Alexandria, LA Map & Demographics
Alexandria Map
Alexandria Overview
$30,457
PER CAPITA INCOME
$59,362
AVG FAMILY INCOME
$49,049
AVG HOUSEHOLD INCOME
9.2%
WAGE / INCOME GAP [ % ]
90.8¢/ $1
WAGE / INCOME GAP [ $ ]
$10,485
FAMILY INCOME DEFICIT
0.52
INEQUALITY / GINI INDEX
45,133
TOTAL POPULATION
21,526
MALE POPULATION
23,607
FEMALE POPULATION
91.18
MALES / 100 FEMALES
109.67
FEMALES / 100 MALES
37.4
MEDIAN AGE
3.3
AVG FAMILY SIZE
2.5
AVG HOUSEHOLD SIZE
20,834
LABOR FORCE [ PEOPLE ]
57.3%
PERCENT IN LABOR FORCE
7.5%
UNEMPLOYMENT RATE
Alexandria Area Codes
Income in Alexandria
Income Overview in Alexandria
Per Capita Income in Alexandria is $30,457, while median incomes of families and households are $59,362 and $49,049 respectively.
| Characteristic | Number | Measure |
| Per Capita Income | 45,133 | $30,457 |
| Median Family Income | 10,394 | $59,362 |
| Mean Family Income | 10,394 | $88,719 |
| Median Household Income | 17,095 | $49,049 |
| Mean Household Income | 17,095 | $75,000 |
| Income Deficit | 10,394 | $10,485 |
| Wage / Income Gap (%) | 45,133 | 9.21% |
| Wage / Income Gap ($) | 45,133 | 90.79¢ per $1 |
| Gini / Inequality Index | 45,133 | 0.52 |
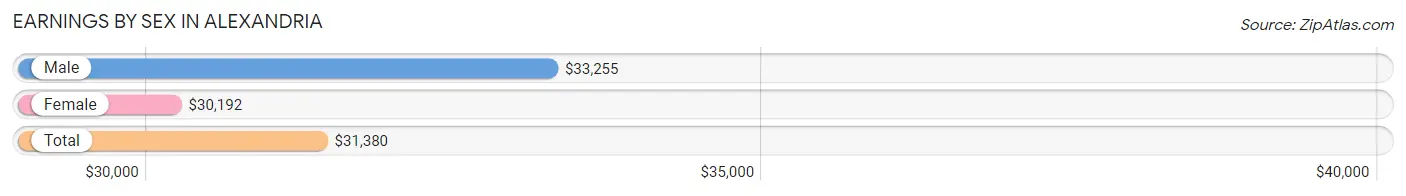
Earnings by Sex in Alexandria
Average Earnings in Alexandria are $31,380, $33,255 for men and $30,192 for women, a difference of 9.2%.
| Sex | Number | Average Earnings |
| Male | 10,130 (47.0%) | $33,255 |
| Female | 11,403 (53.0%) | $30,192 |
| Total | 21,533 (100.0%) | $31,380 |
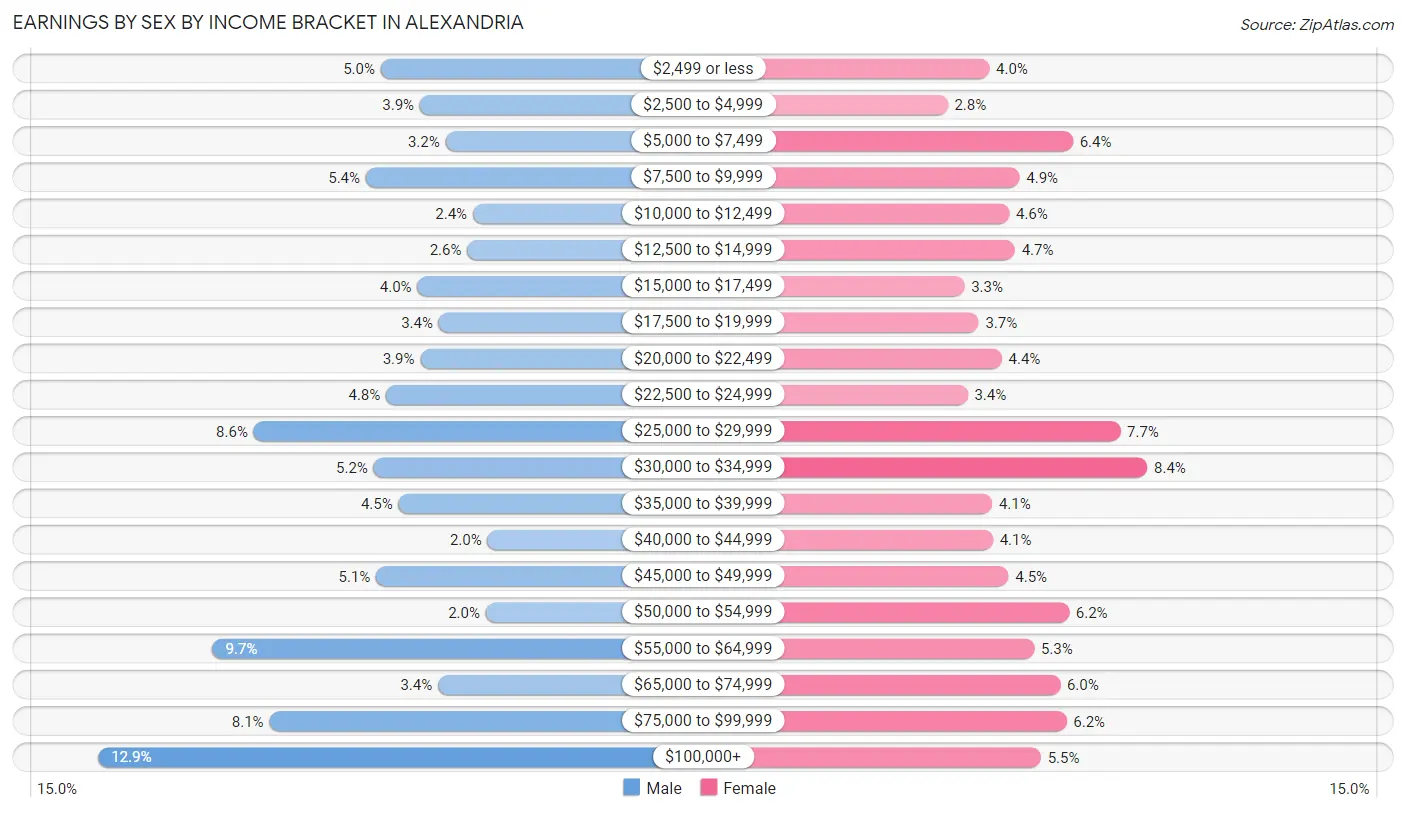
Earnings by Sex by Income Bracket in Alexandria
The most common earnings brackets in Alexandria are $100,000+ for men (1,310 | 12.9%) and $30,000 to $34,999 for women (962 | 8.4%).
| Income | Male | Female |
| $2,499 or less | 505 (5.0%) | 456 (4.0%) |
| $2,500 to $4,999 | 394 (3.9%) | 323 (2.8%) |
| $5,000 to $7,499 | 321 (3.2%) | 724 (6.4%) |
| $7,500 to $9,999 | 548 (5.4%) | 553 (4.9%) |
| $10,000 to $12,499 | 243 (2.4%) | 520 (4.6%) |
| $12,500 to $14,999 | 259 (2.6%) | 538 (4.7%) |
| $15,000 to $17,499 | 401 (4.0%) | 376 (3.3%) |
| $17,500 to $19,999 | 340 (3.4%) | 422 (3.7%) |
| $20,000 to $22,499 | 393 (3.9%) | 496 (4.3%) |
| $22,500 to $24,999 | 490 (4.8%) | 387 (3.4%) |
| $25,000 to $29,999 | 867 (8.6%) | 876 (7.7%) |
| $30,000 to $34,999 | 526 (5.2%) | 962 (8.4%) |
| $35,000 to $39,999 | 455 (4.5%) | 465 (4.1%) |
| $40,000 to $44,999 | 202 (2.0%) | 468 (4.1%) |
| $45,000 to $49,999 | 519 (5.1%) | 518 (4.5%) |
| $50,000 to $54,999 | 207 (2.0%) | 711 (6.2%) |
| $55,000 to $64,999 | 985 (9.7%) | 600 (5.3%) |
| $65,000 to $74,999 | 342 (3.4%) | 683 (6.0%) |
| $75,000 to $99,999 | 823 (8.1%) | 703 (6.2%) |
| $100,000+ | 1,310 (12.9%) | 622 (5.4%) |
| Total | 10,130 (100.0%) | 11,403 (100.0%) |
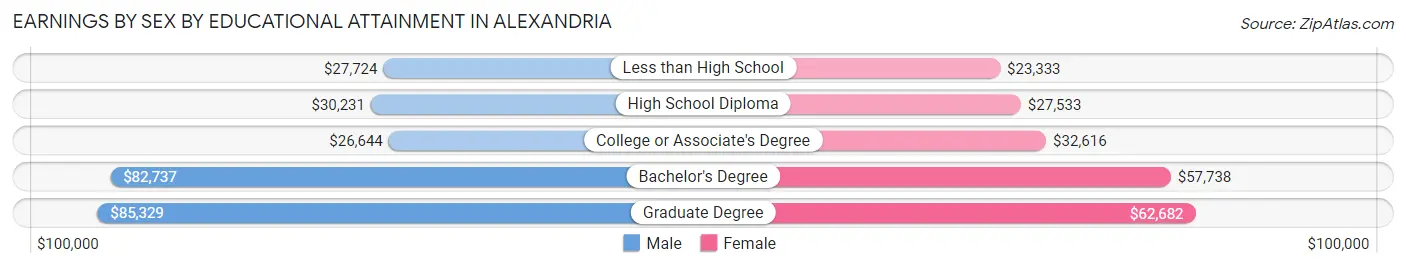
Earnings by Sex by Educational Attainment in Alexandria
Average earnings in Alexandria are $37,564 for men and $33,970 for women, a difference of 9.6%. Men with an educational attainment of graduate degree enjoy the highest average annual earnings of $85,329, while those with college or associate's degree education earn the least with $26,644. Women with an educational attainment of graduate degree earn the most with the average annual earnings of $62,682, while those with less than high school education have the smallest earnings of $23,333.
| Educational Attainment | Male Income | Female Income |
| Less than High School | $27,724 | $23,333 |
| High School Diploma | $30,231 | $27,533 |
| College or Associate's Degree | $26,644 | $32,616 |
| Bachelor's Degree | $82,737 | $57,738 |
| Graduate Degree | $85,329 | $62,682 |
| Total | $37,564 | $33,970 |
Family Income in Alexandria
Family Income Brackets in Alexandria
According to the Alexandria family income data, there are 1,777 families falling into the $50,000 to $74,999 income range, which is the most common income bracket and makes up 17.1% of all families. Conversely, the $10,000 to $14,999 income bracket is the least frequent group with only 426 families (4.1%) belonging to this category.
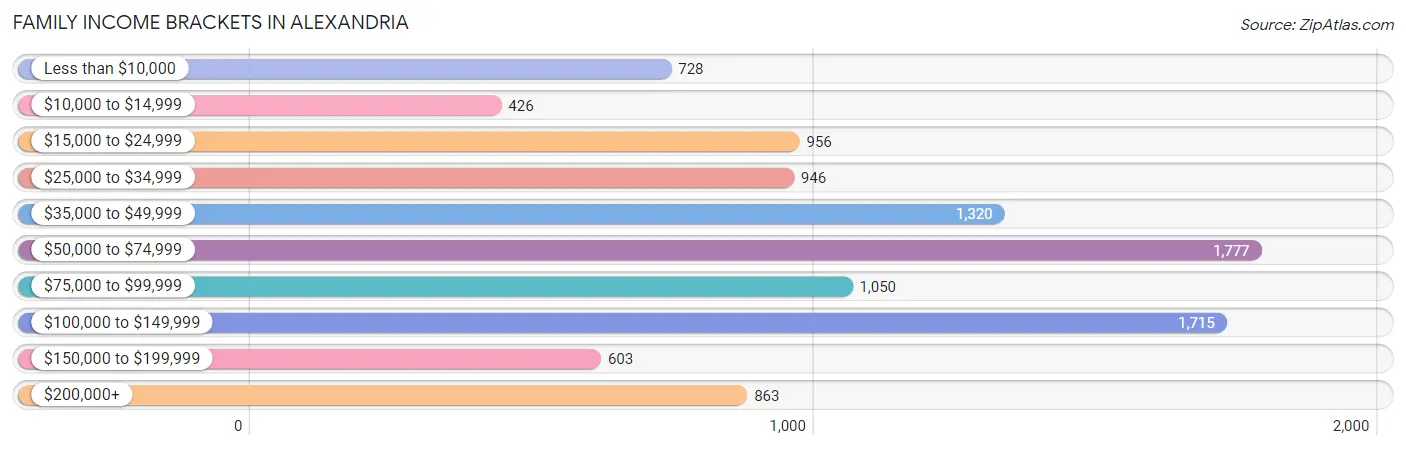
| Income Bracket | # Families | % Families |
| Less than $10,000 | 728 | 7.0% |
| $10,000 to $14,999 | 426 | 4.1% |
| $15,000 to $24,999 | 956 | 9.2% |
| $25,000 to $34,999 | 946 | 9.1% |
| $35,000 to $49,999 | 1,320 | 12.7% |
| $50,000 to $74,999 | 1,777 | 17.1% |
| $75,000 to $99,999 | 1,050 | 10.1% |
| $100,000 to $149,999 | 1,715 | 16.5% |
| $150,000 to $199,999 | 603 | 5.8% |
| $200,000+ | 863 | 8.3% |
Family Income by Famaliy Size in Alexandria
5-person families (688 | 6.6%) account for the highest median family income in Alexandria with $65,263 per family, while 2-person families (5,152 | 49.6%) have the highest median income of $32,202 per family member.
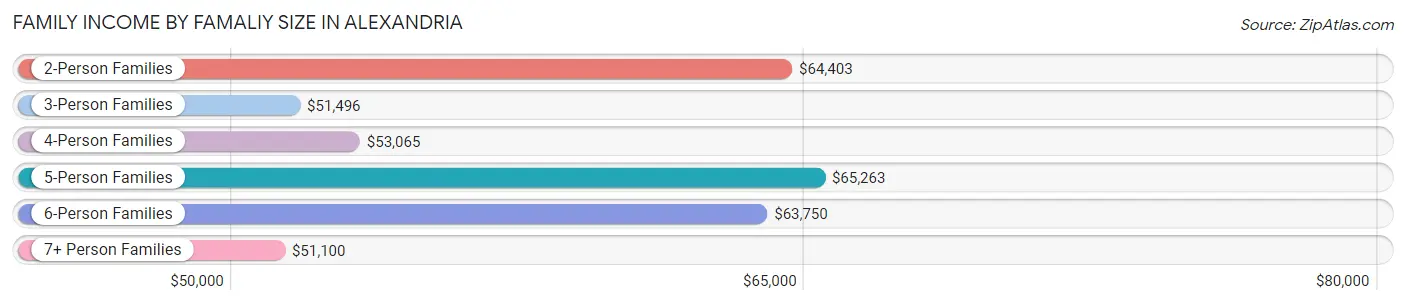
| Income Bracket | # Families | Median Income |
| 2-Person Families | 5,152 (49.6%) | $64,403 |
| 3-Person Families | 2,701 (26.0%) | $51,496 |
| 4-Person Families | 1,311 (12.6%) | $53,065 |
| 5-Person Families | 688 (6.6%) | $65,263 |
| 6-Person Families | 410 (3.9%) | $63,750 |
| 7+ Person Families | 132 (1.3%) | $51,100 |
| Total | 10,394 (100.0%) | $59,362 |
Family Income by Number of Earners in Alexandria
The median family income in Alexandria is $59,362, with families comprising 2 earners (3,375) having the highest median family income of $101,408, while families with no earners (1,604) have the lowest median family income of $27,131, accounting for 32.5% and 15.4% of families, respectively.
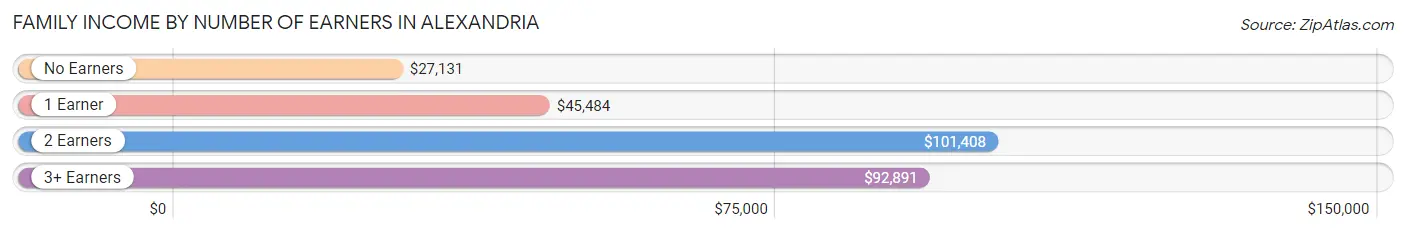
| Number of Earners | # Families | Median Income |
| No Earners | 1,604 (15.4%) | $27,131 |
| 1 Earner | 4,624 (44.5%) | $45,484 |
| 2 Earners | 3,375 (32.5%) | $101,408 |
| 3+ Earners | 791 (7.6%) | $92,891 |
| Total | 10,394 (100.0%) | $59,362 |
Household Income in Alexandria
Household Income Brackets in Alexandria
With 2,804 households falling in the category, the $50,000 to $74,999 income range is the most frequent in Alexandria, accounting for 16.4% of all households. In contrast, only 838 households (4.9%) fall into the $150,000 to $199,999 income bracket, making it the least populous group.
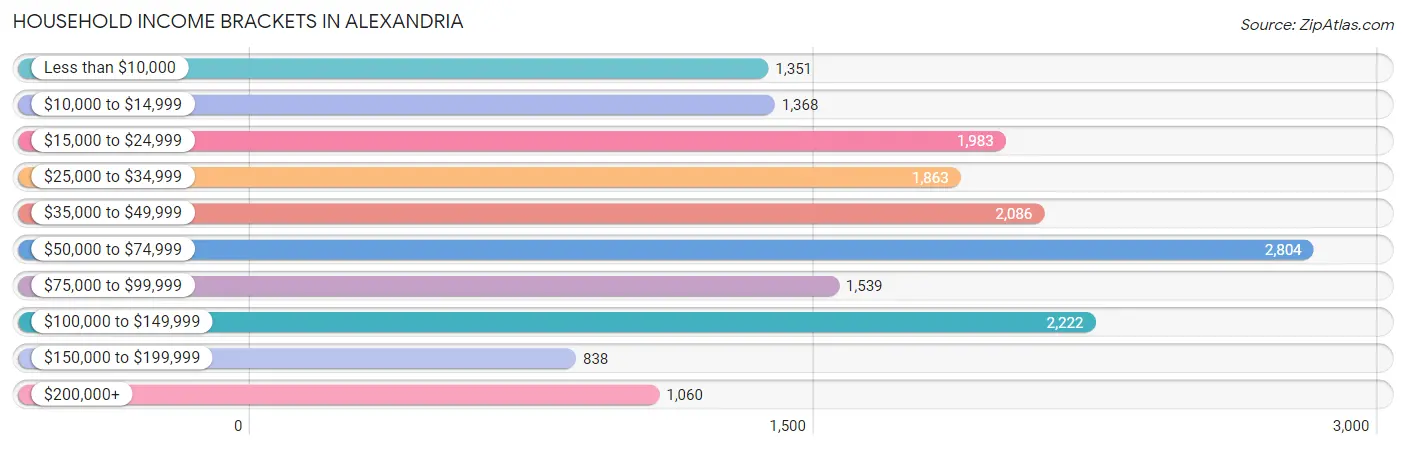
| Income Bracket | # Households | % Households |
| Less than $10,000 | 1,351 | 7.9% |
| $10,000 to $14,999 | 1,368 | 8.0% |
| $15,000 to $24,999 | 1,983 | 11.6% |
| $25,000 to $34,999 | 1,863 | 10.9% |
| $35,000 to $49,999 | 2,086 | 12.2% |
| $50,000 to $74,999 | 2,804 | 16.4% |
| $75,000 to $99,999 | 1,539 | 9.0% |
| $100,000 to $149,999 | 2,222 | 13.0% |
| $150,000 to $199,999 | 838 | 4.9% |
| $200,000+ | 1,060 | 6.2% |
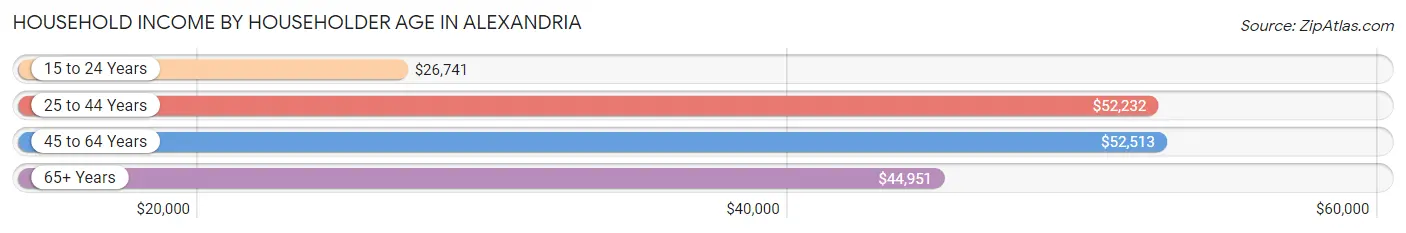
Household Income by Householder Age in Alexandria
The median household income in Alexandria is $49,049, with the highest median household income of $52,513 found in the 45 to 64 years age bracket for the primary householder. A total of 6,489 households (38.0%) fall into this category. Meanwhile, the 15 to 24 years age bracket for the primary householder has the lowest median household income of $26,741, with 797 households (4.7%) in this group.
| Income Bracket | # Households | Median Income |
| 15 to 24 Years | 797 (4.7%) | $26,741 |
| 25 to 44 Years | 5,088 (29.8%) | $52,232 |
| 45 to 64 Years | 6,489 (38.0%) | $52,513 |
| 65+ Years | 4,721 (27.6%) | $44,951 |
| Total | 17,095 (100.0%) | $49,049 |
Poverty in Alexandria
Income Below Poverty by Sex and Age in Alexandria
With 25.8% poverty level for males and 25.6% for females among the residents of Alexandria, 5 year old males and under 5 year old females are the most vulnerable to poverty, with 112 males (59.0%) and 602 females (48.3%) in their respective age groups living below the poverty level.
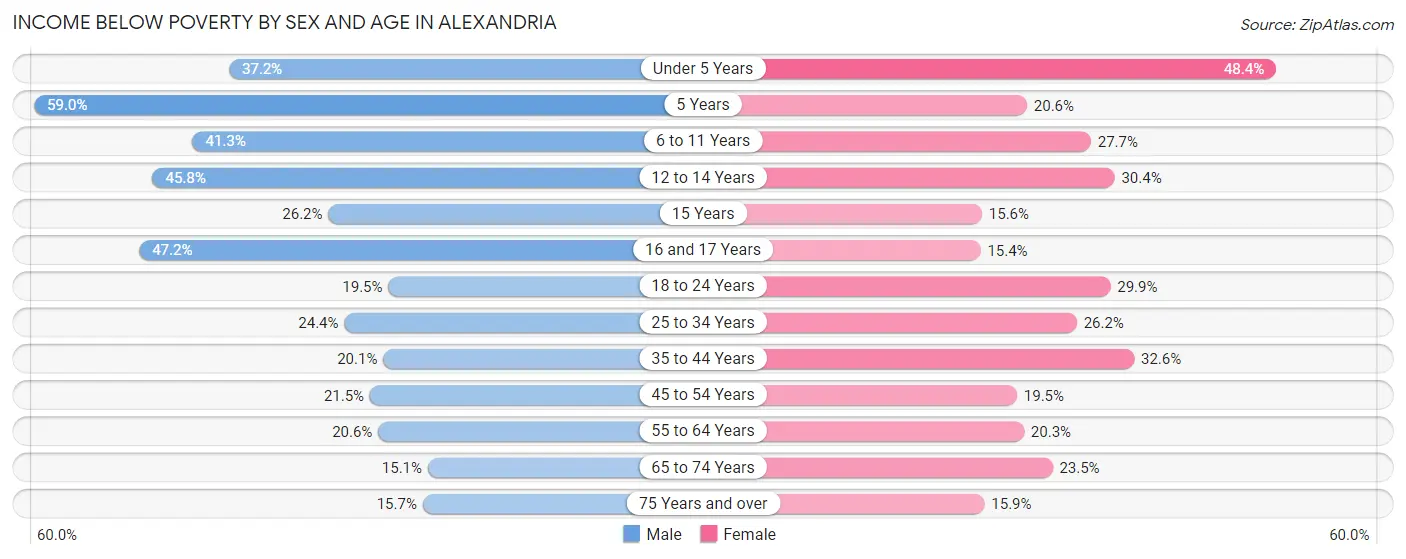
| Age Bracket | Male | Female |
| Under 5 Years | 499 (37.2%) | 602 (48.3%) |
| 5 Years | 112 (59.0%) | 54 (20.6%) |
| 6 to 11 Years | 678 (41.3%) | 444 (27.7%) |
| 12 to 14 Years | 522 (45.8%) | 249 (30.4%) |
| 15 Years | 67 (26.2%) | 34 (15.6%) |
| 16 and 17 Years | 332 (47.2%) | 124 (15.4%) |
| 18 to 24 Years | 372 (19.5%) | 578 (29.9%) |
| 25 to 34 Years | 693 (24.4%) | 864 (26.2%) |
| 35 to 44 Years | 539 (20.1%) | 972 (32.6%) |
| 45 to 54 Years | 522 (21.5%) | 504 (19.5%) |
| 55 to 64 Years | 513 (20.6%) | 698 (20.3%) |
| 65 to 74 Years | 260 (15.1%) | 528 (23.5%) |
| 75 Years and over | 176 (15.7%) | 280 (15.9%) |
| Total | 5,285 (25.8%) | 5,931 (25.6%) |
Income Above Poverty by Sex and Age in Alexandria
According to the poverty statistics in Alexandria, males aged 65 to 74 years and females aged 16 and 17 years are the age groups that are most secure financially, with 84.9% of males and 84.6% of females in these age groups living above the poverty line.
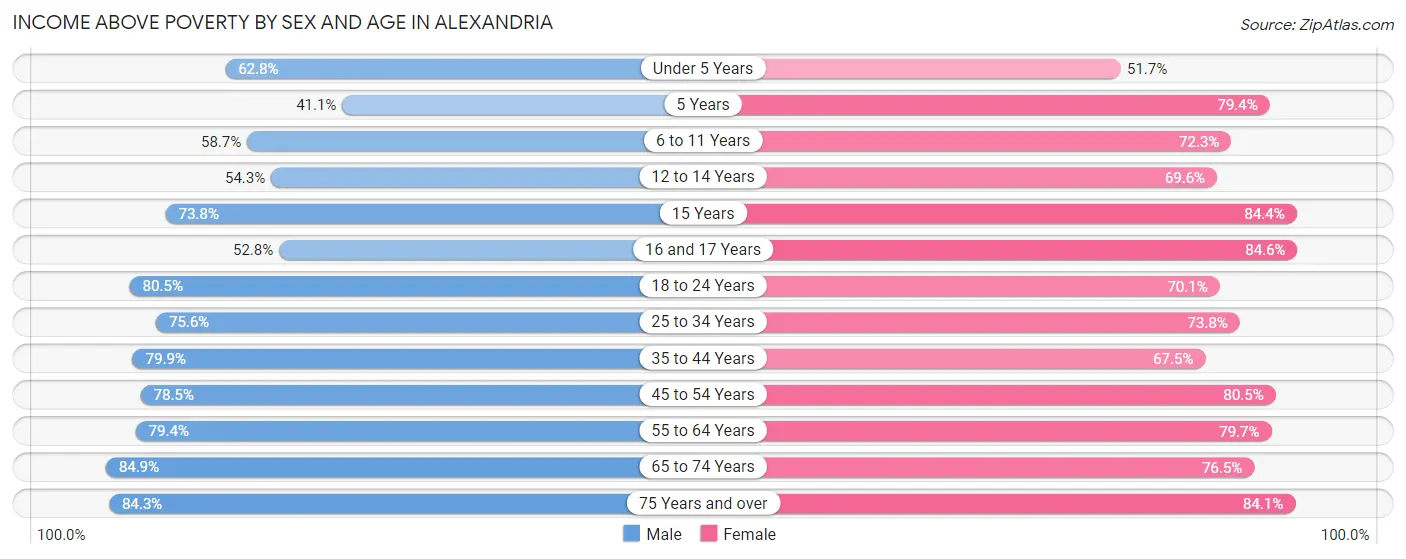
| Age Bracket | Male | Female |
| Under 5 Years | 841 (62.8%) | 643 (51.6%) |
| 5 Years | 78 (41.0%) | 208 (79.4%) |
| 6 to 11 Years | 964 (58.7%) | 1,157 (72.3%) |
| 12 to 14 Years | 619 (54.2%) | 571 (69.6%) |
| 15 Years | 189 (73.8%) | 184 (84.4%) |
| 16 and 17 Years | 371 (52.8%) | 679 (84.6%) |
| 18 to 24 Years | 1,537 (80.5%) | 1,355 (70.1%) |
| 25 to 34 Years | 2,148 (75.6%) | 2,439 (73.8%) |
| 35 to 44 Years | 2,148 (79.9%) | 2,014 (67.4%) |
| 45 to 54 Years | 1,901 (78.5%) | 2,081 (80.5%) |
| 55 to 64 Years | 1,975 (79.4%) | 2,743 (79.7%) |
| 65 to 74 Years | 1,463 (84.9%) | 1,723 (76.5%) |
| 75 Years and over | 948 (84.3%) | 1,483 (84.1%) |
| Total | 15,182 (74.2%) | 17,280 (74.5%) |
Income Below Poverty Among Married-Couple Families in Alexandria
The poverty statistics for married-couple families in Alexandria show that 8.7% or 505 of the total 5,822 families live below the poverty line. Families with 5 or more children have the highest poverty rate of 54.9%, comprising of 45 families. On the other hand, families with no children have the lowest poverty rate of 4.4%, which includes 149 families.
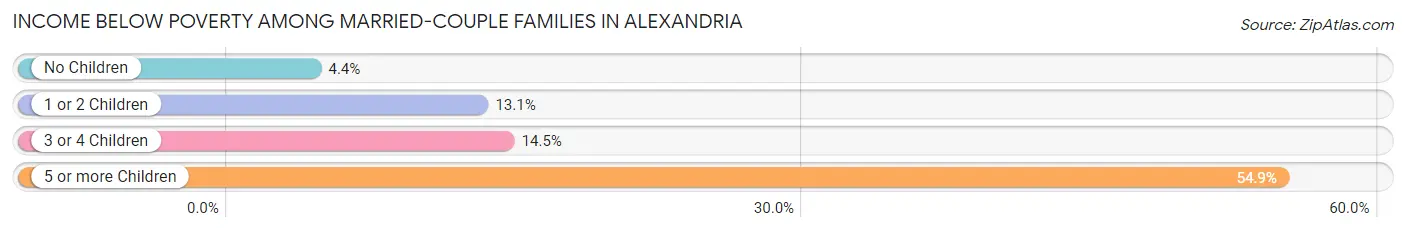
| Children | Above Poverty | Below Poverty |
| No Children | 3,269 (95.6%) | 149 (4.4%) |
| 1 or 2 Children | 1,555 (86.9%) | 234 (13.1%) |
| 3 or 4 Children | 456 (85.6%) | 77 (14.4%) |
| 5 or more Children | 37 (45.1%) | 45 (54.9%) |
| Total | 5,317 (91.3%) | 505 (8.7%) |
Income Below Poverty Among Single-Parent Households in Alexandria
According to the poverty data in Alexandria, 35.3% or 277 single-father households and 35.9% or 1,361 single-mother households are living below the poverty line. Among single-father households, those with no children have the highest poverty rate, with 133 households (36.9%) experiencing poverty. Likewise, among single-mother households, those with 5 or more children have the highest poverty rate, with 10 households (100.0%) falling below the poverty line.
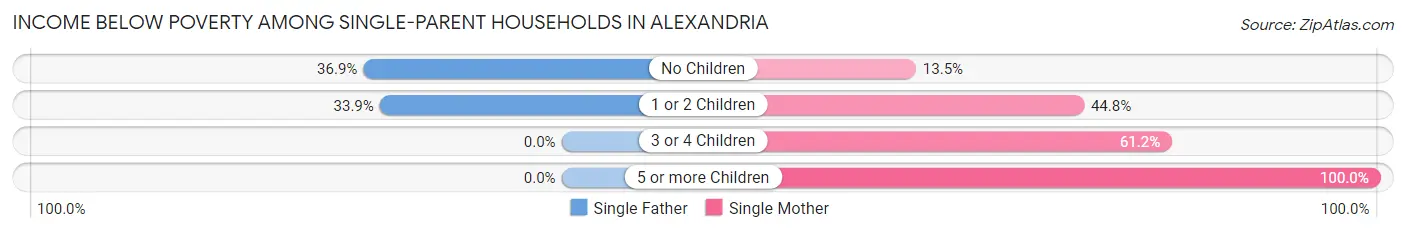
| Children | Single Father | Single Mother |
| No Children | 133 (36.9%) | 169 (13.5%) |
| 1 or 2 Children | 144 (33.9%) | 982 (44.8%) |
| 3 or 4 Children | 0 (0.0%) | 200 (61.2%) |
| 5 or more Children | 0 (0.0%) | 10 (100.0%) |
| Total | 277 (35.3%) | 1,361 (35.9%) |
Income Below Poverty Among Married-Couple vs Single-Parent Households in Alexandria
The poverty data for Alexandria shows that 505 of the married-couple family households (8.7%) and 1,638 of the single-parent households (35.8%) are living below the poverty level. Within the married-couple family households, those with 5 or more children have the highest poverty rate, with 45 households (54.9%) falling below the poverty line. Among the single-parent households, those with 5 or more children have the highest poverty rate, with 10 household (100.0%) living below poverty.
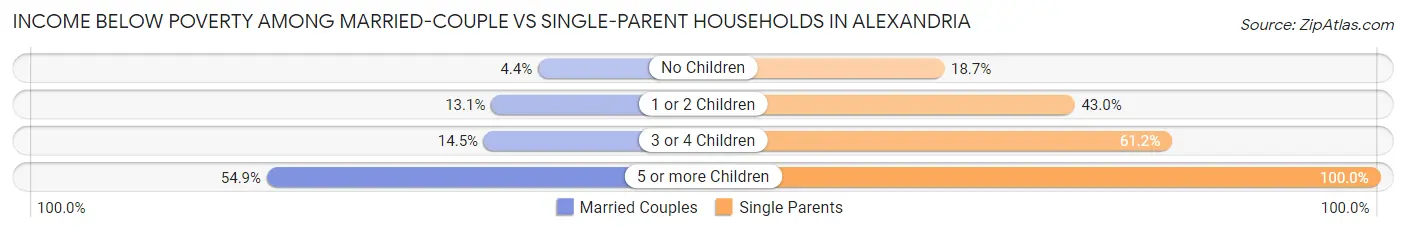
| Children | Married-Couple Families | Single-Parent Households |
| No Children | 149 (4.4%) | 302 (18.7%) |
| 1 or 2 Children | 234 (13.1%) | 1,126 (43.0%) |
| 3 or 4 Children | 77 (14.4%) | 200 (61.2%) |
| 5 or more Children | 45 (54.9%) | 10 (100.0%) |
| Total | 505 (8.7%) | 1,638 (35.8%) |
Race in Alexandria
The most populous races in Alexandria are Black / African American (25,039 | 55.5%), White / Caucasian (17,046 | 37.8%), and Two or more Races (1,592 | 3.5%).
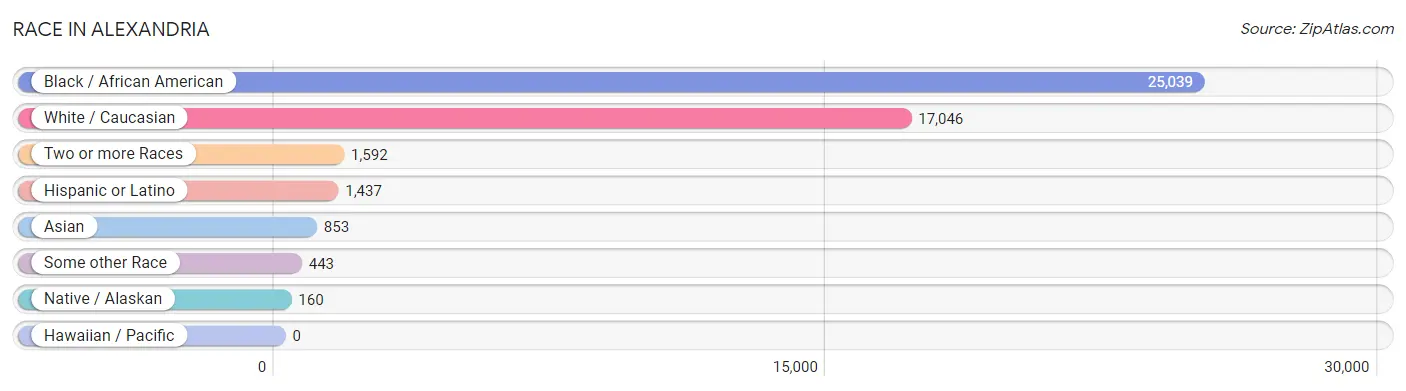
| Race | # Population | % Population |
| Asian | 853 | 1.9% |
| Black / African American | 25,039 | 55.5% |
| Hawaiian / Pacific | 0 | 0.0% |
| Hispanic or Latino | 1,437 | 3.2% |
| Native / Alaskan | 160 | 0.4% |
| White / Caucasian | 17,046 | 37.8% |
| Two or more Races | 1,592 | 3.5% |
| Some other Race | 443 | 1.0% |
| Total | 45,133 | 100.0% |
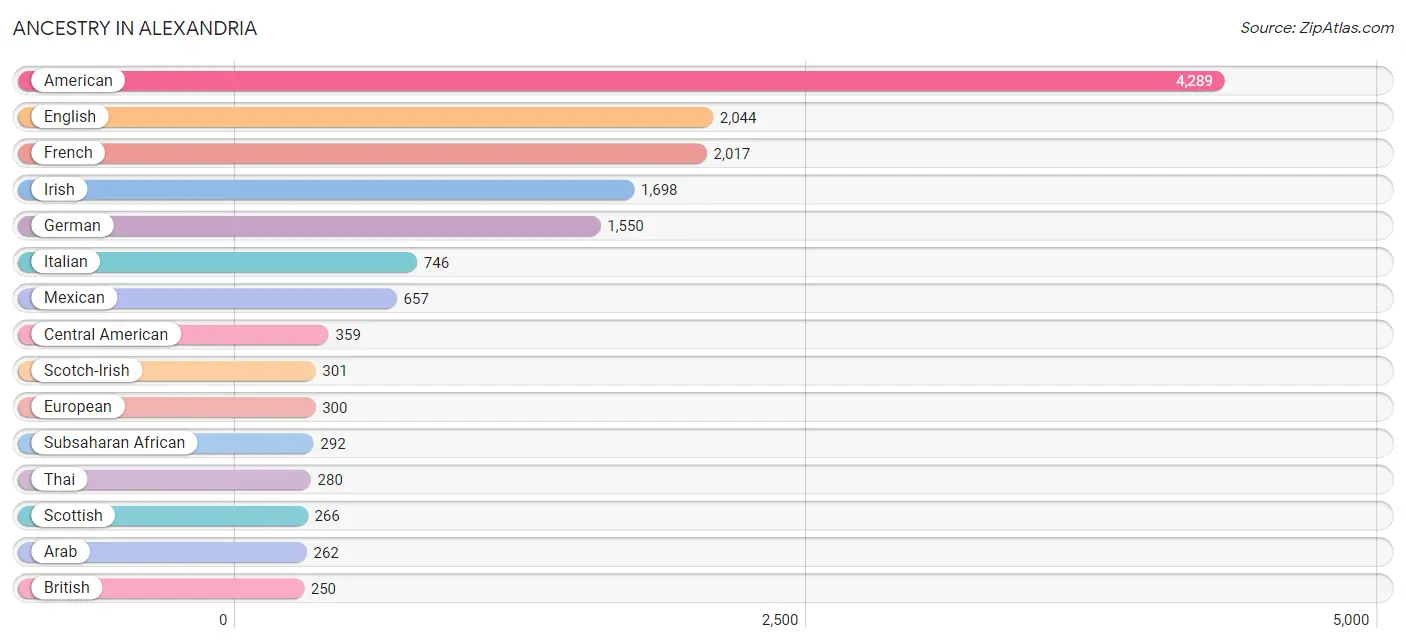
Ancestry in Alexandria
The most populous ancestries reported in Alexandria are American (4,289 | 9.5%), English (2,044 | 4.5%), French (2,017 | 4.5%), Irish (1,698 | 3.8%), and German (1,550 | 3.4%), together accounting for 25.7% of all Alexandria residents.
| Ancestry | # Population | % Population |
| African | 198 | 0.4% |
| Alsatian | 1 | 0.0% |
| American | 4,289 | 9.5% |
| Apache | 11 | 0.0% |
| Arab | 262 | 0.6% |
| Austrian | 44 | 0.1% |
| Belgian | 22 | 0.1% |
| Bhutanese | 179 | 0.4% |
| Blackfeet | 12 | 0.0% |
| Brazilian | 4 | 0.0% |
| British | 250 | 0.5% |
| Bulgarian | 74 | 0.2% |
| Cajun | 250 | 0.5% |
| Central American | 359 | 0.8% |
| Cherokee | 31 | 0.1% |
| Choctaw | 107 | 0.2% |
| Colombian | 18 | 0.0% |
| Costa Rican | 104 | 0.2% |
| Croatian | 10 | 0.0% |
| Cuban | 33 | 0.1% |
| Czech | 7 | 0.0% |
| Czechoslovakian | 11 | 0.0% |
| Dutch | 70 | 0.2% |
| Eastern European | 77 | 0.2% |
| Ecuadorian | 21 | 0.1% |
| English | 2,044 | 4.5% |
| Ethiopian | 23 | 0.1% |
| European | 300 | 0.7% |
| French | 2,017 | 4.5% |
| French American Indian | 9 | 0.0% |
| French Canadian | 145 | 0.3% |
| German | 1,550 | 3.4% |
| Greek | 8 | 0.0% |
| Guatemalan | 75 | 0.2% |
| Haitian | 87 | 0.2% |
| Honduran | 180 | 0.4% |
| Hungarian | 35 | 0.1% |
| Indian (Asian) | 202 | 0.4% |
| Irish | 1,698 | 3.8% |
| Italian | 746 | 1.7% |
| Jordanian | 53 | 0.1% |
| Kenyan | 28 | 0.1% |
| Korean | 123 | 0.3% |
| Lebanese | 11 | 0.0% |
| Liberian | 38 | 0.1% |
| Lithuanian | 18 | 0.0% |
| Malaysian | 65 | 0.1% |
| Mexican | 657 | 1.5% |
| Mexican American Indian | 7 | 0.0% |
| Norwegian | 132 | 0.3% |
| Pakistani | 152 | 0.3% |
| Palestinian | 209 | 0.5% |
| Polish | 95 | 0.2% |
| Portuguese | 21 | 0.1% |
| Puerto Rican | 133 | 0.3% |
| Romanian | 6 | 0.0% |
| Russian | 22 | 0.1% |
| Scandinavian | 98 | 0.2% |
| Scotch-Irish | 301 | 0.7% |
| Scottish | 266 | 0.6% |
| Slavic | 12 | 0.0% |
| Slovak | 30 | 0.1% |
| South American | 39 | 0.1% |
| Spaniard | 52 | 0.1% |
| Spanish | 114 | 0.3% |
| Sri Lankan | 119 | 0.3% |
| Subsaharan African | 292 | 0.6% |
| Swedish | 44 | 0.1% |
| Swiss | 66 | 0.2% |
| Thai | 280 | 0.6% |
| Turkish | 13 | 0.0% |
| Welsh | 39 | 0.1% |
| West Indian | 7 | 0.0% | View All 73 Rows |
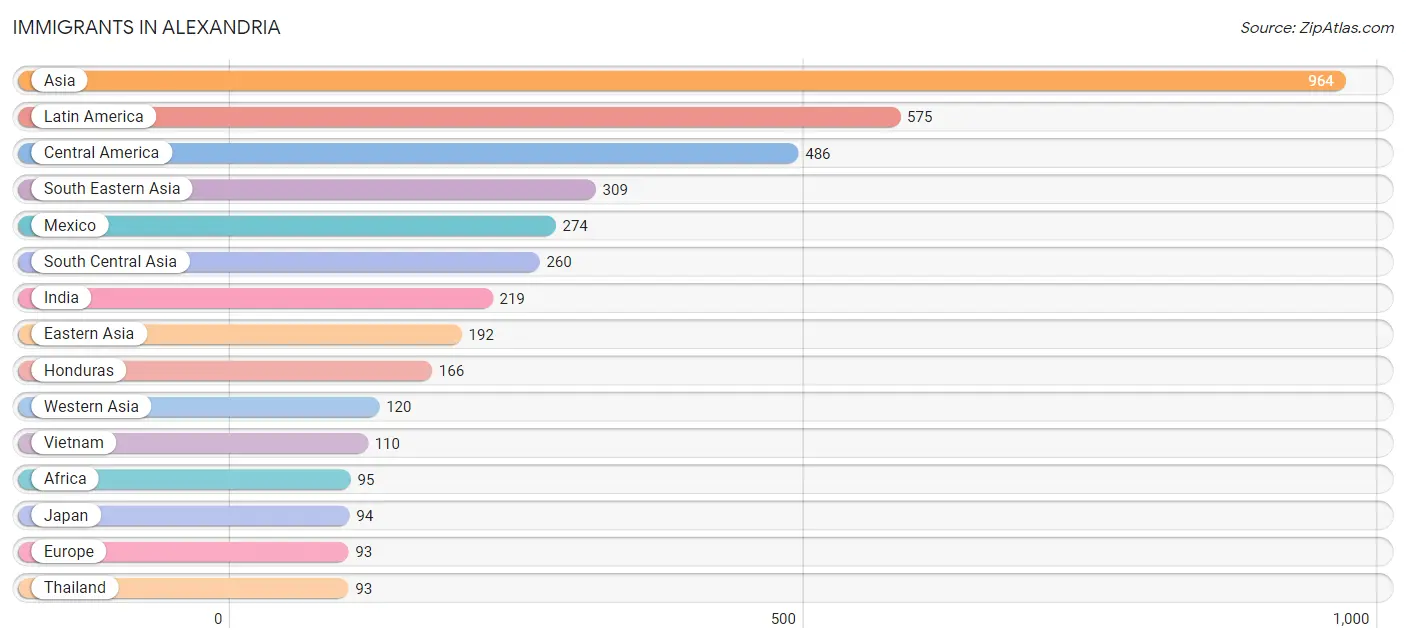
Immigrants in Alexandria
The most numerous immigrant groups reported in Alexandria came from Asia (964 | 2.1%), Latin America (575 | 1.3%), Central America (486 | 1.1%), South Eastern Asia (309 | 0.7%), and Mexico (274 | 0.6%), together accounting for 5.8% of all Alexandria residents.
| Immigration Origin | # Population | % Population |
| Africa | 95 | 0.2% |
| Asia | 964 | 2.1% |
| Austria | 38 | 0.1% |
| Bangladesh | 20 | 0.0% |
| Belize | 7 | 0.0% |
| Brazil | 4 | 0.0% |
| Canada | 31 | 0.1% |
| Caribbean | 33 | 0.1% |
| Central America | 486 | 1.1% |
| China | 72 | 0.2% |
| Costa Rica | 39 | 0.1% |
| Cuba | 33 | 0.1% |
| Eastern Africa | 67 | 0.2% |
| Eastern Asia | 192 | 0.4% |
| Eastern Europe | 14 | 0.0% |
| Ecuador | 21 | 0.1% |
| England | 23 | 0.1% |
| Ethiopia | 23 | 0.1% |
| Europe | 93 | 0.2% |
| Germany | 18 | 0.0% |
| Honduras | 166 | 0.4% |
| India | 219 | 0.5% |
| Israel | 66 | 0.2% |
| Japan | 94 | 0.2% |
| Jordan | 20 | 0.0% |
| Korea | 26 | 0.1% |
| Laos | 31 | 0.1% |
| Latin America | 575 | 1.3% |
| Mexico | 274 | 0.6% |
| Nepal | 2 | 0.0% |
| Northern Europe | 23 | 0.1% |
| Pakistan | 19 | 0.0% |
| Philippines | 75 | 0.2% |
| Russia | 14 | 0.0% |
| South America | 56 | 0.1% |
| South Central Asia | 260 | 0.6% |
| South Eastern Asia | 309 | 0.7% |
| Thailand | 93 | 0.2% |
| Turkey | 23 | 0.1% |
| Venezuela | 31 | 0.1% |
| Vietnam | 110 | 0.2% |
| Western Asia | 120 | 0.3% |
| Western Europe | 56 | 0.1% | View All 43 Rows |
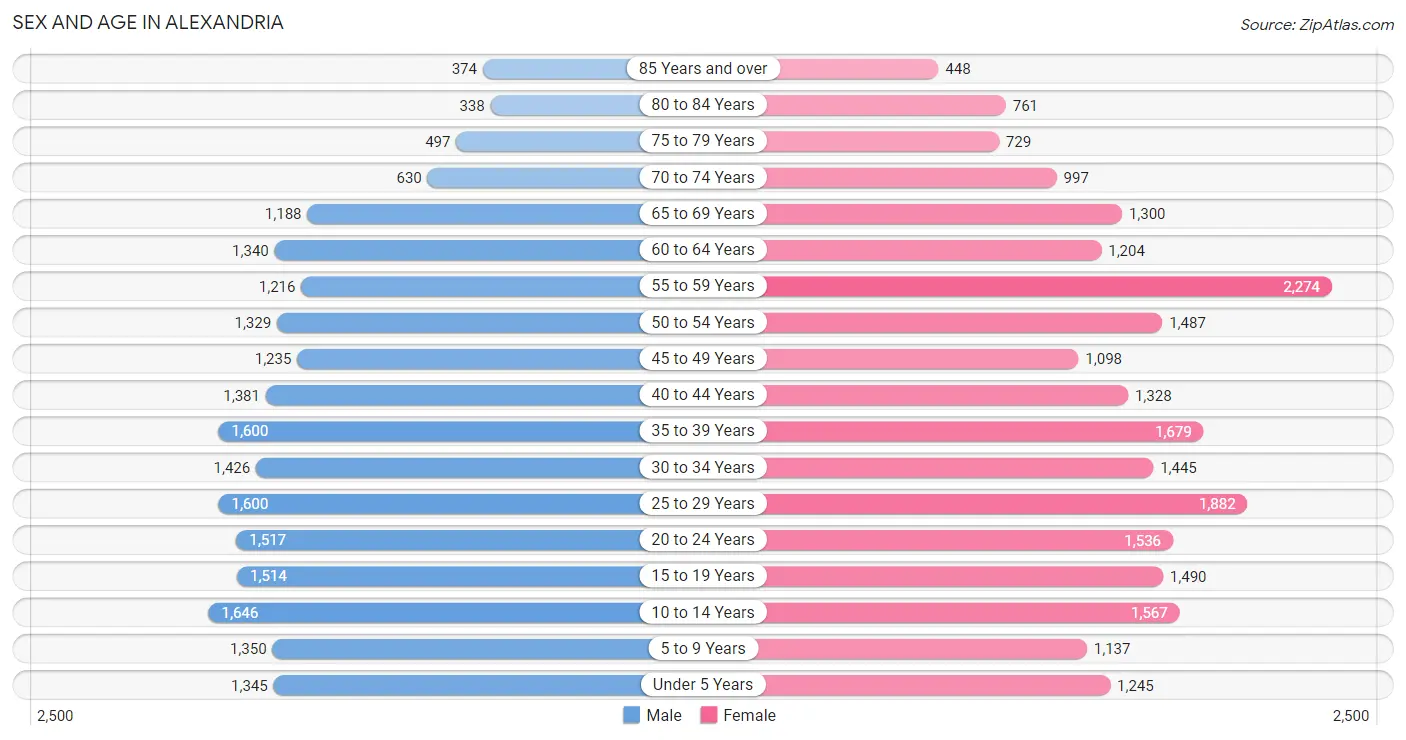
Sex and Age in Alexandria
Sex and Age in Alexandria
The most populous age groups in Alexandria are 10 to 14 Years (1,646 | 7.6%) for men and 55 to 59 Years (2,274 | 9.6%) for women.
| Age Bracket | Male | Female |
| Under 5 Years | 1,345 (6.2%) | 1,245 (5.3%) |
| 5 to 9 Years | 1,350 (6.3%) | 1,137 (4.8%) |
| 10 to 14 Years | 1,646 (7.6%) | 1,567 (6.6%) |
| 15 to 19 Years | 1,514 (7.0%) | 1,490 (6.3%) |
| 20 to 24 Years | 1,517 (7.0%) | 1,536 (6.5%) |
| 25 to 29 Years | 1,600 (7.4%) | 1,882 (8.0%) |
| 30 to 34 Years | 1,426 (6.6%) | 1,445 (6.1%) |
| 35 to 39 Years | 1,600 (7.4%) | 1,679 (7.1%) |
| 40 to 44 Years | 1,381 (6.4%) | 1,328 (5.6%) |
| 45 to 49 Years | 1,235 (5.7%) | 1,098 (4.6%) |
| 50 to 54 Years | 1,329 (6.2%) | 1,487 (6.3%) |
| 55 to 59 Years | 1,216 (5.7%) | 2,274 (9.6%) |
| 60 to 64 Years | 1,340 (6.2%) | 1,204 (5.1%) |
| 65 to 69 Years | 1,188 (5.5%) | 1,300 (5.5%) |
| 70 to 74 Years | 630 (2.9%) | 997 (4.2%) |
| 75 to 79 Years | 497 (2.3%) | 729 (3.1%) |
| 80 to 84 Years | 338 (1.6%) | 761 (3.2%) |
| 85 Years and over | 374 (1.7%) | 448 (1.9%) |
| Total | 21,526 (100.0%) | 23,607 (100.0%) |
Families and Households in Alexandria
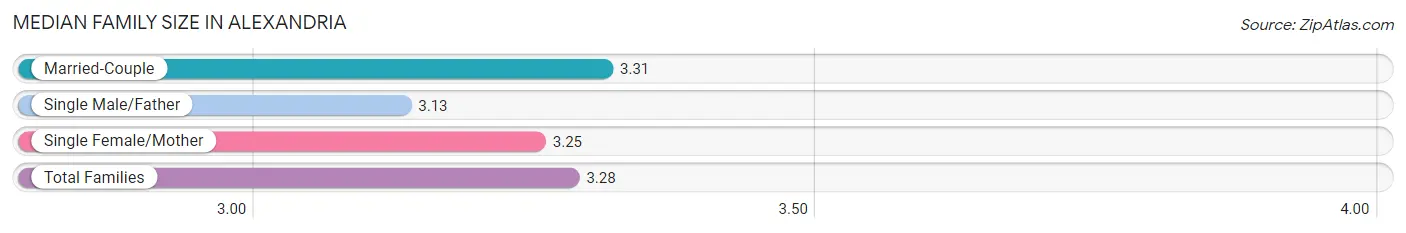
Median Family Size in Alexandria
The median family size in Alexandria is 3.28 persons per family, with married-couple families (5,822 | 56.0%) accounting for the largest median family size of 3.31 persons per family. On the other hand, single male/father families (785 | 7.5%) represent the smallest median family size with 3.13 persons per family.
| Family Type | # Families | Family Size |
| Married-Couple | 5,822 (56.0%) | 3.31 |
| Single Male/Father | 785 (7.5%) | 3.13 |
| Single Female/Mother | 3,787 (36.4%) | 3.25 |
| Total Families | 10,394 (100.0%) | 3.28 |
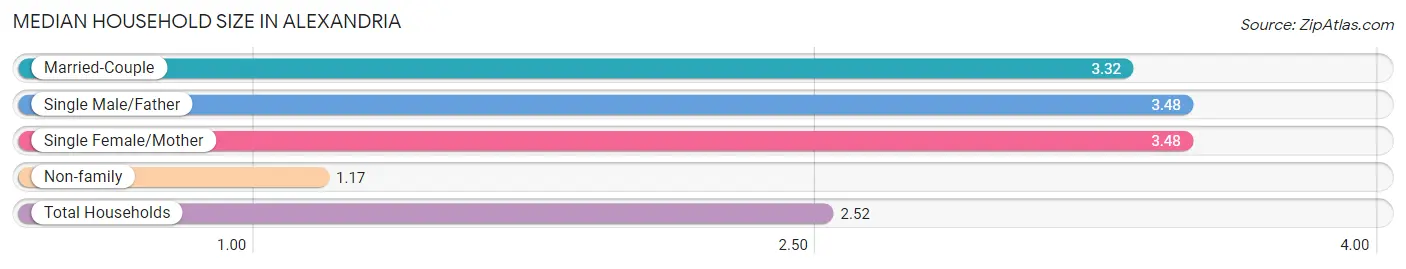
Median Household Size in Alexandria
The median household size in Alexandria is 2.52 persons per household, with single male/father households (785 | 4.6%) accounting for the largest median household size of 3.48 persons per household. non-family households (6,701 | 39.2%) represent the smallest median household size with 1.17 persons per household.
| Household Type | # Households | Household Size |
| Married-Couple | 5,822 (34.1%) | 3.32 |
| Single Male/Father | 785 (4.6%) | 3.48 |
| Single Female/Mother | 3,787 (22.2%) | 3.48 |
| Non-family | 6,701 (39.2%) | 1.17 |
| Total Households | 17,095 (100.0%) | 2.52 |
Household Size by Marriage Status in Alexandria
Out of a total of 17,095 households in Alexandria, 10,394 (60.8%) are family households, while 6,701 (39.2%) are nonfamily households. The most numerous type of family households are 2-person households, comprising 4,794, and the most common type of nonfamily households are 1-person households, comprising 5,858.
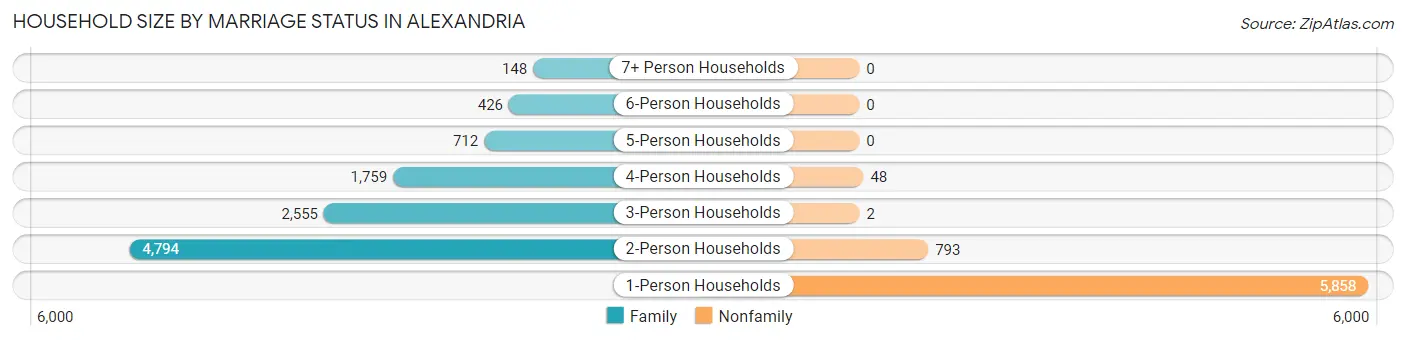
| Household Size | Family Households | Nonfamily Households |
| 1-Person Households | - | 5,858 (34.3%) |
| 2-Person Households | 4,794 (28.0%) | 793 (4.6%) |
| 3-Person Households | 2,555 (14.9%) | 2 (0.0%) |
| 4-Person Households | 1,759 (10.3%) | 48 (0.3%) |
| 5-Person Households | 712 (4.2%) | 0 (0.0%) |
| 6-Person Households | 426 (2.5%) | 0 (0.0%) |
| 7+ Person Households | 148 (0.9%) | 0 (0.0%) |
| Total | 10,394 (60.8%) | 6,701 (39.2%) |
Female Fertility in Alexandria
Fertility by Age in Alexandria
Average fertility rate in Alexandria is 64.0 births per 1,000 women. Women in the age bracket of 20 to 34 years have the highest fertility rate with 83.0 births per 1,000 women. Women in the age bracket of 20 to 34 years acount for 59.2% of all women with births.
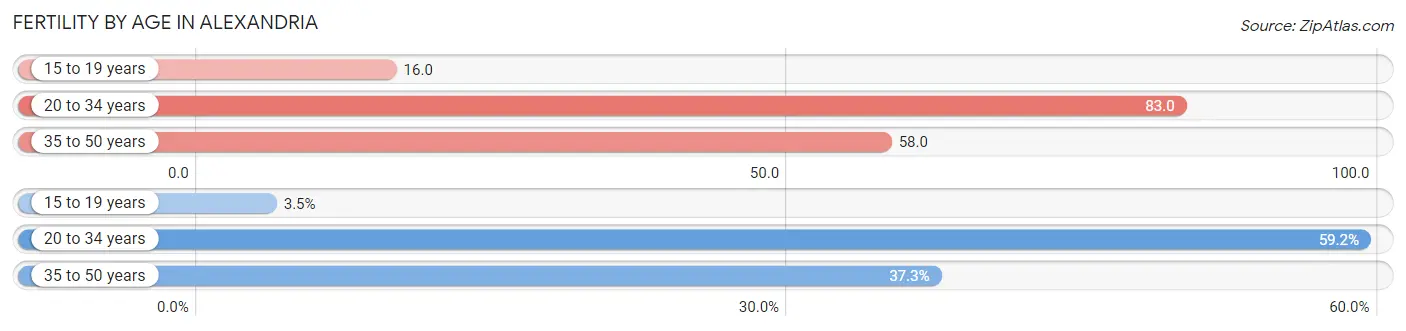
| Age Bracket | Women with Births | Births / 1,000 Women |
| 15 to 19 years | 24 (3.5%) | 16.0 |
| 20 to 34 years | 406 (59.2%) | 83.0 |
| 35 to 50 years | 256 (37.3%) | 58.0 |
| Total | 686 (100.0%) | 64.0 |
Fertility by Age by Marriage Status in Alexandria
50.9% of women with births (686) in Alexandria are married. The highest percentage of unmarried women with births falls into 15 to 19 years age bracket with 100.0% of them unmarried at the time of birth, while the lowest percentage of unmarried women with births belong to 35 to 50 years age bracket with 11.7% of them unmarried.
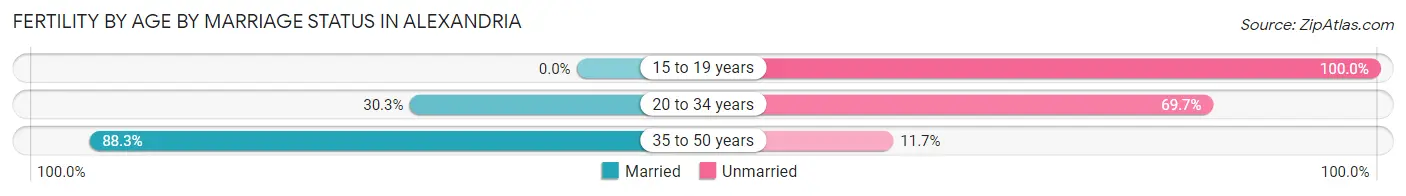
| Age Bracket | Married | Unmarried |
| 15 to 19 years | 0 (0.0%) | 24 (100.0%) |
| 20 to 34 years | 123 (30.3%) | 283 (69.7%) |
| 35 to 50 years | 226 (88.3%) | 30 (11.7%) |
| Total | 349 (50.9%) | 337 (49.1%) |
Fertility by Education in Alexandria
Average fertility rate in Alexandria is 64.0 births per 1,000 women. Women with the education attainment of high school diploma have the highest fertility rate of 110.0 births per 1,000 women, while women with the education attainment of less than high school have the lowest fertility at 20.0 births per 1,000 women. Women with the education attainment of high school diploma represent 47.8% of all women with births.
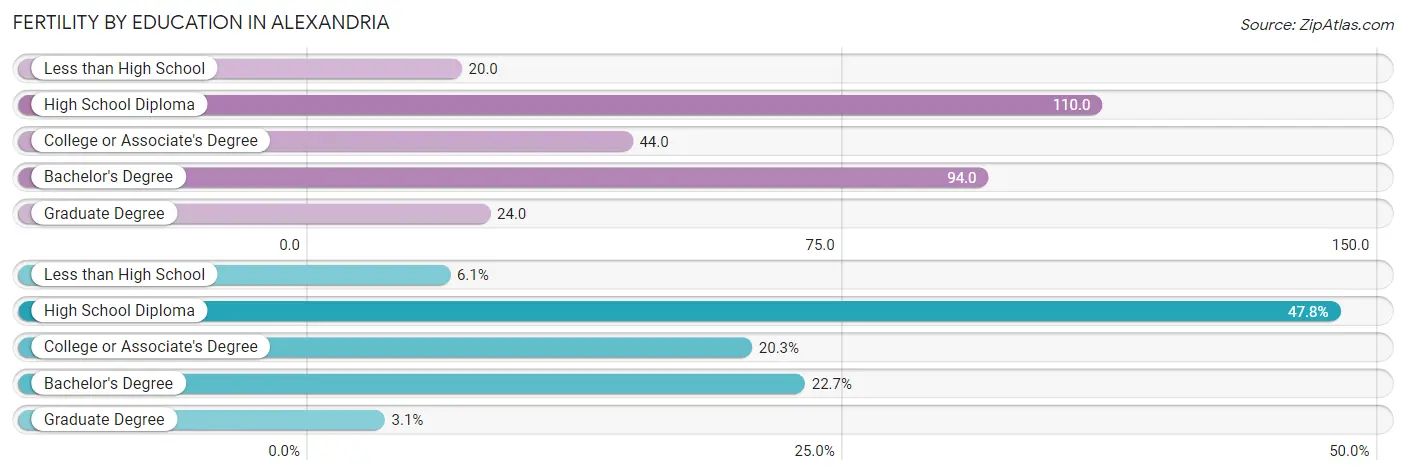
| Educational Attainment | Women with Births | Births / 1,000 Women |
| Less than High School | 42 (6.1%) | 20.0 |
| High School Diploma | 328 (47.8%) | 110.0 |
| College or Associate's Degree | 139 (20.3%) | 44.0 |
| Bachelor's Degree | 156 (22.7%) | 94.0 |
| Graduate Degree | 21 (3.1%) | 24.0 |
| Total | 686 (100.0%) | 64.0 |
Fertility by Education by Marriage Status in Alexandria
49.1% of women with births in Alexandria are unmarried. Women with the educational attainment of graduate degree are most likely to be married with 100.0% of them married at childbirth, while women with the educational attainment of less than high school are least likely to be married with 100.0% of them unmarried at childbirth.
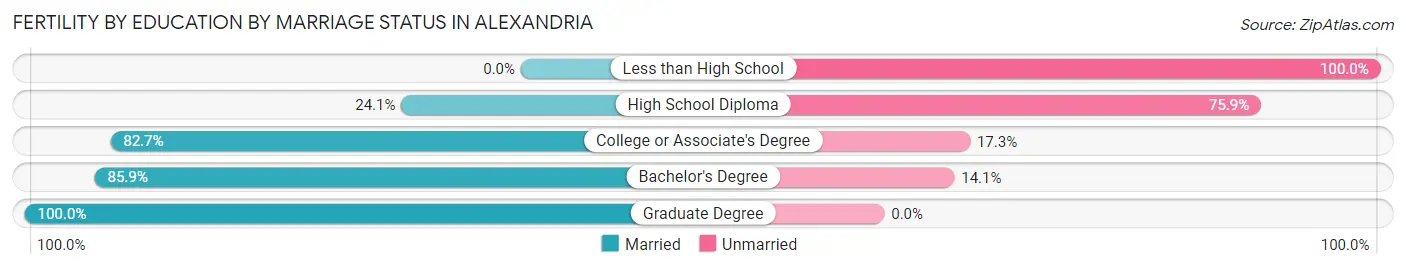
| Educational Attainment | Married | Unmarried |
| Less than High School | 0 (0.0%) | 42 (100.0%) |
| High School Diploma | 79 (24.1%) | 249 (75.9%) |
| College or Associate's Degree | 115 (82.7%) | 24 (17.3%) |
| Bachelor's Degree | 134 (85.9%) | 22 (14.1%) |
| Graduate Degree | 21 (100.0%) | 0 (0.0%) |
| Total | 349 (50.9%) | 337 (49.1%) |
Employment Characteristics in Alexandria
Employment by Class of Employer in Alexandria
Among the 18,674 employed individuals in Alexandria, private company employees (11,716 | 62.7%), not-for-profit organizations (1,753 | 9.4%), and state government employees (1,449 | 7.8%) make up the most common classes of employment.
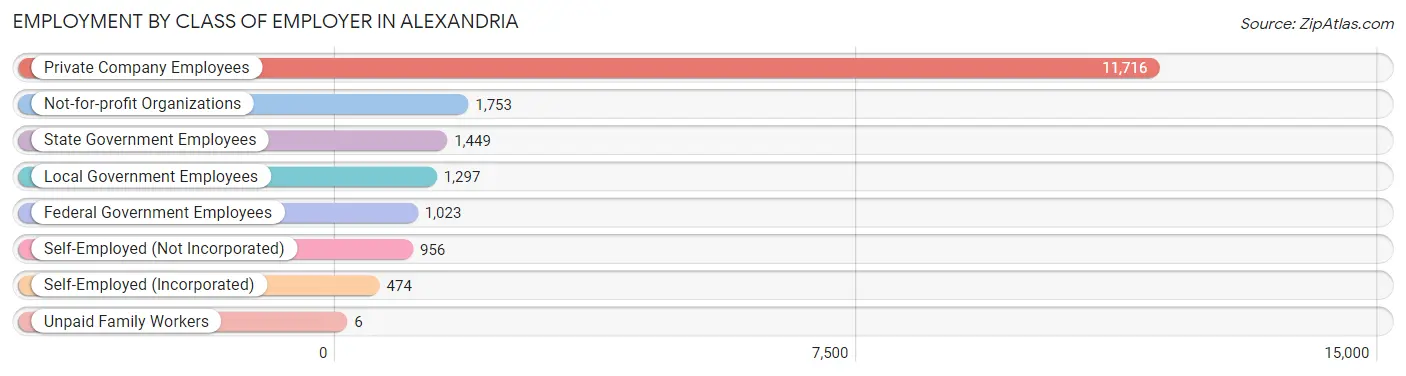
| Employer Class | # Employees | % Employees |
| Private Company Employees | 11,716 | 62.7% |
| Self-Employed (Incorporated) | 474 | 2.5% |
| Self-Employed (Not Incorporated) | 956 | 5.1% |
| Not-for-profit Organizations | 1,753 | 9.4% |
| Local Government Employees | 1,297 | 7.0% |
| State Government Employees | 1,449 | 7.8% |
| Federal Government Employees | 1,023 | 5.5% |
| Unpaid Family Workers | 6 | 0.0% |
| Total | 18,674 | 100.0% |
Employment Status by Age in Alexandria
According to the labor force statistics for Alexandria, out of the total population over 16 years of age (36,360), 57.3% or 20,834 individuals are in the labor force, with 7.5% or 1,563 of them unemployed. The age group with the highest labor force participation rate is 45 to 54 years, with 74.7% or 3,846 individuals in the labor force. Within the labor force, the 16 to 19 years age range has the highest percentage of unemployed individuals, with 25.3% or 149 of them being unemployed.
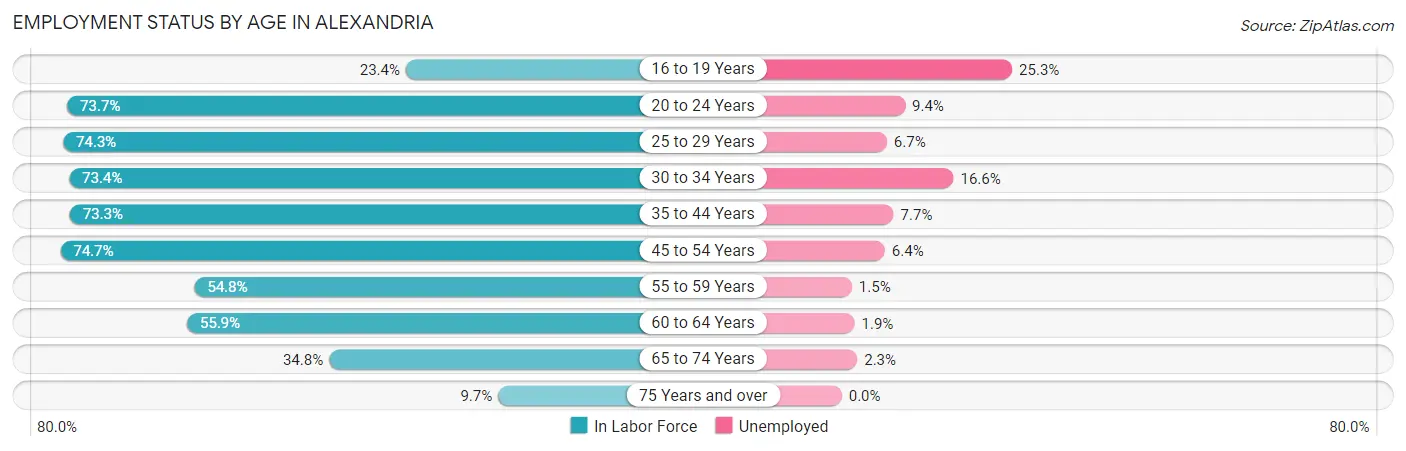
| Age Bracket | In Labor Force | Unemployed |
| 16 to 19 Years | 590 (23.4%) | 149 (25.3%) |
| 20 to 24 Years | 2,250 (73.7%) | 212 (9.4%) |
| 25 to 29 Years | 2,587 (74.3%) | 173 (6.7%) |
| 30 to 34 Years | 2,107 (73.4%) | 350 (16.6%) |
| 35 to 44 Years | 4,389 (73.3%) | 338 (7.7%) |
| 45 to 54 Years | 3,846 (74.7%) | 246 (6.4%) |
| 55 to 59 Years | 1,913 (54.8%) | 29 (1.5%) |
| 60 to 64 Years | 1,422 (55.9%) | 27 (1.9%) |
| 65 to 74 Years | 1,432 (34.8%) | 33 (2.3%) |
| 75 Years and over | 305 (9.7%) | 0 (0.0%) |
| Total | 20,834 (57.3%) | 1,563 (7.5%) |
Employment Status by Educational Attainment in Alexandria
According to labor force statistics for Alexandria, 69.2% of individuals (16,279) out of the total population between 25 and 64 years of age (23,524) are in the labor force, with 7.2% or 1,172 of them being unemployed. The group with the highest labor force participation rate are those with the educational attainment of bachelor's degree or higher, with 83.5% or 4,660 individuals in the labor force. Within the labor force, individuals with high school diploma education have the highest percentage of unemployment, with 12.3% or 693 of them being unemployed.
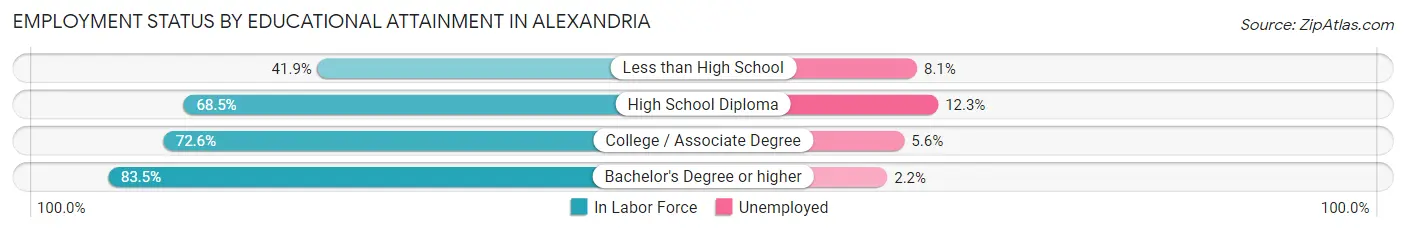
| Educational Attainment | In Labor Force | Unemployed |
| Less than High School | 1,477 (41.9%) | 285 (8.1%) |
| High School Diploma | 5,636 (68.5%) | 1,012 (12.3%) |
| College / Associate Degree | 4,495 (72.6%) | 347 (5.6%) |
| Bachelor's Degree or higher | 4,660 (83.5%) | 123 (2.2%) |
| Total | 16,279 (69.2%) | 1,694 (7.2%) |
Employment Occupations by Sex in Alexandria
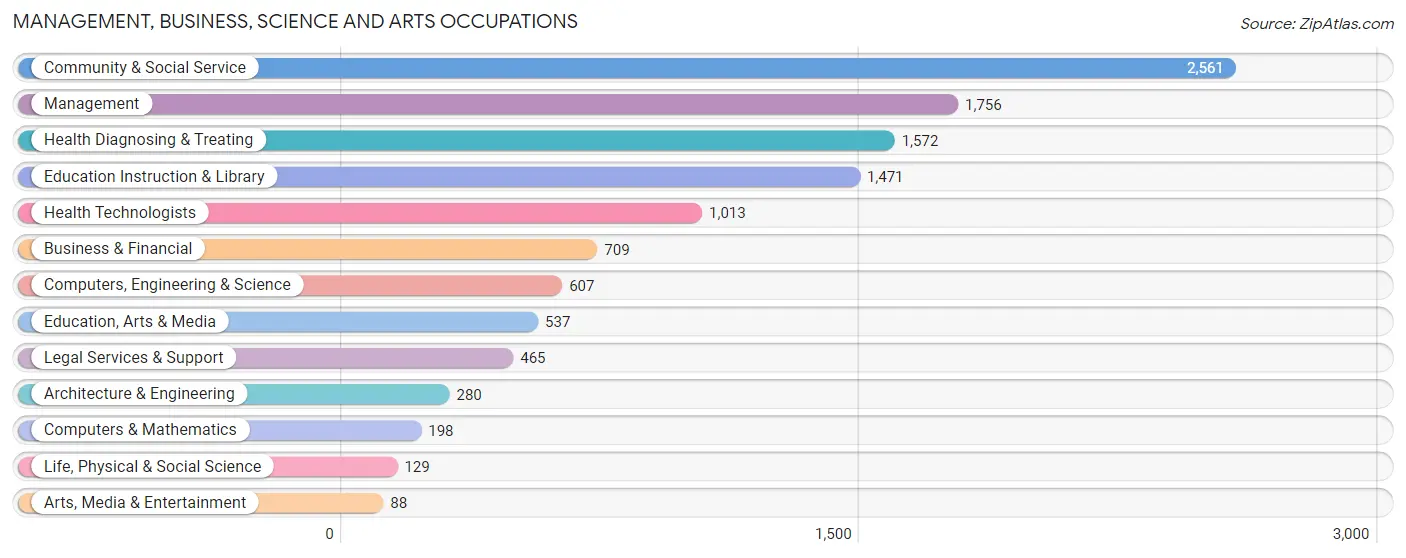
Management, Business, Science and Arts Occupations
The most common Management, Business, Science and Arts occupations in Alexandria are Community & Social Service (2,561 | 13.3%), Management (1,756 | 9.1%), Health Diagnosing & Treating (1,572 | 8.2%), Education Instruction & Library (1,471 | 7.7%), and Health Technologists (1,013 | 5.3%).
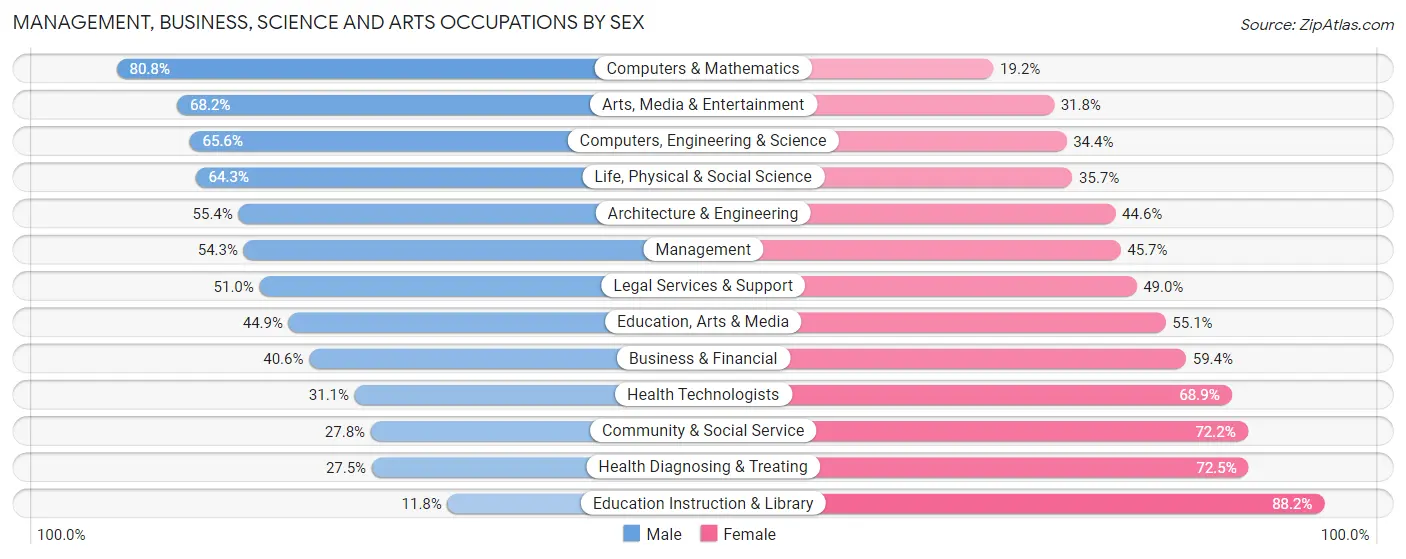
Management, Business, Science and Arts Occupations by Sex
Within the Management, Business, Science and Arts occupations in Alexandria, the most male-oriented occupations are Computers & Mathematics (80.8%), Arts, Media & Entertainment (68.2%), and Computers, Engineering & Science (65.6%), while the most female-oriented occupations are Education Instruction & Library (88.2%), Health Diagnosing & Treating (72.5%), and Community & Social Service (72.2%).
| Occupation | Male | Female |
| Management | 953 (54.3%) | 803 (45.7%) |
| Business & Financial | 288 (40.6%) | 421 (59.4%) |
| Computers, Engineering & Science | 398 (65.6%) | 209 (34.4%) |
| Computers & Mathematics | 160 (80.8%) | 38 (19.2%) |
| Architecture & Engineering | 155 (55.4%) | 125 (44.6%) |
| Life, Physical & Social Science | 83 (64.3%) | 46 (35.7%) |
| Community & Social Service | 711 (27.8%) | 1,850 (72.2%) |
| Education, Arts & Media | 241 (44.9%) | 296 (55.1%) |
| Legal Services & Support | 237 (51.0%) | 228 (49.0%) |
| Education Instruction & Library | 173 (11.8%) | 1,298 (88.2%) |
| Arts, Media & Entertainment | 60 (68.2%) | 28 (31.8%) |
| Health Diagnosing & Treating | 433 (27.5%) | 1,139 (72.5%) |
| Health Technologists | 315 (31.1%) | 698 (68.9%) |
| Total (Category) | 2,783 (38.6%) | 4,422 (61.4%) |
| Total (Overall) | 8,796 (45.8%) | 10,395 (54.2%) |
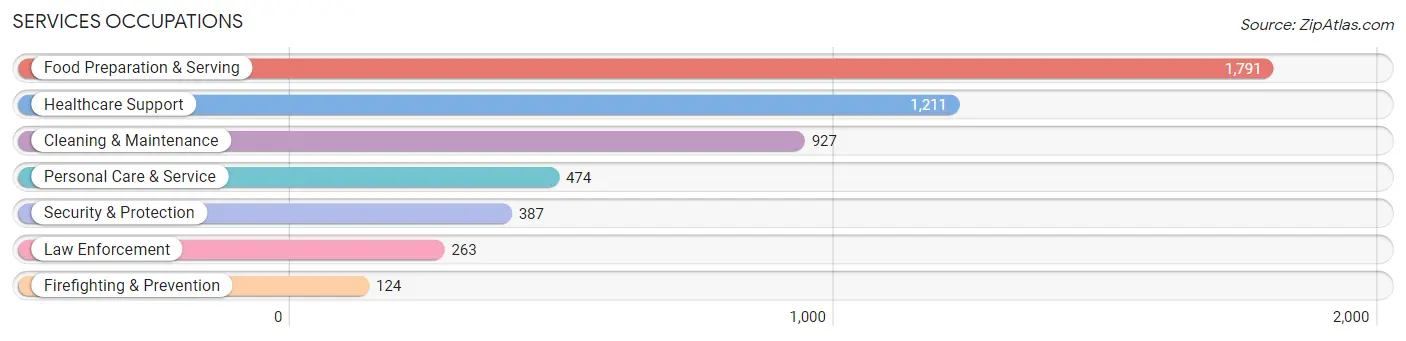
Services Occupations
The most common Services occupations in Alexandria are Food Preparation & Serving (1,791 | 9.3%), Healthcare Support (1,211 | 6.3%), Cleaning & Maintenance (927 | 4.8%), Personal Care & Service (474 | 2.5%), and Security & Protection (387 | 2.0%).
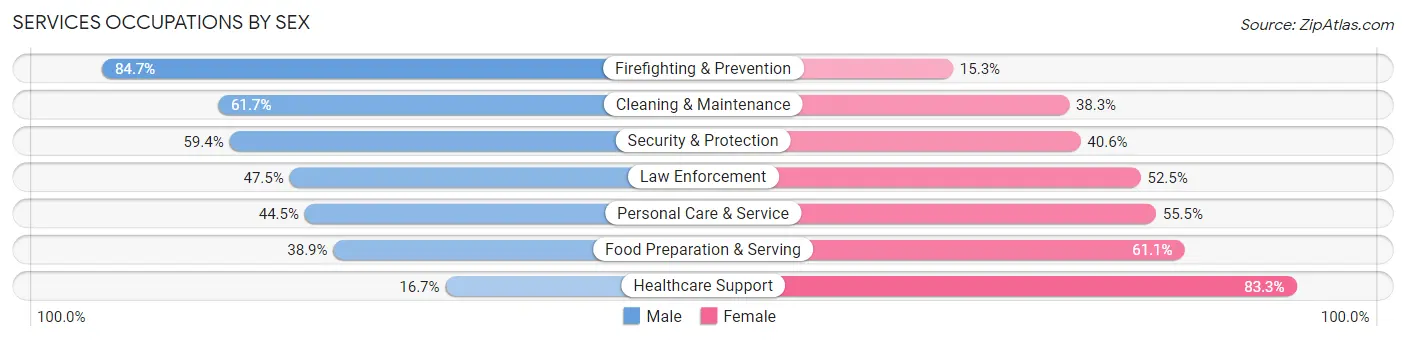
Services Occupations by Sex
Within the Services occupations in Alexandria, the most male-oriented occupations are Firefighting & Prevention (84.7%), Cleaning & Maintenance (61.7%), and Security & Protection (59.4%), while the most female-oriented occupations are Healthcare Support (83.3%), Food Preparation & Serving (61.1%), and Personal Care & Service (55.5%).
| Occupation | Male | Female |
| Healthcare Support | 202 (16.7%) | 1,009 (83.3%) |
| Security & Protection | 230 (59.4%) | 157 (40.6%) |
| Firefighting & Prevention | 105 (84.7%) | 19 (15.3%) |
| Law Enforcement | 125 (47.5%) | 138 (52.5%) |
| Food Preparation & Serving | 696 (38.9%) | 1,095 (61.1%) |
| Cleaning & Maintenance | 572 (61.7%) | 355 (38.3%) |
| Personal Care & Service | 211 (44.5%) | 263 (55.5%) |
| Total (Category) | 1,911 (39.9%) | 2,879 (60.1%) |
| Total (Overall) | 8,796 (45.8%) | 10,395 (54.2%) |
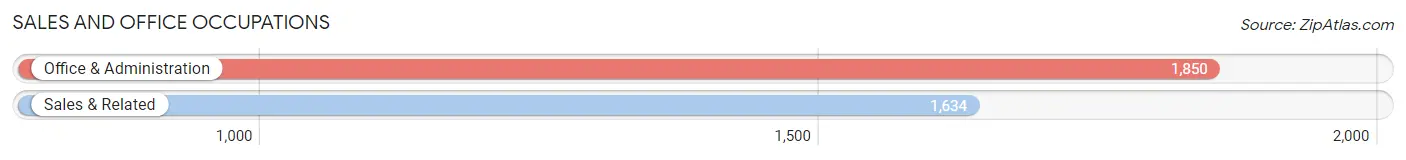
Sales and Office Occupations
The most common Sales and Office occupations in Alexandria are Office & Administration (1,850 | 9.6%), and Sales & Related (1,634 | 8.5%).
Sales and Office Occupations by Sex
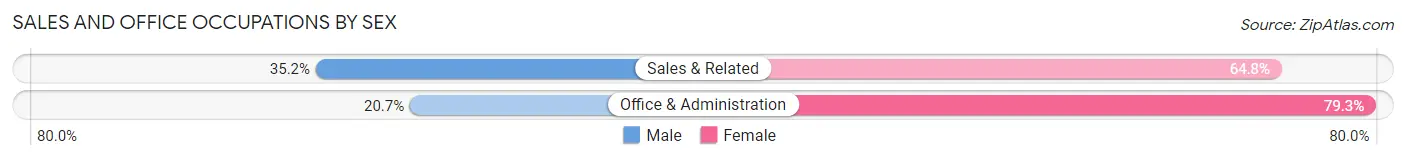
| Occupation | Male | Female |
| Sales & Related | 575 (35.2%) | 1,059 (64.8%) |
| Office & Administration | 383 (20.7%) | 1,467 (79.3%) |
| Total (Category) | 958 (27.5%) | 2,526 (72.5%) |
| Total (Overall) | 8,796 (45.8%) | 10,395 (54.2%) |
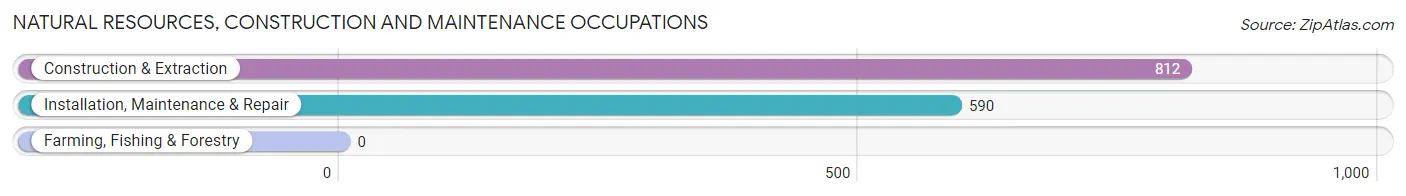
Natural Resources, Construction and Maintenance Occupations
The most common Natural Resources, Construction and Maintenance occupations in Alexandria are Construction & Extraction (812 | 4.2%), and Installation, Maintenance & Repair (590 | 3.1%).
Natural Resources, Construction and Maintenance Occupations by Sex
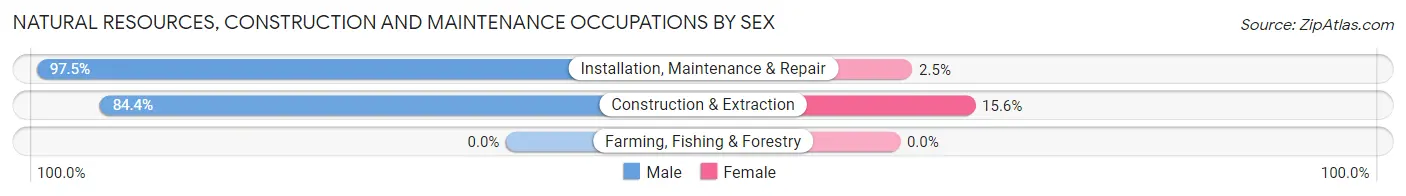
| Occupation | Male | Female |
| Farming, Fishing & Forestry | 0 (0.0%) | 0 (0.0%) |
| Construction & Extraction | 685 (84.4%) | 127 (15.6%) |
| Installation, Maintenance & Repair | 575 (97.5%) | 15 (2.5%) |
| Total (Category) | 1,260 (89.9%) | 142 (10.1%) |
| Total (Overall) | 8,796 (45.8%) | 10,395 (54.2%) |
Production, Transportation and Moving Occupations
The most common Production, Transportation and Moving occupations in Alexandria are Material Moving (960 | 5.0%), Transportation (731 | 3.8%), and Production (619 | 3.2%).
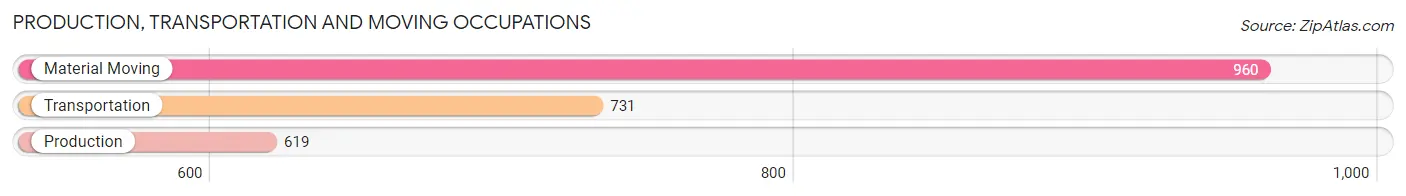
Production, Transportation and Moving Occupations by Sex
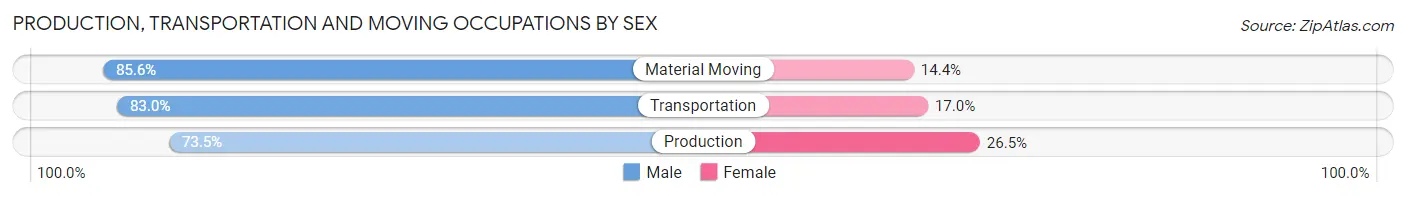
| Occupation | Male | Female |
| Production | 455 (73.5%) | 164 (26.5%) |
| Transportation | 607 (83.0%) | 124 (17.0%) |
| Material Moving | 822 (85.6%) | 138 (14.4%) |
| Total (Category) | 1,884 (81.6%) | 426 (18.4%) |
| Total (Overall) | 8,796 (45.8%) | 10,395 (54.2%) |
Employment Industries by Sex in Alexandria
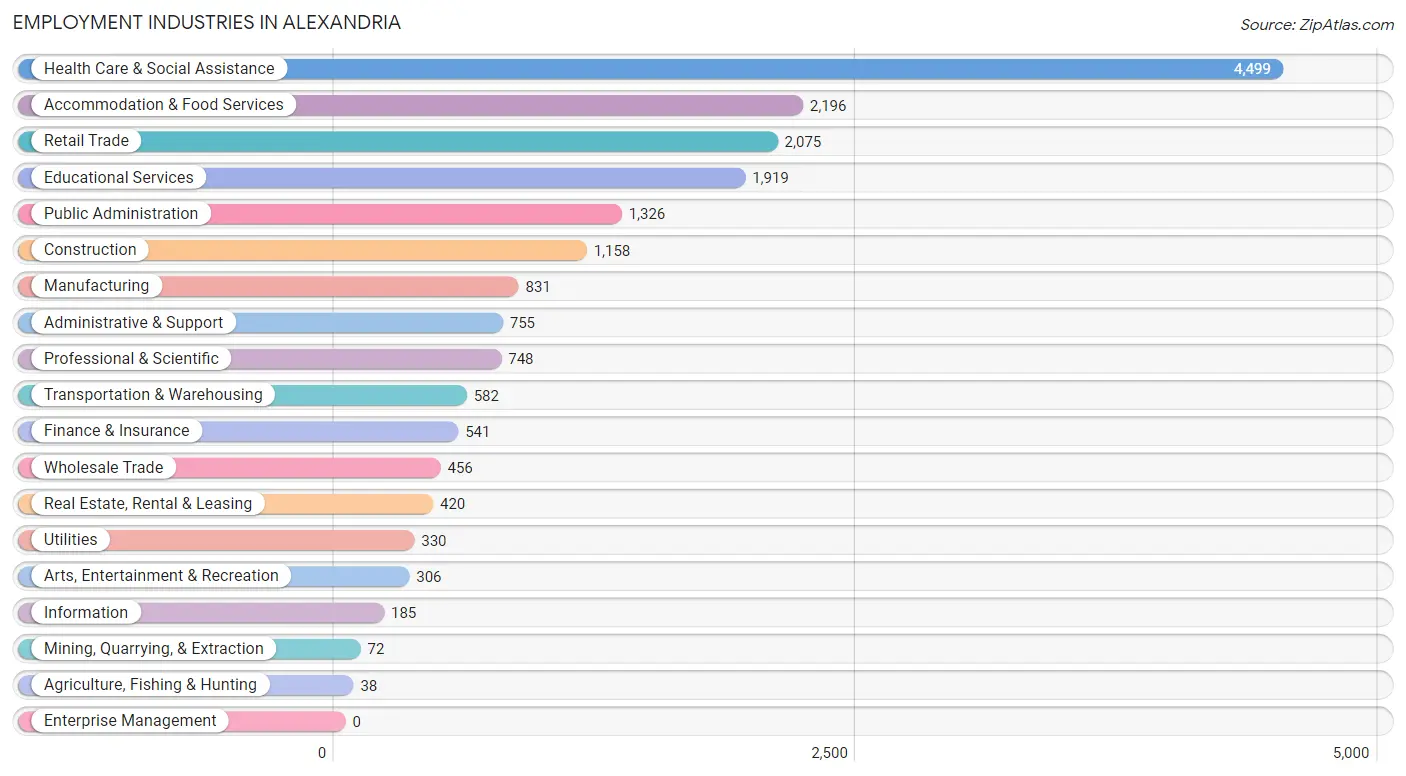
Employment Industries in Alexandria
The major employment industries in Alexandria include Health Care & Social Assistance (4,499 | 23.4%), Accommodation & Food Services (2,196 | 11.4%), Retail Trade (2,075 | 10.8%), Educational Services (1,919 | 10.0%), and Public Administration (1,326 | 6.9%).
Employment Industries by Sex in Alexandria
The Alexandria industries that see more men than women are Mining, Quarrying, & Extraction (100.0%), Wholesale Trade (88.8%), and Construction (86.7%), whereas the industries that tend to have a higher number of women are Health Care & Social Assistance (80.4%), Educational Services (74.3%), and Agriculture, Fishing & Hunting (71.1%).
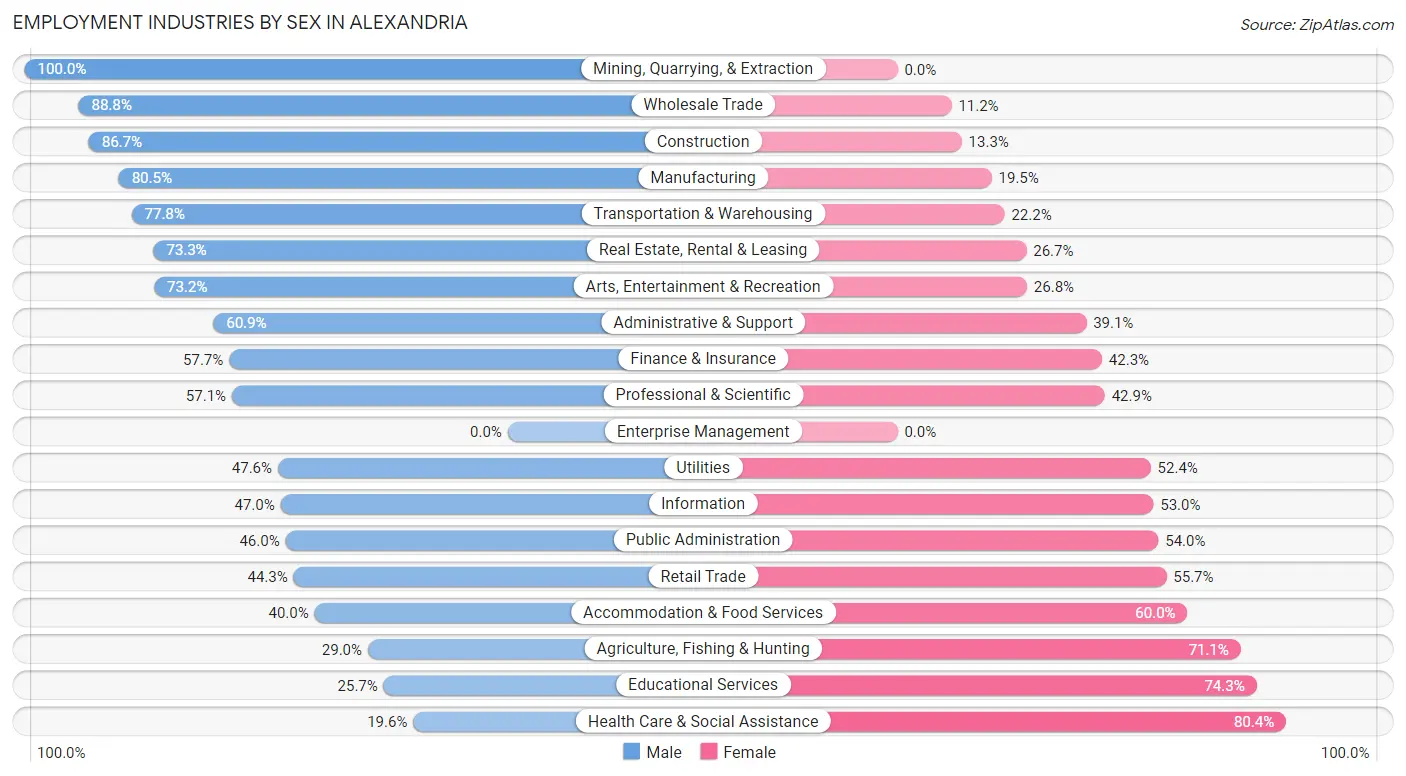
| Industry | Male | Female |
| Agriculture, Fishing & Hunting | 11 (28.9%) | 27 (71.1%) |
| Mining, Quarrying, & Extraction | 72 (100.0%) | 0 (0.0%) |
| Construction | 1,004 (86.7%) | 154 (13.3%) |
| Manufacturing | 669 (80.5%) | 162 (19.5%) |
| Wholesale Trade | 405 (88.8%) | 51 (11.2%) |
| Retail Trade | 920 (44.3%) | 1,155 (55.7%) |
| Transportation & Warehousing | 453 (77.8%) | 129 (22.2%) |
| Utilities | 157 (47.6%) | 173 (52.4%) |
| Information | 87 (47.0%) | 98 (53.0%) |
| Finance & Insurance | 312 (57.7%) | 229 (42.3%) |
| Real Estate, Rental & Leasing | 308 (73.3%) | 112 (26.7%) |
| Professional & Scientific | 427 (57.1%) | 321 (42.9%) |
| Enterprise Management | 0 (0.0%) | 0 (0.0%) |
| Administrative & Support | 460 (60.9%) | 295 (39.1%) |
| Educational Services | 493 (25.7%) | 1,426 (74.3%) |
| Health Care & Social Assistance | 880 (19.6%) | 3,619 (80.4%) |
| Arts, Entertainment & Recreation | 224 (73.2%) | 82 (26.8%) |
| Accommodation & Food Services | 878 (40.0%) | 1,318 (60.0%) |
| Public Administration | 610 (46.0%) | 716 (54.0%) |
| Total | 8,796 (45.8%) | 10,395 (54.2%) |
Education in Alexandria
School Enrollment in Alexandria
The most common levels of schooling among the 10,764 students in Alexandria are high school (2,703 | 25.1%), middle school (2,461 | 22.9%), and elementary school (2,298 | 21.3%).
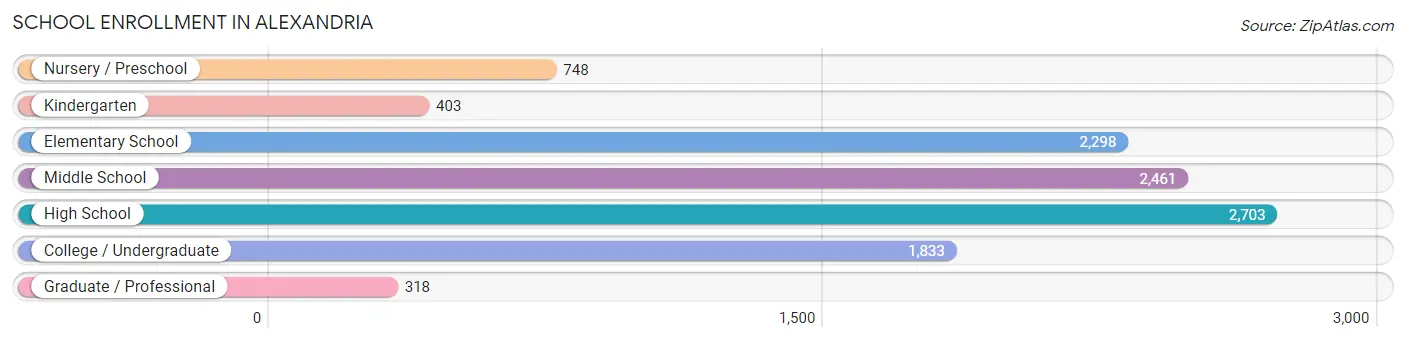
| School Level | # Students | % Students |
| Nursery / Preschool | 748 | 7.0% |
| Kindergarten | 403 | 3.7% |
| Elementary School | 2,298 | 21.3% |
| Middle School | 2,461 | 22.9% |
| High School | 2,703 | 25.1% |
| College / Undergraduate | 1,833 | 17.0% |
| Graduate / Professional | 318 | 2.9% |
| Total | 10,764 | 100.0% |
School Enrollment by Age by Funding Source in Alexandria
Out of a total of 10,764 students who are enrolled in schools in Alexandria, 1,432 (13.3%) attend a private institution, while the remaining 9,332 (86.7%) are enrolled in public schools. The age group of 20 to 24 year olds has the highest likelihood of being enrolled in private schools, with 296 (41.7% in the age bracket) enrolled. Conversely, the age group of 25 to 34 year olds has the lowest likelihood of being enrolled in a private school, with 661 (98.5% in the age bracket) attending a public institution.
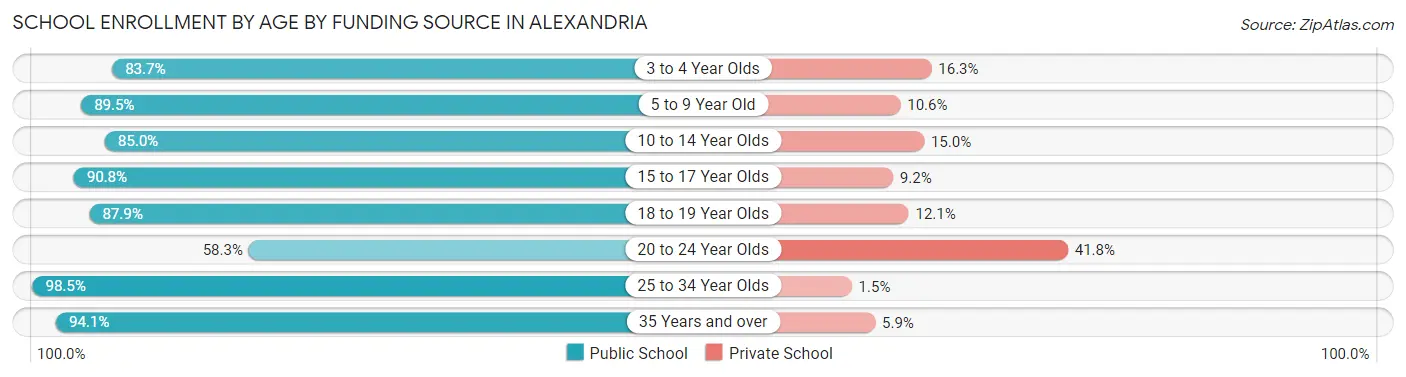
| Age Bracket | Public School | Private School |
| 3 to 4 Year Olds | 579 (83.7%) | 113 (16.3%) |
| 5 to 9 Year Old | 2,129 (89.4%) | 251 (10.5%) |
| 10 to 14 Year Olds | 2,695 (85.0%) | 474 (15.0%) |
| 15 to 17 Year Olds | 1,764 (90.8%) | 178 (9.2%) |
| 18 to 19 Year Olds | 531 (87.9%) | 73 (12.1%) |
| 20 to 24 Year Olds | 413 (58.3%) | 296 (41.7%) |
| 25 to 34 Year Olds | 661 (98.5%) | 10 (1.5%) |
| 35 Years and over | 562 (94.1%) | 35 (5.9%) |
| Total | 9,332 (86.7%) | 1,432 (13.3%) |
Educational Attainment by Field of Study in Alexandria
Business (1,545 | 19.0%), education (1,384 | 17.1%), science & technology (972 | 12.0%), arts & humanities (766 | 9.4%), and psychology (654 | 8.1%) are the most common fields of study among 8,117 individuals in Alexandria who have obtained a bachelor's degree or higher.
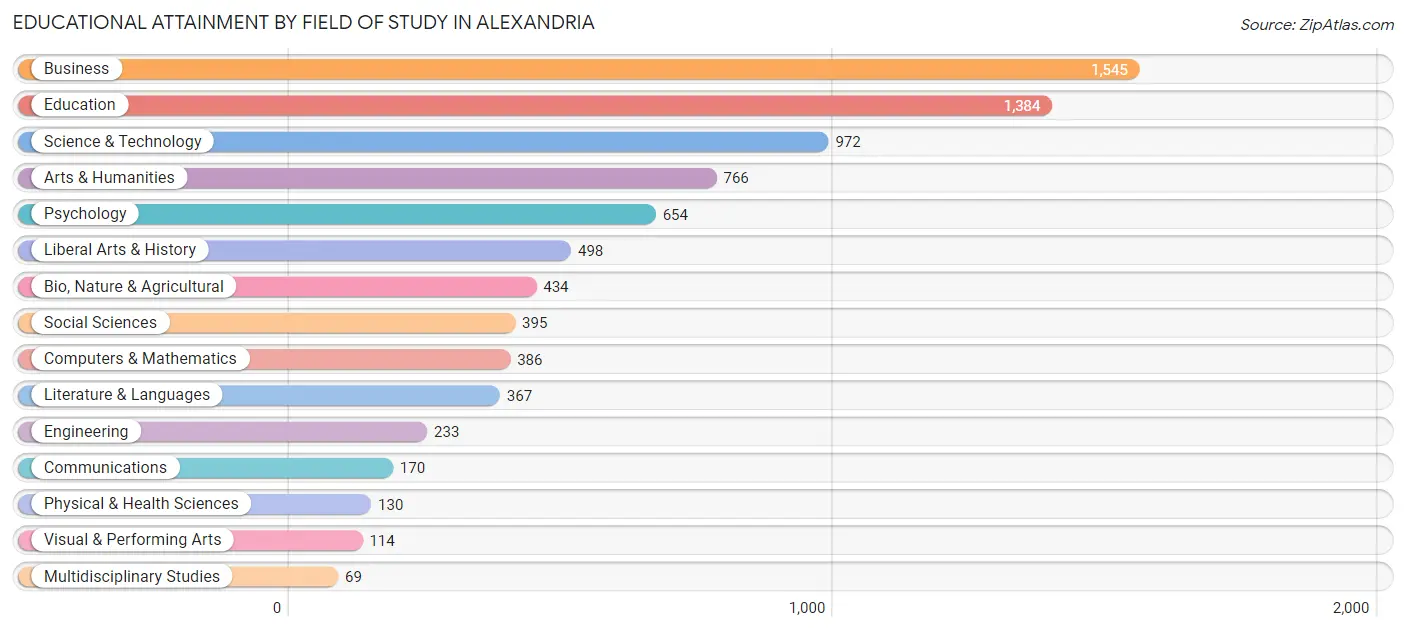
| Field of Study | # Graduates | % Graduates |
| Computers & Mathematics | 386 | 4.8% |
| Bio, Nature & Agricultural | 434 | 5.3% |
| Physical & Health Sciences | 130 | 1.6% |
| Psychology | 654 | 8.1% |
| Social Sciences | 395 | 4.9% |
| Engineering | 233 | 2.9% |
| Multidisciplinary Studies | 69 | 0.9% |
| Science & Technology | 972 | 12.0% |
| Business | 1,545 | 19.0% |
| Education | 1,384 | 17.1% |
| Literature & Languages | 367 | 4.5% |
| Liberal Arts & History | 498 | 6.1% |
| Visual & Performing Arts | 114 | 1.4% |
| Communications | 170 | 2.1% |
| Arts & Humanities | 766 | 9.4% |
| Total | 8,117 | 100.0% |
Transportation & Commute in Alexandria
Vehicle Availability by Sex in Alexandria
The most prevalent vehicle ownership categories in Alexandria are males with 2 vehicles (3,599, accounting for 42.7%) and females with 2 vehicles (3,578, making up 35.5%).
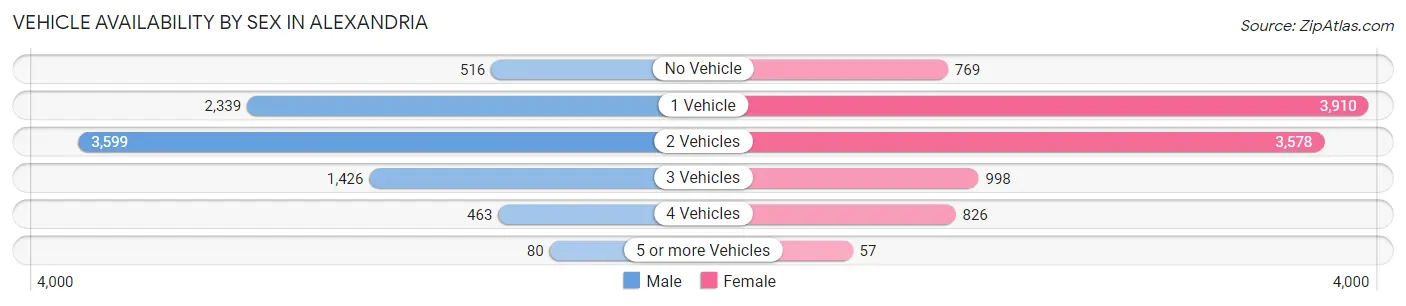
| Vehicles Available | Male | Female |
| No Vehicle | 516 (6.1%) | 769 (7.6%) |
| 1 Vehicle | 2,339 (27.8%) | 3,910 (38.6%) |
| 2 Vehicles | 3,599 (42.7%) | 3,578 (35.3%) |
| 3 Vehicles | 1,426 (16.9%) | 998 (9.8%) |
| 4 Vehicles | 463 (5.5%) | 826 (8.2%) |
| 5 or more Vehicles | 80 (0.9%) | 57 (0.6%) |
| Total | 8,423 (100.0%) | 10,138 (100.0%) |
Commute Time in Alexandria
The most frequently occuring commute durations in Alexandria are 10 to 14 minutes (4,401 commuters, 24.4%), 15 to 19 minutes (4,234 commuters, 23.5%), and 5 to 9 minutes (3,968 commuters, 22.0%).
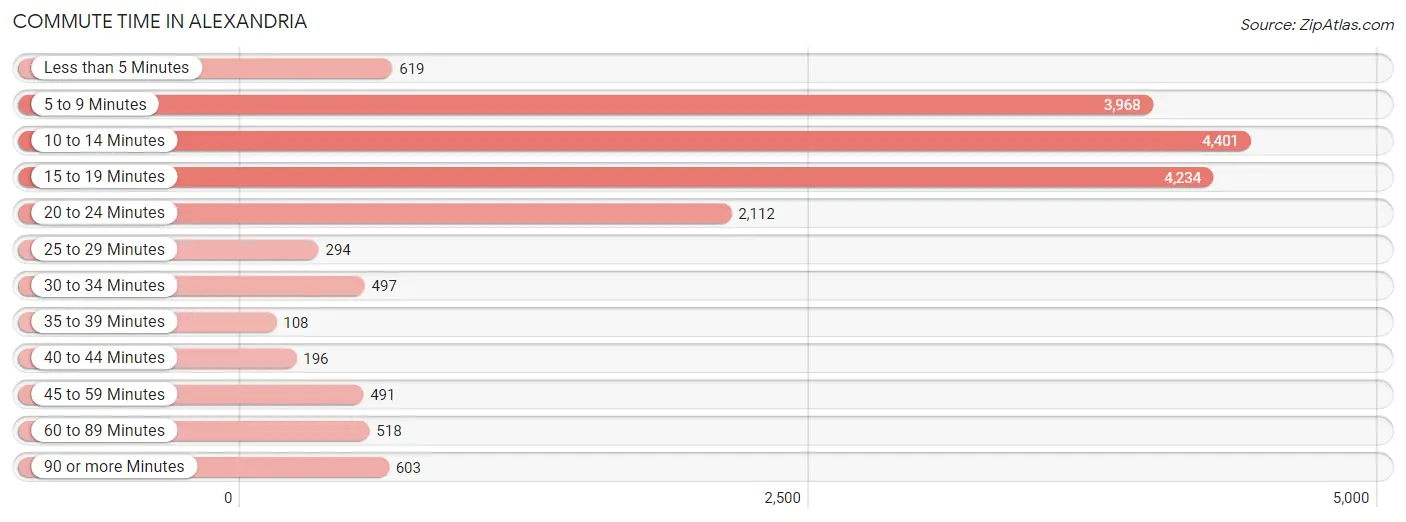
| Commute Time | # Commuters | % Commuters |
| Less than 5 Minutes | 619 | 3.4% |
| 5 to 9 Minutes | 3,968 | 22.0% |
| 10 to 14 Minutes | 4,401 | 24.4% |
| 15 to 19 Minutes | 4,234 | 23.5% |
| 20 to 24 Minutes | 2,112 | 11.7% |
| 25 to 29 Minutes | 294 | 1.6% |
| 30 to 34 Minutes | 497 | 2.8% |
| 35 to 39 Minutes | 108 | 0.6% |
| 40 to 44 Minutes | 196 | 1.1% |
| 45 to 59 Minutes | 491 | 2.7% |
| 60 to 89 Minutes | 518 | 2.9% |
| 90 or more Minutes | 603 | 3.3% |
Commute Time by Sex in Alexandria
The most common commute times in Alexandria are 15 to 19 minutes (1,954 commuters, 23.8%) for males and 10 to 14 minutes (2,775 commuters, 28.2%) for females.
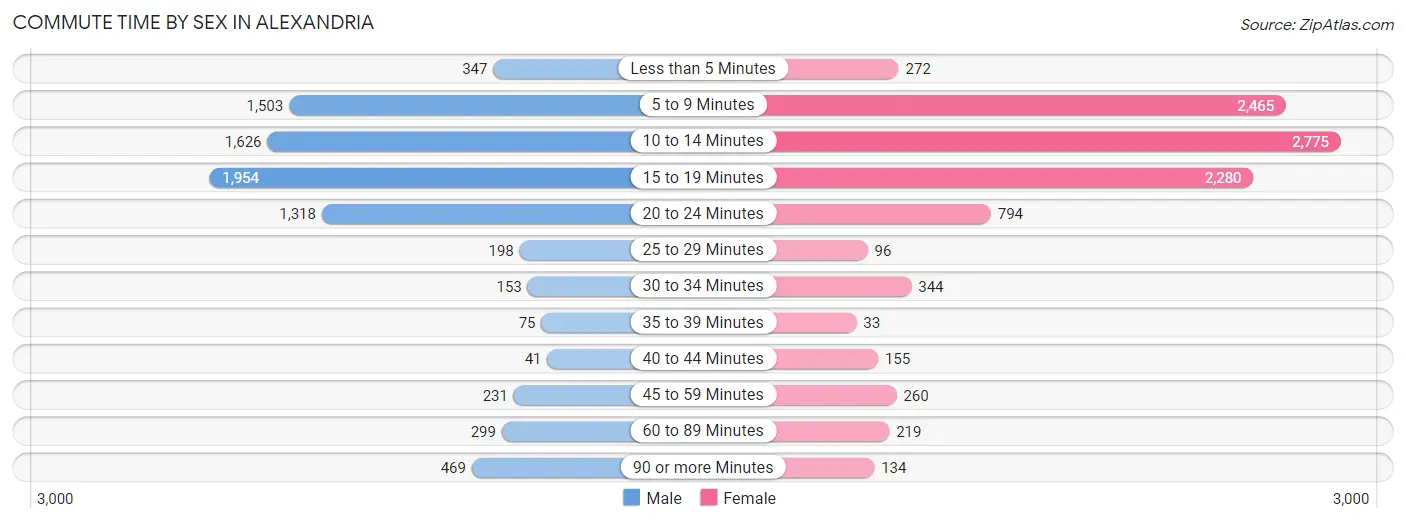
| Commute Time | Male | Female |
| Less than 5 Minutes | 347 (4.2%) | 272 (2.8%) |
| 5 to 9 Minutes | 1,503 (18.3%) | 2,465 (25.1%) |
| 10 to 14 Minutes | 1,626 (19.8%) | 2,775 (28.2%) |
| 15 to 19 Minutes | 1,954 (23.8%) | 2,280 (23.2%) |
| 20 to 24 Minutes | 1,318 (16.1%) | 794 (8.1%) |
| 25 to 29 Minutes | 198 (2.4%) | 96 (1.0%) |
| 30 to 34 Minutes | 153 (1.9%) | 344 (3.5%) |
| 35 to 39 Minutes | 75 (0.9%) | 33 (0.3%) |
| 40 to 44 Minutes | 41 (0.5%) | 155 (1.6%) |
| 45 to 59 Minutes | 231 (2.8%) | 260 (2.6%) |
| 60 to 89 Minutes | 299 (3.6%) | 219 (2.2%) |
| 90 or more Minutes | 469 (5.7%) | 134 (1.4%) |
Time of Departure to Work by Sex in Alexandria
The most frequent times of departure to work in Alexandria are 7:00 AM to 7:29 AM (1,203, 14.6%) for males and 7:30 AM to 7:59 AM (2,004, 20.4%) for females.
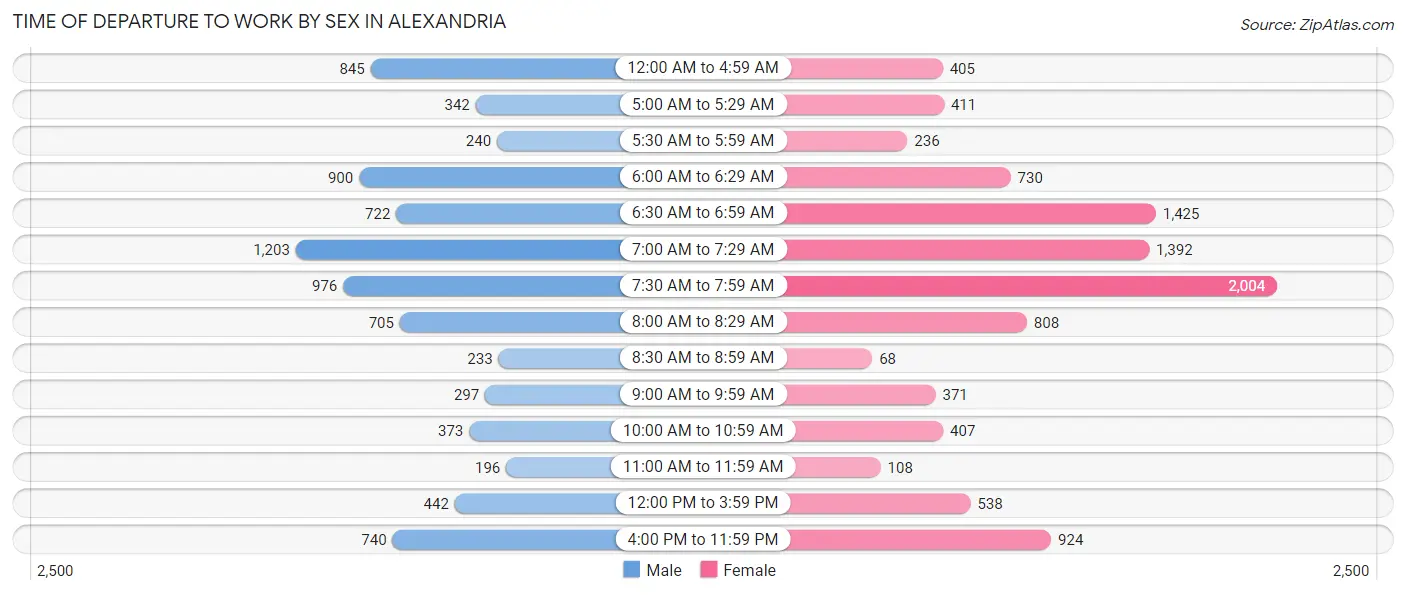
| Time of Departure | Male | Female |
| 12:00 AM to 4:59 AM | 845 (10.3%) | 405 (4.1%) |
| 5:00 AM to 5:29 AM | 342 (4.2%) | 411 (4.2%) |
| 5:30 AM to 5:59 AM | 240 (2.9%) | 236 (2.4%) |
| 6:00 AM to 6:29 AM | 900 (11.0%) | 730 (7.4%) |
| 6:30 AM to 6:59 AM | 722 (8.8%) | 1,425 (14.5%) |
| 7:00 AM to 7:29 AM | 1,203 (14.6%) | 1,392 (14.2%) |
| 7:30 AM to 7:59 AM | 976 (11.9%) | 2,004 (20.4%) |
| 8:00 AM to 8:29 AM | 705 (8.6%) | 808 (8.2%) |
| 8:30 AM to 8:59 AM | 233 (2.8%) | 68 (0.7%) |
| 9:00 AM to 9:59 AM | 297 (3.6%) | 371 (3.8%) |
| 10:00 AM to 10:59 AM | 373 (4.5%) | 407 (4.1%) |
| 11:00 AM to 11:59 AM | 196 (2.4%) | 108 (1.1%) |
| 12:00 PM to 3:59 PM | 442 (5.4%) | 538 (5.5%) |
| 4:00 PM to 11:59 PM | 740 (9.0%) | 924 (9.4%) |
| Total | 8,214 (100.0%) | 9,827 (100.0%) |
Housing Occupancy in Alexandria
Occupancy by Ownership in Alexandria
Of the total 17,095 dwellings in Alexandria, owner-occupied units account for 9,208 (53.9%), while renter-occupied units make up 7,887 (46.1%).
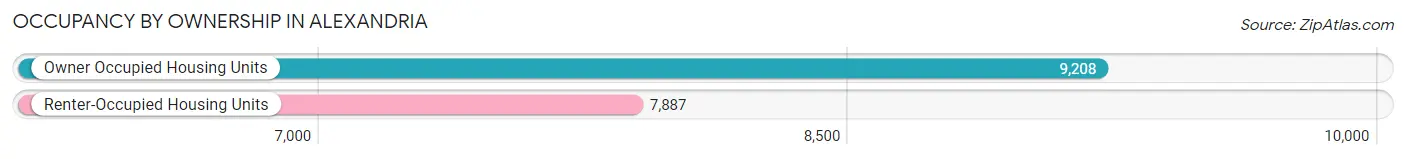
| Occupancy | # Housing Units | % Housing Units |
| Owner Occupied Housing Units | 9,208 | 53.9% |
| Renter-Occupied Housing Units | 7,887 | 46.1% |
| Total Occupied Housing Units | 17,095 | 100.0% |
Occupancy by Household Size in Alexandria

| Household Size | # Housing Units | % Housing Units |
| 1-Person Household | 5,858 | 34.3% |
| 2-Person Household | 5,587 | 32.7% |
| 3-Person Household | 2,557 | 15.0% |
| 4+ Person Household | 3,093 | 18.1% |
| Total Housing Units | 17,095 | 100.0% |
Occupancy by Ownership by Household Size in Alexandria
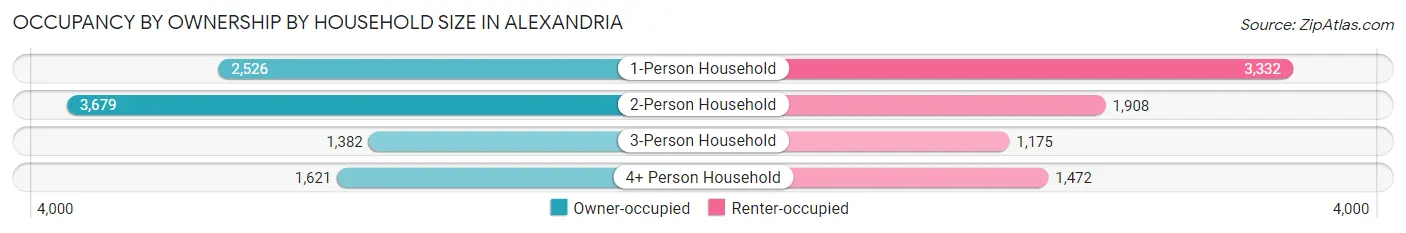
| Household Size | Owner-occupied | Renter-occupied |
| 1-Person Household | 2,526 (43.1%) | 3,332 (56.9%) |
| 2-Person Household | 3,679 (65.8%) | 1,908 (34.2%) |
| 3-Person Household | 1,382 (54.0%) | 1,175 (46.0%) |
| 4+ Person Household | 1,621 (52.4%) | 1,472 (47.6%) |
| Total Housing Units | 9,208 (53.9%) | 7,887 (46.1%) |
Occupancy by Educational Attainment in Alexandria
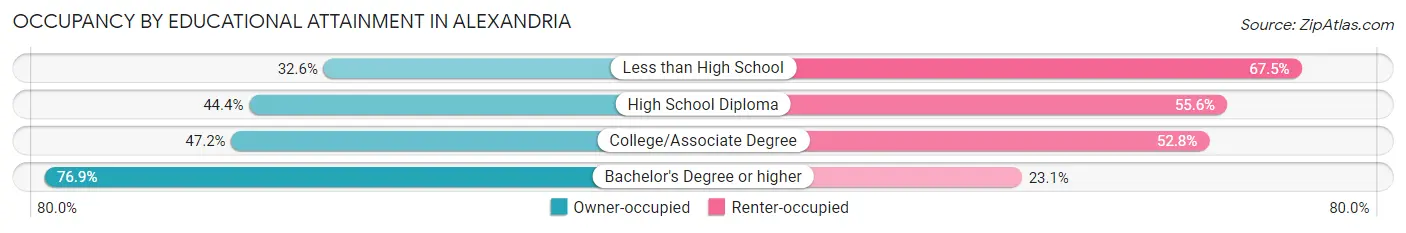
| Household Size | Owner-occupied | Renter-occupied |
| Less than High School | 595 (32.6%) | 1,233 (67.4%) |
| High School Diploma | 2,351 (44.4%) | 2,948 (55.6%) |
| College/Associate Degree | 2,232 (47.2%) | 2,497 (52.8%) |
| Bachelor's Degree or higher | 4,030 (76.9%) | 1,209 (23.1%) |
Occupancy by Age of Householder in Alexandria
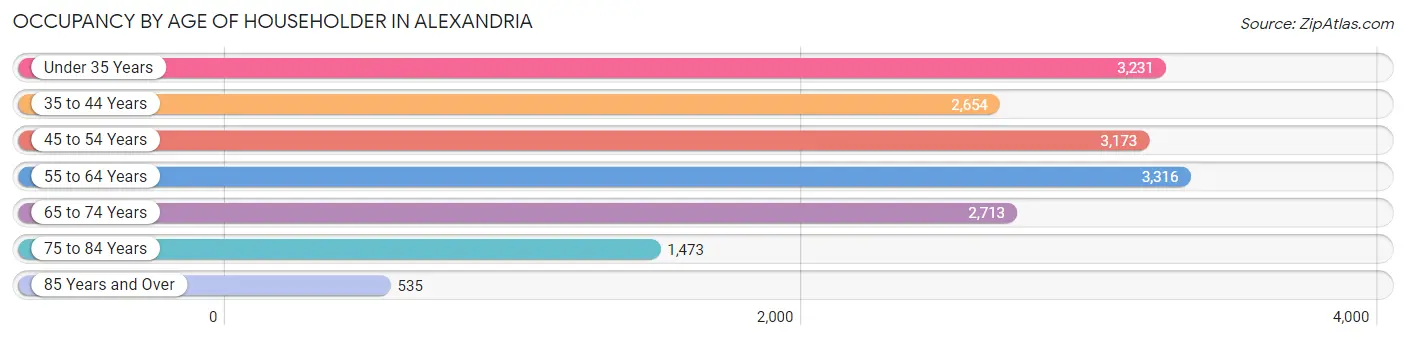
| Age Bracket | # Households | % Households |
| Under 35 Years | 3,231 | 18.9% |
| 35 to 44 Years | 2,654 | 15.5% |
| 45 to 54 Years | 3,173 | 18.6% |
| 55 to 64 Years | 3,316 | 19.4% |
| 65 to 74 Years | 2,713 | 15.9% |
| 75 to 84 Years | 1,473 | 8.6% |
| 85 Years and Over | 535 | 3.1% |
| Total | 17,095 | 100.0% |
Housing Finances in Alexandria
Median Income by Occupancy in Alexandria
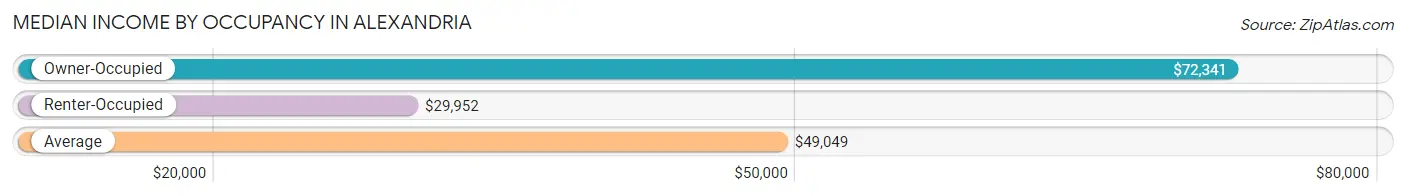
| Occupancy Type | # Households | Median Income |
| Owner-Occupied | 9,208 (53.9%) | $72,341 |
| Renter-Occupied | 7,887 (46.1%) | $29,952 |
| Average | 17,095 (100.0%) | $49,049 |
Occupancy by Householder Income Bracket in Alexandria
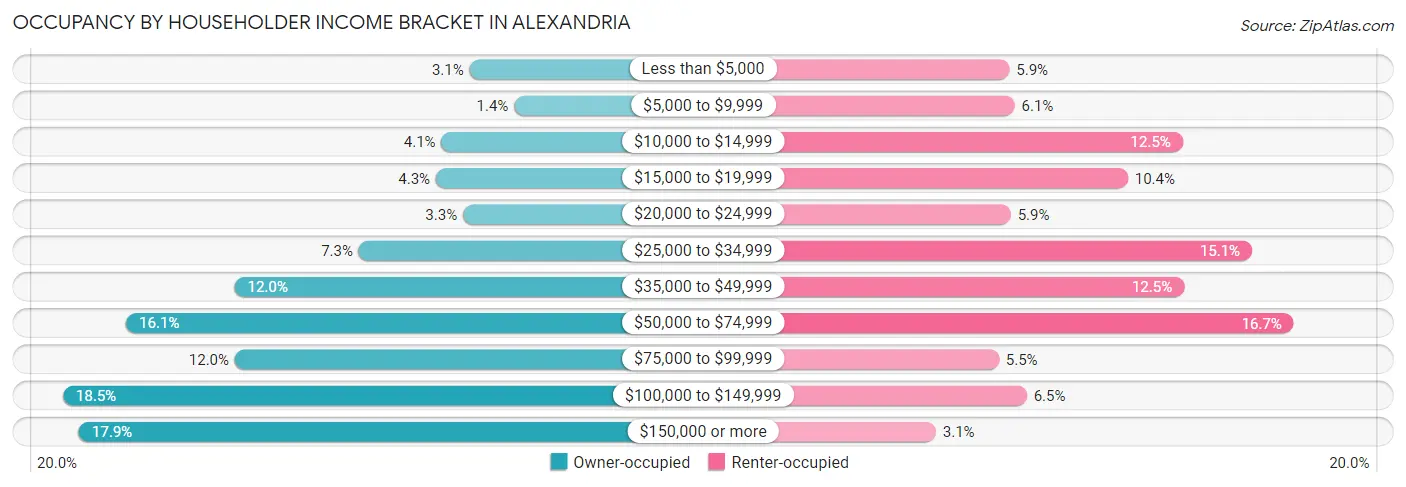
| Income Bracket | Owner-occupied | Renter-occupied |
| Less than $5,000 | 281 (3.0%) | 462 (5.9%) |
| $5,000 to $9,999 | 124 (1.3%) | 478 (6.1%) |
| $10,000 to $14,999 | 379 (4.1%) | 983 (12.5%) |
| $15,000 to $19,999 | 399 (4.3%) | 818 (10.4%) |
| $20,000 to $24,999 | 304 (3.3%) | 466 (5.9%) |
| $25,000 to $34,999 | 669 (7.3%) | 1,191 (15.1%) |
| $35,000 to $49,999 | 1,105 (12.0%) | 987 (12.5%) |
| $50,000 to $74,999 | 1,485 (16.1%) | 1,316 (16.7%) |
| $75,000 to $99,999 | 1,104 (12.0%) | 431 (5.5%) |
| $100,000 to $149,999 | 1,707 (18.5%) | 514 (6.5%) |
| $150,000 or more | 1,651 (17.9%) | 241 (3.1%) |
| Total | 9,208 (100.0%) | 7,887 (100.0%) |
Monthly Housing Cost Tiers in Alexandria
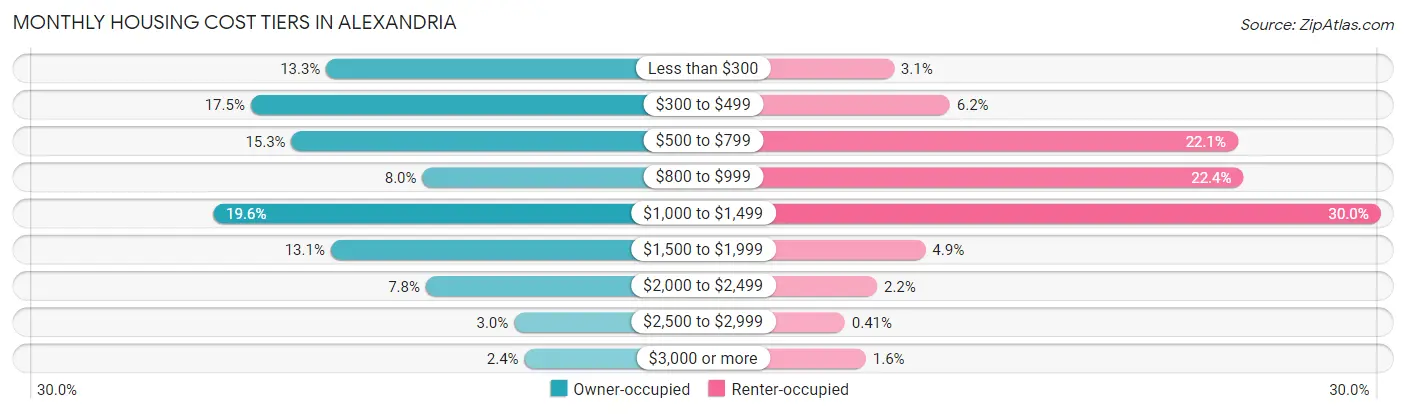
| Monthly Cost | Owner-occupied | Renter-occupied |
| Less than $300 | 1,228 (13.3%) | 246 (3.1%) |
| $300 to $499 | 1,612 (17.5%) | 490 (6.2%) |
| $500 to $799 | 1,405 (15.3%) | 1,744 (22.1%) |
| $800 to $999 | 739 (8.0%) | 1,768 (22.4%) |
| $1,000 to $1,499 | 1,804 (19.6%) | 2,366 (30.0%) |
| $1,500 to $1,999 | 1,205 (13.1%) | 383 (4.9%) |
| $2,000 to $2,499 | 722 (7.8%) | 173 (2.2%) |
| $2,500 to $2,999 | 273 (3.0%) | 32 (0.4%) |
| $3,000 or more | 220 (2.4%) | 124 (1.6%) |
| Total | 9,208 (100.0%) | 7,887 (100.0%) |
Physical Housing Characteristics in Alexandria
Housing Structures in Alexandria
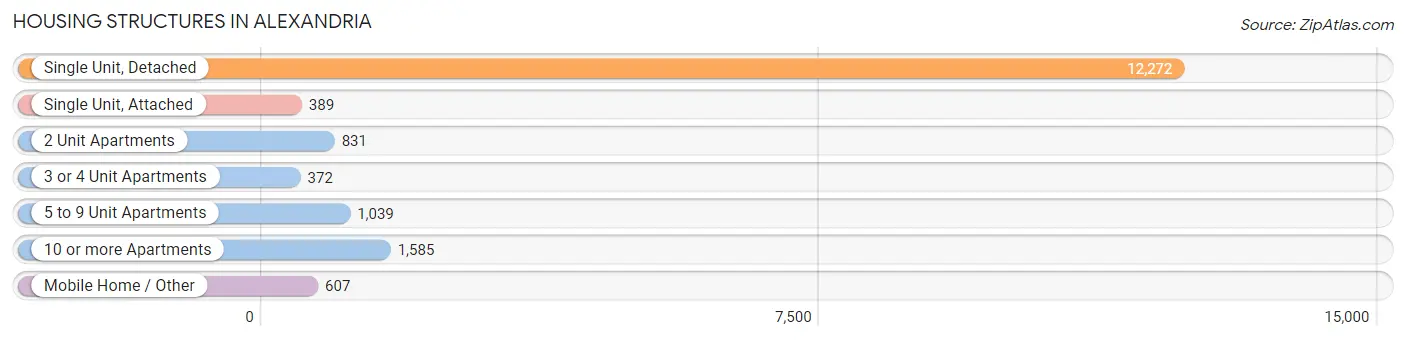
| Structure Type | # Housing Units | % Housing Units |
| Single Unit, Detached | 12,272 | 71.8% |
| Single Unit, Attached | 389 | 2.3% |
| 2 Unit Apartments | 831 | 4.9% |
| 3 or 4 Unit Apartments | 372 | 2.2% |
| 5 to 9 Unit Apartments | 1,039 | 6.1% |
| 10 or more Apartments | 1,585 | 9.3% |
| Mobile Home / Other | 607 | 3.5% |
| Total | 17,095 | 100.0% |
Housing Structures by Occupancy in Alexandria
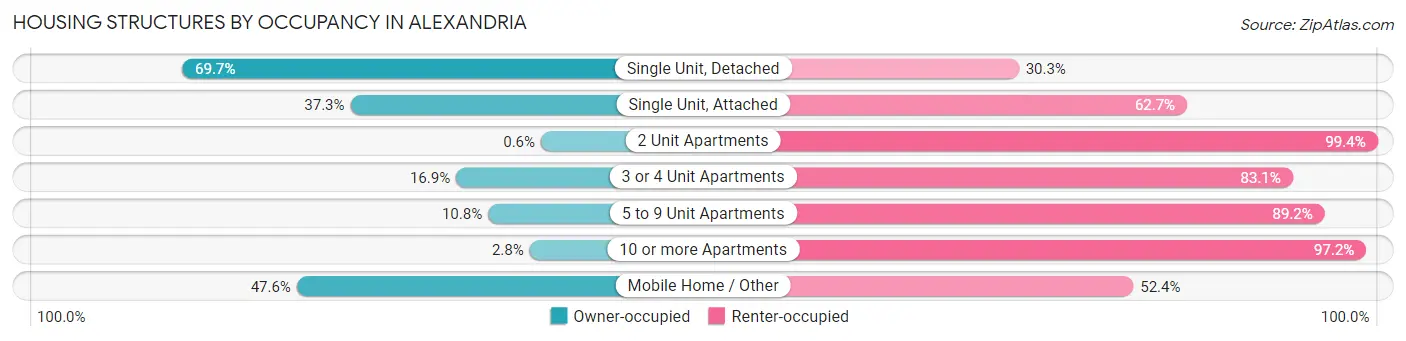
| Structure Type | Owner-occupied | Renter-occupied |
| Single Unit, Detached | 8,550 (69.7%) | 3,722 (30.3%) |
| Single Unit, Attached | 145 (37.3%) | 244 (62.7%) |
| 2 Unit Apartments | 5 (0.6%) | 826 (99.4%) |
| 3 or 4 Unit Apartments | 63 (16.9%) | 309 (83.1%) |
| 5 to 9 Unit Apartments | 112 (10.8%) | 927 (89.2%) |
| 10 or more Apartments | 44 (2.8%) | 1,541 (97.2%) |
| Mobile Home / Other | 289 (47.6%) | 318 (52.4%) |
| Total | 9,208 (53.9%) | 7,887 (46.1%) |
Housing Structures by Number of Rooms in Alexandria
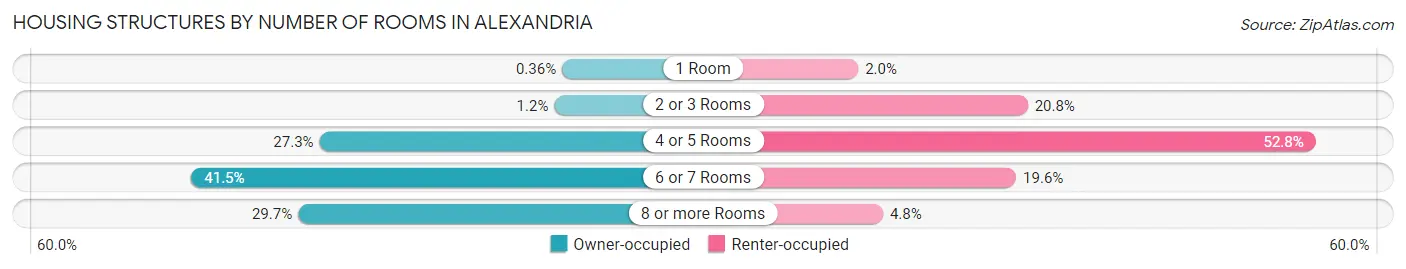
| Number of Rooms | Owner-occupied | Renter-occupied |
| 1 Room | 33 (0.4%) | 160 (2.0%) |
| 2 or 3 Rooms | 112 (1.2%) | 1,644 (20.8%) |
| 4 or 5 Rooms | 2,512 (27.3%) | 4,163 (52.8%) |
| 6 or 7 Rooms | 3,820 (41.5%) | 1,543 (19.6%) |
| 8 or more Rooms | 2,731 (29.7%) | 377 (4.8%) |
| Total | 9,208 (100.0%) | 7,887 (100.0%) |
Housing Structure by Heating Type in Alexandria
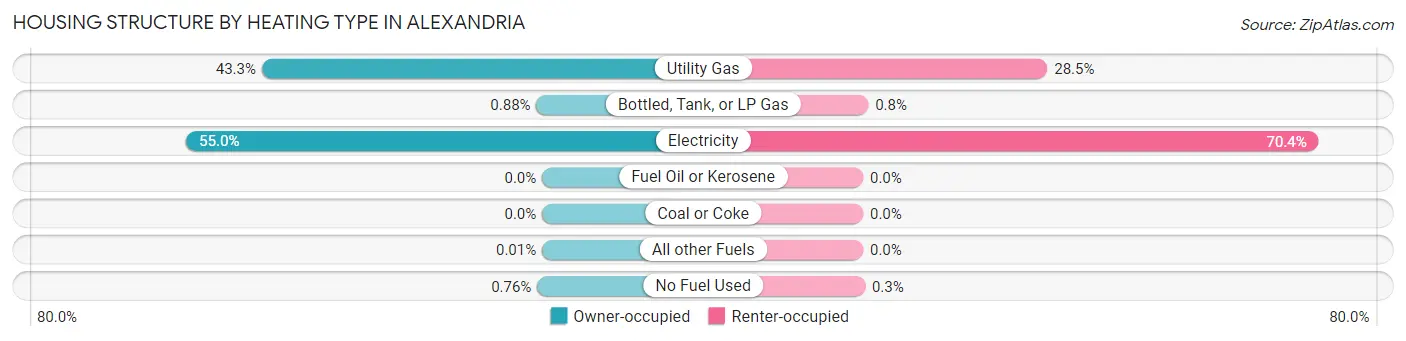
| Heating Type | Owner-occupied | Renter-occupied |
| Utility Gas | 3,990 (43.3%) | 2,246 (28.5%) |
| Bottled, Tank, or LP Gas | 81 (0.9%) | 63 (0.8%) |
| Electricity | 5,066 (55.0%) | 5,554 (70.4%) |
| Fuel Oil or Kerosene | 0 (0.0%) | 0 (0.0%) |
| Coal or Coke | 0 (0.0%) | 0 (0.0%) |
| All other Fuels | 1 (0.0%) | 0 (0.0%) |
| No Fuel Used | 70 (0.8%) | 24 (0.3%) |
| Total | 9,208 (100.0%) | 7,887 (100.0%) |
Household Vehicle Usage in Alexandria
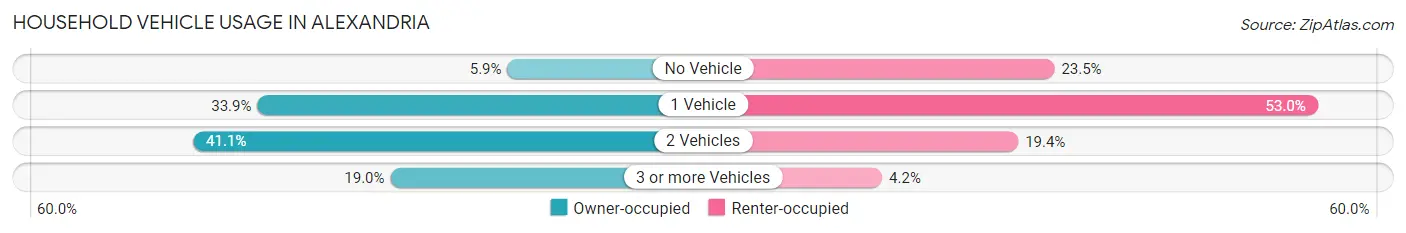
| Vehicles per Household | Owner-occupied | Renter-occupied |
| No Vehicle | 545 (5.9%) | 1,851 (23.5%) |
| 1 Vehicle | 3,124 (33.9%) | 4,176 (52.9%) |
| 2 Vehicles | 3,787 (41.1%) | 1,531 (19.4%) |
| 3 or more Vehicles | 1,752 (19.0%) | 329 (4.2%) |
| Total | 9,208 (100.0%) | 7,887 (100.0%) |
Real Estate & Mortgages in Alexandria
Real Estate and Mortgage Overview in Alexandria
| Characteristic | Without Mortgage | With Mortgage |
| Housing Units | 4,464 | 4,744 |
| Median Property Value | $143,600 | $202,900 |
| Median Household Income | $52,200 | $1,107 |
| Monthly Housing Costs | $423 | $220 |
| Real Estate Taxes | $514 | $479 |
Property Value by Mortgage Status in Alexandria
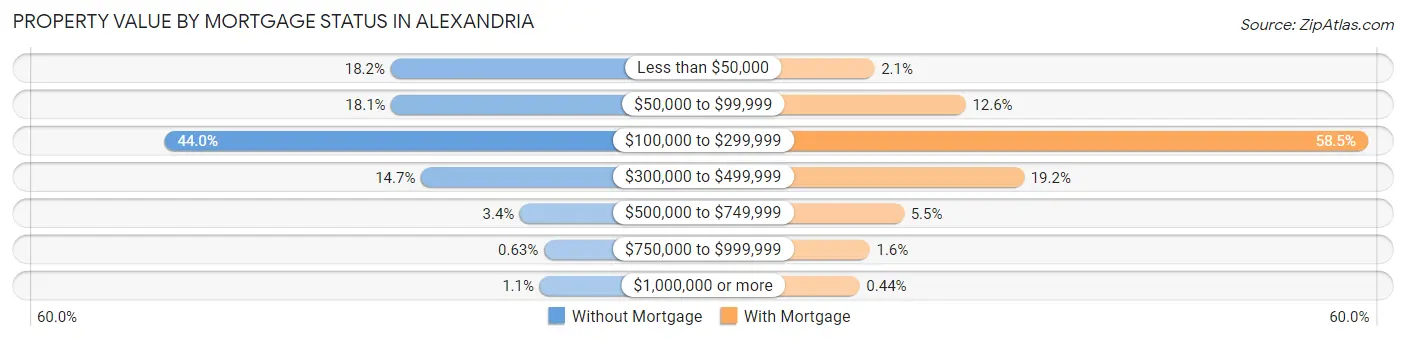
| Property Value | Without Mortgage | With Mortgage |
| Less than $50,000 | 810 (18.1%) | 101 (2.1%) |
| $50,000 to $99,999 | 807 (18.1%) | 596 (12.6%) |
| $100,000 to $299,999 | 1,964 (44.0%) | 2,777 (58.5%) |
| $300,000 to $499,999 | 655 (14.7%) | 912 (19.2%) |
| $500,000 to $749,999 | 150 (3.4%) | 261 (5.5%) |
| $750,000 to $999,999 | 28 (0.6%) | 76 (1.6%) |
| $1,000,000 or more | 50 (1.1%) | 21 (0.4%) |
| Total | 4,464 (100.0%) | 4,744 (100.0%) |
Household Income by Mortgage Status in Alexandria
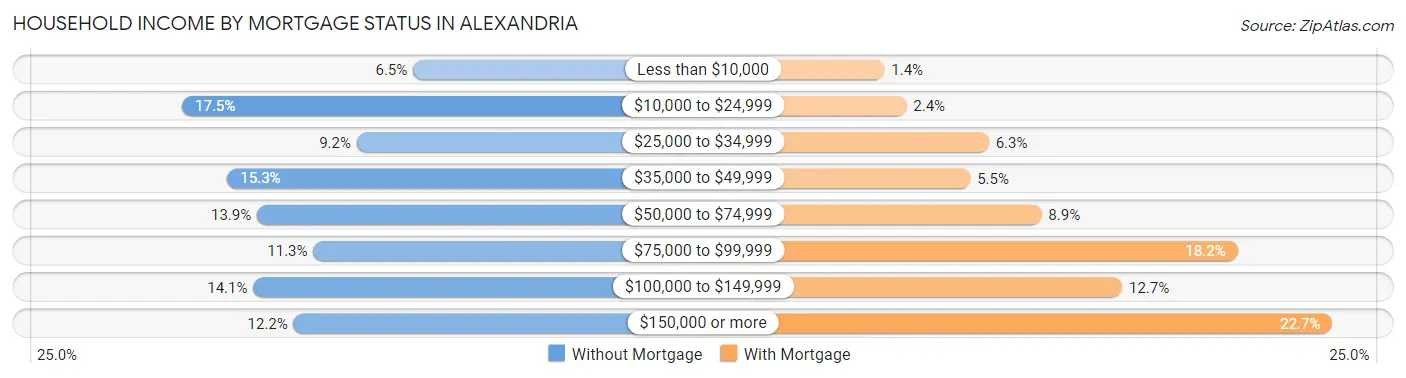
| Household Income | Without Mortgage | With Mortgage |
| Less than $10,000 | 290 (6.5%) | 65 (1.4%) |
| $10,000 to $24,999 | 781 (17.5%) | 115 (2.4%) |
| $25,000 to $34,999 | 410 (9.2%) | 301 (6.3%) |
| $35,000 to $49,999 | 685 (15.3%) | 259 (5.5%) |
| $50,000 to $74,999 | 622 (13.9%) | 420 (8.8%) |
| $75,000 to $99,999 | 502 (11.3%) | 863 (18.2%) |
| $100,000 to $149,999 | 630 (14.1%) | 602 (12.7%) |
| $150,000 or more | 544 (12.2%) | 1,077 (22.7%) |
| Total | 4,464 (100.0%) | 4,744 (100.0%) |
Property Value to Household Income Ratio in Alexandria
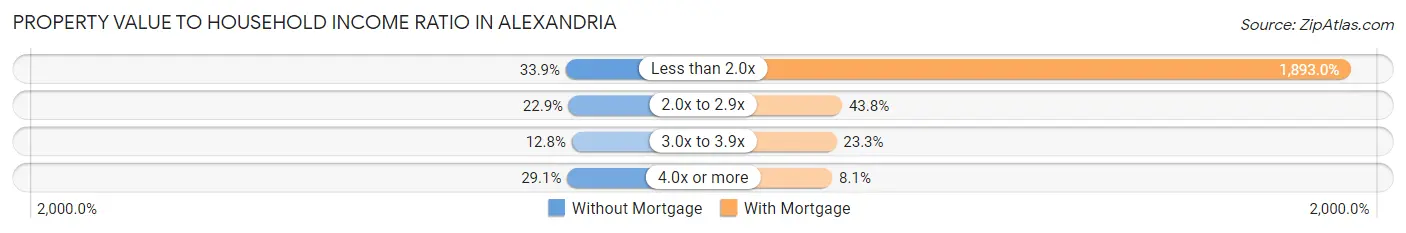
| Value-to-Income Ratio | Without Mortgage | With Mortgage |
| Less than 2.0x | 1,514 (33.9%) | 89,805 (1,893.0%) |
| 2.0x to 2.9x | 1,021 (22.9%) | 2,077 (43.8%) |
| 3.0x to 3.9x | 569 (12.8%) | 1,106 (23.3%) |
| 4.0x or more | 1,297 (29.0%) | 384 (8.1%) |
| Total | 4,464 (100.0%) | 4,744 (100.0%) |
Real Estate Taxes by Mortgage Status in Alexandria
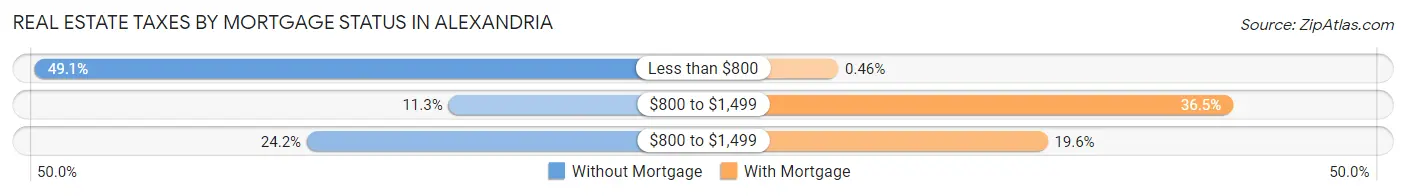
| Property Taxes | Without Mortgage | With Mortgage |
| Less than $800 | 2,190 (49.1%) | 22 (0.5%) |
| $800 to $1,499 | 504 (11.3%) | 1,733 (36.5%) |
| $800 to $1,499 | 1,081 (24.2%) | 929 (19.6%) |
| Total | 4,464 (100.0%) | 4,744 (100.0%) |
Health & Disability in Alexandria
Health Insurance Coverage by Age in Alexandria
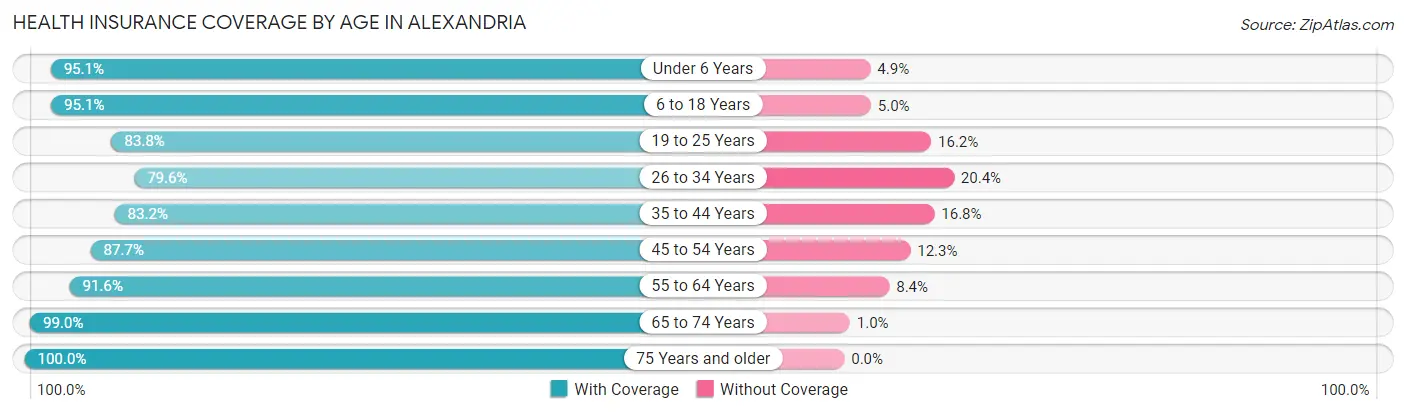
| Age Bracket | With Coverage | Without Coverage |
| Under 6 Years | 2,894 (95.1%) | 148 (4.9%) |
| 6 to 18 Years | 7,339 (95.1%) | 382 (5.0%) |
| 19 to 25 Years | 3,365 (83.8%) | 650 (16.2%) |
| 26 to 34 Years | 4,320 (79.6%) | 1,110 (20.4%) |
| 35 to 44 Years | 4,720 (83.2%) | 953 (16.8%) |
| 45 to 54 Years | 4,392 (87.7%) | 616 (12.3%) |
| 55 to 64 Years | 5,383 (91.6%) | 493 (8.4%) |
| 65 to 74 Years | 3,933 (99.0%) | 41 (1.0%) |
| 75 Years and older | 2,887 (100.0%) | 0 (0.0%) |
| Total | 39,233 (89.9%) | 4,393 (10.1%) |
Health Insurance Coverage by Citizenship Status in Alexandria
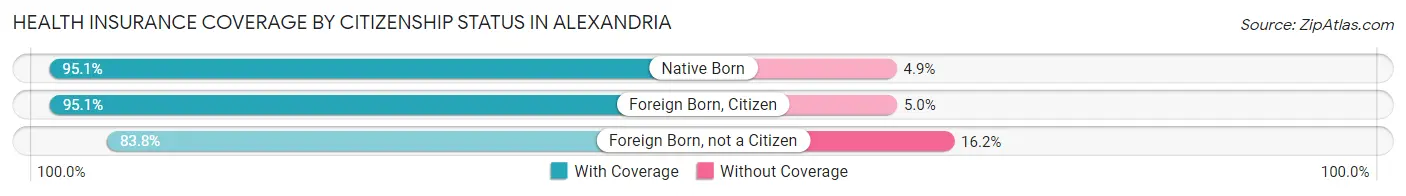
| Citizenship Status | With Coverage | Without Coverage |
| Native Born | 2,894 (95.1%) | 148 (4.9%) |
| Foreign Born, Citizen | 7,339 (95.1%) | 382 (5.0%) |
| Foreign Born, not a Citizen | 3,365 (83.8%) | 650 (16.2%) |
Health Insurance Coverage by Household Income in Alexandria
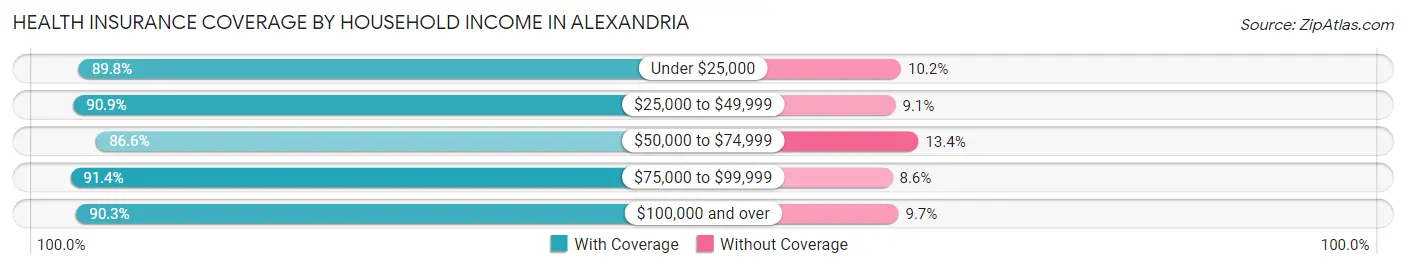
| Household Income | With Coverage | Without Coverage |
| Under $25,000 | 8,187 (89.8%) | 927 (10.2%) |
| $25,000 to $49,999 | 8,887 (90.9%) | 893 (9.1%) |
| $50,000 to $74,999 | 6,583 (86.6%) | 1,021 (13.4%) |
| $75,000 to $99,999 | 4,118 (91.4%) | 386 (8.6%) |
| $100,000 and over | 10,825 (90.3%) | 1,162 (9.7%) |
Public vs Private Health Insurance Coverage by Age in Alexandria
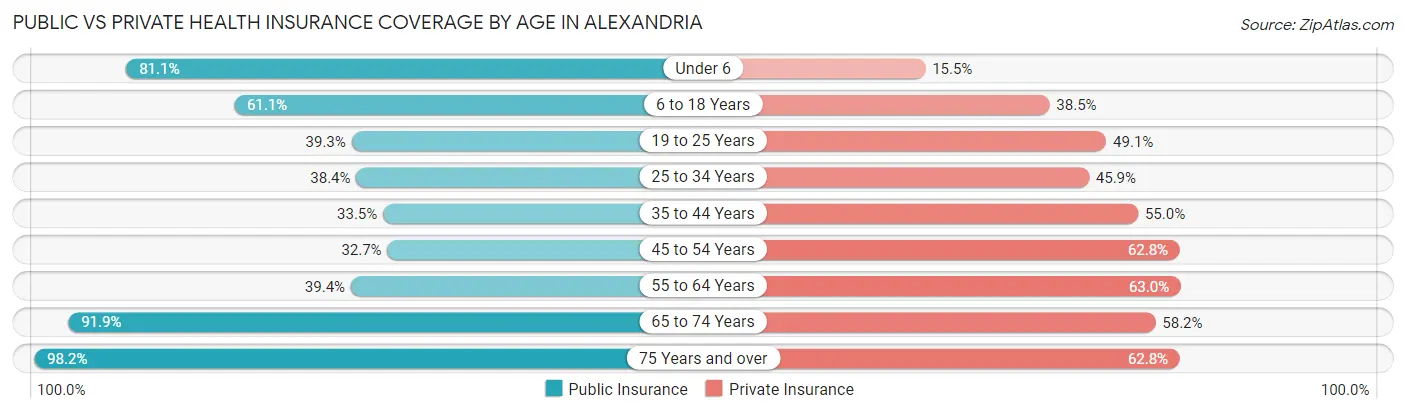
| Age Bracket | Public Insurance | Private Insurance |
| Under 6 | 2,468 (81.1%) | 471 (15.5%) |
| 6 to 18 Years | 4,721 (61.1%) | 2,976 (38.5%) |
| 19 to 25 Years | 1,578 (39.3%) | 1,970 (49.1%) |
| 25 to 34 Years | 2,086 (38.4%) | 2,490 (45.9%) |
| 35 to 44 Years | 1,898 (33.5%) | 3,119 (55.0%) |
| 45 to 54 Years | 1,635 (32.7%) | 3,143 (62.8%) |
| 55 to 64 Years | 2,317 (39.4%) | 3,699 (62.9%) |
| 65 to 74 Years | 3,652 (91.9%) | 2,313 (58.2%) |
| 75 Years and over | 2,836 (98.2%) | 1,812 (62.8%) |
| Total | 23,191 (53.2%) | 21,993 (50.4%) |
Disability Status by Sex by Age in Alexandria
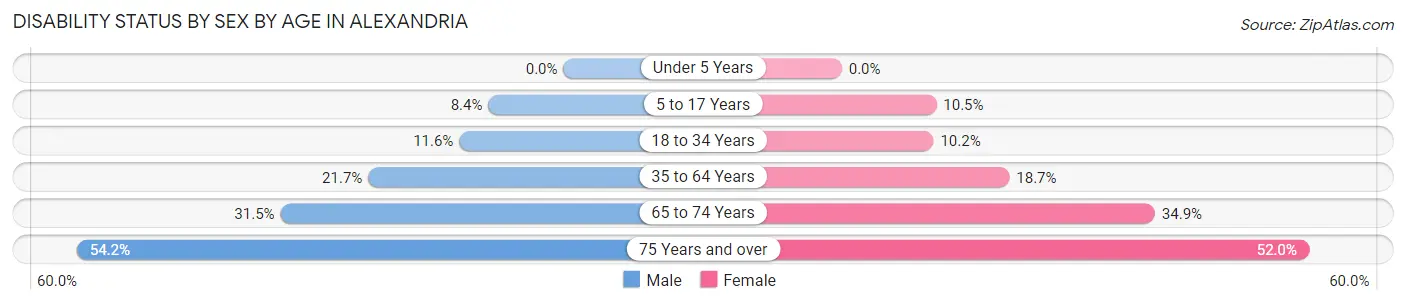
| Age Bracket | Male | Female |
| Under 5 Years | 0 (0.0%) | 0 (0.0%) |
| 5 to 17 Years | 330 (8.4%) | 392 (10.5%) |
| 18 to 34 Years | 545 (11.6%) | 536 (10.2%) |
| 35 to 64 Years | 1,652 (21.7%) | 1,672 (18.7%) |
| 65 to 74 Years | 543 (31.5%) | 785 (34.9%) |
| 75 Years and over | 609 (54.2%) | 917 (52.0%) |
Disability Class by Sex by Age in Alexandria
Disability Class: Hearing Difficulty
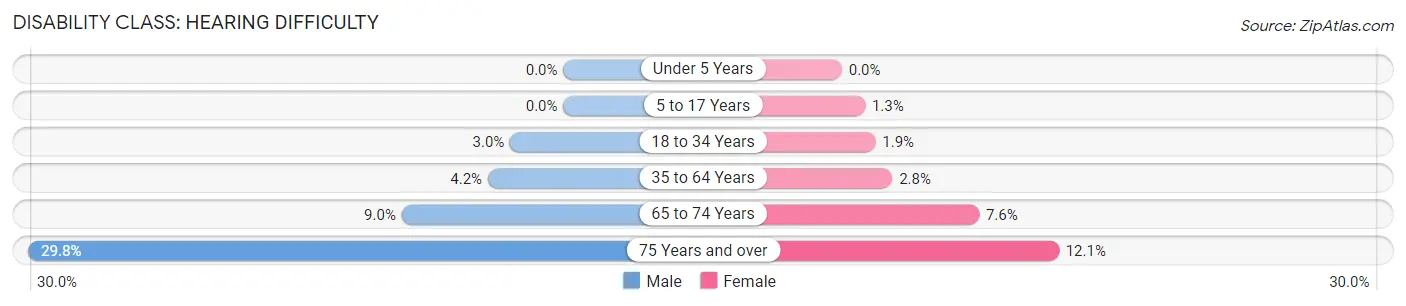
| Age Bracket | Male | Female |
| Under 5 Years | 0 (0.0%) | 0 (0.0%) |
| 5 to 17 Years | 0 (0.0%) | 48 (1.3%) |
| 18 to 34 Years | 139 (3.0%) | 98 (1.9%) |
| 35 to 64 Years | 319 (4.2%) | 252 (2.8%) |
| 65 to 74 Years | 155 (9.0%) | 172 (7.6%) |
| 75 Years and over | 335 (29.8%) | 213 (12.1%) |
Disability Class: Vision Difficulty
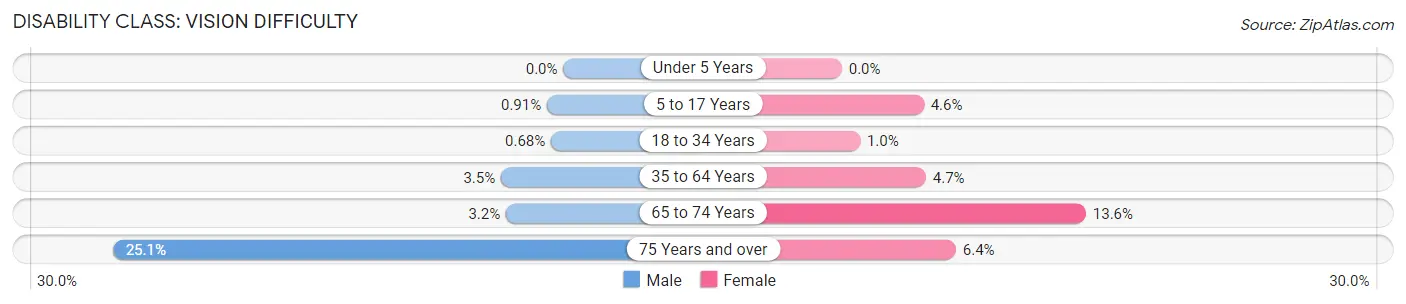
| Age Bracket | Male | Female |
| Under 5 Years | 0 (0.0%) | 0 (0.0%) |
| 5 to 17 Years | 36 (0.9%) | 170 (4.6%) |
| 18 to 34 Years | 32 (0.7%) | 53 (1.0%) |
| 35 to 64 Years | 264 (3.5%) | 419 (4.7%) |
| 65 to 74 Years | 55 (3.2%) | 306 (13.6%) |
| 75 Years and over | 282 (25.1%) | 112 (6.4%) |
Disability Class: Cognitive Difficulty
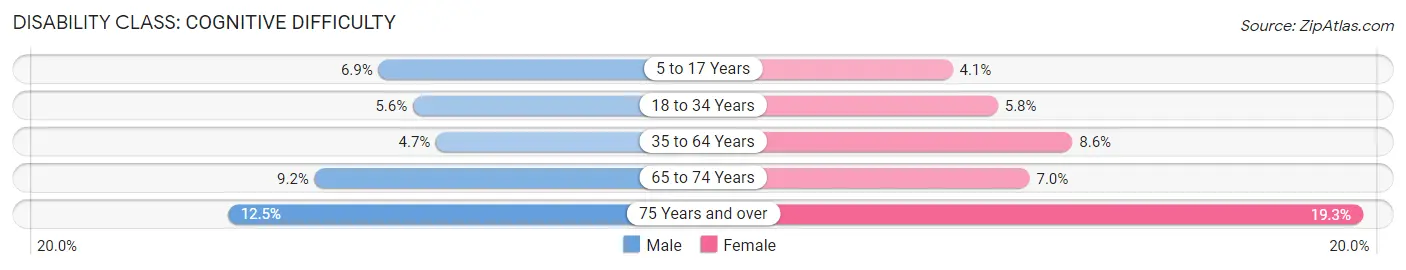
| Age Bracket | Male | Female |
| 5 to 17 Years | 271 (6.9%) | 153 (4.1%) |
| 18 to 34 Years | 262 (5.6%) | 304 (5.8%) |
| 35 to 64 Years | 359 (4.7%) | 767 (8.6%) |
| 65 to 74 Years | 159 (9.2%) | 157 (7.0%) |
| 75 Years and over | 140 (12.5%) | 341 (19.3%) |
Disability Class: Ambulatory Difficulty
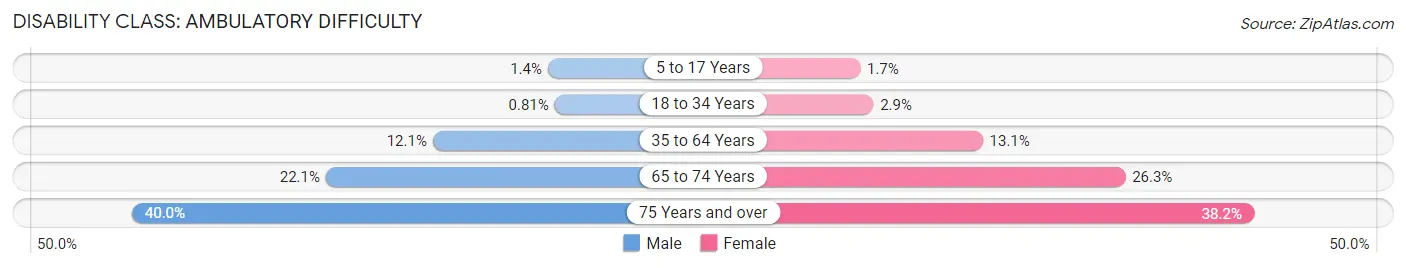
| Age Bracket | Male | Female |
| 5 to 17 Years | 57 (1.4%) | 63 (1.7%) |
| 18 to 34 Years | 38 (0.8%) | 153 (2.9%) |
| 35 to 64 Years | 921 (12.1%) | 1,171 (13.1%) |
| 65 to 74 Years | 380 (22.1%) | 592 (26.3%) |
| 75 Years and over | 450 (40.0%) | 674 (38.2%) |
Disability Class: Self-Care Difficulty
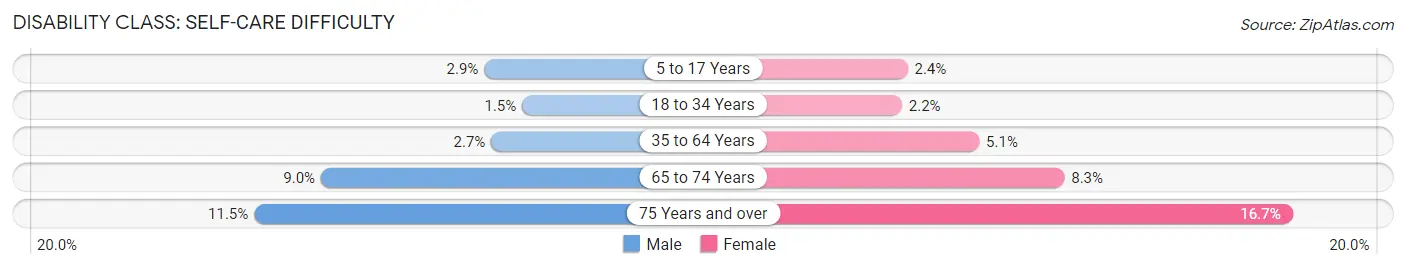
| Age Bracket | Male | Female |
| 5 to 17 Years | 116 (2.9%) | 91 (2.4%) |
| 18 to 34 Years | 72 (1.5%) | 117 (2.2%) |
| 35 to 64 Years | 204 (2.7%) | 457 (5.1%) |
| 65 to 74 Years | 155 (9.0%) | 186 (8.3%) |
| 75 Years and over | 129 (11.5%) | 295 (16.7%) |
Technology Access in Alexandria
Computing Device Access in Alexandria
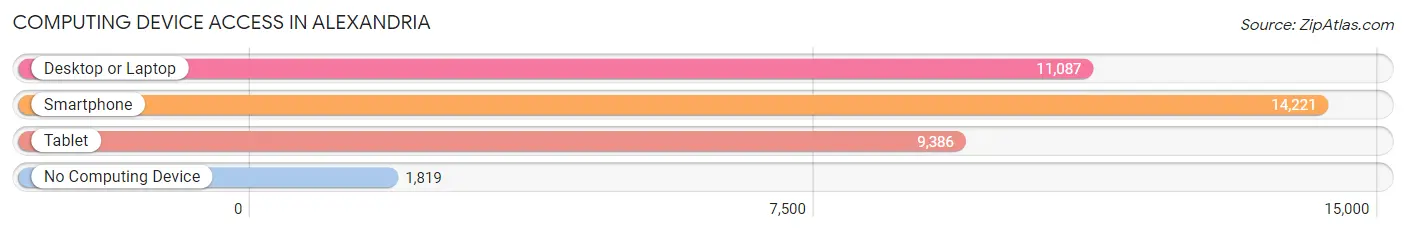
| Device Type | # Households | % Households |
| Desktop or Laptop | 11,087 | 64.9% |
| Smartphone | 14,221 | 83.2% |
| Tablet | 9,386 | 54.9% |
| No Computing Device | 1,819 | 10.6% |
| Total | 17,095 | 100.0% |
Internet Access in Alexandria
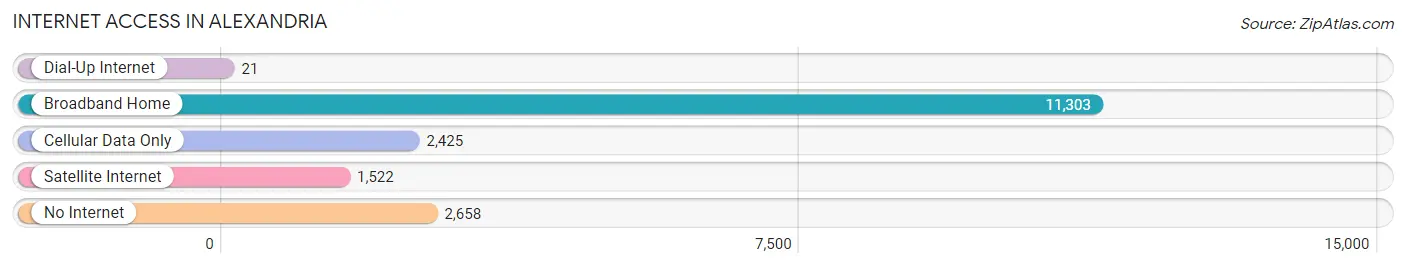
| Internet Type | # Households | % Households |
| Dial-Up Internet | 21 | 0.1% |
| Broadband Home | 11,303 | 66.1% |
| Cellular Data Only | 2,425 | 14.2% |
| Satellite Internet | 1,522 | 8.9% |
| No Internet | 2,658 | 15.5% |
| Total | 17,095 | 100.0% |
Alexandria Summary
Alexandria, Louisiana is a city located in the central part of the state, in Rapides Parish. It is the parish seat and the largest city in the parish. Alexandria is located on the Red River, approximately 150 miles northwest of New Orleans and 130 miles east of Shreveport. The city is the principal city of the Alexandria metropolitan area, which includes all of Rapides and Grant parishes. As of the 2010 census, the population of Alexandria was 47,723, and the estimated population in 2018 was 48,919.
History
The area around Alexandria was first settled by Native Americans, including the Tunica, Choctaw, and Caddo tribes. The first European settlers arrived in the area in the late 1700s, and the city was founded in 1805. It was named after Alexander Fulton, a surveyor who had surveyed the area in the late 1700s.
Alexandria was an important port city during the Civil War, and it was the site of several battles. After the war, the city experienced a period of growth and prosperity, and it became an important center for the lumber and cotton industries.
Geography
Alexandria is located in the central part of Louisiana, in Rapides Parish. It is situated on the Red River, approximately 150 miles northwest of New Orleans and 130 miles east of Shreveport. The city has a total area of 24.2 square miles, of which 24.1 square miles is land and 0.1 square miles is water.
The climate in Alexandria is humid subtropical, with hot, humid summers and mild winters. The average annual temperature is 64.2°F, and the average annual precipitation is 49.2 inches.
Economy
Alexandria’s economy is largely based on the service industry, with healthcare, education, and government being the largest employers. The city is also home to several manufacturing companies, including International Paper, Georgia-Pacific, and Louisiana-Pacific.
The city is also home to several military installations, including the England Airpark, the Alexandria International Airport, and the Alexandria National Guard Base.
Demographics
As of the 2010 census, the population of Alexandria was 47,723, and the estimated population in 2018 was 48,919. The racial makeup of the city was 57.2% White, 37.3% African American, 0.5% Native American, 1.7% Asian, 0.1% Pacific Islander, 1.3% from other races, and 2.0% from two or more races. Hispanic or Latino of any race were 4.2% of the population.
The median income for a household in the city was $35,945, and the median income for a family was $45,845. The per capita income for the city was $20,845. About 17.2% of the population was below the poverty line.
Common Questions
What is Per Capita Income in Alexandria?
Per Capita income in Alexandria is $30,457.
What is the Median Family Income in Alexandria?
Median Family Income in Alexandria is $59,362.
What is the Median Household income in Alexandria?
Median Household Income in Alexandria is $49,049.
What is Income or Wage Gap in Alexandria?
Income or Wage Gap in Alexandria is 9.2%.
Women in Alexandria earn 90.8 cents for every dollar earned by a man.
What is Family Income Deficit in Alexandria?
Family Income Deficit in Alexandria is $10,485.
Families that are below poverty line in Alexandria earn $10,485 less on average than the poverty threshold level.
What is Inequality or Gini Index in Alexandria?
Inequality or Gini Index in Alexandria is 0.52.
What is the Total Population of Alexandria?
Total Population of Alexandria is 45,133.
What is the Total Male Population of Alexandria?
Total Male Population of Alexandria is 21,526.
What is the Total Female Population of Alexandria?
Total Female Population of Alexandria is 23,607.
What is the Ratio of Males per 100 Females in Alexandria?
There are 91.18 Males per 100 Females in Alexandria.
What is the Ratio of Females per 100 Males in Alexandria?
There are 109.67 Females per 100 Males in Alexandria.
What is the Median Population Age in Alexandria?
Median Population Age in Alexandria is 37.4 Years.
What is the Average Family Size in Alexandria
Average Family Size in Alexandria is 3.3 People.
What is the Average Household Size in Alexandria
Average Household Size in Alexandria is 2.5 People.
How Large is the Labor Force in Alexandria?
There are 20,834 People in the Labor Forcein in Alexandria.
What is the Percentage of People in the Labor Force in Alexandria?
57.3% of People are in the Labor Force in Alexandria.
What is the Unemployment Rate in Alexandria?
Unemployment Rate in Alexandria is 7.5%.