New Iberia, LA Map & Demographics
New Iberia Map
New Iberia Overview
$27,270
PER CAPITA INCOME
$51,546
AVG FAMILY INCOME
$47,108
AVG HOUSEHOLD INCOME
52.2%
WAGE / INCOME GAP [ % ]
47.8¢/ $1
WAGE / INCOME GAP [ $ ]
$13,967
FAMILY INCOME DEFICIT
0.53
INEQUALITY / GINI INDEX
28,363
TOTAL POPULATION
13,894
MALE POPULATION
14,469
FEMALE POPULATION
96.03
MALES / 100 FEMALES
104.14
FEMALES / 100 MALES
34.9
MEDIAN AGE
3.1
AVG FAMILY SIZE
2.5
AVG HOUSEHOLD SIZE
11,596
LABOR FORCE [ PEOPLE ]
54.6%
PERCENT IN LABOR FORCE
9.0%
UNEMPLOYMENT RATE
New Iberia Area Codes
Income in New Iberia
Income Overview in New Iberia
Per Capita Income in New Iberia is $27,270, while median incomes of families and households are $51,546 and $47,108 respectively.
| Characteristic | Number | Measure |
| Per Capita Income | 28,363 | $27,270 |
| Median Family Income | 7,295 | $51,546 |
| Mean Family Income | 7,295 | $66,196 |
| Median Household Income | 11,201 | $47,108 |
| Mean Household Income | 11,201 | $68,050 |
| Income Deficit | 7,295 | $13,967 |
| Wage / Income Gap (%) | 28,363 | 52.17% |
| Wage / Income Gap ($) | 28,363 | 47.83¢ per $1 |
| Gini / Inequality Index | 28,363 | 0.53 |
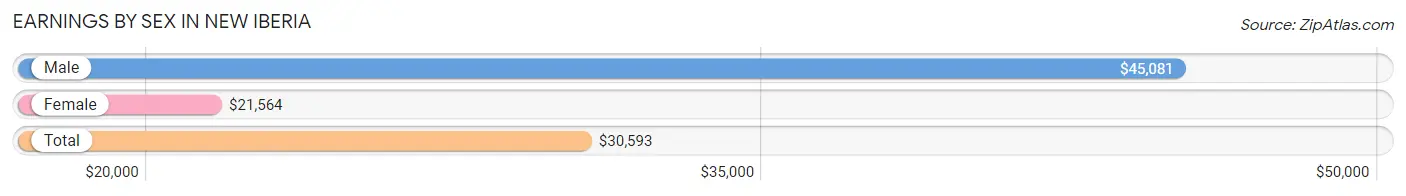
Earnings by Sex in New Iberia
Average Earnings in New Iberia are $30,593, $45,081 for men and $21,564 for women, a difference of 52.2%.
| Sex | Number | Average Earnings |
| Male | 6,119 (51.7%) | $45,081 |
| Female | 5,715 (48.3%) | $21,564 |
| Total | 11,834 (100.0%) | $30,593 |
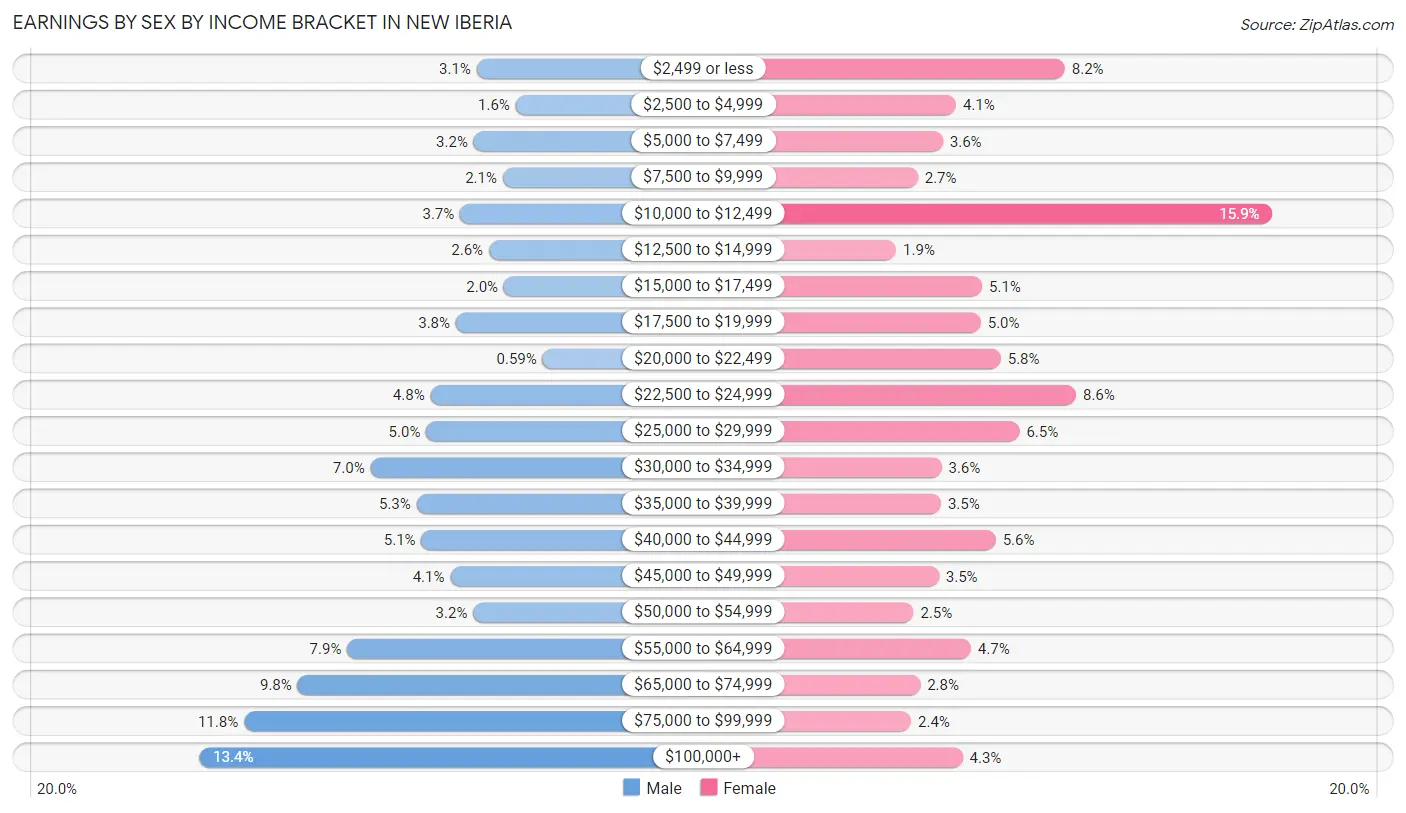
Earnings by Sex by Income Bracket in New Iberia
The most common earnings brackets in New Iberia are $100,000+ for men (821 | 13.4%) and $10,000 to $12,499 for women (909 | 15.9%).
| Income | Male | Female |
| $2,499 or less | 187 (3.1%) | 467 (8.2%) |
| $2,500 to $4,999 | 98 (1.6%) | 234 (4.1%) |
| $5,000 to $7,499 | 194 (3.2%) | 206 (3.6%) |
| $7,500 to $9,999 | 127 (2.1%) | 152 (2.7%) |
| $10,000 to $12,499 | 225 (3.7%) | 909 (15.9%) |
| $12,500 to $14,999 | 159 (2.6%) | 106 (1.8%) |
| $15,000 to $17,499 | 125 (2.0%) | 290 (5.1%) |
| $17,500 to $19,999 | 235 (3.8%) | 287 (5.0%) |
| $20,000 to $22,499 | 36 (0.6%) | 330 (5.8%) |
| $22,500 to $24,999 | 293 (4.8%) | 491 (8.6%) |
| $25,000 to $29,999 | 303 (5.0%) | 370 (6.5%) |
| $30,000 to $34,999 | 431 (7.0%) | 203 (3.5%) |
| $35,000 to $39,999 | 325 (5.3%) | 202 (3.5%) |
| $40,000 to $44,999 | 314 (5.1%) | 319 (5.6%) |
| $45,000 to $49,999 | 248 (4.1%) | 197 (3.5%) |
| $50,000 to $54,999 | 195 (3.2%) | 143 (2.5%) |
| $55,000 to $64,999 | 484 (7.9%) | 266 (4.6%) |
| $65,000 to $74,999 | 598 (9.8%) | 157 (2.8%) |
| $75,000 to $99,999 | 721 (11.8%) | 138 (2.4%) |
| $100,000+ | 821 (13.4%) | 248 (4.3%) |
| Total | 6,119 (100.0%) | 5,715 (100.0%) |
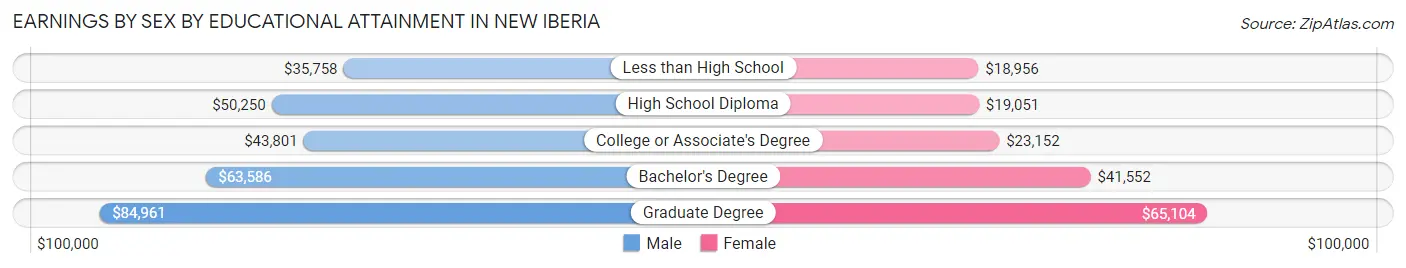
Earnings by Sex by Educational Attainment in New Iberia
Average earnings in New Iberia are $47,212 for men and $23,311 for women, a difference of 50.6%. Men with an educational attainment of graduate degree enjoy the highest average annual earnings of $84,961, while those with less than high school education earn the least with $35,758. Women with an educational attainment of graduate degree earn the most with the average annual earnings of $65,104, while those with less than high school education have the smallest earnings of $18,956.
| Educational Attainment | Male Income | Female Income |
| Less than High School | $35,758 | $18,956 |
| High School Diploma | $50,250 | $19,051 |
| College or Associate's Degree | $43,801 | $23,152 |
| Bachelor's Degree | $63,586 | $41,552 |
| Graduate Degree | $84,961 | $65,104 |
| Total | $47,212 | $23,311 |
Family Income in New Iberia
Family Income Brackets in New Iberia
According to the New Iberia family income data, there are 1,444 families falling into the $50,000 to $74,999 income range, which is the most common income bracket and makes up 19.8% of all families. Conversely, the $200,000+ income bracket is the least frequent group with only 190 families (2.6%) belonging to this category.
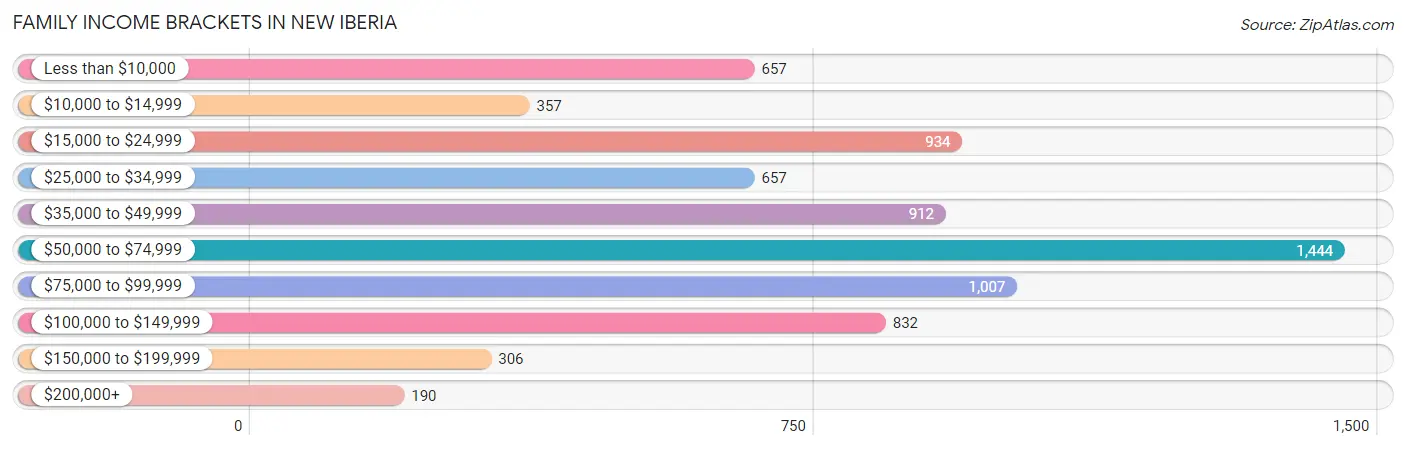
| Income Bracket | # Families | % Families |
| Less than $10,000 | 657 | 9.0% |
| $10,000 to $14,999 | 357 | 4.9% |
| $15,000 to $24,999 | 934 | 12.8% |
| $25,000 to $34,999 | 657 | 9.0% |
| $35,000 to $49,999 | 912 | 12.5% |
| $50,000 to $74,999 | 1,444 | 19.8% |
| $75,000 to $99,999 | 1,007 | 13.8% |
| $100,000 to $149,999 | 832 | 11.4% |
| $150,000 to $199,999 | 306 | 4.2% |
| $200,000+ | 190 | 2.6% |
Family Income by Famaliy Size in New Iberia
6-person families (279 | 3.8%) account for the highest median family income in New Iberia with $64,053 per family, while 2-person families (3,361 | 46.1%) have the highest median income of $25,696 per family member.
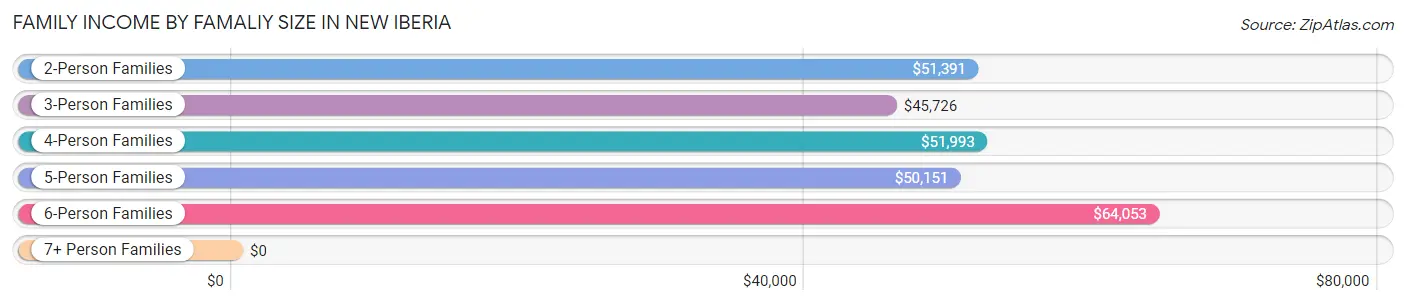
| Income Bracket | # Families | Median Income |
| 2-Person Families | 3,361 (46.1%) | $51,391 |
| 3-Person Families | 1,456 (20.0%) | $45,726 |
| 4-Person Families | 1,464 (20.1%) | $51,993 |
| 5-Person Families | 481 (6.6%) | $50,151 |
| 6-Person Families | 279 (3.8%) | $64,053 |
| 7+ Person Families | 254 (3.5%) | $0 |
| Total | 7,295 (100.0%) | $51,546 |
Family Income by Number of Earners in New Iberia
The median family income in New Iberia is $51,546, with families comprising 3+ earners (412) having the highest median family income of $115,882, while families with no earners (1,367) have the lowest median family income of $21,592, accounting for 5.7% and 18.7% of families, respectively.
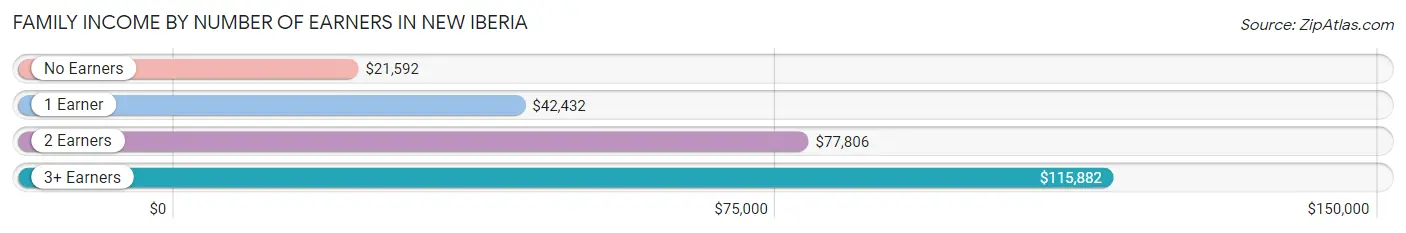
| Number of Earners | # Families | Median Income |
| No Earners | 1,367 (18.7%) | $21,592 |
| 1 Earner | 3,508 (48.1%) | $42,432 |
| 2 Earners | 2,008 (27.5%) | $77,806 |
| 3+ Earners | 412 (5.7%) | $115,882 |
| Total | 7,295 (100.0%) | $51,546 |
Household Income in New Iberia
Household Income Brackets in New Iberia
With 2,184 households falling in the category, the $50,000 to $74,999 income range is the most frequent in New Iberia, accounting for 19.5% of all households. In contrast, only 314 households (2.8%) fall into the $200,000+ income bracket, making it the least populous group.
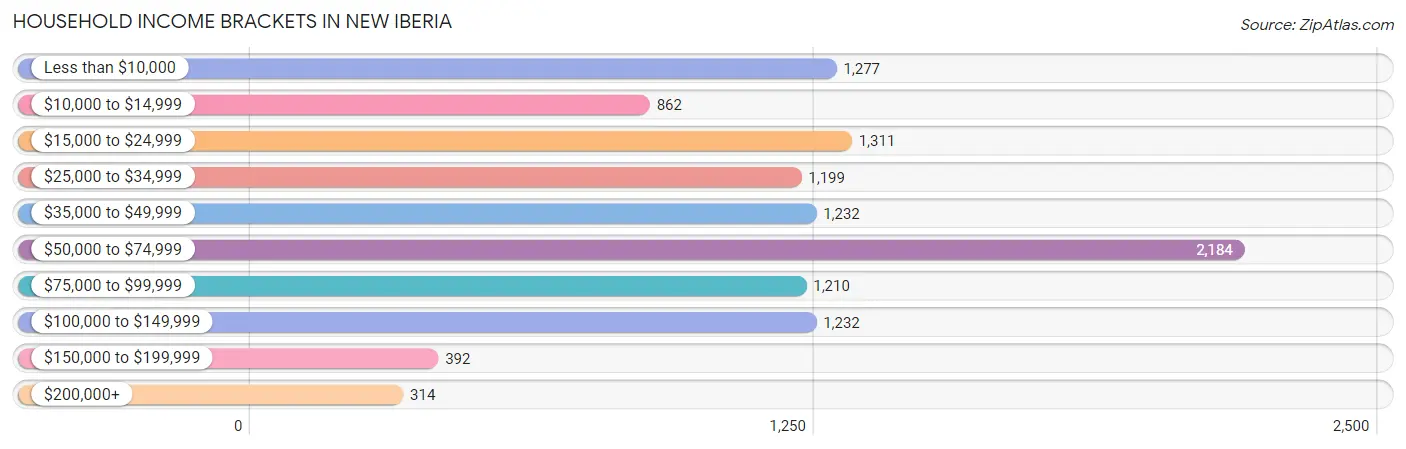
| Income Bracket | # Households | % Households |
| Less than $10,000 | 1,277 | 11.4% |
| $10,000 to $14,999 | 862 | 7.7% |
| $15,000 to $24,999 | 1,311 | 11.7% |
| $25,000 to $34,999 | 1,199 | 10.7% |
| $35,000 to $49,999 | 1,232 | 11.0% |
| $50,000 to $74,999 | 2,184 | 19.5% |
| $75,000 to $99,999 | 1,210 | 10.8% |
| $100,000 to $149,999 | 1,232 | 11.0% |
| $150,000 to $199,999 | 392 | 3.5% |
| $200,000+ | 314 | 2.8% |
Household Income by Householder Age in New Iberia
The median household income in New Iberia is $47,108, with the highest median household income of $55,731 found in the 45 to 64 years age bracket for the primary householder. A total of 4,233 households (37.8%) fall into this category. Meanwhile, the 65+ years age bracket for the primary householder has the lowest median household income of $39,508, with 2,787 households (24.9%) in this group.
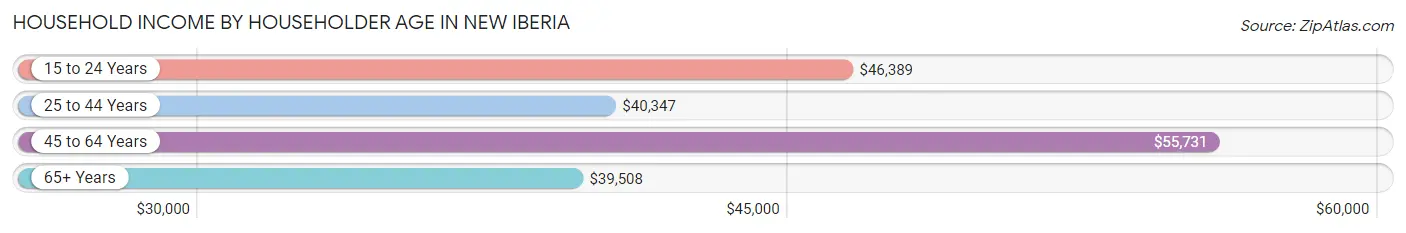
| Income Bracket | # Households | Median Income |
| 15 to 24 Years | 558 (5.0%) | $46,389 |
| 25 to 44 Years | 3,623 (32.4%) | $40,347 |
| 45 to 64 Years | 4,233 (37.8%) | $55,731 |
| 65+ Years | 2,787 (24.9%) | $39,508 |
| Total | 11,201 (100.0%) | $47,108 |
Poverty in New Iberia
Income Below Poverty by Sex and Age in New Iberia
With 24.0% poverty level for males and 36.6% for females among the residents of New Iberia, 12 to 14 year old males and 6 to 11 year old females are the most vulnerable to poverty, with 382 males (52.8%) and 989 females (70.4%) in their respective age groups living below the poverty level.
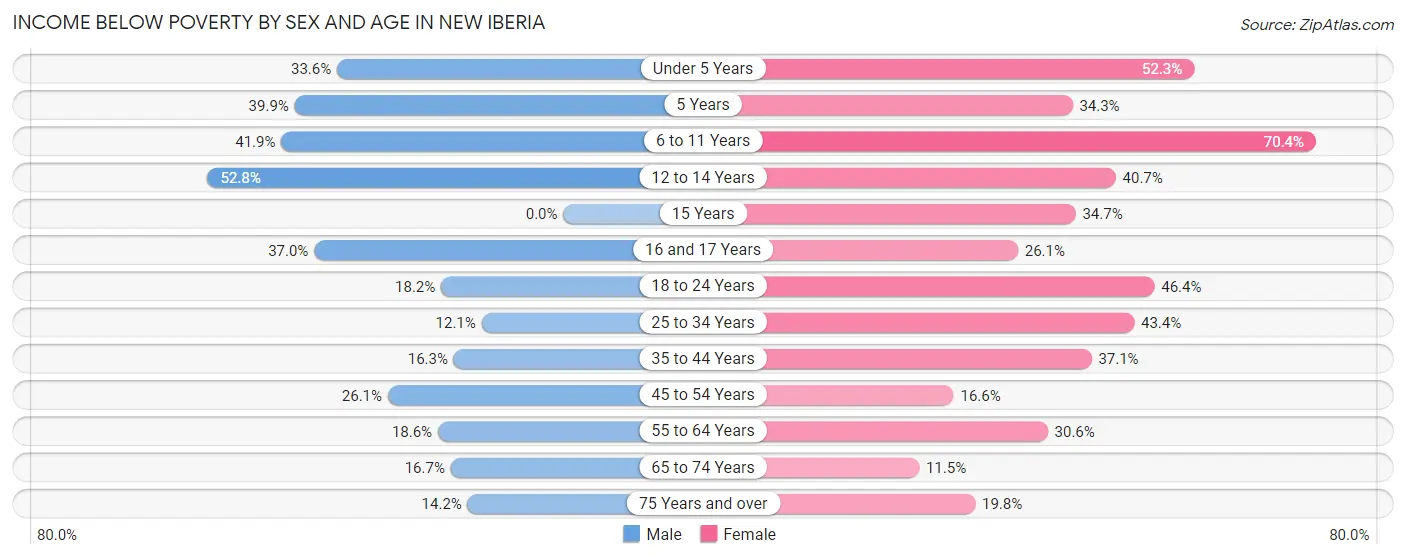
| Age Bracket | Male | Female |
| Under 5 Years | 479 (33.6%) | 691 (52.3%) |
| 5 Years | 79 (39.9%) | 62 (34.3%) |
| 6 to 11 Years | 467 (41.9%) | 989 (70.4%) |
| 12 to 14 Years | 382 (52.8%) | 196 (40.7%) |
| 15 Years | 0 (0.0%) | 76 (34.7%) |
| 16 and 17 Years | 148 (37.0%) | 75 (26.1%) |
| 18 to 24 Years | 224 (18.1%) | 560 (46.4%) |
| 25 to 34 Years | 229 (12.1%) | 901 (43.4%) |
| 35 to 44 Years | 244 (16.3%) | 585 (37.1%) |
| 45 to 54 Years | 400 (26.1%) | 262 (16.6%) |
| 55 to 64 Years | 339 (18.6%) | 500 (30.6%) |
| 65 to 74 Years | 213 (16.7%) | 162 (11.5%) |
| 75 Years and over | 82 (14.2%) | 181 (19.8%) |
| Total | 3,286 (24.0%) | 5,240 (36.6%) |
Income Above Poverty by Sex and Age in New Iberia
According to the poverty statistics in New Iberia, males aged 15 years and females aged 65 to 74 years are the age groups that are most secure financially, with 100.0% of males and 88.5% of females in these age groups living above the poverty line.
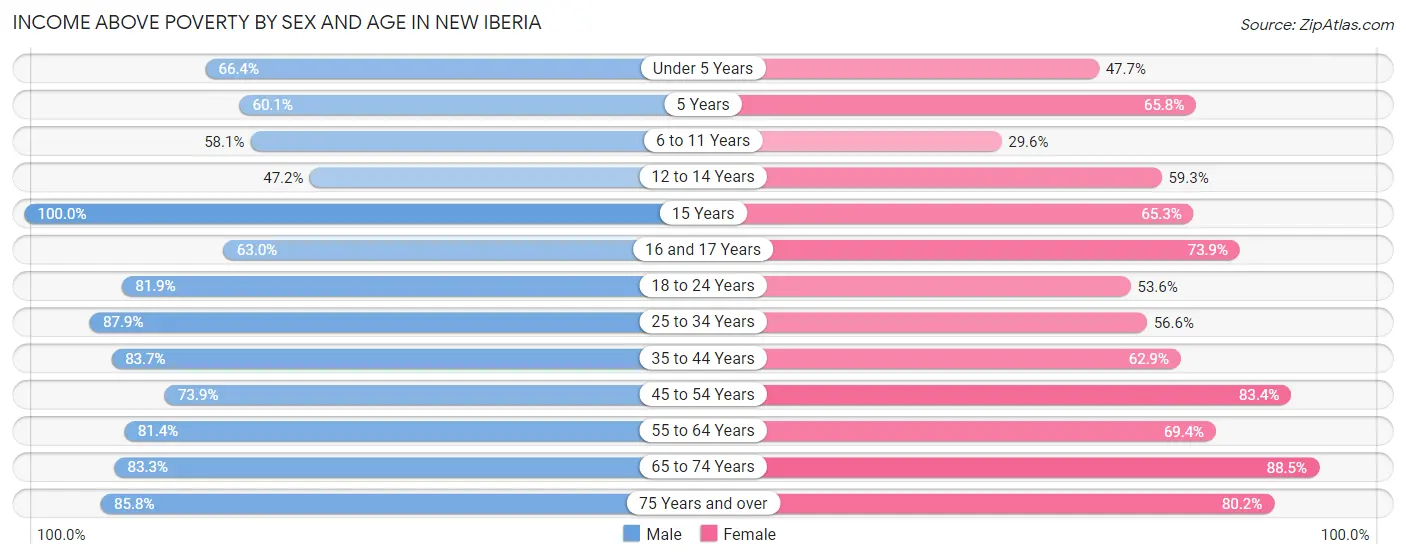
| Age Bracket | Male | Female |
| Under 5 Years | 946 (66.4%) | 630 (47.7%) |
| 5 Years | 119 (60.1%) | 119 (65.7%) |
| 6 to 11 Years | 648 (58.1%) | 416 (29.6%) |
| 12 to 14 Years | 341 (47.2%) | 286 (59.3%) |
| 15 Years | 23 (100.0%) | 143 (65.3%) |
| 16 and 17 Years | 252 (63.0%) | 212 (73.9%) |
| 18 to 24 Years | 1,010 (81.9%) | 647 (53.6%) |
| 25 to 34 Years | 1,657 (87.9%) | 1,175 (56.6%) |
| 35 to 44 Years | 1,256 (83.7%) | 993 (62.9%) |
| 45 to 54 Years | 1,135 (73.9%) | 1,316 (83.4%) |
| 55 to 64 Years | 1,482 (81.4%) | 1,136 (69.4%) |
| 65 to 74 Years | 1,061 (83.3%) | 1,252 (88.5%) |
| 75 Years and over | 495 (85.8%) | 734 (80.2%) |
| Total | 10,425 (76.0%) | 9,059 (63.3%) |
Income Below Poverty Among Married-Couple Families in New Iberia
The poverty statistics for married-couple families in New Iberia show that 10.4% or 395 of the total 3,790 families live below the poverty line. Families with 5 or more children have the highest poverty rate of 100.0%, comprising of 73 families. On the other hand, families with no children have the lowest poverty rate of 7.0%, which includes 157 families.
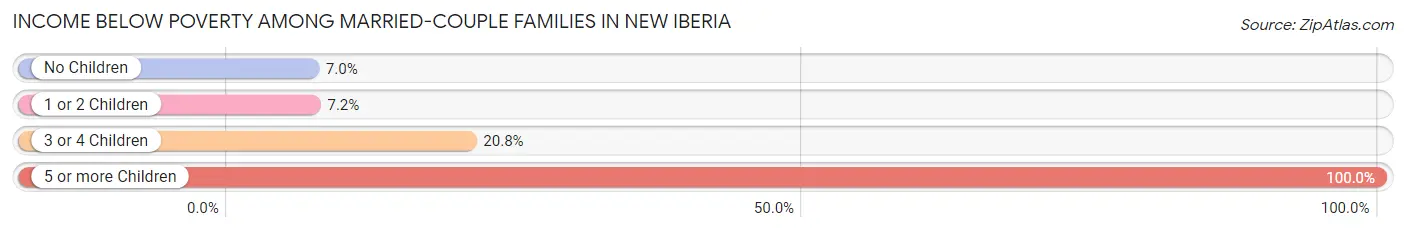
| Children | Above Poverty | Below Poverty |
| No Children | 2,073 (93.0%) | 157 (7.0%) |
| 1 or 2 Children | 982 (92.8%) | 76 (7.2%) |
| 3 or 4 Children | 340 (79.2%) | 89 (20.7%) |
| 5 or more Children | 0 (0.0%) | 73 (100.0%) |
| Total | 3,395 (89.6%) | 395 (10.4%) |
Income Below Poverty Among Single-Parent Households in New Iberia
According to the poverty data in New Iberia, 21.8% or 269 single-father households and 50.3% or 1,142 single-mother households are living below the poverty line. Among single-father households, those with 5 or more children have the highest poverty rate, with 43 households (100.0%) experiencing poverty. Likewise, among single-mother households, those with 5 or more children have the highest poverty rate, with 43 households (93.5%) falling below the poverty line.
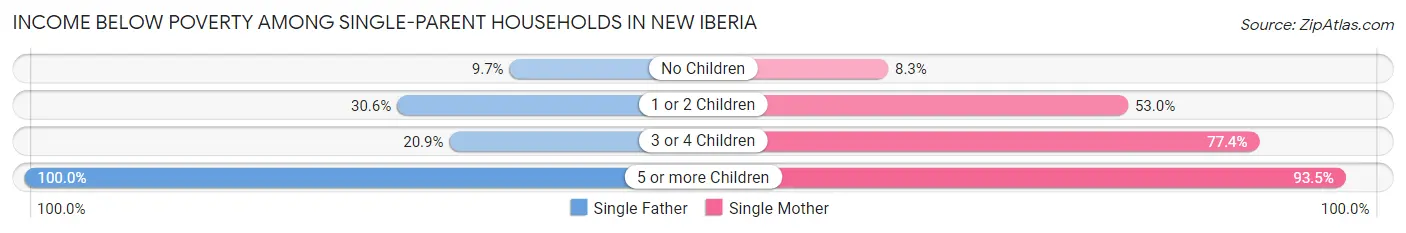
| Children | Single Father | Single Mother |
| No Children | 57 (9.7%) | 40 (8.3%) |
| 1 or 2 Children | 136 (30.6%) | 627 (53.0%) |
| 3 or 4 Children | 33 (20.9%) | 432 (77.4%) |
| 5 or more Children | 43 (100.0%) | 43 (93.5%) |
| Total | 269 (21.8%) | 1,142 (50.3%) |
Income Below Poverty Among Married-Couple vs Single-Parent Households in New Iberia
The poverty data for New Iberia shows that 395 of the married-couple family households (10.4%) and 1,411 of the single-parent households (40.3%) are living below the poverty level. Within the married-couple family households, those with 5 or more children have the highest poverty rate, with 73 households (100.0%) falling below the poverty line. Among the single-parent households, those with 5 or more children have the highest poverty rate, with 86 household (96.6%) living below poverty.
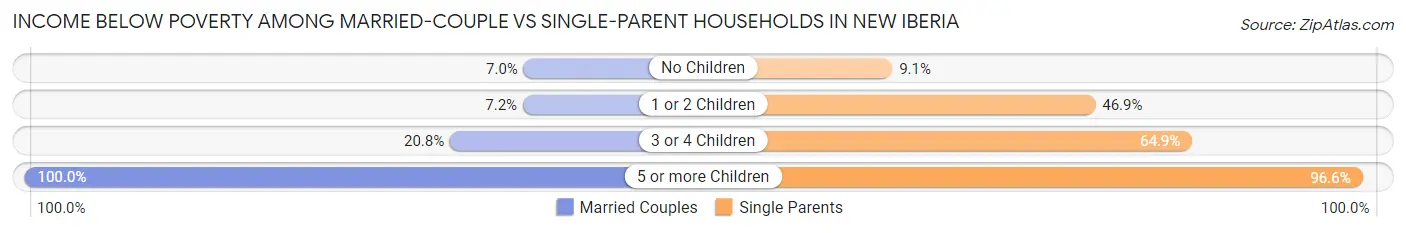
| Children | Married-Couple Families | Single-Parent Households |
| No Children | 157 (7.0%) | 97 (9.0%) |
| 1 or 2 Children | 76 (7.2%) | 763 (46.9%) |
| 3 or 4 Children | 89 (20.7%) | 465 (64.9%) |
| 5 or more Children | 73 (100.0%) | 86 (96.6%) |
| Total | 395 (10.4%) | 1,411 (40.3%) |
Race in New Iberia
The most populous races in New Iberia are White / Caucasian (13,211 | 46.6%), Black / African American (12,682 | 44.7%), and Two or more Races (1,782 | 6.3%).
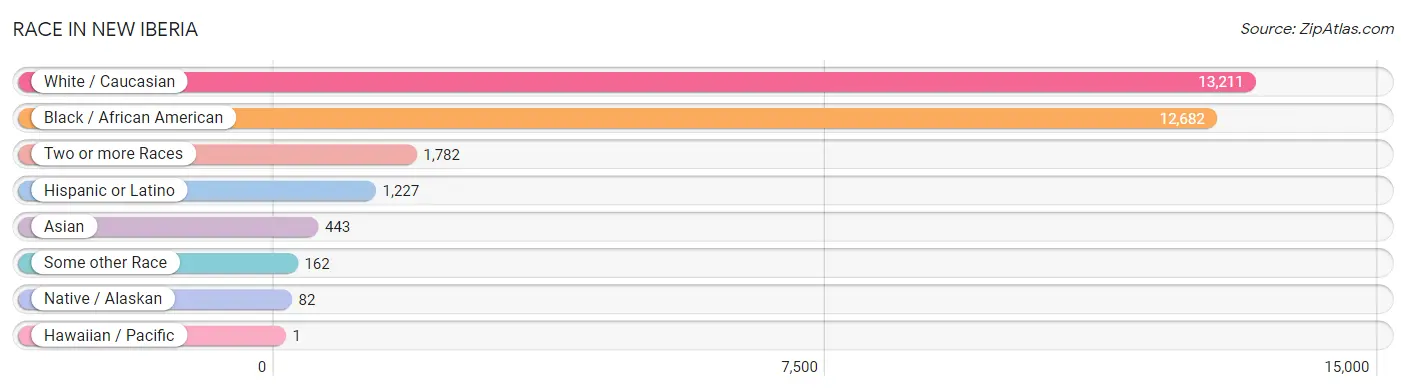
| Race | # Population | % Population |
| Asian | 443 | 1.6% |
| Black / African American | 12,682 | 44.7% |
| Hawaiian / Pacific | 1 | 0.0% |
| Hispanic or Latino | 1,227 | 4.3% |
| Native / Alaskan | 82 | 0.3% |
| White / Caucasian | 13,211 | 46.6% |
| Two or more Races | 1,782 | 6.3% |
| Some other Race | 162 | 0.6% |
| Total | 28,363 | 100.0% |
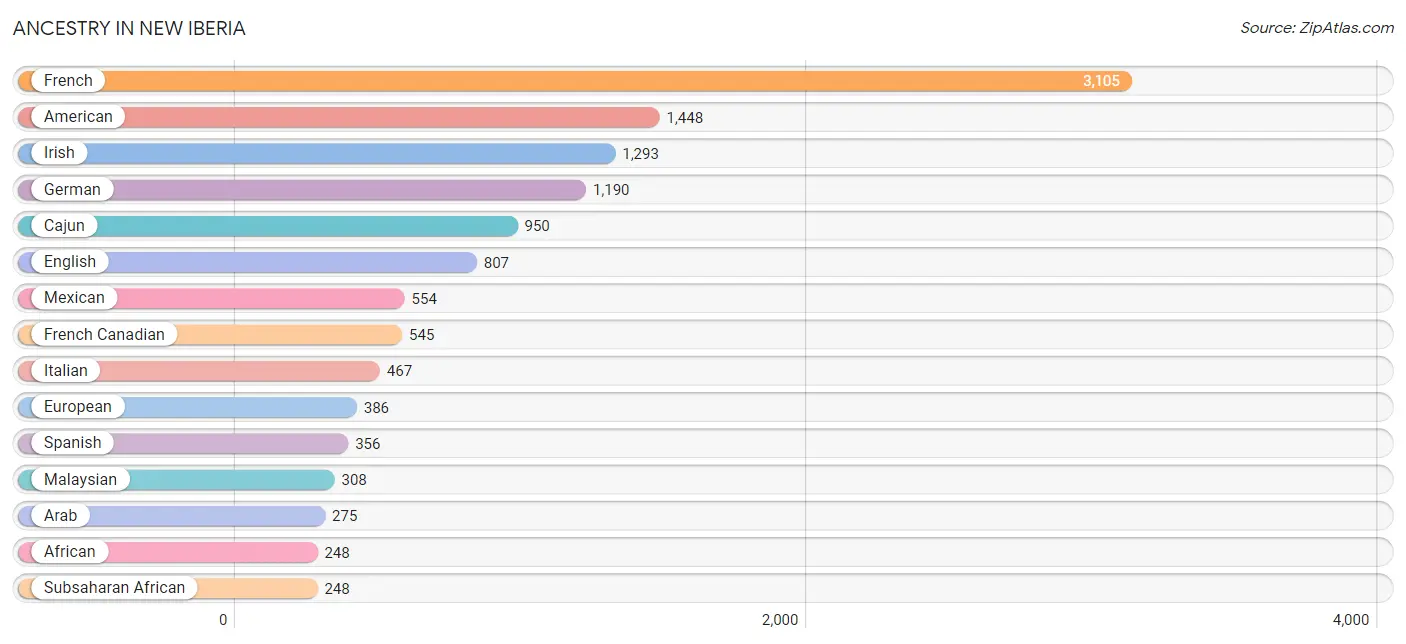
Ancestry in New Iberia
The most populous ancestries reported in New Iberia are French (3,105 | 11.0%), American (1,448 | 5.1%), Irish (1,293 | 4.6%), German (1,190 | 4.2%), and Cajun (950 | 3.4%), together accounting for 28.2% of all New Iberia residents.
| Ancestry | # Population | % Population |
| African | 248 | 0.9% |
| American | 1,448 | 5.1% |
| Arab | 275 | 1.0% |
| Austrian | 10 | 0.0% |
| Bhutanese | 1 | 0.0% |
| Blackfeet | 15 | 0.1% |
| British | 50 | 0.2% |
| Cajun | 950 | 3.4% |
| Canadian | 32 | 0.1% |
| Central American | 114 | 0.4% |
| Central American Indian | 31 | 0.1% |
| Cherokee | 54 | 0.2% |
| Croatian | 12 | 0.0% |
| Czech | 25 | 0.1% |
| Dutch | 68 | 0.2% |
| English | 807 | 2.9% |
| European | 386 | 1.4% |
| French | 3,105 | 11.0% |
| French American Indian | 1 | 0.0% |
| French Canadian | 545 | 1.9% |
| German | 1,190 | 4.2% |
| Honduran | 35 | 0.1% |
| Houma | 6 | 0.0% |
| Hungarian | 9 | 0.0% |
| Indian (Asian) | 92 | 0.3% |
| Irish | 1,293 | 4.6% |
| Italian | 467 | 1.7% |
| Korean | 25 | 0.1% |
| Lebanese | 51 | 0.2% |
| Malaysian | 308 | 1.1% |
| Mexican | 554 | 1.9% |
| Mexican American Indian | 88 | 0.3% |
| Moroccan | 224 | 0.8% |
| Panamanian | 33 | 0.1% |
| Polish | 167 | 0.6% |
| Portuguese | 6 | 0.0% |
| Puerto Rican | 75 | 0.3% |
| Salvadoran | 46 | 0.2% |
| Scandinavian | 11 | 0.0% |
| Scotch-Irish | 95 | 0.3% |
| Scottish | 49 | 0.2% |
| Slovene | 2 | 0.0% |
| South American | 51 | 0.2% |
| Spaniard | 9 | 0.0% |
| Spanish | 356 | 1.3% |
| Spanish American | 21 | 0.1% |
| Sri Lankan | 88 | 0.3% |
| Subsaharan African | 248 | 0.9% |
| Swedish | 23 | 0.1% |
| Thai | 8 | 0.0% |
| Venezuelan | 51 | 0.2% | View All 51 Rows |
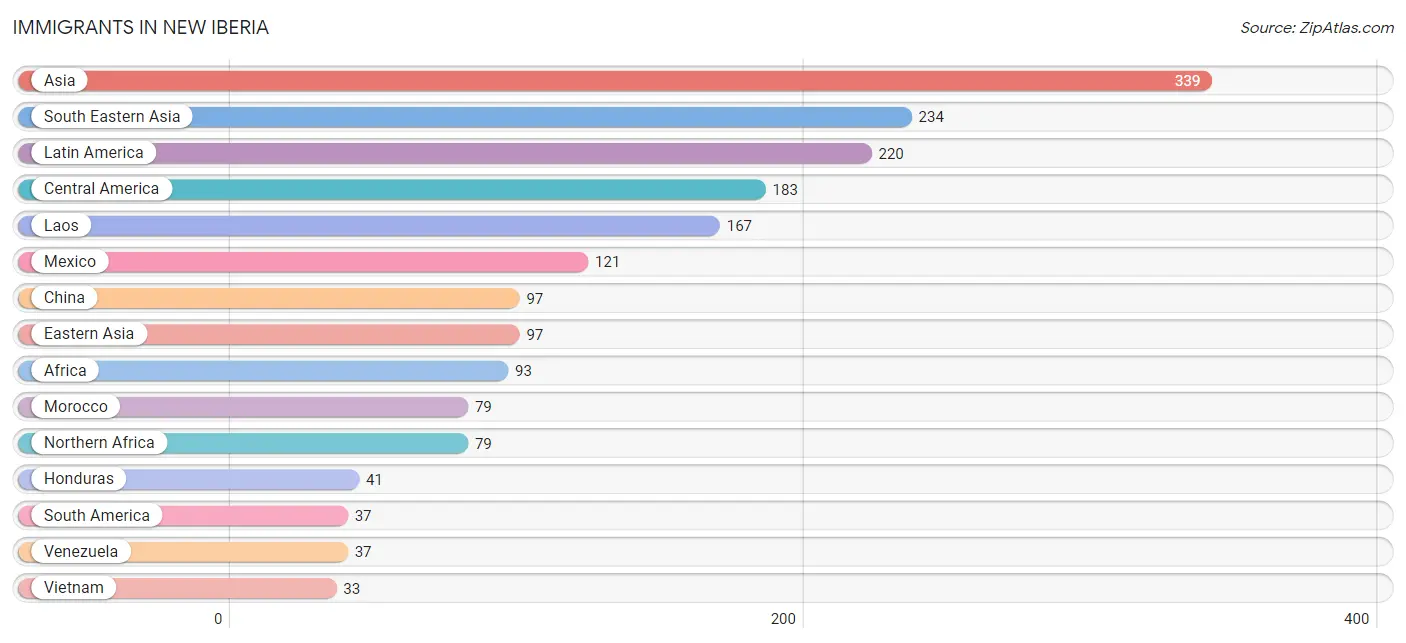
Immigrants in New Iberia
The most numerous immigrant groups reported in New Iberia came from Asia (339 | 1.2%), South Eastern Asia (234 | 0.8%), Latin America (220 | 0.8%), Central America (183 | 0.6%), and Laos (167 | 0.6%), together accounting for 4.1% of all New Iberia residents.
| Immigration Origin | # Population | % Population |
| Africa | 93 | 0.3% |
| Asia | 339 | 1.2% |
| Canada | 22 | 0.1% |
| Central America | 183 | 0.6% |
| China | 97 | 0.3% |
| Eastern Asia | 97 | 0.3% |
| El Salvador | 20 | 0.1% |
| Europe | 10 | 0.0% |
| France | 10 | 0.0% |
| Ghana | 14 | 0.1% |
| Honduras | 41 | 0.1% |
| India | 8 | 0.0% |
| Laos | 167 | 0.6% |
| Latin America | 220 | 0.8% |
| Mexico | 121 | 0.4% |
| Morocco | 79 | 0.3% |
| Northern Africa | 79 | 0.3% |
| Panama | 1 | 0.0% |
| Philippines | 18 | 0.1% |
| South America | 37 | 0.1% |
| South Central Asia | 8 | 0.0% |
| South Eastern Asia | 234 | 0.8% |
| Thailand | 16 | 0.1% |
| Venezuela | 37 | 0.1% |
| Vietnam | 33 | 0.1% |
| Western Africa | 14 | 0.1% |
| Western Europe | 10 | 0.0% | View All 27 Rows |
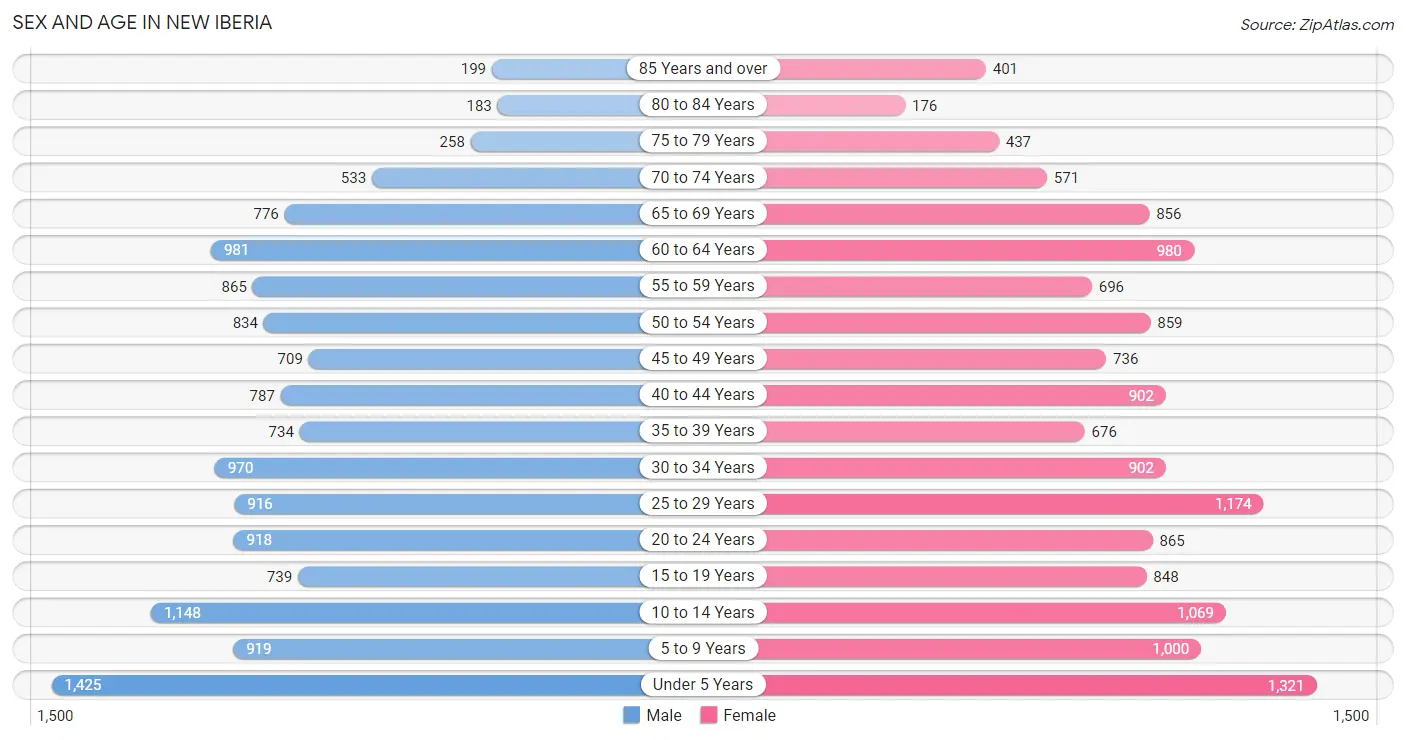
Sex and Age in New Iberia
Sex and Age in New Iberia
The most populous age groups in New Iberia are Under 5 Years (1,425 | 10.3%) for men and Under 5 Years (1,321 | 9.1%) for women.
| Age Bracket | Male | Female |
| Under 5 Years | 1,425 (10.3%) | 1,321 (9.1%) |
| 5 to 9 Years | 919 (6.6%) | 1,000 (6.9%) |
| 10 to 14 Years | 1,148 (8.3%) | 1,069 (7.4%) |
| 15 to 19 Years | 739 (5.3%) | 848 (5.9%) |
| 20 to 24 Years | 918 (6.6%) | 865 (6.0%) |
| 25 to 29 Years | 916 (6.6%) | 1,174 (8.1%) |
| 30 to 34 Years | 970 (7.0%) | 902 (6.2%) |
| 35 to 39 Years | 734 (5.3%) | 676 (4.7%) |
| 40 to 44 Years | 787 (5.7%) | 902 (6.2%) |
| 45 to 49 Years | 709 (5.1%) | 736 (5.1%) |
| 50 to 54 Years | 834 (6.0%) | 859 (5.9%) |
| 55 to 59 Years | 865 (6.2%) | 696 (4.8%) |
| 60 to 64 Years | 981 (7.1%) | 980 (6.8%) |
| 65 to 69 Years | 776 (5.6%) | 856 (5.9%) |
| 70 to 74 Years | 533 (3.8%) | 571 (4.0%) |
| 75 to 79 Years | 258 (1.9%) | 437 (3.0%) |
| 80 to 84 Years | 183 (1.3%) | 176 (1.2%) |
| 85 Years and over | 199 (1.4%) | 401 (2.8%) |
| Total | 13,894 (100.0%) | 14,469 (100.0%) |
Families and Households in New Iberia
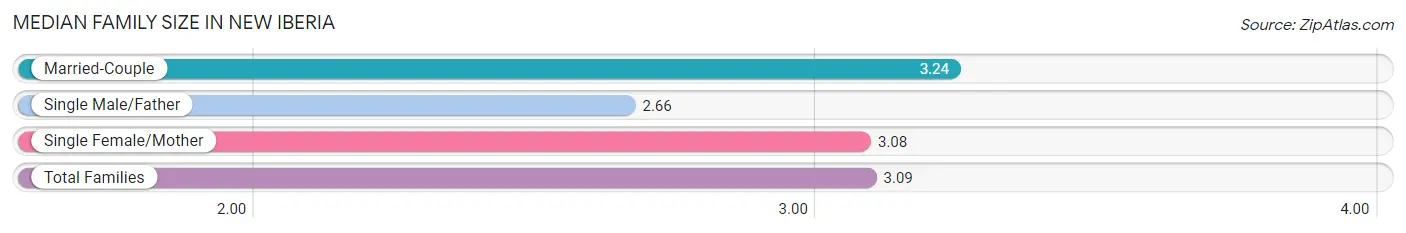
Median Family Size in New Iberia
The median family size in New Iberia is 3.09 persons per family, with married-couple families (3,790 | 51.9%) accounting for the largest median family size of 3.24 persons per family. On the other hand, single male/father families (1,233 | 16.9%) represent the smallest median family size with 2.66 persons per family.
| Family Type | # Families | Family Size |
| Married-Couple | 3,790 (51.9%) | 3.24 |
| Single Male/Father | 1,233 (16.9%) | 2.66 |
| Single Female/Mother | 2,272 (31.1%) | 3.08 |
| Total Families | 7,295 (100.0%) | 3.09 |
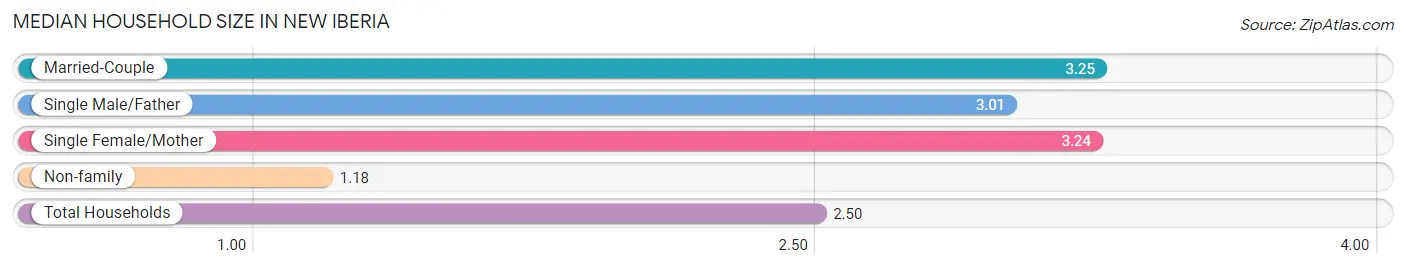
Median Household Size in New Iberia
The median household size in New Iberia is 2.50 persons per household, with married-couple households (3,790 | 33.8%) accounting for the largest median household size of 3.25 persons per household. non-family households (3,906 | 34.9%) represent the smallest median household size with 1.18 persons per household.
| Household Type | # Households | Household Size |
| Married-Couple | 3,790 (33.8%) | 3.25 |
| Single Male/Father | 1,233 (11.0%) | 3.01 |
| Single Female/Mother | 2,272 (20.3%) | 3.24 |
| Non-family | 3,906 (34.9%) | 1.18 |
| Total Households | 11,201 (100.0%) | 2.50 |
Household Size by Marriage Status in New Iberia
Out of a total of 11,201 households in New Iberia, 7,295 (65.1%) are family households, while 3,906 (34.9%) are nonfamily households. The most numerous type of family households are 2-person households, comprising 3,020, and the most common type of nonfamily households are 1-person households, comprising 3,271.
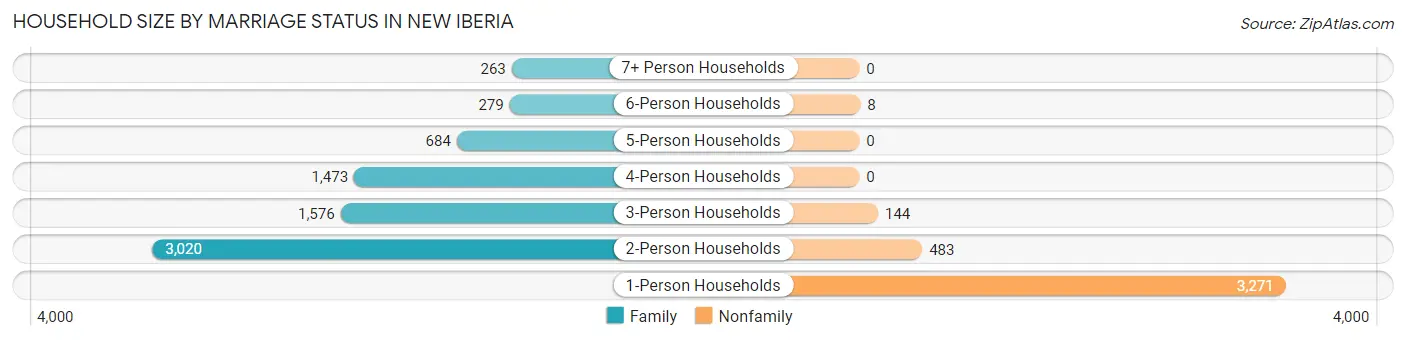
| Household Size | Family Households | Nonfamily Households |
| 1-Person Households | - | 3,271 (29.2%) |
| 2-Person Households | 3,020 (27.0%) | 483 (4.3%) |
| 3-Person Households | 1,576 (14.1%) | 144 (1.3%) |
| 4-Person Households | 1,473 (13.2%) | 0 (0.0%) |
| 5-Person Households | 684 (6.1%) | 0 (0.0%) |
| 6-Person Households | 279 (2.5%) | 8 (0.1%) |
| 7+ Person Households | 263 (2.4%) | 0 (0.0%) |
| Total | 7,295 (65.1%) | 3,906 (34.9%) |
Female Fertility in New Iberia
Fertility by Age in New Iberia
Average fertility rate in New Iberia is 82.0 births per 1,000 women. Women in the age bracket of 20 to 34 years have the highest fertility rate with 171.0 births per 1,000 women. Women in the age bracket of 20 to 34 years acount for 97.7% of all women with births.
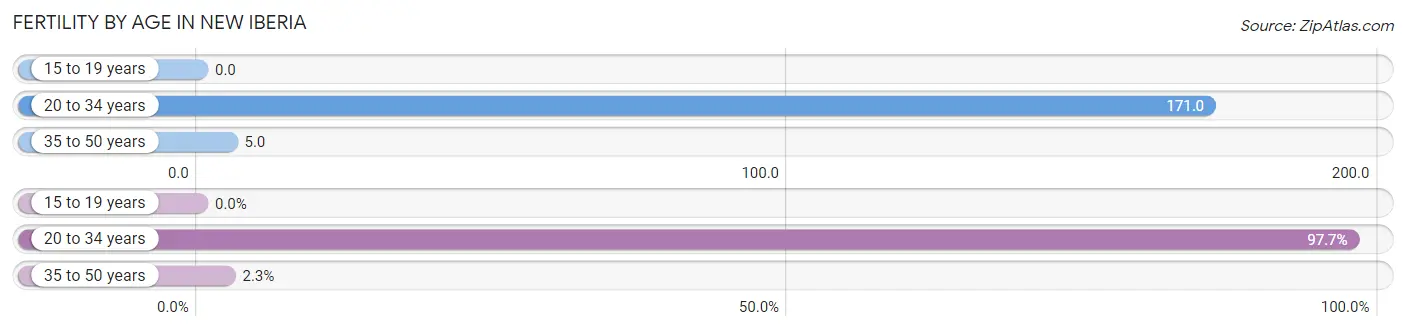
| Age Bracket | Women with Births | Births / 1,000 Women |
| 15 to 19 years | 0 (0.0%) | 0.0 |
| 20 to 34 years | 502 (97.7%) | 171.0 |
| 35 to 50 years | 12 (2.3%) | 5.0 |
| Total | 514 (100.0%) | 82.0 |
Fertility by Age by Marriage Status in New Iberia
36.8% of women with births (514) in New Iberia are married. The highest percentage of unmarried women with births falls into 20 to 34 years age bracket with 64.7% of them unmarried at the time of birth, while the lowest percentage of unmarried women with births belong to 35 to 50 years age bracket with 0.0% of them unmarried.
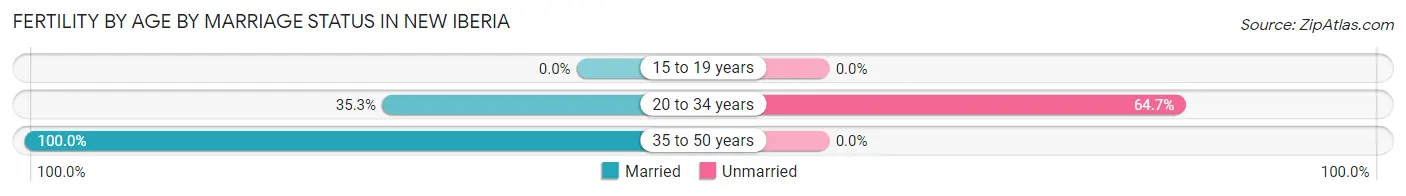
| Age Bracket | Married | Unmarried |
| 15 to 19 years | 0 (0.0%) | 0 (0.0%) |
| 20 to 34 years | 177 (35.3%) | 325 (64.7%) |
| 35 to 50 years | 12 (100.0%) | 0 (0.0%) |
| Total | 189 (36.8%) | 325 (63.2%) |
Fertility by Education in New Iberia
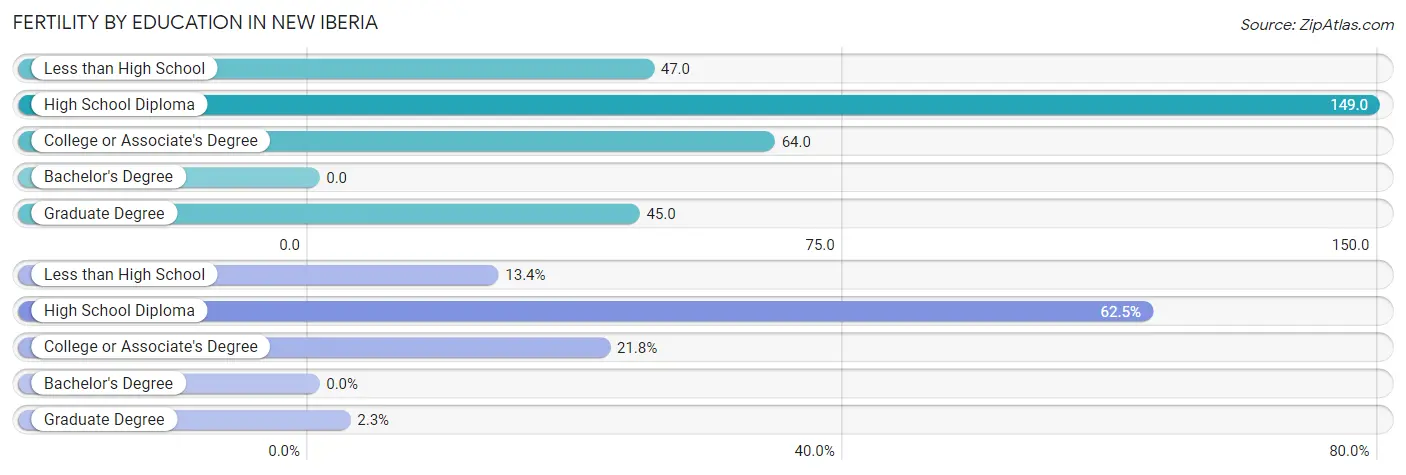
| Educational Attainment | Women with Births | Births / 1,000 Women |
| Less than High School | 69 (13.4%) | 47.0 |
| High School Diploma | 321 (62.5%) | 149.0 |
| College or Associate's Degree | 112 (21.8%) | 64.0 |
| Bachelor's Degree | 0 (0.0%) | 0.0 |
| Graduate Degree | 12 (2.3%) | 45.0 |
| Total | 514 (100.0%) | 82.0 |
Fertility by Education by Marriage Status in New Iberia
63.2% of women with births in New Iberia are unmarried. Women with the educational attainment of graduate degree are most likely to be married with 100.0% of them married at childbirth, while women with the educational attainment of less than high school are least likely to be married with 100.0% of them unmarried at childbirth.
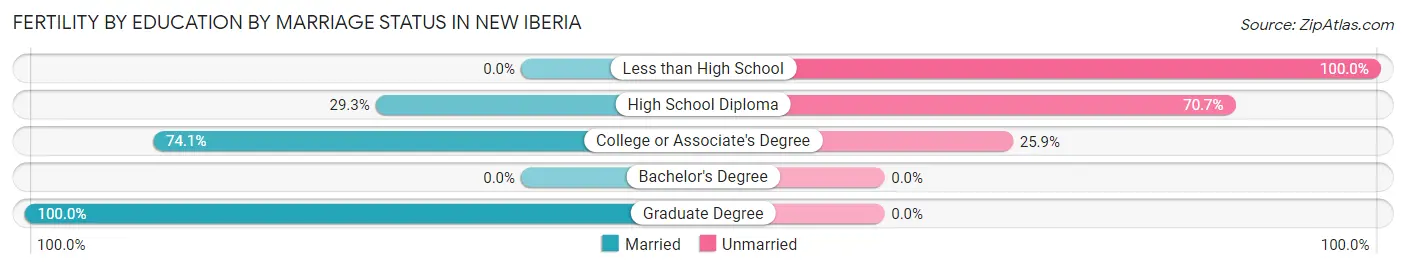
| Educational Attainment | Married | Unmarried |
| Less than High School | 0 (0.0%) | 69 (100.0%) |
| High School Diploma | 94 (29.3%) | 227 (70.7%) |
| College or Associate's Degree | 83 (74.1%) | 29 (25.9%) |
| Bachelor's Degree | 0 (0.0%) | 0 (0.0%) |
| Graduate Degree | 12 (100.0%) | 0 (0.0%) |
| Total | 189 (36.8%) | 325 (63.2%) |
Employment Characteristics in New Iberia
Employment by Class of Employer in New Iberia
Among the 10,407 employed individuals in New Iberia, private company employees (7,675 | 73.8%), local government employees (897 | 8.6%), and self-employed (not incorporated) (748 | 7.2%) make up the most common classes of employment.
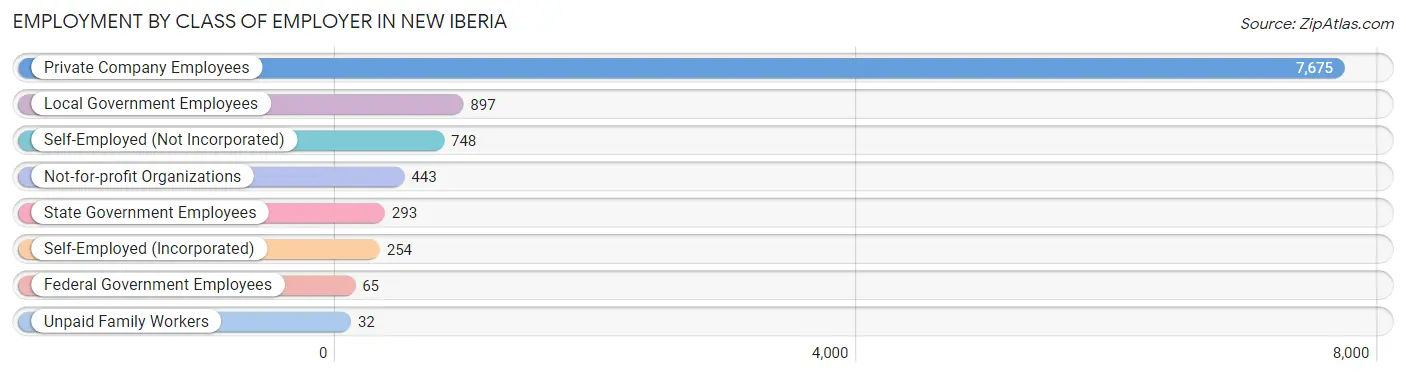
| Employer Class | # Employees | % Employees |
| Private Company Employees | 7,675 | 73.8% |
| Self-Employed (Incorporated) | 254 | 2.4% |
| Self-Employed (Not Incorporated) | 748 | 7.2% |
| Not-for-profit Organizations | 443 | 4.3% |
| Local Government Employees | 897 | 8.6% |
| State Government Employees | 293 | 2.8% |
| Federal Government Employees | 65 | 0.6% |
| Unpaid Family Workers | 32 | 0.3% |
| Total | 10,407 | 100.0% |
Employment Status by Age in New Iberia
According to the labor force statistics for New Iberia, out of the total population over 16 years of age (21,239), 54.6% or 11,596 individuals are in the labor force, with 9.0% or 1,044 of them unemployed. The age group with the highest labor force participation rate is 25 to 29 years, with 77.8% or 1,626 individuals in the labor force. Within the labor force, the 16 to 19 years age range has the highest percentage of unemployed individuals, with 31.4% or 82 of them being unemployed.
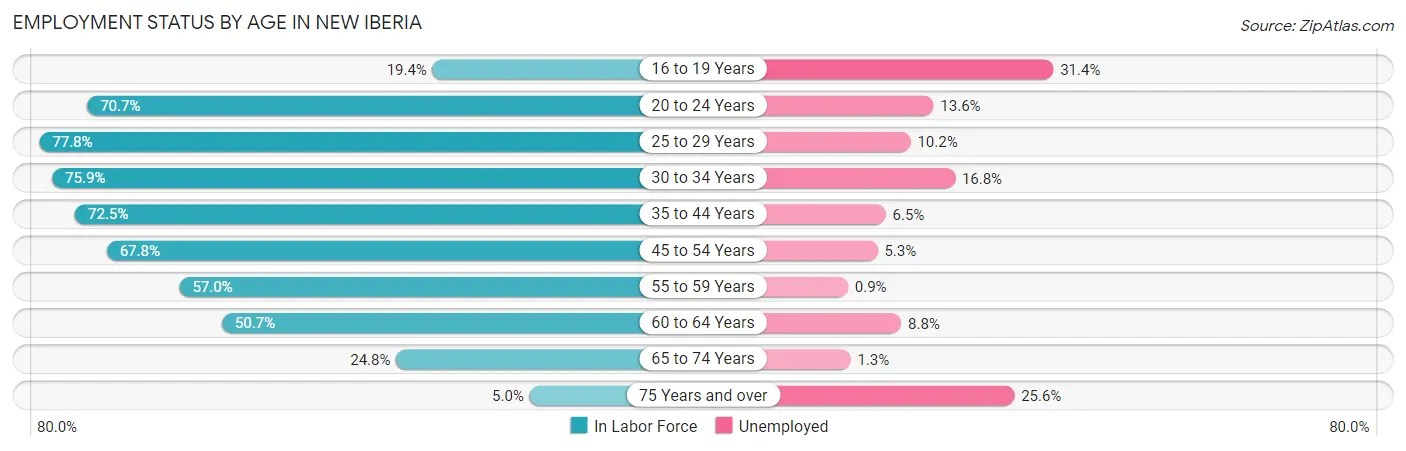
| Age Bracket | In Labor Force | Unemployed |
| 16 to 19 Years | 261 (19.4%) | 82 (31.4%) |
| 20 to 24 Years | 1,261 (70.7%) | 171 (13.6%) |
| 25 to 29 Years | 1,626 (77.8%) | 166 (10.2%) |
| 30 to 34 Years | 1,421 (75.9%) | 239 (16.8%) |
| 35 to 44 Years | 2,247 (72.5%) | 146 (6.5%) |
| 45 to 54 Years | 2,128 (67.8%) | 113 (5.3%) |
| 55 to 59 Years | 890 (57.0%) | 8 (0.9%) |
| 60 to 64 Years | 994 (50.7%) | 87 (8.8%) |
| 65 to 74 Years | 679 (24.8%) | 9 (1.3%) |
| 75 Years and over | 83 (5.0%) | 21 (25.6%) |
| Total | 11,596 (54.6%) | 1,044 (9.0%) |
Employment Status by Educational Attainment in New Iberia
According to labor force statistics for New Iberia, 67.8% of individuals (9,303) out of the total population between 25 and 64 years of age (13,721) are in the labor force, with 8.2% or 763 of them being unemployed. The group with the highest labor force participation rate are those with the educational attainment of bachelor's degree or higher, with 84.8% or 1,932 individuals in the labor force. Within the labor force, individuals with less than high school education have the highest percentage of unemployment, with 13.6% or 192 of them being unemployed.
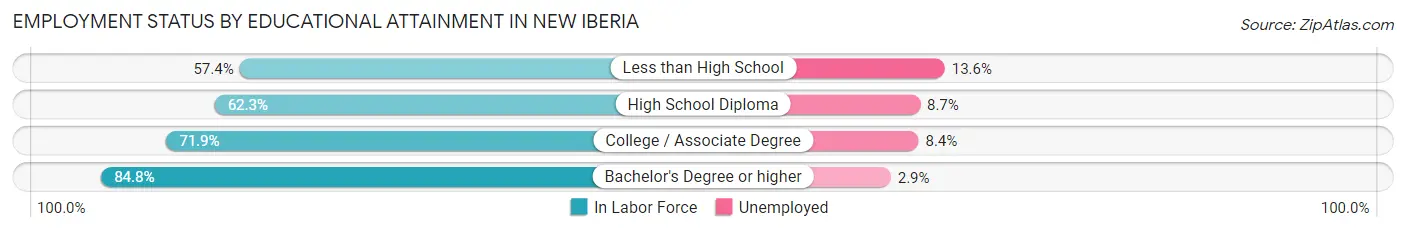
| Educational Attainment | In Labor Force | Unemployed |
| Less than High School | 1,414 (57.4%) | 335 (13.6%) |
| High School Diploma | 3,224 (62.3%) | 450 (8.7%) |
| College / Associate Degree | 2,735 (71.9%) | 320 (8.4%) |
| Bachelor's Degree or higher | 1,932 (84.8%) | 66 (2.9%) |
| Total | 9,303 (67.8%) | 1,125 (8.2%) |
Employment Occupations by Sex in New Iberia
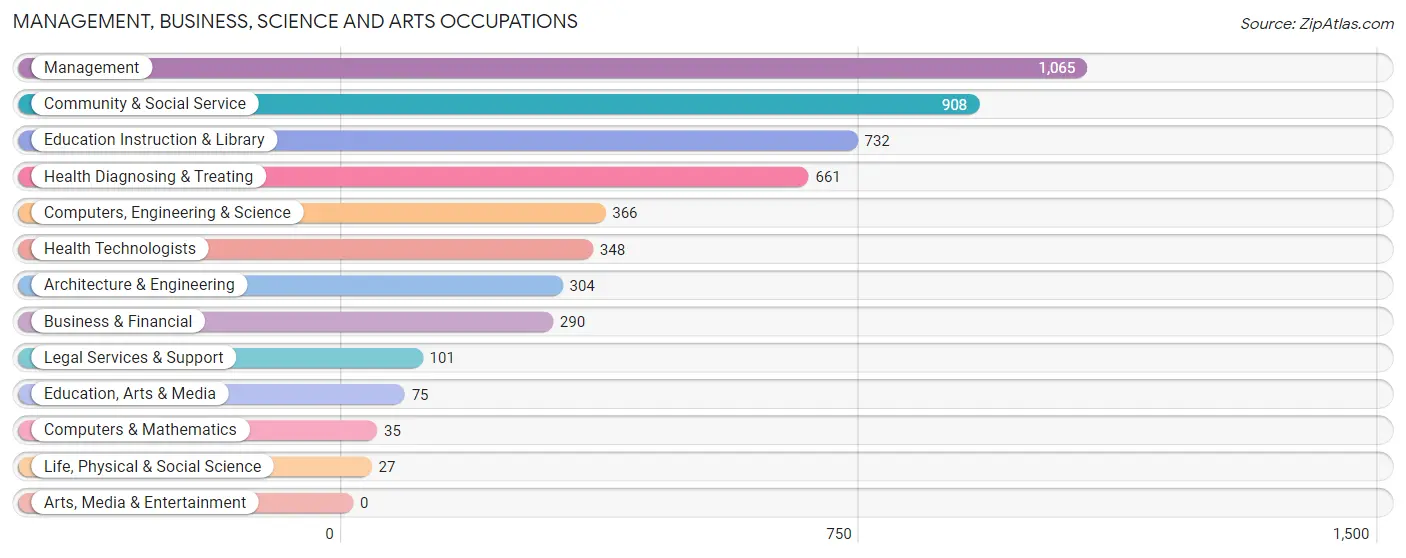
Management, Business, Science and Arts Occupations
The most common Management, Business, Science and Arts occupations in New Iberia are Management (1,065 | 10.1%), Community & Social Service (908 | 8.6%), Education Instruction & Library (732 | 6.9%), Health Diagnosing & Treating (661 | 6.3%), and Computers, Engineering & Science (366 | 3.5%).
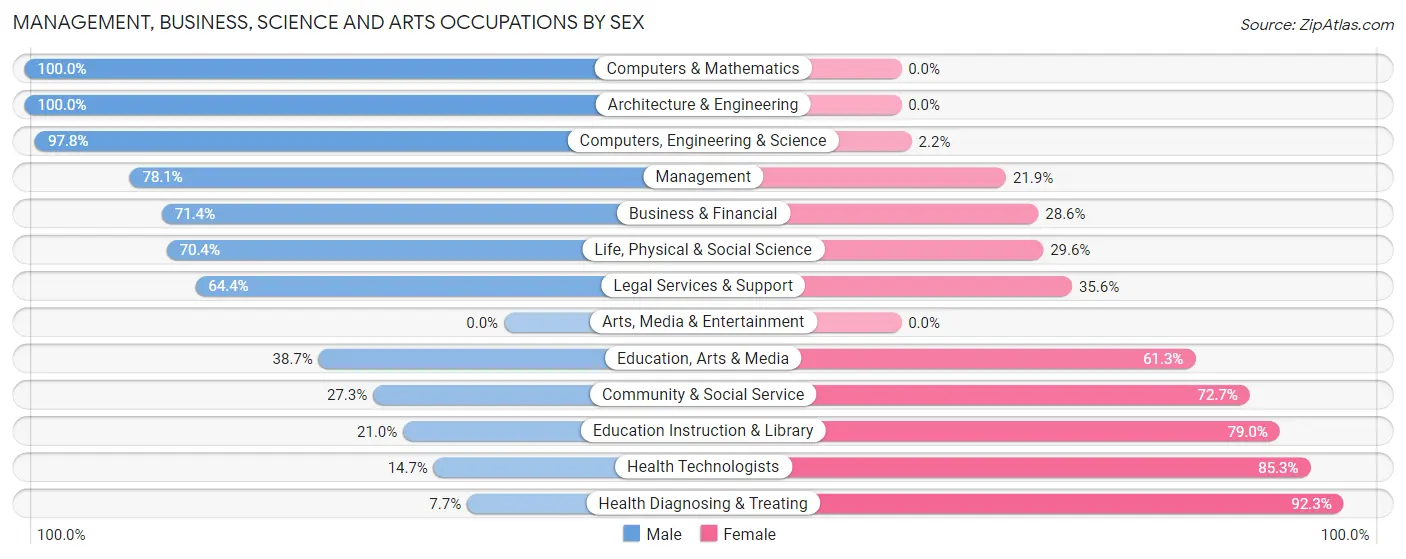
Management, Business, Science and Arts Occupations by Sex
Within the Management, Business, Science and Arts occupations in New Iberia, the most male-oriented occupations are Computers & Mathematics (100.0%), Architecture & Engineering (100.0%), and Computers, Engineering & Science (97.8%), while the most female-oriented occupations are Health Diagnosing & Treating (92.3%), Health Technologists (85.3%), and Education Instruction & Library (79.0%).
| Occupation | Male | Female |
| Management | 832 (78.1%) | 233 (21.9%) |
| Business & Financial | 207 (71.4%) | 83 (28.6%) |
| Computers, Engineering & Science | 358 (97.8%) | 8 (2.2%) |
| Computers & Mathematics | 35 (100.0%) | 0 (0.0%) |
| Architecture & Engineering | 304 (100.0%) | 0 (0.0%) |
| Life, Physical & Social Science | 19 (70.4%) | 8 (29.6%) |
| Community & Social Service | 248 (27.3%) | 660 (72.7%) |
| Education, Arts & Media | 29 (38.7%) | 46 (61.3%) |
| Legal Services & Support | 65 (64.4%) | 36 (35.6%) |
| Education Instruction & Library | 154 (21.0%) | 578 (79.0%) |
| Arts, Media & Entertainment | 0 (0.0%) | 0 (0.0%) |
| Health Diagnosing & Treating | 51 (7.7%) | 610 (92.3%) |
| Health Technologists | 51 (14.7%) | 297 (85.3%) |
| Total (Category) | 1,696 (51.5%) | 1,594 (48.4%) |
| Total (Overall) | 5,543 (52.6%) | 5,004 (47.4%) |
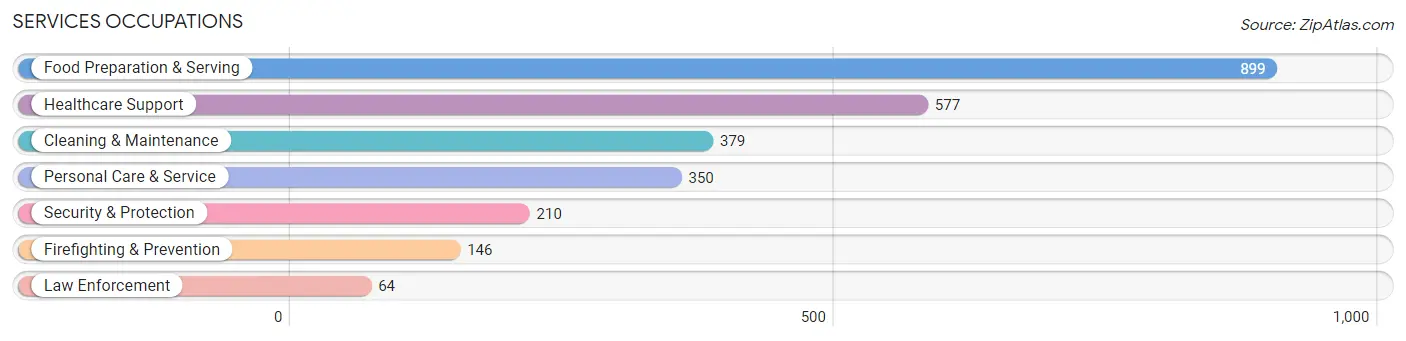
Services Occupations
The most common Services occupations in New Iberia are Food Preparation & Serving (899 | 8.5%), Healthcare Support (577 | 5.5%), Cleaning & Maintenance (379 | 3.6%), Personal Care & Service (350 | 3.3%), and Security & Protection (210 | 2.0%).
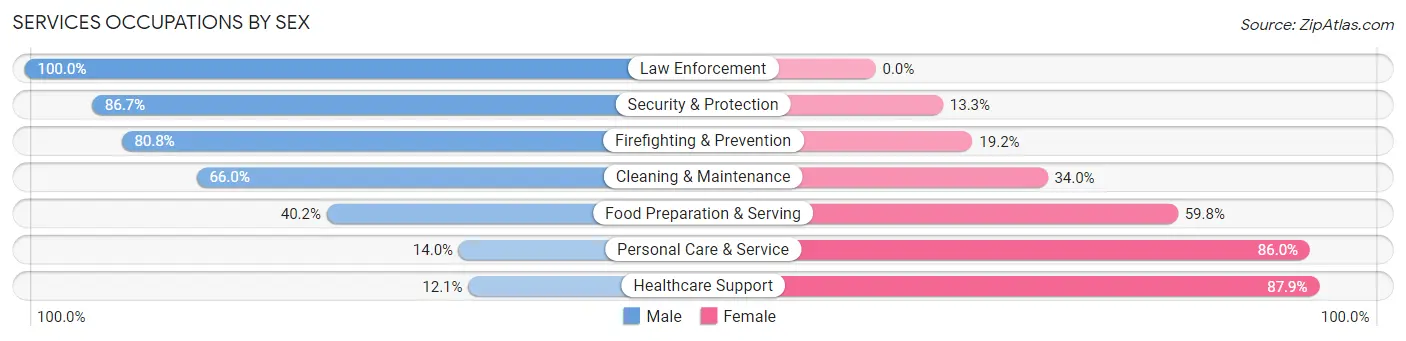
Services Occupations by Sex
Within the Services occupations in New Iberia, the most male-oriented occupations are Law Enforcement (100.0%), Security & Protection (86.7%), and Firefighting & Prevention (80.8%), while the most female-oriented occupations are Healthcare Support (87.9%), Personal Care & Service (86.0%), and Food Preparation & Serving (59.8%).
| Occupation | Male | Female |
| Healthcare Support | 70 (12.1%) | 507 (87.9%) |
| Security & Protection | 182 (86.7%) | 28 (13.3%) |
| Firefighting & Prevention | 118 (80.8%) | 28 (19.2%) |
| Law Enforcement | 64 (100.0%) | 0 (0.0%) |
| Food Preparation & Serving | 361 (40.2%) | 538 (59.8%) |
| Cleaning & Maintenance | 250 (66.0%) | 129 (34.0%) |
| Personal Care & Service | 49 (14.0%) | 301 (86.0%) |
| Total (Category) | 912 (37.8%) | 1,503 (62.2%) |
| Total (Overall) | 5,543 (52.6%) | 5,004 (47.4%) |
Sales and Office Occupations
The most common Sales and Office occupations in New Iberia are Sales & Related (1,299 | 12.3%), and Office & Administration (832 | 7.9%).

Sales and Office Occupations by Sex
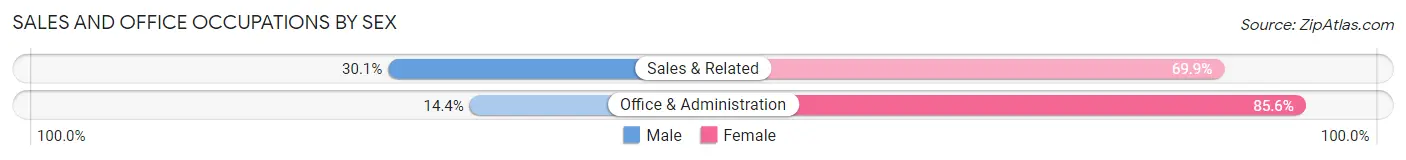
| Occupation | Male | Female |
| Sales & Related | 391 (30.1%) | 908 (69.9%) |
| Office & Administration | 120 (14.4%) | 712 (85.6%) |
| Total (Category) | 511 (24.0%) | 1,620 (76.0%) |
| Total (Overall) | 5,543 (52.6%) | 5,004 (47.4%) |
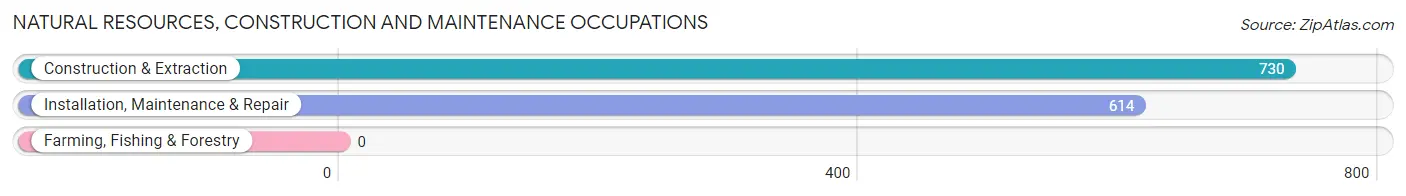
Natural Resources, Construction and Maintenance Occupations
The most common Natural Resources, Construction and Maintenance occupations in New Iberia are Construction & Extraction (730 | 6.9%), and Installation, Maintenance & Repair (614 | 5.8%).
Natural Resources, Construction and Maintenance Occupations by Sex
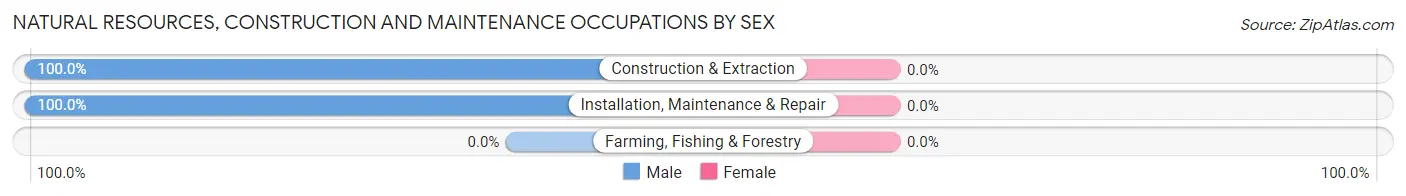
| Occupation | Male | Female |
| Farming, Fishing & Forestry | 0 (0.0%) | 0 (0.0%) |
| Construction & Extraction | 730 (100.0%) | 0 (0.0%) |
| Installation, Maintenance & Repair | 614 (100.0%) | 0 (0.0%) |
| Total (Category) | 1,344 (100.0%) | 0 (0.0%) |
| Total (Overall) | 5,543 (52.6%) | 5,004 (47.4%) |
Production, Transportation and Moving Occupations
The most common Production, Transportation and Moving occupations in New Iberia are Production (687 | 6.5%), Transportation (361 | 3.4%), and Material Moving (319 | 3.0%).
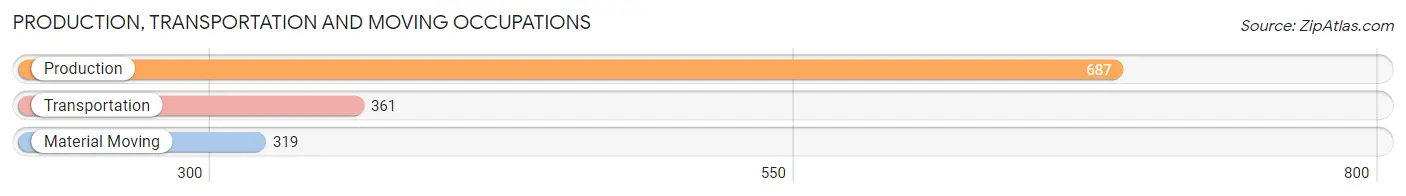
Production, Transportation and Moving Occupations by Sex
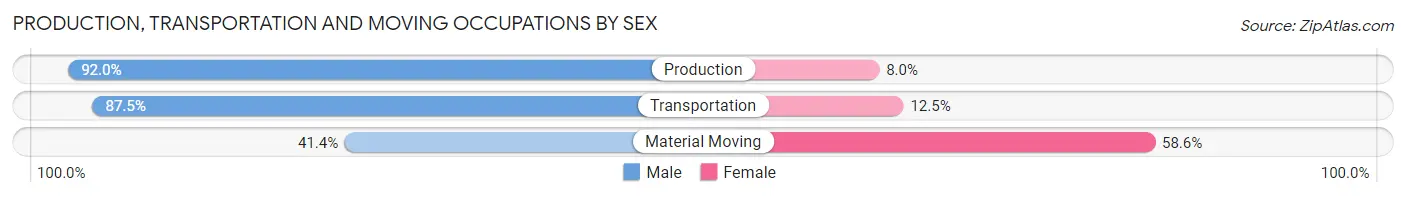
| Occupation | Male | Female |
| Production | 632 (92.0%) | 55 (8.0%) |
| Transportation | 316 (87.5%) | 45 (12.5%) |
| Material Moving | 132 (41.4%) | 187 (58.6%) |
| Total (Category) | 1,080 (79.0%) | 287 (21.0%) |
| Total (Overall) | 5,543 (52.6%) | 5,004 (47.4%) |
Employment Industries by Sex in New Iberia
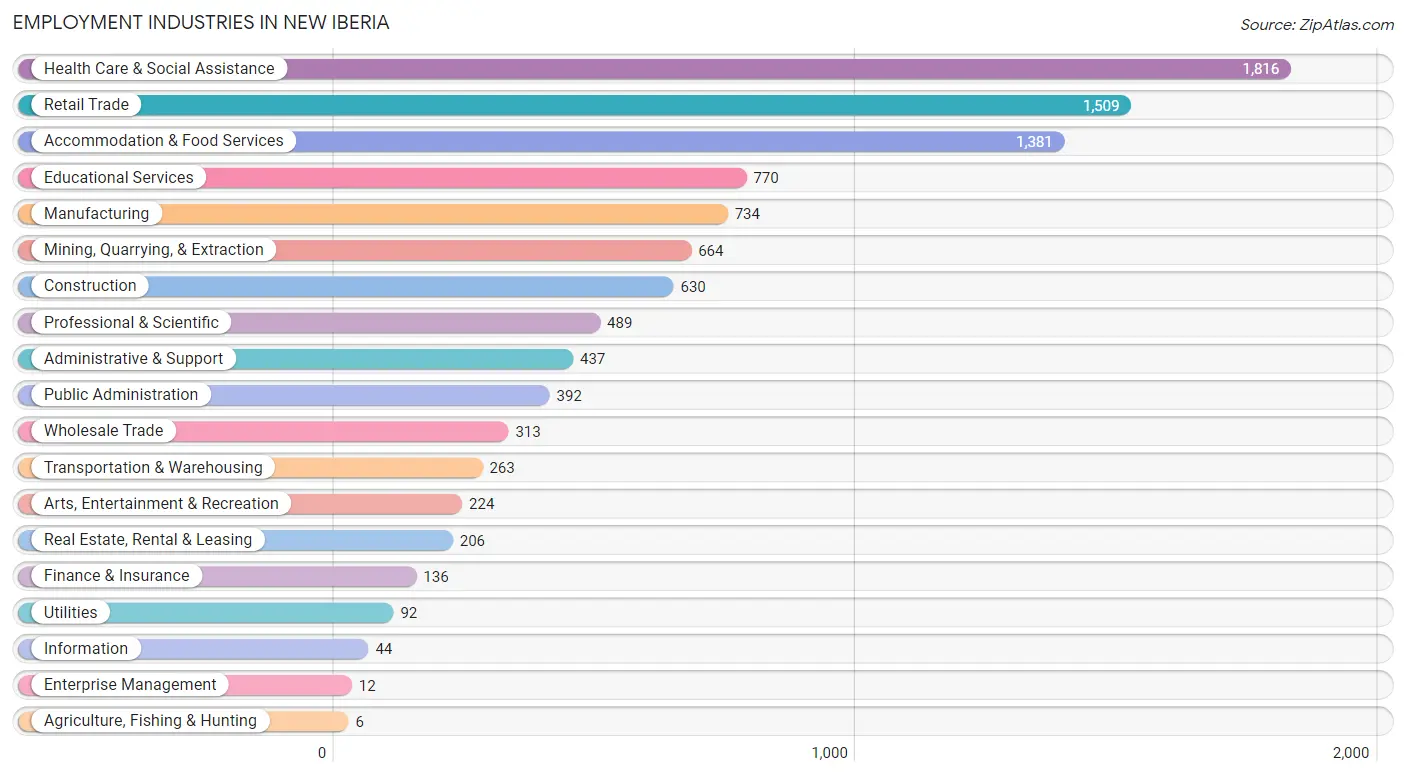
Employment Industries in New Iberia
The major employment industries in New Iberia include Health Care & Social Assistance (1,816 | 17.2%), Retail Trade (1,509 | 14.3%), Accommodation & Food Services (1,381 | 13.1%), Educational Services (770 | 7.3%), and Manufacturing (734 | 7.0%).
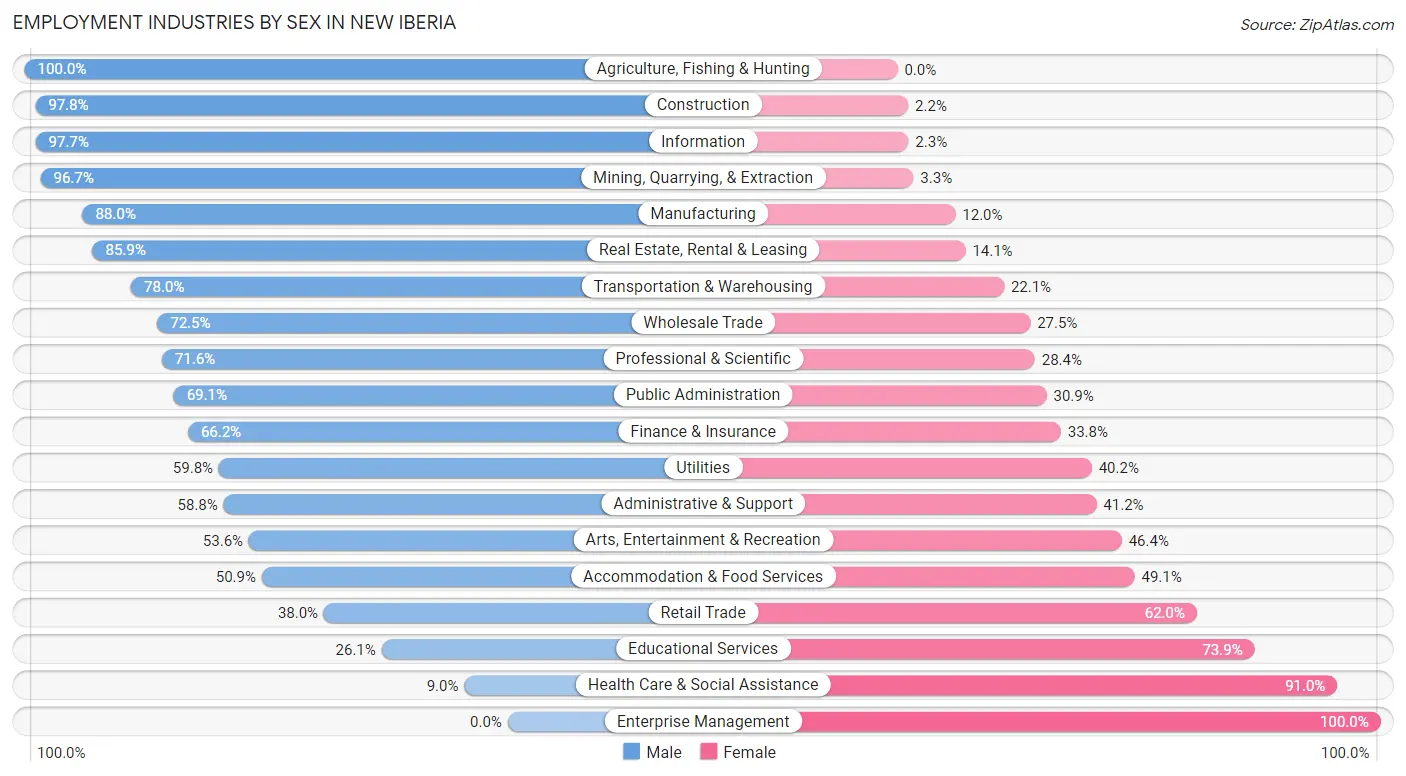
Employment Industries by Sex in New Iberia
The New Iberia industries that see more men than women are Agriculture, Fishing & Hunting (100.0%), Construction (97.8%), and Information (97.7%), whereas the industries that tend to have a higher number of women are Enterprise Management (100.0%), Health Care & Social Assistance (91.0%), and Educational Services (73.9%).
| Industry | Male | Female |
| Agriculture, Fishing & Hunting | 6 (100.0%) | 0 (0.0%) |
| Mining, Quarrying, & Extraction | 642 (96.7%) | 22 (3.3%) |
| Construction | 616 (97.8%) | 14 (2.2%) |
| Manufacturing | 646 (88.0%) | 88 (12.0%) |
| Wholesale Trade | 227 (72.5%) | 86 (27.5%) |
| Retail Trade | 574 (38.0%) | 935 (62.0%) |
| Transportation & Warehousing | 205 (77.9%) | 58 (22.1%) |
| Utilities | 55 (59.8%) | 37 (40.2%) |
| Information | 43 (97.7%) | 1 (2.3%) |
| Finance & Insurance | 90 (66.2%) | 46 (33.8%) |
| Real Estate, Rental & Leasing | 177 (85.9%) | 29 (14.1%) |
| Professional & Scientific | 350 (71.6%) | 139 (28.4%) |
| Enterprise Management | 0 (0.0%) | 12 (100.0%) |
| Administrative & Support | 257 (58.8%) | 180 (41.2%) |
| Educational Services | 201 (26.1%) | 569 (73.9%) |
| Health Care & Social Assistance | 163 (9.0%) | 1,653 (91.0%) |
| Arts, Entertainment & Recreation | 120 (53.6%) | 104 (46.4%) |
| Accommodation & Food Services | 703 (50.9%) | 678 (49.1%) |
| Public Administration | 271 (69.1%) | 121 (30.9%) |
| Total | 5,543 (52.6%) | 5,004 (47.4%) |
Education in New Iberia
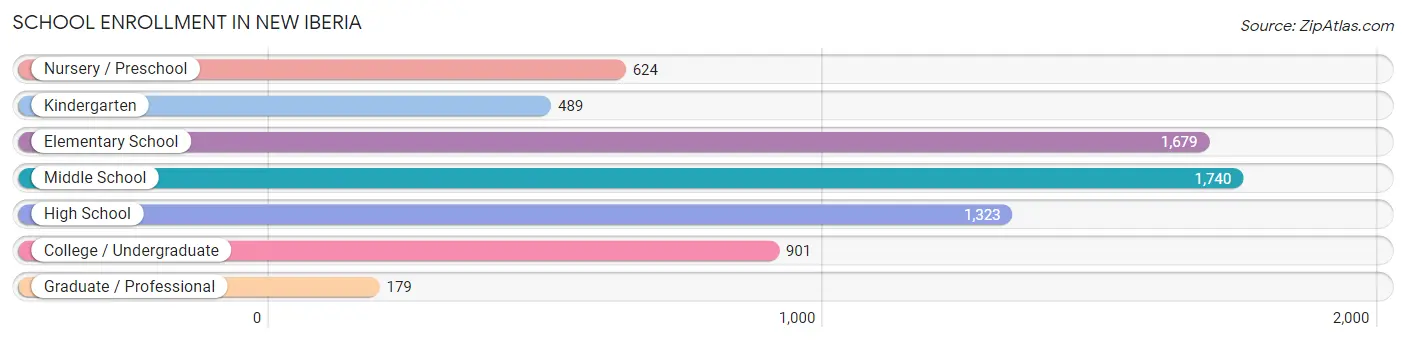
School Enrollment in New Iberia
The most common levels of schooling among the 6,935 students in New Iberia are middle school (1,740 | 25.1%), elementary school (1,679 | 24.2%), and high school (1,323 | 19.1%).
| School Level | # Students | % Students |
| Nursery / Preschool | 624 | 9.0% |
| Kindergarten | 489 | 7.0% |
| Elementary School | 1,679 | 24.2% |
| Middle School | 1,740 | 25.1% |
| High School | 1,323 | 19.1% |
| College / Undergraduate | 901 | 13.0% |
| Graduate / Professional | 179 | 2.6% |
| Total | 6,935 | 100.0% |
School Enrollment by Age by Funding Source in New Iberia
Out of a total of 6,935 students who are enrolled in schools in New Iberia, 978 (14.1%) attend a private institution, while the remaining 5,957 (85.9%) are enrolled in public schools. The age group of 18 to 19 year olds has the highest likelihood of being enrolled in private schools, with 125 (35.4% in the age bracket) enrolled. Conversely, the age group of 5 to 9 year old has the lowest likelihood of being enrolled in a private school, with 1,818 (97.4% in the age bracket) attending a public institution.
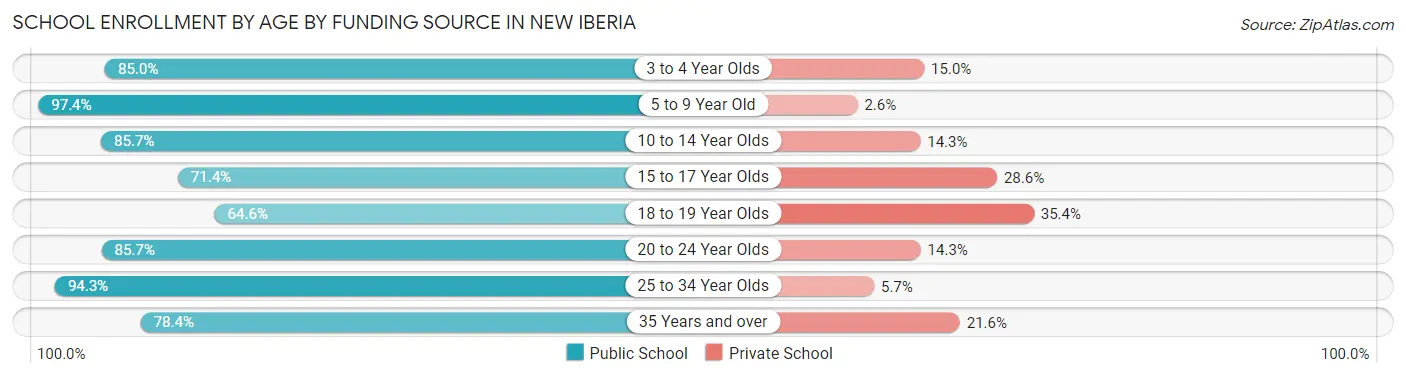
| Age Bracket | Public School | Private School |
| 3 to 4 Year Olds | 482 (85.0%) | 85 (15.0%) |
| 5 to 9 Year Old | 1,818 (97.4%) | 48 (2.6%) |
| 10 to 14 Year Olds | 1,856 (85.7%) | 309 (14.3%) |
| 15 to 17 Year Olds | 643 (71.4%) | 257 (28.6%) |
| 18 to 19 Year Olds | 228 (64.6%) | 125 (35.4%) |
| 20 to 24 Year Olds | 239 (85.7%) | 40 (14.3%) |
| 25 to 34 Year Olds | 367 (94.3%) | 22 (5.7%) |
| 35 Years and over | 326 (78.4%) | 90 (21.6%) |
| Total | 5,957 (85.9%) | 978 (14.1%) |
Educational Attainment by Field of Study in New Iberia
Business (594 | 18.6%), science & technology (457 | 14.3%), education (415 | 13.0%), liberal arts & history (320 | 10.0%), and arts & humanities (272 | 8.5%) are the most common fields of study among 3,199 individuals in New Iberia who have obtained a bachelor's degree or higher.
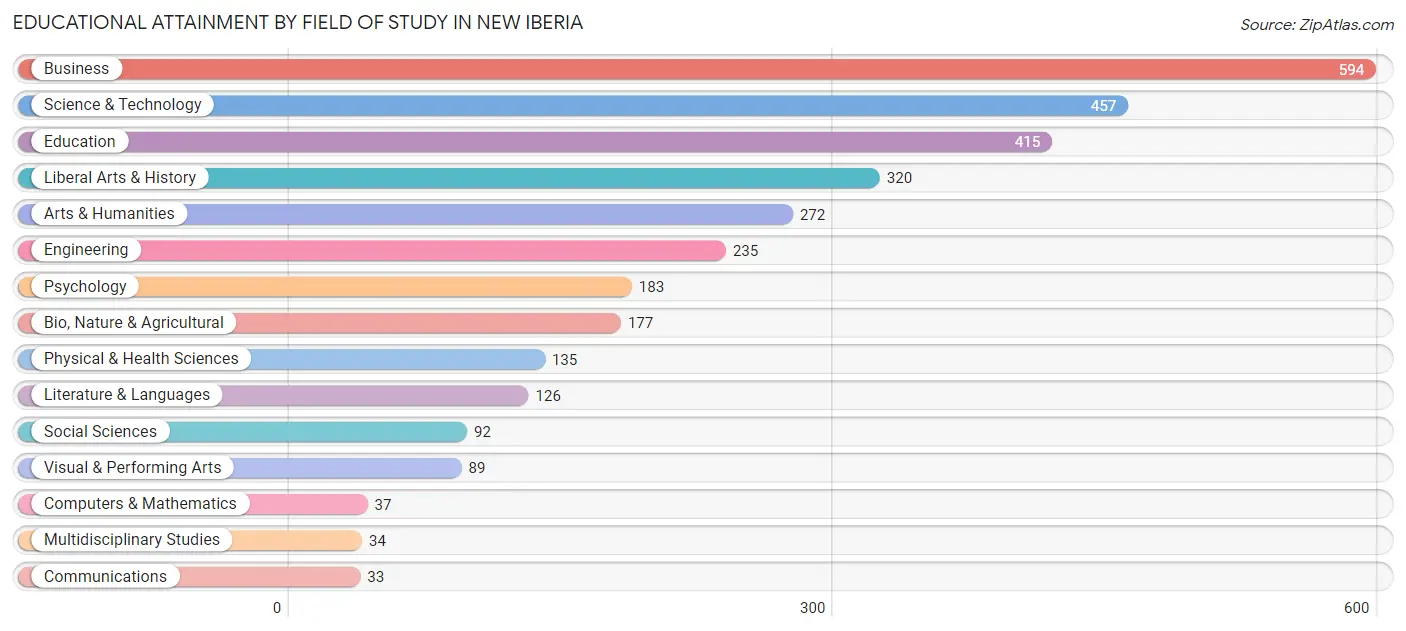
| Field of Study | # Graduates | % Graduates |
| Computers & Mathematics | 37 | 1.2% |
| Bio, Nature & Agricultural | 177 | 5.5% |
| Physical & Health Sciences | 135 | 4.2% |
| Psychology | 183 | 5.7% |
| Social Sciences | 92 | 2.9% |
| Engineering | 235 | 7.3% |
| Multidisciplinary Studies | 34 | 1.1% |
| Science & Technology | 457 | 14.3% |
| Business | 594 | 18.6% |
| Education | 415 | 13.0% |
| Literature & Languages | 126 | 3.9% |
| Liberal Arts & History | 320 | 10.0% |
| Visual & Performing Arts | 89 | 2.8% |
| Communications | 33 | 1.0% |
| Arts & Humanities | 272 | 8.5% |
| Total | 3,199 | 100.0% |
Transportation & Commute in New Iberia
Vehicle Availability by Sex in New Iberia
The most prevalent vehicle ownership categories in New Iberia are males with 2 vehicles (2,221, accounting for 40.6%) and females with 2 vehicles (1,918, making up 45.1%).
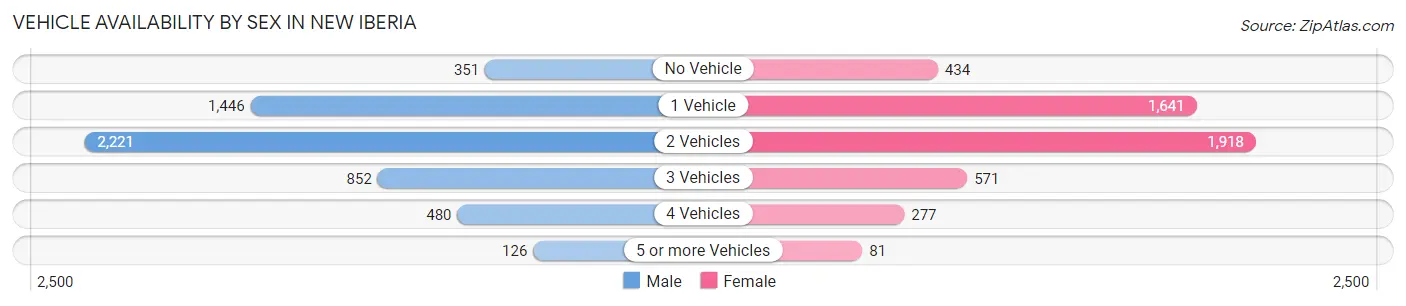
| Vehicles Available | Male | Female |
| No Vehicle | 351 (6.4%) | 434 (8.8%) |
| 1 Vehicle | 1,446 (26.4%) | 1,641 (33.3%) |
| 2 Vehicles | 2,221 (40.6%) | 1,918 (39.0%) |
| 3 Vehicles | 852 (15.6%) | 571 (11.6%) |
| 4 Vehicles | 480 (8.8%) | 277 (5.6%) |
| 5 or more Vehicles | 126 (2.3%) | 81 (1.7%) |
| Total | 5,476 (100.0%) | 4,922 (100.0%) |
Commute Time in New Iberia
The most frequently occuring commute durations in New Iberia are 10 to 14 minutes (2,300 commuters, 22.9%), 5 to 9 minutes (1,829 commuters, 18.2%), and 15 to 19 minutes (1,191 commuters, 11.8%).
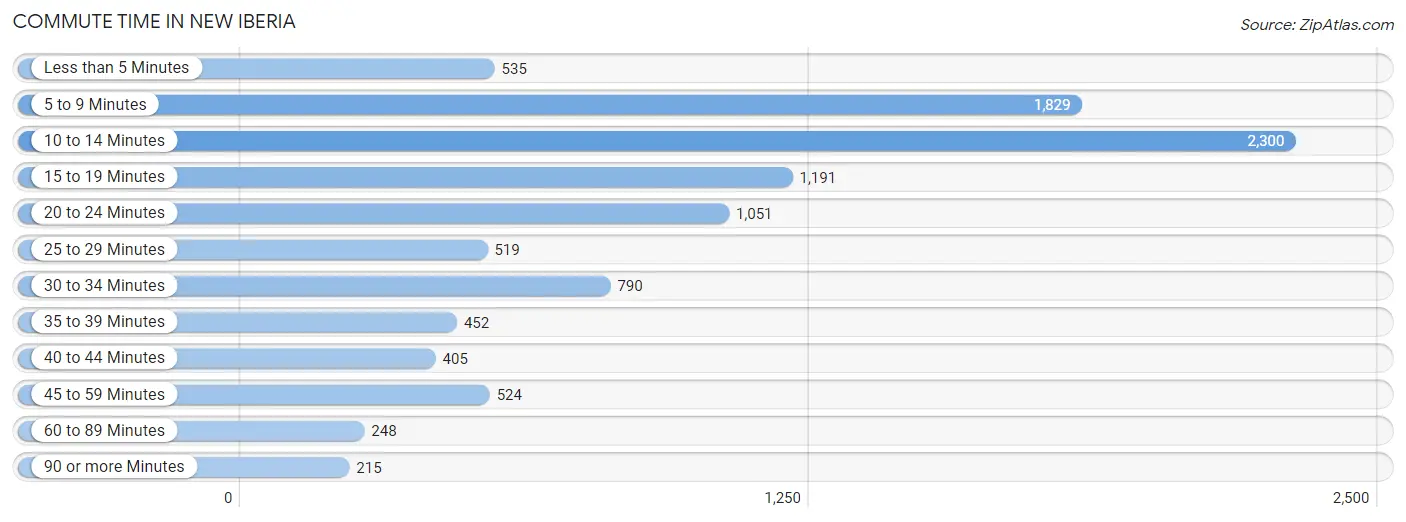
| Commute Time | # Commuters | % Commuters |
| Less than 5 Minutes | 535 | 5.3% |
| 5 to 9 Minutes | 1,829 | 18.2% |
| 10 to 14 Minutes | 2,300 | 22.9% |
| 15 to 19 Minutes | 1,191 | 11.8% |
| 20 to 24 Minutes | 1,051 | 10.4% |
| 25 to 29 Minutes | 519 | 5.2% |
| 30 to 34 Minutes | 790 | 7.9% |
| 35 to 39 Minutes | 452 | 4.5% |
| 40 to 44 Minutes | 405 | 4.0% |
| 45 to 59 Minutes | 524 | 5.2% |
| 60 to 89 Minutes | 248 | 2.5% |
| 90 or more Minutes | 215 | 2.1% |
Commute Time by Sex in New Iberia
The most common commute times in New Iberia are 10 to 14 minutes (948 commuters, 18.1%) for males and 10 to 14 minutes (1,352 commuters, 28.0%) for females.
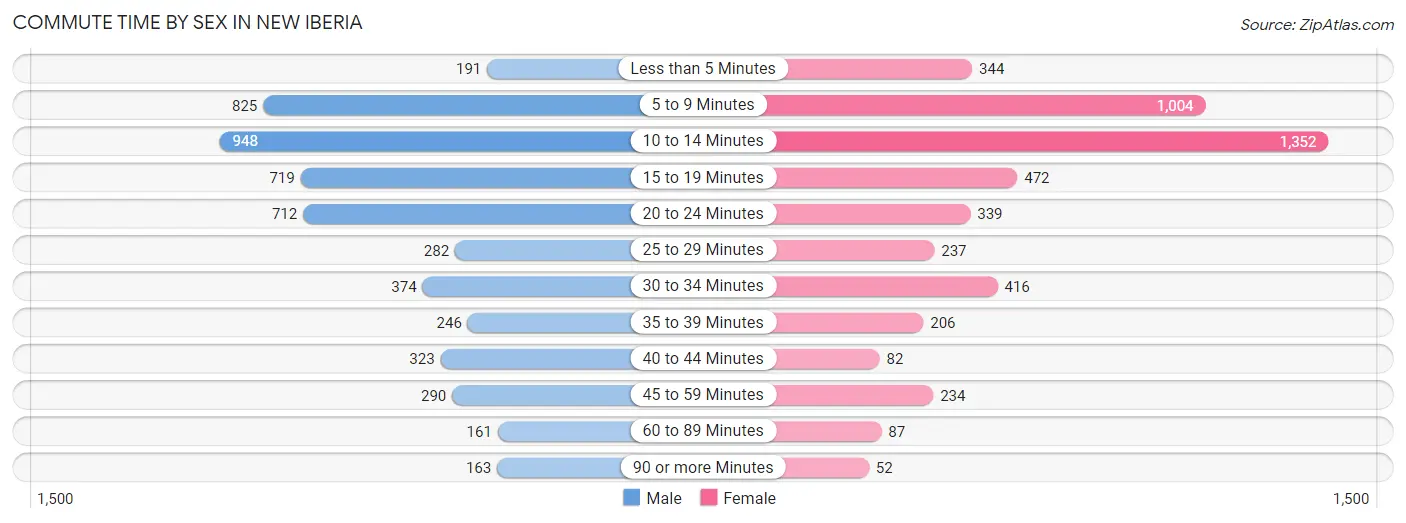
| Commute Time | Male | Female |
| Less than 5 Minutes | 191 (3.6%) | 344 (7.1%) |
| 5 to 9 Minutes | 825 (15.8%) | 1,004 (20.8%) |
| 10 to 14 Minutes | 948 (18.1%) | 1,352 (28.0%) |
| 15 to 19 Minutes | 719 (13.7%) | 472 (9.8%) |
| 20 to 24 Minutes | 712 (13.6%) | 339 (7.0%) |
| 25 to 29 Minutes | 282 (5.4%) | 237 (4.9%) |
| 30 to 34 Minutes | 374 (7.1%) | 416 (8.6%) |
| 35 to 39 Minutes | 246 (4.7%) | 206 (4.3%) |
| 40 to 44 Minutes | 323 (6.2%) | 82 (1.7%) |
| 45 to 59 Minutes | 290 (5.5%) | 234 (4.9%) |
| 60 to 89 Minutes | 161 (3.1%) | 87 (1.8%) |
| 90 or more Minutes | 163 (3.1%) | 52 (1.1%) |
Time of Departure to Work by Sex in New Iberia
The most frequent times of departure to work in New Iberia are 7:00 AM to 7:29 AM (1,198, 22.9%) for males and 7:00 AM to 7:29 AM (961, 19.9%) for females.
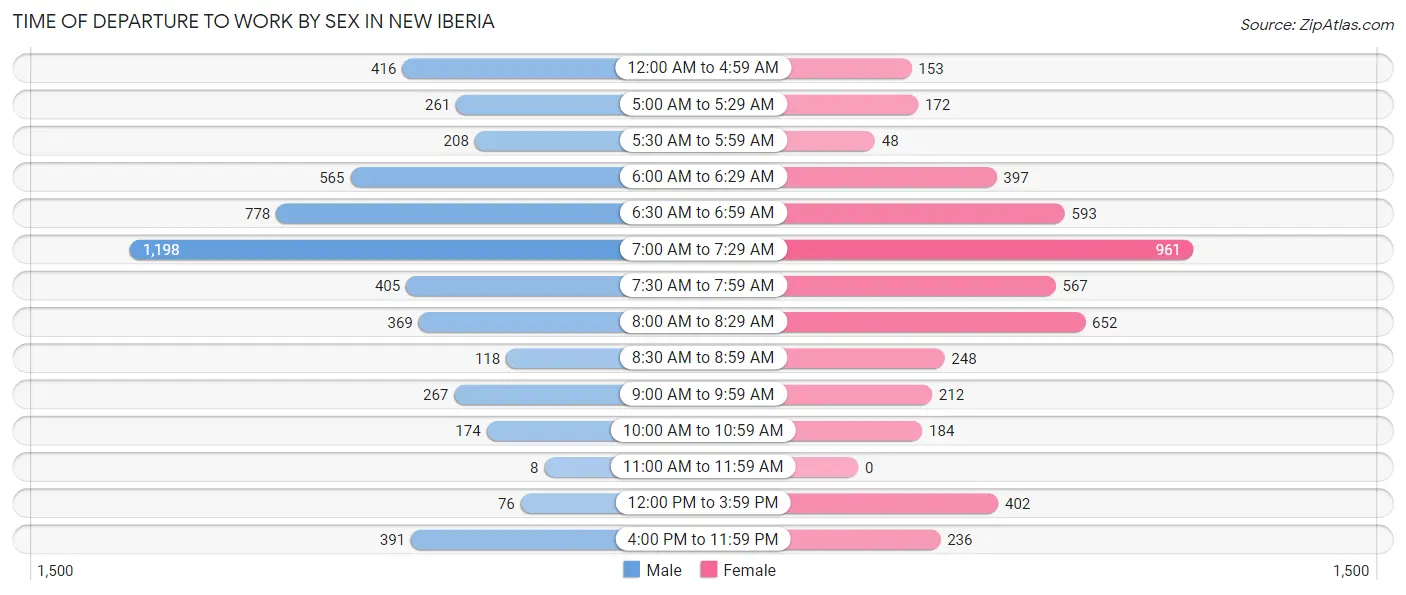
| Time of Departure | Male | Female |
| 12:00 AM to 4:59 AM | 416 (8.0%) | 153 (3.2%) |
| 5:00 AM to 5:29 AM | 261 (5.0%) | 172 (3.6%) |
| 5:30 AM to 5:59 AM | 208 (4.0%) | 48 (1.0%) |
| 6:00 AM to 6:29 AM | 565 (10.8%) | 397 (8.2%) |
| 6:30 AM to 6:59 AM | 778 (14.9%) | 593 (12.3%) |
| 7:00 AM to 7:29 AM | 1,198 (22.9%) | 961 (19.9%) |
| 7:30 AM to 7:59 AM | 405 (7.7%) | 567 (11.7%) |
| 8:00 AM to 8:29 AM | 369 (7.0%) | 652 (13.5%) |
| 8:30 AM to 8:59 AM | 118 (2.2%) | 248 (5.1%) |
| 9:00 AM to 9:59 AM | 267 (5.1%) | 212 (4.4%) |
| 10:00 AM to 10:59 AM | 174 (3.3%) | 184 (3.8%) |
| 11:00 AM to 11:59 AM | 8 (0.2%) | 0 (0.0%) |
| 12:00 PM to 3:59 PM | 76 (1.5%) | 402 (8.3%) |
| 4:00 PM to 11:59 PM | 391 (7.5%) | 236 (4.9%) |
| Total | 5,234 (100.0%) | 4,825 (100.0%) |
Housing Occupancy in New Iberia
Occupancy by Ownership in New Iberia
Of the total 11,201 dwellings in New Iberia, owner-occupied units account for 5,715 (51.0%), while renter-occupied units make up 5,486 (49.0%).
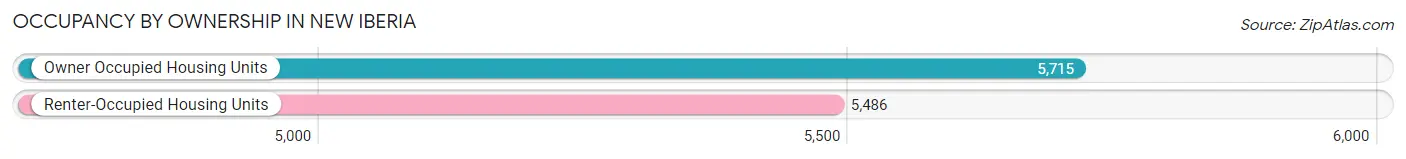
| Occupancy | # Housing Units | % Housing Units |
| Owner Occupied Housing Units | 5,715 | 51.0% |
| Renter-Occupied Housing Units | 5,486 | 49.0% |
| Total Occupied Housing Units | 11,201 | 100.0% |
Occupancy by Household Size in New Iberia
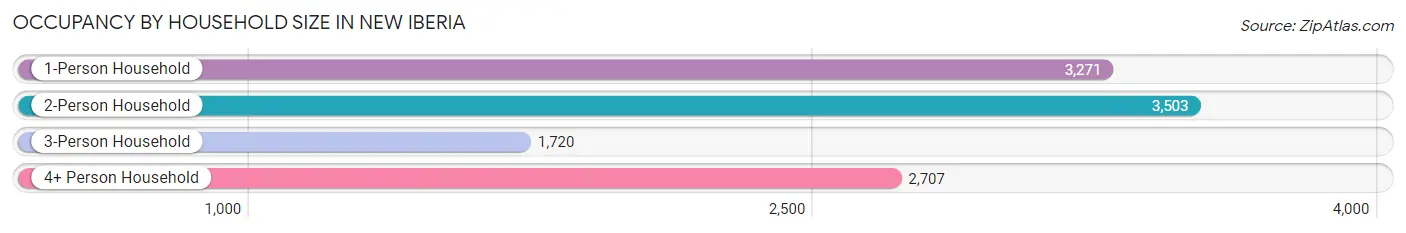
| Household Size | # Housing Units | % Housing Units |
| 1-Person Household | 3,271 | 29.2% |
| 2-Person Household | 3,503 | 31.3% |
| 3-Person Household | 1,720 | 15.4% |
| 4+ Person Household | 2,707 | 24.2% |
| Total Housing Units | 11,201 | 100.0% |
Occupancy by Ownership by Household Size in New Iberia
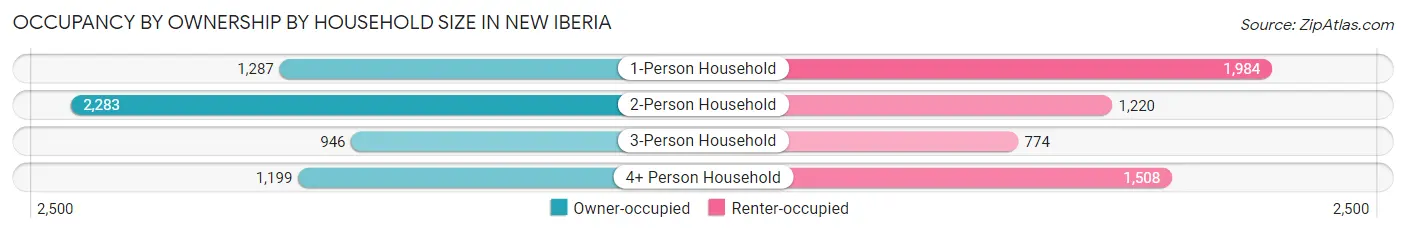
| Household Size | Owner-occupied | Renter-occupied |
| 1-Person Household | 1,287 (39.4%) | 1,984 (60.7%) |
| 2-Person Household | 2,283 (65.2%) | 1,220 (34.8%) |
| 3-Person Household | 946 (55.0%) | 774 (45.0%) |
| 4+ Person Household | 1,199 (44.3%) | 1,508 (55.7%) |
| Total Housing Units | 5,715 (51.0%) | 5,486 (49.0%) |
Occupancy by Educational Attainment in New Iberia
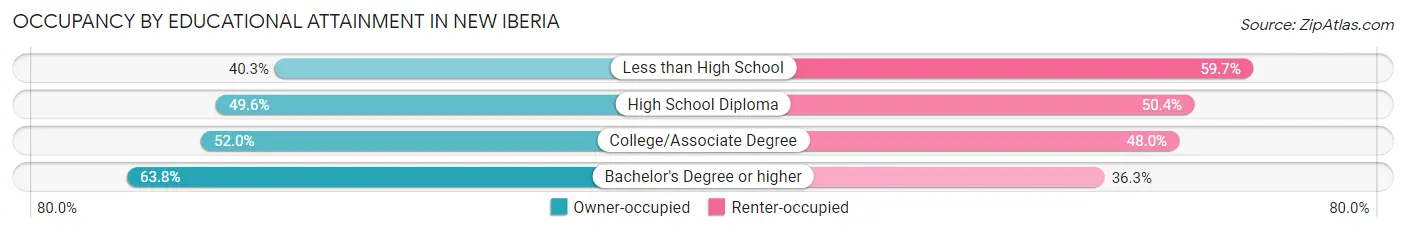
| Household Size | Owner-occupied | Renter-occupied |
| Less than High School | 850 (40.3%) | 1,258 (59.7%) |
| High School Diploma | 2,044 (49.6%) | 2,076 (50.4%) |
| College/Associate Degree | 1,544 (52.0%) | 1,426 (48.0%) |
| Bachelor's Degree or higher | 1,277 (63.7%) | 726 (36.2%) |
Occupancy by Age of Householder in New Iberia
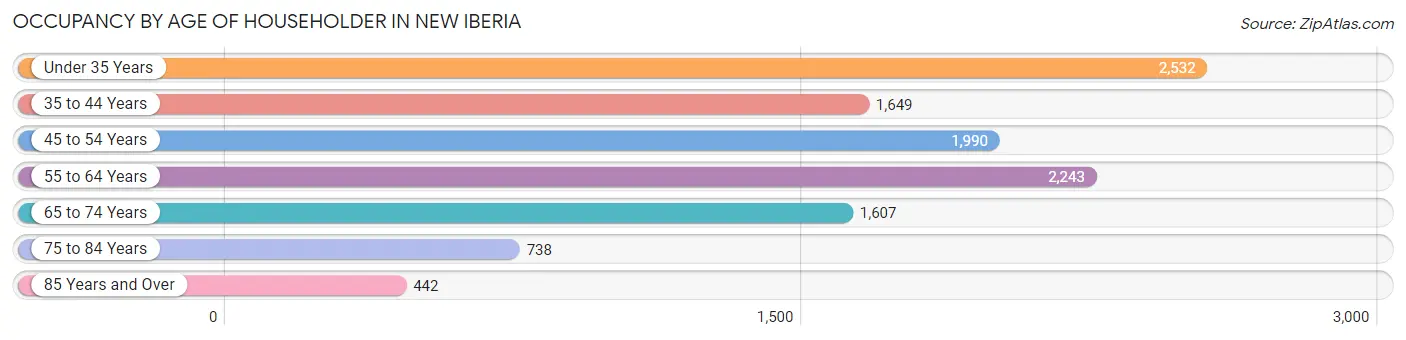
| Age Bracket | # Households | % Households |
| Under 35 Years | 2,532 | 22.6% |
| 35 to 44 Years | 1,649 | 14.7% |
| 45 to 54 Years | 1,990 | 17.8% |
| 55 to 64 Years | 2,243 | 20.0% |
| 65 to 74 Years | 1,607 | 14.3% |
| 75 to 84 Years | 738 | 6.6% |
| 85 Years and Over | 442 | 4.0% |
| Total | 11,201 | 100.0% |
Housing Finances in New Iberia
Median Income by Occupancy in New Iberia
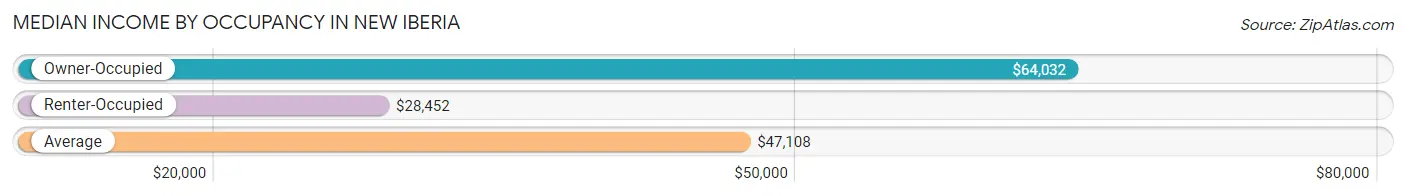
| Occupancy Type | # Households | Median Income |
| Owner-Occupied | 5,715 (51.0%) | $64,032 |
| Renter-Occupied | 5,486 (49.0%) | $28,452 |
| Average | 11,201 (100.0%) | $47,108 |
Occupancy by Householder Income Bracket in New Iberia
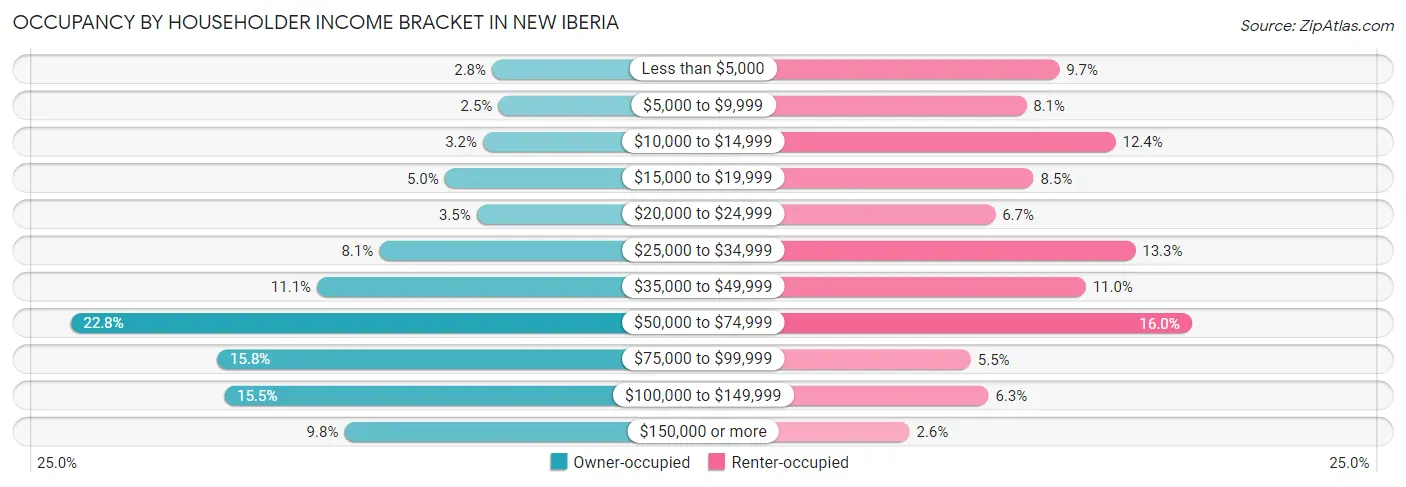
| Income Bracket | Owner-occupied | Renter-occupied |
| Less than $5,000 | 157 (2.8%) | 532 (9.7%) |
| $5,000 to $9,999 | 140 (2.5%) | 446 (8.1%) |
| $10,000 to $14,999 | 182 (3.2%) | 679 (12.4%) |
| $15,000 to $19,999 | 286 (5.0%) | 465 (8.5%) |
| $20,000 to $24,999 | 199 (3.5%) | 365 (6.7%) |
| $25,000 to $34,999 | 464 (8.1%) | 731 (13.3%) |
| $35,000 to $49,999 | 633 (11.1%) | 601 (11.0%) |
| $50,000 to $74,999 | 1,304 (22.8%) | 878 (16.0%) |
| $75,000 to $99,999 | 905 (15.8%) | 301 (5.5%) |
| $100,000 to $149,999 | 886 (15.5%) | 347 (6.3%) |
| $150,000 or more | 559 (9.8%) | 141 (2.6%) |
| Total | 5,715 (100.0%) | 5,486 (100.0%) |
Monthly Housing Cost Tiers in New Iberia
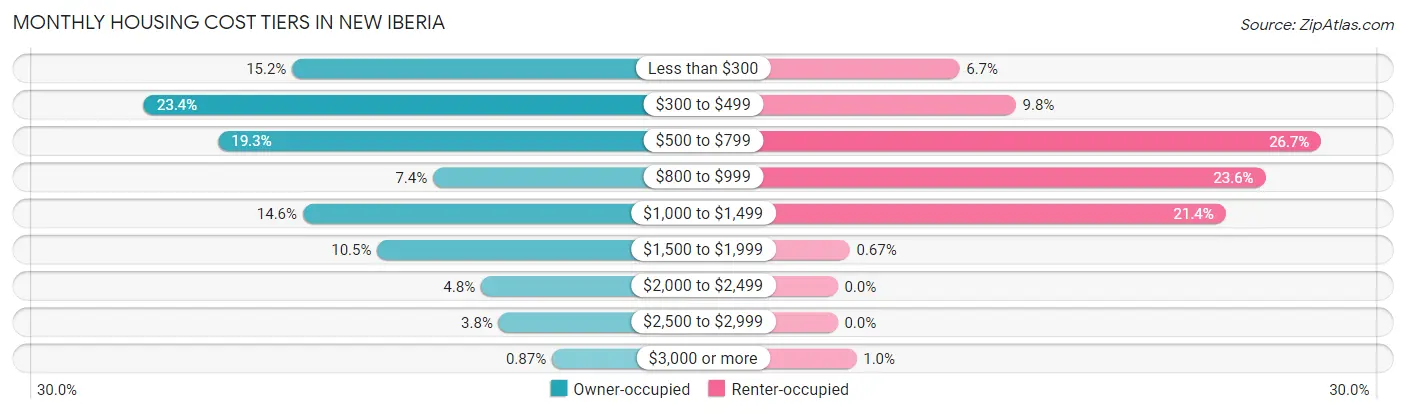
| Monthly Cost | Owner-occupied | Renter-occupied |
| Less than $300 | 870 (15.2%) | 369 (6.7%) |
| $300 to $499 | 1,338 (23.4%) | 540 (9.8%) |
| $500 to $799 | 1,103 (19.3%) | 1,466 (26.7%) |
| $800 to $999 | 425 (7.4%) | 1,297 (23.6%) |
| $1,000 to $1,499 | 836 (14.6%) | 1,176 (21.4%) |
| $1,500 to $1,999 | 601 (10.5%) | 37 (0.7%) |
| $2,000 to $2,499 | 274 (4.8%) | 0 (0.0%) |
| $2,500 to $2,999 | 218 (3.8%) | 0 (0.0%) |
| $3,000 or more | 50 (0.9%) | 57 (1.0%) |
| Total | 5,715 (100.0%) | 5,486 (100.0%) |
Physical Housing Characteristics in New Iberia
Housing Structures in New Iberia
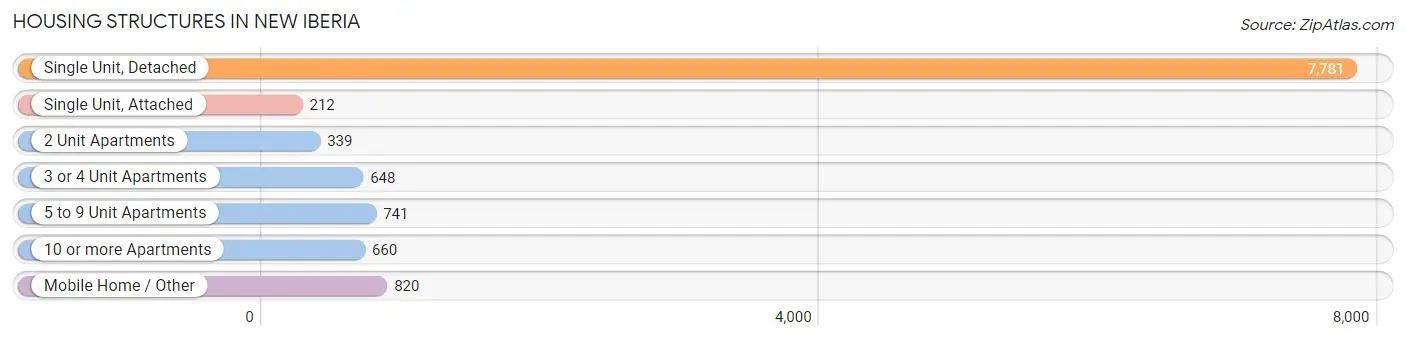
| Structure Type | # Housing Units | % Housing Units |
| Single Unit, Detached | 7,781 | 69.5% |
| Single Unit, Attached | 212 | 1.9% |
| 2 Unit Apartments | 339 | 3.0% |
| 3 or 4 Unit Apartments | 648 | 5.8% |
| 5 to 9 Unit Apartments | 741 | 6.6% |
| 10 or more Apartments | 660 | 5.9% |
| Mobile Home / Other | 820 | 7.3% |
| Total | 11,201 | 100.0% |
Housing Structures by Occupancy in New Iberia
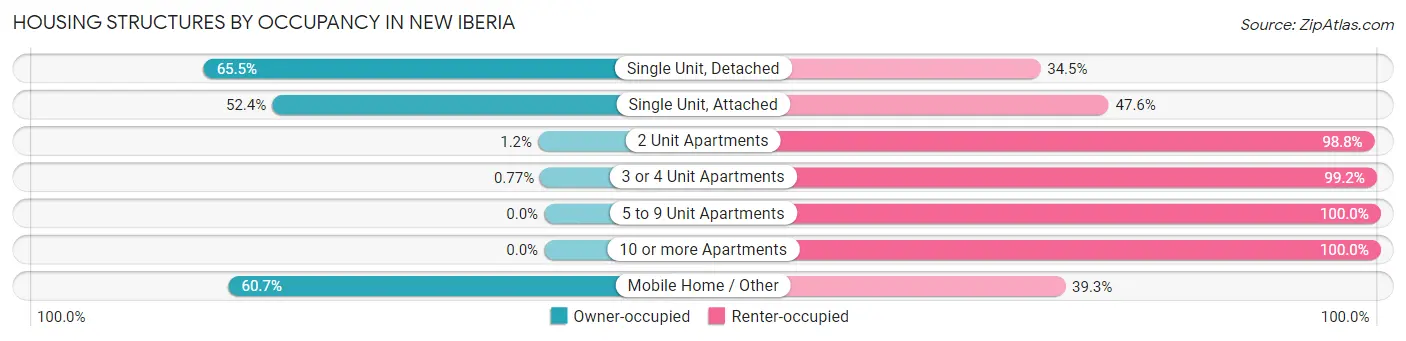
| Structure Type | Owner-occupied | Renter-occupied |
| Single Unit, Detached | 5,097 (65.5%) | 2,684 (34.5%) |
| Single Unit, Attached | 111 (52.4%) | 101 (47.6%) |
| 2 Unit Apartments | 4 (1.2%) | 335 (98.8%) |
| 3 or 4 Unit Apartments | 5 (0.8%) | 643 (99.2%) |
| 5 to 9 Unit Apartments | 0 (0.0%) | 741 (100.0%) |
| 10 or more Apartments | 0 (0.0%) | 660 (100.0%) |
| Mobile Home / Other | 498 (60.7%) | 322 (39.3%) |
| Total | 5,715 (51.0%) | 5,486 (49.0%) |
Housing Structures by Number of Rooms in New Iberia
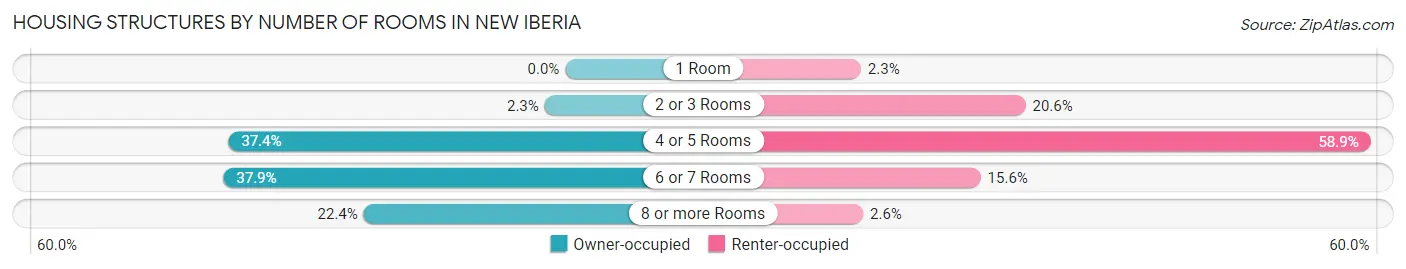
| Number of Rooms | Owner-occupied | Renter-occupied |
| 1 Room | 0 (0.0%) | 128 (2.3%) |
| 2 or 3 Rooms | 131 (2.3%) | 1,130 (20.6%) |
| 4 or 5 Rooms | 2,137 (37.4%) | 3,230 (58.9%) |
| 6 or 7 Rooms | 2,168 (37.9%) | 857 (15.6%) |
| 8 or more Rooms | 1,279 (22.4%) | 141 (2.6%) |
| Total | 5,715 (100.0%) | 5,486 (100.0%) |
Housing Structure by Heating Type in New Iberia
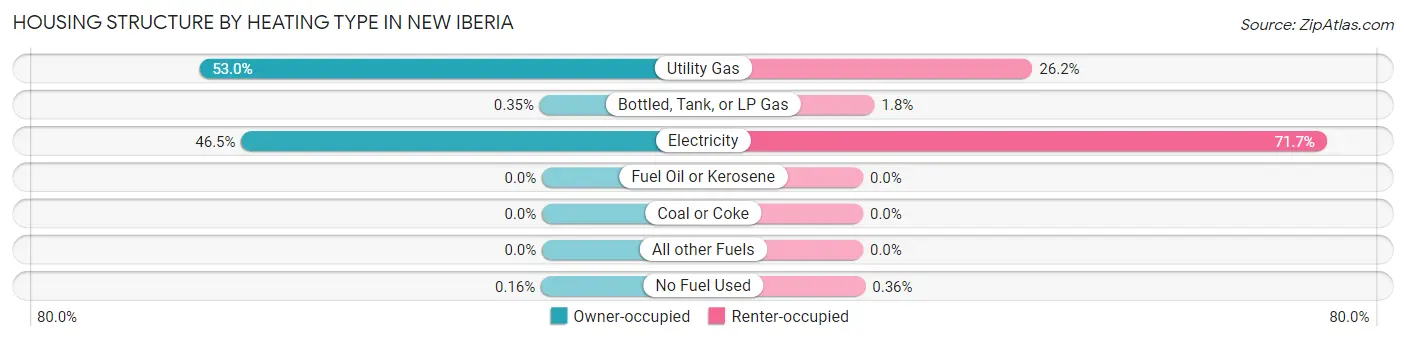
| Heating Type | Owner-occupied | Renter-occupied |
| Utility Gas | 3,029 (53.0%) | 1,436 (26.2%) |
| Bottled, Tank, or LP Gas | 20 (0.4%) | 98 (1.8%) |
| Electricity | 2,657 (46.5%) | 3,932 (71.7%) |
| Fuel Oil or Kerosene | 0 (0.0%) | 0 (0.0%) |
| Coal or Coke | 0 (0.0%) | 0 (0.0%) |
| All other Fuels | 0 (0.0%) | 0 (0.0%) |
| No Fuel Used | 9 (0.2%) | 20 (0.4%) |
| Total | 5,715 (100.0%) | 5,486 (100.0%) |
Household Vehicle Usage in New Iberia
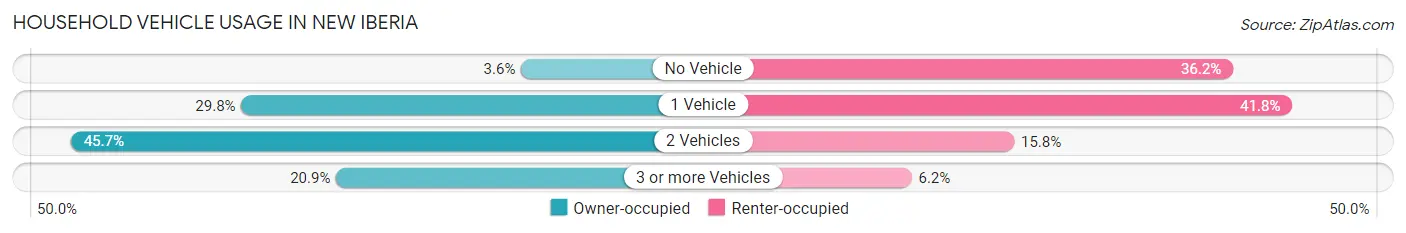
| Vehicles per Household | Owner-occupied | Renter-occupied |
| No Vehicle | 208 (3.6%) | 1,988 (36.2%) |
| 1 Vehicle | 1,701 (29.8%) | 2,291 (41.8%) |
| 2 Vehicles | 2,611 (45.7%) | 866 (15.8%) |
| 3 or more Vehicles | 1,195 (20.9%) | 341 (6.2%) |
| Total | 5,715 (100.0%) | 5,486 (100.0%) |
Real Estate & Mortgages in New Iberia
Real Estate and Mortgage Overview in New Iberia
| Characteristic | Without Mortgage | With Mortgage |
| Housing Units | 3,092 | 2,623 |
| Median Property Value | $115,100 | $174,200 |
| Median Household Income | $50,291 | $409 |
| Monthly Housing Costs | $415 | $48 |
| Real Estate Taxes | $295 | $149 |
Property Value by Mortgage Status in New Iberia
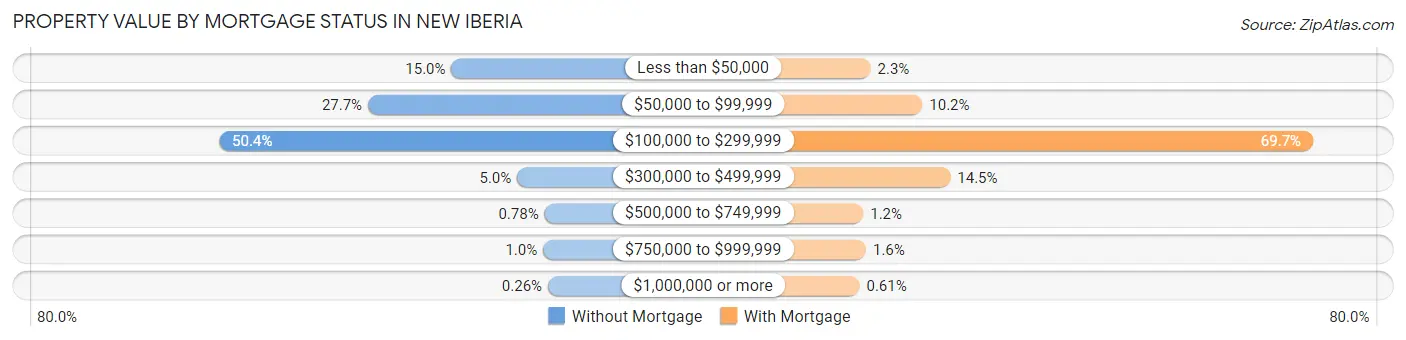
| Property Value | Without Mortgage | With Mortgage |
| Less than $50,000 | 463 (15.0%) | 60 (2.3%) |
| $50,000 to $99,999 | 856 (27.7%) | 267 (10.2%) |
| $100,000 to $299,999 | 1,557 (50.4%) | 1,828 (69.7%) |
| $300,000 to $499,999 | 153 (5.0%) | 379 (14.4%) |
| $500,000 to $749,999 | 24 (0.8%) | 31 (1.2%) |
| $750,000 to $999,999 | 31 (1.0%) | 42 (1.6%) |
| $1,000,000 or more | 8 (0.3%) | 16 (0.6%) |
| Total | 3,092 (100.0%) | 2,623 (100.0%) |
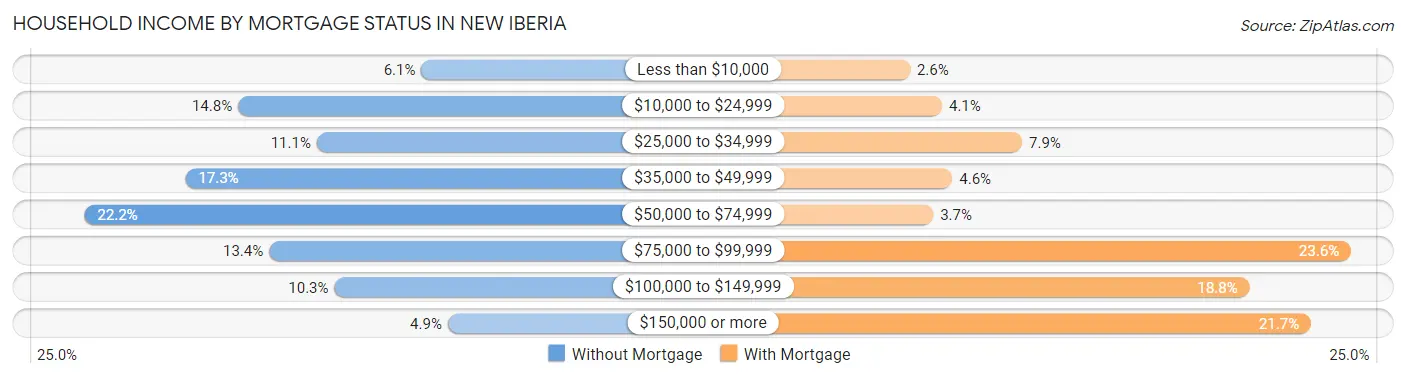
Household Income by Mortgage Status in New Iberia
| Household Income | Without Mortgage | With Mortgage |
| Less than $10,000 | 189 (6.1%) | 68 (2.6%) |
| $10,000 to $24,999 | 459 (14.8%) | 108 (4.1%) |
| $25,000 to $34,999 | 343 (11.1%) | 208 (7.9%) |
| $35,000 to $49,999 | 536 (17.3%) | 121 (4.6%) |
| $50,000 to $74,999 | 685 (22.2%) | 97 (3.7%) |
| $75,000 to $99,999 | 413 (13.4%) | 619 (23.6%) |
| $100,000 to $149,999 | 317 (10.2%) | 492 (18.8%) |
| $150,000 or more | 150 (4.9%) | 569 (21.7%) |
| Total | 3,092 (100.0%) | 2,623 (100.0%) |
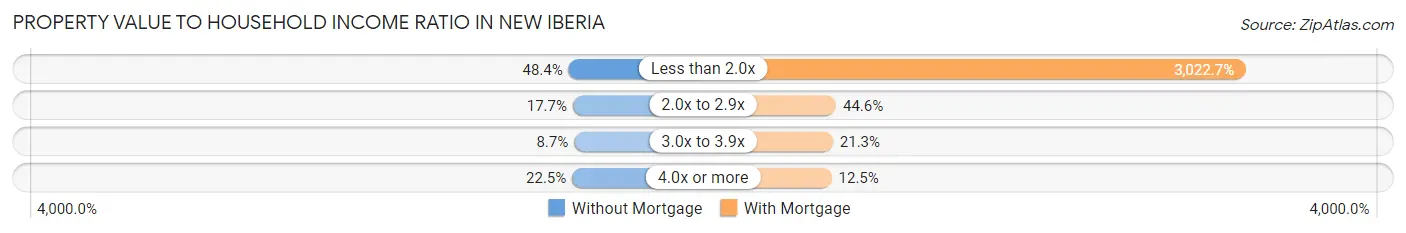
Property Value to Household Income Ratio in New Iberia
| Value-to-Income Ratio | Without Mortgage | With Mortgage |
| Less than 2.0x | 1,496 (48.4%) | 79,284 (3,022.7%) |
| 2.0x to 2.9x | 547 (17.7%) | 1,169 (44.6%) |
| 3.0x to 3.9x | 268 (8.7%) | 558 (21.3%) |
| 4.0x or more | 695 (22.5%) | 327 (12.5%) |
| Total | 3,092 (100.0%) | 2,623 (100.0%) |
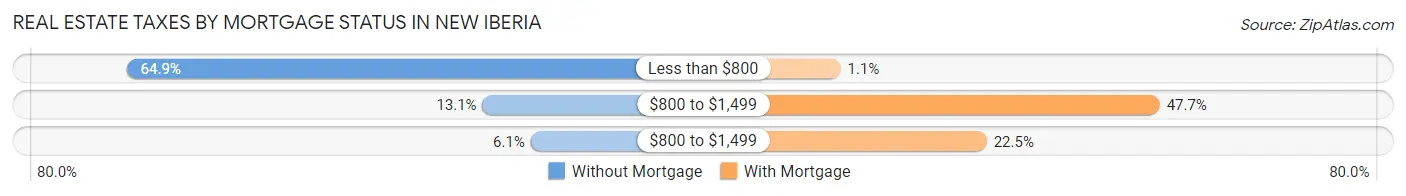
Real Estate Taxes by Mortgage Status in New Iberia
| Property Taxes | Without Mortgage | With Mortgage |
| Less than $800 | 2,008 (64.9%) | 29 (1.1%) |
| $800 to $1,499 | 405 (13.1%) | 1,252 (47.7%) |
| $800 to $1,499 | 187 (6.0%) | 589 (22.5%) |
| Total | 3,092 (100.0%) | 2,623 (100.0%) |
Health & Disability in New Iberia
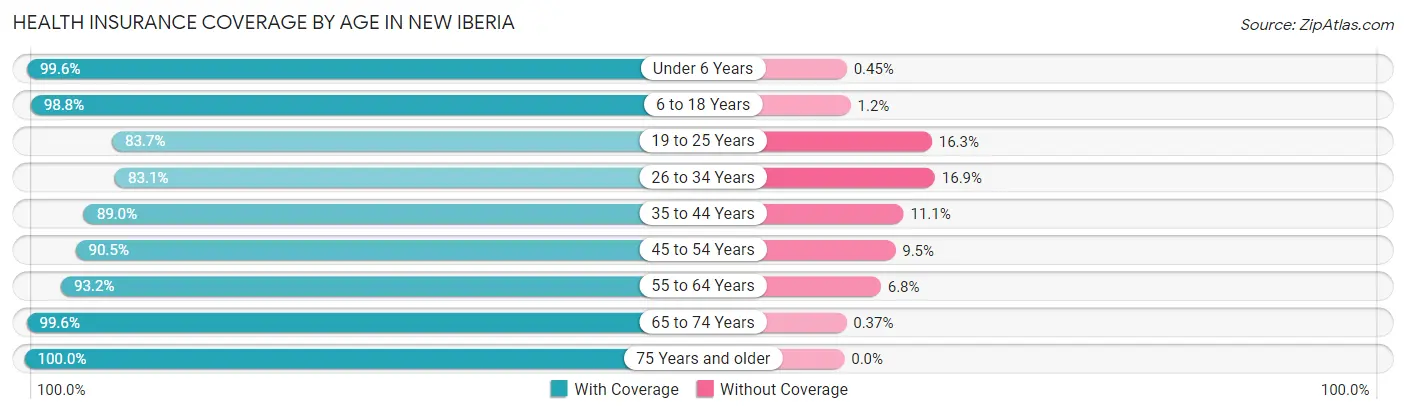
Health Insurance Coverage by Age in New Iberia
| Age Bracket | With Coverage | Without Coverage |
| Under 6 Years | 3,111 (99.6%) | 14 (0.4%) |
| 6 to 18 Years | 4,890 (98.8%) | 58 (1.2%) |
| 19 to 25 Years | 2,186 (83.7%) | 426 (16.3%) |
| 26 to 34 Years | 2,933 (83.1%) | 596 (16.9%) |
| 35 to 44 Years | 2,738 (88.9%) | 340 (11.1%) |
| 45 to 54 Years | 2,817 (90.5%) | 296 (9.5%) |
| 55 to 64 Years | 3,222 (93.2%) | 235 (6.8%) |
| 65 to 74 Years | 2,678 (99.6%) | 10 (0.4%) |
| 75 Years and older | 1,492 (100.0%) | 0 (0.0%) |
| Total | 26,067 (93.0%) | 1,975 (7.0%) |
Health Insurance Coverage by Citizenship Status in New Iberia
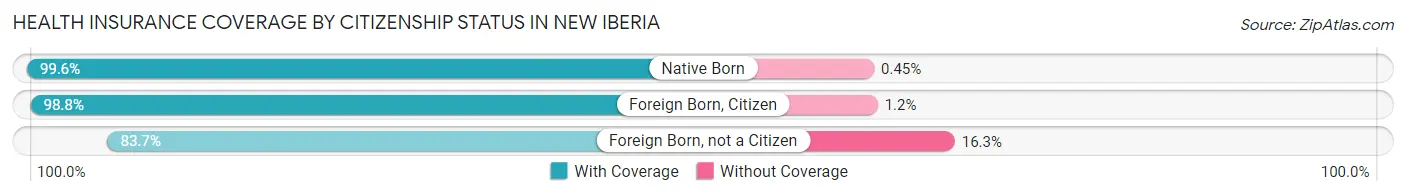
| Citizenship Status | With Coverage | Without Coverage |
| Native Born | 3,111 (99.6%) | 14 (0.4%) |
| Foreign Born, Citizen | 4,890 (98.8%) | 58 (1.2%) |
| Foreign Born, not a Citizen | 2,186 (83.7%) | 426 (16.3%) |
Health Insurance Coverage by Household Income in New Iberia
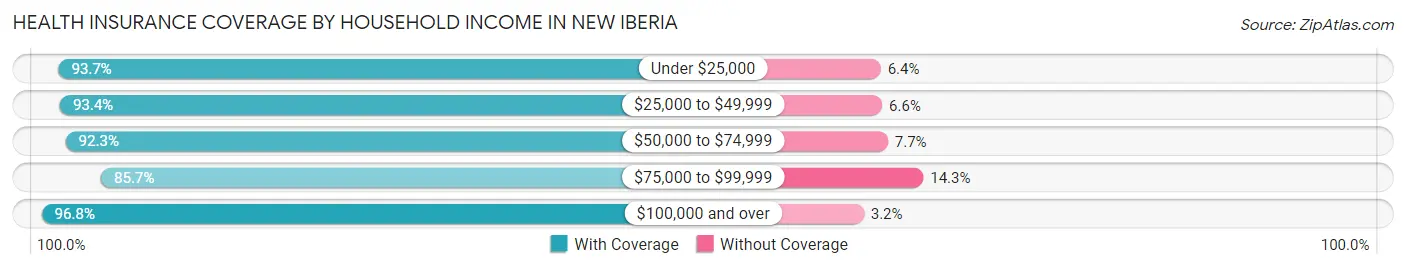
| Household Income | With Coverage | Without Coverage |
| Under $25,000 | 7,139 (93.6%) | 484 (6.4%) |
| $25,000 to $49,999 | 5,108 (93.4%) | 363 (6.6%) |
| $50,000 to $74,999 | 5,518 (92.3%) | 460 (7.7%) |
| $75,000 to $99,999 | 2,939 (85.7%) | 492 (14.3%) |
| $100,000 and over | 5,321 (96.8%) | 175 (3.2%) |
Public vs Private Health Insurance Coverage by Age in New Iberia
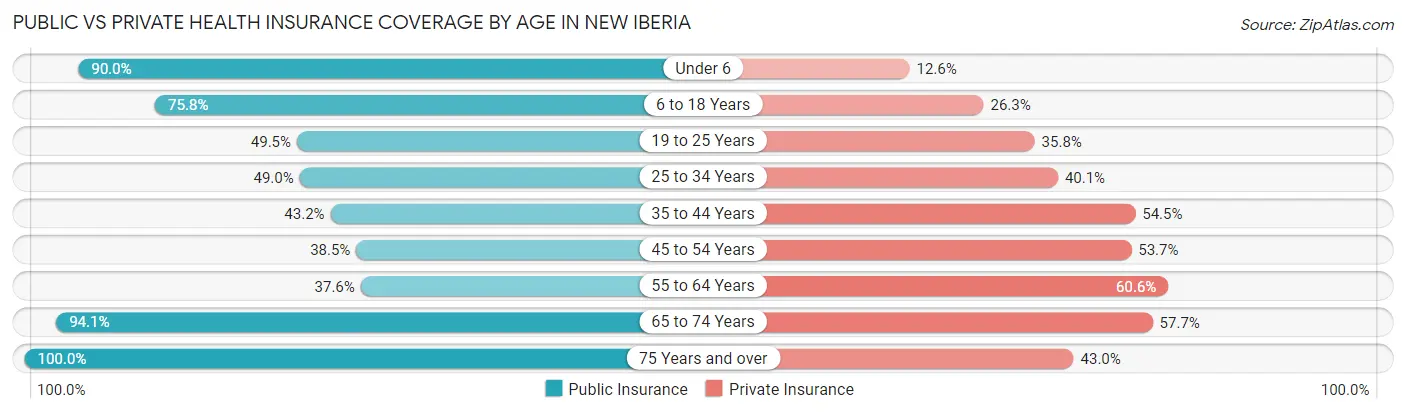
| Age Bracket | Public Insurance | Private Insurance |
| Under 6 | 2,813 (90.0%) | 393 (12.6%) |
| 6 to 18 Years | 3,749 (75.8%) | 1,302 (26.3%) |
| 19 to 25 Years | 1,292 (49.5%) | 935 (35.8%) |
| 25 to 34 Years | 1,728 (49.0%) | 1,416 (40.1%) |
| 35 to 44 Years | 1,331 (43.2%) | 1,677 (54.5%) |
| 45 to 54 Years | 1,197 (38.5%) | 1,673 (53.7%) |
| 55 to 64 Years | 1,301 (37.6%) | 2,094 (60.6%) |
| 65 to 74 Years | 2,530 (94.1%) | 1,551 (57.7%) |
| 75 Years and over | 1,492 (100.0%) | 642 (43.0%) |
| Total | 17,433 (62.2%) | 11,683 (41.7%) |
Disability Status by Sex by Age in New Iberia
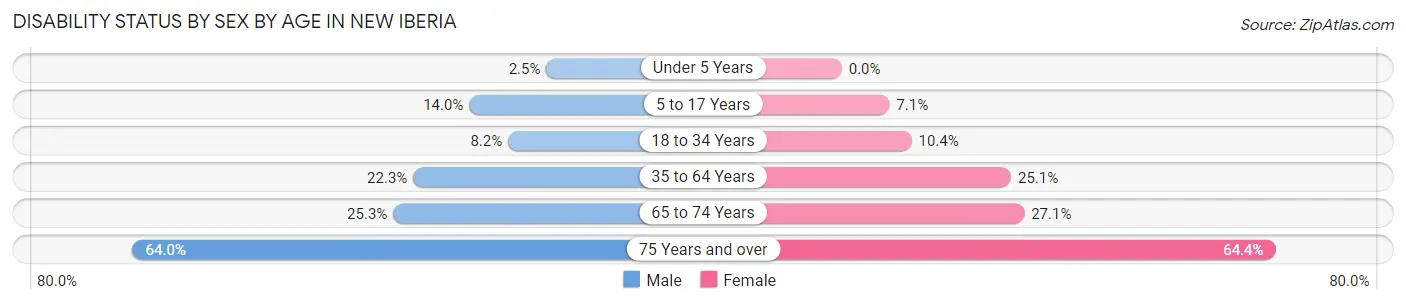
| Age Bracket | Male | Female |
| Under 5 Years | 36 (2.5%) | 0 (0.0%) |
| 5 to 17 Years | 348 (14.0%) | 182 (7.1%) |
| 18 to 34 Years | 256 (8.2%) | 340 (10.4%) |
| 35 to 64 Years | 1,083 (22.3%) | 1,204 (25.1%) |
| 65 to 74 Years | 322 (25.3%) | 383 (27.1%) |
| 75 Years and over | 369 (63.9%) | 589 (64.4%) |
Disability Class by Sex by Age in New Iberia
Disability Class: Hearing Difficulty
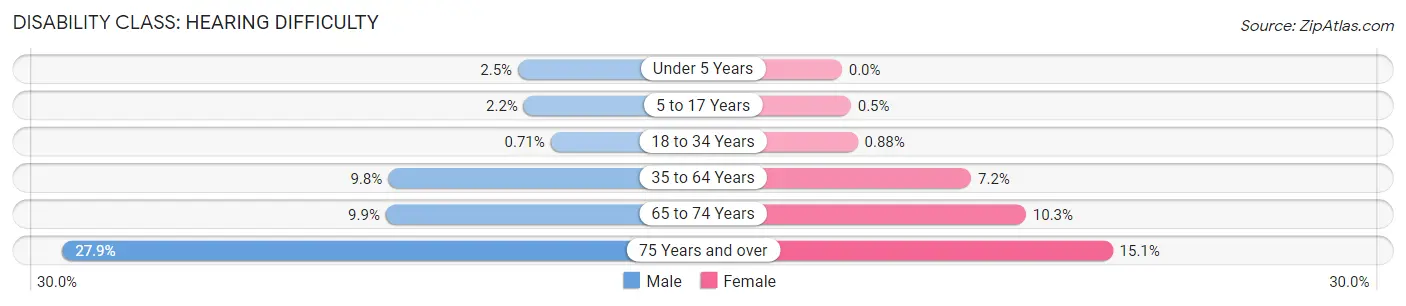
| Age Bracket | Male | Female |
| Under 5 Years | 36 (2.5%) | 0 (0.0%) |
| 5 to 17 Years | 55 (2.2%) | 13 (0.5%) |
| 18 to 34 Years | 22 (0.7%) | 29 (0.9%) |
| 35 to 64 Years | 474 (9.8%) | 345 (7.2%) |
| 65 to 74 Years | 126 (9.9%) | 145 (10.2%) |
| 75 Years and over | 161 (27.9%) | 138 (15.1%) |
Disability Class: Vision Difficulty
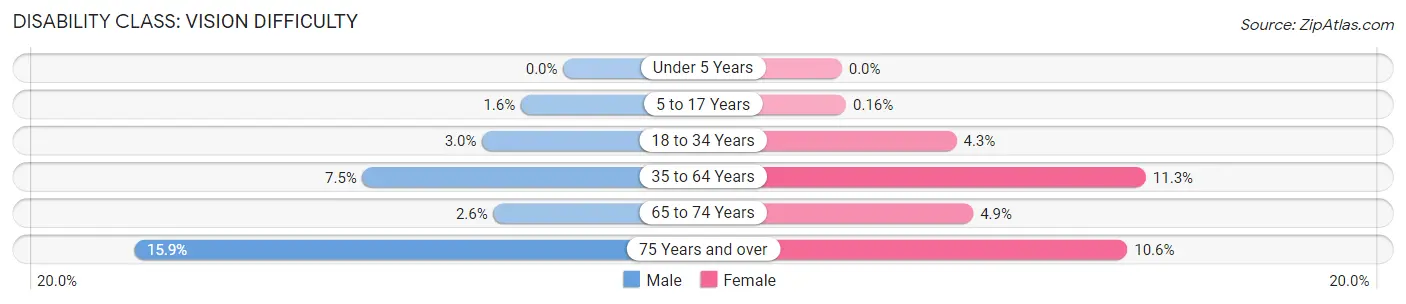
| Age Bracket | Male | Female |
| Under 5 Years | 0 (0.0%) | 0 (0.0%) |
| 5 to 17 Years | 39 (1.6%) | 4 (0.2%) |
| 18 to 34 Years | 94 (3.0%) | 140 (4.3%) |
| 35 to 64 Years | 362 (7.4%) | 541 (11.3%) |
| 65 to 74 Years | 33 (2.6%) | 69 (4.9%) |
| 75 Years and over | 92 (15.9%) | 97 (10.6%) |
Disability Class: Cognitive Difficulty
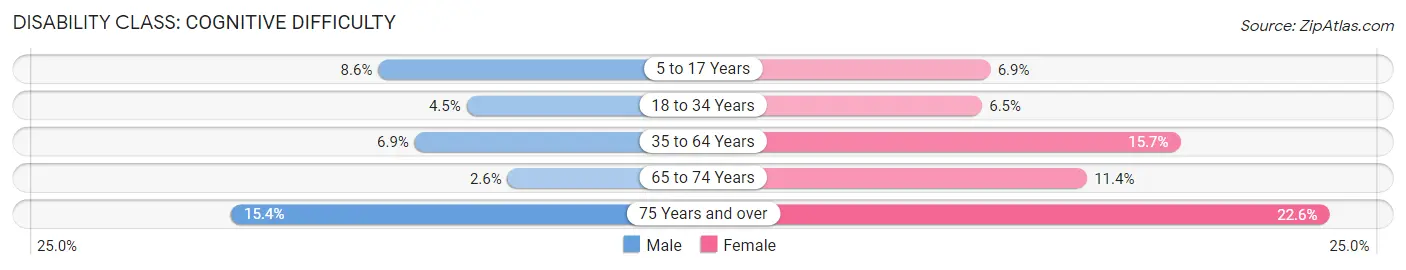
| Age Bracket | Male | Female |
| 5 to 17 Years | 214 (8.6%) | 178 (6.9%) |
| 18 to 34 Years | 140 (4.5%) | 214 (6.5%) |
| 35 to 64 Years | 335 (6.9%) | 753 (15.7%) |
| 65 to 74 Years | 33 (2.6%) | 161 (11.4%) |
| 75 Years and over | 89 (15.4%) | 207 (22.6%) |
Disability Class: Ambulatory Difficulty
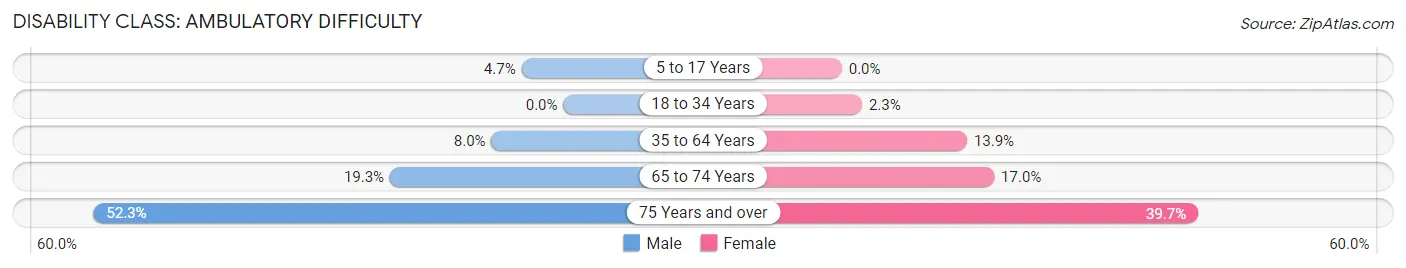
| Age Bracket | Male | Female |
| 5 to 17 Years | 116 (4.7%) | 0 (0.0%) |
| 18 to 34 Years | 0 (0.0%) | 74 (2.2%) |
| 35 to 64 Years | 389 (8.0%) | 668 (13.9%) |
| 65 to 74 Years | 246 (19.3%) | 240 (17.0%) |
| 75 Years and over | 302 (52.3%) | 363 (39.7%) |
Disability Class: Self-Care Difficulty
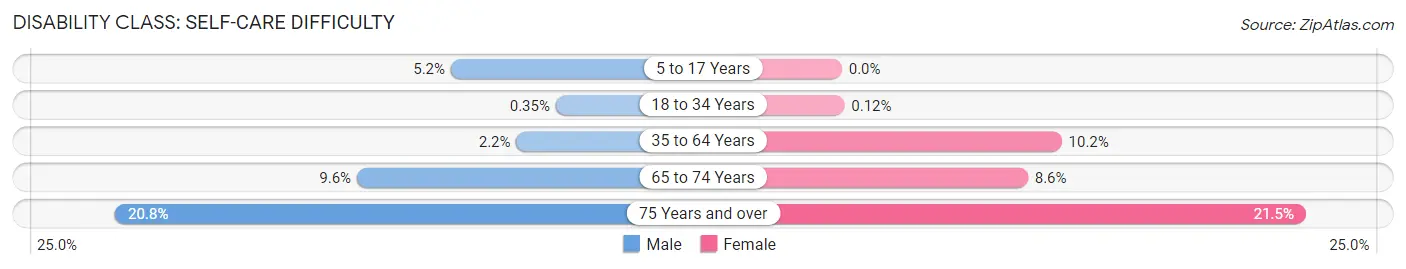
| Age Bracket | Male | Female |
| 5 to 17 Years | 130 (5.2%) | 0 (0.0%) |
| 18 to 34 Years | 11 (0.4%) | 4 (0.1%) |
| 35 to 64 Years | 106 (2.2%) | 489 (10.2%) |
| 65 to 74 Years | 122 (9.6%) | 122 (8.6%) |
| 75 Years and over | 120 (20.8%) | 197 (21.5%) |
Technology Access in New Iberia
Computing Device Access in New Iberia
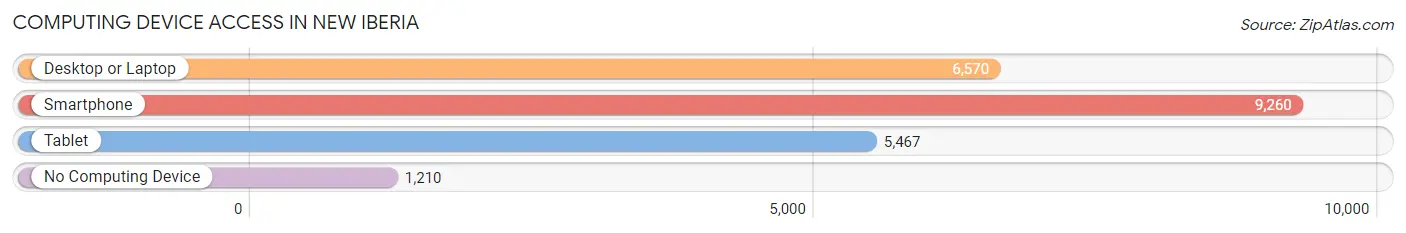
| Device Type | # Households | % Households |
| Desktop or Laptop | 6,570 | 58.7% |
| Smartphone | 9,260 | 82.7% |
| Tablet | 5,467 | 48.8% |
| No Computing Device | 1,210 | 10.8% |
| Total | 11,201 | 100.0% |
Internet Access in New Iberia
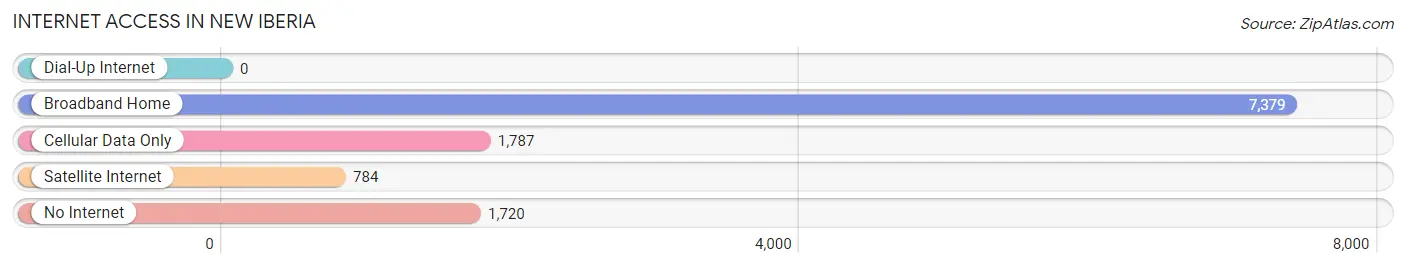
| Internet Type | # Households | % Households |
| Dial-Up Internet | 0 | 0.0% |
| Broadband Home | 7,379 | 65.9% |
| Cellular Data Only | 1,787 | 16.0% |
| Satellite Internet | 784 | 7.0% |
| No Internet | 1,720 | 15.4% |
| Total | 11,201 | 100.0% |
New Iberia Summary
Iberia Parish, Louisiana is located in the south-central part of the state, and is home to the city of New Iberia. The parish was established in 1868 and is named after the Iberian Peninsula in Europe. The parish seat is New Iberia, which is the largest city in the parish. The population of Iberia Parish was 73,240 in the 2010 census, and the population of New Iberia was 30,617.
History
The area that is now Iberia Parish was originally inhabited by the Chitimacha Indians. The first Europeans to settle in the area were French settlers in the late 1760s. The area was part of the Attakapas District, which was established in 1763. The area was part of St. Martin Parish until 1868, when Iberia Parish was established.
The city of New Iberia was founded in 1860 by a group of French settlers. The city was named after the Iberian Peninsula in Europe. The city was incorporated in 1868, the same year that Iberia Parish was established.
Geography
Iberia Parish is located in the south-central part of Louisiana. It is bordered by St. Martin Parish to the north, St. Mary Parish to the east, Vermilion Parish to the south, and Lafayette Parish to the west. The parish has a total area of 845 square miles, of which 835 square miles is land and 10 square miles is water.
The terrain of Iberia Parish is mostly flat, with some rolling hills in the northern part of the parish. The parish is located in the coastal plain region of Louisiana, and is part of the Atchafalaya Basin. The parish is drained by the Bayou Teche, which flows through the center of the parish.
Economy
The economy of Iberia Parish is largely based on agriculture and oil and gas production. The parish is home to several large oil and gas companies, including Chevron, ExxonMobil, and Shell. Agriculture is also an important part of the economy, with sugarcane, rice, and soybeans being the main crops.
The parish is also home to several manufacturing companies, including the New Iberia Manufacturing Company, which produces furniture and other wood products. The parish is also home to several seafood processing plants, which process shrimp, oysters, and other seafood.
Demographics
As of the 2010 census, the population of Iberia Parish was 73,240. The population of New Iberia was 30,617. The racial makeup of the parish was 65.3% White, 30.2% African American, 0.5% Native American, 1.2% Asian, 0.1% Pacific Islander, 1.7% from other races, and 1.2% from two or more races. Hispanic or Latino of any race were 4.3% of the population.
The median income for a household in Iberia Parish was $37,945, and the median income for a family was $45,945. The per capita income for the parish was $19,945. About 17.2% of the population was below the poverty line.
Common Questions
What is Per Capita Income in New Iberia?
Per Capita income in New Iberia is $27,270.
What is the Median Family Income in New Iberia?
Median Family Income in New Iberia is $51,546.
What is the Median Household income in New Iberia?
Median Household Income in New Iberia is $47,108.
What is Income or Wage Gap in New Iberia?
Income or Wage Gap in New Iberia is 52.2%.
Women in New Iberia earn 47.8 cents for every dollar earned by a man.
What is Family Income Deficit in New Iberia?
Family Income Deficit in New Iberia is $13,967.
Families that are below poverty line in New Iberia earn $13,967 less on average than the poverty threshold level.
What is Inequality or Gini Index in New Iberia?
Inequality or Gini Index in New Iberia is 0.53.
What is the Total Population of New Iberia?
Total Population of New Iberia is 28,363.
What is the Total Male Population of New Iberia?
Total Male Population of New Iberia is 13,894.
What is the Total Female Population of New Iberia?
Total Female Population of New Iberia is 14,469.
What is the Ratio of Males per 100 Females in New Iberia?
There are 96.03 Males per 100 Females in New Iberia.
What is the Ratio of Females per 100 Males in New Iberia?
There are 104.14 Females per 100 Males in New Iberia.
What is the Median Population Age in New Iberia?
Median Population Age in New Iberia is 34.9 Years.
What is the Average Family Size in New Iberia
Average Family Size in New Iberia is 3.1 People.
What is the Average Household Size in New Iberia
Average Household Size in New Iberia is 2.5 People.
How Large is the Labor Force in New Iberia?
There are 11,596 People in the Labor Forcein in New Iberia.
What is the Percentage of People in the Labor Force in New Iberia?
54.6% of People are in the Labor Force in New Iberia.
What is the Unemployment Rate in New Iberia?
Unemployment Rate in New Iberia is 9.0%.