Estelle, LA Map & Demographics
Estelle Map
Estelle Overview
$28,056
PER CAPITA INCOME
$78,351
AVG FAMILY INCOME
$73,756
AVG HOUSEHOLD INCOME
41.7%
WAGE / INCOME GAP [ % ]
58.3¢/ $1
WAGE / INCOME GAP [ $ ]
$12,002
FAMILY INCOME DEFICIT
0.37
INEQUALITY / GINI INDEX
17,091
TOTAL POPULATION
8,515
MALE POPULATION
8,576
FEMALE POPULATION
99.29
MALES / 100 FEMALES
100.72
FEMALES / 100 MALES
36.8
MEDIAN AGE
3.3
AVG FAMILY SIZE
2.9
AVG HOUSEHOLD SIZE
9,414
LABOR FORCE [ PEOPLE ]
69.0%
PERCENT IN LABOR FORCE
6.4%
UNEMPLOYMENT RATE
Income in Estelle
Income Overview in Estelle
Per Capita Income in Estelle is $28,056, while median incomes of families and households are $78,351 and $73,756 respectively.
| Characteristic | Number | Measure |
| Per Capita Income | 17,091 | $28,056 |
| Median Family Income | 4,620 | $78,351 |
| Mean Family Income | 4,620 | $86,240 |
| Median Household Income | 5,878 | $73,756 |
| Mean Household Income | 5,878 | $79,555 |
| Income Deficit | 4,620 | $12,002 |
| Wage / Income Gap (%) | 17,091 | 41.69% |
| Wage / Income Gap ($) | 17,091 | 58.31¢ per $1 |
| Gini / Inequality Index | 17,091 | 0.37 |
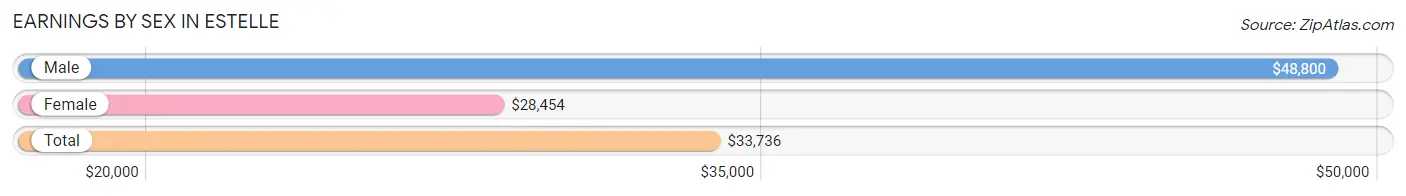
Earnings by Sex in Estelle
Average Earnings in Estelle are $33,736, $48,800 for men and $28,454 for women, a difference of 41.7%.
| Sex | Number | Average Earnings |
| Male | 4,807 (50.5%) | $48,800 |
| Female | 4,708 (49.5%) | $28,454 |
| Total | 9,515 (100.0%) | $33,736 |
Earnings by Sex by Income Bracket in Estelle
The most common earnings brackets in Estelle are $65,000 to $74,999 for men (664 | 13.8%) and $35,000 to $39,999 for women (424 | 9.0%).
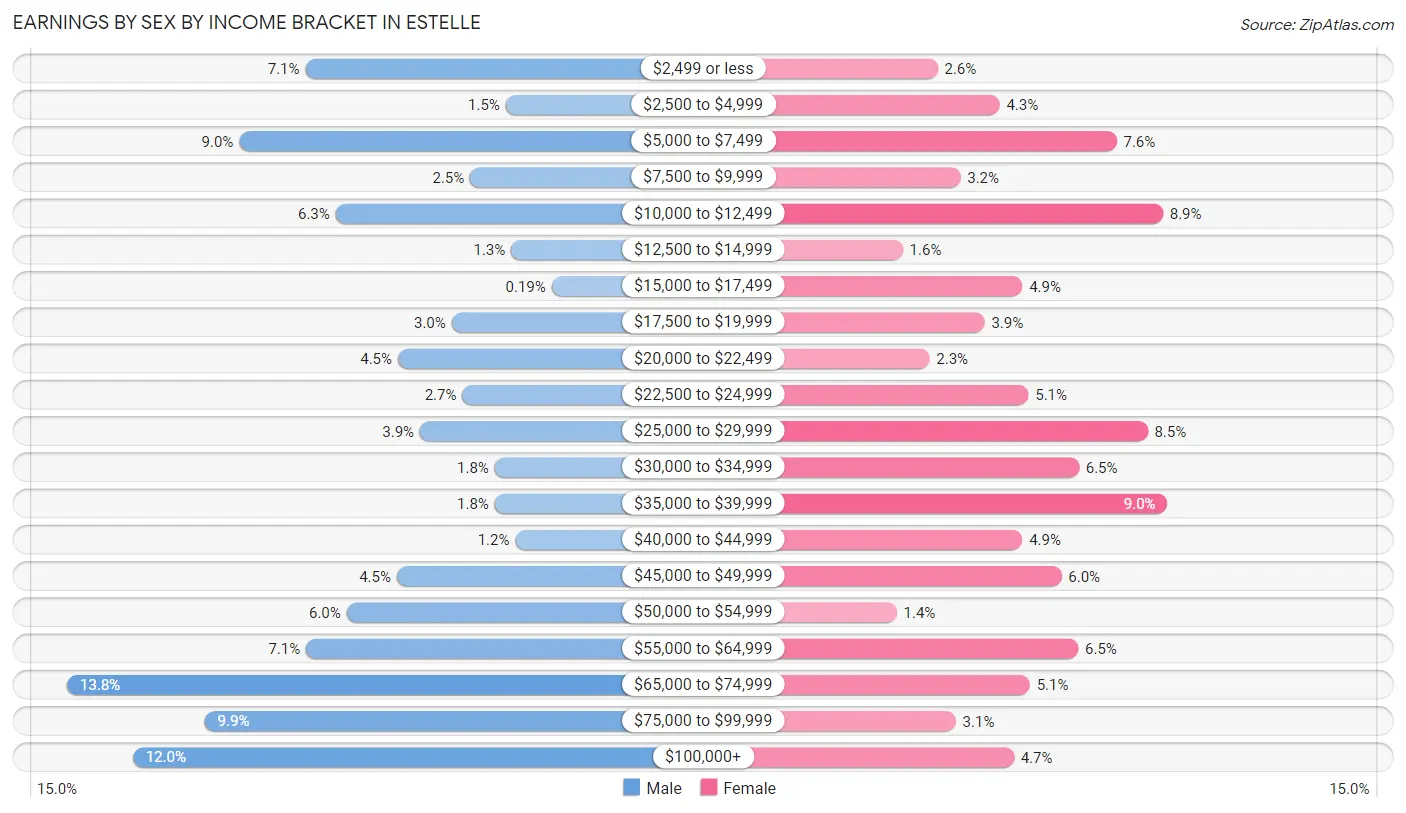
| Income | Male | Female |
| $2,499 or less | 342 (7.1%) | 120 (2.5%) |
| $2,500 to $4,999 | 71 (1.5%) | 202 (4.3%) |
| $5,000 to $7,499 | 431 (9.0%) | 357 (7.6%) |
| $7,500 to $9,999 | 119 (2.5%) | 150 (3.2%) |
| $10,000 to $12,499 | 301 (6.3%) | 418 (8.9%) |
| $12,500 to $14,999 | 64 (1.3%) | 74 (1.6%) |
| $15,000 to $17,499 | 9 (0.2%) | 232 (4.9%) |
| $17,500 to $19,999 | 144 (3.0%) | 182 (3.9%) |
| $20,000 to $22,499 | 217 (4.5%) | 109 (2.3%) |
| $22,500 to $24,999 | 130 (2.7%) | 240 (5.1%) |
| $25,000 to $29,999 | 187 (3.9%) | 398 (8.5%) |
| $30,000 to $34,999 | 86 (1.8%) | 307 (6.5%) |
| $35,000 to $39,999 | 86 (1.8%) | 424 (9.0%) |
| $40,000 to $44,999 | 58 (1.2%) | 232 (4.9%) |
| $45,000 to $49,999 | 218 (4.5%) | 284 (6.0%) |
| $50,000 to $54,999 | 286 (5.9%) | 66 (1.4%) |
| $55,000 to $64,999 | 341 (7.1%) | 306 (6.5%) |
| $65,000 to $74,999 | 664 (13.8%) | 242 (5.1%) |
| $75,000 to $99,999 | 478 (9.9%) | 144 (3.1%) |
| $100,000+ | 575 (12.0%) | 221 (4.7%) |
| Total | 4,807 (100.0%) | 4,708 (100.0%) |
Earnings by Sex by Educational Attainment in Estelle
Average earnings in Estelle are $51,311 for men and $34,863 for women, a difference of 32.1%. Men with an educational attainment of high school diploma enjoy the highest average annual earnings of $58,966, while those with less than high school education earn the least with $45,798. Women with an educational attainment of bachelor's degree earn the most with the average annual earnings of $49,146, while those with less than high school education have the smallest earnings of $28,098.
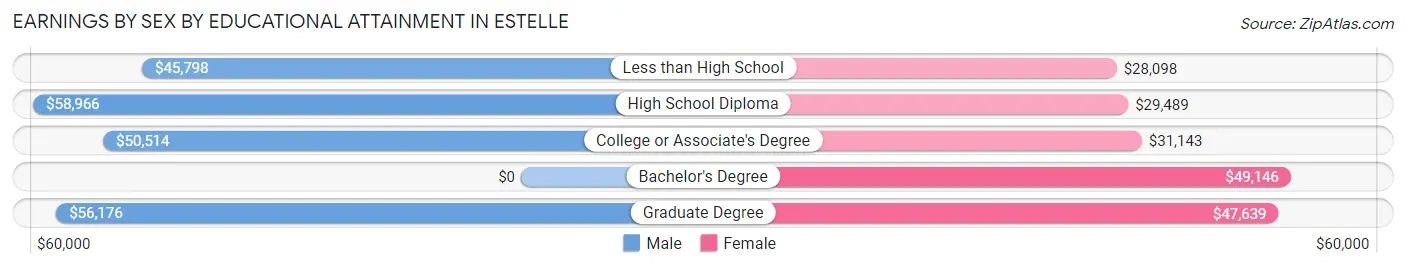
| Educational Attainment | Male Income | Female Income |
| Less than High School | $45,798 | $28,098 |
| High School Diploma | $58,966 | $29,489 |
| College or Associate's Degree | $50,514 | $31,143 |
| Bachelor's Degree | - | - |
| Graduate Degree | $56,176 | $47,639 |
| Total | $51,311 | $34,863 |
Family Income in Estelle
Family Income Brackets in Estelle
According to the Estelle family income data, there are 1,187 families falling into the $100,000 to $149,999 income range, which is the most common income bracket and makes up 25.7% of all families. Conversely, the $10,000 to $14,999 income bracket is the least frequent group with only 23 families (0.5%) belonging to this category.
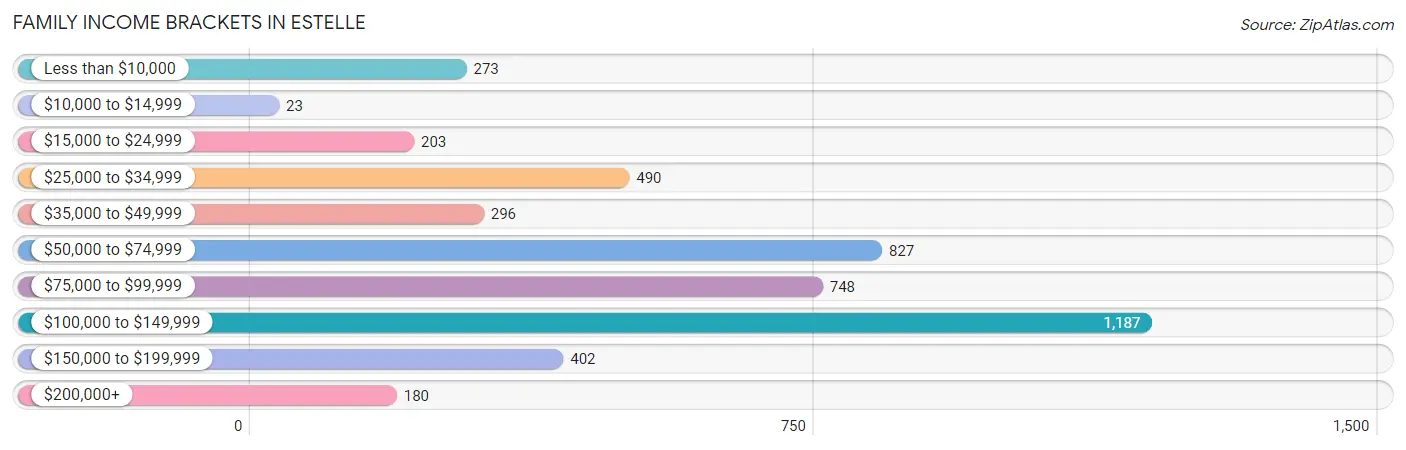
| Income Bracket | # Families | % Families |
| Less than $10,000 | 273 | 5.9% |
| $10,000 to $14,999 | 23 | 0.5% |
| $15,000 to $24,999 | 203 | 4.4% |
| $25,000 to $34,999 | 490 | 10.6% |
| $35,000 to $49,999 | 296 | 6.4% |
| $50,000 to $74,999 | 827 | 17.9% |
| $75,000 to $99,999 | 748 | 16.2% |
| $100,000 to $149,999 | 1,187 | 25.7% |
| $150,000 to $199,999 | 402 | 8.7% |
| $200,000+ | 180 | 3.9% |
Family Income by Famaliy Size in Estelle
4-person families (1,066 | 23.1%) account for the highest median family income in Estelle with $105,756 per family, while 2-person families (1,803 | 39.0%) have the highest median income of $35,901 per family member.
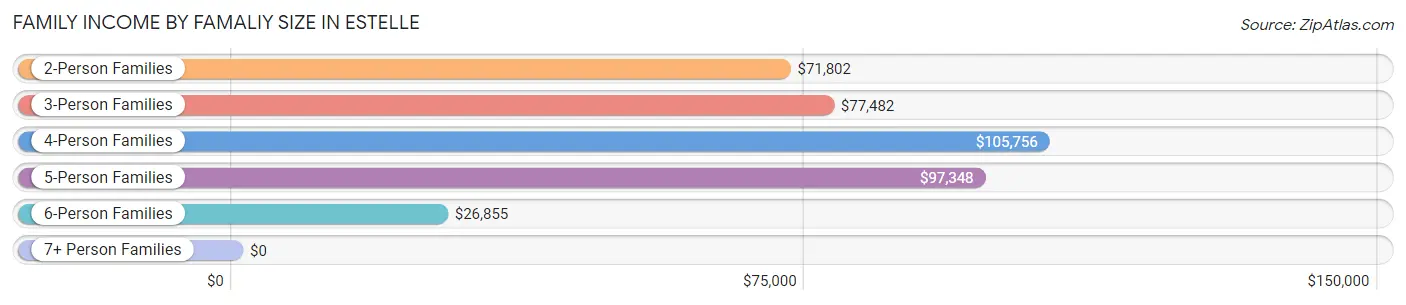
| Income Bracket | # Families | Median Income |
| 2-Person Families | 1,803 (39.0%) | $71,802 |
| 3-Person Families | 1,482 (32.1%) | $77,482 |
| 4-Person Families | 1,066 (23.1%) | $105,756 |
| 5-Person Families | 79 (1.7%) | $97,348 |
| 6-Person Families | 190 (4.1%) | $26,855 |
| 7+ Person Families | 0 (0.0%) | $0 |
| Total | 4,620 (100.0%) | $78,351 |
Family Income by Number of Earners in Estelle
The median family income in Estelle is $78,351, with families comprising 3+ earners (357) having the highest median family income of $131,492, while families with no earners (419) have the lowest median family income of $26,810, accounting for 7.7% and 9.1% of families, respectively.
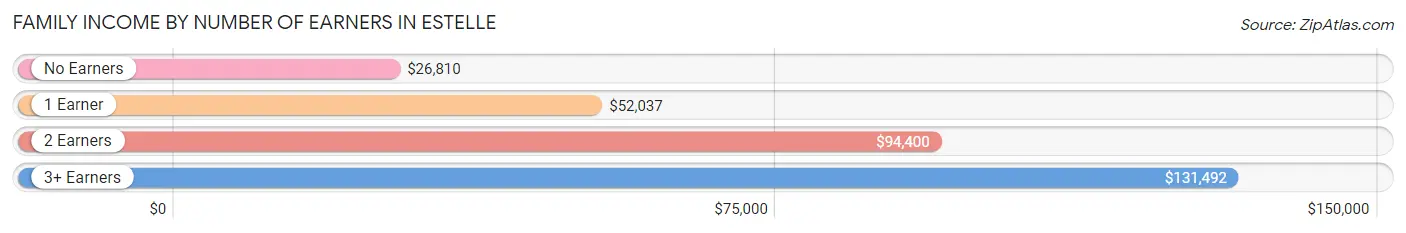
| Number of Earners | # Families | Median Income |
| No Earners | 419 (9.1%) | $26,810 |
| 1 Earner | 1,582 (34.2%) | $52,037 |
| 2 Earners | 2,262 (49.0%) | $94,400 |
| 3+ Earners | 357 (7.7%) | $131,492 |
| Total | 4,620 (100.0%) | $78,351 |
Household Income in Estelle
Household Income Brackets in Estelle
With 1,328 households falling in the category, the $100,000 to $149,999 income range is the most frequent in Estelle, accounting for 22.6% of all households. In contrast, only 71 households (1.2%) fall into the $10,000 to $14,999 income bracket, making it the least populous group.
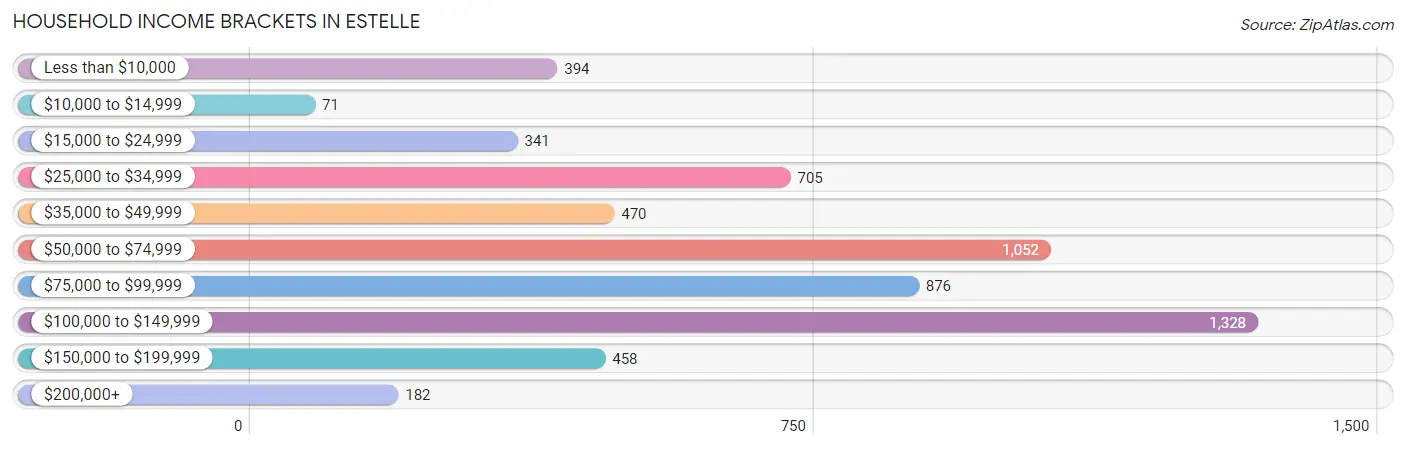
| Income Bracket | # Households | % Households |
| Less than $10,000 | 394 | 6.7% |
| $10,000 to $14,999 | 71 | 1.2% |
| $15,000 to $24,999 | 341 | 5.8% |
| $25,000 to $34,999 | 705 | 12.0% |
| $35,000 to $49,999 | 470 | 8.0% |
| $50,000 to $74,999 | 1,052 | 17.9% |
| $75,000 to $99,999 | 876 | 14.9% |
| $100,000 to $149,999 | 1,328 | 22.6% |
| $150,000 to $199,999 | 458 | 7.8% |
| $200,000+ | 182 | 3.1% |
Household Income by Householder Age in Estelle
The median household income in Estelle is $73,756, with the highest median household income of $87,813 found in the 25 to 44 years age bracket for the primary householder. A total of 2,039 households (34.7%) fall into this category. Meanwhile, the 15 to 24 years age bracket for the primary householder has the lowest median household income of $50,136, with 195 households (3.3%) in this group.
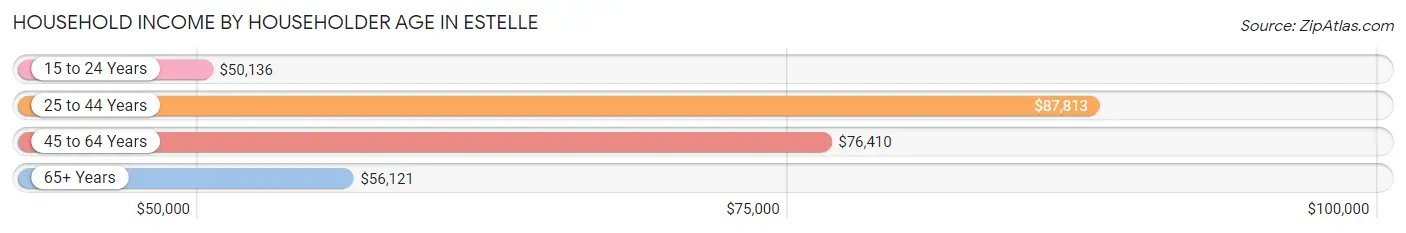
| Income Bracket | # Households | Median Income |
| 15 to 24 Years | 195 (3.3%) | $50,136 |
| 25 to 44 Years | 2,039 (34.7%) | $87,813 |
| 45 to 64 Years | 2,646 (45.0%) | $76,410 |
| 65+ Years | 998 (17.0%) | $56,121 |
| Total | 5,878 (100.0%) | $73,756 |
Poverty in Estelle
Income Below Poverty by Sex and Age in Estelle
With 16.9% poverty level for males and 18.7% for females among the residents of Estelle, 16 and 17 year old males and 15 year old females are the most vulnerable to poverty, with 227 males (57.6%) and 149 females (58.7%) in their respective age groups living below the poverty level.
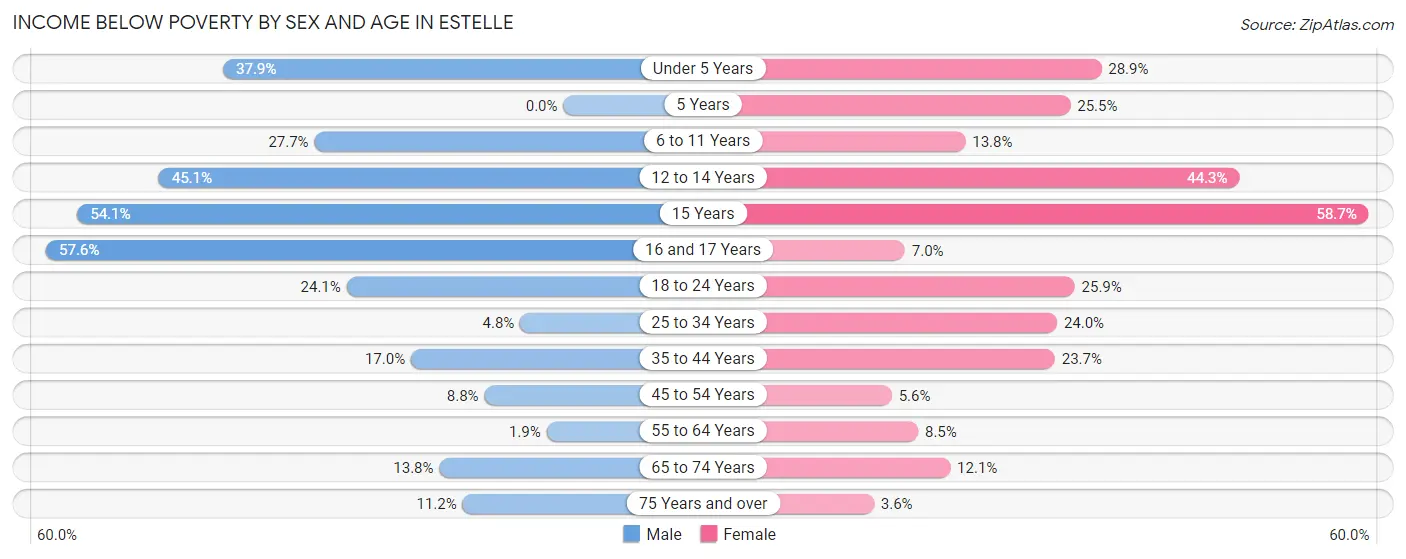
| Age Bracket | Male | Female |
| Under 5 Years | 144 (37.9%) | 124 (28.9%) |
| 5 Years | 0 (0.0%) | 42 (25.5%) |
| 6 to 11 Years | 199 (27.7%) | 70 (13.8%) |
| 12 to 14 Years | 191 (45.1%) | 166 (44.3%) |
| 15 Years | 59 (54.1%) | 149 (58.7%) |
| 16 and 17 Years | 227 (57.6%) | 16 (7.0%) |
| 18 to 24 Years | 141 (24.1%) | 266 (25.9%) |
| 25 to 34 Years | 78 (4.8%) | 236 (24.0%) |
| 35 to 44 Years | 150 (17.0%) | 255 (23.7%) |
| 45 to 54 Years | 101 (8.8%) | 68 (5.6%) |
| 55 to 64 Years | 24 (1.9%) | 127 (8.5%) |
| 65 to 74 Years | 83 (13.8%) | 74 (12.1%) |
| 75 Years and over | 32 (11.2%) | 7 (3.6%) |
| Total | 1,429 (16.9%) | 1,600 (18.7%) |
Income Above Poverty by Sex and Age in Estelle
According to the poverty statistics in Estelle, males aged 5 years and females aged 75 years and over are the age groups that are most secure financially, with 100.0% of males and 96.4% of females in these age groups living above the poverty line.
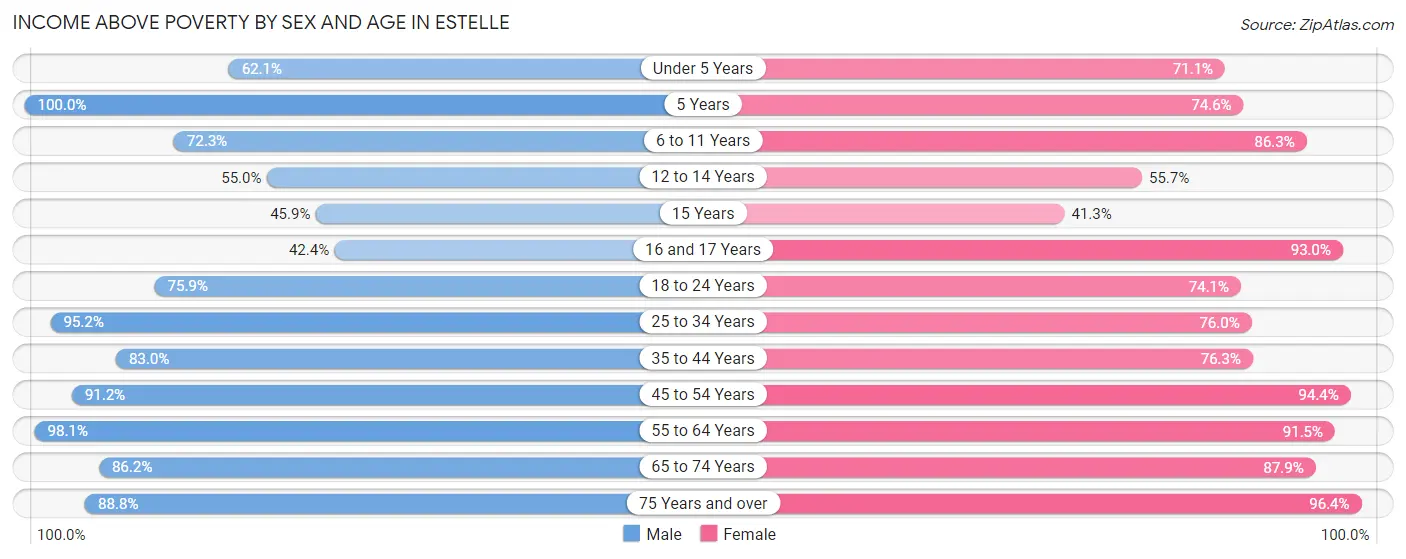
| Age Bracket | Male | Female |
| Under 5 Years | 236 (62.1%) | 305 (71.1%) |
| 5 Years | 50 (100.0%) | 123 (74.6%) |
| 6 to 11 Years | 519 (72.3%) | 439 (86.3%) |
| 12 to 14 Years | 233 (54.9%) | 209 (55.7%) |
| 15 Years | 50 (45.9%) | 105 (41.3%) |
| 16 and 17 Years | 167 (42.4%) | 212 (93.0%) |
| 18 to 24 Years | 443 (75.9%) | 760 (74.1%) |
| 25 to 34 Years | 1,543 (95.2%) | 749 (76.0%) |
| 35 to 44 Years | 734 (83.0%) | 820 (76.3%) |
| 45 to 54 Years | 1,048 (91.2%) | 1,156 (94.4%) |
| 55 to 64 Years | 1,259 (98.1%) | 1,369 (91.5%) |
| 65 to 74 Years | 518 (86.2%) | 539 (87.9%) |
| 75 Years and over | 253 (88.8%) | 189 (96.4%) |
| Total | 7,053 (83.2%) | 6,975 (81.3%) |
Income Below Poverty Among Married-Couple Families in Estelle
The poverty statistics for married-couple families in Estelle show that 5.1% or 158 of the total 3,070 families live below the poverty line. Families with 3 or 4 children have the highest poverty rate of 65.8%, comprising of 54 families. On the other hand, families with no children have the lowest poverty rate of 3.3%, which includes 56 families.
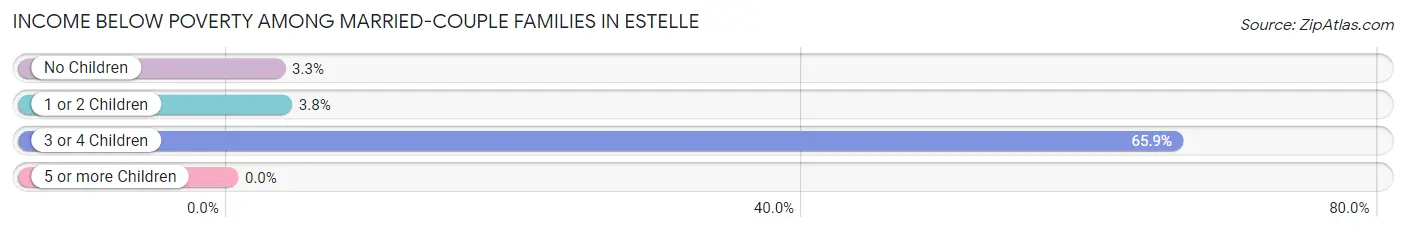
| Children | Above Poverty | Below Poverty |
| No Children | 1,651 (96.7%) | 56 (3.3%) |
| 1 or 2 Children | 1,233 (96.3%) | 48 (3.7%) |
| 3 or 4 Children | 28 (34.2%) | 54 (65.8%) |
| 5 or more Children | 0 (0.0%) | 0 (0.0%) |
| Total | 2,912 (94.9%) | 158 (5.1%) |
Income Below Poverty Among Single-Parent Households in Estelle
According to the poverty data in Estelle, 35.1% or 173 single-father households and 27.0% or 285 single-mother households are living below the poverty line. Among single-father households, those with 3 or 4 children have the highest poverty rate, with 76 households (100.0%) experiencing poverty. Likewise, among single-mother households, those with 3 or 4 children have the highest poverty rate, with 154 households (81.0%) falling below the poverty line.
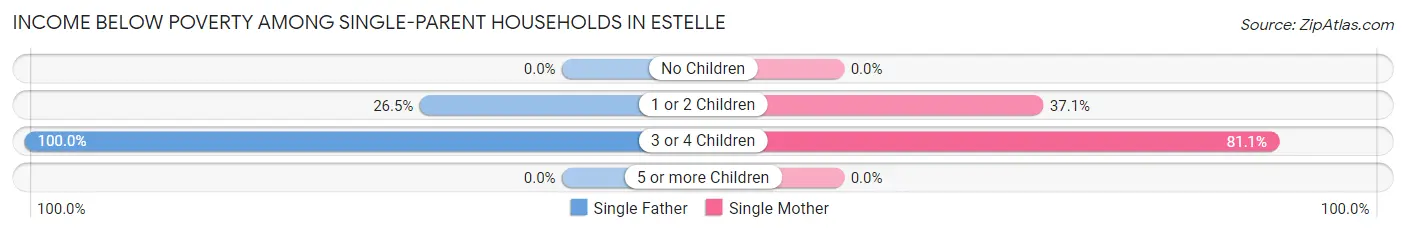
| Children | Single Father | Single Mother |
| No Children | 0 (0.0%) | 0 (0.0%) |
| 1 or 2 Children | 97 (26.5%) | 131 (37.1%) |
| 3 or 4 Children | 76 (100.0%) | 154 (81.0%) |
| 5 or more Children | 0 (0.0%) | 0 (0.0%) |
| Total | 173 (35.1%) | 285 (27.0%) |
Income Below Poverty Among Married-Couple vs Single-Parent Households in Estelle
The poverty data for Estelle shows that 158 of the married-couple family households (5.1%) and 458 of the single-parent households (29.5%) are living below the poverty level. Within the married-couple family households, those with 3 or 4 children have the highest poverty rate, with 54 households (65.8%) falling below the poverty line. Among the single-parent households, those with 3 or 4 children have the highest poverty rate, with 230 household (86.5%) living below poverty.
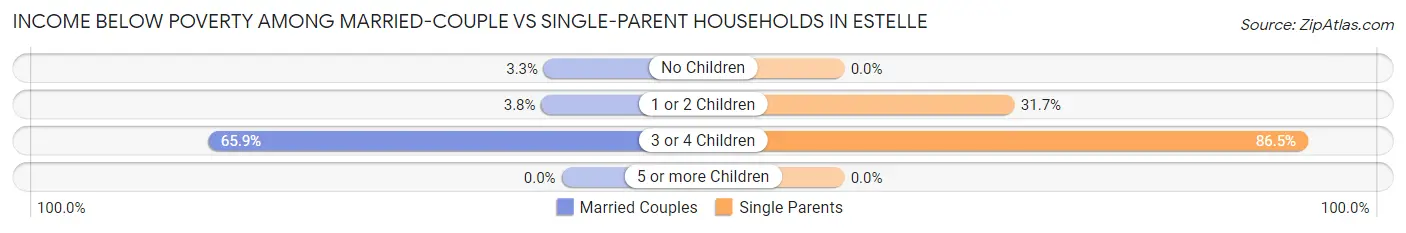
| Children | Married-Couple Families | Single-Parent Households |
| No Children | 56 (3.3%) | 0 (0.0%) |
| 1 or 2 Children | 48 (3.7%) | 228 (31.7%) |
| 3 or 4 Children | 54 (65.8%) | 230 (86.5%) |
| 5 or more Children | 0 (0.0%) | 0 (0.0%) |
| Total | 158 (5.1%) | 458 (29.5%) |
Race in Estelle
The most populous races in Estelle are White / Caucasian (9,033 | 52.8%), Black / African American (4,828 | 28.2%), and Hispanic or Latino (2,205 | 12.9%).
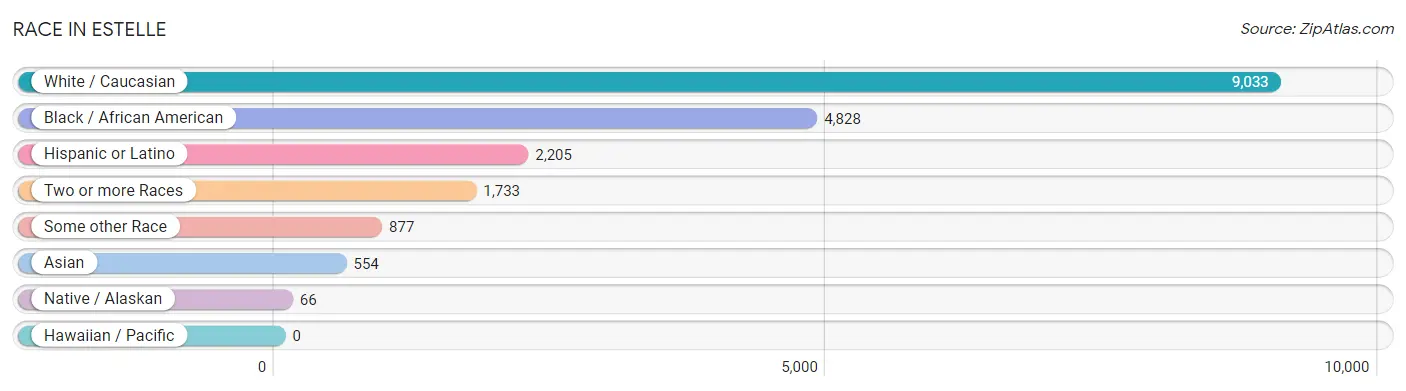
| Race | # Population | % Population |
| Asian | 554 | 3.2% |
| Black / African American | 4,828 | 28.2% |
| Hawaiian / Pacific | 0 | 0.0% |
| Hispanic or Latino | 2,205 | 12.9% |
| Native / Alaskan | 66 | 0.4% |
| White / Caucasian | 9,033 | 52.8% |
| Two or more Races | 1,733 | 10.1% |
| Some other Race | 877 | 5.1% |
| Total | 17,091 | 100.0% |
Ancestry in Estelle
The most populous ancestries reported in Estelle are French (2,860 | 16.7%), German (1,489 | 8.7%), Italian (1,263 | 7.4%), Irish (939 | 5.5%), and Mexican (843 | 4.9%), together accounting for 43.3% of all Estelle residents.
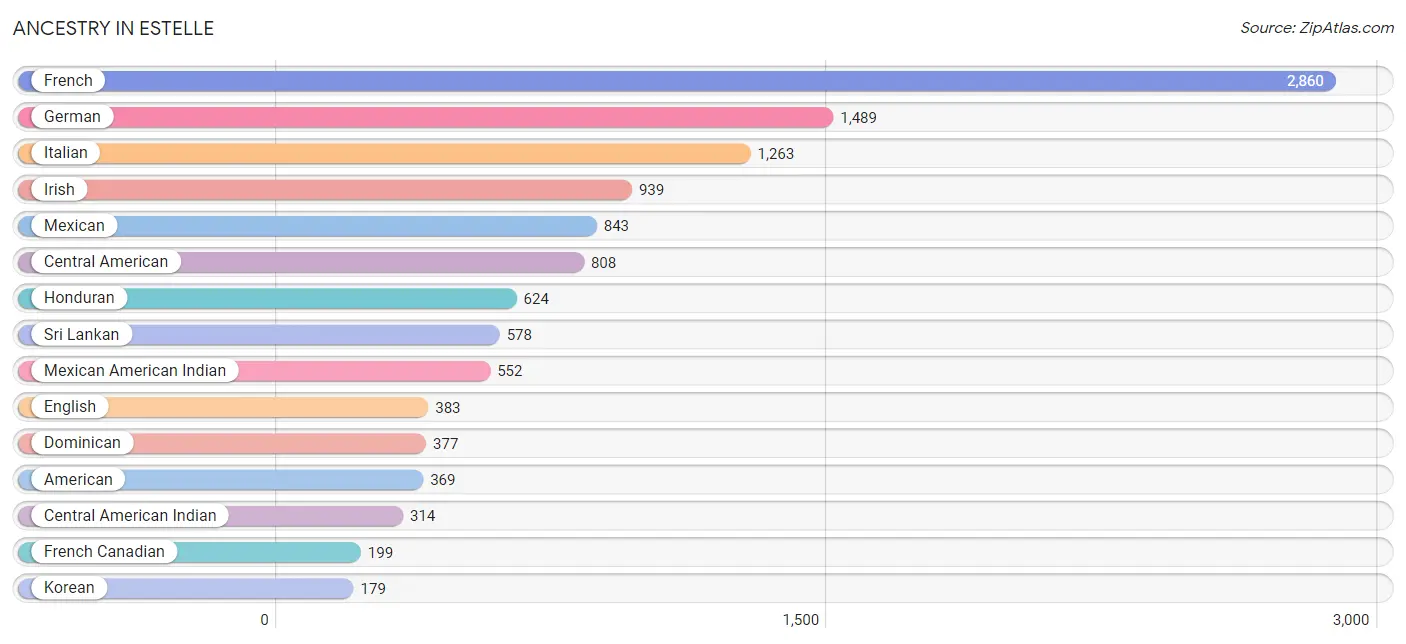
| Ancestry | # Population | % Population |
| African | 106 | 0.6% |
| American | 369 | 2.2% |
| Arab | 43 | 0.3% |
| Austrian | 13 | 0.1% |
| Belizean | 53 | 0.3% |
| British | 16 | 0.1% |
| Cajun | 109 | 0.6% |
| Central American | 808 | 4.7% |
| Central American Indian | 314 | 1.8% |
| Cherokee | 87 | 0.5% |
| Cuban | 1 | 0.0% |
| Czech | 7 | 0.0% |
| Dominican | 377 | 2.2% |
| Dutch | 82 | 0.5% |
| English | 383 | 2.2% |
| European | 19 | 0.1% |
| French | 2,860 | 16.7% |
| French Canadian | 199 | 1.2% |
| German | 1,489 | 8.7% |
| Greek | 68 | 0.4% |
| Guatemalan | 148 | 0.9% |
| Honduran | 624 | 3.6% |
| Houma | 124 | 0.7% |
| Inupiat | 14 | 0.1% |
| Irish | 939 | 5.5% |
| Iroquois | 24 | 0.1% |
| Italian | 1,263 | 7.4% |
| Korean | 179 | 1.1% |
| Mexican | 843 | 4.9% |
| Mexican American Indian | 552 | 3.2% |
| Native Hawaiian | 17 | 0.1% |
| Palestinian | 43 | 0.3% |
| Panamanian | 17 | 0.1% |
| Polish | 53 | 0.3% |
| Portuguese | 21 | 0.1% |
| Puerto Rican | 36 | 0.2% |
| Russian | 6 | 0.0% |
| Salvadoran | 19 | 0.1% |
| Scotch-Irish | 19 | 0.1% |
| Scottish | 19 | 0.1% |
| Slovak | 26 | 0.2% |
| Slovene | 88 | 0.5% |
| Spaniard | 77 | 0.4% |
| Spanish | 55 | 0.3% |
| Sri Lankan | 578 | 3.4% |
| Subsaharan African | 106 | 0.6% |
| Swedish | 27 | 0.2% |
| Swiss | 30 | 0.2% | View All 48 Rows |
Immigrants in Estelle
The most numerous immigrant groups reported in Estelle came from Latin America (965 | 5.7%), Central America (799 | 4.7%), Asia (458 | 2.7%), South Eastern Asia (458 | 2.7%), and Mexico (443 | 2.6%), together accounting for 18.3% of all Estelle residents.
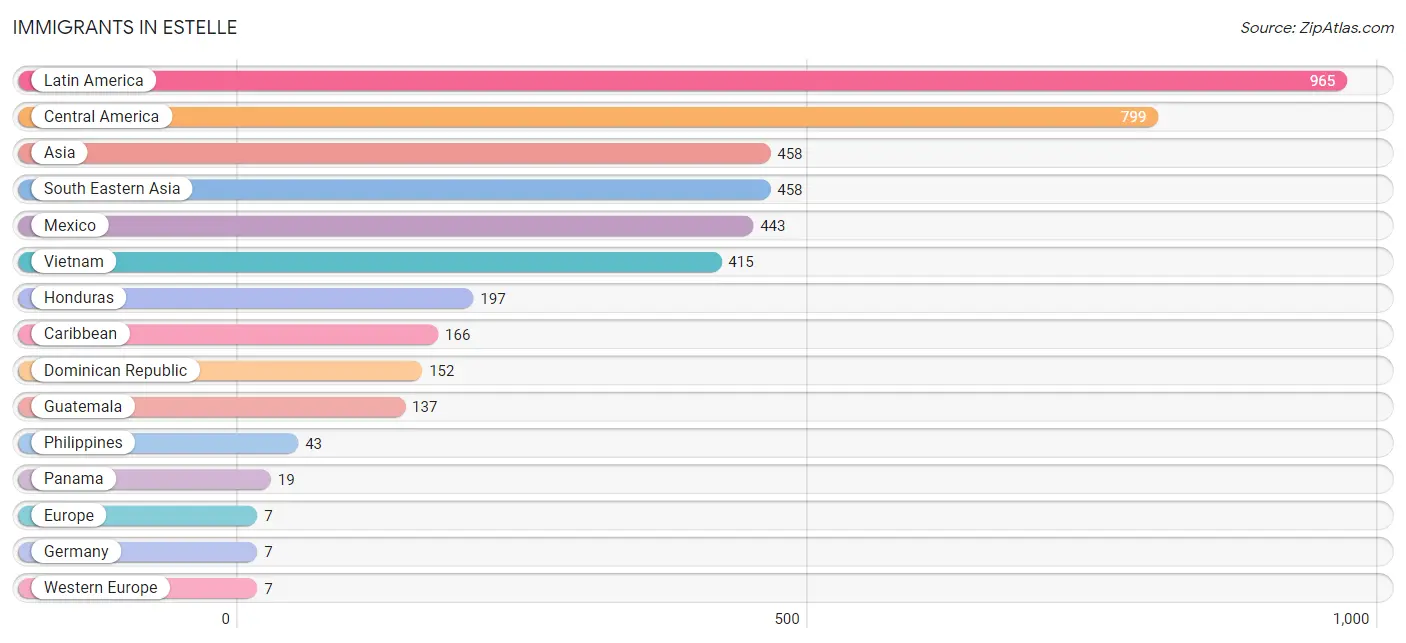
| Immigration Origin | # Population | % Population |
| Asia | 458 | 2.7% |
| Caribbean | 166 | 1.0% |
| Central America | 799 | 4.7% |
| Dominican Republic | 152 | 0.9% |
| El Salvador | 1 | 0.0% |
| Europe | 7 | 0.0% |
| Germany | 7 | 0.0% |
| Guatemala | 137 | 0.8% |
| Honduras | 197 | 1.1% |
| Latin America | 965 | 5.7% |
| Mexico | 443 | 2.6% |
| Nicaragua | 2 | 0.0% |
| Panama | 19 | 0.1% |
| Philippines | 43 | 0.3% |
| South Eastern Asia | 458 | 2.7% |
| Vietnam | 415 | 2.4% |
| Western Europe | 7 | 0.0% | View All 17 Rows |
Sex and Age in Estelle
Sex and Age in Estelle
The most populous age groups in Estelle are 30 to 34 Years (937 | 11.0%) for men and 55 to 59 Years (1,009 | 11.8%) for women.
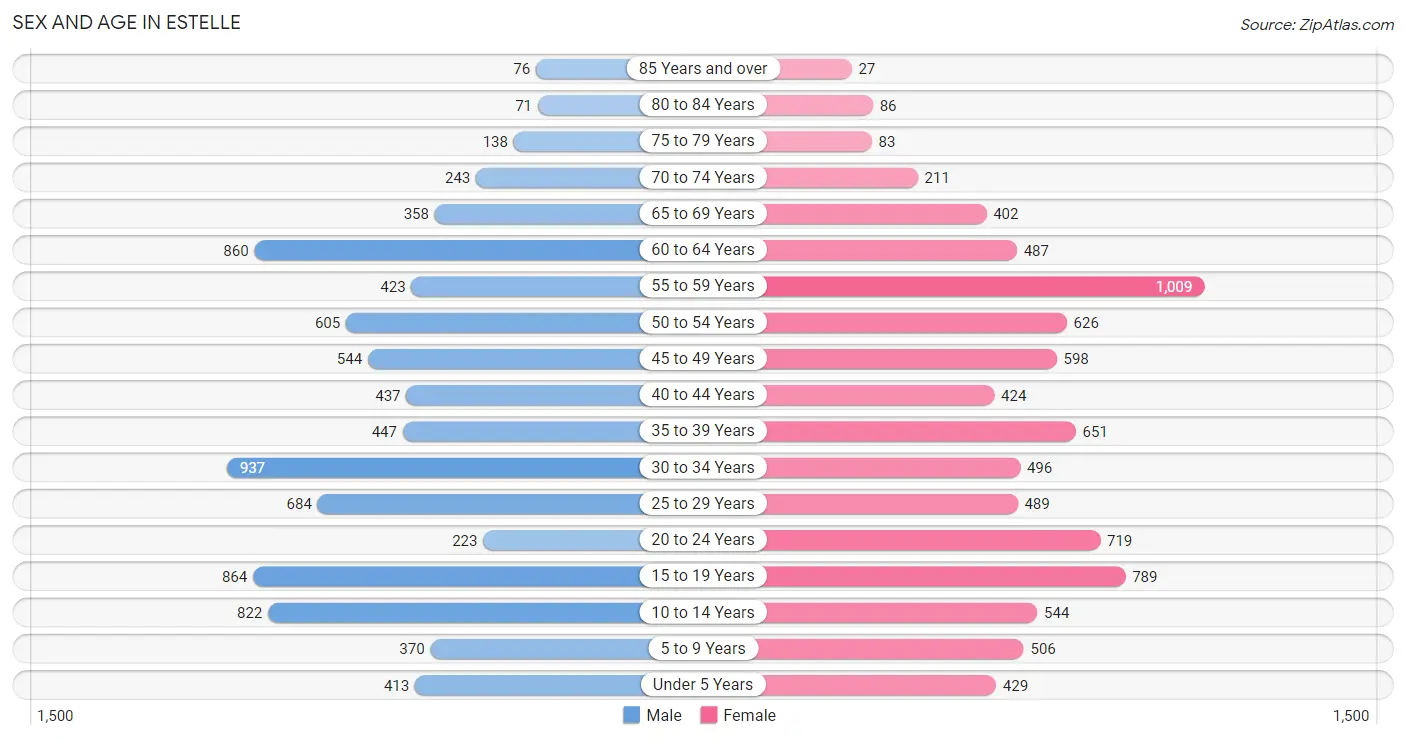
| Age Bracket | Male | Female |
| Under 5 Years | 413 (4.9%) | 429 (5.0%) |
| 5 to 9 Years | 370 (4.3%) | 506 (5.9%) |
| 10 to 14 Years | 822 (9.7%) | 544 (6.3%) |
| 15 to 19 Years | 864 (10.2%) | 789 (9.2%) |
| 20 to 24 Years | 223 (2.6%) | 719 (8.4%) |
| 25 to 29 Years | 684 (8.0%) | 489 (5.7%) |
| 30 to 34 Years | 937 (11.0%) | 496 (5.8%) |
| 35 to 39 Years | 447 (5.2%) | 651 (7.6%) |
| 40 to 44 Years | 437 (5.1%) | 424 (4.9%) |
| 45 to 49 Years | 544 (6.4%) | 598 (7.0%) |
| 50 to 54 Years | 605 (7.1%) | 626 (7.3%) |
| 55 to 59 Years | 423 (5.0%) | 1,009 (11.8%) |
| 60 to 64 Years | 860 (10.1%) | 487 (5.7%) |
| 65 to 69 Years | 358 (4.2%) | 402 (4.7%) |
| 70 to 74 Years | 243 (2.9%) | 211 (2.5%) |
| 75 to 79 Years | 138 (1.6%) | 83 (1.0%) |
| 80 to 84 Years | 71 (0.8%) | 86 (1.0%) |
| 85 Years and over | 76 (0.9%) | 27 (0.3%) |
| Total | 8,515 (100.0%) | 8,576 (100.0%) |
Families and Households in Estelle
Median Family Size in Estelle
The median family size in Estelle is 3.27 persons per family, with married-couple families (3,070 | 66.4%) accounting for the largest median family size of 3.34 persons per family. On the other hand, single male/father families (493 | 10.7%) represent the smallest median family size with 3.05 persons per family.
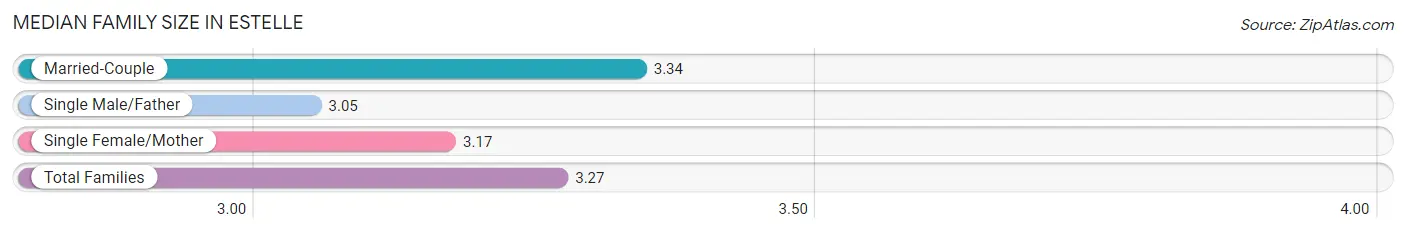
| Family Type | # Families | Family Size |
| Married-Couple | 3,070 (66.4%) | 3.34 |
| Single Male/Father | 493 (10.7%) | 3.05 |
| Single Female/Mother | 1,057 (22.9%) | 3.17 |
| Total Families | 4,620 (100.0%) | 3.27 |
Median Household Size in Estelle
The median household size in Estelle is 2.91 persons per household, with single male/father households (493 | 8.4%) accounting for the largest median household size of 3.57 persons per household. non-family households (1,258 | 21.4%) represent the smallest median household size with 1.09 persons per household.
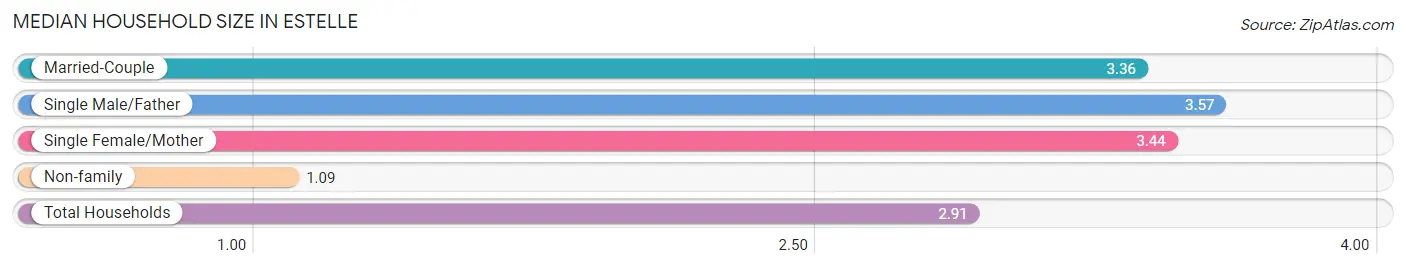
| Household Type | # Households | Household Size |
| Married-Couple | 3,070 (52.2%) | 3.36 |
| Single Male/Father | 493 (8.4%) | 3.57 |
| Single Female/Mother | 1,057 (18.0%) | 3.44 |
| Non-family | 1,258 (21.4%) | 1.09 |
| Total Households | 5,878 (100.0%) | 2.91 |
Household Size by Marriage Status in Estelle
Out of a total of 5,878 households in Estelle, 4,620 (78.6%) are family households, while 1,258 (21.4%) are nonfamily households. The most numerous type of family households are 3-person households, comprising 1,677, and the most common type of nonfamily households are 1-person households, comprising 1,147.
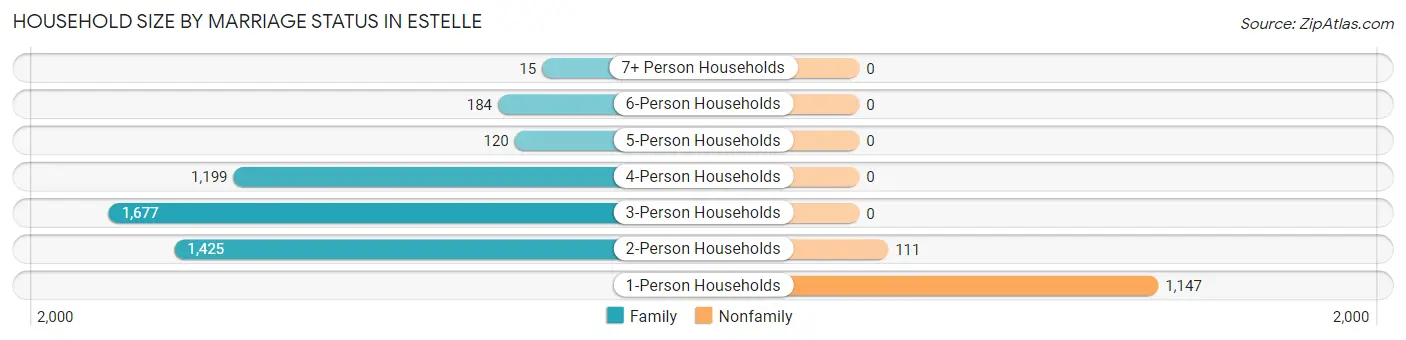
| Household Size | Family Households | Nonfamily Households |
| 1-Person Households | - | 1,147 (19.5%) |
| 2-Person Households | 1,425 (24.2%) | 111 (1.9%) |
| 3-Person Households | 1,677 (28.5%) | 0 (0.0%) |
| 4-Person Households | 1,199 (20.4%) | 0 (0.0%) |
| 5-Person Households | 120 (2.0%) | 0 (0.0%) |
| 6-Person Households | 184 (3.1%) | 0 (0.0%) |
| 7+ Person Households | 15 (0.3%) | 0 (0.0%) |
| Total | 4,620 (78.6%) | 1,258 (21.4%) |
Female Fertility in Estelle
Fertility by Age in Estelle
Average fertility rate in Estelle is 44.0 births per 1,000 women. Women in the age bracket of 20 to 34 years have the highest fertility rate with 101.0 births per 1,000 women. Women in the age bracket of 20 to 34 years acount for 88.2% of all women with births.
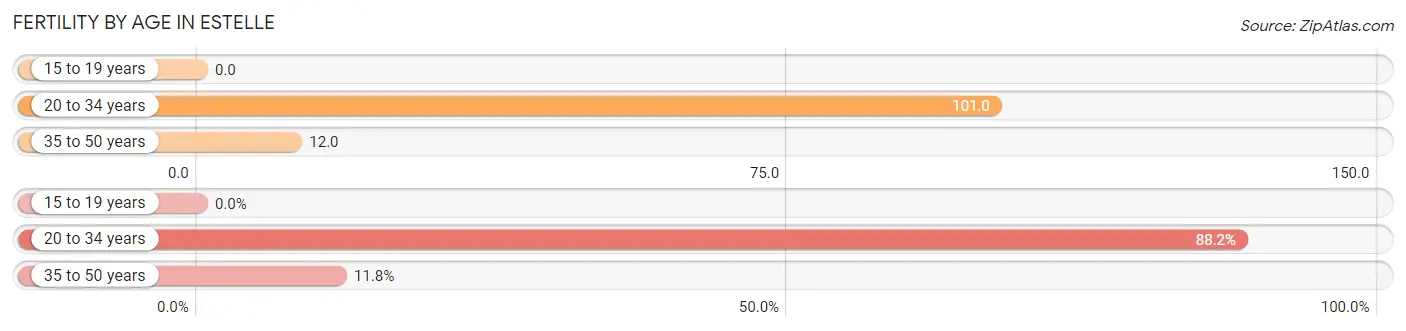
| Age Bracket | Women with Births | Births / 1,000 Women |
| 15 to 19 years | 0 (0.0%) | 0.0 |
| 20 to 34 years | 172 (88.2%) | 101.0 |
| 35 to 50 years | 23 (11.8%) | 12.0 |
| Total | 195 (100.0%) | 44.0 |
Fertility by Age by Marriage Status in Estelle
48.2% of women with births (195) in Estelle are married. The highest percentage of unmarried women with births falls into 35 to 50 years age bracket with 60.9% of them unmarried at the time of birth, while the lowest percentage of unmarried women with births belong to 20 to 34 years age bracket with 50.6% of them unmarried.
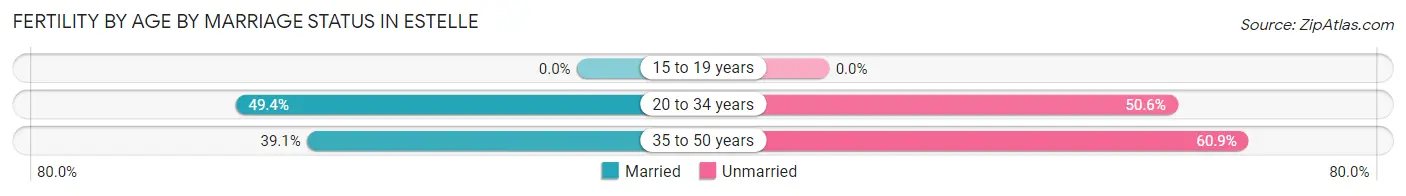
| Age Bracket | Married | Unmarried |
| 15 to 19 years | 0 (0.0%) | 0 (0.0%) |
| 20 to 34 years | 85 (49.4%) | 87 (50.6%) |
| 35 to 50 years | 9 (39.1%) | 14 (60.9%) |
| Total | 94 (48.2%) | 101 (51.8%) |
Fertility by Education in Estelle
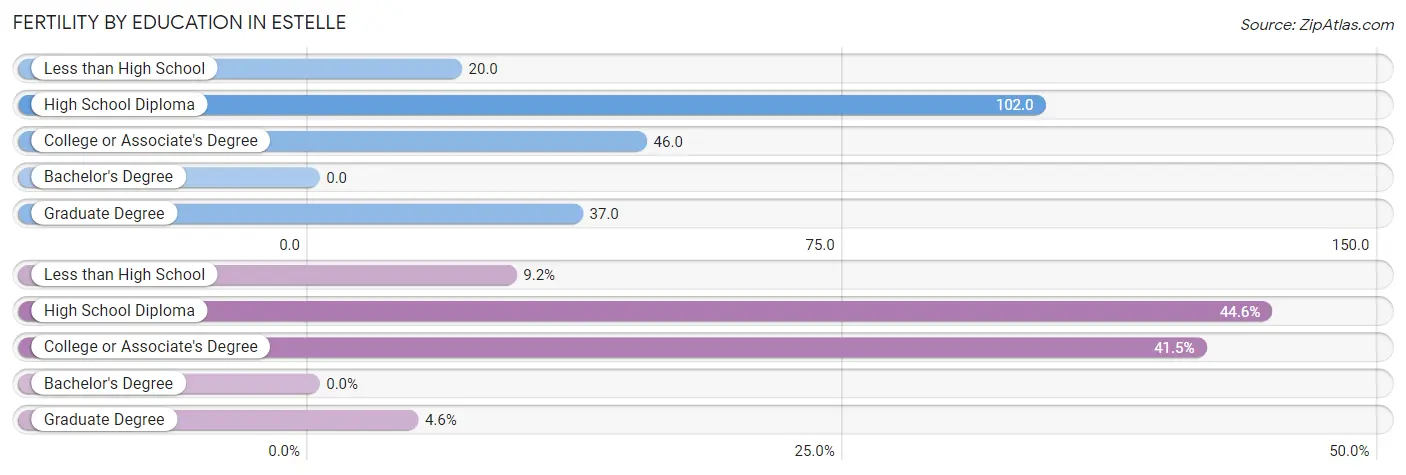
| Educational Attainment | Women with Births | Births / 1,000 Women |
| Less than High School | 18 (9.2%) | 20.0 |
| High School Diploma | 87 (44.6%) | 102.0 |
| College or Associate's Degree | 81 (41.5%) | 46.0 |
| Bachelor's Degree | 0 (0.0%) | 0.0 |
| Graduate Degree | 9 (4.6%) | 37.0 |
| Total | 195 (100.0%) | 44.0 |
Fertility by Education by Marriage Status in Estelle
51.8% of women with births in Estelle are unmarried. Women with the educational attainment of less than high school are most likely to be married with 100.0% of them married at childbirth, while women with the educational attainment of high school diploma are least likely to be married with 100.0% of them unmarried at childbirth.
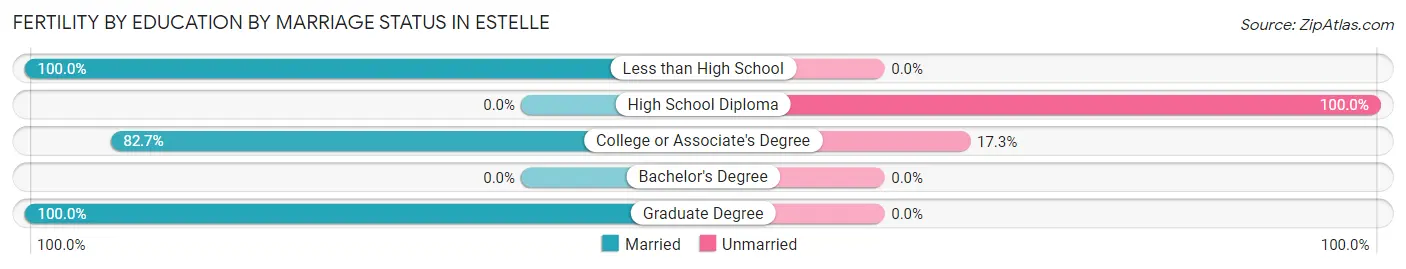
| Educational Attainment | Married | Unmarried |
| Less than High School | 18 (100.0%) | 0 (0.0%) |
| High School Diploma | 0 (0.0%) | 87 (100.0%) |
| College or Associate's Degree | 67 (82.7%) | 14 (17.3%) |
| Bachelor's Degree | 0 (0.0%) | 0 (0.0%) |
| Graduate Degree | 9 (100.0%) | 0 (0.0%) |
| Total | 94 (48.2%) | 101 (51.8%) |
Employment Characteristics in Estelle
Employment by Class of Employer in Estelle
Among the 8,581 employed individuals in Estelle, private company employees (6,033 | 70.3%), self-employed (not incorporated) (675 | 7.9%), and not-for-profit organizations (672 | 7.8%) make up the most common classes of employment.
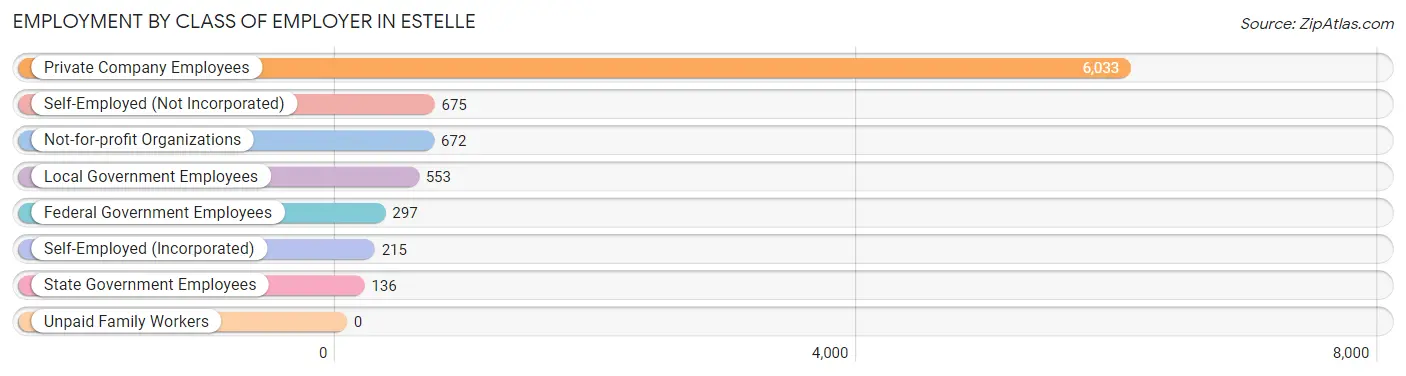
| Employer Class | # Employees | % Employees |
| Private Company Employees | 6,033 | 70.3% |
| Self-Employed (Incorporated) | 215 | 2.5% |
| Self-Employed (Not Incorporated) | 675 | 7.9% |
| Not-for-profit Organizations | 672 | 7.8% |
| Local Government Employees | 553 | 6.4% |
| State Government Employees | 136 | 1.6% |
| Federal Government Employees | 297 | 3.5% |
| Unpaid Family Workers | 0 | 0.0% |
| Total | 8,581 | 100.0% |
Employment Status by Age in Estelle
According to the labor force statistics for Estelle, out of the total population over 16 years of age (13,644), 69.0% or 9,414 individuals are in the labor force, with 6.4% or 602 of them unemployed. The age group with the highest labor force participation rate is 25 to 29 years, with 94.5% or 1,108 individuals in the labor force. Within the labor force, the 16 to 19 years age range has the highest percentage of unemployed individuals, with 18.0% or 109 of them being unemployed.
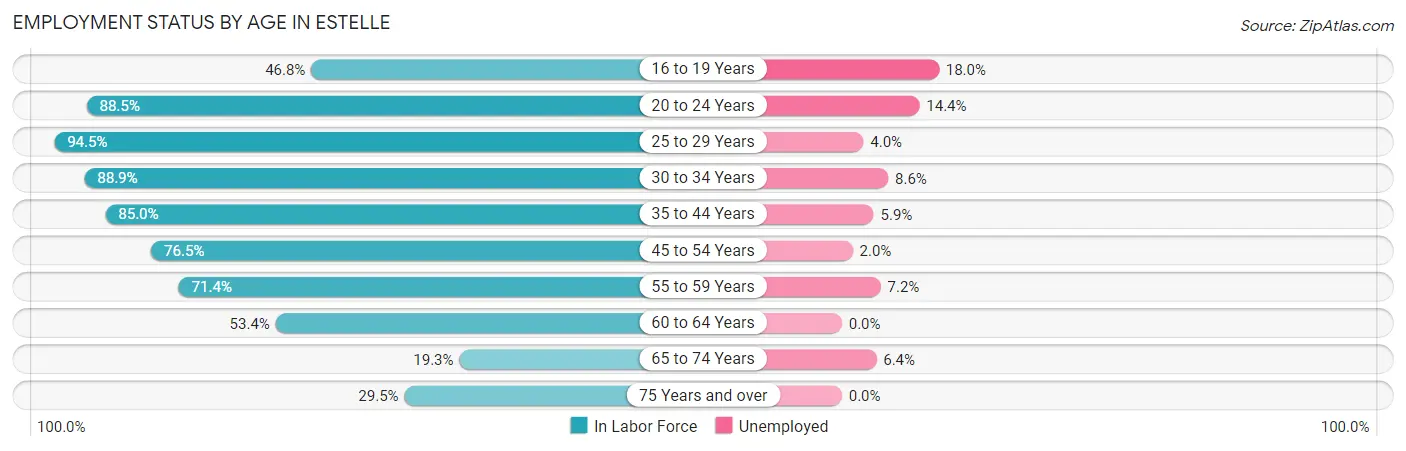
| Age Bracket | In Labor Force | Unemployed |
| 16 to 19 Years | 604 (46.8%) | 109 (18.0%) |
| 20 to 24 Years | 834 (88.5%) | 120 (14.4%) |
| 25 to 29 Years | 1,108 (94.5%) | 44 (4.0%) |
| 30 to 34 Years | 1,274 (88.9%) | 110 (8.6%) |
| 35 to 44 Years | 1,665 (85.0%) | 98 (5.9%) |
| 45 to 54 Years | 1,815 (76.5%) | 36 (2.0%) |
| 55 to 59 Years | 1,022 (71.4%) | 74 (7.2%) |
| 60 to 64 Years | 719 (53.4%) | 0 (0.0%) |
| 65 to 74 Years | 234 (19.3%) | 15 (6.4%) |
| 75 Years and over | 142 (29.5%) | 0 (0.0%) |
| Total | 9,414 (69.0%) | 602 (6.4%) |
Employment Status by Educational Attainment in Estelle
According to labor force statistics for Estelle, 78.3% of individuals (7,608) out of the total population between 25 and 64 years of age (9,717) are in the labor force, with 4.8% or 365 of them being unemployed. The group with the highest labor force participation rate are those with the educational attainment of bachelor's degree or higher, with 87.3% or 1,764 individuals in the labor force. Within the labor force, individuals with less than high school education have the highest percentage of unemployment, with 15.0% or 138 of them being unemployed.
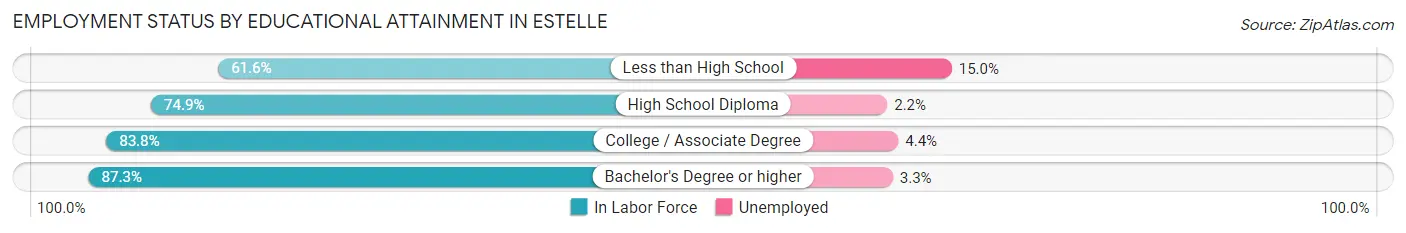
| Educational Attainment | In Labor Force | Unemployed |
| Less than High School | 920 (61.6%) | 224 (15.0%) |
| High School Diploma | 2,329 (74.9%) | 68 (2.2%) |
| College / Associate Degree | 2,591 (83.8%) | 136 (4.4%) |
| Bachelor's Degree or higher | 1,764 (87.3%) | 67 (3.3%) |
| Total | 7,608 (78.3%) | 466 (4.8%) |
Employment Occupations by Sex in Estelle
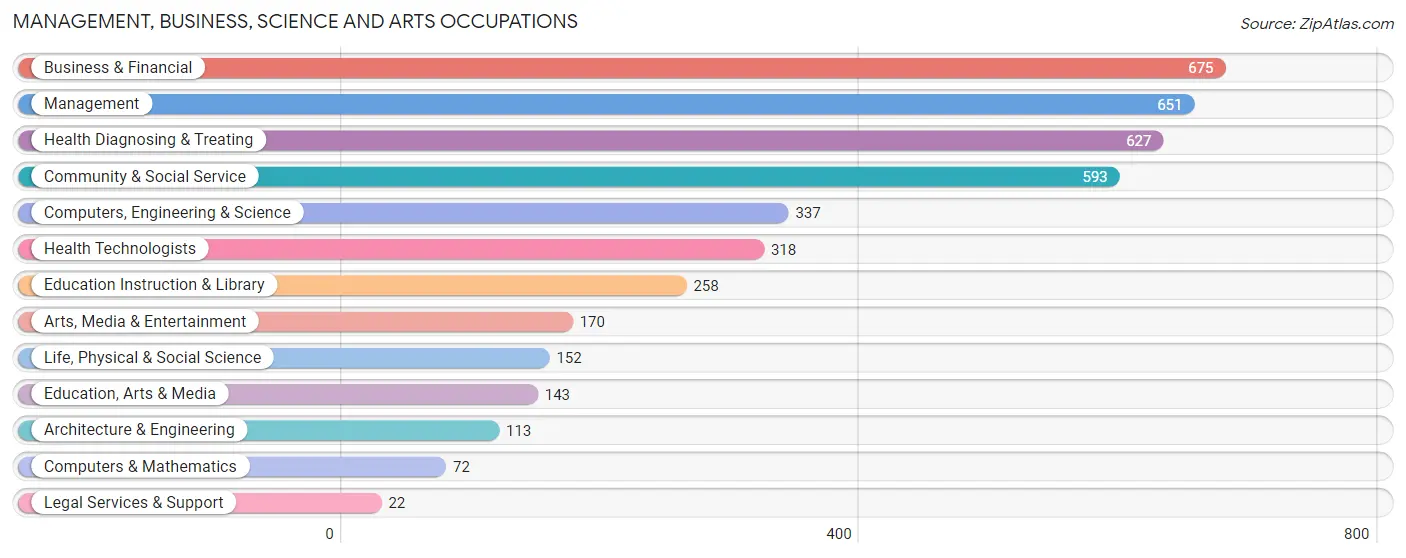
Management, Business, Science and Arts Occupations
The most common Management, Business, Science and Arts occupations in Estelle are Business & Financial (675 | 7.7%), Management (651 | 7.4%), Health Diagnosing & Treating (627 | 7.1%), Community & Social Service (593 | 6.7%), and Computers, Engineering & Science (337 | 3.8%).
Management, Business, Science and Arts Occupations by Sex
Within the Management, Business, Science and Arts occupations in Estelle, the most male-oriented occupations are Architecture & Engineering (100.0%), Arts, Media & Entertainment (91.8%), and Computers, Engineering & Science (90.8%), while the most female-oriented occupations are Legal Services & Support (100.0%), Education Instruction & Library (95.7%), and Health Technologists (87.7%).
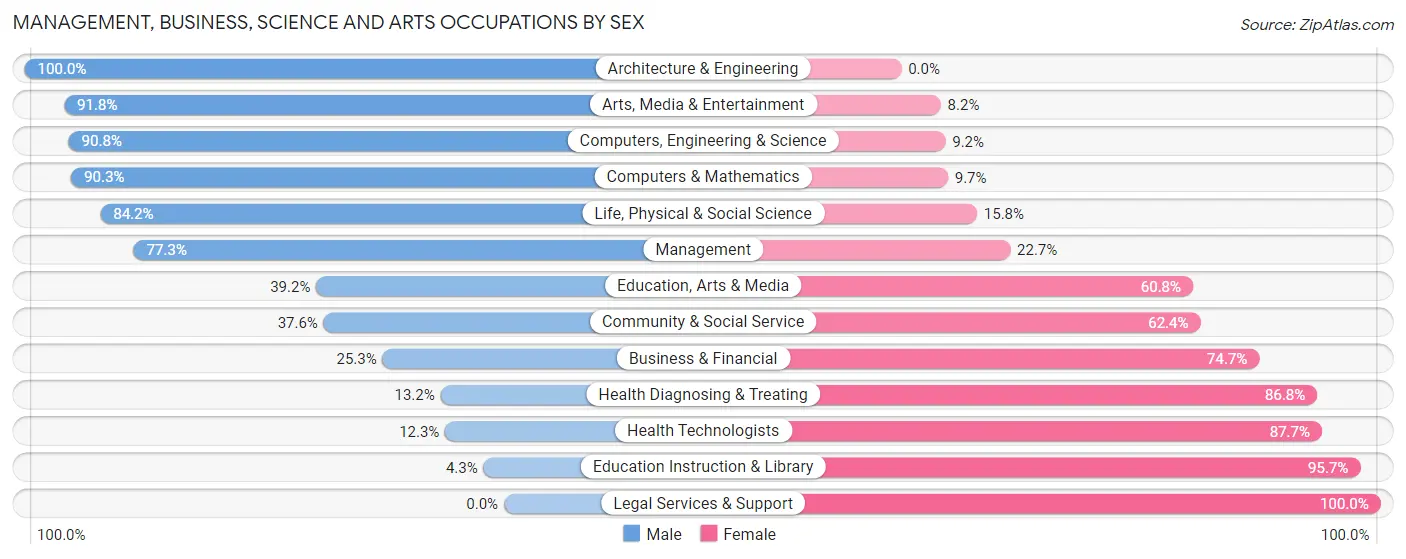
| Occupation | Male | Female |
| Management | 503 (77.3%) | 148 (22.7%) |
| Business & Financial | 171 (25.3%) | 504 (74.7%) |
| Computers, Engineering & Science | 306 (90.8%) | 31 (9.2%) |
| Computers & Mathematics | 65 (90.3%) | 7 (9.7%) |
| Architecture & Engineering | 113 (100.0%) | 0 (0.0%) |
| Life, Physical & Social Science | 128 (84.2%) | 24 (15.8%) |
| Community & Social Service | 223 (37.6%) | 370 (62.4%) |
| Education, Arts & Media | 56 (39.2%) | 87 (60.8%) |
| Legal Services & Support | 0 (0.0%) | 22 (100.0%) |
| Education Instruction & Library | 11 (4.3%) | 247 (95.7%) |
| Arts, Media & Entertainment | 156 (91.8%) | 14 (8.2%) |
| Health Diagnosing & Treating | 83 (13.2%) | 544 (86.8%) |
| Health Technologists | 39 (12.3%) | 279 (87.7%) |
| Total (Category) | 1,286 (44.6%) | 1,597 (55.4%) |
| Total (Overall) | 4,464 (50.7%) | 4,336 (49.3%) |
Services Occupations
The most common Services occupations in Estelle are Food Preparation & Serving (867 | 9.9%), Personal Care & Service (248 | 2.8%), Healthcare Support (233 | 2.6%), Cleaning & Maintenance (197 | 2.2%), and Security & Protection (174 | 2.0%).
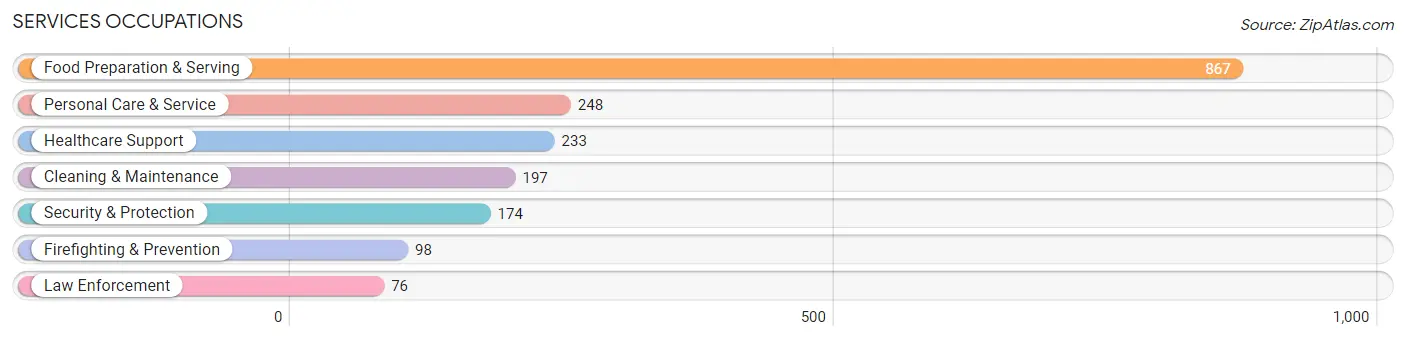
Services Occupations by Sex
Within the Services occupations in Estelle, the most male-oriented occupations are Firefighting & Prevention (68.4%), Cleaning & Maintenance (67.5%), and Security & Protection (64.4%), while the most female-oriented occupations are Healthcare Support (100.0%), Personal Care & Service (86.3%), and Food Preparation & Serving (65.2%).
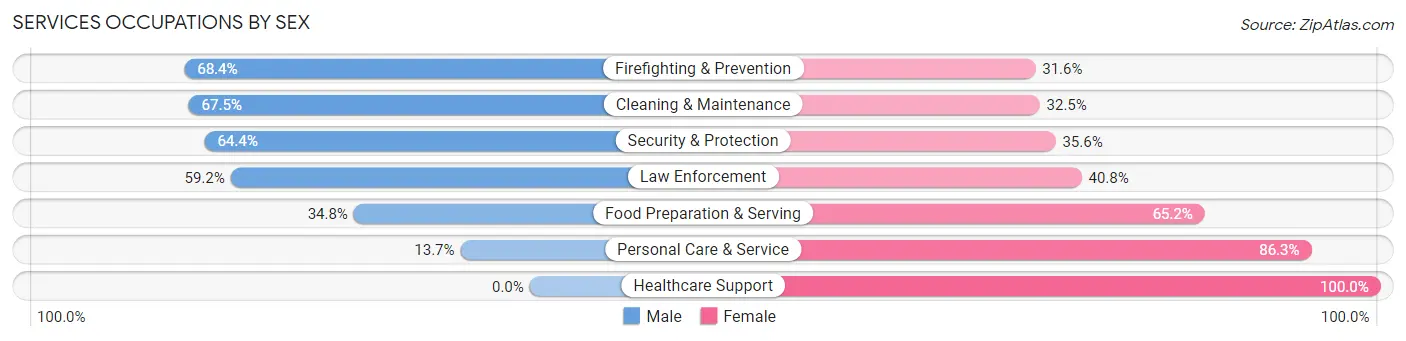
| Occupation | Male | Female |
| Healthcare Support | 0 (0.0%) | 233 (100.0%) |
| Security & Protection | 112 (64.4%) | 62 (35.6%) |
| Firefighting & Prevention | 67 (68.4%) | 31 (31.6%) |
| Law Enforcement | 45 (59.2%) | 31 (40.8%) |
| Food Preparation & Serving | 302 (34.8%) | 565 (65.2%) |
| Cleaning & Maintenance | 133 (67.5%) | 64 (32.5%) |
| Personal Care & Service | 34 (13.7%) | 214 (86.3%) |
| Total (Category) | 581 (33.8%) | 1,138 (66.2%) |
| Total (Overall) | 4,464 (50.7%) | 4,336 (49.3%) |
Sales and Office Occupations
The most common Sales and Office occupations in Estelle are Office & Administration (1,290 | 14.7%), and Sales & Related (735 | 8.4%).

Sales and Office Occupations by Sex

| Occupation | Male | Female |
| Sales & Related | 363 (49.4%) | 372 (50.6%) |
| Office & Administration | 142 (11.0%) | 1,148 (89.0%) |
| Total (Category) | 505 (24.9%) | 1,520 (75.1%) |
| Total (Overall) | 4,464 (50.7%) | 4,336 (49.3%) |
Natural Resources, Construction and Maintenance Occupations
The most common Natural Resources, Construction and Maintenance occupations in Estelle are Construction & Extraction (889 | 10.1%), Installation, Maintenance & Repair (230 | 2.6%), and Farming, Fishing & Forestry (85 | 1.0%).
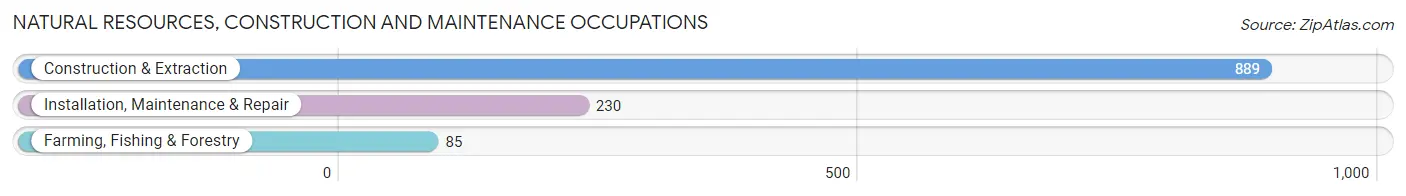
Natural Resources, Construction and Maintenance Occupations by Sex

| Occupation | Male | Female |
| Farming, Fishing & Forestry | 85 (100.0%) | 0 (0.0%) |
| Construction & Extraction | 889 (100.0%) | 0 (0.0%) |
| Installation, Maintenance & Repair | 230 (100.0%) | 0 (0.0%) |
| Total (Category) | 1,204 (100.0%) | 0 (0.0%) |
| Total (Overall) | 4,464 (50.7%) | 4,336 (49.3%) |
Production, Transportation and Moving Occupations
The most common Production, Transportation and Moving occupations in Estelle are Production (557 | 6.3%), Transportation (285 | 3.2%), and Material Moving (127 | 1.4%).
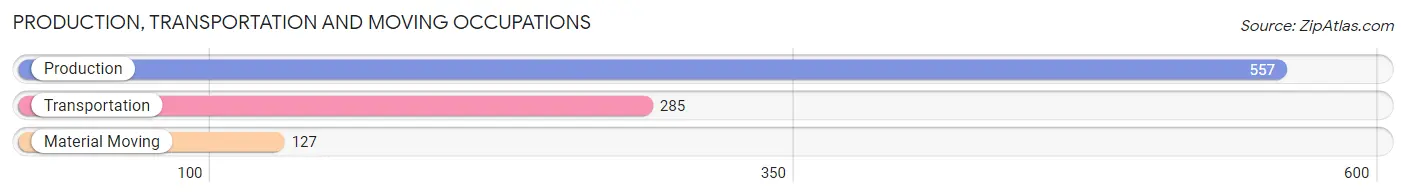
Production, Transportation and Moving Occupations by Sex
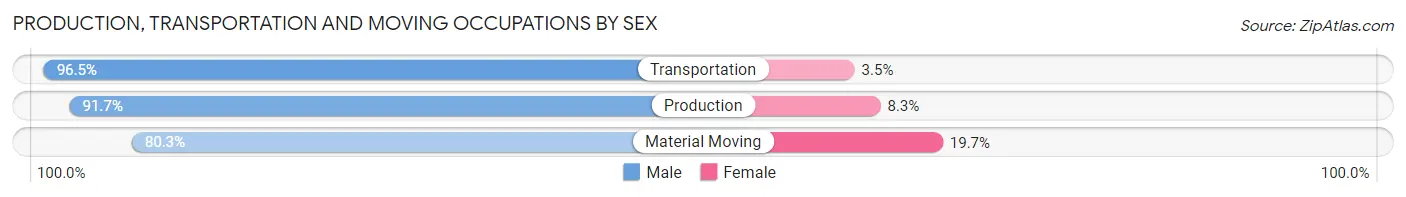
| Occupation | Male | Female |
| Production | 511 (91.7%) | 46 (8.3%) |
| Transportation | 275 (96.5%) | 10 (3.5%) |
| Material Moving | 102 (80.3%) | 25 (19.7%) |
| Total (Category) | 888 (91.6%) | 81 (8.4%) |
| Total (Overall) | 4,464 (50.7%) | 4,336 (49.3%) |
Employment Industries by Sex in Estelle
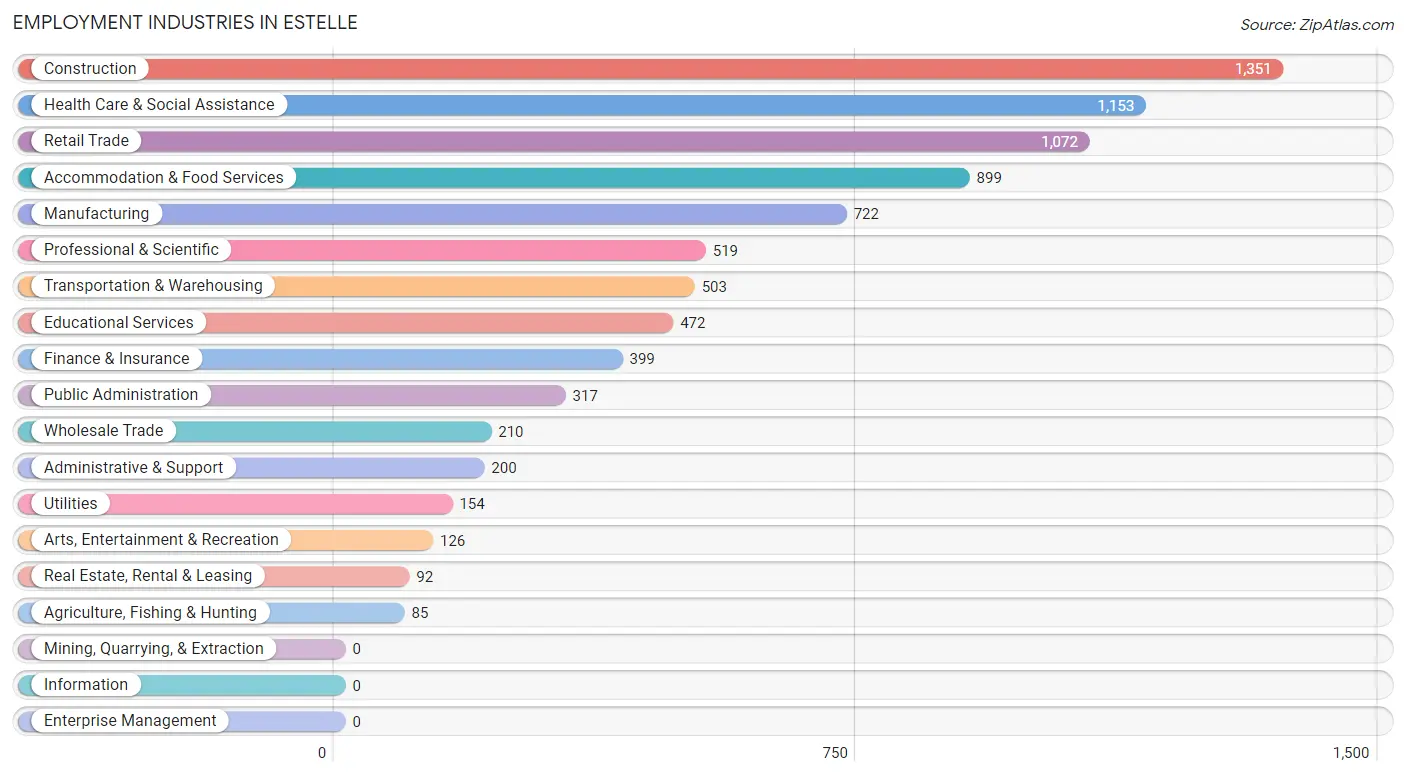
Employment Industries in Estelle
The major employment industries in Estelle include Construction (1,351 | 15.3%), Health Care & Social Assistance (1,153 | 13.1%), Retail Trade (1,072 | 12.2%), Accommodation & Food Services (899 | 10.2%), and Manufacturing (722 | 8.2%).
Employment Industries by Sex in Estelle
The Estelle industries that see more men than women are Agriculture, Fishing & Hunting (100.0%), Administrative & Support (93.5%), and Transportation & Warehousing (84.1%), whereas the industries that tend to have a higher number of women are Real Estate, Rental & Leasing (100.0%), Health Care & Social Assistance (91.0%), and Educational Services (84.8%).
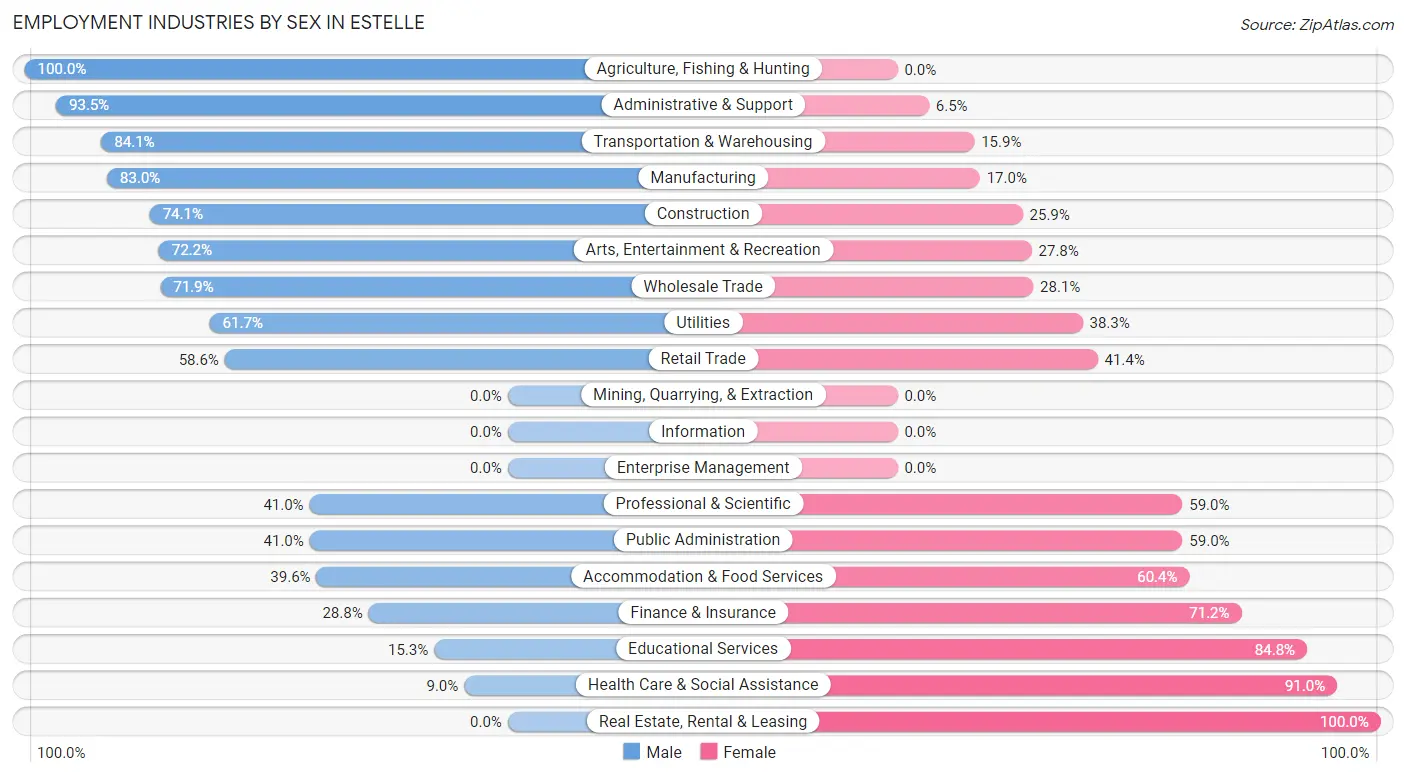
| Industry | Male | Female |
| Agriculture, Fishing & Hunting | 85 (100.0%) | 0 (0.0%) |
| Mining, Quarrying, & Extraction | 0 (0.0%) | 0 (0.0%) |
| Construction | 1,001 (74.1%) | 350 (25.9%) |
| Manufacturing | 599 (83.0%) | 123 (17.0%) |
| Wholesale Trade | 151 (71.9%) | 59 (28.1%) |
| Retail Trade | 628 (58.6%) | 444 (41.4%) |
| Transportation & Warehousing | 423 (84.1%) | 80 (15.9%) |
| Utilities | 95 (61.7%) | 59 (38.3%) |
| Information | 0 (0.0%) | 0 (0.0%) |
| Finance & Insurance | 115 (28.8%) | 284 (71.2%) |
| Real Estate, Rental & Leasing | 0 (0.0%) | 92 (100.0%) |
| Professional & Scientific | 213 (41.0%) | 306 (59.0%) |
| Enterprise Management | 0 (0.0%) | 0 (0.0%) |
| Administrative & Support | 187 (93.5%) | 13 (6.5%) |
| Educational Services | 72 (15.2%) | 400 (84.8%) |
| Health Care & Social Assistance | 104 (9.0%) | 1,049 (91.0%) |
| Arts, Entertainment & Recreation | 91 (72.2%) | 35 (27.8%) |
| Accommodation & Food Services | 356 (39.6%) | 543 (60.4%) |
| Public Administration | 130 (41.0%) | 187 (59.0%) |
| Total | 4,464 (50.7%) | 4,336 (49.3%) |
Education in Estelle
School Enrollment in Estelle
The most common levels of schooling among the 4,018 students in Estelle are high school (1,220 | 30.4%), middle school (1,203 | 29.9%), and elementary school (670 | 16.7%).
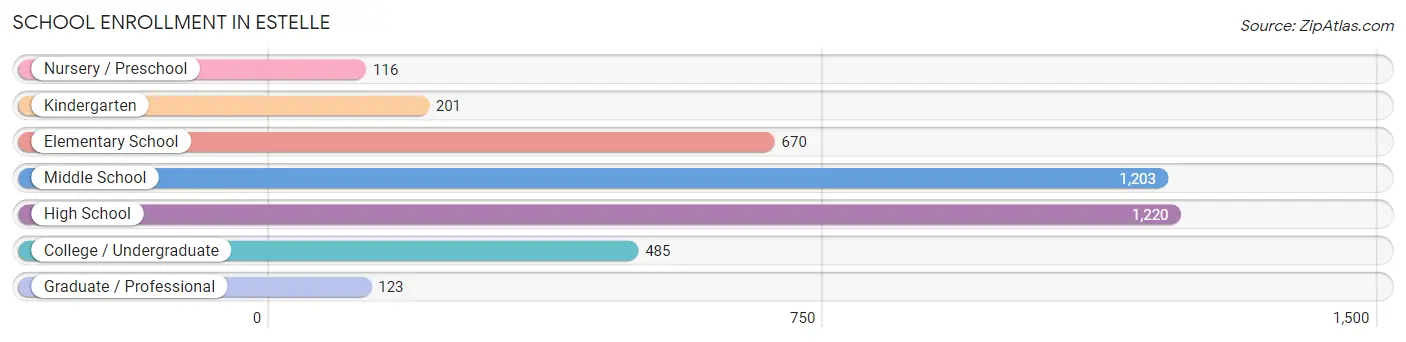
| School Level | # Students | % Students |
| Nursery / Preschool | 116 | 2.9% |
| Kindergarten | 201 | 5.0% |
| Elementary School | 670 | 16.7% |
| Middle School | 1,203 | 29.9% |
| High School | 1,220 | 30.4% |
| College / Undergraduate | 485 | 12.1% |
| Graduate / Professional | 123 | 3.1% |
| Total | 4,018 | 100.0% |
School Enrollment by Age by Funding Source in Estelle
Out of a total of 4,018 students who are enrolled in schools in Estelle, 1,069 (26.6%) attend a private institution, while the remaining 2,949 (73.4%) are enrolled in public schools. The age group of 25 to 34 year olds has the highest likelihood of being enrolled in private schools, with 93 (43.5% in the age bracket) enrolled. Conversely, the age group of 15 to 17 year olds has the lowest likelihood of being enrolled in a private school, with 803 (87.3% in the age bracket) attending a public institution.
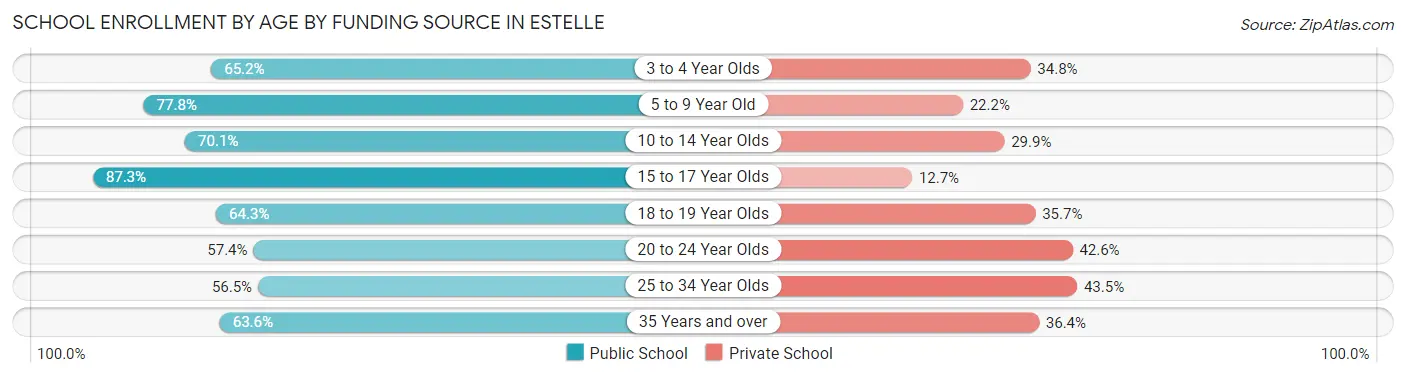
| Age Bracket | Public School | Private School |
| 3 to 4 Year Olds | 75 (65.2%) | 40 (34.8%) |
| 5 to 9 Year Old | 649 (77.8%) | 185 (22.2%) |
| 10 to 14 Year Olds | 893 (70.1%) | 381 (29.9%) |
| 15 to 17 Year Olds | 803 (87.3%) | 117 (12.7%) |
| 18 to 19 Year Olds | 256 (64.3%) | 142 (35.7%) |
| 20 to 24 Year Olds | 132 (57.4%) | 98 (42.6%) |
| 25 to 34 Year Olds | 121 (56.5%) | 93 (43.5%) |
| 35 Years and over | 21 (63.6%) | 12 (36.4%) |
| Total | 2,949 (73.4%) | 1,069 (26.6%) |
Educational Attainment by Field of Study in Estelle
Business (682 | 28.0%), science & technology (370 | 15.2%), physical & health sciences (229 | 9.4%), arts & humanities (206 | 8.5%), and bio, nature & agricultural (185 | 7.6%) are the most common fields of study among 2,433 individuals in Estelle who have obtained a bachelor's degree or higher.
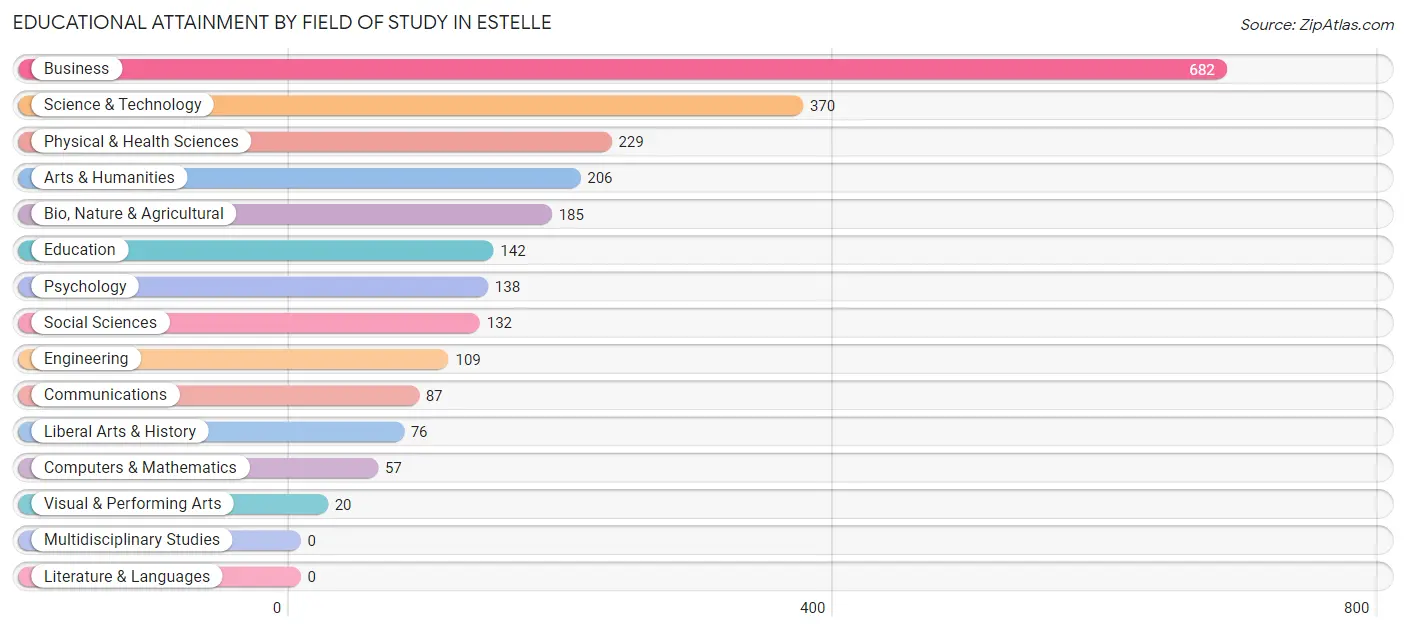
| Field of Study | # Graduates | % Graduates |
| Computers & Mathematics | 57 | 2.3% |
| Bio, Nature & Agricultural | 185 | 7.6% |
| Physical & Health Sciences | 229 | 9.4% |
| Psychology | 138 | 5.7% |
| Social Sciences | 132 | 5.4% |
| Engineering | 109 | 4.5% |
| Multidisciplinary Studies | 0 | 0.0% |
| Science & Technology | 370 | 15.2% |
| Business | 682 | 28.0% |
| Education | 142 | 5.8% |
| Literature & Languages | 0 | 0.0% |
| Liberal Arts & History | 76 | 3.1% |
| Visual & Performing Arts | 20 | 0.8% |
| Communications | 87 | 3.6% |
| Arts & Humanities | 206 | 8.5% |
| Total | 2,433 | 100.0% |
Transportation & Commute in Estelle
Vehicle Availability by Sex in Estelle
The most prevalent vehicle ownership categories in Estelle are males with 2 vehicles (2,205, accounting for 50.4%) and females with 2 vehicles (1,803, making up 52.4%).
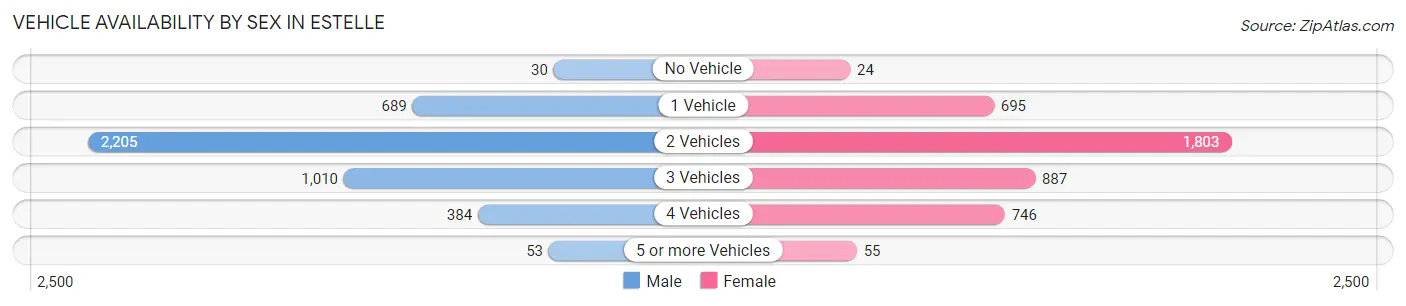
| Vehicles Available | Male | Female |
| No Vehicle | 30 (0.7%) | 24 (0.6%) |
| 1 Vehicle | 689 (15.8%) | 695 (16.5%) |
| 2 Vehicles | 2,205 (50.4%) | 1,803 (42.8%) |
| 3 Vehicles | 1,010 (23.1%) | 887 (21.1%) |
| 4 Vehicles | 384 (8.8%) | 746 (17.7%) |
| 5 or more Vehicles | 53 (1.2%) | 55 (1.3%) |
| Total | 4,371 (100.0%) | 4,210 (100.0%) |
Commute Time in Estelle
The most frequently occuring commute durations in Estelle are 30 to 34 minutes (1,600 commuters, 20.2%), 15 to 19 minutes (1,289 commuters, 16.2%), and 20 to 24 minutes (1,159 commuters, 14.6%).
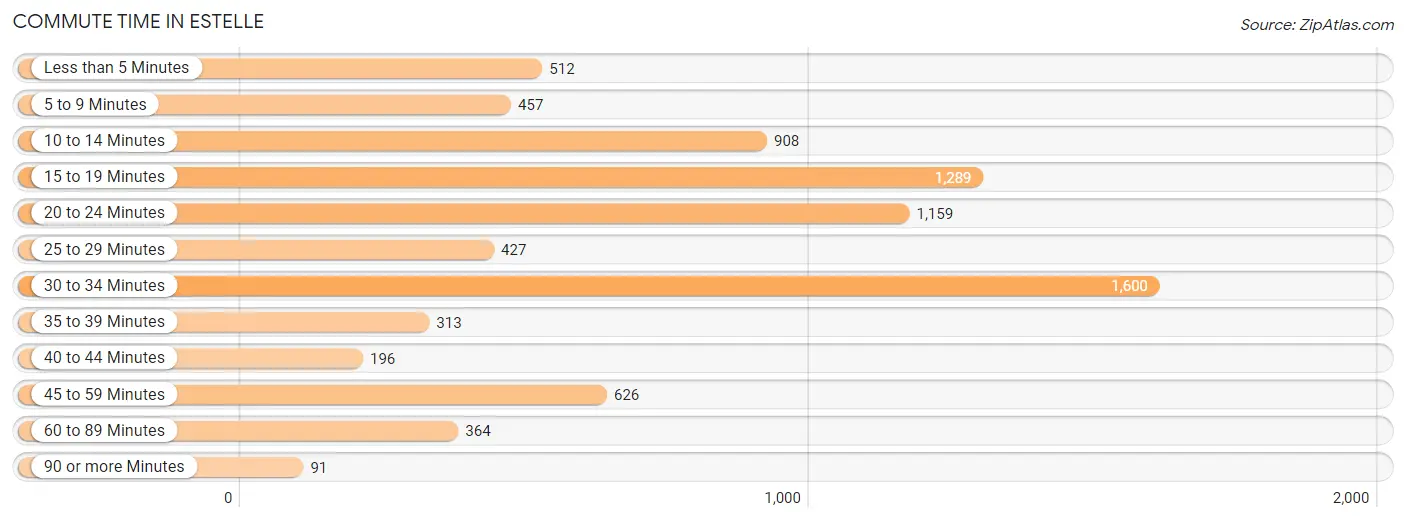
| Commute Time | # Commuters | % Commuters |
| Less than 5 Minutes | 512 | 6.5% |
| 5 to 9 Minutes | 457 | 5.8% |
| 10 to 14 Minutes | 908 | 11.4% |
| 15 to 19 Minutes | 1,289 | 16.2% |
| 20 to 24 Minutes | 1,159 | 14.6% |
| 25 to 29 Minutes | 427 | 5.4% |
| 30 to 34 Minutes | 1,600 | 20.2% |
| 35 to 39 Minutes | 313 | 3.9% |
| 40 to 44 Minutes | 196 | 2.5% |
| 45 to 59 Minutes | 626 | 7.9% |
| 60 to 89 Minutes | 364 | 4.6% |
| 90 or more Minutes | 91 | 1.1% |
Commute Time by Sex in Estelle
The most common commute times in Estelle are 30 to 34 minutes (942 commuters, 22.3%) for males and 15 to 19 minutes (749 commuters, 20.2%) for females.
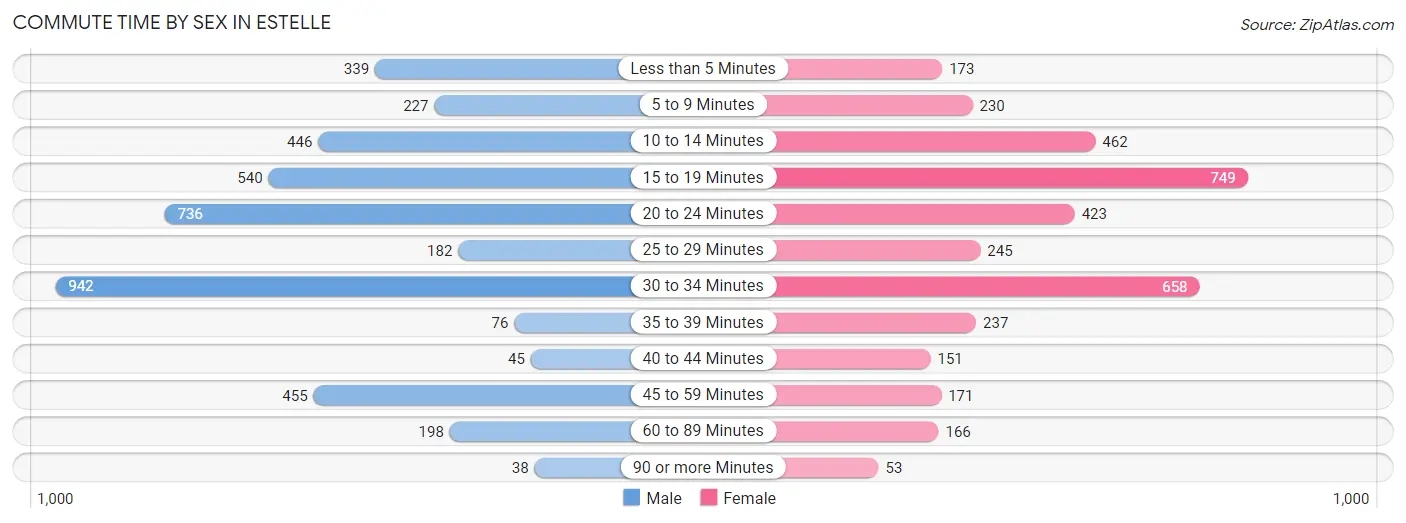
| Commute Time | Male | Female |
| Less than 5 Minutes | 339 (8.0%) | 173 (4.6%) |
| 5 to 9 Minutes | 227 (5.4%) | 230 (6.2%) |
| 10 to 14 Minutes | 446 (10.6%) | 462 (12.4%) |
| 15 to 19 Minutes | 540 (12.8%) | 749 (20.2%) |
| 20 to 24 Minutes | 736 (17.4%) | 423 (11.4%) |
| 25 to 29 Minutes | 182 (4.3%) | 245 (6.6%) |
| 30 to 34 Minutes | 942 (22.3%) | 658 (17.7%) |
| 35 to 39 Minutes | 76 (1.8%) | 237 (6.4%) |
| 40 to 44 Minutes | 45 (1.1%) | 151 (4.1%) |
| 45 to 59 Minutes | 455 (10.8%) | 171 (4.6%) |
| 60 to 89 Minutes | 198 (4.7%) | 166 (4.5%) |
| 90 or more Minutes | 38 (0.9%) | 53 (1.4%) |
Time of Departure to Work by Sex in Estelle
The most frequent times of departure to work in Estelle are 6:00 AM to 6:29 AM (598, 14.2%) for males and 7:00 AM to 7:29 AM (602, 16.2%) for females.
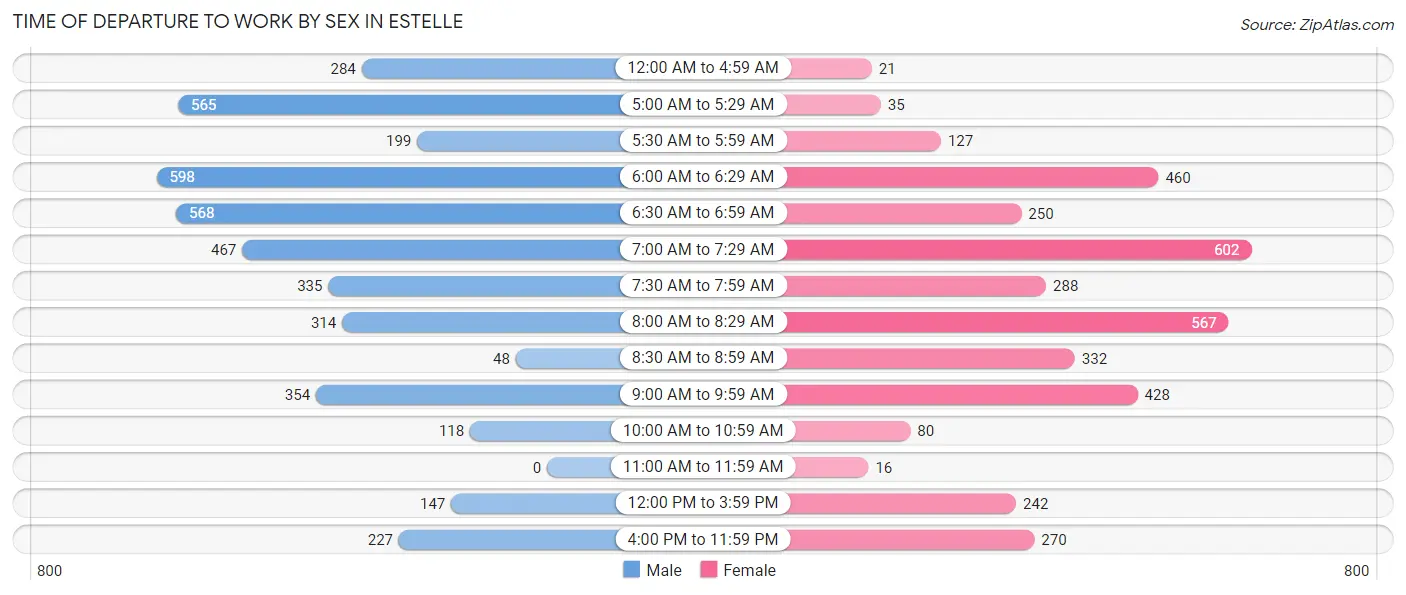
| Time of Departure | Male | Female |
| 12:00 AM to 4:59 AM | 284 (6.7%) | 21 (0.6%) |
| 5:00 AM to 5:29 AM | 565 (13.4%) | 35 (0.9%) |
| 5:30 AM to 5:59 AM | 199 (4.7%) | 127 (3.4%) |
| 6:00 AM to 6:29 AM | 598 (14.2%) | 460 (12.4%) |
| 6:30 AM to 6:59 AM | 568 (13.5%) | 250 (6.7%) |
| 7:00 AM to 7:29 AM | 467 (11.1%) | 602 (16.2%) |
| 7:30 AM to 7:59 AM | 335 (7.9%) | 288 (7.7%) |
| 8:00 AM to 8:29 AM | 314 (7.4%) | 567 (15.2%) |
| 8:30 AM to 8:59 AM | 48 (1.1%) | 332 (8.9%) |
| 9:00 AM to 9:59 AM | 354 (8.4%) | 428 (11.5%) |
| 10:00 AM to 10:59 AM | 118 (2.8%) | 80 (2.1%) |
| 11:00 AM to 11:59 AM | 0 (0.0%) | 16 (0.4%) |
| 12:00 PM to 3:59 PM | 147 (3.5%) | 242 (6.5%) |
| 4:00 PM to 11:59 PM | 227 (5.4%) | 270 (7.3%) |
| Total | 4,224 (100.0%) | 3,718 (100.0%) |
Housing Occupancy in Estelle
Occupancy by Ownership in Estelle
Of the total 5,878 dwellings in Estelle, owner-occupied units account for 5,238 (89.1%), while renter-occupied units make up 640 (10.9%).
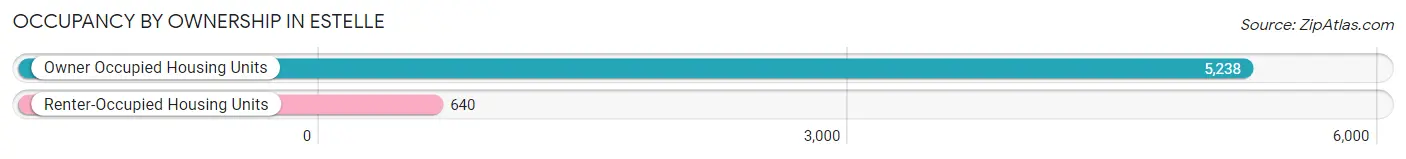
| Occupancy | # Housing Units | % Housing Units |
| Owner Occupied Housing Units | 5,238 | 89.1% |
| Renter-Occupied Housing Units | 640 | 10.9% |
| Total Occupied Housing Units | 5,878 | 100.0% |
Occupancy by Household Size in Estelle
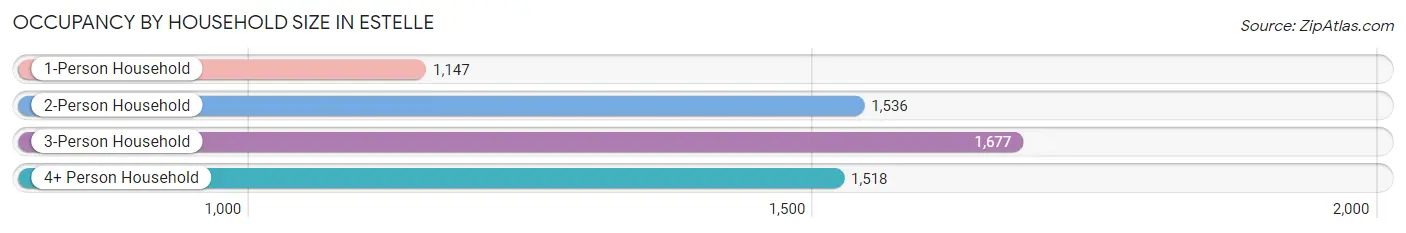
| Household Size | # Housing Units | % Housing Units |
| 1-Person Household | 1,147 | 19.5% |
| 2-Person Household | 1,536 | 26.1% |
| 3-Person Household | 1,677 | 28.5% |
| 4+ Person Household | 1,518 | 25.8% |
| Total Housing Units | 5,878 | 100.0% |
Occupancy by Ownership by Household Size in Estelle
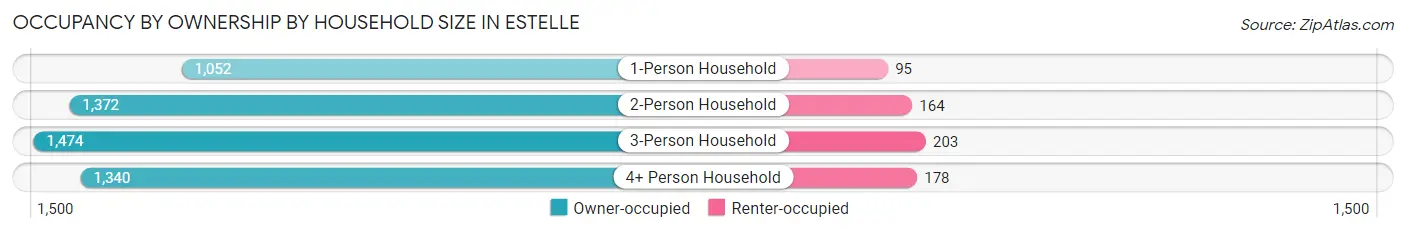
| Household Size | Owner-occupied | Renter-occupied |
| 1-Person Household | 1,052 (91.7%) | 95 (8.3%) |
| 2-Person Household | 1,372 (89.3%) | 164 (10.7%) |
| 3-Person Household | 1,474 (87.9%) | 203 (12.1%) |
| 4+ Person Household | 1,340 (88.3%) | 178 (11.7%) |
| Total Housing Units | 5,238 (89.1%) | 640 (10.9%) |
Occupancy by Educational Attainment in Estelle
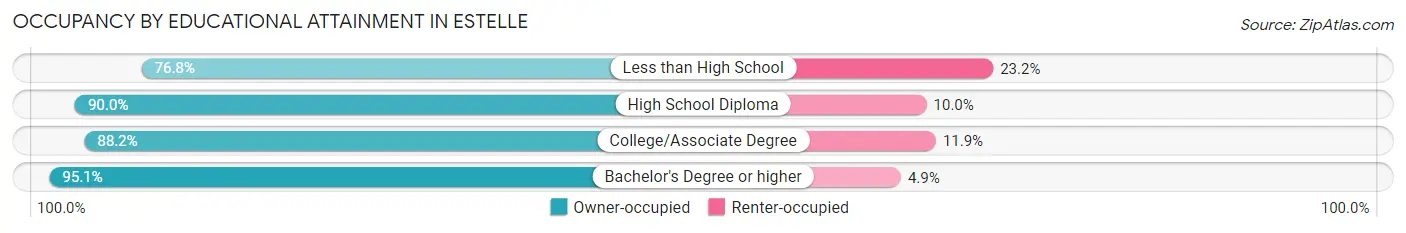
| Household Size | Owner-occupied | Renter-occupied |
| Less than High School | 526 (76.8%) | 159 (23.2%) |
| High School Diploma | 1,737 (90.0%) | 193 (10.0%) |
| College/Associate Degree | 1,622 (88.1%) | 218 (11.8%) |
| Bachelor's Degree or higher | 1,353 (95.1%) | 70 (4.9%) |
Occupancy by Age of Householder in Estelle
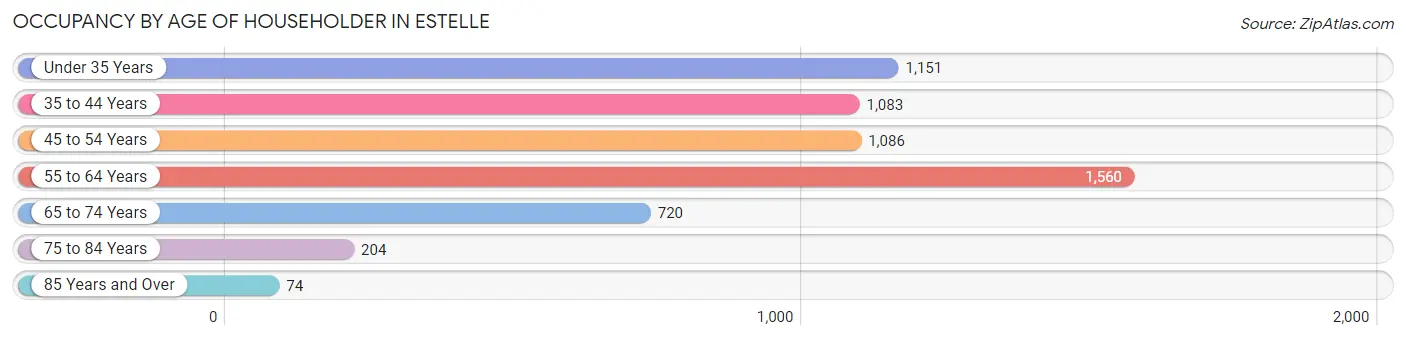
| Age Bracket | # Households | % Households |
| Under 35 Years | 1,151 | 19.6% |
| 35 to 44 Years | 1,083 | 18.4% |
| 45 to 54 Years | 1,086 | 18.5% |
| 55 to 64 Years | 1,560 | 26.5% |
| 65 to 74 Years | 720 | 12.2% |
| 75 to 84 Years | 204 | 3.5% |
| 85 Years and Over | 74 | 1.3% |
| Total | 5,878 | 100.0% |
Housing Finances in Estelle
Median Income by Occupancy in Estelle
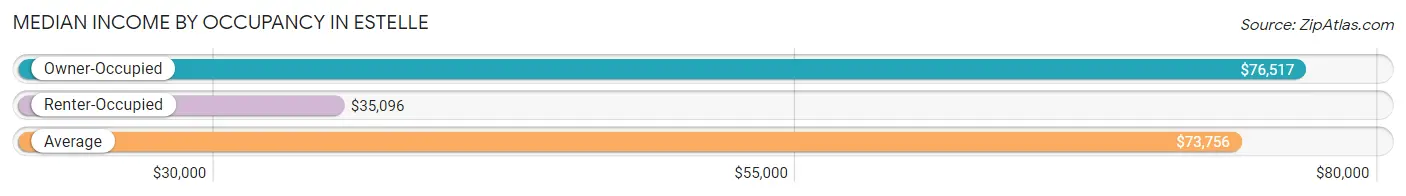
| Occupancy Type | # Households | Median Income |
| Owner-Occupied | 5,238 (89.1%) | $76,517 |
| Renter-Occupied | 640 (10.9%) | $35,096 |
| Average | 5,878 (100.0%) | $73,756 |
Occupancy by Householder Income Bracket in Estelle
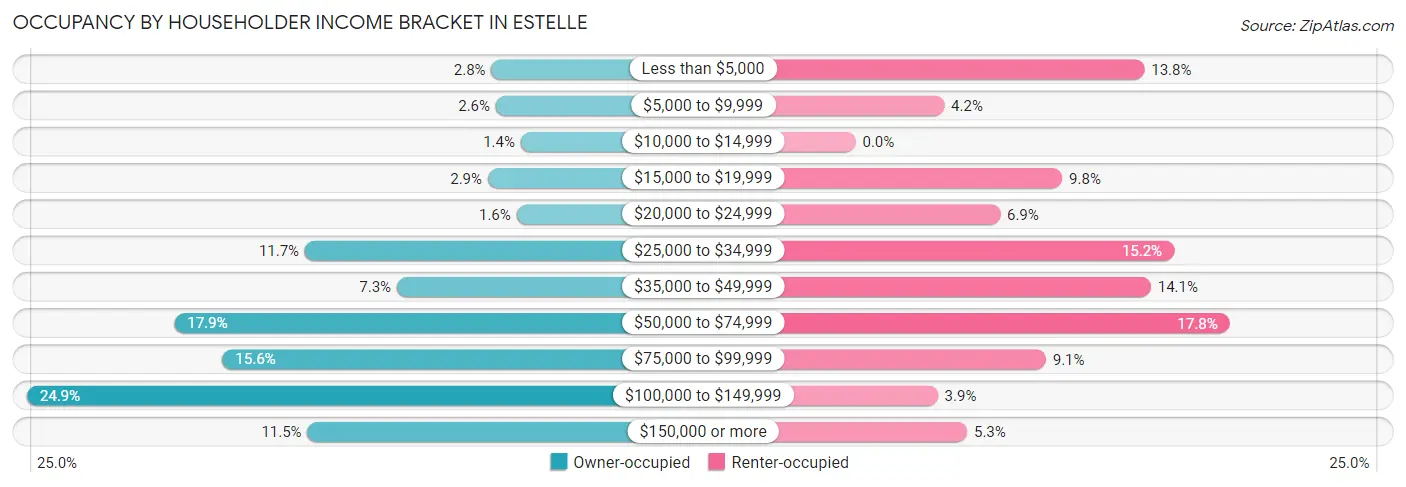
| Income Bracket | Owner-occupied | Renter-occupied |
| Less than $5,000 | 145 (2.8%) | 88 (13.8%) |
| $5,000 to $9,999 | 134 (2.6%) | 27 (4.2%) |
| $10,000 to $14,999 | 72 (1.4%) | 0 (0.0%) |
| $15,000 to $19,999 | 154 (2.9%) | 63 (9.8%) |
| $20,000 to $24,999 | 82 (1.6%) | 44 (6.9%) |
| $25,000 to $34,999 | 610 (11.7%) | 97 (15.2%) |
| $35,000 to $49,999 | 381 (7.3%) | 90 (14.1%) |
| $50,000 to $74,999 | 936 (17.9%) | 114 (17.8%) |
| $75,000 to $99,999 | 816 (15.6%) | 58 (9.1%) |
| $100,000 to $149,999 | 1,304 (24.9%) | 25 (3.9%) |
| $150,000 or more | 604 (11.5%) | 34 (5.3%) |
| Total | 5,238 (100.0%) | 640 (100.0%) |
Monthly Housing Cost Tiers in Estelle
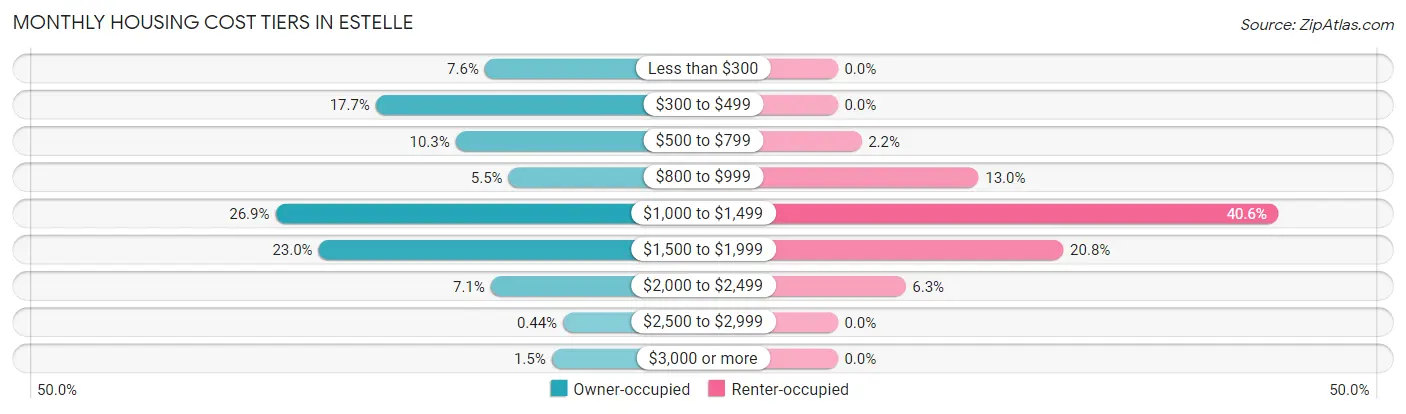
| Monthly Cost | Owner-occupied | Renter-occupied |
| Less than $300 | 400 (7.6%) | 0 (0.0%) |
| $300 to $499 | 926 (17.7%) | 0 (0.0%) |
| $500 to $799 | 541 (10.3%) | 14 (2.2%) |
| $800 to $999 | 286 (5.5%) | 83 (13.0%) |
| $1,000 to $1,499 | 1,410 (26.9%) | 260 (40.6%) |
| $1,500 to $1,999 | 1,202 (23.0%) | 133 (20.8%) |
| $2,000 to $2,499 | 372 (7.1%) | 40 (6.2%) |
| $2,500 to $2,999 | 23 (0.4%) | 0 (0.0%) |
| $3,000 or more | 78 (1.5%) | 0 (0.0%) |
| Total | 5,238 (100.0%) | 640 (100.0%) |
Physical Housing Characteristics in Estelle
Housing Structures in Estelle
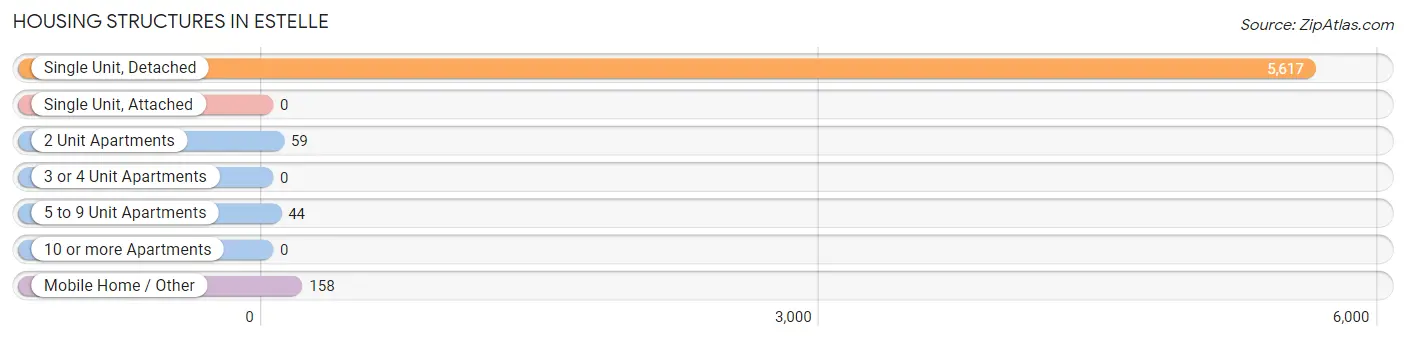
| Structure Type | # Housing Units | % Housing Units |
| Single Unit, Detached | 5,617 | 95.6% |
| Single Unit, Attached | 0 | 0.0% |
| 2 Unit Apartments | 59 | 1.0% |
| 3 or 4 Unit Apartments | 0 | 0.0% |
| 5 to 9 Unit Apartments | 44 | 0.7% |
| 10 or more Apartments | 0 | 0.0% |
| Mobile Home / Other | 158 | 2.7% |
| Total | 5,878 | 100.0% |
Housing Structures by Occupancy in Estelle
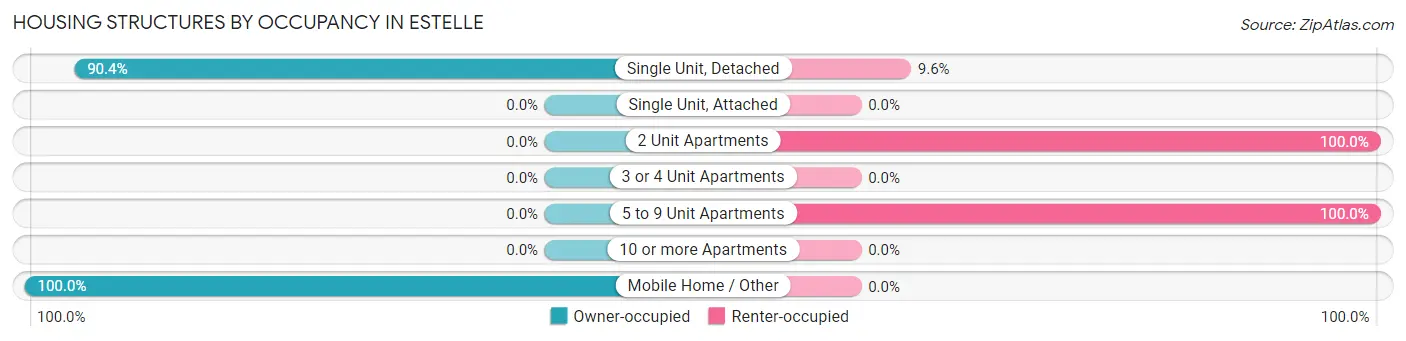
| Structure Type | Owner-occupied | Renter-occupied |
| Single Unit, Detached | 5,080 (90.4%) | 537 (9.6%) |
| Single Unit, Attached | 0 (0.0%) | 0 (0.0%) |
| 2 Unit Apartments | 0 (0.0%) | 59 (100.0%) |
| 3 or 4 Unit Apartments | 0 (0.0%) | 0 (0.0%) |
| 5 to 9 Unit Apartments | 0 (0.0%) | 44 (100.0%) |
| 10 or more Apartments | 0 (0.0%) | 0 (0.0%) |
| Mobile Home / Other | 158 (100.0%) | 0 (0.0%) |
| Total | 5,238 (89.1%) | 640 (10.9%) |
Housing Structures by Number of Rooms in Estelle
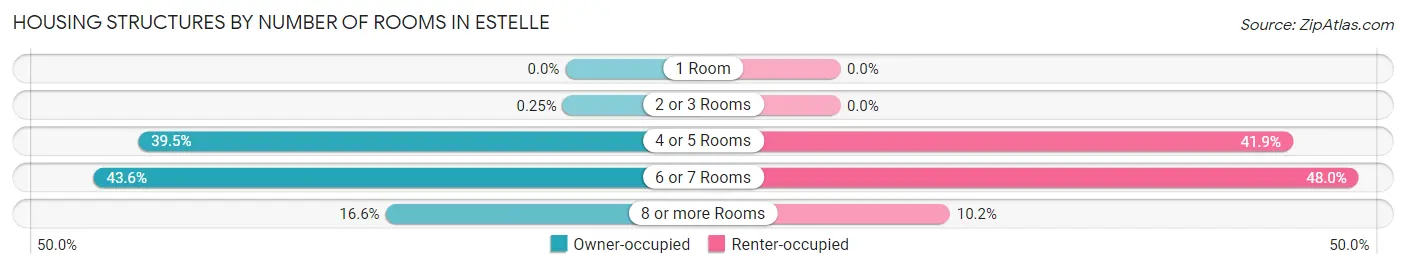
| Number of Rooms | Owner-occupied | Renter-occupied |
| 1 Room | 0 (0.0%) | 0 (0.0%) |
| 2 or 3 Rooms | 13 (0.3%) | 0 (0.0%) |
| 4 or 5 Rooms | 2,069 (39.5%) | 268 (41.9%) |
| 6 or 7 Rooms | 2,285 (43.6%) | 307 (48.0%) |
| 8 or more Rooms | 871 (16.6%) | 65 (10.2%) |
| Total | 5,238 (100.0%) | 640 (100.0%) |
Housing Structure by Heating Type in Estelle
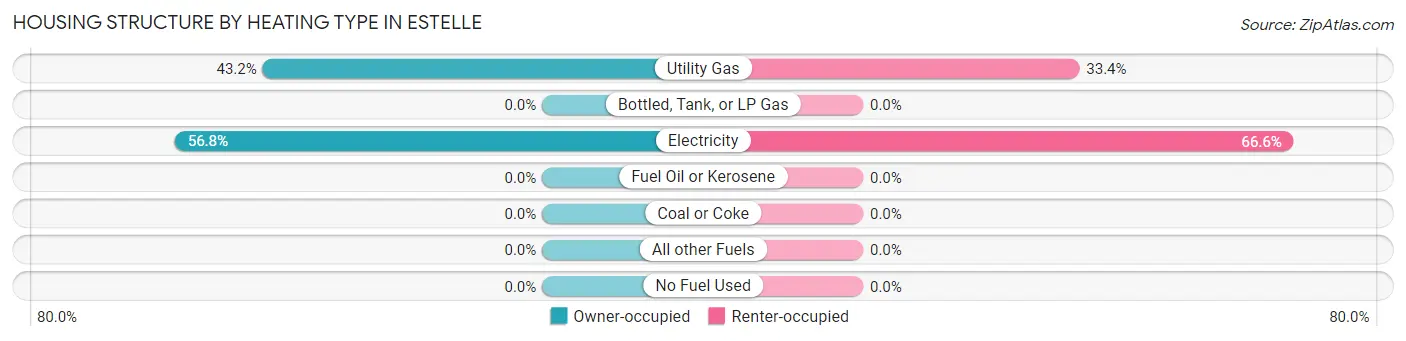
| Heating Type | Owner-occupied | Renter-occupied |
| Utility Gas | 2,264 (43.2%) | 214 (33.4%) |
| Bottled, Tank, or LP Gas | 0 (0.0%) | 0 (0.0%) |
| Electricity | 2,974 (56.8%) | 426 (66.6%) |
| Fuel Oil or Kerosene | 0 (0.0%) | 0 (0.0%) |
| Coal or Coke | 0 (0.0%) | 0 (0.0%) |
| All other Fuels | 0 (0.0%) | 0 (0.0%) |
| No Fuel Used | 0 (0.0%) | 0 (0.0%) |
| Total | 5,238 (100.0%) | 640 (100.0%) |
Household Vehicle Usage in Estelle
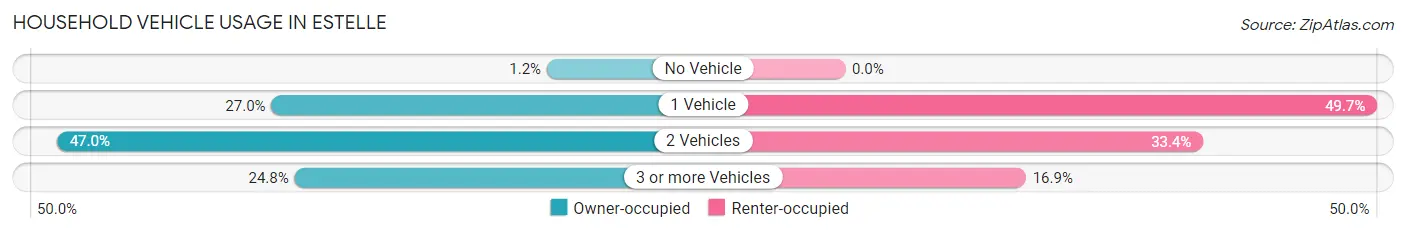
| Vehicles per Household | Owner-occupied | Renter-occupied |
| No Vehicle | 65 (1.2%) | 0 (0.0%) |
| 1 Vehicle | 1,412 (27.0%) | 318 (49.7%) |
| 2 Vehicles | 2,462 (47.0%) | 214 (33.4%) |
| 3 or more Vehicles | 1,299 (24.8%) | 108 (16.9%) |
| Total | 5,238 (100.0%) | 640 (100.0%) |
Real Estate & Mortgages in Estelle
Real Estate and Mortgage Overview in Estelle
| Characteristic | Without Mortgage | With Mortgage |
| Housing Units | 1,843 | 3,395 |
| Median Property Value | $179,900 | $205,500 |
| Median Household Income | $60,396 | $292 |
| Monthly Housing Costs | $424 | $78 |
| Real Estate Taxes | $552 | $141 |
Property Value by Mortgage Status in Estelle
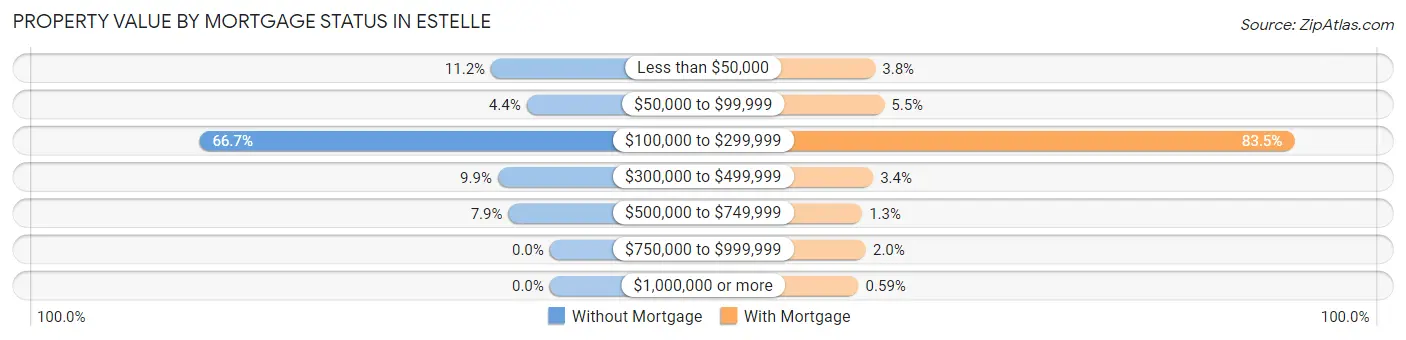
| Property Value | Without Mortgage | With Mortgage |
| Less than $50,000 | 206 (11.2%) | 128 (3.8%) |
| $50,000 to $99,999 | 81 (4.4%) | 186 (5.5%) |
| $100,000 to $299,999 | 1,229 (66.7%) | 2,836 (83.5%) |
| $300,000 to $499,999 | 182 (9.9%) | 114 (3.4%) |
| $500,000 to $749,999 | 145 (7.9%) | 43 (1.3%) |
| $750,000 to $999,999 | 0 (0.0%) | 68 (2.0%) |
| $1,000,000 or more | 0 (0.0%) | 20 (0.6%) |
| Total | 1,843 (100.0%) | 3,395 (100.0%) |
Household Income by Mortgage Status in Estelle
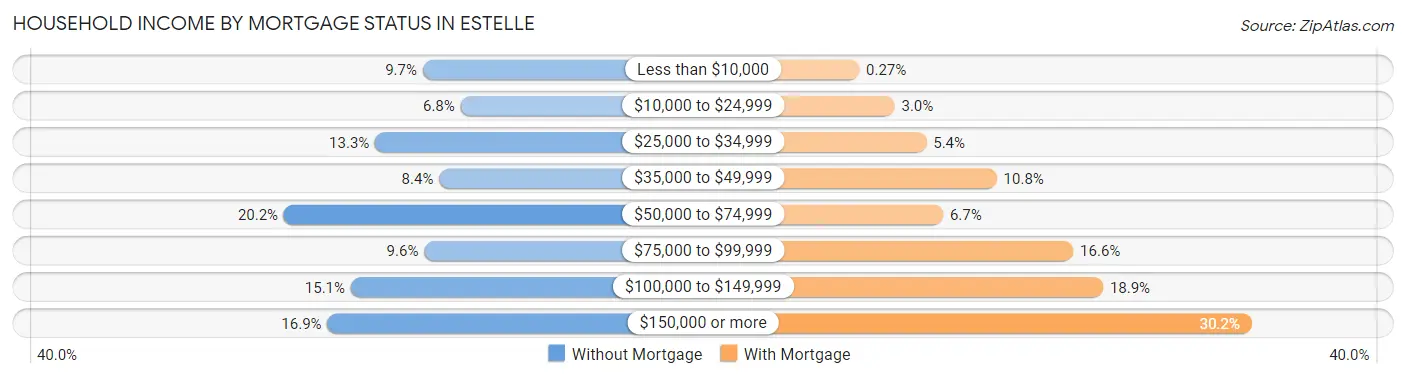
| Household Income | Without Mortgage | With Mortgage |
| Less than $10,000 | 178 (9.7%) | 9 (0.3%) |
| $10,000 to $24,999 | 125 (6.8%) | 101 (3.0%) |
| $25,000 to $34,999 | 245 (13.3%) | 183 (5.4%) |
| $35,000 to $49,999 | 155 (8.4%) | 365 (10.7%) |
| $50,000 to $74,999 | 373 (20.2%) | 226 (6.7%) |
| $75,000 to $99,999 | 176 (9.6%) | 563 (16.6%) |
| $100,000 to $149,999 | 279 (15.1%) | 640 (18.9%) |
| $150,000 or more | 312 (16.9%) | 1,025 (30.2%) |
| Total | 1,843 (100.0%) | 3,395 (100.0%) |
Property Value to Household Income Ratio in Estelle
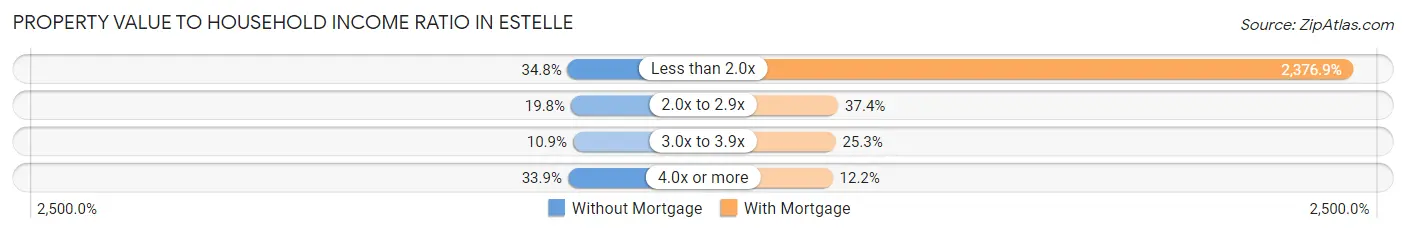
| Value-to-Income Ratio | Without Mortgage | With Mortgage |
| Less than 2.0x | 642 (34.8%) | 80,694 (2,376.8%) |
| 2.0x to 2.9x | 364 (19.8%) | 1,269 (37.4%) |
| 3.0x to 3.9x | 200 (10.8%) | 859 (25.3%) |
| 4.0x or more | 625 (33.9%) | 415 (12.2%) |
| Total | 1,843 (100.0%) | 3,395 (100.0%) |
Real Estate Taxes by Mortgage Status in Estelle

| Property Taxes | Without Mortgage | With Mortgage |
| Less than $800 | 1,033 (56.0%) | 54 (1.6%) |
| $800 to $1,499 | 274 (14.9%) | 1,102 (32.5%) |
| $800 to $1,499 | 330 (17.9%) | 836 (24.6%) |
| Total | 1,843 (100.0%) | 3,395 (100.0%) |
Health & Disability in Estelle
Health Insurance Coverage by Age in Estelle
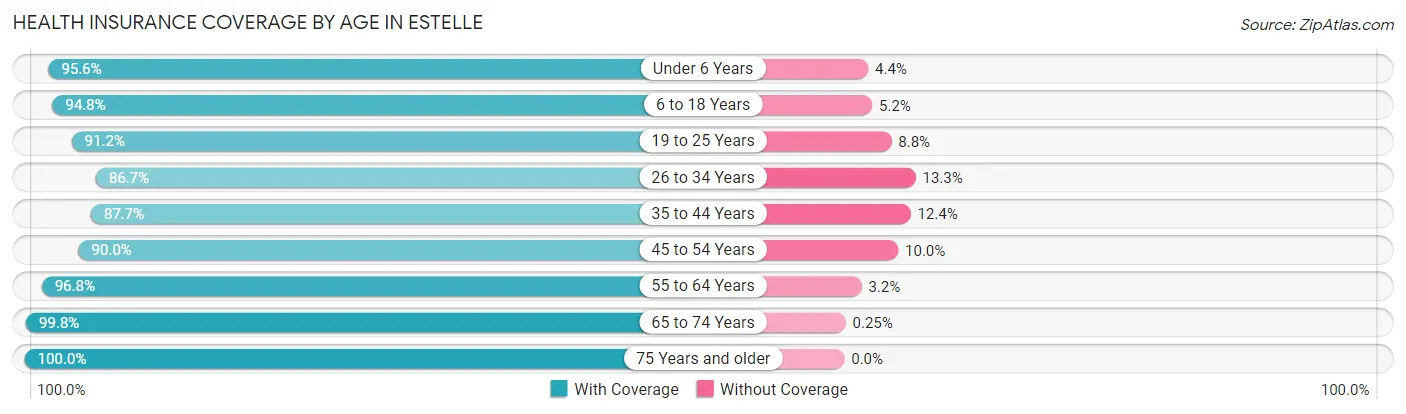
| Age Bracket | With Coverage | Without Coverage |
| Under 6 Years | 1,011 (95.6%) | 47 (4.4%) |
| 6 to 18 Years | 3,219 (94.8%) | 176 (5.2%) |
| 19 to 25 Years | 1,319 (91.2%) | 127 (8.8%) |
| 26 to 34 Years | 2,069 (86.7%) | 317 (13.3%) |
| 35 to 44 Years | 1,717 (87.6%) | 242 (12.3%) |
| 45 to 54 Years | 2,123 (90.0%) | 237 (10.0%) |
| 55 to 64 Years | 2,690 (96.8%) | 89 (3.2%) |
| 65 to 74 Years | 1,211 (99.8%) | 3 (0.3%) |
| 75 Years and older | 481 (100.0%) | 0 (0.0%) |
| Total | 15,840 (92.7%) | 1,238 (7.2%) |
Health Insurance Coverage by Citizenship Status in Estelle

| Citizenship Status | With Coverage | Without Coverage |
| Native Born | 1,011 (95.6%) | 47 (4.4%) |
| Foreign Born, Citizen | 3,219 (94.8%) | 176 (5.2%) |
| Foreign Born, not a Citizen | 1,319 (91.2%) | 127 (8.8%) |
Health Insurance Coverage by Household Income in Estelle

| Household Income | With Coverage | Without Coverage |
| Under $25,000 | 1,488 (89.4%) | 177 (10.6%) |
| $25,000 to $49,999 | 2,927 (90.6%) | 302 (9.3%) |
| $50,000 to $74,999 | 3,107 (88.5%) | 404 (11.5%) |
| $75,000 to $99,999 | 2,214 (90.5%) | 232 (9.5%) |
| $100,000 and over | 6,104 (98.0%) | 123 (2.0%) |
Public vs Private Health Insurance Coverage by Age in Estelle
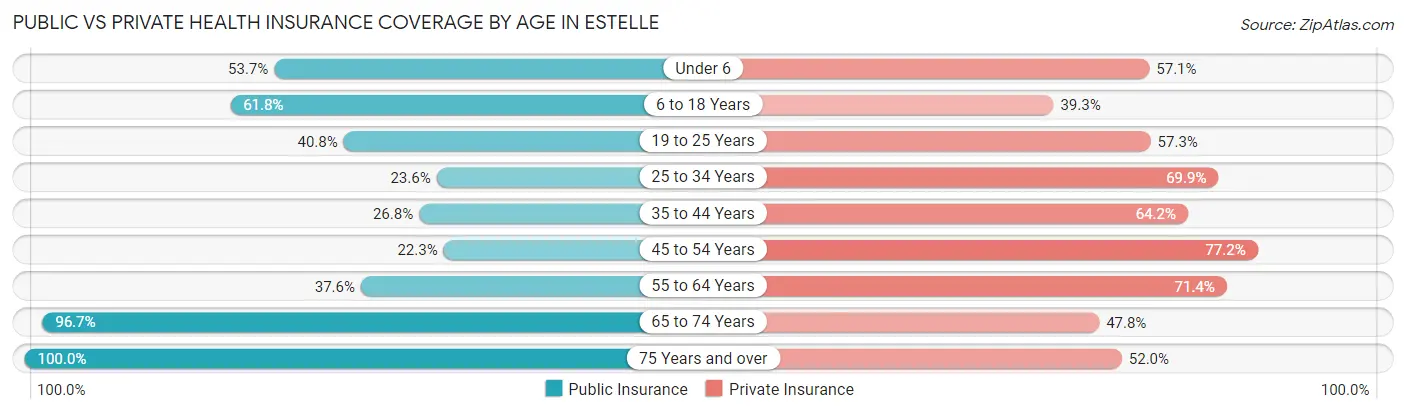
| Age Bracket | Public Insurance | Private Insurance |
| Under 6 | 568 (53.7%) | 604 (57.1%) |
| 6 to 18 Years | 2,099 (61.8%) | 1,334 (39.3%) |
| 19 to 25 Years | 590 (40.8%) | 829 (57.3%) |
| 25 to 34 Years | 562 (23.5%) | 1,667 (69.9%) |
| 35 to 44 Years | 525 (26.8%) | 1,258 (64.2%) |
| 45 to 54 Years | 525 (22.3%) | 1,821 (77.2%) |
| 55 to 64 Years | 1,045 (37.6%) | 1,985 (71.4%) |
| 65 to 74 Years | 1,174 (96.7%) | 580 (47.8%) |
| 75 Years and over | 481 (100.0%) | 250 (52.0%) |
| Total | 7,569 (44.3%) | 10,328 (60.5%) |
Disability Status by Sex by Age in Estelle
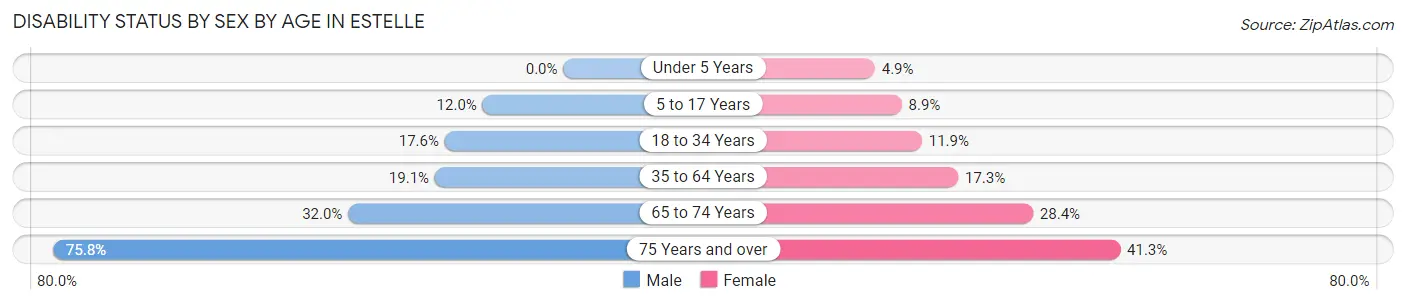
| Age Bracket | Male | Female |
| Under 5 Years | 0 (0.0%) | 21 (4.9%) |
| 5 to 17 Years | 203 (12.0%) | 136 (8.9%) |
| 18 to 34 Years | 388 (17.6%) | 239 (11.9%) |
| 35 to 64 Years | 630 (19.1%) | 655 (17.3%) |
| 65 to 74 Years | 192 (32.0%) | 174 (28.4%) |
| 75 Years and over | 216 (75.8%) | 81 (41.3%) |
Disability Class by Sex by Age in Estelle
Disability Class: Hearing Difficulty
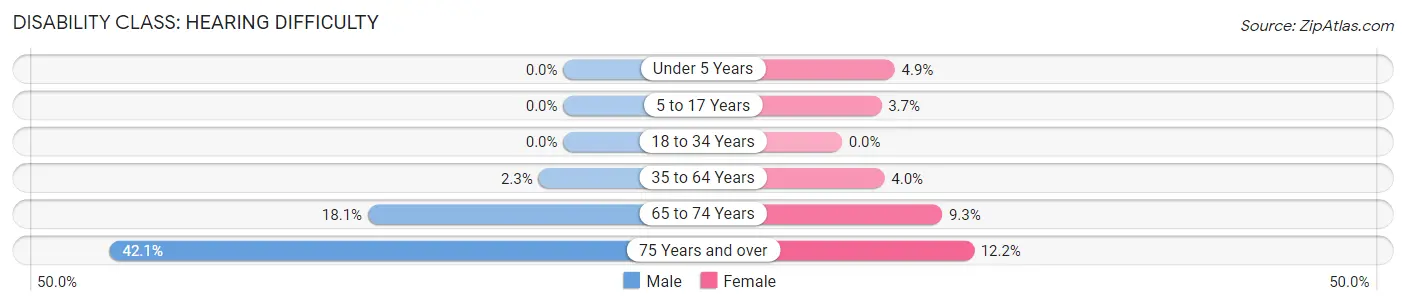
| Age Bracket | Male | Female |
| Under 5 Years | 0 (0.0%) | 21 (4.9%) |
| 5 to 17 Years | 0 (0.0%) | 56 (3.7%) |
| 18 to 34 Years | 0 (0.0%) | 0 (0.0%) |
| 35 to 64 Years | 76 (2.3%) | 150 (4.0%) |
| 65 to 74 Years | 109 (18.1%) | 57 (9.3%) |
| 75 Years and over | 120 (42.1%) | 24 (12.2%) |
Disability Class: Vision Difficulty
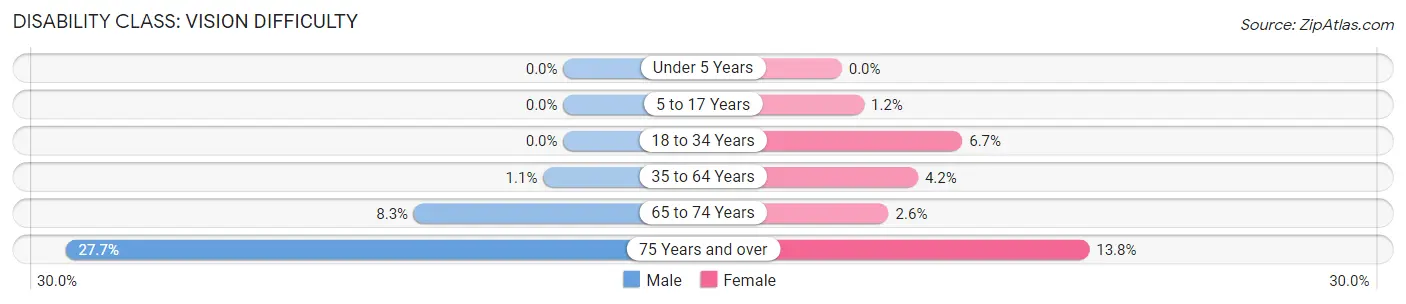
| Age Bracket | Male | Female |
| Under 5 Years | 0 (0.0%) | 0 (0.0%) |
| 5 to 17 Years | 0 (0.0%) | 19 (1.2%) |
| 18 to 34 Years | 0 (0.0%) | 135 (6.7%) |
| 35 to 64 Years | 37 (1.1%) | 161 (4.2%) |
| 65 to 74 Years | 50 (8.3%) | 16 (2.6%) |
| 75 Years and over | 79 (27.7%) | 27 (13.8%) |
Disability Class: Cognitive Difficulty
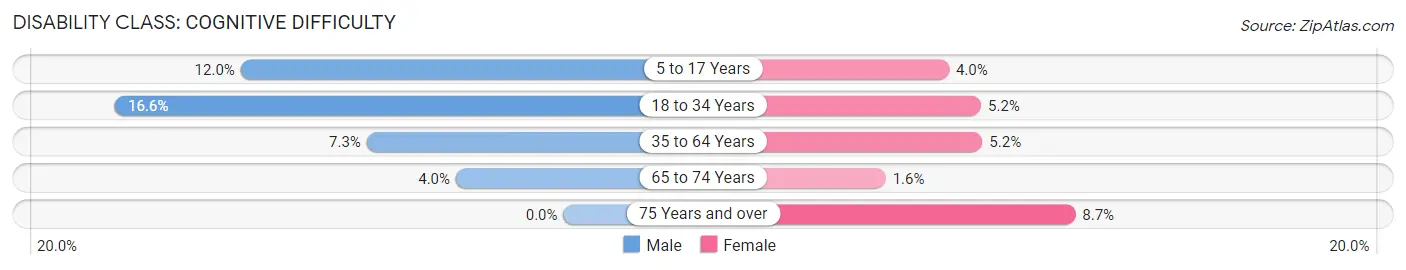
| Age Bracket | Male | Female |
| 5 to 17 Years | 203 (12.0%) | 61 (4.0%) |
| 18 to 34 Years | 367 (16.6%) | 104 (5.2%) |
| 35 to 64 Years | 241 (7.3%) | 198 (5.2%) |
| 65 to 74 Years | 24 (4.0%) | 10 (1.6%) |
| 75 Years and over | 0 (0.0%) | 17 (8.7%) |
Disability Class: Ambulatory Difficulty
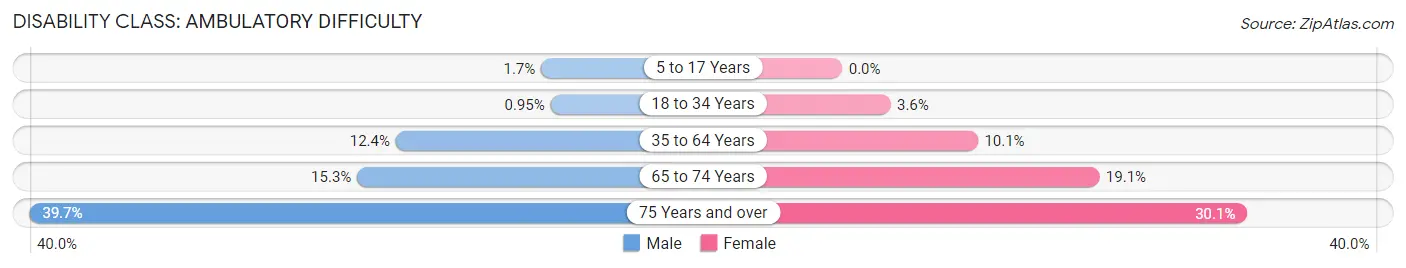
| Age Bracket | Male | Female |
| 5 to 17 Years | 28 (1.7%) | 0 (0.0%) |
| 18 to 34 Years | 21 (0.9%) | 72 (3.6%) |
| 35 to 64 Years | 411 (12.4%) | 382 (10.1%) |
| 65 to 74 Years | 92 (15.3%) | 117 (19.1%) |
| 75 Years and over | 113 (39.7%) | 59 (30.1%) |
Disability Class: Self-Care Difficulty

| Age Bracket | Male | Female |
| 5 to 17 Years | 49 (2.9%) | 0 (0.0%) |
| 18 to 34 Years | 0 (0.0%) | 0 (0.0%) |
| 35 to 64 Years | 195 (5.9%) | 156 (4.1%) |
| 65 to 74 Years | 8 (1.3%) | 3 (0.5%) |
| 75 Years and over | 44 (15.4%) | 0 (0.0%) |
Technology Access in Estelle
Computing Device Access in Estelle
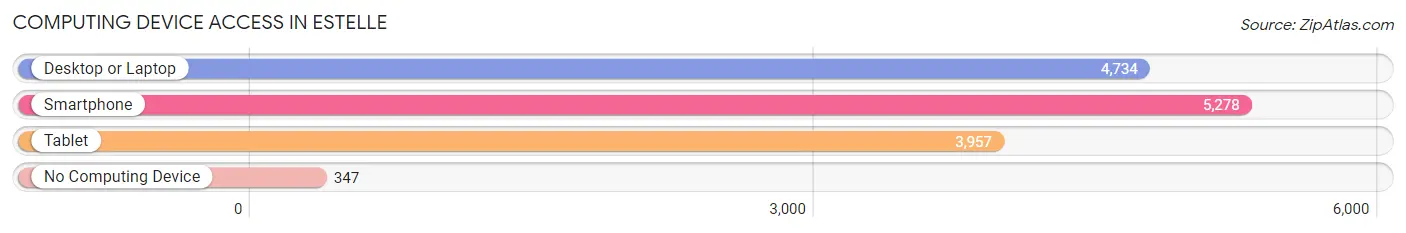
| Device Type | # Households | % Households |
| Desktop or Laptop | 4,734 | 80.5% |
| Smartphone | 5,278 | 89.8% |
| Tablet | 3,957 | 67.3% |
| No Computing Device | 347 | 5.9% |
| Total | 5,878 | 100.0% |
Internet Access in Estelle
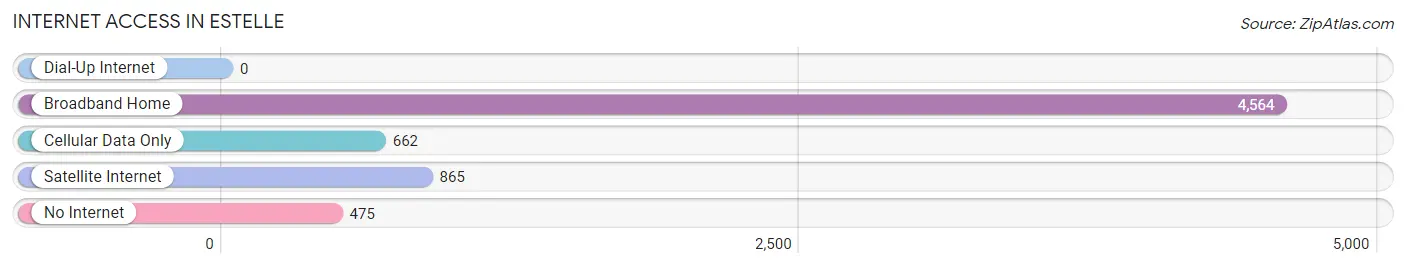
| Internet Type | # Households | % Households |
| Dial-Up Internet | 0 | 0.0% |
| Broadband Home | 4,564 | 77.6% |
| Cellular Data Only | 662 | 11.3% |
| Satellite Internet | 865 | 14.7% |
| No Internet | 475 | 8.1% |
| Total | 5,878 | 100.0% |
Estelle Summary
Estelle is a small city located in St. Charles Parish, Louisiana. It is situated on the banks of the Mississippi River, about 25 miles west of New Orleans. Estelle has a population of approximately 4,000 people and is part of the Greater New Orleans Metropolitan Area.
History
Estelle was founded in 1883 by the Estelle Land and Improvement Company. The company was formed by a group of investors from New Orleans who wanted to develop the area for agricultural and industrial purposes. The town was named after Estelle, the daughter of one of the investors.
The town grew quickly and by the early 1900s, it had become a thriving agricultural center. The town was home to several cotton gins, a sugar mill, and a sawmill. The town also had a railroad station, which connected it to New Orleans and other nearby towns.
In the 1920s, Estelle experienced a period of growth and prosperity. The town was home to several businesses, including a bank, a hotel, and a movie theater. The town also had a public library and a hospital.
In the 1950s, Estelle began to decline. The railroad station closed and many of the businesses moved away. The town’s population decreased and the economy suffered.
In the late 1970s, Estelle began to experience a revival. The town was designated as a historic district and several of the old buildings were restored. The town also began to attract new businesses and residents.
Geography
Estelle is located in St. Charles Parish, Louisiana. It is situated on the banks of the Mississippi River, about 25 miles west of New Orleans. The town is located in a flat, low-lying area and is surrounded by swamps and marshlands.
The climate in Estelle is humid and subtropical. The average temperature in the summer is around 90 degrees Fahrenheit and the average temperature in the winter is around 50 degrees Fahrenheit.
Economy
Estelle’s economy is largely based on agriculture and tourism. The town is home to several farms that produce a variety of crops, including cotton, corn, soybeans, and sugar cane. The town also has several restaurants, hotels, and other businesses that cater to tourists.
Demographics
As of the 2010 census, Estelle had a population of 4,000 people. The racial makeup of the town was 79.3% White, 17.2% African American, 0.7% Native American, 0.3% Asian, and 2.5% from other races. The median household income was $37,500 and the median family income was $45,000.
Estelle is a small town with a rich history and a bright future. The town has experienced a period of growth and prosperity in recent years and is home to a diverse population. Estelle is a great place to live, work, and visit.
Common Questions
What is Per Capita Income in Estelle?
Per Capita income in Estelle is $28,056.
What is the Median Family Income in Estelle?
Median Family Income in Estelle is $78,351.
What is the Median Household income in Estelle?
Median Household Income in Estelle is $73,756.
What is Income or Wage Gap in Estelle?
Income or Wage Gap in Estelle is 41.7%.
Women in Estelle earn 58.3 cents for every dollar earned by a man.
What is Family Income Deficit in Estelle?
Family Income Deficit in Estelle is $12,002.
Families that are below poverty line in Estelle earn $12,002 less on average than the poverty threshold level.
What is Inequality or Gini Index in Estelle?
Inequality or Gini Index in Estelle is 0.37.
What is the Total Population of Estelle?
Total Population of Estelle is 17,091.
What is the Total Male Population of Estelle?
Total Male Population of Estelle is 8,515.
What is the Total Female Population of Estelle?
Total Female Population of Estelle is 8,576.
What is the Ratio of Males per 100 Females in Estelle?
There are 99.29 Males per 100 Females in Estelle.
What is the Ratio of Females per 100 Males in Estelle?
There are 100.72 Females per 100 Males in Estelle.
What is the Median Population Age in Estelle?
Median Population Age in Estelle is 36.8 Years.
What is the Average Family Size in Estelle
Average Family Size in Estelle is 3.3 People.
What is the Average Household Size in Estelle
Average Household Size in Estelle is 2.9 People.
How Large is the Labor Force in Estelle?
There are 9,414 People in the Labor Forcein in Estelle.
What is the Percentage of People in the Labor Force in Estelle?
69.0% of People are in the Labor Force in Estelle.
What is the Unemployment Rate in Estelle?
Unemployment Rate in Estelle is 6.4%.