Gretna, LA Map & Demographics
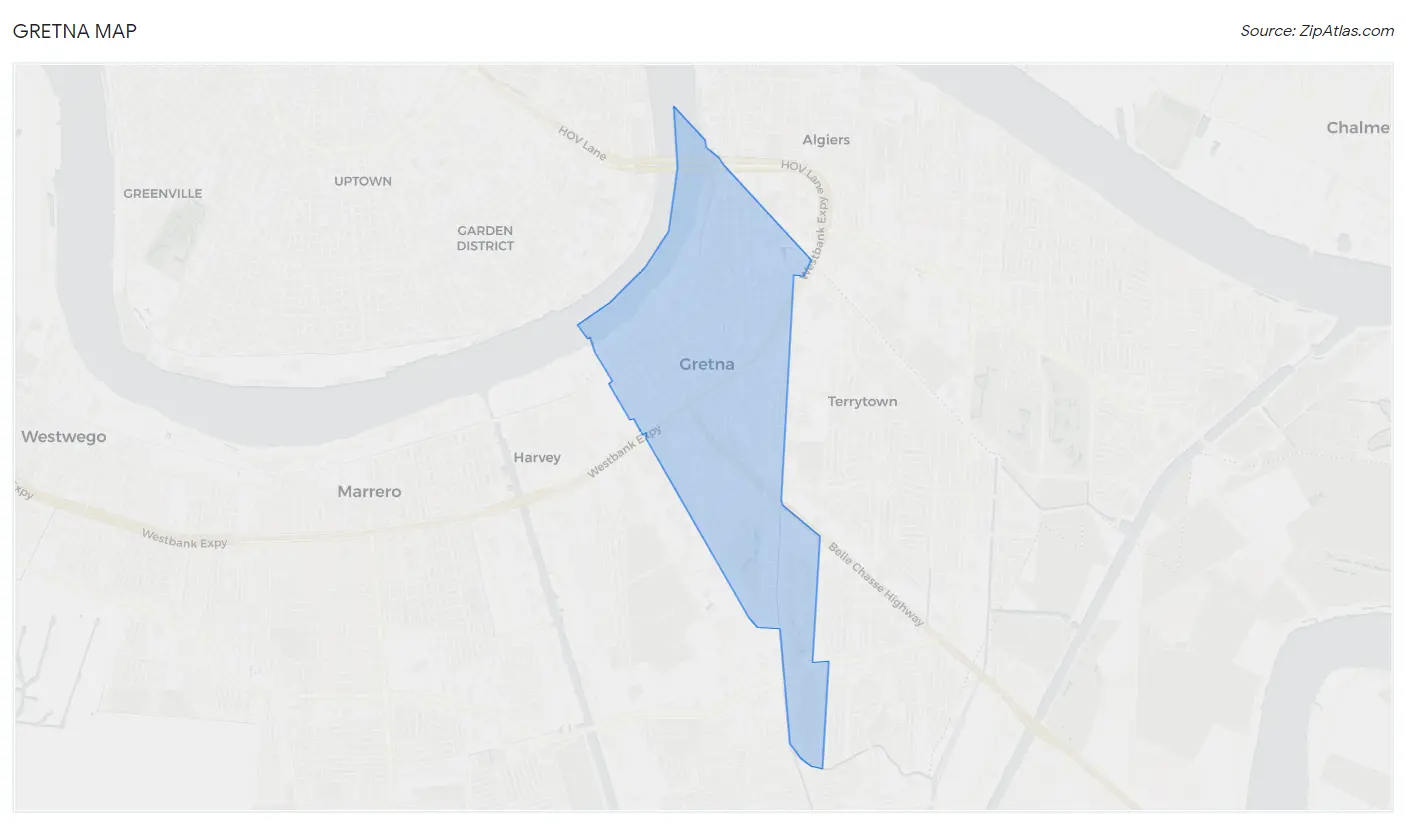
Gretna Map
Gretna Overview
$29,772
PER CAPITA INCOME
$64,424
AVG FAMILY INCOME
$47,010
AVG HOUSEHOLD INCOME
0.9%
WAGE / INCOME GAP [ % ]
99.1¢/ $1
WAGE / INCOME GAP [ $ ]
$12,087
FAMILY INCOME DEFICIT
0.52
INEQUALITY / GINI INDEX
17,640
TOTAL POPULATION
8,905
MALE POPULATION
8,735
FEMALE POPULATION
101.95
MALES / 100 FEMALES
98.09
FEMALES / 100 MALES
39.0
MEDIAN AGE
2.9
AVG FAMILY SIZE
2.2
AVG HOUSEHOLD SIZE
8,363
LABOR FORCE [ PEOPLE ]
58.3%
PERCENT IN LABOR FORCE
6.9%
UNEMPLOYMENT RATE
Gretna Area Codes
Income in Gretna
Income Overview in Gretna
Per Capita Income in Gretna is $29,772, while median incomes of families and households are $64,424 and $47,010 respectively.
| Characteristic | Number | Measure |
| Per Capita Income | 17,640 | $29,772 |
| Median Family Income | 3,936 | $64,424 |
| Mean Family Income | 3,936 | $90,103 |
| Median Household Income | 7,678 | $47,010 |
| Mean Household Income | 7,678 | $67,111 |
| Income Deficit | 3,936 | $12,087 |
| Wage / Income Gap (%) | 17,640 | 0.87% |
| Wage / Income Gap ($) | 17,640 | 99.13¢ per $1 |
| Gini / Inequality Index | 17,640 | 0.52 |
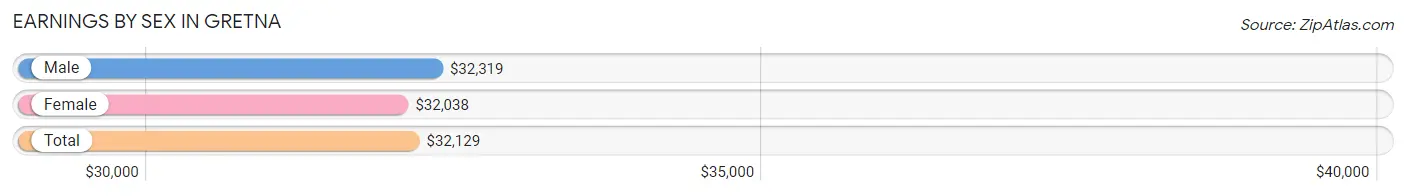
Earnings by Sex in Gretna
Average Earnings in Gretna are $32,129, $32,319 for men and $32,038 for women, a difference of 0.9%.
| Sex | Number | Average Earnings |
| Male | 4,908 (54.6%) | $32,319 |
| Female | 4,078 (45.4%) | $32,038 |
| Total | 8,986 (100.0%) | $32,129 |
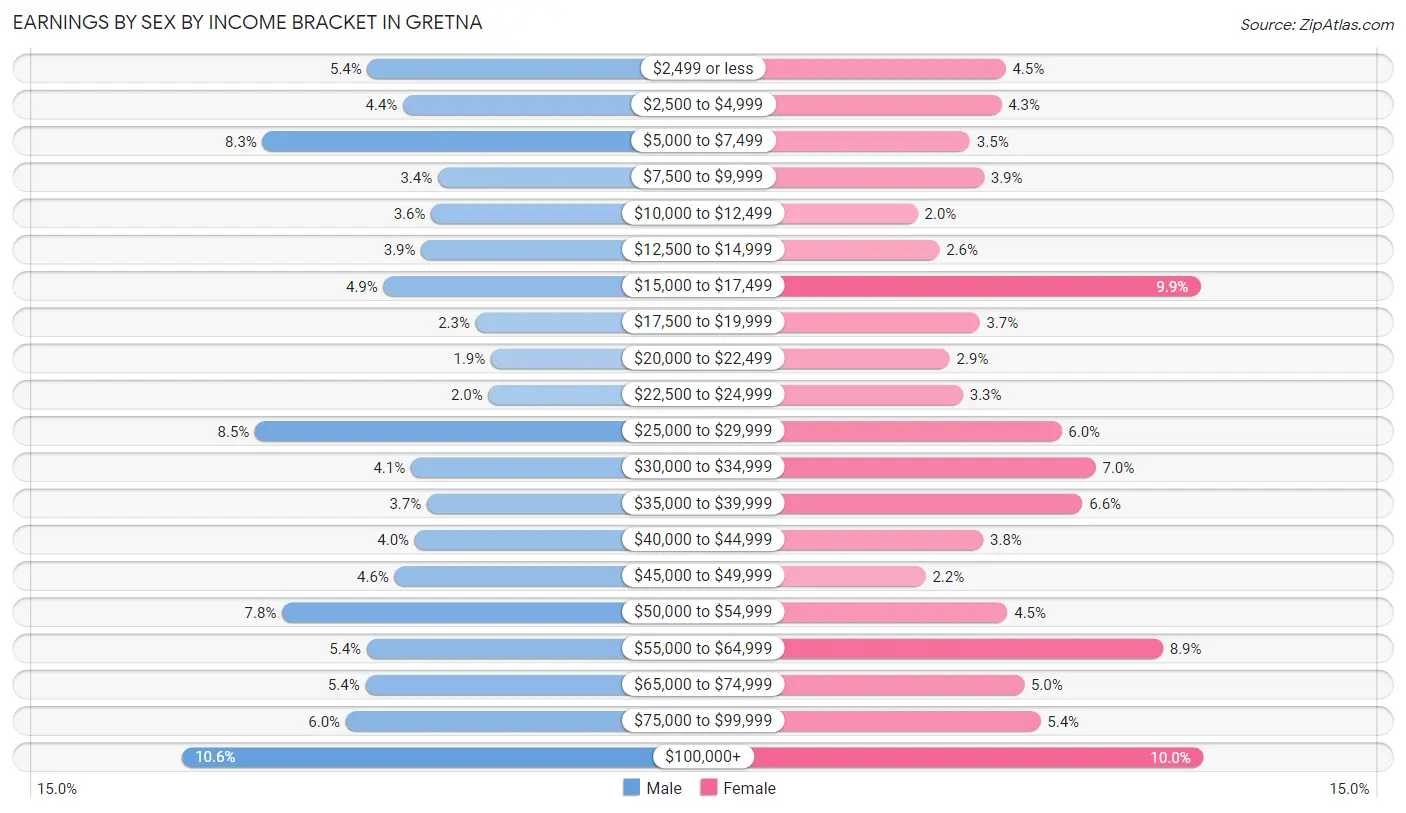
Earnings by Sex by Income Bracket in Gretna
The most common earnings brackets in Gretna are $100,000+ for men (519 | 10.6%) and $100,000+ for women (408 | 10.0%).
| Income | Male | Female |
| $2,499 or less | 263 (5.4%) | 182 (4.5%) |
| $2,500 to $4,999 | 214 (4.4%) | 177 (4.3%) |
| $5,000 to $7,499 | 408 (8.3%) | 141 (3.5%) |
| $7,500 to $9,999 | 166 (3.4%) | 157 (3.8%) |
| $10,000 to $12,499 | 175 (3.6%) | 81 (2.0%) |
| $12,500 to $14,999 | 189 (3.8%) | 106 (2.6%) |
| $15,000 to $17,499 | 241 (4.9%) | 405 (9.9%) |
| $17,500 to $19,999 | 114 (2.3%) | 152 (3.7%) |
| $20,000 to $22,499 | 93 (1.9%) | 118 (2.9%) |
| $22,500 to $24,999 | 96 (2.0%) | 133 (3.3%) |
| $25,000 to $29,999 | 418 (8.5%) | 246 (6.0%) |
| $30,000 to $34,999 | 203 (4.1%) | 285 (7.0%) |
| $35,000 to $39,999 | 181 (3.7%) | 270 (6.6%) |
| $40,000 to $44,999 | 198 (4.0%) | 156 (3.8%) |
| $45,000 to $49,999 | 226 (4.6%) | 90 (2.2%) |
| $50,000 to $54,999 | 381 (7.8%) | 184 (4.5%) |
| $55,000 to $64,999 | 264 (5.4%) | 362 (8.9%) |
| $65,000 to $74,999 | 266 (5.4%) | 203 (5.0%) |
| $75,000 to $99,999 | 293 (6.0%) | 222 (5.4%) |
| $100,000+ | 519 (10.6%) | 408 (10.0%) |
| Total | 4,908 (100.0%) | 4,078 (100.0%) |
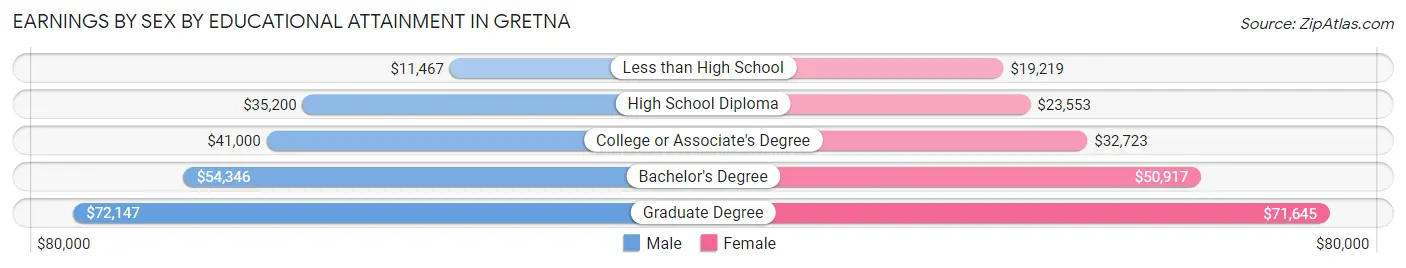
Earnings by Sex by Educational Attainment in Gretna
Average earnings in Gretna are $37,560 for men and $36,106 for women, a difference of 3.9%. Men with an educational attainment of graduate degree enjoy the highest average annual earnings of $72,147, while those with less than high school education earn the least with $11,467. Women with an educational attainment of graduate degree earn the most with the average annual earnings of $71,645, while those with less than high school education have the smallest earnings of $19,219.
| Educational Attainment | Male Income | Female Income |
| Less than High School | $11,467 | $19,219 |
| High School Diploma | $35,200 | $23,553 |
| College or Associate's Degree | $41,000 | $32,723 |
| Bachelor's Degree | $54,346 | $50,917 |
| Graduate Degree | $72,147 | $71,645 |
| Total | $37,560 | $36,106 |
Family Income in Gretna
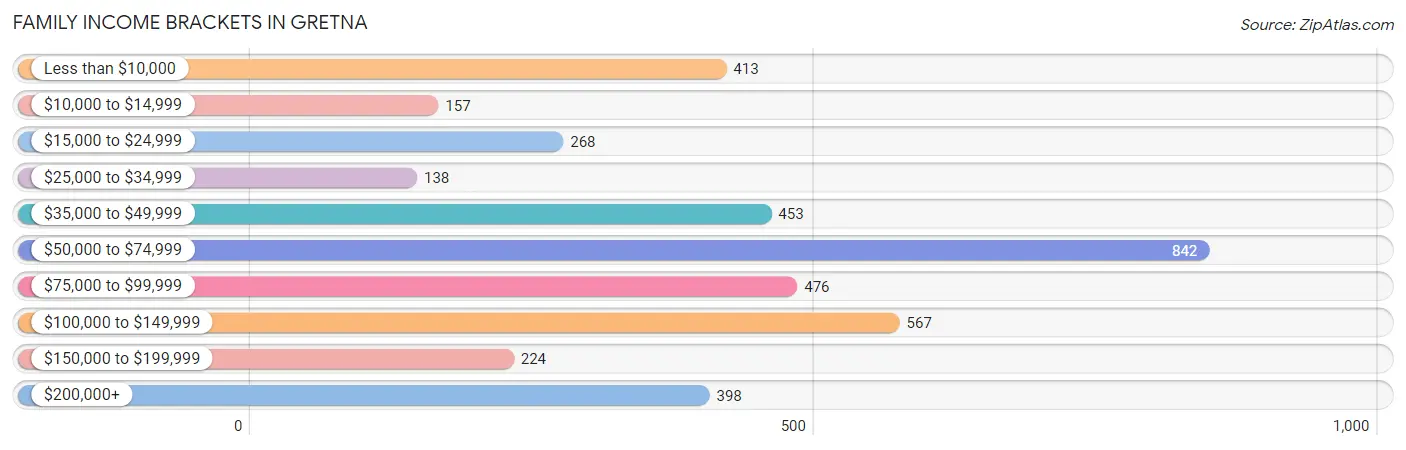
Family Income Brackets in Gretna
According to the Gretna family income data, there are 842 families falling into the $50,000 to $74,999 income range, which is the most common income bracket and makes up 21.4% of all families. Conversely, the $25,000 to $34,999 income bracket is the least frequent group with only 138 families (3.5%) belonging to this category.
| Income Bracket | # Families | % Families |
| Less than $10,000 | 413 | 10.5% |
| $10,000 to $14,999 | 157 | 4.0% |
| $15,000 to $24,999 | 268 | 6.8% |
| $25,000 to $34,999 | 138 | 3.5% |
| $35,000 to $49,999 | 453 | 11.5% |
| $50,000 to $74,999 | 842 | 21.4% |
| $75,000 to $99,999 | 476 | 12.1% |
| $100,000 to $149,999 | 567 | 14.4% |
| $150,000 to $199,999 | 224 | 5.7% |
| $200,000+ | 398 | 10.1% |
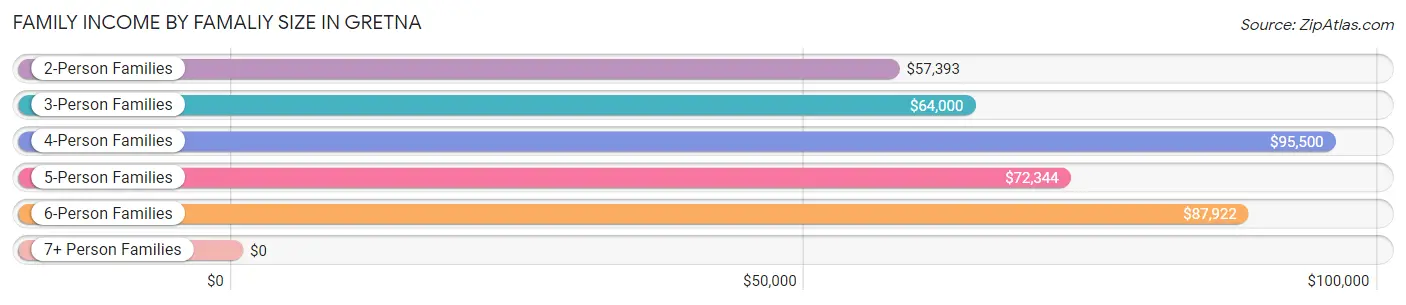
Family Income by Famaliy Size in Gretna
4-person families (580 | 14.7%) account for the highest median family income in Gretna with $95,500 per family, while 2-person families (1,917 | 48.7%) have the highest median income of $28,696 per family member.
| Income Bracket | # Families | Median Income |
| 2-Person Families | 1,917 (48.7%) | $57,393 |
| 3-Person Families | 1,004 (25.5%) | $64,000 |
| 4-Person Families | 580 (14.7%) | $95,500 |
| 5-Person Families | 275 (7.0%) | $72,344 |
| 6-Person Families | 140 (3.6%) | $87,922 |
| 7+ Person Families | 20 (0.5%) | $0 |
| Total | 3,936 (100.0%) | $64,424 |
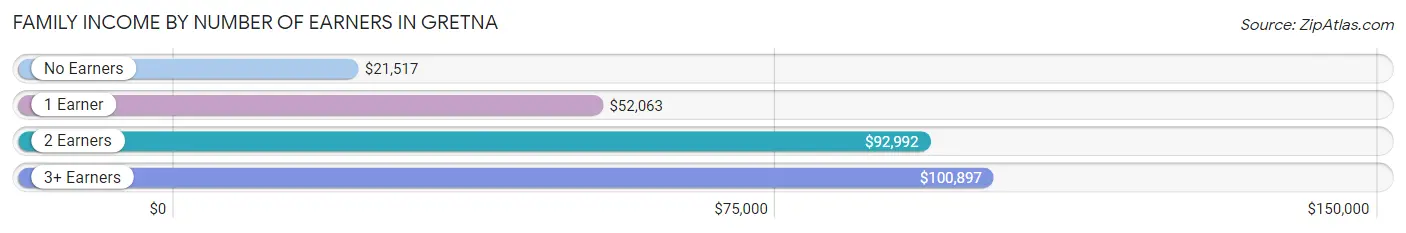
Family Income by Number of Earners in Gretna
The median family income in Gretna is $64,424, with families comprising 3+ earners (387) having the highest median family income of $100,897, while families with no earners (645) have the lowest median family income of $21,517, accounting for 9.8% and 16.4% of families, respectively.
| Number of Earners | # Families | Median Income |
| No Earners | 645 (16.4%) | $21,517 |
| 1 Earner | 1,564 (39.7%) | $52,063 |
| 2 Earners | 1,340 (34.0%) | $92,992 |
| 3+ Earners | 387 (9.8%) | $100,897 |
| Total | 3,936 (100.0%) | $64,424 |
Household Income in Gretna
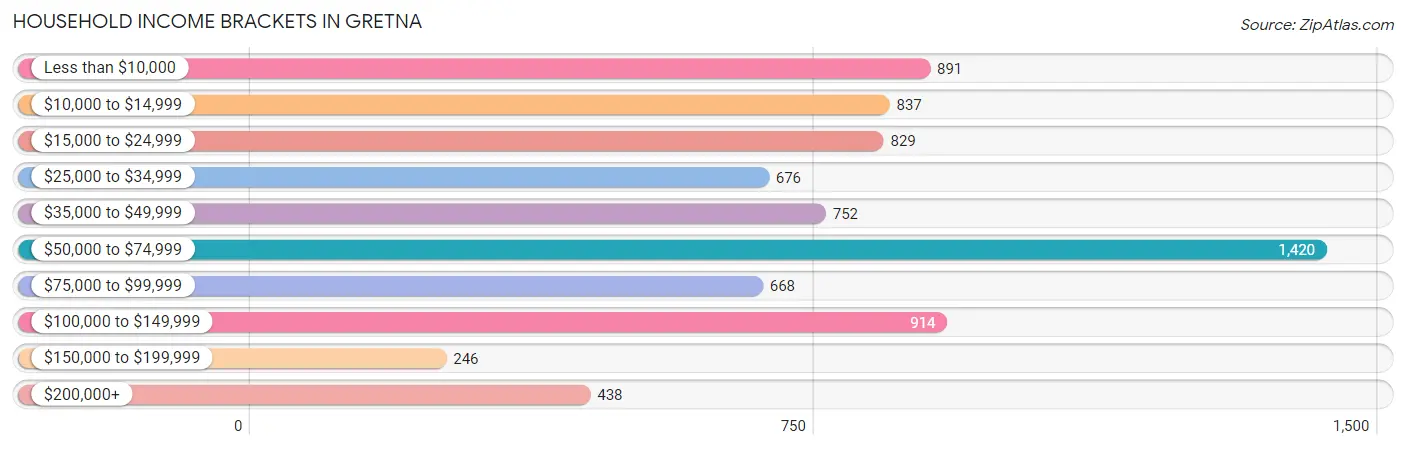
Household Income Brackets in Gretna
With 1,420 households falling in the category, the $50,000 to $74,999 income range is the most frequent in Gretna, accounting for 18.5% of all households. In contrast, only 246 households (3.2%) fall into the $150,000 to $199,999 income bracket, making it the least populous group.
| Income Bracket | # Households | % Households |
| Less than $10,000 | 891 | 11.6% |
| $10,000 to $14,999 | 837 | 10.9% |
| $15,000 to $24,999 | 829 | 10.8% |
| $25,000 to $34,999 | 676 | 8.8% |
| $35,000 to $49,999 | 752 | 9.8% |
| $50,000 to $74,999 | 1,420 | 18.5% |
| $75,000 to $99,999 | 668 | 8.7% |
| $100,000 to $149,999 | 914 | 11.9% |
| $150,000 to $199,999 | 246 | 3.2% |
| $200,000+ | 438 | 5.7% |
Household Income by Householder Age in Gretna
The median household income in Gretna is $47,010, with the highest median household income of $55,750 found in the 25 to 44 years age bracket for the primary householder. A total of 2,619 households (34.1%) fall into this category. Meanwhile, the 15 to 24 years age bracket for the primary householder has the lowest median household income of $0, with 267 households (3.5%) in this group.
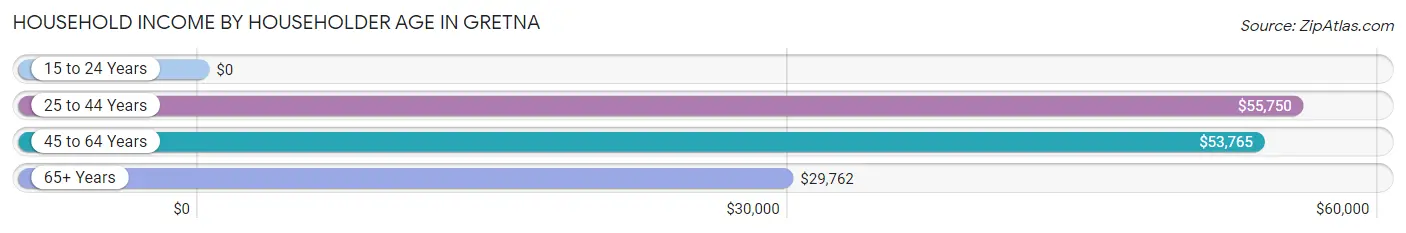
| Income Bracket | # Households | Median Income |
| 15 to 24 Years | 267 (3.5%) | $0 |
| 25 to 44 Years | 2,619 (34.1%) | $55,750 |
| 45 to 64 Years | 2,815 (36.7%) | $53,765 |
| 65+ Years | 1,977 (25.8%) | $29,762 |
| Total | 7,678 (100.0%) | $47,010 |
Poverty in Gretna
Income Below Poverty by Sex and Age in Gretna
With 26.8% poverty level for males and 23.8% for females among the residents of Gretna, 5 year old males and 15 year old females are the most vulnerable to poverty, with 125 males (71.8%) and 81 females (56.6%) in their respective age groups living below the poverty level.
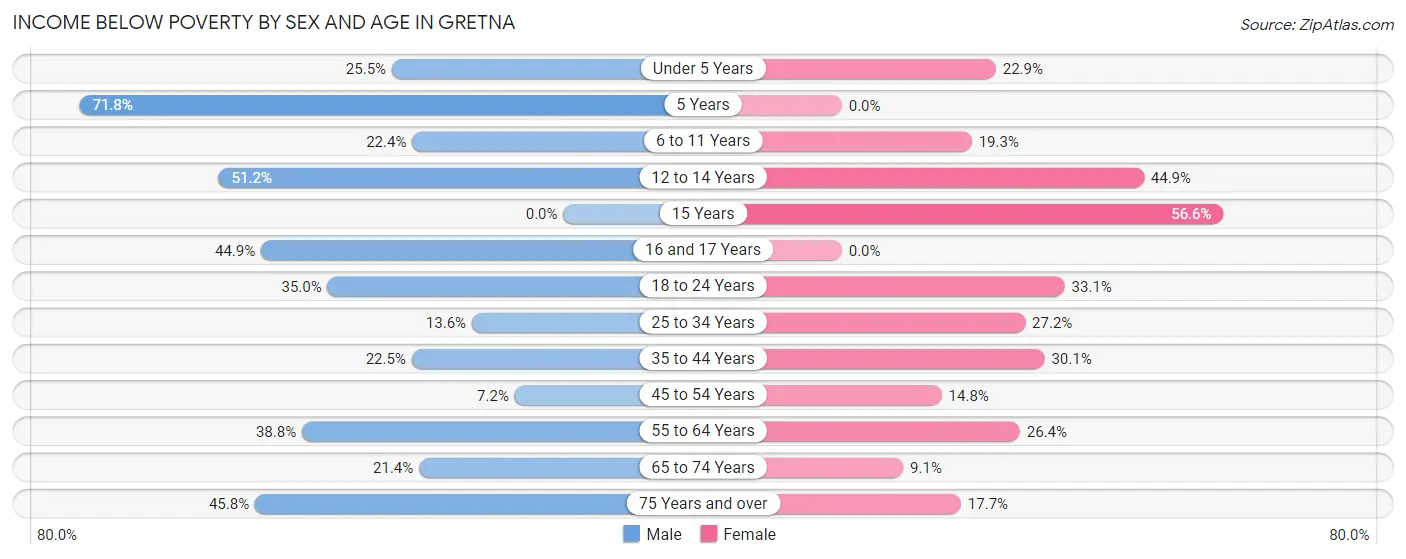
| Age Bracket | Male | Female |
| Under 5 Years | 139 (25.5%) | 113 (22.9%) |
| 5 Years | 125 (71.8%) | 0 (0.0%) |
| 6 to 11 Years | 162 (22.4%) | 104 (19.3%) |
| 12 to 14 Years | 65 (51.2%) | 183 (44.9%) |
| 15 Years | 0 (0.0%) | 81 (56.6%) |
| 16 and 17 Years | 79 (44.9%) | 0 (0.0%) |
| 18 to 24 Years | 222 (35.0%) | 178 (33.1%) |
| 25 to 34 Years | 142 (13.6%) | 339 (27.2%) |
| 35 to 44 Years | 257 (22.5%) | 378 (30.1%) |
| 45 to 54 Years | 70 (7.2%) | 136 (14.8%) |
| 55 to 64 Years | 520 (38.8%) | 303 (26.4%) |
| 65 to 74 Years | 124 (21.4%) | 85 (9.1%) |
| 75 Years and over | 239 (45.8%) | 124 (17.7%) |
| Total | 2,144 (26.8%) | 2,024 (23.8%) |
Income Above Poverty by Sex and Age in Gretna
According to the poverty statistics in Gretna, males aged 15 years and females aged 5 years are the age groups that are most secure financially, with 100.0% of males and 100.0% of females in these age groups living above the poverty line.
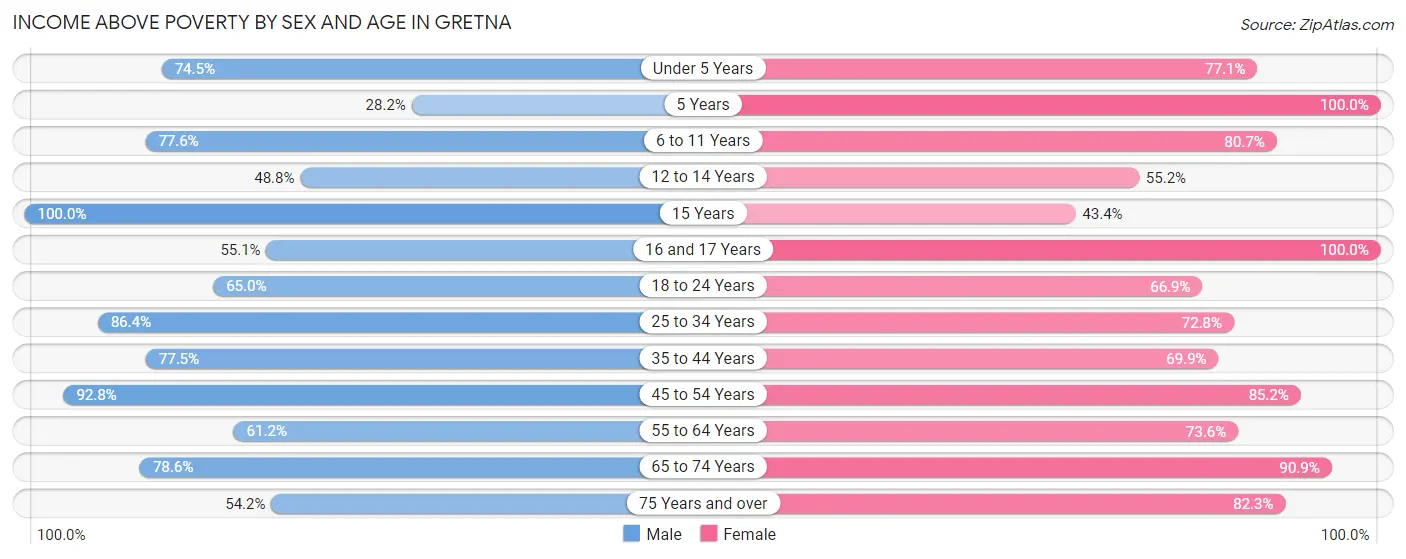
| Age Bracket | Male | Female |
| Under 5 Years | 407 (74.5%) | 381 (77.1%) |
| 5 Years | 49 (28.2%) | 29 (100.0%) |
| 6 to 11 Years | 560 (77.6%) | 435 (80.7%) |
| 12 to 14 Years | 62 (48.8%) | 225 (55.1%) |
| 15 Years | 33 (100.0%) | 62 (43.4%) |
| 16 and 17 Years | 97 (55.1%) | 169 (100.0%) |
| 18 to 24 Years | 412 (65.0%) | 360 (66.9%) |
| 25 to 34 Years | 904 (86.4%) | 906 (72.8%) |
| 35 to 44 Years | 884 (77.5%) | 878 (69.9%) |
| 45 to 54 Years | 899 (92.8%) | 781 (85.2%) |
| 55 to 64 Years | 820 (61.2%) | 843 (73.6%) |
| 65 to 74 Years | 455 (78.6%) | 848 (90.9%) |
| 75 Years and over | 283 (54.2%) | 577 (82.3%) |
| Total | 5,865 (73.2%) | 6,494 (76.2%) |
Income Below Poverty Among Married-Couple Families in Gretna
The poverty statistics for married-couple families in Gretna show that 8.3% or 170 of the total 2,052 families live below the poverty line. Families with 3 or 4 children have the highest poverty rate of 10.5%, comprising of 20 families. On the other hand, families with no children have the lowest poverty rate of 7.0%, which includes 79 families.
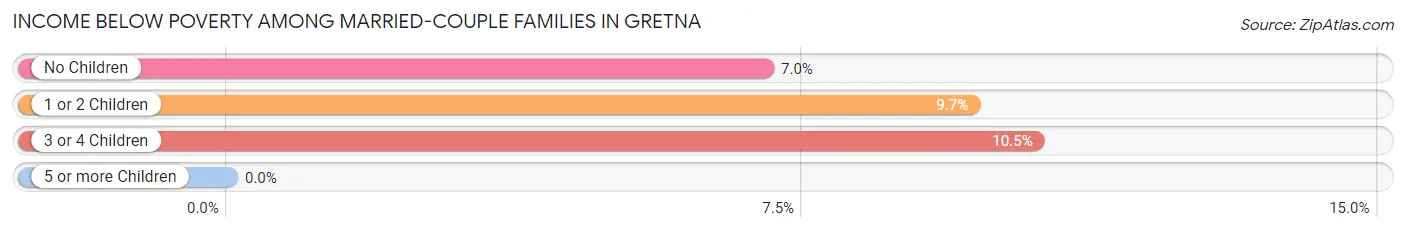
| Children | Above Poverty | Below Poverty |
| No Children | 1,050 (93.0%) | 79 (7.0%) |
| 1 or 2 Children | 662 (90.3%) | 71 (9.7%) |
| 3 or 4 Children | 170 (89.5%) | 20 (10.5%) |
| 5 or more Children | 0 (0.0%) | 0 (0.0%) |
| Total | 1,882 (91.7%) | 170 (8.3%) |
Income Below Poverty Among Single-Parent Households in Gretna
According to the poverty data in Gretna, 28.7% or 127 single-father households and 32.1% or 463 single-mother households are living below the poverty line. Among single-father households, those with no children have the highest poverty rate, with 60 households (37.7%) experiencing poverty. Likewise, among single-mother households, those with 1 or 2 children have the highest poverty rate, with 376 households (45.4%) falling below the poverty line.

| Children | Single Father | Single Mother |
| No Children | 60 (37.7%) | 50 (10.0%) |
| 1 or 2 Children | 44 (21.6%) | 376 (45.4%) |
| 3 or 4 Children | 23 (28.7%) | 37 (32.5%) |
| 5 or more Children | 0 (0.0%) | 0 (0.0%) |
| Total | 127 (28.7%) | 463 (32.1%) |
Income Below Poverty Among Married-Couple vs Single-Parent Households in Gretna
The poverty data for Gretna shows that 170 of the married-couple family households (8.3%) and 590 of the single-parent households (31.3%) are living below the poverty level. Within the married-couple family households, those with 3 or 4 children have the highest poverty rate, with 20 households (10.5%) falling below the poverty line. Among the single-parent households, those with 1 or 2 children have the highest poverty rate, with 420 household (40.7%) living below poverty.
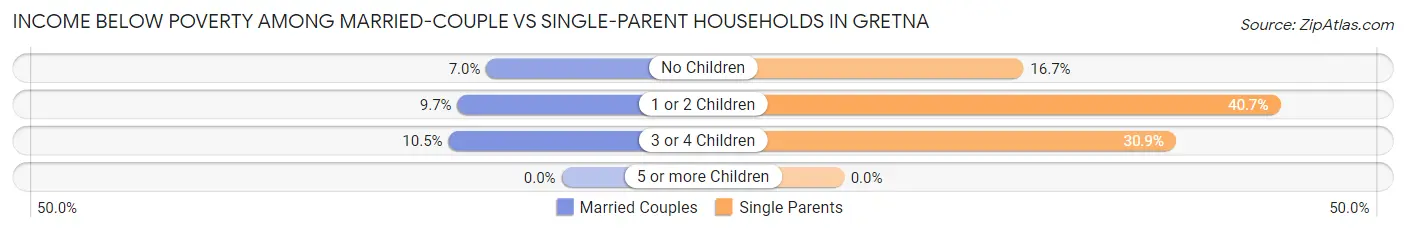
| Children | Married-Couple Families | Single-Parent Households |
| No Children | 79 (7.0%) | 110 (16.7%) |
| 1 or 2 Children | 71 (9.7%) | 420 (40.7%) |
| 3 or 4 Children | 20 (10.5%) | 60 (30.9%) |
| 5 or more Children | 0 (0.0%) | 0 (0.0%) |
| Total | 170 (8.3%) | 590 (31.3%) |
Race in Gretna
The most populous races in Gretna are White / Caucasian (8,193 | 46.5%), Black / African American (5,262 | 29.8%), and Hispanic or Latino (3,965 | 22.5%).
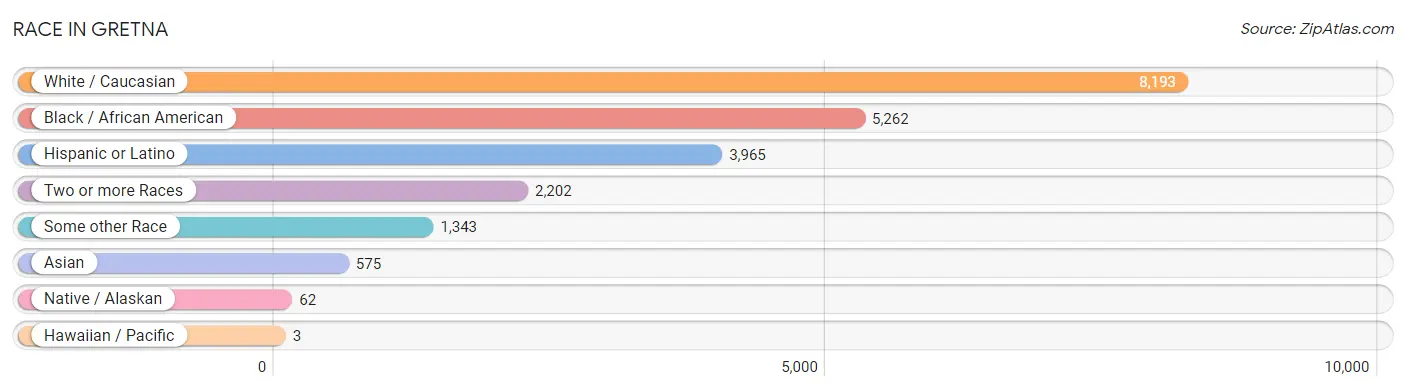
| Race | # Population | % Population |
| Asian | 575 | 3.3% |
| Black / African American | 5,262 | 29.8% |
| Hawaiian / Pacific | 3 | 0.0% |
| Hispanic or Latino | 3,965 | 22.5% |
| Native / Alaskan | 62 | 0.4% |
| White / Caucasian | 8,193 | 46.5% |
| Two or more Races | 2,202 | 12.5% |
| Some other Race | 1,343 | 7.6% |
| Total | 17,640 | 100.0% |
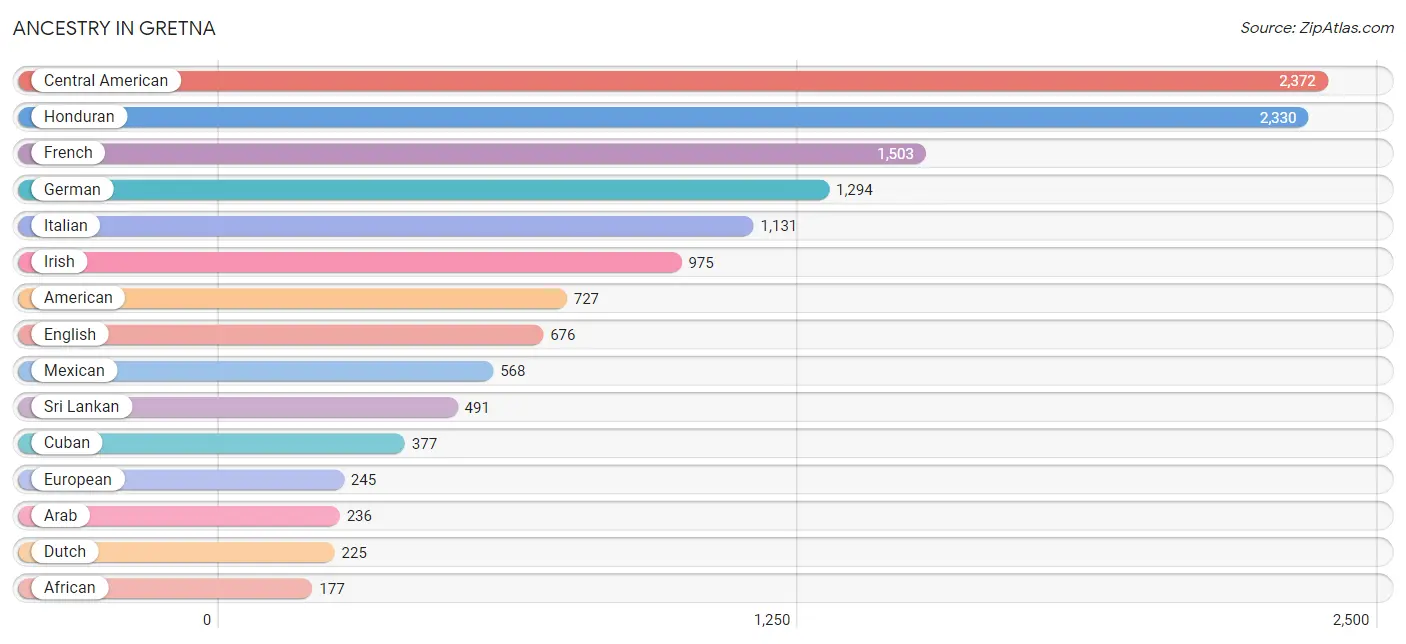
Ancestry in Gretna
The most populous ancestries reported in Gretna are Central American (2,372 | 13.5%), Honduran (2,330 | 13.2%), French (1,503 | 8.5%), German (1,294 | 7.3%), and Italian (1,131 | 6.4%), together accounting for 48.9% of all Gretna residents.
| Ancestry | # Population | % Population |
| African | 177 | 1.0% |
| American | 727 | 4.1% |
| Apache | 8 | 0.1% |
| Arab | 236 | 1.3% |
| Austrian | 3 | 0.0% |
| Basque | 28 | 0.2% |
| Blackfeet | 10 | 0.1% |
| British | 69 | 0.4% |
| Cajun | 73 | 0.4% |
| Cambodian | 8 | 0.1% |
| Central American | 2,372 | 13.5% |
| Central American Indian | 6 | 0.0% |
| Cherokee | 27 | 0.2% |
| Colombian | 41 | 0.2% |
| Cuban | 377 | 2.1% |
| Czech | 7 | 0.0% |
| Czechoslovakian | 31 | 0.2% |
| Danish | 9 | 0.1% |
| Dominican | 106 | 0.6% |
| Dutch | 225 | 1.3% |
| Ecuadorian | 1 | 0.0% |
| Egyptian | 6 | 0.0% |
| English | 676 | 3.8% |
| European | 245 | 1.4% |
| Finnish | 6 | 0.0% |
| French | 1,503 | 8.5% |
| French Canadian | 162 | 0.9% |
| German | 1,294 | 7.3% |
| Greek | 63 | 0.4% |
| Guatemalan | 17 | 0.1% |
| Honduran | 2,330 | 13.2% |
| Houma | 24 | 0.1% |
| Hungarian | 20 | 0.1% |
| Indian (Asian) | 70 | 0.4% |
| Irish | 975 | 5.5% |
| Italian | 1,131 | 6.4% |
| Korean | 78 | 0.4% |
| Lebanese | 33 | 0.2% |
| Mexican | 568 | 3.2% |
| Moroccan | 37 | 0.2% |
| Nicaraguan | 1 | 0.0% |
| Northern European | 8 | 0.1% |
| Norwegian | 39 | 0.2% |
| Pakistani | 14 | 0.1% |
| Panamanian | 6 | 0.0% |
| Polish | 37 | 0.2% |
| Portuguese | 34 | 0.2% |
| Puerto Rican | 102 | 0.6% |
| Russian | 33 | 0.2% |
| Salvadoran | 18 | 0.1% |
| Samoan | 3 | 0.0% |
| Scotch-Irish | 17 | 0.1% |
| Scottish | 172 | 1.0% |
| Slovene | 25 | 0.1% |
| South American | 42 | 0.2% |
| Spaniard | 51 | 0.3% |
| Spanish | 143 | 0.8% |
| Spanish American | 10 | 0.1% |
| Sri Lankan | 491 | 2.8% |
| Subsaharan African | 177 | 1.0% |
| Swedish | 35 | 0.2% |
| Swiss | 5 | 0.0% |
| Syrian | 25 | 0.1% |
| Thai | 8 | 0.1% |
| Trinidadian and Tobagonian | 17 | 0.1% |
| Ukrainian | 3 | 0.0% |
| Welsh | 24 | 0.1% |
| West Indian | 21 | 0.1% |
| Yugoslavian | 7 | 0.0% | View All 69 Rows |
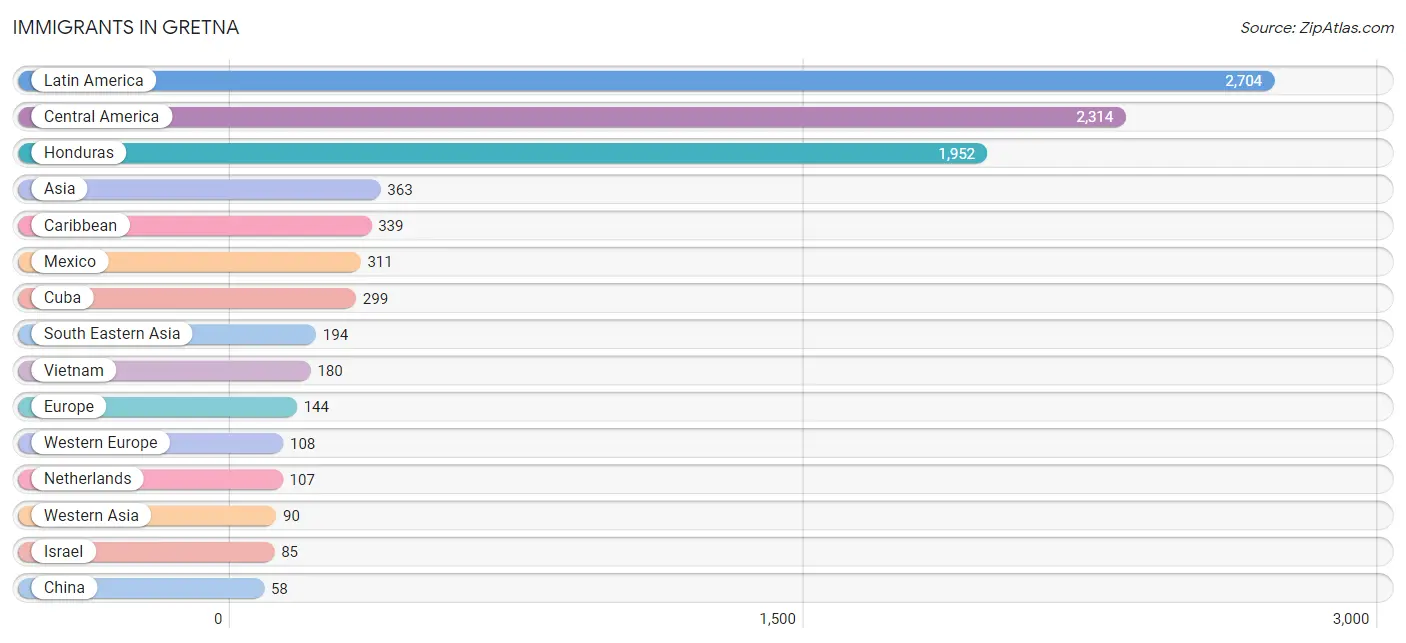
Immigrants in Gretna
The most numerous immigrant groups reported in Gretna came from Latin America (2,704 | 15.3%), Central America (2,314 | 13.1%), Honduras (1,952 | 11.1%), Asia (363 | 2.1%), and Caribbean (339 | 1.9%), together accounting for 43.5% of all Gretna residents.
| Immigration Origin | # Population | % Population |
| Africa | 6 | 0.0% |
| Asia | 363 | 2.1% |
| Australia | 2 | 0.0% |
| Belize | 11 | 0.1% |
| Brazil | 8 | 0.1% |
| Caribbean | 339 | 1.9% |
| Central America | 2,314 | 13.1% |
| China | 58 | 0.3% |
| Colombia | 41 | 0.2% |
| Cuba | 299 | 1.7% |
| Dominican Republic | 19 | 0.1% |
| Eastern Asia | 58 | 0.3% |
| Egypt | 6 | 0.0% |
| El Salvador | 23 | 0.1% |
| Europe | 144 | 0.8% |
| Germany | 1 | 0.0% |
| Greece | 29 | 0.2% |
| Guatemala | 16 | 0.1% |
| Honduras | 1,952 | 11.1% |
| Hong Kong | 10 | 0.1% |
| India | 12 | 0.1% |
| Israel | 85 | 0.5% |
| Jamaica | 13 | 0.1% |
| Latin America | 2,704 | 15.3% |
| Mexico | 311 | 1.8% |
| Netherlands | 107 | 0.6% |
| Nicaragua | 1 | 0.0% |
| Northern Africa | 6 | 0.0% |
| Northern Europe | 7 | 0.0% |
| Oceania | 2 | 0.0% |
| Peru | 2 | 0.0% |
| South America | 51 | 0.3% |
| South Central Asia | 12 | 0.1% |
| South Eastern Asia | 194 | 1.1% |
| Southern Europe | 29 | 0.2% |
| Syria | 5 | 0.0% |
| Thailand | 14 | 0.1% |
| Trinidad and Tobago | 8 | 0.1% |
| Vietnam | 180 | 1.0% |
| Western Asia | 90 | 0.5% |
| Western Europe | 108 | 0.6% | View All 41 Rows |
Sex and Age in Gretna
Sex and Age in Gretna
The most populous age groups in Gretna are 55 to 59 Years (945 | 10.6%) for men and 30 to 34 Years (847 | 9.7%) for women.
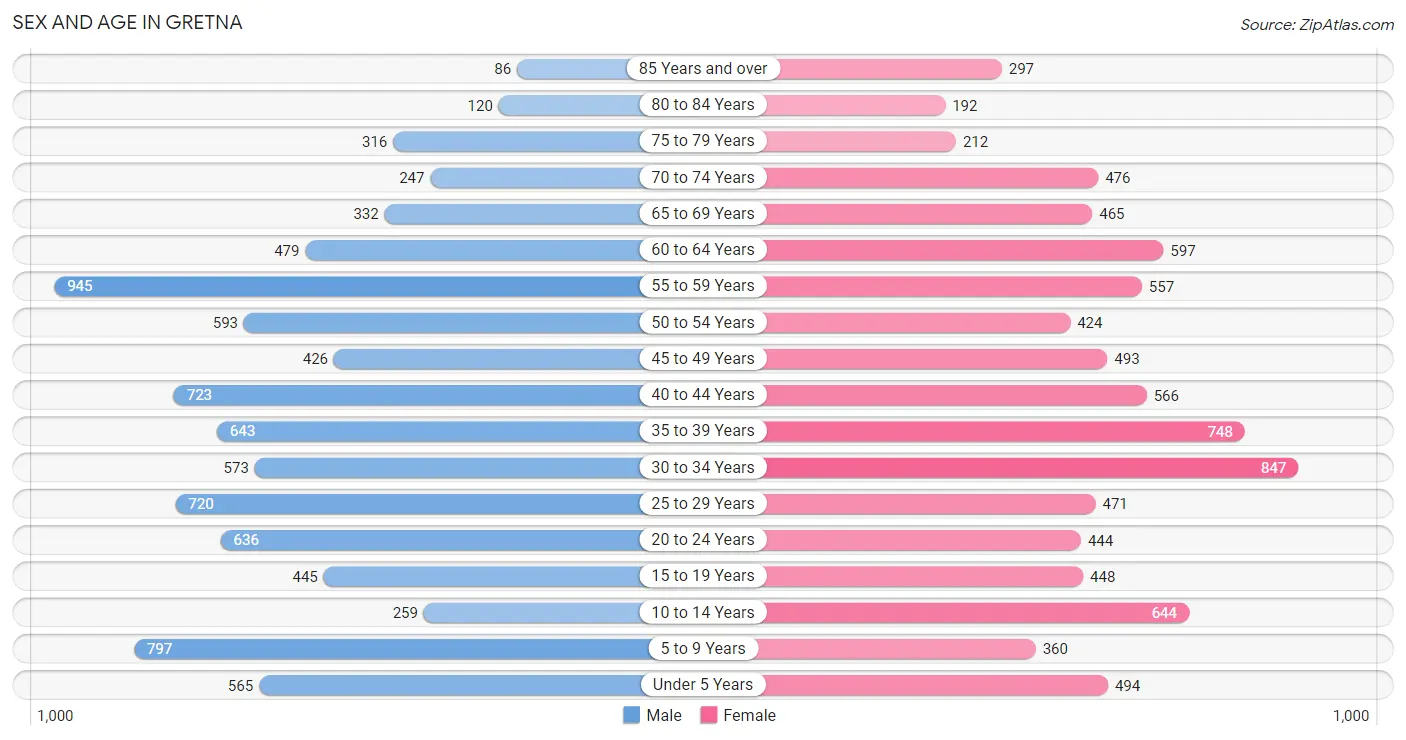
| Age Bracket | Male | Female |
| Under 5 Years | 565 (6.3%) | 494 (5.7%) |
| 5 to 9 Years | 797 (8.9%) | 360 (4.1%) |
| 10 to 14 Years | 259 (2.9%) | 644 (7.4%) |
| 15 to 19 Years | 445 (5.0%) | 448 (5.1%) |
| 20 to 24 Years | 636 (7.1%) | 444 (5.1%) |
| 25 to 29 Years | 720 (8.1%) | 471 (5.4%) |
| 30 to 34 Years | 573 (6.4%) | 847 (9.7%) |
| 35 to 39 Years | 643 (7.2%) | 748 (8.6%) |
| 40 to 44 Years | 723 (8.1%) | 566 (6.5%) |
| 45 to 49 Years | 426 (4.8%) | 493 (5.6%) |
| 50 to 54 Years | 593 (6.7%) | 424 (4.9%) |
| 55 to 59 Years | 945 (10.6%) | 557 (6.4%) |
| 60 to 64 Years | 479 (5.4%) | 597 (6.8%) |
| 65 to 69 Years | 332 (3.7%) | 465 (5.3%) |
| 70 to 74 Years | 247 (2.8%) | 476 (5.4%) |
| 75 to 79 Years | 316 (3.5%) | 212 (2.4%) |
| 80 to 84 Years | 120 (1.3%) | 192 (2.2%) |
| 85 Years and over | 86 (1.0%) | 297 (3.4%) |
| Total | 8,905 (100.0%) | 8,735 (100.0%) |
Families and Households in Gretna
Median Family Size in Gretna
The median family size in Gretna is 2.94 persons per family, with single female/mother families (1,441 | 36.6%) accounting for the largest median family size of 2.97 persons per family. On the other hand, married-couple families (2,052 | 52.1%) represent the smallest median family size with 2.92 persons per family.
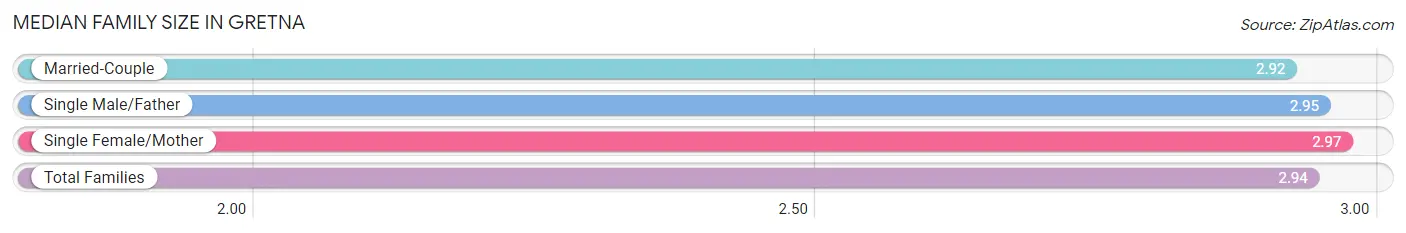
| Family Type | # Families | Family Size |
| Married-Couple | 2,052 (52.1%) | 2.92 |
| Single Male/Father | 443 (11.3%) | 2.95 |
| Single Female/Mother | 1,441 (36.6%) | 2.97 |
| Total Families | 3,936 (100.0%) | 2.94 |
Median Household Size in Gretna
The median household size in Gretna is 2.16 persons per household, with single male/father households (443 | 5.8%) accounting for the largest median household size of 3.35 persons per household. non-family households (3,742 | 48.7%) represent the smallest median household size with 1.19 persons per household.
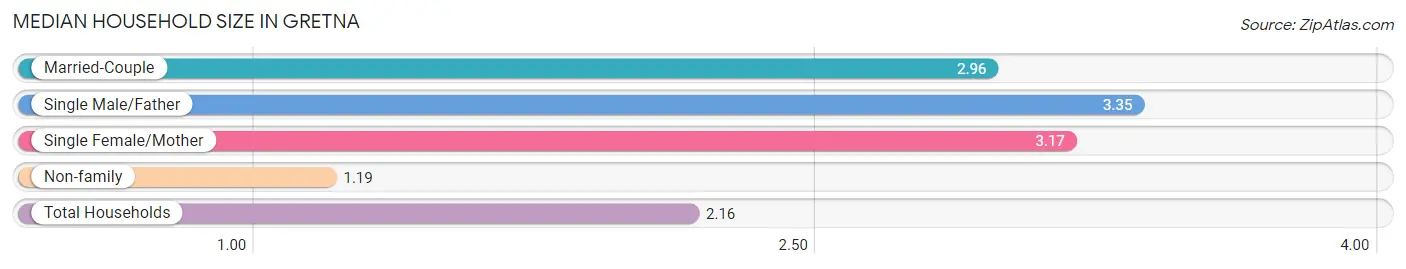
| Household Type | # Households | Household Size |
| Married-Couple | 2,052 (26.7%) | 2.96 |
| Single Male/Father | 443 (5.8%) | 3.35 |
| Single Female/Mother | 1,441 (18.8%) | 3.17 |
| Non-family | 3,742 (48.7%) | 1.19 |
| Total Households | 7,678 (100.0%) | 2.16 |
Household Size by Marriage Status in Gretna
Out of a total of 7,678 households in Gretna, 3,936 (51.3%) are family households, while 3,742 (48.7%) are nonfamily households. The most numerous type of family households are 2-person households, comprising 1,676, and the most common type of nonfamily households are 1-person households, comprising 3,189.
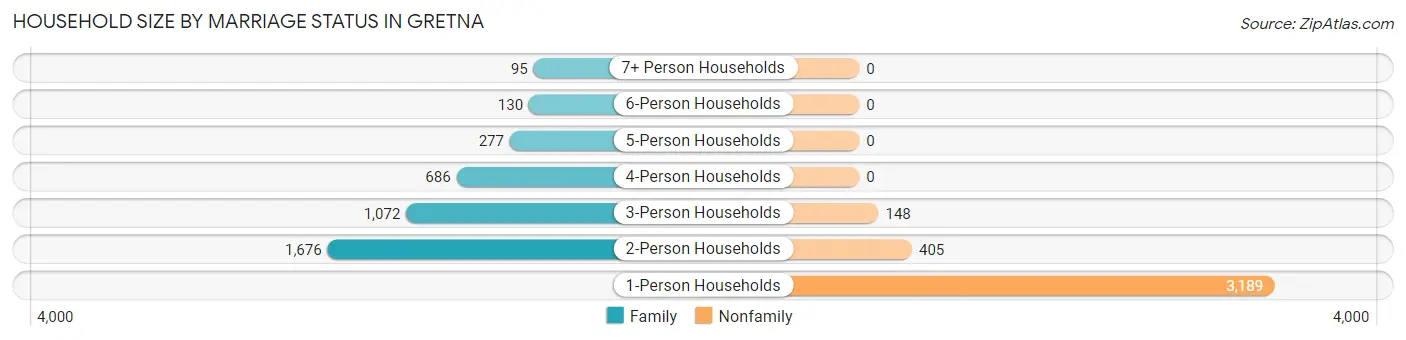
| Household Size | Family Households | Nonfamily Households |
| 1-Person Households | - | 3,189 (41.5%) |
| 2-Person Households | 1,676 (21.8%) | 405 (5.3%) |
| 3-Person Households | 1,072 (14.0%) | 148 (1.9%) |
| 4-Person Households | 686 (8.9%) | 0 (0.0%) |
| 5-Person Households | 277 (3.6%) | 0 (0.0%) |
| 6-Person Households | 130 (1.7%) | 0 (0.0%) |
| 7+ Person Households | 95 (1.2%) | 0 (0.0%) |
| Total | 3,936 (51.3%) | 3,742 (48.7%) |
Female Fertility in Gretna
Fertility by Age in Gretna
Average fertility rate in Gretna is 65.0 births per 1,000 women. Women in the age bracket of 20 to 34 years have the highest fertility rate with 113.0 births per 1,000 women. Women in the age bracket of 20 to 34 years acount for 74.8% of all women with births.
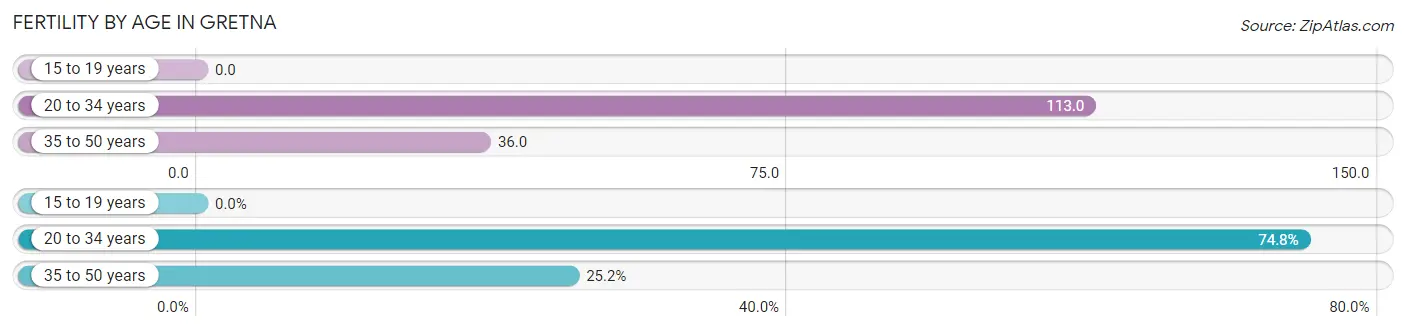
| Age Bracket | Women with Births | Births / 1,000 Women |
| 15 to 19 years | 0 (0.0%) | 0.0 |
| 20 to 34 years | 199 (74.8%) | 113.0 |
| 35 to 50 years | 67 (25.2%) | 36.0 |
| Total | 266 (100.0%) | 65.0 |
Fertility by Age by Marriage Status in Gretna
38.3% of women with births (266) in Gretna are married. The highest percentage of unmarried women with births falls into 20 to 34 years age bracket with 82.4% of them unmarried at the time of birth, while the lowest percentage of unmarried women with births belong to 35 to 50 years age bracket with 0.0% of them unmarried.
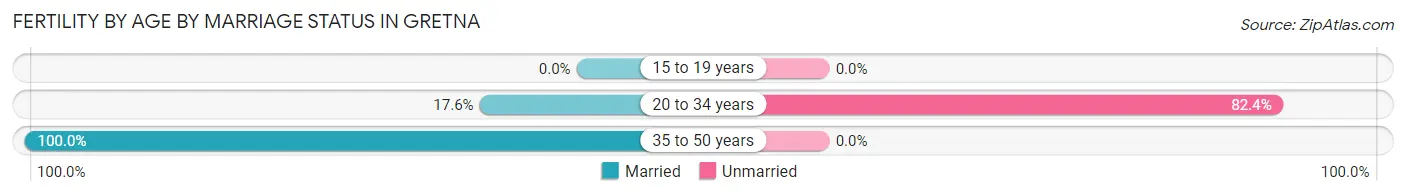
| Age Bracket | Married | Unmarried |
| 15 to 19 years | 0 (0.0%) | 0 (0.0%) |
| 20 to 34 years | 35 (17.6%) | 164 (82.4%) |
| 35 to 50 years | 67 (100.0%) | 0 (0.0%) |
| Total | 102 (38.4%) | 164 (61.7%) |
Fertility by Education in Gretna
Average fertility rate in Gretna is 65.0 births per 1,000 women. Women with the education attainment of high school diploma have the highest fertility rate of 84.0 births per 1,000 women, while women with the education attainment of bachelor's degree have the lowest fertility at 48.0 births per 1,000 women. Women with the education attainment of less than high school represent 30.1% of all women with births.
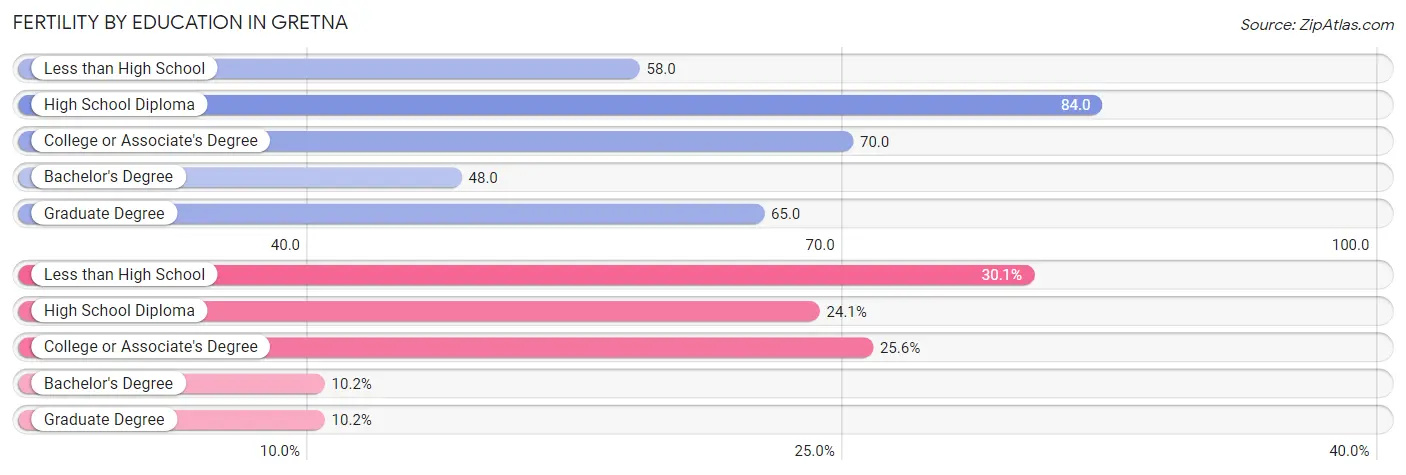
| Educational Attainment | Women with Births | Births / 1,000 Women |
| Less than High School | 80 (30.1%) | 58.0 |
| High School Diploma | 64 (24.1%) | 84.0 |
| College or Associate's Degree | 68 (25.6%) | 70.0 |
| Bachelor's Degree | 27 (10.2%) | 48.0 |
| Graduate Degree | 27 (10.2%) | 65.0 |
| Total | 266 (100.0%) | 65.0 |
Fertility by Education by Marriage Status in Gretna
61.7% of women with births in Gretna are unmarried. Women with the educational attainment of bachelor's degree are most likely to be married with 100.0% of them married at childbirth, while women with the educational attainment of college or associate's degree are least likely to be married with 100.0% of them unmarried at childbirth.
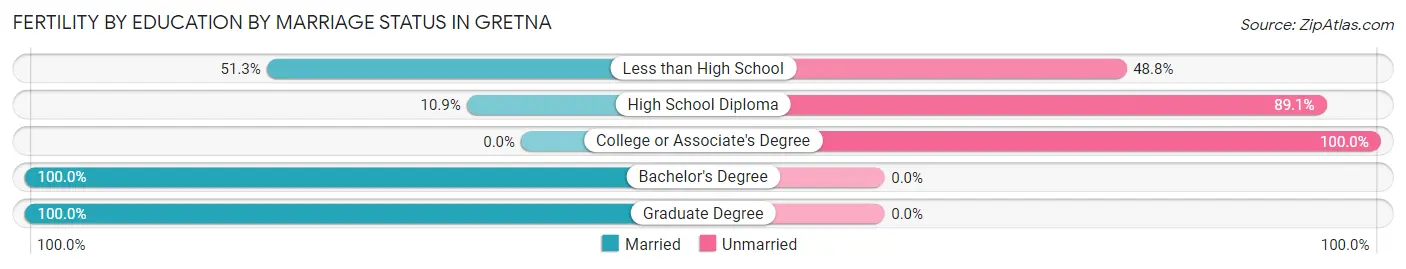
| Educational Attainment | Married | Unmarried |
| Less than High School | 41 (51.2%) | 39 (48.7%) |
| High School Diploma | 7 (10.9%) | 57 (89.1%) |
| College or Associate's Degree | 0 (0.0%) | 68 (100.0%) |
| Bachelor's Degree | 27 (100.0%) | 0 (0.0%) |
| Graduate Degree | 27 (100.0%) | 0 (0.0%) |
| Total | 102 (38.4%) | 164 (61.7%) |
Employment Characteristics in Gretna
Employment by Class of Employer in Gretna
Among the 7,519 employed individuals in Gretna, private company employees (5,047 | 67.1%), not-for-profit organizations (544 | 7.2%), and self-employed (not incorporated) (537 | 7.1%) make up the most common classes of employment.
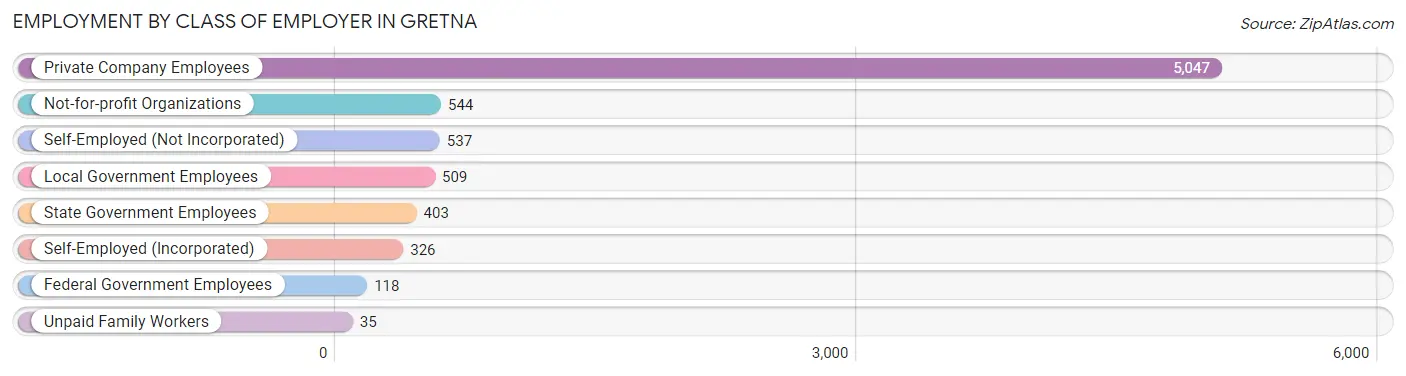
| Employer Class | # Employees | % Employees |
| Private Company Employees | 5,047 | 67.1% |
| Self-Employed (Incorporated) | 326 | 4.3% |
| Self-Employed (Not Incorporated) | 537 | 7.1% |
| Not-for-profit Organizations | 544 | 7.2% |
| Local Government Employees | 509 | 6.8% |
| State Government Employees | 403 | 5.4% |
| Federal Government Employees | 118 | 1.6% |
| Unpaid Family Workers | 35 | 0.5% |
| Total | 7,519 | 100.0% |
Employment Status by Age in Gretna
According to the labor force statistics for Gretna, out of the total population over 16 years of age (14,345), 58.3% or 8,363 individuals are in the labor force, with 6.9% or 577 of them unemployed. The age group with the highest labor force participation rate is 45 to 54 years, with 80.2% or 1,553 individuals in the labor force. Within the labor force, the 20 to 24 years age range has the highest percentage of unemployed individuals, with 14.9% or 99 of them being unemployed.
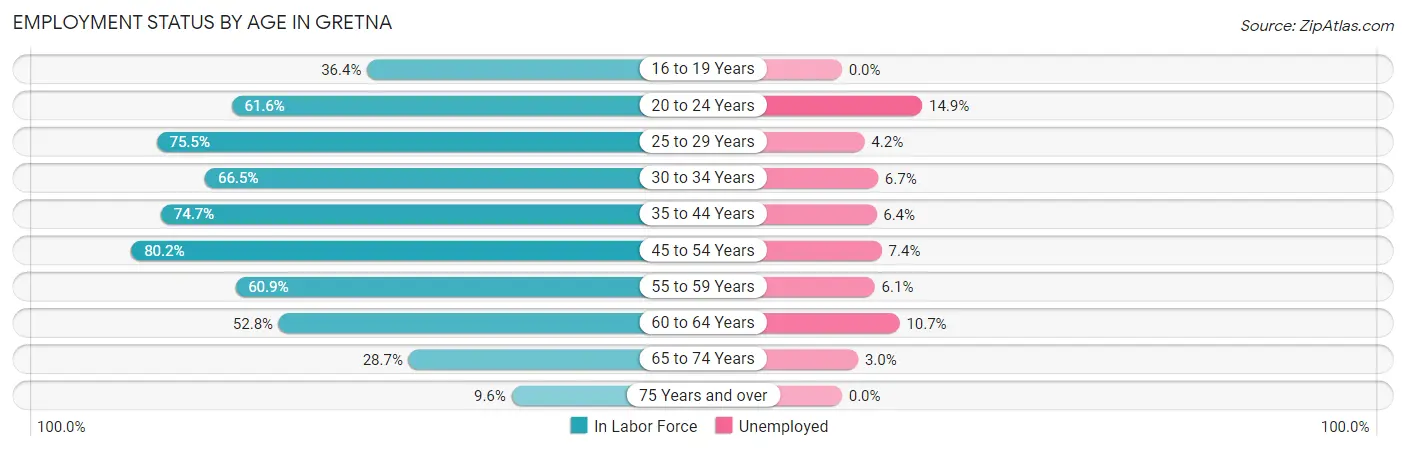
| Age Bracket | In Labor Force | Unemployed |
| 16 to 19 Years | 261 (36.4%) | 0 (0.0%) |
| 20 to 24 Years | 665 (61.6%) | 99 (14.9%) |
| 25 to 29 Years | 899 (75.5%) | 38 (4.2%) |
| 30 to 34 Years | 944 (66.5%) | 63 (6.7%) |
| 35 to 44 Years | 2,002 (74.7%) | 128 (6.4%) |
| 45 to 54 Years | 1,553 (80.2%) | 115 (7.4%) |
| 55 to 59 Years | 915 (60.9%) | 56 (6.1%) |
| 60 to 64 Years | 568 (52.8%) | 61 (10.7%) |
| 65 to 74 Years | 436 (28.7%) | 13 (3.0%) |
| 75 Years and over | 117 (9.6%) | 0 (0.0%) |
| Total | 8,363 (58.3%) | 577 (6.9%) |
Employment Status by Educational Attainment in Gretna
According to labor force statistics for Gretna, 70.2% of individuals (6,883) out of the total population between 25 and 64 years of age (9,805) are in the labor force, with 6.7% or 461 of them being unemployed. The group with the highest labor force participation rate are those with the educational attainment of bachelor's degree or higher, with 92.4% or 2,551 individuals in the labor force. Within the labor force, individuals with high school diploma education have the highest percentage of unemployment, with 13.2% or 191 of them being unemployed.
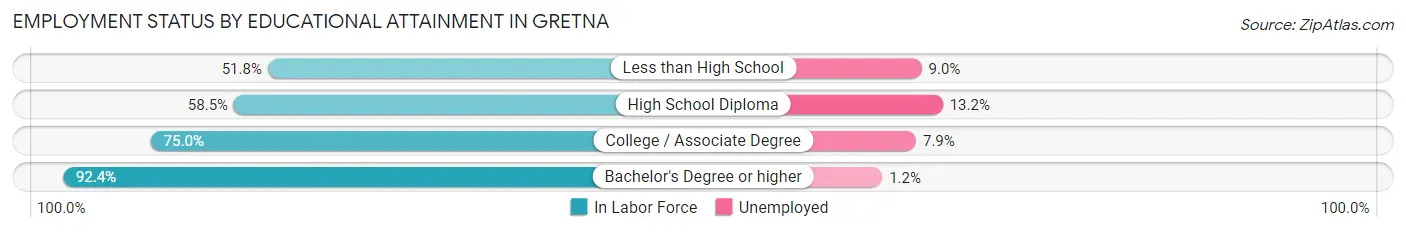
| Educational Attainment | In Labor Force | Unemployed |
| Less than High School | 1,211 (51.8%) | 210 (9.0%) |
| High School Diploma | 1,448 (58.5%) | 327 (13.2%) |
| College / Associate Degree | 1,672 (75.0%) | 176 (7.9%) |
| Bachelor's Degree or higher | 2,551 (92.4%) | 33 (1.2%) |
| Total | 6,883 (70.2%) | 657 (6.7%) |
Employment Occupations by Sex in Gretna
Management, Business, Science and Arts Occupations
The most common Management, Business, Science and Arts occupations in Gretna are Community & Social Service (669 | 8.6%), Management (628 | 8.1%), Health Diagnosing & Treating (457 | 5.9%), Computers, Engineering & Science (393 | 5.1%), and Health Technologists (355 | 4.6%).
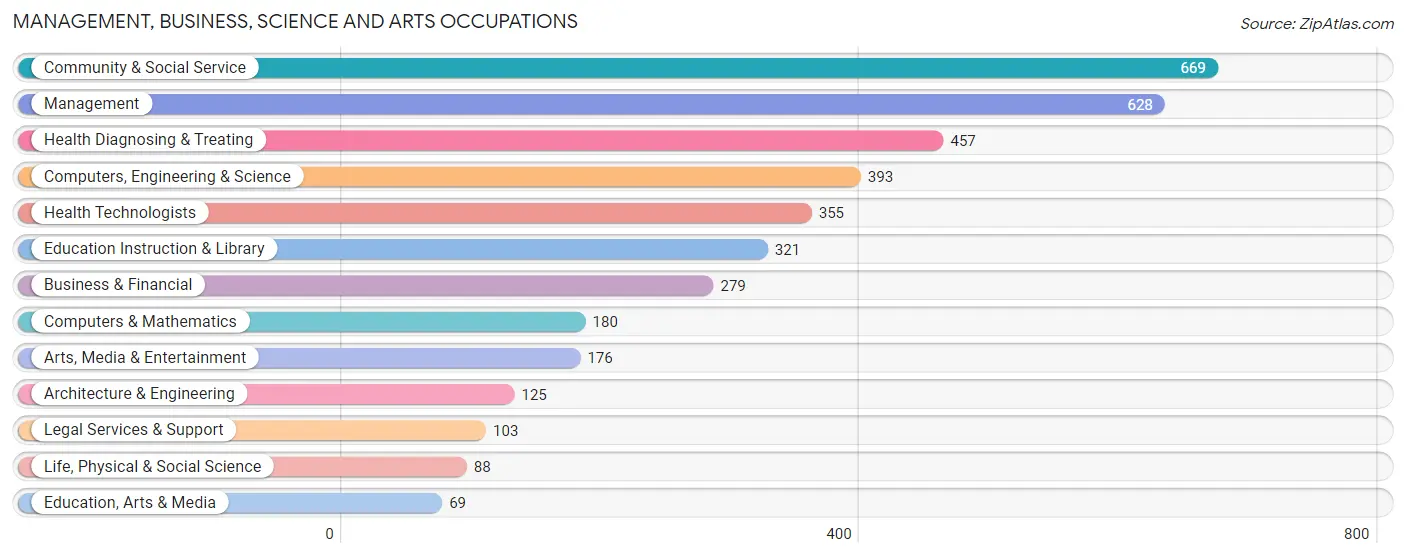
Management, Business, Science and Arts Occupations by Sex
Within the Management, Business, Science and Arts occupations in Gretna, the most male-oriented occupations are Arts, Media & Entertainment (85.2%), Life, Physical & Social Science (70.5%), and Architecture & Engineering (60.8%), while the most female-oriented occupations are Legal Services & Support (80.6%), Health Diagnosing & Treating (80.1%), and Education Instruction & Library (75.1%).
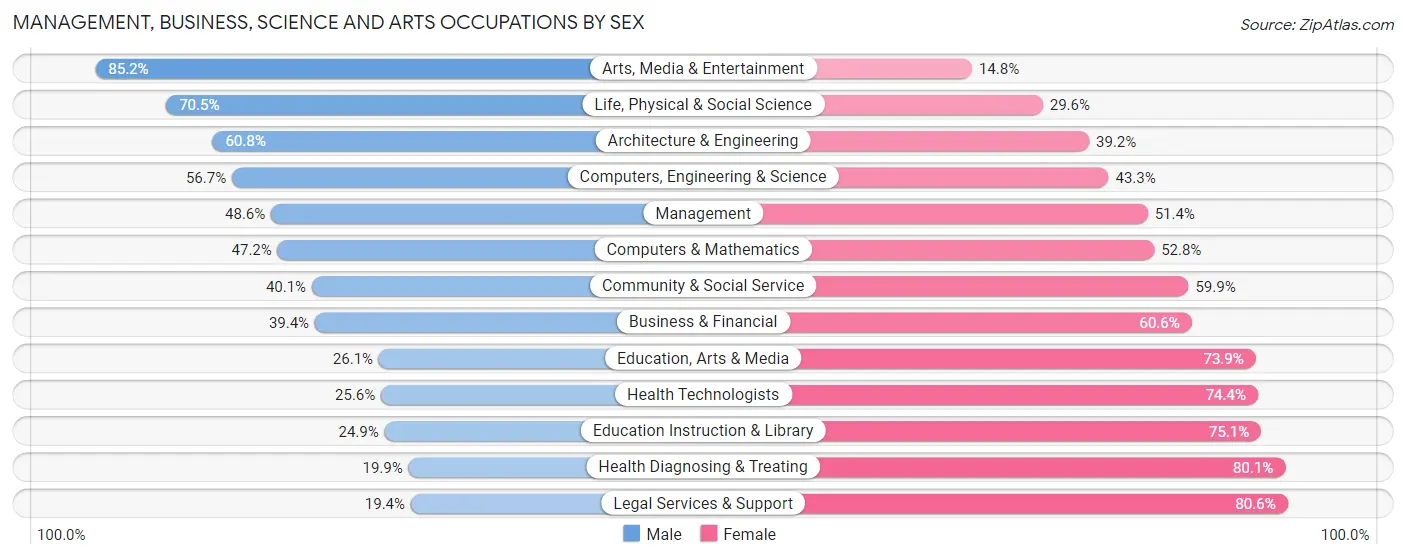
| Occupation | Male | Female |
| Management | 305 (48.6%) | 323 (51.4%) |
| Business & Financial | 110 (39.4%) | 169 (60.6%) |
| Computers, Engineering & Science | 223 (56.7%) | 170 (43.3%) |
| Computers & Mathematics | 85 (47.2%) | 95 (52.8%) |
| Architecture & Engineering | 76 (60.8%) | 49 (39.2%) |
| Life, Physical & Social Science | 62 (70.5%) | 26 (29.5%) |
| Community & Social Service | 268 (40.1%) | 401 (59.9%) |
| Education, Arts & Media | 18 (26.1%) | 51 (73.9%) |
| Legal Services & Support | 20 (19.4%) | 83 (80.6%) |
| Education Instruction & Library | 80 (24.9%) | 241 (75.1%) |
| Arts, Media & Entertainment | 150 (85.2%) | 26 (14.8%) |
| Health Diagnosing & Treating | 91 (19.9%) | 366 (80.1%) |
| Health Technologists | 91 (25.6%) | 264 (74.4%) |
| Total (Category) | 997 (41.1%) | 1,429 (58.9%) |
| Total (Overall) | 4,064 (52.2%) | 3,721 (47.8%) |
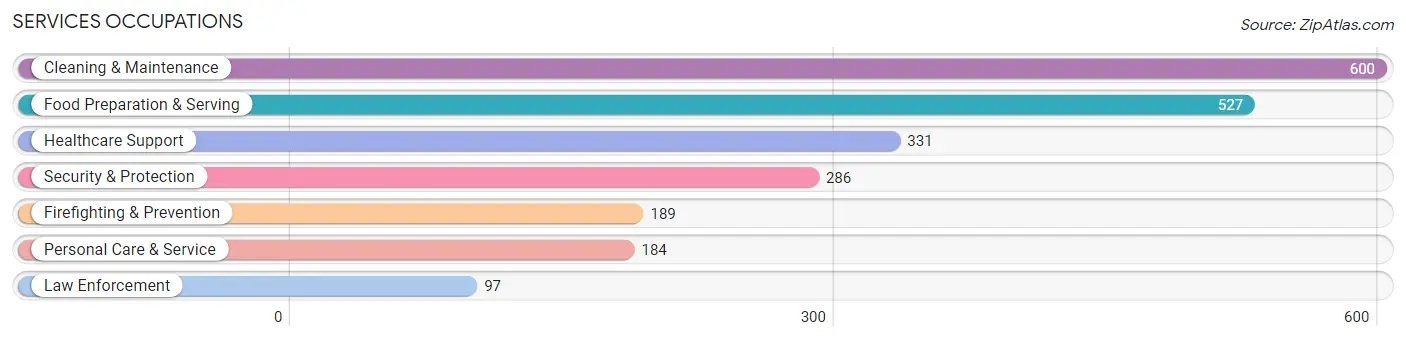
Services Occupations
The most common Services occupations in Gretna are Cleaning & Maintenance (600 | 7.7%), Food Preparation & Serving (527 | 6.8%), Healthcare Support (331 | 4.3%), Security & Protection (286 | 3.7%), and Firefighting & Prevention (189 | 2.4%).
Services Occupations by Sex
Within the Services occupations in Gretna, the most male-oriented occupations are Law Enforcement (100.0%), Security & Protection (76.6%), and Firefighting & Prevention (64.5%), while the most female-oriented occupations are Healthcare Support (78.2%), Personal Care & Service (64.7%), and Cleaning & Maintenance (52.7%).
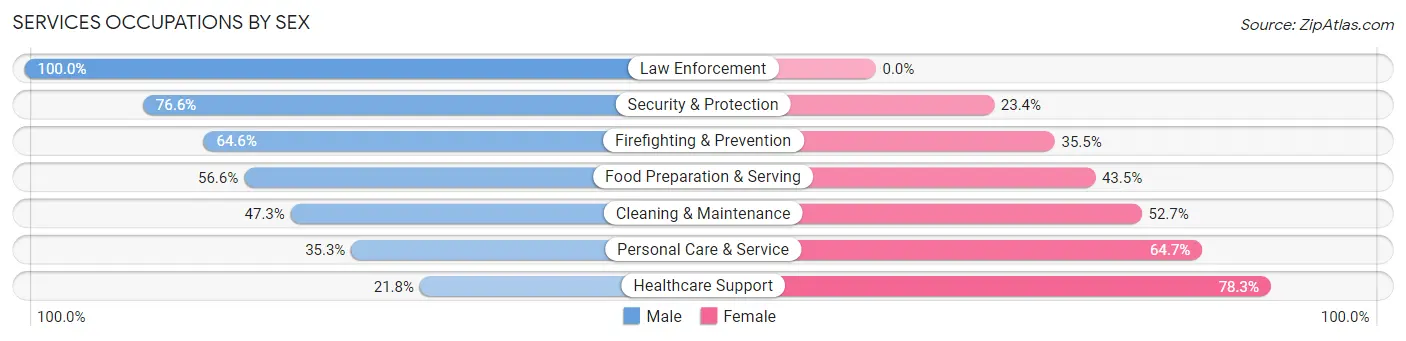
| Occupation | Male | Female |
| Healthcare Support | 72 (21.7%) | 259 (78.2%) |
| Security & Protection | 219 (76.6%) | 67 (23.4%) |
| Firefighting & Prevention | 122 (64.5%) | 67 (35.4%) |
| Law Enforcement | 97 (100.0%) | 0 (0.0%) |
| Food Preparation & Serving | 298 (56.6%) | 229 (43.4%) |
| Cleaning & Maintenance | 284 (47.3%) | 316 (52.7%) |
| Personal Care & Service | 65 (35.3%) | 119 (64.7%) |
| Total (Category) | 938 (48.6%) | 990 (51.3%) |
| Total (Overall) | 4,064 (52.2%) | 3,721 (47.8%) |
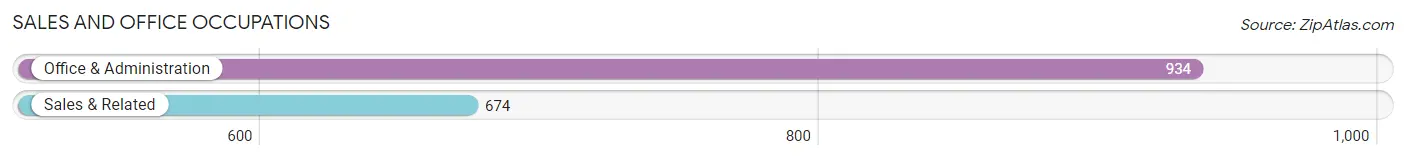
Sales and Office Occupations
The most common Sales and Office occupations in Gretna are Office & Administration (934 | 12.0%), and Sales & Related (674 | 8.7%).
Sales and Office Occupations by Sex
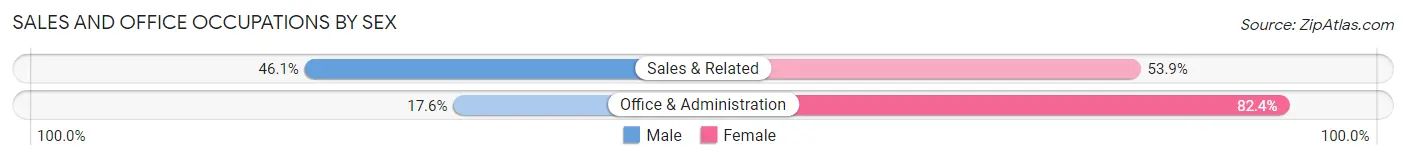
| Occupation | Male | Female |
| Sales & Related | 311 (46.1%) | 363 (53.9%) |
| Office & Administration | 164 (17.6%) | 770 (82.4%) |
| Total (Category) | 475 (29.5%) | 1,133 (70.5%) |
| Total (Overall) | 4,064 (52.2%) | 3,721 (47.8%) |
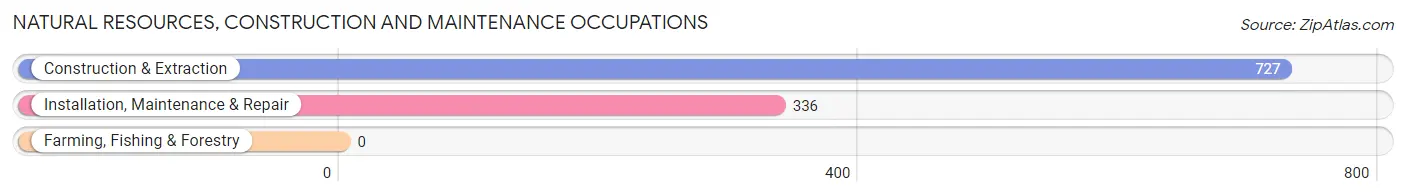
Natural Resources, Construction and Maintenance Occupations
The most common Natural Resources, Construction and Maintenance occupations in Gretna are Construction & Extraction (727 | 9.3%), and Installation, Maintenance & Repair (336 | 4.3%).
Natural Resources, Construction and Maintenance Occupations by Sex
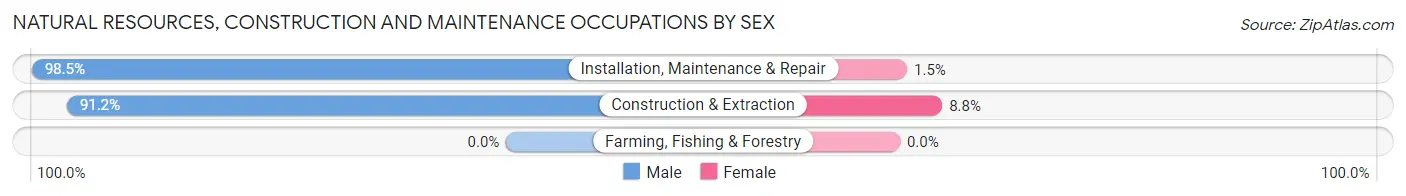
| Occupation | Male | Female |
| Farming, Fishing & Forestry | 0 (0.0%) | 0 (0.0%) |
| Construction & Extraction | 663 (91.2%) | 64 (8.8%) |
| Installation, Maintenance & Repair | 331 (98.5%) | 5 (1.5%) |
| Total (Category) | 994 (93.5%) | 69 (6.5%) |
| Total (Overall) | 4,064 (52.2%) | 3,721 (47.8%) |
Production, Transportation and Moving Occupations
The most common Production, Transportation and Moving occupations in Gretna are Production (371 | 4.8%), Transportation (195 | 2.5%), and Material Moving (194 | 2.5%).
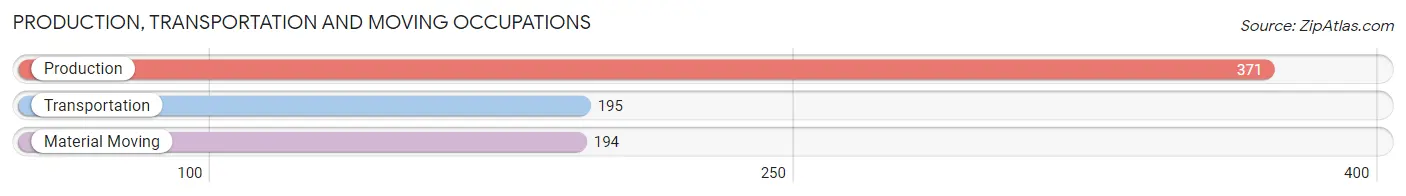
Production, Transportation and Moving Occupations by Sex
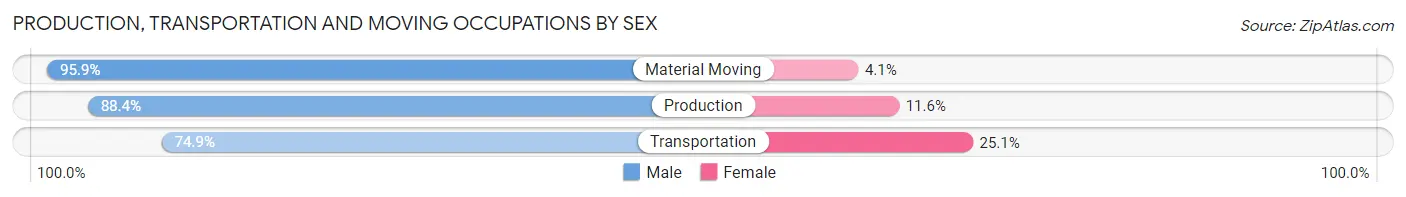
| Occupation | Male | Female |
| Production | 328 (88.4%) | 43 (11.6%) |
| Transportation | 146 (74.9%) | 49 (25.1%) |
| Material Moving | 186 (95.9%) | 8 (4.1%) |
| Total (Category) | 660 (86.8%) | 100 (13.2%) |
| Total (Overall) | 4,064 (52.2%) | 3,721 (47.8%) |
Employment Industries by Sex in Gretna
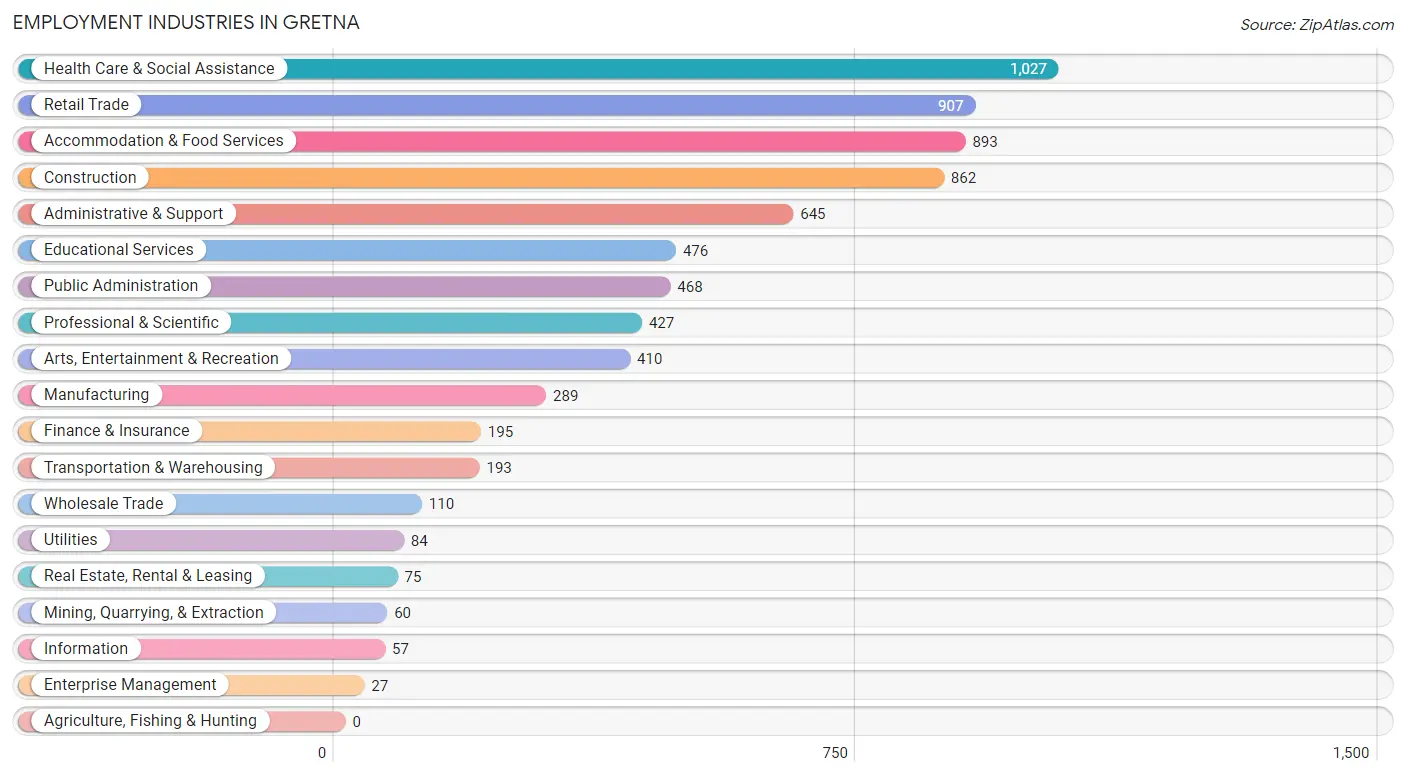
Employment Industries in Gretna
The major employment industries in Gretna include Health Care & Social Assistance (1,027 | 13.2%), Retail Trade (907 | 11.7%), Accommodation & Food Services (893 | 11.5%), Construction (862 | 11.1%), and Administrative & Support (645 | 8.3%).
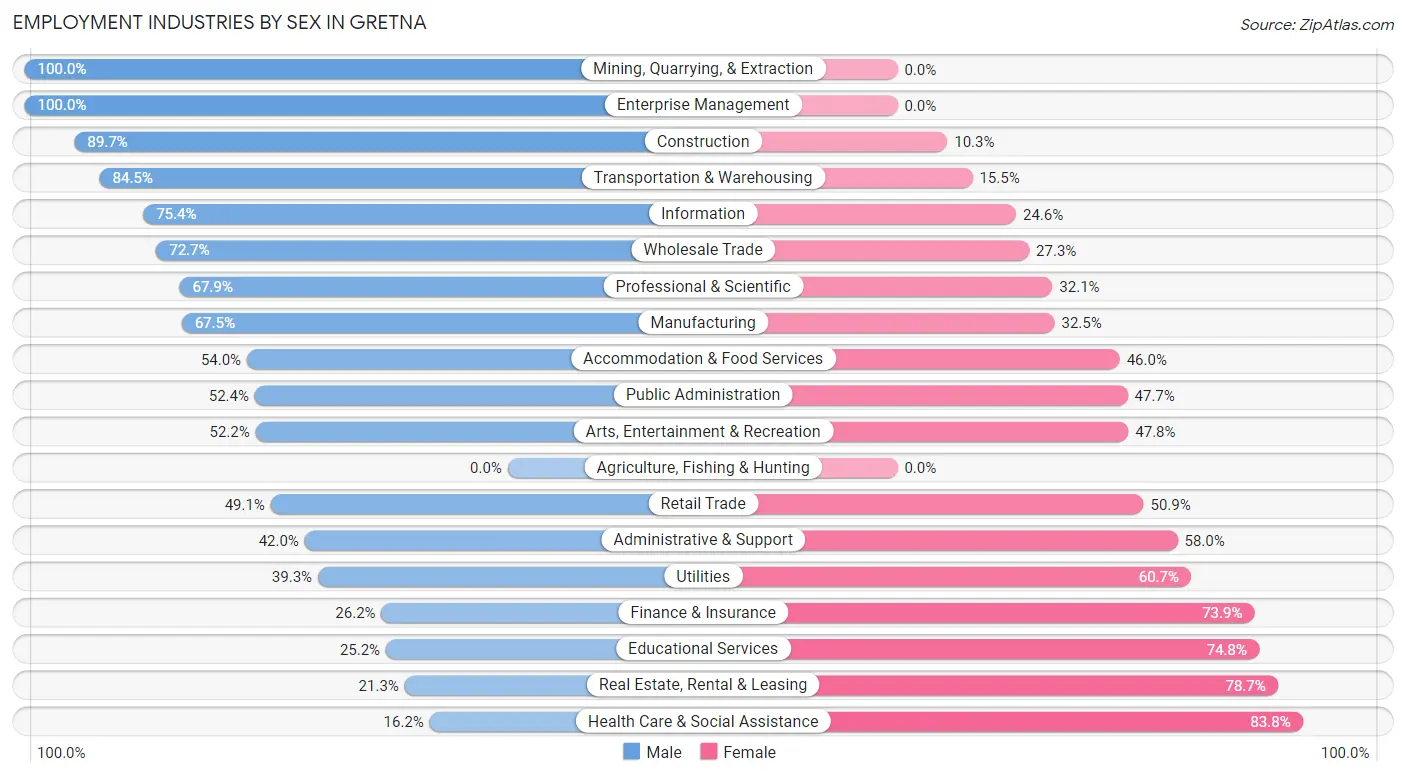
Employment Industries by Sex in Gretna
The Gretna industries that see more men than women are Mining, Quarrying, & Extraction (100.0%), Enterprise Management (100.0%), and Construction (89.7%), whereas the industries that tend to have a higher number of women are Health Care & Social Assistance (83.8%), Real Estate, Rental & Leasing (78.7%), and Educational Services (74.8%).
| Industry | Male | Female |
| Agriculture, Fishing & Hunting | 0 (0.0%) | 0 (0.0%) |
| Mining, Quarrying, & Extraction | 60 (100.0%) | 0 (0.0%) |
| Construction | 773 (89.7%) | 89 (10.3%) |
| Manufacturing | 195 (67.5%) | 94 (32.5%) |
| Wholesale Trade | 80 (72.7%) | 30 (27.3%) |
| Retail Trade | 445 (49.1%) | 462 (50.9%) |
| Transportation & Warehousing | 163 (84.5%) | 30 (15.5%) |
| Utilities | 33 (39.3%) | 51 (60.7%) |
| Information | 43 (75.4%) | 14 (24.6%) |
| Finance & Insurance | 51 (26.2%) | 144 (73.9%) |
| Real Estate, Rental & Leasing | 16 (21.3%) | 59 (78.7%) |
| Professional & Scientific | 290 (67.9%) | 137 (32.1%) |
| Enterprise Management | 27 (100.0%) | 0 (0.0%) |
| Administrative & Support | 271 (42.0%) | 374 (58.0%) |
| Educational Services | 120 (25.2%) | 356 (74.8%) |
| Health Care & Social Assistance | 166 (16.2%) | 861 (83.8%) |
| Arts, Entertainment & Recreation | 214 (52.2%) | 196 (47.8%) |
| Accommodation & Food Services | 482 (54.0%) | 411 (46.0%) |
| Public Administration | 245 (52.3%) | 223 (47.6%) |
| Total | 4,064 (52.2%) | 3,721 (47.8%) |
Education in Gretna
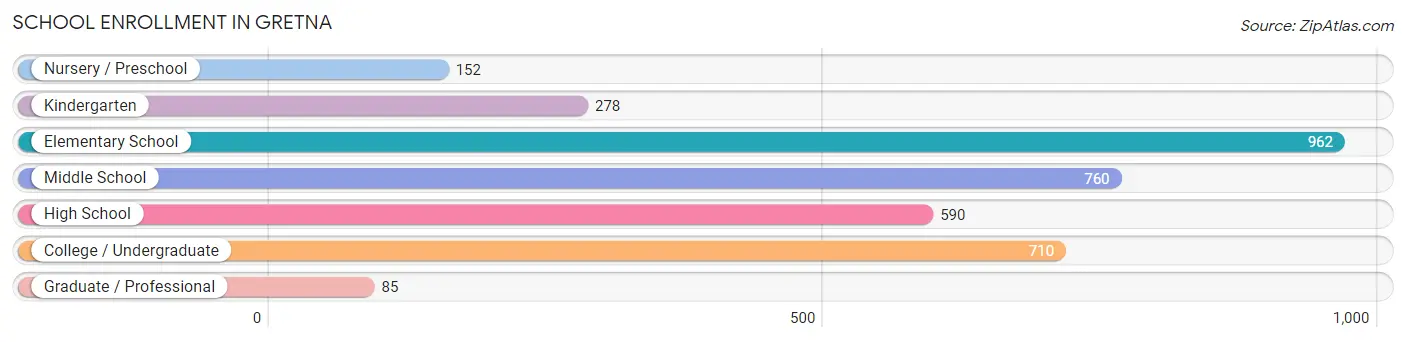
School Enrollment in Gretna
The most common levels of schooling among the 3,537 students in Gretna are elementary school (962 | 27.2%), middle school (760 | 21.5%), and college / undergraduate (710 | 20.1%).
| School Level | # Students | % Students |
| Nursery / Preschool | 152 | 4.3% |
| Kindergarten | 278 | 7.9% |
| Elementary School | 962 | 27.2% |
| Middle School | 760 | 21.5% |
| High School | 590 | 16.7% |
| College / Undergraduate | 710 | 20.1% |
| Graduate / Professional | 85 | 2.4% |
| Total | 3,537 | 100.0% |
School Enrollment by Age by Funding Source in Gretna
Out of a total of 3,537 students who are enrolled in schools in Gretna, 874 (24.7%) attend a private institution, while the remaining 2,663 (75.3%) are enrolled in public schools. The age group of 20 to 24 year olds has the highest likelihood of being enrolled in private schools, with 131 (53.0% in the age bracket) enrolled. Conversely, the age group of 18 to 19 year olds has the lowest likelihood of being enrolled in a private school, with 230 (98.3% in the age bracket) attending a public institution.
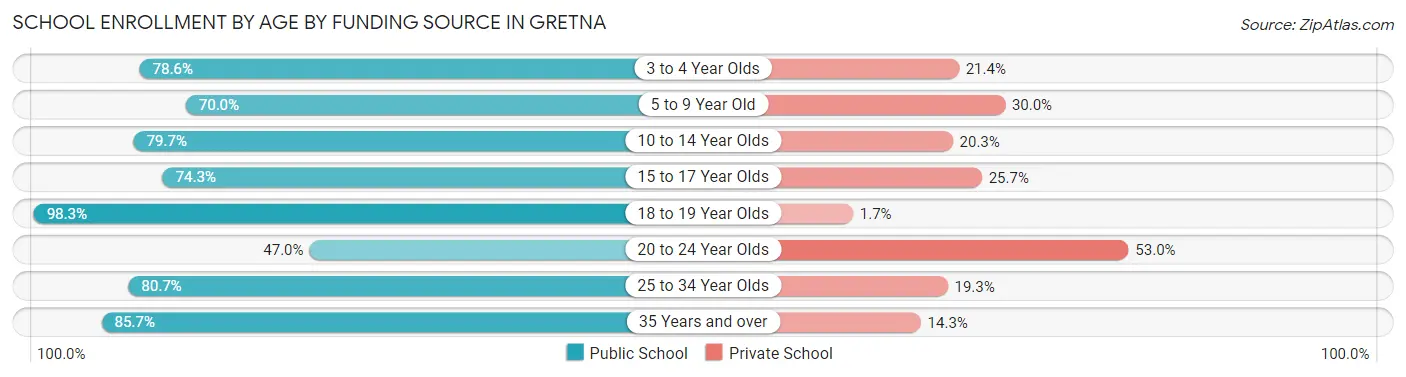
| Age Bracket | Public School | Private School |
| 3 to 4 Year Olds | 154 (78.6%) | 42 (21.4%) |
| 5 to 9 Year Old | 764 (70.0%) | 328 (30.0%) |
| 10 to 14 Year Olds | 711 (79.7%) | 181 (20.3%) |
| 15 to 17 Year Olds | 335 (74.3%) | 116 (25.7%) |
| 18 to 19 Year Olds | 230 (98.3%) | 4 (1.7%) |
| 20 to 24 Year Olds | 116 (47.0%) | 131 (53.0%) |
| 25 to 34 Year Olds | 146 (80.7%) | 35 (19.3%) |
| 35 Years and over | 209 (85.7%) | 35 (14.3%) |
| Total | 2,663 (75.3%) | 874 (24.7%) |
Educational Attainment by Field of Study in Gretna
Business (703 | 21.5%), education (365 | 11.2%), science & technology (360 | 11.0%), engineering (292 | 8.9%), and communications (266 | 8.1%) are the most common fields of study among 3,270 individuals in Gretna who have obtained a bachelor's degree or higher.
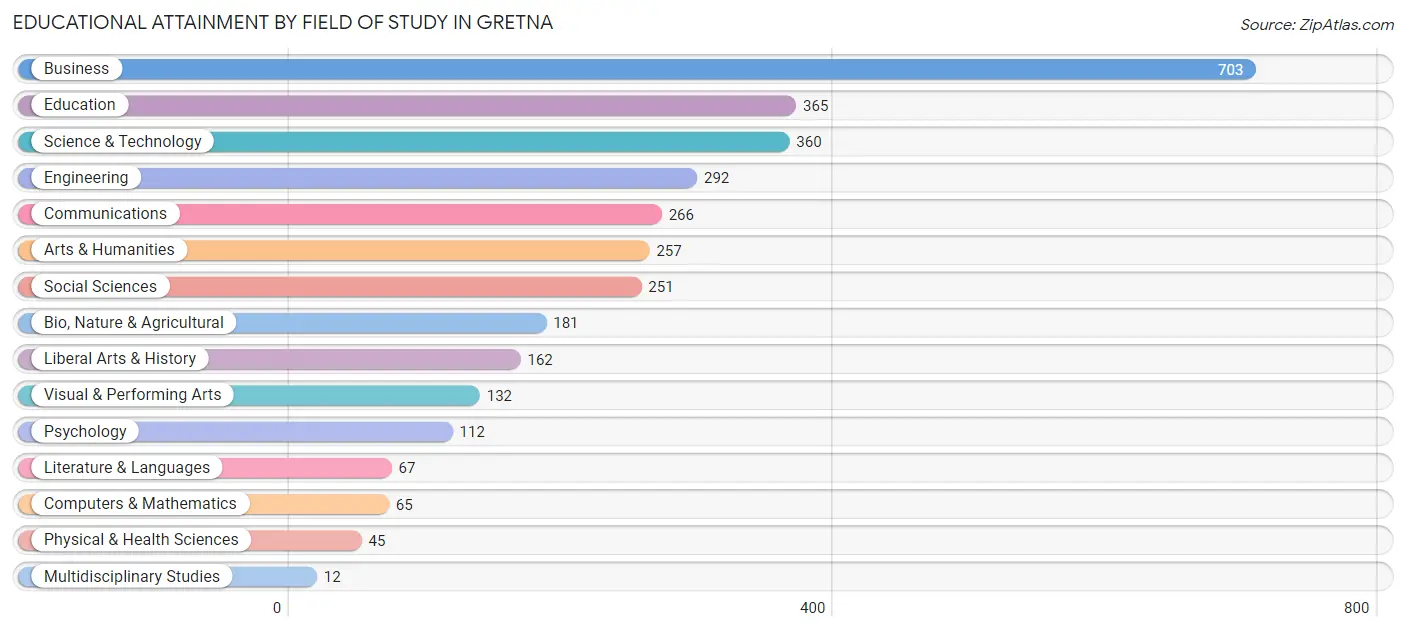
| Field of Study | # Graduates | % Graduates |
| Computers & Mathematics | 65 | 2.0% |
| Bio, Nature & Agricultural | 181 | 5.5% |
| Physical & Health Sciences | 45 | 1.4% |
| Psychology | 112 | 3.4% |
| Social Sciences | 251 | 7.7% |
| Engineering | 292 | 8.9% |
| Multidisciplinary Studies | 12 | 0.4% |
| Science & Technology | 360 | 11.0% |
| Business | 703 | 21.5% |
| Education | 365 | 11.2% |
| Literature & Languages | 67 | 2.1% |
| Liberal Arts & History | 162 | 5.0% |
| Visual & Performing Arts | 132 | 4.0% |
| Communications | 266 | 8.1% |
| Arts & Humanities | 257 | 7.9% |
| Total | 3,270 | 100.0% |
Transportation & Commute in Gretna
Vehicle Availability by Sex in Gretna
The most prevalent vehicle ownership categories in Gretna are males with 2 vehicles (1,822, accounting for 45.5%) and females with 2 vehicles (1,337, making up 52.0%).
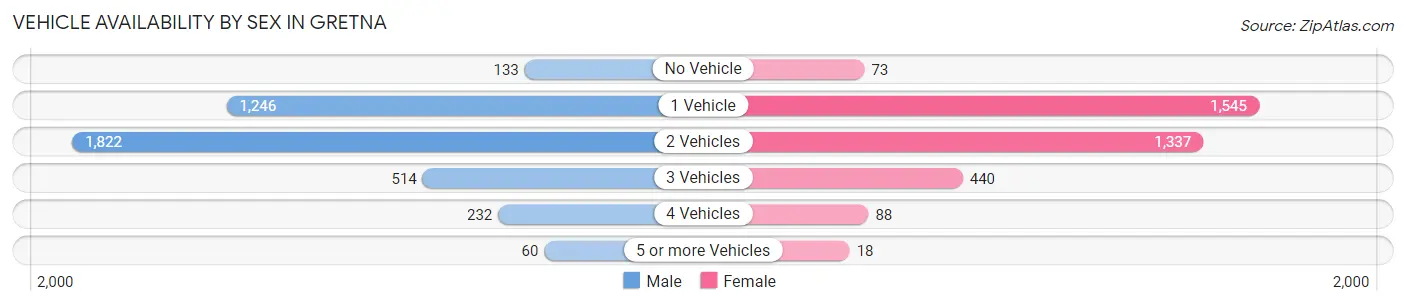
| Vehicles Available | Male | Female |
| No Vehicle | 133 (3.3%) | 73 (2.1%) |
| 1 Vehicle | 1,246 (31.1%) | 1,545 (44.1%) |
| 2 Vehicles | 1,822 (45.5%) | 1,337 (38.2%) |
| 3 Vehicles | 514 (12.8%) | 440 (12.6%) |
| 4 Vehicles | 232 (5.8%) | 88 (2.5%) |
| 5 or more Vehicles | 60 (1.5%) | 18 (0.5%) |
| Total | 4,007 (100.0%) | 3,501 (100.0%) |
Commute Time in Gretna
The most frequently occuring commute durations in Gretna are 15 to 19 minutes (1,358 commuters, 19.0%), 20 to 24 minutes (1,186 commuters, 16.6%), and 30 to 34 minutes (1,129 commuters, 15.8%).
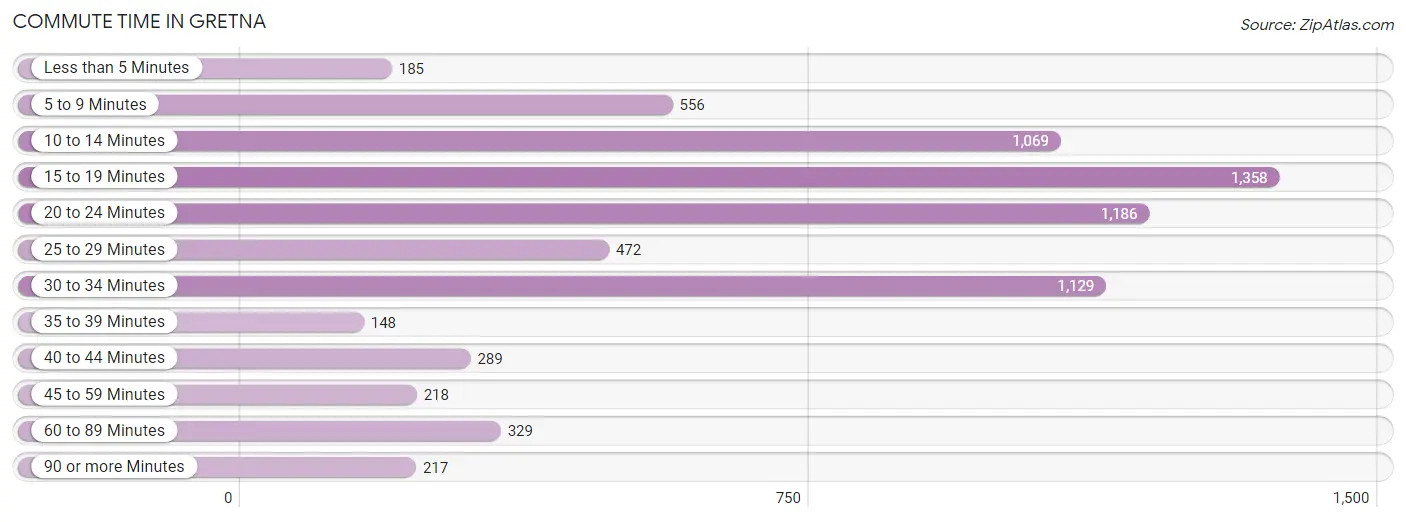
| Commute Time | # Commuters | % Commuters |
| Less than 5 Minutes | 185 | 2.6% |
| 5 to 9 Minutes | 556 | 7.8% |
| 10 to 14 Minutes | 1,069 | 14.9% |
| 15 to 19 Minutes | 1,358 | 19.0% |
| 20 to 24 Minutes | 1,186 | 16.6% |
| 25 to 29 Minutes | 472 | 6.6% |
| 30 to 34 Minutes | 1,129 | 15.8% |
| 35 to 39 Minutes | 148 | 2.1% |
| 40 to 44 Minutes | 289 | 4.0% |
| 45 to 59 Minutes | 218 | 3.0% |
| 60 to 89 Minutes | 329 | 4.6% |
| 90 or more Minutes | 217 | 3.0% |
Commute Time by Sex in Gretna
The most common commute times in Gretna are 30 to 34 minutes (752 commuters, 19.3%) for males and 15 to 19 minutes (719 commuters, 22.1%) for females.
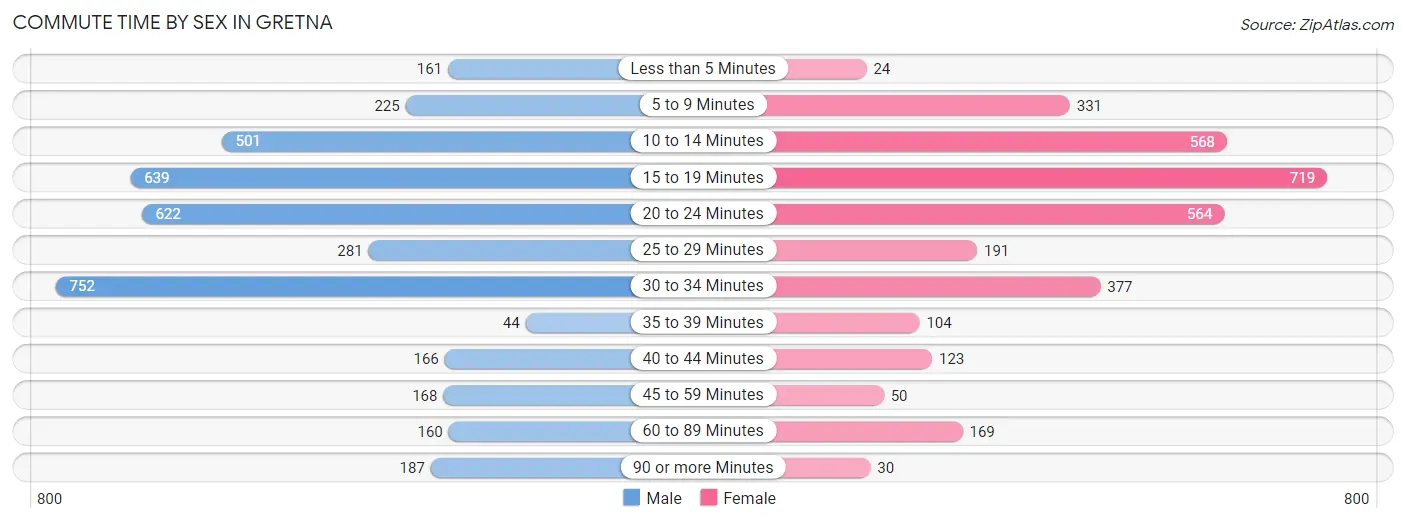
| Commute Time | Male | Female |
| Less than 5 Minutes | 161 (4.1%) | 24 (0.7%) |
| 5 to 9 Minutes | 225 (5.8%) | 331 (10.2%) |
| 10 to 14 Minutes | 501 (12.8%) | 568 (17.5%) |
| 15 to 19 Minutes | 639 (16.4%) | 719 (22.1%) |
| 20 to 24 Minutes | 622 (15.9%) | 564 (17.3%) |
| 25 to 29 Minutes | 281 (7.2%) | 191 (5.9%) |
| 30 to 34 Minutes | 752 (19.3%) | 377 (11.6%) |
| 35 to 39 Minutes | 44 (1.1%) | 104 (3.2%) |
| 40 to 44 Minutes | 166 (4.3%) | 123 (3.8%) |
| 45 to 59 Minutes | 168 (4.3%) | 50 (1.5%) |
| 60 to 89 Minutes | 160 (4.1%) | 169 (5.2%) |
| 90 or more Minutes | 187 (4.8%) | 30 (0.9%) |
Time of Departure to Work by Sex in Gretna
The most frequent times of departure to work in Gretna are 7:00 AM to 7:29 AM (563, 14.4%) for males and 7:30 AM to 7:59 AM (609, 18.7%) for females.
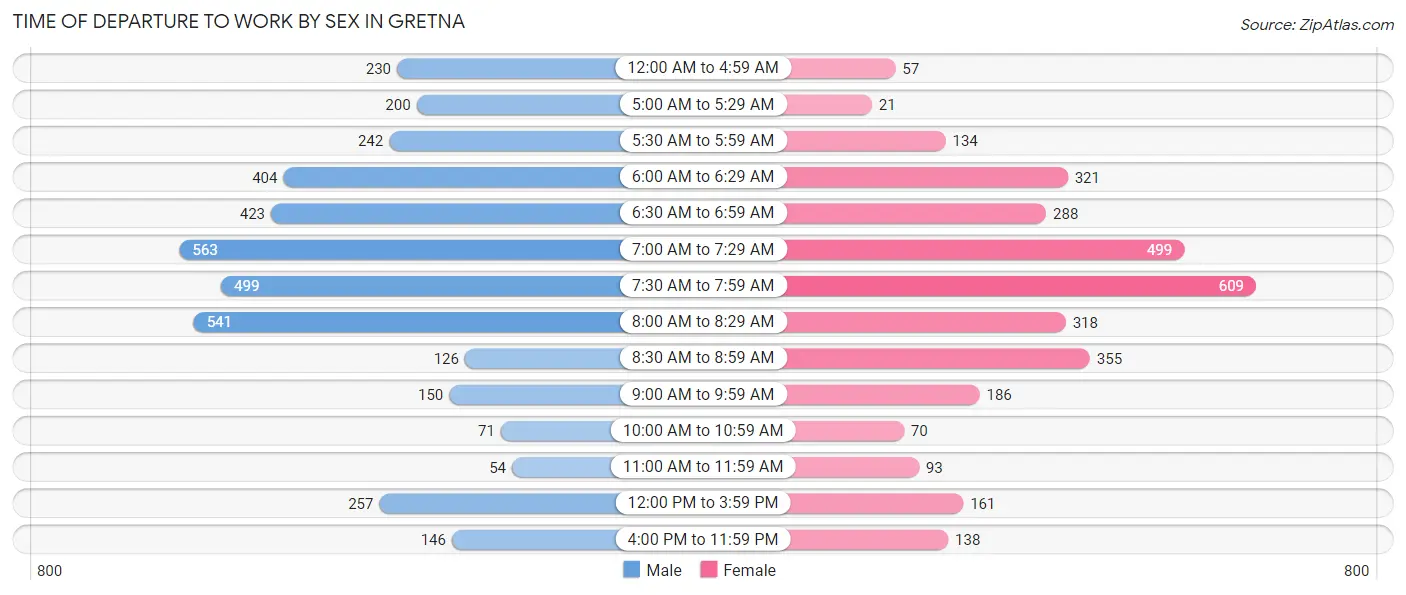
| Time of Departure | Male | Female |
| 12:00 AM to 4:59 AM | 230 (5.9%) | 57 (1.8%) |
| 5:00 AM to 5:29 AM | 200 (5.1%) | 21 (0.6%) |
| 5:30 AM to 5:59 AM | 242 (6.2%) | 134 (4.1%) |
| 6:00 AM to 6:29 AM | 404 (10.3%) | 321 (9.9%) |
| 6:30 AM to 6:59 AM | 423 (10.8%) | 288 (8.9%) |
| 7:00 AM to 7:29 AM | 563 (14.4%) | 499 (15.3%) |
| 7:30 AM to 7:59 AM | 499 (12.8%) | 609 (18.7%) |
| 8:00 AM to 8:29 AM | 541 (13.9%) | 318 (9.8%) |
| 8:30 AM to 8:59 AM | 126 (3.2%) | 355 (10.9%) |
| 9:00 AM to 9:59 AM | 150 (3.8%) | 186 (5.7%) |
| 10:00 AM to 10:59 AM | 71 (1.8%) | 70 (2.1%) |
| 11:00 AM to 11:59 AM | 54 (1.4%) | 93 (2.9%) |
| 12:00 PM to 3:59 PM | 257 (6.6%) | 161 (5.0%) |
| 4:00 PM to 11:59 PM | 146 (3.7%) | 138 (4.3%) |
| Total | 3,906 (100.0%) | 3,250 (100.0%) |
Housing Occupancy in Gretna
Occupancy by Ownership in Gretna
Of the total 7,678 dwellings in Gretna, owner-occupied units account for 3,809 (49.6%), while renter-occupied units make up 3,869 (50.4%).
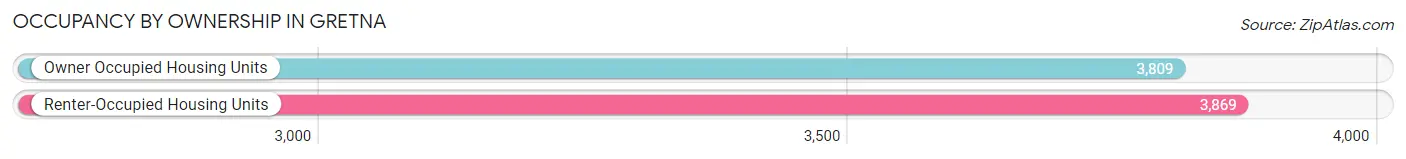
| Occupancy | # Housing Units | % Housing Units |
| Owner Occupied Housing Units | 3,809 | 49.6% |
| Renter-Occupied Housing Units | 3,869 | 50.4% |
| Total Occupied Housing Units | 7,678 | 100.0% |
Occupancy by Household Size in Gretna
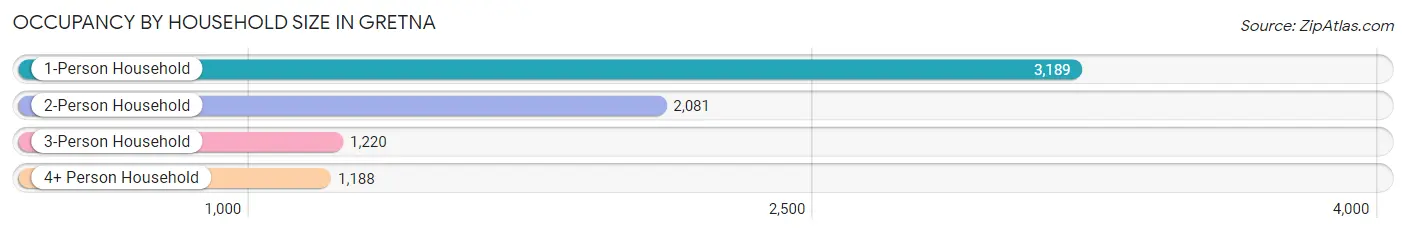
| Household Size | # Housing Units | % Housing Units |
| 1-Person Household | 3,189 | 41.5% |
| 2-Person Household | 2,081 | 27.1% |
| 3-Person Household | 1,220 | 15.9% |
| 4+ Person Household | 1,188 | 15.5% |
| Total Housing Units | 7,678 | 100.0% |
Occupancy by Ownership by Household Size in Gretna
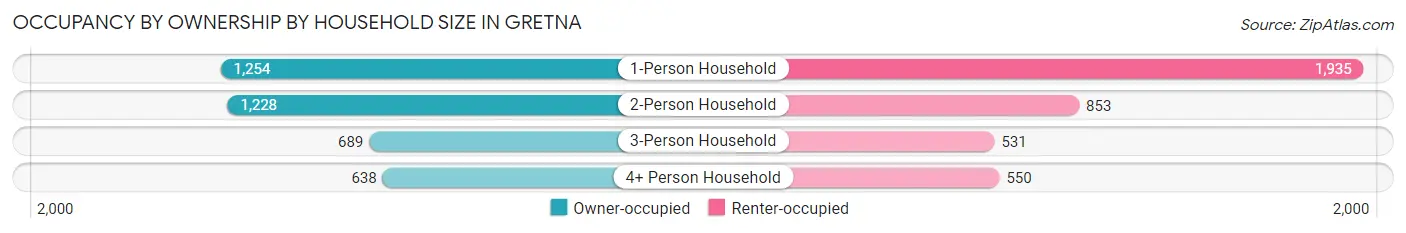
| Household Size | Owner-occupied | Renter-occupied |
| 1-Person Household | 1,254 (39.3%) | 1,935 (60.7%) |
| 2-Person Household | 1,228 (59.0%) | 853 (41.0%) |
| 3-Person Household | 689 (56.5%) | 531 (43.5%) |
| 4+ Person Household | 638 (53.7%) | 550 (46.3%) |
| Total Housing Units | 3,809 (49.6%) | 3,869 (50.4%) |
Occupancy by Educational Attainment in Gretna
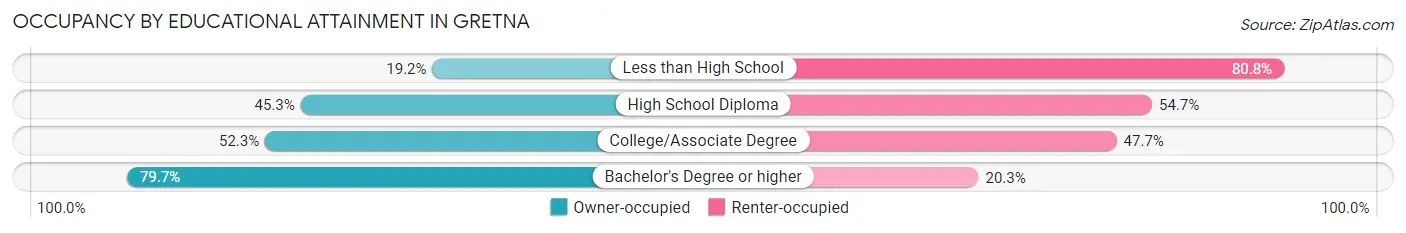
| Household Size | Owner-occupied | Renter-occupied |
| Less than High School | 362 (19.2%) | 1,527 (80.8%) |
| High School Diploma | 789 (45.3%) | 953 (54.7%) |
| College/Associate Degree | 1,084 (52.3%) | 988 (47.7%) |
| Bachelor's Degree or higher | 1,574 (79.7%) | 401 (20.3%) |
Occupancy by Age of Householder in Gretna
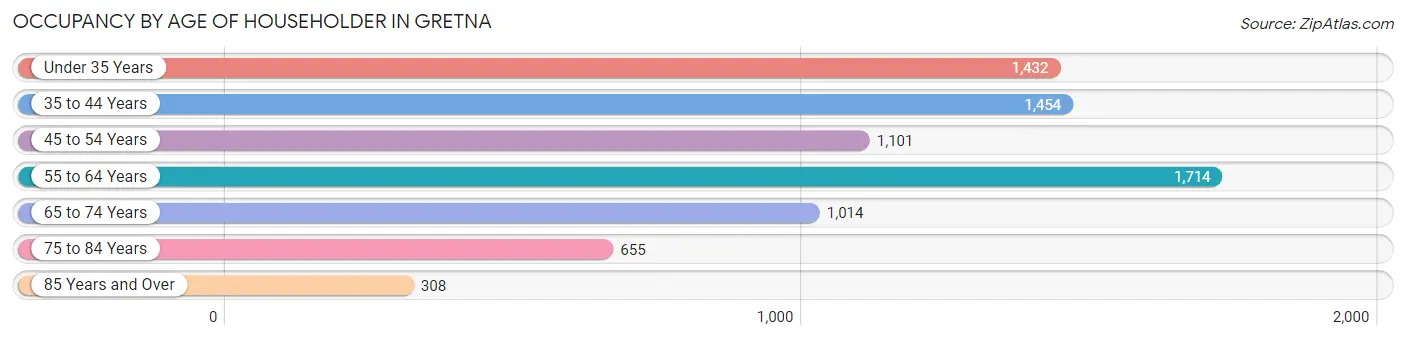
| Age Bracket | # Households | % Households |
| Under 35 Years | 1,432 | 18.6% |
| 35 to 44 Years | 1,454 | 18.9% |
| 45 to 54 Years | 1,101 | 14.3% |
| 55 to 64 Years | 1,714 | 22.3% |
| 65 to 74 Years | 1,014 | 13.2% |
| 75 to 84 Years | 655 | 8.5% |
| 85 Years and Over | 308 | 4.0% |
| Total | 7,678 | 100.0% |
Housing Finances in Gretna
Median Income by Occupancy in Gretna
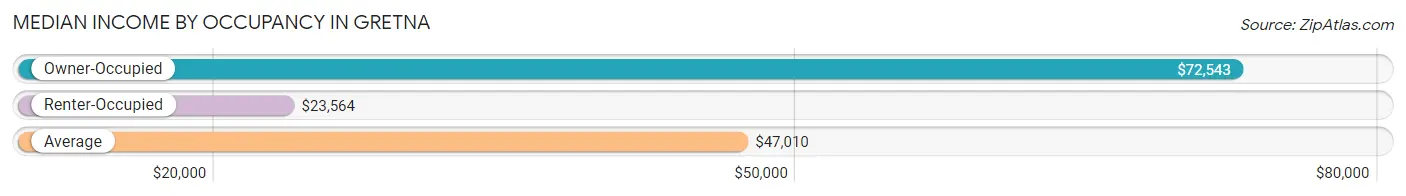
| Occupancy Type | # Households | Median Income |
| Owner-Occupied | 3,809 (49.6%) | $72,543 |
| Renter-Occupied | 3,869 (50.4%) | $23,564 |
| Average | 7,678 (100.0%) | $47,010 |
Occupancy by Householder Income Bracket in Gretna
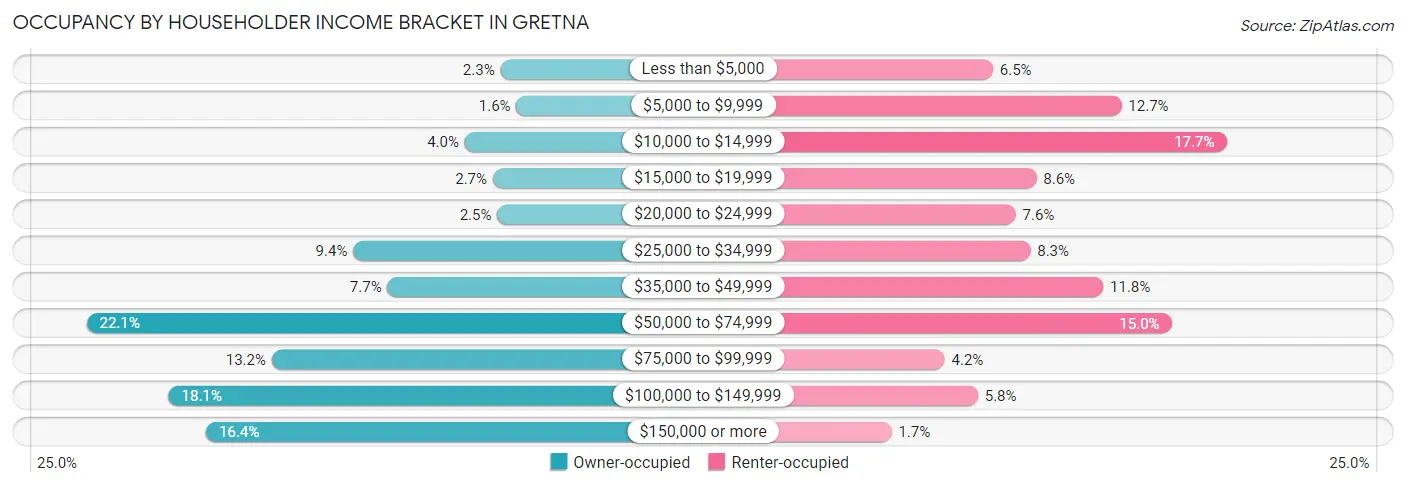
| Income Bracket | Owner-occupied | Renter-occupied |
| Less than $5,000 | 89 (2.3%) | 253 (6.5%) |
| $5,000 to $9,999 | 60 (1.6%) | 490 (12.7%) |
| $10,000 to $14,999 | 154 (4.0%) | 683 (17.6%) |
| $15,000 to $19,999 | 103 (2.7%) | 333 (8.6%) |
| $20,000 to $24,999 | 95 (2.5%) | 295 (7.6%) |
| $25,000 to $34,999 | 356 (9.3%) | 322 (8.3%) |
| $35,000 to $49,999 | 294 (7.7%) | 456 (11.8%) |
| $50,000 to $74,999 | 840 (22.1%) | 582 (15.0%) |
| $75,000 to $99,999 | 504 (13.2%) | 164 (4.2%) |
| $100,000 to $149,999 | 691 (18.1%) | 225 (5.8%) |
| $150,000 or more | 623 (16.4%) | 66 (1.7%) |
| Total | 3,809 (100.0%) | 3,869 (100.0%) |
Monthly Housing Cost Tiers in Gretna
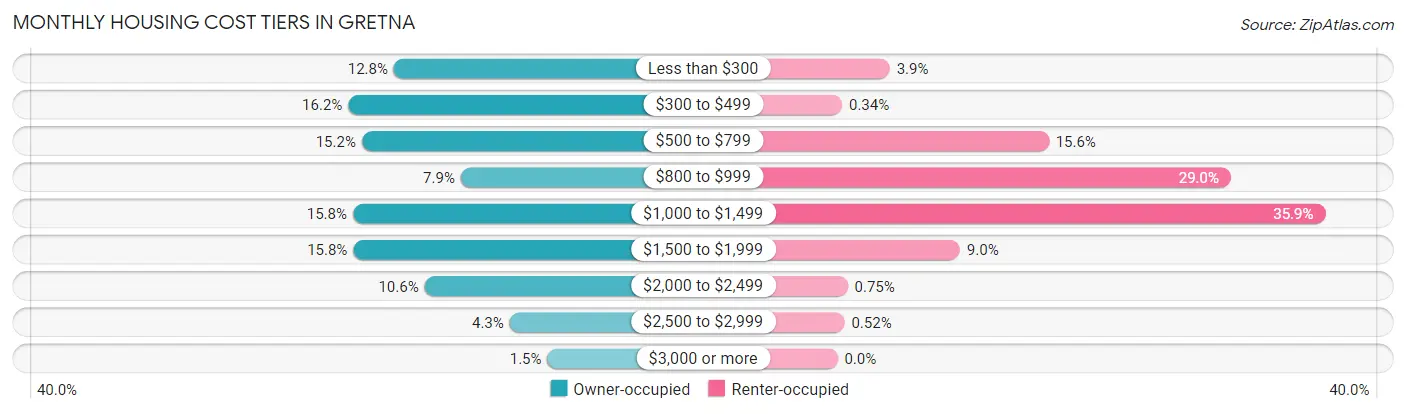
| Monthly Cost | Owner-occupied | Renter-occupied |
| Less than $300 | 488 (12.8%) | 149 (3.8%) |
| $300 to $499 | 616 (16.2%) | 13 (0.3%) |
| $500 to $799 | 578 (15.2%) | 602 (15.6%) |
| $800 to $999 | 300 (7.9%) | 1,121 (29.0%) |
| $1,000 to $1,499 | 603 (15.8%) | 1,390 (35.9%) |
| $1,500 to $1,999 | 602 (15.8%) | 349 (9.0%) |
| $2,000 to $2,499 | 402 (10.5%) | 29 (0.7%) |
| $2,500 to $2,999 | 163 (4.3%) | 20 (0.5%) |
| $3,000 or more | 57 (1.5%) | 0 (0.0%) |
| Total | 3,809 (100.0%) | 3,869 (100.0%) |
Physical Housing Characteristics in Gretna
Housing Structures in Gretna
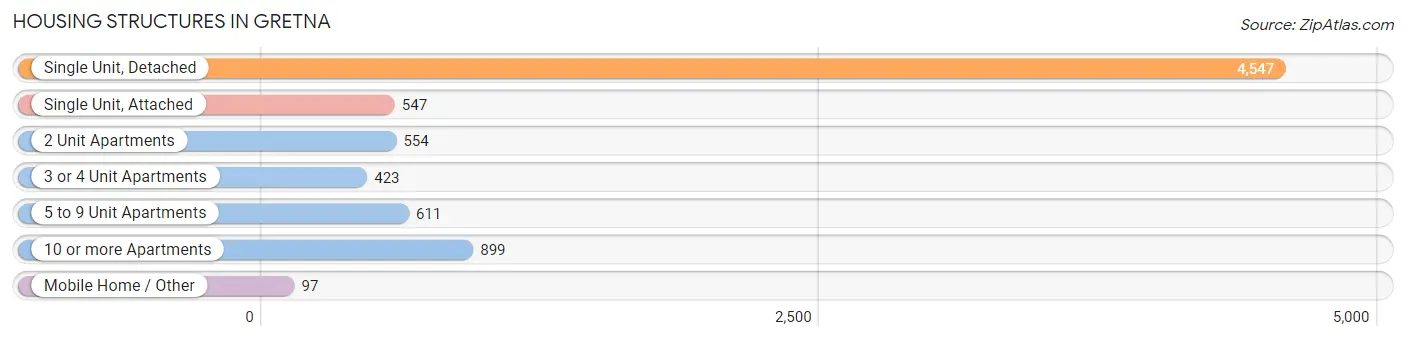
| Structure Type | # Housing Units | % Housing Units |
| Single Unit, Detached | 4,547 | 59.2% |
| Single Unit, Attached | 547 | 7.1% |
| 2 Unit Apartments | 554 | 7.2% |
| 3 or 4 Unit Apartments | 423 | 5.5% |
| 5 to 9 Unit Apartments | 611 | 8.0% |
| 10 or more Apartments | 899 | 11.7% |
| Mobile Home / Other | 97 | 1.3% |
| Total | 7,678 | 100.0% |
Housing Structures by Occupancy in Gretna
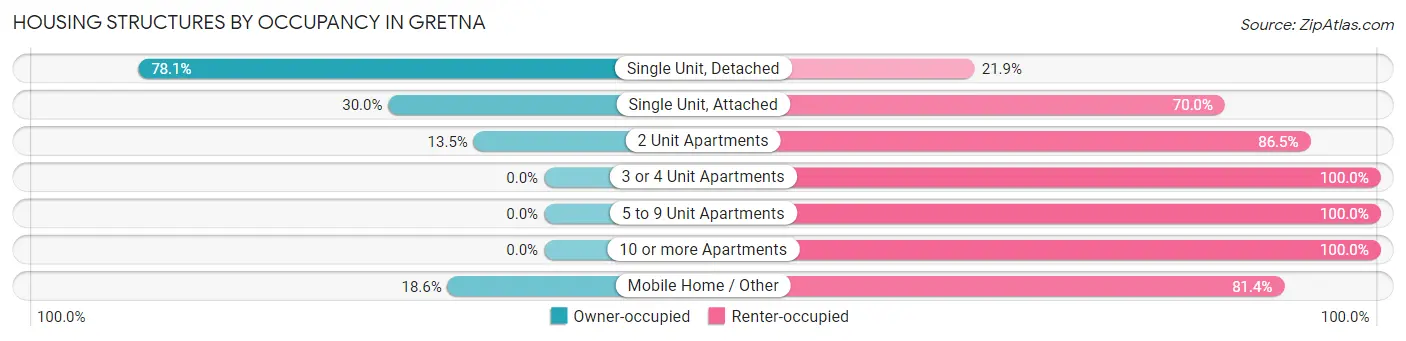
| Structure Type | Owner-occupied | Renter-occupied |
| Single Unit, Detached | 3,552 (78.1%) | 995 (21.9%) |
| Single Unit, Attached | 164 (30.0%) | 383 (70.0%) |
| 2 Unit Apartments | 75 (13.5%) | 479 (86.5%) |
| 3 or 4 Unit Apartments | 0 (0.0%) | 423 (100.0%) |
| 5 to 9 Unit Apartments | 0 (0.0%) | 611 (100.0%) |
| 10 or more Apartments | 0 (0.0%) | 899 (100.0%) |
| Mobile Home / Other | 18 (18.6%) | 79 (81.4%) |
| Total | 3,809 (49.6%) | 3,869 (50.4%) |
Housing Structures by Number of Rooms in Gretna
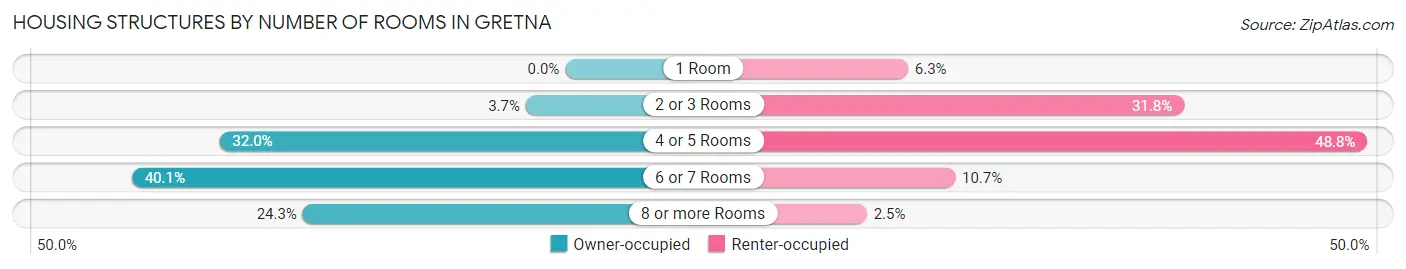
| Number of Rooms | Owner-occupied | Renter-occupied |
| 1 Room | 0 (0.0%) | 243 (6.3%) |
| 2 or 3 Rooms | 139 (3.6%) | 1,231 (31.8%) |
| 4 or 5 Rooms | 1,218 (32.0%) | 1,887 (48.8%) |
| 6 or 7 Rooms | 1,527 (40.1%) | 412 (10.6%) |
| 8 or more Rooms | 925 (24.3%) | 96 (2.5%) |
| Total | 3,809 (100.0%) | 3,869 (100.0%) |
Housing Structure by Heating Type in Gretna
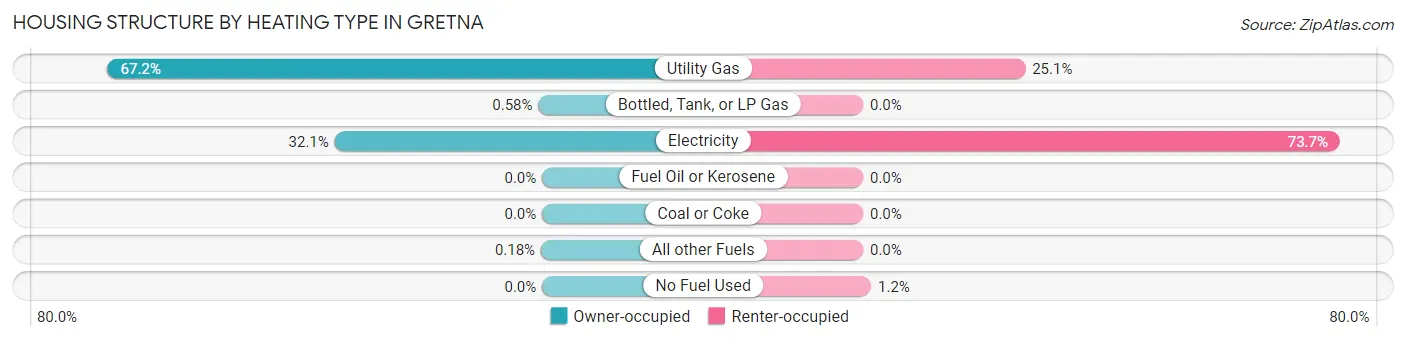
| Heating Type | Owner-occupied | Renter-occupied |
| Utility Gas | 2,558 (67.2%) | 970 (25.1%) |
| Bottled, Tank, or LP Gas | 22 (0.6%) | 0 (0.0%) |
| Electricity | 1,222 (32.1%) | 2,851 (73.7%) |
| Fuel Oil or Kerosene | 0 (0.0%) | 0 (0.0%) |
| Coal or Coke | 0 (0.0%) | 0 (0.0%) |
| All other Fuels | 7 (0.2%) | 0 (0.0%) |
| No Fuel Used | 0 (0.0%) | 48 (1.2%) |
| Total | 3,809 (100.0%) | 3,869 (100.0%) |
Household Vehicle Usage in Gretna
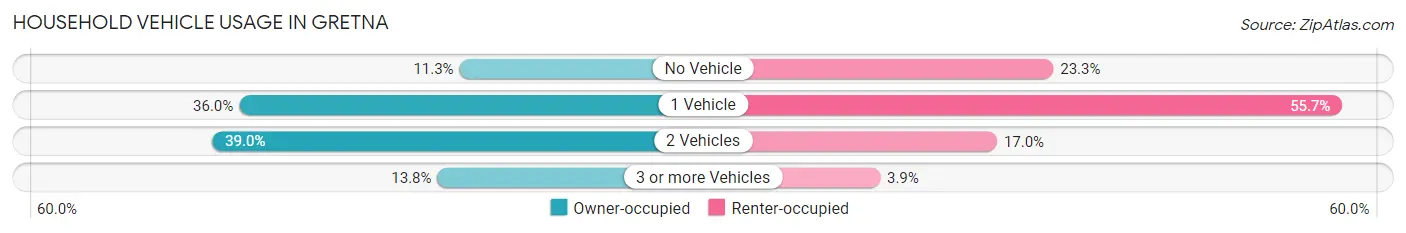
| Vehicles per Household | Owner-occupied | Renter-occupied |
| No Vehicle | 430 (11.3%) | 903 (23.3%) |
| 1 Vehicle | 1,370 (36.0%) | 2,155 (55.7%) |
| 2 Vehicles | 1,485 (39.0%) | 659 (17.0%) |
| 3 or more Vehicles | 524 (13.8%) | 152 (3.9%) |
| Total | 3,809 (100.0%) | 3,869 (100.0%) |
Real Estate & Mortgages in Gretna
Real Estate and Mortgage Overview in Gretna
| Characteristic | Without Mortgage | With Mortgage |
| Housing Units | 1,944 | 1,865 |
| Median Property Value | $211,600 | $241,400 |
| Median Household Income | $58,810 | $469 |
| Monthly Housing Costs | $454 | $56 |
| Real Estate Taxes | $1,092 | $146 |
Property Value by Mortgage Status in Gretna
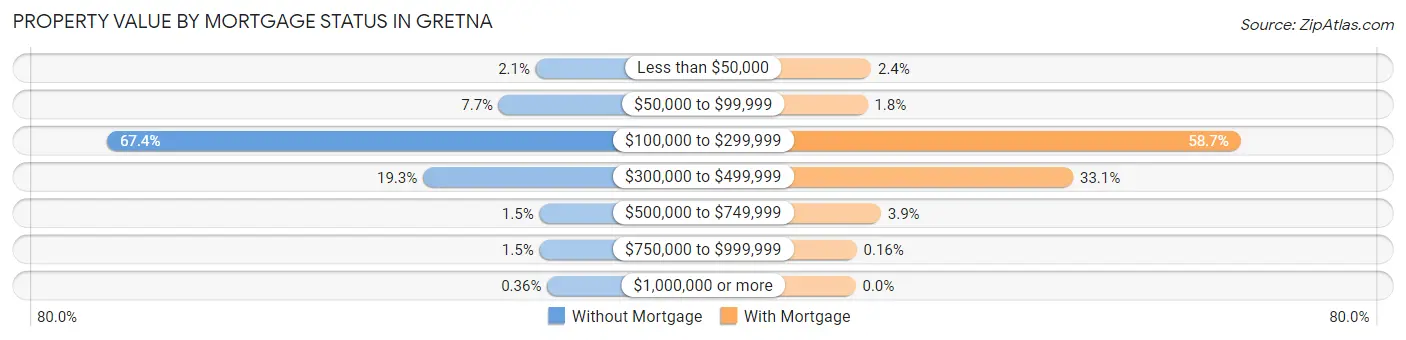
| Property Value | Without Mortgage | With Mortgage |
| Less than $50,000 | 41 (2.1%) | 44 (2.4%) |
| $50,000 to $99,999 | 150 (7.7%) | 34 (1.8%) |
| $100,000 to $299,999 | 1,311 (67.4%) | 1,094 (58.7%) |
| $300,000 to $499,999 | 375 (19.3%) | 618 (33.1%) |
| $500,000 to $749,999 | 30 (1.5%) | 72 (3.9%) |
| $750,000 to $999,999 | 30 (1.5%) | 3 (0.2%) |
| $1,000,000 or more | 7 (0.4%) | 0 (0.0%) |
| Total | 1,944 (100.0%) | 1,865 (100.0%) |
Household Income by Mortgage Status in Gretna
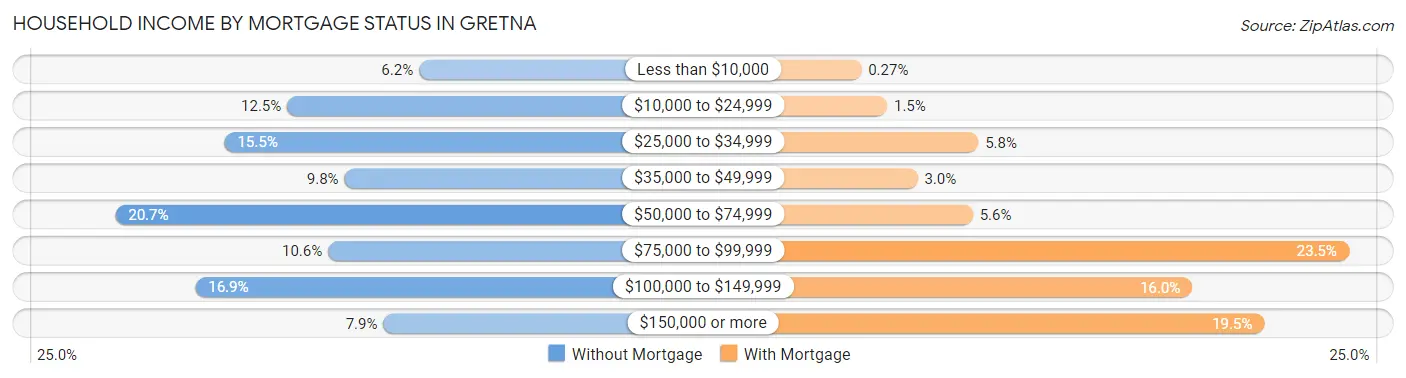
| Household Income | Without Mortgage | With Mortgage |
| Less than $10,000 | 121 (6.2%) | 5 (0.3%) |
| $10,000 to $24,999 | 243 (12.5%) | 28 (1.5%) |
| $25,000 to $34,999 | 301 (15.5%) | 109 (5.8%) |
| $35,000 to $49,999 | 190 (9.8%) | 55 (2.9%) |
| $50,000 to $74,999 | 402 (20.7%) | 104 (5.6%) |
| $75,000 to $99,999 | 205 (10.5%) | 438 (23.5%) |
| $100,000 to $149,999 | 328 (16.9%) | 299 (16.0%) |
| $150,000 or more | 154 (7.9%) | 363 (19.5%) |
| Total | 1,944 (100.0%) | 1,865 (100.0%) |
Property Value to Household Income Ratio in Gretna
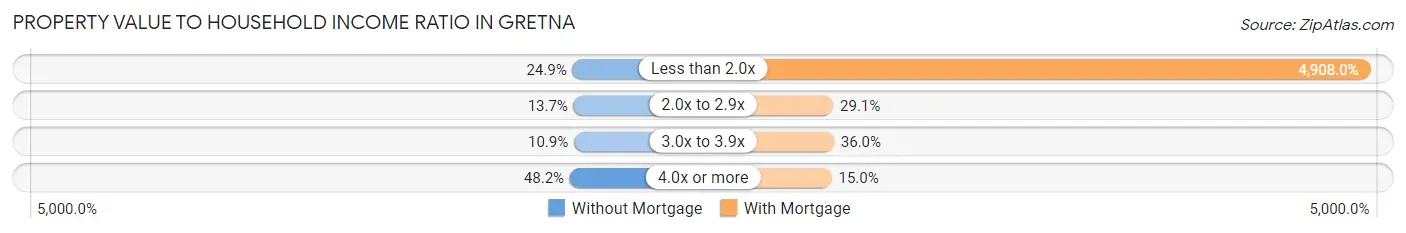
| Value-to-Income Ratio | Without Mortgage | With Mortgage |
| Less than 2.0x | 483 (24.8%) | 91,534 (4,908.0%) |
| 2.0x to 2.9x | 266 (13.7%) | 542 (29.1%) |
| 3.0x to 3.9x | 212 (10.9%) | 671 (36.0%) |
| 4.0x or more | 937 (48.2%) | 280 (15.0%) |
| Total | 1,944 (100.0%) | 1,865 (100.0%) |
Real Estate Taxes by Mortgage Status in Gretna
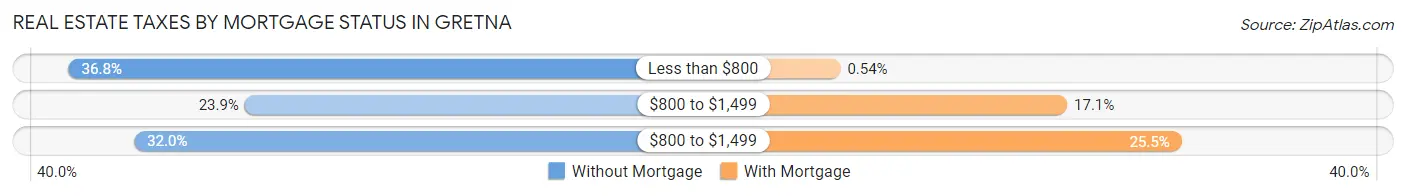
| Property Taxes | Without Mortgage | With Mortgage |
| Less than $800 | 715 (36.8%) | 10 (0.5%) |
| $800 to $1,499 | 465 (23.9%) | 319 (17.1%) |
| $800 to $1,499 | 622 (32.0%) | 475 (25.5%) |
| Total | 1,944 (100.0%) | 1,865 (100.0%) |
Health & Disability in Gretna
Health Insurance Coverage by Age in Gretna
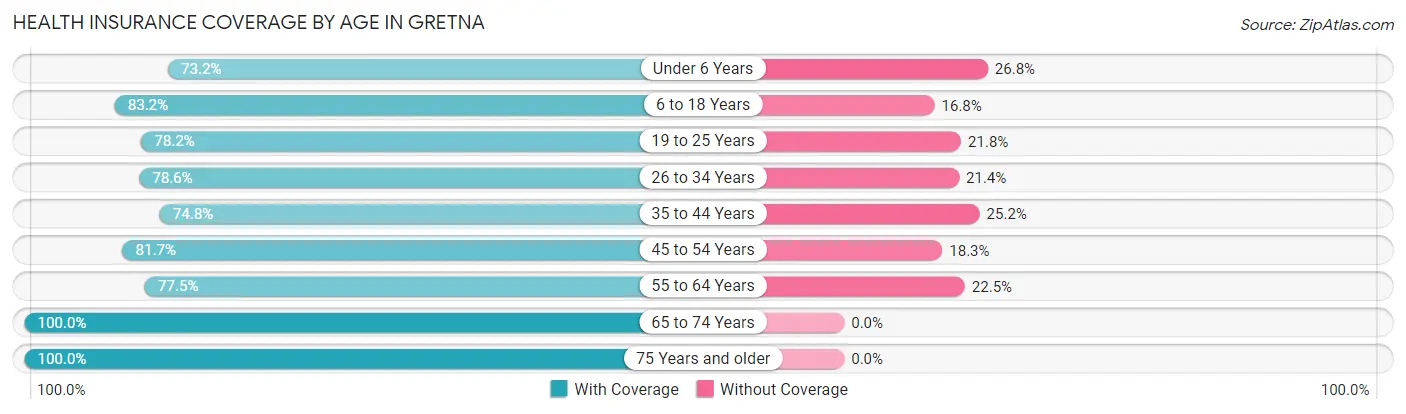
| Age Bracket | With Coverage | Without Coverage |
| Under 6 Years | 924 (73.2%) | 338 (26.8%) |
| 6 to 18 Years | 2,044 (83.2%) | 414 (16.8%) |
| 19 to 25 Years | 1,120 (78.2%) | 312 (21.8%) |
| 26 to 34 Years | 1,542 (78.6%) | 420 (21.4%) |
| 35 to 44 Years | 1,792 (74.8%) | 605 (25.2%) |
| 45 to 54 Years | 1,541 (81.7%) | 345 (18.3%) |
| 55 to 64 Years | 1,927 (77.5%) | 559 (22.5%) |
| 65 to 74 Years | 1,512 (100.0%) | 0 (0.0%) |
| 75 Years and older | 1,223 (100.0%) | 0 (0.0%) |
| Total | 13,625 (82.0%) | 2,993 (18.0%) |
Health Insurance Coverage by Citizenship Status in Gretna
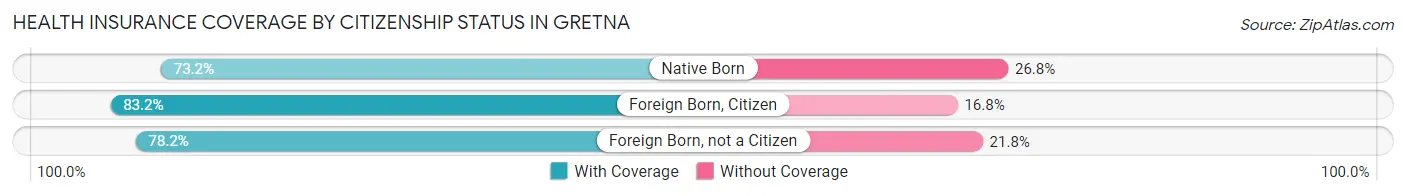
| Citizenship Status | With Coverage | Without Coverage |
| Native Born | 924 (73.2%) | 338 (26.8%) |
| Foreign Born, Citizen | 2,044 (83.2%) | 414 (16.8%) |
| Foreign Born, not a Citizen | 1,120 (78.2%) | 312 (21.8%) |
Health Insurance Coverage by Household Income in Gretna
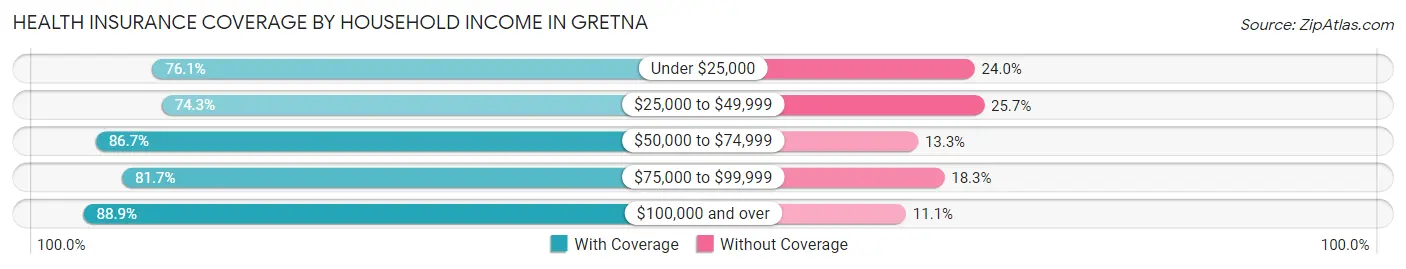
| Household Income | With Coverage | Without Coverage |
| Under $25,000 | 3,254 (76.0%) | 1,025 (23.9%) |
| $25,000 to $49,999 | 1,965 (74.3%) | 680 (25.7%) |
| $50,000 to $74,999 | 2,796 (86.7%) | 430 (13.3%) |
| $75,000 to $99,999 | 1,670 (81.7%) | 373 (18.3%) |
| $100,000 and over | 3,895 (88.9%) | 485 (11.1%) |
Public vs Private Health Insurance Coverage by Age in Gretna
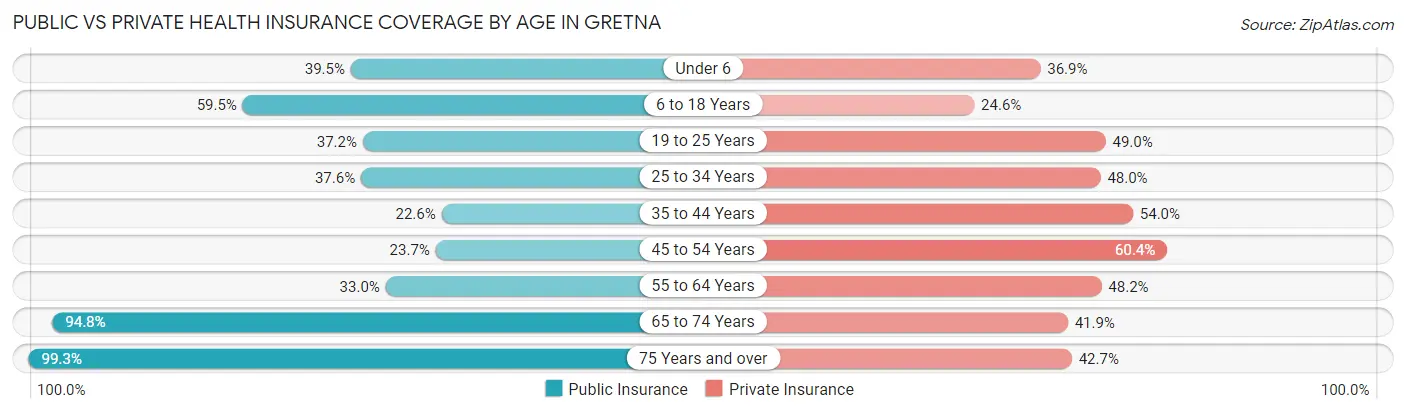
| Age Bracket | Public Insurance | Private Insurance |
| Under 6 | 498 (39.5%) | 465 (36.8%) |
| 6 to 18 Years | 1,463 (59.5%) | 604 (24.6%) |
| 19 to 25 Years | 533 (37.2%) | 701 (48.9%) |
| 25 to 34 Years | 737 (37.6%) | 942 (48.0%) |
| 35 to 44 Years | 542 (22.6%) | 1,295 (54.0%) |
| 45 to 54 Years | 447 (23.7%) | 1,139 (60.4%) |
| 55 to 64 Years | 820 (33.0%) | 1,198 (48.2%) |
| 65 to 74 Years | 1,434 (94.8%) | 634 (41.9%) |
| 75 Years and over | 1,214 (99.3%) | 522 (42.7%) |
| Total | 7,688 (46.3%) | 7,500 (45.1%) |
Disability Status by Sex by Age in Gretna
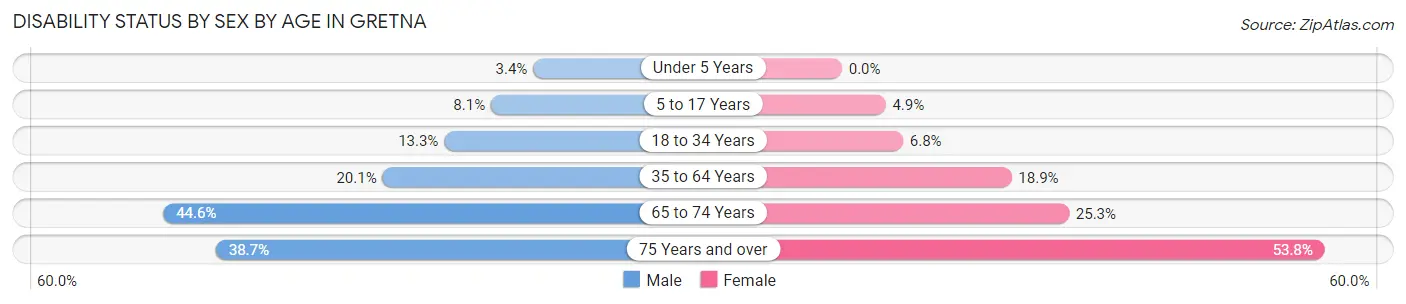
| Age Bracket | Male | Female |
| Under 5 Years | 19 (3.4%) | 0 (0.0%) |
| 5 to 17 Years | 102 (8.1%) | 64 (4.9%) |
| 18 to 34 Years | 223 (13.3%) | 122 (6.8%) |
| 35 to 64 Years | 695 (20.1%) | 627 (18.9%) |
| 65 to 74 Years | 258 (44.6%) | 236 (25.3%) |
| 75 Years and over | 202 (38.7%) | 377 (53.8%) |
Disability Class by Sex by Age in Gretna
Disability Class: Hearing Difficulty
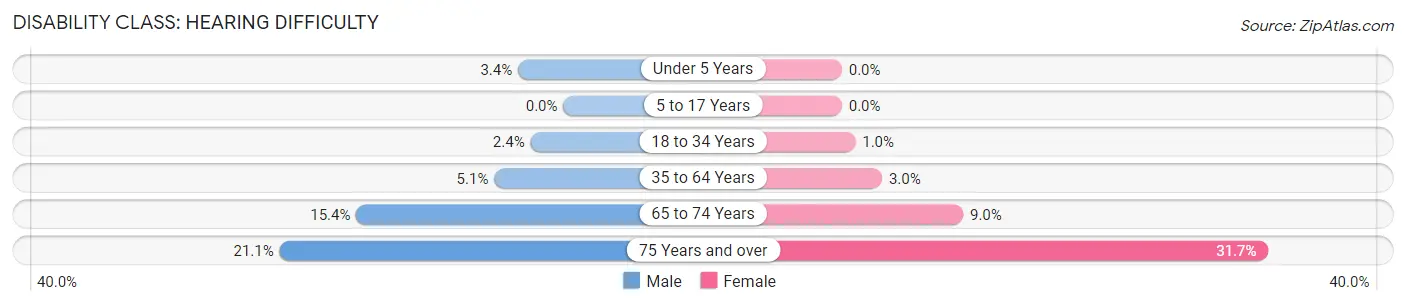
| Age Bracket | Male | Female |
| Under 5 Years | 19 (3.4%) | 0 (0.0%) |
| 5 to 17 Years | 0 (0.0%) | 0 (0.0%) |
| 18 to 34 Years | 41 (2.4%) | 18 (1.0%) |
| 35 to 64 Years | 177 (5.1%) | 99 (3.0%) |
| 65 to 74 Years | 89 (15.4%) | 84 (9.0%) |
| 75 Years and over | 110 (21.1%) | 222 (31.7%) |
Disability Class: Vision Difficulty
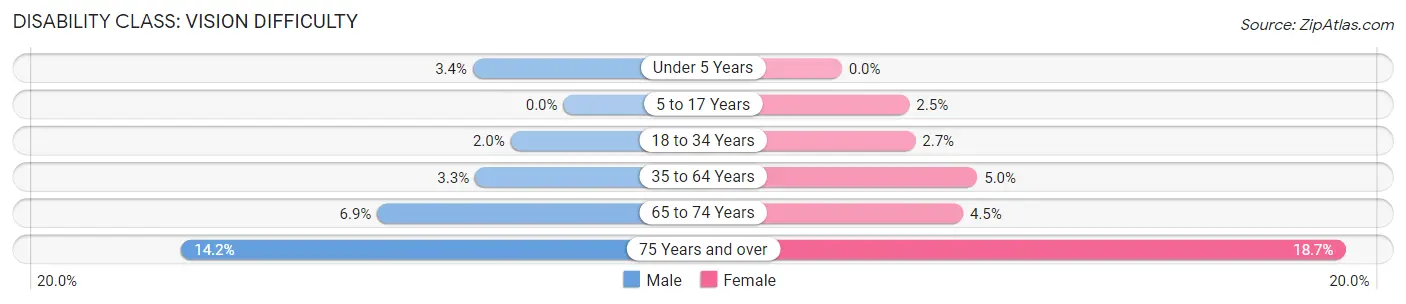
| Age Bracket | Male | Female |
| Under 5 Years | 19 (3.4%) | 0 (0.0%) |
| 5 to 17 Years | 0 (0.0%) | 33 (2.5%) |
| 18 to 34 Years | 33 (2.0%) | 49 (2.7%) |
| 35 to 64 Years | 113 (3.3%) | 167 (5.0%) |
| 65 to 74 Years | 40 (6.9%) | 42 (4.5%) |
| 75 Years and over | 74 (14.2%) | 131 (18.7%) |
Disability Class: Cognitive Difficulty
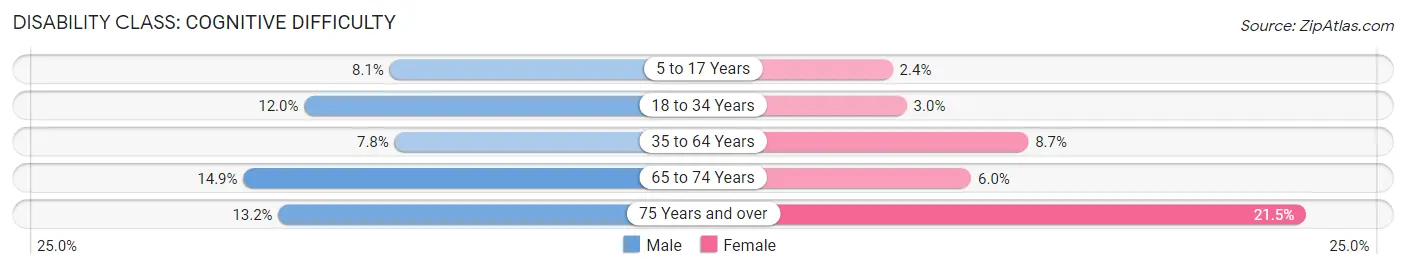
| Age Bracket | Male | Female |
| 5 to 17 Years | 102 (8.1%) | 31 (2.4%) |
| 18 to 34 Years | 202 (12.0%) | 54 (3.0%) |
| 35 to 64 Years | 270 (7.8%) | 287 (8.6%) |
| 65 to 74 Years | 86 (14.8%) | 56 (6.0%) |
| 75 Years and over | 69 (13.2%) | 151 (21.5%) |
Disability Class: Ambulatory Difficulty
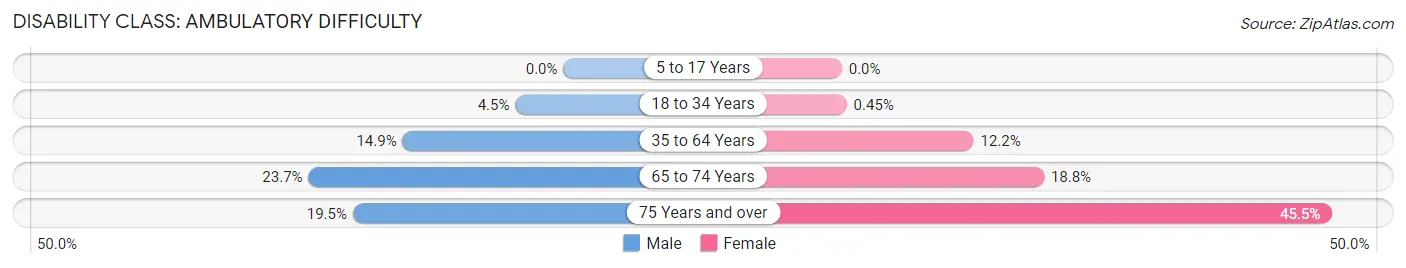
| Age Bracket | Male | Female |
| 5 to 17 Years | 0 (0.0%) | 0 (0.0%) |
| 18 to 34 Years | 75 (4.5%) | 8 (0.4%) |
| 35 to 64 Years | 515 (14.9%) | 406 (12.2%) |
| 65 to 74 Years | 137 (23.7%) | 175 (18.8%) |
| 75 Years and over | 102 (19.5%) | 319 (45.5%) |
Disability Class: Self-Care Difficulty
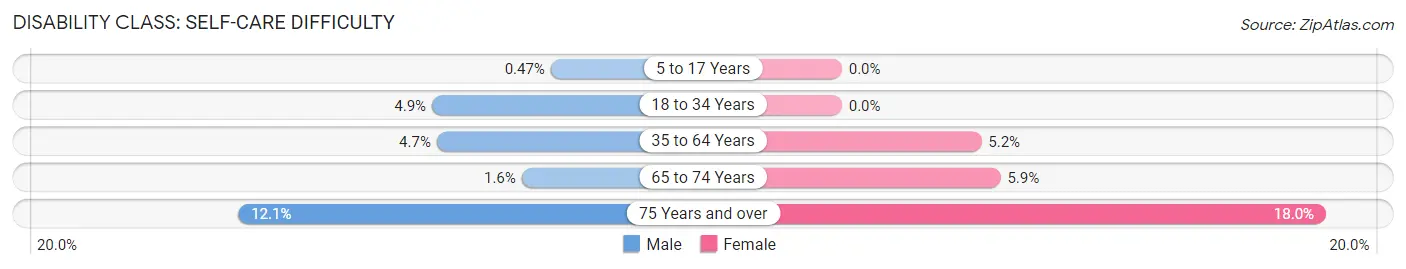
| Age Bracket | Male | Female |
| 5 to 17 Years | 6 (0.5%) | 0 (0.0%) |
| 18 to 34 Years | 82 (4.9%) | 0 (0.0%) |
| 35 to 64 Years | 162 (4.7%) | 172 (5.2%) |
| 65 to 74 Years | 9 (1.5%) | 55 (5.9%) |
| 75 Years and over | 63 (12.1%) | 126 (18.0%) |
Technology Access in Gretna
Computing Device Access in Gretna
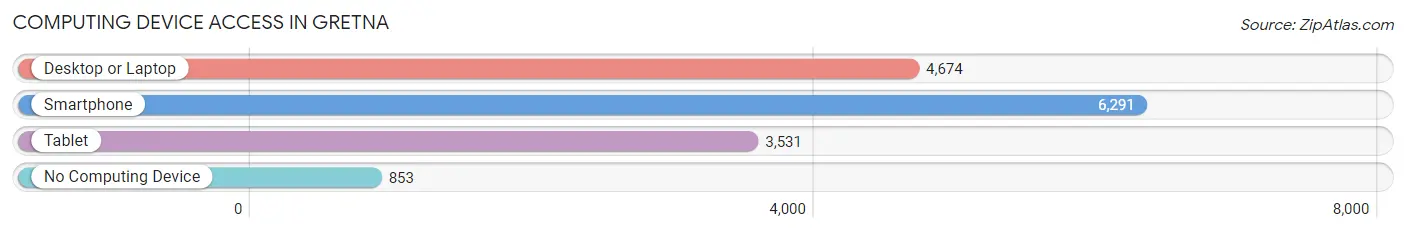
| Device Type | # Households | % Households |
| Desktop or Laptop | 4,674 | 60.9% |
| Smartphone | 6,291 | 81.9% |
| Tablet | 3,531 | 46.0% |
| No Computing Device | 853 | 11.1% |
| Total | 7,678 | 100.0% |
Internet Access in Gretna
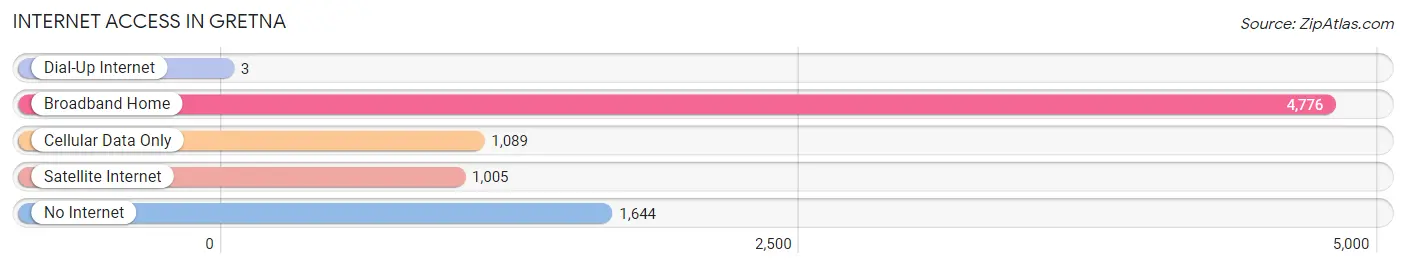
| Internet Type | # Households | % Households |
| Dial-Up Internet | 3 | 0.0% |
| Broadband Home | 4,776 | 62.2% |
| Cellular Data Only | 1,089 | 14.2% |
| Satellite Internet | 1,005 | 13.1% |
| No Internet | 1,644 | 21.4% |
| Total | 7,678 | 100.0% |
Gretna Summary
Gretna is a city located in Jefferson Parish, Louisiana, United States. It is situated on the west bank of the Mississippi River, across from the city of New Orleans. Gretna is the second-largest city in Jefferson Parish, and the largest city in the New Orleans metropolitan area. As of the 2010 census, the city had a population of 17,736.
History
Gretna was founded in 1836 by German immigrants who named the city after the German city of Gretna. The city was incorporated in 1913 and has since grown to become the second-largest city in Jefferson Parish.
Gretna was the site of a major battle during the Civil War, when Union forces attempted to capture the city from Confederate forces. The battle was unsuccessful, and the city remained in Confederate hands until the end of the war.
In the late 19th century, Gretna became a popular destination for immigrants from Europe, particularly from Italy and Ireland. The city also became a center for the manufacture of sugar and molasses.
Geography
Gretna is located at 29°54'N 90°3'W (29.9000, -90.0500). It is situated on the west bank of the Mississippi River, across from the city of New Orleans. The city has a total area of 8.2 square miles (21.2 km2), of which 8.1 square miles (21.0 km2) is land and 0.1 square miles (0.2 km2) is water.
Economy
Gretna is a major industrial center in the New Orleans metropolitan area. The city is home to several large manufacturing plants, including a sugar refinery, a molasses plant, and a paper mill. The city also has a large port, which is used for shipping and receiving goods.
Gretna is also home to several large retail stores, including Walmart, Target, and Home Depot. The city also has a large number of restaurants, bars, and other entertainment venues.
Demographics
As of the 2010 census, Gretna had a population of 17,736. The racial makeup of the city was 57.2% White, 33.3% African American, 0.4% Native American, 1.7% Asian, 0.1% Pacific Islander, 5.2% from other races, and 2.1% from two or more races. Hispanic or Latino of any race were 11.2% of the population.
The median income for a household in the city was $37,945, and the median income for a family was $45,945. Males had a median income of $35,945 versus $25,945 for females. The per capita income for the city was $19,945. About 11.2% of families and 13.3% of the population were below the poverty line, including 17.3% of those under age 18 and 8.3% of those age 65 or over.
Common Questions
What is Per Capita Income in Gretna?
Per Capita income in Gretna is $29,772.
What is the Median Family Income in Gretna?
Median Family Income in Gretna is $64,424.
What is the Median Household income in Gretna?
Median Household Income in Gretna is $47,010.
What is Income or Wage Gap in Gretna?
Income or Wage Gap in Gretna is 0.9%.
Women in Gretna earn 99.1 cents for every dollar earned by a man.
What is Family Income Deficit in Gretna?
Family Income Deficit in Gretna is $12,087.
Families that are below poverty line in Gretna earn $12,087 less on average than the poverty threshold level.
What is Inequality or Gini Index in Gretna?
Inequality or Gini Index in Gretna is 0.52.
What is the Total Population of Gretna?
Total Population of Gretna is 17,640.
What is the Total Male Population of Gretna?
Total Male Population of Gretna is 8,905.
What is the Total Female Population of Gretna?
Total Female Population of Gretna is 8,735.
What is the Ratio of Males per 100 Females in Gretna?
There are 101.95 Males per 100 Females in Gretna.
What is the Ratio of Females per 100 Males in Gretna?
There are 98.09 Females per 100 Males in Gretna.
What is the Median Population Age in Gretna?
Median Population Age in Gretna is 39.0 Years.
What is the Average Family Size in Gretna
Average Family Size in Gretna is 2.9 People.
What is the Average Household Size in Gretna
Average Household Size in Gretna is 2.2 People.
How Large is the Labor Force in Gretna?
There are 8,363 People in the Labor Forcein in Gretna.
What is the Percentage of People in the Labor Force in Gretna?
58.3% of People are in the Labor Force in Gretna.
What is the Unemployment Rate in Gretna?
Unemployment Rate in Gretna is 6.9%.