Lake Charles, LA Map & Demographics
Lake Charles Map
Lake Charles Overview
$34,341
PER CAPITA INCOME
$74,758
AVG FAMILY INCOME
$54,761
AVG HOUSEHOLD INCOME
45.6%
WAGE / INCOME GAP [ % ]
54.4¢/ $1
WAGE / INCOME GAP [ $ ]
$9,821
FAMILY INCOME DEFICIT
0.53
INEQUALITY / GINI INDEX
82,430
TOTAL POPULATION
40,423
MALE POPULATION
42,007
FEMALE POPULATION
96.23
MALES / 100 FEMALES
103.92
FEMALES / 100 MALES
35.7
MEDIAN AGE
3.3
AVG FAMILY SIZE
2.5
AVG HOUSEHOLD SIZE
38,754
LABOR FORCE [ PEOPLE ]
59.1%
PERCENT IN LABOR FORCE
5.7%
UNEMPLOYMENT RATE
Lake Charles Area Codes
Income in Lake Charles
Income Overview in Lake Charles
Per Capita Income in Lake Charles is $34,341, while median incomes of families and households are $74,758 and $54,761 respectively.
| Characteristic | Number | Measure |
| Per Capita Income | 82,430 | $34,341 |
| Median Family Income | 18,625 | $74,758 |
| Mean Family Income | 18,625 | $109,996 |
| Median Household Income | 32,187 | $54,761 |
| Mean Household Income | 32,187 | $84,976 |
| Income Deficit | 18,625 | $9,821 |
| Wage / Income Gap (%) | 82,430 | 45.59% |
| Wage / Income Gap ($) | 82,430 | 54.41¢ per $1 |
| Gini / Inequality Index | 82,430 | 0.53 |
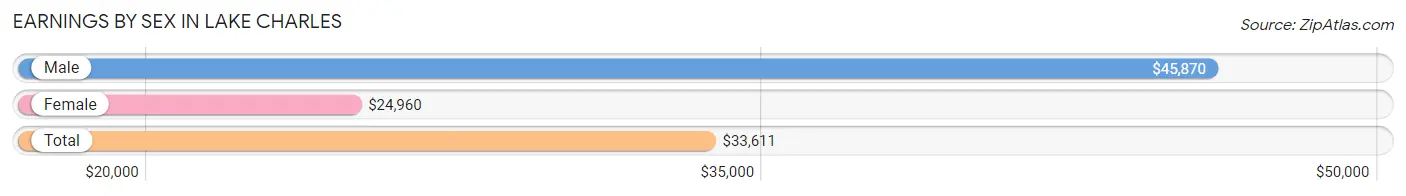
Earnings by Sex in Lake Charles
Average Earnings in Lake Charles are $33,611, $45,870 for men and $24,960 for women, a difference of 45.6%.
| Sex | Number | Average Earnings |
| Male | 19,980 (49.7%) | $45,870 |
| Female | 20,216 (50.3%) | $24,960 |
| Total | 40,196 (100.0%) | $33,611 |
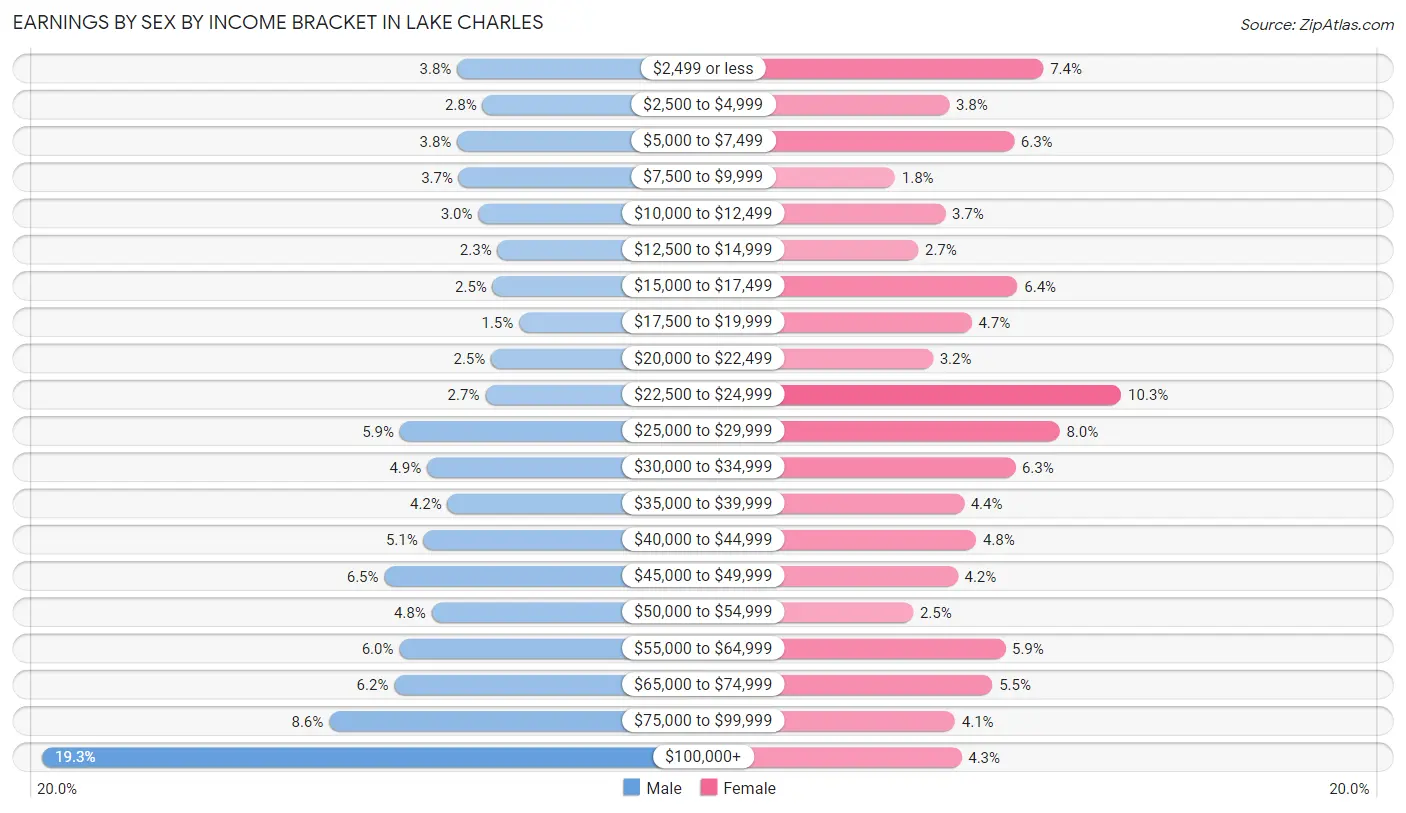
Earnings by Sex by Income Bracket in Lake Charles
The most common earnings brackets in Lake Charles are $100,000+ for men (3,864 | 19.3%) and $22,500 to $24,999 for women (2,079 | 10.3%).
| Income | Male | Female |
| $2,499 or less | 757 (3.8%) | 1,488 (7.4%) |
| $2,500 to $4,999 | 568 (2.8%) | 774 (3.8%) |
| $5,000 to $7,499 | 758 (3.8%) | 1,265 (6.3%) |
| $7,500 to $9,999 | 745 (3.7%) | 364 (1.8%) |
| $10,000 to $12,499 | 599 (3.0%) | 743 (3.7%) |
| $12,500 to $14,999 | 456 (2.3%) | 540 (2.7%) |
| $15,000 to $17,499 | 492 (2.5%) | 1,292 (6.4%) |
| $17,500 to $19,999 | 294 (1.5%) | 945 (4.7%) |
| $20,000 to $22,499 | 504 (2.5%) | 651 (3.2%) |
| $22,500 to $24,999 | 547 (2.7%) | 2,079 (10.3%) |
| $25,000 to $29,999 | 1,186 (5.9%) | 1,611 (8.0%) |
| $30,000 to $34,999 | 984 (4.9%) | 1,274 (6.3%) |
| $35,000 to $39,999 | 829 (4.2%) | 885 (4.4%) |
| $40,000 to $44,999 | 1,009 (5.1%) | 978 (4.8%) |
| $45,000 to $49,999 | 1,303 (6.5%) | 839 (4.2%) |
| $50,000 to $54,999 | 950 (4.8%) | 502 (2.5%) |
| $55,000 to $64,999 | 1,190 (6.0%) | 1,198 (5.9%) |
| $65,000 to $74,999 | 1,229 (6.1%) | 1,101 (5.4%) |
| $75,000 to $99,999 | 1,716 (8.6%) | 819 (4.1%) |
| $100,000+ | 3,864 (19.3%) | 868 (4.3%) |
| Total | 19,980 (100.0%) | 20,216 (100.0%) |
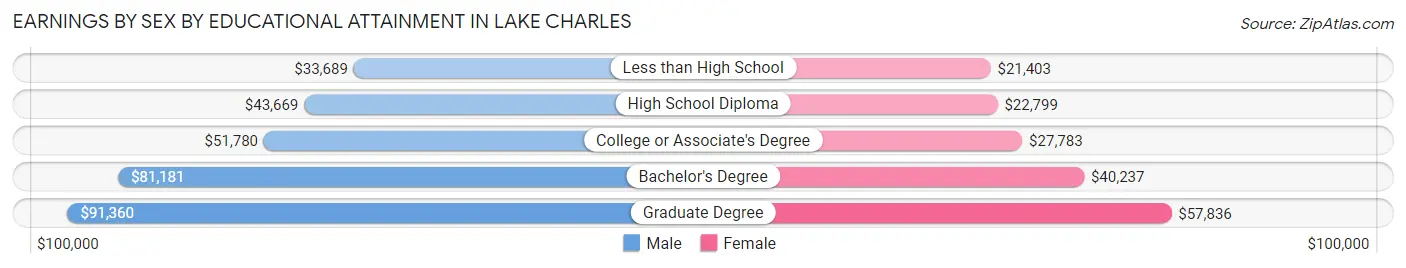
Earnings by Sex by Educational Attainment in Lake Charles
Average earnings in Lake Charles are $51,889 for men and $28,847 for women, a difference of 44.4%. Men with an educational attainment of graduate degree enjoy the highest average annual earnings of $91,360, while those with less than high school education earn the least with $33,689. Women with an educational attainment of graduate degree earn the most with the average annual earnings of $57,836, while those with less than high school education have the smallest earnings of $21,403.
| Educational Attainment | Male Income | Female Income |
| Less than High School | $33,689 | $21,403 |
| High School Diploma | $43,669 | $22,799 |
| College or Associate's Degree | $51,780 | $27,783 |
| Bachelor's Degree | $81,181 | $40,237 |
| Graduate Degree | $91,360 | $57,836 |
| Total | $51,889 | $28,847 |
Family Income in Lake Charles
Family Income Brackets in Lake Charles
According to the Lake Charles family income data, there are 3,911 families falling into the $100,000 to $149,999 income range, which is the most common income bracket and makes up 21.0% of all families. Conversely, the $10,000 to $14,999 income bracket is the least frequent group with only 577 families (3.1%) belonging to this category.
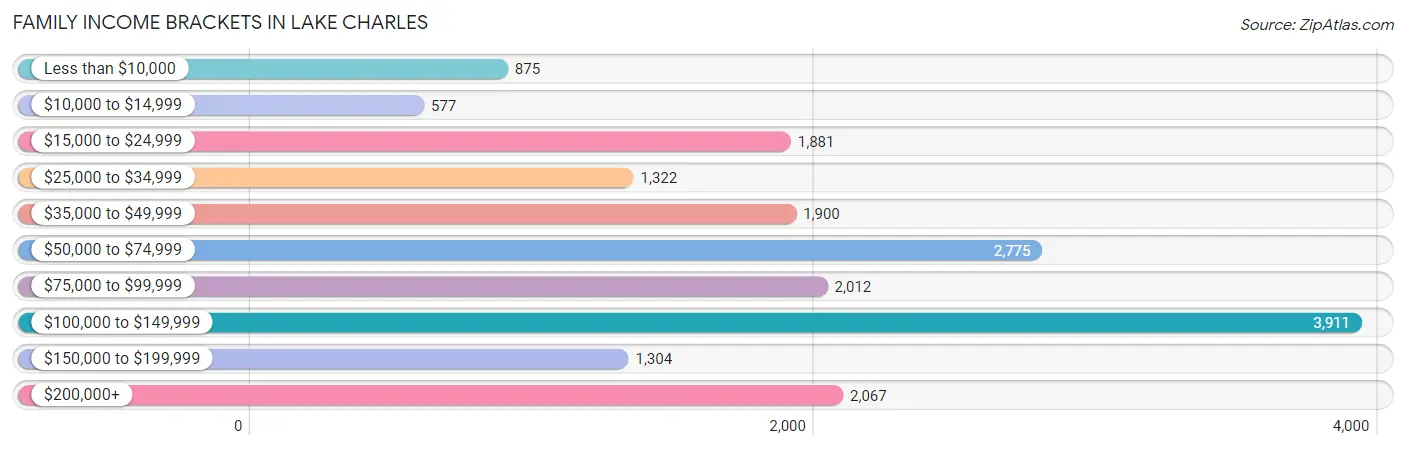
| Income Bracket | # Families | % Families |
| Less than $10,000 | 875 | 4.7% |
| $10,000 to $14,999 | 577 | 3.1% |
| $15,000 to $24,999 | 1,881 | 10.1% |
| $25,000 to $34,999 | 1,322 | 7.1% |
| $35,000 to $49,999 | 1,900 | 10.2% |
| $50,000 to $74,999 | 2,775 | 14.9% |
| $75,000 to $99,999 | 2,012 | 10.8% |
| $100,000 to $149,999 | 3,911 | 21.0% |
| $150,000 to $199,999 | 1,304 | 7.0% |
| $200,000+ | 2,067 | 11.1% |
Family Income by Famaliy Size in Lake Charles
5-person families (1,751 | 9.4%) account for the highest median family income in Lake Charles with $123,244 per family, while 2-person families (9,528 | 51.2%) have the highest median income of $34,186 per family member.
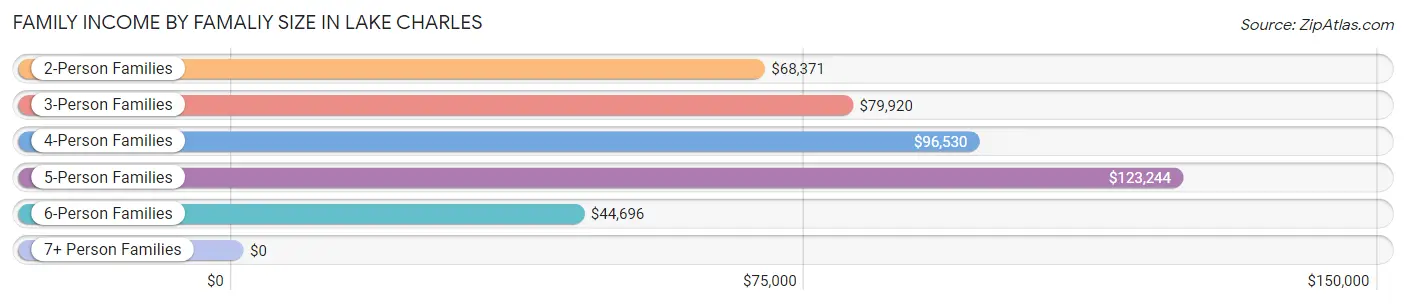
| Income Bracket | # Families | Median Income |
| 2-Person Families | 9,528 (51.2%) | $68,371 |
| 3-Person Families | 4,011 (21.5%) | $79,920 |
| 4-Person Families | 2,813 (15.1%) | $96,530 |
| 5-Person Families | 1,751 (9.4%) | $123,244 |
| 6-Person Families | 389 (2.1%) | $44,696 |
| 7+ Person Families | 133 (0.7%) | $0 |
| Total | 18,625 (100.0%) | $74,758 |
Family Income by Number of Earners in Lake Charles
The median family income in Lake Charles is $74,758, with families comprising 3+ earners (1,159) having the highest median family income of $134,612, while families with no earners (3,602) have the lowest median family income of $34,318, accounting for 6.2% and 19.3% of families, respectively.
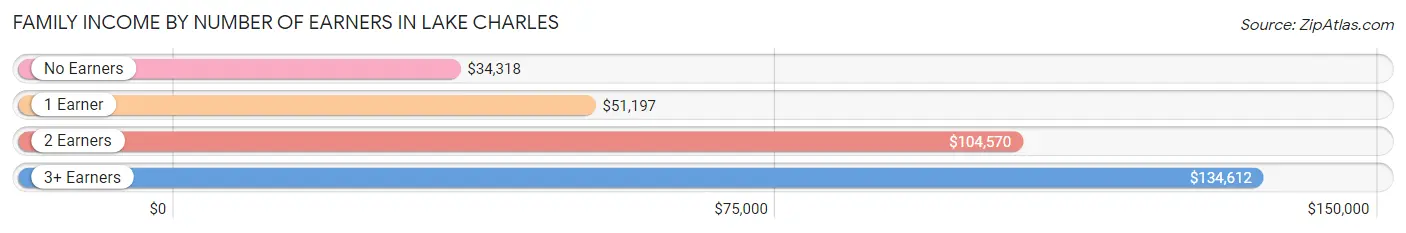
| Number of Earners | # Families | Median Income |
| No Earners | 3,602 (19.3%) | $34,318 |
| 1 Earner | 6,163 (33.1%) | $51,197 |
| 2 Earners | 7,701 (41.3%) | $104,570 |
| 3+ Earners | 1,159 (6.2%) | $134,612 |
| Total | 18,625 (100.0%) | $74,758 |
Household Income in Lake Charles
Household Income Brackets in Lake Charles
With 5,182 households falling in the category, the $50,000 to $74,999 income range is the most frequent in Lake Charles, accounting for 16.1% of all households. In contrast, only 1,545 households (4.8%) fall into the $150,000 to $199,999 income bracket, making it the least populous group.
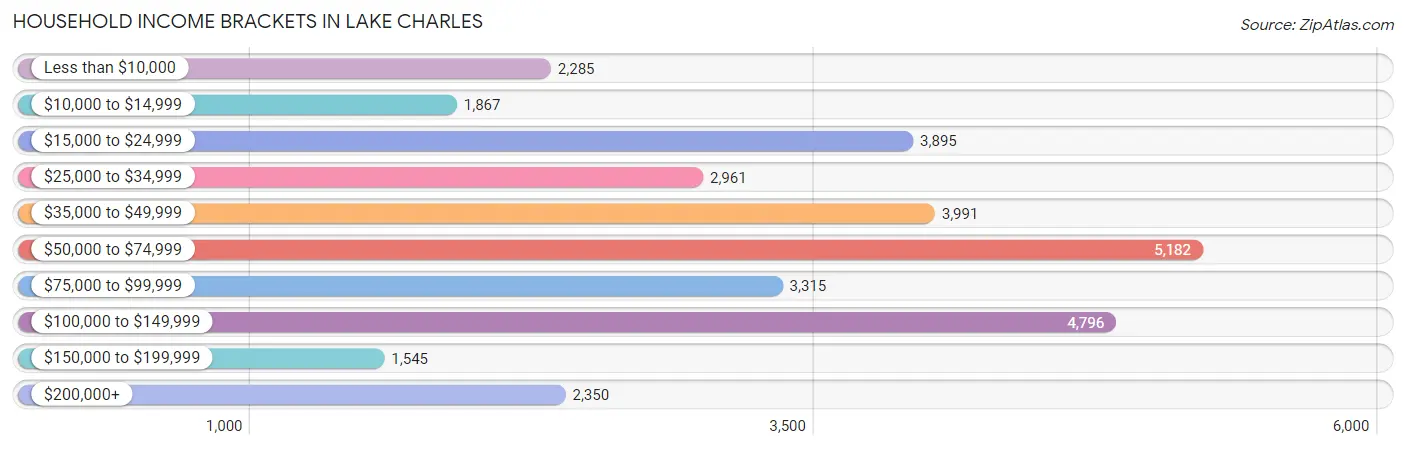
| Income Bracket | # Households | % Households |
| Less than $10,000 | 2,285 | 7.1% |
| $10,000 to $14,999 | 1,867 | 5.8% |
| $15,000 to $24,999 | 3,895 | 12.1% |
| $25,000 to $34,999 | 2,961 | 9.2% |
| $35,000 to $49,999 | 3,991 | 12.4% |
| $50,000 to $74,999 | 5,182 | 16.1% |
| $75,000 to $99,999 | 3,315 | 10.3% |
| $100,000 to $149,999 | 4,796 | 14.9% |
| $150,000 to $199,999 | 1,545 | 4.8% |
| $200,000+ | 2,350 | 7.3% |
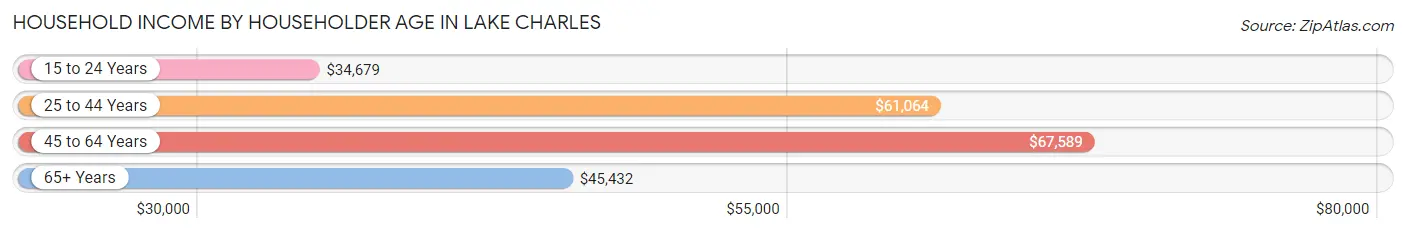
Household Income by Householder Age in Lake Charles
The median household income in Lake Charles is $54,761, with the highest median household income of $67,589 found in the 45 to 64 years age bracket for the primary householder. A total of 11,156 households (34.7%) fall into this category. Meanwhile, the 15 to 24 years age bracket for the primary householder has the lowest median household income of $34,679, with 2,129 households (6.6%) in this group.
| Income Bracket | # Households | Median Income |
| 15 to 24 Years | 2,129 (6.6%) | $34,679 |
| 25 to 44 Years | 9,964 (31.0%) | $61,064 |
| 45 to 64 Years | 11,156 (34.7%) | $67,589 |
| 65+ Years | 8,938 (27.8%) | $45,432 |
| Total | 32,187 (100.0%) | $54,761 |
Poverty in Lake Charles
Income Below Poverty by Sex and Age in Lake Charles
With 20.9% poverty level for males and 24.1% for females among the residents of Lake Charles, 12 to 14 year old males and 5 year old females are the most vulnerable to poverty, with 851 males (46.9%) and 170 females (40.2%) in their respective age groups living below the poverty level.
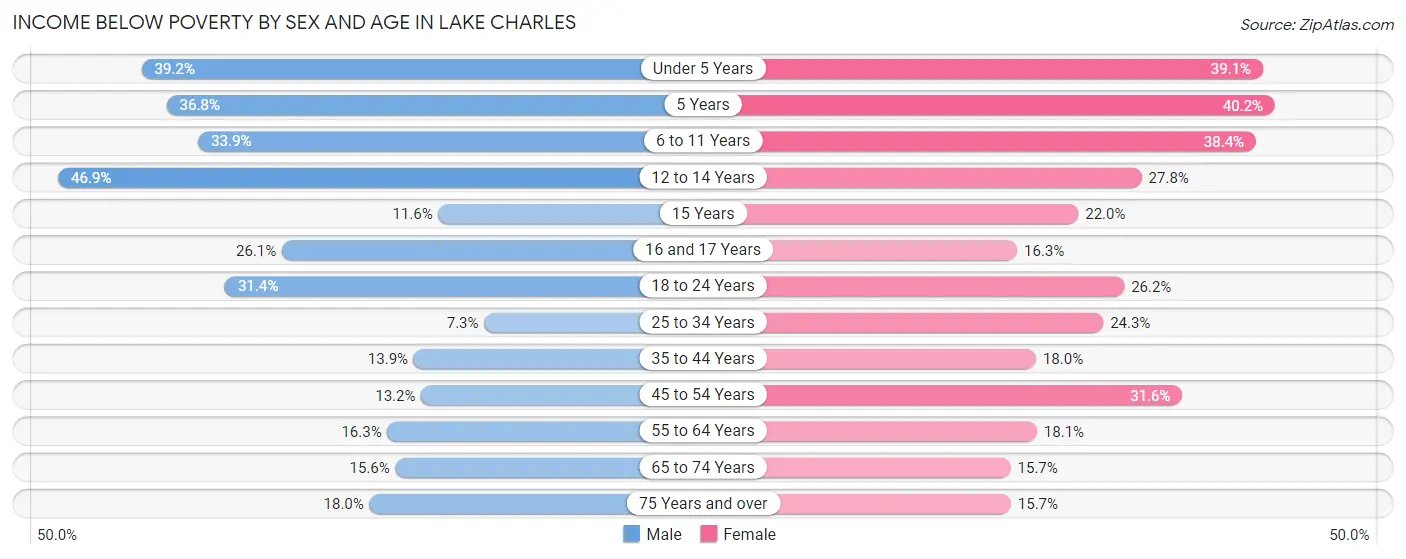
| Age Bracket | Male | Female |
| Under 5 Years | 1,241 (39.2%) | 879 (39.1%) |
| 5 Years | 74 (36.8%) | 170 (40.2%) |
| 6 to 11 Years | 1,209 (33.9%) | 1,118 (38.4%) |
| 12 to 14 Years | 851 (46.9%) | 379 (27.8%) |
| 15 Years | 72 (11.6%) | 90 (22.0%) |
| 16 and 17 Years | 208 (26.1%) | 130 (16.3%) |
| 18 to 24 Years | 1,158 (31.4%) | 1,074 (26.2%) |
| 25 to 34 Years | 425 (7.3%) | 1,685 (24.3%) |
| 35 to 44 Years | 655 (13.9%) | 859 (18.0%) |
| 45 to 54 Years | 578 (13.2%) | 1,424 (31.6%) |
| 55 to 64 Years | 722 (16.3%) | 954 (18.1%) |
| 65 to 74 Years | 524 (15.6%) | 626 (15.7%) |
| 75 Years and over | 434 (18.0%) | 524 (15.7%) |
| Total | 8,151 (20.9%) | 9,912 (24.1%) |
Income Above Poverty by Sex and Age in Lake Charles
According to the poverty statistics in Lake Charles, males aged 25 to 34 years and females aged 65 to 74 years are the age groups that are most secure financially, with 92.7% of males and 84.3% of females in these age groups living above the poverty line.
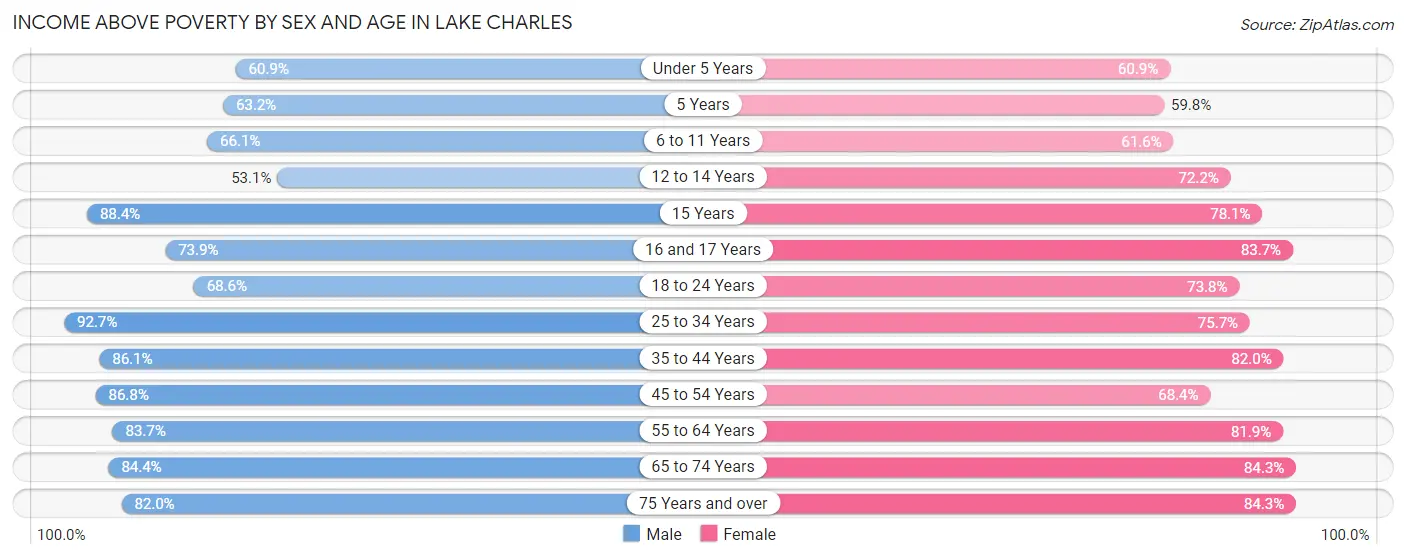
| Age Bracket | Male | Female |
| Under 5 Years | 1,929 (60.9%) | 1,370 (60.9%) |
| 5 Years | 127 (63.2%) | 253 (59.8%) |
| 6 to 11 Years | 2,358 (66.1%) | 1,791 (61.6%) |
| 12 to 14 Years | 964 (53.1%) | 983 (72.2%) |
| 15 Years | 550 (88.4%) | 320 (78.0%) |
| 16 and 17 Years | 589 (73.9%) | 669 (83.7%) |
| 18 to 24 Years | 2,530 (68.6%) | 3,024 (73.8%) |
| 25 to 34 Years | 5,371 (92.7%) | 5,261 (75.7%) |
| 35 to 44 Years | 4,066 (86.1%) | 3,907 (82.0%) |
| 45 to 54 Years | 3,806 (86.8%) | 3,083 (68.4%) |
| 55 to 64 Years | 3,702 (83.7%) | 4,314 (81.9%) |
| 65 to 74 Years | 2,842 (84.4%) | 3,369 (84.3%) |
| 75 Years and over | 1,980 (82.0%) | 2,816 (84.3%) |
| Total | 30,814 (79.1%) | 31,160 (75.9%) |
Income Below Poverty Among Married-Couple Families in Lake Charles
The poverty statistics for married-couple families in Lake Charles show that 7.0% or 854 of the total 12,248 families live below the poverty line. Families with 5 or more children have the highest poverty rate of 45.5%, comprising of 20 families. On the other hand, families with no children have the lowest poverty rate of 6.3%, which includes 491 families.
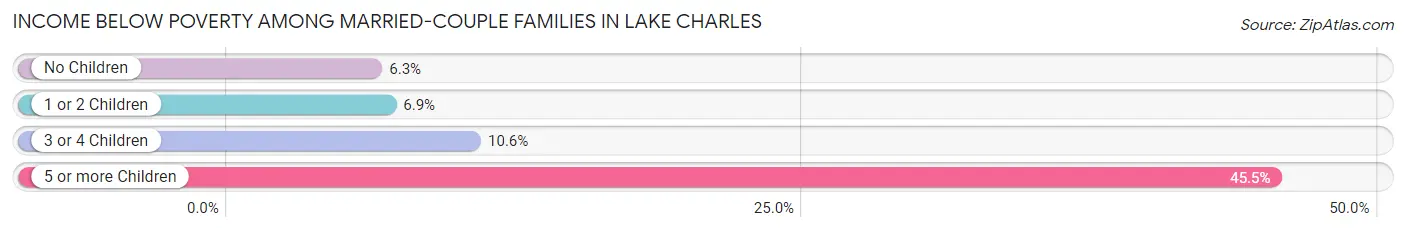
| Children | Above Poverty | Below Poverty |
| No Children | 7,325 (93.7%) | 491 (6.3%) |
| 1 or 2 Children | 3,056 (93.1%) | 226 (6.9%) |
| 3 or 4 Children | 989 (89.4%) | 117 (10.6%) |
| 5 or more Children | 24 (54.5%) | 20 (45.5%) |
| Total | 11,394 (93.0%) | 854 (7.0%) |
Income Below Poverty Among Single-Parent Households in Lake Charles
According to the poverty data in Lake Charles, 21.1% or 230 single-father households and 37.0% or 1,957 single-mother households are living below the poverty line. Among single-father households, those with 3 or 4 children have the highest poverty rate, with 126 households (40.8%) experiencing poverty. Likewise, among single-mother households, those with 5 or more children have the highest poverty rate, with 5 households (100.0%) falling below the poverty line.
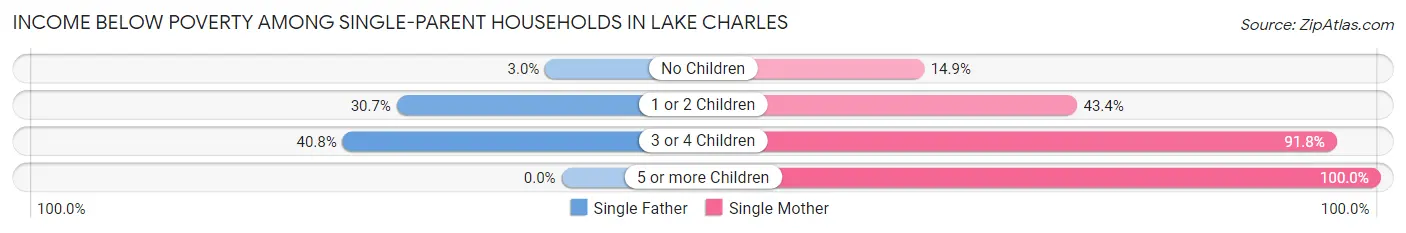
| Children | Single Father | Single Mother |
| No Children | 15 (3.0%) | 310 (14.9%) |
| 1 or 2 Children | 89 (30.7%) | 1,161 (43.4%) |
| 3 or 4 Children | 126 (40.8%) | 481 (91.8%) |
| 5 or more Children | 0 (0.0%) | 5 (100.0%) |
| Total | 230 (21.1%) | 1,957 (37.0%) |
Income Below Poverty Among Married-Couple vs Single-Parent Households in Lake Charles
The poverty data for Lake Charles shows that 854 of the married-couple family households (7.0%) and 2,187 of the single-parent households (34.3%) are living below the poverty level. Within the married-couple family households, those with 5 or more children have the highest poverty rate, with 20 households (45.5%) falling below the poverty line. Among the single-parent households, those with 5 or more children have the highest poverty rate, with 5 household (100.0%) living below poverty.
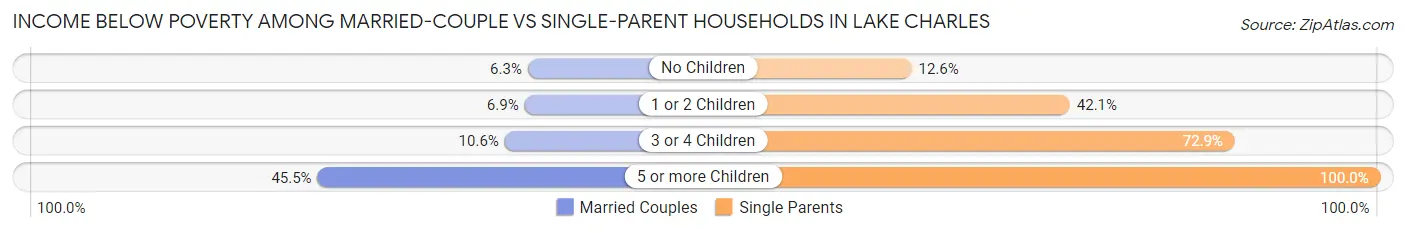
| Children | Married-Couple Families | Single-Parent Households |
| No Children | 491 (6.3%) | 325 (12.6%) |
| 1 or 2 Children | 226 (6.9%) | 1,250 (42.1%) |
| 3 or 4 Children | 117 (10.6%) | 607 (72.9%) |
| 5 or more Children | 20 (45.5%) | 5 (100.0%) |
| Total | 854 (7.0%) | 2,187 (34.3%) |
Race in Lake Charles
The most populous races in Lake Charles are Black / African American (37,754 | 45.8%), White / Caucasian (37,396 | 45.4%), and Two or more Races (4,255 | 5.2%).
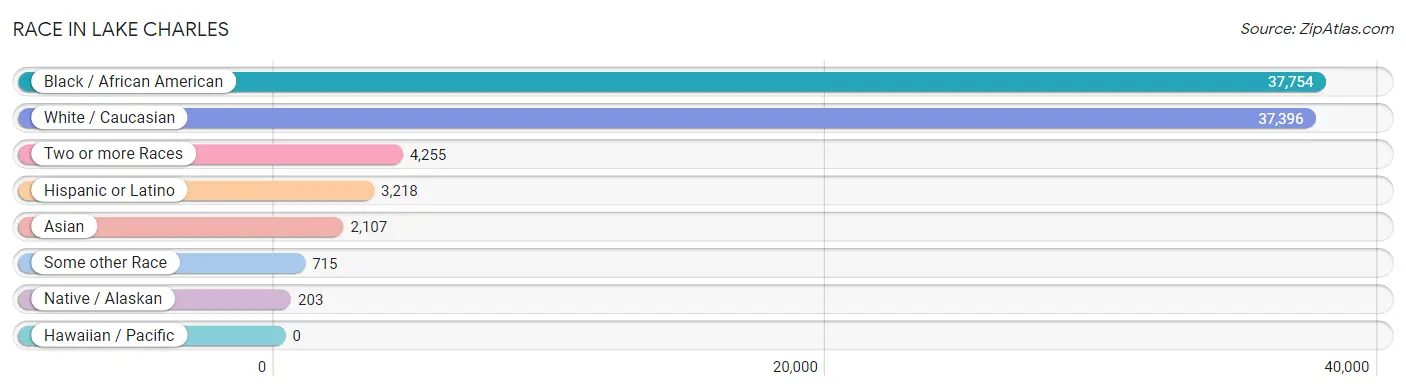
| Race | # Population | % Population |
| Asian | 2,107 | 2.6% |
| Black / African American | 37,754 | 45.8% |
| Hawaiian / Pacific | 0 | 0.0% |
| Hispanic or Latino | 3,218 | 3.9% |
| Native / Alaskan | 203 | 0.3% |
| White / Caucasian | 37,396 | 45.4% |
| Two or more Races | 4,255 | 5.2% |
| Some other Race | 715 | 0.9% |
| Total | 82,430 | 100.0% |
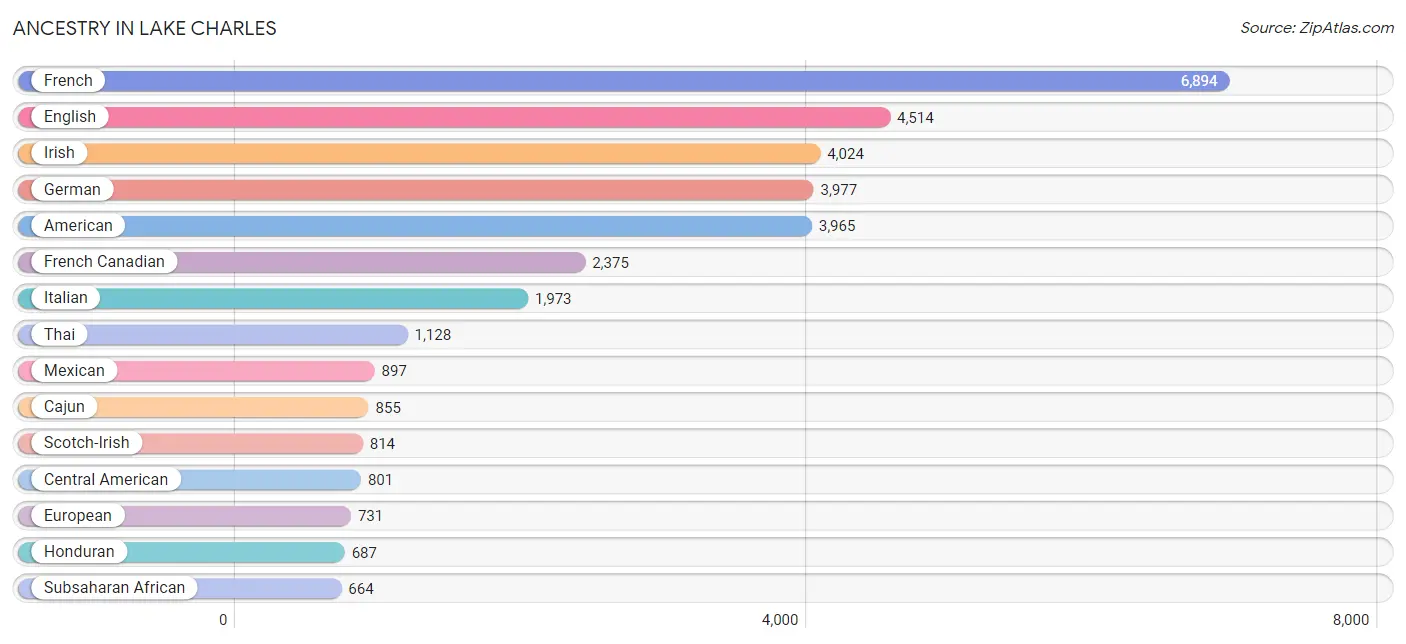
Ancestry in Lake Charles
The most populous ancestries reported in Lake Charles are French (6,894 | 8.4%), English (4,514 | 5.5%), Irish (4,024 | 4.9%), German (3,977 | 4.8%), and American (3,965 | 4.8%), together accounting for 28.3% of all Lake Charles residents.
| Ancestry | # Population | % Population |
| African | 555 | 0.7% |
| American | 3,965 | 4.8% |
| Arab | 356 | 0.4% |
| Austrian | 71 | 0.1% |
| Bangladeshi | 38 | 0.1% |
| Basque | 7 | 0.0% |
| Bhutanese | 21 | 0.0% |
| Blackfeet | 245 | 0.3% |
| Brazilian | 64 | 0.1% |
| British | 417 | 0.5% |
| Bulgarian | 5 | 0.0% |
| Burmese | 20 | 0.0% |
| Cajun | 855 | 1.0% |
| Canadian | 112 | 0.1% |
| Central American | 801 | 1.0% |
| Cherokee | 30 | 0.0% |
| Choctaw | 133 | 0.2% |
| Colombian | 195 | 0.2% |
| Costa Rican | 5 | 0.0% |
| Cuban | 75 | 0.1% |
| Czech | 131 | 0.2% |
| Danish | 25 | 0.0% |
| Dutch | 316 | 0.4% |
| Egyptian | 21 | 0.0% |
| English | 4,514 | 5.5% |
| European | 731 | 0.9% |
| Filipino | 36 | 0.0% |
| Finnish | 68 | 0.1% |
| French | 6,894 | 8.4% |
| French Canadian | 2,375 | 2.9% |
| German | 3,977 | 4.8% |
| Ghanaian | 18 | 0.0% |
| Greek | 44 | 0.1% |
| Guatemalan | 17 | 0.0% |
| Haitian | 114 | 0.1% |
| Honduran | 687 | 0.8% |
| Houma | 71 | 0.1% |
| Hungarian | 35 | 0.0% |
| Indian (Asian) | 1 | 0.0% |
| Irish | 4,024 | 4.9% |
| Italian | 1,973 | 2.4% |
| Jamaican | 86 | 0.1% |
| Korean | 85 | 0.1% |
| Laotian | 5 | 0.0% |
| Lebanese | 180 | 0.2% |
| Macedonian | 38 | 0.1% |
| Malaysian | 73 | 0.1% |
| Mexican | 897 | 1.1% |
| Mexican American Indian | 26 | 0.0% |
| Native Hawaiian | 40 | 0.1% |
| Nicaraguan | 16 | 0.0% |
| Nigerian | 80 | 0.1% |
| Northern European | 162 | 0.2% |
| Norwegian | 160 | 0.2% |
| Pakistani | 17 | 0.0% |
| Palestinian | 42 | 0.1% |
| Panamanian | 7 | 0.0% |
| Pennsylvania German | 27 | 0.0% |
| Peruvian | 17 | 0.0% |
| Polish | 230 | 0.3% |
| Portuguese | 80 | 0.1% |
| Puerto Rican | 371 | 0.4% |
| Romanian | 77 | 0.1% |
| Russian | 73 | 0.1% |
| Salvadoran | 69 | 0.1% |
| Scandinavian | 124 | 0.2% |
| Scotch-Irish | 814 | 1.0% |
| Scottish | 456 | 0.5% |
| Seminole | 12 | 0.0% |
| South American | 367 | 0.4% |
| Spaniard | 151 | 0.2% |
| Spanish | 468 | 0.6% |
| Sri Lankan | 93 | 0.1% |
| Subsaharan African | 664 | 0.8% |
| Swedish | 140 | 0.2% |
| Swiss | 12 | 0.0% |
| Syrian | 8 | 0.0% |
| Thai | 1,128 | 1.4% |
| Trinidadian and Tobagonian | 20 | 0.0% |
| Turkish | 35 | 0.0% |
| Ukrainian | 9 | 0.0% |
| Uruguayan | 11 | 0.0% |
| Venezuelan | 144 | 0.2% |
| Vietnamese | 14 | 0.0% |
| Welsh | 204 | 0.3% |
| West Indian | 6 | 0.0% | View All 86 Rows |
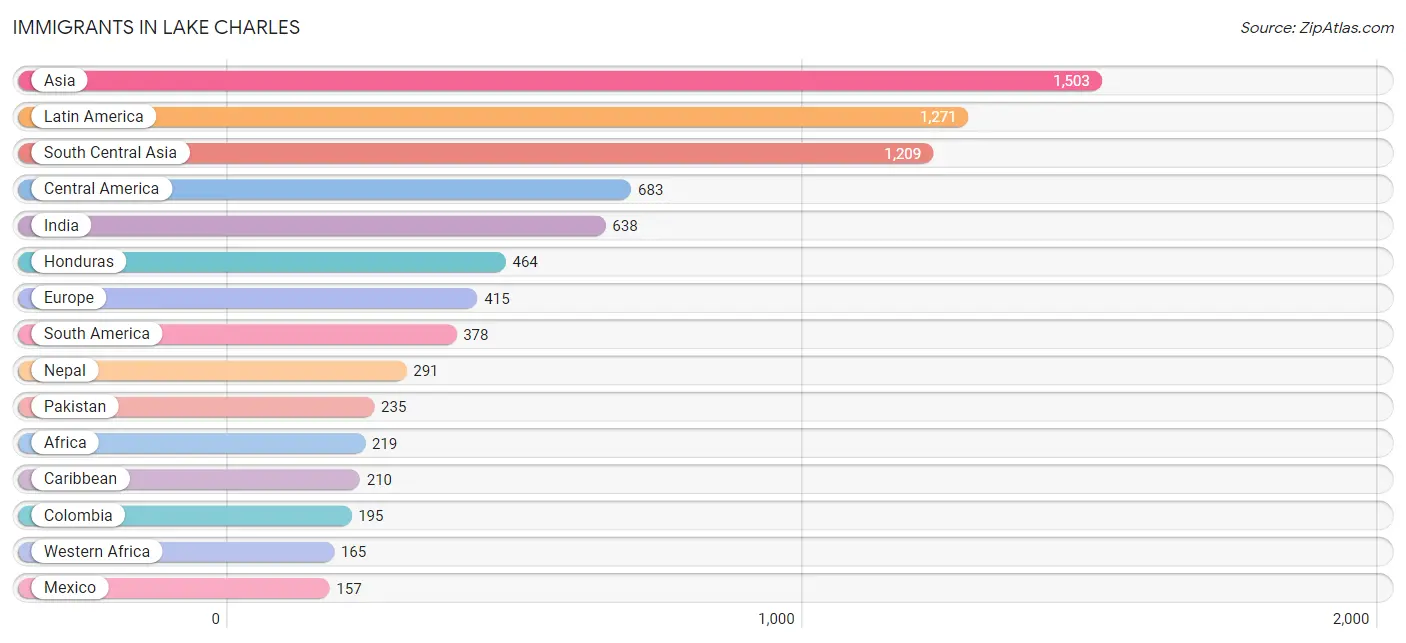
Immigrants in Lake Charles
The most numerous immigrant groups reported in Lake Charles came from Asia (1,503 | 1.8%), Latin America (1,271 | 1.5%), South Central Asia (1,209 | 1.5%), Central America (683 | 0.8%), and India (638 | 0.8%), together accounting for 6.4% of all Lake Charles residents.
| Immigration Origin | # Population | % Population |
| Africa | 219 | 0.3% |
| Asia | 1,503 | 1.8% |
| Bangladesh | 30 | 0.0% |
| Brazil | 26 | 0.0% |
| Bulgaria | 5 | 0.0% |
| Canada | 70 | 0.1% |
| Caribbean | 210 | 0.3% |
| Central America | 683 | 0.8% |
| China | 24 | 0.0% |
| Colombia | 195 | 0.2% |
| Costa Rica | 5 | 0.0% |
| Cuba | 7 | 0.0% |
| Eastern Africa | 13 | 0.0% |
| Eastern Asia | 45 | 0.1% |
| Eastern Europe | 113 | 0.1% |
| Egypt | 21 | 0.0% |
| El Salvador | 22 | 0.0% |
| England | 79 | 0.1% |
| Europe | 415 | 0.5% |
| France | 13 | 0.0% |
| Germany | 54 | 0.1% |
| Ghana | 18 | 0.0% |
| Guatemala | 12 | 0.0% |
| Haiti | 135 | 0.2% |
| Honduras | 464 | 0.6% |
| Hungary | 19 | 0.0% |
| India | 638 | 0.8% |
| Ireland | 7 | 0.0% |
| Italy | 7 | 0.0% |
| Jamaica | 48 | 0.1% |
| Jordan | 50 | 0.1% |
| Korea | 21 | 0.0% |
| Laos | 42 | 0.1% |
| Latin America | 1,271 | 1.5% |
| Mexico | 157 | 0.2% |
| Nepal | 291 | 0.4% |
| Netherlands | 21 | 0.0% |
| Nicaragua | 16 | 0.0% |
| Nigeria | 147 | 0.2% |
| North Macedonia | 38 | 0.1% |
| Northern Africa | 41 | 0.1% |
| Northern Europe | 90 | 0.1% |
| Oceania | 35 | 0.0% |
| Pakistan | 235 | 0.3% |
| Panama | 7 | 0.0% |
| Peru | 17 | 0.0% |
| Philippines | 38 | 0.1% |
| Poland | 5 | 0.0% |
| Romania | 46 | 0.1% |
| Saudi Arabia | 23 | 0.0% |
| South America | 378 | 0.5% |
| South Central Asia | 1,209 | 1.5% |
| South Eastern Asia | 150 | 0.2% |
| Southern Europe | 124 | 0.2% |
| Spain | 117 | 0.1% |
| Taiwan | 24 | 0.0% |
| Thailand | 17 | 0.0% |
| Trinidad and Tobago | 20 | 0.0% |
| Turkey | 26 | 0.0% |
| Uruguay | 11 | 0.0% |
| Venezuela | 115 | 0.1% |
| Vietnam | 53 | 0.1% |
| Western Africa | 165 | 0.2% |
| Western Asia | 99 | 0.1% |
| Western Europe | 88 | 0.1% | View All 65 Rows |
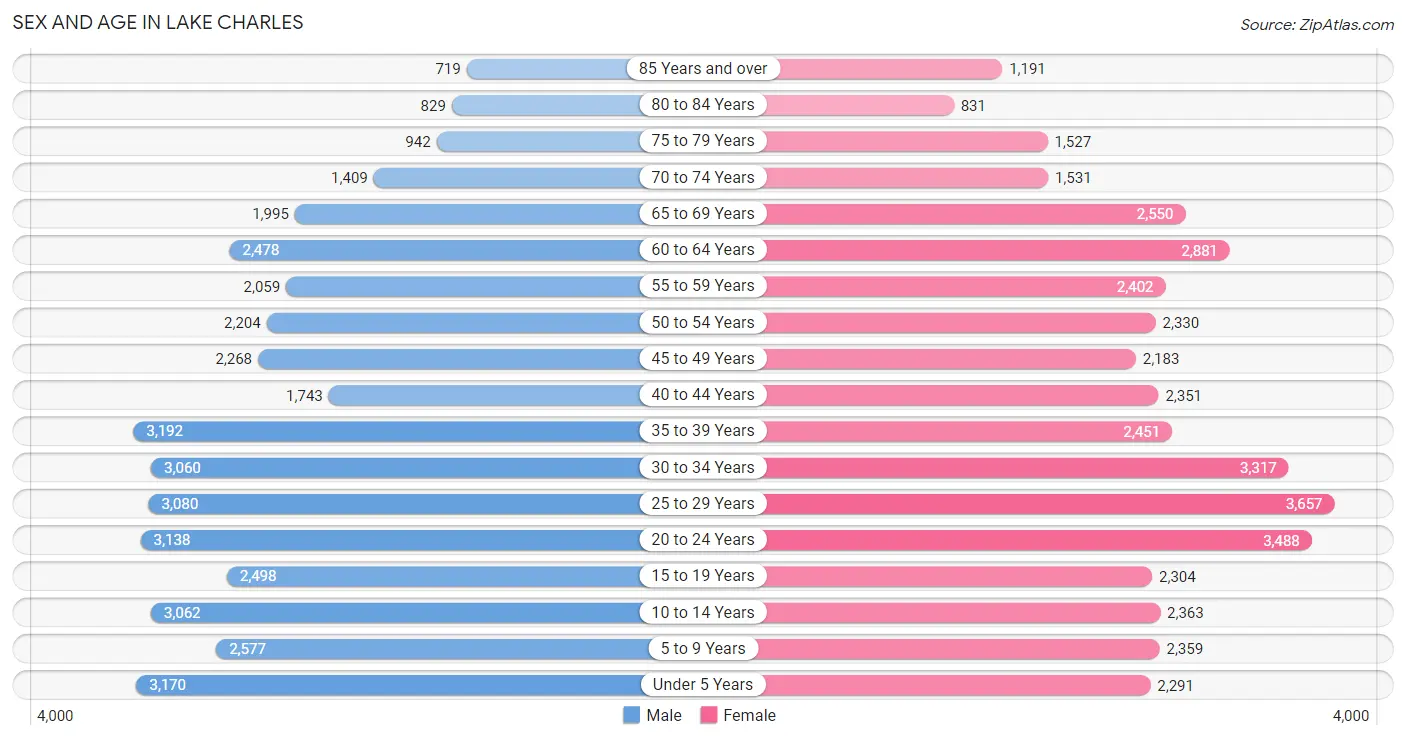
Sex and Age in Lake Charles
Sex and Age in Lake Charles
The most populous age groups in Lake Charles are 35 to 39 Years (3,192 | 7.9%) for men and 25 to 29 Years (3,657 | 8.7%) for women.
| Age Bracket | Male | Female |
| Under 5 Years | 3,170 (7.8%) | 2,291 (5.4%) |
| 5 to 9 Years | 2,577 (6.4%) | 2,359 (5.6%) |
| 10 to 14 Years | 3,062 (7.6%) | 2,363 (5.6%) |
| 15 to 19 Years | 2,498 (6.2%) | 2,304 (5.5%) |
| 20 to 24 Years | 3,138 (7.8%) | 3,488 (8.3%) |
| 25 to 29 Years | 3,080 (7.6%) | 3,657 (8.7%) |
| 30 to 34 Years | 3,060 (7.6%) | 3,317 (7.9%) |
| 35 to 39 Years | 3,192 (7.9%) | 2,451 (5.8%) |
| 40 to 44 Years | 1,743 (4.3%) | 2,351 (5.6%) |
| 45 to 49 Years | 2,268 (5.6%) | 2,183 (5.2%) |
| 50 to 54 Years | 2,204 (5.4%) | 2,330 (5.6%) |
| 55 to 59 Years | 2,059 (5.1%) | 2,402 (5.7%) |
| 60 to 64 Years | 2,478 (6.1%) | 2,881 (6.9%) |
| 65 to 69 Years | 1,995 (4.9%) | 2,550 (6.1%) |
| 70 to 74 Years | 1,409 (3.5%) | 1,531 (3.6%) |
| 75 to 79 Years | 942 (2.3%) | 1,527 (3.6%) |
| 80 to 84 Years | 829 (2.1%) | 831 (2.0%) |
| 85 Years and over | 719 (1.8%) | 1,191 (2.8%) |
| Total | 40,423 (100.0%) | 42,007 (100.0%) |
Families and Households in Lake Charles
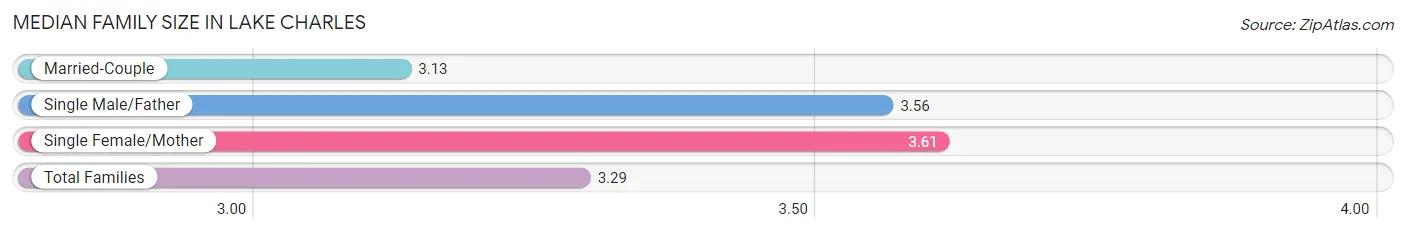
Median Family Size in Lake Charles
The median family size in Lake Charles is 3.29 persons per family, with single female/mother families (5,285 | 28.4%) accounting for the largest median family size of 3.61 persons per family. On the other hand, married-couple families (12,248 | 65.8%) represent the smallest median family size with 3.13 persons per family.
| Family Type | # Families | Family Size |
| Married-Couple | 12,248 (65.8%) | 3.13 |
| Single Male/Father | 1,092 (5.9%) | 3.56 |
| Single Female/Mother | 5,285 (28.4%) | 3.61 |
| Total Families | 18,625 (100.0%) | 3.29 |
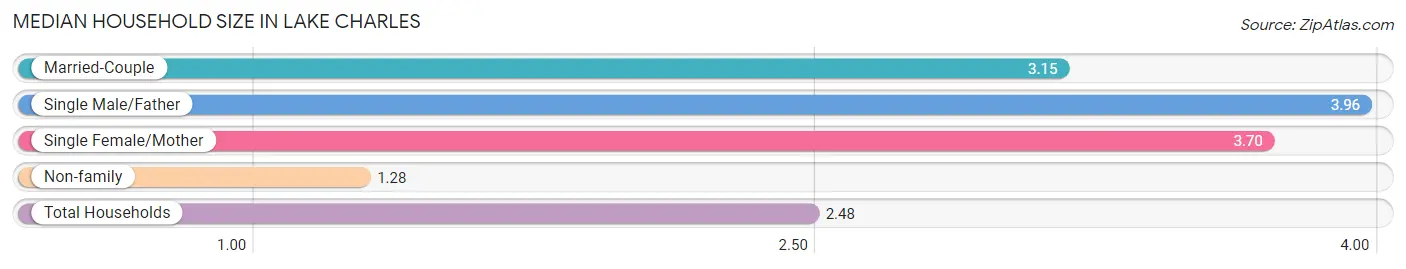
Median Household Size in Lake Charles
The median household size in Lake Charles is 2.48 persons per household, with single male/father households (1,092 | 3.4%) accounting for the largest median household size of 3.96 persons per household. non-family households (13,562 | 42.1%) represent the smallest median household size with 1.28 persons per household.
| Household Type | # Households | Household Size |
| Married-Couple | 12,248 (38.1%) | 3.15 |
| Single Male/Father | 1,092 (3.4%) | 3.96 |
| Single Female/Mother | 5,285 (16.4%) | 3.70 |
| Non-family | 13,562 (42.1%) | 1.28 |
| Total Households | 32,187 (100.0%) | 2.48 |
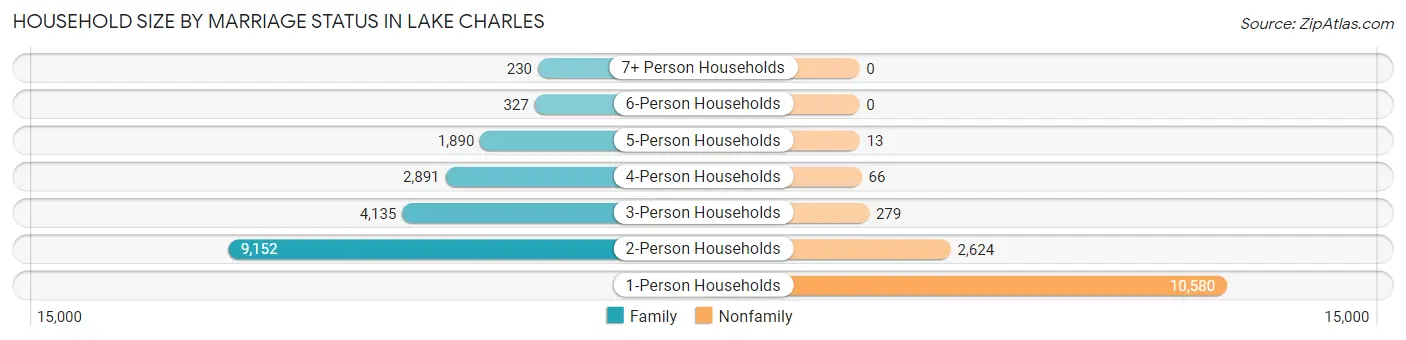
Household Size by Marriage Status in Lake Charles
Out of a total of 32,187 households in Lake Charles, 18,625 (57.9%) are family households, while 13,562 (42.1%) are nonfamily households. The most numerous type of family households are 2-person households, comprising 9,152, and the most common type of nonfamily households are 1-person households, comprising 10,580.
| Household Size | Family Households | Nonfamily Households |
| 1-Person Households | - | 10,580 (32.9%) |
| 2-Person Households | 9,152 (28.4%) | 2,624 (8.2%) |
| 3-Person Households | 4,135 (12.9%) | 279 (0.9%) |
| 4-Person Households | 2,891 (9.0%) | 66 (0.2%) |
| 5-Person Households | 1,890 (5.9%) | 13 (0.0%) |
| 6-Person Households | 327 (1.0%) | 0 (0.0%) |
| 7+ Person Households | 230 (0.7%) | 0 (0.0%) |
| Total | 18,625 (57.9%) | 13,562 (42.1%) |
Female Fertility in Lake Charles
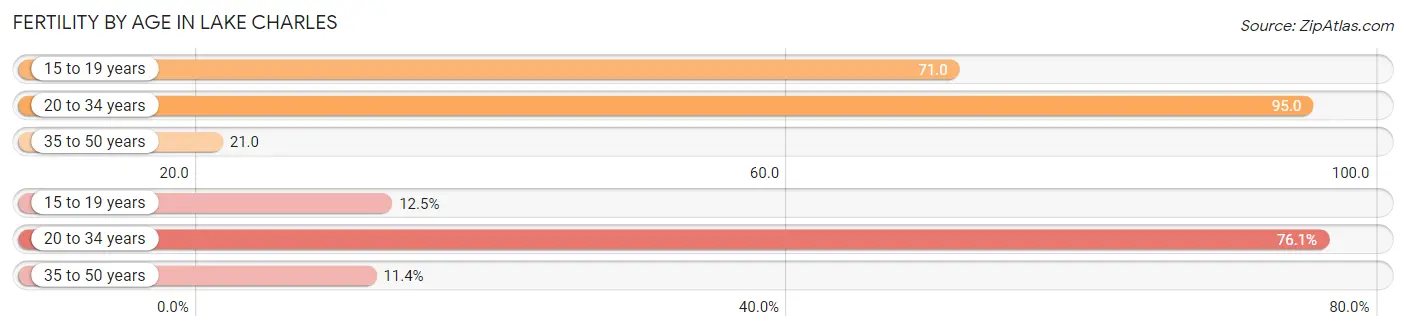
Fertility by Age in Lake Charles
Average fertility rate in Lake Charles is 65.0 births per 1,000 women. Women in the age bracket of 20 to 34 years have the highest fertility rate with 95.0 births per 1,000 women. Women in the age bracket of 20 to 34 years acount for 76.1% of all women with births.
| Age Bracket | Women with Births | Births / 1,000 Women |
| 15 to 19 years | 164 (12.5%) | 71.0 |
| 20 to 34 years | 998 (76.1%) | 95.0 |
| 35 to 50 years | 150 (11.4%) | 21.0 |
| Total | 1,312 (100.0%) | 65.0 |
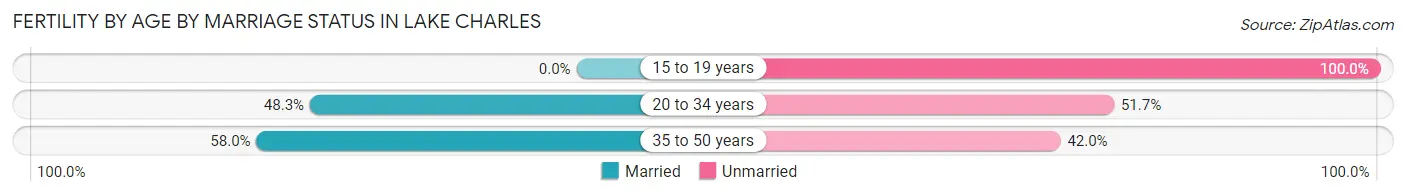
Fertility by Age by Marriage Status in Lake Charles
43.4% of women with births (1,312) in Lake Charles are married. The highest percentage of unmarried women with births falls into 15 to 19 years age bracket with 100.0% of them unmarried at the time of birth, while the lowest percentage of unmarried women with births belong to 35 to 50 years age bracket with 42.0% of them unmarried.
| Age Bracket | Married | Unmarried |
| 15 to 19 years | 0 (0.0%) | 164 (100.0%) |
| 20 to 34 years | 482 (48.3%) | 516 (51.7%) |
| 35 to 50 years | 87 (58.0%) | 63 (42.0%) |
| Total | 569 (43.4%) | 743 (56.6%) |
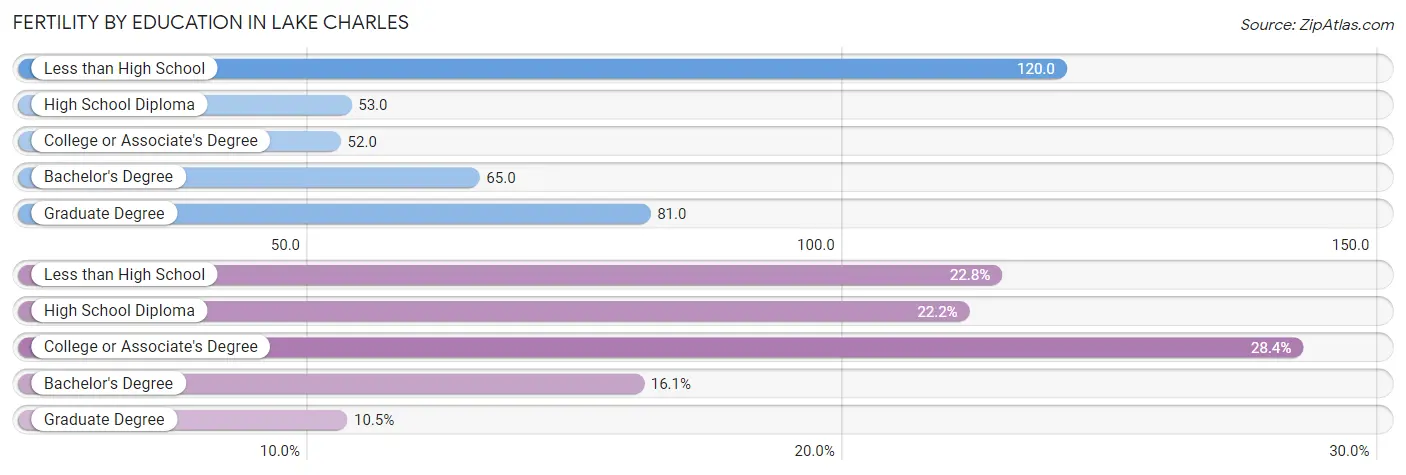
Fertility by Education in Lake Charles
Average fertility rate in Lake Charles is 65.0 births per 1,000 women. Women with the education attainment of less than high school have the highest fertility rate of 120.0 births per 1,000 women, while women with the education attainment of college or associate's degree have the lowest fertility at 52.0 births per 1,000 women. Women with the education attainment of college or associate's degree represent 28.4% of all women with births.
| Educational Attainment | Women with Births | Births / 1,000 Women |
| Less than High School | 299 (22.8%) | 120.0 |
| High School Diploma | 291 (22.2%) | 53.0 |
| College or Associate's Degree | 373 (28.4%) | 52.0 |
| Bachelor's Degree | 211 (16.1%) | 65.0 |
| Graduate Degree | 138 (10.5%) | 81.0 |
| Total | 1,312 (100.0%) | 65.0 |
Fertility by Education by Marriage Status in Lake Charles
56.6% of women with births in Lake Charles are unmarried. Women with the educational attainment of graduate degree are most likely to be married with 100.0% of them married at childbirth, while women with the educational attainment of less than high school are least likely to be married with 88.6% of them unmarried at childbirth.
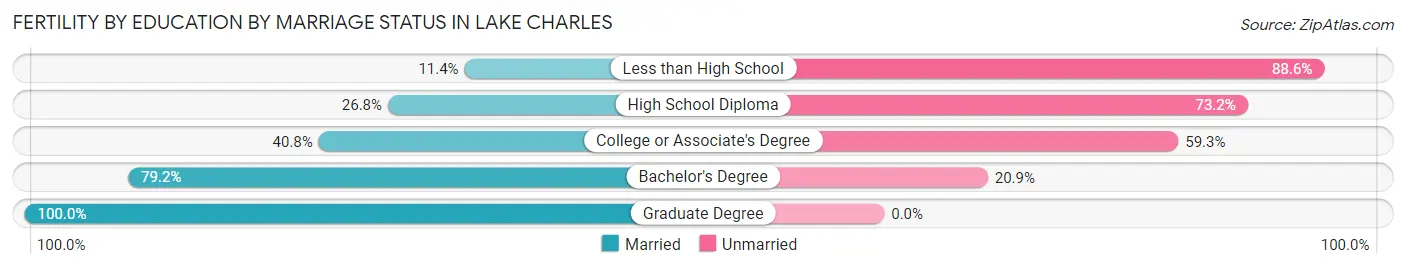
| Educational Attainment | Married | Unmarried |
| Less than High School | 34 (11.4%) | 265 (88.6%) |
| High School Diploma | 78 (26.8%) | 213 (73.2%) |
| College or Associate's Degree | 152 (40.7%) | 221 (59.3%) |
| Bachelor's Degree | 167 (79.1%) | 44 (20.8%) |
| Graduate Degree | 138 (100.0%) | 0 (0.0%) |
| Total | 569 (43.4%) | 743 (56.6%) |
Employment Characteristics in Lake Charles
Employment by Class of Employer in Lake Charles
Among the 36,038 employed individuals in Lake Charles, private company employees (25,411 | 70.5%), local government employees (3,015 | 8.4%), and not-for-profit organizations (2,361 | 6.6%) make up the most common classes of employment.
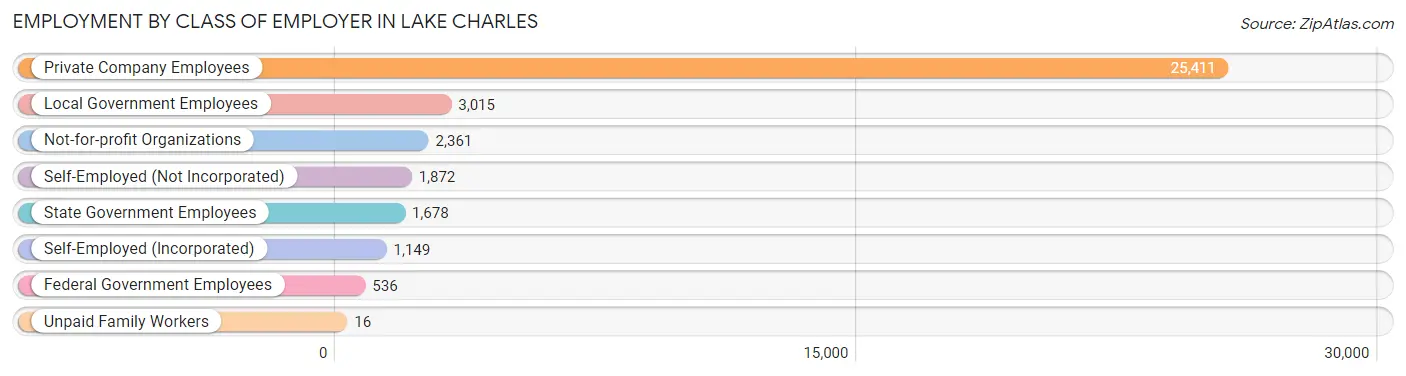
| Employer Class | # Employees | % Employees |
| Private Company Employees | 25,411 | 70.5% |
| Self-Employed (Incorporated) | 1,149 | 3.2% |
| Self-Employed (Not Incorporated) | 1,872 | 5.2% |
| Not-for-profit Organizations | 2,361 | 6.6% |
| Local Government Employees | 3,015 | 8.4% |
| State Government Employees | 1,678 | 4.7% |
| Federal Government Employees | 536 | 1.5% |
| Unpaid Family Workers | 16 | 0.0% |
| Total | 36,038 | 100.0% |
Employment Status by Age in Lake Charles
According to the labor force statistics for Lake Charles, out of the total population over 16 years of age (65,574), 59.1% or 38,754 individuals are in the labor force, with 5.7% or 2,209 of them unemployed. The age group with the highest labor force participation rate is 35 to 44 years, with 80.8% or 7,867 individuals in the labor force. Within the labor force, the 16 to 19 years age range has the highest percentage of unemployed individuals, with 19.5% or 328 of them being unemployed.
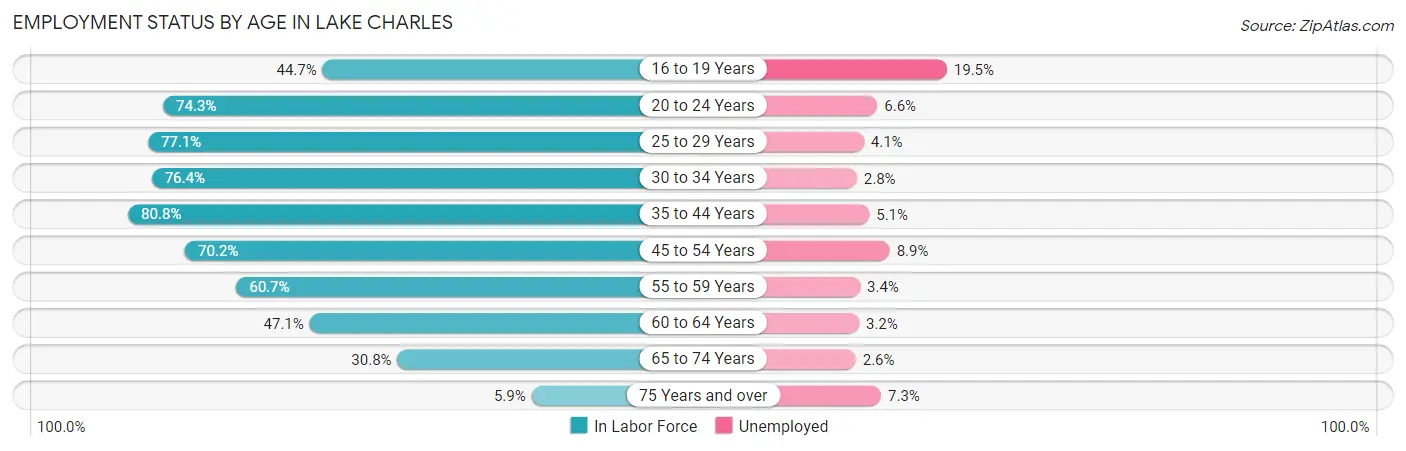
| Age Bracket | In Labor Force | Unemployed |
| 16 to 19 Years | 1,684 (44.7%) | 328 (19.5%) |
| 20 to 24 Years | 4,923 (74.3%) | 325 (6.6%) |
| 25 to 29 Years | 5,194 (77.1%) | 213 (4.1%) |
| 30 to 34 Years | 4,872 (76.4%) | 136 (2.8%) |
| 35 to 44 Years | 7,867 (80.8%) | 401 (5.1%) |
| 45 to 54 Years | 6,307 (70.2%) | 561 (8.9%) |
| 55 to 59 Years | 2,708 (60.7%) | 92 (3.4%) |
| 60 to 64 Years | 2,524 (47.1%) | 81 (3.2%) |
| 65 to 74 Years | 2,305 (30.8%) | 60 (2.6%) |
| 75 Years and over | 356 (5.9%) | 26 (7.3%) |
| Total | 38,754 (59.1%) | 2,209 (5.7%) |
Employment Status by Educational Attainment in Lake Charles
According to labor force statistics for Lake Charles, 70.8% of individuals (29,492) out of the total population between 25 and 64 years of age (41,656) are in the labor force, with 5.0% or 1,475 of them being unemployed. The group with the highest labor force participation rate are those with the educational attainment of bachelor's degree or higher, with 84.7% or 9,829 individuals in the labor force. Within the labor force, individuals with less than high school education have the highest percentage of unemployment, with 15.0% or 218 of them being unemployed.
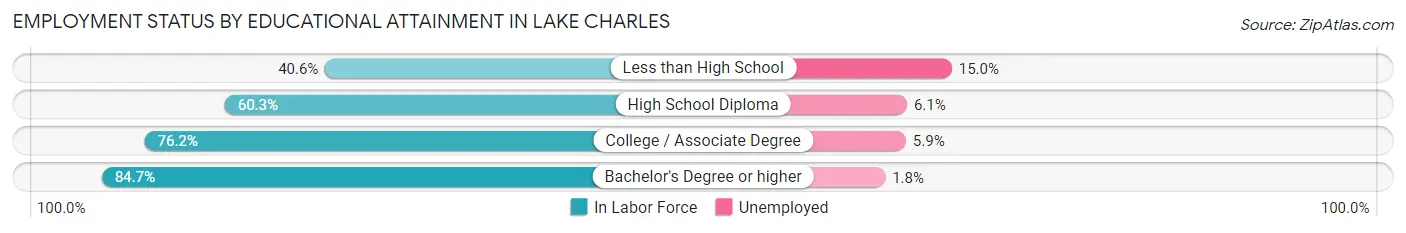
| Educational Attainment | In Labor Force | Unemployed |
| Less than High School | 1,453 (40.6%) | 537 (15.0%) |
| High School Diploma | 7,528 (60.3%) | 762 (6.1%) |
| College / Associate Degree | 10,658 (76.2%) | 825 (5.9%) |
| Bachelor's Degree or higher | 9,829 (84.7%) | 209 (1.8%) |
| Total | 29,492 (70.8%) | 2,083 (5.0%) |
Employment Occupations by Sex in Lake Charles
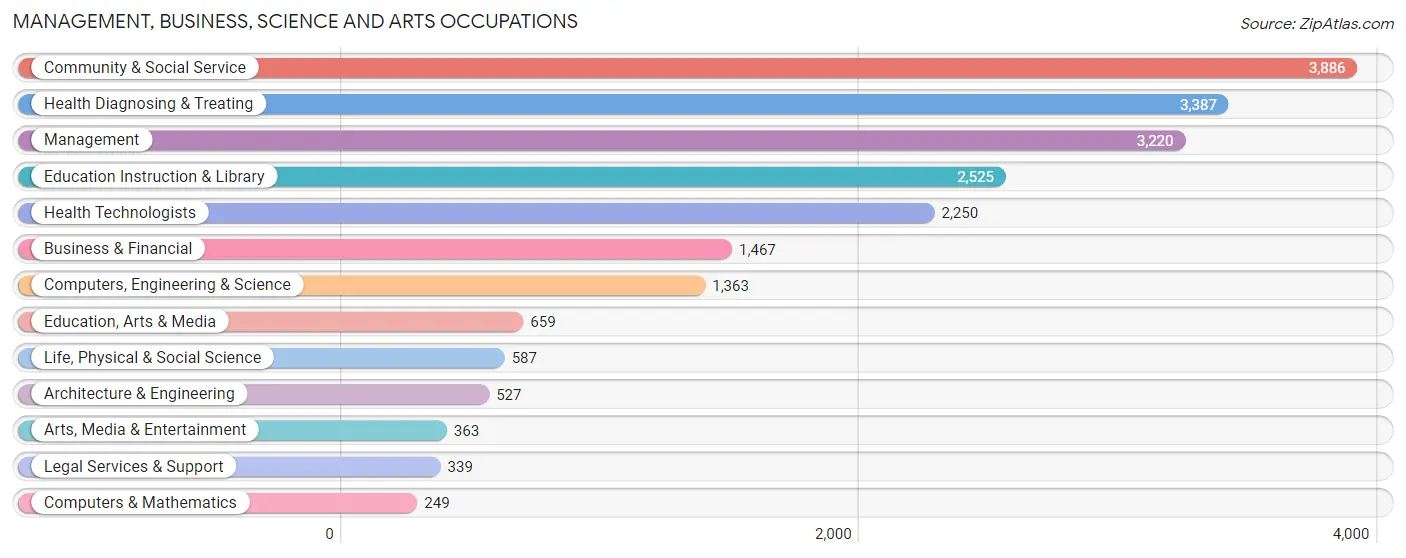
Management, Business, Science and Arts Occupations
The most common Management, Business, Science and Arts occupations in Lake Charles are Community & Social Service (3,886 | 10.6%), Health Diagnosing & Treating (3,387 | 9.3%), Management (3,220 | 8.8%), Education Instruction & Library (2,525 | 6.9%), and Health Technologists (2,250 | 6.2%).
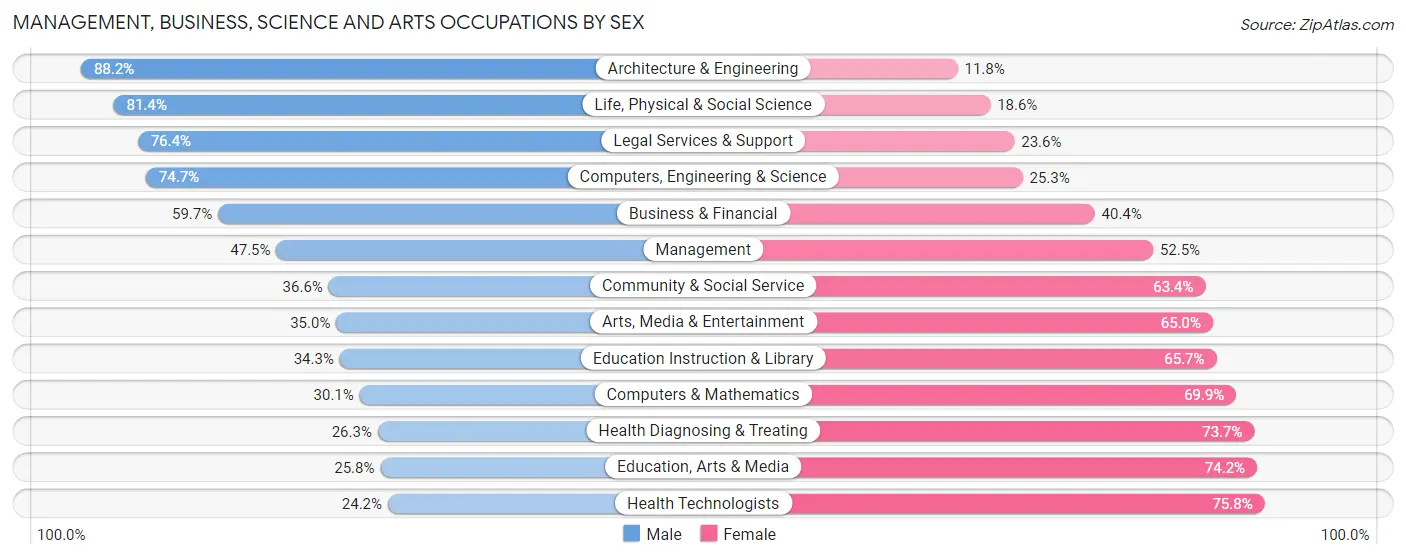
Management, Business, Science and Arts Occupations by Sex
Within the Management, Business, Science and Arts occupations in Lake Charles, the most male-oriented occupations are Architecture & Engineering (88.2%), Life, Physical & Social Science (81.4%), and Legal Services & Support (76.4%), while the most female-oriented occupations are Health Technologists (75.8%), Education, Arts & Media (74.2%), and Health Diagnosing & Treating (73.7%).
| Occupation | Male | Female |
| Management | 1,529 (47.5%) | 1,691 (52.5%) |
| Business & Financial | 875 (59.7%) | 592 (40.4%) |
| Computers, Engineering & Science | 1,018 (74.7%) | 345 (25.3%) |
| Computers & Mathematics | 75 (30.1%) | 174 (69.9%) |
| Architecture & Engineering | 465 (88.2%) | 62 (11.8%) |
| Life, Physical & Social Science | 478 (81.4%) | 109 (18.6%) |
| Community & Social Service | 1,421 (36.6%) | 2,465 (63.4%) |
| Education, Arts & Media | 170 (25.8%) | 489 (74.2%) |
| Legal Services & Support | 259 (76.4%) | 80 (23.6%) |
| Education Instruction & Library | 865 (34.3%) | 1,660 (65.7%) |
| Arts, Media & Entertainment | 127 (35.0%) | 236 (65.0%) |
| Health Diagnosing & Treating | 892 (26.3%) | 2,495 (73.7%) |
| Health Technologists | 545 (24.2%) | 1,705 (75.8%) |
| Total (Category) | 5,735 (43.0%) | 7,588 (57.0%) |
| Total (Overall) | 18,016 (49.4%) | 18,464 (50.6%) |
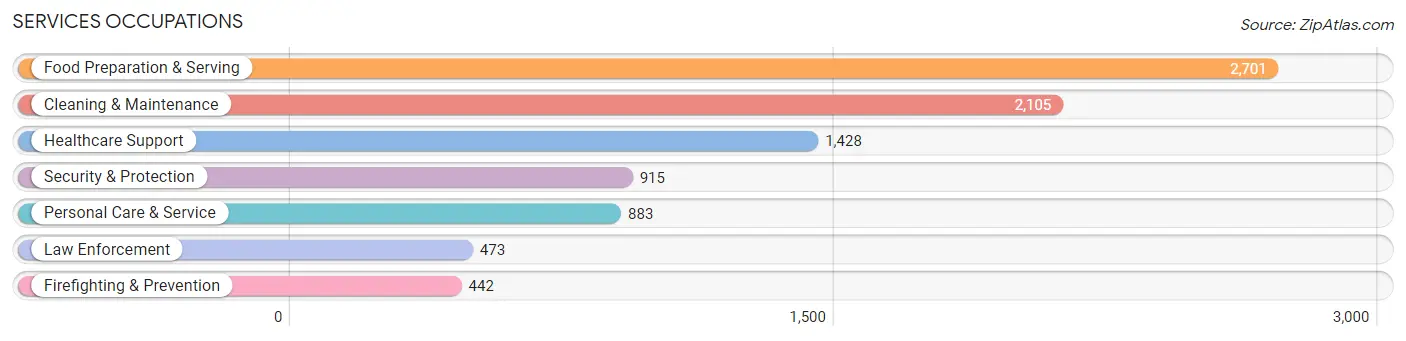
Services Occupations
The most common Services occupations in Lake Charles are Food Preparation & Serving (2,701 | 7.4%), Cleaning & Maintenance (2,105 | 5.8%), Healthcare Support (1,428 | 3.9%), Security & Protection (915 | 2.5%), and Personal Care & Service (883 | 2.4%).
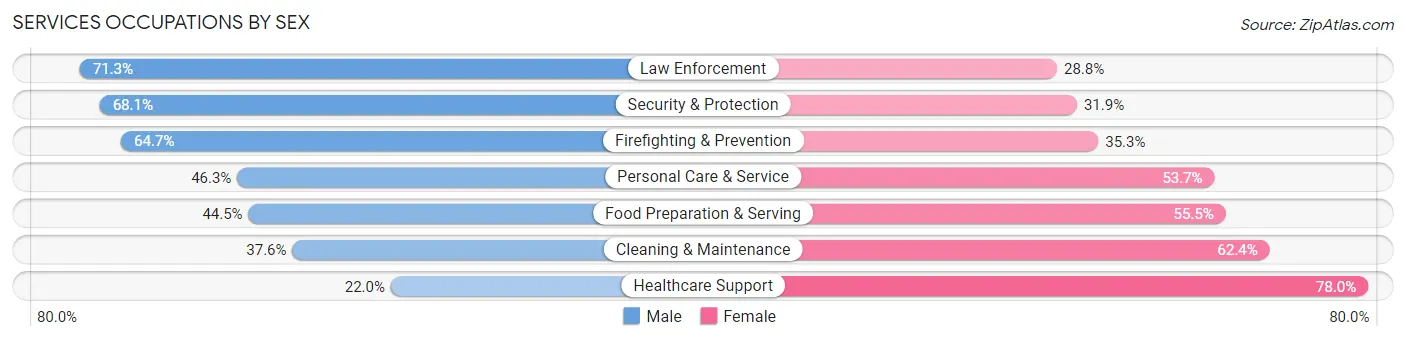
Services Occupations by Sex
Within the Services occupations in Lake Charles, the most male-oriented occupations are Law Enforcement (71.3%), Security & Protection (68.1%), and Firefighting & Prevention (64.7%), while the most female-oriented occupations are Healthcare Support (78.0%), Cleaning & Maintenance (62.4%), and Food Preparation & Serving (55.5%).
| Occupation | Male | Female |
| Healthcare Support | 314 (22.0%) | 1,114 (78.0%) |
| Security & Protection | 623 (68.1%) | 292 (31.9%) |
| Firefighting & Prevention | 286 (64.7%) | 156 (35.3%) |
| Law Enforcement | 337 (71.3%) | 136 (28.7%) |
| Food Preparation & Serving | 1,203 (44.5%) | 1,498 (55.5%) |
| Cleaning & Maintenance | 791 (37.6%) | 1,314 (62.4%) |
| Personal Care & Service | 409 (46.3%) | 474 (53.7%) |
| Total (Category) | 3,340 (41.6%) | 4,692 (58.4%) |
| Total (Overall) | 18,016 (49.4%) | 18,464 (50.6%) |
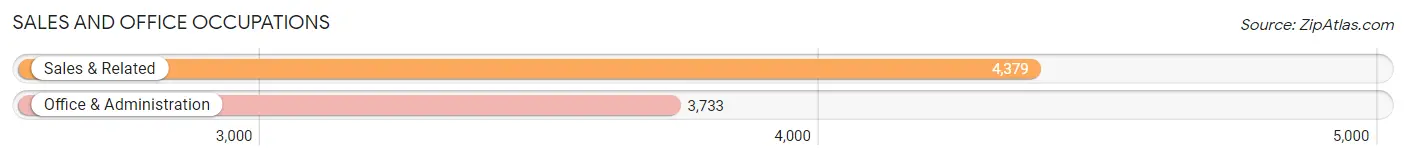
Sales and Office Occupations
The most common Sales and Office occupations in Lake Charles are Sales & Related (4,379 | 12.0%), and Office & Administration (3,733 | 10.2%).
Sales and Office Occupations by Sex
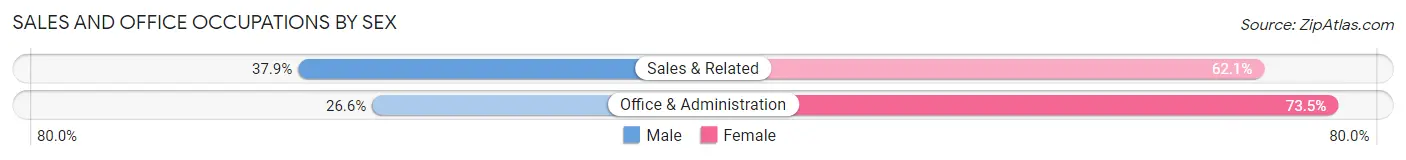
| Occupation | Male | Female |
| Sales & Related | 1,661 (37.9%) | 2,718 (62.1%) |
| Office & Administration | 991 (26.6%) | 2,742 (73.5%) |
| Total (Category) | 2,652 (32.7%) | 5,460 (67.3%) |
| Total (Overall) | 18,016 (49.4%) | 18,464 (50.6%) |
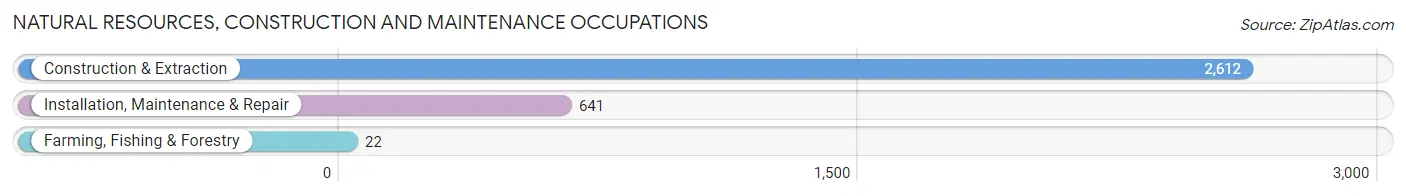
Natural Resources, Construction and Maintenance Occupations
The most common Natural Resources, Construction and Maintenance occupations in Lake Charles are Construction & Extraction (2,612 | 7.2%), Installation, Maintenance & Repair (641 | 1.8%), and Farming, Fishing & Forestry (22 | 0.1%).
Natural Resources, Construction and Maintenance Occupations by Sex
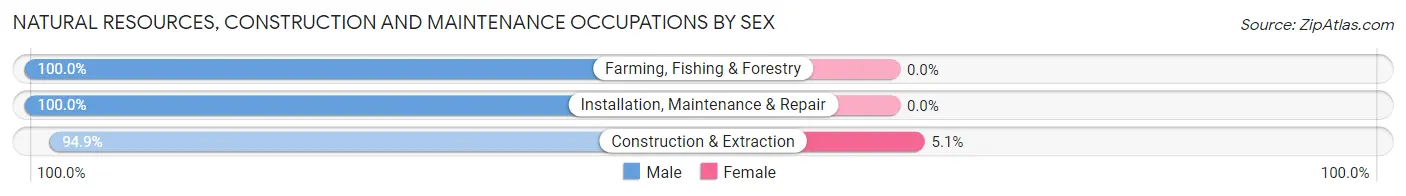
| Occupation | Male | Female |
| Farming, Fishing & Forestry | 22 (100.0%) | 0 (0.0%) |
| Construction & Extraction | 2,478 (94.9%) | 134 (5.1%) |
| Installation, Maintenance & Repair | 641 (100.0%) | 0 (0.0%) |
| Total (Category) | 3,141 (95.9%) | 134 (4.1%) |
| Total (Overall) | 18,016 (49.4%) | 18,464 (50.6%) |
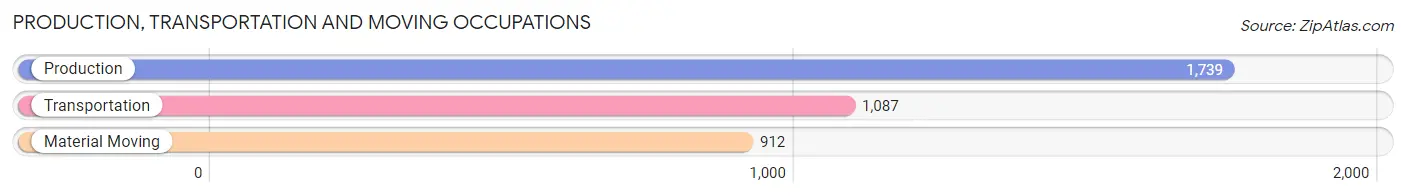
Production, Transportation and Moving Occupations
The most common Production, Transportation and Moving occupations in Lake Charles are Production (1,739 | 4.8%), Transportation (1,087 | 3.0%), and Material Moving (912 | 2.5%).
Production, Transportation and Moving Occupations by Sex
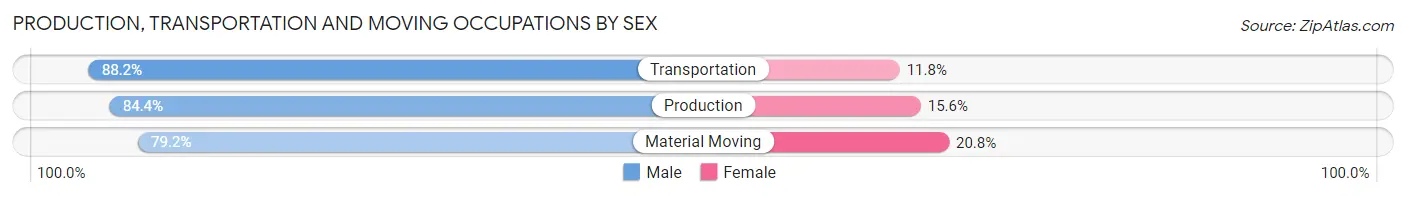
| Occupation | Male | Female |
| Production | 1,467 (84.4%) | 272 (15.6%) |
| Transportation | 959 (88.2%) | 128 (11.8%) |
| Material Moving | 722 (79.2%) | 190 (20.8%) |
| Total (Category) | 3,148 (84.2%) | 590 (15.8%) |
| Total (Overall) | 18,016 (49.4%) | 18,464 (50.6%) |
Employment Industries by Sex in Lake Charles
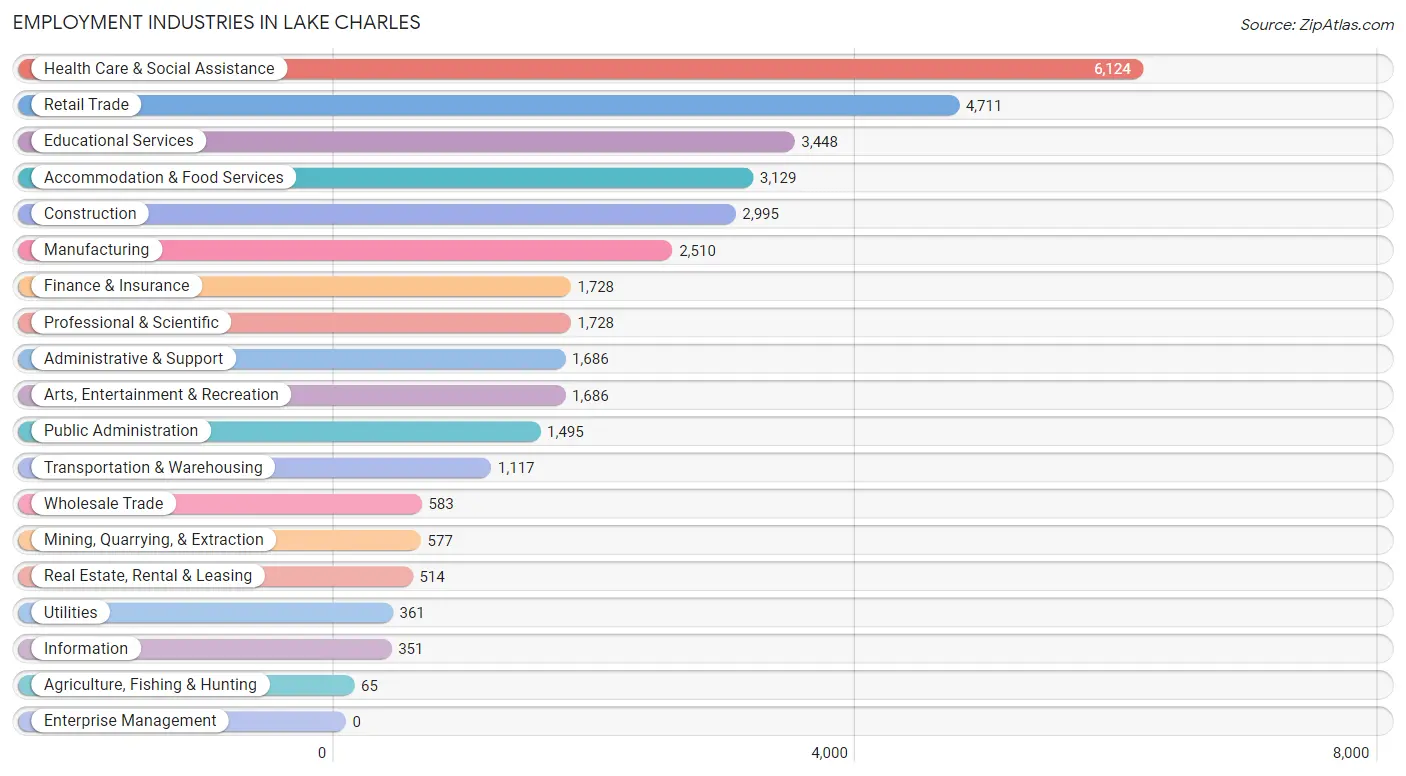
Employment Industries in Lake Charles
The major employment industries in Lake Charles include Health Care & Social Assistance (6,124 | 16.8%), Retail Trade (4,711 | 12.9%), Educational Services (3,448 | 9.5%), Accommodation & Food Services (3,129 | 8.6%), and Construction (2,995 | 8.2%).
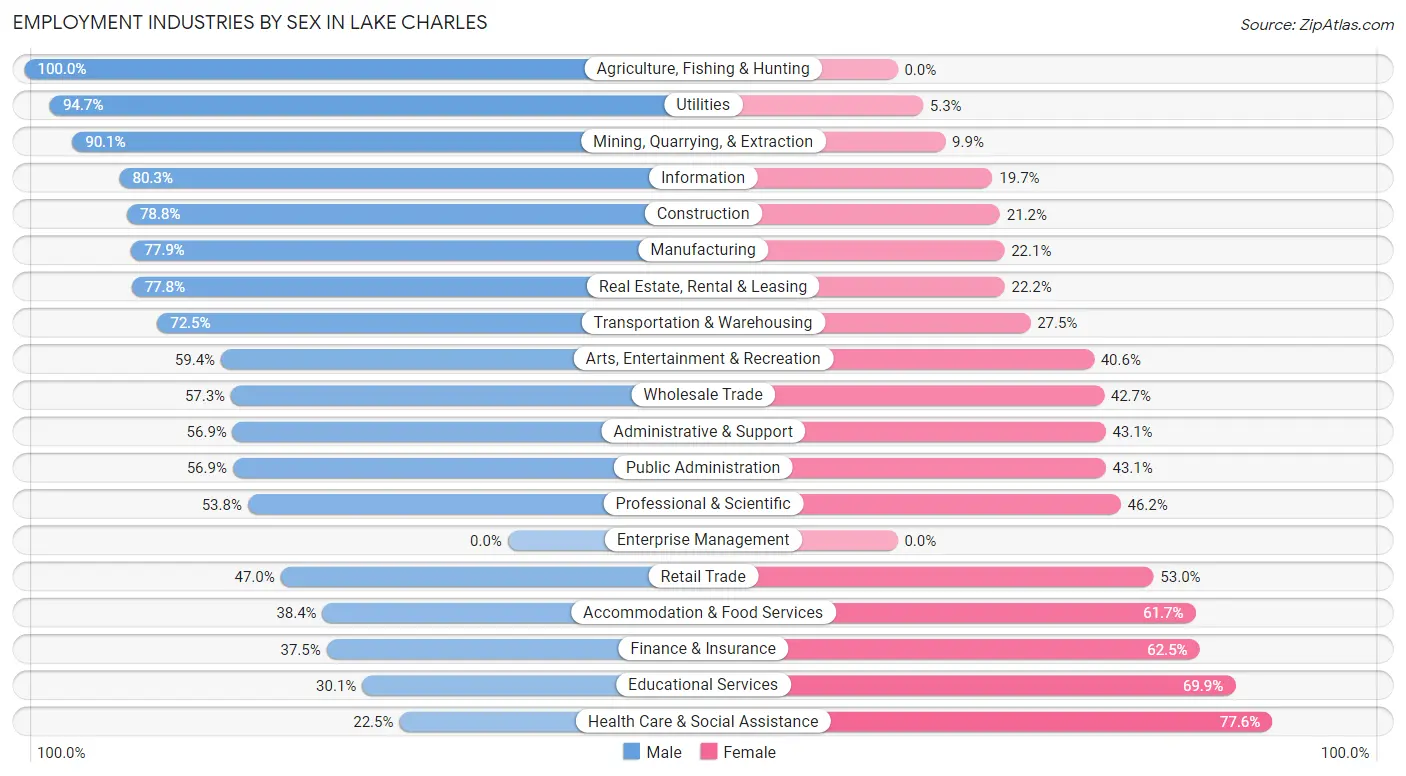
Employment Industries by Sex in Lake Charles
The Lake Charles industries that see more men than women are Agriculture, Fishing & Hunting (100.0%), Utilities (94.7%), and Mining, Quarrying, & Extraction (90.1%), whereas the industries that tend to have a higher number of women are Health Care & Social Assistance (77.5%), Educational Services (69.9%), and Finance & Insurance (62.5%).
| Industry | Male | Female |
| Agriculture, Fishing & Hunting | 65 (100.0%) | 0 (0.0%) |
| Mining, Quarrying, & Extraction | 520 (90.1%) | 57 (9.9%) |
| Construction | 2,360 (78.8%) | 635 (21.2%) |
| Manufacturing | 1,955 (77.9%) | 555 (22.1%) |
| Wholesale Trade | 334 (57.3%) | 249 (42.7%) |
| Retail Trade | 2,215 (47.0%) | 2,496 (53.0%) |
| Transportation & Warehousing | 810 (72.5%) | 307 (27.5%) |
| Utilities | 342 (94.7%) | 19 (5.3%) |
| Information | 282 (80.3%) | 69 (19.7%) |
| Finance & Insurance | 648 (37.5%) | 1,080 (62.5%) |
| Real Estate, Rental & Leasing | 400 (77.8%) | 114 (22.2%) |
| Professional & Scientific | 930 (53.8%) | 798 (46.2%) |
| Enterprise Management | 0 (0.0%) | 0 (0.0%) |
| Administrative & Support | 960 (56.9%) | 726 (43.1%) |
| Educational Services | 1,039 (30.1%) | 2,409 (69.9%) |
| Health Care & Social Assistance | 1,375 (22.5%) | 4,749 (77.5%) |
| Arts, Entertainment & Recreation | 1,001 (59.4%) | 685 (40.6%) |
| Accommodation & Food Services | 1,200 (38.4%) | 1,929 (61.7%) |
| Public Administration | 851 (56.9%) | 644 (43.1%) |
| Total | 18,016 (49.4%) | 18,464 (50.6%) |
Education in Lake Charles
School Enrollment in Lake Charles
The most common levels of schooling among the 20,224 students in Lake Charles are middle school (5,073 | 25.1%), college / undergraduate (5,072 | 25.1%), and elementary school (3,901 | 19.3%).
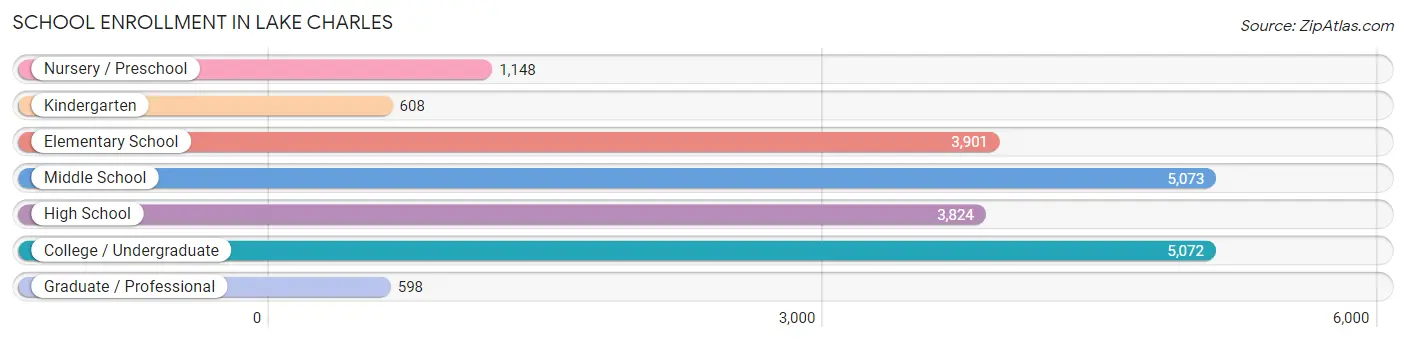
| School Level | # Students | % Students |
| Nursery / Preschool | 1,148 | 5.7% |
| Kindergarten | 608 | 3.0% |
| Elementary School | 3,901 | 19.3% |
| Middle School | 5,073 | 25.1% |
| High School | 3,824 | 18.9% |
| College / Undergraduate | 5,072 | 25.1% |
| Graduate / Professional | 598 | 3.0% |
| Total | 20,224 | 100.0% |
School Enrollment by Age by Funding Source in Lake Charles
Out of a total of 20,224 students who are enrolled in schools in Lake Charles, 2,589 (12.8%) attend a private institution, while the remaining 17,635 (87.2%) are enrolled in public schools. The age group of 3 to 4 year olds has the highest likelihood of being enrolled in private schools, with 270 (30.0% in the age bracket) enrolled. Conversely, the age group of 18 to 19 year olds has the lowest likelihood of being enrolled in a private school, with 1,423 (95.4% in the age bracket) attending a public institution.
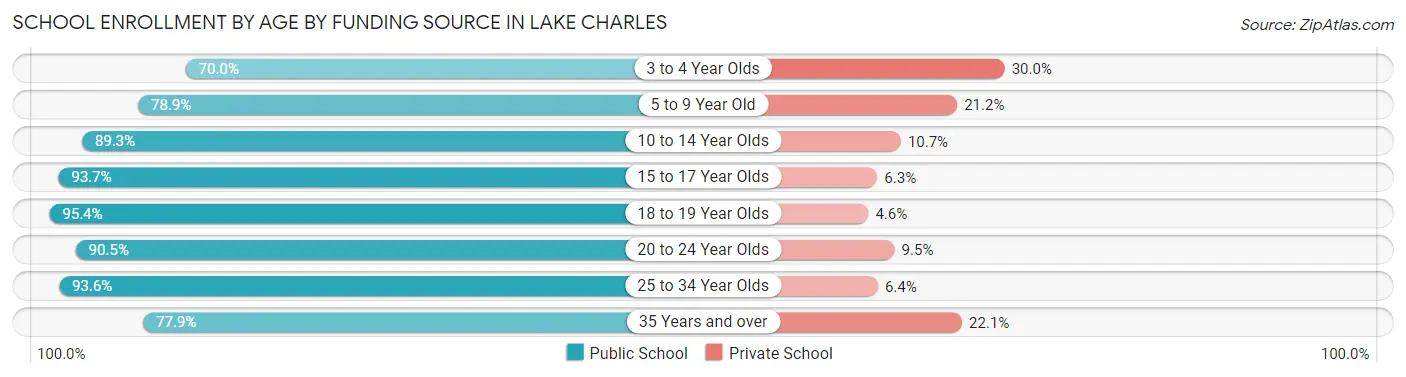
| Age Bracket | Public School | Private School |
| 3 to 4 Year Olds | 630 (70.0%) | 270 (30.0%) |
| 5 to 9 Year Old | 3,765 (78.8%) | 1,010 (21.1%) |
| 10 to 14 Year Olds | 4,706 (89.3%) | 562 (10.7%) |
| 15 to 17 Year Olds | 2,446 (93.7%) | 164 (6.3%) |
| 18 to 19 Year Olds | 1,423 (95.4%) | 69 (4.6%) |
| 20 to 24 Year Olds | 2,714 (90.5%) | 285 (9.5%) |
| 25 to 34 Year Olds | 1,506 (93.6%) | 103 (6.4%) |
| 35 Years and over | 445 (77.9%) | 126 (22.1%) |
| Total | 17,635 (87.2%) | 2,589 (12.8%) |
Educational Attainment by Field of Study in Lake Charles
Business (2,869 | 18.2%), education (2,783 | 17.7%), science & technology (1,899 | 12.1%), liberal arts & history (1,539 | 9.8%), and arts & humanities (1,205 | 7.6%) are the most common fields of study among 15,742 individuals in Lake Charles who have obtained a bachelor's degree or higher.
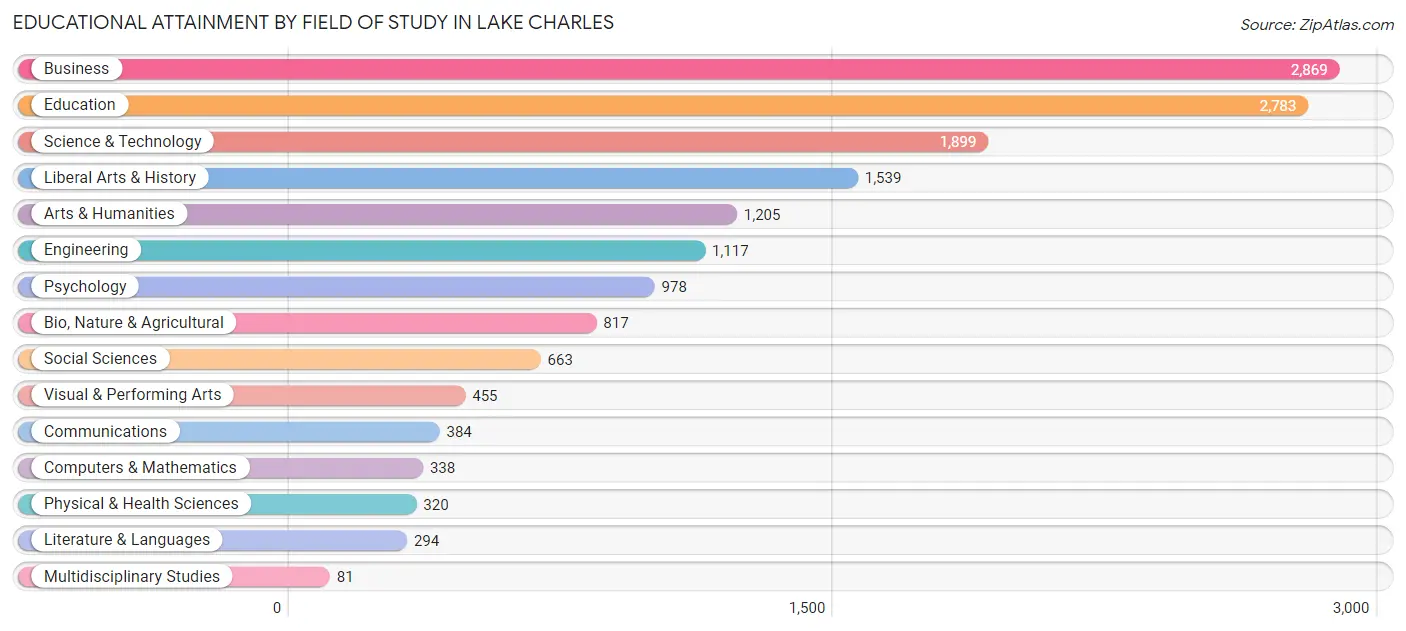
| Field of Study | # Graduates | % Graduates |
| Computers & Mathematics | 338 | 2.1% |
| Bio, Nature & Agricultural | 817 | 5.2% |
| Physical & Health Sciences | 320 | 2.0% |
| Psychology | 978 | 6.2% |
| Social Sciences | 663 | 4.2% |
| Engineering | 1,117 | 7.1% |
| Multidisciplinary Studies | 81 | 0.5% |
| Science & Technology | 1,899 | 12.1% |
| Business | 2,869 | 18.2% |
| Education | 2,783 | 17.7% |
| Literature & Languages | 294 | 1.9% |
| Liberal Arts & History | 1,539 | 9.8% |
| Visual & Performing Arts | 455 | 2.9% |
| Communications | 384 | 2.4% |
| Arts & Humanities | 1,205 | 7.6% |
| Total | 15,742 | 100.0% |
Transportation & Commute in Lake Charles
Vehicle Availability by Sex in Lake Charles
The most prevalent vehicle ownership categories in Lake Charles are males with 2 vehicles (8,503, accounting for 47.9%) and females with 2 vehicles (6,728, making up 47.8%).
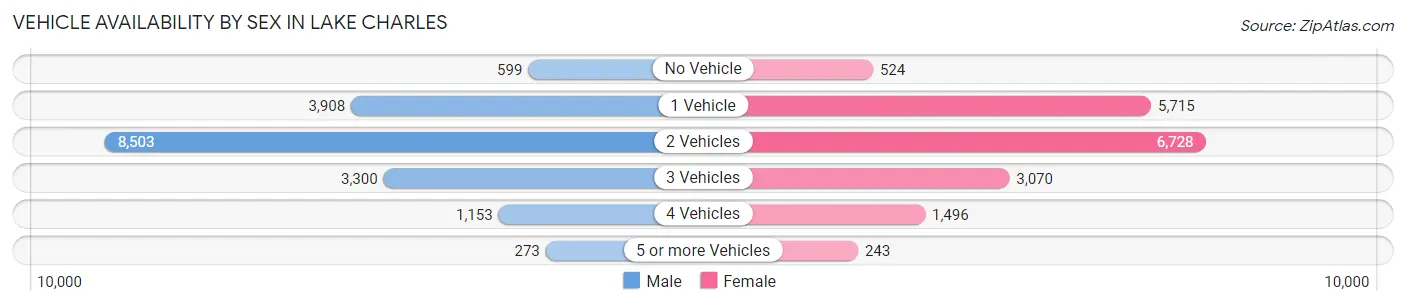
| Vehicles Available | Male | Female |
| No Vehicle | 599 (3.4%) | 524 (2.9%) |
| 1 Vehicle | 3,908 (22.0%) | 5,715 (32.2%) |
| 2 Vehicles | 8,503 (47.9%) | 6,728 (37.9%) |
| 3 Vehicles | 3,300 (18.6%) | 3,070 (17.3%) |
| 4 Vehicles | 1,153 (6.5%) | 1,496 (8.4%) |
| 5 or more Vehicles | 273 (1.5%) | 243 (1.4%) |
| Total | 17,736 (100.0%) | 17,776 (100.0%) |
Commute Time in Lake Charles
The most frequently occuring commute durations in Lake Charles are 10 to 14 minutes (8,875 commuters, 25.7%), 15 to 19 minutes (8,214 commuters, 23.8%), and 5 to 9 minutes (5,820 commuters, 16.9%).
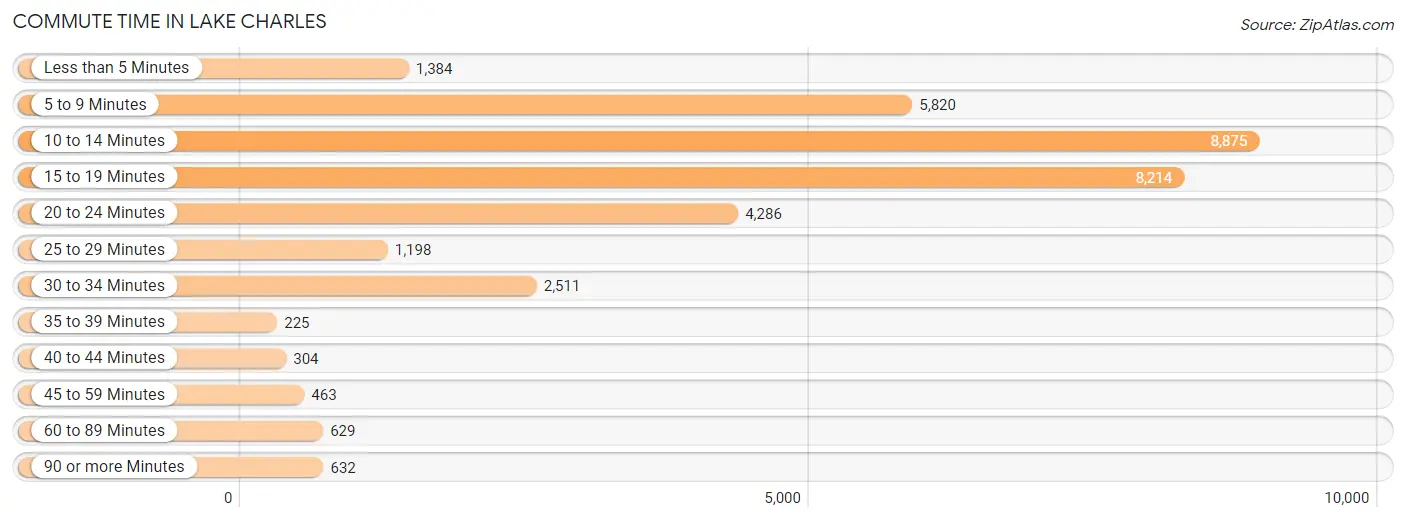
| Commute Time | # Commuters | % Commuters |
| Less than 5 Minutes | 1,384 | 4.0% |
| 5 to 9 Minutes | 5,820 | 16.9% |
| 10 to 14 Minutes | 8,875 | 25.7% |
| 15 to 19 Minutes | 8,214 | 23.8% |
| 20 to 24 Minutes | 4,286 | 12.4% |
| 25 to 29 Minutes | 1,198 | 3.5% |
| 30 to 34 Minutes | 2,511 | 7.3% |
| 35 to 39 Minutes | 225 | 0.6% |
| 40 to 44 Minutes | 304 | 0.9% |
| 45 to 59 Minutes | 463 | 1.3% |
| 60 to 89 Minutes | 629 | 1.8% |
| 90 or more Minutes | 632 | 1.8% |
Commute Time by Sex in Lake Charles
The most common commute times in Lake Charles are 10 to 14 minutes (4,330 commuters, 25.1%) for males and 15 to 19 minutes (4,797 commuters, 27.7%) for females.
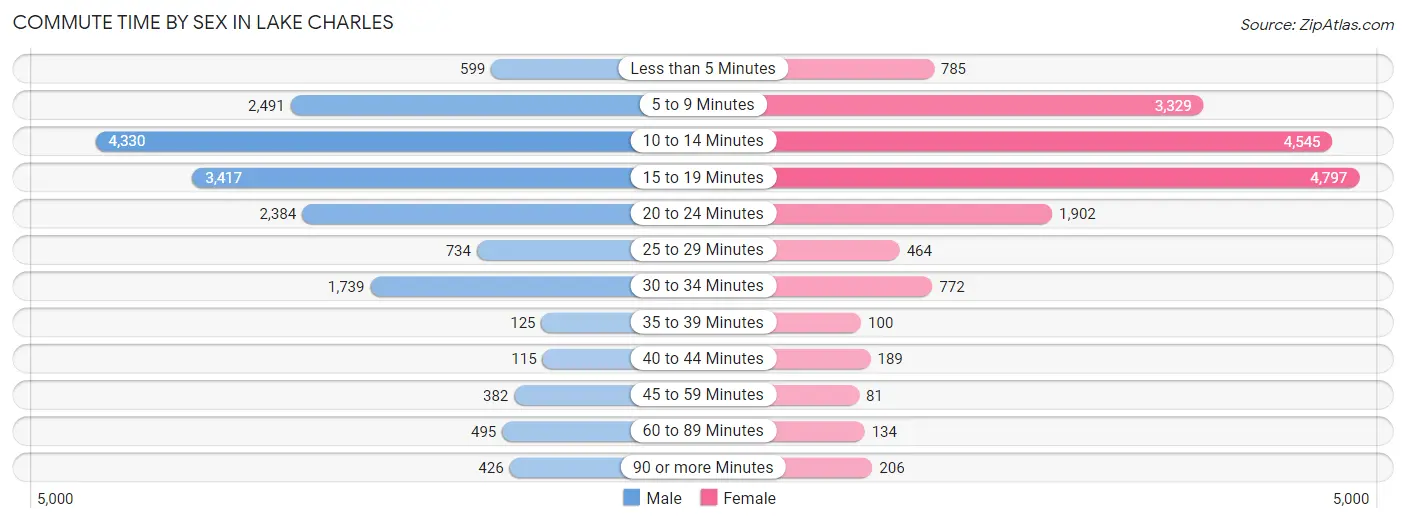
| Commute Time | Male | Female |
| Less than 5 Minutes | 599 (3.5%) | 785 (4.5%) |
| 5 to 9 Minutes | 2,491 (14.4%) | 3,329 (19.2%) |
| 10 to 14 Minutes | 4,330 (25.1%) | 4,545 (26.3%) |
| 15 to 19 Minutes | 3,417 (19.8%) | 4,797 (27.7%) |
| 20 to 24 Minutes | 2,384 (13.8%) | 1,902 (11.0%) |
| 25 to 29 Minutes | 734 (4.3%) | 464 (2.7%) |
| 30 to 34 Minutes | 1,739 (10.1%) | 772 (4.5%) |
| 35 to 39 Minutes | 125 (0.7%) | 100 (0.6%) |
| 40 to 44 Minutes | 115 (0.7%) | 189 (1.1%) |
| 45 to 59 Minutes | 382 (2.2%) | 81 (0.5%) |
| 60 to 89 Minutes | 495 (2.9%) | 134 (0.8%) |
| 90 or more Minutes | 426 (2.5%) | 206 (1.2%) |
Time of Departure to Work by Sex in Lake Charles
The most frequent times of departure to work in Lake Charles are 7:00 AM to 7:29 AM (2,258, 13.1%) for males and 7:00 AM to 7:29 AM (3,214, 18.6%) for females.
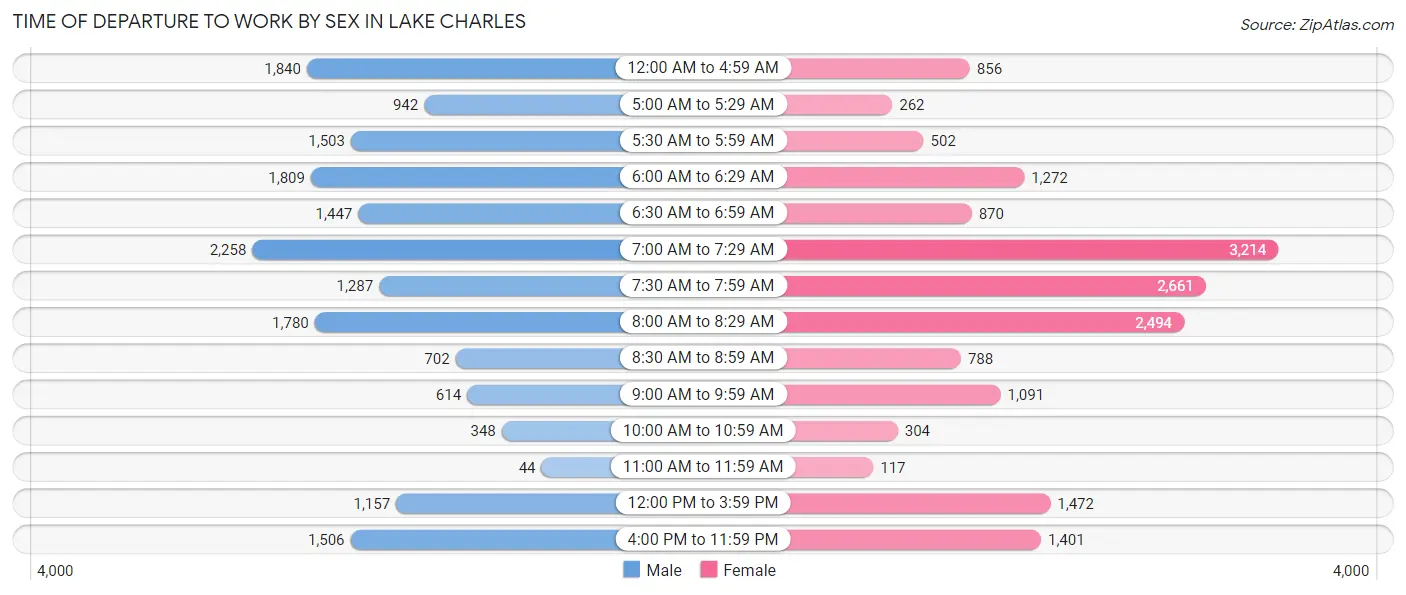
| Time of Departure | Male | Female |
| 12:00 AM to 4:59 AM | 1,840 (10.7%) | 856 (5.0%) |
| 5:00 AM to 5:29 AM | 942 (5.5%) | 262 (1.5%) |
| 5:30 AM to 5:59 AM | 1,503 (8.7%) | 502 (2.9%) |
| 6:00 AM to 6:29 AM | 1,809 (10.5%) | 1,272 (7.3%) |
| 6:30 AM to 6:59 AM | 1,447 (8.4%) | 870 (5.0%) |
| 7:00 AM to 7:29 AM | 2,258 (13.1%) | 3,214 (18.6%) |
| 7:30 AM to 7:59 AM | 1,287 (7.5%) | 2,661 (15.4%) |
| 8:00 AM to 8:29 AM | 1,780 (10.3%) | 2,494 (14.4%) |
| 8:30 AM to 8:59 AM | 702 (4.1%) | 788 (4.5%) |
| 9:00 AM to 9:59 AM | 614 (3.6%) | 1,091 (6.3%) |
| 10:00 AM to 10:59 AM | 348 (2.0%) | 304 (1.8%) |
| 11:00 AM to 11:59 AM | 44 (0.3%) | 117 (0.7%) |
| 12:00 PM to 3:59 PM | 1,157 (6.7%) | 1,472 (8.5%) |
| 4:00 PM to 11:59 PM | 1,506 (8.7%) | 1,401 (8.1%) |
| Total | 17,237 (100.0%) | 17,304 (100.0%) |
Housing Occupancy in Lake Charles
Occupancy by Ownership in Lake Charles
Of the total 32,187 dwellings in Lake Charles, owner-occupied units account for 18,543 (57.6%), while renter-occupied units make up 13,644 (42.4%).
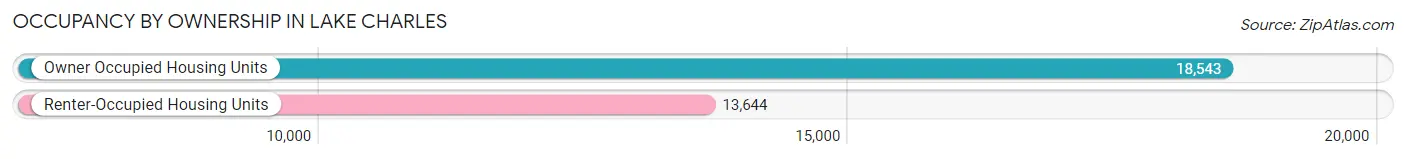
| Occupancy | # Housing Units | % Housing Units |
| Owner Occupied Housing Units | 18,543 | 57.6% |
| Renter-Occupied Housing Units | 13,644 | 42.4% |
| Total Occupied Housing Units | 32,187 | 100.0% |
Occupancy by Household Size in Lake Charles
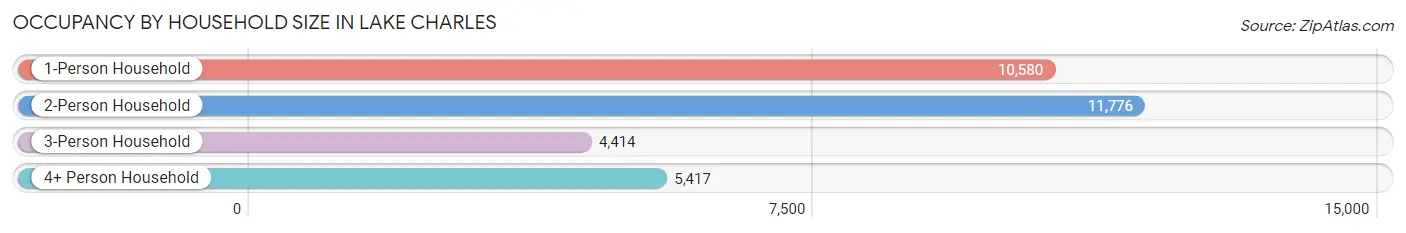
| Household Size | # Housing Units | % Housing Units |
| 1-Person Household | 10,580 | 32.9% |
| 2-Person Household | 11,776 | 36.6% |
| 3-Person Household | 4,414 | 13.7% |
| 4+ Person Household | 5,417 | 16.8% |
| Total Housing Units | 32,187 | 100.0% |
Occupancy by Ownership by Household Size in Lake Charles
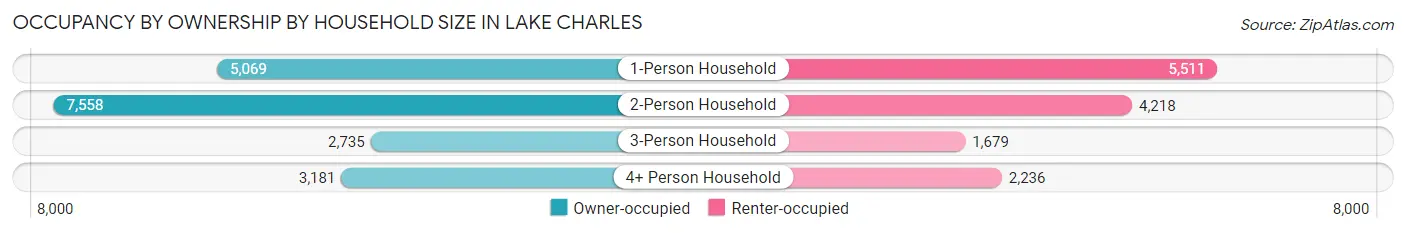
| Household Size | Owner-occupied | Renter-occupied |
| 1-Person Household | 5,069 (47.9%) | 5,511 (52.1%) |
| 2-Person Household | 7,558 (64.2%) | 4,218 (35.8%) |
| 3-Person Household | 2,735 (62.0%) | 1,679 (38.0%) |
| 4+ Person Household | 3,181 (58.7%) | 2,236 (41.3%) |
| Total Housing Units | 18,543 (57.6%) | 13,644 (42.4%) |
Occupancy by Educational Attainment in Lake Charles
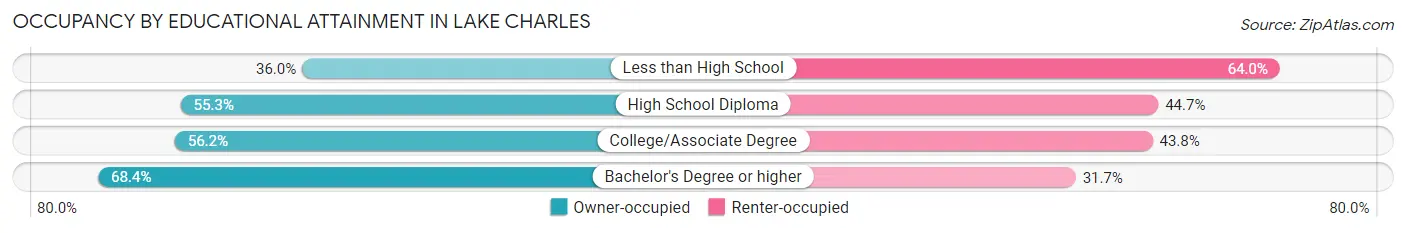
| Household Size | Owner-occupied | Renter-occupied |
| Less than High School | 1,051 (36.0%) | 1,869 (64.0%) |
| High School Diploma | 4,855 (55.3%) | 3,930 (44.7%) |
| College/Associate Degree | 6,283 (56.2%) | 4,903 (43.8%) |
| Bachelor's Degree or higher | 6,354 (68.3%) | 2,942 (31.7%) |
Occupancy by Age of Householder in Lake Charles
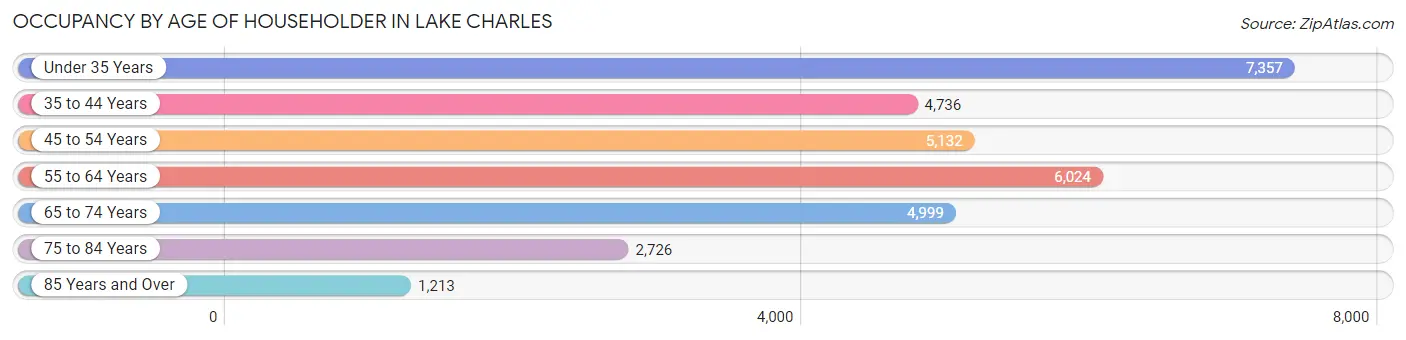
| Age Bracket | # Households | % Households |
| Under 35 Years | 7,357 | 22.9% |
| 35 to 44 Years | 4,736 | 14.7% |
| 45 to 54 Years | 5,132 | 15.9% |
| 55 to 64 Years | 6,024 | 18.7% |
| 65 to 74 Years | 4,999 | 15.5% |
| 75 to 84 Years | 2,726 | 8.5% |
| 85 Years and Over | 1,213 | 3.8% |
| Total | 32,187 | 100.0% |
Housing Finances in Lake Charles
Median Income by Occupancy in Lake Charles
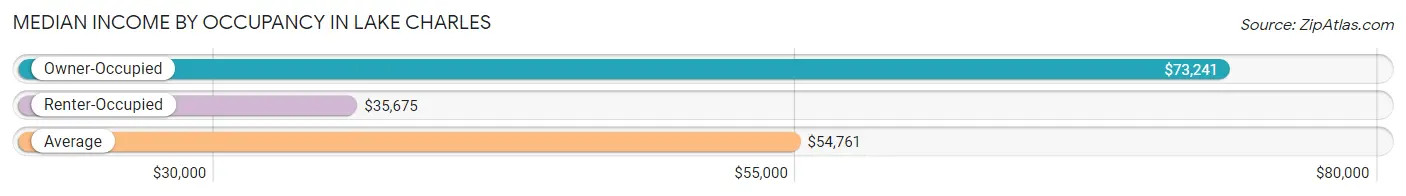
| Occupancy Type | # Households | Median Income |
| Owner-Occupied | 18,543 (57.6%) | $73,241 |
| Renter-Occupied | 13,644 (42.4%) | $35,675 |
| Average | 32,187 (100.0%) | $54,761 |
Occupancy by Householder Income Bracket in Lake Charles
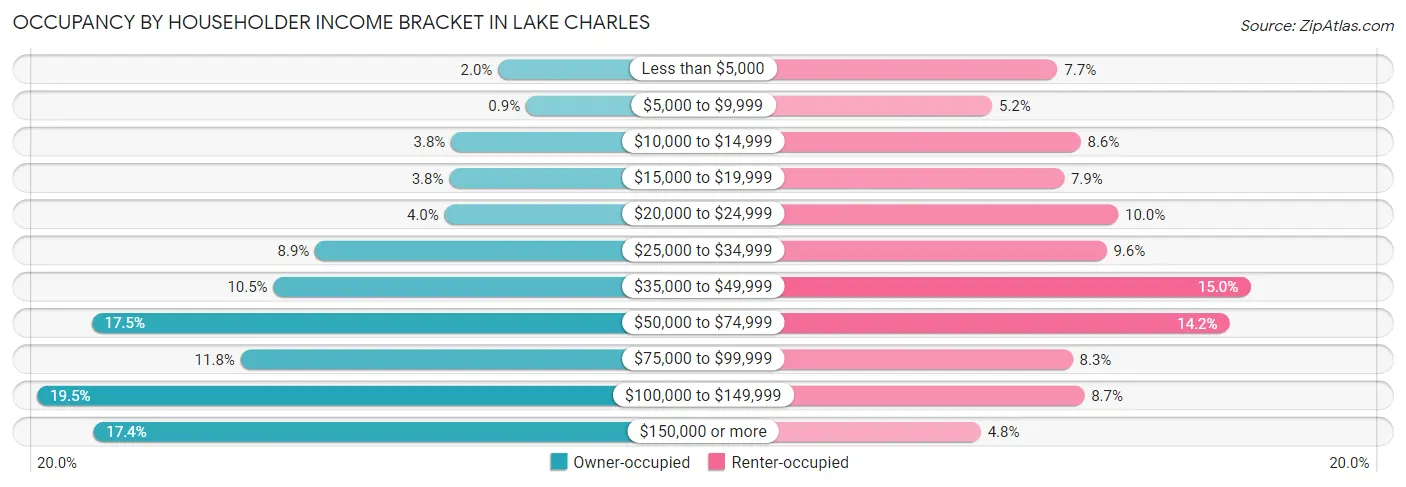
| Income Bracket | Owner-occupied | Renter-occupied |
| Less than $5,000 | 364 (2.0%) | 1,049 (7.7%) |
| $5,000 to $9,999 | 166 (0.9%) | 710 (5.2%) |
| $10,000 to $14,999 | 696 (3.7%) | 1,169 (8.6%) |
| $15,000 to $19,999 | 708 (3.8%) | 1,083 (7.9%) |
| $20,000 to $24,999 | 742 (4.0%) | 1,365 (10.0%) |
| $25,000 to $34,999 | 1,656 (8.9%) | 1,305 (9.6%) |
| $35,000 to $49,999 | 1,950 (10.5%) | 2,051 (15.0%) |
| $50,000 to $74,999 | 3,235 (17.4%) | 1,943 (14.2%) |
| $75,000 to $99,999 | 2,183 (11.8%) | 1,129 (8.3%) |
| $100,000 to $149,999 | 3,620 (19.5%) | 1,189 (8.7%) |
| $150,000 or more | 3,223 (17.4%) | 651 (4.8%) |
| Total | 18,543 (100.0%) | 13,644 (100.0%) |
Monthly Housing Cost Tiers in Lake Charles
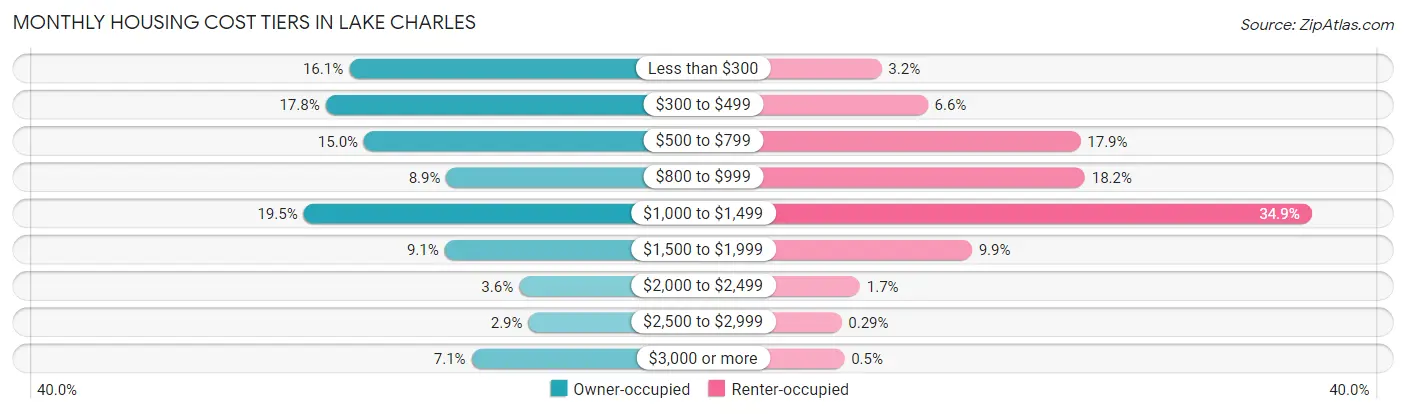
| Monthly Cost | Owner-occupied | Renter-occupied |
| Less than $300 | 2,987 (16.1%) | 442 (3.2%) |
| $300 to $499 | 3,308 (17.8%) | 906 (6.6%) |
| $500 to $799 | 2,783 (15.0%) | 2,441 (17.9%) |
| $800 to $999 | 1,657 (8.9%) | 2,486 (18.2%) |
| $1,000 to $1,499 | 3,609 (19.5%) | 4,763 (34.9%) |
| $1,500 to $1,999 | 1,682 (9.1%) | 1,349 (9.9%) |
| $2,000 to $2,499 | 665 (3.6%) | 225 (1.7%) |
| $2,500 to $2,999 | 538 (2.9%) | 39 (0.3%) |
| $3,000 or more | 1,314 (7.1%) | 68 (0.5%) |
| Total | 18,543 (100.0%) | 13,644 (100.0%) |
Physical Housing Characteristics in Lake Charles
Housing Structures in Lake Charles
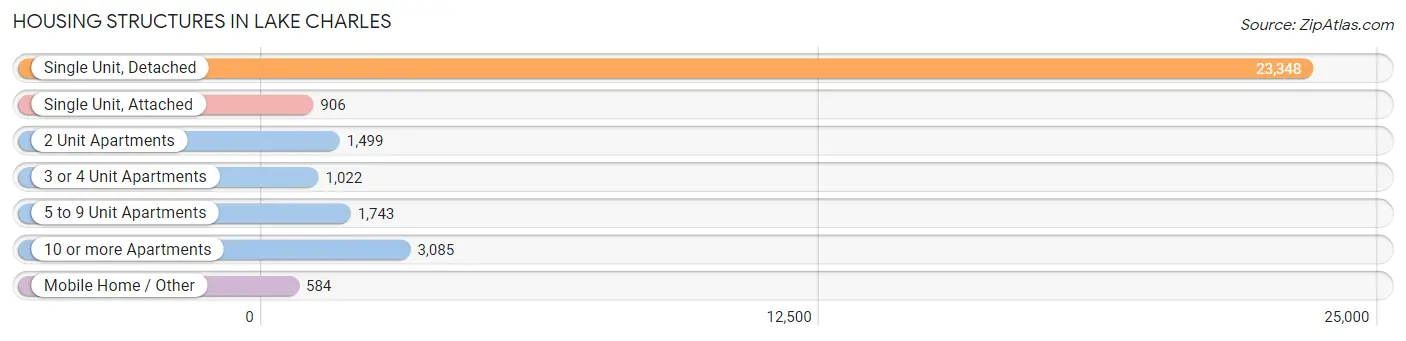
| Structure Type | # Housing Units | % Housing Units |
| Single Unit, Detached | 23,348 | 72.5% |
| Single Unit, Attached | 906 | 2.8% |
| 2 Unit Apartments | 1,499 | 4.7% |
| 3 or 4 Unit Apartments | 1,022 | 3.2% |
| 5 to 9 Unit Apartments | 1,743 | 5.4% |
| 10 or more Apartments | 3,085 | 9.6% |
| Mobile Home / Other | 584 | 1.8% |
| Total | 32,187 | 100.0% |
Housing Structures by Occupancy in Lake Charles
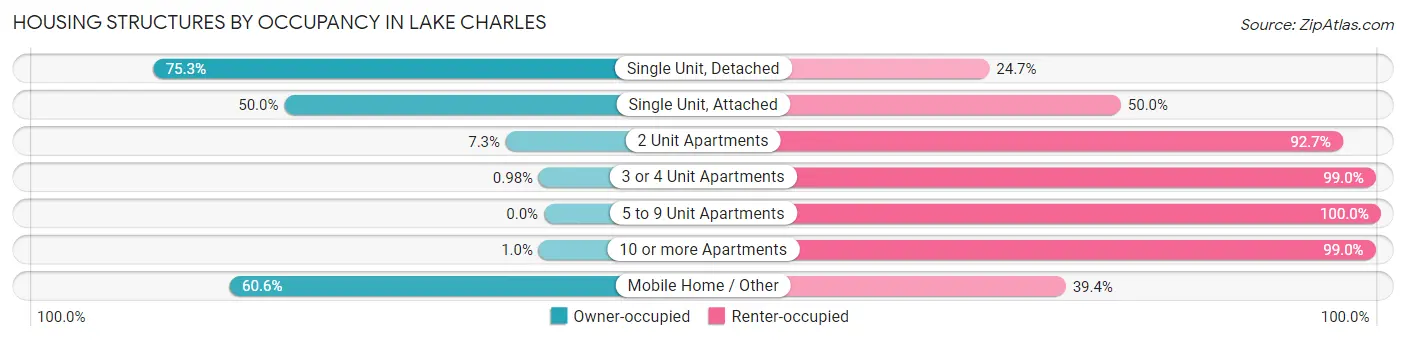
| Structure Type | Owner-occupied | Renter-occupied |
| Single Unit, Detached | 17,585 (75.3%) | 5,763 (24.7%) |
| Single Unit, Attached | 453 (50.0%) | 453 (50.0%) |
| 2 Unit Apartments | 110 (7.3%) | 1,389 (92.7%) |
| 3 or 4 Unit Apartments | 10 (1.0%) | 1,012 (99.0%) |
| 5 to 9 Unit Apartments | 0 (0.0%) | 1,743 (100.0%) |
| 10 or more Apartments | 31 (1.0%) | 3,054 (99.0%) |
| Mobile Home / Other | 354 (60.6%) | 230 (39.4%) |
| Total | 18,543 (57.6%) | 13,644 (42.4%) |
Housing Structures by Number of Rooms in Lake Charles

| Number of Rooms | Owner-occupied | Renter-occupied |
| 1 Room | 1 (0.0%) | 408 (3.0%) |
| 2 or 3 Rooms | 303 (1.6%) | 2,924 (21.4%) |
| 4 or 5 Rooms | 5,117 (27.6%) | 6,778 (49.7%) |
| 6 or 7 Rooms | 7,718 (41.6%) | 2,718 (19.9%) |
| 8 or more Rooms | 5,404 (29.1%) | 816 (6.0%) |
| Total | 18,543 (100.0%) | 13,644 (100.0%) |
Housing Structure by Heating Type in Lake Charles
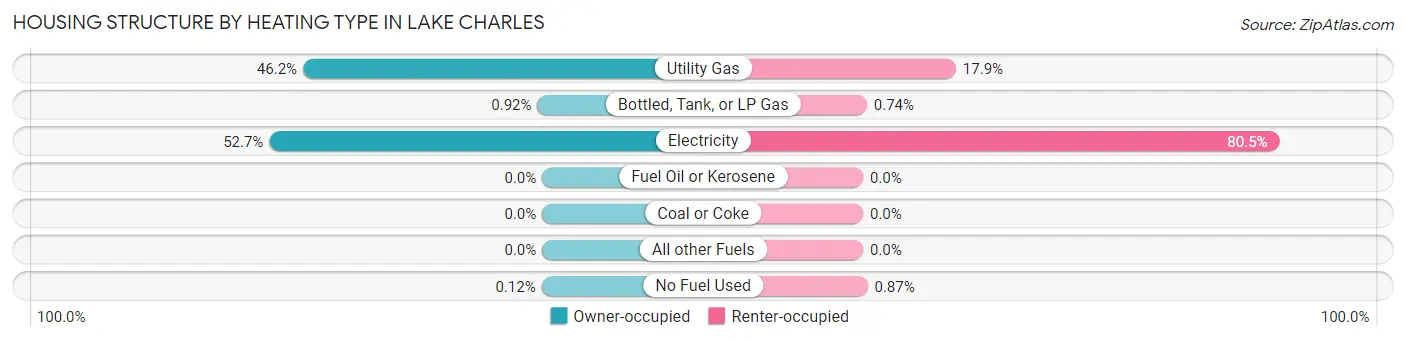
| Heating Type | Owner-occupied | Renter-occupied |
| Utility Gas | 8,570 (46.2%) | 2,448 (17.9%) |
| Bottled, Tank, or LP Gas | 170 (0.9%) | 101 (0.7%) |
| Electricity | 9,780 (52.7%) | 10,976 (80.4%) |
| Fuel Oil or Kerosene | 0 (0.0%) | 0 (0.0%) |
| Coal or Coke | 0 (0.0%) | 0 (0.0%) |
| All other Fuels | 0 (0.0%) | 0 (0.0%) |
| No Fuel Used | 23 (0.1%) | 119 (0.9%) |
| Total | 18,543 (100.0%) | 13,644 (100.0%) |
Household Vehicle Usage in Lake Charles
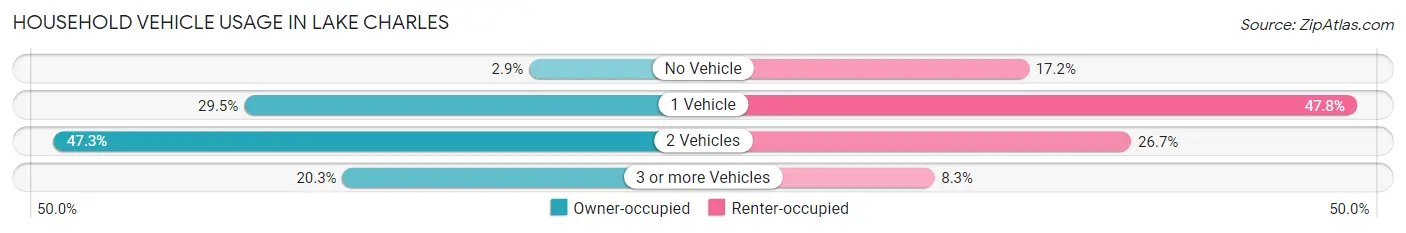
| Vehicles per Household | Owner-occupied | Renter-occupied |
| No Vehicle | 538 (2.9%) | 2,341 (17.2%) |
| 1 Vehicle | 5,472 (29.5%) | 6,519 (47.8%) |
| 2 Vehicles | 8,763 (47.3%) | 3,646 (26.7%) |
| 3 or more Vehicles | 3,770 (20.3%) | 1,138 (8.3%) |
| Total | 18,543 (100.0%) | 13,644 (100.0%) |
Real Estate & Mortgages in Lake Charles
Real Estate and Mortgage Overview in Lake Charles
| Characteristic | Without Mortgage | With Mortgage |
| Housing Units | 8,455 | 10,088 |
| Median Property Value | $189,400 | $192,000 |
| Median Household Income | $57,896 | $2,290 |
| Monthly Housing Costs | $379 | $1,262 |
| Real Estate Taxes | $496 | $556 |
Property Value by Mortgage Status in Lake Charles
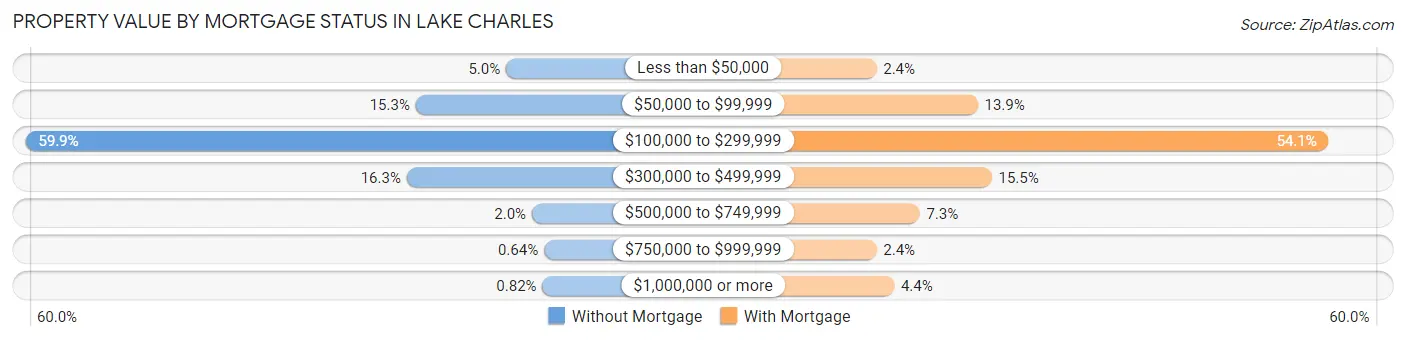
| Property Value | Without Mortgage | With Mortgage |
| Less than $50,000 | 421 (5.0%) | 239 (2.4%) |
| $50,000 to $99,999 | 1,294 (15.3%) | 1,406 (13.9%) |
| $100,000 to $299,999 | 5,065 (59.9%) | 5,455 (54.1%) |
| $300,000 to $499,999 | 1,381 (16.3%) | 1,568 (15.5%) |
| $500,000 to $749,999 | 171 (2.0%) | 737 (7.3%) |
| $750,000 to $999,999 | 54 (0.6%) | 240 (2.4%) |
| $1,000,000 or more | 69 (0.8%) | 443 (4.4%) |
| Total | 8,455 (100.0%) | 10,088 (100.0%) |
Household Income by Mortgage Status in Lake Charles
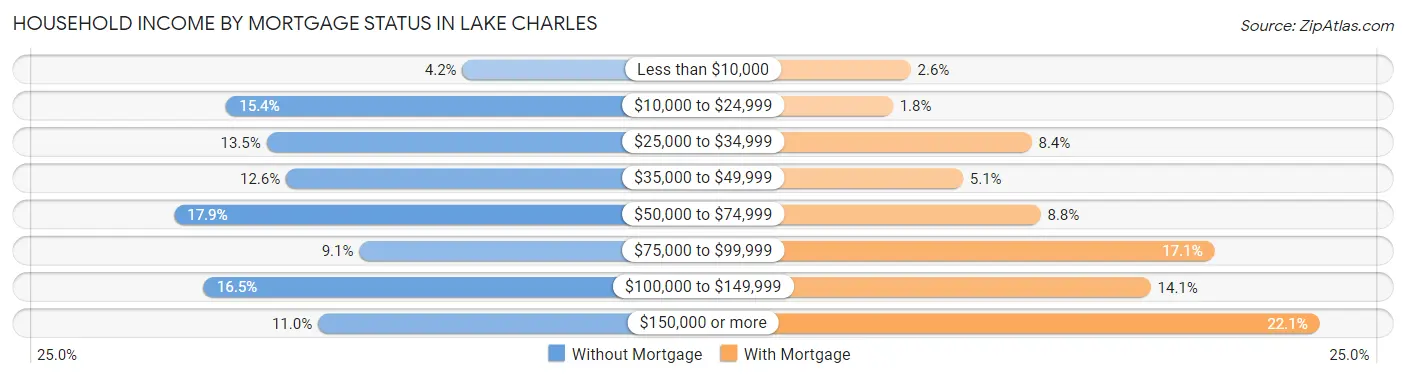
| Household Income | Without Mortgage | With Mortgage |
| Less than $10,000 | 351 (4.2%) | 264 (2.6%) |
| $10,000 to $24,999 | 1,301 (15.4%) | 179 (1.8%) |
| $25,000 to $34,999 | 1,140 (13.5%) | 845 (8.4%) |
| $35,000 to $49,999 | 1,061 (12.6%) | 516 (5.1%) |
| $50,000 to $74,999 | 1,511 (17.9%) | 889 (8.8%) |
| $75,000 to $99,999 | 766 (9.1%) | 1,724 (17.1%) |
| $100,000 to $149,999 | 1,392 (16.5%) | 1,417 (14.1%) |
| $150,000 or more | 933 (11.0%) | 2,228 (22.1%) |
| Total | 8,455 (100.0%) | 10,088 (100.0%) |
Property Value to Household Income Ratio in Lake Charles
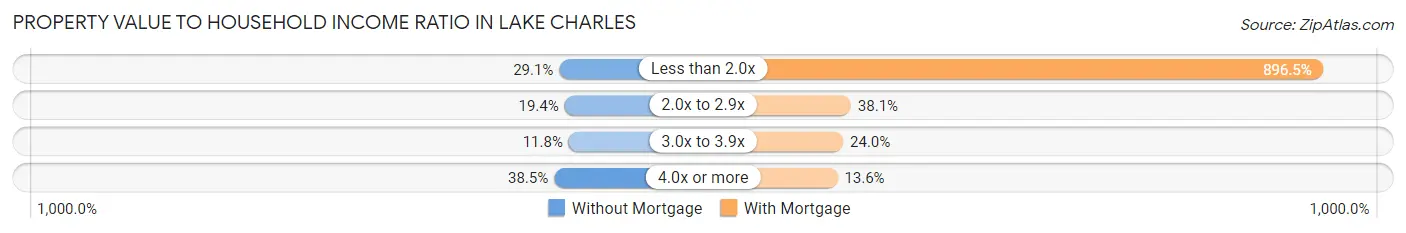
| Value-to-Income Ratio | Without Mortgage | With Mortgage |
| Less than 2.0x | 2,463 (29.1%) | 90,443 (896.5%) |
| 2.0x to 2.9x | 1,636 (19.4%) | 3,845 (38.1%) |
| 3.0x to 3.9x | 997 (11.8%) | 2,421 (24.0%) |
| 4.0x or more | 3,257 (38.5%) | 1,375 (13.6%) |
| Total | 8,455 (100.0%) | 10,088 (100.0%) |
Real Estate Taxes by Mortgage Status in Lake Charles
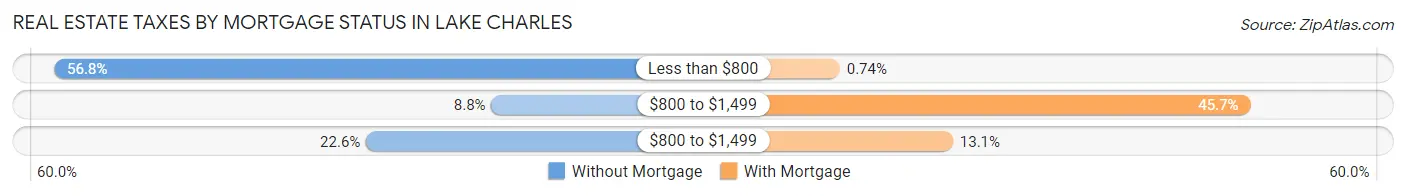
| Property Taxes | Without Mortgage | With Mortgage |
| Less than $800 | 4,800 (56.8%) | 75 (0.7%) |
| $800 to $1,499 | 747 (8.8%) | 4,614 (45.7%) |
| $800 to $1,499 | 1,908 (22.6%) | 1,325 (13.1%) |
| Total | 8,455 (100.0%) | 10,088 (100.0%) |
Health & Disability in Lake Charles
Health Insurance Coverage by Age in Lake Charles
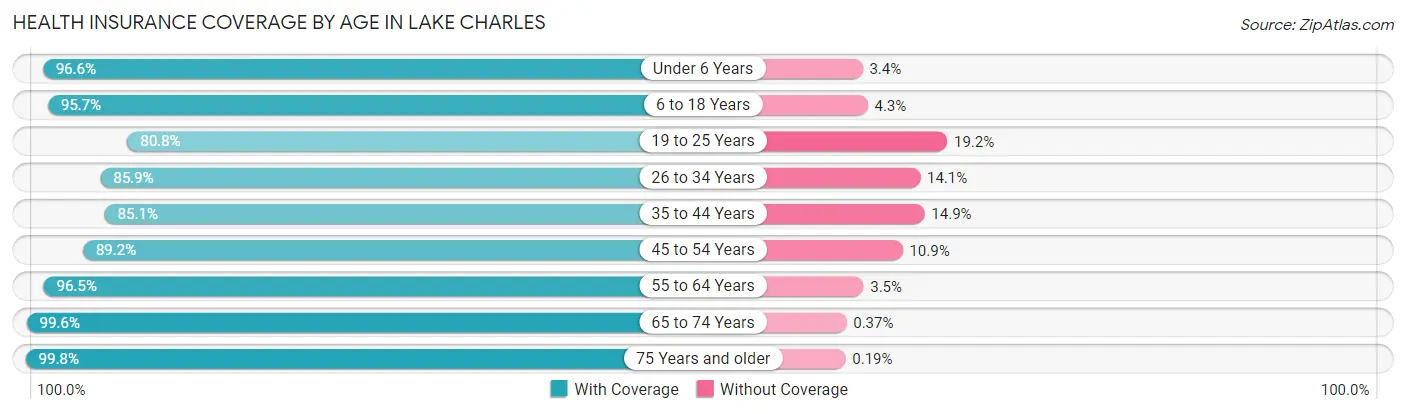
| Age Bracket | With Coverage | Without Coverage |
| Under 6 Years | 5,879 (96.6%) | 206 (3.4%) |
| 6 to 18 Years | 12,847 (95.7%) | 582 (4.3%) |
| 19 to 25 Years | 7,216 (80.8%) | 1,710 (19.2%) |
| 26 to 34 Years | 9,791 (85.9%) | 1,610 (14.1%) |
| 35 to 44 Years | 8,058 (85.1%) | 1,415 (14.9%) |
| 45 to 54 Years | 7,926 (89.1%) | 965 (10.8%) |
| 55 to 64 Years | 9,349 (96.5%) | 343 (3.5%) |
| 65 to 74 Years | 7,334 (99.6%) | 27 (0.4%) |
| 75 Years and older | 5,743 (99.8%) | 11 (0.2%) |
| Total | 74,143 (91.5%) | 6,869 (8.5%) |
Health Insurance Coverage by Citizenship Status in Lake Charles
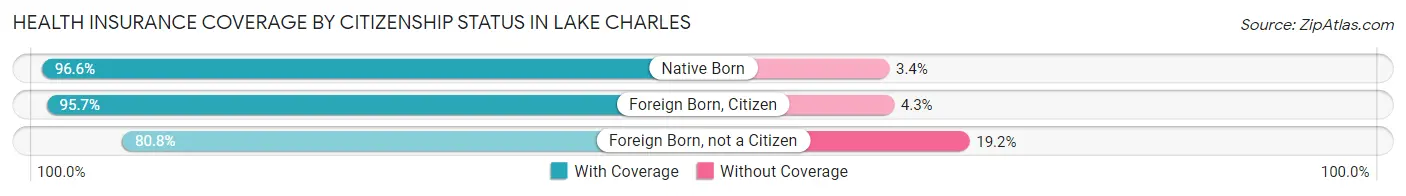
| Citizenship Status | With Coverage | Without Coverage |
| Native Born | 5,879 (96.6%) | 206 (3.4%) |
| Foreign Born, Citizen | 12,847 (95.7%) | 582 (4.3%) |
| Foreign Born, not a Citizen | 7,216 (80.8%) | 1,710 (19.2%) |
Health Insurance Coverage by Household Income in Lake Charles
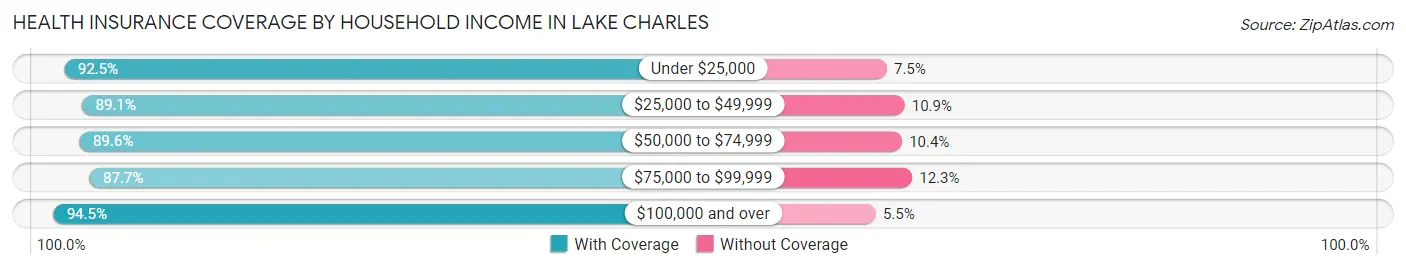
| Household Income | With Coverage | Without Coverage |
| Under $25,000 | 15,706 (92.5%) | 1,280 (7.5%) |
| $25,000 to $49,999 | 14,113 (89.1%) | 1,722 (10.9%) |
| $50,000 to $74,999 | 10,207 (89.6%) | 1,182 (10.4%) |
| $75,000 to $99,999 | 7,995 (87.7%) | 1,119 (12.3%) |
| $100,000 and over | 25,038 (94.5%) | 1,447 (5.5%) |
Public vs Private Health Insurance Coverage by Age in Lake Charles
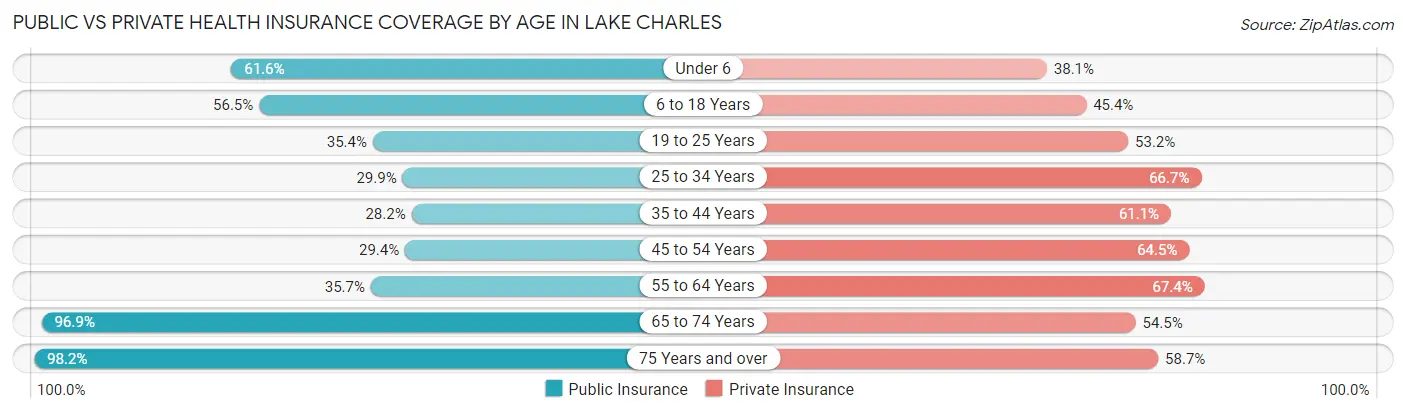
| Age Bracket | Public Insurance | Private Insurance |
| Under 6 | 3,750 (61.6%) | 2,316 (38.1%) |
| 6 to 18 Years | 7,583 (56.5%) | 6,091 (45.4%) |
| 19 to 25 Years | 3,157 (35.4%) | 4,744 (53.1%) |
| 25 to 34 Years | 3,404 (29.9%) | 7,606 (66.7%) |
| 35 to 44 Years | 2,670 (28.2%) | 5,787 (61.1%) |
| 45 to 54 Years | 2,613 (29.4%) | 5,733 (64.5%) |
| 55 to 64 Years | 3,464 (35.7%) | 6,528 (67.3%) |
| 65 to 74 Years | 7,130 (96.9%) | 4,014 (54.5%) |
| 75 Years and over | 5,653 (98.2%) | 3,379 (58.7%) |
| Total | 39,424 (48.7%) | 46,198 (57.0%) |
Disability Status by Sex by Age in Lake Charles
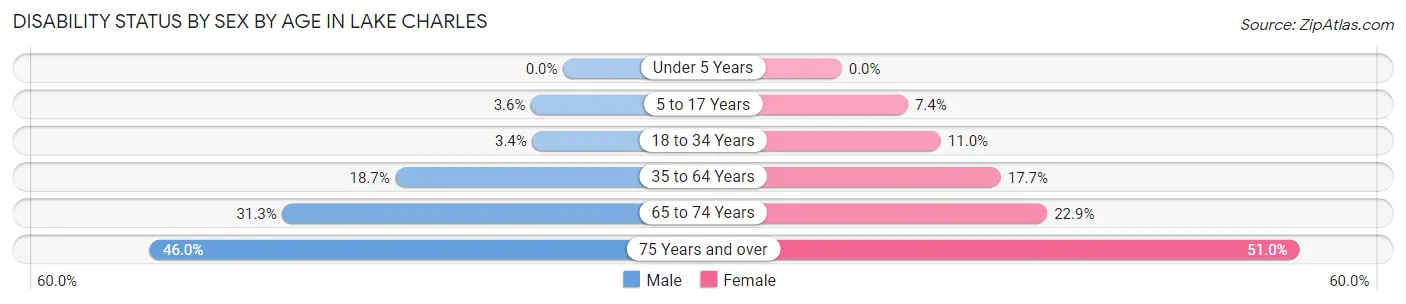
| Age Bracket | Male | Female |
| Under 5 Years | 0 (0.0%) | 0 (0.0%) |
| 5 to 17 Years | 252 (3.6%) | 437 (7.4%) |
| 18 to 34 Years | 338 (3.4%) | 1,271 (11.0%) |
| 35 to 64 Years | 2,526 (18.7%) | 2,575 (17.7%) |
| 65 to 74 Years | 1,053 (31.3%) | 914 (22.9%) |
| 75 Years and over | 1,111 (46.0%) | 1,702 (51.0%) |
Disability Class by Sex by Age in Lake Charles
Disability Class: Hearing Difficulty
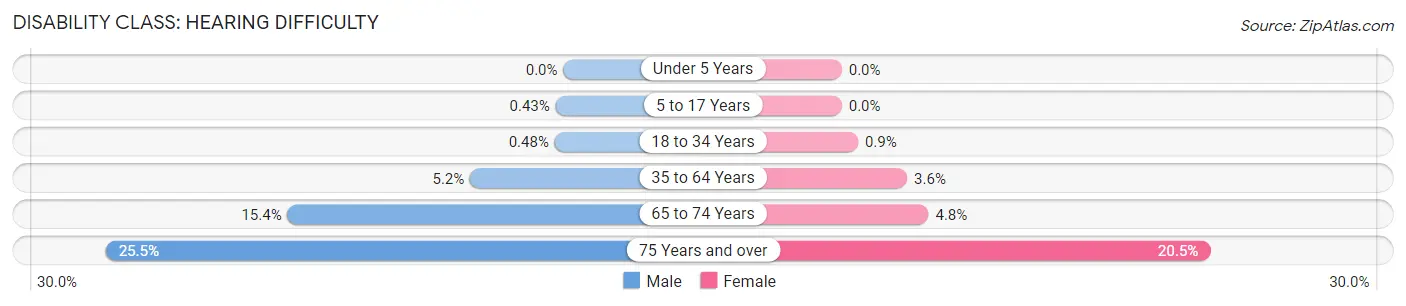
| Age Bracket | Male | Female |
| Under 5 Years | 0 (0.0%) | 0 (0.0%) |
| 5 to 17 Years | 30 (0.4%) | 0 (0.0%) |
| 18 to 34 Years | 47 (0.5%) | 104 (0.9%) |
| 35 to 64 Years | 702 (5.2%) | 530 (3.6%) |
| 65 to 74 Years | 517 (15.4%) | 193 (4.8%) |
| 75 Years and over | 615 (25.5%) | 685 (20.5%) |
Disability Class: Vision Difficulty
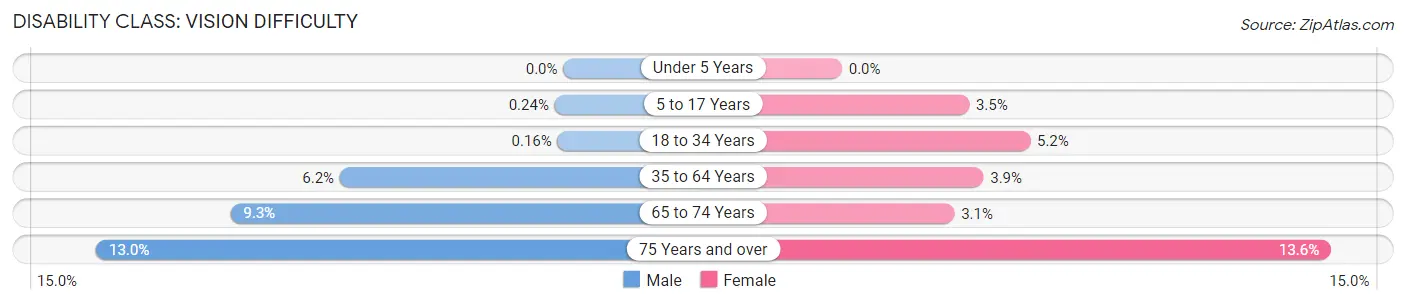
| Age Bracket | Male | Female |
| Under 5 Years | 0 (0.0%) | 0 (0.0%) |
| 5 to 17 Years | 17 (0.2%) | 210 (3.5%) |
| 18 to 34 Years | 16 (0.2%) | 603 (5.2%) |
| 35 to 64 Years | 841 (6.2%) | 573 (3.9%) |
| 65 to 74 Years | 312 (9.3%) | 125 (3.1%) |
| 75 Years and over | 314 (13.0%) | 455 (13.6%) |
Disability Class: Cognitive Difficulty
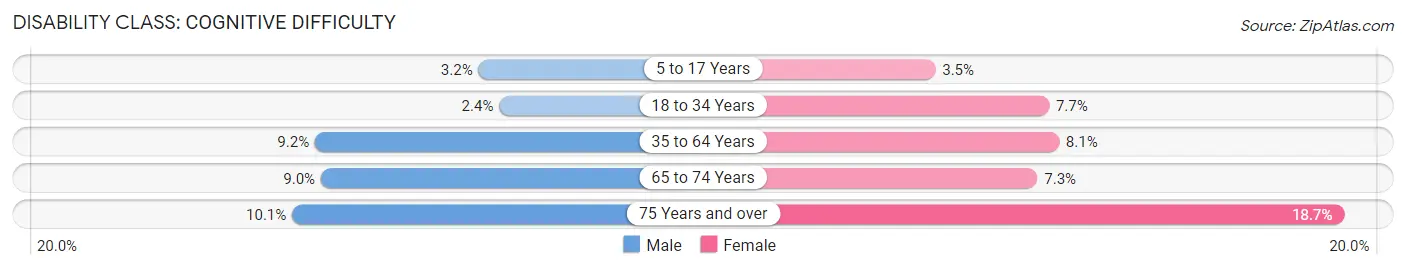
| Age Bracket | Male | Female |
| 5 to 17 Years | 222 (3.2%) | 206 (3.5%) |
| 18 to 34 Years | 235 (2.4%) | 886 (7.7%) |
| 35 to 64 Years | 1,246 (9.2%) | 1,172 (8.1%) |
| 65 to 74 Years | 303 (9.0%) | 290 (7.3%) |
| 75 Years and over | 243 (10.1%) | 623 (18.6%) |
Disability Class: Ambulatory Difficulty
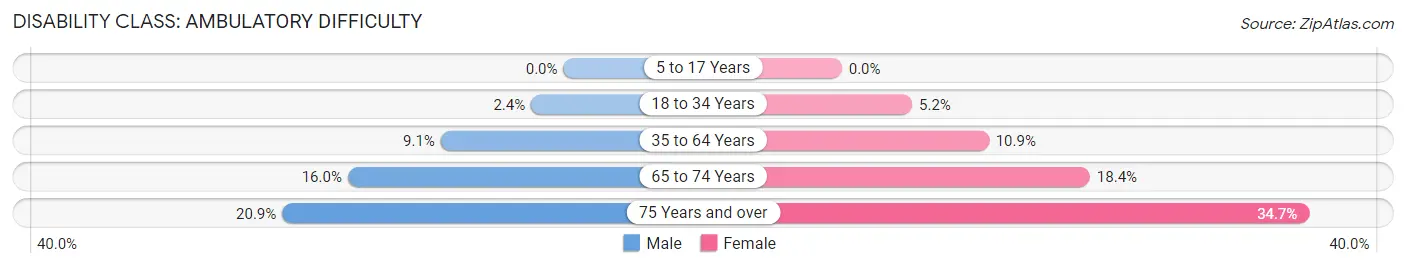
| Age Bracket | Male | Female |
| 5 to 17 Years | 0 (0.0%) | 0 (0.0%) |
| 18 to 34 Years | 237 (2.4%) | 601 (5.2%) |
| 35 to 64 Years | 1,231 (9.1%) | 1,586 (10.9%) |
| 65 to 74 Years | 539 (16.0%) | 736 (18.4%) |
| 75 Years and over | 504 (20.9%) | 1,159 (34.7%) |
Disability Class: Self-Care Difficulty
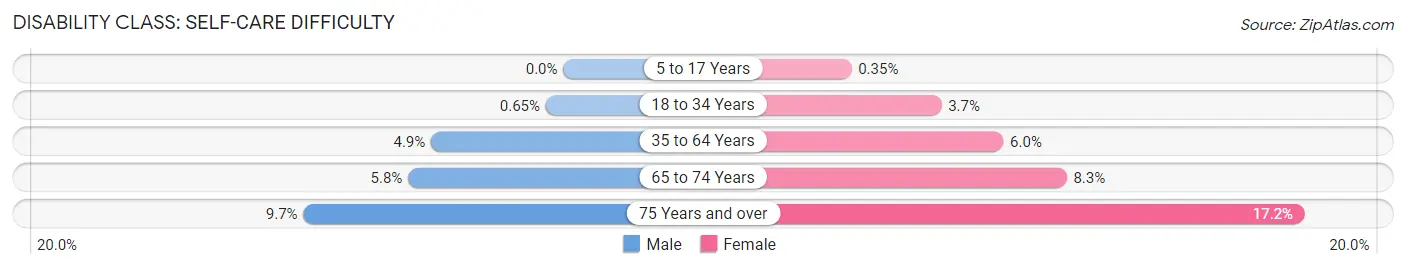
| Age Bracket | Male | Female |
| 5 to 17 Years | 0 (0.0%) | 21 (0.4%) |
| 18 to 34 Years | 64 (0.6%) | 425 (3.7%) |
| 35 to 64 Years | 664 (4.9%) | 871 (6.0%) |
| 65 to 74 Years | 194 (5.8%) | 333 (8.3%) |
| 75 Years and over | 233 (9.7%) | 574 (17.2%) |
Technology Access in Lake Charles
Computing Device Access in Lake Charles
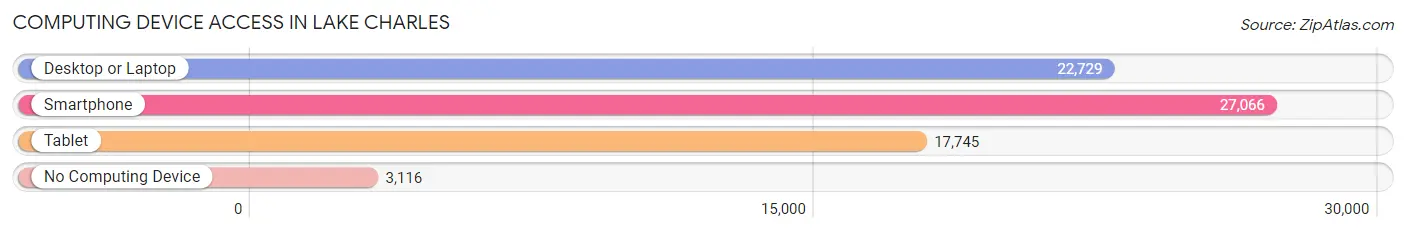
| Device Type | # Households | % Households |
| Desktop or Laptop | 22,729 | 70.6% |
| Smartphone | 27,066 | 84.1% |
| Tablet | 17,745 | 55.1% |
| No Computing Device | 3,116 | 9.7% |
| Total | 32,187 | 100.0% |
Internet Access in Lake Charles
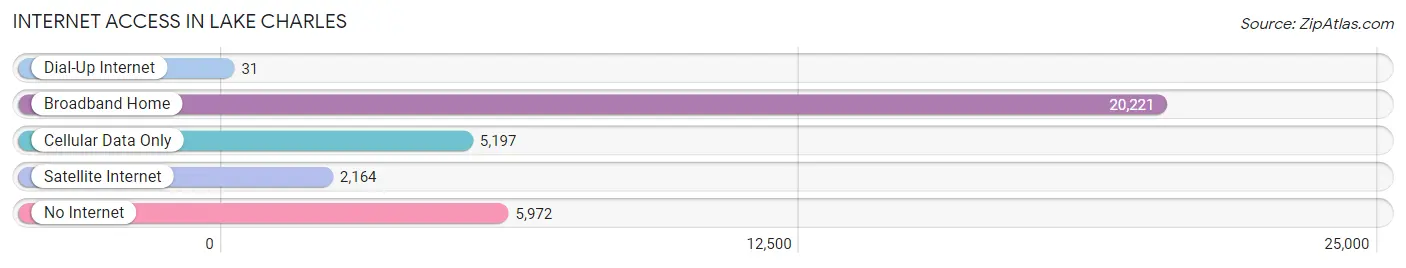
| Internet Type | # Households | % Households |
| Dial-Up Internet | 31 | 0.1% |
| Broadband Home | 20,221 | 62.8% |
| Cellular Data Only | 5,197 | 16.2% |
| Satellite Internet | 2,164 | 6.7% |
| No Internet | 5,972 | 18.5% |
| Total | 32,187 | 100.0% |
Lake Charles Summary
Lake Charles is a city located in the southwestern corner of Louisiana, United States. It is the fifth-largest city in the state and the largest principal city of the Lake Charles Metropolitan Statistical Area. The city is situated on the banks of the Calcasieu River, which is a distributary of the larger Sabine River. The city is known for its rich history, diverse culture, and vibrant economy.
History
The area that is now Lake Charles was first inhabited by the Attakapas Native American tribe. The first European settlers arrived in the area in the late 1700s, and the city was officially founded in 1861. The city was named after Charles Sallier, a French-Canadian fur trader who established a trading post in the area in the early 1800s.
During the Civil War, Lake Charles was a major port for the Confederate Army. After the war, the city experienced a period of rapid growth and development, becoming a major center for the lumber and oil industries. In the early 1900s, the city was a major hub for the railroad industry, and it was also home to several large shipyards.
Geography
Lake Charles is located in the southwestern corner of Louisiana, about 50 miles east of the Texas border. The city is situated on the banks of the Calcasieu River, which is a distributary of the larger Sabine River. The city is surrounded by several bodies of water, including Lake Charles, Prien Lake, and the Calcasieu River. The city is located in a humid subtropical climate zone, with hot, humid summers and mild winters.
Economy
Lake Charles is a major center for the oil and gas industry, and it is home to several large oil refineries. The city is also a major hub for the petrochemical industry, and it is home to several large chemical plants. The city is also a major center for the gaming industry, and it is home to several large casinos. Additionally, the city is home to several large manufacturing plants, including a large paper mill and a large steel mill.
Demographics
As of the 2010 census, the population of Lake Charles was 71,993. The city has a diverse population, with a large African American population (37.3%), a large Hispanic population (14.2%), and a large Asian population (3.2%). The median household income in the city is $41,945, and the median home value is $128,400.
Conclusion
Lake Charles is a vibrant city located in the southwestern corner of Louisiana. The city is known for its rich history, diverse culture, and vibrant economy. The city is a major center for the oil and gas industry, and it is home to several large oil refineries and chemical plants. Additionally, the city is a major hub for the gaming industry, and it is home to several large casinos. The city has a diverse population, with a large African American, Hispanic, and Asian population. The median household income in the city is $41,945, and the median home value is $128,400.
Common Questions
What is Per Capita Income in Lake Charles?
Per Capita income in Lake Charles is $34,341.
What is the Median Family Income in Lake Charles?
Median Family Income in Lake Charles is $74,758.
What is the Median Household income in Lake Charles?
Median Household Income in Lake Charles is $54,761.
What is Income or Wage Gap in Lake Charles?
Income or Wage Gap in Lake Charles is 45.6%.
Women in Lake Charles earn 54.4 cents for every dollar earned by a man.
What is Family Income Deficit in Lake Charles?
Family Income Deficit in Lake Charles is $9,821.
Families that are below poverty line in Lake Charles earn $9,821 less on average than the poverty threshold level.
What is Inequality or Gini Index in Lake Charles?
Inequality or Gini Index in Lake Charles is 0.53.
What is the Total Population of Lake Charles?
Total Population of Lake Charles is 82,430.
What is the Total Male Population of Lake Charles?
Total Male Population of Lake Charles is 40,423.
What is the Total Female Population of Lake Charles?
Total Female Population of Lake Charles is 42,007.
What is the Ratio of Males per 100 Females in Lake Charles?
There are 96.23 Males per 100 Females in Lake Charles.
What is the Ratio of Females per 100 Males in Lake Charles?
There are 103.92 Females per 100 Males in Lake Charles.
What is the Median Population Age in Lake Charles?
Median Population Age in Lake Charles is 35.7 Years.
What is the Average Family Size in Lake Charles
Average Family Size in Lake Charles is 3.3 People.
What is the Average Household Size in Lake Charles
Average Household Size in Lake Charles is 2.5 People.
How Large is the Labor Force in Lake Charles?
There are 38,754 People in the Labor Forcein in Lake Charles.
What is the Percentage of People in the Labor Force in Lake Charles?
59.1% of People are in the Labor Force in Lake Charles.
What is the Unemployment Rate in Lake Charles?
Unemployment Rate in Lake Charles is 5.7%.