Zip Codes with the Highest Percentage of Population Employed in Health Diagnosing & Treating in Fishers, IN
RELATED REPORTS & OPTIONS
Health Diagnosing & Treating
Fishers
Compare Zip Codes
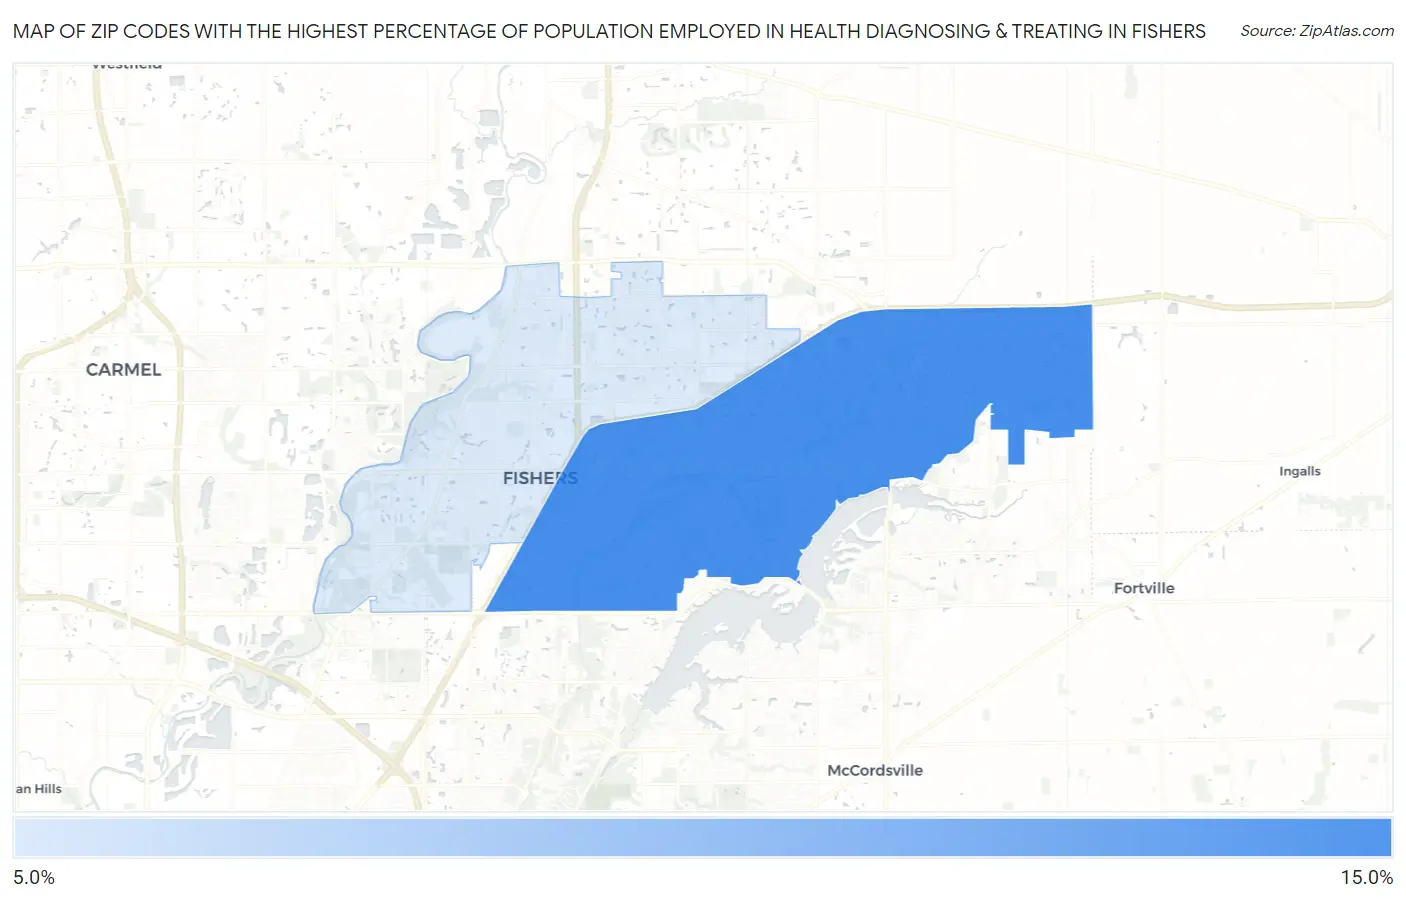
Map of Zip Codes with the Highest Percentage of Population Employed in Health Diagnosing & Treating in Fishers
6.8%
11.3%
Zip Codes with the Highest Percentage of Population Employed in Health Diagnosing & Treating in Fishers, IN
| Zip Code | % Employed | vs State | vs National | |
| 1. | 46037 | 11.3% | 6.6%(+4.80)#51 | 6.2%(+5.10)#2,625 |
| 2. | 46038 | 6.8% | 6.6%(+0.205)#262 | 6.2%(+0.511)#11,136 |
1
Common Questions
What are the Top Zip Codes with the Highest Percentage of Population Employed in Health Diagnosing & Treating in Fishers, IN?
Top Zip Codes with the Highest Percentage of Population Employed in Health Diagnosing & Treating in Fishers, IN are:
What zip code has the Highest Percentage of Population Employed in Health Diagnosing & Treating in Fishers, IN?
46037 has the Highest Percentage of Population Employed in Health Diagnosing & Treating in Fishers, IN with 11.3%.
What is the Percentage of Population Employed in Health Diagnosing & Treating in Fishers, IN?
Percentage of Population Employed in Health Diagnosing & Treating in Fishers is 9.5%.
What is the Percentage of Population Employed in Health Diagnosing & Treating in Indiana?
Percentage of Population Employed in Health Diagnosing & Treating in Indiana is 6.6%.
What is the Percentage of Population Employed in Health Diagnosing & Treating in the United States?
Percentage of Population Employed in Health Diagnosing & Treating in the United States is 6.2%.