Zip Codes with the Highest Percentage of Population Employed in Health Diagnosing & Treating in Marion, IN
RELATED REPORTS & OPTIONS
Health Diagnosing & Treating
Marion
Compare Zip Codes
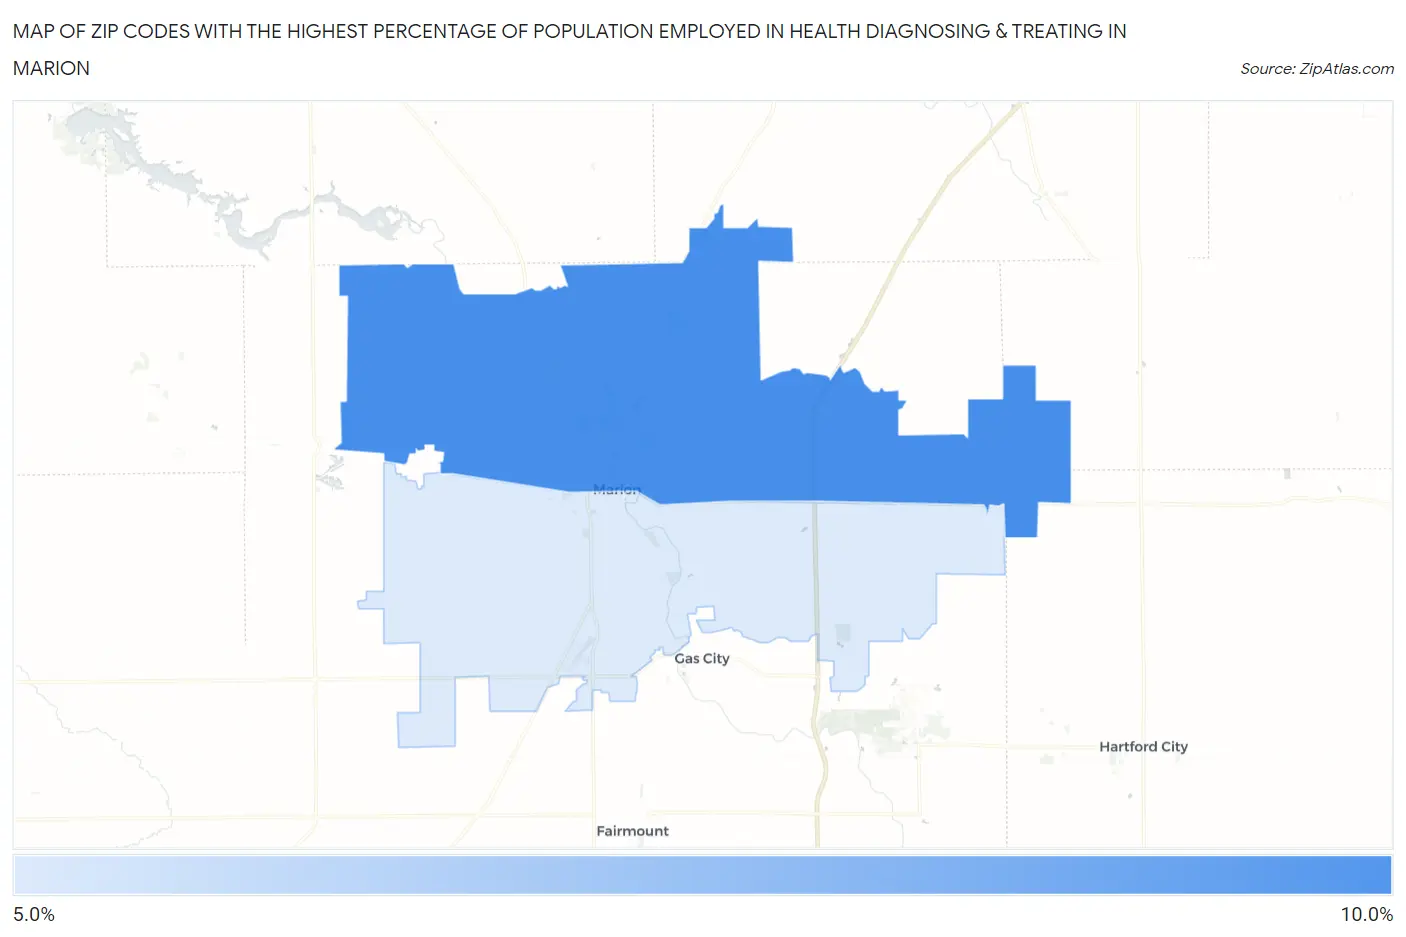
Map of Zip Codes with the Highest Percentage of Population Employed in Health Diagnosing & Treating in Marion
6.0%
9.0%
Zip Codes with the Highest Percentage of Population Employed in Health Diagnosing & Treating in Marion, IN
| Zip Code | % Employed | vs State | vs National | |
| 1. | 46952 | 9.0% | 6.6%(+2.43)#125 | 6.2%(+2.73)#5,411 |
| 2. | 46953 | 6.0% | 6.6%(-0.595)#334 | 6.2%(-0.289)#14,030 |
1
Common Questions
What are the Top Zip Codes with the Highest Percentage of Population Employed in Health Diagnosing & Treating in Marion, IN?
Top Zip Codes with the Highest Percentage of Population Employed in Health Diagnosing & Treating in Marion, IN are:
What zip code has the Highest Percentage of Population Employed in Health Diagnosing & Treating in Marion, IN?
46952 has the Highest Percentage of Population Employed in Health Diagnosing & Treating in Marion, IN with 9.0%.
What is the Percentage of Population Employed in Health Diagnosing & Treating in Marion, IN?
Percentage of Population Employed in Health Diagnosing & Treating in Marion is 19.3%.
What is the Percentage of Population Employed in Health Diagnosing & Treating in Indiana?
Percentage of Population Employed in Health Diagnosing & Treating in Indiana is 6.6%.
What is the Percentage of Population Employed in Health Diagnosing & Treating in the United States?
Percentage of Population Employed in Health Diagnosing & Treating in the United States is 6.2%.