Zip Codes with the Highest Percentage of Population Employed in Health Diagnosing & Treating in Indianapolis, IN
RELATED REPORTS & OPTIONS
Health Diagnosing & Treating
Indianapolis
Compare Zip Codes
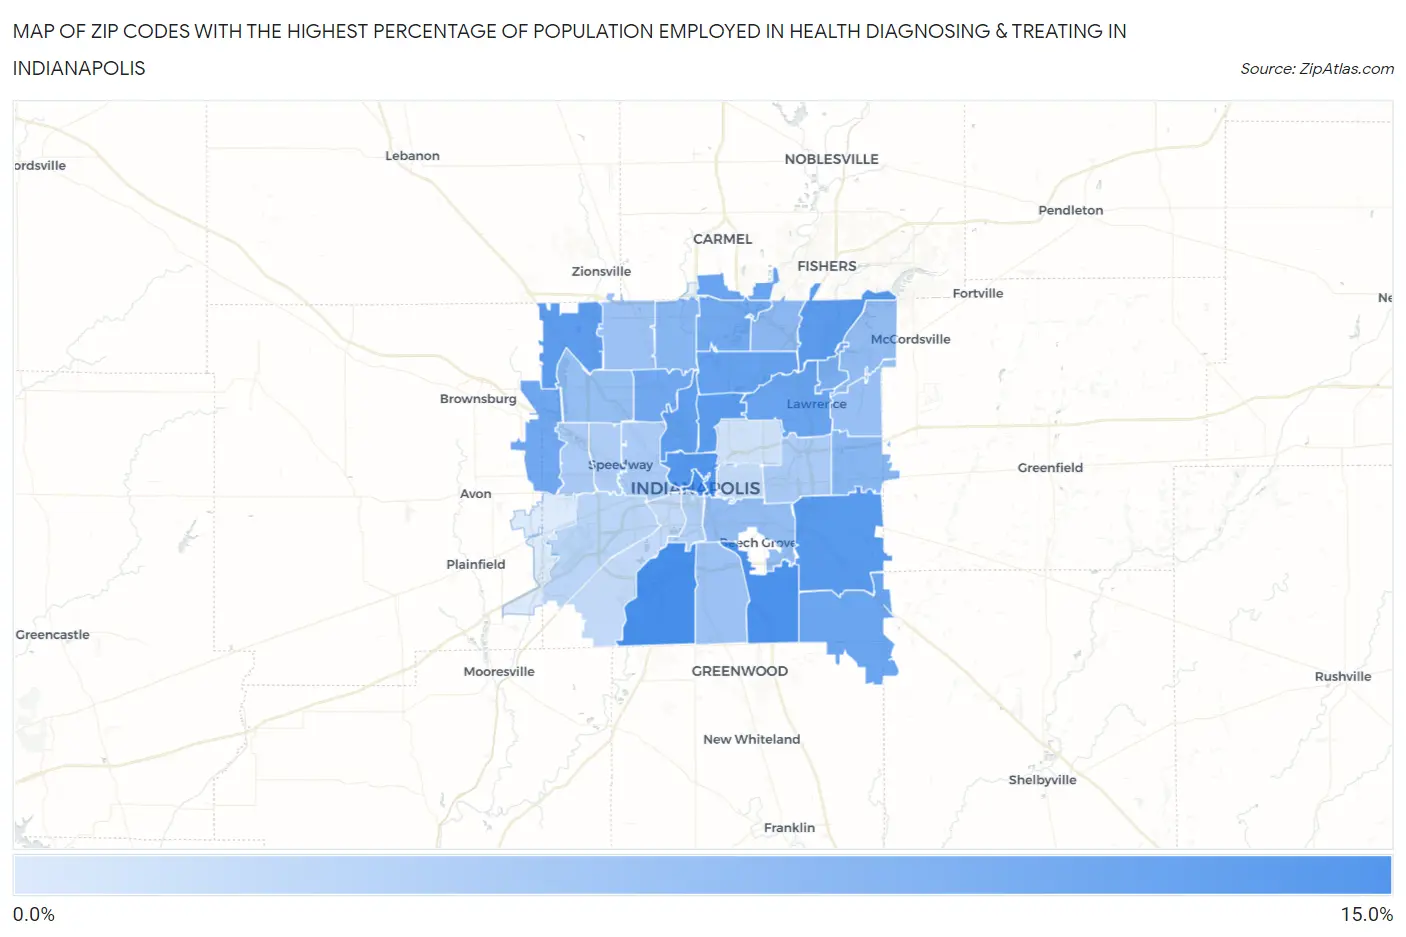
Map of Zip Codes with the Highest Percentage of Population Employed in Health Diagnosing & Treating in Indianapolis
1.9%
10.3%
Zip Codes with the Highest Percentage of Population Employed in Health Diagnosing & Treating in Indianapolis, IN
| Zip Code | % Employed | vs State | vs National | |
| 1. | 46217 | 10.3% | 6.6%(+3.78)#67 | 6.2%(+4.08)#3,496 |
| 2. | 46204 | 10.1% | 6.6%(+3.60)#74 | 6.2%(+3.90)#3,702 |
| 3. | 46237 | 10.0% | 6.6%(+3.45)#79 | 6.2%(+3.75)#3,908 |
| 4. | 46202 | 9.5% | 6.6%(+2.93)#99 | 6.2%(+3.24)#4,565 |
| 5. | 46239 | 9.3% | 6.6%(+2.80)#103 | 6.2%(+3.10)#4,768 |
| 6. | 46256 | 9.1% | 6.6%(+2.59)#115 | 6.2%(+2.90)#5,115 |
| 7. | 46205 | 9.1% | 6.6%(+2.51)#123 | 6.2%(+2.82)#5,260 |
| 8. | 46278 | 9.0% | 6.6%(+2.50)#124 | 6.2%(+2.80)#5,289 |
| 9. | 46208 | 8.9% | 6.6%(+2.30)#129 | 6.2%(+2.61)#5,621 |
| 10. | 46220 | 8.6% | 6.6%(+2.01)#141 | 6.2%(+2.31)#6,215 |
| 11. | 46280 | 8.4% | 6.6%(+1.81)#153 | 6.2%(+2.11)#6,624 |
| 12. | 46226 | 8.3% | 6.6%(+1.75)#158 | 6.2%(+2.06)#6,763 |
| 13. | 46259 | 8.1% | 6.6%(+1.58)#169 | 6.2%(+1.89)#7,165 |
| 14. | 46234 | 7.9% | 6.6%(+1.38)#185 | 6.2%(+1.69)#7,679 |
| 15. | 46228 | 7.9% | 6.6%(+1.32)#188 | 6.2%(+1.62)#7,843 |
| 16. | 46240 | 7.8% | 6.6%(+1.28)#192 | 6.2%(+1.58)#7,926 |
| 17. | 46216 | 7.3% | 6.6%(+0.717)#221 | 6.2%(+1.02)#9,507 |
| 18. | 46260 | 6.6% | 6.6%(+0.093)#272 | 6.2%(+0.399)#11,511 |
| 19. | 46229 | 6.6% | 6.6%(+0.049)#276 | 6.2%(+0.355)#11,668 |
| 20. | 46250 | 6.3% | 6.6%(-0.242)#308 | 6.2%(+0.064)#12,725 |
| 21. | 46203 | 5.9% | 6.6%(-0.619)#335 | 6.2%(-0.313)#14,100 |
| 22. | 46236 | 5.9% | 6.6%(-0.658)#338 | 6.2%(-0.352)#14,248 |
| 23. | 46254 | 5.8% | 6.6%(-0.732)#344 | 6.2%(-0.426)#14,526 |
| 24. | 46235 | 5.7% | 6.6%(-0.882)#359 | 6.2%(-0.576)#15,105 |
| 25. | 46227 | 5.6% | 6.6%(-0.970)#373 | 6.2%(-0.664)#15,474 |
| 26. | 46268 | 5.4% | 6.6%(-1.19)#390 | 6.2%(-0.879)#16,308 |
| 27. | 46222 | 4.7% | 6.6%(-1.84)#437 | 6.2%(-1.54)#18,825 |
| 28. | 46214 | 4.7% | 6.6%(-1.88)#441 | 6.2%(-1.57)#18,952 |
| 29. | 46219 | 4.6% | 6.6%(-1.91)#445 | 6.2%(-1.60)#19,100 |
| 30. | 46224 | 4.4% | 6.6%(-2.19)#472 | 6.2%(-1.88)#20,118 |
| 31. | 46225 | 4.1% | 6.6%(-2.44)#491 | 6.2%(-2.14)#21,035 |
| 32. | 46241 | 3.7% | 6.6%(-2.82)#526 | 6.2%(-2.52)#22,212 |
| 33. | 46221 | 3.4% | 6.6%(-3.12)#544 | 6.2%(-2.81)#23,106 |
| 34. | 46201 | 3.3% | 6.6%(-3.27)#554 | 6.2%(-2.97)#23,549 |
| 35. | 46218 | 2.6% | 6.6%(-3.91)#604 | 6.2%(-3.60)#25,172 |
| 36. | 46231 | 1.9% | 6.6%(-4.68)#651 | 6.2%(-4.38)#26,693 |
1
Common Questions
What are the Top 10 Zip Codes with the Highest Percentage of Population Employed in Health Diagnosing & Treating in Indianapolis, IN?
Top 10 Zip Codes with the Highest Percentage of Population Employed in Health Diagnosing & Treating in Indianapolis, IN are:
What zip code has the Highest Percentage of Population Employed in Health Diagnosing & Treating in Indianapolis, IN?
46217 has the Highest Percentage of Population Employed in Health Diagnosing & Treating in Indianapolis, IN with 10.3%.
What is the Percentage of Population Employed in Health Diagnosing & Treating in Indianapolis, IN?
Percentage of Population Employed in Health Diagnosing & Treating in Indianapolis is 6.7%.
What is the Percentage of Population Employed in Health Diagnosing & Treating in Indiana?
Percentage of Population Employed in Health Diagnosing & Treating in Indiana is 6.6%.
What is the Percentage of Population Employed in Health Diagnosing & Treating in the United States?
Percentage of Population Employed in Health Diagnosing & Treating in the United States is 6.2%.