Zip Codes with the Highest Percentage of Population Employed in Health Diagnosing & Treating in Noblesville, IN
RELATED REPORTS & OPTIONS
Health Diagnosing & Treating
Noblesville
Compare Zip Codes
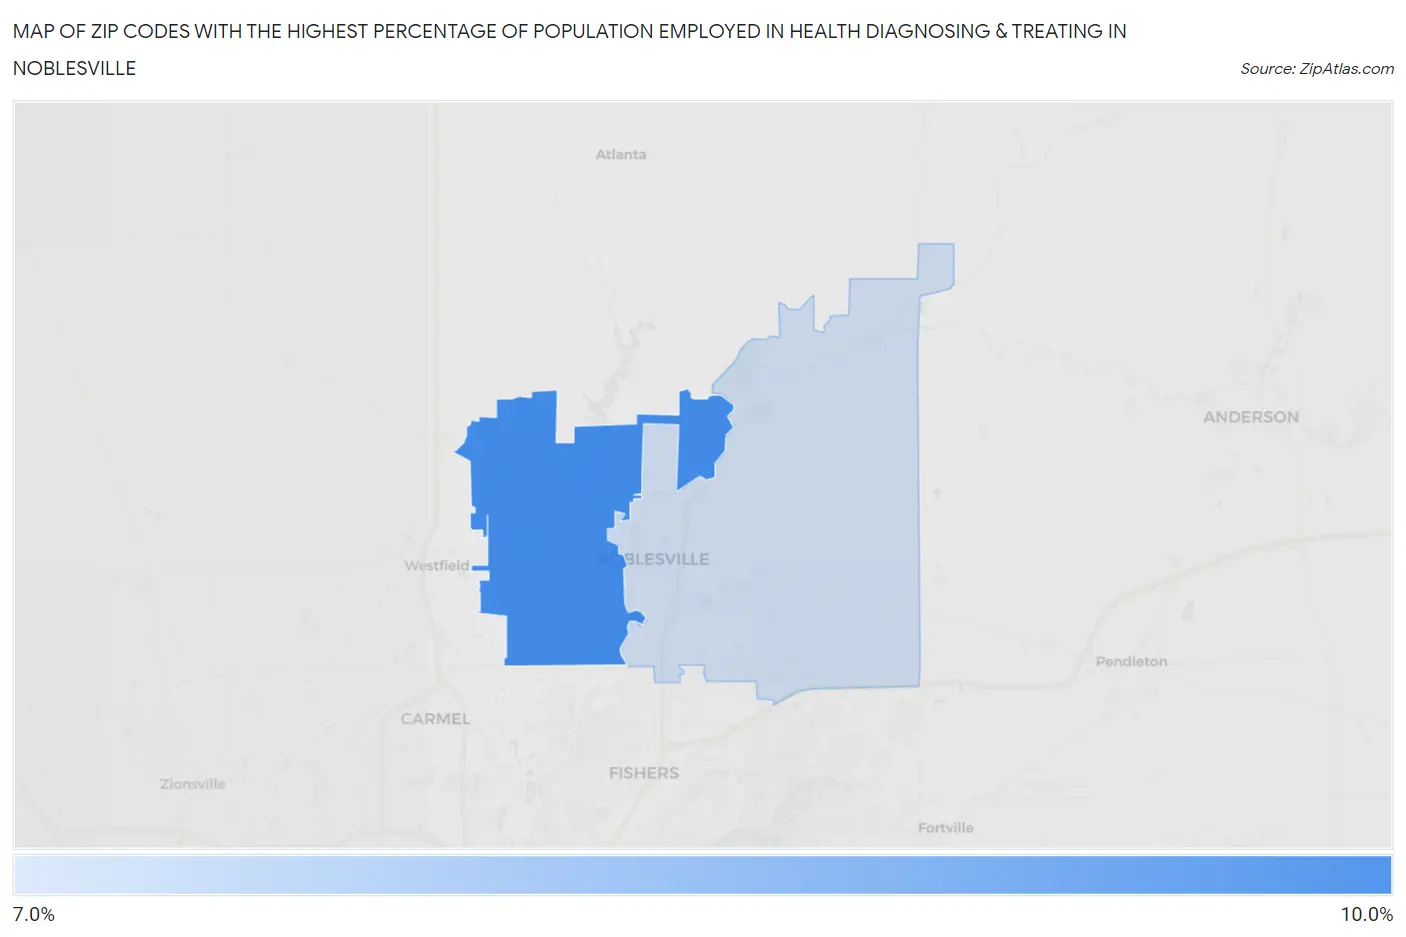
Map of Zip Codes with the Highest Percentage of Population Employed in Health Diagnosing & Treating in Noblesville
7.7%
8.3%
Zip Codes with the Highest Percentage of Population Employed in Health Diagnosing & Treating in Noblesville, IN
| Zip Code | % Employed | vs State | vs National | |
| 1. | 46062 | 8.3% | 6.6%(+1.77)#157 | 6.2%(+2.07)#6,729 |
| 2. | 46060 | 7.7% | 6.6%(+1.16)#198 | 6.2%(+1.47)#8,211 |
1
Common Questions
What are the Top Zip Codes with the Highest Percentage of Population Employed in Health Diagnosing & Treating in Noblesville, IN?
Top Zip Codes with the Highest Percentage of Population Employed in Health Diagnosing & Treating in Noblesville, IN are:
What zip code has the Highest Percentage of Population Employed in Health Diagnosing & Treating in Noblesville, IN?
46062 has the Highest Percentage of Population Employed in Health Diagnosing & Treating in Noblesville, IN with 8.3%.
What is the Percentage of Population Employed in Health Diagnosing & Treating in Noblesville, IN?
Percentage of Population Employed in Health Diagnosing & Treating in Noblesville is 7.9%.
What is the Percentage of Population Employed in Health Diagnosing & Treating in Indiana?
Percentage of Population Employed in Health Diagnosing & Treating in Indiana is 6.6%.
What is the Percentage of Population Employed in Health Diagnosing & Treating in the United States?
Percentage of Population Employed in Health Diagnosing & Treating in the United States is 6.2%.