Zip Codes with the Highest Percentage of Population Employed in Health Diagnosing & Treating in Muncie, IN
RELATED REPORTS & OPTIONS
Health Diagnosing & Treating
Muncie
Compare Zip Codes
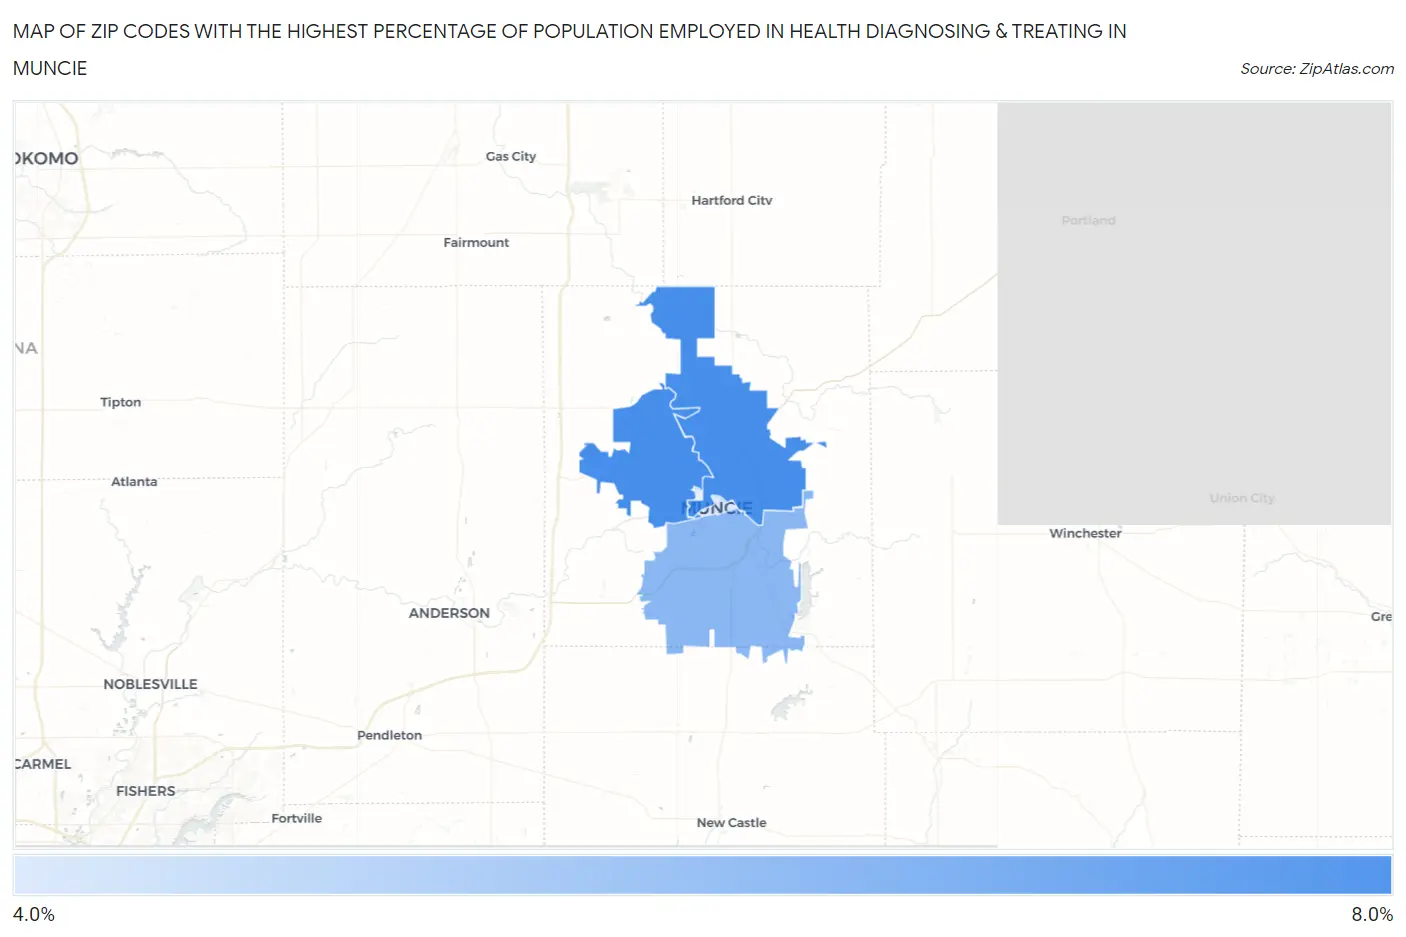
Map of Zip Codes with the Highest Percentage of Population Employed in Health Diagnosing & Treating in Muncie
4.3%
6.9%
Zip Codes with the Highest Percentage of Population Employed in Health Diagnosing & Treating in Muncie, IN
| Zip Code | % Employed | vs State | vs National | |
| 1. | 47303 | 6.9% | 6.6%(+0.309)#251 | 6.2%(+0.615)#10,813 |
| 2. | 47304 | 6.8% | 6.6%(+0.292)#256 | 6.2%(+0.598)#10,870 |
| 3. | 47302 | 5.7% | 6.6%(-0.828)#354 | 6.2%(-0.522)#14,901 |
| 4. | 47305 | 4.3% | 6.6%(-2.24)#476 | 6.2%(-1.93)#20,302 |
1
Common Questions
What are the Top 3 Zip Codes with the Highest Percentage of Population Employed in Health Diagnosing & Treating in Muncie, IN?
Top 3 Zip Codes with the Highest Percentage of Population Employed in Health Diagnosing & Treating in Muncie, IN are:
What zip code has the Highest Percentage of Population Employed in Health Diagnosing & Treating in Muncie, IN?
47303 has the Highest Percentage of Population Employed in Health Diagnosing & Treating in Muncie, IN with 6.9%.
What is the Percentage of Population Employed in Health Diagnosing & Treating in Muncie, IN?
Percentage of Population Employed in Health Diagnosing & Treating in Muncie is 5.6%.
What is the Percentage of Population Employed in Health Diagnosing & Treating in Indiana?
Percentage of Population Employed in Health Diagnosing & Treating in Indiana is 6.6%.
What is the Percentage of Population Employed in Health Diagnosing & Treating in the United States?
Percentage of Population Employed in Health Diagnosing & Treating in the United States is 6.2%.