East Germantown, IN Map & Demographics
East Germantown Map
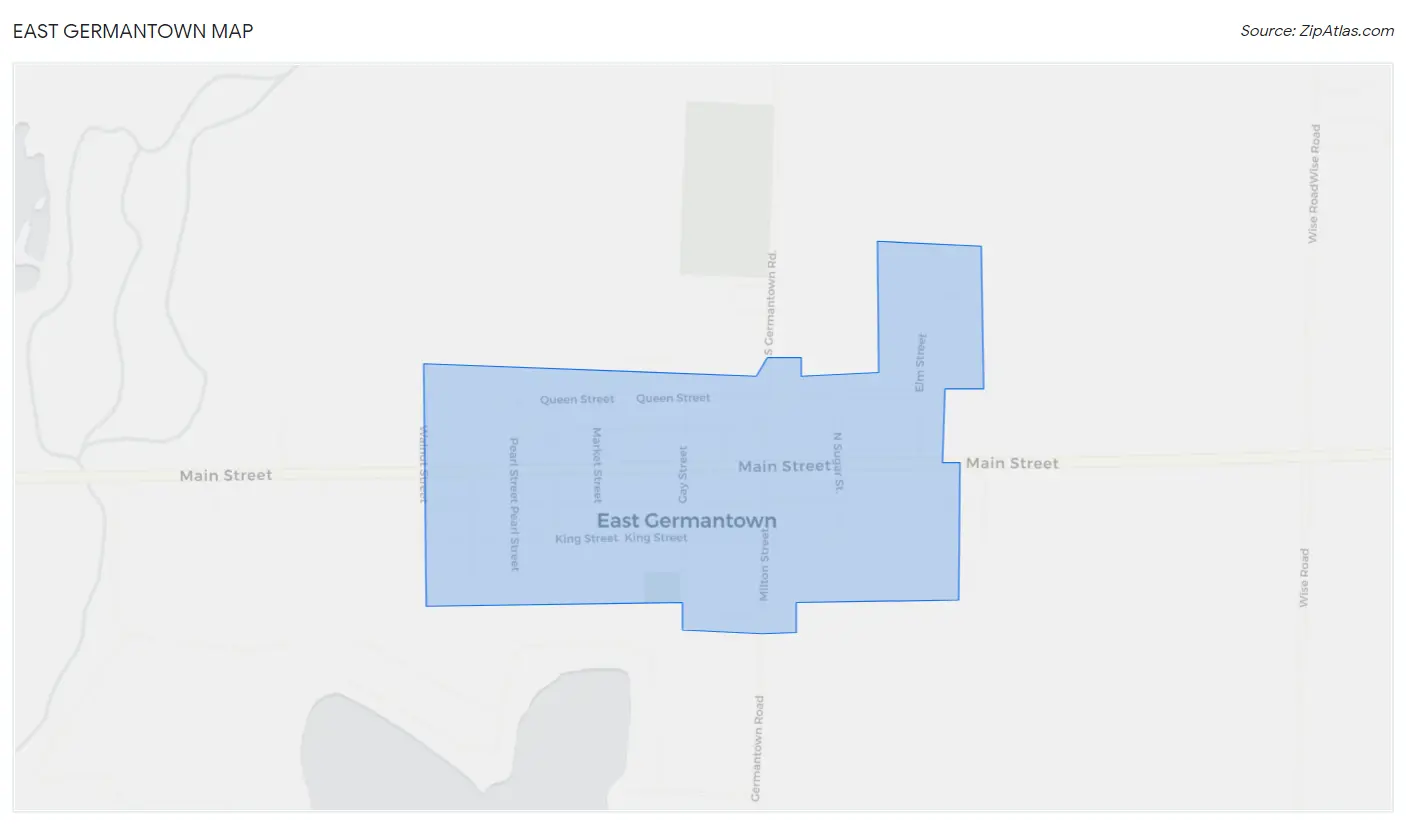
East Germantown Overview
$31,126
PER CAPITA INCOME
$71,250
AVG FAMILY INCOME
$48,929
AVG HOUSEHOLD INCOME
55.7%
WAGE / INCOME GAP [ % ]
44.3¢/ $1
WAGE / INCOME GAP [ $ ]
0.42
INEQUALITY / GINI INDEX
232
TOTAL POPULATION
120
MALE POPULATION
112
FEMALE POPULATION
107.14
MALES / 100 FEMALES
93.33
FEMALES / 100 MALES
56.6
MEDIAN AGE
2.2
AVG FAMILY SIZE
1.7
AVG HOUSEHOLD SIZE
128
LABOR FORCE [ PEOPLE ]
57.4%
PERCENT IN LABOR FORCE
East Germantown Area Codes
Income in East Germantown
Income Overview in East Germantown
Per Capita Income in East Germantown is $31,126, while median incomes of families and households are $71,250 and $48,929 respectively.
| Characteristic | Number | Measure |
| Per Capita Income | 232 | $31,126 |
| Median Family Income | 64 | $71,250 |
| Mean Family Income | 64 | $83,980 |
| Median Household Income | 140 | $48,929 |
| Mean Household Income | 140 | $54,812 |
| Income Deficit | 64 | $0 |
| Wage / Income Gap (%) | 232 | 55.72% |
| Wage / Income Gap ($) | 232 | 44.28¢ per $1 |
| Gini / Inequality Index | 232 | 0.42 |
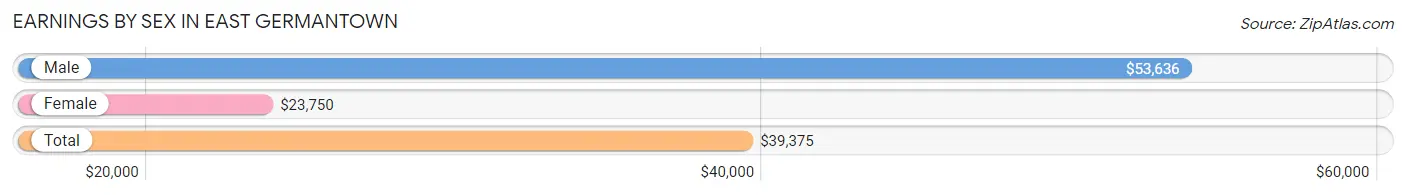
Earnings by Sex in East Germantown
Average Earnings in East Germantown are $39,375, $53,636 for men and $23,750 for women, a difference of 55.7%.
| Sex | Number | Average Earnings |
| Male | 66 (51.6%) | $53,636 |
| Female | 62 (48.4%) | $23,750 |
| Total | 128 (100.0%) | $39,375 |
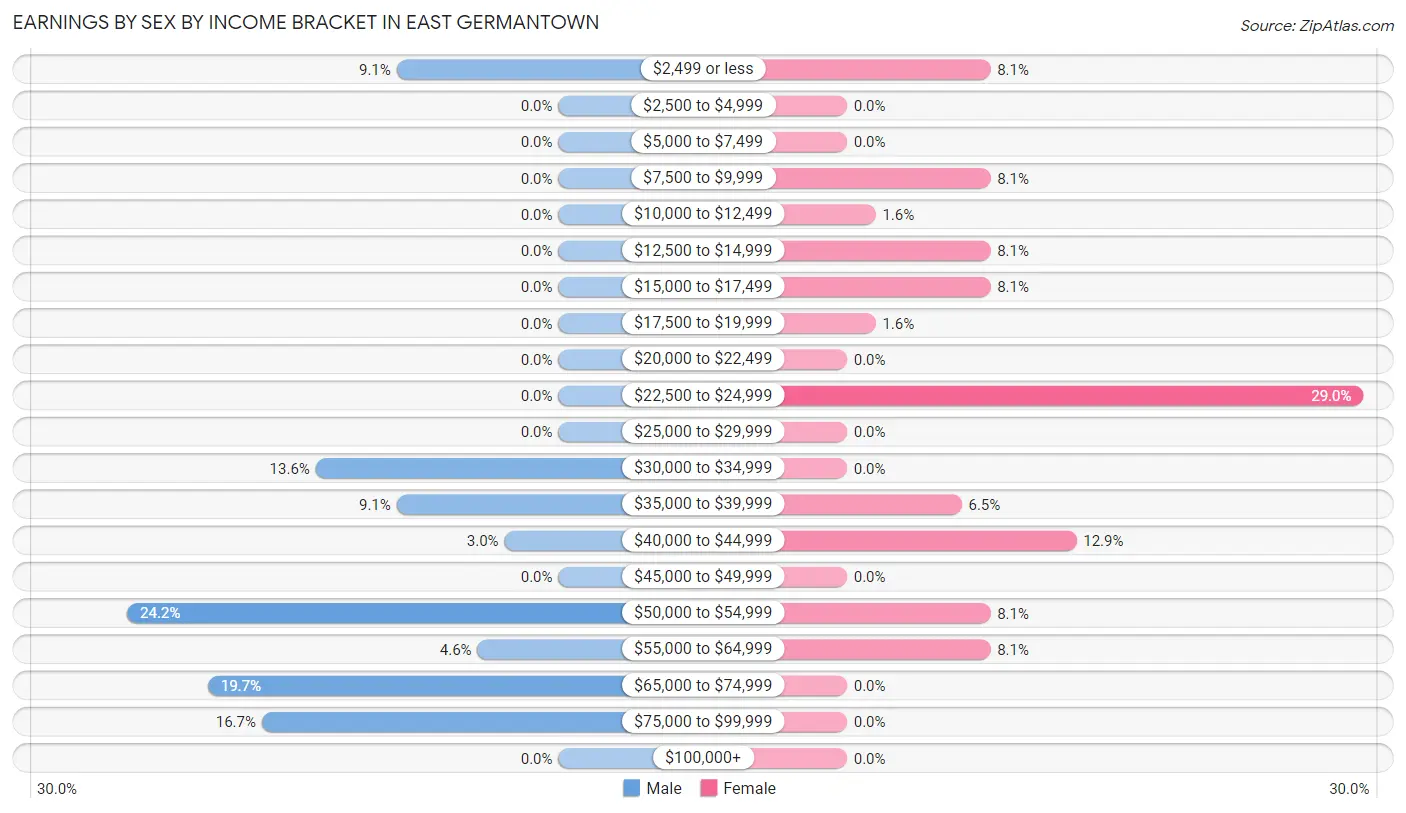
Earnings by Sex by Income Bracket in East Germantown
The most common earnings brackets in East Germantown are $50,000 to $54,999 for men (16 | 24.2%) and $22,500 to $24,999 for women (18 | 29.0%).
| Income | Male | Female |
| $2,499 or less | 6 (9.1%) | 5 (8.1%) |
| $2,500 to $4,999 | 0 (0.0%) | 0 (0.0%) |
| $5,000 to $7,499 | 0 (0.0%) | 0 (0.0%) |
| $7,500 to $9,999 | 0 (0.0%) | 5 (8.1%) |
| $10,000 to $12,499 | 0 (0.0%) | 1 (1.6%) |
| $12,500 to $14,999 | 0 (0.0%) | 5 (8.1%) |
| $15,000 to $17,499 | 0 (0.0%) | 5 (8.1%) |
| $17,500 to $19,999 | 0 (0.0%) | 1 (1.6%) |
| $20,000 to $22,499 | 0 (0.0%) | 0 (0.0%) |
| $22,500 to $24,999 | 0 (0.0%) | 18 (29.0%) |
| $25,000 to $29,999 | 0 (0.0%) | 0 (0.0%) |
| $30,000 to $34,999 | 9 (13.6%) | 0 (0.0%) |
| $35,000 to $39,999 | 6 (9.1%) | 4 (6.5%) |
| $40,000 to $44,999 | 2 (3.0%) | 8 (12.9%) |
| $45,000 to $49,999 | 0 (0.0%) | 0 (0.0%) |
| $50,000 to $54,999 | 16 (24.2%) | 5 (8.1%) |
| $55,000 to $64,999 | 3 (4.5%) | 5 (8.1%) |
| $65,000 to $74,999 | 13 (19.7%) | 0 (0.0%) |
| $75,000 to $99,999 | 11 (16.7%) | 0 (0.0%) |
| $100,000+ | 0 (0.0%) | 0 (0.0%) |
| Total | 66 (100.0%) | 62 (100.0%) |
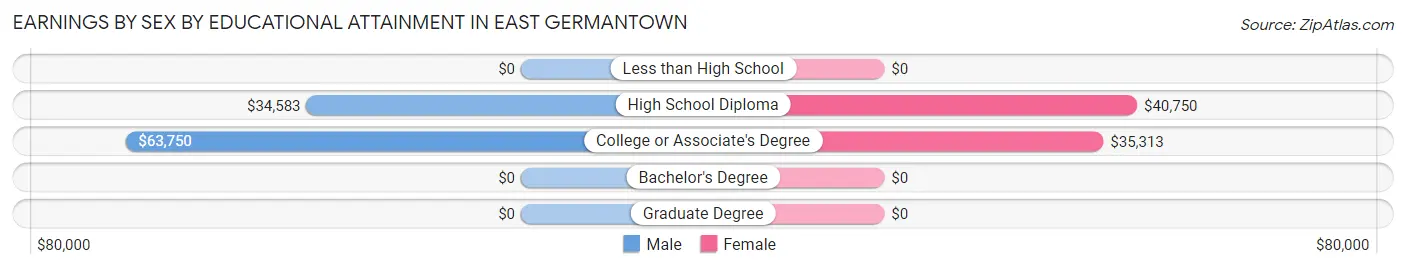
Earnings by Sex by Educational Attainment in East Germantown
Average earnings in East Germantown are $54,318 for men and $35,625 for women, a difference of 34.4%. Men with an educational attainment of college or associate's degree enjoy the highest average annual earnings of $63,750, while those with high school diploma education earn the least with $34,583. Women with an educational attainment of high school diploma earn the most with the average annual earnings of $40,750, while those with college or associate's degree education have the smallest earnings of $35,313.
| Educational Attainment | Male Income | Female Income |
| Less than High School | - | - |
| High School Diploma | $34,583 | $40,750 |
| College or Associate's Degree | $63,750 | $35,313 |
| Bachelor's Degree | - | - |
| Graduate Degree | - | - |
| Total | $54,318 | $35,625 |
Family Income in East Germantown
Family Income Brackets in East Germantown
According to the East Germantown family income data, there are 21 families falling into the $100,000 to $149,999 income range, which is the most common income bracket and makes up 32.8% of all families.
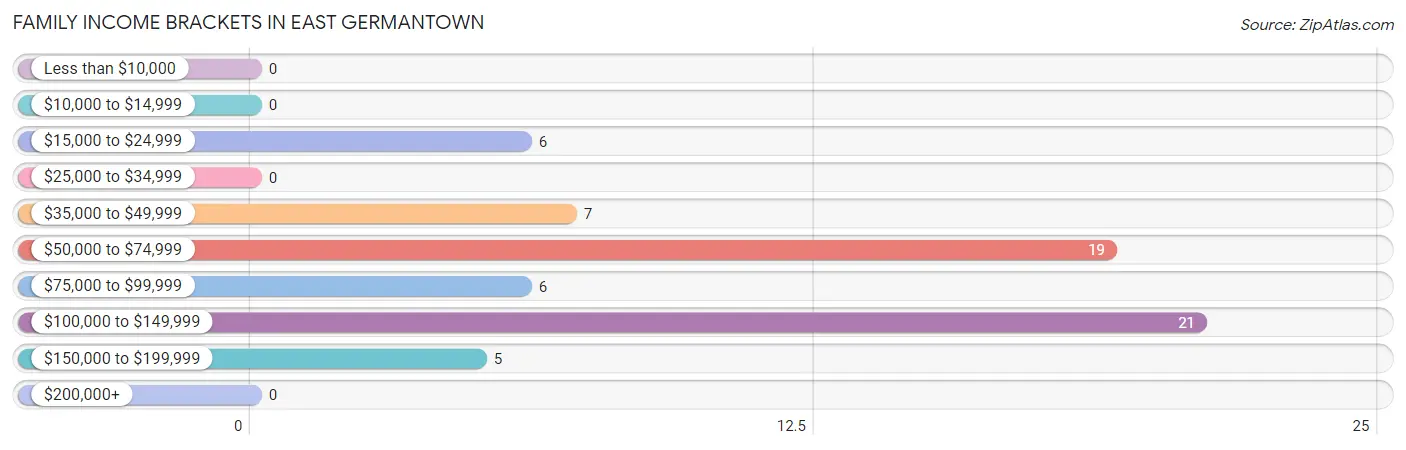
| Income Bracket | # Families | % Families |
| Less than $10,000 | 0 | 0.0% |
| $10,000 to $14,999 | 0 | 0.0% |
| $15,000 to $24,999 | 6 | 9.4% |
| $25,000 to $34,999 | 0 | 0.0% |
| $35,000 to $49,999 | 7 | 10.9% |
| $50,000 to $74,999 | 19 | 29.7% |
| $75,000 to $99,999 | 6 | 9.4% |
| $100,000 to $149,999 | 21 | 32.8% |
| $150,000 to $199,999 | 5 | 7.8% |
| $200,000+ | 0 | 0.0% |
Family Income by Famaliy Size in East Germantown
2-person families (53 | 82.8%) account for the highest median family income in East Germantown with $59,375 per family, while 2-person families (53 | 82.8%) have the highest median income of $29,688 per family member.
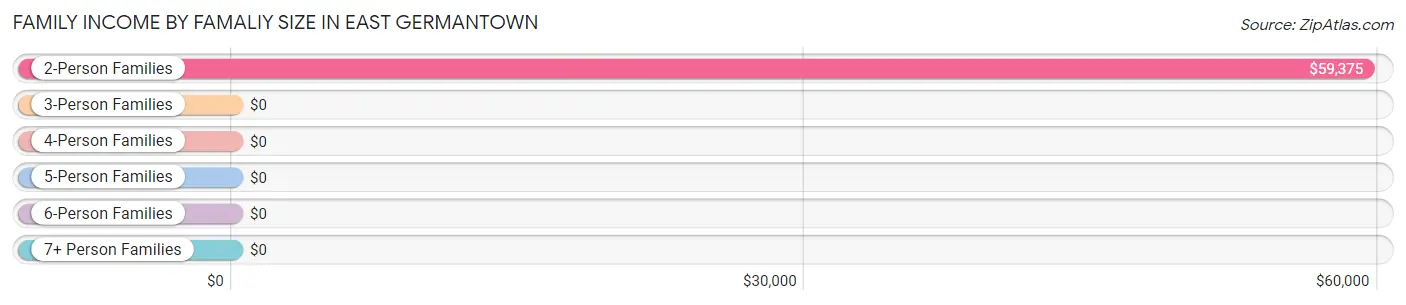
| Income Bracket | # Families | Median Income |
| 2-Person Families | 53 (82.8%) | $59,375 |
| 3-Person Families | 6 (9.4%) | $0 |
| 4-Person Families | 5 (7.8%) | $0 |
| 5-Person Families | 0 (0.0%) | $0 |
| 6-Person Families | 0 (0.0%) | $0 |
| 7+ Person Families | 0 (0.0%) | $0 |
| Total | 64 (100.0%) | $71,250 |
Family Income by Number of Earners in East Germantown
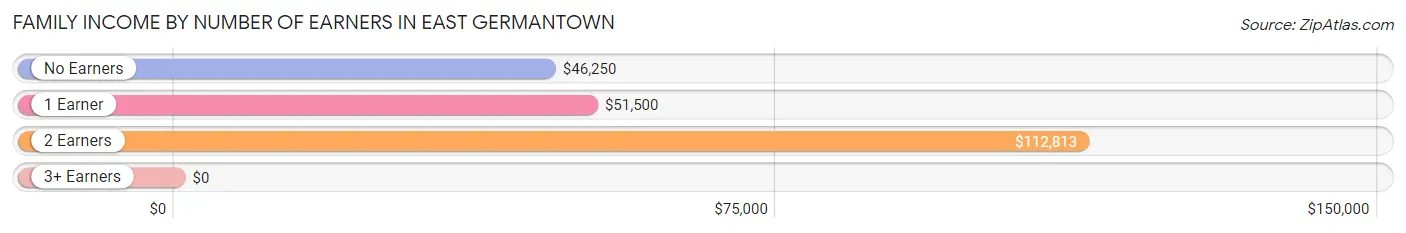
| Number of Earners | # Families | Median Income |
| No Earners | 12 (18.8%) | $46,250 |
| 1 Earner | 18 (28.1%) | $51,500 |
| 2 Earners | 23 (35.9%) | $112,813 |
| 3+ Earners | 11 (17.2%) | $0 |
| Total | 64 (100.0%) | $71,250 |
Household Income in East Germantown
Household Income Brackets in East Germantown
With 34 households falling in the category, the $50,000 to $74,999 income range is the most frequent in East Germantown, accounting for 24.3% of all households.
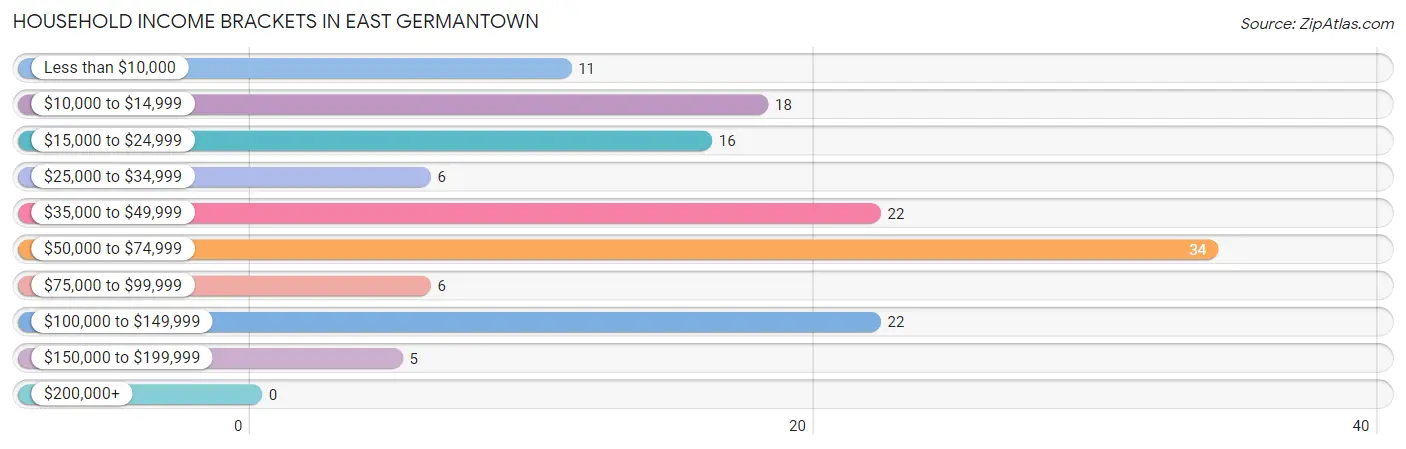
| Income Bracket | # Households | % Households |
| Less than $10,000 | 11 | 7.9% |
| $10,000 to $14,999 | 18 | 12.9% |
| $15,000 to $24,999 | 16 | 11.4% |
| $25,000 to $34,999 | 6 | 4.3% |
| $35,000 to $49,999 | 22 | 15.7% |
| $50,000 to $74,999 | 34 | 24.3% |
| $75,000 to $99,999 | 6 | 4.3% |
| $100,000 to $149,999 | 22 | 15.7% |
| $150,000 to $199,999 | 5 | 3.6% |
| $200,000+ | 0 | 0.0% |
Household Income by Householder Age in East Germantown
The median household income in East Germantown is $48,929, with the highest median household income of $43,750 found in the 45 to 64 years age bracket for the primary householder. A total of 46 households (32.9%) fall into this category. Meanwhile, the 15 to 24 years age bracket for the primary householder has the lowest median household income of $0, with 15 households (10.7%) in this group.
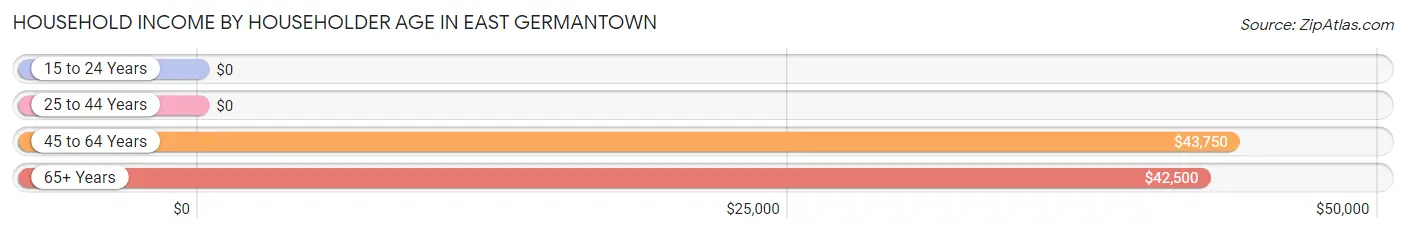
| Income Bracket | # Households | Median Income |
| 15 to 24 Years | 15 (10.7%) | $0 |
| 25 to 44 Years | 25 (17.9%) | $0 |
| 45 to 64 Years | 46 (32.9%) | $43,750 |
| 65+ Years | 54 (38.6%) | $42,500 |
| Total | 140 (100.0%) | $48,929 |
Poverty in East Germantown
Income Below Poverty by Sex and Age in East Germantown
With 5.8% poverty level for males and 14.3% for females among the residents of East Germantown, 55 to 64 year old males and 25 to 34 year old females are the most vulnerable to poverty, with 5 males (17.9%) and 5 females (62.5%) in their respective age groups living below the poverty level.
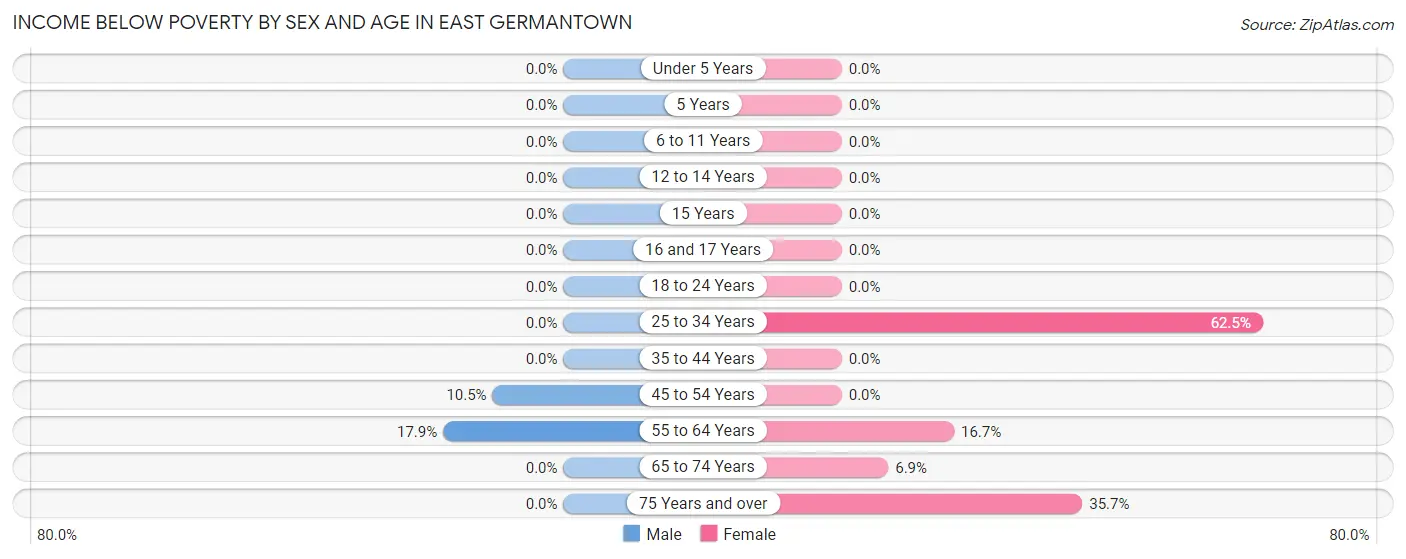
| Age Bracket | Male | Female |
| Under 5 Years | 0 (0.0%) | 0 (0.0%) |
| 5 Years | 0 (0.0%) | 0 (0.0%) |
| 6 to 11 Years | 0 (0.0%) | 0 (0.0%) |
| 12 to 14 Years | 0 (0.0%) | 0 (0.0%) |
| 15 Years | 0 (0.0%) | 0 (0.0%) |
| 16 and 17 Years | 0 (0.0%) | 0 (0.0%) |
| 18 to 24 Years | 0 (0.0%) | 0 (0.0%) |
| 25 to 34 Years | 0 (0.0%) | 5 (62.5%) |
| 35 to 44 Years | 0 (0.0%) | 0 (0.0%) |
| 45 to 54 Years | 2 (10.5%) | 0 (0.0%) |
| 55 to 64 Years | 5 (17.9%) | 4 (16.7%) |
| 65 to 74 Years | 0 (0.0%) | 2 (6.9%) |
| 75 Years and over | 0 (0.0%) | 5 (35.7%) |
| Total | 7 (5.8%) | 16 (14.3%) |
Income Above Poverty by Sex and Age in East Germantown
According to the poverty statistics in East Germantown, males aged under 5 years and females aged 16 and 17 years are the age groups that are most secure financially, with 100.0% of males and 100.0% of females in these age groups living above the poverty line.
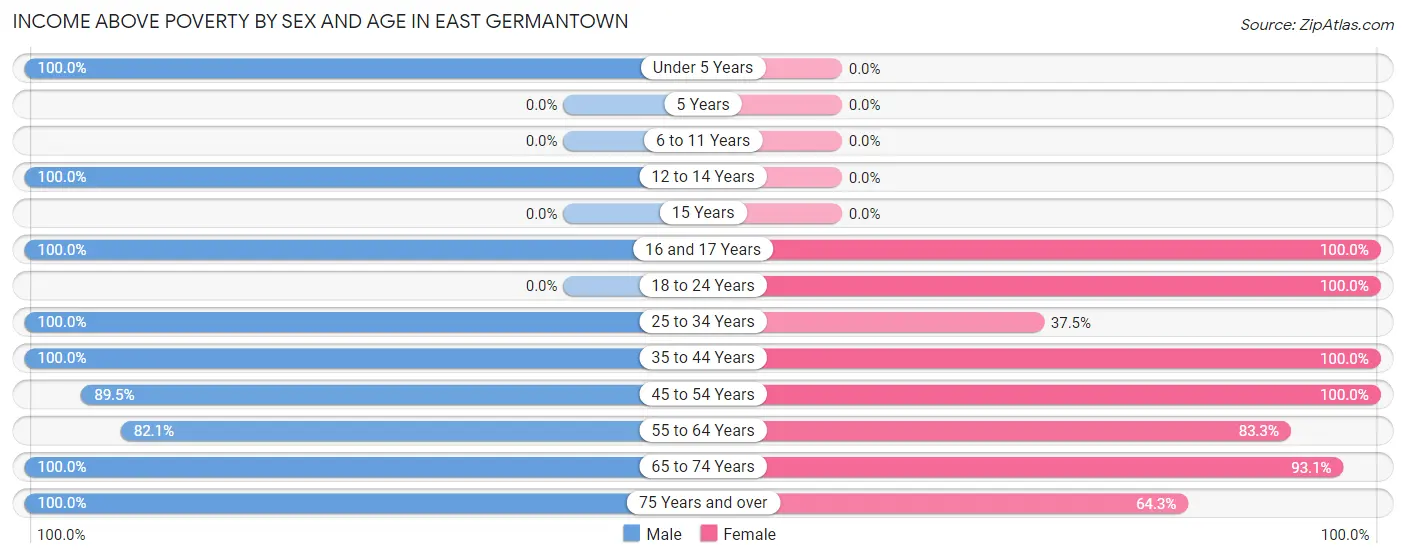
| Age Bracket | Male | Female |
| Under 5 Years | 4 (100.0%) | 0 (0.0%) |
| 5 Years | 0 (0.0%) | 0 (0.0%) |
| 6 to 11 Years | 0 (0.0%) | 0 (0.0%) |
| 12 to 14 Years | 5 (100.0%) | 0 (0.0%) |
| 15 Years | 0 (0.0%) | 0 (0.0%) |
| 16 and 17 Years | 6 (100.0%) | 5 (100.0%) |
| 18 to 24 Years | 0 (0.0%) | 15 (100.0%) |
| 25 to 34 Years | 16 (100.0%) | 3 (37.5%) |
| 35 to 44 Years | 18 (100.0%) | 10 (100.0%) |
| 45 to 54 Years | 17 (89.5%) | 7 (100.0%) |
| 55 to 64 Years | 23 (82.1%) | 20 (83.3%) |
| 65 to 74 Years | 16 (100.0%) | 27 (93.1%) |
| 75 Years and over | 8 (100.0%) | 9 (64.3%) |
| Total | 113 (94.2%) | 96 (85.7%) |
Income Below Poverty Among Married-Couple Families in East Germantown
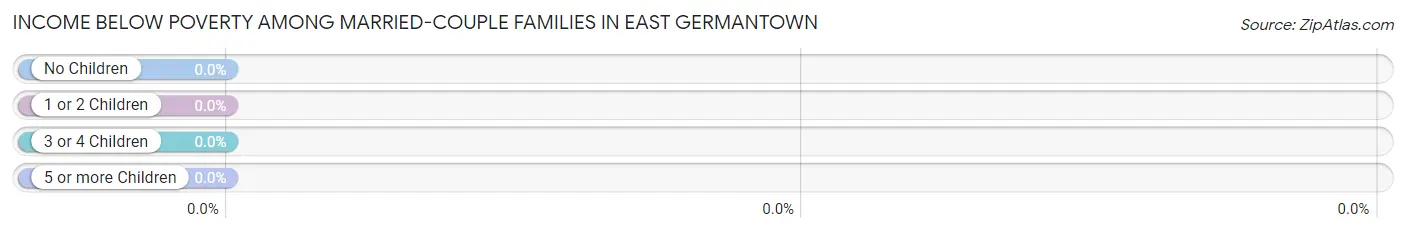
| Children | Above Poverty | Below Poverty |
| No Children | 47 (100.0%) | 0 (0.0%) |
| 1 or 2 Children | 5 (100.0%) | 0 (0.0%) |
| 3 or 4 Children | 0 (0.0%) | 0 (0.0%) |
| 5 or more Children | 0 (0.0%) | 0 (0.0%) |
| Total | 52 (100.0%) | 0 (0.0%) |
Income Below Poverty Among Single-Parent Households in East Germantown
| Children | Single Father | Single Mother |
| No Children | 0 (0.0%) | 0 (0.0%) |
| 1 or 2 Children | 0 (0.0%) | 0 (0.0%) |
| 3 or 4 Children | 0 (0.0%) | 0 (0.0%) |
| 5 or more Children | 0 (0.0%) | 0 (0.0%) |
| Total | 0 (0.0%) | 0 (0.0%) |
Income Below Poverty Among Married-Couple vs Single-Parent Households in East Germantown
| Children | Married-Couple Families | Single-Parent Households |
| No Children | 0 (0.0%) | 0 (0.0%) |
| 1 or 2 Children | 0 (0.0%) | 0 (0.0%) |
| 3 or 4 Children | 0 (0.0%) | 0 (0.0%) |
| 5 or more Children | 0 (0.0%) | 0 (0.0%) |
| Total | 0 (0.0%) | 0 (0.0%) |
Race in East Germantown
The most populous races in East Germantown are White / Caucasian (231 | 99.6%), and Two or more Races (1 | 0.4%).
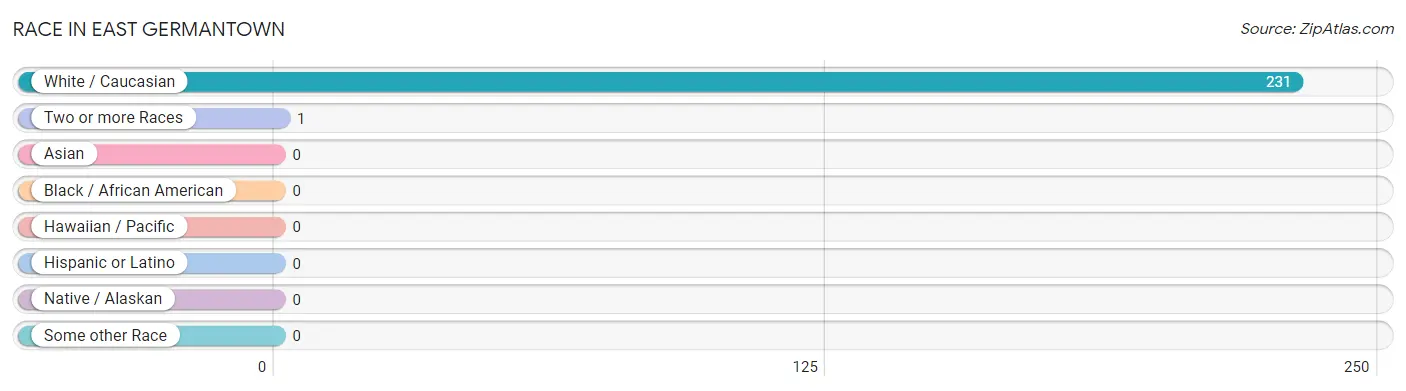
| Race | # Population | % Population |
| Asian | 0 | 0.0% |
| Black / African American | 0 | 0.0% |
| Hawaiian / Pacific | 0 | 0.0% |
| Hispanic or Latino | 0 | 0.0% |
| Native / Alaskan | 0 | 0.0% |
| White / Caucasian | 231 | 99.6% |
| Two or more Races | 1 | 0.4% |
| Some other Race | 0 | 0.0% |
| Total | 232 | 100.0% |
Ancestry in East Germantown
The most populous ancestries reported in East Germantown are English (48 | 20.7%), German (29 | 12.5%), Irish (28 | 12.1%), American (24 | 10.3%), and Scottish (13 | 5.6%), together accounting for 61.2% of all East Germantown residents.
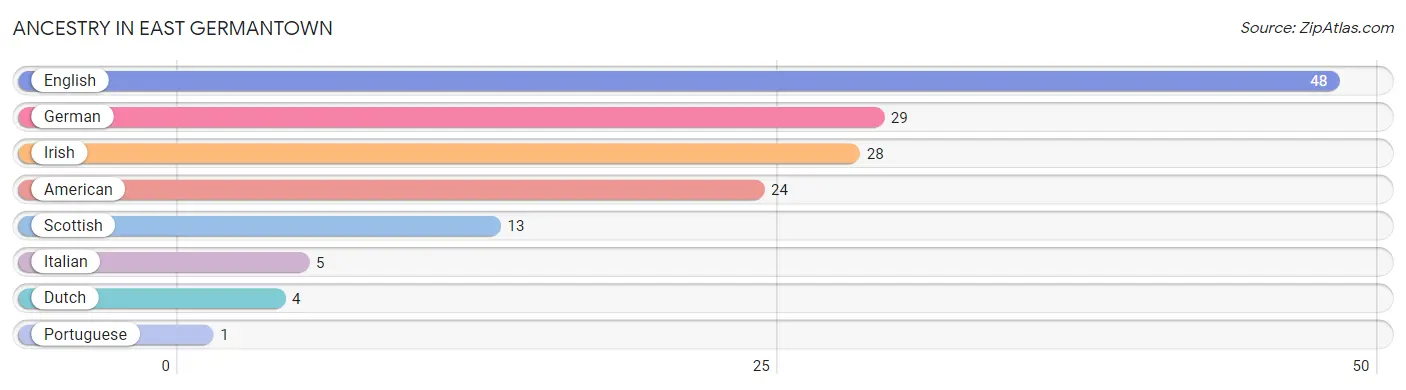
| Ancestry | # Population | % Population |
| American | 24 | 10.3% |
| Dutch | 4 | 1.7% |
| English | 48 | 20.7% |
| German | 29 | 12.5% |
| Irish | 28 | 12.1% |
| Italian | 5 | 2.2% |
| Portuguese | 1 | 0.4% |
| Scottish | 13 | 5.6% | View All 8 Rows |
Immigrants in East Germantown

| Immigration Origin | # Population | % Population | View All 0 Rows |
Sex and Age in East Germantown
Sex and Age in East Germantown
The most populous age groups in East Germantown are 40 to 44 Years (17 | 14.2%) for men and 70 to 74 Years (24 | 21.4%) for women.
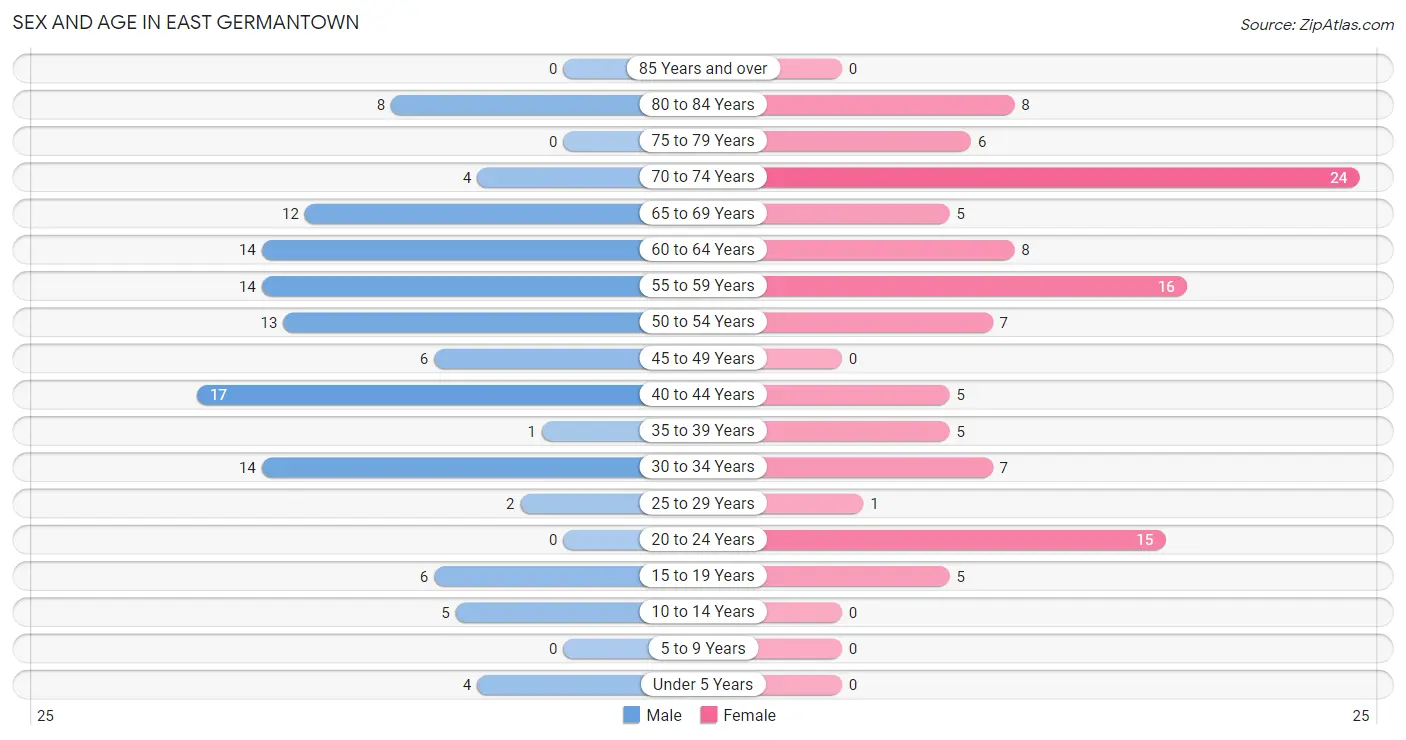
| Age Bracket | Male | Female |
| Under 5 Years | 4 (3.3%) | 0 (0.0%) |
| 5 to 9 Years | 0 (0.0%) | 0 (0.0%) |
| 10 to 14 Years | 5 (4.2%) | 0 (0.0%) |
| 15 to 19 Years | 6 (5.0%) | 5 (4.5%) |
| 20 to 24 Years | 0 (0.0%) | 15 (13.4%) |
| 25 to 29 Years | 2 (1.7%) | 1 (0.9%) |
| 30 to 34 Years | 14 (11.7%) | 7 (6.2%) |
| 35 to 39 Years | 1 (0.8%) | 5 (4.5%) |
| 40 to 44 Years | 17 (14.2%) | 5 (4.5%) |
| 45 to 49 Years | 6 (5.0%) | 0 (0.0%) |
| 50 to 54 Years | 13 (10.8%) | 7 (6.2%) |
| 55 to 59 Years | 14 (11.7%) | 16 (14.3%) |
| 60 to 64 Years | 14 (11.7%) | 8 (7.1%) |
| 65 to 69 Years | 12 (10.0%) | 5 (4.5%) |
| 70 to 74 Years | 4 (3.3%) | 24 (21.4%) |
| 75 to 79 Years | 0 (0.0%) | 6 (5.4%) |
| 80 to 84 Years | 8 (6.7%) | 8 (7.1%) |
| 85 Years and over | 0 (0.0%) | 0 (0.0%) |
| Total | 120 (100.0%) | 112 (100.0%) |
Families and Households in East Germantown
Median Family Size in East Germantown
The median family size in East Germantown is 2.17 persons per family, with single male/father families (11 | 17.2%) accounting for the largest median family size of 2.36 persons per family. On the other hand, single female/mother families (1 | 1.6%) represent the smallest median family size with 2.00 persons per family.
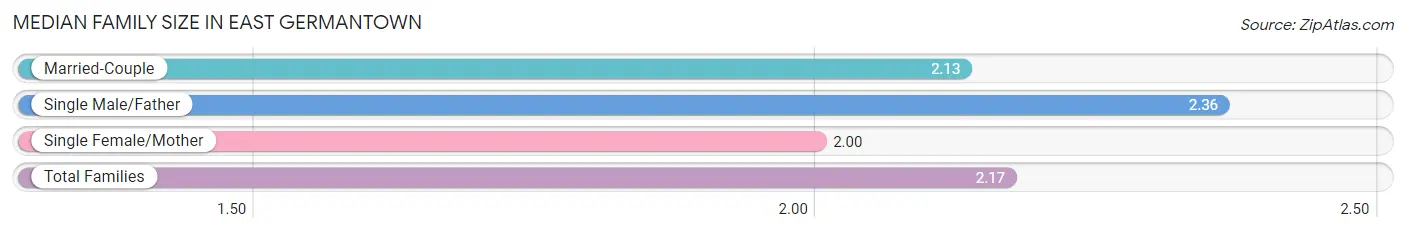
| Family Type | # Families | Family Size |
| Married-Couple | 52 (81.2%) | 2.13 |
| Single Male/Father | 11 (17.2%) | 2.36 |
| Single Female/Mother | 1 (1.6%) | 2.00 |
| Total Families | 64 (100.0%) | 2.17 |
Median Household Size in East Germantown
The median household size in East Germantown is 1.66 persons per household, with single male/father households (11 | 7.9%) accounting for the largest median household size of 2.82 persons per household. non-family households (76 | 54.3%) represent the smallest median household size with 1.16 persons per household.
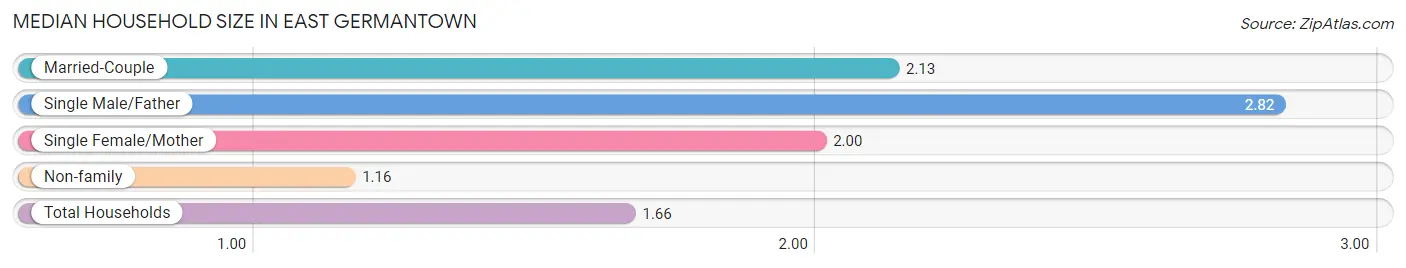
| Household Type | # Households | Household Size |
| Married-Couple | 52 (37.1%) | 2.13 |
| Single Male/Father | 11 (7.9%) | 2.82 |
| Single Female/Mother | 1 (0.7%) | 2.00 |
| Non-family | 76 (54.3%) | 1.16 |
| Total Households | 140 (100.0%) | 1.66 |
Household Size by Marriage Status in East Germantown
Out of a total of 140 households in East Germantown, 64 (45.7%) are family households, while 76 (54.3%) are nonfamily households. The most numerous type of family households are 2-person households, comprising 48, and the most common type of nonfamily households are 1-person households, comprising 54.
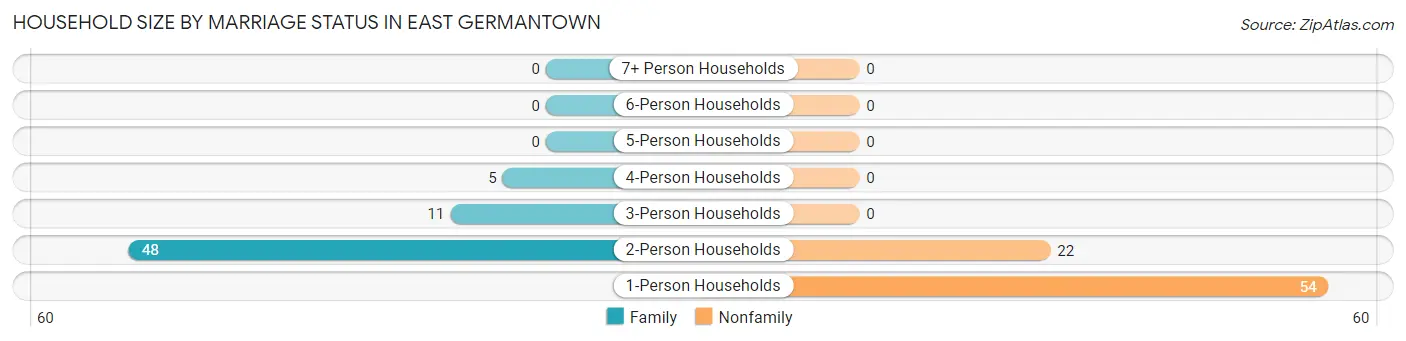
| Household Size | Family Households | Nonfamily Households |
| 1-Person Households | - | 54 (38.6%) |
| 2-Person Households | 48 (34.3%) | 22 (15.7%) |
| 3-Person Households | 11 (7.9%) | 0 (0.0%) |
| 4-Person Households | 5 (3.6%) | 0 (0.0%) |
| 5-Person Households | 0 (0.0%) | 0 (0.0%) |
| 6-Person Households | 0 (0.0%) | 0 (0.0%) |
| 7+ Person Households | 0 (0.0%) | 0 (0.0%) |
| Total | 64 (45.7%) | 76 (54.3%) |
Female Fertility in East Germantown
Fertility by Age in East Germantown
| Age Bracket | Women with Births | Births / 1,000 Women |
| 15 to 19 years | 0 (0.0%) | 0.0 |
| 20 to 34 years | 0 (0.0%) | 0.0 |
| 35 to 50 years | 0 (0.0%) | 0.0 |
| Total | 0 (0.0%) | 0.0 |
Fertility by Age by Marriage Status in East Germantown
| Age Bracket | Married | Unmarried |
| 15 to 19 years | 0 (0.0%) | 0 (0.0%) |
| 20 to 34 years | 0 (0.0%) | 0 (0.0%) |
| 35 to 50 years | 0 (0.0%) | 0 (0.0%) |
| Total | 0 (0.0%) | 0 (0.0%) |
Fertility by Education in East Germantown
| Educational Attainment | Women with Births | Births / 1,000 Women |
| Less than High School | 0 (0.0%) | 0.0 |
| High School Diploma | 0 (0.0%) | 0.0 |
| College or Associate's Degree | 0 (0.0%) | 0.0 |
| Bachelor's Degree | 0 (0.0%) | 0.0 |
| Graduate Degree | 0 (0.0%) | 0.0 |
| Total | 0 (0.0%) | 0.0 |
Fertility by Education by Marriage Status in East Germantown
| Educational Attainment | Married | Unmarried |
| Less than High School | 0 (0.0%) | 0 (0.0%) |
| High School Diploma | 0 (0.0%) | 0 (0.0%) |
| College or Associate's Degree | 0 (0.0%) | 0 (0.0%) |
| Bachelor's Degree | 0 (0.0%) | 0 (0.0%) |
| Graduate Degree | 0 (0.0%) | 0 (0.0%) |
| Total | 0 (0.0%) | 0 (0.0%) |
Employment Characteristics in East Germantown
Employment by Class of Employer in East Germantown
Among the 124 employed individuals in East Germantown, private company employees (99 | 79.8%), local government employees (8 | 6.5%), and self-employed (not incorporated) (6 | 4.8%) make up the most common classes of employment.
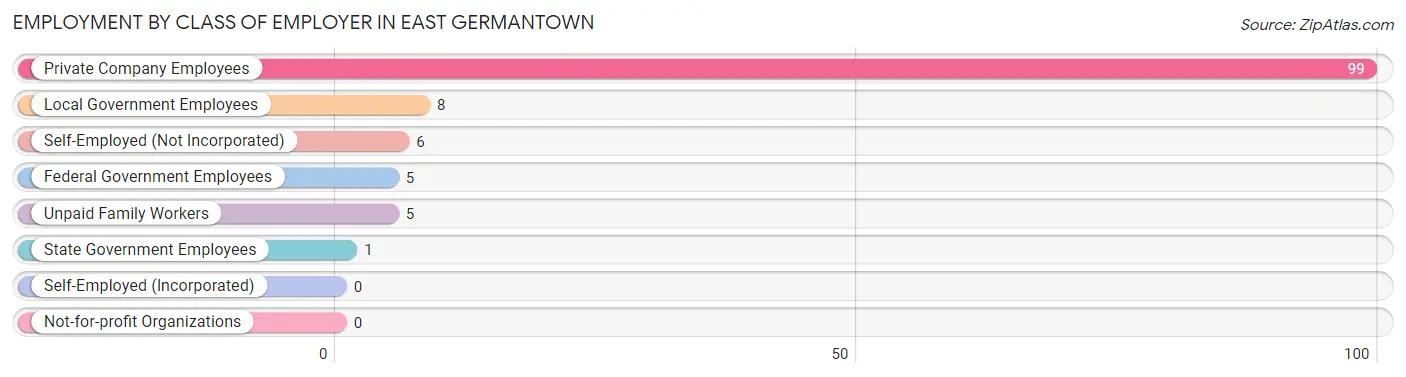
| Employer Class | # Employees | % Employees |
| Private Company Employees | 99 | 79.8% |
| Self-Employed (Incorporated) | 0 | 0.0% |
| Self-Employed (Not Incorporated) | 6 | 4.8% |
| Not-for-profit Organizations | 0 | 0.0% |
| Local Government Employees | 8 | 6.5% |
| State Government Employees | 1 | 0.8% |
| Federal Government Employees | 5 | 4.0% |
| Unpaid Family Workers | 5 | 4.0% |
| Total | 124 | 100.0% |
Employment Status by Age in East Germantown
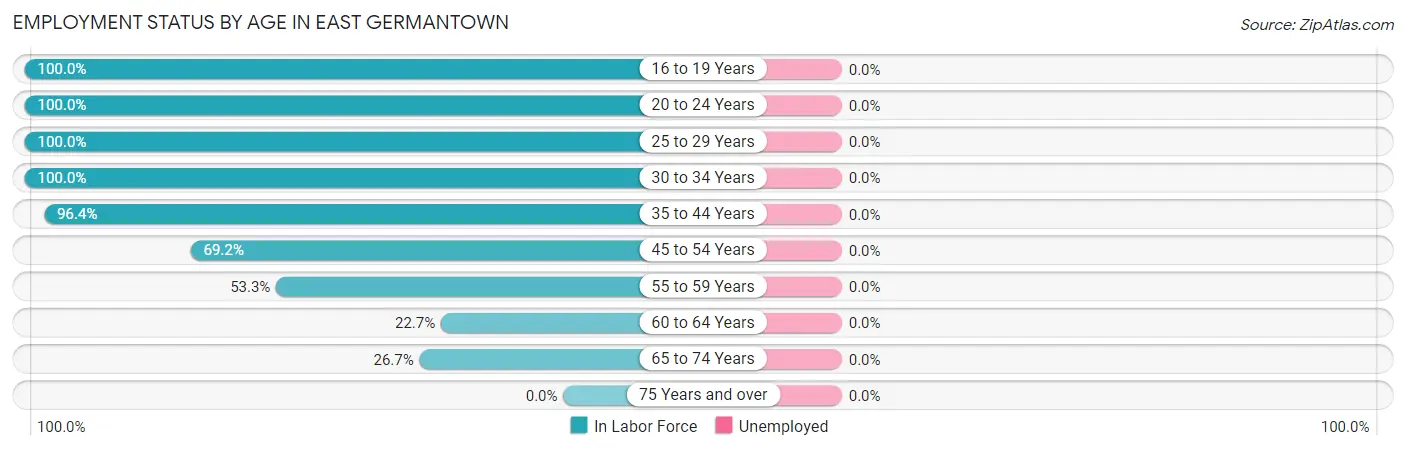
| Age Bracket | In Labor Force | Unemployed |
| 16 to 19 Years | 11 (100.0%) | 0 (0.0%) |
| 20 to 24 Years | 15 (100.0%) | 0 (0.0%) |
| 25 to 29 Years | 3 (100.0%) | 0 (0.0%) |
| 30 to 34 Years | 21 (100.0%) | 0 (0.0%) |
| 35 to 44 Years | 27 (96.4%) | 0 (0.0%) |
| 45 to 54 Years | 18 (69.2%) | 0 (0.0%) |
| 55 to 59 Years | 16 (53.3%) | 0 (0.0%) |
| 60 to 64 Years | 5 (22.7%) | 0 (0.0%) |
| 65 to 74 Years | 12 (26.7%) | 0 (0.0%) |
| 75 Years and over | 0 (0.0%) | 0 (0.0%) |
| Total | 128 (57.4%) | 0 (0.0%) |
Employment Status by Educational Attainment in East Germantown
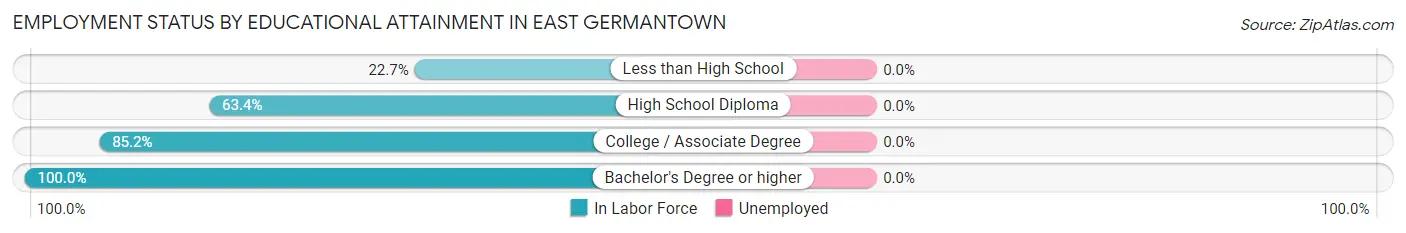
| Educational Attainment | In Labor Force | Unemployed |
| Less than High School | 5 (22.7%) | 0 (0.0%) |
| High School Diploma | 26 (63.4%) | 0 (0.0%) |
| College / Associate Degree | 46 (85.2%) | 0 (0.0%) |
| Bachelor's Degree or higher | 13 (100.0%) | 0 (0.0%) |
| Total | 90 (69.2%) | 0 (0.0%) |
Employment Occupations by Sex in East Germantown
Management, Business, Science and Arts Occupations
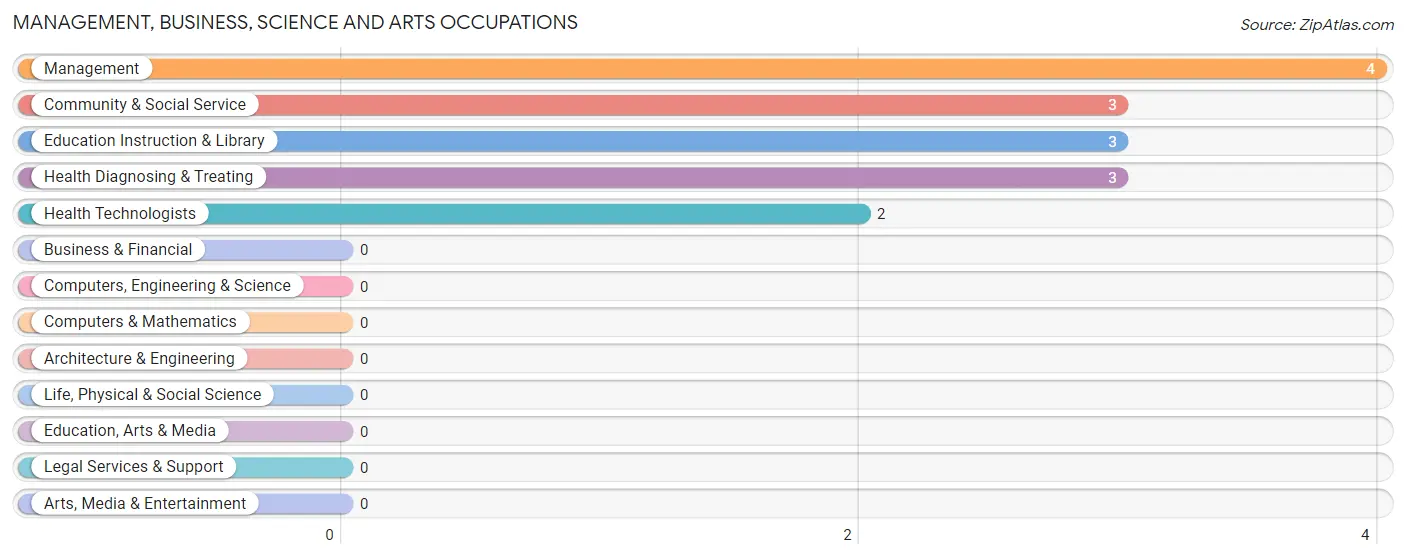
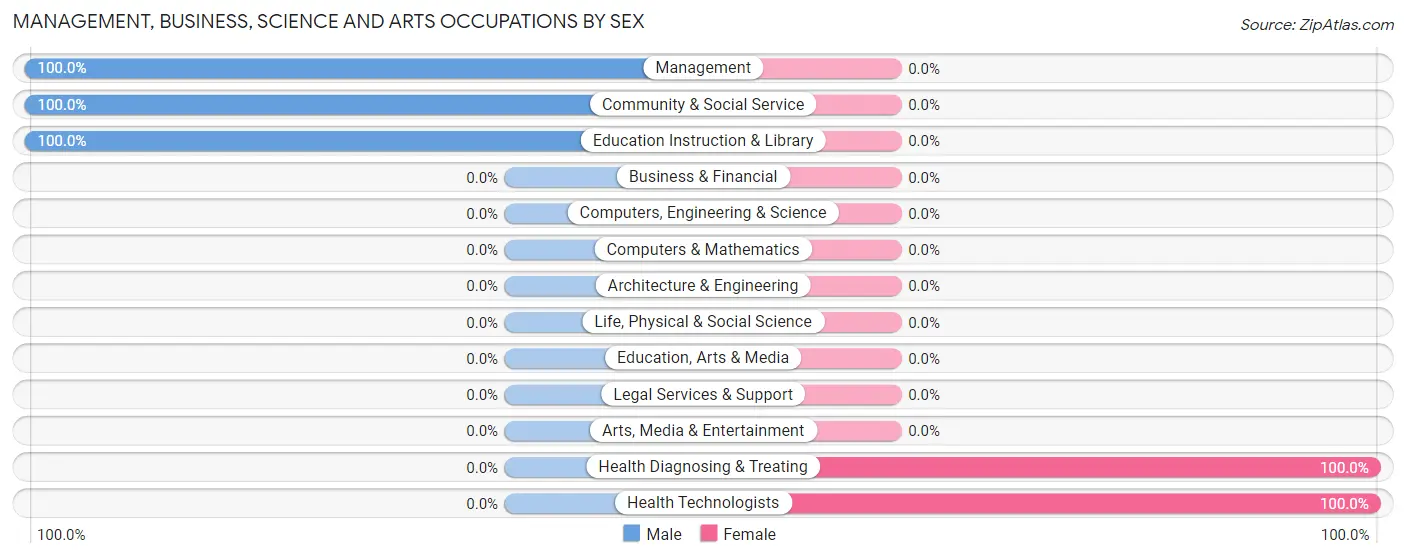
The most common Management, Business, Science and Arts occupations in East Germantown are Management (4 | 3.1%), Community & Social Service (3 | 2.3%), Education Instruction & Library (3 | 2.3%), Health Diagnosing & Treating (3 | 2.3%), and Health Technologists (2 | 1.6%).
Management, Business, Science and Arts Occupations by Sex
Within the Management, Business, Science and Arts occupations in East Germantown, the most male-oriented occupations are Management (100.0%), Community & Social Service (100.0%), and Education Instruction & Library (100.0%), while the most female-oriented occupations are Health Diagnosing & Treating (100.0%), and Health Technologists (100.0%).
| Occupation | Male | Female |
| Management | 4 (100.0%) | 0 (0.0%) |
| Business & Financial | 0 (0.0%) | 0 (0.0%) |
| Computers, Engineering & Science | 0 (0.0%) | 0 (0.0%) |
| Computers & Mathematics | 0 (0.0%) | 0 (0.0%) |
| Architecture & Engineering | 0 (0.0%) | 0 (0.0%) |
| Life, Physical & Social Science | 0 (0.0%) | 0 (0.0%) |
| Community & Social Service | 3 (100.0%) | 0 (0.0%) |
| Education, Arts & Media | 0 (0.0%) | 0 (0.0%) |
| Legal Services & Support | 0 (0.0%) | 0 (0.0%) |
| Education Instruction & Library | 3 (100.0%) | 0 (0.0%) |
| Arts, Media & Entertainment | 0 (0.0%) | 0 (0.0%) |
| Health Diagnosing & Treating | 0 (0.0%) | 3 (100.0%) |
| Health Technologists | 0 (0.0%) | 2 (100.0%) |
| Total (Category) | 7 (70.0%) | 3 (30.0%) |
| Total (Overall) | 66 (51.6%) | 62 (48.4%) |
Services Occupations
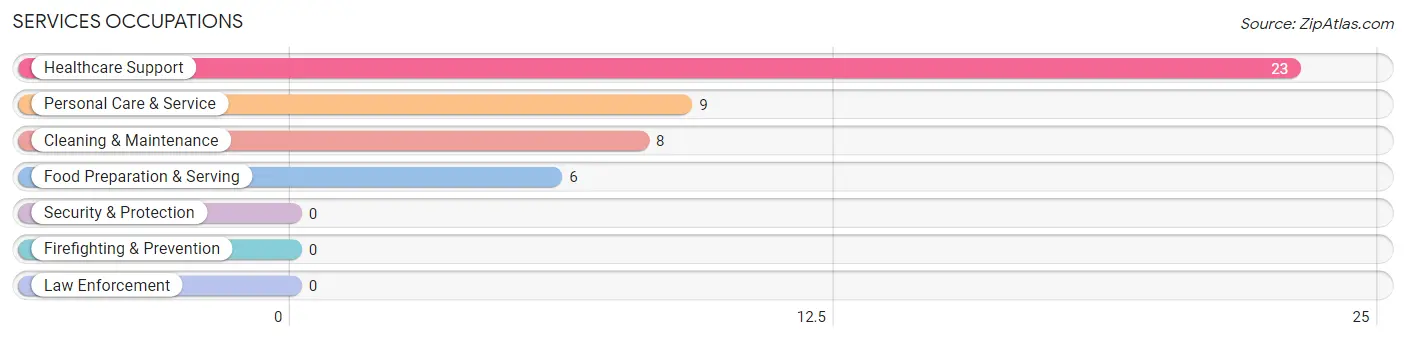
The most common Services occupations in East Germantown are Healthcare Support (23 | 18.0%), Personal Care & Service (9 | 7.0%), Cleaning & Maintenance (8 | 6.2%), and Food Preparation & Serving (6 | 4.7%).
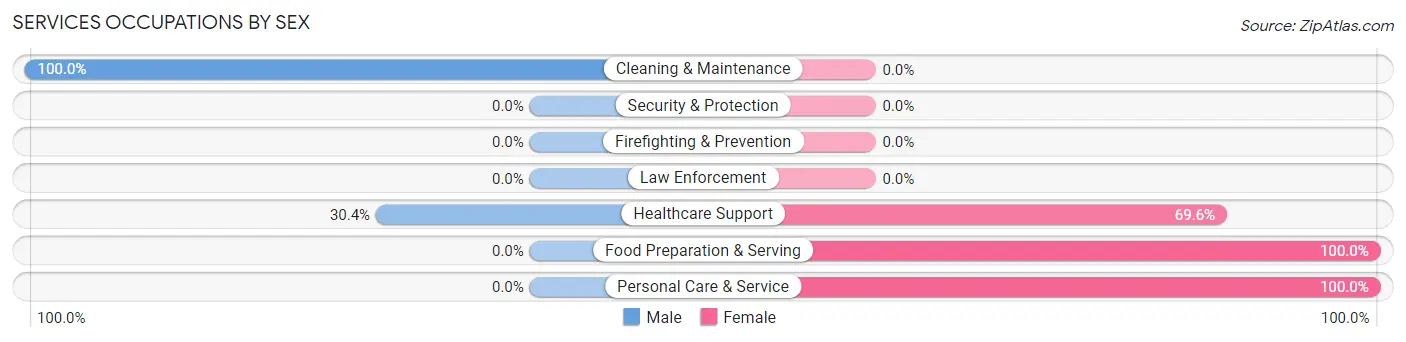
Services Occupations by Sex
Within the Services occupations in East Germantown, the most male-oriented occupations are Cleaning & Maintenance (100.0%), and Healthcare Support (30.4%), while the most female-oriented occupations are Food Preparation & Serving (100.0%), Personal Care & Service (100.0%), and Healthcare Support (69.6%).
| Occupation | Male | Female |
| Healthcare Support | 7 (30.4%) | 16 (69.6%) |
| Security & Protection | 0 (0.0%) | 0 (0.0%) |
| Firefighting & Prevention | 0 (0.0%) | 0 (0.0%) |
| Law Enforcement | 0 (0.0%) | 0 (0.0%) |
| Food Preparation & Serving | 0 (0.0%) | 6 (100.0%) |
| Cleaning & Maintenance | 8 (100.0%) | 0 (0.0%) |
| Personal Care & Service | 0 (0.0%) | 9 (100.0%) |
| Total (Category) | 15 (32.6%) | 31 (67.4%) |
| Total (Overall) | 66 (51.6%) | 62 (48.4%) |
Sales and Office Occupations
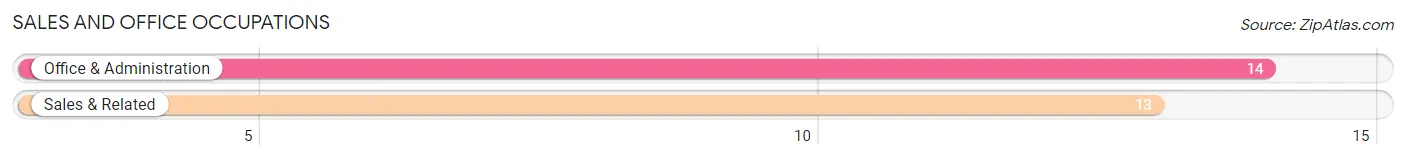
The most common Sales and Office occupations in East Germantown are Office & Administration (14 | 10.9%), and Sales & Related (13 | 10.2%).
Sales and Office Occupations by Sex
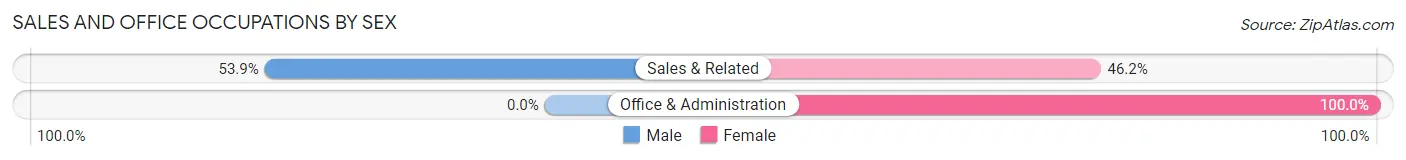
| Occupation | Male | Female |
| Sales & Related | 7 (53.8%) | 6 (46.2%) |
| Office & Administration | 0 (0.0%) | 14 (100.0%) |
| Total (Category) | 7 (25.9%) | 20 (74.1%) |
| Total (Overall) | 66 (51.6%) | 62 (48.4%) |
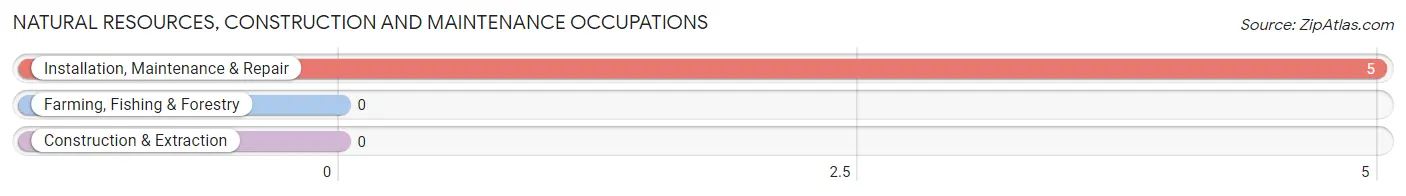
Natural Resources, Construction and Maintenance Occupations
The most common Natural Resources, Construction and Maintenance occupations in East Germantown are , and Installation, Maintenance & Repair (5 | 3.9%).
Natural Resources, Construction and Maintenance Occupations by Sex
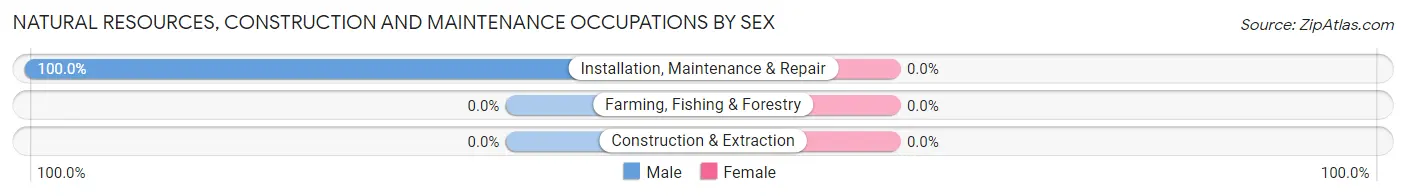
| Occupation | Male | Female |
| Farming, Fishing & Forestry | 0 (0.0%) | 0 (0.0%) |
| Construction & Extraction | 0 (0.0%) | 0 (0.0%) |
| Installation, Maintenance & Repair | 5 (100.0%) | 0 (0.0%) |
| Total (Category) | 5 (100.0%) | 0 (0.0%) |
| Total (Overall) | 66 (51.6%) | 62 (48.4%) |
Production, Transportation and Moving Occupations
The most common Production, Transportation and Moving occupations in East Germantown are Production (21 | 16.4%), Material Moving (14 | 10.9%), and Transportation (5 | 3.9%).
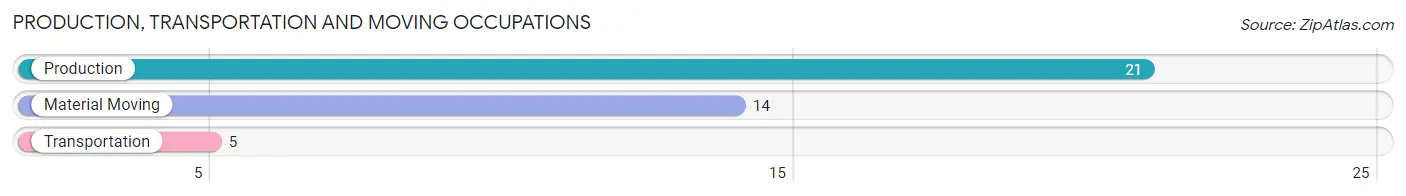
Production, Transportation and Moving Occupations by Sex
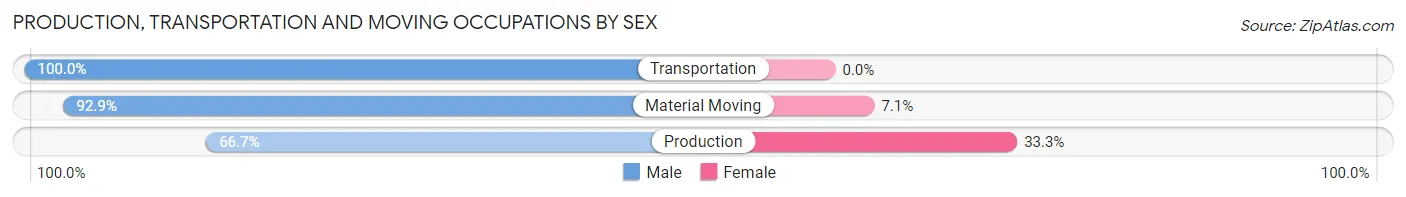
| Occupation | Male | Female |
| Production | 14 (66.7%) | 7 (33.3%) |
| Transportation | 5 (100.0%) | 0 (0.0%) |
| Material Moving | 13 (92.9%) | 1 (7.1%) |
| Total (Category) | 32 (80.0%) | 8 (20.0%) |
| Total (Overall) | 66 (51.6%) | 62 (48.4%) |
Employment Industries by Sex in East Germantown
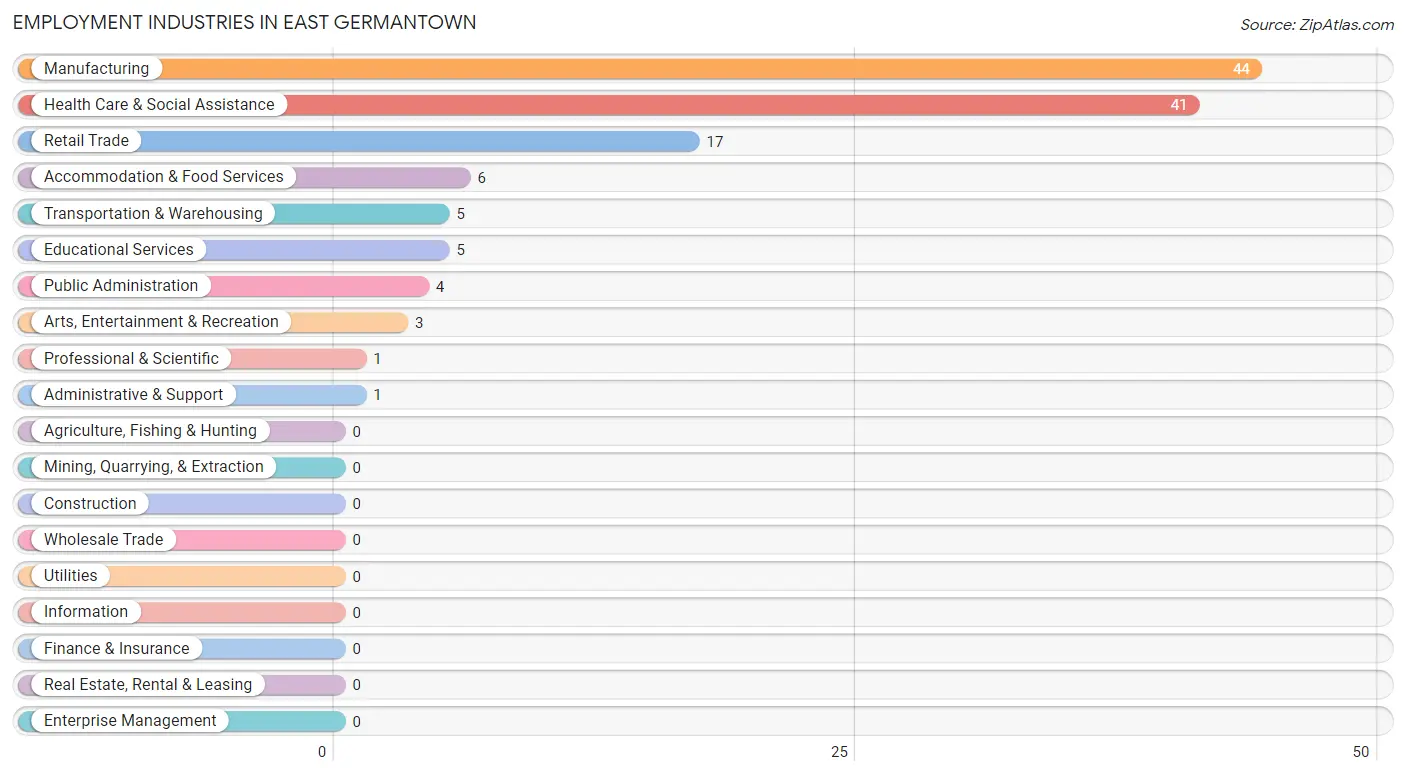
Employment Industries in East Germantown
The major employment industries in East Germantown include Manufacturing (44 | 34.4%), Health Care & Social Assistance (41 | 32.0%), Retail Trade (17 | 13.3%), Accommodation & Food Services (6 | 4.7%), and Transportation & Warehousing (5 | 3.9%).
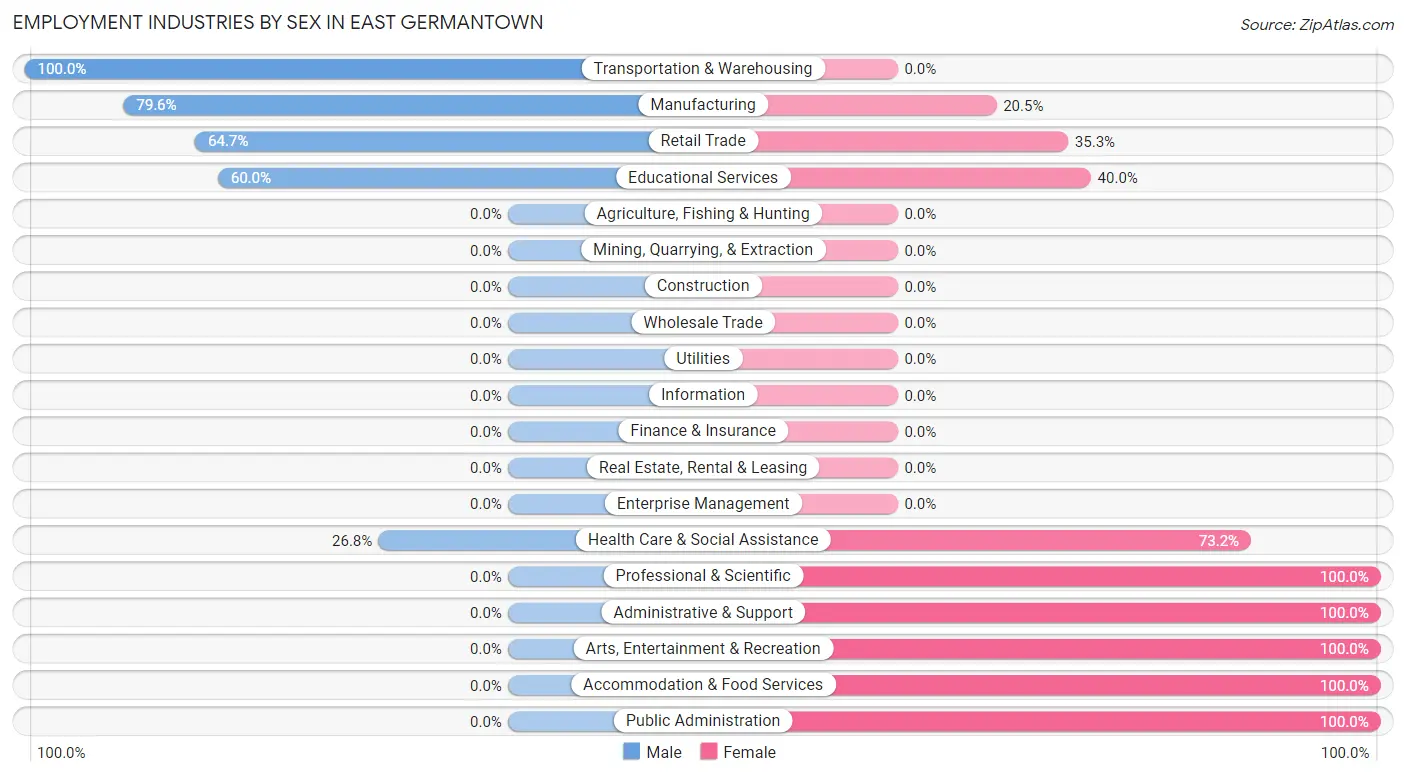
Employment Industries by Sex in East Germantown
The East Germantown industries that see more men than women are Transportation & Warehousing (100.0%), Manufacturing (79.5%), and Retail Trade (64.7%), whereas the industries that tend to have a higher number of women are Professional & Scientific (100.0%), Administrative & Support (100.0%), and Arts, Entertainment & Recreation (100.0%).
| Industry | Male | Female |
| Agriculture, Fishing & Hunting | 0 (0.0%) | 0 (0.0%) |
| Mining, Quarrying, & Extraction | 0 (0.0%) | 0 (0.0%) |
| Construction | 0 (0.0%) | 0 (0.0%) |
| Manufacturing | 35 (79.5%) | 9 (20.4%) |
| Wholesale Trade | 0 (0.0%) | 0 (0.0%) |
| Retail Trade | 11 (64.7%) | 6 (35.3%) |
| Transportation & Warehousing | 5 (100.0%) | 0 (0.0%) |
| Utilities | 0 (0.0%) | 0 (0.0%) |
| Information | 0 (0.0%) | 0 (0.0%) |
| Finance & Insurance | 0 (0.0%) | 0 (0.0%) |
| Real Estate, Rental & Leasing | 0 (0.0%) | 0 (0.0%) |
| Professional & Scientific | 0 (0.0%) | 1 (100.0%) |
| Enterprise Management | 0 (0.0%) | 0 (0.0%) |
| Administrative & Support | 0 (0.0%) | 1 (100.0%) |
| Educational Services | 3 (60.0%) | 2 (40.0%) |
| Health Care & Social Assistance | 11 (26.8%) | 30 (73.2%) |
| Arts, Entertainment & Recreation | 0 (0.0%) | 3 (100.0%) |
| Accommodation & Food Services | 0 (0.0%) | 6 (100.0%) |
| Public Administration | 0 (0.0%) | 4 (100.0%) |
| Total | 66 (51.6%) | 62 (48.4%) |
Education in East Germantown
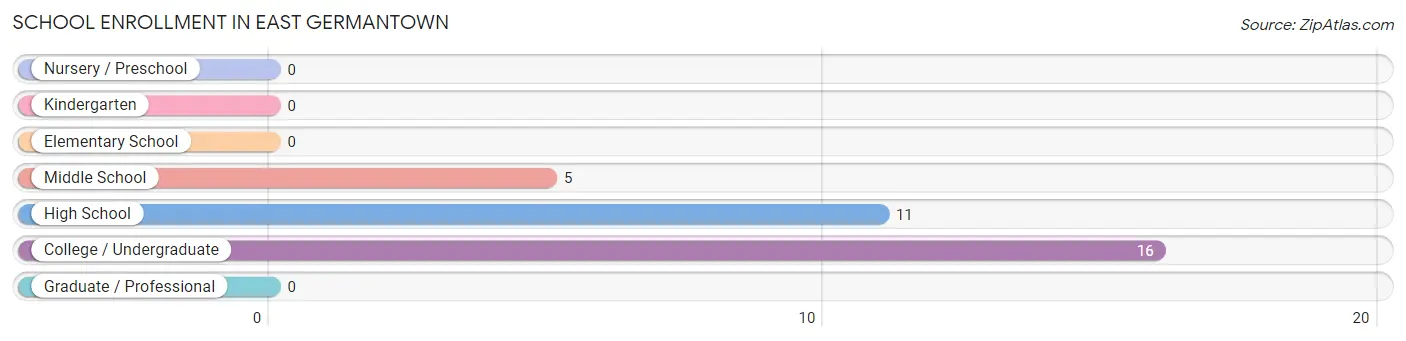
School Enrollment in East Germantown
The most common levels of schooling among the 32 students in East Germantown are college / undergraduate (16 | 50.0%), high school (11 | 34.4%), and middle school (5 | 15.6%).
| School Level | # Students | % Students |
| Nursery / Preschool | 0 | 0.0% |
| Kindergarten | 0 | 0.0% |
| Elementary School | 0 | 0.0% |
| Middle School | 5 | 15.6% |
| High School | 11 | 34.4% |
| College / Undergraduate | 16 | 50.0% |
| Graduate / Professional | 0 | 0.0% |
| Total | 32 | 100.0% |
School Enrollment by Age by Funding Source in East Germantown
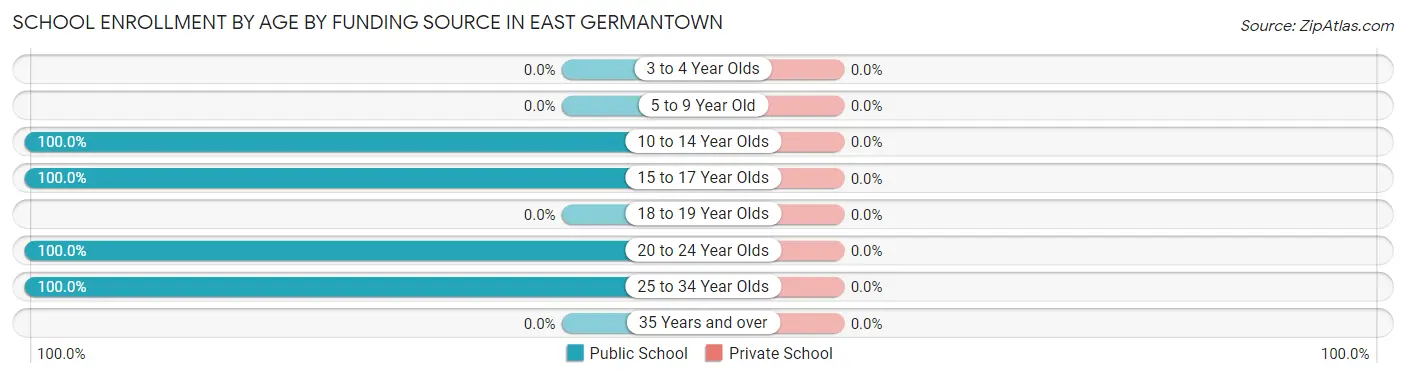
| Age Bracket | Public School | Private School |
| 3 to 4 Year Olds | 0 (0.0%) | 0 (0.0%) |
| 5 to 9 Year Old | 0 (0.0%) | 0 (0.0%) |
| 10 to 14 Year Olds | 5 (100.0%) | 0 (0.0%) |
| 15 to 17 Year Olds | 11 (100.0%) | 0 (0.0%) |
| 18 to 19 Year Olds | 0 (0.0%) | 0 (0.0%) |
| 20 to 24 Year Olds | 15 (100.0%) | 0 (0.0%) |
| 25 to 34 Year Olds | 1 (100.0%) | 0 (0.0%) |
| 35 Years and over | 0 (0.0%) | 0 (0.0%) |
| Total | 32 (100.0%) | 0 (0.0%) |
Educational Attainment by Field of Study in East Germantown
Visual & performing arts (5 | 26.3%), communications (5 | 26.3%), education (4 | 21.0%), science & technology (2 | 10.5%), and bio, nature & agricultural (1 | 5.3%) are the most common fields of study among 19 individuals in East Germantown who have obtained a bachelor's degree or higher.
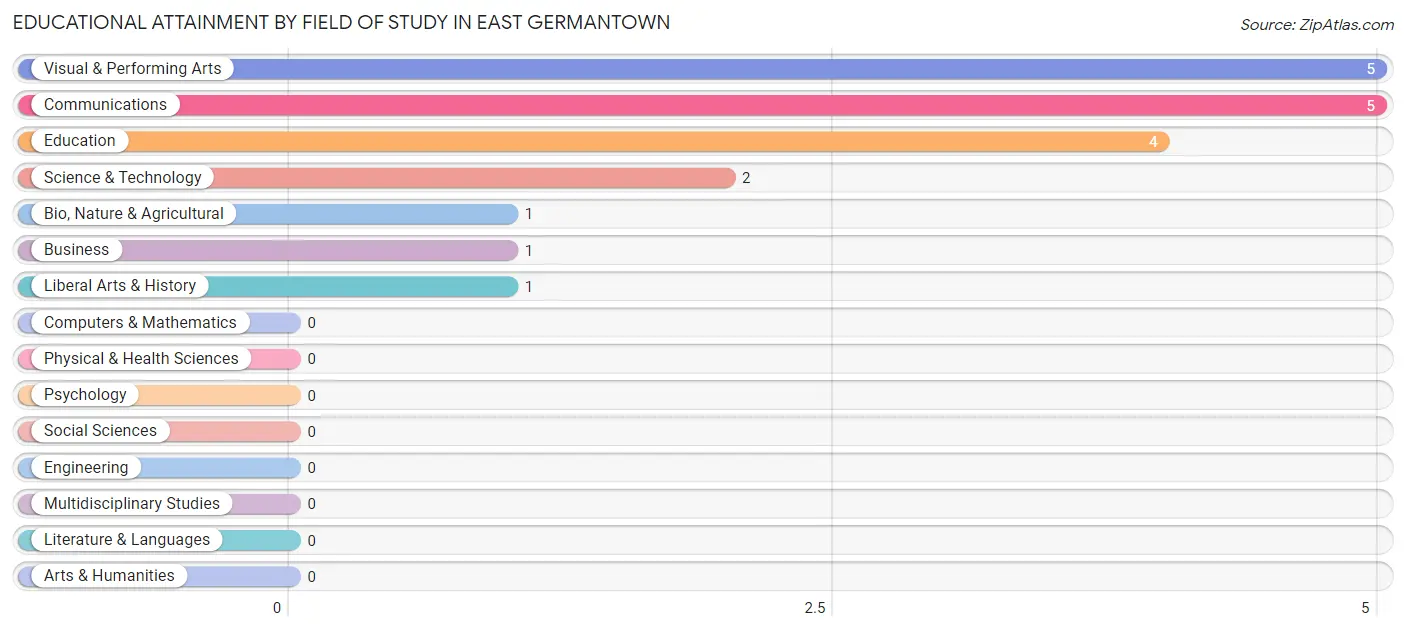
| Field of Study | # Graduates | % Graduates |
| Computers & Mathematics | 0 | 0.0% |
| Bio, Nature & Agricultural | 1 | 5.3% |
| Physical & Health Sciences | 0 | 0.0% |
| Psychology | 0 | 0.0% |
| Social Sciences | 0 | 0.0% |
| Engineering | 0 | 0.0% |
| Multidisciplinary Studies | 0 | 0.0% |
| Science & Technology | 2 | 10.5% |
| Business | 1 | 5.3% |
| Education | 4 | 21.0% |
| Literature & Languages | 0 | 0.0% |
| Liberal Arts & History | 1 | 5.3% |
| Visual & Performing Arts | 5 | 26.3% |
| Communications | 5 | 26.3% |
| Arts & Humanities | 0 | 0.0% |
| Total | 19 | 100.0% |
Transportation & Commute in East Germantown
Vehicle Availability by Sex in East Germantown
The most prevalent vehicle ownership categories in East Germantown are males with 3 vehicles (30, accounting for 45.5%) and females with 3 vehicles (30, making up 51.7%).
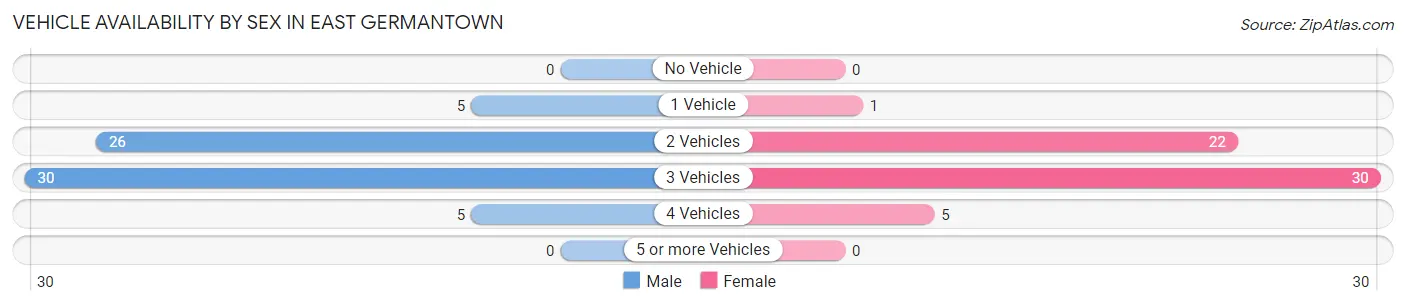
| Vehicles Available | Male | Female |
| No Vehicle | 0 (0.0%) | 0 (0.0%) |
| 1 Vehicle | 5 (7.6%) | 1 (1.7%) |
| 2 Vehicles | 26 (39.4%) | 22 (37.9%) |
| 3 Vehicles | 30 (45.5%) | 30 (51.7%) |
| 4 Vehicles | 5 (7.6%) | 5 (8.6%) |
| 5 or more Vehicles | 0 (0.0%) | 0 (0.0%) |
| Total | 66 (100.0%) | 58 (100.0%) |
Commute Time in East Germantown
The most frequently occuring commute durations in East Germantown are 35 to 39 minutes (22 commuters, 19.5%), 5 to 9 minutes (20 commuters, 17.7%), and 30 to 34 minutes (16 commuters, 14.2%).
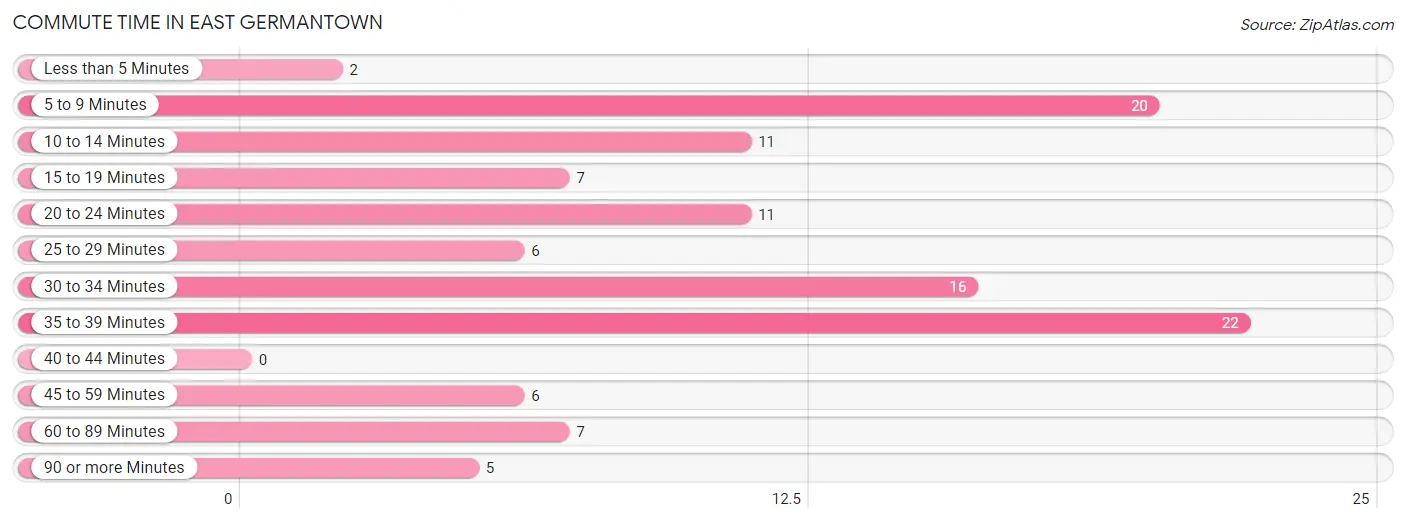
| Commute Time | # Commuters | % Commuters |
| Less than 5 Minutes | 2 | 1.8% |
| 5 to 9 Minutes | 20 | 17.7% |
| 10 to 14 Minutes | 11 | 9.7% |
| 15 to 19 Minutes | 7 | 6.2% |
| 20 to 24 Minutes | 11 | 9.7% |
| 25 to 29 Minutes | 6 | 5.3% |
| 30 to 34 Minutes | 16 | 14.2% |
| 35 to 39 Minutes | 22 | 19.5% |
| 40 to 44 Minutes | 0 | 0.0% |
| 45 to 59 Minutes | 6 | 5.3% |
| 60 to 89 Minutes | 7 | 6.2% |
| 90 or more Minutes | 5 | 4.4% |
Commute Time by Sex in East Germantown
The most common commute times in East Germantown are 5 to 9 minutes (18 commuters, 28.1%) for males and 35 to 39 minutes (15 commuters, 30.6%) for females.
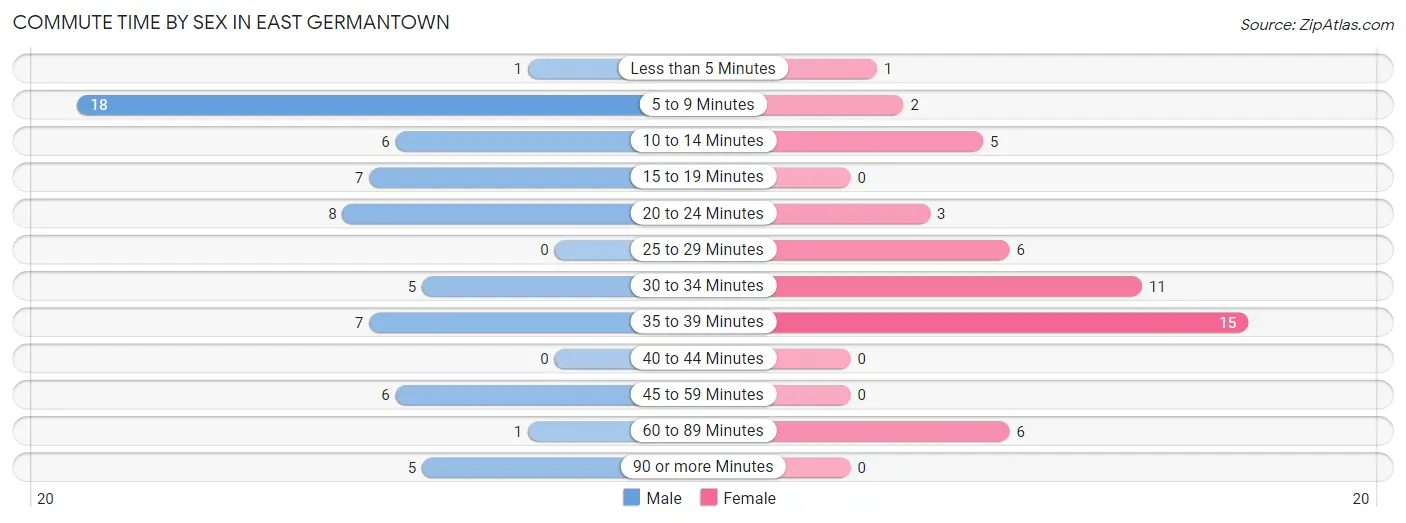
| Commute Time | Male | Female |
| Less than 5 Minutes | 1 (1.6%) | 1 (2.0%) |
| 5 to 9 Minutes | 18 (28.1%) | 2 (4.1%) |
| 10 to 14 Minutes | 6 (9.4%) | 5 (10.2%) |
| 15 to 19 Minutes | 7 (10.9%) | 0 (0.0%) |
| 20 to 24 Minutes | 8 (12.5%) | 3 (6.1%) |
| 25 to 29 Minutes | 0 (0.0%) | 6 (12.2%) |
| 30 to 34 Minutes | 5 (7.8%) | 11 (22.5%) |
| 35 to 39 Minutes | 7 (10.9%) | 15 (30.6%) |
| 40 to 44 Minutes | 0 (0.0%) | 0 (0.0%) |
| 45 to 59 Minutes | 6 (9.4%) | 0 (0.0%) |
| 60 to 89 Minutes | 1 (1.6%) | 6 (12.2%) |
| 90 or more Minutes | 5 (7.8%) | 0 (0.0%) |
Time of Departure to Work by Sex in East Germantown
The most frequent times of departure to work in East Germantown are 5:00 AM to 5:29 AM (20, 31.2%) for males and 5:30 AM to 5:59 AM (15, 30.6%) for females.
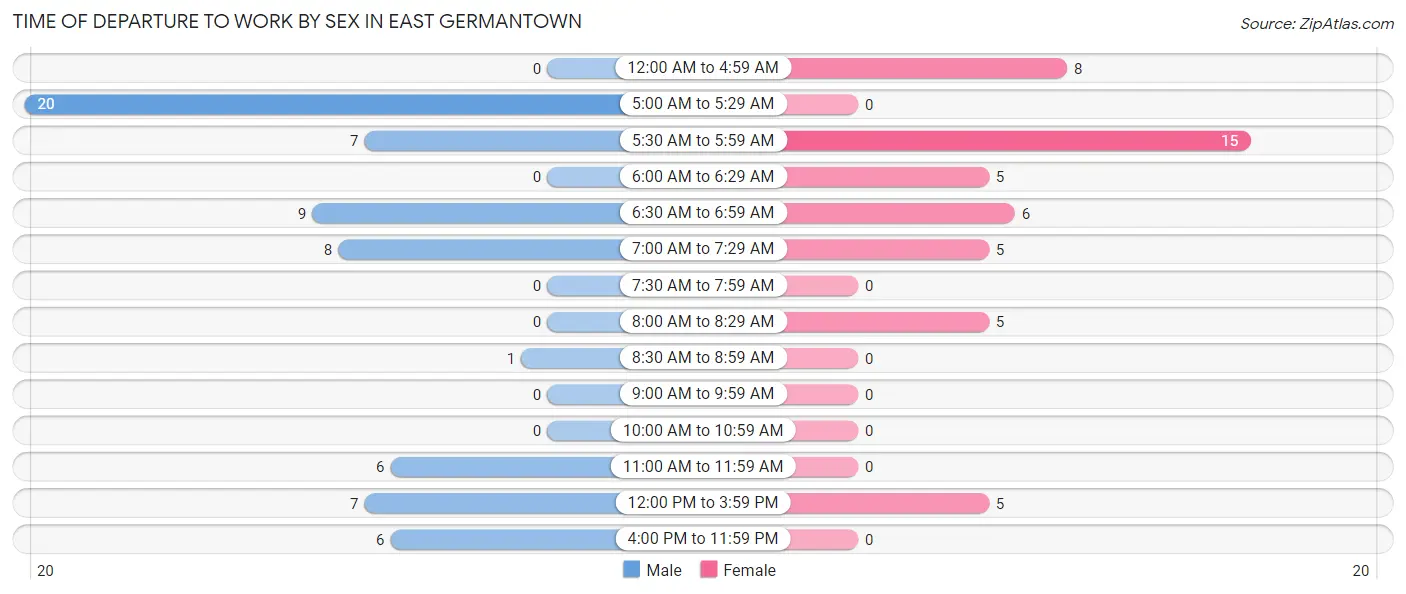
| Time of Departure | Male | Female |
| 12:00 AM to 4:59 AM | 0 (0.0%) | 8 (16.3%) |
| 5:00 AM to 5:29 AM | 20 (31.2%) | 0 (0.0%) |
| 5:30 AM to 5:59 AM | 7 (10.9%) | 15 (30.6%) |
| 6:00 AM to 6:29 AM | 0 (0.0%) | 5 (10.2%) |
| 6:30 AM to 6:59 AM | 9 (14.1%) | 6 (12.2%) |
| 7:00 AM to 7:29 AM | 8 (12.5%) | 5 (10.2%) |
| 7:30 AM to 7:59 AM | 0 (0.0%) | 0 (0.0%) |
| 8:00 AM to 8:29 AM | 0 (0.0%) | 5 (10.2%) |
| 8:30 AM to 8:59 AM | 1 (1.6%) | 0 (0.0%) |
| 9:00 AM to 9:59 AM | 0 (0.0%) | 0 (0.0%) |
| 10:00 AM to 10:59 AM | 0 (0.0%) | 0 (0.0%) |
| 11:00 AM to 11:59 AM | 6 (9.4%) | 0 (0.0%) |
| 12:00 PM to 3:59 PM | 7 (10.9%) | 5 (10.2%) |
| 4:00 PM to 11:59 PM | 6 (9.4%) | 0 (0.0%) |
| Total | 64 (100.0%) | 49 (100.0%) |
Housing Occupancy in East Germantown
Occupancy by Ownership in East Germantown
Of the total 140 dwellings in East Germantown, owner-occupied units account for 114 (81.4%), while renter-occupied units make up 26 (18.6%).
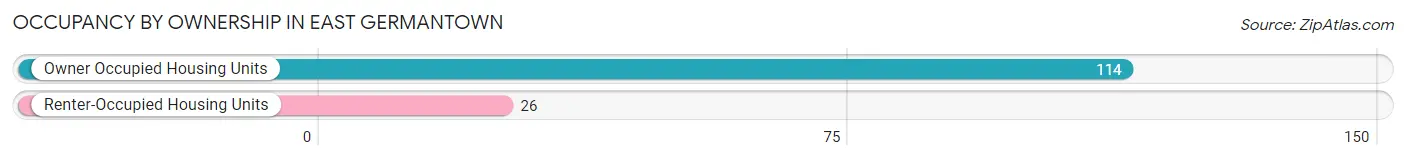
| Occupancy | # Housing Units | % Housing Units |
| Owner Occupied Housing Units | 114 | 81.4% |
| Renter-Occupied Housing Units | 26 | 18.6% |
| Total Occupied Housing Units | 140 | 100.0% |
Occupancy by Household Size in East Germantown
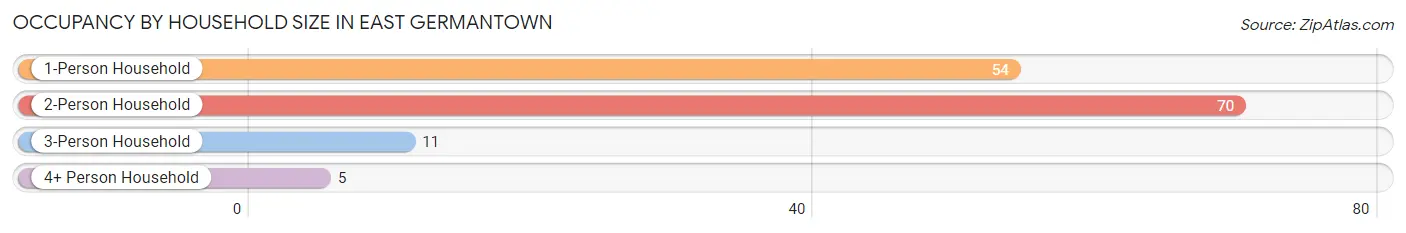
| Household Size | # Housing Units | % Housing Units |
| 1-Person Household | 54 | 38.6% |
| 2-Person Household | 70 | 50.0% |
| 3-Person Household | 11 | 7.9% |
| 4+ Person Household | 5 | 3.6% |
| Total Housing Units | 140 | 100.0% |
Occupancy by Ownership by Household Size in East Germantown
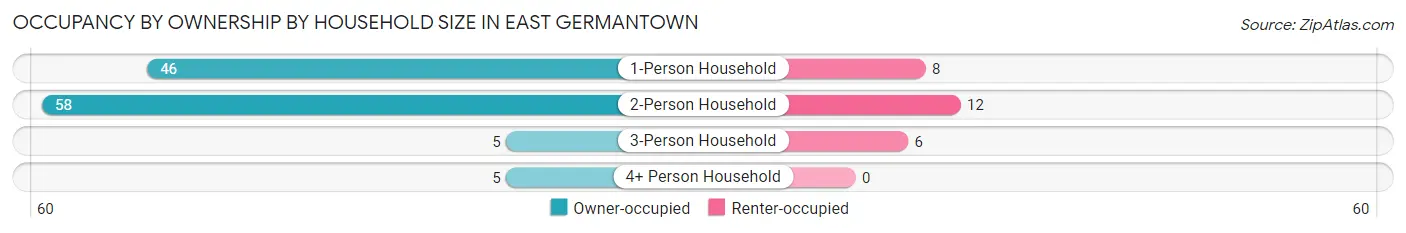
| Household Size | Owner-occupied | Renter-occupied |
| 1-Person Household | 46 (85.2%) | 8 (14.8%) |
| 2-Person Household | 58 (82.9%) | 12 (17.1%) |
| 3-Person Household | 5 (45.5%) | 6 (54.5%) |
| 4+ Person Household | 5 (100.0%) | 0 (0.0%) |
| Total Housing Units | 114 (81.4%) | 26 (18.6%) |
Occupancy by Educational Attainment in East Germantown
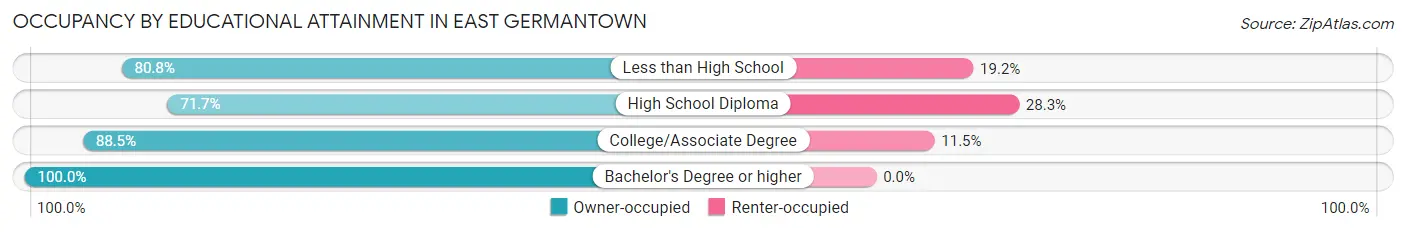
| Household Size | Owner-occupied | Renter-occupied |
| Less than High School | 21 (80.8%) | 5 (19.2%) |
| High School Diploma | 38 (71.7%) | 15 (28.3%) |
| College/Associate Degree | 46 (88.5%) | 6 (11.5%) |
| Bachelor's Degree or higher | 9 (100.0%) | 0 (0.0%) |
Occupancy by Age of Householder in East Germantown
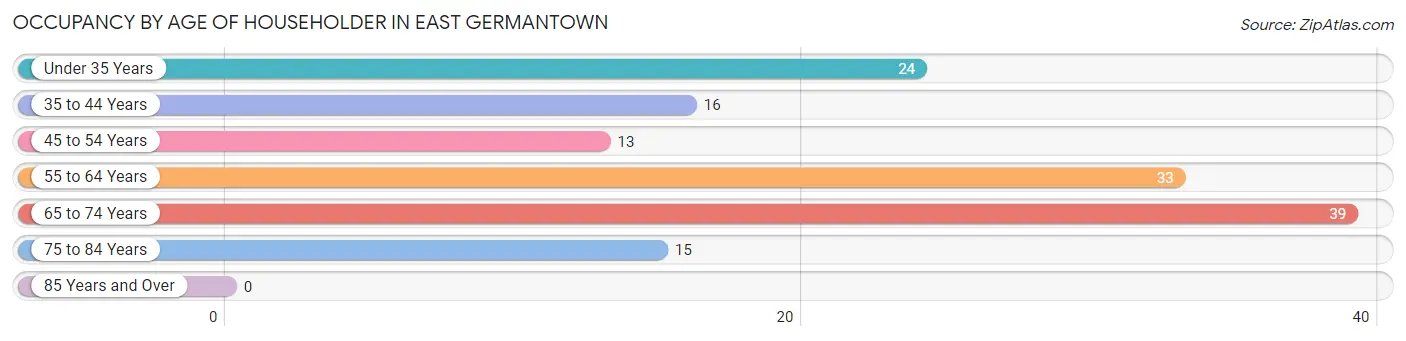
| Age Bracket | # Households | % Households |
| Under 35 Years | 24 | 17.1% |
| 35 to 44 Years | 16 | 11.4% |
| 45 to 54 Years | 13 | 9.3% |
| 55 to 64 Years | 33 | 23.6% |
| 65 to 74 Years | 39 | 27.9% |
| 75 to 84 Years | 15 | 10.7% |
| 85 Years and Over | 0 | 0.0% |
| Total | 140 | 100.0% |
Housing Finances in East Germantown
Median Income by Occupancy in East Germantown
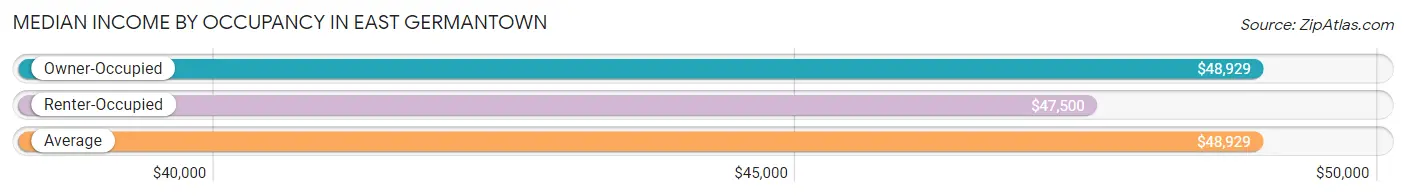
| Occupancy Type | # Households | Median Income |
| Owner-Occupied | 114 (81.4%) | $48,929 |
| Renter-Occupied | 26 (18.6%) | $47,500 |
| Average | 140 (100.0%) | $48,929 |
Occupancy by Householder Income Bracket in East Germantown
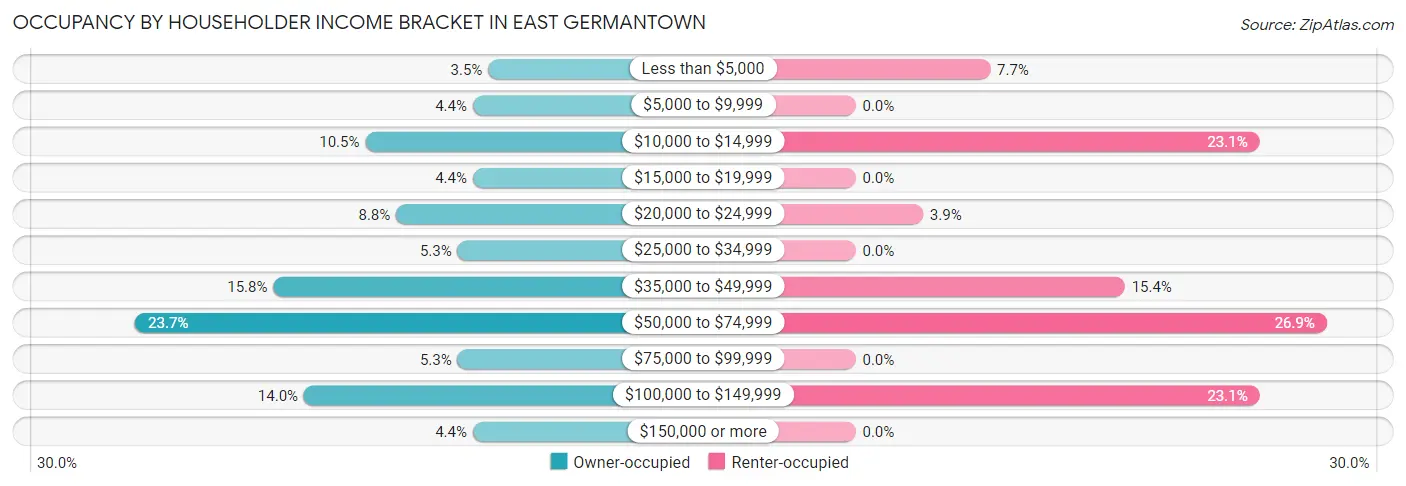
| Income Bracket | Owner-occupied | Renter-occupied |
| Less than $5,000 | 4 (3.5%) | 2 (7.7%) |
| $5,000 to $9,999 | 5 (4.4%) | 0 (0.0%) |
| $10,000 to $14,999 | 12 (10.5%) | 6 (23.1%) |
| $15,000 to $19,999 | 5 (4.4%) | 0 (0.0%) |
| $20,000 to $24,999 | 10 (8.8%) | 1 (3.8%) |
| $25,000 to $34,999 | 6 (5.3%) | 0 (0.0%) |
| $35,000 to $49,999 | 18 (15.8%) | 4 (15.4%) |
| $50,000 to $74,999 | 27 (23.7%) | 7 (26.9%) |
| $75,000 to $99,999 | 6 (5.3%) | 0 (0.0%) |
| $100,000 to $149,999 | 16 (14.0%) | 6 (23.1%) |
| $150,000 or more | 5 (4.4%) | 0 (0.0%) |
| Total | 114 (100.0%) | 26 (100.0%) |
Monthly Housing Cost Tiers in East Germantown
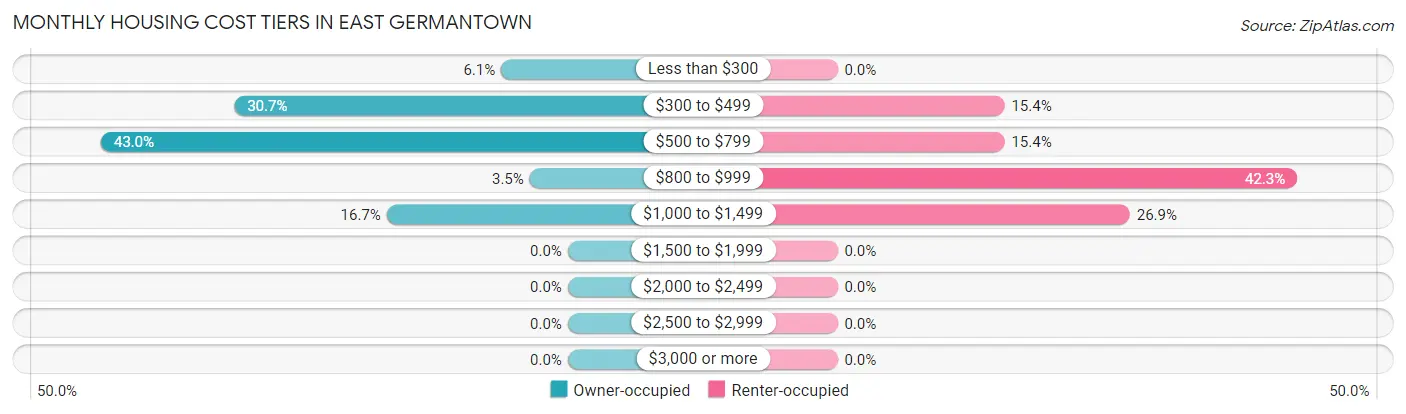
| Monthly Cost | Owner-occupied | Renter-occupied |
| Less than $300 | 7 (6.1%) | 0 (0.0%) |
| $300 to $499 | 35 (30.7%) | 4 (15.4%) |
| $500 to $799 | 49 (43.0%) | 4 (15.4%) |
| $800 to $999 | 4 (3.5%) | 11 (42.3%) |
| $1,000 to $1,499 | 19 (16.7%) | 7 (26.9%) |
| $1,500 to $1,999 | 0 (0.0%) | 0 (0.0%) |
| $2,000 to $2,499 | 0 (0.0%) | 0 (0.0%) |
| $2,500 to $2,999 | 0 (0.0%) | 0 (0.0%) |
| $3,000 or more | 0 (0.0%) | 0 (0.0%) |
| Total | 114 (100.0%) | 26 (100.0%) |
Physical Housing Characteristics in East Germantown
Housing Structures in East Germantown
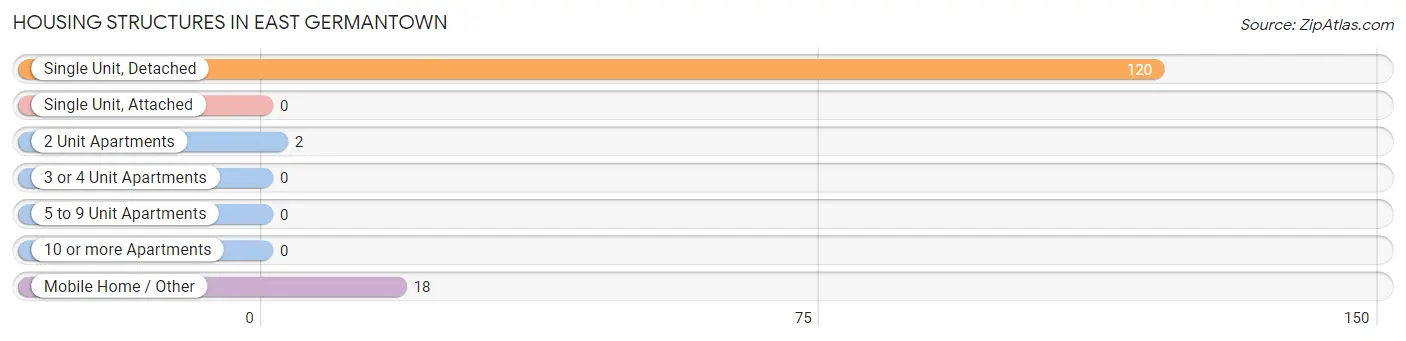
| Structure Type | # Housing Units | % Housing Units |
| Single Unit, Detached | 120 | 85.7% |
| Single Unit, Attached | 0 | 0.0% |
| 2 Unit Apartments | 2 | 1.4% |
| 3 or 4 Unit Apartments | 0 | 0.0% |
| 5 to 9 Unit Apartments | 0 | 0.0% |
| 10 or more Apartments | 0 | 0.0% |
| Mobile Home / Other | 18 | 12.9% |
| Total | 140 | 100.0% |
Housing Structures by Occupancy in East Germantown
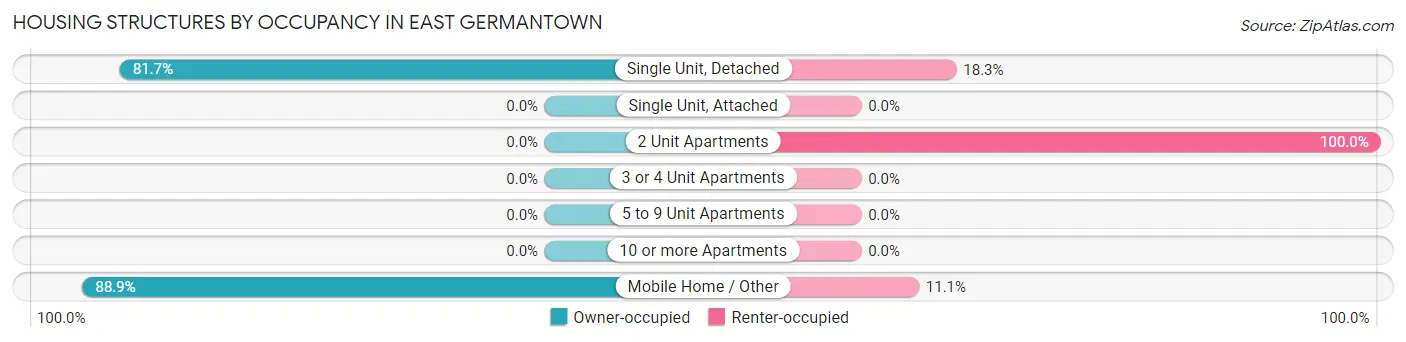
| Structure Type | Owner-occupied | Renter-occupied |
| Single Unit, Detached | 98 (81.7%) | 22 (18.3%) |
| Single Unit, Attached | 0 (0.0%) | 0 (0.0%) |
| 2 Unit Apartments | 0 (0.0%) | 2 (100.0%) |
| 3 or 4 Unit Apartments | 0 (0.0%) | 0 (0.0%) |
| 5 to 9 Unit Apartments | 0 (0.0%) | 0 (0.0%) |
| 10 or more Apartments | 0 (0.0%) | 0 (0.0%) |
| Mobile Home / Other | 16 (88.9%) | 2 (11.1%) |
| Total | 114 (81.4%) | 26 (18.6%) |
Housing Structures by Number of Rooms in East Germantown
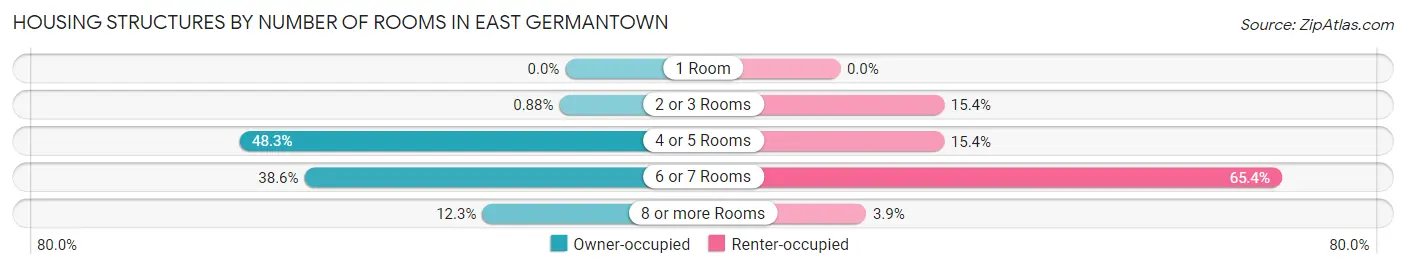
| Number of Rooms | Owner-occupied | Renter-occupied |
| 1 Room | 0 (0.0%) | 0 (0.0%) |
| 2 or 3 Rooms | 1 (0.9%) | 4 (15.4%) |
| 4 or 5 Rooms | 55 (48.2%) | 4 (15.4%) |
| 6 or 7 Rooms | 44 (38.6%) | 17 (65.4%) |
| 8 or more Rooms | 14 (12.3%) | 1 (3.8%) |
| Total | 114 (100.0%) | 26 (100.0%) |
Housing Structure by Heating Type in East Germantown
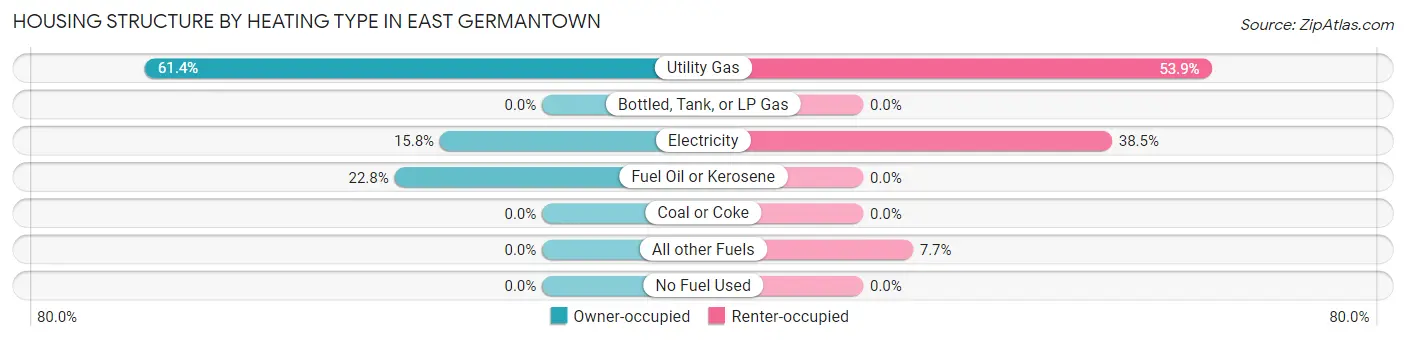
| Heating Type | Owner-occupied | Renter-occupied |
| Utility Gas | 70 (61.4%) | 14 (53.8%) |
| Bottled, Tank, or LP Gas | 0 (0.0%) | 0 (0.0%) |
| Electricity | 18 (15.8%) | 10 (38.5%) |
| Fuel Oil or Kerosene | 26 (22.8%) | 0 (0.0%) |
| Coal or Coke | 0 (0.0%) | 0 (0.0%) |
| All other Fuels | 0 (0.0%) | 2 (7.7%) |
| No Fuel Used | 0 (0.0%) | 0 (0.0%) |
| Total | 114 (100.0%) | 26 (100.0%) |
Household Vehicle Usage in East Germantown
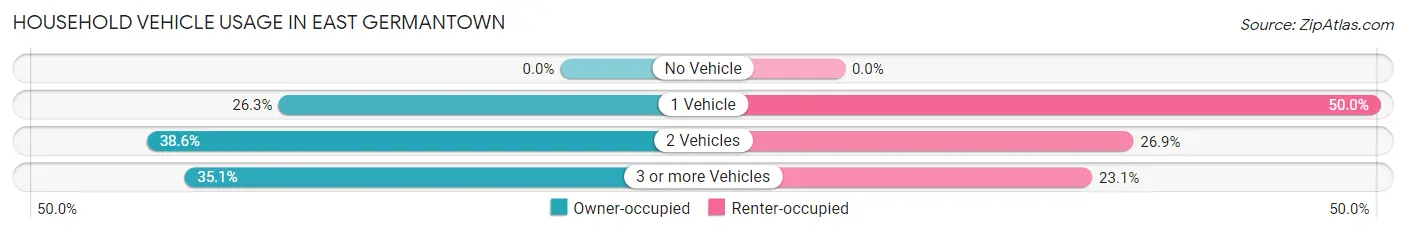
| Vehicles per Household | Owner-occupied | Renter-occupied |
| No Vehicle | 0 (0.0%) | 0 (0.0%) |
| 1 Vehicle | 30 (26.3%) | 13 (50.0%) |
| 2 Vehicles | 44 (38.6%) | 7 (26.9%) |
| 3 or more Vehicles | 40 (35.1%) | 6 (23.1%) |
| Total | 114 (100.0%) | 26 (100.0%) |
Real Estate & Mortgages in East Germantown
Real Estate and Mortgage Overview in East Germantown
| Characteristic | Without Mortgage | With Mortgage |
| Housing Units | 74 | 40 |
| Median Property Value | $83,000 | $88,300 |
| Median Household Income | $43,611 | $5 |
| Monthly Housing Costs | $483 | $0 |
| Real Estate Taxes | - | - |
Property Value by Mortgage Status in East Germantown
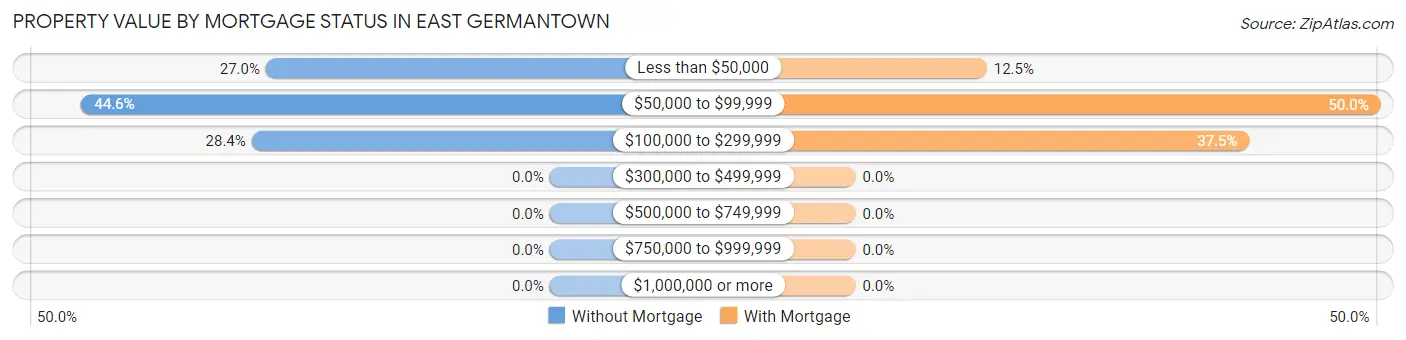
| Property Value | Without Mortgage | With Mortgage |
| Less than $50,000 | 20 (27.0%) | 5 (12.5%) |
| $50,000 to $99,999 | 33 (44.6%) | 20 (50.0%) |
| $100,000 to $299,999 | 21 (28.4%) | 15 (37.5%) |
| $300,000 to $499,999 | 0 (0.0%) | 0 (0.0%) |
| $500,000 to $749,999 | 0 (0.0%) | 0 (0.0%) |
| $750,000 to $999,999 | 0 (0.0%) | 0 (0.0%) |
| $1,000,000 or more | 0 (0.0%) | 0 (0.0%) |
| Total | 74 (100.0%) | 40 (100.0%) |
Household Income by Mortgage Status in East Germantown
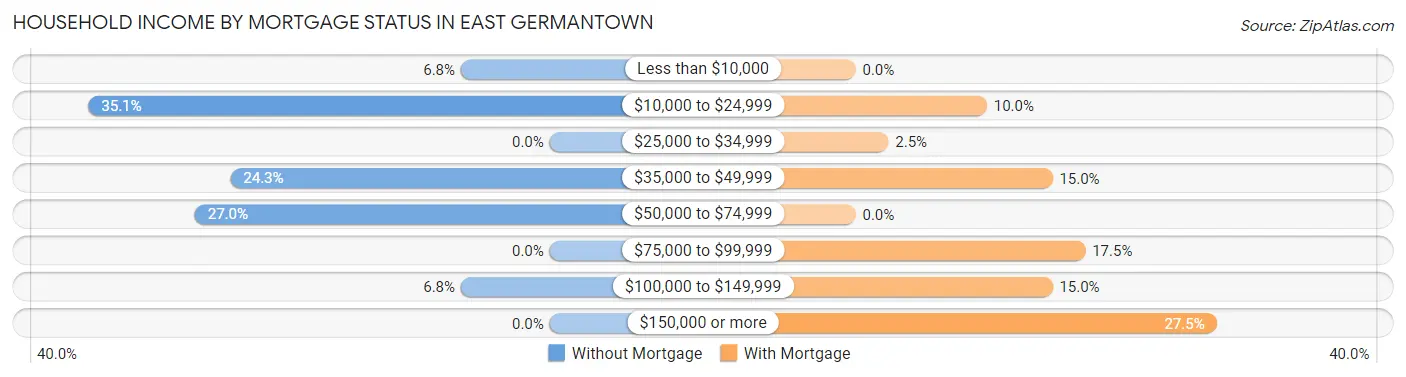
| Household Income | Without Mortgage | With Mortgage |
| Less than $10,000 | 5 (6.8%) | 0 (0.0%) |
| $10,000 to $24,999 | 26 (35.1%) | 4 (10.0%) |
| $25,000 to $34,999 | 0 (0.0%) | 1 (2.5%) |
| $35,000 to $49,999 | 18 (24.3%) | 6 (15.0%) |
| $50,000 to $74,999 | 20 (27.0%) | 0 (0.0%) |
| $75,000 to $99,999 | 0 (0.0%) | 7 (17.5%) |
| $100,000 to $149,999 | 5 (6.8%) | 6 (15.0%) |
| $150,000 or more | 0 (0.0%) | 11 (27.5%) |
| Total | 74 (100.0%) | 40 (100.0%) |
Property Value to Household Income Ratio in East Germantown
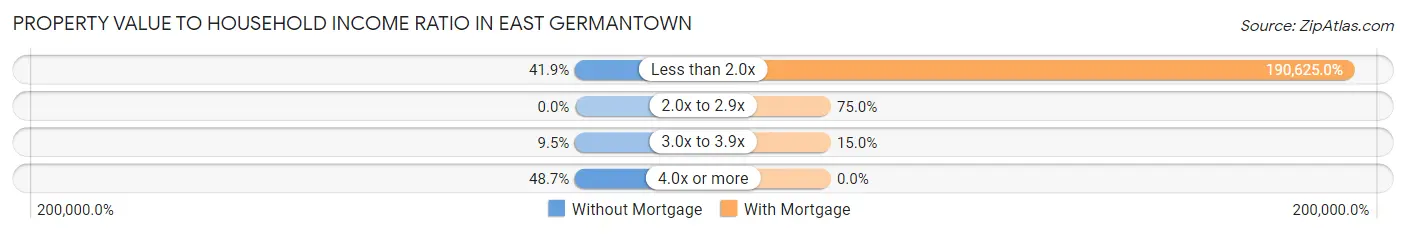
| Value-to-Income Ratio | Without Mortgage | With Mortgage |
| Less than 2.0x | 31 (41.9%) | 76,250 (190,625.0%) |
| 2.0x to 2.9x | 0 (0.0%) | 30 (75.0%) |
| 3.0x to 3.9x | 7 (9.5%) | 6 (15.0%) |
| 4.0x or more | 36 (48.6%) | 0 (0.0%) |
| Total | 74 (100.0%) | 40 (100.0%) |
Real Estate Taxes by Mortgage Status in East Germantown
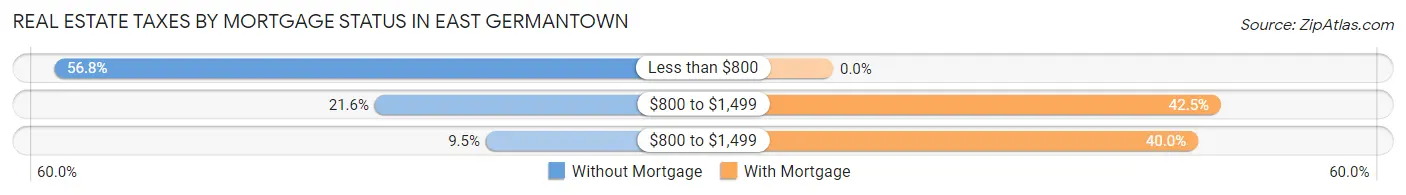
| Property Taxes | Without Mortgage | With Mortgage |
| Less than $800 | 42 (56.8%) | 0 (0.0%) |
| $800 to $1,499 | 16 (21.6%) | 17 (42.5%) |
| $800 to $1,499 | 7 (9.5%) | 16 (40.0%) |
| Total | 74 (100.0%) | 40 (100.0%) |
Health & Disability in East Germantown
Health Insurance Coverage by Age in East Germantown
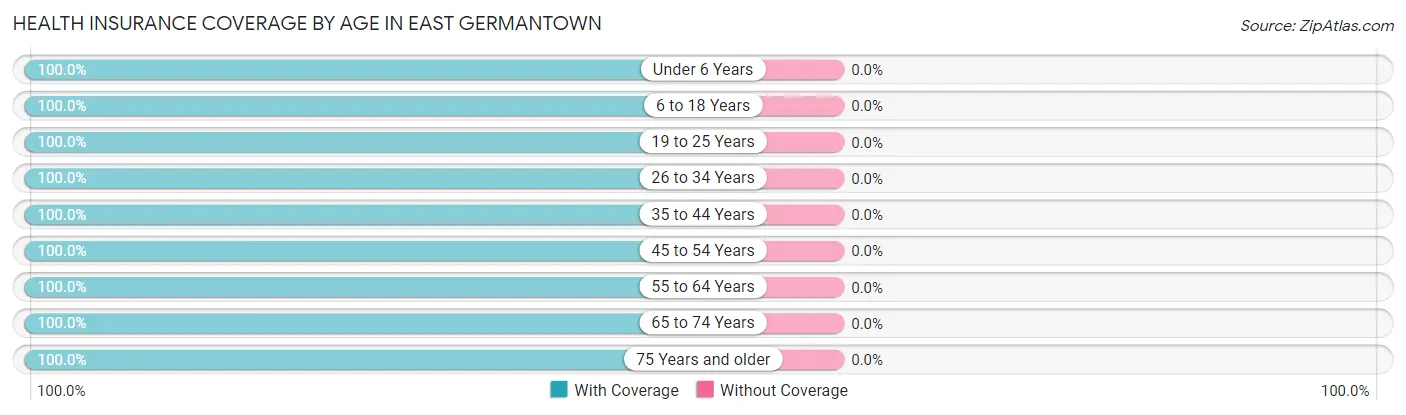
| Age Bracket | With Coverage | Without Coverage |
| Under 6 Years | 4 (100.0%) | 0 (0.0%) |
| 6 to 18 Years | 16 (100.0%) | 0 (0.0%) |
| 19 to 25 Years | 17 (100.0%) | 0 (0.0%) |
| 26 to 34 Years | 22 (100.0%) | 0 (0.0%) |
| 35 to 44 Years | 28 (100.0%) | 0 (0.0%) |
| 45 to 54 Years | 26 (100.0%) | 0 (0.0%) |
| 55 to 64 Years | 52 (100.0%) | 0 (0.0%) |
| 65 to 74 Years | 45 (100.0%) | 0 (0.0%) |
| 75 Years and older | 22 (100.0%) | 0 (0.0%) |
| Total | 232 (100.0%) | 0 (0.0%) |
Health Insurance Coverage by Citizenship Status in East Germantown
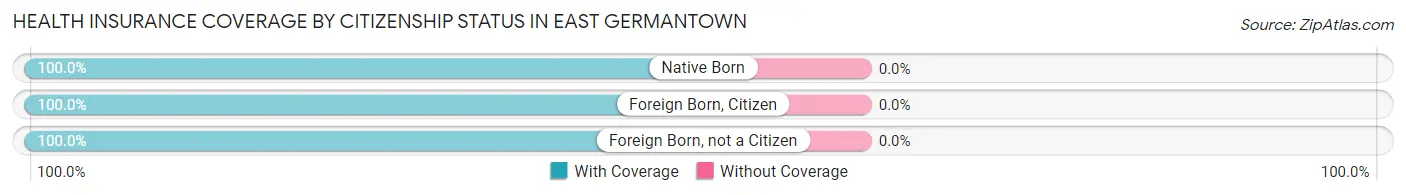
| Citizenship Status | With Coverage | Without Coverage |
| Native Born | 4 (100.0%) | 0 (0.0%) |
| Foreign Born, Citizen | 16 (100.0%) | 0 (0.0%) |
| Foreign Born, not a Citizen | 17 (100.0%) | 0 (0.0%) |
Health Insurance Coverage by Household Income in East Germantown
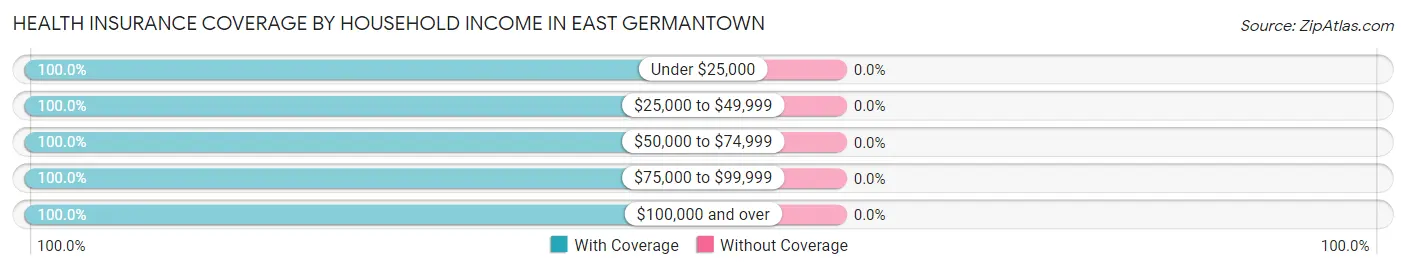
| Household Income | With Coverage | Without Coverage |
| Under $25,000 | 52 (100.0%) | 0 (0.0%) |
| $25,000 to $49,999 | 39 (100.0%) | 0 (0.0%) |
| $50,000 to $74,999 | 62 (100.0%) | 0 (0.0%) |
| $75,000 to $99,999 | 11 (100.0%) | 0 (0.0%) |
| $100,000 and over | 68 (100.0%) | 0 (0.0%) |
Public vs Private Health Insurance Coverage by Age in East Germantown
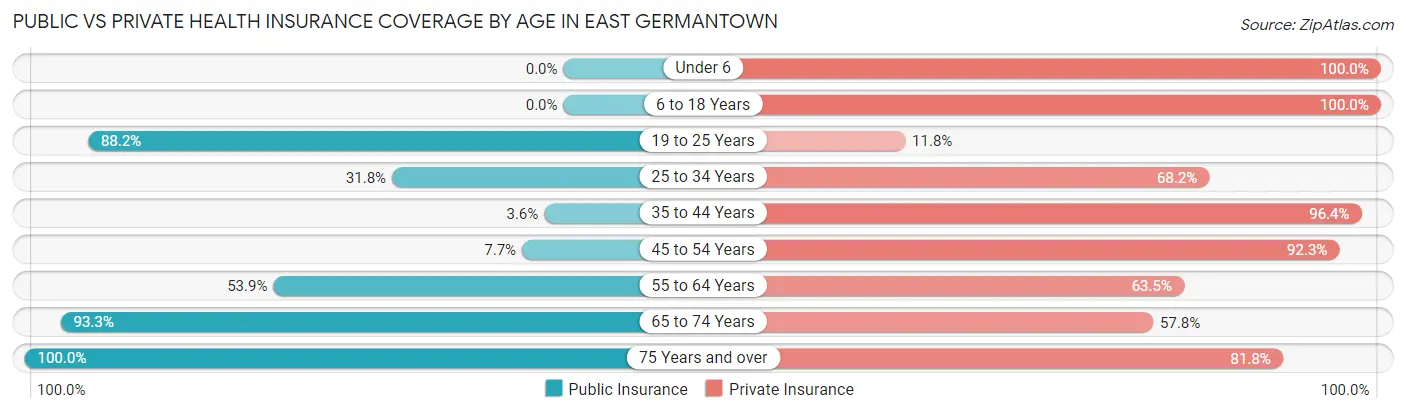
| Age Bracket | Public Insurance | Private Insurance |
| Under 6 | 0 (0.0%) | 4 (100.0%) |
| 6 to 18 Years | 0 (0.0%) | 16 (100.0%) |
| 19 to 25 Years | 15 (88.2%) | 2 (11.8%) |
| 25 to 34 Years | 7 (31.8%) | 15 (68.2%) |
| 35 to 44 Years | 1 (3.6%) | 27 (96.4%) |
| 45 to 54 Years | 2 (7.7%) | 24 (92.3%) |
| 55 to 64 Years | 28 (53.8%) | 33 (63.5%) |
| 65 to 74 Years | 42 (93.3%) | 26 (57.8%) |
| 75 Years and over | 22 (100.0%) | 18 (81.8%) |
| Total | 117 (50.4%) | 165 (71.1%) |
Disability Status by Sex by Age in East Germantown
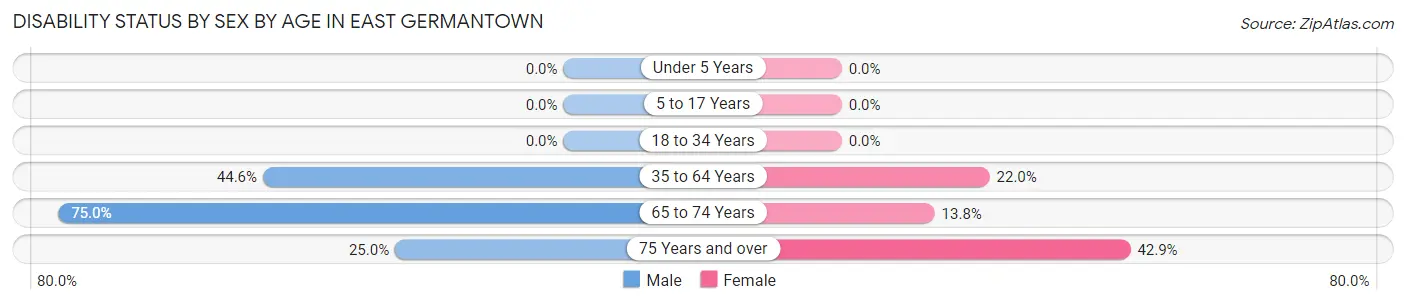
| Age Bracket | Male | Female |
| Under 5 Years | 0 (0.0%) | 0 (0.0%) |
| 5 to 17 Years | 0 (0.0%) | 0 (0.0%) |
| 18 to 34 Years | 0 (0.0%) | 0 (0.0%) |
| 35 to 64 Years | 29 (44.6%) | 9 (22.0%) |
| 65 to 74 Years | 12 (75.0%) | 4 (13.8%) |
| 75 Years and over | 2 (25.0%) | 6 (42.9%) |
Disability Class by Sex by Age in East Germantown
Disability Class: Hearing Difficulty
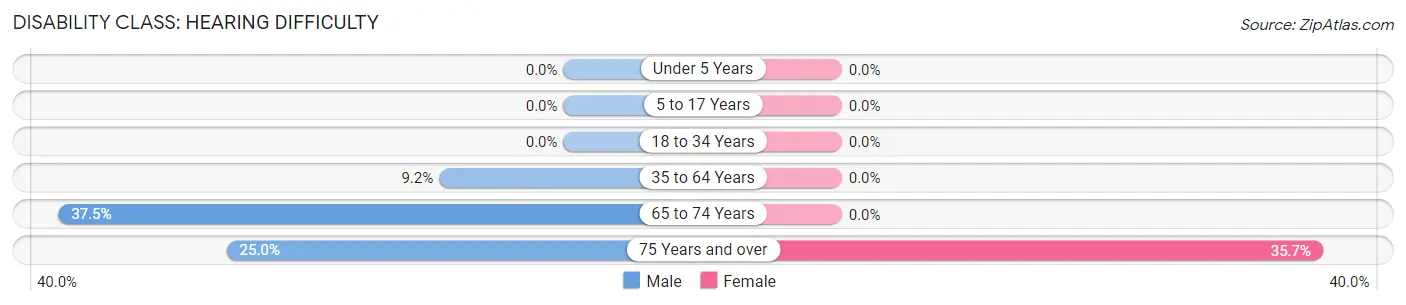
| Age Bracket | Male | Female |
| Under 5 Years | 0 (0.0%) | 0 (0.0%) |
| 5 to 17 Years | 0 (0.0%) | 0 (0.0%) |
| 18 to 34 Years | 0 (0.0%) | 0 (0.0%) |
| 35 to 64 Years | 6 (9.2%) | 0 (0.0%) |
| 65 to 74 Years | 6 (37.5%) | 0 (0.0%) |
| 75 Years and over | 2 (25.0%) | 5 (35.7%) |
Disability Class: Vision Difficulty
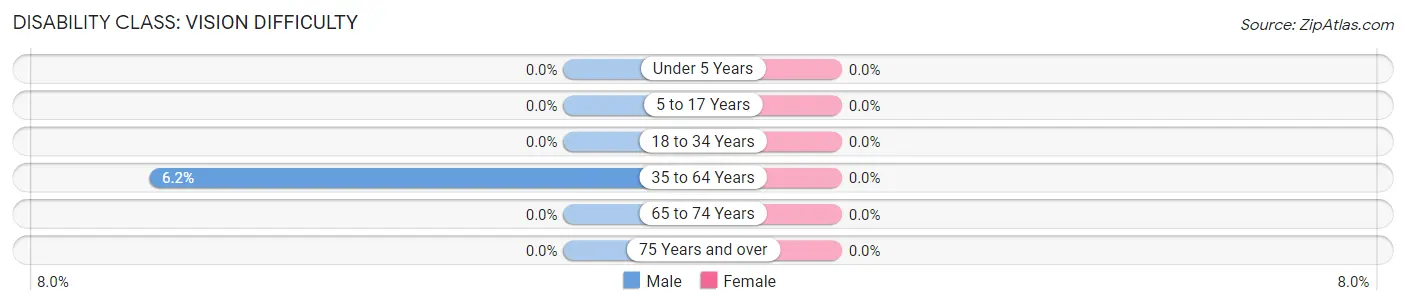
| Age Bracket | Male | Female |
| Under 5 Years | 0 (0.0%) | 0 (0.0%) |
| 5 to 17 Years | 0 (0.0%) | 0 (0.0%) |
| 18 to 34 Years | 0 (0.0%) | 0 (0.0%) |
| 35 to 64 Years | 4 (6.1%) | 0 (0.0%) |
| 65 to 74 Years | 0 (0.0%) | 0 (0.0%) |
| 75 Years and over | 0 (0.0%) | 0 (0.0%) |
Disability Class: Cognitive Difficulty
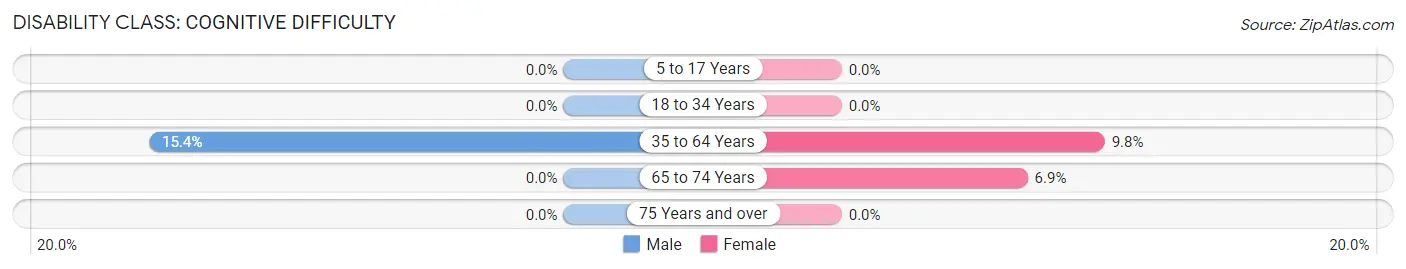
| Age Bracket | Male | Female |
| 5 to 17 Years | 0 (0.0%) | 0 (0.0%) |
| 18 to 34 Years | 0 (0.0%) | 0 (0.0%) |
| 35 to 64 Years | 10 (15.4%) | 4 (9.8%) |
| 65 to 74 Years | 0 (0.0%) | 2 (6.9%) |
| 75 Years and over | 0 (0.0%) | 0 (0.0%) |
Disability Class: Ambulatory Difficulty
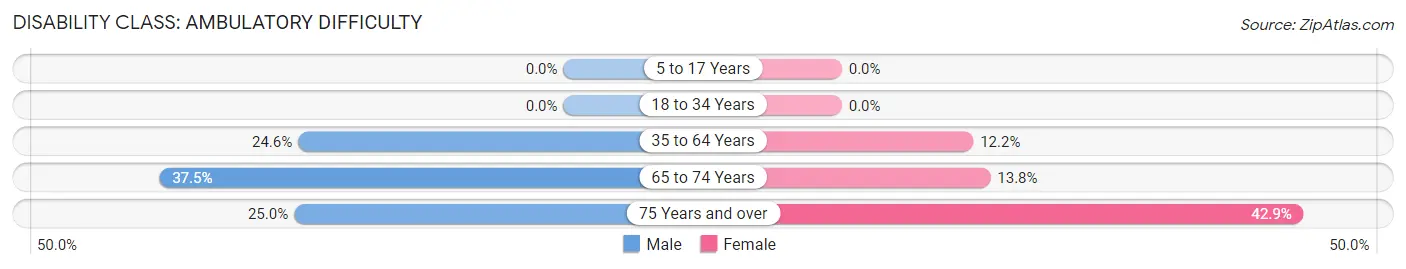
| Age Bracket | Male | Female |
| 5 to 17 Years | 0 (0.0%) | 0 (0.0%) |
| 18 to 34 Years | 0 (0.0%) | 0 (0.0%) |
| 35 to 64 Years | 16 (24.6%) | 5 (12.2%) |
| 65 to 74 Years | 6 (37.5%) | 4 (13.8%) |
| 75 Years and over | 2 (25.0%) | 6 (42.9%) |
Disability Class: Self-Care Difficulty
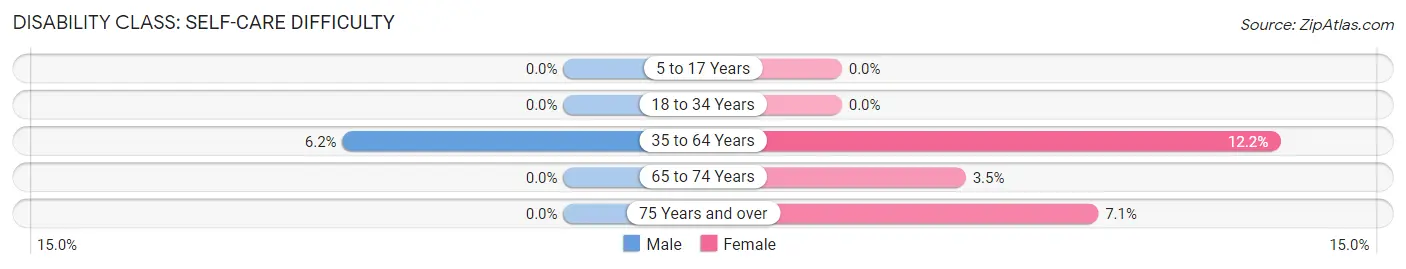
| Age Bracket | Male | Female |
| 5 to 17 Years | 0 (0.0%) | 0 (0.0%) |
| 18 to 34 Years | 0 (0.0%) | 0 (0.0%) |
| 35 to 64 Years | 4 (6.1%) | 5 (12.2%) |
| 65 to 74 Years | 0 (0.0%) | 1 (3.5%) |
| 75 Years and over | 0 (0.0%) | 1 (7.1%) |
Technology Access in East Germantown
Computing Device Access in East Germantown
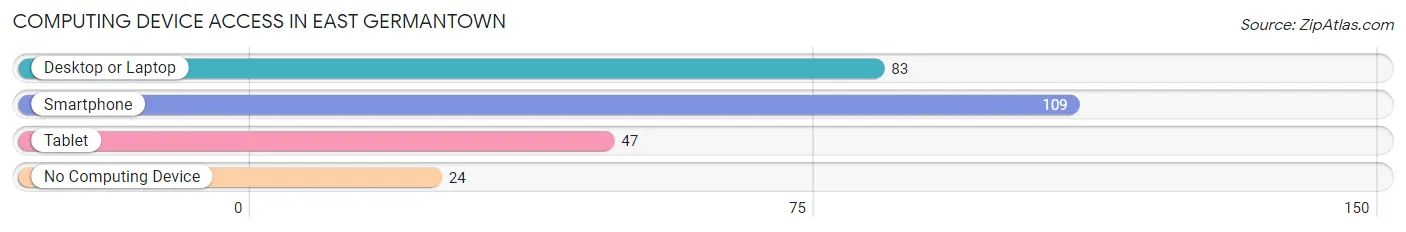
| Device Type | # Households | % Households |
| Desktop or Laptop | 83 | 59.3% |
| Smartphone | 109 | 77.9% |
| Tablet | 47 | 33.6% |
| No Computing Device | 24 | 17.1% |
| Total | 140 | 100.0% |
Internet Access in East Germantown
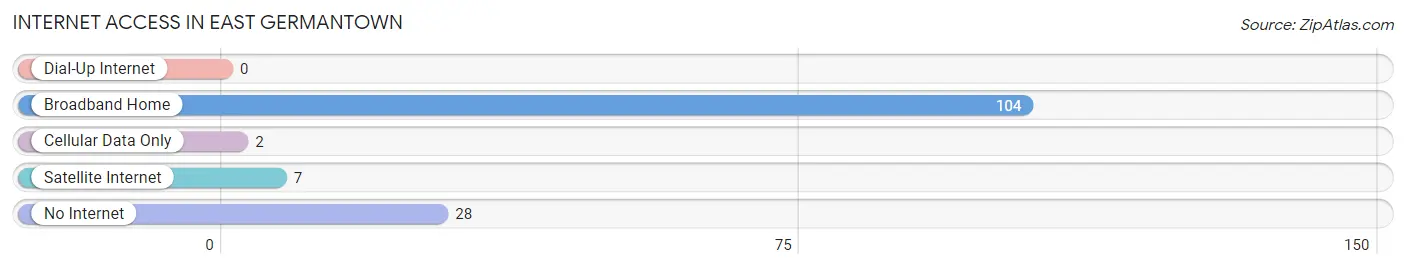
| Internet Type | # Households | % Households |
| Dial-Up Internet | 0 | 0.0% |
| Broadband Home | 104 | 74.3% |
| Cellular Data Only | 2 | 1.4% |
| Satellite Internet | 7 | 5.0% |
| No Internet | 28 | 20.0% |
| Total | 140 | 100.0% |
East Germantown Summary
History
East Germantown, Indiana is a small town located in the southeastern part of the state. It is situated in the heart of the Wabash Valley, and is part of the larger metropolitan area of Terre Haute. The town was founded in 1837 by German immigrants who were looking for a place to settle and start a new life. The town was originally called “Germantown”, but the name was changed to “East Germantown” in 1845 to distinguish it from the nearby town of West Germantown.
East Germantown has a rich history that dates back to the early 19th century. The town was a major stop on the Wabash and Erie Canal, which was a major transportation route for goods and people in the mid-1800s. The canal was a major factor in the growth of the town, as it allowed for the transportation of goods and people to and from the area.
The town was also a major stop on the Underground Railroad, which was a network of secret routes and safe houses used by African Americans escaping slavery in the southern United States. East Germantown was a safe haven for many of these individuals, and the town was home to several prominent abolitionists.
Geography
East Germantown is located in the southeastern part of Indiana, in the Wabash Valley. The town is situated on the banks of the Wabash River, and is surrounded by rolling hills and farmland. The town is located approximately 30 miles south of Terre Haute, and is part of the larger metropolitan area.
The town is located in a temperate climate, with hot summers and cold winters. The average temperature in the summer is around 80 degrees Fahrenheit, and the average temperature in the winter is around 30 degrees Fahrenheit. The town receives an average of 40 inches of precipitation per year, with most of it falling in the spring and summer months.
Economy
East Germantown’s economy is largely based on agriculture and manufacturing. The town is home to several large farms, which produce a variety of crops such as corn, soybeans, and wheat. The town is also home to several manufacturing companies, which produce a variety of products such as furniture, clothing, and automotive parts.
The town is also home to several small businesses, which provide services such as restaurants, retail stores, and auto repair shops. The town is also home to several banks and financial institutions, which provide banking services to the local community.
Demographics
As of the 2010 census, the population of East Germantown was 1,845. The town is predominantly white, with a population that is 94.3% white, 2.2% African American, 0.7% Asian, and 2.8% other. The median household income in the town is $41,250, and the median home value is $90,000. The town has a poverty rate of 16.2%, which is higher than the national average.
East Germantown is a small town with a rich history and a diverse economy. The town is home to several large farms and manufacturing companies, as well as a variety of small businesses. The town is also home to a diverse population, with a median household income and home value that are both higher than the national average.
Common Questions
What is Per Capita Income in East Germantown?
Per Capita income in East Germantown is $31,126.
What is the Median Family Income in East Germantown?
Median Family Income in East Germantown is $71,250.
What is the Median Household income in East Germantown?
Median Household Income in East Germantown is $48,929.
What is Income or Wage Gap in East Germantown?
Income or Wage Gap in East Germantown is 55.7%.
Women in East Germantown earn 44.3 cents for every dollar earned by a man.
What is Inequality or Gini Index in East Germantown?
Inequality or Gini Index in East Germantown is 0.42.
What is the Total Population of East Germantown?
Total Population of East Germantown is 232.
What is the Total Male Population of East Germantown?
Total Male Population of East Germantown is 120.
What is the Total Female Population of East Germantown?
Total Female Population of East Germantown is 112.
What is the Ratio of Males per 100 Females in East Germantown?
There are 107.14 Males per 100 Females in East Germantown.
What is the Ratio of Females per 100 Males in East Germantown?
There are 93.33 Females per 100 Males in East Germantown.
What is the Median Population Age in East Germantown?
Median Population Age in East Germantown is 56.6 Years.
What is the Average Family Size in East Germantown
Average Family Size in East Germantown is 2.2 People.
What is the Average Household Size in East Germantown
Average Household Size in East Germantown is 1.7 People.
How Large is the Labor Force in East Germantown?
There are 128 People in the Labor Forcein in East Germantown.
What is the Percentage of People in the Labor Force in East Germantown?
57.4% of People are in the Labor Force in East Germantown.