Caldwell, ID Map & Demographics
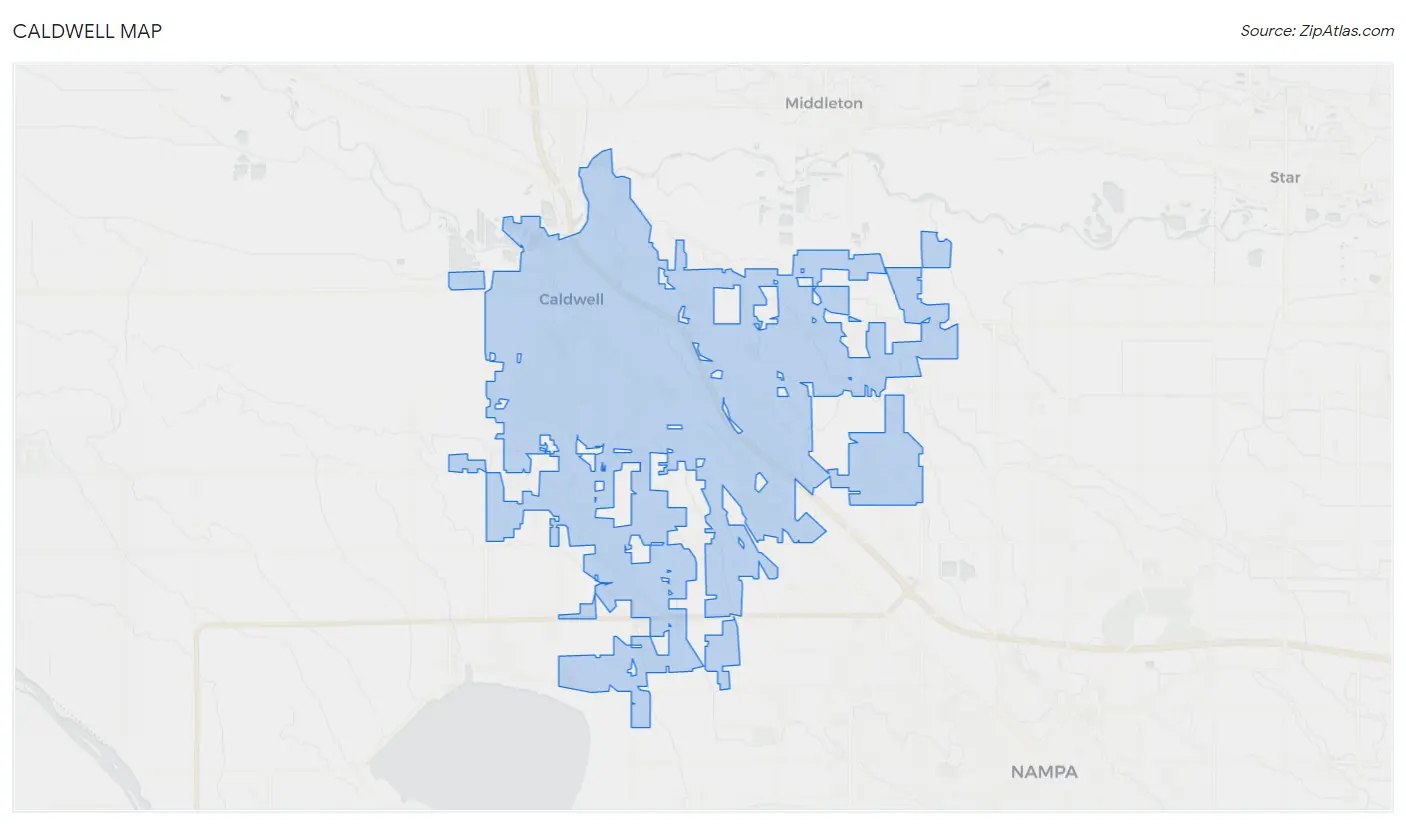
Caldwell Map
Caldwell Overview
$24,112
PER CAPITA INCOME
$71,487
AVG FAMILY INCOME
$65,259
AVG HOUSEHOLD INCOME
28.0%
WAGE / INCOME GAP [ % ]
72.0¢/ $1
WAGE / INCOME GAP [ $ ]
$12,373
FAMILY INCOME DEFICIT
0.38
INEQUALITY / GINI INDEX
61,212
TOTAL POPULATION
30,531
MALE POPULATION
30,681
FEMALE POPULATION
99.51
MALES / 100 FEMALES
100.49
FEMALES / 100 MALES
30.3
MEDIAN AGE
3.6
AVG FAMILY SIZE
3.0
AVG HOUSEHOLD SIZE
28,042
LABOR FORCE [ PEOPLE ]
63.9%
PERCENT IN LABOR FORCE
5.1%
UNEMPLOYMENT RATE
Caldwell Area Codes
Income in Caldwell
Income Overview in Caldwell
Per Capita Income in Caldwell is $24,112, while median incomes of families and households are $71,487 and $65,259 respectively.
| Characteristic | Number | Measure |
| Per Capita Income | 61,212 | $24,112 |
| Median Family Income | 13,999 | $71,487 |
| Mean Family Income | 13,999 | $80,804 |
| Median Household Income | 19,589 | $65,259 |
| Mean Household Income | 19,589 | $73,513 |
| Income Deficit | 13,999 | $12,373 |
| Wage / Income Gap (%) | 61,212 | 27.98% |
| Wage / Income Gap ($) | 61,212 | 72.02¢ per $1 |
| Gini / Inequality Index | 61,212 | 0.38 |
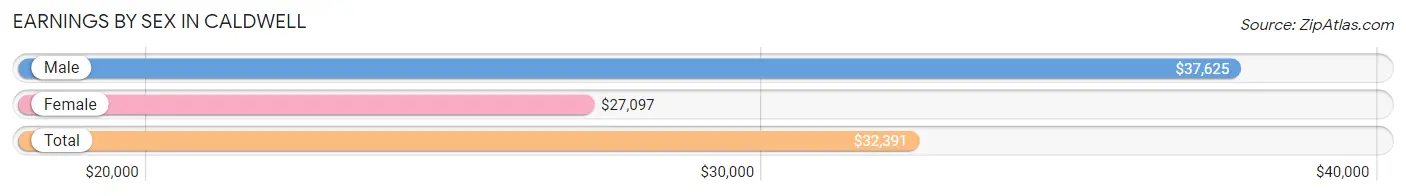
Earnings by Sex in Caldwell
Average Earnings in Caldwell are $32,391, $37,625 for men and $27,097 for women, a difference of 28.0%.
| Sex | Number | Average Earnings |
| Male | 16,852 (55.2%) | $37,625 |
| Female | 13,673 (44.8%) | $27,097 |
| Total | 30,525 (100.0%) | $32,391 |
Earnings by Sex by Income Bracket in Caldwell
The most common earnings brackets in Caldwell are $75,000 to $99,999 for men (2,003 | 11.9%) and $25,000 to $29,999 for women (1,441 | 10.5%).
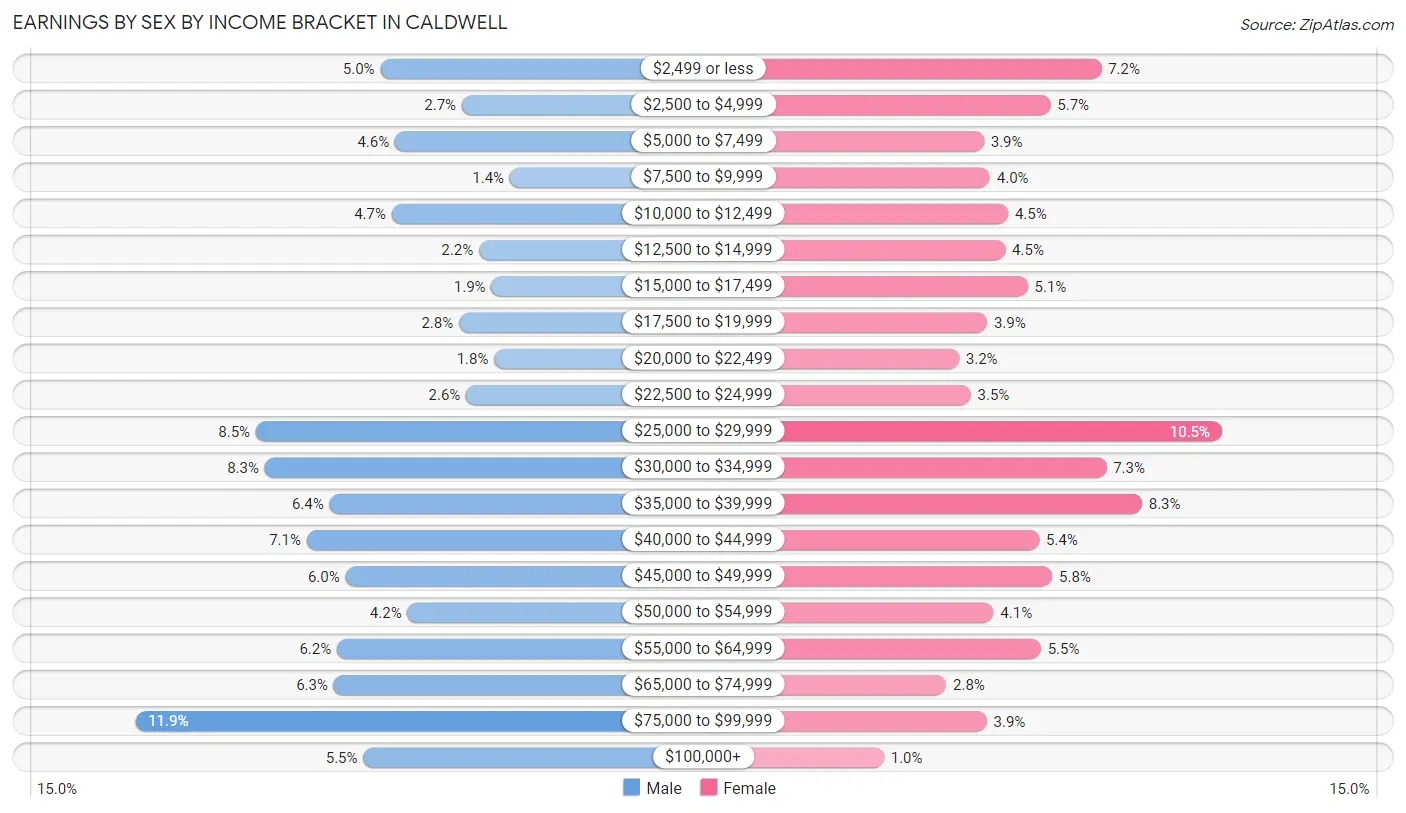
| Income | Male | Female |
| $2,499 or less | 842 (5.0%) | 978 (7.1%) |
| $2,500 to $4,999 | 456 (2.7%) | 782 (5.7%) |
| $5,000 to $7,499 | 774 (4.6%) | 527 (3.8%) |
| $7,500 to $9,999 | 230 (1.4%) | 550 (4.0%) |
| $10,000 to $12,499 | 789 (4.7%) | 619 (4.5%) |
| $12,500 to $14,999 | 375 (2.2%) | 608 (4.4%) |
| $15,000 to $17,499 | 316 (1.9%) | 694 (5.1%) |
| $17,500 to $19,999 | 471 (2.8%) | 539 (3.9%) |
| $20,000 to $22,499 | 304 (1.8%) | 431 (3.2%) |
| $22,500 to $24,999 | 436 (2.6%) | 476 (3.5%) |
| $25,000 to $29,999 | 1,433 (8.5%) | 1,441 (10.5%) |
| $30,000 to $34,999 | 1,390 (8.3%) | 997 (7.3%) |
| $35,000 to $39,999 | 1,084 (6.4%) | 1,134 (8.3%) |
| $40,000 to $44,999 | 1,192 (7.1%) | 738 (5.4%) |
| $45,000 to $49,999 | 1,007 (6.0%) | 789 (5.8%) |
| $50,000 to $54,999 | 715 (4.2%) | 563 (4.1%) |
| $55,000 to $64,999 | 1,048 (6.2%) | 745 (5.4%) |
| $65,000 to $74,999 | 1,064 (6.3%) | 382 (2.8%) |
| $75,000 to $99,999 | 2,003 (11.9%) | 538 (3.9%) |
| $100,000+ | 923 (5.5%) | 142 (1.0%) |
| Total | 16,852 (100.0%) | 13,673 (100.0%) |
Earnings by Sex by Educational Attainment in Caldwell
Average earnings in Caldwell are $44,105 for men and $32,712 for women, a difference of 25.8%. Men with an educational attainment of graduate degree enjoy the highest average annual earnings of $78,180, while those with less than high school education earn the least with $39,325. Women with an educational attainment of graduate degree earn the most with the average annual earnings of $46,852, while those with less than high school education have the smallest earnings of $22,781.
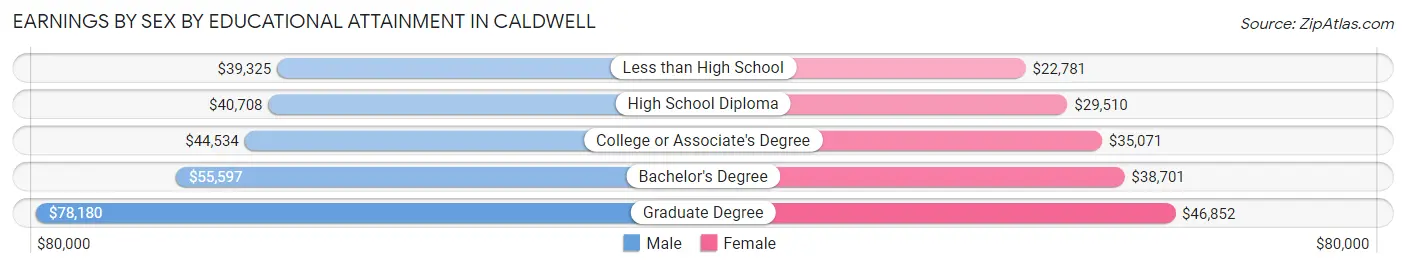
| Educational Attainment | Male Income | Female Income |
| Less than High School | $39,325 | $22,781 |
| High School Diploma | $40,708 | $29,510 |
| College or Associate's Degree | $44,534 | $35,071 |
| Bachelor's Degree | $55,597 | $38,701 |
| Graduate Degree | $78,180 | $46,852 |
| Total | $44,105 | $32,712 |
Family Income in Caldwell
Family Income Brackets in Caldwell
According to the Caldwell family income data, there are 3,570 families falling into the $50,000 to $74,999 income range, which is the most common income bracket and makes up 25.5% of all families. Conversely, the $10,000 to $14,999 income bracket is the least frequent group with only 280 families (2.0%) belonging to this category.
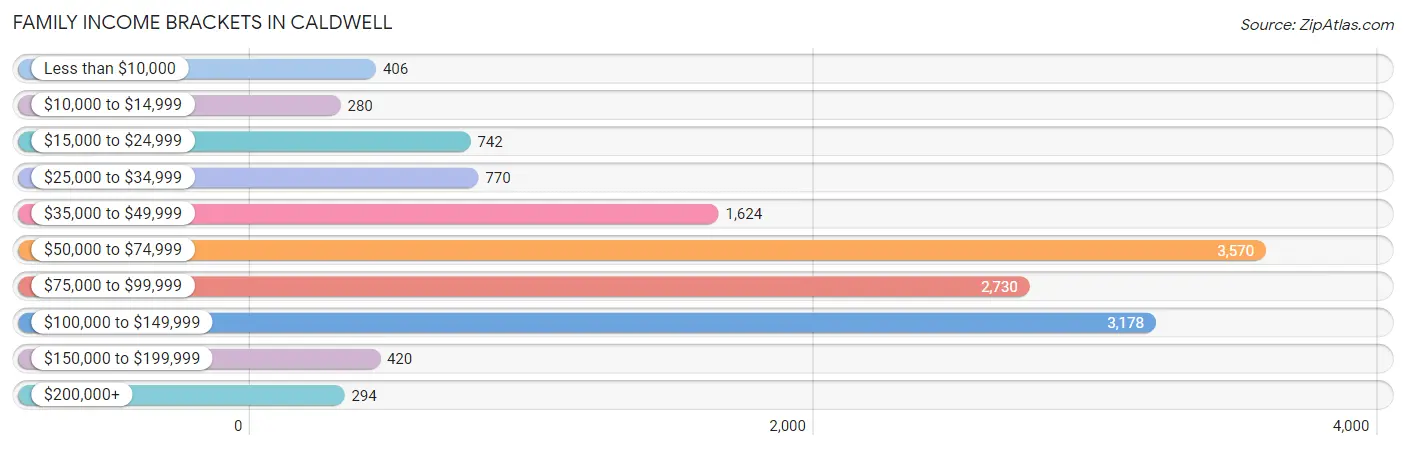
| Income Bracket | # Families | % Families |
| Less than $10,000 | 406 | 2.9% |
| $10,000 to $14,999 | 280 | 2.0% |
| $15,000 to $24,999 | 742 | 5.3% |
| $25,000 to $34,999 | 770 | 5.5% |
| $35,000 to $49,999 | 1,624 | 11.6% |
| $50,000 to $74,999 | 3,570 | 25.5% |
| $75,000 to $99,999 | 2,730 | 19.5% |
| $100,000 to $149,999 | 3,178 | 22.7% |
| $150,000 to $199,999 | 420 | 3.0% |
| $200,000+ | 294 | 2.1% |
Family Income by Famaliy Size in Caldwell
7+ person families (570 | 4.1%) account for the highest median family income in Caldwell with $84,706 per family, while 2-person families (4,683 | 33.5%) have the highest median income of $34,213 per family member.
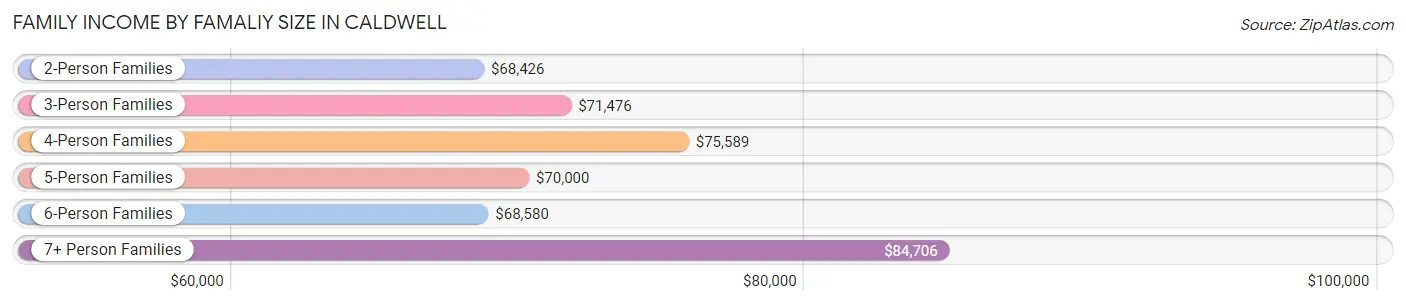
| Income Bracket | # Families | Median Income |
| 2-Person Families | 4,683 (33.5%) | $68,426 |
| 3-Person Families | 3,129 (22.4%) | $71,476 |
| 4-Person Families | 2,637 (18.8%) | $75,589 |
| 5-Person Families | 1,914 (13.7%) | $70,000 |
| 6-Person Families | 1,066 (7.6%) | $68,580 |
| 7+ Person Families | 570 (4.1%) | $84,706 |
| Total | 13,999 (100.0%) | $71,487 |
Family Income by Number of Earners in Caldwell
The median family income in Caldwell is $71,487, with families comprising 3+ earners (1,830) having the highest median family income of $101,953, while families with no earners (1,407) have the lowest median family income of $41,007, accounting for 13.1% and 10.1% of families, respectively.
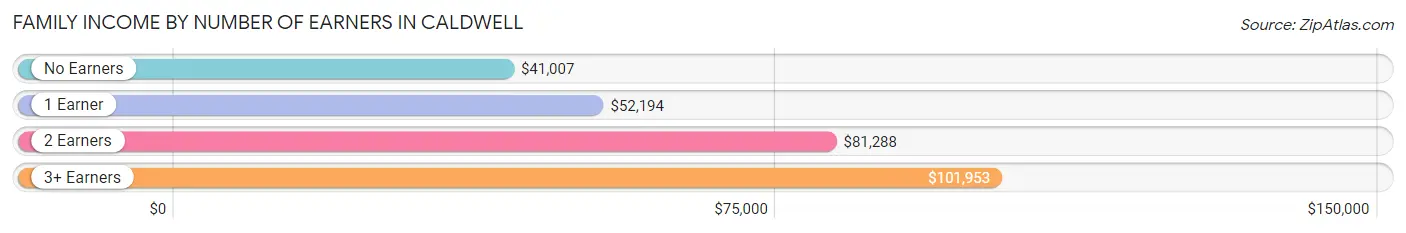
| Number of Earners | # Families | Median Income |
| No Earners | 1,407 (10.1%) | $41,007 |
| 1 Earner | 4,608 (32.9%) | $52,194 |
| 2 Earners | 6,154 (44.0%) | $81,288 |
| 3+ Earners | 1,830 (13.1%) | $101,953 |
| Total | 13,999 (100.0%) | $71,487 |
Household Income in Caldwell
Household Income Brackets in Caldwell
With 4,701 households falling in the category, the $50,000 to $74,999 income range is the most frequent in Caldwell, accounting for 24.0% of all households. In contrast, only 392 households (2.0%) fall into the $200,000+ income bracket, making it the least populous group.
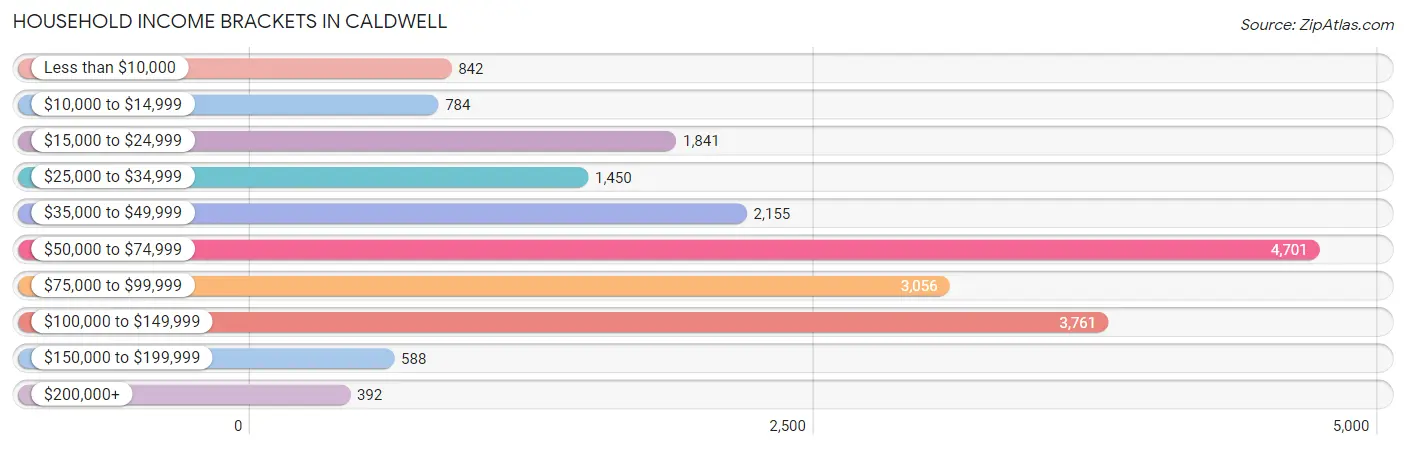
| Income Bracket | # Households | % Households |
| Less than $10,000 | 842 | 4.3% |
| $10,000 to $14,999 | 784 | 4.0% |
| $15,000 to $24,999 | 1,841 | 9.4% |
| $25,000 to $34,999 | 1,450 | 7.4% |
| $35,000 to $49,999 | 2,155 | 11.0% |
| $50,000 to $74,999 | 4,701 | 24.0% |
| $75,000 to $99,999 | 3,056 | 15.6% |
| $100,000 to $149,999 | 3,761 | 19.2% |
| $150,000 to $199,999 | 588 | 3.0% |
| $200,000+ | 392 | 2.0% |
Household Income by Householder Age in Caldwell
The median household income in Caldwell is $65,259, with the highest median household income of $70,773 found in the 25 to 44 years age bracket for the primary householder. A total of 8,419 households (43.0%) fall into this category. Meanwhile, the 65+ years age bracket for the primary householder has the lowest median household income of $46,374, with 3,838 households (19.6%) in this group.
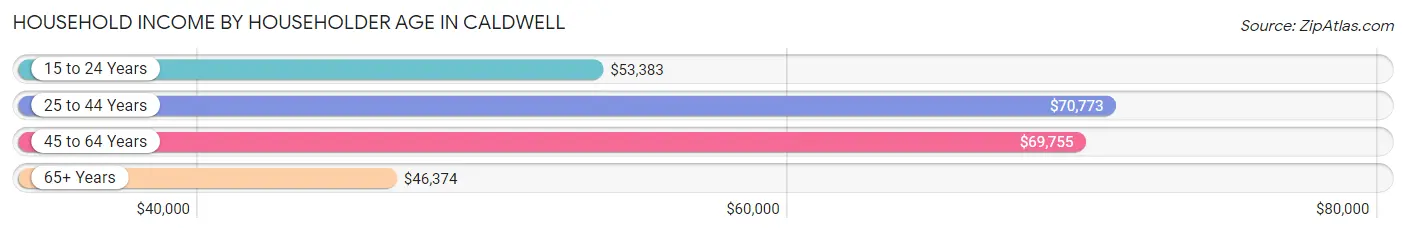
| Income Bracket | # Households | Median Income |
| 15 to 24 Years | 1,197 (6.1%) | $53,383 |
| 25 to 44 Years | 8,419 (43.0%) | $70,773 |
| 45 to 64 Years | 6,135 (31.3%) | $69,755 |
| 65+ Years | 3,838 (19.6%) | $46,374 |
| Total | 19,589 (100.0%) | $65,259 |
Poverty in Caldwell
Income Below Poverty by Sex and Age in Caldwell
With 11.3% poverty level for males and 13.9% for females among the residents of Caldwell, 5 year old males and 6 to 11 year old females are the most vulnerable to poverty, with 154 males (38.1%) and 590 females (19.5%) in their respective age groups living below the poverty level.
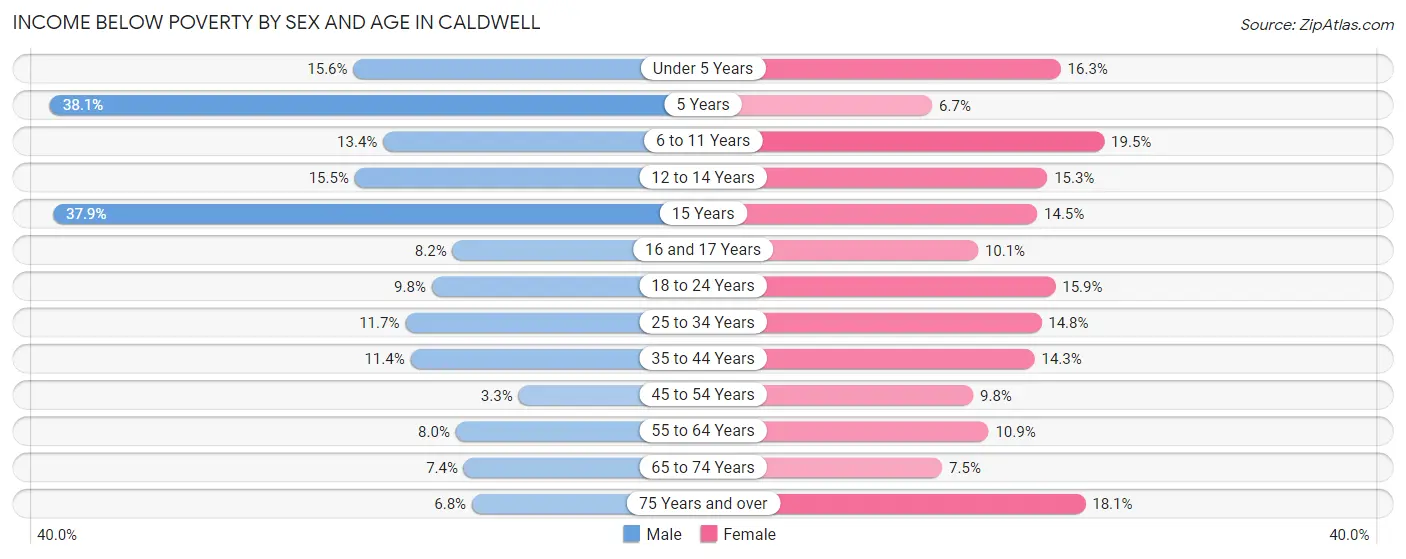
| Age Bracket | Male | Female |
| Under 5 Years | 441 (15.6%) | 389 (16.3%) |
| 5 Years | 154 (38.1%) | 52 (6.7%) |
| 6 to 11 Years | 437 (13.4%) | 590 (19.5%) |
| 12 to 14 Years | 289 (15.5%) | 224 (15.2%) |
| 15 Years | 161 (37.9%) | 98 (14.5%) |
| 16 and 17 Years | 105 (8.2%) | 82 (10.1%) |
| 18 to 24 Years | 255 (9.8%) | 436 (15.9%) |
| 25 to 34 Years | 473 (11.7%) | 698 (14.8%) |
| 35 to 44 Years | 544 (11.4%) | 521 (14.3%) |
| 45 to 54 Years | 96 (3.3%) | 297 (9.8%) |
| 55 to 64 Years | 191 (8.0%) | 348 (10.9%) |
| 65 to 74 Years | 114 (7.4%) | 131 (7.4%) |
| 75 Years and over | 76 (6.8%) | 282 (18.1%) |
| Total | 3,336 (11.3%) | 4,148 (13.9%) |
Income Above Poverty by Sex and Age in Caldwell
According to the poverty statistics in Caldwell, males aged 45 to 54 years and females aged 5 years are the age groups that are most secure financially, with 96.7% of males and 93.3% of females in these age groups living above the poverty line.
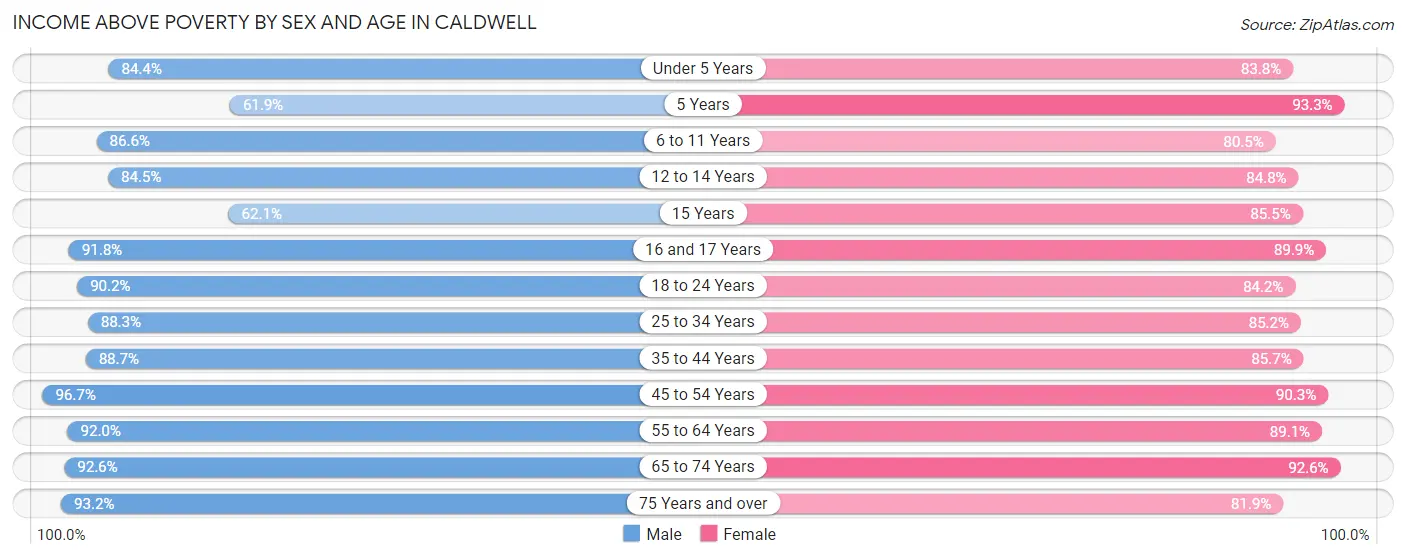
| Age Bracket | Male | Female |
| Under 5 Years | 2,388 (84.4%) | 2,005 (83.8%) |
| 5 Years | 250 (61.9%) | 723 (93.3%) |
| 6 to 11 Years | 2,830 (86.6%) | 2,438 (80.5%) |
| 12 to 14 Years | 1,577 (84.5%) | 1,245 (84.8%) |
| 15 Years | 264 (62.1%) | 578 (85.5%) |
| 16 and 17 Years | 1,171 (91.8%) | 729 (89.9%) |
| 18 to 24 Years | 2,356 (90.2%) | 2,315 (84.2%) |
| 25 to 34 Years | 3,555 (88.3%) | 4,015 (85.2%) |
| 35 to 44 Years | 4,248 (88.6%) | 3,120 (85.7%) |
| 45 to 54 Years | 2,789 (96.7%) | 2,748 (90.2%) |
| 55 to 64 Years | 2,199 (92.0%) | 2,847 (89.1%) |
| 65 to 74 Years | 1,429 (92.6%) | 1,628 (92.5%) |
| 75 Years and over | 1,043 (93.2%) | 1,278 (81.9%) |
| Total | 26,099 (88.7%) | 25,669 (86.1%) |
Income Below Poverty Among Married-Couple Families in Caldwell
The poverty statistics for married-couple families in Caldwell show that 6.0% or 607 of the total 10,150 families live below the poverty line. Families with 5 or more children have the highest poverty rate of 44.2%, comprising of 99 families. On the other hand, families with no children have the lowest poverty rate of 3.0%, which includes 126 families.
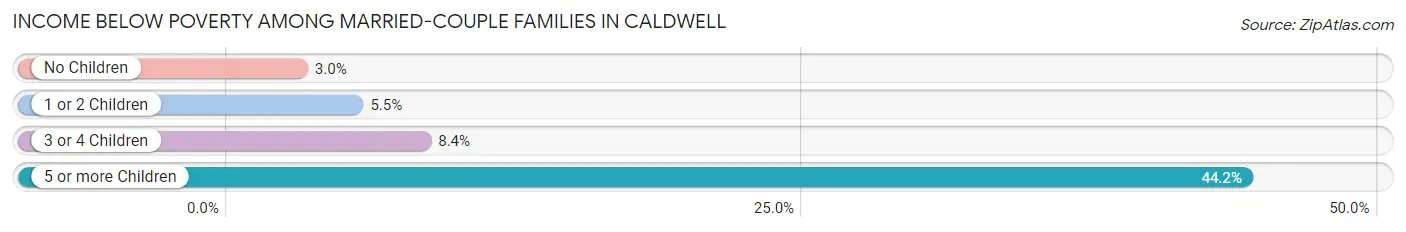
| Children | Above Poverty | Below Poverty |
| No Children | 4,013 (97.0%) | 126 (3.0%) |
| 1 or 2 Children | 3,357 (94.5%) | 194 (5.5%) |
| 3 or 4 Children | 2,048 (91.6%) | 188 (8.4%) |
| 5 or more Children | 125 (55.8%) | 99 (44.2%) |
| Total | 9,543 (94.0%) | 607 (6.0%) |
Income Below Poverty Among Single-Parent Households in Caldwell
According to the poverty data in Caldwell, 16.1% or 201 single-father households and 21.8% or 567 single-mother households are living below the poverty line. Among single-father households, those with 3 or 4 children have the highest poverty rate, with 28 households (20.6%) experiencing poverty. Likewise, among single-mother households, those with 3 or 4 children have the highest poverty rate, with 157 households (33.8%) falling below the poverty line.
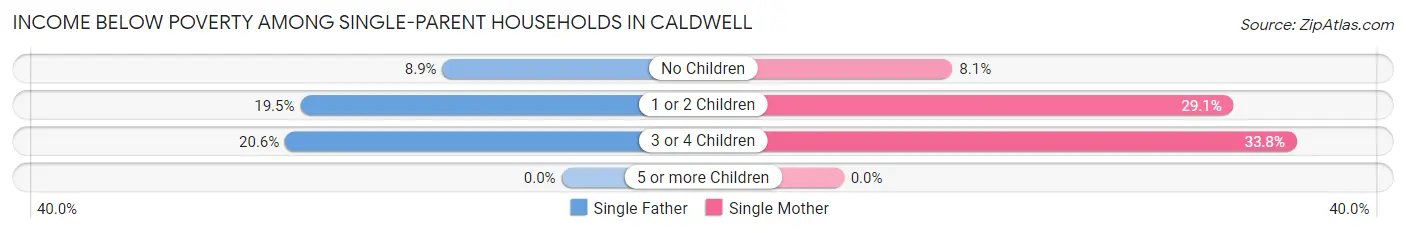
| Children | Single Father | Single Mother |
| No Children | 36 (8.9%) | 80 (8.1%) |
| 1 or 2 Children | 137 (19.5%) | 330 (29.0%) |
| 3 or 4 Children | 28 (20.6%) | 157 (33.8%) |
| 5 or more Children | 0 (0.0%) | 0 (0.0%) |
| Total | 201 (16.1%) | 567 (21.8%) |
Income Below Poverty Among Married-Couple vs Single-Parent Households in Caldwell
The poverty data for Caldwell shows that 607 of the married-couple family households (6.0%) and 768 of the single-parent households (20.0%) are living below the poverty level. Within the married-couple family households, those with 5 or more children have the highest poverty rate, with 99 households (44.2%) falling below the poverty line. Among the single-parent households, those with 3 or 4 children have the highest poverty rate, with 185 household (30.8%) living below poverty.
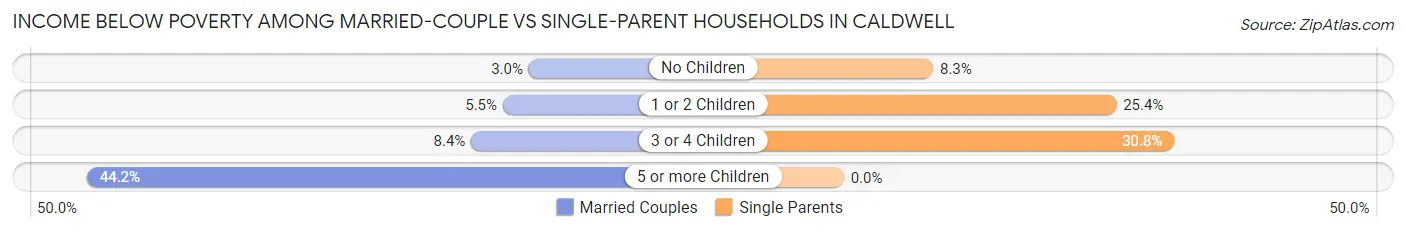
| Children | Married-Couple Families | Single-Parent Households |
| No Children | 126 (3.0%) | 116 (8.3%) |
| 1 or 2 Children | 194 (5.5%) | 467 (25.4%) |
| 3 or 4 Children | 188 (8.4%) | 185 (30.8%) |
| 5 or more Children | 99 (44.2%) | 0 (0.0%) |
| Total | 607 (6.0%) | 768 (20.0%) |
Race in Caldwell
The most populous races in Caldwell are White / Caucasian (40,868 | 66.8%), Hispanic or Latino (23,205 | 37.9%), and Some other Race (11,421 | 18.7%).
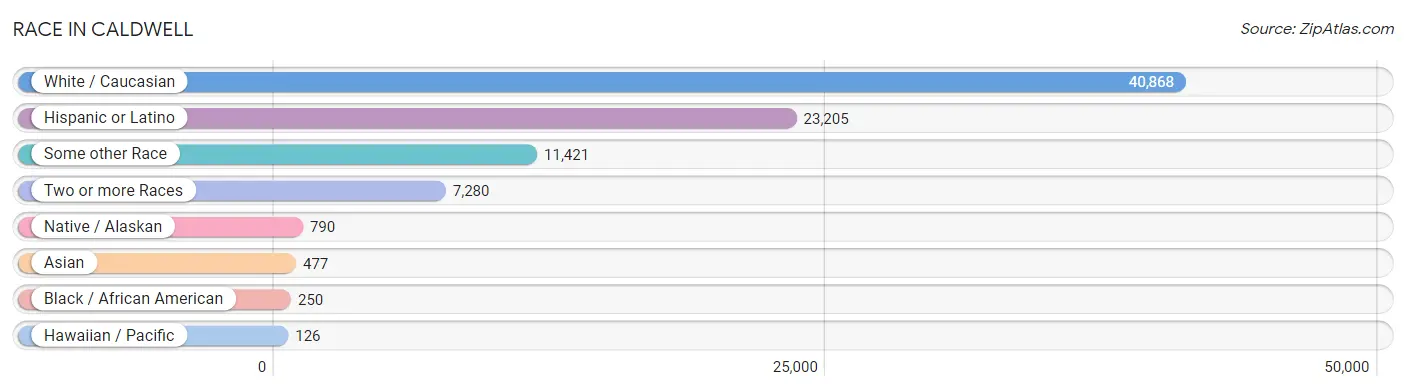
| Race | # Population | % Population |
| Asian | 477 | 0.8% |
| Black / African American | 250 | 0.4% |
| Hawaiian / Pacific | 126 | 0.2% |
| Hispanic or Latino | 23,205 | 37.9% |
| Native / Alaskan | 790 | 1.3% |
| White / Caucasian | 40,868 | 66.8% |
| Two or more Races | 7,280 | 11.9% |
| Some other Race | 11,421 | 18.7% |
| Total | 61,212 | 100.0% |
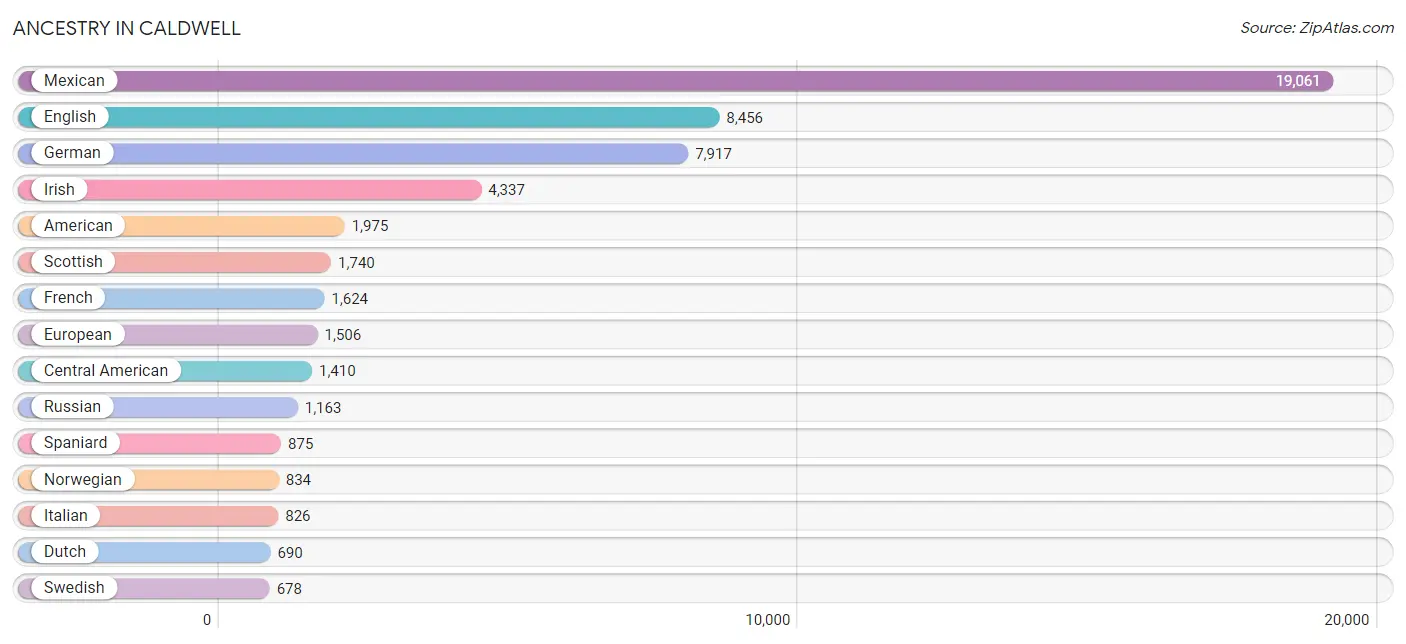
Ancestry in Caldwell
The most populous ancestries reported in Caldwell are Mexican (19,061 | 31.1%), English (8,456 | 13.8%), German (7,917 | 12.9%), Irish (4,337 | 7.1%), and American (1,975 | 3.2%), together accounting for 68.2% of all Caldwell residents.
| Ancestry | # Population | % Population |
| African | 123 | 0.2% |
| Alaska Native | 1 | 0.0% |
| Aleut | 4 | 0.0% |
| American | 1,975 | 3.2% |
| Apache | 334 | 0.5% |
| Arab | 98 | 0.2% |
| Armenian | 10 | 0.0% |
| Australian | 184 | 0.3% |
| Austrian | 23 | 0.0% |
| Basque | 62 | 0.1% |
| Bhutanese | 85 | 0.1% |
| Blackfeet | 112 | 0.2% |
| Brazilian | 28 | 0.1% |
| British | 383 | 0.6% |
| Bulgarian | 48 | 0.1% |
| Burmese | 315 | 0.5% |
| Canadian | 118 | 0.2% |
| Celtic | 17 | 0.0% |
| Central American | 1,410 | 2.3% |
| Cherokee | 238 | 0.4% |
| Chickasaw | 11 | 0.0% |
| Choctaw | 188 | 0.3% |
| Colombian | 88 | 0.1% |
| Creek | 6 | 0.0% |
| Croatian | 10 | 0.0% |
| Crow | 6 | 0.0% |
| Cuban | 6 | 0.0% |
| Czech | 150 | 0.3% |
| Danish | 454 | 0.7% |
| Dominican | 4 | 0.0% |
| Dutch | 690 | 1.1% |
| Eastern European | 115 | 0.2% |
| English | 8,456 | 13.8% |
| European | 1,506 | 2.5% |
| Finnish | 57 | 0.1% |
| French | 1,624 | 2.6% |
| French Canadian | 168 | 0.3% |
| German | 7,917 | 12.9% |
| Greek | 120 | 0.2% |
| Guatemalan | 457 | 0.7% |
| Hmong | 314 | 0.5% |
| Honduran | 200 | 0.3% |
| Hopi | 38 | 0.1% |
| Hungarian | 340 | 0.6% |
| Indian (Asian) | 345 | 0.6% |
| Iraqi | 33 | 0.1% |
| Irish | 4,337 | 7.1% |
| Iroquois | 29 | 0.1% |
| Italian | 826 | 1.3% |
| Korean | 602 | 1.0% |
| Latvian | 9 | 0.0% |
| Lebanese | 19 | 0.0% |
| Lithuanian | 56 | 0.1% |
| Mexican | 19,061 | 31.1% |
| Mexican American Indian | 255 | 0.4% |
| Native Hawaiian | 459 | 0.7% |
| Navajo | 63 | 0.1% |
| Nicaraguan | 198 | 0.3% |
| Northern European | 142 | 0.2% |
| Norwegian | 834 | 1.4% |
| Ottawa | 9 | 0.0% |
| Pakistani | 186 | 0.3% |
| Palestinian | 10 | 0.0% |
| Peruvian | 409 | 0.7% |
| Polish | 335 | 0.5% |
| Portuguese | 277 | 0.4% |
| Potawatomi | 33 | 0.1% |
| Puerto Rican | 193 | 0.3% |
| Romanian | 30 | 0.1% |
| Russian | 1,163 | 1.9% |
| Salvadoran | 555 | 0.9% |
| Samoan | 105 | 0.2% |
| Scandinavian | 246 | 0.4% |
| Scotch-Irish | 271 | 0.4% |
| Scottish | 1,740 | 2.8% |
| Sioux | 77 | 0.1% |
| South American | 497 | 0.8% |
| Spaniard | 875 | 1.4% |
| Spanish | 86 | 0.1% |
| Sri Lankan | 70 | 0.1% |
| Subsaharan African | 142 | 0.2% |
| Swedish | 678 | 1.1% |
| Swiss | 96 | 0.2% |
| Thai | 48 | 0.1% |
| Tongan | 23 | 0.0% |
| Turkish | 24 | 0.0% |
| Ugandan | 10 | 0.0% |
| Ukrainian | 81 | 0.1% |
| Welsh | 203 | 0.3% | View All 89 Rows |
Immigrants in Caldwell
The most numerous immigrant groups reported in Caldwell came from Latin America (6,414 | 10.5%), Central America (6,142 | 10.0%), Mexico (5,595 | 9.1%), Asia (472 | 0.8%), and Europe (343 | 0.6%), together accounting for 31.0% of all Caldwell residents.
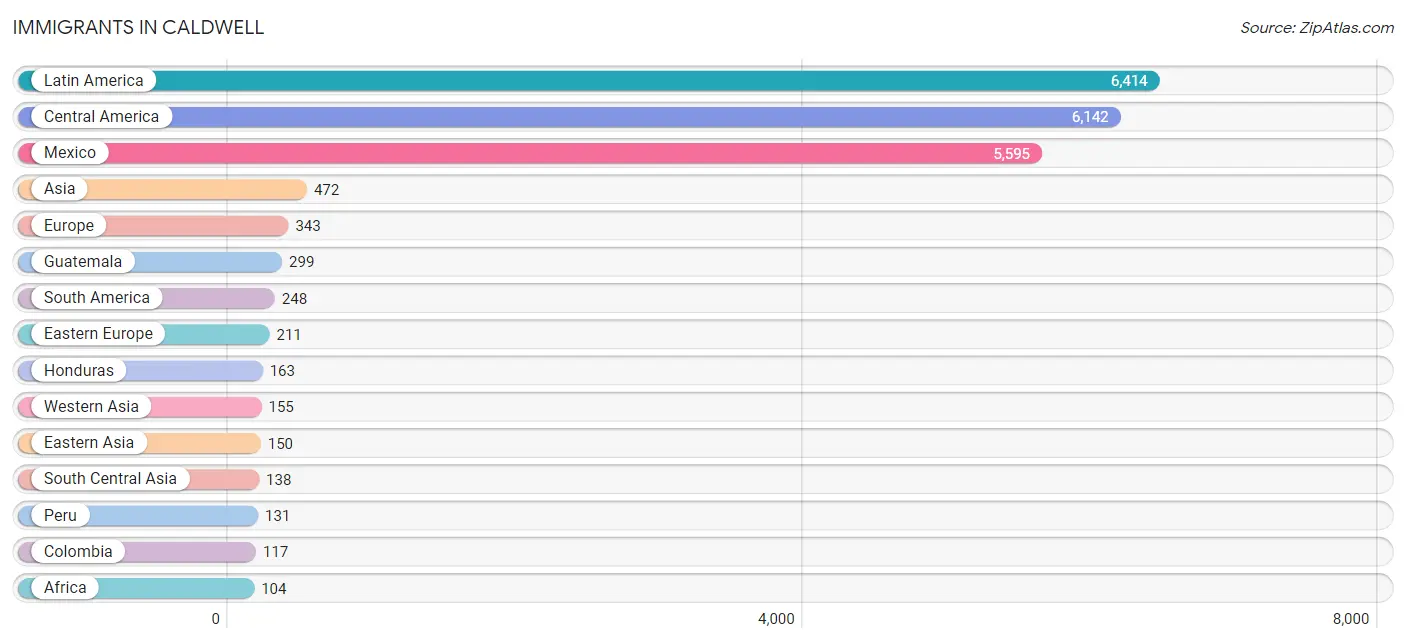
| Immigration Origin | # Population | % Population |
| Afghanistan | 90 | 0.2% |
| Africa | 104 | 0.2% |
| Armenia | 10 | 0.0% |
| Asia | 472 | 0.8% |
| Australia | 72 | 0.1% |
| Bulgaria | 72 | 0.1% |
| Canada | 42 | 0.1% |
| Caribbean | 24 | 0.0% |
| Central America | 6,142 | 10.0% |
| China | 68 | 0.1% |
| Colombia | 117 | 0.2% |
| Croatia | 10 | 0.0% |
| Cuba | 6 | 0.0% |
| Eastern Asia | 150 | 0.3% |
| Eastern Europe | 211 | 0.3% |
| El Salvador | 7 | 0.0% |
| England | 19 | 0.0% |
| Europe | 343 | 0.6% |
| France | 8 | 0.0% |
| Germany | 22 | 0.0% |
| Guatemala | 299 | 0.5% |
| Honduras | 163 | 0.3% |
| Hong Kong | 35 | 0.1% |
| India | 48 | 0.1% |
| Iraq | 49 | 0.1% |
| Korea | 82 | 0.1% |
| Latin America | 6,414 | 10.5% |
| Mexico | 5,595 | 9.1% |
| Netherlands | 19 | 0.0% |
| Nicaragua | 66 | 0.1% |
| Northern Africa | 71 | 0.1% |
| Northern Europe | 37 | 0.1% |
| Oceania | 99 | 0.2% |
| Peru | 131 | 0.2% |
| Poland | 8 | 0.0% |
| Romania | 26 | 0.0% |
| Russia | 43 | 0.1% |
| South America | 248 | 0.4% |
| South Central Asia | 138 | 0.2% |
| South Eastern Asia | 29 | 0.1% |
| Southern Europe | 12 | 0.0% |
| Spain | 12 | 0.0% |
| Sudan | 71 | 0.1% |
| Switzerland | 34 | 0.1% |
| Taiwan | 11 | 0.0% |
| Ukraine | 33 | 0.1% |
| Vietnam | 29 | 0.1% |
| West Indies | 18 | 0.0% |
| Western Asia | 155 | 0.3% |
| Western Europe | 83 | 0.1% | View All 50 Rows |
Sex and Age in Caldwell
Sex and Age in Caldwell
The most populous age groups in Caldwell are 10 to 14 Years (3,249 | 10.6%) for men and 5 to 9 Years (2,776 | 9.0%) for women.
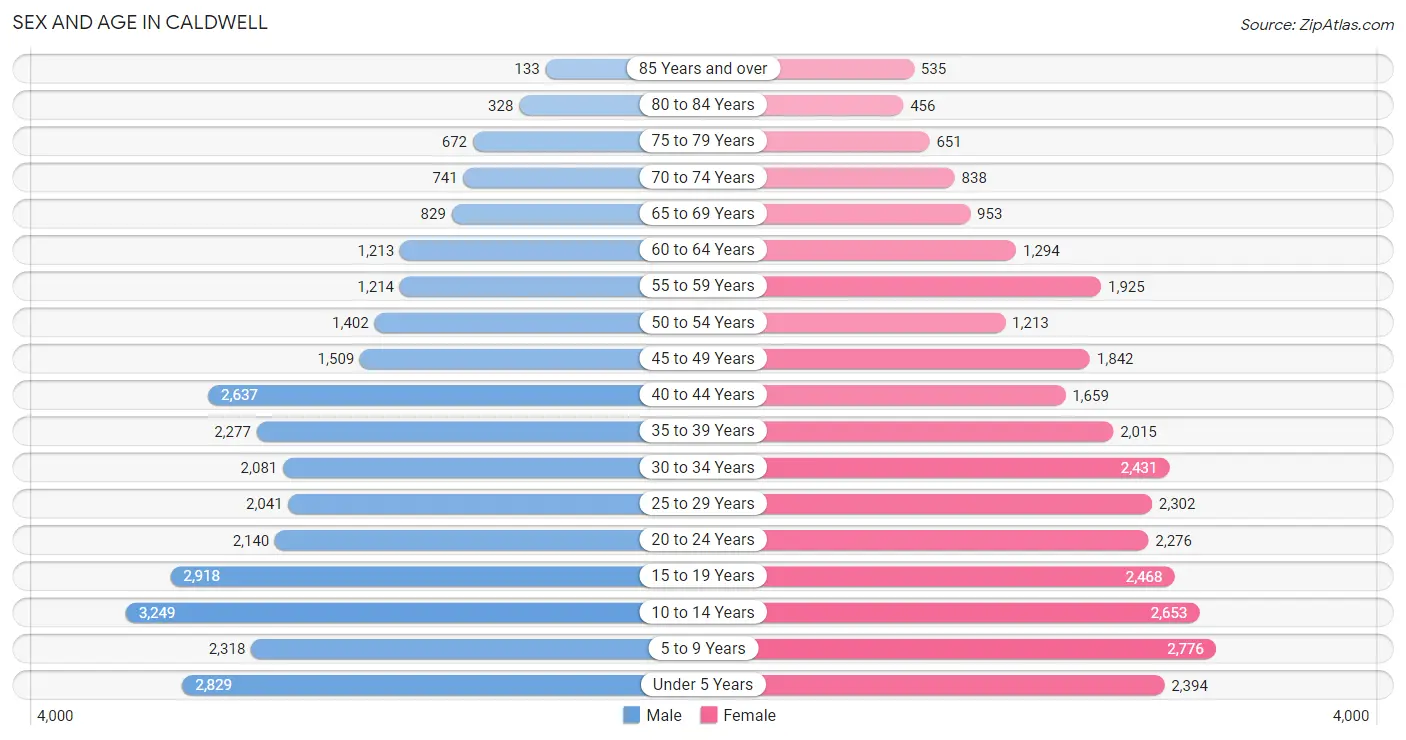
| Age Bracket | Male | Female |
| Under 5 Years | 2,829 (9.3%) | 2,394 (7.8%) |
| 5 to 9 Years | 2,318 (7.6%) | 2,776 (9.0%) |
| 10 to 14 Years | 3,249 (10.6%) | 2,653 (8.6%) |
| 15 to 19 Years | 2,918 (9.6%) | 2,468 (8.0%) |
| 20 to 24 Years | 2,140 (7.0%) | 2,276 (7.4%) |
| 25 to 29 Years | 2,041 (6.7%) | 2,302 (7.5%) |
| 30 to 34 Years | 2,081 (6.8%) | 2,431 (7.9%) |
| 35 to 39 Years | 2,277 (7.5%) | 2,015 (6.6%) |
| 40 to 44 Years | 2,637 (8.6%) | 1,659 (5.4%) |
| 45 to 49 Years | 1,509 (4.9%) | 1,842 (6.0%) |
| 50 to 54 Years | 1,402 (4.6%) | 1,213 (4.0%) |
| 55 to 59 Years | 1,214 (4.0%) | 1,925 (6.3%) |
| 60 to 64 Years | 1,213 (4.0%) | 1,294 (4.2%) |
| 65 to 69 Years | 829 (2.7%) | 953 (3.1%) |
| 70 to 74 Years | 741 (2.4%) | 838 (2.7%) |
| 75 to 79 Years | 672 (2.2%) | 651 (2.1%) |
| 80 to 84 Years | 328 (1.1%) | 456 (1.5%) |
| 85 Years and over | 133 (0.4%) | 535 (1.7%) |
| Total | 30,531 (100.0%) | 30,681 (100.0%) |
Families and Households in Caldwell
Median Family Size in Caldwell
The median family size in Caldwell is 3.61 persons per family, with married-couple families (10,150 | 72.5%) accounting for the largest median family size of 3.71 persons per family. On the other hand, single male/father families (1,246 | 8.9%) represent the smallest median family size with 3.02 persons per family.
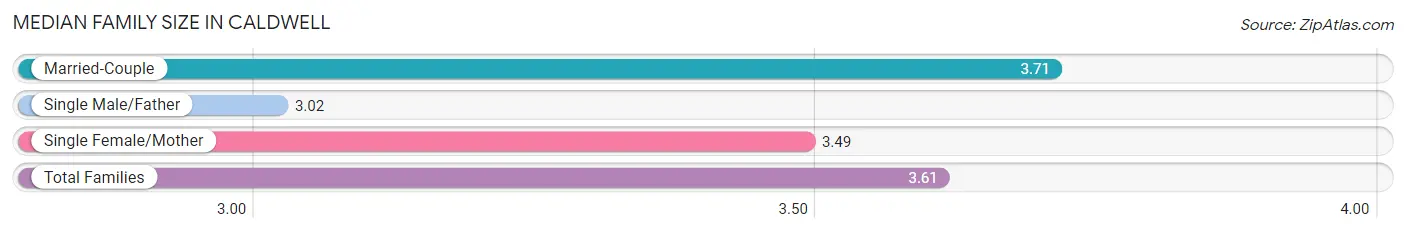
| Family Type | # Families | Family Size |
| Married-Couple | 10,150 (72.5%) | 3.71 |
| Single Male/Father | 1,246 (8.9%) | 3.02 |
| Single Female/Mother | 2,603 (18.6%) | 3.49 |
| Total Families | 13,999 (100.0%) | 3.61 |
Median Household Size in Caldwell
The median household size in Caldwell is 3.03 persons per household, with married-couple households (10,150 | 51.8%) accounting for the largest median household size of 3.74 persons per household. non-family households (5,590 | 28.5%) represent the smallest median household size with 1.29 persons per household.
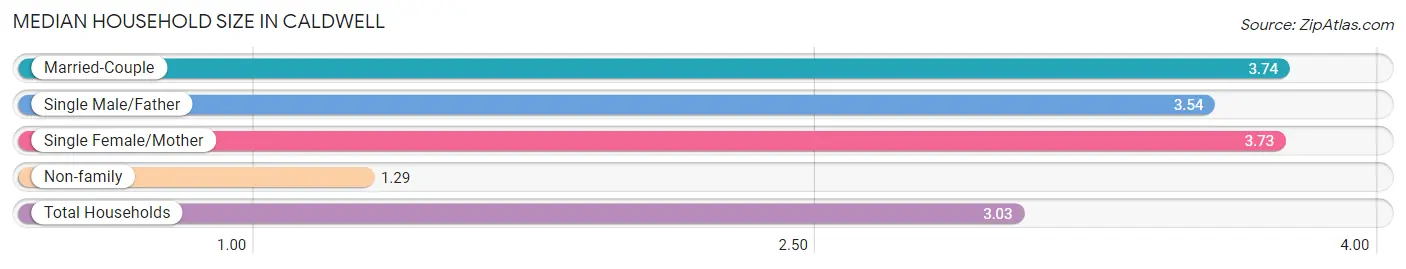
| Household Type | # Households | Household Size |
| Married-Couple | 10,150 (51.8%) | 3.74 |
| Single Male/Father | 1,246 (6.4%) | 3.54 |
| Single Female/Mother | 2,603 (13.3%) | 3.73 |
| Non-family | 5,590 (28.5%) | 1.29 |
| Total Households | 19,589 (100.0%) | 3.03 |
Household Size by Marriage Status in Caldwell
Out of a total of 19,589 households in Caldwell, 13,999 (71.5%) are family households, while 5,590 (28.5%) are nonfamily households. The most numerous type of family households are 2-person households, comprising 4,190, and the most common type of nonfamily households are 1-person households, comprising 4,245.
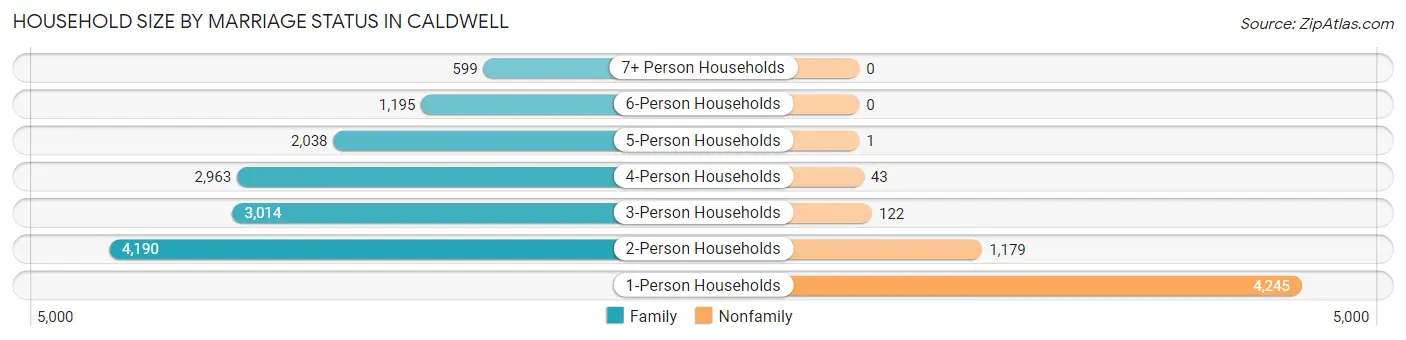
| Household Size | Family Households | Nonfamily Households |
| 1-Person Households | - | 4,245 (21.7%) |
| 2-Person Households | 4,190 (21.4%) | 1,179 (6.0%) |
| 3-Person Households | 3,014 (15.4%) | 122 (0.6%) |
| 4-Person Households | 2,963 (15.1%) | 43 (0.2%) |
| 5-Person Households | 2,038 (10.4%) | 1 (0.0%) |
| 6-Person Households | 1,195 (6.1%) | 0 (0.0%) |
| 7+ Person Households | 599 (3.1%) | 0 (0.0%) |
| Total | 13,999 (71.5%) | 5,590 (28.5%) |
Female Fertility in Caldwell
Fertility by Age in Caldwell
Average fertility rate in Caldwell is 64.0 births per 1,000 women. Women in the age bracket of 20 to 34 years have the highest fertility rate with 124.0 births per 1,000 women. Women in the age bracket of 20 to 34 years acount for 89.1% of all women with births.
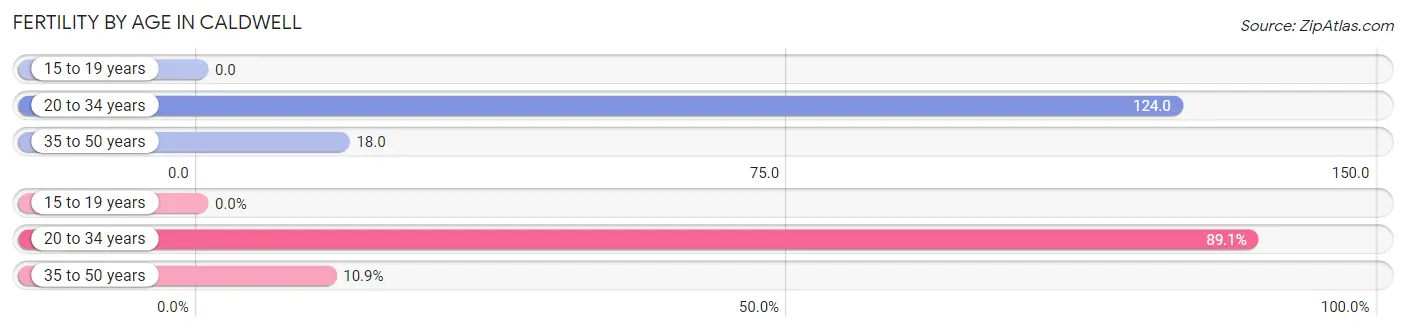
| Age Bracket | Women with Births | Births / 1,000 Women |
| 15 to 19 years | 0 (0.0%) | 0.0 |
| 20 to 34 years | 868 (89.1%) | 124.0 |
| 35 to 50 years | 106 (10.9%) | 18.0 |
| Total | 974 (100.0%) | 64.0 |
Fertility by Age by Marriage Status in Caldwell
80.4% of women with births (974) in Caldwell are married. The highest percentage of unmarried women with births falls into 20 to 34 years age bracket with 20.2% of them unmarried at the time of birth, while the lowest percentage of unmarried women with births belong to 35 to 50 years age bracket with 15.1% of them unmarried.
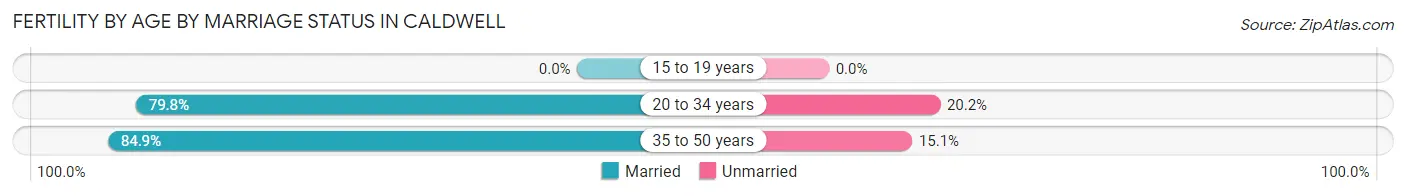
| Age Bracket | Married | Unmarried |
| 15 to 19 years | 0 (0.0%) | 0 (0.0%) |
| 20 to 34 years | 693 (79.8%) | 175 (20.2%) |
| 35 to 50 years | 90 (84.9%) | 16 (15.1%) |
| Total | 783 (80.4%) | 191 (19.6%) |
Fertility by Education in Caldwell
Average fertility rate in Caldwell is 64.0 births per 1,000 women. Women with the education attainment of graduate degree have the highest fertility rate of 162.0 births per 1,000 women, while women with the education attainment of less than high school have the lowest fertility at 45.0 births per 1,000 women. Women with the education attainment of bachelor's degree represent 30.5% of all women with births.
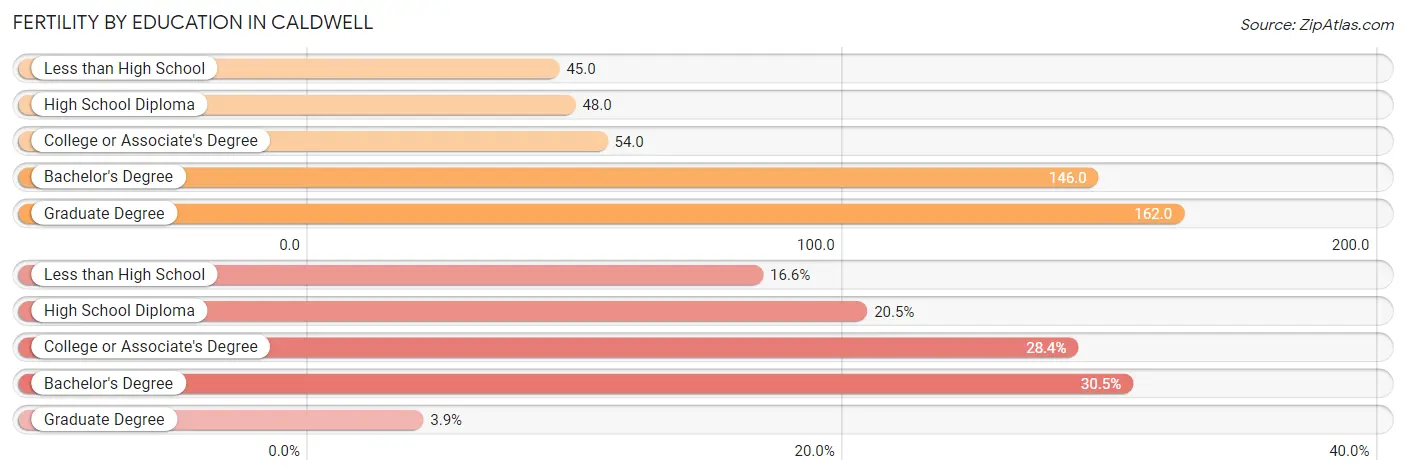
| Educational Attainment | Women with Births | Births / 1,000 Women |
| Less than High School | 162 (16.6%) | 45.0 |
| High School Diploma | 200 (20.5%) | 48.0 |
| College or Associate's Degree | 277 (28.4%) | 54.0 |
| Bachelor's Degree | 297 (30.5%) | 146.0 |
| Graduate Degree | 38 (3.9%) | 162.0 |
| Total | 974 (100.0%) | 64.0 |
Fertility by Education by Marriage Status in Caldwell
19.6% of women with births in Caldwell are unmarried. Women with the educational attainment of less than high school are most likely to be married with 100.0% of them married at childbirth, while women with the educational attainment of graduate degree are least likely to be married with 31.6% of them unmarried at childbirth.
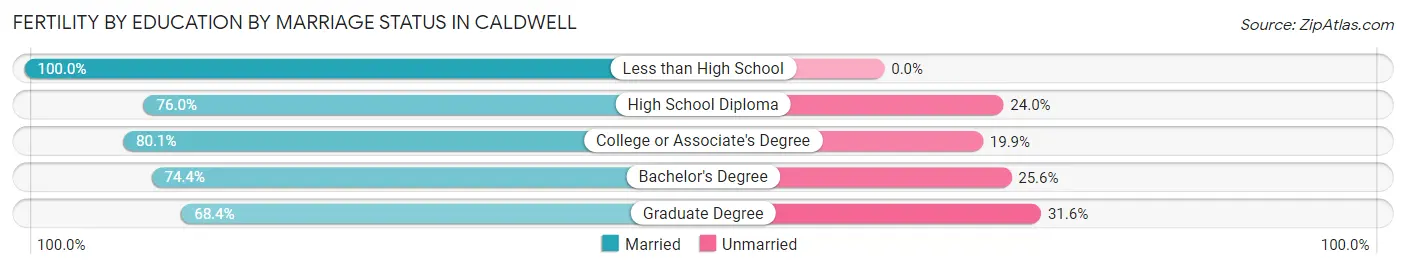
| Educational Attainment | Married | Unmarried |
| Less than High School | 162 (100.0%) | 0 (0.0%) |
| High School Diploma | 152 (76.0%) | 48 (24.0%) |
| College or Associate's Degree | 222 (80.1%) | 55 (19.9%) |
| Bachelor's Degree | 221 (74.4%) | 76 (25.6%) |
| Graduate Degree | 26 (68.4%) | 12 (31.6%) |
| Total | 783 (80.4%) | 191 (19.6%) |
Employment Characteristics in Caldwell
Employment by Class of Employer in Caldwell
Among the 25,949 employed individuals in Caldwell, private company employees (18,759 | 72.3%), not-for-profit organizations (2,258 | 8.7%), and local government employees (1,463 | 5.6%) make up the most common classes of employment.
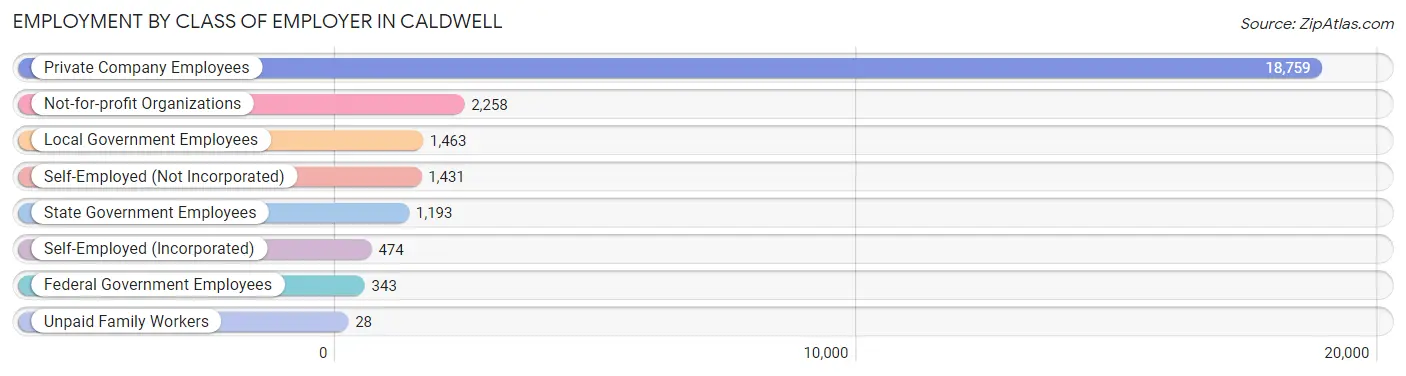
| Employer Class | # Employees | % Employees |
| Private Company Employees | 18,759 | 72.3% |
| Self-Employed (Incorporated) | 474 | 1.8% |
| Self-Employed (Not Incorporated) | 1,431 | 5.5% |
| Not-for-profit Organizations | 2,258 | 8.7% |
| Local Government Employees | 1,463 | 5.6% |
| State Government Employees | 1,193 | 4.6% |
| Federal Government Employees | 343 | 1.3% |
| Unpaid Family Workers | 28 | 0.1% |
| Total | 25,949 | 100.0% |
Employment Status by Age in Caldwell
According to the labor force statistics for Caldwell, out of the total population over 16 years of age (43,884), 63.9% or 28,042 individuals are in the labor force, with 5.1% or 1,430 of them unemployed. The age group with the highest labor force participation rate is 25 to 29 years, with 82.8% or 3,596 individuals in the labor force. Within the labor force, the 75 years and over age range has the highest percentage of unemployed individuals, with 35.6% or 21 of them being unemployed.
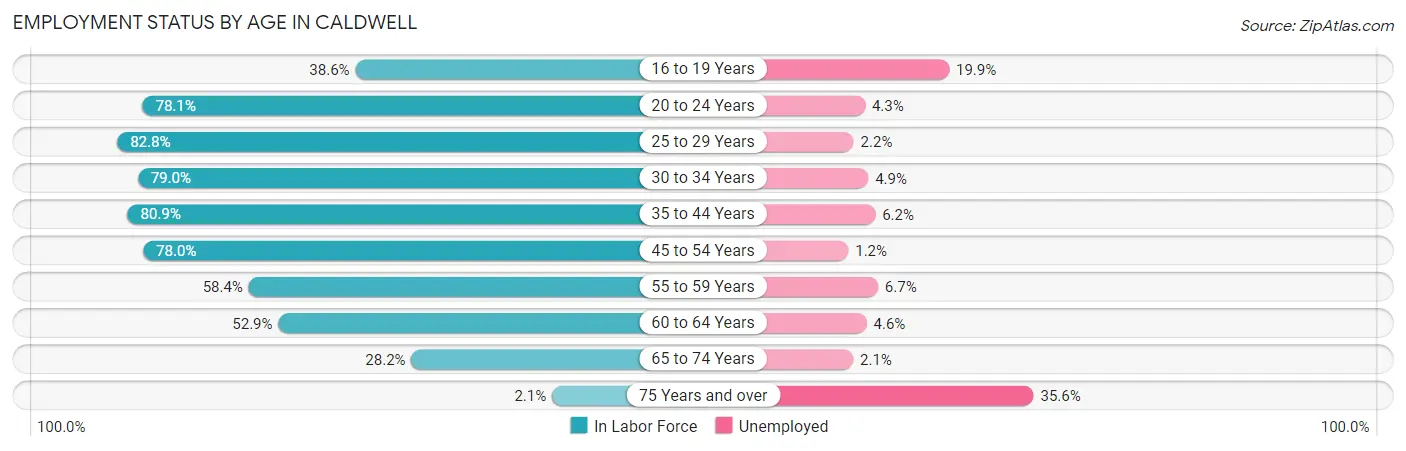
| Age Bracket | In Labor Force | Unemployed |
| 16 to 19 Years | 1,651 (38.6%) | 329 (19.9%) |
| 20 to 24 Years | 3,449 (78.1%) | 148 (4.3%) |
| 25 to 29 Years | 3,596 (82.8%) | 79 (2.2%) |
| 30 to 34 Years | 3,564 (79.0%) | 175 (4.9%) |
| 35 to 44 Years | 6,948 (80.9%) | 431 (6.2%) |
| 45 to 54 Years | 4,653 (78.0%) | 56 (1.2%) |
| 55 to 59 Years | 1,833 (58.4%) | 123 (6.7%) |
| 60 to 64 Years | 1,326 (52.9%) | 61 (4.6%) |
| 65 to 74 Years | 948 (28.2%) | 20 (2.1%) |
| 75 Years and over | 58 (2.1%) | 21 (35.6%) |
| Total | 28,042 (63.9%) | 1,430 (5.1%) |
Employment Status by Educational Attainment in Caldwell
According to labor force statistics for Caldwell, 75.5% of individuals (21,937) out of the total population between 25 and 64 years of age (29,055) are in the labor force, with 4.2% or 921 of them being unemployed. The group with the highest labor force participation rate are those with the educational attainment of bachelor's degree or higher, with 85.3% or 4,335 individuals in the labor force. Within the labor force, individuals with bachelor's degree or higher education have the highest percentage of unemployment, with 5.7% or 247 of them being unemployed.
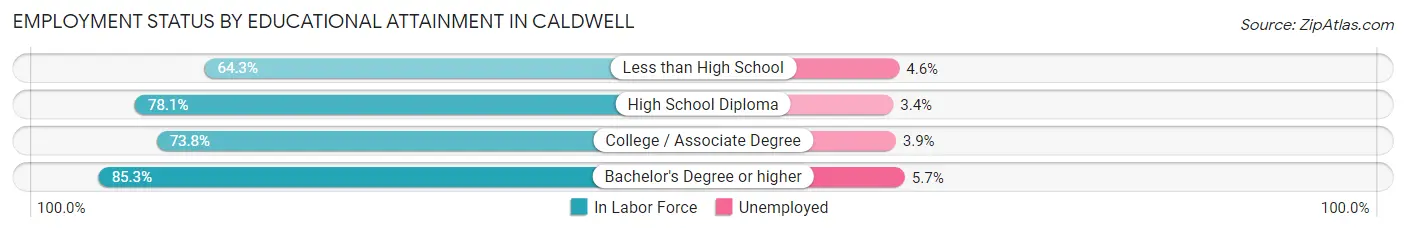
| Educational Attainment | In Labor Force | Unemployed |
| Less than High School | 3,294 (64.3%) | 236 (4.6%) |
| High School Diploma | 7,044 (78.1%) | 307 (3.4%) |
| College / Associate Degree | 7,255 (73.8%) | 383 (3.9%) |
| Bachelor's Degree or higher | 4,335 (85.3%) | 290 (5.7%) |
| Total | 21,937 (75.5%) | 1,220 (4.2%) |
Employment Occupations by Sex in Caldwell
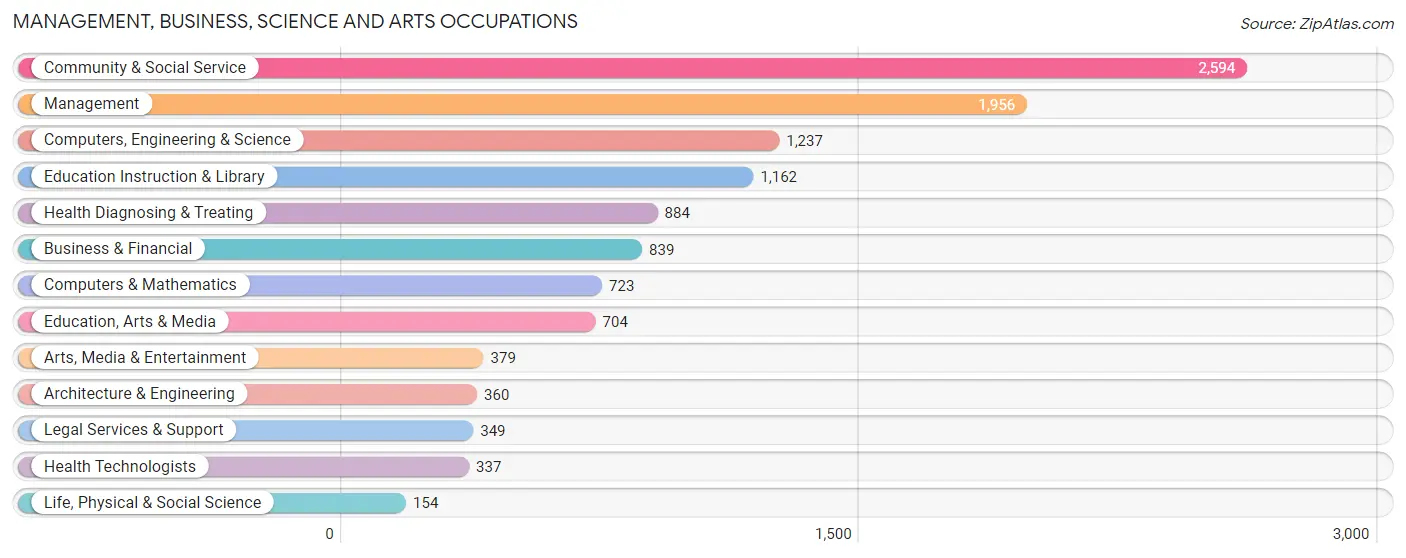
Management, Business, Science and Arts Occupations
The most common Management, Business, Science and Arts occupations in Caldwell are Community & Social Service (2,594 | 9.8%), Management (1,956 | 7.4%), Computers, Engineering & Science (1,237 | 4.7%), Education Instruction & Library (1,162 | 4.4%), and Health Diagnosing & Treating (884 | 3.3%).
Management, Business, Science and Arts Occupations by Sex
Within the Management, Business, Science and Arts occupations in Caldwell, the most male-oriented occupations are Architecture & Engineering (98.1%), Computers, Engineering & Science (72.5%), and Computers & Mathematics (69.0%), while the most female-oriented occupations are Health Diagnosing & Treating (86.2%), Education Instruction & Library (84.3%), and Health Technologists (82.8%).
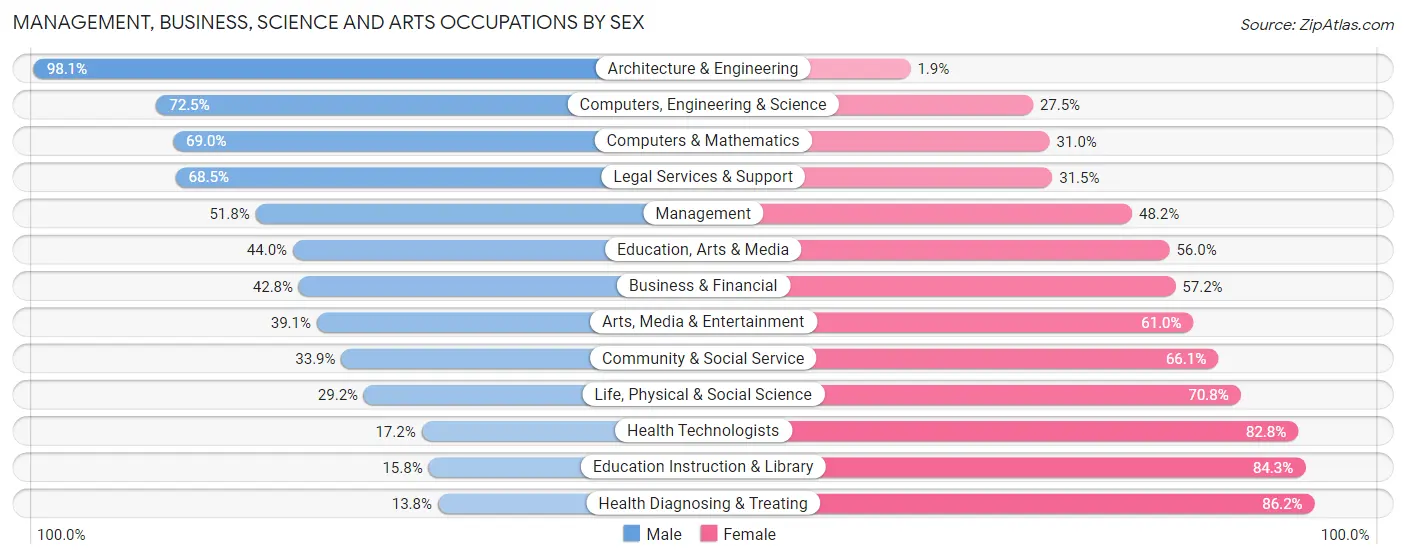
| Occupation | Male | Female |
| Management | 1,014 (51.8%) | 942 (48.2%) |
| Business & Financial | 359 (42.8%) | 480 (57.2%) |
| Computers, Engineering & Science | 897 (72.5%) | 340 (27.5%) |
| Computers & Mathematics | 499 (69.0%) | 224 (31.0%) |
| Architecture & Engineering | 353 (98.1%) | 7 (1.9%) |
| Life, Physical & Social Science | 45 (29.2%) | 109 (70.8%) |
| Community & Social Service | 880 (33.9%) | 1,714 (66.1%) |
| Education, Arts & Media | 310 (44.0%) | 394 (56.0%) |
| Legal Services & Support | 239 (68.5%) | 110 (31.5%) |
| Education Instruction & Library | 183 (15.8%) | 979 (84.3%) |
| Arts, Media & Entertainment | 148 (39.1%) | 231 (61.0%) |
| Health Diagnosing & Treating | 122 (13.8%) | 762 (86.2%) |
| Health Technologists | 58 (17.2%) | 279 (82.8%) |
| Total (Category) | 3,272 (43.6%) | 4,238 (56.4%) |
| Total (Overall) | 14,040 (52.8%) | 12,532 (47.2%) |
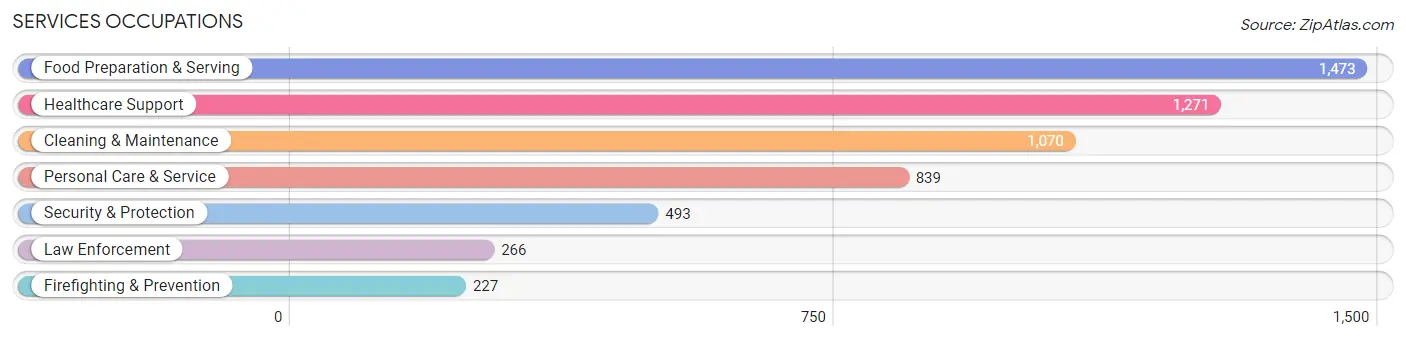
Services Occupations
The most common Services occupations in Caldwell are Food Preparation & Serving (1,473 | 5.5%), Healthcare Support (1,271 | 4.8%), Cleaning & Maintenance (1,070 | 4.0%), Personal Care & Service (839 | 3.2%), and Security & Protection (493 | 1.9%).
Services Occupations by Sex
Within the Services occupations in Caldwell, the most male-oriented occupations are Law Enforcement (94.4%), Security & Protection (81.7%), and Cleaning & Maintenance (76.7%), while the most female-oriented occupations are Personal Care & Service (100.0%), Healthcare Support (83.6%), and Food Preparation & Serving (62.4%).
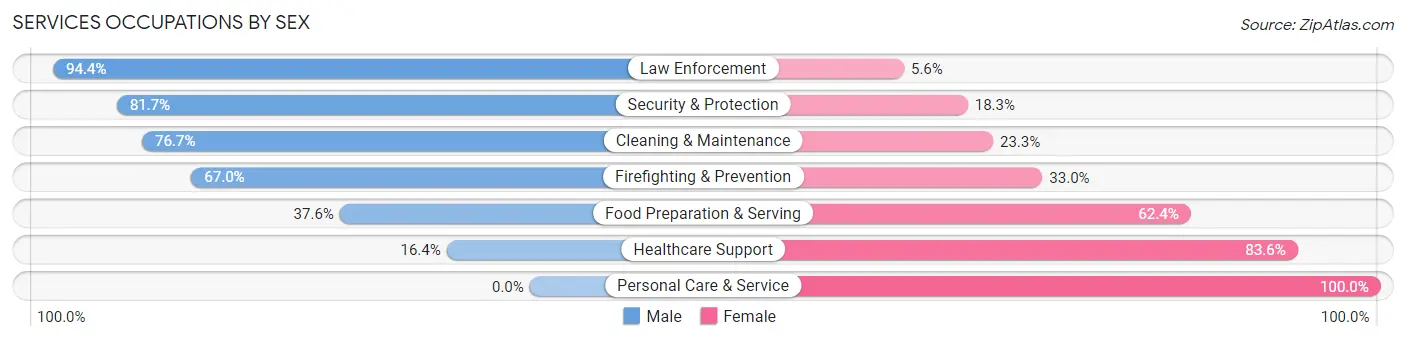
| Occupation | Male | Female |
| Healthcare Support | 209 (16.4%) | 1,062 (83.6%) |
| Security & Protection | 403 (81.7%) | 90 (18.3%) |
| Firefighting & Prevention | 152 (67.0%) | 75 (33.0%) |
| Law Enforcement | 251 (94.4%) | 15 (5.6%) |
| Food Preparation & Serving | 554 (37.6%) | 919 (62.4%) |
| Cleaning & Maintenance | 821 (76.7%) | 249 (23.3%) |
| Personal Care & Service | 0 (0.0%) | 839 (100.0%) |
| Total (Category) | 1,987 (38.6%) | 3,159 (61.4%) |
| Total (Overall) | 14,040 (52.8%) | 12,532 (47.2%) |
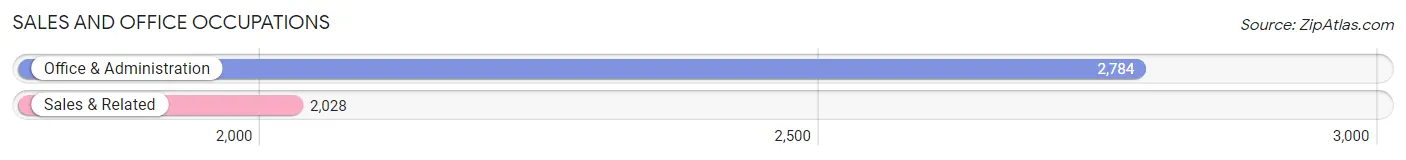
Sales and Office Occupations
The most common Sales and Office occupations in Caldwell are Office & Administration (2,784 | 10.5%), and Sales & Related (2,028 | 7.6%).
Sales and Office Occupations by Sex
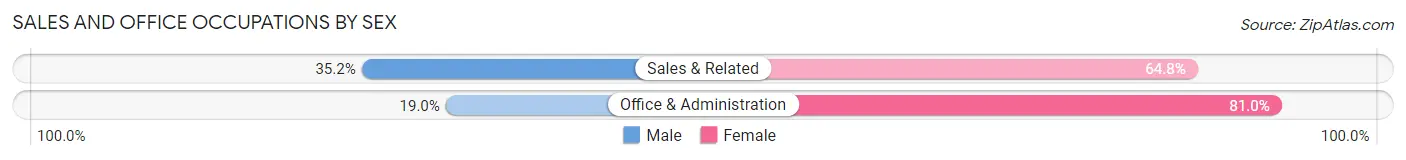
| Occupation | Male | Female |
| Sales & Related | 714 (35.2%) | 1,314 (64.8%) |
| Office & Administration | 530 (19.0%) | 2,254 (81.0%) |
| Total (Category) | 1,244 (25.9%) | 3,568 (74.2%) |
| Total (Overall) | 14,040 (52.8%) | 12,532 (47.2%) |
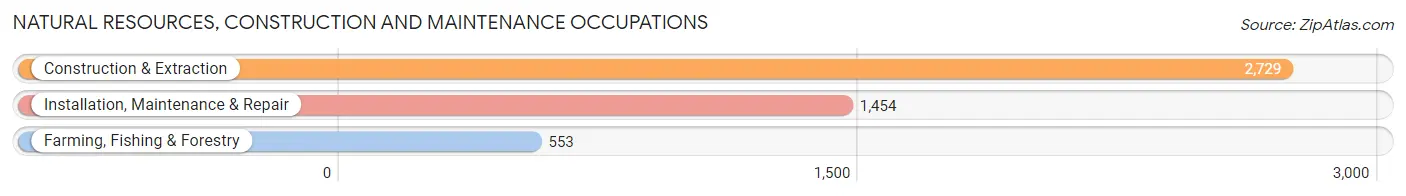
Natural Resources, Construction and Maintenance Occupations
The most common Natural Resources, Construction and Maintenance occupations in Caldwell are Construction & Extraction (2,729 | 10.3%), Installation, Maintenance & Repair (1,454 | 5.5%), and Farming, Fishing & Forestry (553 | 2.1%).
Natural Resources, Construction and Maintenance Occupations by Sex
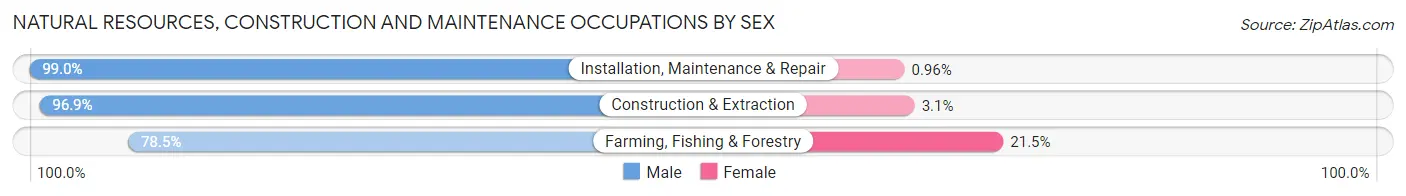
| Occupation | Male | Female |
| Farming, Fishing & Forestry | 434 (78.5%) | 119 (21.5%) |
| Construction & Extraction | 2,645 (96.9%) | 84 (3.1%) |
| Installation, Maintenance & Repair | 1,440 (99.0%) | 14 (1.0%) |
| Total (Category) | 4,519 (95.4%) | 217 (4.6%) |
| Total (Overall) | 14,040 (52.8%) | 12,532 (47.2%) |
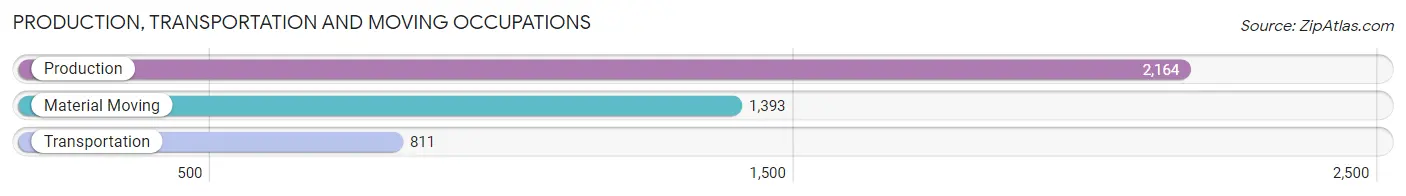
Production, Transportation and Moving Occupations
The most common Production, Transportation and Moving occupations in Caldwell are Production (2,164 | 8.1%), Material Moving (1,393 | 5.2%), and Transportation (811 | 3.0%).
Production, Transportation and Moving Occupations by Sex
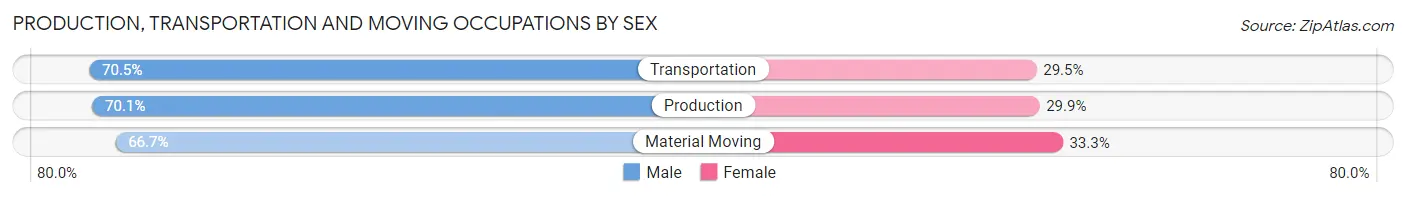
| Occupation | Male | Female |
| Production | 1,517 (70.1%) | 647 (29.9%) |
| Transportation | 572 (70.5%) | 239 (29.5%) |
| Material Moving | 929 (66.7%) | 464 (33.3%) |
| Total (Category) | 3,018 (69.1%) | 1,350 (30.9%) |
| Total (Overall) | 14,040 (52.8%) | 12,532 (47.2%) |
Employment Industries by Sex in Caldwell
Employment Industries in Caldwell
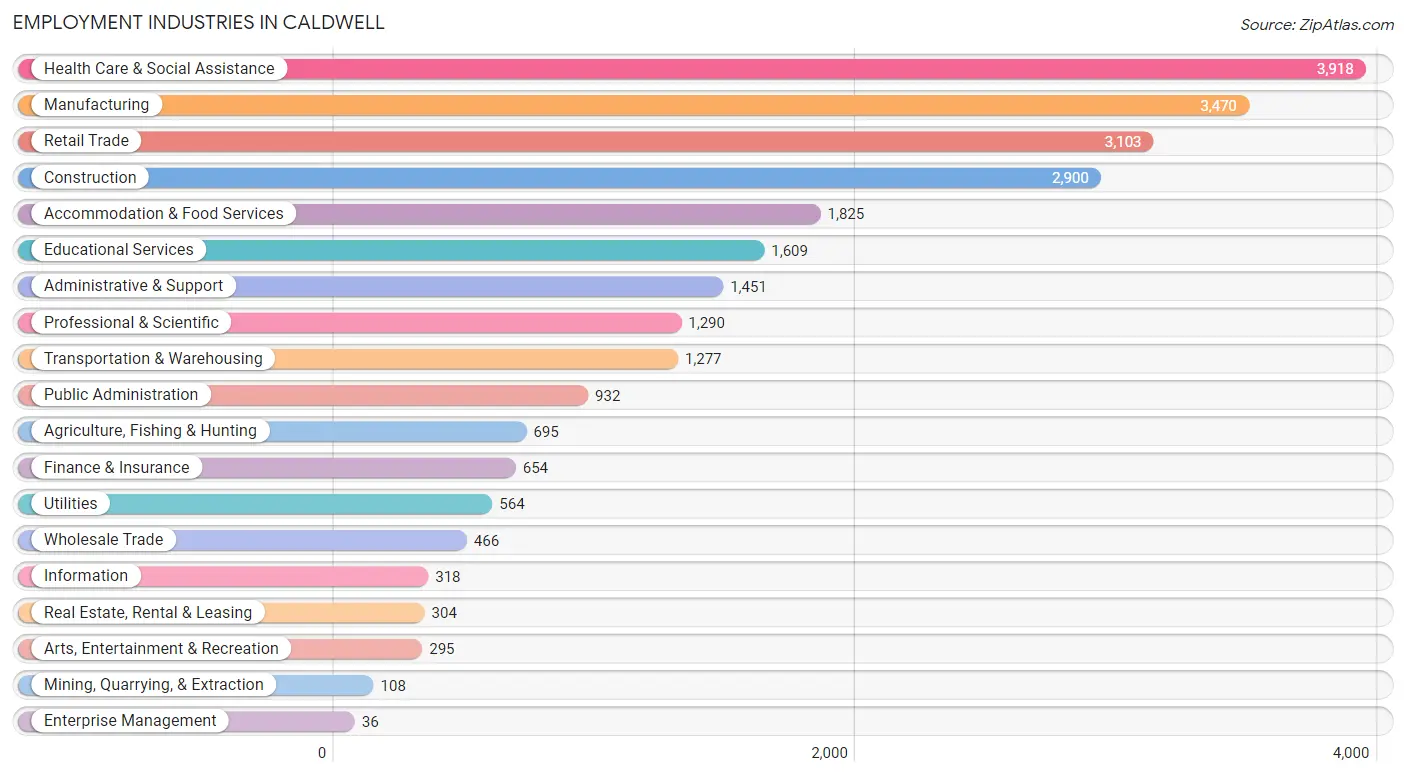
The major employment industries in Caldwell include Health Care & Social Assistance (3,918 | 14.7%), Manufacturing (3,470 | 13.1%), Retail Trade (3,103 | 11.7%), Construction (2,900 | 10.9%), and Accommodation & Food Services (1,825 | 6.9%).
Employment Industries by Sex in Caldwell
The Caldwell industries that see more men than women are Utilities (97.0%), Construction (91.7%), and Mining, Quarrying, & Extraction (88.0%), whereas the industries that tend to have a higher number of women are Enterprise Management (100.0%), Finance & Insurance (95.4%), and Arts, Entertainment & Recreation (79.3%).
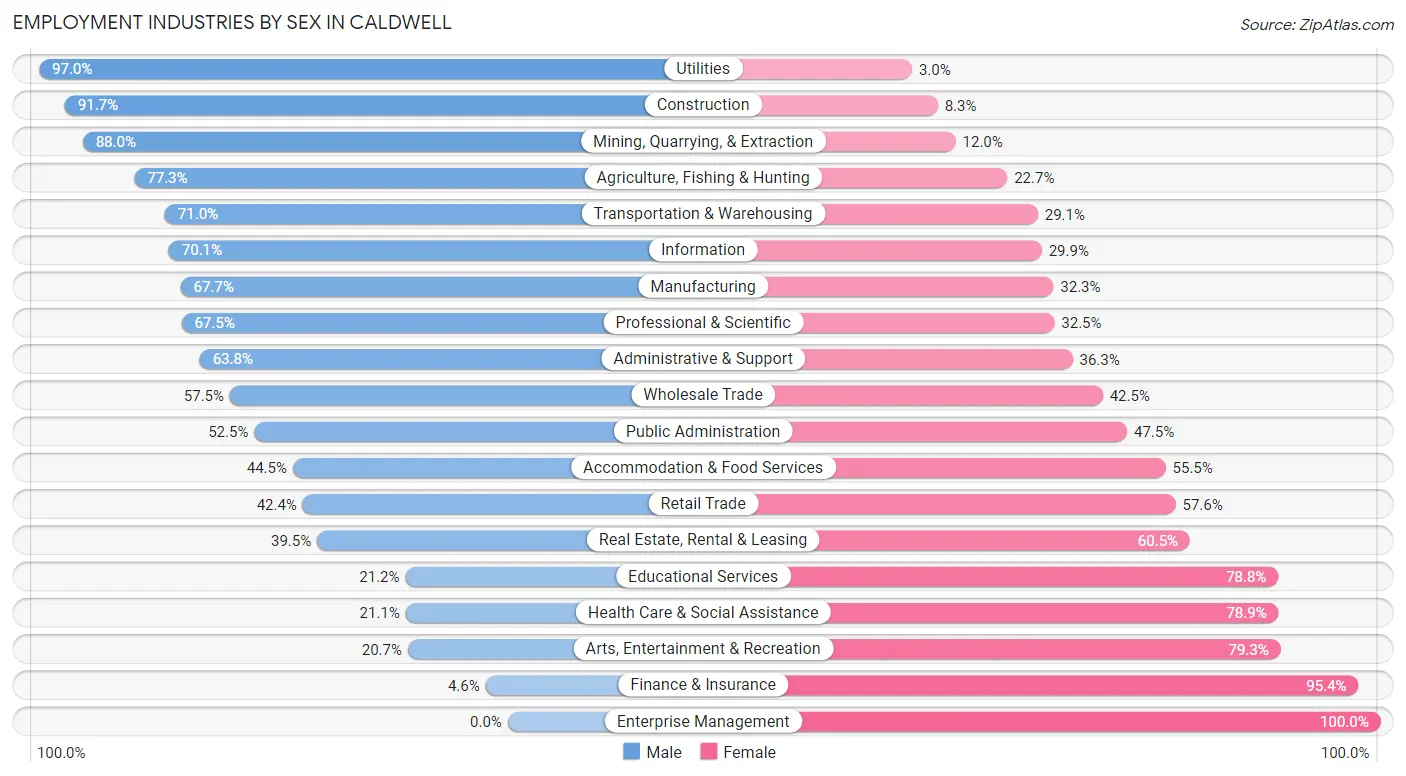
| Industry | Male | Female |
| Agriculture, Fishing & Hunting | 537 (77.3%) | 158 (22.7%) |
| Mining, Quarrying, & Extraction | 95 (88.0%) | 13 (12.0%) |
| Construction | 2,658 (91.7%) | 242 (8.3%) |
| Manufacturing | 2,350 (67.7%) | 1,120 (32.3%) |
| Wholesale Trade | 268 (57.5%) | 198 (42.5%) |
| Retail Trade | 1,317 (42.4%) | 1,786 (57.6%) |
| Transportation & Warehousing | 906 (71.0%) | 371 (29.0%) |
| Utilities | 547 (97.0%) | 17 (3.0%) |
| Information | 223 (70.1%) | 95 (29.9%) |
| Finance & Insurance | 30 (4.6%) | 624 (95.4%) |
| Real Estate, Rental & Leasing | 120 (39.5%) | 184 (60.5%) |
| Professional & Scientific | 871 (67.5%) | 419 (32.5%) |
| Enterprise Management | 0 (0.0%) | 36 (100.0%) |
| Administrative & Support | 925 (63.7%) | 526 (36.2%) |
| Educational Services | 341 (21.2%) | 1,268 (78.8%) |
| Health Care & Social Assistance | 828 (21.1%) | 3,090 (78.9%) |
| Arts, Entertainment & Recreation | 61 (20.7%) | 234 (79.3%) |
| Accommodation & Food Services | 812 (44.5%) | 1,013 (55.5%) |
| Public Administration | 489 (52.5%) | 443 (47.5%) |
| Total | 14,040 (52.8%) | 12,532 (47.2%) |
Education in Caldwell
School Enrollment in Caldwell
The most common levels of schooling among the 18,799 students in Caldwell are middle school (4,681 | 24.9%), high school (4,431 | 23.6%), and elementary school (3,875 | 20.6%).
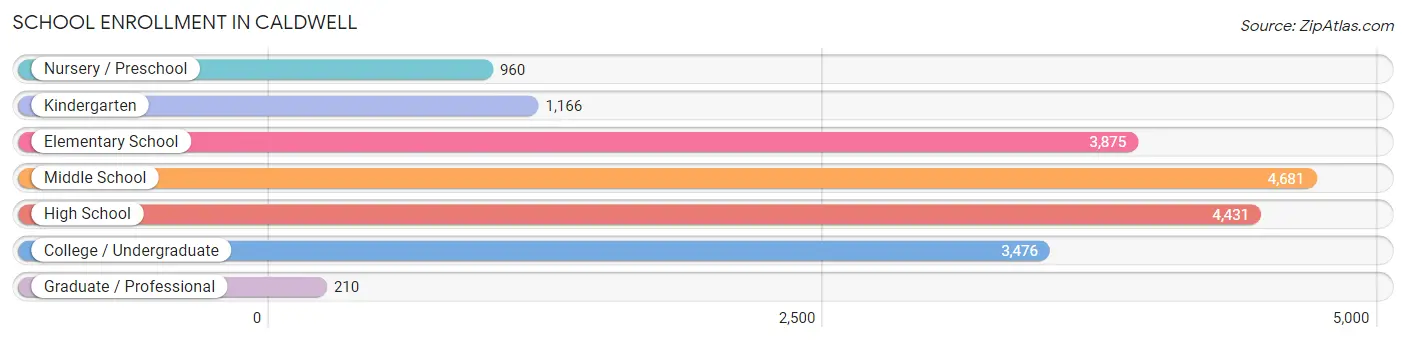
| School Level | # Students | % Students |
| Nursery / Preschool | 960 | 5.1% |
| Kindergarten | 1,166 | 6.2% |
| Elementary School | 3,875 | 20.6% |
| Middle School | 4,681 | 24.9% |
| High School | 4,431 | 23.6% |
| College / Undergraduate | 3,476 | 18.5% |
| Graduate / Professional | 210 | 1.1% |
| Total | 18,799 | 100.0% |
School Enrollment by Age by Funding Source in Caldwell
Out of a total of 18,799 students who are enrolled in schools in Caldwell, 3,083 (16.4%) attend a private institution, while the remaining 15,716 (83.6%) are enrolled in public schools. The age group of 3 to 4 year olds has the highest likelihood of being enrolled in private schools, with 446 (54.1% in the age bracket) enrolled. Conversely, the age group of 10 to 14 year olds has the lowest likelihood of being enrolled in a private school, with 5,421 (94.5% in the age bracket) attending a public institution.
| Age Bracket | Public School | Private School |
| 3 to 4 Year Olds | 379 (45.9%) | 446 (54.1%) |
| 5 to 9 Year Old | 4,171 (87.8%) | 581 (12.2%) |
| 10 to 14 Year Olds | 5,421 (94.5%) | 316 (5.5%) |
| 15 to 17 Year Olds | 2,913 (91.2%) | 281 (8.8%) |
| 18 to 19 Year Olds | 857 (58.6%) | 606 (41.4%) |
| 20 to 24 Year Olds | 753 (54.6%) | 627 (45.4%) |
| 25 to 34 Year Olds | 748 (93.6%) | 51 (6.4%) |
| 35 Years and over | 481 (74.1%) | 168 (25.9%) |
| Total | 15,716 (83.6%) | 3,083 (16.4%) |
Educational Attainment by Field of Study in Caldwell
Business (1,397 | 21.2%), science & technology (1,075 | 16.3%), education (796 | 12.1%), arts & humanities (668 | 10.2%), and social sciences (482 | 7.3%) are the most common fields of study among 6,577 individuals in Caldwell who have obtained a bachelor's degree or higher.
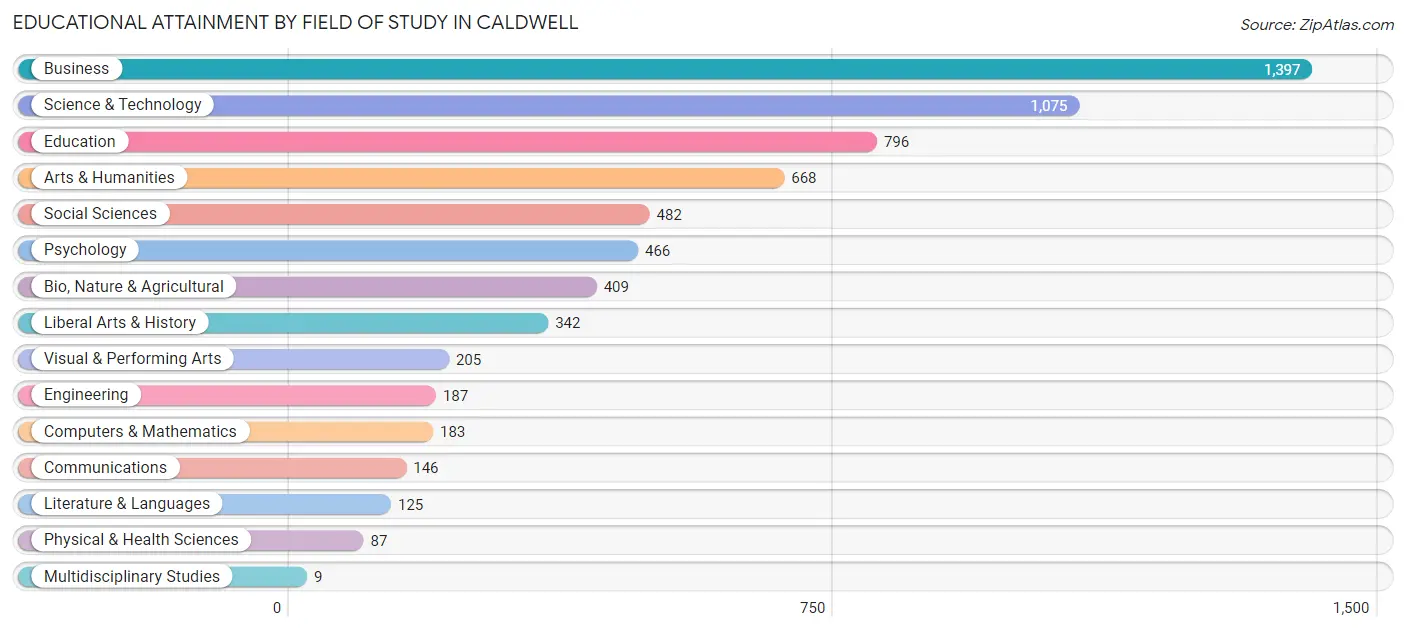
| Field of Study | # Graduates | % Graduates |
| Computers & Mathematics | 183 | 2.8% |
| Bio, Nature & Agricultural | 409 | 6.2% |
| Physical & Health Sciences | 87 | 1.3% |
| Psychology | 466 | 7.1% |
| Social Sciences | 482 | 7.3% |
| Engineering | 187 | 2.8% |
| Multidisciplinary Studies | 9 | 0.1% |
| Science & Technology | 1,075 | 16.3% |
| Business | 1,397 | 21.2% |
| Education | 796 | 12.1% |
| Literature & Languages | 125 | 1.9% |
| Liberal Arts & History | 342 | 5.2% |
| Visual & Performing Arts | 205 | 3.1% |
| Communications | 146 | 2.2% |
| Arts & Humanities | 668 | 10.2% |
| Total | 6,577 | 100.0% |
Transportation & Commute in Caldwell
Vehicle Availability by Sex in Caldwell
The most prevalent vehicle ownership categories in Caldwell are males with 2 vehicles (6,452, accounting for 48.1%) and females with 2 vehicles (5,931, making up 53.5%).
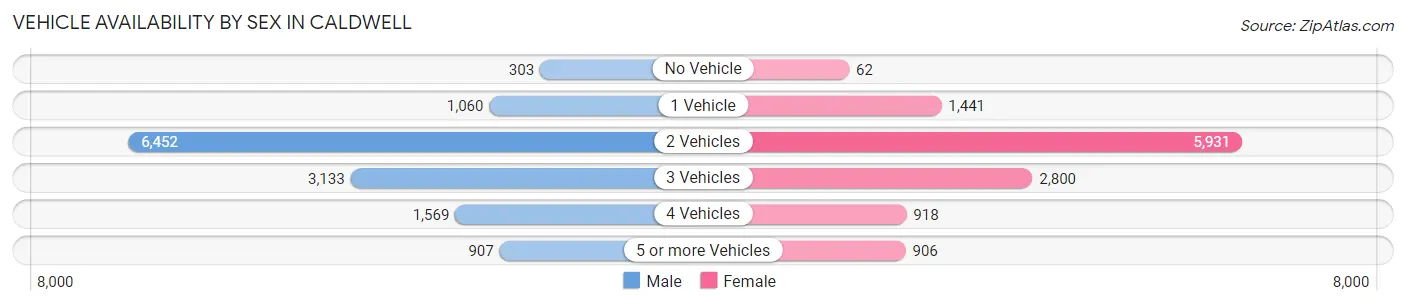
| Vehicles Available | Male | Female |
| No Vehicle | 303 (2.3%) | 62 (0.5%) |
| 1 Vehicle | 1,060 (7.9%) | 1,441 (11.9%) |
| 2 Vehicles | 6,452 (48.1%) | 5,931 (49.2%) |
| 3 Vehicles | 3,133 (23.3%) | 2,800 (23.2%) |
| 4 Vehicles | 1,569 (11.7%) | 918 (7.6%) |
| 5 or more Vehicles | 907 (6.8%) | 906 (7.5%) |
| Total | 13,424 (100.0%) | 12,058 (100.0%) |
Commute Time in Caldwell
The most frequently occuring commute durations in Caldwell are 10 to 14 minutes (3,624 commuters, 15.5%), 30 to 34 minutes (3,358 commuters, 14.3%), and 20 to 24 minutes (3,148 commuters, 13.5%).
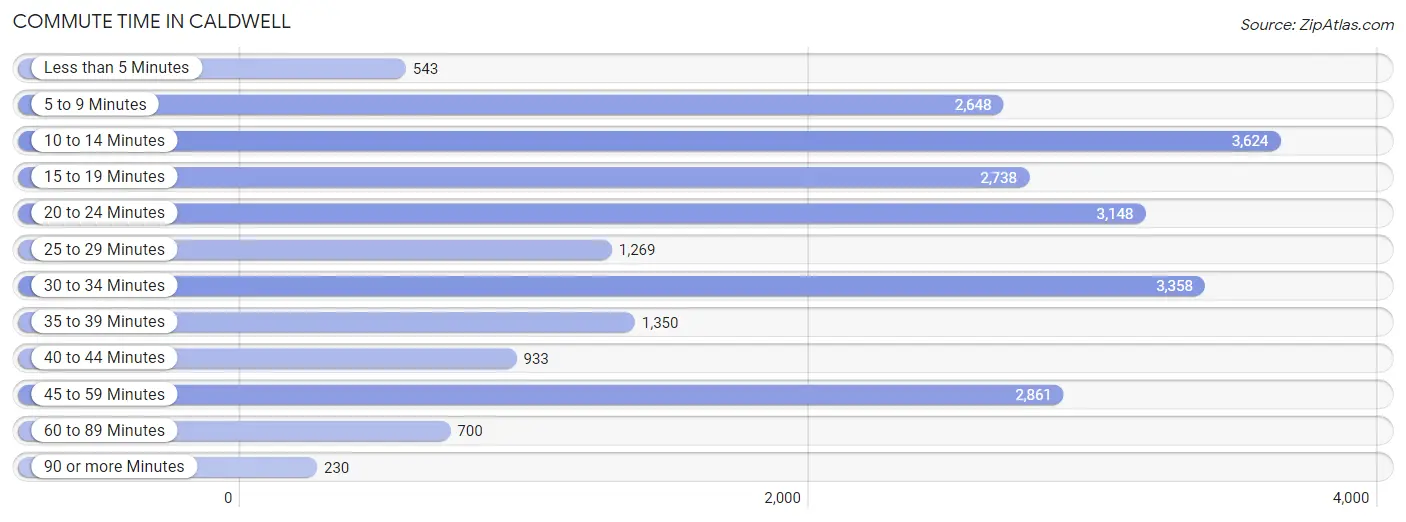
| Commute Time | # Commuters | % Commuters |
| Less than 5 Minutes | 543 | 2.3% |
| 5 to 9 Minutes | 2,648 | 11.3% |
| 10 to 14 Minutes | 3,624 | 15.5% |
| 15 to 19 Minutes | 2,738 | 11.7% |
| 20 to 24 Minutes | 3,148 | 13.5% |
| 25 to 29 Minutes | 1,269 | 5.4% |
| 30 to 34 Minutes | 3,358 | 14.3% |
| 35 to 39 Minutes | 1,350 | 5.8% |
| 40 to 44 Minutes | 933 | 4.0% |
| 45 to 59 Minutes | 2,861 | 12.2% |
| 60 to 89 Minutes | 700 | 3.0% |
| 90 or more Minutes | 230 | 1.0% |
Commute Time by Sex in Caldwell
The most common commute times in Caldwell are 30 to 34 minutes (2,216 commuters, 17.2%) for males and 10 to 14 minutes (1,965 commuters, 18.6%) for females.
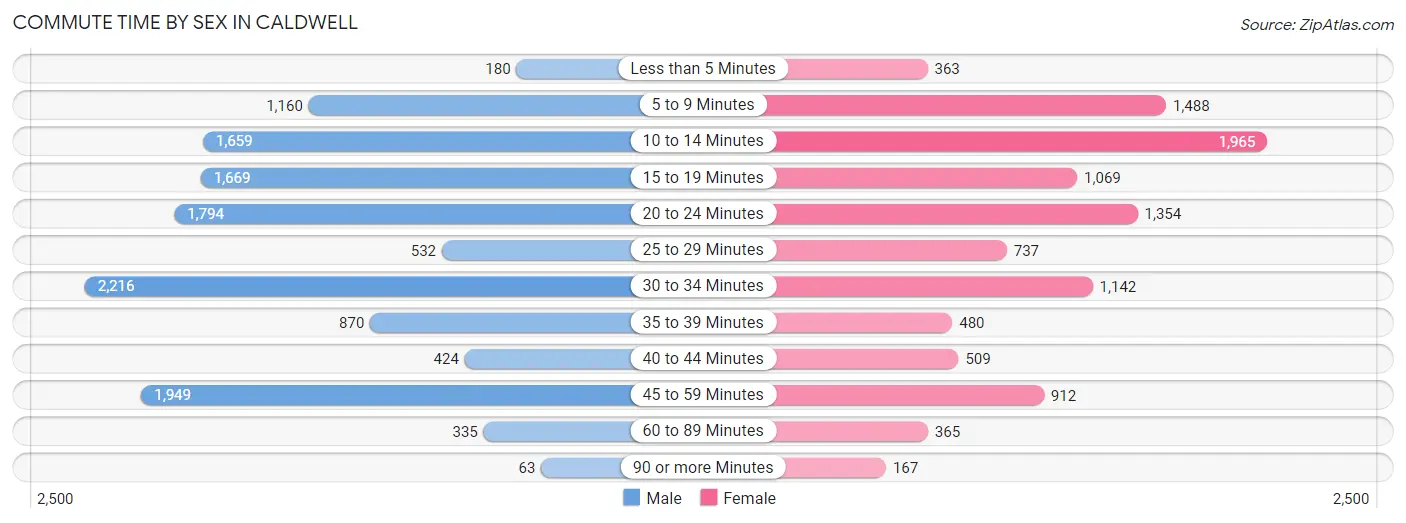
| Commute Time | Male | Female |
| Less than 5 Minutes | 180 (1.4%) | 363 (3.4%) |
| 5 to 9 Minutes | 1,160 (9.0%) | 1,488 (14.1%) |
| 10 to 14 Minutes | 1,659 (12.9%) | 1,965 (18.6%) |
| 15 to 19 Minutes | 1,669 (13.0%) | 1,069 (10.1%) |
| 20 to 24 Minutes | 1,794 (14.0%) | 1,354 (12.8%) |
| 25 to 29 Minutes | 532 (4.1%) | 737 (7.0%) |
| 30 to 34 Minutes | 2,216 (17.2%) | 1,142 (10.8%) |
| 35 to 39 Minutes | 870 (6.8%) | 480 (4.5%) |
| 40 to 44 Minutes | 424 (3.3%) | 509 (4.8%) |
| 45 to 59 Minutes | 1,949 (15.2%) | 912 (8.6%) |
| 60 to 89 Minutes | 335 (2.6%) | 365 (3.5%) |
| 90 or more Minutes | 63 (0.5%) | 167 (1.6%) |
Time of Departure to Work by Sex in Caldwell
The most frequent times of departure to work in Caldwell are 7:00 AM to 7:29 AM (1,941, 15.1%) for males and 7:00 AM to 7:29 AM (2,137, 20.3%) for females.
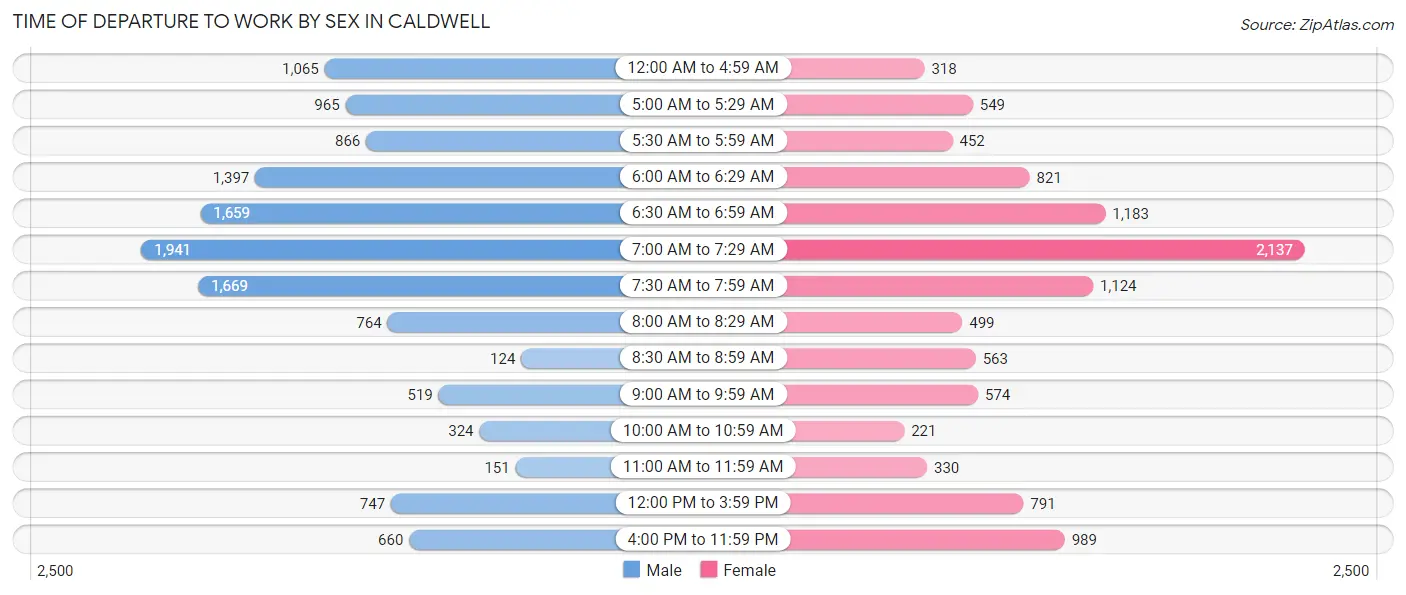
| Time of Departure | Male | Female |
| 12:00 AM to 4:59 AM | 1,065 (8.3%) | 318 (3.0%) |
| 5:00 AM to 5:29 AM | 965 (7.5%) | 549 (5.2%) |
| 5:30 AM to 5:59 AM | 866 (6.7%) | 452 (4.3%) |
| 6:00 AM to 6:29 AM | 1,397 (10.9%) | 821 (7.8%) |
| 6:30 AM to 6:59 AM | 1,659 (12.9%) | 1,183 (11.2%) |
| 7:00 AM to 7:29 AM | 1,941 (15.1%) | 2,137 (20.3%) |
| 7:30 AM to 7:59 AM | 1,669 (13.0%) | 1,124 (10.6%) |
| 8:00 AM to 8:29 AM | 764 (5.9%) | 499 (4.7%) |
| 8:30 AM to 8:59 AM | 124 (1.0%) | 563 (5.3%) |
| 9:00 AM to 9:59 AM | 519 (4.0%) | 574 (5.4%) |
| 10:00 AM to 10:59 AM | 324 (2.5%) | 221 (2.1%) |
| 11:00 AM to 11:59 AM | 151 (1.2%) | 330 (3.1%) |
| 12:00 PM to 3:59 PM | 747 (5.8%) | 791 (7.5%) |
| 4:00 PM to 11:59 PM | 660 (5.1%) | 989 (9.4%) |
| Total | 12,851 (100.0%) | 10,551 (100.0%) |
Housing Occupancy in Caldwell
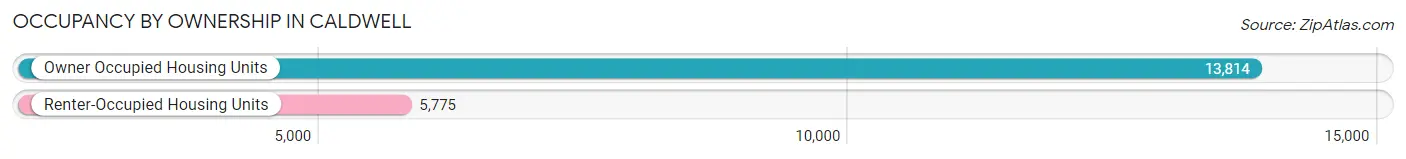
Occupancy by Ownership in Caldwell
Of the total 19,589 dwellings in Caldwell, owner-occupied units account for 13,814 (70.5%), while renter-occupied units make up 5,775 (29.5%).
| Occupancy | # Housing Units | % Housing Units |
| Owner Occupied Housing Units | 13,814 | 70.5% |
| Renter-Occupied Housing Units | 5,775 | 29.5% |
| Total Occupied Housing Units | 19,589 | 100.0% |
Occupancy by Household Size in Caldwell
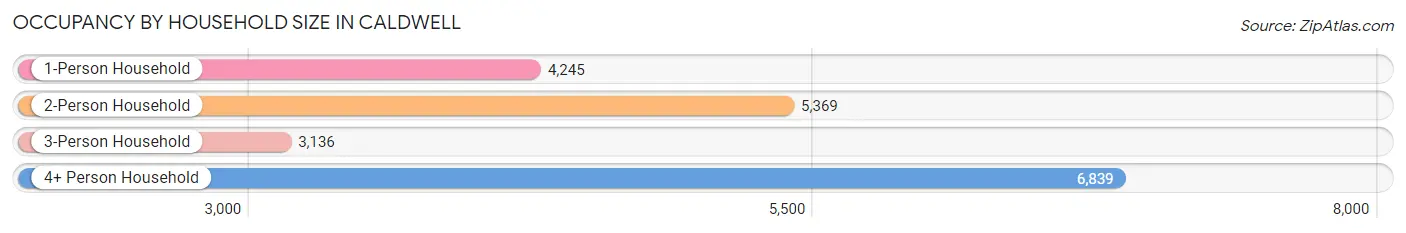
| Household Size | # Housing Units | % Housing Units |
| 1-Person Household | 4,245 | 21.7% |
| 2-Person Household | 5,369 | 27.4% |
| 3-Person Household | 3,136 | 16.0% |
| 4+ Person Household | 6,839 | 34.9% |
| Total Housing Units | 19,589 | 100.0% |
Occupancy by Ownership by Household Size in Caldwell
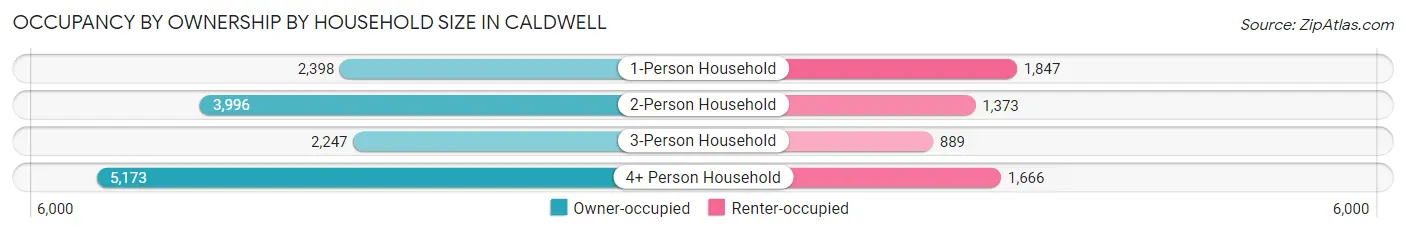
| Household Size | Owner-occupied | Renter-occupied |
| 1-Person Household | 2,398 (56.5%) | 1,847 (43.5%) |
| 2-Person Household | 3,996 (74.4%) | 1,373 (25.6%) |
| 3-Person Household | 2,247 (71.7%) | 889 (28.3%) |
| 4+ Person Household | 5,173 (75.6%) | 1,666 (24.4%) |
| Total Housing Units | 13,814 (70.5%) | 5,775 (29.5%) |
Occupancy by Educational Attainment in Caldwell
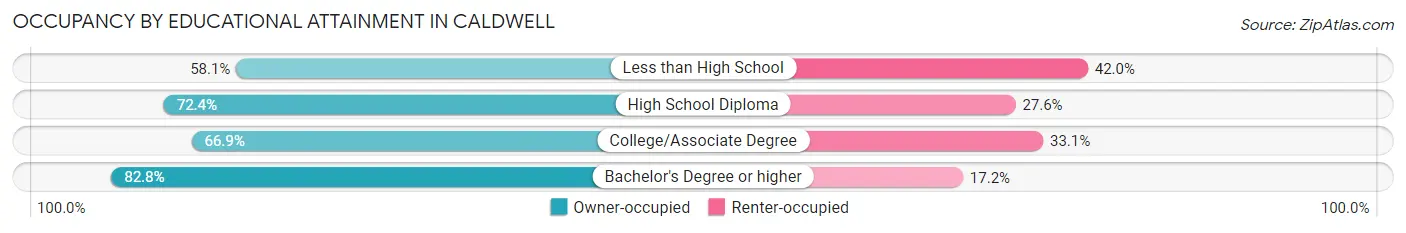
| Household Size | Owner-occupied | Renter-occupied |
| Less than High School | 1,677 (58.1%) | 1,212 (41.9%) |
| High School Diploma | 4,256 (72.4%) | 1,623 (27.6%) |
| College/Associate Degree | 4,541 (66.9%) | 2,246 (33.1%) |
| Bachelor's Degree or higher | 3,340 (82.8%) | 694 (17.2%) |
Occupancy by Age of Householder in Caldwell
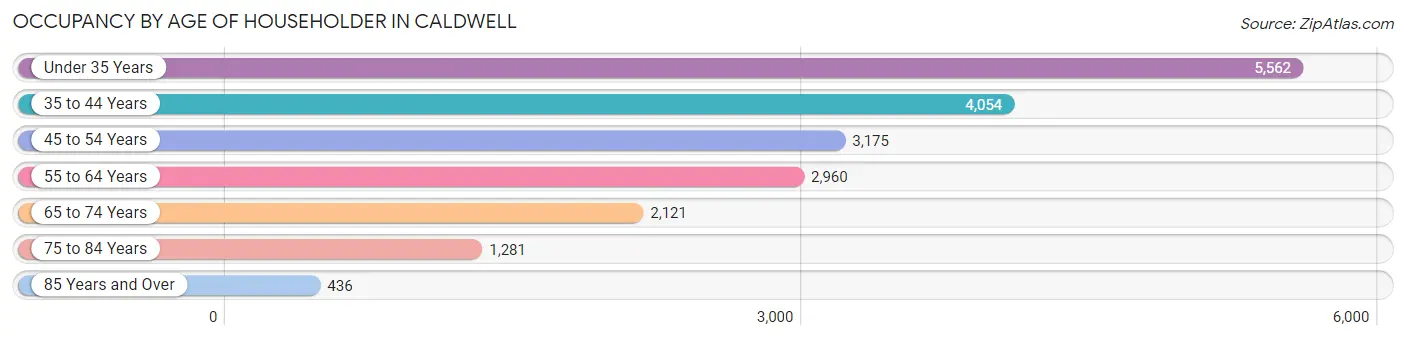
| Age Bracket | # Households | % Households |
| Under 35 Years | 5,562 | 28.4% |
| 35 to 44 Years | 4,054 | 20.7% |
| 45 to 54 Years | 3,175 | 16.2% |
| 55 to 64 Years | 2,960 | 15.1% |
| 65 to 74 Years | 2,121 | 10.8% |
| 75 to 84 Years | 1,281 | 6.5% |
| 85 Years and Over | 436 | 2.2% |
| Total | 19,589 | 100.0% |
Housing Finances in Caldwell
Median Income by Occupancy in Caldwell
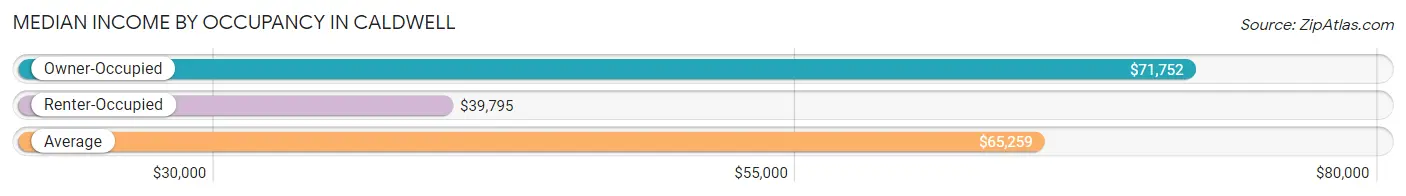
| Occupancy Type | # Households | Median Income |
| Owner-Occupied | 13,814 (70.5%) | $71,752 |
| Renter-Occupied | 5,775 (29.5%) | $39,795 |
| Average | 19,589 (100.0%) | $65,259 |
Occupancy by Householder Income Bracket in Caldwell
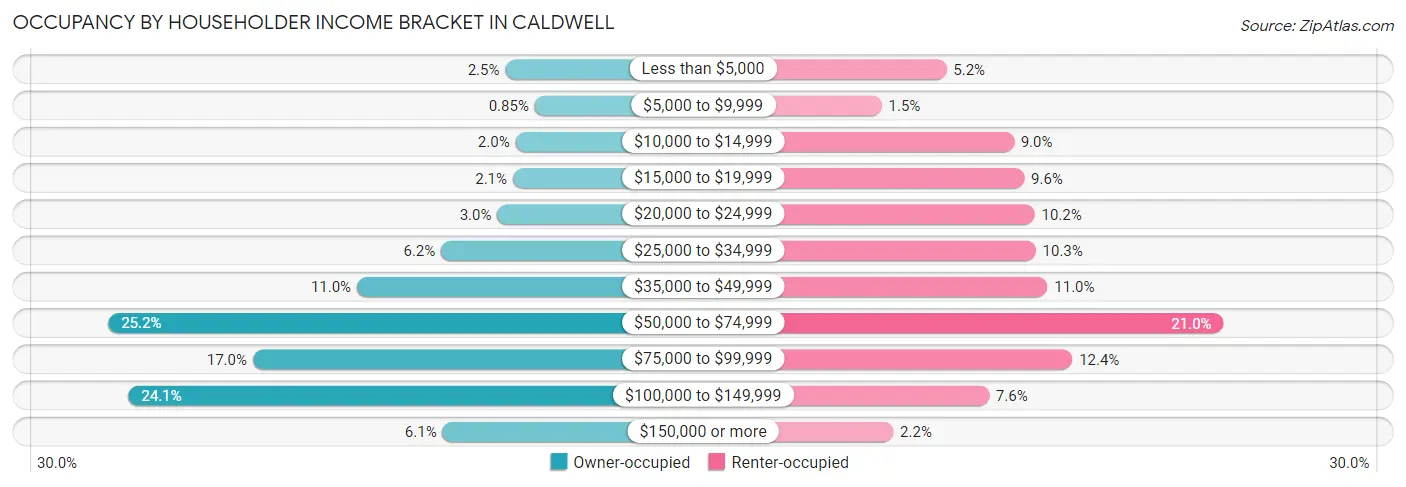
| Income Bracket | Owner-occupied | Renter-occupied |
| Less than $5,000 | 349 (2.5%) | 300 (5.2%) |
| $5,000 to $9,999 | 117 (0.9%) | 86 (1.5%) |
| $10,000 to $14,999 | 270 (1.9%) | 522 (9.0%) |
| $15,000 to $19,999 | 290 (2.1%) | 556 (9.6%) |
| $20,000 to $24,999 | 413 (3.0%) | 591 (10.2%) |
| $25,000 to $34,999 | 856 (6.2%) | 594 (10.3%) |
| $35,000 to $49,999 | 1,521 (11.0%) | 633 (11.0%) |
| $50,000 to $74,999 | 3,484 (25.2%) | 1,214 (21.0%) |
| $75,000 to $99,999 | 2,343 (17.0%) | 715 (12.4%) |
| $100,000 to $149,999 | 3,325 (24.1%) | 440 (7.6%) |
| $150,000 or more | 846 (6.1%) | 124 (2.1%) |
| Total | 13,814 (100.0%) | 5,775 (100.0%) |
Monthly Housing Cost Tiers in Caldwell
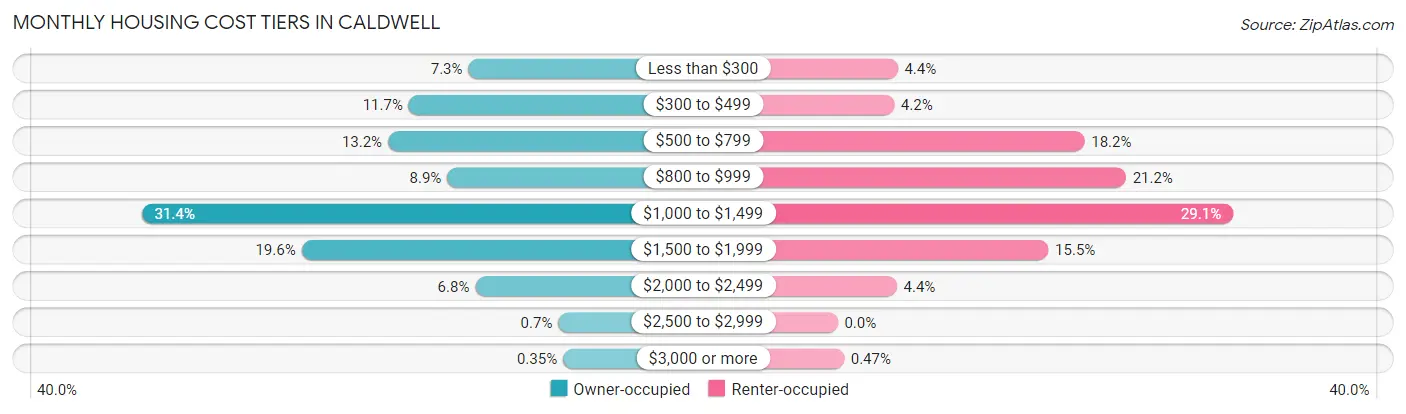
| Monthly Cost | Owner-occupied | Renter-occupied |
| Less than $300 | 1,011 (7.3%) | 255 (4.4%) |
| $300 to $499 | 1,617 (11.7%) | 240 (4.2%) |
| $500 to $799 | 1,829 (13.2%) | 1,050 (18.2%) |
| $800 to $999 | 1,226 (8.9%) | 1,226 (21.2%) |
| $1,000 to $1,499 | 4,336 (31.4%) | 1,682 (29.1%) |
| $1,500 to $1,999 | 2,709 (19.6%) | 896 (15.5%) |
| $2,000 to $2,499 | 941 (6.8%) | 252 (4.4%) |
| $2,500 to $2,999 | 97 (0.7%) | 0 (0.0%) |
| $3,000 or more | 48 (0.4%) | 27 (0.5%) |
| Total | 13,814 (100.0%) | 5,775 (100.0%) |
Physical Housing Characteristics in Caldwell
Housing Structures in Caldwell
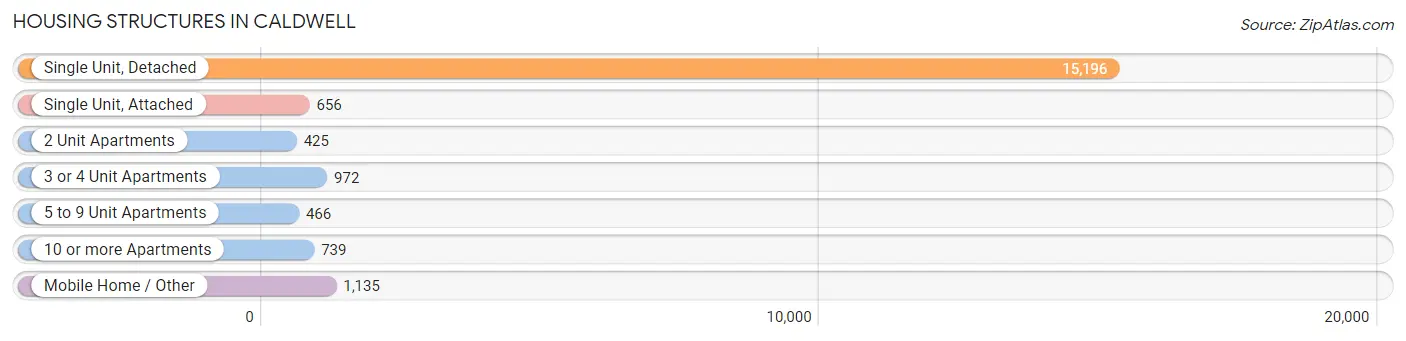
| Structure Type | # Housing Units | % Housing Units |
| Single Unit, Detached | 15,196 | 77.6% |
| Single Unit, Attached | 656 | 3.4% |
| 2 Unit Apartments | 425 | 2.2% |
| 3 or 4 Unit Apartments | 972 | 5.0% |
| 5 to 9 Unit Apartments | 466 | 2.4% |
| 10 or more Apartments | 739 | 3.8% |
| Mobile Home / Other | 1,135 | 5.8% |
| Total | 19,589 | 100.0% |
Housing Structures by Occupancy in Caldwell
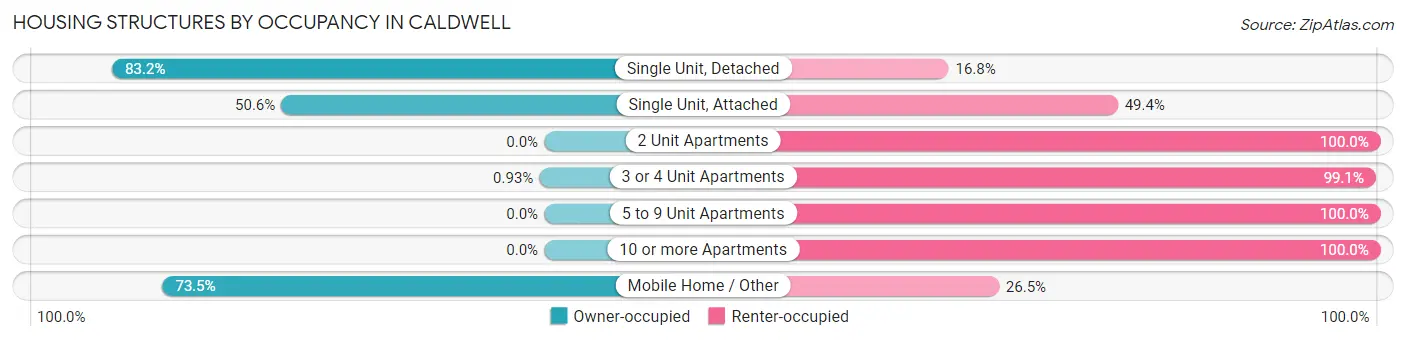
| Structure Type | Owner-occupied | Renter-occupied |
| Single Unit, Detached | 12,639 (83.2%) | 2,557 (16.8%) |
| Single Unit, Attached | 332 (50.6%) | 324 (49.4%) |
| 2 Unit Apartments | 0 (0.0%) | 425 (100.0%) |
| 3 or 4 Unit Apartments | 9 (0.9%) | 963 (99.1%) |
| 5 to 9 Unit Apartments | 0 (0.0%) | 466 (100.0%) |
| 10 or more Apartments | 0 (0.0%) | 739 (100.0%) |
| Mobile Home / Other | 834 (73.5%) | 301 (26.5%) |
| Total | 13,814 (70.5%) | 5,775 (29.5%) |
Housing Structures by Number of Rooms in Caldwell
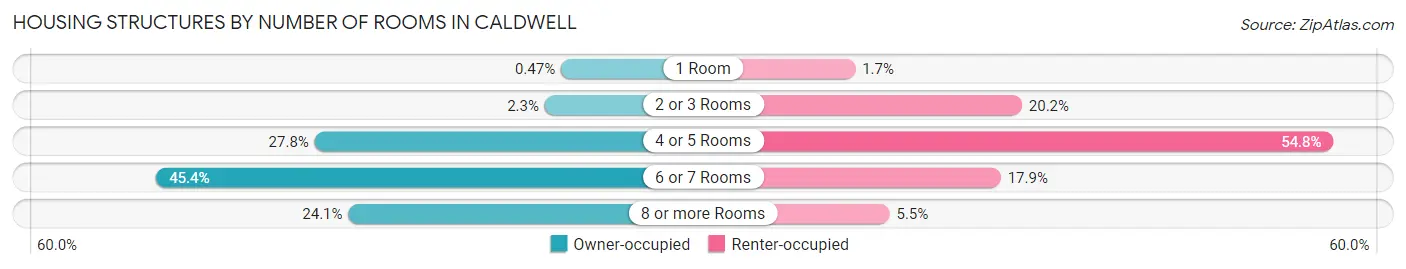
| Number of Rooms | Owner-occupied | Renter-occupied |
| 1 Room | 65 (0.5%) | 98 (1.7%) |
| 2 or 3 Rooms | 313 (2.3%) | 1,166 (20.2%) |
| 4 or 5 Rooms | 3,841 (27.8%) | 3,162 (54.7%) |
| 6 or 7 Rooms | 6,270 (45.4%) | 1,031 (17.8%) |
| 8 or more Rooms | 3,325 (24.1%) | 318 (5.5%) |
| Total | 13,814 (100.0%) | 5,775 (100.0%) |
Housing Structure by Heating Type in Caldwell
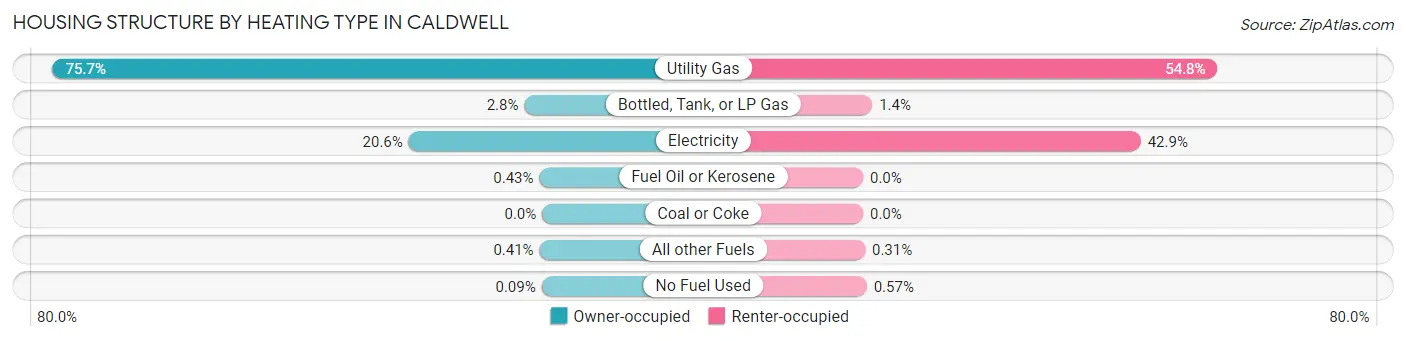
| Heating Type | Owner-occupied | Renter-occupied |
| Utility Gas | 10,454 (75.7%) | 3,163 (54.8%) |
| Bottled, Tank, or LP Gas | 380 (2.8%) | 82 (1.4%) |
| Electricity | 2,851 (20.6%) | 2,479 (42.9%) |
| Fuel Oil or Kerosene | 59 (0.4%) | 0 (0.0%) |
| Coal or Coke | 0 (0.0%) | 0 (0.0%) |
| All other Fuels | 57 (0.4%) | 18 (0.3%) |
| No Fuel Used | 13 (0.1%) | 33 (0.6%) |
| Total | 13,814 (100.0%) | 5,775 (100.0%) |
Household Vehicle Usage in Caldwell
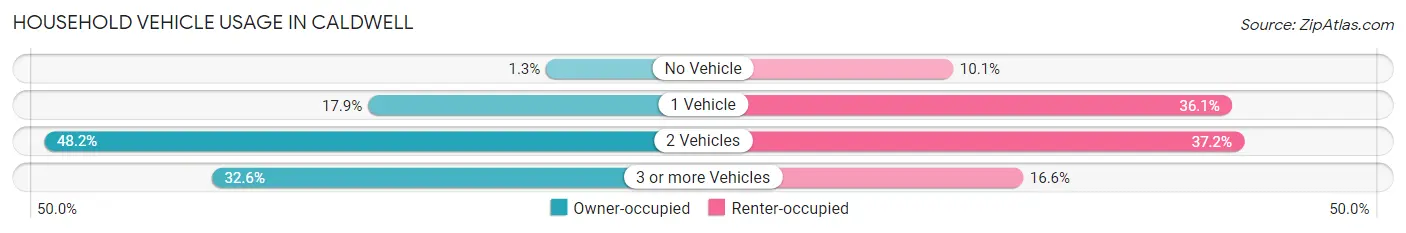
| Vehicles per Household | Owner-occupied | Renter-occupied |
| No Vehicle | 182 (1.3%) | 582 (10.1%) |
| 1 Vehicle | 2,478 (17.9%) | 2,084 (36.1%) |
| 2 Vehicles | 6,657 (48.2%) | 2,150 (37.2%) |
| 3 or more Vehicles | 4,497 (32.6%) | 959 (16.6%) |
| Total | 13,814 (100.0%) | 5,775 (100.0%) |
Real Estate & Mortgages in Caldwell
Real Estate and Mortgage Overview in Caldwell
| Characteristic | Without Mortgage | With Mortgage |
| Housing Units | 3,514 | 10,300 |
| Median Property Value | $252,300 | $292,700 |
| Median Household Income | $61,493 | $591 |
| Monthly Housing Costs | $414 | $41 |
| Real Estate Taxes | $1,656 | $625 |
Property Value by Mortgage Status in Caldwell
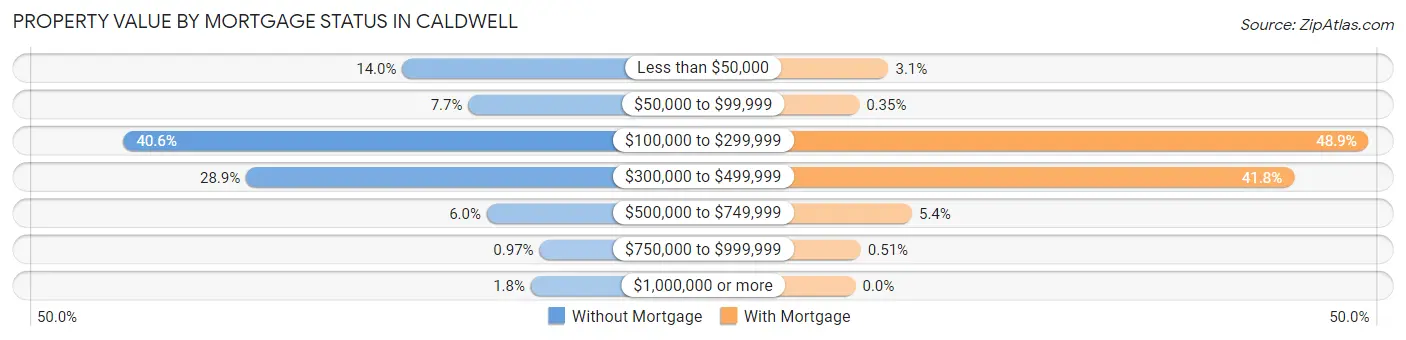
| Property Value | Without Mortgage | With Mortgage |
| Less than $50,000 | 493 (14.0%) | 323 (3.1%) |
| $50,000 to $99,999 | 272 (7.7%) | 36 (0.4%) |
| $100,000 to $299,999 | 1,426 (40.6%) | 5,033 (48.9%) |
| $300,000 to $499,999 | 1,016 (28.9%) | 4,301 (41.8%) |
| $500,000 to $749,999 | 210 (6.0%) | 554 (5.4%) |
| $750,000 to $999,999 | 34 (1.0%) | 53 (0.5%) |
| $1,000,000 or more | 63 (1.8%) | 0 (0.0%) |
| Total | 3,514 (100.0%) | 10,300 (100.0%) |
Household Income by Mortgage Status in Caldwell
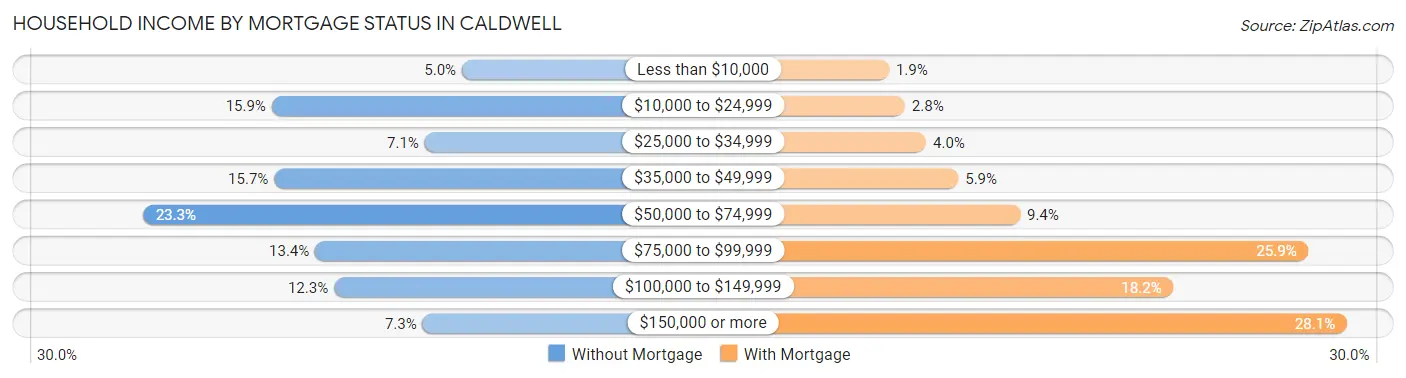
| Household Income | Without Mortgage | With Mortgage |
| Less than $10,000 | 176 (5.0%) | 197 (1.9%) |
| $10,000 to $24,999 | 558 (15.9%) | 290 (2.8%) |
| $25,000 to $34,999 | 251 (7.1%) | 415 (4.0%) |
| $35,000 to $49,999 | 553 (15.7%) | 605 (5.9%) |
| $50,000 to $74,999 | 817 (23.3%) | 968 (9.4%) |
| $75,000 to $99,999 | 471 (13.4%) | 2,667 (25.9%) |
| $100,000 to $149,999 | 433 (12.3%) | 1,872 (18.2%) |
| $150,000 or more | 255 (7.3%) | 2,892 (28.1%) |
| Total | 3,514 (100.0%) | 10,300 (100.0%) |
Property Value to Household Income Ratio in Caldwell
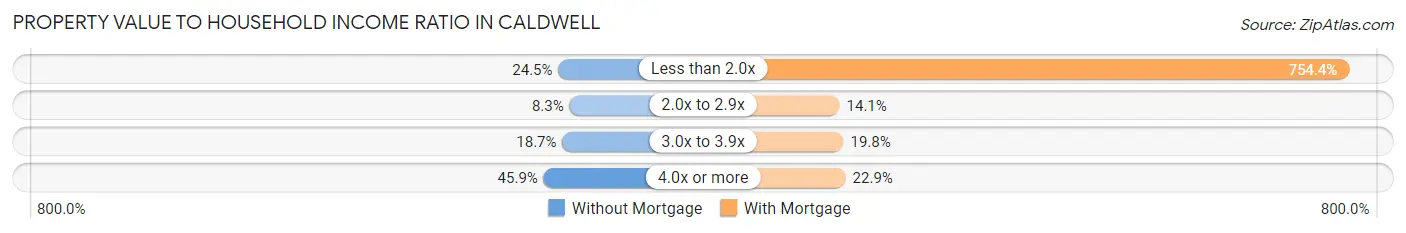
| Value-to-Income Ratio | Without Mortgage | With Mortgage |
| Less than 2.0x | 861 (24.5%) | 77,703 (754.4%) |
| 2.0x to 2.9x | 290 (8.3%) | 1,449 (14.1%) |
| 3.0x to 3.9x | 656 (18.7%) | 2,043 (19.8%) |
| 4.0x or more | 1,611 (45.9%) | 2,355 (22.9%) |
| Total | 3,514 (100.0%) | 10,300 (100.0%) |
Real Estate Taxes by Mortgage Status in Caldwell
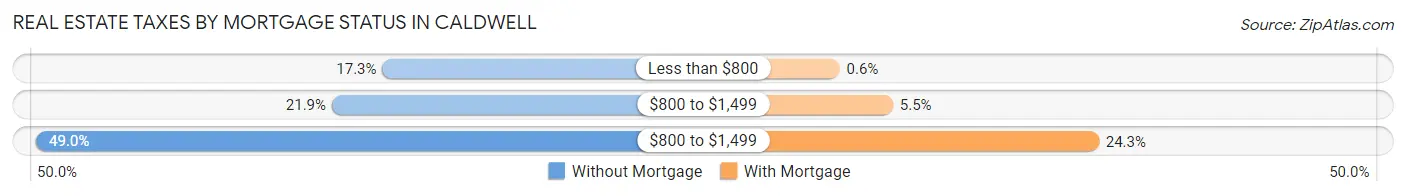
| Property Taxes | Without Mortgage | With Mortgage |
| Less than $800 | 609 (17.3%) | 62 (0.6%) |
| $800 to $1,499 | 771 (21.9%) | 562 (5.5%) |
| $800 to $1,499 | 1,720 (48.9%) | 2,500 (24.3%) |
| Total | 3,514 (100.0%) | 10,300 (100.0%) |
Health & Disability in Caldwell
Health Insurance Coverage by Age in Caldwell
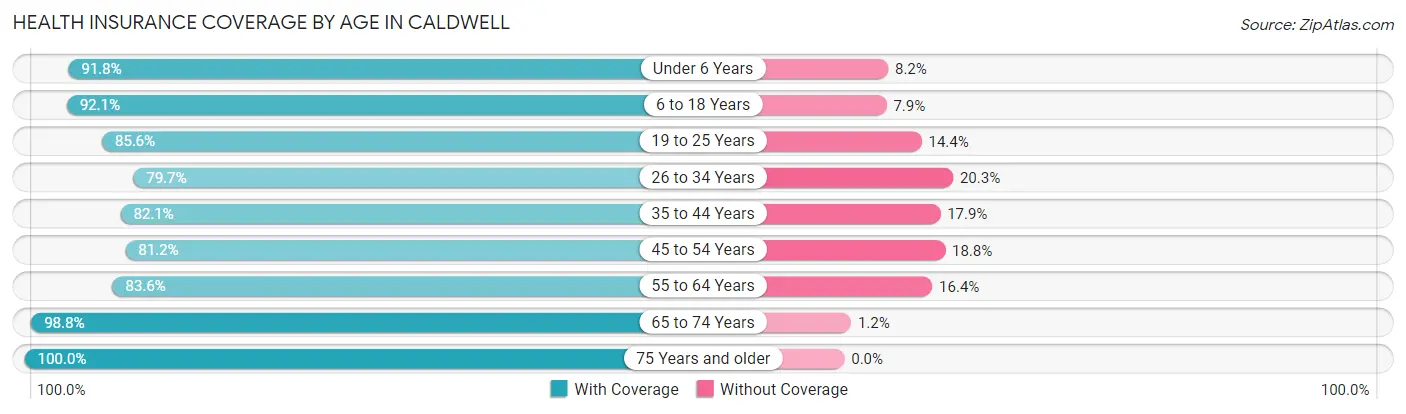
| Age Bracket | With Coverage | Without Coverage |
| Under 6 Years | 5,922 (91.8%) | 526 (8.2%) |
| 6 to 18 Years | 13,233 (92.1%) | 1,129 (7.9%) |
| 19 to 25 Years | 4,965 (85.6%) | 836 (14.4%) |
| 26 to 34 Years | 6,418 (79.7%) | 1,632 (20.3%) |
| 35 to 44 Years | 6,925 (82.1%) | 1,508 (17.9%) |
| 45 to 54 Years | 4,816 (81.2%) | 1,114 (18.8%) |
| 55 to 64 Years | 4,670 (83.6%) | 915 (16.4%) |
| 65 to 74 Years | 3,261 (98.8%) | 41 (1.2%) |
| 75 Years and older | 2,679 (100.0%) | 0 (0.0%) |
| Total | 52,889 (87.3%) | 7,701 (12.7%) |
Health Insurance Coverage by Citizenship Status in Caldwell
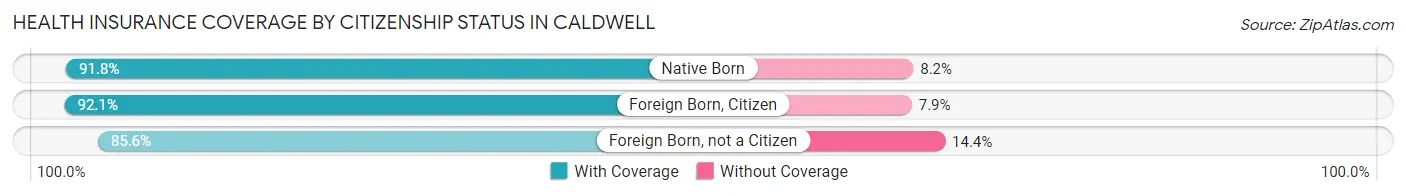
| Citizenship Status | With Coverage | Without Coverage |
| Native Born | 5,922 (91.8%) | 526 (8.2%) |
| Foreign Born, Citizen | 13,233 (92.1%) | 1,129 (7.9%) |
| Foreign Born, not a Citizen | 4,965 (85.6%) | 836 (14.4%) |
Health Insurance Coverage by Household Income in Caldwell
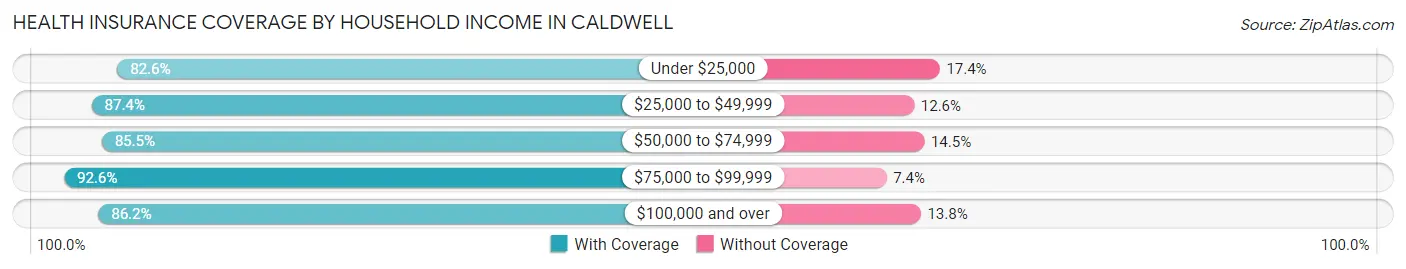
| Household Income | With Coverage | Without Coverage |
| Under $25,000 | 5,431 (82.6%) | 1,141 (17.4%) |
| $25,000 to $49,999 | 8,302 (87.4%) | 1,192 (12.6%) |
| $50,000 to $74,999 | 12,877 (85.5%) | 2,177 (14.5%) |
| $75,000 to $99,999 | 10,935 (92.6%) | 873 (7.4%) |
| $100,000 and over | 14,125 (86.2%) | 2,263 (13.8%) |
Public vs Private Health Insurance Coverage by Age in Caldwell
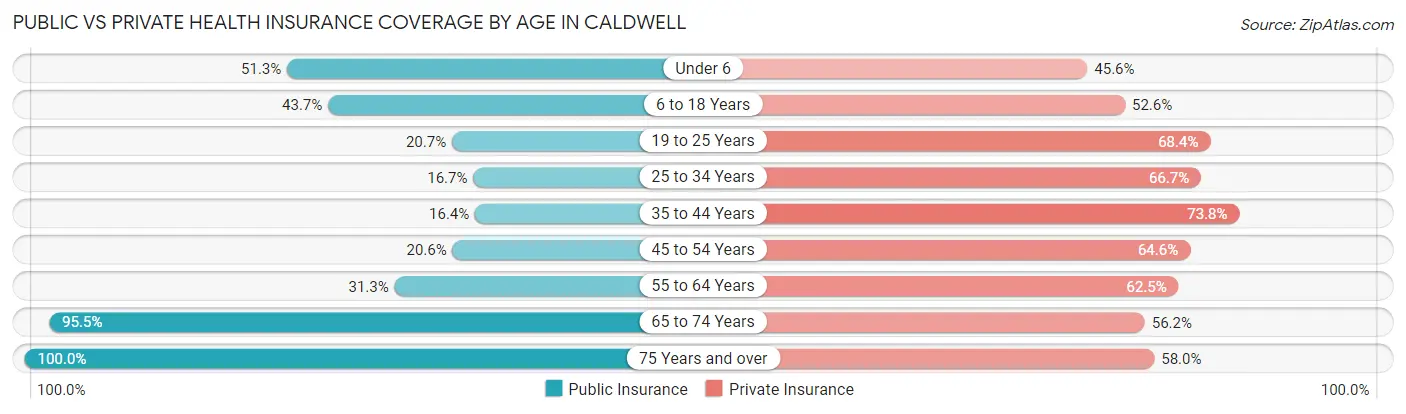
| Age Bracket | Public Insurance | Private Insurance |
| Under 6 | 3,306 (51.3%) | 2,939 (45.6%) |
| 6 to 18 Years | 6,272 (43.7%) | 7,552 (52.6%) |
| 19 to 25 Years | 1,199 (20.7%) | 3,967 (68.4%) |
| 25 to 34 Years | 1,345 (16.7%) | 5,368 (66.7%) |
| 35 to 44 Years | 1,381 (16.4%) | 6,223 (73.8%) |
| 45 to 54 Years | 1,219 (20.6%) | 3,832 (64.6%) |
| 55 to 64 Years | 1,750 (31.3%) | 3,491 (62.5%) |
| 65 to 74 Years | 3,152 (95.5%) | 1,857 (56.2%) |
| 75 Years and over | 2,679 (100.0%) | 1,554 (58.0%) |
| Total | 22,303 (36.8%) | 36,783 (60.7%) |
Disability Status by Sex by Age in Caldwell
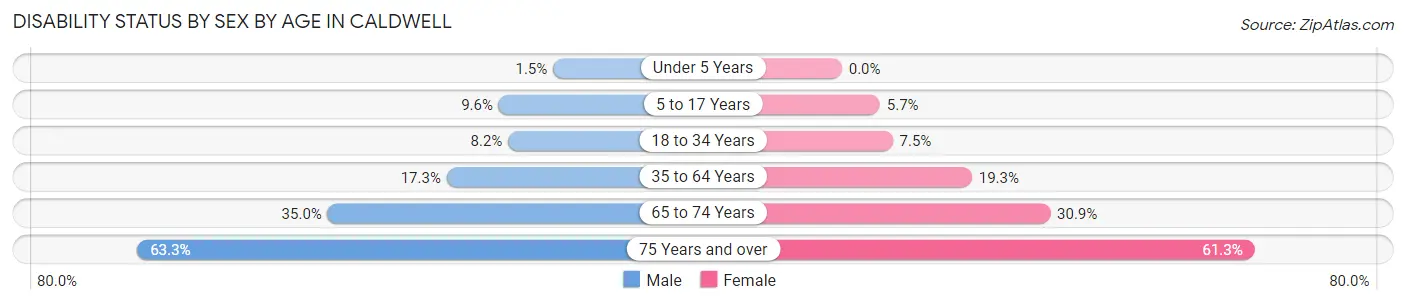
| Age Bracket | Male | Female |
| Under 5 Years | 43 (1.5%) | 0 (0.0%) |
| 5 to 17 Years | 697 (9.6%) | 391 (5.7%) |
| 18 to 34 Years | 598 (8.2%) | 600 (7.5%) |
| 35 to 64 Years | 1,744 (17.3%) | 1,907 (19.3%) |
| 65 to 74 Years | 540 (35.0%) | 544 (30.9%) |
| 75 Years and over | 708 (63.3%) | 956 (61.3%) |
Disability Class by Sex by Age in Caldwell
Disability Class: Hearing Difficulty
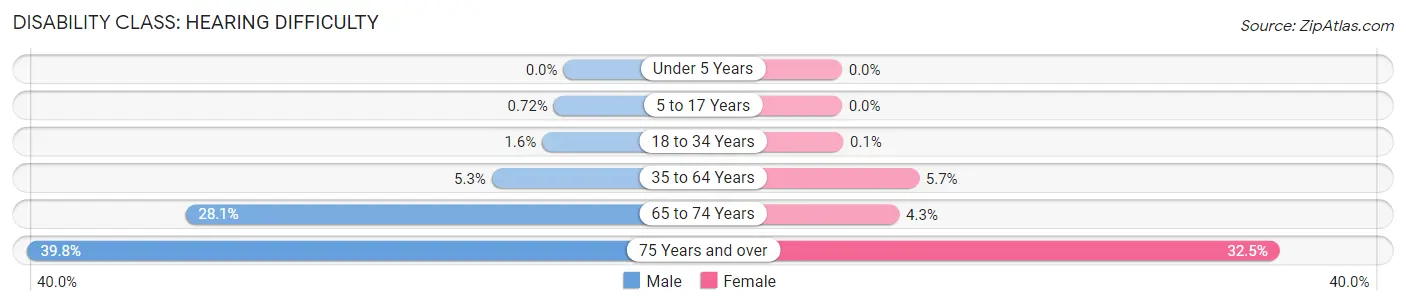
| Age Bracket | Male | Female |
| Under 5 Years | 0 (0.0%) | 0 (0.0%) |
| 5 to 17 Years | 52 (0.7%) | 0 (0.0%) |
| 18 to 34 Years | 115 (1.6%) | 8 (0.1%) |
| 35 to 64 Years | 536 (5.3%) | 565 (5.7%) |
| 65 to 74 Years | 433 (28.1%) | 75 (4.3%) |
| 75 Years and over | 445 (39.8%) | 507 (32.5%) |
Disability Class: Vision Difficulty
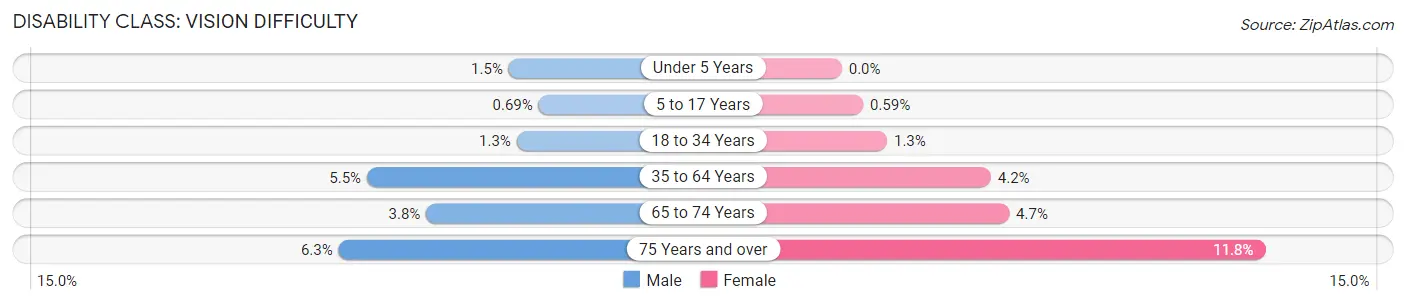
| Age Bracket | Male | Female |
| Under 5 Years | 43 (1.5%) | 0 (0.0%) |
| 5 to 17 Years | 50 (0.7%) | 41 (0.6%) |
| 18 to 34 Years | 95 (1.3%) | 100 (1.3%) |
| 35 to 64 Years | 551 (5.5%) | 410 (4.2%) |
| 65 to 74 Years | 59 (3.8%) | 82 (4.7%) |
| 75 Years and over | 70 (6.3%) | 184 (11.8%) |
Disability Class: Cognitive Difficulty
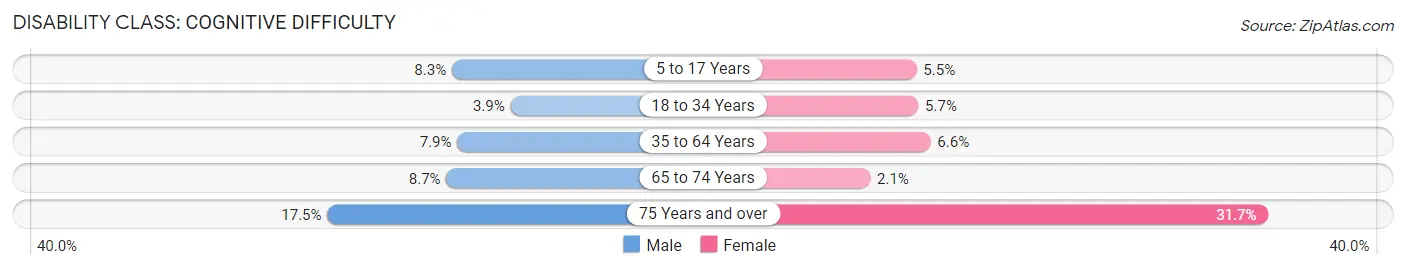
| Age Bracket | Male | Female |
| 5 to 17 Years | 601 (8.3%) | 383 (5.5%) |
| 18 to 34 Years | 286 (3.9%) | 451 (5.7%) |
| 35 to 64 Years | 792 (7.9%) | 650 (6.6%) |
| 65 to 74 Years | 134 (8.7%) | 37 (2.1%) |
| 75 Years and over | 196 (17.5%) | 494 (31.7%) |
Disability Class: Ambulatory Difficulty
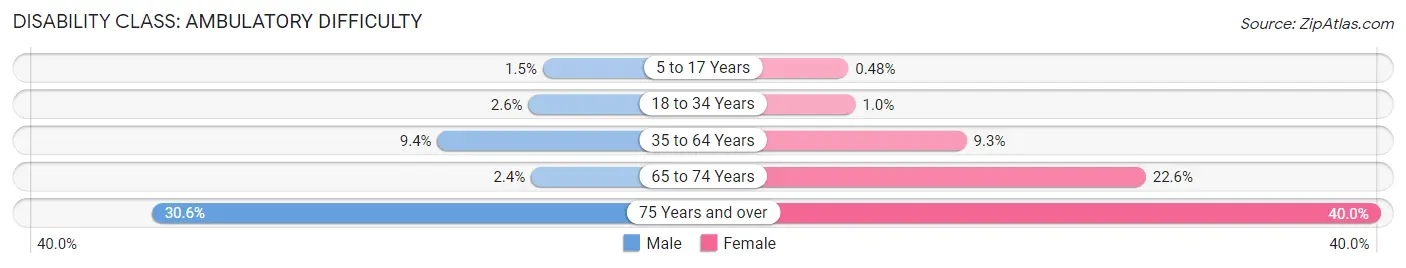
| Age Bracket | Male | Female |
| 5 to 17 Years | 111 (1.5%) | 33 (0.5%) |
| 18 to 34 Years | 189 (2.6%) | 81 (1.0%) |
| 35 to 64 Years | 941 (9.3%) | 916 (9.3%) |
| 65 to 74 Years | 37 (2.4%) | 397 (22.6%) |
| 75 Years and over | 342 (30.6%) | 624 (40.0%) |
Disability Class: Self-Care Difficulty
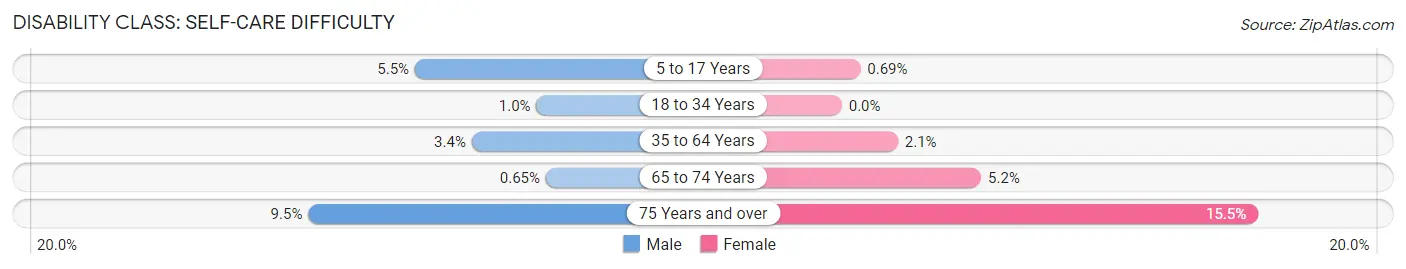
| Age Bracket | Male | Female |
| 5 to 17 Years | 400 (5.5%) | 48 (0.7%) |
| 18 to 34 Years | 73 (1.0%) | 0 (0.0%) |
| 35 to 64 Years | 342 (3.4%) | 206 (2.1%) |
| 65 to 74 Years | 10 (0.6%) | 91 (5.2%) |
| 75 Years and over | 106 (9.5%) | 241 (15.4%) |
Technology Access in Caldwell
Computing Device Access in Caldwell
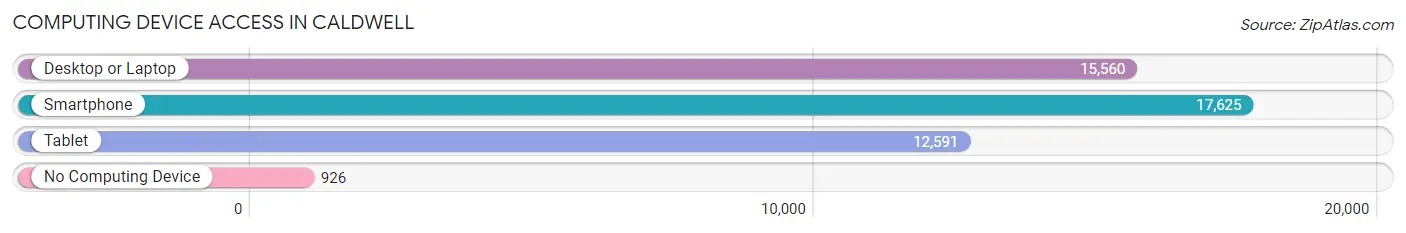
| Device Type | # Households | % Households |
| Desktop or Laptop | 15,560 | 79.4% |
| Smartphone | 17,625 | 90.0% |
| Tablet | 12,591 | 64.3% |
| No Computing Device | 926 | 4.7% |
| Total | 19,589 | 100.0% |
Internet Access in Caldwell
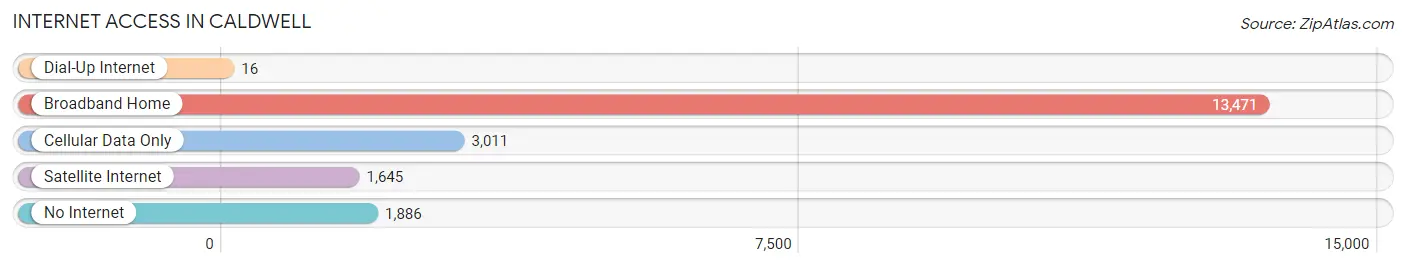
| Internet Type | # Households | % Households |
| Dial-Up Internet | 16 | 0.1% |
| Broadband Home | 13,471 | 68.8% |
| Cellular Data Only | 3,011 | 15.4% |
| Satellite Internet | 1,645 | 8.4% |
| No Internet | 1,886 | 9.6% |
| Total | 19,589 | 100.0% |
Caldwell Summary
Caldwell, Idaho is a city located in Canyon County, Idaho, United States. It is the county seat of Canyon County and the largest city in the county. The population of Caldwell was 46,237 at the 2010 census, making it the third-largest city in Idaho.
History
Caldwell was founded in 1883 by Alexander Caldwell, a former Union soldier who had moved to the area from Missouri. Caldwell was originally a farming community, but it quickly grew into a bustling town due to its location on the Oregon Short Line Railroad. The railroad connected Caldwell to the larger cities of Boise and Portland, Oregon, and allowed for the transport of goods and people.
In the early 1900s, Caldwell was a major center for the dairy industry, with several large dairy farms located in the area. The city was also home to several brickyards, which supplied bricks for many of the buildings in the city.
Geography
Caldwell is located in the Treasure Valley region of southwestern Idaho, about 30 miles west of Boise. The city is situated in the foothills of the Boise Mountains, and is surrounded by rolling hills and farmland. The city is located at an elevation of 2,400 feet above sea level.
The city is bisected by the Boise River, which flows through the city from north to south. The river is a popular destination for fishing, swimming, and other recreational activities.
Economy
Caldwell’s economy is largely based on agriculture and manufacturing. The city is home to several large food processing plants, including the J.R. Simplot Company, which produces potato products. The city is also home to several large dairy farms, which produce milk, cheese, and other dairy products.
The city is also home to several large retail stores, including Walmart, Lowe’s, and Home Depot. The city is also home to several large medical facilities, including Saint Alphonsus Regional Medical Center and West Valley Medical Center.
Demographics
As of the 2010 census, the population of Caldwell was 46,237. The racial makeup of the city was 79.3% White, 0.7% African American, 0.7% Native American, 0.7% Asian, 0.2% Pacific Islander, 16.2% from other races, and 2.4% from two or more races. Hispanic or Latino of any race were 28.3% of the population.
The median income for a household in Caldwell was $37,945, and the median income for a family was $45,945. The per capita income for the city was $18,945. About 17.2% of families and 21.3% of the population were below the poverty line, including 28.3% of those under age 18 and 8.3% of those age 65 or over.
Common Questions
What is Per Capita Income in Caldwell?
Per Capita income in Caldwell is $24,112.
What is the Median Family Income in Caldwell?
Median Family Income in Caldwell is $71,487.
What is the Median Household income in Caldwell?
Median Household Income in Caldwell is $65,259.
What is Income or Wage Gap in Caldwell?
Income or Wage Gap in Caldwell is 28.0%.
Women in Caldwell earn 72.0 cents for every dollar earned by a man.
What is Family Income Deficit in Caldwell?
Family Income Deficit in Caldwell is $12,373.
Families that are below poverty line in Caldwell earn $12,373 less on average than the poverty threshold level.
What is Inequality or Gini Index in Caldwell?
Inequality or Gini Index in Caldwell is 0.38.
What is the Total Population of Caldwell?
Total Population of Caldwell is 61,212.
What is the Total Male Population of Caldwell?
Total Male Population of Caldwell is 30,531.
What is the Total Female Population of Caldwell?
Total Female Population of Caldwell is 30,681.
What is the Ratio of Males per 100 Females in Caldwell?
There are 99.51 Males per 100 Females in Caldwell.
What is the Ratio of Females per 100 Males in Caldwell?
There are 100.49 Females per 100 Males in Caldwell.
What is the Median Population Age in Caldwell?
Median Population Age in Caldwell is 30.3 Years.
What is the Average Family Size in Caldwell
Average Family Size in Caldwell is 3.6 People.
What is the Average Household Size in Caldwell
Average Household Size in Caldwell is 3.0 People.
How Large is the Labor Force in Caldwell?
There are 28,042 People in the Labor Forcein in Caldwell.
What is the Percentage of People in the Labor Force in Caldwell?
63.9% of People are in the Labor Force in Caldwell.
What is the Unemployment Rate in Caldwell?
Unemployment Rate in Caldwell is 5.1%.