Chubbuck, ID Map & Demographics
Chubbuck Map
Chubbuck Overview
$30,782
PER CAPITA INCOME
$88,384
AVG FAMILY INCOME
$69,992
AVG HOUSEHOLD INCOME
39.0%
WAGE / INCOME GAP [ % ]
61.0¢/ $1
WAGE / INCOME GAP [ $ ]
$11,353
FAMILY INCOME DEFICIT
0.38
INEQUALITY / GINI INDEX
15,638
TOTAL POPULATION
7,717
MALE POPULATION
7,921
FEMALE POPULATION
97.42
MALES / 100 FEMALES
102.64
FEMALES / 100 MALES
35.1
MEDIAN AGE
3.4
AVG FAMILY SIZE
2.8
AVG HOUSEHOLD SIZE
7,602
LABOR FORCE [ PEOPLE ]
64.7%
PERCENT IN LABOR FORCE
3.9%
UNEMPLOYMENT RATE
Chubbuck Area Codes
Income in Chubbuck
Income Overview in Chubbuck
Per Capita Income in Chubbuck is $30,782, while median incomes of families and households are $88,384 and $69,992 respectively.
| Characteristic | Number | Measure |
| Per Capita Income | 15,638 | $30,782 |
| Median Family Income | 4,007 | $88,384 |
| Mean Family Income | 4,007 | $100,555 |
| Median Household Income | 5,671 | $69,992 |
| Mean Household Income | 5,671 | $84,448 |
| Income Deficit | 4,007 | $11,353 |
| Wage / Income Gap (%) | 15,638 | 39.01% |
| Wage / Income Gap ($) | 15,638 | 60.99¢ per $1 |
| Gini / Inequality Index | 15,638 | 0.38 |
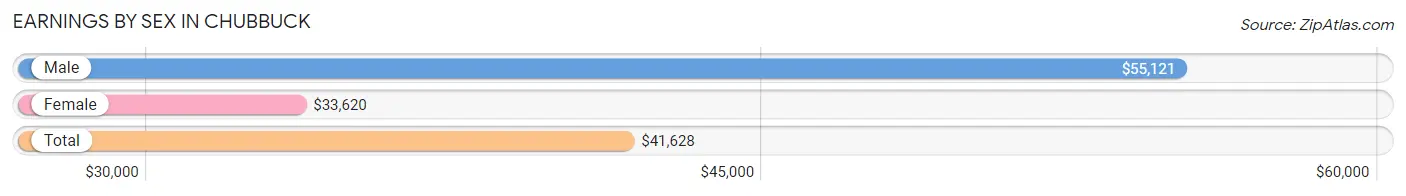
Earnings by Sex in Chubbuck
Average Earnings in Chubbuck are $41,628, $55,121 for men and $33,620 for women, a difference of 39.0%.
| Sex | Number | Average Earnings |
| Male | 4,223 (53.2%) | $55,121 |
| Female | 3,708 (46.8%) | $33,620 |
| Total | 7,931 (100.0%) | $41,628 |
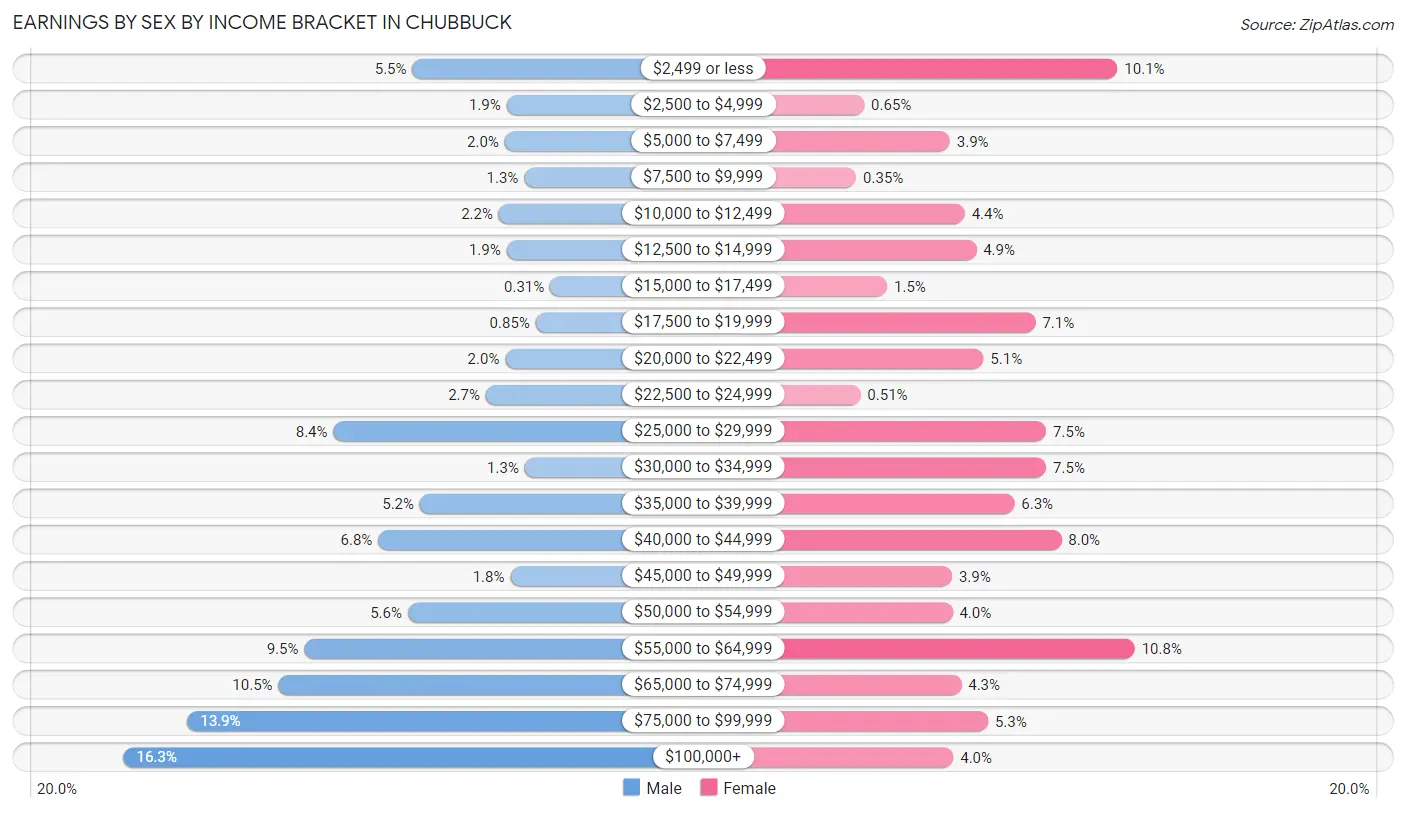
Earnings by Sex by Income Bracket in Chubbuck
The most common earnings brackets in Chubbuck are $100,000+ for men (688 | 16.3%) and $55,000 to $64,999 for women (400 | 10.8%).
| Income | Male | Female |
| $2,499 or less | 231 (5.5%) | 376 (10.1%) |
| $2,500 to $4,999 | 82 (1.9%) | 24 (0.6%) |
| $5,000 to $7,499 | 85 (2.0%) | 143 (3.9%) |
| $7,500 to $9,999 | 54 (1.3%) | 13 (0.4%) |
| $10,000 to $12,499 | 94 (2.2%) | 164 (4.4%) |
| $12,500 to $14,999 | 82 (1.9%) | 180 (4.9%) |
| $15,000 to $17,499 | 13 (0.3%) | 56 (1.5%) |
| $17,500 to $19,999 | 36 (0.9%) | 262 (7.1%) |
| $20,000 to $22,499 | 84 (2.0%) | 190 (5.1%) |
| $22,500 to $24,999 | 115 (2.7%) | 19 (0.5%) |
| $25,000 to $29,999 | 356 (8.4%) | 277 (7.5%) |
| $30,000 to $34,999 | 53 (1.3%) | 277 (7.5%) |
| $35,000 to $39,999 | 219 (5.2%) | 233 (6.3%) |
| $40,000 to $44,999 | 285 (6.8%) | 298 (8.0%) |
| $45,000 to $49,999 | 76 (1.8%) | 146 (3.9%) |
| $50,000 to $54,999 | 238 (5.6%) | 147 (4.0%) |
| $55,000 to $64,999 | 402 (9.5%) | 400 (10.8%) |
| $65,000 to $74,999 | 443 (10.5%) | 159 (4.3%) |
| $75,000 to $99,999 | 587 (13.9%) | 196 (5.3%) |
| $100,000+ | 688 (16.3%) | 148 (4.0%) |
| Total | 4,223 (100.0%) | 3,708 (100.0%) |
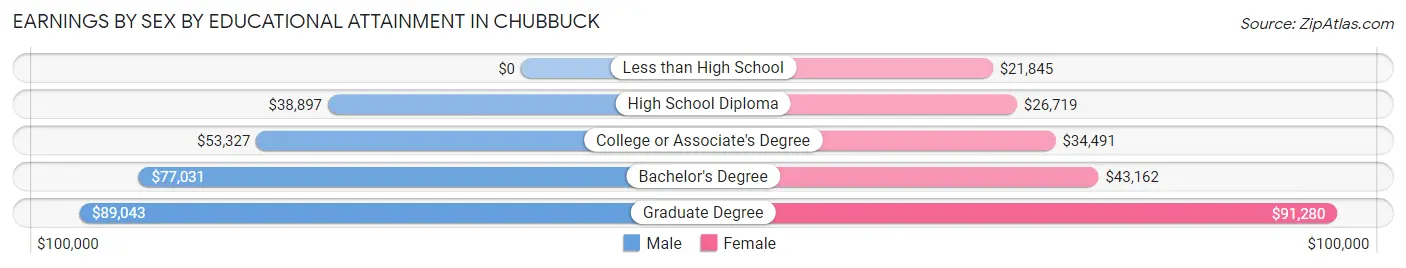
Earnings by Sex by Educational Attainment in Chubbuck
Average earnings in Chubbuck are $63,203 for men and $34,977 for women, a difference of 44.7%. Men with an educational attainment of graduate degree enjoy the highest average annual earnings of $89,043, while those with high school diploma education earn the least with $38,897. Women with an educational attainment of graduate degree earn the most with the average annual earnings of $91,280, while those with less than high school education have the smallest earnings of $21,845.
| Educational Attainment | Male Income | Female Income |
| Less than High School | - | - |
| High School Diploma | $38,897 | $26,719 |
| College or Associate's Degree | $53,327 | $34,491 |
| Bachelor's Degree | $77,031 | $43,162 |
| Graduate Degree | $89,043 | $91,280 |
| Total | $63,203 | $34,977 |
Family Income in Chubbuck
Family Income Brackets in Chubbuck
According to the Chubbuck family income data, there are 1,002 families falling into the $100,000 to $149,999 income range, which is the most common income bracket and makes up 25.0% of all families.
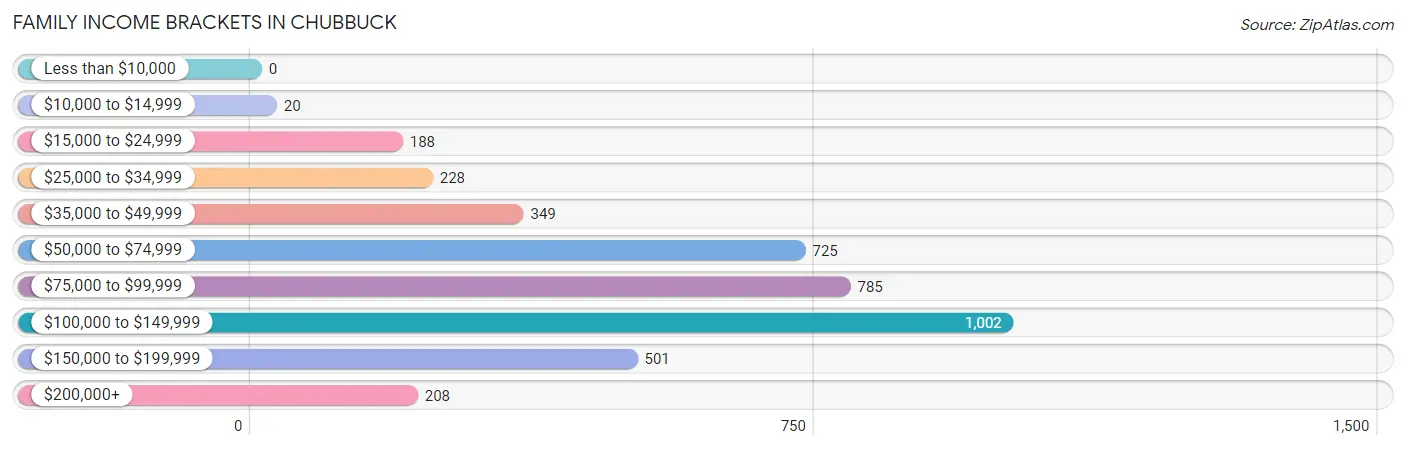
| Income Bracket | # Families | % Families |
| Less than $10,000 | 0 | 0.0% |
| $10,000 to $14,999 | 20 | 0.5% |
| $15,000 to $24,999 | 188 | 4.7% |
| $25,000 to $34,999 | 228 | 5.7% |
| $35,000 to $49,999 | 349 | 8.7% |
| $50,000 to $74,999 | 725 | 18.1% |
| $75,000 to $99,999 | 785 | 19.6% |
| $100,000 to $149,999 | 1,002 | 25.0% |
| $150,000 to $199,999 | 501 | 12.5% |
| $200,000+ | 208 | 5.2% |
Family Income by Famaliy Size in Chubbuck
6-person families (200 | 5.0%) account for the highest median family income in Chubbuck with $115,217 per family, while 2-person families (1,664 | 41.5%) have the highest median income of $38,152 per family member.
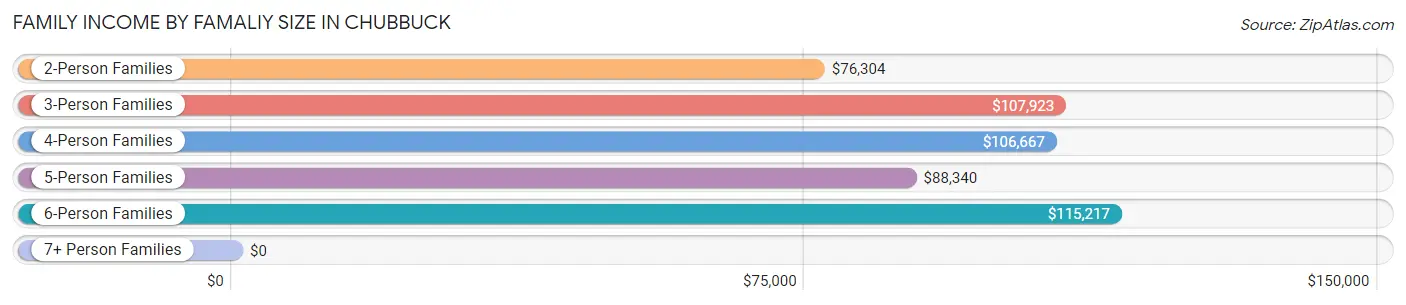
| Income Bracket | # Families | Median Income |
| 2-Person Families | 1,664 (41.5%) | $76,304 |
| 3-Person Families | 624 (15.6%) | $107,923 |
| 4-Person Families | 938 (23.4%) | $106,667 |
| 5-Person Families | 467 (11.7%) | $88,340 |
| 6-Person Families | 200 (5.0%) | $115,217 |
| 7+ Person Families | 114 (2.9%) | $0 |
| Total | 4,007 (100.0%) | $88,384 |
Family Income by Number of Earners in Chubbuck
The median family income in Chubbuck is $88,384, with families comprising 3+ earners (629) having the highest median family income of $165,703, while families with no earners (611) have the lowest median family income of $47,659, accounting for 15.7% and 15.2% of families, respectively.
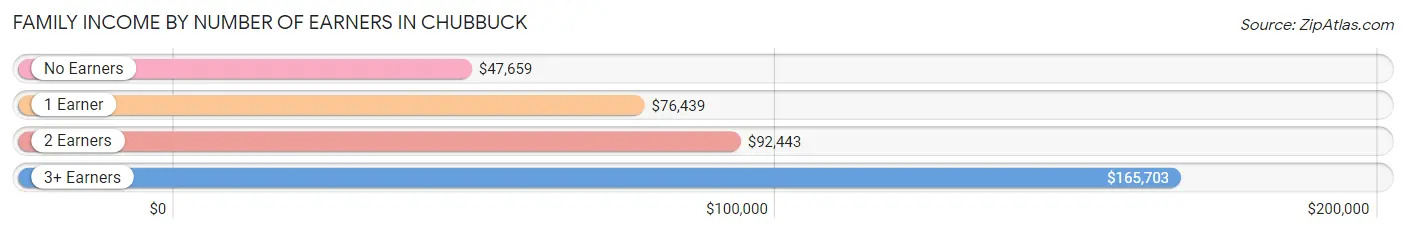
| Number of Earners | # Families | Median Income |
| No Earners | 611 (15.2%) | $47,659 |
| 1 Earner | 1,040 (26.0%) | $76,439 |
| 2 Earners | 1,727 (43.1%) | $92,443 |
| 3+ Earners | 629 (15.7%) | $165,703 |
| Total | 4,007 (100.0%) | $88,384 |
Household Income in Chubbuck
Household Income Brackets in Chubbuck
With 1,083 households falling in the category, the $50,000 to $74,999 income range is the most frequent in Chubbuck, accounting for 19.1% of all households. In contrast, only 153 households (2.7%) fall into the less than $10,000 income bracket, making it the least populous group.
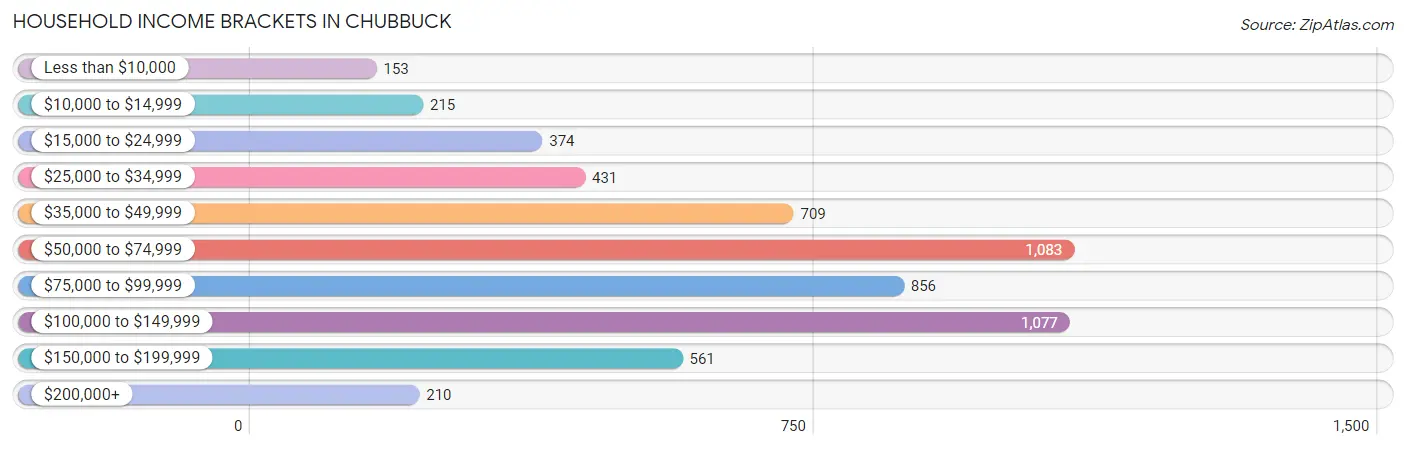
| Income Bracket | # Households | % Households |
| Less than $10,000 | 153 | 2.7% |
| $10,000 to $14,999 | 215 | 3.8% |
| $15,000 to $24,999 | 374 | 6.6% |
| $25,000 to $34,999 | 431 | 7.6% |
| $35,000 to $49,999 | 709 | 12.5% |
| $50,000 to $74,999 | 1,083 | 19.1% |
| $75,000 to $99,999 | 856 | 15.1% |
| $100,000 to $149,999 | 1,077 | 19.0% |
| $150,000 to $199,999 | 561 | 9.9% |
| $200,000+ | 210 | 3.7% |
Household Income by Householder Age in Chubbuck
The median household income in Chubbuck is $69,992, with the highest median household income of $104,387 found in the 45 to 64 years age bracket for the primary householder. A total of 2,042 households (36.0%) fall into this category. Meanwhile, the 15 to 24 years age bracket for the primary householder has the lowest median household income of $29,046, with 167 households (2.9%) in this group.
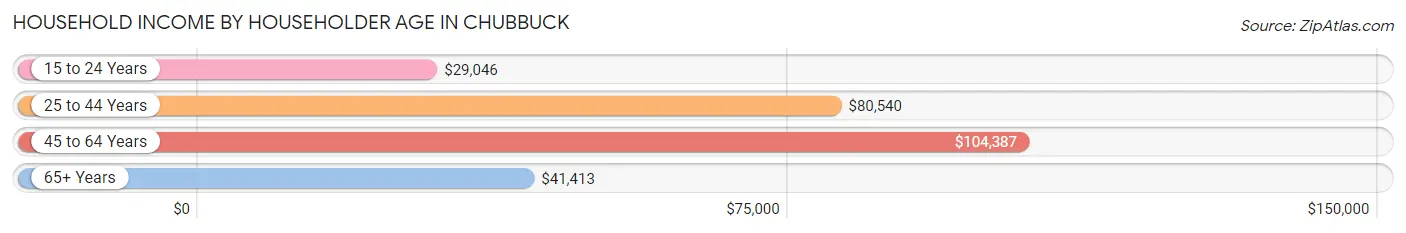
| Income Bracket | # Households | Median Income |
| 15 to 24 Years | 167 (2.9%) | $29,046 |
| 25 to 44 Years | 2,031 (35.8%) | $80,540 |
| 45 to 64 Years | 2,042 (36.0%) | $104,387 |
| 65+ Years | 1,431 (25.2%) | $41,413 |
| Total | 5,671 (100.0%) | $69,992 |
Poverty in Chubbuck
Income Below Poverty by Sex and Age in Chubbuck
With 8.1% poverty level for males and 8.3% for females among the residents of Chubbuck, 15 year old males and under 5 year old females are the most vulnerable to poverty, with 70 males (39.8%) and 146 females (28.0%) in their respective age groups living below the poverty level.
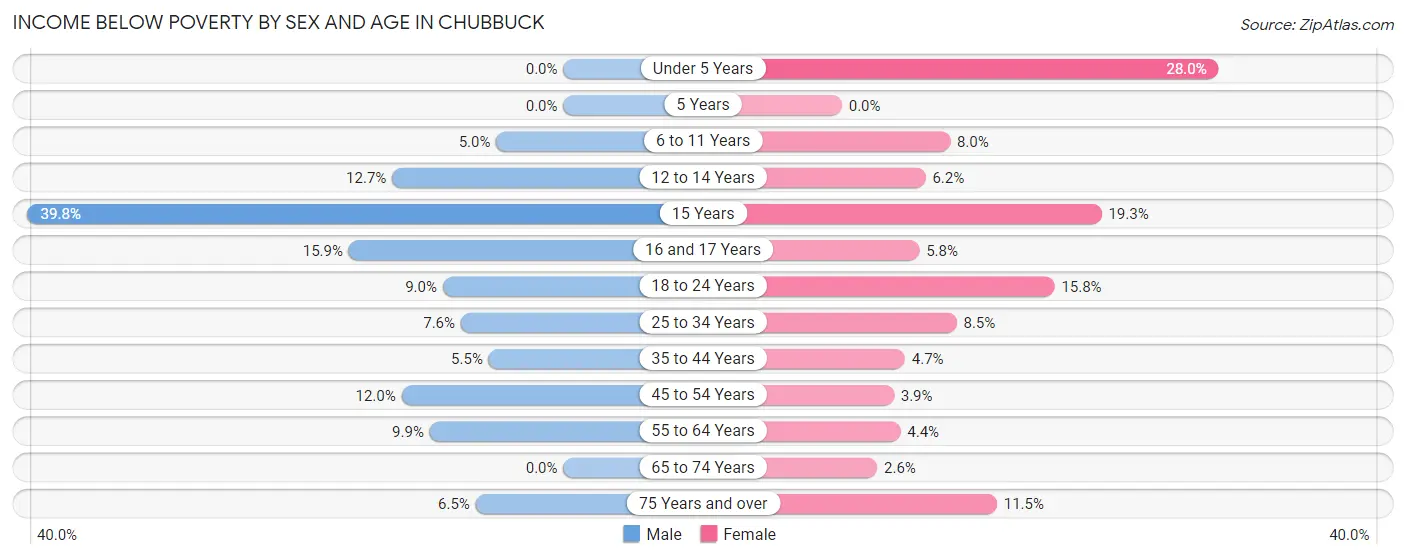
| Age Bracket | Male | Female |
| Under 5 Years | 0 (0.0%) | 146 (28.0%) |
| 5 Years | 0 (0.0%) | 0 (0.0%) |
| 6 to 11 Years | 48 (5.0%) | 66 (8.0%) |
| 12 to 14 Years | 46 (12.7%) | 21 (6.2%) |
| 15 Years | 70 (39.8%) | 16 (19.3%) |
| 16 and 17 Years | 58 (15.9%) | 21 (5.8%) |
| 18 to 24 Years | 45 (8.9%) | 99 (15.8%) |
| 25 to 34 Years | 94 (7.6%) | 68 (8.5%) |
| 35 to 44 Years | 61 (5.5%) | 46 (4.7%) |
| 45 to 54 Years | 91 (12.0%) | 41 (3.9%) |
| 55 to 64 Years | 87 (9.9%) | 38 (4.3%) |
| 65 to 74 Years | 0 (0.0%) | 18 (2.6%) |
| 75 Years and over | 22 (6.5%) | 73 (11.5%) |
| Total | 622 (8.1%) | 653 (8.3%) |
Income Above Poverty by Sex and Age in Chubbuck
According to the poverty statistics in Chubbuck, males aged under 5 years and females aged 5 years are the age groups that are most secure financially, with 100.0% of males and 100.0% of females in these age groups living above the poverty line.
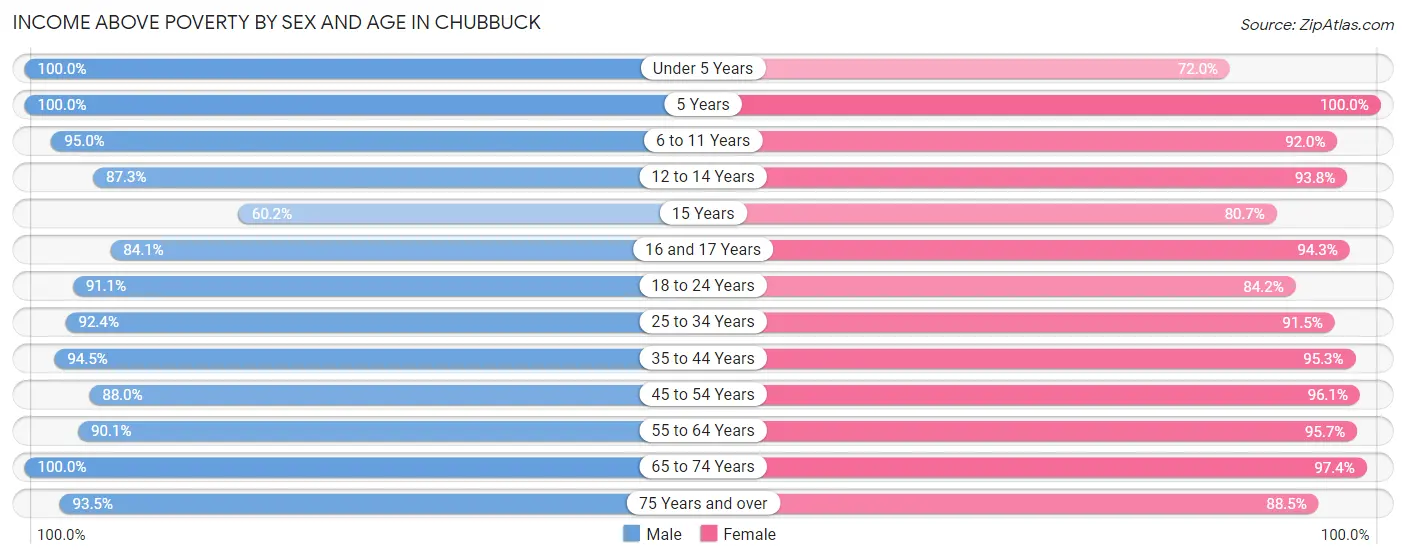
| Age Bracket | Male | Female |
| Under 5 Years | 323 (100.0%) | 376 (72.0%) |
| 5 Years | 151 (100.0%) | 98 (100.0%) |
| 6 to 11 Years | 916 (95.0%) | 756 (92.0%) |
| 12 to 14 Years | 316 (87.3%) | 317 (93.8%) |
| 15 Years | 106 (60.2%) | 67 (80.7%) |
| 16 and 17 Years | 306 (84.1%) | 344 (94.3%) |
| 18 to 24 Years | 458 (91.0%) | 528 (84.2%) |
| 25 to 34 Years | 1,141 (92.4%) | 730 (91.5%) |
| 35 to 44 Years | 1,040 (94.5%) | 936 (95.3%) |
| 45 to 54 Years | 667 (88.0%) | 1,022 (96.1%) |
| 55 to 64 Years | 790 (90.1%) | 835 (95.7%) |
| 65 to 74 Years | 541 (100.0%) | 668 (97.4%) |
| 75 Years and over | 316 (93.5%) | 561 (88.5%) |
| Total | 7,071 (91.9%) | 7,238 (91.7%) |
Income Below Poverty Among Married-Couple Families in Chubbuck
The poverty statistics for married-couple families in Chubbuck show that 3.4% or 118 of the total 3,493 families live below the poverty line. Families with 5 or more children have the highest poverty rate of 58.7%, comprising of 61 families. On the other hand, families with no children have the lowest poverty rate of 0.7%, which includes 13 families.
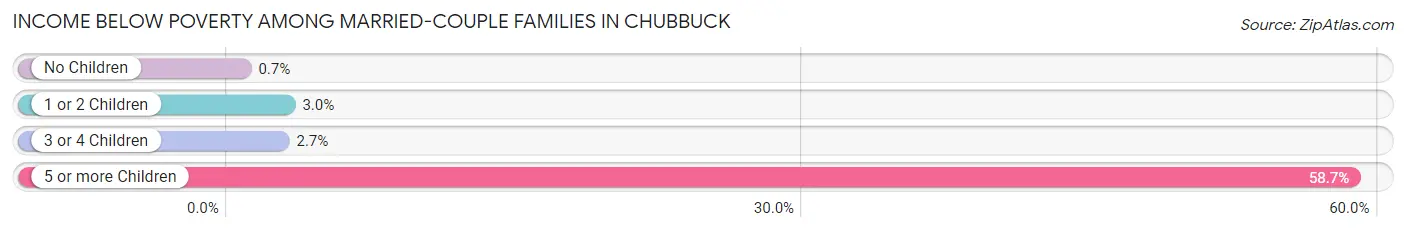
| Children | Above Poverty | Below Poverty |
| No Children | 1,854 (99.3%) | 13 (0.7%) |
| 1 or 2 Children | 971 (97.0%) | 30 (3.0%) |
| 3 or 4 Children | 507 (97.3%) | 14 (2.7%) |
| 5 or more Children | 43 (41.3%) | 61 (58.7%) |
| Total | 3,375 (96.6%) | 118 (3.4%) |
Income Below Poverty Among Single-Parent Households in Chubbuck
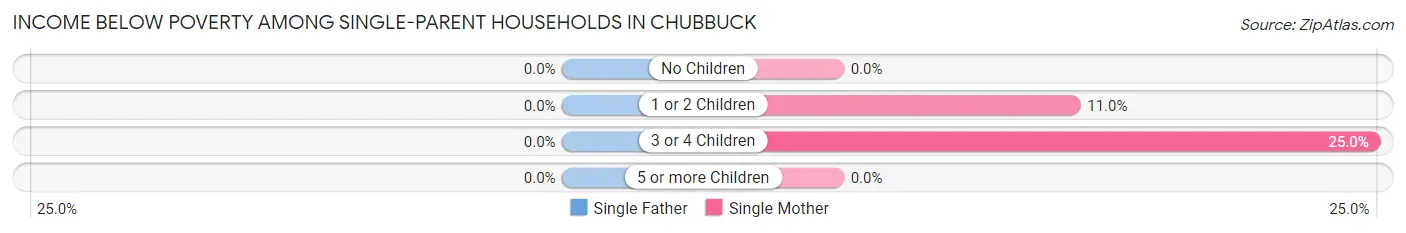
| Children | Single Father | Single Mother |
| No Children | 0 (0.0%) | 0 (0.0%) |
| 1 or 2 Children | 0 (0.0%) | 14 (11.0%) |
| 3 or 4 Children | 0 (0.0%) | 18 (25.0%) |
| 5 or more Children | 0 (0.0%) | 0 (0.0%) |
| Total | 0 (0.0%) | 32 (9.8%) |
Income Below Poverty Among Married-Couple vs Single-Parent Households in Chubbuck
The poverty data for Chubbuck shows that 118 of the married-couple family households (3.4%) and 32 of the single-parent households (6.2%) are living below the poverty level. Within the married-couple family households, those with 5 or more children have the highest poverty rate, with 61 households (58.7%) falling below the poverty line. Among the single-parent households, those with 3 or 4 children have the highest poverty rate, with 18 household (11.6%) living below poverty.
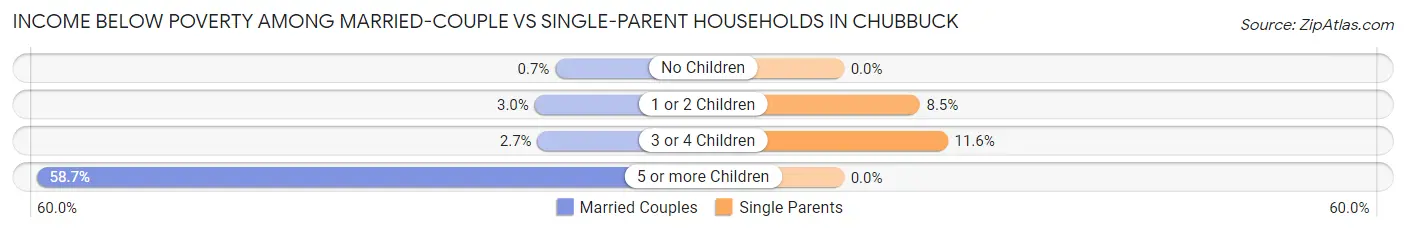
| Children | Married-Couple Families | Single-Parent Households |
| No Children | 13 (0.7%) | 0 (0.0%) |
| 1 or 2 Children | 30 (3.0%) | 14 (8.5%) |
| 3 or 4 Children | 14 (2.7%) | 18 (11.6%) |
| 5 or more Children | 61 (58.7%) | 0 (0.0%) |
| Total | 118 (3.4%) | 32 (6.2%) |
Race in Chubbuck
The most populous races in Chubbuck are White / Caucasian (13,357 | 85.4%), Hispanic or Latino (1,908 | 12.2%), and Two or more Races (934 | 6.0%).
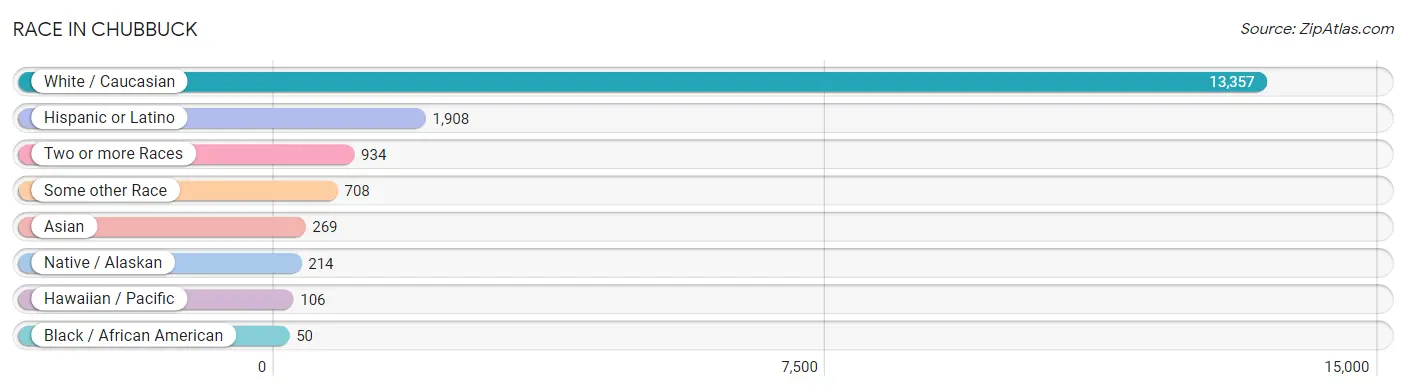
| Race | # Population | % Population |
| Asian | 269 | 1.7% |
| Black / African American | 50 | 0.3% |
| Hawaiian / Pacific | 106 | 0.7% |
| Hispanic or Latino | 1,908 | 12.2% |
| Native / Alaskan | 214 | 1.4% |
| White / Caucasian | 13,357 | 85.4% |
| Two or more Races | 934 | 6.0% |
| Some other Race | 708 | 4.5% |
| Total | 15,638 | 100.0% |
Ancestry in Chubbuck
The most populous ancestries reported in Chubbuck are English (3,476 | 22.2%), German (2,822 | 18.0%), Mexican (1,884 | 12.0%), American (1,178 | 7.5%), and Swedish (872 | 5.6%), together accounting for 65.4% of all Chubbuck residents.
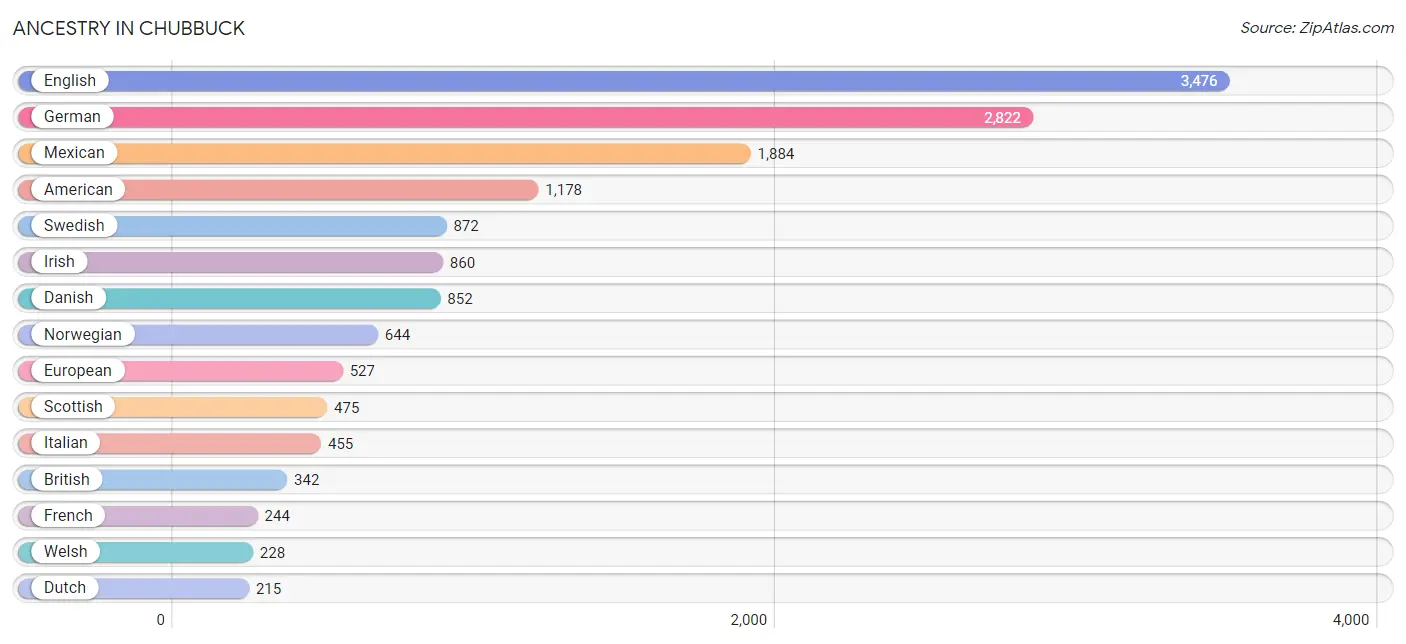
| Ancestry | # Population | % Population |
| American | 1,178 | 7.5% |
| Basque | 60 | 0.4% |
| Bhutanese | 47 | 0.3% |
| Blackfeet | 10 | 0.1% |
| Brazilian | 45 | 0.3% |
| British | 342 | 2.2% |
| Canadian | 28 | 0.2% |
| Cherokee | 38 | 0.2% |
| Chippewa | 27 | 0.2% |
| Creek | 6 | 0.0% |
| Cuban | 6 | 0.0% |
| Czech | 36 | 0.2% |
| Czechoslovakian | 17 | 0.1% |
| Danish | 852 | 5.4% |
| Dutch | 215 | 1.4% |
| English | 3,476 | 22.2% |
| Ethiopian | 17 | 0.1% |
| European | 527 | 3.4% |
| Finnish | 133 | 0.9% |
| French | 244 | 1.6% |
| French Canadian | 12 | 0.1% |
| German | 2,822 | 18.0% |
| Icelander | 17 | 0.1% |
| Indian (Asian) | 44 | 0.3% |
| Inupiat | 10 | 0.1% |
| Iranian | 16 | 0.1% |
| Irish | 860 | 5.5% |
| Italian | 455 | 2.9% |
| Korean | 37 | 0.2% |
| Mexican | 1,884 | 12.0% |
| Mexican American Indian | 43 | 0.3% |
| Native Hawaiian | 98 | 0.6% |
| Navajo | 10 | 0.1% |
| Northern European | 20 | 0.1% |
| Norwegian | 644 | 4.1% |
| Pennsylvania German | 10 | 0.1% |
| Polish | 131 | 0.8% |
| Russian | 1 | 0.0% |
| Scandinavian | 142 | 0.9% |
| Scotch-Irish | 88 | 0.6% |
| Scottish | 475 | 3.0% |
| Shoshone | 30 | 0.2% |
| Sioux | 99 | 0.6% |
| Spaniard | 18 | 0.1% |
| Subsaharan African | 17 | 0.1% |
| Swedish | 872 | 5.6% |
| Thai | 135 | 0.9% |
| Welsh | 228 | 1.5% | View All 48 Rows |
Immigrants in Chubbuck
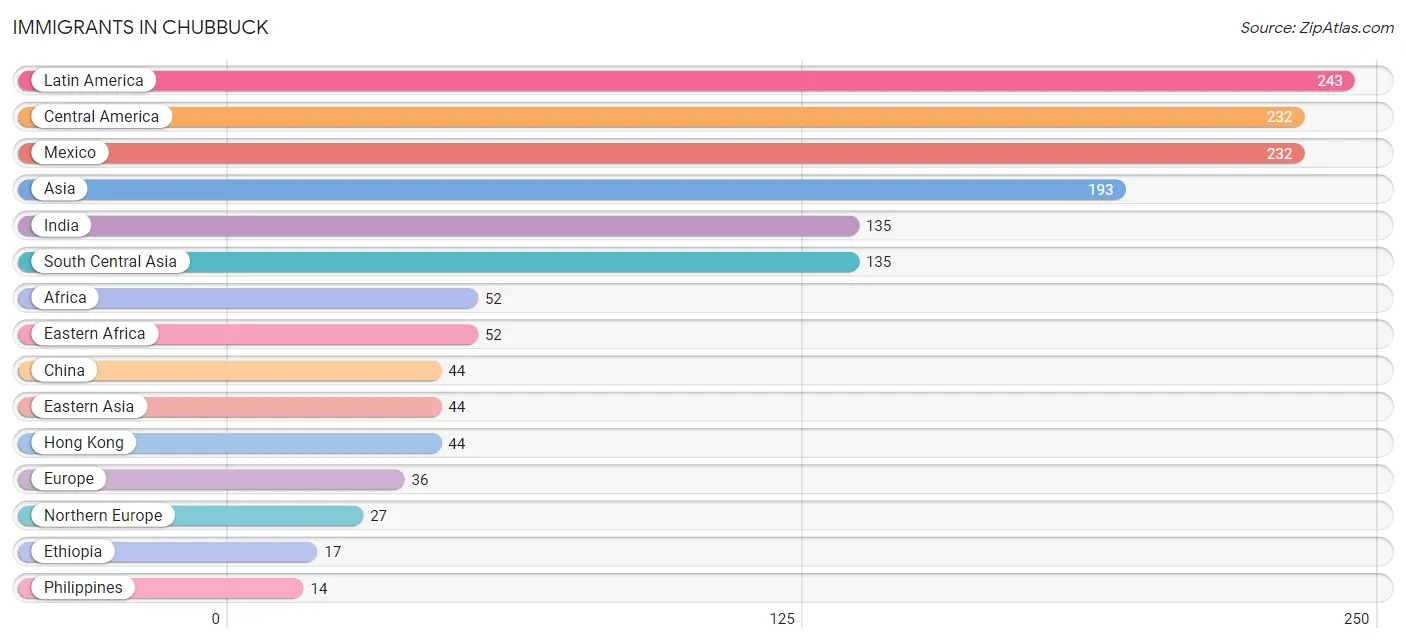
The most numerous immigrant groups reported in Chubbuck came from Latin America (243 | 1.5%), Central America (232 | 1.5%), Mexico (232 | 1.5%), Asia (193 | 1.2%), and India (135 | 0.9%), together accounting for 6.6% of all Chubbuck residents.
| Immigration Origin | # Population | % Population |
| Africa | 52 | 0.3% |
| Asia | 193 | 1.2% |
| Brazil | 11 | 0.1% |
| Canada | 11 | 0.1% |
| Central America | 232 | 1.5% |
| China | 44 | 0.3% |
| Eastern Africa | 52 | 0.3% |
| Eastern Asia | 44 | 0.3% |
| Ethiopia | 17 | 0.1% |
| Europe | 36 | 0.2% |
| Fiji | 8 | 0.1% |
| France | 9 | 0.1% |
| Hong Kong | 44 | 0.3% |
| India | 135 | 0.9% |
| Latin America | 243 | 1.5% |
| Mexico | 232 | 1.5% |
| Northern Europe | 27 | 0.2% |
| Oceania | 8 | 0.1% |
| Philippines | 14 | 0.1% |
| South America | 11 | 0.1% |
| South Central Asia | 135 | 0.9% |
| South Eastern Asia | 14 | 0.1% |
| Western Europe | 9 | 0.1% | View All 23 Rows |
Sex and Age in Chubbuck
Sex and Age in Chubbuck
The most populous age groups in Chubbuck are 5 to 9 Years (747 | 9.7%) for men and 5 to 9 Years (684 | 8.6%) for women.
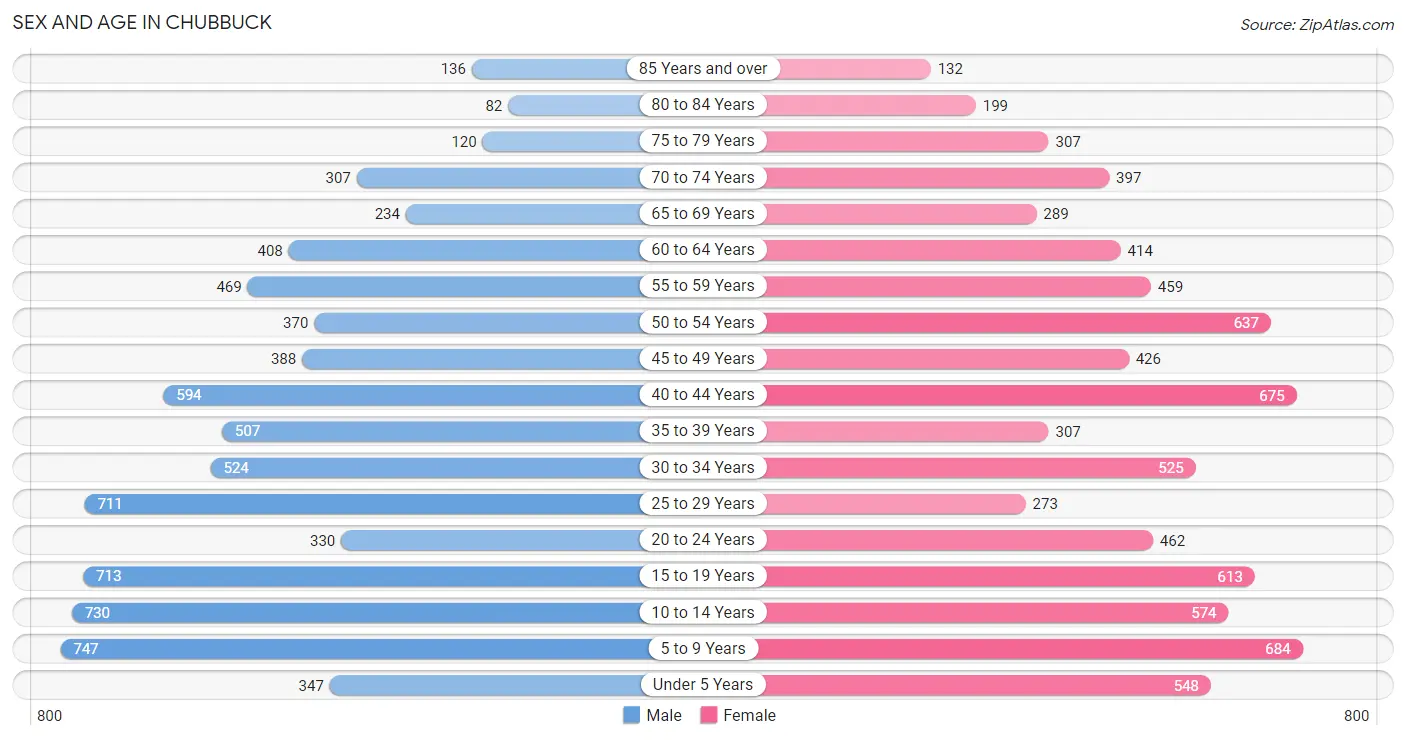
| Age Bracket | Male | Female |
| Under 5 Years | 347 (4.5%) | 548 (6.9%) |
| 5 to 9 Years | 747 (9.7%) | 684 (8.6%) |
| 10 to 14 Years | 730 (9.5%) | 574 (7.2%) |
| 15 to 19 Years | 713 (9.2%) | 613 (7.7%) |
| 20 to 24 Years | 330 (4.3%) | 462 (5.8%) |
| 25 to 29 Years | 711 (9.2%) | 273 (3.5%) |
| 30 to 34 Years | 524 (6.8%) | 525 (6.6%) |
| 35 to 39 Years | 507 (6.6%) | 307 (3.9%) |
| 40 to 44 Years | 594 (7.7%) | 675 (8.5%) |
| 45 to 49 Years | 388 (5.0%) | 426 (5.4%) |
| 50 to 54 Years | 370 (4.8%) | 637 (8.0%) |
| 55 to 59 Years | 469 (6.1%) | 459 (5.8%) |
| 60 to 64 Years | 408 (5.3%) | 414 (5.2%) |
| 65 to 69 Years | 234 (3.0%) | 289 (3.6%) |
| 70 to 74 Years | 307 (4.0%) | 397 (5.0%) |
| 75 to 79 Years | 120 (1.6%) | 307 (3.9%) |
| 80 to 84 Years | 82 (1.1%) | 199 (2.5%) |
| 85 Years and over | 136 (1.8%) | 132 (1.7%) |
| Total | 7,717 (100.0%) | 7,921 (100.0%) |
Families and Households in Chubbuck
Median Family Size in Chubbuck
The median family size in Chubbuck is 3.37 persons per family, with single female/mother families (327 | 8.2%) accounting for the largest median family size of 4.36 persons per family. On the other hand, single male/father families (187 | 4.7%) represent the smallest median family size with 2.92 persons per family.
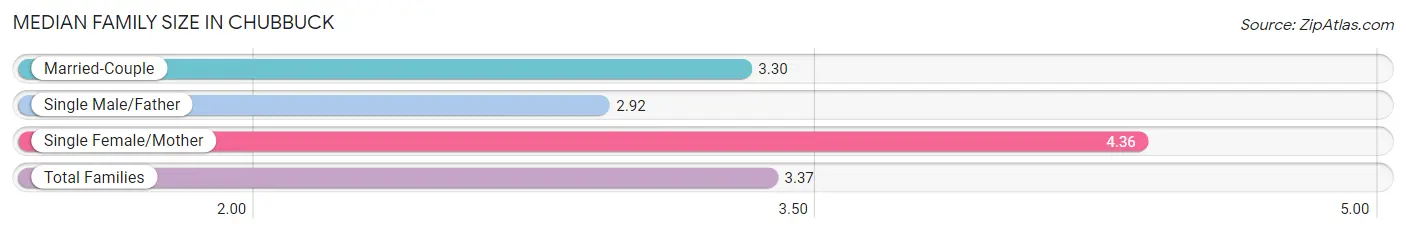
| Family Type | # Families | Family Size |
| Married-Couple | 3,493 (87.2%) | 3.30 |
| Single Male/Father | 187 (4.7%) | 2.92 |
| Single Female/Mother | 327 (8.2%) | 4.36 |
| Total Families | 4,007 (100.0%) | 3.37 |
Median Household Size in Chubbuck
The median household size in Chubbuck is 2.75 persons per household, with single female/mother households (327 | 5.8%) accounting for the largest median household size of 4.4 persons per household. non-family households (1,664 | 29.3%) represent the smallest median household size with 1.22 persons per household.
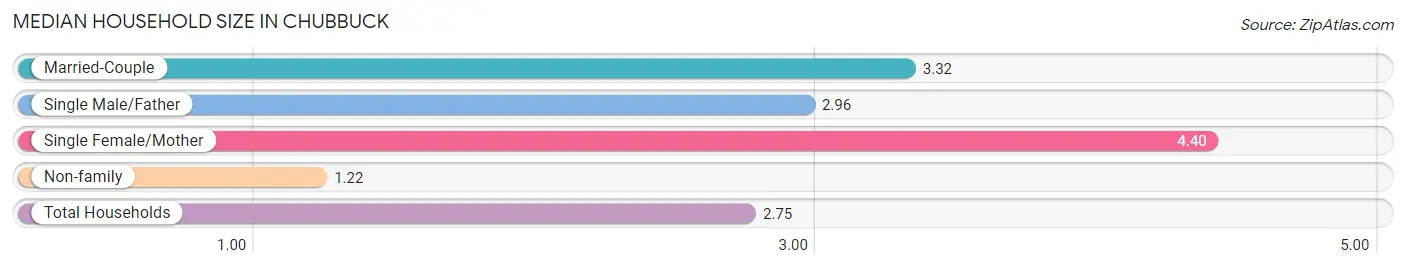
| Household Type | # Households | Household Size |
| Married-Couple | 3,493 (61.6%) | 3.32 |
| Single Male/Father | 187 (3.3%) | 2.96 |
| Single Female/Mother | 327 (5.8%) | 4.40 |
| Non-family | 1,664 (29.3%) | 1.22 |
| Total Households | 5,671 (100.0%) | 2.75 |
Household Size by Marriage Status in Chubbuck
Out of a total of 5,671 households in Chubbuck, 4,007 (70.7%) are family households, while 1,664 (29.3%) are nonfamily households. The most numerous type of family households are 2-person households, comprising 1,657, and the most common type of nonfamily households are 1-person households, comprising 1,384.
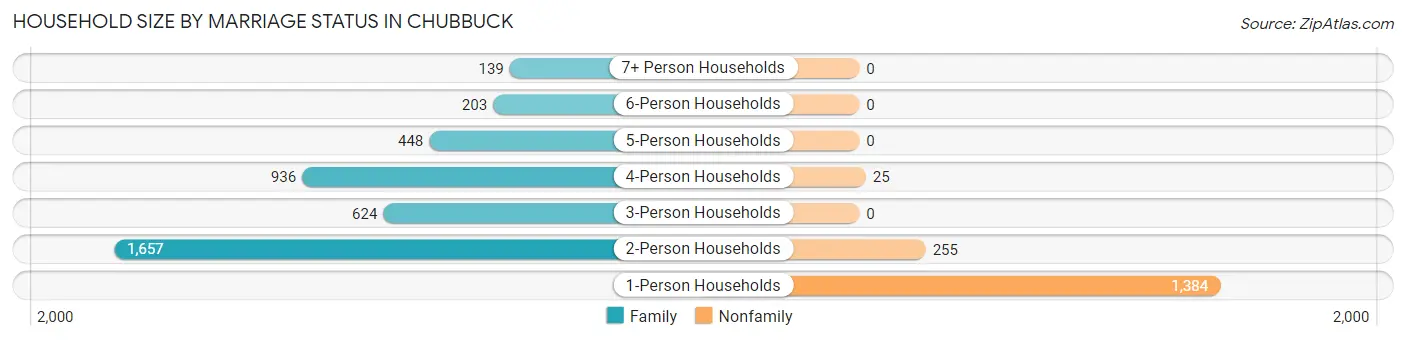
| Household Size | Family Households | Nonfamily Households |
| 1-Person Households | - | 1,384 (24.4%) |
| 2-Person Households | 1,657 (29.2%) | 255 (4.5%) |
| 3-Person Households | 624 (11.0%) | 0 (0.0%) |
| 4-Person Households | 936 (16.5%) | 25 (0.4%) |
| 5-Person Households | 448 (7.9%) | 0 (0.0%) |
| 6-Person Households | 203 (3.6%) | 0 (0.0%) |
| 7+ Person Households | 139 (2.5%) | 0 (0.0%) |
| Total | 4,007 (70.7%) | 1,664 (29.3%) |
Female Fertility in Chubbuck
Fertility by Age in Chubbuck
Average fertility rate in Chubbuck is 49.0 births per 1,000 women. Women in the age bracket of 20 to 34 years have the highest fertility rate with 115.0 births per 1,000 women. Women in the age bracket of 20 to 34 years acount for 87.4% of all women with births.
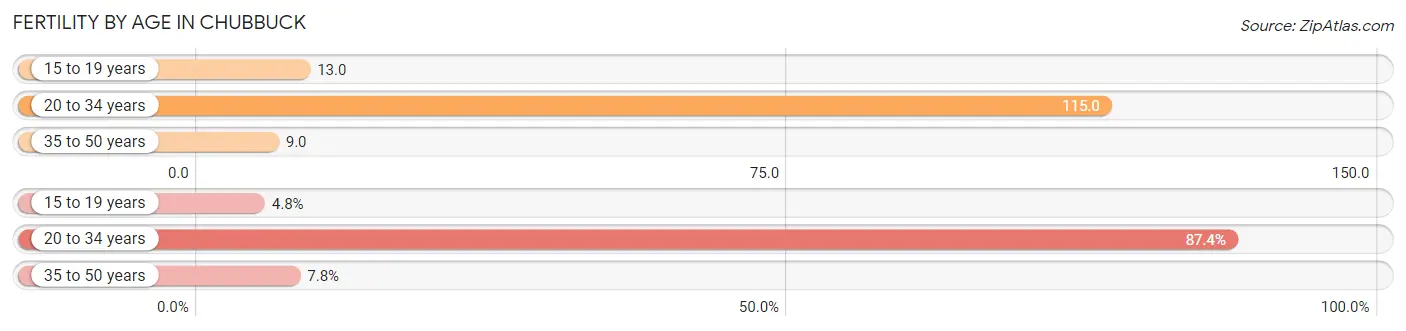
| Age Bracket | Women with Births | Births / 1,000 Women |
| 15 to 19 years | 8 (4.8%) | 13.0 |
| 20 to 34 years | 145 (87.4%) | 115.0 |
| 35 to 50 years | 13 (7.8%) | 9.0 |
| Total | 166 (100.0%) | 49.0 |
Fertility by Age by Marriage Status in Chubbuck
95.2% of women with births (166) in Chubbuck are married. The highest percentage of unmarried women with births falls into 20 to 34 years age bracket with 5.5% of them unmarried at the time of birth, while the lowest percentage of unmarried women with births belong to 15 to 19 years age bracket with 0.0% of them unmarried.
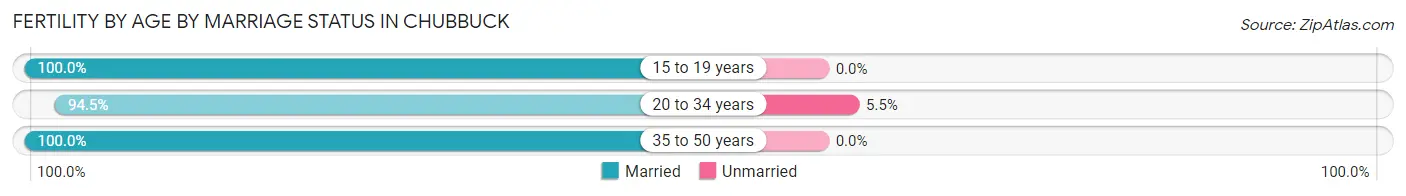
| Age Bracket | Married | Unmarried |
| 15 to 19 years | 8 (100.0%) | 0 (0.0%) |
| 20 to 34 years | 137 (94.5%) | 8 (5.5%) |
| 35 to 50 years | 13 (100.0%) | 0 (0.0%) |
| Total | 158 (95.2%) | 8 (4.8%) |
Fertility by Education in Chubbuck
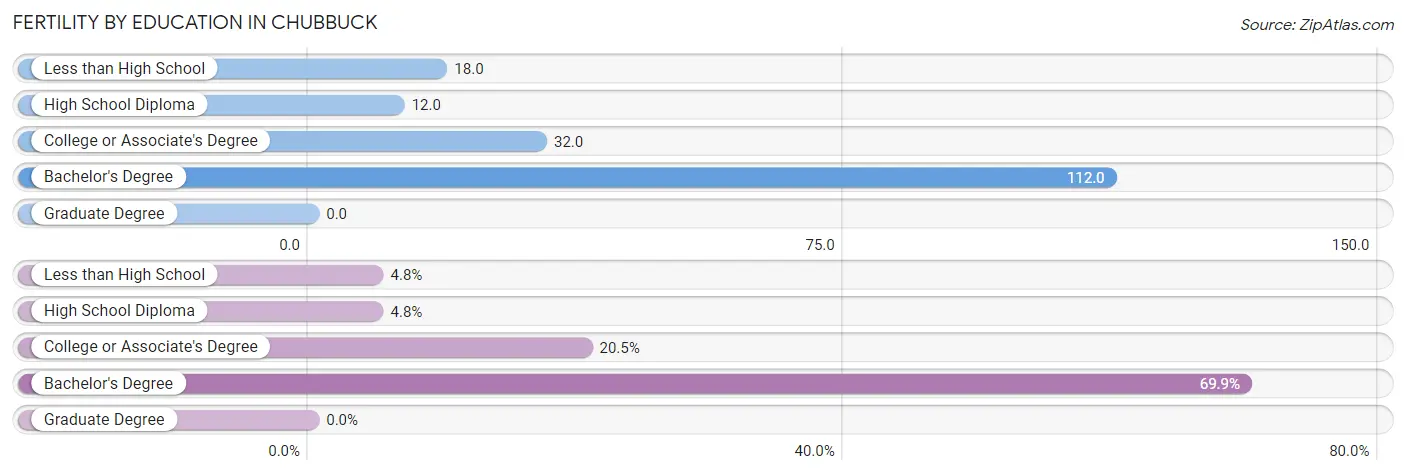
| Educational Attainment | Women with Births | Births / 1,000 Women |
| Less than High School | 8 (4.8%) | 18.0 |
| High School Diploma | 8 (4.8%) | 12.0 |
| College or Associate's Degree | 34 (20.5%) | 32.0 |
| Bachelor's Degree | 116 (69.9%) | 112.0 |
| Graduate Degree | 0 (0.0%) | 0.0 |
| Total | 166 (100.0%) | 49.0 |
Fertility by Education by Marriage Status in Chubbuck
4.8% of women with births in Chubbuck are unmarried. Women with the educational attainment of less than high school are most likely to be married with 100.0% of them married at childbirth, while women with the educational attainment of college or associate's degree are least likely to be married with 23.5% of them unmarried at childbirth.
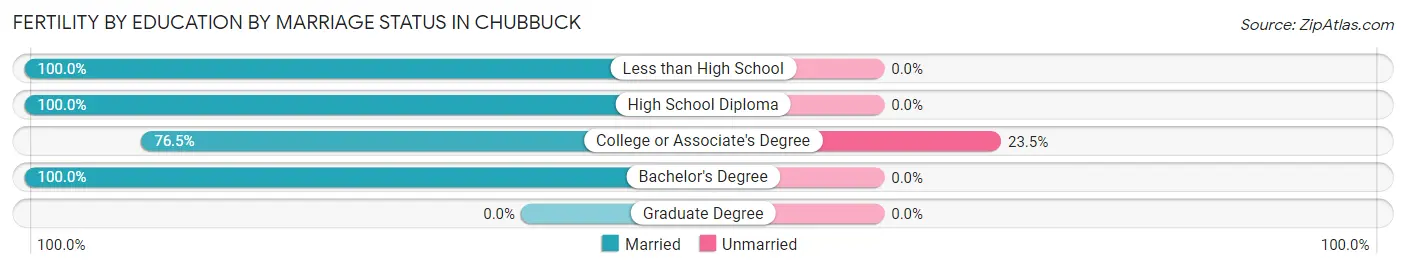
| Educational Attainment | Married | Unmarried |
| Less than High School | 8 (100.0%) | 0 (0.0%) |
| High School Diploma | 8 (100.0%) | 0 (0.0%) |
| College or Associate's Degree | 26 (76.5%) | 8 (23.5%) |
| Bachelor's Degree | 116 (100.0%) | 0 (0.0%) |
| Graduate Degree | 0 (0.0%) | 0 (0.0%) |
| Total | 158 (95.2%) | 8 (4.8%) |
Employment Characteristics in Chubbuck
Employment by Class of Employer in Chubbuck
Among the 7,200 employed individuals in Chubbuck, private company employees (5,173 | 71.9%), state government employees (498 | 6.9%), and local government employees (403 | 5.6%) make up the most common classes of employment.
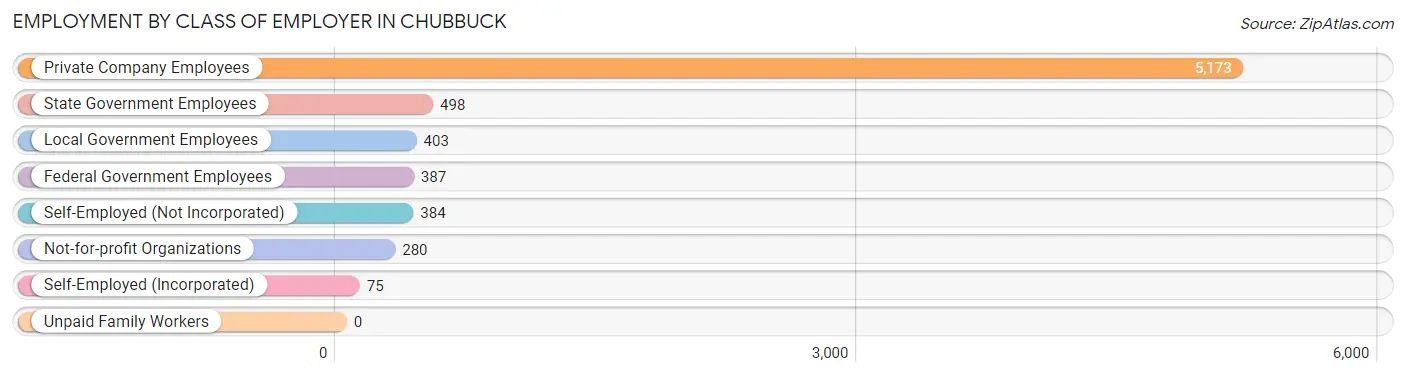
| Employer Class | # Employees | % Employees |
| Private Company Employees | 5,173 | 71.9% |
| Self-Employed (Incorporated) | 75 | 1.0% |
| Self-Employed (Not Incorporated) | 384 | 5.3% |
| Not-for-profit Organizations | 280 | 3.9% |
| Local Government Employees | 403 | 5.6% |
| State Government Employees | 498 | 6.9% |
| Federal Government Employees | 387 | 5.4% |
| Unpaid Family Workers | 0 | 0.0% |
| Total | 7,200 | 100.0% |
Employment Status by Age in Chubbuck
According to the labor force statistics for Chubbuck, out of the total population over 16 years of age (11,749), 64.7% or 7,602 individuals are in the labor force, with 3.9% or 296 of them unemployed. The age group with the highest labor force participation rate is 25 to 29 years, with 94.6% or 931 individuals in the labor force. Within the labor force, the 65 to 74 years age range has the highest percentage of unemployed individuals, with 29.5% or 65 of them being unemployed.
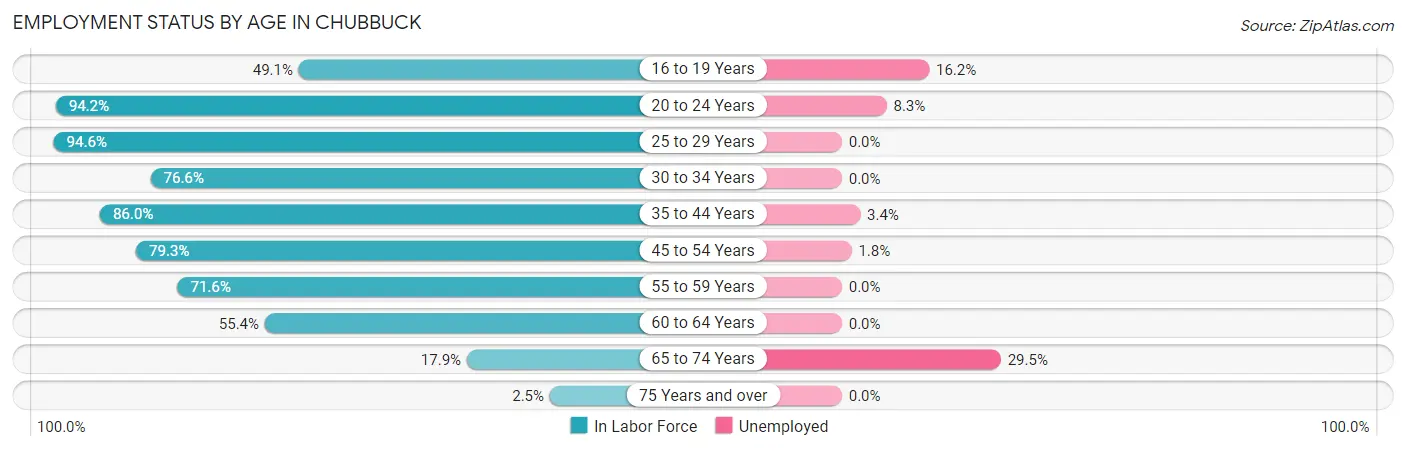
| Age Bracket | In Labor Force | Unemployed |
| 16 to 19 Years | 524 (49.1%) | 85 (16.2%) |
| 20 to 24 Years | 746 (94.2%) | 62 (8.3%) |
| 25 to 29 Years | 931 (94.6%) | 0 (0.0%) |
| 30 to 34 Years | 804 (76.6%) | 0 (0.0%) |
| 35 to 44 Years | 1,791 (86.0%) | 61 (3.4%) |
| 45 to 54 Years | 1,444 (79.3%) | 26 (1.8%) |
| 55 to 59 Years | 664 (71.6%) | 0 (0.0%) |
| 60 to 64 Years | 455 (55.4%) | 0 (0.0%) |
| 65 to 74 Years | 220 (17.9%) | 65 (29.5%) |
| 75 Years and over | 24 (2.5%) | 0 (0.0%) |
| Total | 7,602 (64.7%) | 296 (3.9%) |
Employment Status by Educational Attainment in Chubbuck
According to labor force statistics for Chubbuck, 79.2% of individuals (6,088) out of the total population between 25 and 64 years of age (7,687) are in the labor force, with 1.4% or 85 of them being unemployed. The group with the highest labor force participation rate are those with the educational attainment of bachelor's degree or higher, with 91.8% or 2,275 individuals in the labor force. Within the labor force, individuals with high school diploma education have the highest percentage of unemployment, with 2.6% or 31 of them being unemployed.
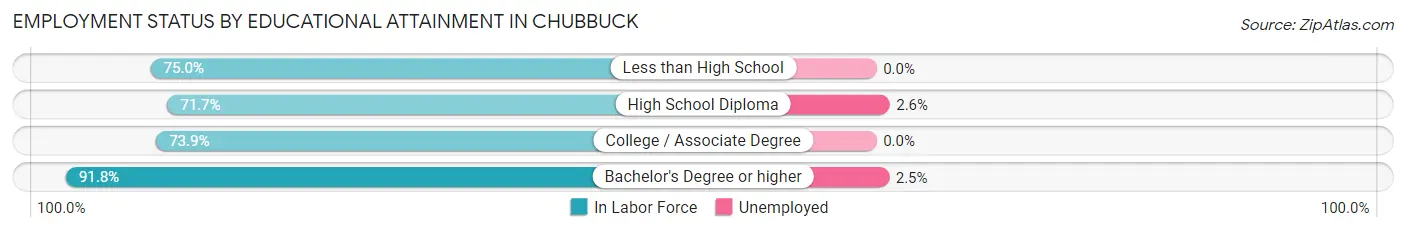
| Educational Attainment | In Labor Force | Unemployed |
| Less than High School | 186 (75.0%) | 0 (0.0%) |
| High School Diploma | 1,184 (71.7%) | 43 (2.6%) |
| College / Associate Degree | 2,445 (73.9%) | 0 (0.0%) |
| Bachelor's Degree or higher | 2,275 (91.8%) | 62 (2.5%) |
| Total | 6,088 (79.2%) | 108 (1.4%) |
Employment Occupations by Sex in Chubbuck
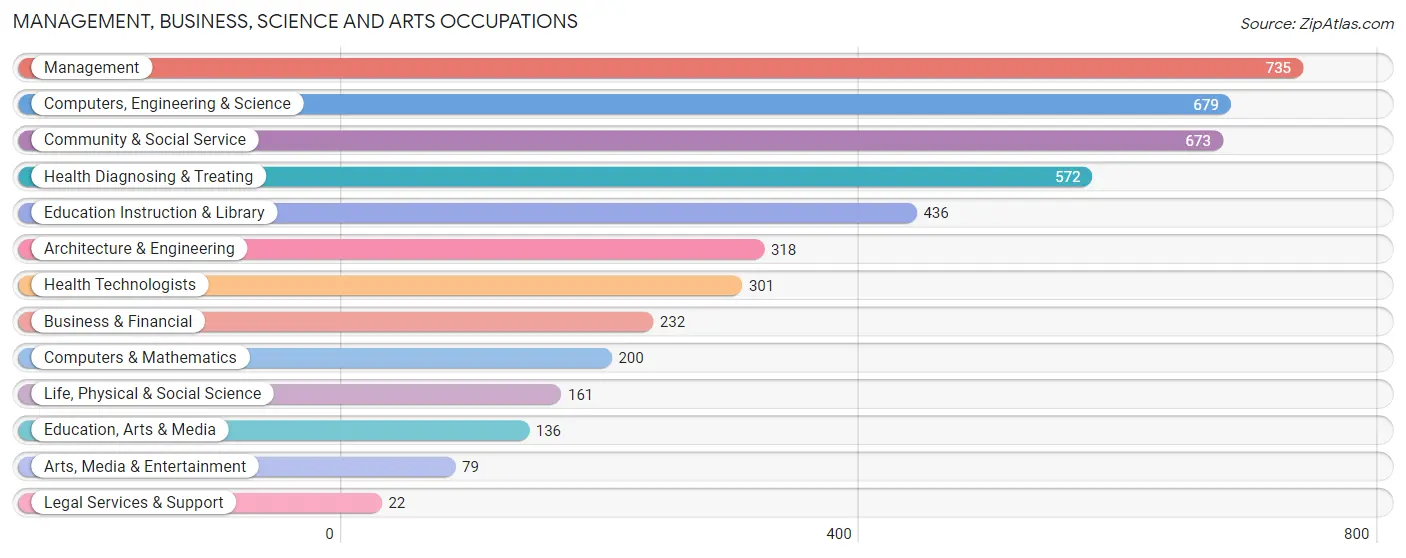
Management, Business, Science and Arts Occupations
The most common Management, Business, Science and Arts occupations in Chubbuck are Management (735 | 10.1%), Computers, Engineering & Science (679 | 9.3%), Community & Social Service (673 | 9.3%), Health Diagnosing & Treating (572 | 7.9%), and Education Instruction & Library (436 | 6.0%).
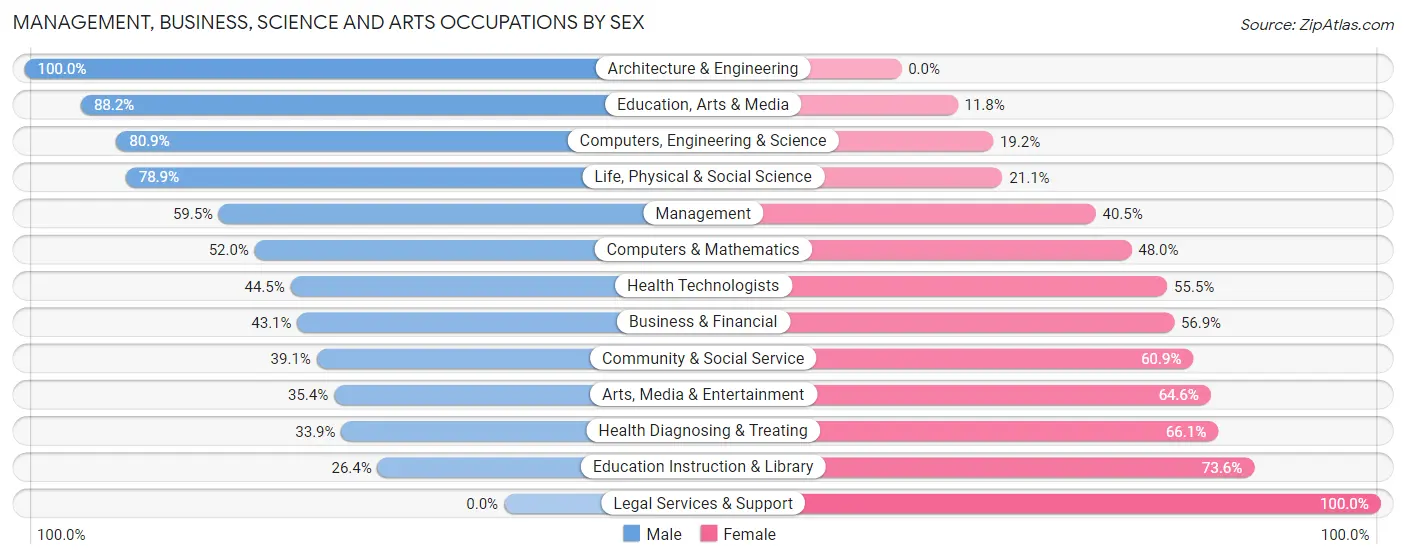
Management, Business, Science and Arts Occupations by Sex
Within the Management, Business, Science and Arts occupations in Chubbuck, the most male-oriented occupations are Architecture & Engineering (100.0%), Education, Arts & Media (88.2%), and Computers, Engineering & Science (80.8%), while the most female-oriented occupations are Legal Services & Support (100.0%), Education Instruction & Library (73.6%), and Health Diagnosing & Treating (66.1%).
| Occupation | Male | Female |
| Management | 437 (59.5%) | 298 (40.5%) |
| Business & Financial | 100 (43.1%) | 132 (56.9%) |
| Computers, Engineering & Science | 549 (80.8%) | 130 (19.2%) |
| Computers & Mathematics | 104 (52.0%) | 96 (48.0%) |
| Architecture & Engineering | 318 (100.0%) | 0 (0.0%) |
| Life, Physical & Social Science | 127 (78.9%) | 34 (21.1%) |
| Community & Social Service | 263 (39.1%) | 410 (60.9%) |
| Education, Arts & Media | 120 (88.2%) | 16 (11.8%) |
| Legal Services & Support | 0 (0.0%) | 22 (100.0%) |
| Education Instruction & Library | 115 (26.4%) | 321 (73.6%) |
| Arts, Media & Entertainment | 28 (35.4%) | 51 (64.6%) |
| Health Diagnosing & Treating | 194 (33.9%) | 378 (66.1%) |
| Health Technologists | 134 (44.5%) | 167 (55.5%) |
| Total (Category) | 1,543 (53.4%) | 1,348 (46.6%) |
| Total (Overall) | 3,890 (53.5%) | 3,381 (46.5%) |
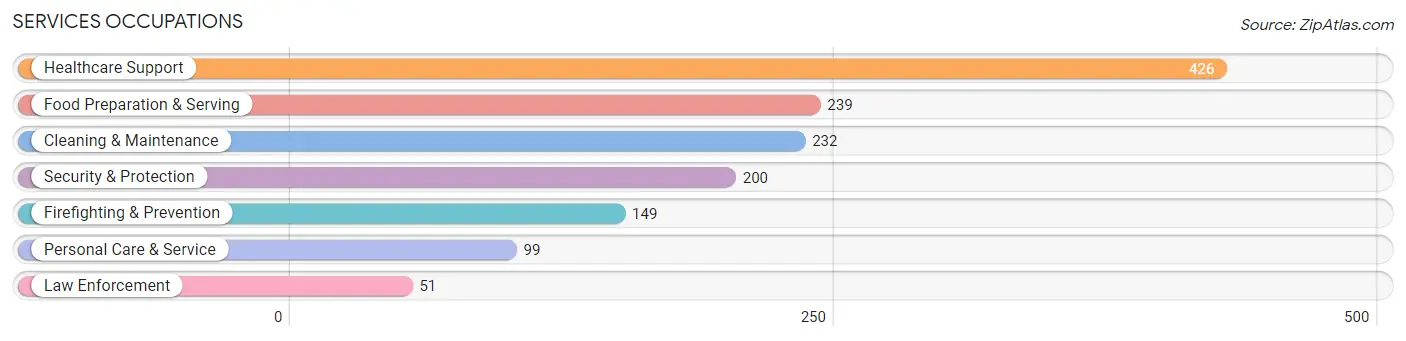
Services Occupations
The most common Services occupations in Chubbuck are Healthcare Support (426 | 5.9%), Food Preparation & Serving (239 | 3.3%), Cleaning & Maintenance (232 | 3.2%), Security & Protection (200 | 2.8%), and Firefighting & Prevention (149 | 2.1%).
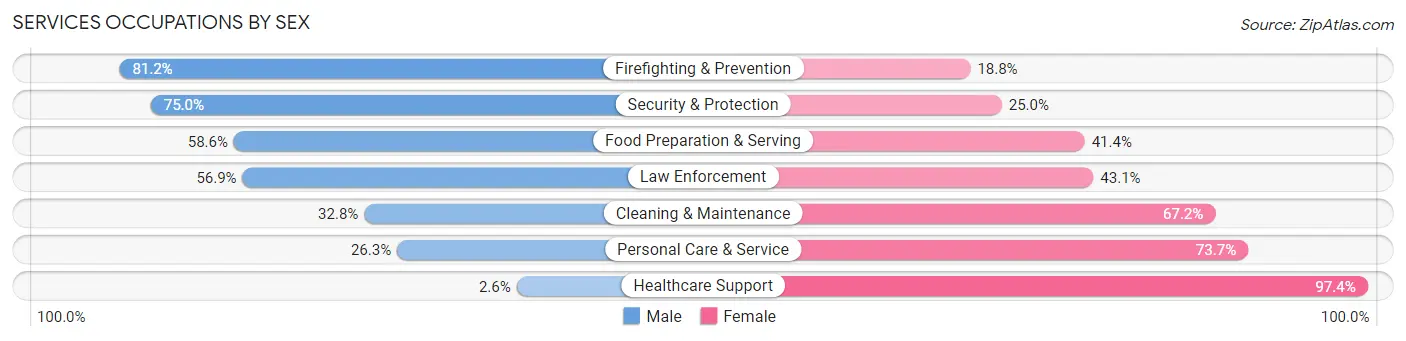
Services Occupations by Sex
Within the Services occupations in Chubbuck, the most male-oriented occupations are Firefighting & Prevention (81.2%), Security & Protection (75.0%), and Food Preparation & Serving (58.6%), while the most female-oriented occupations are Healthcare Support (97.4%), Personal Care & Service (73.7%), and Cleaning & Maintenance (67.2%).
| Occupation | Male | Female |
| Healthcare Support | 11 (2.6%) | 415 (97.4%) |
| Security & Protection | 150 (75.0%) | 50 (25.0%) |
| Firefighting & Prevention | 121 (81.2%) | 28 (18.8%) |
| Law Enforcement | 29 (56.9%) | 22 (43.1%) |
| Food Preparation & Serving | 140 (58.6%) | 99 (41.4%) |
| Cleaning & Maintenance | 76 (32.8%) | 156 (67.2%) |
| Personal Care & Service | 26 (26.3%) | 73 (73.7%) |
| Total (Category) | 403 (33.7%) | 793 (66.3%) |
| Total (Overall) | 3,890 (53.5%) | 3,381 (46.5%) |
Sales and Office Occupations
The most common Sales and Office occupations in Chubbuck are Office & Administration (971 | 13.4%), and Sales & Related (749 | 10.3%).
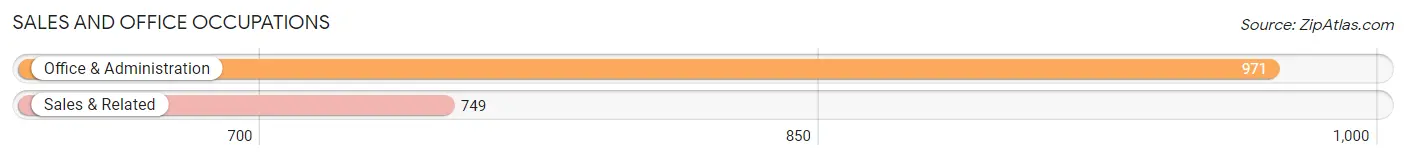
Sales and Office Occupations by Sex
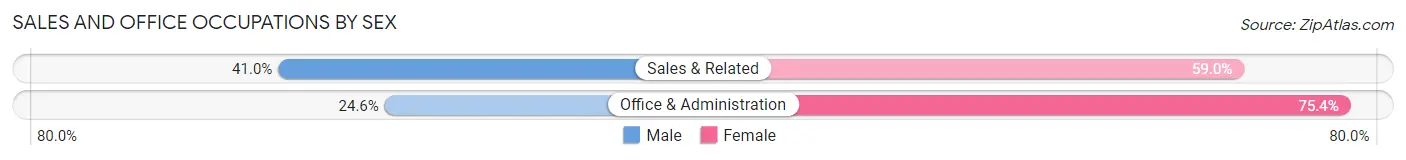
| Occupation | Male | Female |
| Sales & Related | 307 (41.0%) | 442 (59.0%) |
| Office & Administration | 239 (24.6%) | 732 (75.4%) |
| Total (Category) | 546 (31.7%) | 1,174 (68.3%) |
| Total (Overall) | 3,890 (53.5%) | 3,381 (46.5%) |
Natural Resources, Construction and Maintenance Occupations
The most common Natural Resources, Construction and Maintenance occupations in Chubbuck are Installation, Maintenance & Repair (354 | 4.9%), Construction & Extraction (288 | 4.0%), and Farming, Fishing & Forestry (17 | 0.2%).
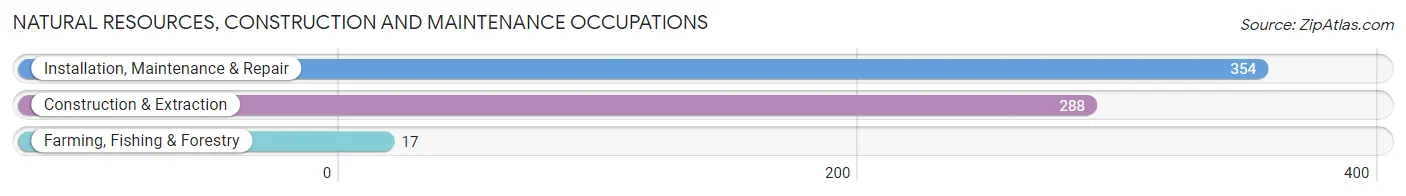
Natural Resources, Construction and Maintenance Occupations by Sex
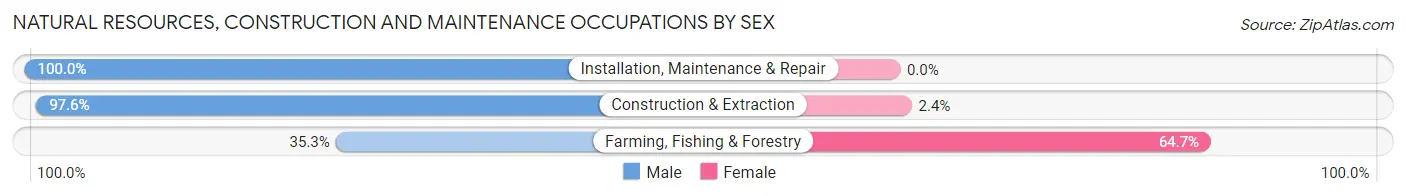
| Occupation | Male | Female |
| Farming, Fishing & Forestry | 6 (35.3%) | 11 (64.7%) |
| Construction & Extraction | 281 (97.6%) | 7 (2.4%) |
| Installation, Maintenance & Repair | 354 (100.0%) | 0 (0.0%) |
| Total (Category) | 641 (97.3%) | 18 (2.7%) |
| Total (Overall) | 3,890 (53.5%) | 3,381 (46.5%) |
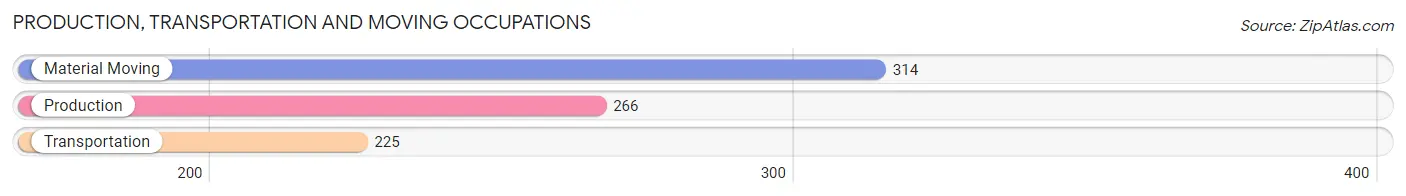
Production, Transportation and Moving Occupations
The most common Production, Transportation and Moving occupations in Chubbuck are Material Moving (314 | 4.3%), Production (266 | 3.7%), and Transportation (225 | 3.1%).
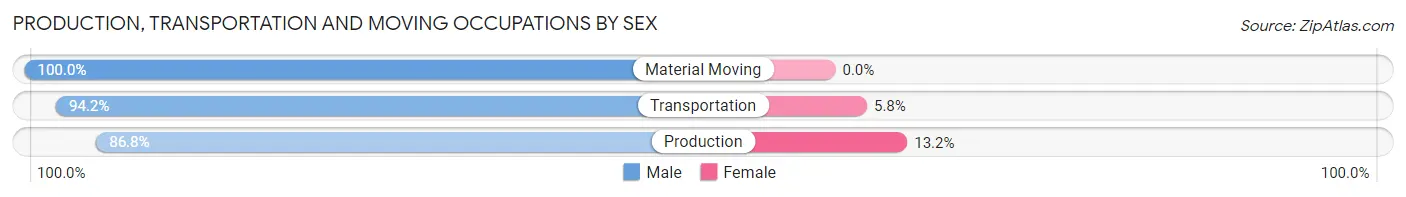
Production, Transportation and Moving Occupations by Sex
| Occupation | Male | Female |
| Production | 231 (86.8%) | 35 (13.2%) |
| Transportation | 212 (94.2%) | 13 (5.8%) |
| Material Moving | 314 (100.0%) | 0 (0.0%) |
| Total (Category) | 757 (94.0%) | 48 (6.0%) |
| Total (Overall) | 3,890 (53.5%) | 3,381 (46.5%) |
Employment Industries by Sex in Chubbuck
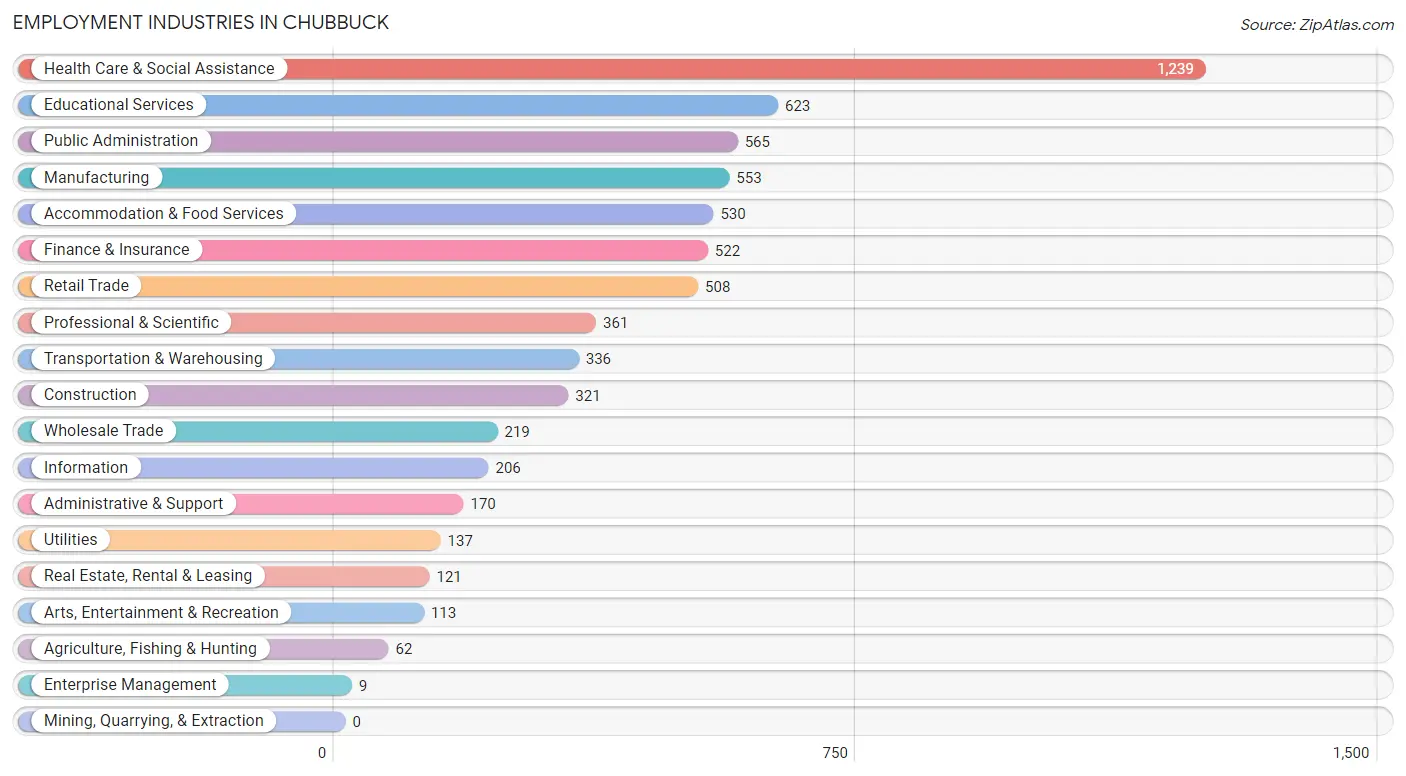
Employment Industries in Chubbuck
The major employment industries in Chubbuck include Health Care & Social Assistance (1,239 | 17.0%), Educational Services (623 | 8.6%), Public Administration (565 | 7.8%), Manufacturing (553 | 7.6%), and Accommodation & Food Services (530 | 7.3%).
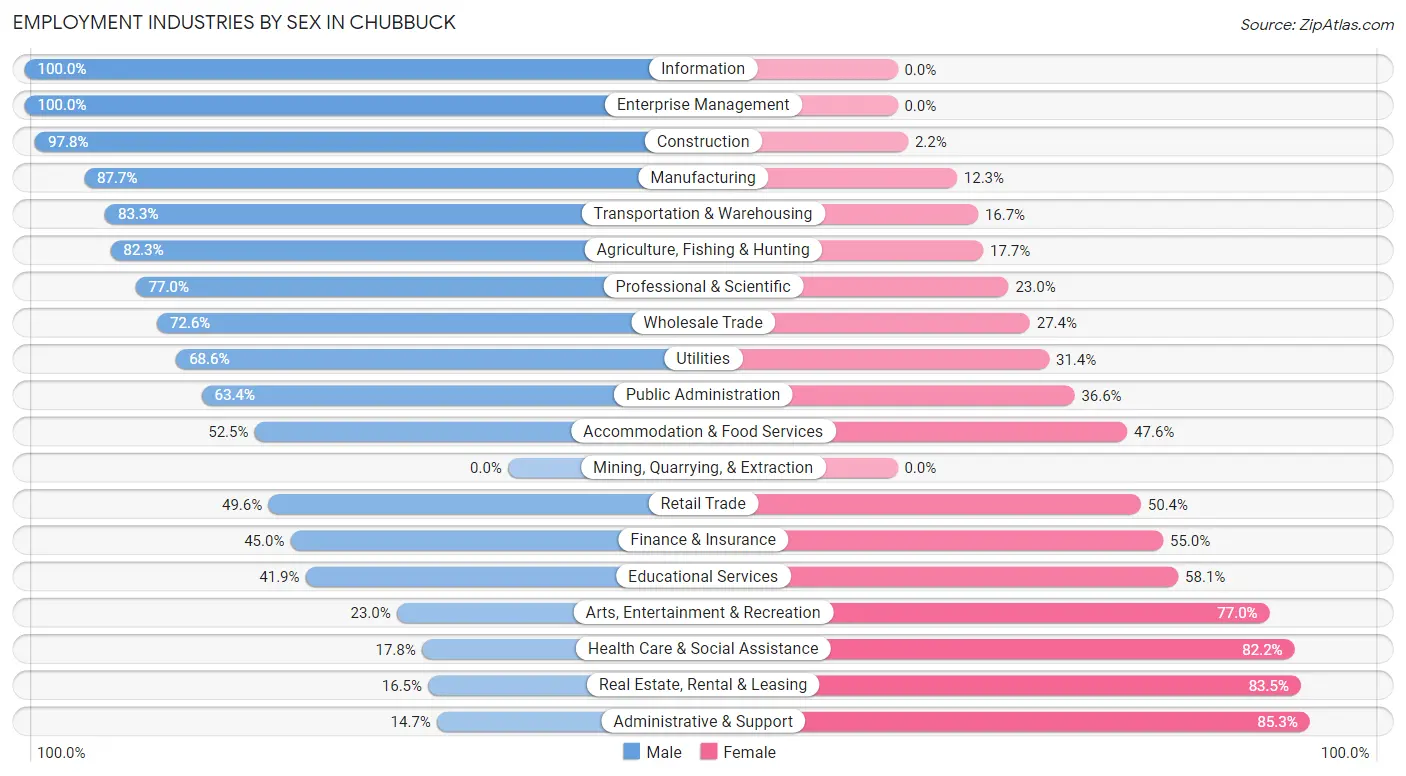
Employment Industries by Sex in Chubbuck
The Chubbuck industries that see more men than women are Information (100.0%), Enterprise Management (100.0%), and Construction (97.8%), whereas the industries that tend to have a higher number of women are Administrative & Support (85.3%), Real Estate, Rental & Leasing (83.5%), and Health Care & Social Assistance (82.2%).
| Industry | Male | Female |
| Agriculture, Fishing & Hunting | 51 (82.3%) | 11 (17.7%) |
| Mining, Quarrying, & Extraction | 0 (0.0%) | 0 (0.0%) |
| Construction | 314 (97.8%) | 7 (2.2%) |
| Manufacturing | 485 (87.7%) | 68 (12.3%) |
| Wholesale Trade | 159 (72.6%) | 60 (27.4%) |
| Retail Trade | 252 (49.6%) | 256 (50.4%) |
| Transportation & Warehousing | 280 (83.3%) | 56 (16.7%) |
| Utilities | 94 (68.6%) | 43 (31.4%) |
| Information | 206 (100.0%) | 0 (0.0%) |
| Finance & Insurance | 235 (45.0%) | 287 (55.0%) |
| Real Estate, Rental & Leasing | 20 (16.5%) | 101 (83.5%) |
| Professional & Scientific | 278 (77.0%) | 83 (23.0%) |
| Enterprise Management | 9 (100.0%) | 0 (0.0%) |
| Administrative & Support | 25 (14.7%) | 145 (85.3%) |
| Educational Services | 261 (41.9%) | 362 (58.1%) |
| Health Care & Social Assistance | 221 (17.8%) | 1,018 (82.2%) |
| Arts, Entertainment & Recreation | 26 (23.0%) | 87 (77.0%) |
| Accommodation & Food Services | 278 (52.4%) | 252 (47.5%) |
| Public Administration | 358 (63.4%) | 207 (36.6%) |
| Total | 3,890 (53.5%) | 3,381 (46.5%) |
Education in Chubbuck
School Enrollment in Chubbuck
The most common levels of schooling among the 4,346 students in Chubbuck are elementary school (1,176 | 27.1%), middle school (971 | 22.3%), and high school (902 | 20.7%).
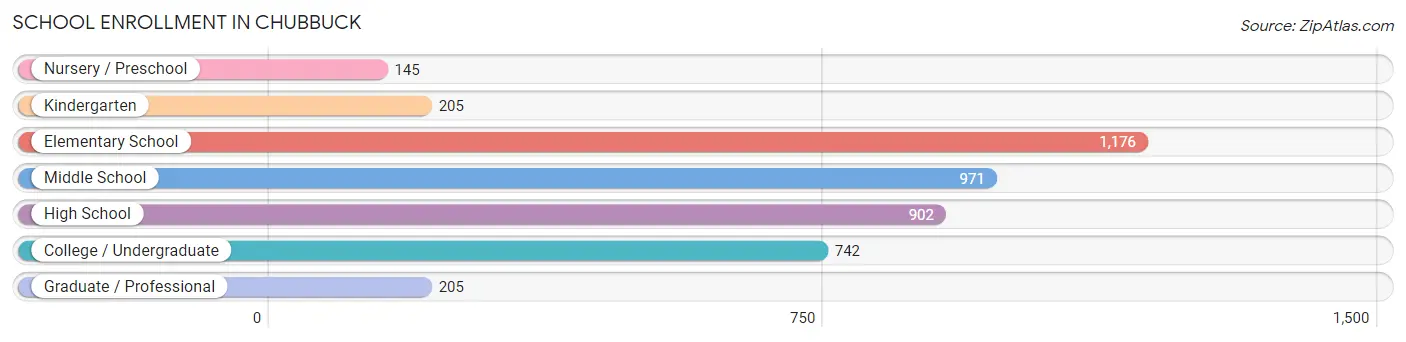
| School Level | # Students | % Students |
| Nursery / Preschool | 145 | 3.3% |
| Kindergarten | 205 | 4.7% |
| Elementary School | 1,176 | 27.1% |
| Middle School | 971 | 22.3% |
| High School | 902 | 20.7% |
| College / Undergraduate | 742 | 17.1% |
| Graduate / Professional | 205 | 4.7% |
| Total | 4,346 | 100.0% |
School Enrollment by Age by Funding Source in Chubbuck
Out of a total of 4,346 students who are enrolled in schools in Chubbuck, 465 (10.7%) attend a private institution, while the remaining 3,881 (89.3%) are enrolled in public schools. The age group of 3 to 4 year olds has the highest likelihood of being enrolled in private schools, with 64 (85.3% in the age bracket) enrolled. Conversely, the age group of 15 to 17 year olds has the lowest likelihood of being enrolled in a private school, with 886 (98.2% in the age bracket) attending a public institution.
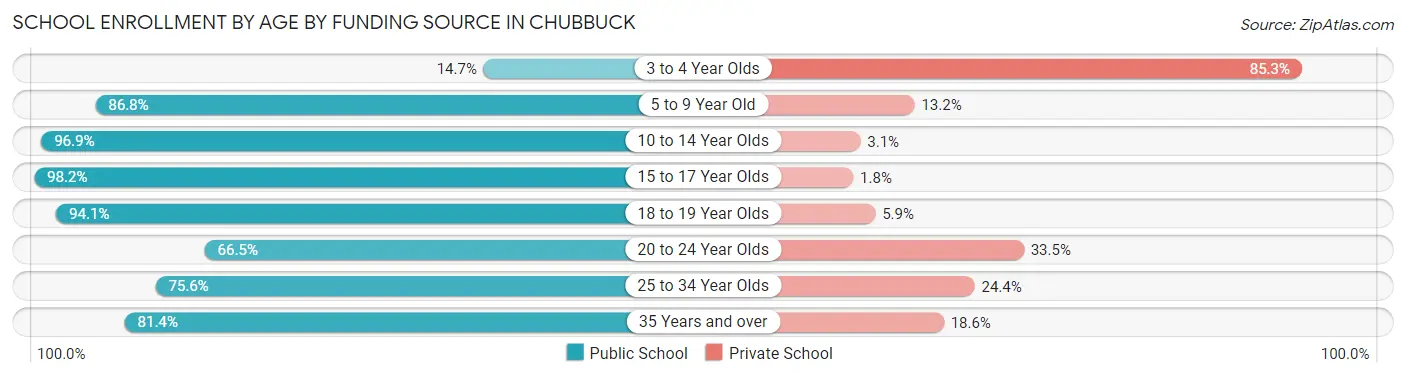
| Age Bracket | Public School | Private School |
| 3 to 4 Year Olds | 11 (14.7%) | 64 (85.3%) |
| 5 to 9 Year Old | 1,073 (86.8%) | 163 (13.2%) |
| 10 to 14 Year Olds | 1,189 (96.9%) | 38 (3.1%) |
| 15 to 17 Year Olds | 886 (98.2%) | 16 (1.8%) |
| 18 to 19 Year Olds | 208 (94.1%) | 13 (5.9%) |
| 20 to 24 Year Olds | 107 (66.5%) | 54 (33.5%) |
| 25 to 34 Year Olds | 242 (75.6%) | 78 (24.4%) |
| 35 Years and over | 166 (81.4%) | 38 (18.6%) |
| Total | 3,881 (89.3%) | 465 (10.7%) |
Educational Attainment by Field of Study in Chubbuck
Science & technology (512 | 17.0%), business (505 | 16.7%), engineering (439 | 14.6%), education (394 | 13.1%), and arts & humanities (204 | 6.8%) are the most common fields of study among 3,016 individuals in Chubbuck who have obtained a bachelor's degree or higher.
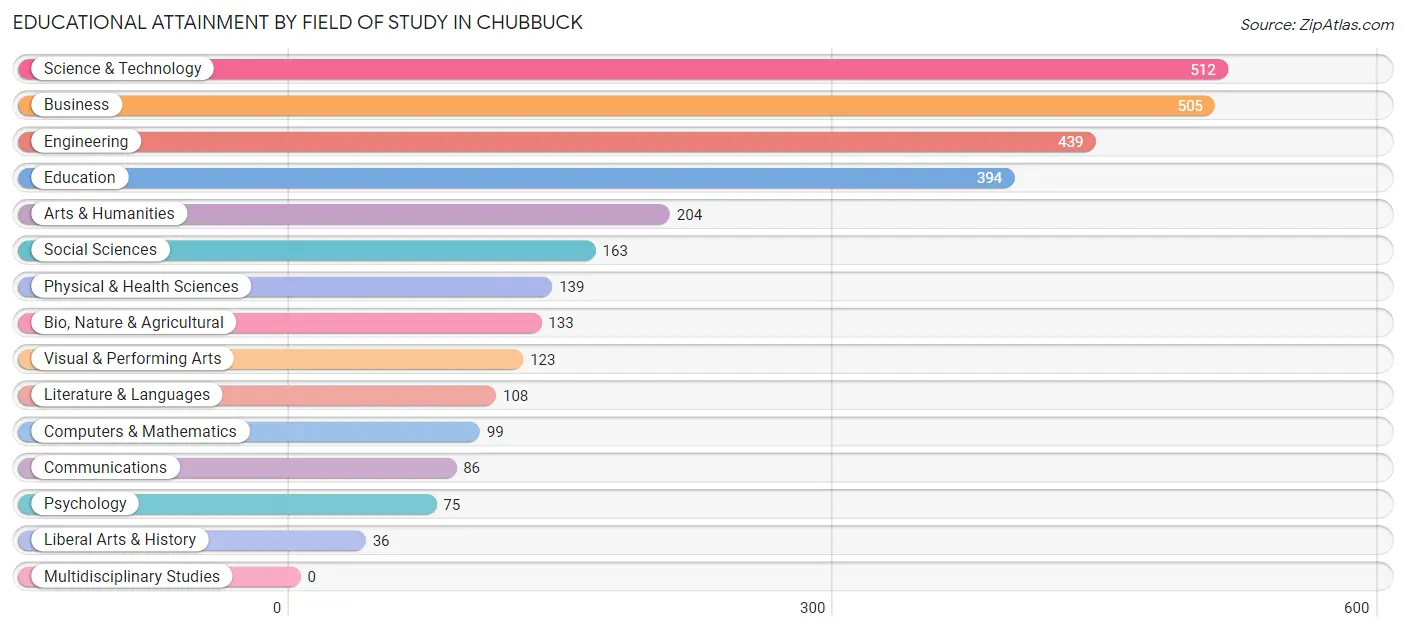
| Field of Study | # Graduates | % Graduates |
| Computers & Mathematics | 99 | 3.3% |
| Bio, Nature & Agricultural | 133 | 4.4% |
| Physical & Health Sciences | 139 | 4.6% |
| Psychology | 75 | 2.5% |
| Social Sciences | 163 | 5.4% |
| Engineering | 439 | 14.6% |
| Multidisciplinary Studies | 0 | 0.0% |
| Science & Technology | 512 | 17.0% |
| Business | 505 | 16.7% |
| Education | 394 | 13.1% |
| Literature & Languages | 108 | 3.6% |
| Liberal Arts & History | 36 | 1.2% |
| Visual & Performing Arts | 123 | 4.1% |
| Communications | 86 | 2.9% |
| Arts & Humanities | 204 | 6.8% |
| Total | 3,016 | 100.0% |
Transportation & Commute in Chubbuck
Vehicle Availability by Sex in Chubbuck
The most prevalent vehicle ownership categories in Chubbuck are males with 2 vehicles (1,320, accounting for 34.1%) and females with 2 vehicles (1,262, making up 39.6%).
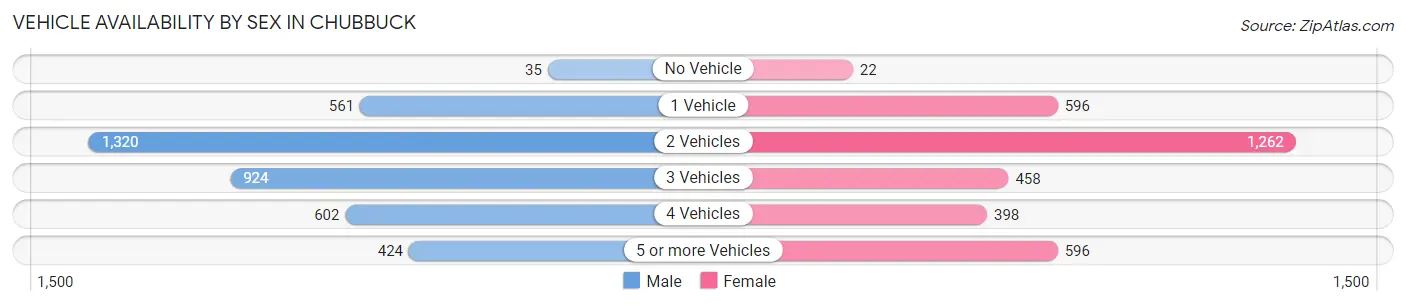
| Vehicles Available | Male | Female |
| No Vehicle | 35 (0.9%) | 22 (0.7%) |
| 1 Vehicle | 561 (14.5%) | 596 (17.9%) |
| 2 Vehicles | 1,320 (34.1%) | 1,262 (37.9%) |
| 3 Vehicles | 924 (23.9%) | 458 (13.8%) |
| 4 Vehicles | 602 (15.6%) | 398 (11.9%) |
| 5 or more Vehicles | 424 (11.0%) | 596 (17.9%) |
| Total | 3,866 (100.0%) | 3,332 (100.0%) |
Commute Time in Chubbuck
The most frequently occuring commute durations in Chubbuck are 10 to 14 minutes (2,062 commuters, 31.5%), 15 to 19 minutes (1,854 commuters, 28.4%), and 5 to 9 minutes (1,281 commuters, 19.6%).
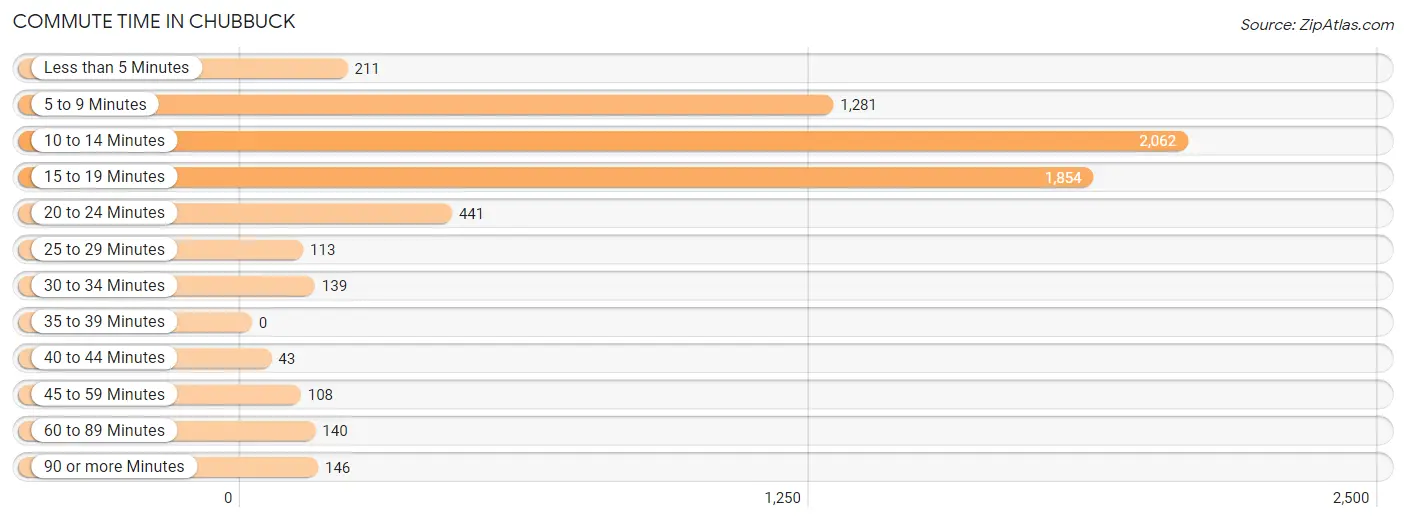
| Commute Time | # Commuters | % Commuters |
| Less than 5 Minutes | 211 | 3.2% |
| 5 to 9 Minutes | 1,281 | 19.6% |
| 10 to 14 Minutes | 2,062 | 31.5% |
| 15 to 19 Minutes | 1,854 | 28.4% |
| 20 to 24 Minutes | 441 | 6.8% |
| 25 to 29 Minutes | 113 | 1.7% |
| 30 to 34 Minutes | 139 | 2.1% |
| 35 to 39 Minutes | 0 | 0.0% |
| 40 to 44 Minutes | 43 | 0.7% |
| 45 to 59 Minutes | 108 | 1.7% |
| 60 to 89 Minutes | 140 | 2.1% |
| 90 or more Minutes | 146 | 2.2% |
Commute Time by Sex in Chubbuck
The most common commute times in Chubbuck are 10 to 14 minutes (1,064 commuters, 29.4%) for males and 10 to 14 minutes (998 commuters, 34.2%) for females.
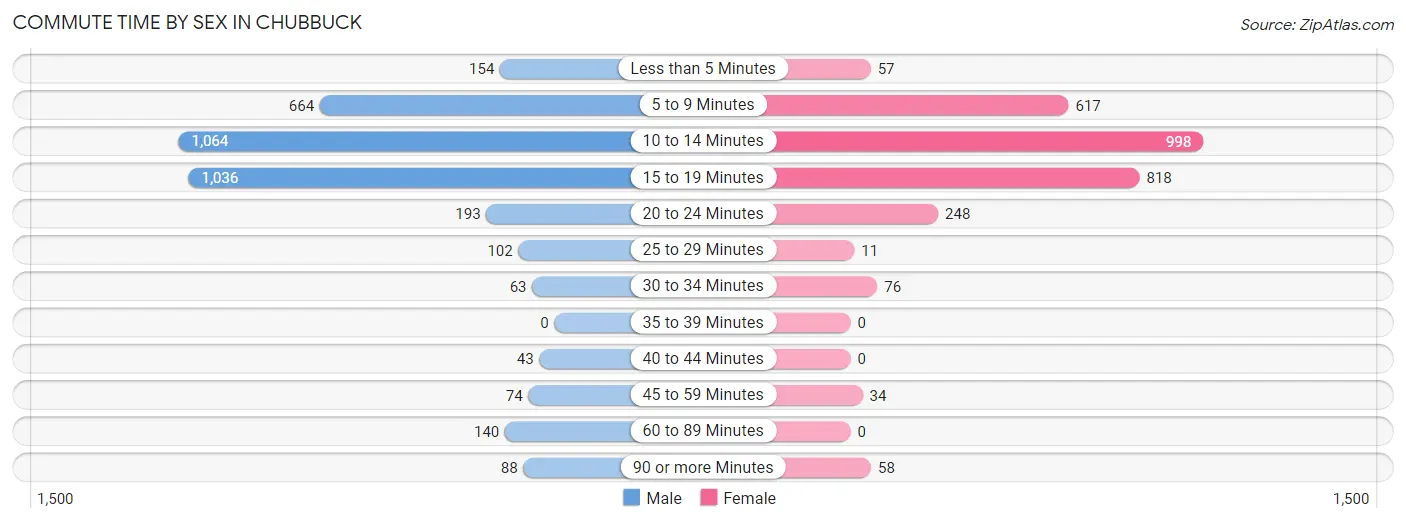
| Commute Time | Male | Female |
| Less than 5 Minutes | 154 (4.3%) | 57 (1.9%) |
| 5 to 9 Minutes | 664 (18.3%) | 617 (21.1%) |
| 10 to 14 Minutes | 1,064 (29.4%) | 998 (34.2%) |
| 15 to 19 Minutes | 1,036 (28.6%) | 818 (28.0%) |
| 20 to 24 Minutes | 193 (5.3%) | 248 (8.5%) |
| 25 to 29 Minutes | 102 (2.8%) | 11 (0.4%) |
| 30 to 34 Minutes | 63 (1.7%) | 76 (2.6%) |
| 35 to 39 Minutes | 0 (0.0%) | 0 (0.0%) |
| 40 to 44 Minutes | 43 (1.2%) | 0 (0.0%) |
| 45 to 59 Minutes | 74 (2.0%) | 34 (1.2%) |
| 60 to 89 Minutes | 140 (3.9%) | 0 (0.0%) |
| 90 or more Minutes | 88 (2.4%) | 58 (2.0%) |
Time of Departure to Work by Sex in Chubbuck
The most frequent times of departure to work in Chubbuck are 7:30 AM to 7:59 AM (633, 17.5%) for males and 7:30 AM to 7:59 AM (640, 21.9%) for females.
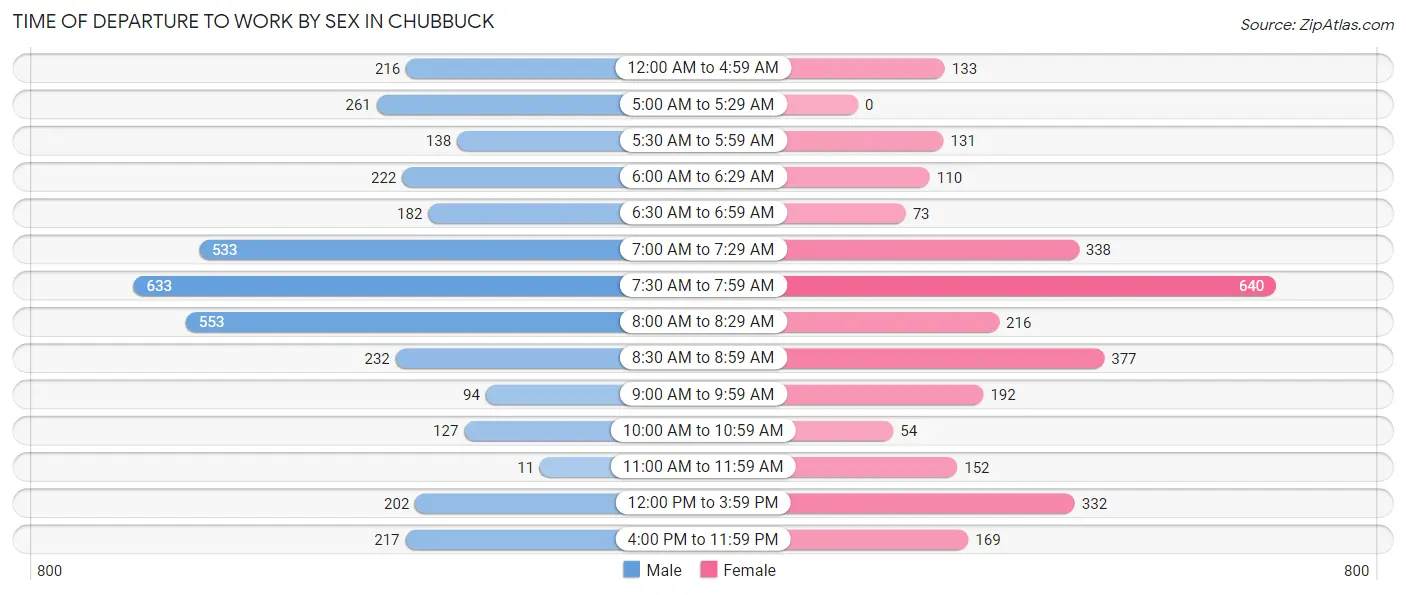
| Time of Departure | Male | Female |
| 12:00 AM to 4:59 AM | 216 (6.0%) | 133 (4.6%) |
| 5:00 AM to 5:29 AM | 261 (7.2%) | 0 (0.0%) |
| 5:30 AM to 5:59 AM | 138 (3.8%) | 131 (4.5%) |
| 6:00 AM to 6:29 AM | 222 (6.1%) | 110 (3.8%) |
| 6:30 AM to 6:59 AM | 182 (5.0%) | 73 (2.5%) |
| 7:00 AM to 7:29 AM | 533 (14.7%) | 338 (11.6%) |
| 7:30 AM to 7:59 AM | 633 (17.5%) | 640 (21.9%) |
| 8:00 AM to 8:29 AM | 553 (15.3%) | 216 (7.4%) |
| 8:30 AM to 8:59 AM | 232 (6.4%) | 377 (12.9%) |
| 9:00 AM to 9:59 AM | 94 (2.6%) | 192 (6.6%) |
| 10:00 AM to 10:59 AM | 127 (3.5%) | 54 (1.8%) |
| 11:00 AM to 11:59 AM | 11 (0.3%) | 152 (5.2%) |
| 12:00 PM to 3:59 PM | 202 (5.6%) | 332 (11.4%) |
| 4:00 PM to 11:59 PM | 217 (6.0%) | 169 (5.8%) |
| Total | 3,621 (100.0%) | 2,917 (100.0%) |
Housing Occupancy in Chubbuck
Occupancy by Ownership in Chubbuck
Of the total 5,671 dwellings in Chubbuck, owner-occupied units account for 4,038 (71.2%), while renter-occupied units make up 1,633 (28.8%).
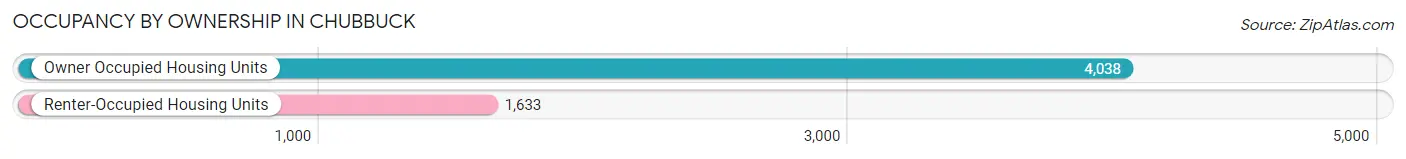
| Occupancy | # Housing Units | % Housing Units |
| Owner Occupied Housing Units | 4,038 | 71.2% |
| Renter-Occupied Housing Units | 1,633 | 28.8% |
| Total Occupied Housing Units | 5,671 | 100.0% |
Occupancy by Household Size in Chubbuck
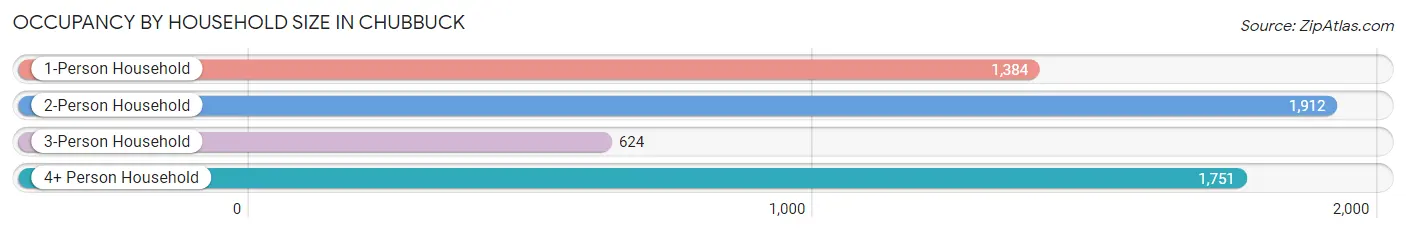
| Household Size | # Housing Units | % Housing Units |
| 1-Person Household | 1,384 | 24.4% |
| 2-Person Household | 1,912 | 33.7% |
| 3-Person Household | 624 | 11.0% |
| 4+ Person Household | 1,751 | 30.9% |
| Total Housing Units | 5,671 | 100.0% |
Occupancy by Ownership by Household Size in Chubbuck
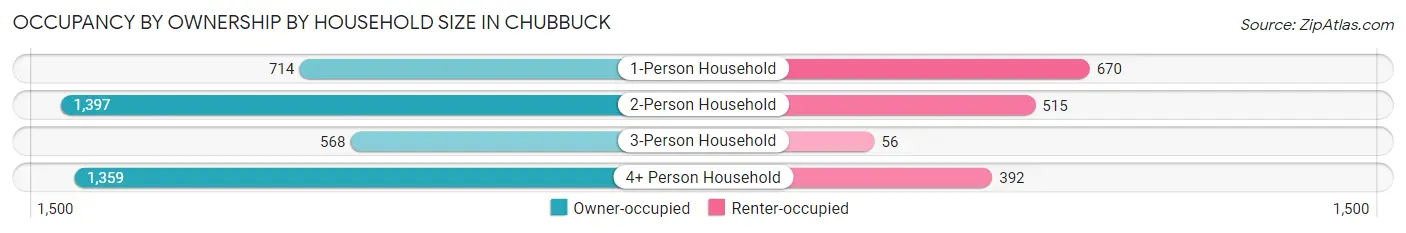
| Household Size | Owner-occupied | Renter-occupied |
| 1-Person Household | 714 (51.6%) | 670 (48.4%) |
| 2-Person Household | 1,397 (73.1%) | 515 (26.9%) |
| 3-Person Household | 568 (91.0%) | 56 (9.0%) |
| 4+ Person Household | 1,359 (77.6%) | 392 (22.4%) |
| Total Housing Units | 4,038 (71.2%) | 1,633 (28.8%) |
Occupancy by Educational Attainment in Chubbuck
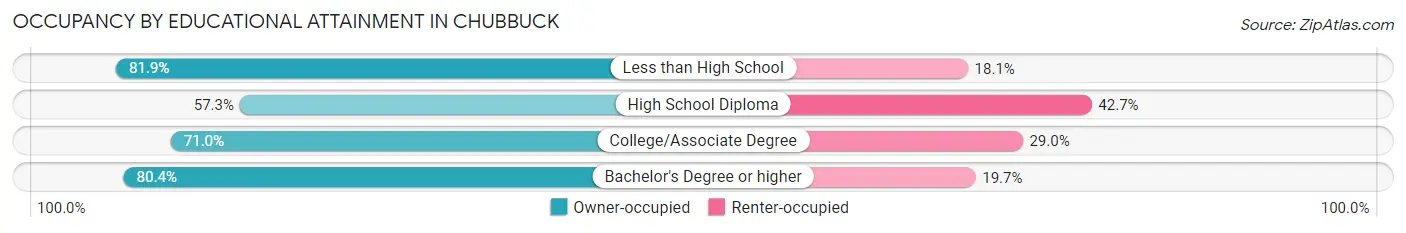
| Household Size | Owner-occupied | Renter-occupied |
| Less than High School | 167 (81.9%) | 37 (18.1%) |
| High School Diploma | 708 (57.3%) | 527 (42.7%) |
| College/Associate Degree | 1,801 (71.0%) | 736 (29.0%) |
| Bachelor's Degree or higher | 1,362 (80.3%) | 333 (19.7%) |
Occupancy by Age of Householder in Chubbuck
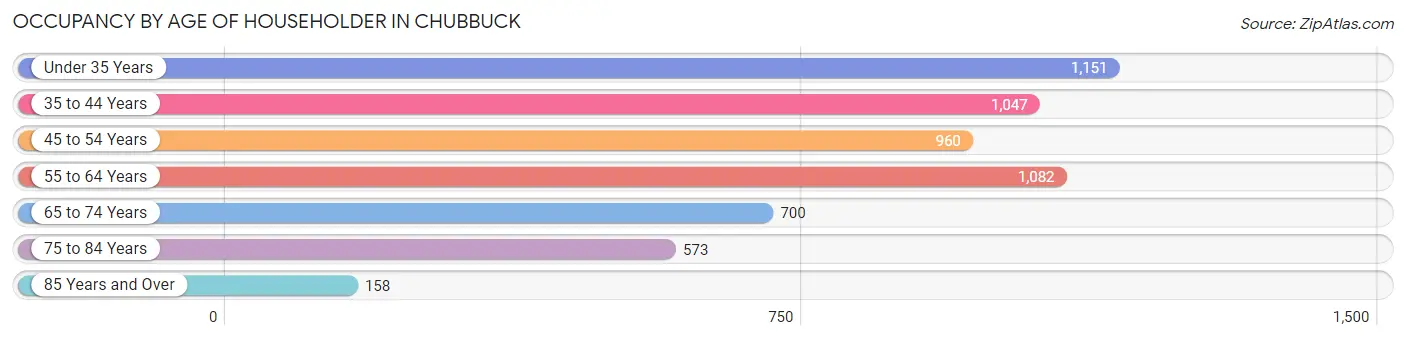
| Age Bracket | # Households | % Households |
| Under 35 Years | 1,151 | 20.3% |
| 35 to 44 Years | 1,047 | 18.5% |
| 45 to 54 Years | 960 | 16.9% |
| 55 to 64 Years | 1,082 | 19.1% |
| 65 to 74 Years | 700 | 12.3% |
| 75 to 84 Years | 573 | 10.1% |
| 85 Years and Over | 158 | 2.8% |
| Total | 5,671 | 100.0% |
Housing Finances in Chubbuck
Median Income by Occupancy in Chubbuck
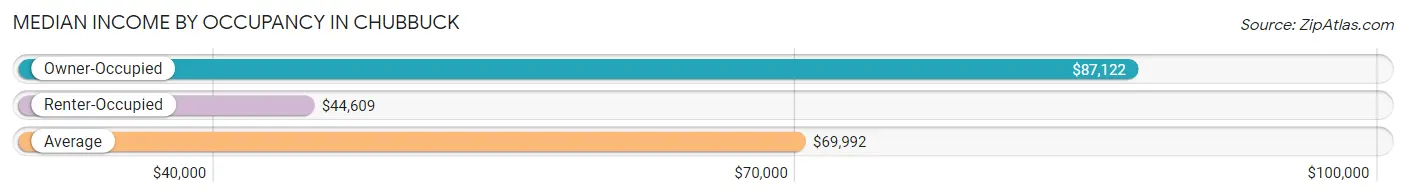
| Occupancy Type | # Households | Median Income |
| Owner-Occupied | 4,038 (71.2%) | $87,122 |
| Renter-Occupied | 1,633 (28.8%) | $44,609 |
| Average | 5,671 (100.0%) | $69,992 |
Occupancy by Householder Income Bracket in Chubbuck
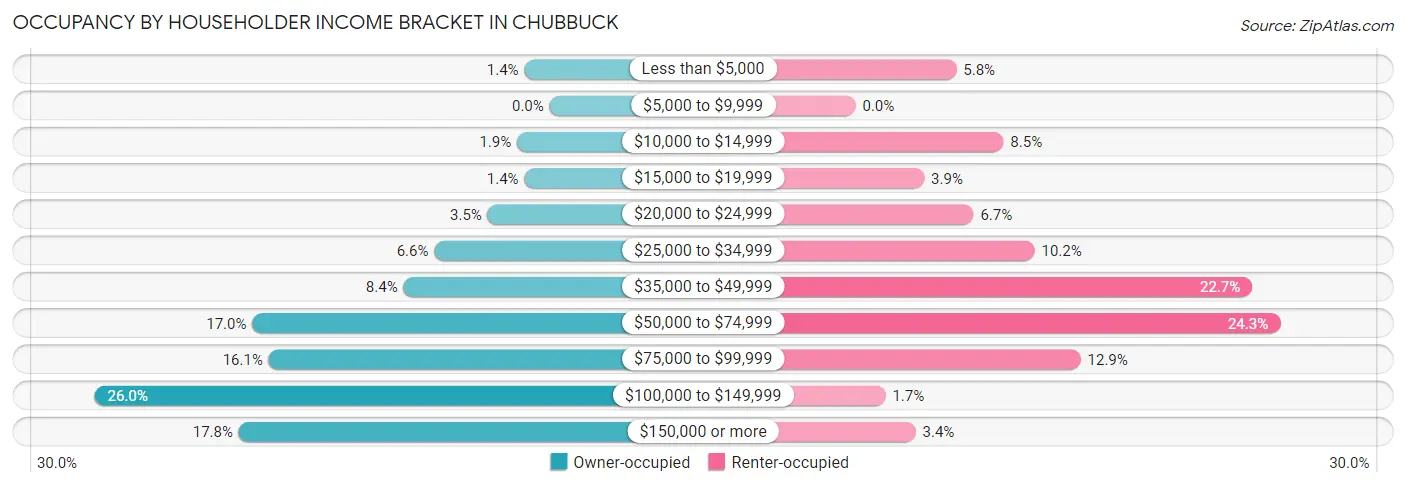
| Income Bracket | Owner-occupied | Renter-occupied |
| Less than $5,000 | 58 (1.4%) | 94 (5.8%) |
| $5,000 to $9,999 | 0 (0.0%) | 0 (0.0%) |
| $10,000 to $14,999 | 75 (1.9%) | 138 (8.5%) |
| $15,000 to $19,999 | 58 (1.4%) | 64 (3.9%) |
| $20,000 to $24,999 | 143 (3.5%) | 110 (6.7%) |
| $25,000 to $34,999 | 266 (6.6%) | 167 (10.2%) |
| $35,000 to $49,999 | 337 (8.4%) | 370 (22.7%) |
| $50,000 to $74,999 | 686 (17.0%) | 396 (24.2%) |
| $75,000 to $99,999 | 648 (16.1%) | 210 (12.9%) |
| $100,000 to $149,999 | 1,050 (26.0%) | 28 (1.7%) |
| $150,000 or more | 717 (17.8%) | 56 (3.4%) |
| Total | 4,038 (100.0%) | 1,633 (100.0%) |
Monthly Housing Cost Tiers in Chubbuck
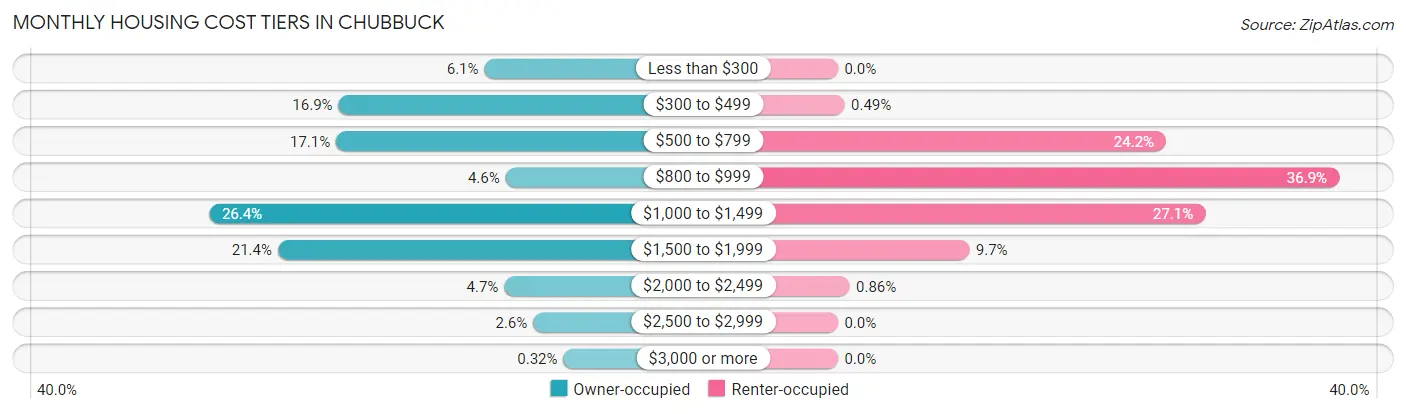
| Monthly Cost | Owner-occupied | Renter-occupied |
| Less than $300 | 248 (6.1%) | 0 (0.0%) |
| $300 to $499 | 682 (16.9%) | 8 (0.5%) |
| $500 to $799 | 689 (17.1%) | 395 (24.2%) |
| $800 to $999 | 185 (4.6%) | 603 (36.9%) |
| $1,000 to $1,499 | 1,067 (26.4%) | 442 (27.1%) |
| $1,500 to $1,999 | 862 (21.3%) | 158 (9.7%) |
| $2,000 to $2,499 | 189 (4.7%) | 14 (0.9%) |
| $2,500 to $2,999 | 103 (2.5%) | 0 (0.0%) |
| $3,000 or more | 13 (0.3%) | 0 (0.0%) |
| Total | 4,038 (100.0%) | 1,633 (100.0%) |
Physical Housing Characteristics in Chubbuck
Housing Structures in Chubbuck
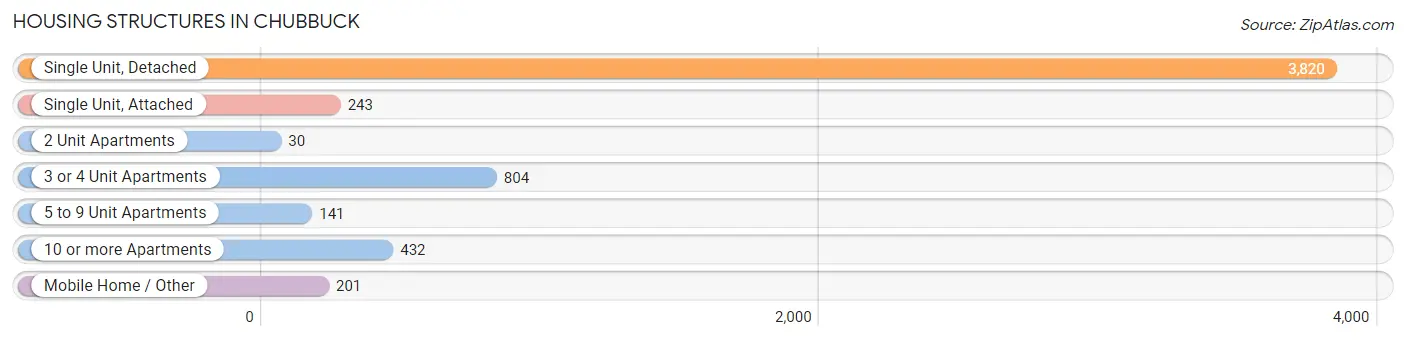
| Structure Type | # Housing Units | % Housing Units |
| Single Unit, Detached | 3,820 | 67.4% |
| Single Unit, Attached | 243 | 4.3% |
| 2 Unit Apartments | 30 | 0.5% |
| 3 or 4 Unit Apartments | 804 | 14.2% |
| 5 to 9 Unit Apartments | 141 | 2.5% |
| 10 or more Apartments | 432 | 7.6% |
| Mobile Home / Other | 201 | 3.5% |
| Total | 5,671 | 100.0% |
Housing Structures by Occupancy in Chubbuck
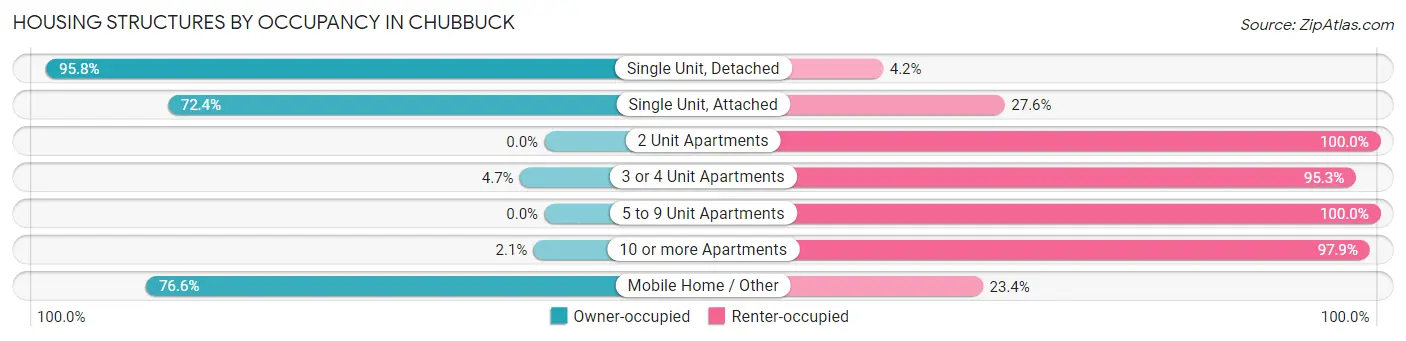
| Structure Type | Owner-occupied | Renter-occupied |
| Single Unit, Detached | 3,661 (95.8%) | 159 (4.2%) |
| Single Unit, Attached | 176 (72.4%) | 67 (27.6%) |
| 2 Unit Apartments | 0 (0.0%) | 30 (100.0%) |
| 3 or 4 Unit Apartments | 38 (4.7%) | 766 (95.3%) |
| 5 to 9 Unit Apartments | 0 (0.0%) | 141 (100.0%) |
| 10 or more Apartments | 9 (2.1%) | 423 (97.9%) |
| Mobile Home / Other | 154 (76.6%) | 47 (23.4%) |
| Total | 4,038 (71.2%) | 1,633 (28.8%) |
Housing Structures by Number of Rooms in Chubbuck
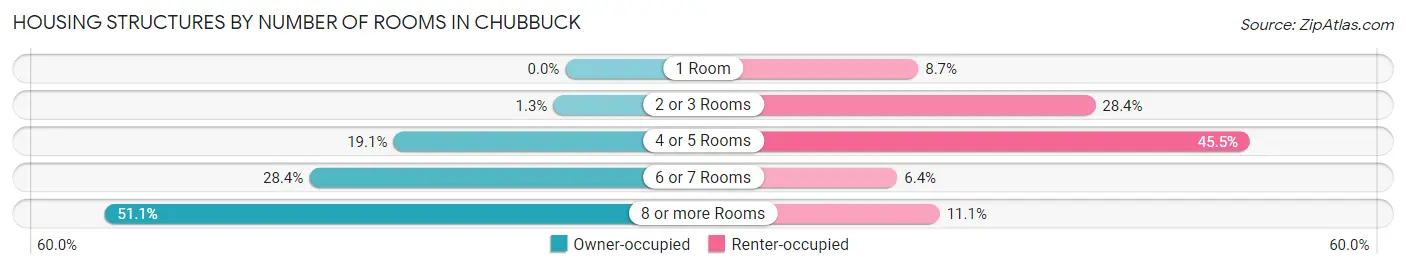
| Number of Rooms | Owner-occupied | Renter-occupied |
| 1 Room | 0 (0.0%) | 142 (8.7%) |
| 2 or 3 Rooms | 54 (1.3%) | 463 (28.3%) |
| 4 or 5 Rooms | 771 (19.1%) | 743 (45.5%) |
| 6 or 7 Rooms | 1,148 (28.4%) | 104 (6.4%) |
| 8 or more Rooms | 2,065 (51.1%) | 181 (11.1%) |
| Total | 4,038 (100.0%) | 1,633 (100.0%) |
Housing Structure by Heating Type in Chubbuck
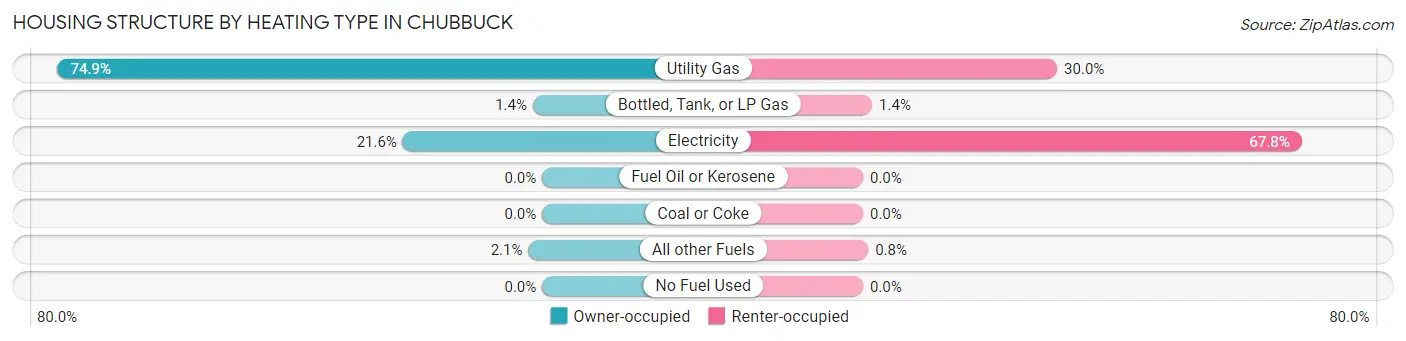
| Heating Type | Owner-occupied | Renter-occupied |
| Utility Gas | 3,024 (74.9%) | 490 (30.0%) |
| Bottled, Tank, or LP Gas | 58 (1.4%) | 23 (1.4%) |
| Electricity | 870 (21.5%) | 1,107 (67.8%) |
| Fuel Oil or Kerosene | 0 (0.0%) | 0 (0.0%) |
| Coal or Coke | 0 (0.0%) | 0 (0.0%) |
| All other Fuels | 86 (2.1%) | 13 (0.8%) |
| No Fuel Used | 0 (0.0%) | 0 (0.0%) |
| Total | 4,038 (100.0%) | 1,633 (100.0%) |
Household Vehicle Usage in Chubbuck
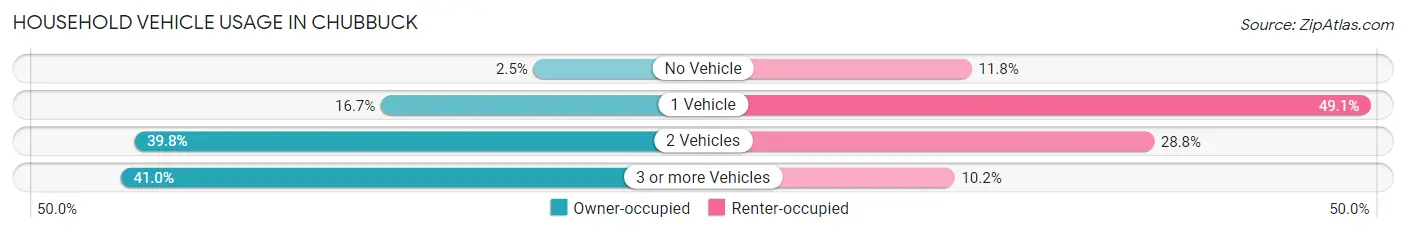
| Vehicles per Household | Owner-occupied | Renter-occupied |
| No Vehicle | 100 (2.5%) | 193 (11.8%) |
| 1 Vehicle | 675 (16.7%) | 802 (49.1%) |
| 2 Vehicles | 1,606 (39.8%) | 471 (28.8%) |
| 3 or more Vehicles | 1,657 (41.0%) | 167 (10.2%) |
| Total | 4,038 (100.0%) | 1,633 (100.0%) |
Real Estate & Mortgages in Chubbuck
Real Estate and Mortgage Overview in Chubbuck
| Characteristic | Without Mortgage | With Mortgage |
| Housing Units | 1,568 | 2,470 |
| Median Property Value | $264,100 | $314,400 |
| Median Household Income | $54,968 | $313 |
| Monthly Housing Costs | $464 | $13 |
| Real Estate Taxes | $2,188 | $43 |
Property Value by Mortgage Status in Chubbuck
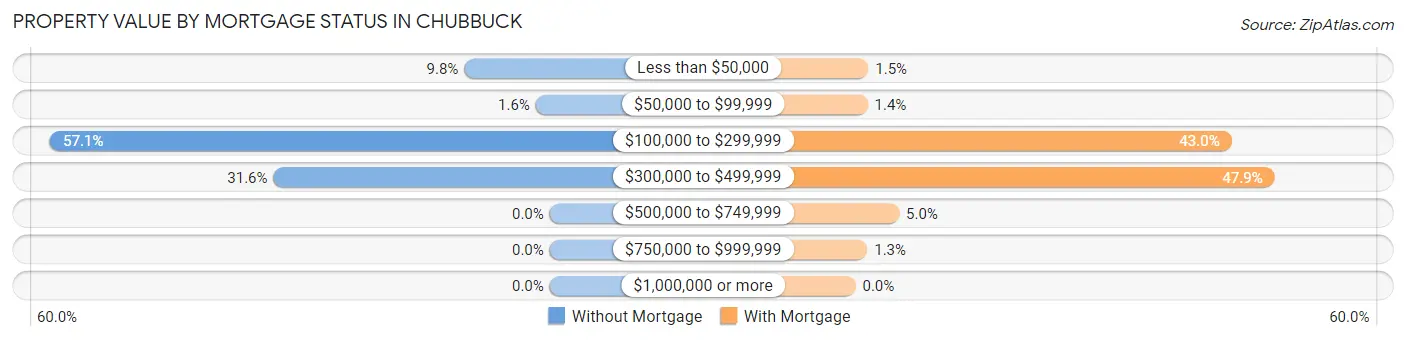
| Property Value | Without Mortgage | With Mortgage |
| Less than $50,000 | 153 (9.8%) | 36 (1.5%) |
| $50,000 to $99,999 | 25 (1.6%) | 34 (1.4%) |
| $100,000 to $299,999 | 895 (57.1%) | 1,061 (43.0%) |
| $300,000 to $499,999 | 495 (31.6%) | 1,183 (47.9%) |
| $500,000 to $749,999 | 0 (0.0%) | 123 (5.0%) |
| $750,000 to $999,999 | 0 (0.0%) | 33 (1.3%) |
| $1,000,000 or more | 0 (0.0%) | 0 (0.0%) |
| Total | 1,568 (100.0%) | 2,470 (100.0%) |
Household Income by Mortgage Status in Chubbuck
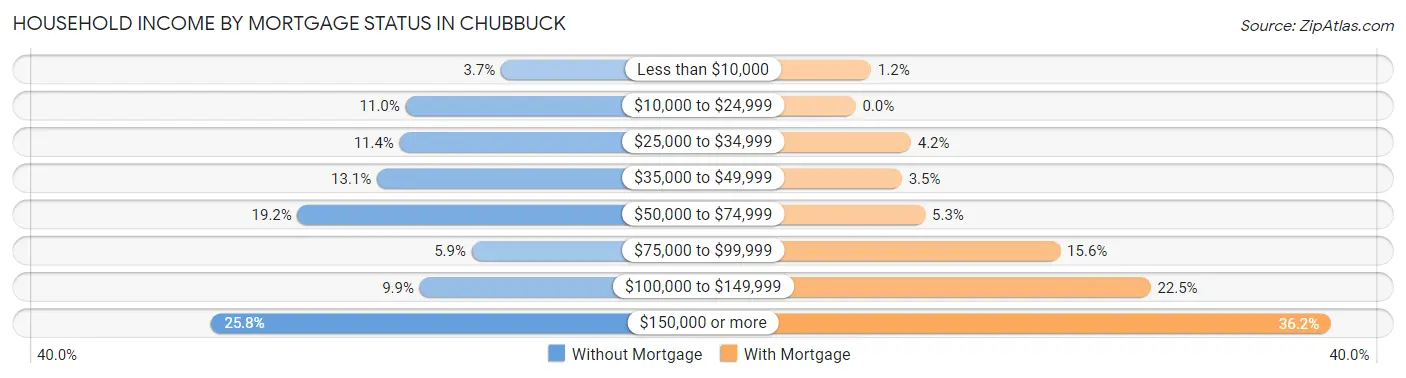
| Household Income | Without Mortgage | With Mortgage |
| Less than $10,000 | 58 (3.7%) | 29 (1.2%) |
| $10,000 to $24,999 | 172 (11.0%) | 0 (0.0%) |
| $25,000 to $34,999 | 179 (11.4%) | 104 (4.2%) |
| $35,000 to $49,999 | 206 (13.1%) | 87 (3.5%) |
| $50,000 to $74,999 | 301 (19.2%) | 131 (5.3%) |
| $75,000 to $99,999 | 93 (5.9%) | 385 (15.6%) |
| $100,000 to $149,999 | 155 (9.9%) | 555 (22.5%) |
| $150,000 or more | 404 (25.8%) | 895 (36.2%) |
| Total | 1,568 (100.0%) | 2,470 (100.0%) |
Property Value to Household Income Ratio in Chubbuck
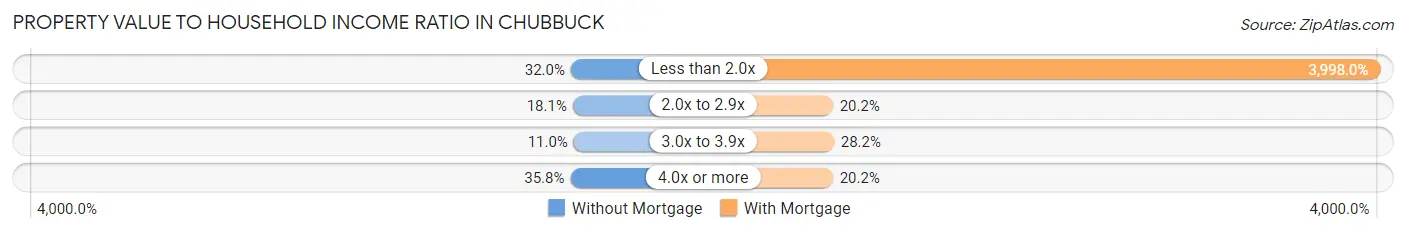
| Value-to-Income Ratio | Without Mortgage | With Mortgage |
| Less than 2.0x | 501 (32.0%) | 98,750 (3,998.0%) |
| 2.0x to 2.9x | 284 (18.1%) | 499 (20.2%) |
| 3.0x to 3.9x | 172 (11.0%) | 697 (28.2%) |
| 4.0x or more | 562 (35.8%) | 498 (20.2%) |
| Total | 1,568 (100.0%) | 2,470 (100.0%) |
Real Estate Taxes by Mortgage Status in Chubbuck
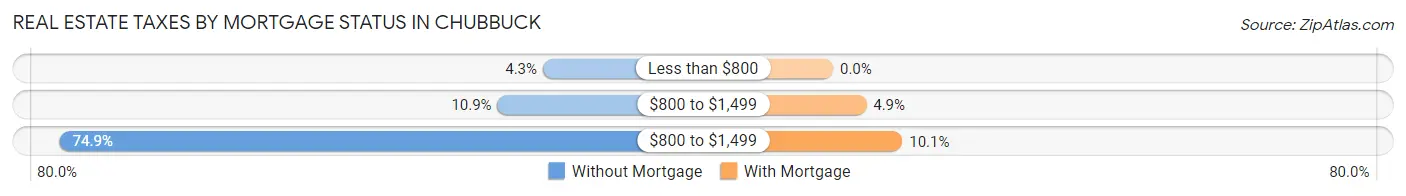
| Property Taxes | Without Mortgage | With Mortgage |
| Less than $800 | 67 (4.3%) | 0 (0.0%) |
| $800 to $1,499 | 171 (10.9%) | 120 (4.9%) |
| $800 to $1,499 | 1,174 (74.9%) | 250 (10.1%) |
| Total | 1,568 (100.0%) | 2,470 (100.0%) |
Health & Disability in Chubbuck
Health Insurance Coverage by Age in Chubbuck
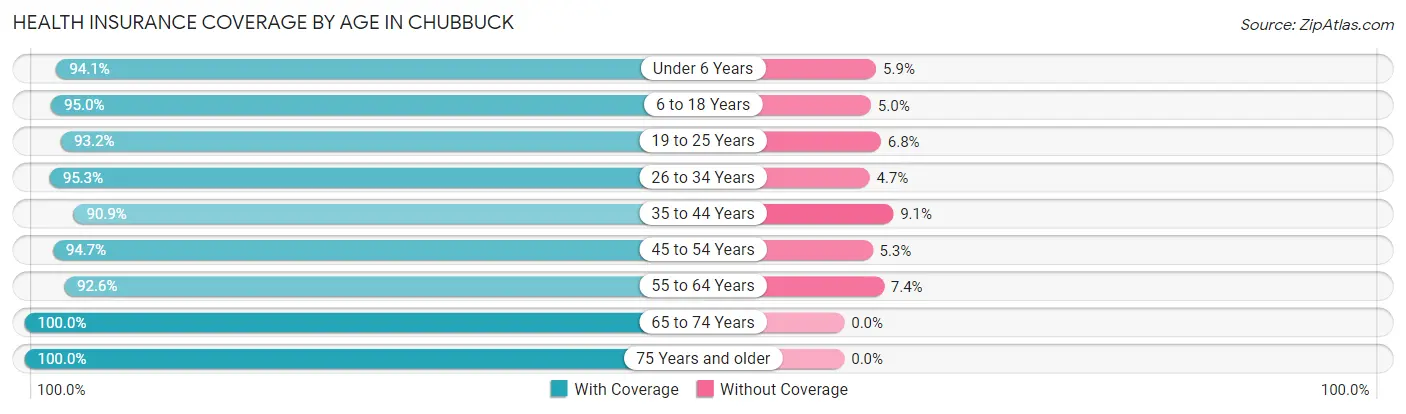
| Age Bracket | With Coverage | Without Coverage |
| Under 6 Years | 1,076 (94.1%) | 68 (5.9%) |
| 6 to 18 Years | 3,450 (95.0%) | 180 (5.0%) |
| 19 to 25 Years | 1,107 (93.2%) | 81 (6.8%) |
| 26 to 34 Years | 1,701 (95.3%) | 84 (4.7%) |
| 35 to 44 Years | 1,893 (90.9%) | 190 (9.1%) |
| 45 to 54 Years | 1,725 (94.7%) | 96 (5.3%) |
| 55 to 64 Years | 1,621 (92.6%) | 129 (7.4%) |
| 65 to 74 Years | 1,227 (100.0%) | 0 (0.0%) |
| 75 Years and older | 972 (100.0%) | 0 (0.0%) |
| Total | 14,772 (94.7%) | 828 (5.3%) |
Health Insurance Coverage by Citizenship Status in Chubbuck
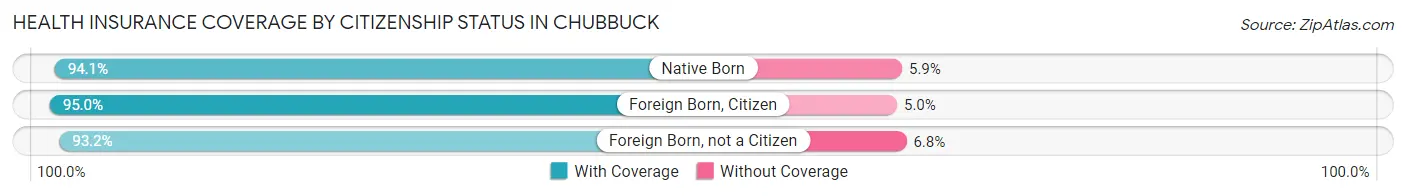
| Citizenship Status | With Coverage | Without Coverage |
| Native Born | 1,076 (94.1%) | 68 (5.9%) |
| Foreign Born, Citizen | 3,450 (95.0%) | 180 (5.0%) |
| Foreign Born, not a Citizen | 1,107 (93.2%) | 81 (6.8%) |
Health Insurance Coverage by Household Income in Chubbuck
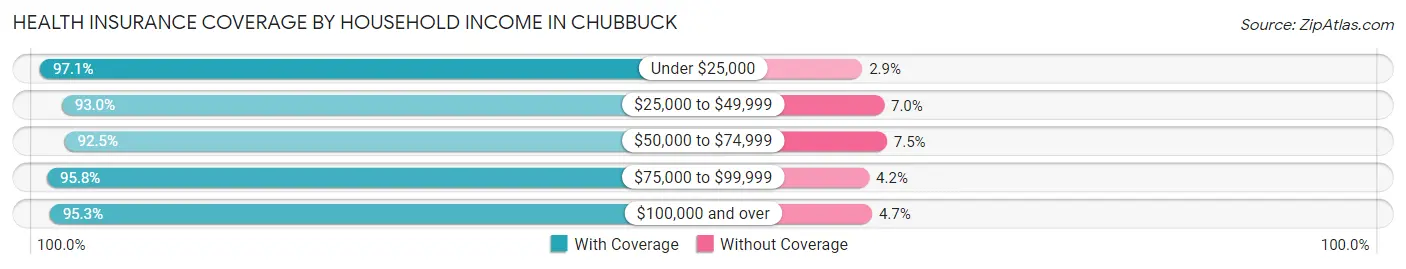
| Household Income | With Coverage | Without Coverage |
| Under $25,000 | 1,310 (97.1%) | 39 (2.9%) |
| $25,000 to $49,999 | 2,292 (93.0%) | 172 (7.0%) |
| $50,000 to $74,999 | 2,516 (92.5%) | 204 (7.5%) |
| $75,000 to $99,999 | 2,816 (95.8%) | 123 (4.2%) |
| $100,000 and over | 5,811 (95.3%) | 288 (4.7%) |
Public vs Private Health Insurance Coverage by Age in Chubbuck
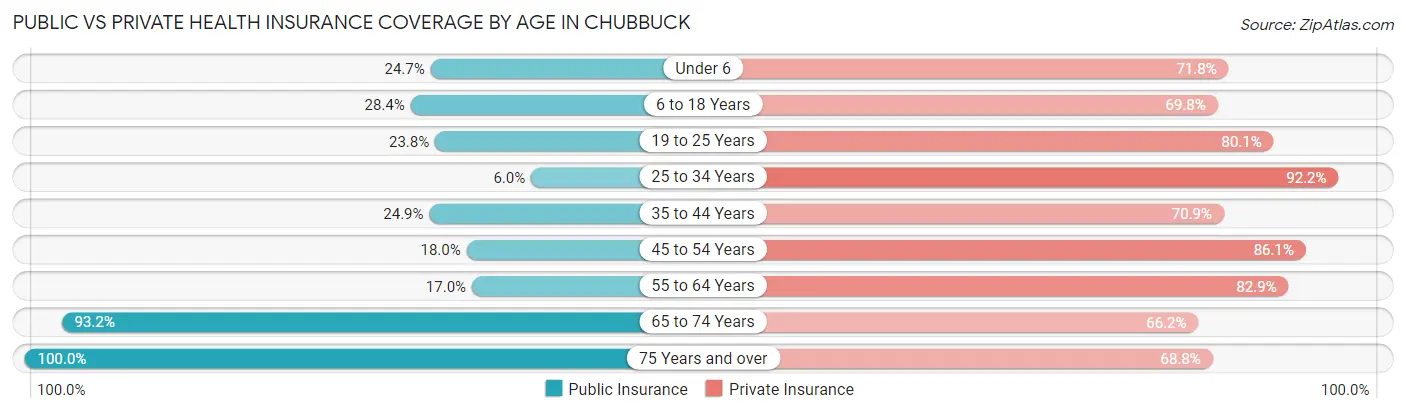
| Age Bracket | Public Insurance | Private Insurance |
| Under 6 | 282 (24.6%) | 821 (71.8%) |
| 6 to 18 Years | 1,029 (28.3%) | 2,532 (69.8%) |
| 19 to 25 Years | 283 (23.8%) | 952 (80.1%) |
| 25 to 34 Years | 107 (6.0%) | 1,645 (92.2%) |
| 35 to 44 Years | 518 (24.9%) | 1,477 (70.9%) |
| 45 to 54 Years | 327 (18.0%) | 1,568 (86.1%) |
| 55 to 64 Years | 297 (17.0%) | 1,451 (82.9%) |
| 65 to 74 Years | 1,143 (93.1%) | 812 (66.2%) |
| 75 Years and over | 972 (100.0%) | 669 (68.8%) |
| Total | 4,958 (31.8%) | 11,927 (76.5%) |
Disability Status by Sex by Age in Chubbuck
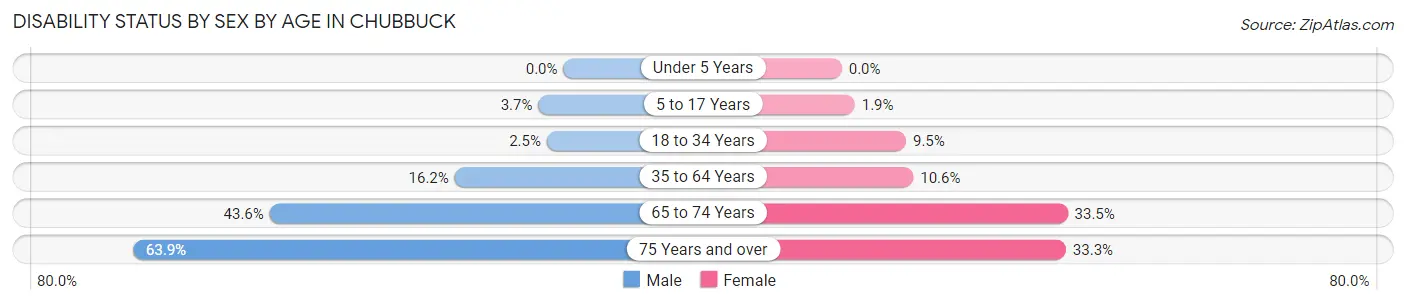
| Age Bracket | Male | Female |
| Under 5 Years | 0 (0.0%) | 0 (0.0%) |
| 5 to 17 Years | 75 (3.7%) | 33 (1.9%) |
| 18 to 34 Years | 42 (2.5%) | 136 (9.5%) |
| 35 to 64 Years | 442 (16.2%) | 310 (10.6%) |
| 65 to 74 Years | 236 (43.6%) | 230 (33.5%) |
| 75 Years and over | 216 (63.9%) | 211 (33.3%) |
Disability Class by Sex by Age in Chubbuck
Disability Class: Hearing Difficulty
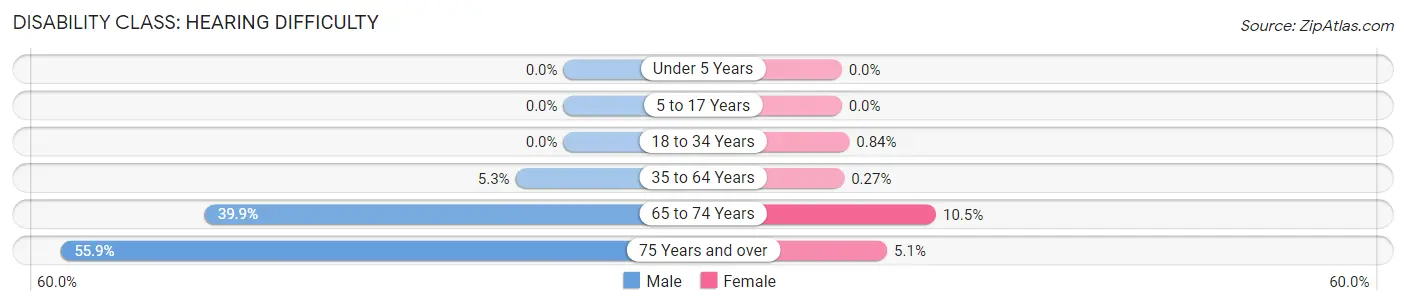
| Age Bracket | Male | Female |
| Under 5 Years | 0 (0.0%) | 0 (0.0%) |
| 5 to 17 Years | 0 (0.0%) | 0 (0.0%) |
| 18 to 34 Years | 0 (0.0%) | 12 (0.8%) |
| 35 to 64 Years | 146 (5.3%) | 8 (0.3%) |
| 65 to 74 Years | 216 (39.9%) | 72 (10.5%) |
| 75 Years and over | 189 (55.9%) | 32 (5.1%) |
Disability Class: Vision Difficulty
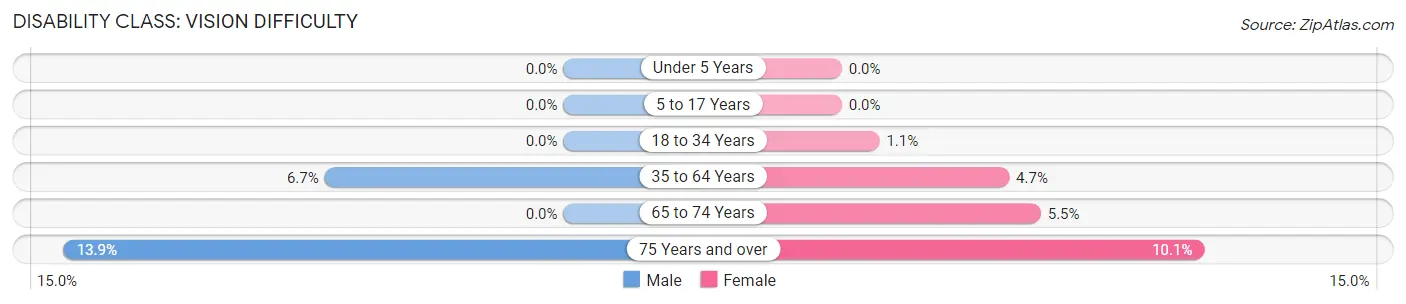
| Age Bracket | Male | Female |
| Under 5 Years | 0 (0.0%) | 0 (0.0%) |
| 5 to 17 Years | 0 (0.0%) | 0 (0.0%) |
| 18 to 34 Years | 0 (0.0%) | 15 (1.1%) |
| 35 to 64 Years | 182 (6.7%) | 136 (4.7%) |
| 65 to 74 Years | 0 (0.0%) | 38 (5.5%) |
| 75 Years and over | 47 (13.9%) | 64 (10.1%) |
Disability Class: Cognitive Difficulty
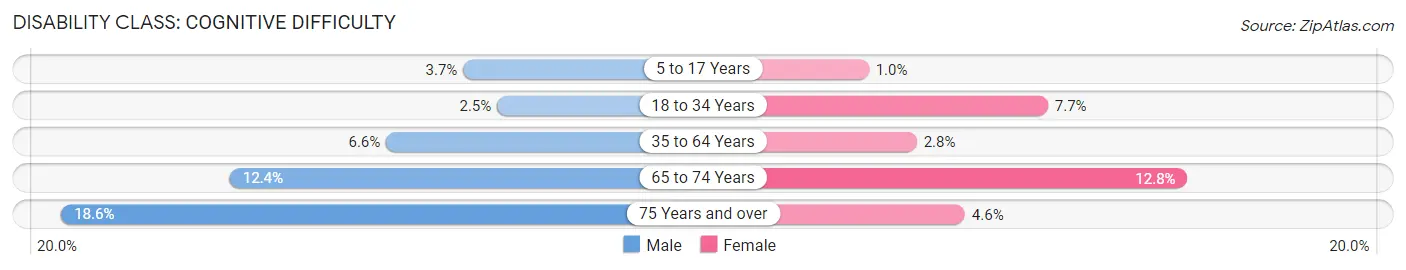
| Age Bracket | Male | Female |
| 5 to 17 Years | 75 (3.7%) | 17 (1.0%) |
| 18 to 34 Years | 42 (2.5%) | 109 (7.6%) |
| 35 to 64 Years | 180 (6.6%) | 81 (2.8%) |
| 65 to 74 Years | 67 (12.4%) | 88 (12.8%) |
| 75 Years and over | 63 (18.6%) | 29 (4.6%) |
Disability Class: Ambulatory Difficulty
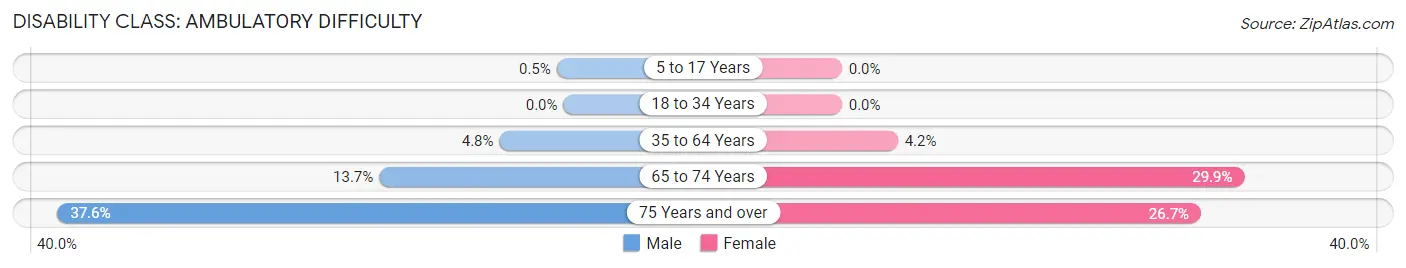
| Age Bracket | Male | Female |
| 5 to 17 Years | 10 (0.5%) | 0 (0.0%) |
| 18 to 34 Years | 0 (0.0%) | 0 (0.0%) |
| 35 to 64 Years | 130 (4.8%) | 121 (4.2%) |
| 65 to 74 Years | 74 (13.7%) | 205 (29.9%) |
| 75 Years and over | 127 (37.6%) | 169 (26.7%) |
Disability Class: Self-Care Difficulty
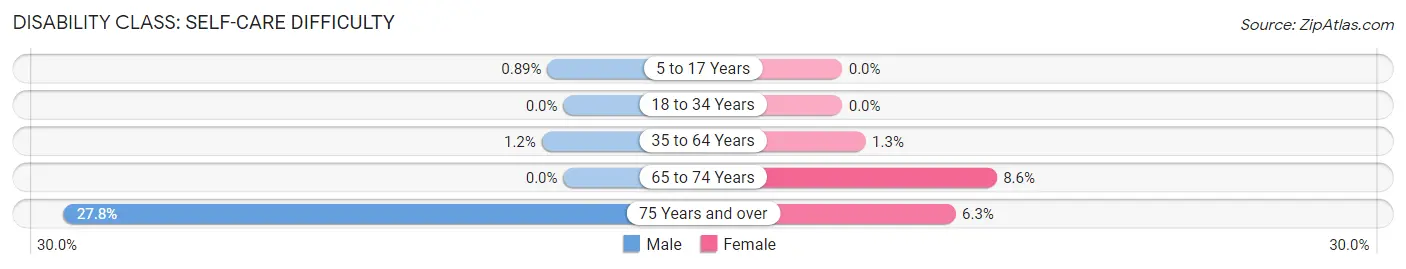
| Age Bracket | Male | Female |
| 5 to 17 Years | 18 (0.9%) | 0 (0.0%) |
| 18 to 34 Years | 0 (0.0%) | 0 (0.0%) |
| 35 to 64 Years | 33 (1.2%) | 38 (1.3%) |
| 65 to 74 Years | 0 (0.0%) | 59 (8.6%) |
| 75 Years and over | 94 (27.8%) | 40 (6.3%) |
Technology Access in Chubbuck
Computing Device Access in Chubbuck
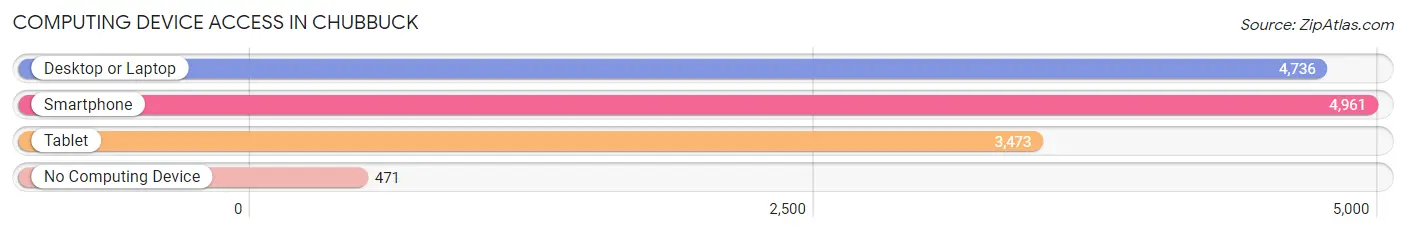
| Device Type | # Households | % Households |
| Desktop or Laptop | 4,736 | 83.5% |
| Smartphone | 4,961 | 87.5% |
| Tablet | 3,473 | 61.2% |
| No Computing Device | 471 | 8.3% |
| Total | 5,671 | 100.0% |
Internet Access in Chubbuck
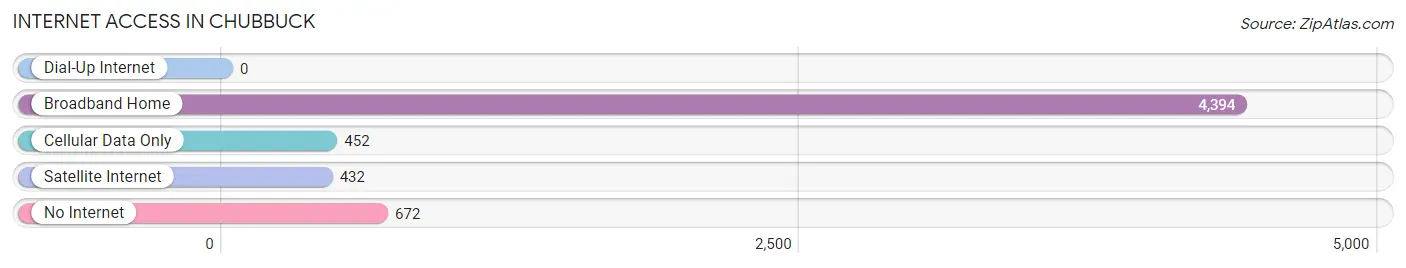
| Internet Type | # Households | % Households |
| Dial-Up Internet | 0 | 0.0% |
| Broadband Home | 4,394 | 77.5% |
| Cellular Data Only | 452 | 8.0% |
| Satellite Internet | 432 | 7.6% |
| No Internet | 672 | 11.8% |
| Total | 5,671 | 100.0% |
Chubbuck Summary
Chubbuck, Idaho is a city located in Bannock County, Idaho, United States. It is part of the Pocatello, Idaho Metropolitan Statistical Area. The population was 14,919 at the 2010 census.
History
Chubbuck was founded in 1883 by the Union Pacific Railroad. The city was named after William Chubbuck, a Union Pacific Railroad official. The city was incorporated in 1903.
Geography
Chubbuck is located at an elevation of 4,845 feet (1,477 m) above sea level. It is located at the intersection of Interstate 86 and U.S. Route 30. The city is located in the Portneuf River Valley, which is surrounded by the Portneuf Range to the north and the Bannock Range to the south.
Economy
Chubbuck is a major economic center for the region. The city is home to several large employers, including Idaho State University, the Idaho National Laboratory, and the Portneuf Medical Center. The city is also home to several retail stores, restaurants, and other businesses.
Demographics
As of the 2010 census, there were 14,919 people, 5,845 households, and 3,717 families residing in the city. The population density was 1,845.3 people per square mile (711.7/km2). The racial makeup of the city was 90.2% White, 0.7% African American, 0.7% Native American, 1.7% Asian, 0.2% Pacific Islander, 4.2% from other races, and 2.3% from two or more races. Hispanic or Latino of any race were 8.3% of the population.
The median income for a household in the city was $37,945, and the median income for a family was $45,945. Males had a median income of $35,945 versus $25,945 for females. The per capita income for the city was $18,945. About 8.3% of families and 11.7% of the population were below the poverty line, including 15.7% of those under age 18 and 8.3% of those age 65 or over.
Conclusion
Chubbuck, Idaho is a city located in Bannock County, Idaho, United States. It is part of the Pocatello, Idaho Metropolitan Statistical Area. The city was founded in 1883 by the Union Pacific Railroad and has since grown to become a major economic center for the region. The population was 14,919 at the 2010 census, with a median household income of $37,945 and a median family income of $45,945. The city is home to several large employers, including Idaho State University, the Idaho National Laboratory, and the Portneuf Medical Center. Chubbuck is a diverse city, with a population that is 90.2% White, 0.7% African American, 0.7% Native American, 1.7% Asian, 0.2% Pacific Islander, 4.2% from other races, and 2.3% from two or more races.
Common Questions
What is Per Capita Income in Chubbuck?
Per Capita income in Chubbuck is $30,782.
What is the Median Family Income in Chubbuck?
Median Family Income in Chubbuck is $88,384.
What is the Median Household income in Chubbuck?
Median Household Income in Chubbuck is $69,992.
What is Income or Wage Gap in Chubbuck?
Income or Wage Gap in Chubbuck is 39.0%.
Women in Chubbuck earn 61.0 cents for every dollar earned by a man.
What is Family Income Deficit in Chubbuck?
Family Income Deficit in Chubbuck is $11,353.
Families that are below poverty line in Chubbuck earn $11,353 less on average than the poverty threshold level.
What is Inequality or Gini Index in Chubbuck?
Inequality or Gini Index in Chubbuck is 0.38.
What is the Total Population of Chubbuck?
Total Population of Chubbuck is 15,638.
What is the Total Male Population of Chubbuck?
Total Male Population of Chubbuck is 7,717.
What is the Total Female Population of Chubbuck?
Total Female Population of Chubbuck is 7,921.
What is the Ratio of Males per 100 Females in Chubbuck?
There are 97.42 Males per 100 Females in Chubbuck.
What is the Ratio of Females per 100 Males in Chubbuck?
There are 102.64 Females per 100 Males in Chubbuck.
What is the Median Population Age in Chubbuck?
Median Population Age in Chubbuck is 35.1 Years.
What is the Average Family Size in Chubbuck
Average Family Size in Chubbuck is 3.4 People.
What is the Average Household Size in Chubbuck
Average Household Size in Chubbuck is 2.8 People.
How Large is the Labor Force in Chubbuck?
There are 7,602 People in the Labor Forcein in Chubbuck.
What is the Percentage of People in the Labor Force in Chubbuck?
64.7% of People are in the Labor Force in Chubbuck.
What is the Unemployment Rate in Chubbuck?
Unemployment Rate in Chubbuck is 3.9%.