Emmett, ID Map & Demographics
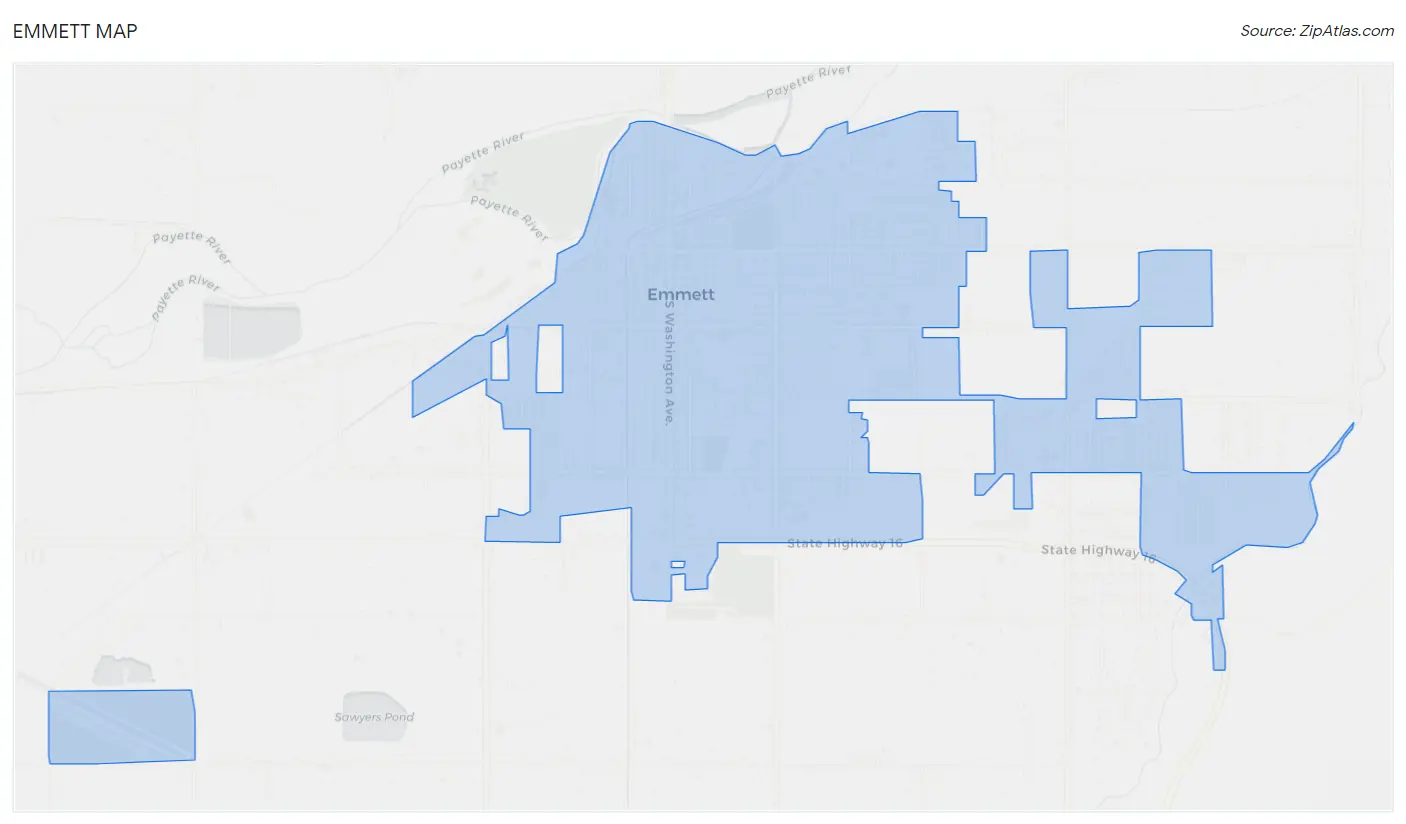
Emmett Map
Emmett Overview
$32,055
PER CAPITA INCOME
$64,038
AVG FAMILY INCOME
$54,575
AVG HOUSEHOLD INCOME
29.7%
WAGE / INCOME GAP [ % ]
70.3¢/ $1
WAGE / INCOME GAP [ $ ]
$8,041
FAMILY INCOME DEFICIT
0.50
INEQUALITY / GINI INDEX
7,694
TOTAL POPULATION
3,979
MALE POPULATION
3,715
FEMALE POPULATION
107.11
MALES / 100 FEMALES
93.37
FEMALES / 100 MALES
35.0
MEDIAN AGE
3.1
AVG FAMILY SIZE
2.7
AVG HOUSEHOLD SIZE
3,360
LABOR FORCE [ PEOPLE ]
57.2%
PERCENT IN LABOR FORCE
0.3%
UNEMPLOYMENT RATE
Emmett Zip Codes
Emmett Area Codes
Income in Emmett
Income Overview in Emmett
Per Capita Income in Emmett is $32,055, while median incomes of families and households are $64,038 and $54,575 respectively.
| Characteristic | Number | Measure |
| Per Capita Income | 7,694 | $32,055 |
| Median Family Income | 1,850 | $64,038 |
| Mean Family Income | 1,850 | $82,679 |
| Median Household Income | 2,790 | $54,575 |
| Mean Household Income | 2,790 | $78,817 |
| Income Deficit | 1,850 | $8,041 |
| Wage / Income Gap (%) | 7,694 | 29.66% |
| Wage / Income Gap ($) | 7,694 | 70.34¢ per $1 |
| Gini / Inequality Index | 7,694 | 0.50 |
Earnings by Sex in Emmett
Average Earnings in Emmett are $31,108, $36,812 for men and $25,893 for women, a difference of 29.7%.
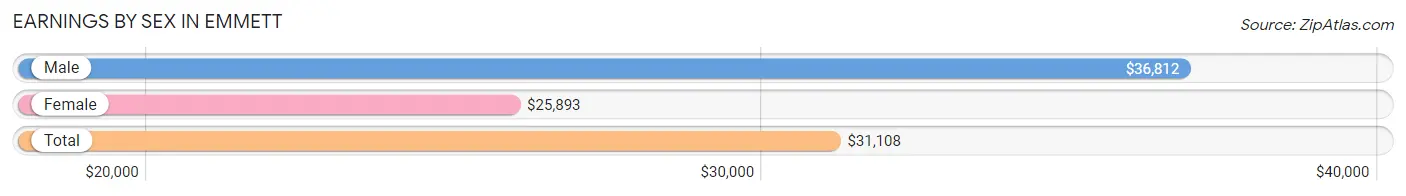
| Sex | Number | Average Earnings |
| Male | 2,003 (53.5%) | $36,812 |
| Female | 1,741 (46.5%) | $25,893 |
| Total | 3,744 (100.0%) | $31,108 |
Earnings by Sex by Income Bracket in Emmett
The most common earnings brackets in Emmett are $55,000 to $64,999 for men (293 | 14.6%) and $40,000 to $44,999 for women (321 | 18.4%).
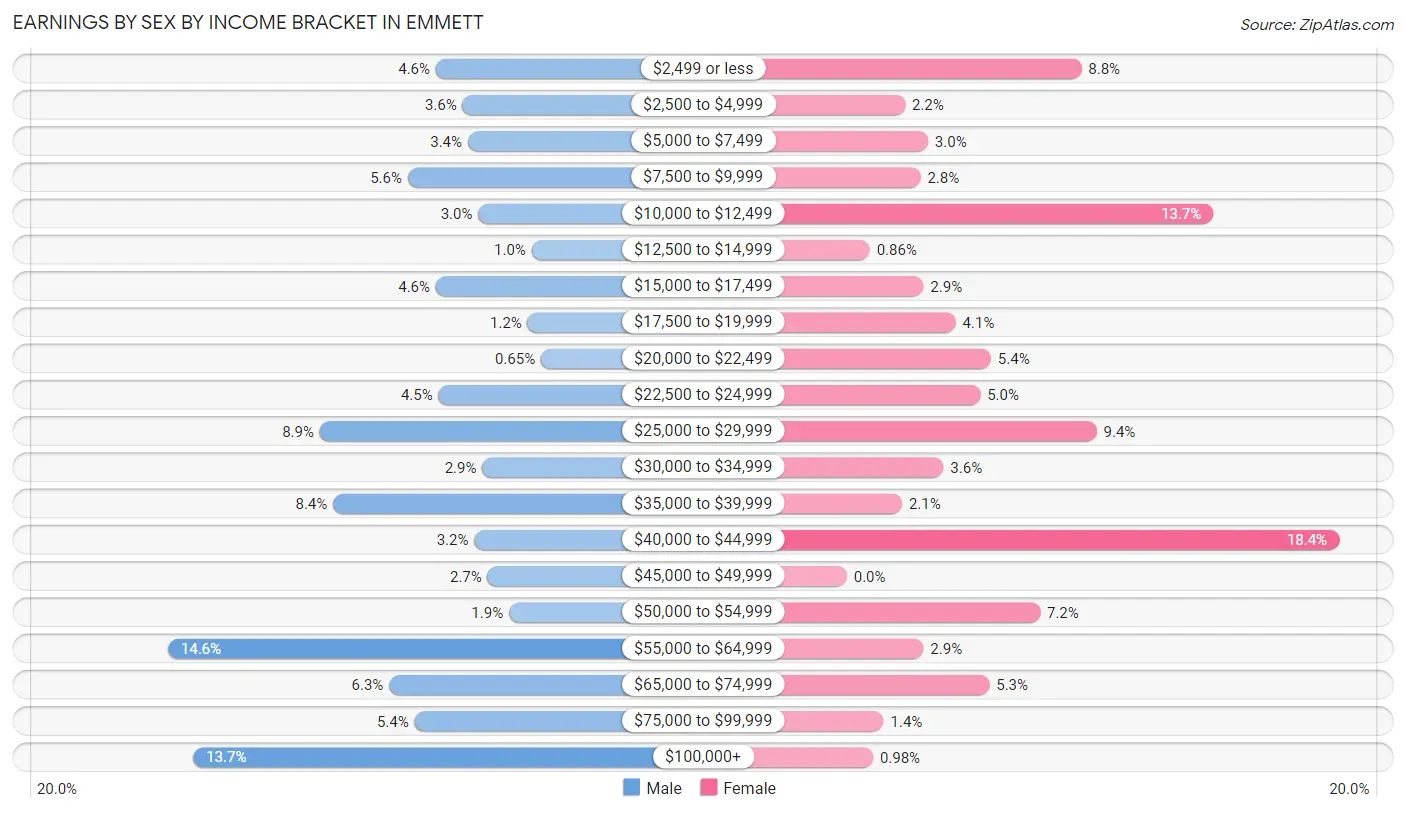
| Income | Male | Female |
| $2,499 or less | 92 (4.6%) | 153 (8.8%) |
| $2,500 to $4,999 | 72 (3.6%) | 38 (2.2%) |
| $5,000 to $7,499 | 68 (3.4%) | 53 (3.0%) |
| $7,500 to $9,999 | 113 (5.6%) | 48 (2.8%) |
| $10,000 to $12,499 | 60 (3.0%) | 239 (13.7%) |
| $12,500 to $14,999 | 20 (1.0%) | 15 (0.9%) |
| $15,000 to $17,499 | 92 (4.6%) | 50 (2.9%) |
| $17,500 to $19,999 | 23 (1.1%) | 71 (4.1%) |
| $20,000 to $22,499 | 13 (0.6%) | 94 (5.4%) |
| $22,500 to $24,999 | 90 (4.5%) | 87 (5.0%) |
| $25,000 to $29,999 | 179 (8.9%) | 163 (9.4%) |
| $30,000 to $34,999 | 57 (2.9%) | 63 (3.6%) |
| $35,000 to $39,999 | 169 (8.4%) | 36 (2.1%) |
| $40,000 to $44,999 | 63 (3.2%) | 321 (18.4%) |
| $45,000 to $49,999 | 53 (2.6%) | 0 (0.0%) |
| $50,000 to $54,999 | 37 (1.8%) | 126 (7.2%) |
| $55,000 to $64,999 | 293 (14.6%) | 50 (2.9%) |
| $65,000 to $74,999 | 127 (6.3%) | 93 (5.3%) |
| $75,000 to $99,999 | 108 (5.4%) | 24 (1.4%) |
| $100,000+ | 274 (13.7%) | 17 (1.0%) |
| Total | 2,003 (100.0%) | 1,741 (100.0%) |
Earnings by Sex by Educational Attainment in Emmett
Average earnings in Emmett are $55,448 for men and $29,625 for women, a difference of 46.6%. Men with an educational attainment of graduate degree enjoy the highest average annual earnings of $58,938, while those with less than high school education earn the least with $41,979. Women with an educational attainment of graduate degree earn the most with the average annual earnings of $60,250, while those with high school diploma education have the smallest earnings of $21,155.
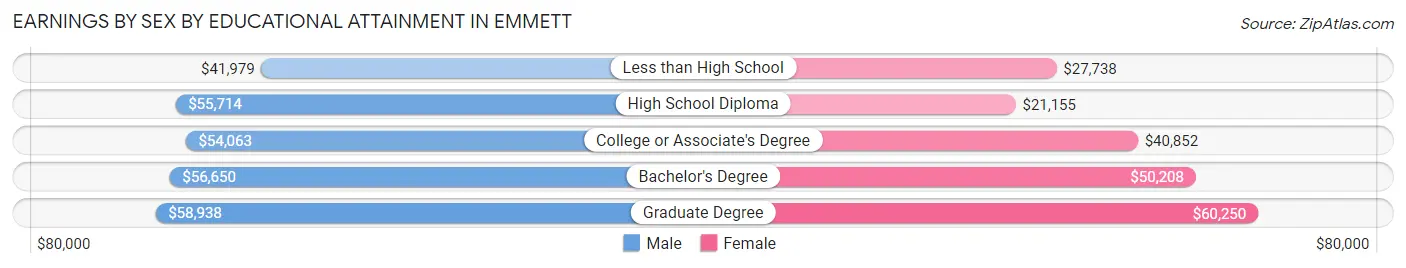
| Educational Attainment | Male Income | Female Income |
| Less than High School | $41,979 | $27,738 |
| High School Diploma | $55,714 | $21,155 |
| College or Associate's Degree | $54,063 | $40,852 |
| Bachelor's Degree | $56,650 | $50,208 |
| Graduate Degree | $58,938 | $60,250 |
| Total | $55,448 | $29,625 |
Family Income in Emmett
Family Income Brackets in Emmett
According to the Emmett family income data, there are 379 families falling into the $100,000 to $149,999 income range, which is the most common income bracket and makes up 20.5% of all families. Conversely, the less than $10,000 income bracket is the least frequent group with only 22 families (1.2%) belonging to this category.
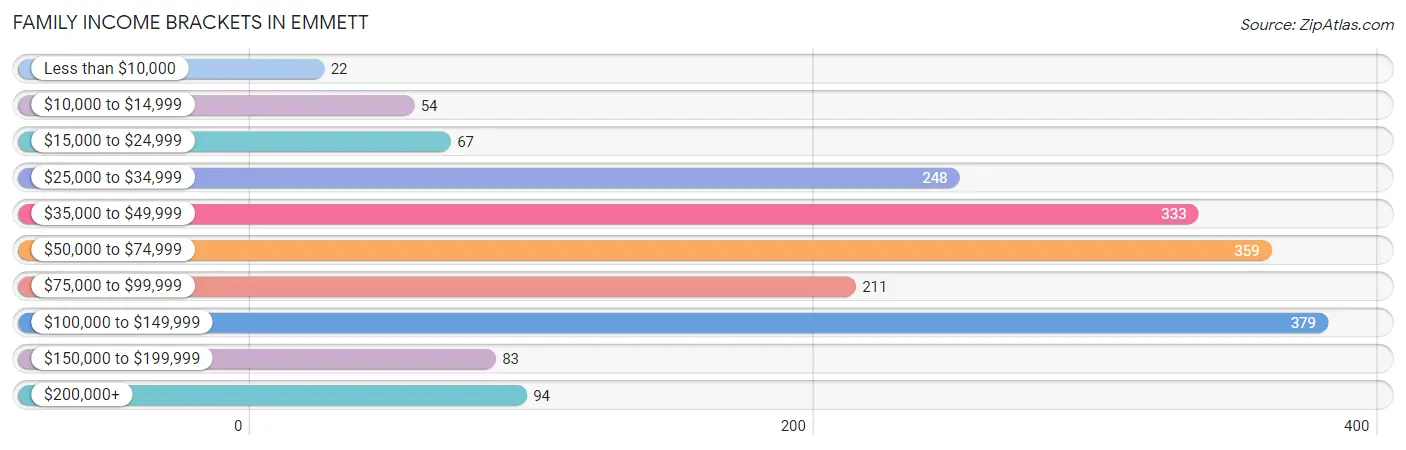
| Income Bracket | # Families | % Families |
| Less than $10,000 | 22 | 1.2% |
| $10,000 to $14,999 | 54 | 2.9% |
| $15,000 to $24,999 | 67 | 3.6% |
| $25,000 to $34,999 | 248 | 13.4% |
| $35,000 to $49,999 | 333 | 18.0% |
| $50,000 to $74,999 | 359 | 19.4% |
| $75,000 to $99,999 | 211 | 11.4% |
| $100,000 to $149,999 | 379 | 20.5% |
| $150,000 to $199,999 | 83 | 4.5% |
| $200,000+ | 94 | 5.1% |
Family Income by Famaliy Size in Emmett
6-person families (159 | 8.6%) account for the highest median family income in Emmett with $123,702 per family, while 4-person families (267 | 14.4%) have the highest median income of $26,354 per family member.
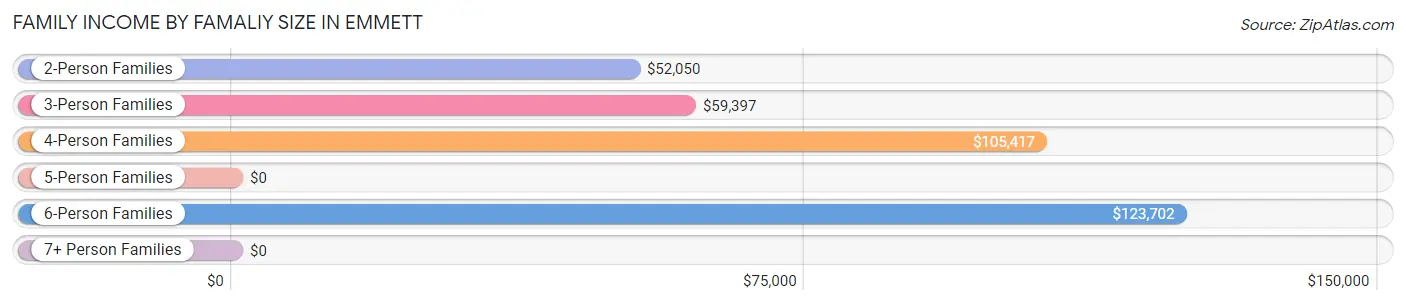
| Income Bracket | # Families | Median Income |
| 2-Person Families | 903 (48.8%) | $52,050 |
| 3-Person Families | 402 (21.7%) | $59,397 |
| 4-Person Families | 267 (14.4%) | $105,417 |
| 5-Person Families | 80 (4.3%) | $0 |
| 6-Person Families | 159 (8.6%) | $123,702 |
| 7+ Person Families | 39 (2.1%) | $0 |
| Total | 1,850 (100.0%) | $64,038 |
Family Income by Number of Earners in Emmett
The median family income in Emmett is $64,038, with families comprising 3+ earners (278) having the highest median family income of $132,619, while families with no earners (191) have the lowest median family income of $32,372, accounting for 15.0% and 10.3% of families, respectively.
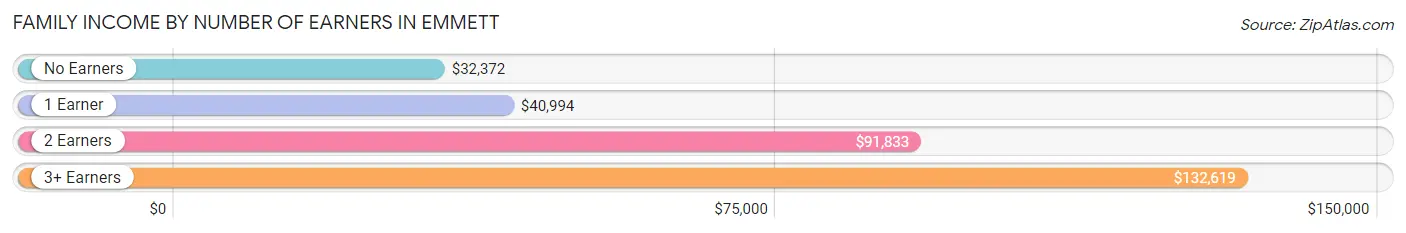
| Number of Earners | # Families | Median Income |
| No Earners | 191 (10.3%) | $32,372 |
| 1 Earner | 719 (38.9%) | $40,994 |
| 2 Earners | 662 (35.8%) | $91,833 |
| 3+ Earners | 278 (15.0%) | $132,619 |
| Total | 1,850 (100.0%) | $64,038 |
Household Income in Emmett
Household Income Brackets in Emmett
With 628 households falling in the category, the $50,000 to $74,999 income range is the most frequent in Emmett, accounting for 22.5% of all households. In contrast, only 98 households (3.5%) fall into the $150,000 to $199,999 income bracket, making it the least populous group.
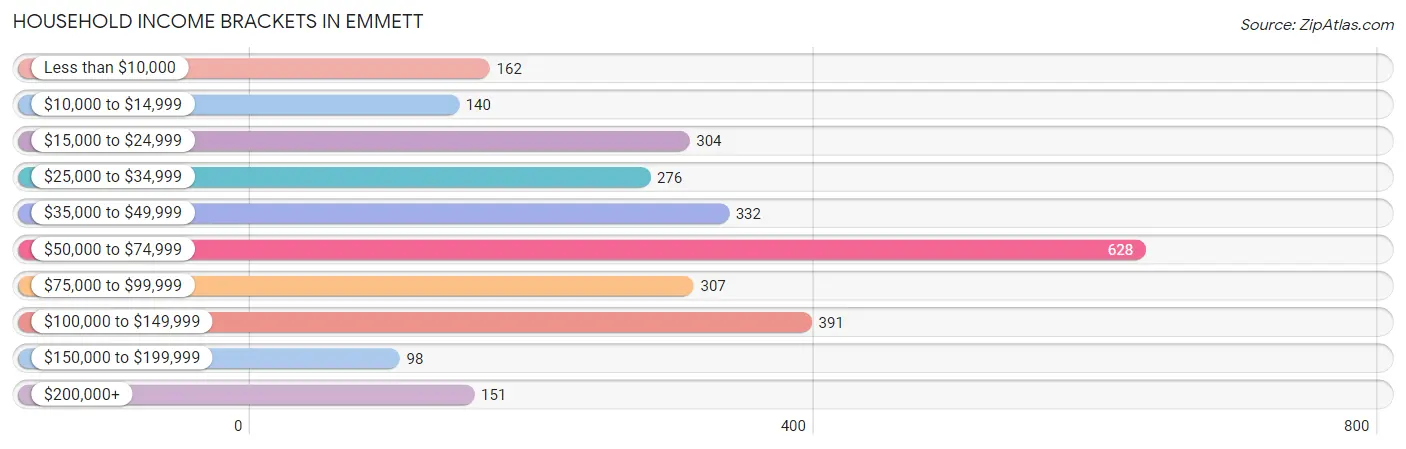
| Income Bracket | # Households | % Households |
| Less than $10,000 | 162 | 5.8% |
| $10,000 to $14,999 | 140 | 5.0% |
| $15,000 to $24,999 | 304 | 10.9% |
| $25,000 to $34,999 | 276 | 9.9% |
| $35,000 to $49,999 | 332 | 11.9% |
| $50,000 to $74,999 | 628 | 22.5% |
| $75,000 to $99,999 | 307 | 11.0% |
| $100,000 to $149,999 | 391 | 14.0% |
| $150,000 to $199,999 | 98 | 3.5% |
| $200,000+ | 151 | 5.4% |
Household Income by Householder Age in Emmett
The median household income in Emmett is $54,575, with the highest median household income of $70,319 found in the 15 to 24 years age bracket for the primary householder. A total of 103 households (3.7%) fall into this category. Meanwhile, the 65+ years age bracket for the primary householder has the lowest median household income of $32,009, with 994 households (35.6%) in this group.
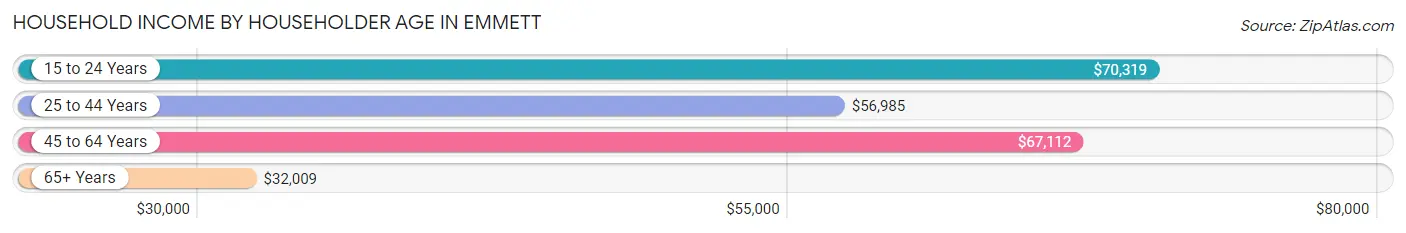
| Income Bracket | # Households | Median Income |
| 15 to 24 Years | 103 (3.7%) | $70,319 |
| 25 to 44 Years | 980 (35.1%) | $56,985 |
| 45 to 64 Years | 713 (25.6%) | $67,112 |
| 65+ Years | 994 (35.6%) | $32,009 |
| Total | 2,790 (100.0%) | $54,575 |
Poverty in Emmett
Income Below Poverty by Sex and Age in Emmett
With 18.8% poverty level for males and 18.9% for females among the residents of Emmett, 15 year old males and 5 year old females are the most vulnerable to poverty, with 55 males (69.6%) and 21 females (80.8%) in their respective age groups living below the poverty level.
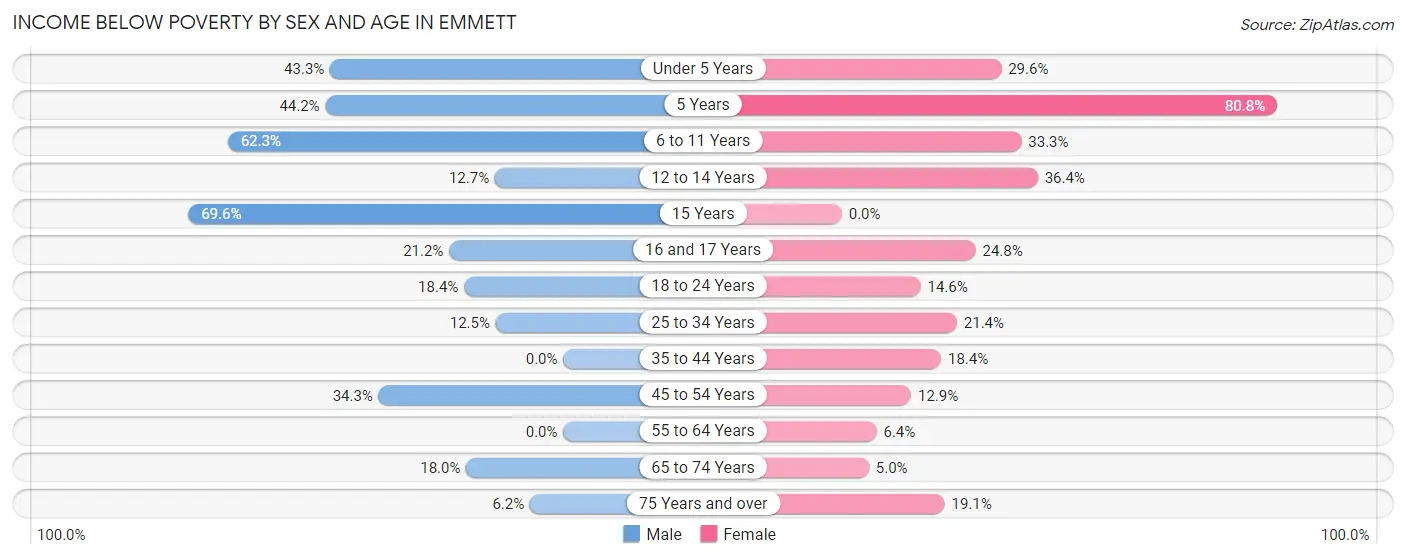
| Age Bracket | Male | Female |
| Under 5 Years | 87 (43.3%) | 79 (29.6%) |
| 5 Years | 34 (44.2%) | 21 (80.8%) |
| 6 to 11 Years | 119 (62.3%) | 119 (33.3%) |
| 12 to 14 Years | 17 (12.7%) | 56 (36.4%) |
| 15 Years | 55 (69.6%) | 0 (0.0%) |
| 16 and 17 Years | 32 (21.2%) | 34 (24.8%) |
| 18 to 24 Years | 65 (18.4%) | 26 (14.6%) |
| 25 to 34 Years | 71 (12.5%) | 132 (21.4%) |
| 35 to 44 Years | 0 (0.0%) | 91 (18.4%) |
| 45 to 54 Years | 98 (34.3%) | 37 (12.9%) |
| 55 to 64 Years | 0 (0.0%) | 25 (6.4%) |
| 65 to 74 Years | 89 (18.0%) | 21 (5.0%) |
| 75 Years and over | 16 (6.2%) | 41 (19.1%) |
| Total | 683 (18.8%) | 682 (18.9%) |
Income Above Poverty by Sex and Age in Emmett
According to the poverty statistics in Emmett, males aged 35 to 44 years and females aged 15 years are the age groups that are most secure financially, with 100.0% of males and 100.0% of females in these age groups living above the poverty line.
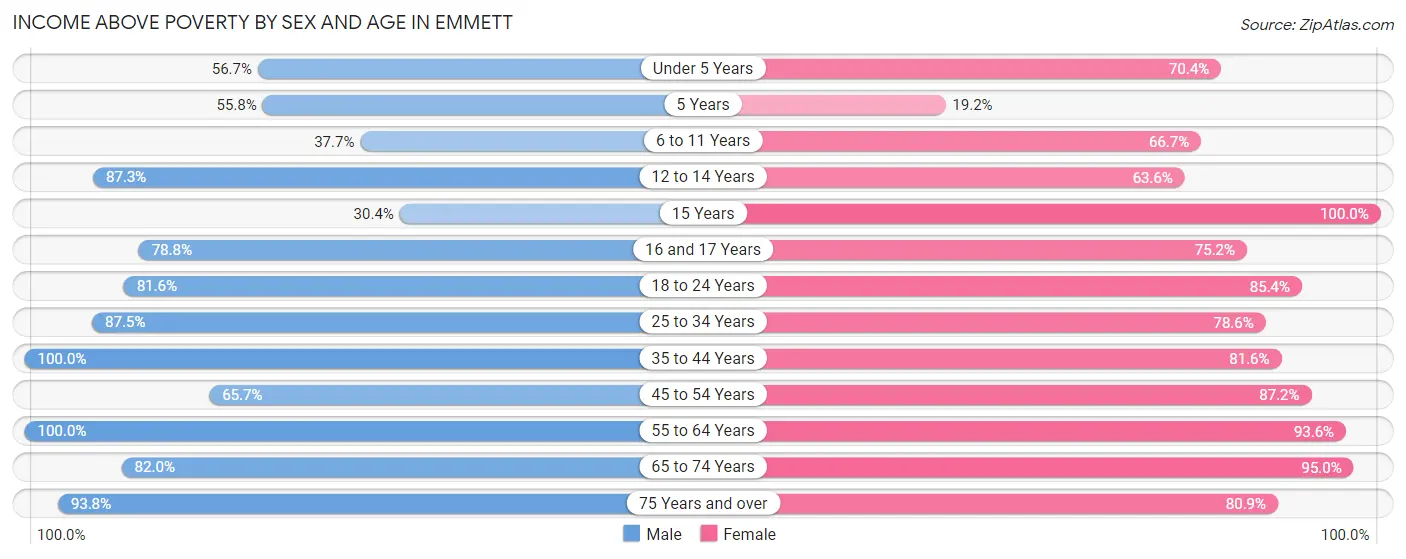
| Age Bracket | Male | Female |
| Under 5 Years | 114 (56.7%) | 188 (70.4%) |
| 5 Years | 43 (55.8%) | 5 (19.2%) |
| 6 to 11 Years | 72 (37.7%) | 238 (66.7%) |
| 12 to 14 Years | 117 (87.3%) | 98 (63.6%) |
| 15 Years | 24 (30.4%) | 70 (100.0%) |
| 16 and 17 Years | 119 (78.8%) | 103 (75.2%) |
| 18 to 24 Years | 288 (81.6%) | 152 (85.4%) |
| 25 to 34 Years | 495 (87.5%) | 486 (78.6%) |
| 35 to 44 Years | 421 (100.0%) | 403 (81.6%) |
| 45 to 54 Years | 188 (65.7%) | 251 (87.2%) |
| 55 to 64 Years | 414 (100.0%) | 364 (93.6%) |
| 65 to 74 Years | 405 (82.0%) | 397 (95.0%) |
| 75 Years and over | 243 (93.8%) | 174 (80.9%) |
| Total | 2,943 (81.2%) | 2,929 (81.1%) |
Income Below Poverty Among Married-Couple Families in Emmett
The poverty statistics for married-couple families in Emmett show that 9.9% or 121 of the total 1,226 families live below the poverty line. Families with 5 or more children have the highest poverty rate of 100.0%, comprising of 11 families. On the other hand, families with 1 or 2 children have the lowest poverty rate of 3.1%, which includes 10 families.
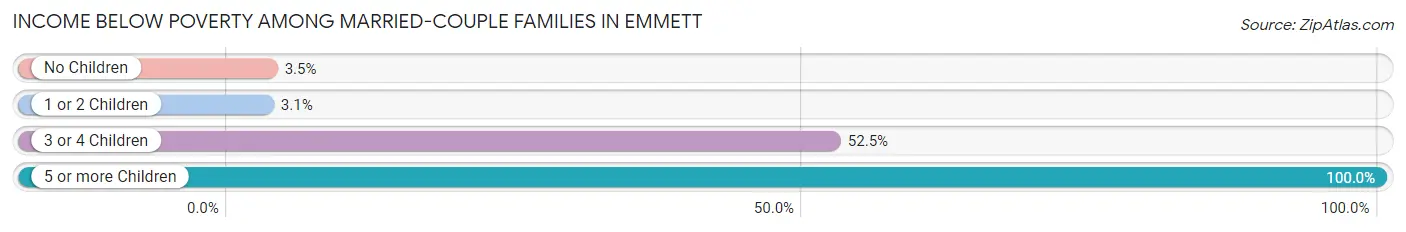
| Children | Above Poverty | Below Poverty |
| No Children | 728 (96.6%) | 26 (3.5%) |
| 1 or 2 Children | 310 (96.9%) | 10 (3.1%) |
| 3 or 4 Children | 67 (47.5%) | 74 (52.5%) |
| 5 or more Children | 0 (0.0%) | 11 (100.0%) |
| Total | 1,105 (90.1%) | 121 (9.9%) |
Income Below Poverty Among Single-Parent Households in Emmett
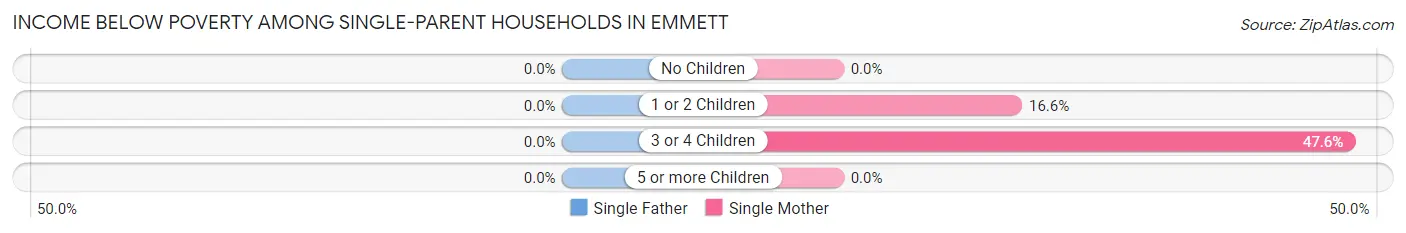
| Children | Single Father | Single Mother |
| No Children | 0 (0.0%) | 0 (0.0%) |
| 1 or 2 Children | 0 (0.0%) | 47 (16.6%) |
| 3 or 4 Children | 0 (0.0%) | 30 (47.6%) |
| 5 or more Children | 0 (0.0%) | 0 (0.0%) |
| Total | 0 (0.0%) | 77 (17.6%) |
Income Below Poverty Among Married-Couple vs Single-Parent Households in Emmett
The poverty data for Emmett shows that 121 of the married-couple family households (9.9%) and 77 of the single-parent households (12.3%) are living below the poverty level. Within the married-couple family households, those with 5 or more children have the highest poverty rate, with 11 households (100.0%) falling below the poverty line. Among the single-parent households, those with 3 or 4 children have the highest poverty rate, with 30 household (39.5%) living below poverty.
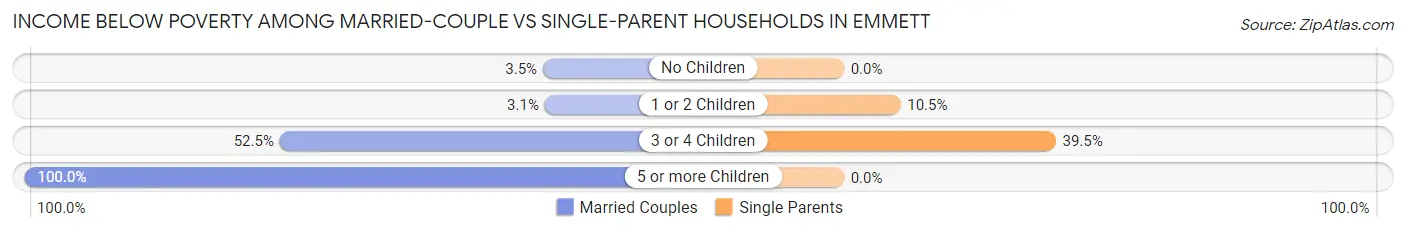
| Children | Married-Couple Families | Single-Parent Households |
| No Children | 26 (3.5%) | 0 (0.0%) |
| 1 or 2 Children | 10 (3.1%) | 47 (10.5%) |
| 3 or 4 Children | 74 (52.5%) | 30 (39.5%) |
| 5 or more Children | 11 (100.0%) | 0 (0.0%) |
| Total | 121 (9.9%) | 77 (12.3%) |
Race in Emmett
The most populous races in Emmett are White / Caucasian (6,292 | 81.8%), Hispanic or Latino (1,163 | 15.1%), and Two or more Races (750 | 9.8%).
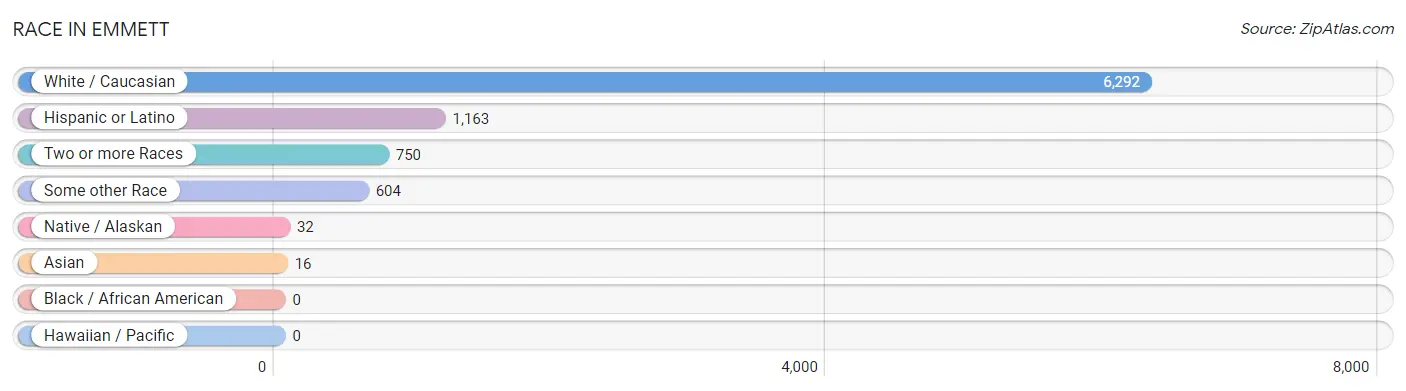
| Race | # Population | % Population |
| Asian | 16 | 0.2% |
| Black / African American | 0 | 0.0% |
| Hawaiian / Pacific | 0 | 0.0% |
| Hispanic or Latino | 1,163 | 15.1% |
| Native / Alaskan | 32 | 0.4% |
| White / Caucasian | 6,292 | 81.8% |
| Two or more Races | 750 | 9.8% |
| Some other Race | 604 | 7.9% |
| Total | 7,694 | 100.0% |
Ancestry in Emmett
The most populous ancestries reported in Emmett are Mexican (1,021 | 13.3%), German (977 | 12.7%), English (850 | 11.1%), American (626 | 8.1%), and Irish (621 | 8.1%), together accounting for 53.2% of all Emmett residents.
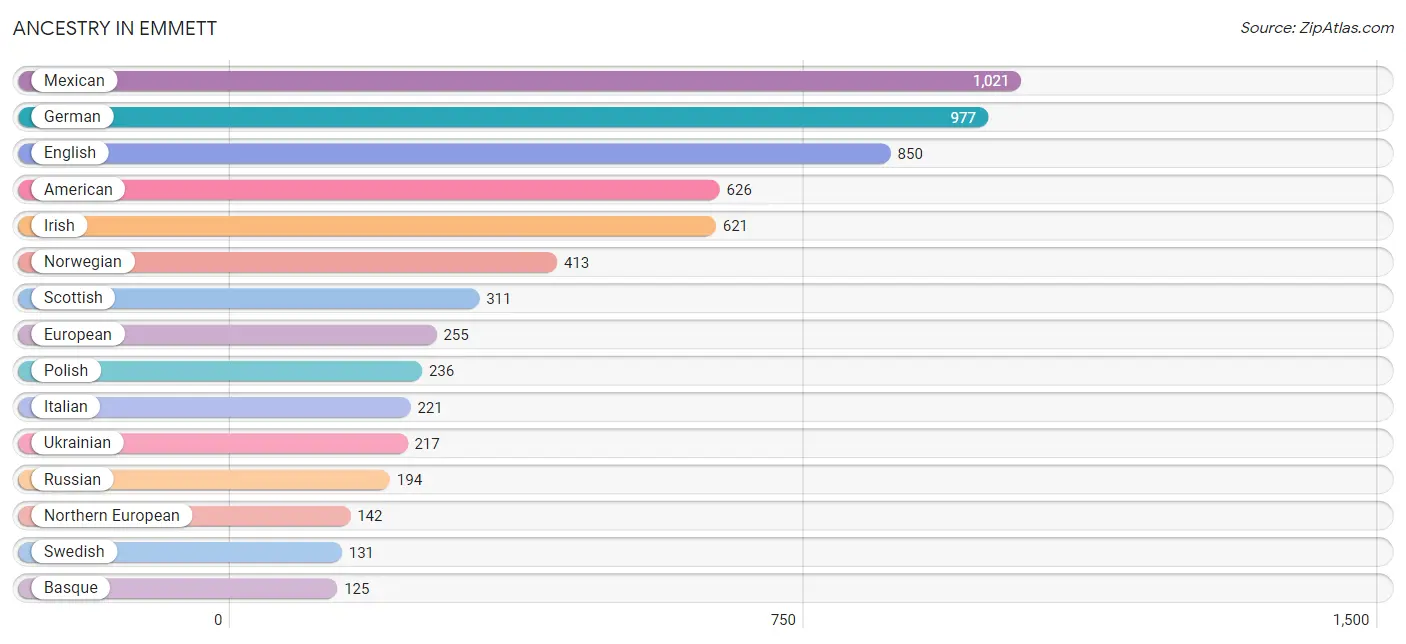
| Ancestry | # Population | % Population |
| African | 11 | 0.1% |
| American | 626 | 8.1% |
| Basque | 125 | 1.6% |
| Bhutanese | 41 | 0.5% |
| British | 65 | 0.8% |
| Central American | 18 | 0.2% |
| Central American Indian | 19 | 0.3% |
| Cherokee | 3 | 0.0% |
| Cheyenne | 17 | 0.2% |
| Croatian | 43 | 0.6% |
| Cuban | 27 | 0.4% |
| Czech | 18 | 0.2% |
| Danish | 46 | 0.6% |
| Dutch | 117 | 1.5% |
| English | 850 | 11.1% |
| European | 255 | 3.3% |
| Finnish | 85 | 1.1% |
| French | 64 | 0.8% |
| French Canadian | 44 | 0.6% |
| German | 977 | 12.7% |
| Greek | 25 | 0.3% |
| Indian (Asian) | 50 | 0.6% |
| Irish | 621 | 8.1% |
| Italian | 221 | 2.9% |
| Korean | 24 | 0.3% |
| Mexican | 1,021 | 13.3% |
| Mexican American Indian | 13 | 0.2% |
| Native Hawaiian | 92 | 1.2% |
| Northern European | 142 | 1.8% |
| Norwegian | 413 | 5.4% |
| Peruvian | 97 | 1.3% |
| Polish | 236 | 3.1% |
| Portuguese | 27 | 0.4% |
| Puget Sound Salish | 12 | 0.2% |
| Russian | 194 | 2.5% |
| Salvadoran | 18 | 0.2% |
| Samoan | 27 | 0.4% |
| Scandinavian | 2 | 0.0% |
| Scotch-Irish | 36 | 0.5% |
| Scottish | 311 | 4.0% |
| South American | 97 | 1.3% |
| Subsaharan African | 11 | 0.1% |
| Swedish | 131 | 1.7% |
| Swiss | 99 | 1.3% |
| Ukrainian | 217 | 2.8% |
| Welsh | 17 | 0.2% |
| Yaqui | 11 | 0.1% | View All 47 Rows |
Immigrants in Emmett
The most numerous immigrant groups reported in Emmett came from Latin America (432 | 5.6%), Europe (382 | 5.0%), Eastern Europe (377 | 4.9%), Central America (365 | 4.7%), and Mexico (365 | 4.7%), together accounting for 24.9% of all Emmett residents.
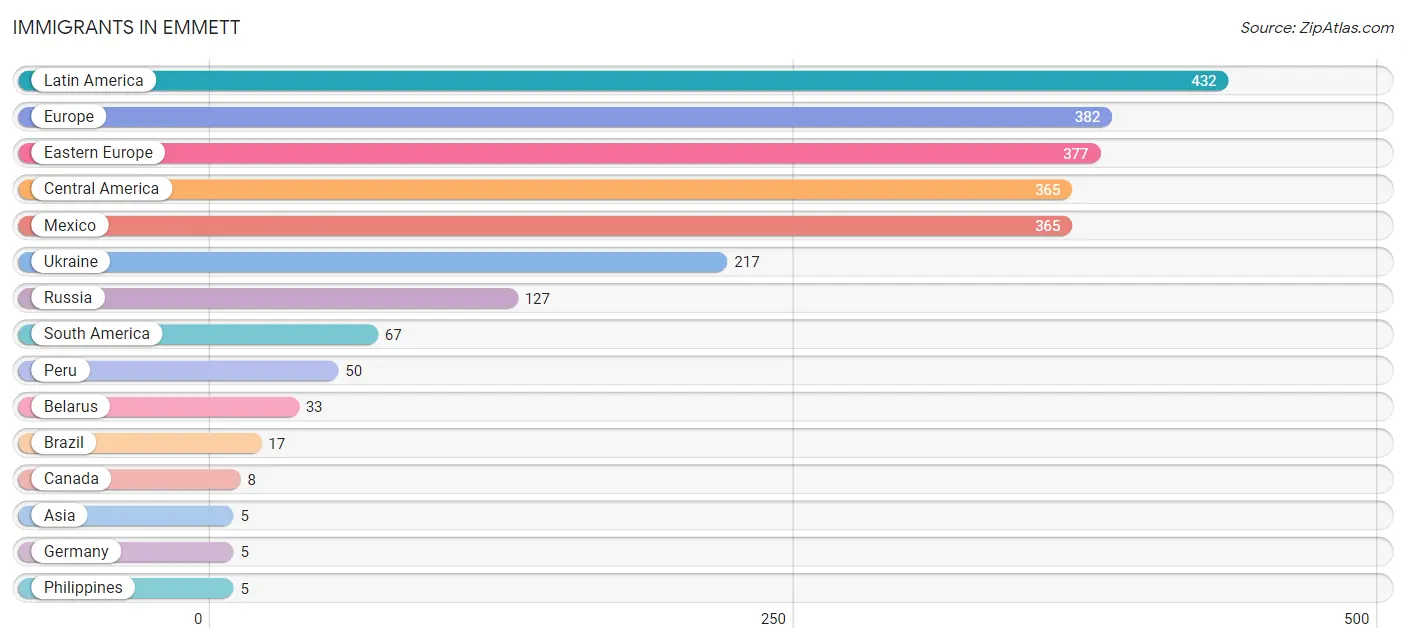
| Immigration Origin | # Population | % Population |
| Asia | 5 | 0.1% |
| Belarus | 33 | 0.4% |
| Brazil | 17 | 0.2% |
| Canada | 8 | 0.1% |
| Central America | 365 | 4.7% |
| Eastern Europe | 377 | 4.9% |
| Europe | 382 | 5.0% |
| Germany | 5 | 0.1% |
| Latin America | 432 | 5.6% |
| Mexico | 365 | 4.7% |
| Peru | 50 | 0.6% |
| Philippines | 5 | 0.1% |
| Russia | 127 | 1.7% |
| South America | 67 | 0.9% |
| South Eastern Asia | 5 | 0.1% |
| Ukraine | 217 | 2.8% |
| Western Europe | 5 | 0.1% | View All 17 Rows |
Sex and Age in Emmett
Sex and Age in Emmett
The most populous age groups in Emmett are 5 to 9 Years (373 | 9.4%) for men and 30 to 34 Years (399 | 10.7%) for women.
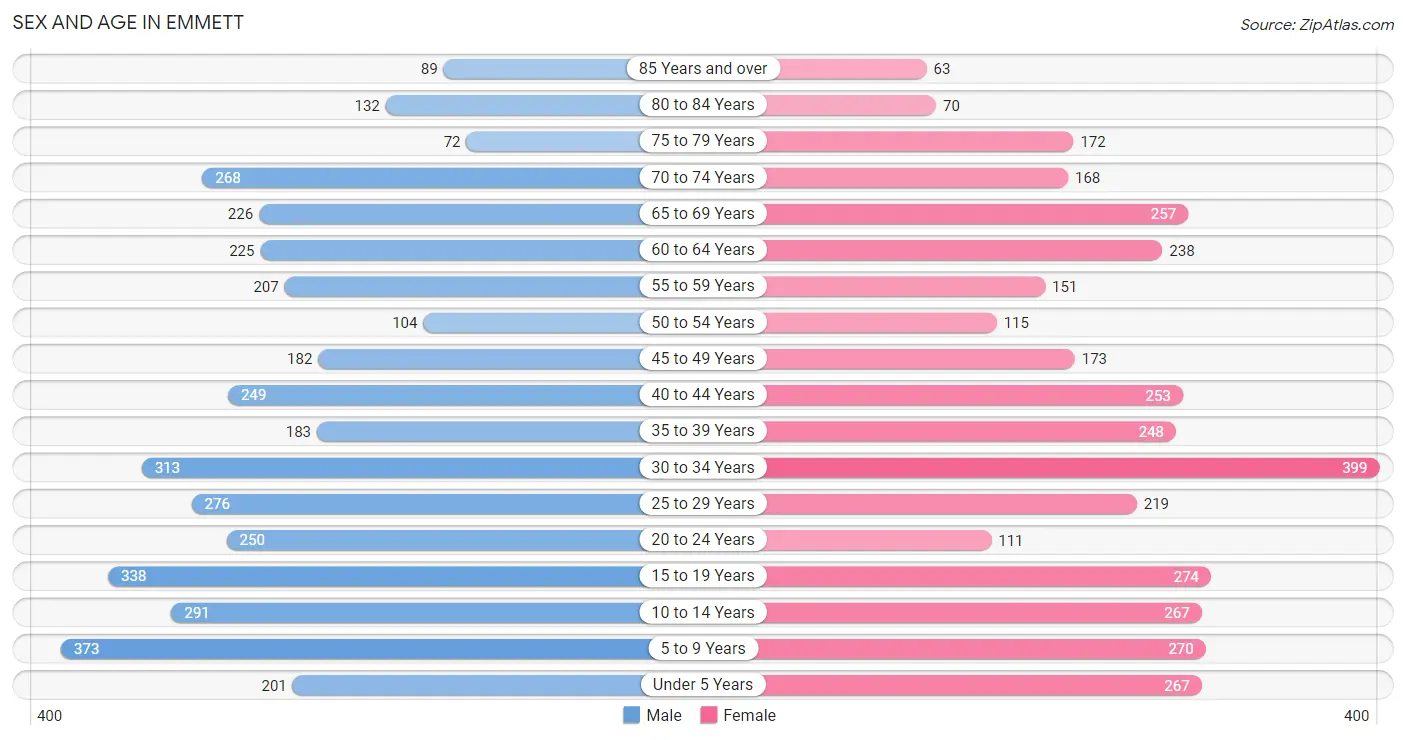
| Age Bracket | Male | Female |
| Under 5 Years | 201 (5.1%) | 267 (7.2%) |
| 5 to 9 Years | 373 (9.4%) | 270 (7.3%) |
| 10 to 14 Years | 291 (7.3%) | 267 (7.2%) |
| 15 to 19 Years | 338 (8.5%) | 274 (7.4%) |
| 20 to 24 Years | 250 (6.3%) | 111 (3.0%) |
| 25 to 29 Years | 276 (6.9%) | 219 (5.9%) |
| 30 to 34 Years | 313 (7.9%) | 399 (10.7%) |
| 35 to 39 Years | 183 (4.6%) | 248 (6.7%) |
| 40 to 44 Years | 249 (6.3%) | 253 (6.8%) |
| 45 to 49 Years | 182 (4.6%) | 173 (4.7%) |
| 50 to 54 Years | 104 (2.6%) | 115 (3.1%) |
| 55 to 59 Years | 207 (5.2%) | 151 (4.1%) |
| 60 to 64 Years | 225 (5.7%) | 238 (6.4%) |
| 65 to 69 Years | 226 (5.7%) | 257 (6.9%) |
| 70 to 74 Years | 268 (6.7%) | 168 (4.5%) |
| 75 to 79 Years | 72 (1.8%) | 172 (4.6%) |
| 80 to 84 Years | 132 (3.3%) | 70 (1.9%) |
| 85 Years and over | 89 (2.2%) | 63 (1.7%) |
| Total | 3,979 (100.0%) | 3,715 (100.0%) |
Families and Households in Emmett
Median Family Size in Emmett
The median family size in Emmett is 3.12 persons per family, with married-couple families (1,226 | 66.3%) accounting for the largest median family size of 3.39 persons per family. On the other hand, single male/father families (187 | 10.1%) represent the smallest median family size with 2.20 persons per family.
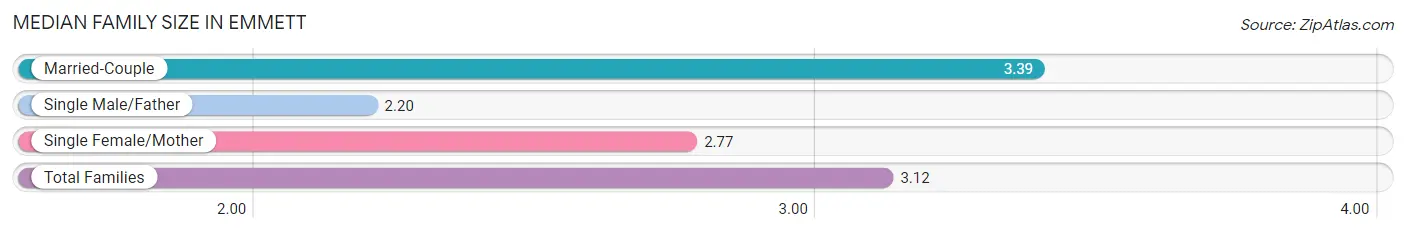
| Family Type | # Families | Family Size |
| Married-Couple | 1,226 (66.3%) | 3.39 |
| Single Male/Father | 187 (10.1%) | 2.20 |
| Single Female/Mother | 437 (23.6%) | 2.77 |
| Total Families | 1,850 (100.0%) | 3.12 |
Median Household Size in Emmett
The median household size in Emmett is 2.69 persons per household, with married-couple households (1,226 | 43.9%) accounting for the largest median household size of 3.59 persons per household. non-family households (940 | 33.7%) represent the smallest median household size with 1.08 persons per household.
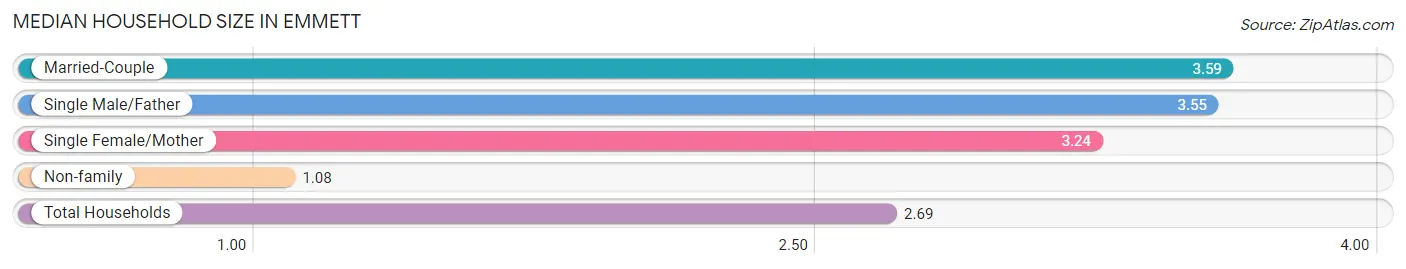
| Household Type | # Households | Household Size |
| Married-Couple | 1,226 (43.9%) | 3.59 |
| Single Male/Father | 187 (6.7%) | 3.55 |
| Single Female/Mother | 437 (15.7%) | 3.24 |
| Non-family | 940 (33.7%) | 1.08 |
| Total Households | 2,790 (100.0%) | 2.69 |
Household Size by Marriage Status in Emmett
Out of a total of 2,790 households in Emmett, 1,850 (66.3%) are family households, while 940 (33.7%) are nonfamily households. The most numerous type of family households are 2-person households, comprising 689, and the most common type of nonfamily households are 1-person households, comprising 861.
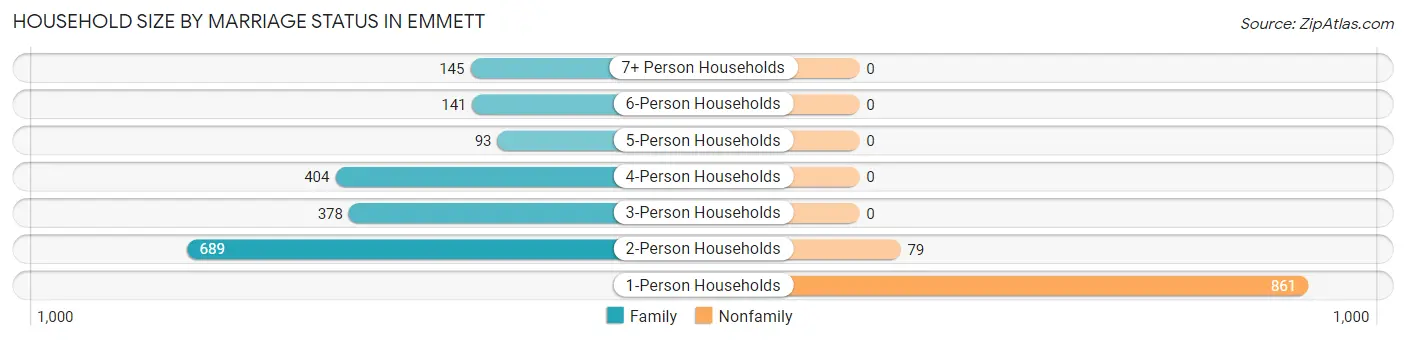
| Household Size | Family Households | Nonfamily Households |
| 1-Person Households | - | 861 (30.9%) |
| 2-Person Households | 689 (24.7%) | 79 (2.8%) |
| 3-Person Households | 378 (13.6%) | 0 (0.0%) |
| 4-Person Households | 404 (14.5%) | 0 (0.0%) |
| 5-Person Households | 93 (3.3%) | 0 (0.0%) |
| 6-Person Households | 141 (5.1%) | 0 (0.0%) |
| 7+ Person Households | 145 (5.2%) | 0 (0.0%) |
| Total | 1,850 (66.3%) | 940 (33.7%) |
Female Fertility in Emmett
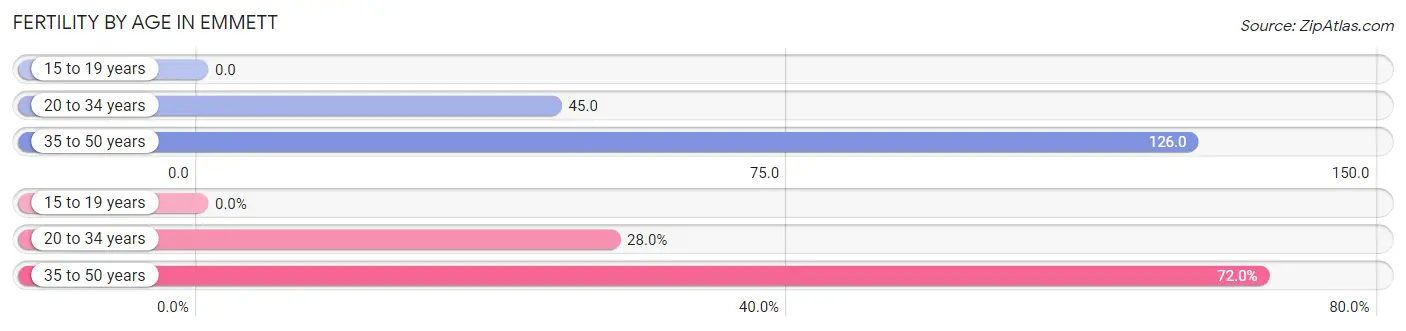
Fertility by Age in Emmett
Average fertility rate in Emmett is 70.0 births per 1,000 women. Women in the age bracket of 35 to 50 years have the highest fertility rate with 126.0 births per 1,000 women. Women in the age bracket of 35 to 50 years acount for 72.0% of all women with births.
| Age Bracket | Women with Births | Births / 1,000 Women |
| 15 to 19 years | 0 (0.0%) | 0.0 |
| 20 to 34 years | 33 (28.0%) | 45.0 |
| 35 to 50 years | 85 (72.0%) | 126.0 |
| Total | 118 (100.0%) | 70.0 |
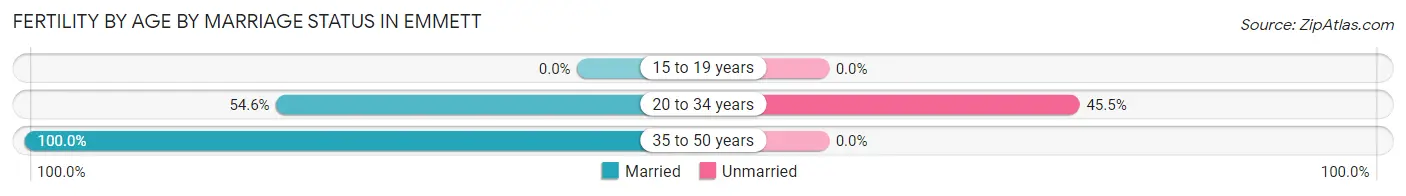
Fertility by Age by Marriage Status in Emmett
87.3% of women with births (118) in Emmett are married. The highest percentage of unmarried women with births falls into 20 to 34 years age bracket with 45.5% of them unmarried at the time of birth, while the lowest percentage of unmarried women with births belong to 35 to 50 years age bracket with 0.0% of them unmarried.
| Age Bracket | Married | Unmarried |
| 15 to 19 years | 0 (0.0%) | 0 (0.0%) |
| 20 to 34 years | 18 (54.5%) | 15 (45.5%) |
| 35 to 50 years | 85 (100.0%) | 0 (0.0%) |
| Total | 103 (87.3%) | 15 (12.7%) |
Fertility by Education in Emmett
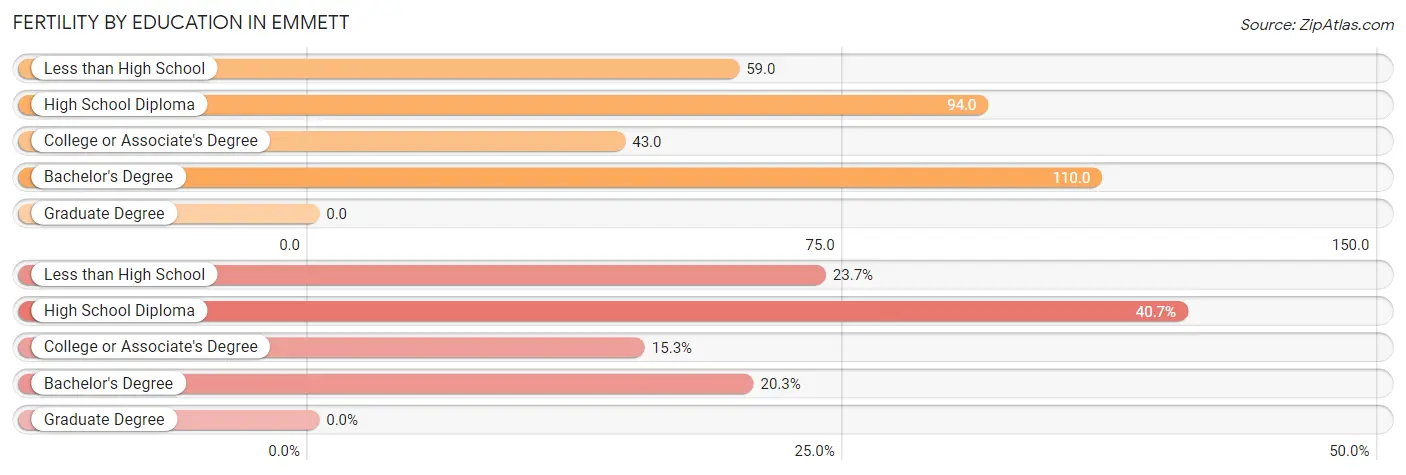
| Educational Attainment | Women with Births | Births / 1,000 Women |
| Less than High School | 28 (23.7%) | 59.0 |
| High School Diploma | 48 (40.7%) | 94.0 |
| College or Associate's Degree | 18 (15.2%) | 43.0 |
| Bachelor's Degree | 24 (20.3%) | 110.0 |
| Graduate Degree | 0 (0.0%) | 0.0 |
| Total | 118 (100.0%) | 70.0 |
Fertility by Education by Marriage Status in Emmett
12.7% of women with births in Emmett are unmarried. Women with the educational attainment of less than high school are most likely to be married with 100.0% of them married at childbirth, while women with the educational attainment of high school diploma are least likely to be married with 31.2% of them unmarried at childbirth.
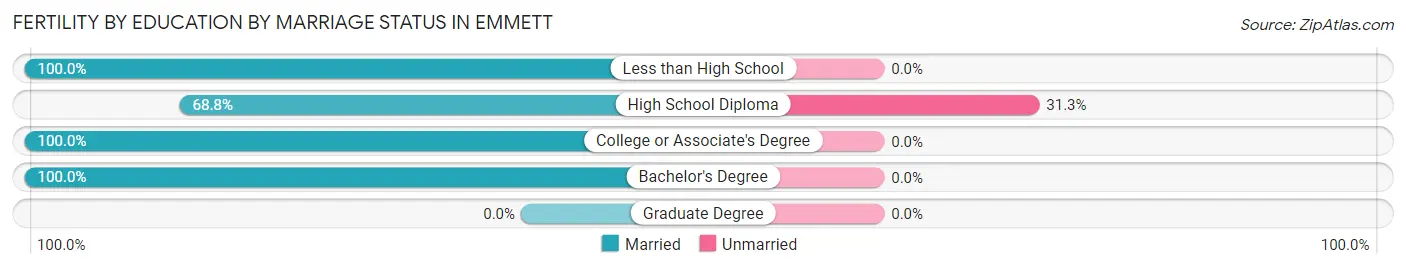
| Educational Attainment | Married | Unmarried |
| Less than High School | 28 (100.0%) | 0 (0.0%) |
| High School Diploma | 33 (68.8%) | 15 (31.2%) |
| College or Associate's Degree | 18 (100.0%) | 0 (0.0%) |
| Bachelor's Degree | 24 (100.0%) | 0 (0.0%) |
| Graduate Degree | 0 (0.0%) | 0 (0.0%) |
| Total | 103 (87.3%) | 15 (12.7%) |
Employment Characteristics in Emmett
Employment by Class of Employer in Emmett
Among the 3,167 employed individuals in Emmett, private company employees (2,253 | 71.1%), local government employees (341 | 10.8%), and not-for-profit organizations (147 | 4.6%) make up the most common classes of employment.
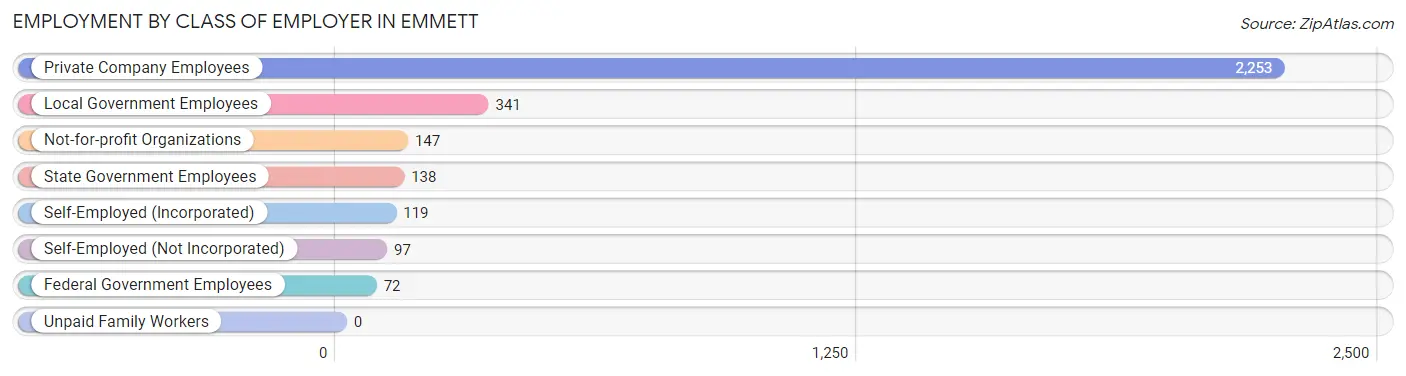
| Employer Class | # Employees | % Employees |
| Private Company Employees | 2,253 | 71.1% |
| Self-Employed (Incorporated) | 119 | 3.8% |
| Self-Employed (Not Incorporated) | 97 | 3.1% |
| Not-for-profit Organizations | 147 | 4.6% |
| Local Government Employees | 341 | 10.8% |
| State Government Employees | 138 | 4.4% |
| Federal Government Employees | 72 | 2.3% |
| Unpaid Family Workers | 0 | 0.0% |
| Total | 3,167 | 100.0% |
Employment Status by Age in Emmett
According to the labor force statistics for Emmett, out of the total population over 16 years of age (5,875), 57.2% or 3,360 individuals are in the labor force, with 0.3% or 10 of them unemployed. The age group with the highest labor force participation rate is 20 to 24 years, with 94.5% or 341 individuals in the labor force. Within the labor force, the 25 to 29 years age range has the highest percentage of unemployed individuals, with 2.4% or 10 of them being unemployed.
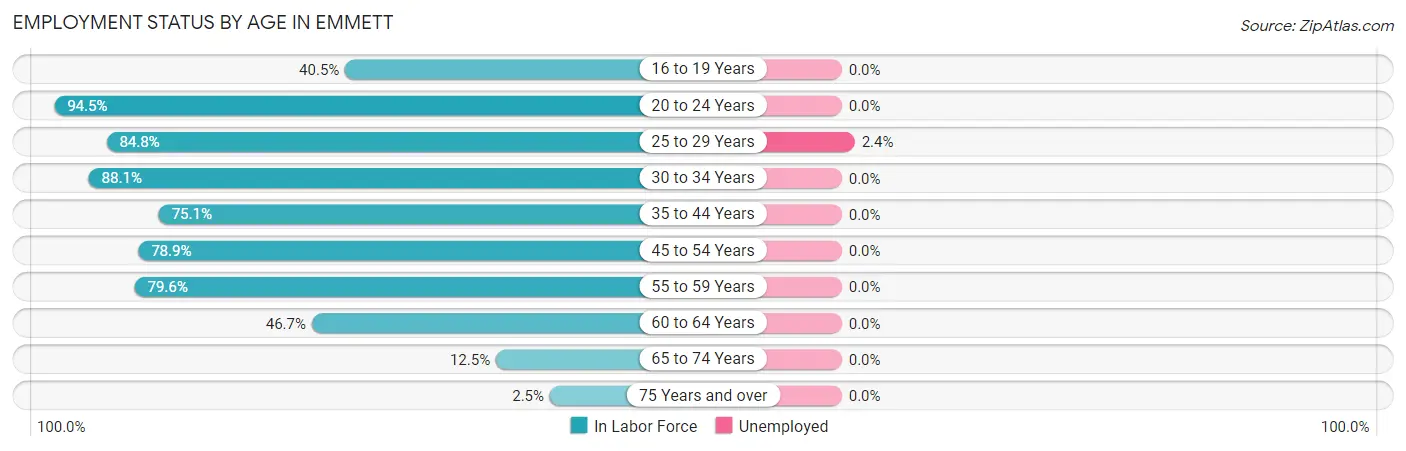
| Age Bracket | In Labor Force | Unemployed |
| 16 to 19 Years | 187 (40.5%) | 0 (0.0%) |
| 20 to 24 Years | 341 (94.5%) | 0 (0.0%) |
| 25 to 29 Years | 420 (84.8%) | 10 (2.4%) |
| 30 to 34 Years | 627 (88.1%) | 0 (0.0%) |
| 35 to 44 Years | 701 (75.1%) | 0 (0.0%) |
| 45 to 54 Years | 453 (78.9%) | 0 (0.0%) |
| 55 to 59 Years | 285 (79.6%) | 0 (0.0%) |
| 60 to 64 Years | 216 (46.7%) | 0 (0.0%) |
| 65 to 74 Years | 115 (12.5%) | 0 (0.0%) |
| 75 Years and over | 15 (2.5%) | 0 (0.0%) |
| Total | 3,360 (57.2%) | 10 (0.3%) |
Employment Status by Educational Attainment in Emmett
According to labor force statistics for Emmett, 76.4% of individuals (2,701) out of the total population between 25 and 64 years of age (3,535) are in the labor force, with 0.4% or 11 of them being unemployed. The group with the highest labor force participation rate are those with the educational attainment of bachelor's degree or higher, with 86.5% or 615 individuals in the labor force. Within the labor force, individuals with bachelor's degree or higher education have the highest percentage of unemployment, with 1.6% or 10 of them being unemployed.
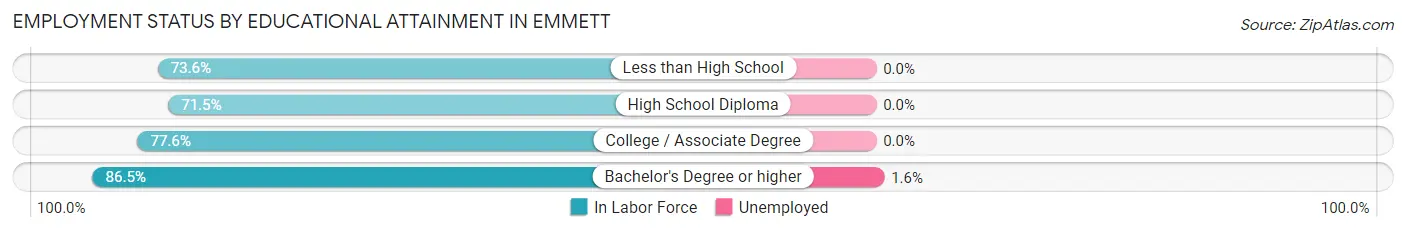
| Educational Attainment | In Labor Force | Unemployed |
| Less than High School | 505 (73.6%) | 0 (0.0%) |
| High School Diploma | 894 (71.5%) | 0 (0.0%) |
| College / Associate Degree | 688 (77.6%) | 0 (0.0%) |
| Bachelor's Degree or higher | 615 (86.5%) | 11 (1.6%) |
| Total | 2,701 (76.4%) | 14 (0.4%) |
Employment Occupations by Sex in Emmett
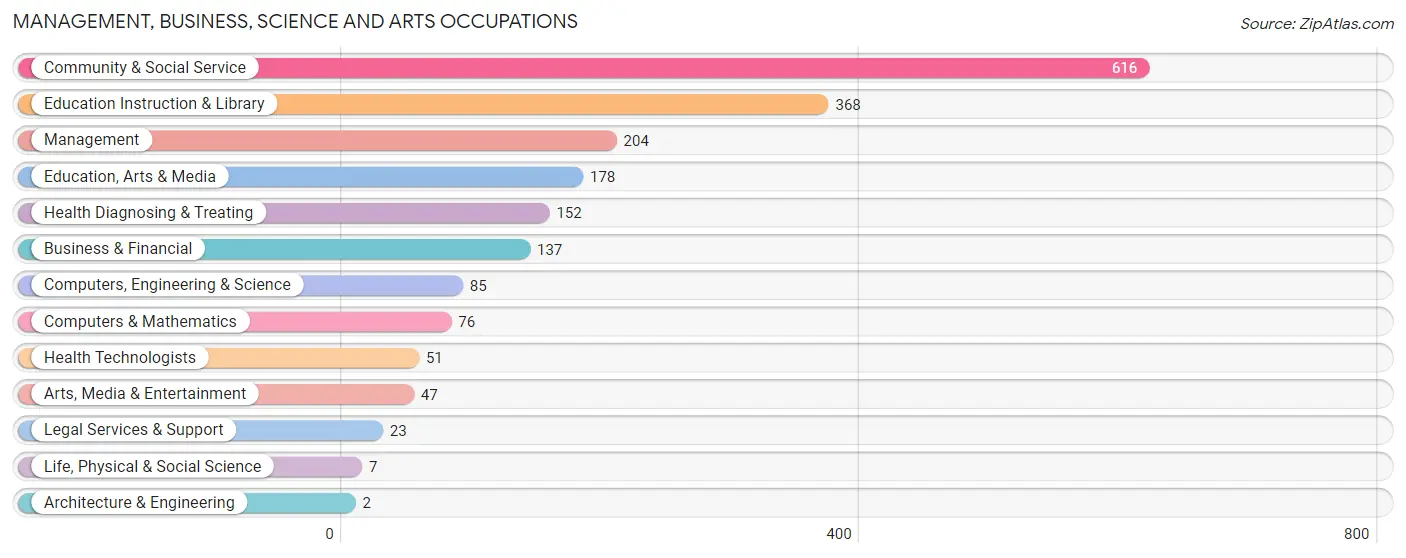
Management, Business, Science and Arts Occupations
The most common Management, Business, Science and Arts occupations in Emmett are Community & Social Service (616 | 18.4%), Education Instruction & Library (368 | 11.0%), Management (204 | 6.1%), Education, Arts & Media (178 | 5.3%), and Health Diagnosing & Treating (152 | 4.5%).
Management, Business, Science and Arts Occupations by Sex
Within the Management, Business, Science and Arts occupations in Emmett, the most male-oriented occupations are Architecture & Engineering (100.0%), Management (39.7%), and Computers & Mathematics (38.2%), while the most female-oriented occupations are Life, Physical & Social Science (100.0%), Legal Services & Support (100.0%), and Arts, Media & Entertainment (100.0%).
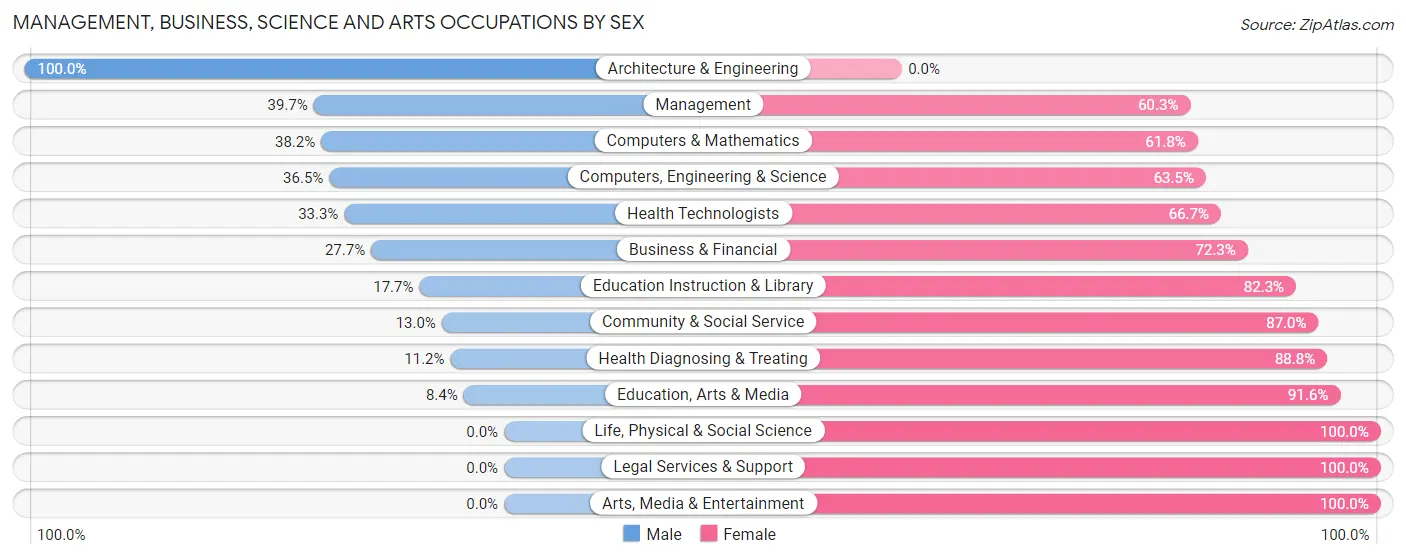
| Occupation | Male | Female |
| Management | 81 (39.7%) | 123 (60.3%) |
| Business & Financial | 38 (27.7%) | 99 (72.3%) |
| Computers, Engineering & Science | 31 (36.5%) | 54 (63.5%) |
| Computers & Mathematics | 29 (38.2%) | 47 (61.8%) |
| Architecture & Engineering | 2 (100.0%) | 0 (0.0%) |
| Life, Physical & Social Science | 0 (0.0%) | 7 (100.0%) |
| Community & Social Service | 80 (13.0%) | 536 (87.0%) |
| Education, Arts & Media | 15 (8.4%) | 163 (91.6%) |
| Legal Services & Support | 0 (0.0%) | 23 (100.0%) |
| Education Instruction & Library | 65 (17.7%) | 303 (82.3%) |
| Arts, Media & Entertainment | 0 (0.0%) | 47 (100.0%) |
| Health Diagnosing & Treating | 17 (11.2%) | 135 (88.8%) |
| Health Technologists | 17 (33.3%) | 34 (66.7%) |
| Total (Category) | 247 (20.7%) | 947 (79.3%) |
| Total (Overall) | 1,817 (54.2%) | 1,533 (45.8%) |
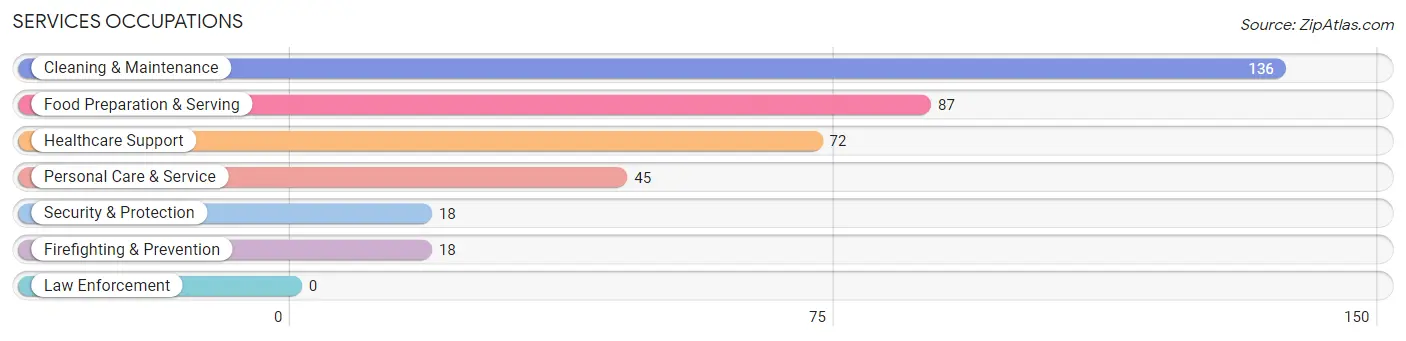
Services Occupations
The most common Services occupations in Emmett are Cleaning & Maintenance (136 | 4.1%), Food Preparation & Serving (87 | 2.6%), Healthcare Support (72 | 2.1%), Personal Care & Service (45 | 1.3%), and Security & Protection (18 | 0.5%).
Services Occupations by Sex
Within the Services occupations in Emmett, the most male-oriented occupations are Security & Protection (100.0%), Firefighting & Prevention (100.0%), and Cleaning & Maintenance (36.0%), while the most female-oriented occupations are Food Preparation & Serving (100.0%), Personal Care & Service (100.0%), and Healthcare Support (88.9%).
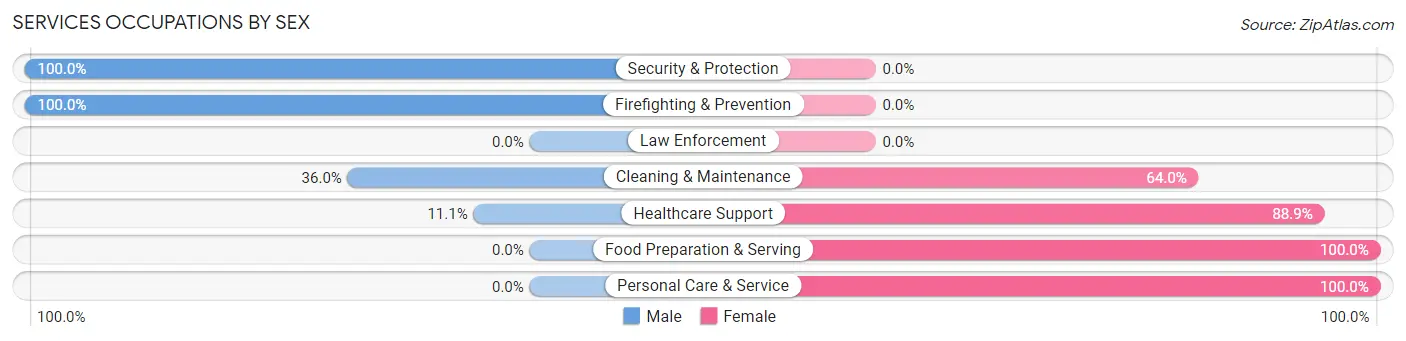
| Occupation | Male | Female |
| Healthcare Support | 8 (11.1%) | 64 (88.9%) |
| Security & Protection | 18 (100.0%) | 0 (0.0%) |
| Firefighting & Prevention | 18 (100.0%) | 0 (0.0%) |
| Law Enforcement | 0 (0.0%) | 0 (0.0%) |
| Food Preparation & Serving | 0 (0.0%) | 87 (100.0%) |
| Cleaning & Maintenance | 49 (36.0%) | 87 (64.0%) |
| Personal Care & Service | 0 (0.0%) | 45 (100.0%) |
| Total (Category) | 75 (20.9%) | 283 (79.0%) |
| Total (Overall) | 1,817 (54.2%) | 1,533 (45.8%) |
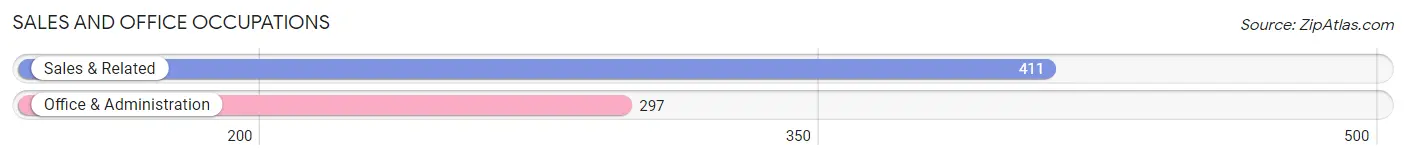
Sales and Office Occupations
The most common Sales and Office occupations in Emmett are Sales & Related (411 | 12.3%), and Office & Administration (297 | 8.9%).
Sales and Office Occupations by Sex
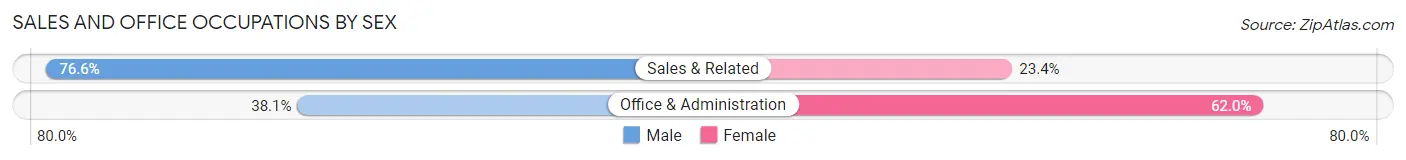
| Occupation | Male | Female |
| Sales & Related | 315 (76.6%) | 96 (23.4%) |
| Office & Administration | 113 (38.1%) | 184 (62.0%) |
| Total (Category) | 428 (60.5%) | 280 (39.6%) |
| Total (Overall) | 1,817 (54.2%) | 1,533 (45.8%) |
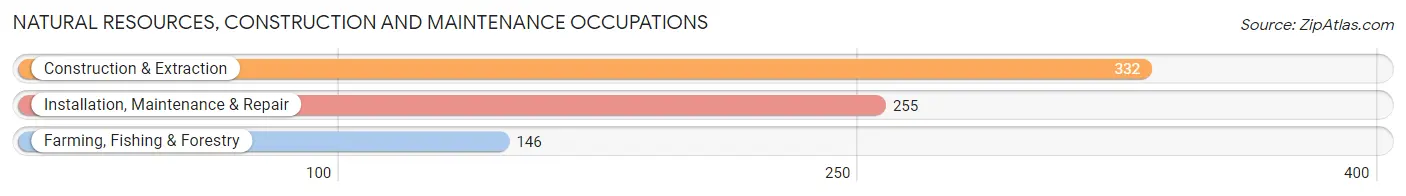
Natural Resources, Construction and Maintenance Occupations
The most common Natural Resources, Construction and Maintenance occupations in Emmett are Construction & Extraction (332 | 9.9%), Installation, Maintenance & Repair (255 | 7.6%), and Farming, Fishing & Forestry (146 | 4.4%).
Natural Resources, Construction and Maintenance Occupations by Sex
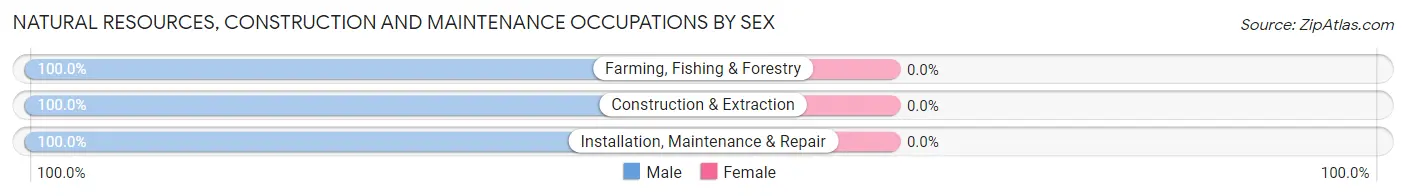
| Occupation | Male | Female |
| Farming, Fishing & Forestry | 146 (100.0%) | 0 (0.0%) |
| Construction & Extraction | 332 (100.0%) | 0 (0.0%) |
| Installation, Maintenance & Repair | 255 (100.0%) | 0 (0.0%) |
| Total (Category) | 733 (100.0%) | 0 (0.0%) |
| Total (Overall) | 1,817 (54.2%) | 1,533 (45.8%) |
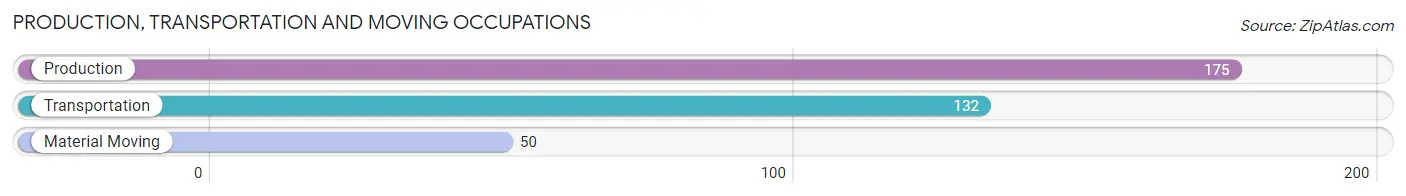
Production, Transportation and Moving Occupations
The most common Production, Transportation and Moving occupations in Emmett are Production (175 | 5.2%), Transportation (132 | 3.9%), and Material Moving (50 | 1.5%).
Production, Transportation and Moving Occupations by Sex
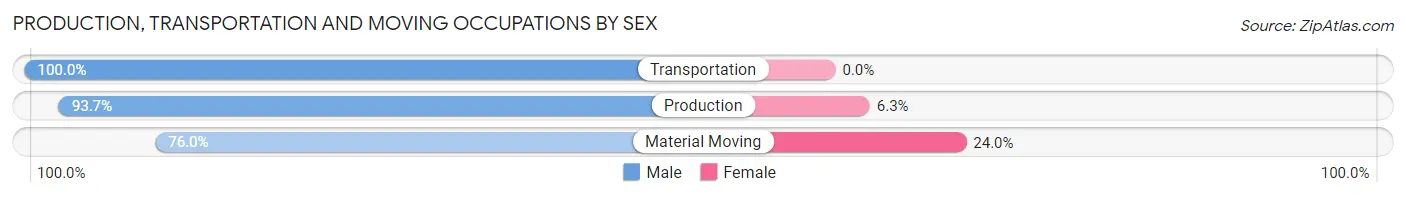
| Occupation | Male | Female |
| Production | 164 (93.7%) | 11 (6.3%) |
| Transportation | 132 (100.0%) | 0 (0.0%) |
| Material Moving | 38 (76.0%) | 12 (24.0%) |
| Total (Category) | 334 (93.6%) | 23 (6.4%) |
| Total (Overall) | 1,817 (54.2%) | 1,533 (45.8%) |
Employment Industries by Sex in Emmett
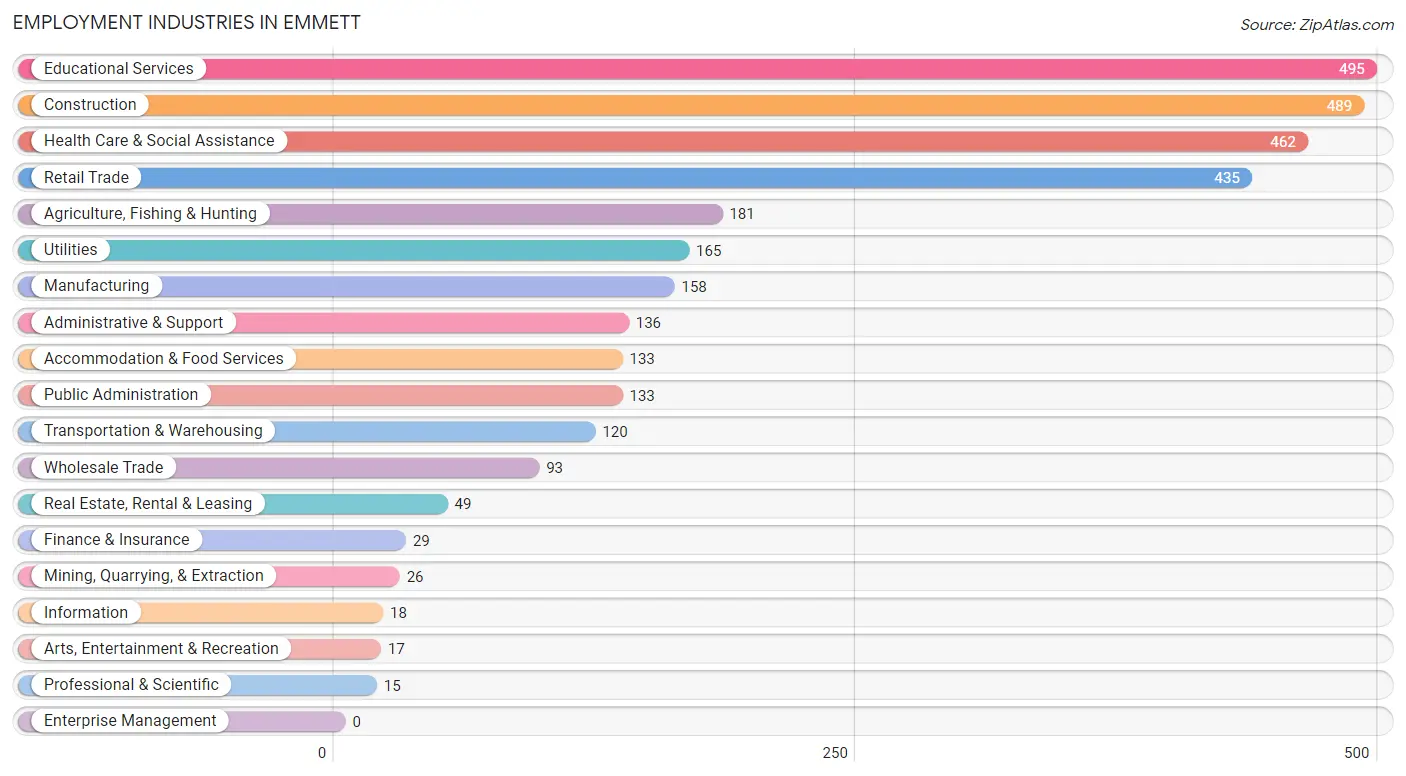
Employment Industries in Emmett
The major employment industries in Emmett include Educational Services (495 | 14.8%), Construction (489 | 14.6%), Health Care & Social Assistance (462 | 13.8%), Retail Trade (435 | 13.0%), and Agriculture, Fishing & Hunting (181 | 5.4%).
Employment Industries by Sex in Emmett
The Emmett industries that see more men than women are Mining, Quarrying, & Extraction (100.0%), Transportation & Warehousing (100.0%), and Utilities (100.0%), whereas the industries that tend to have a higher number of women are Information (100.0%), Finance & Insurance (100.0%), and Accommodation & Food Services (100.0%).
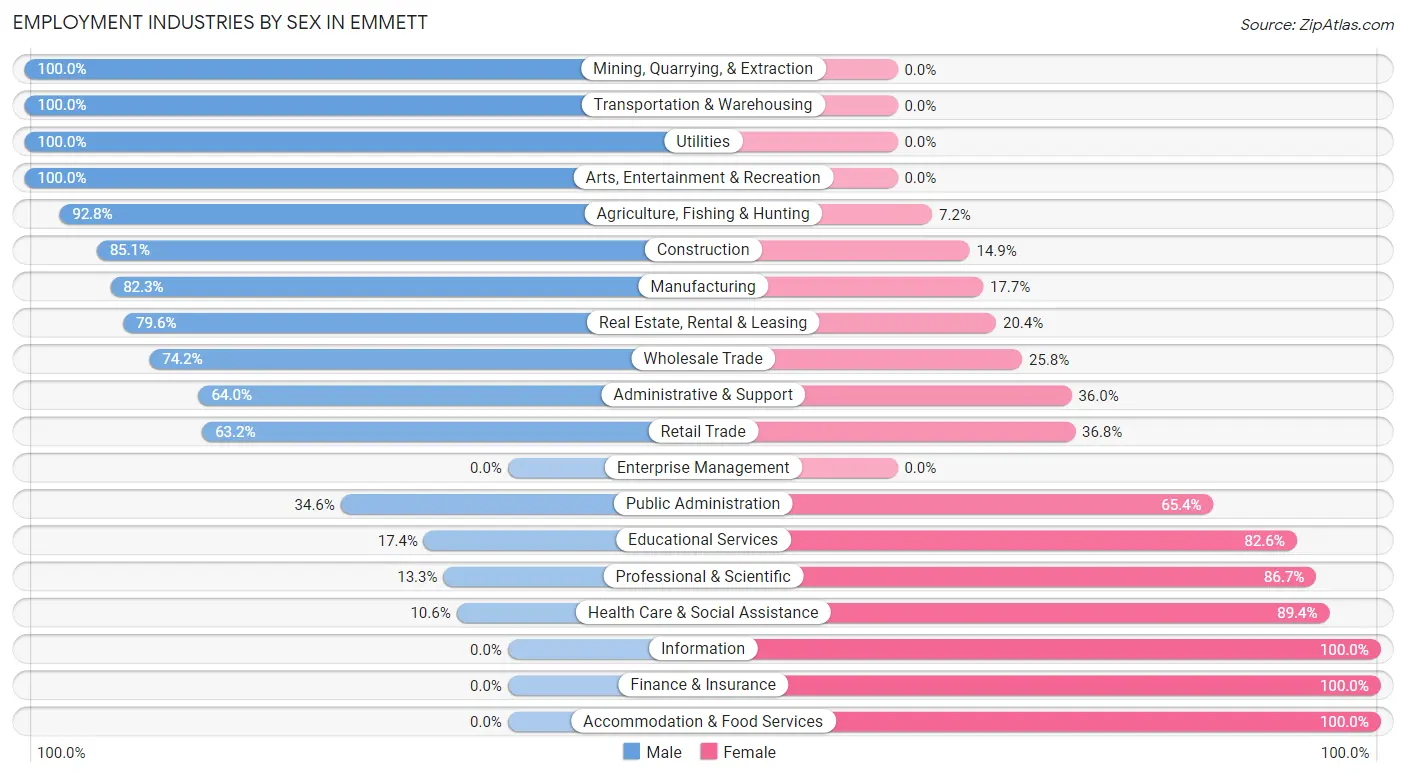
| Industry | Male | Female |
| Agriculture, Fishing & Hunting | 168 (92.8%) | 13 (7.2%) |
| Mining, Quarrying, & Extraction | 26 (100.0%) | 0 (0.0%) |
| Construction | 416 (85.1%) | 73 (14.9%) |
| Manufacturing | 130 (82.3%) | 28 (17.7%) |
| Wholesale Trade | 69 (74.2%) | 24 (25.8%) |
| Retail Trade | 275 (63.2%) | 160 (36.8%) |
| Transportation & Warehousing | 120 (100.0%) | 0 (0.0%) |
| Utilities | 165 (100.0%) | 0 (0.0%) |
| Information | 0 (0.0%) | 18 (100.0%) |
| Finance & Insurance | 0 (0.0%) | 29 (100.0%) |
| Real Estate, Rental & Leasing | 39 (79.6%) | 10 (20.4%) |
| Professional & Scientific | 2 (13.3%) | 13 (86.7%) |
| Enterprise Management | 0 (0.0%) | 0 (0.0%) |
| Administrative & Support | 87 (64.0%) | 49 (36.0%) |
| Educational Services | 86 (17.4%) | 409 (82.6%) |
| Health Care & Social Assistance | 49 (10.6%) | 413 (89.4%) |
| Arts, Entertainment & Recreation | 17 (100.0%) | 0 (0.0%) |
| Accommodation & Food Services | 0 (0.0%) | 133 (100.0%) |
| Public Administration | 46 (34.6%) | 87 (65.4%) |
| Total | 1,817 (54.2%) | 1,533 (45.8%) |
Education in Emmett
School Enrollment in Emmett
The most common levels of schooling among the 1,733 students in Emmett are high school (512 | 29.5%), middle school (432 | 24.9%), and elementary school (405 | 23.4%).
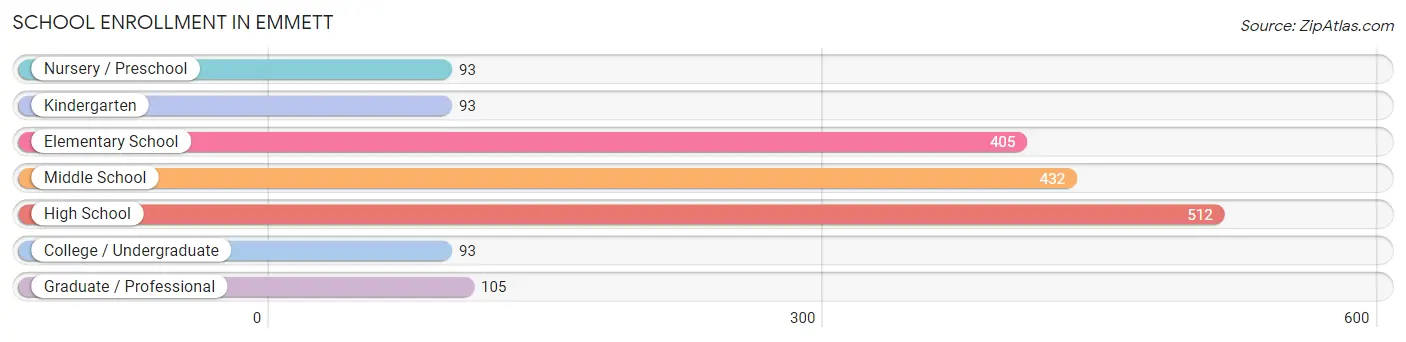
| School Level | # Students | % Students |
| Nursery / Preschool | 93 | 5.4% |
| Kindergarten | 93 | 5.4% |
| Elementary School | 405 | 23.4% |
| Middle School | 432 | 24.9% |
| High School | 512 | 29.5% |
| College / Undergraduate | 93 | 5.4% |
| Graduate / Professional | 105 | 6.1% |
| Total | 1,733 | 100.0% |
School Enrollment by Age by Funding Source in Emmett
Out of a total of 1,733 students who are enrolled in schools in Emmett, 243 (14.0%) attend a private institution, while the remaining 1,490 (86.0%) are enrolled in public schools. The age group of 25 to 34 year olds has the highest likelihood of being enrolled in private schools, with 78 (79.6% in the age bracket) enrolled. Conversely, the age group of 18 to 19 year olds has the lowest likelihood of being enrolled in a private school, with 20 (100.0% in the age bracket) attending a public institution.
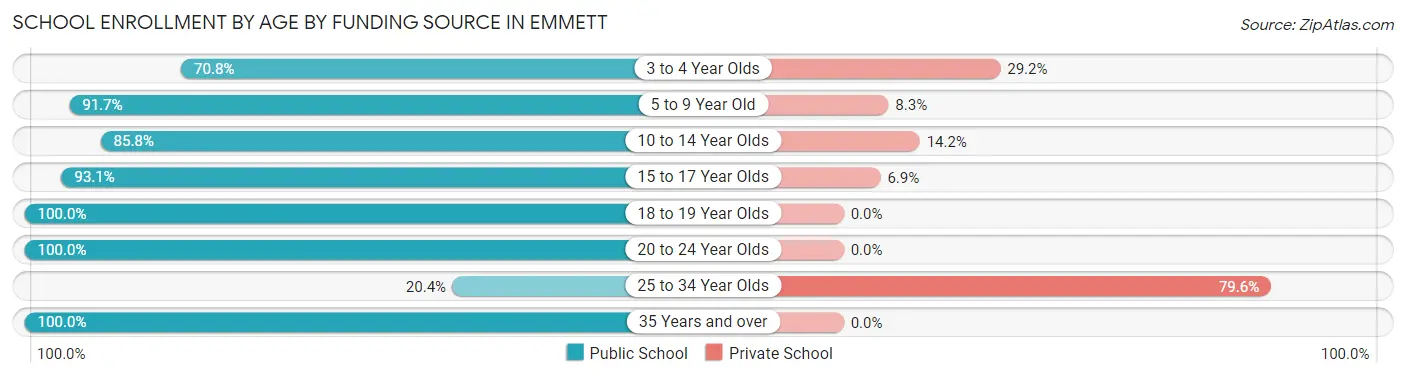
| Age Bracket | Public School | Private School |
| 3 to 4 Year Olds | 34 (70.8%) | 14 (29.2%) |
| 5 to 9 Year Old | 473 (91.7%) | 43 (8.3%) |
| 10 to 14 Year Olds | 479 (85.8%) | 79 (14.2%) |
| 15 to 17 Year Olds | 380 (93.1%) | 28 (6.9%) |
| 18 to 19 Year Olds | 20 (100.0%) | 0 (0.0%) |
| 20 to 24 Year Olds | 74 (100.0%) | 0 (0.0%) |
| 25 to 34 Year Olds | 20 (20.4%) | 78 (79.6%) |
| 35 Years and over | 11 (100.0%) | 0 (0.0%) |
| Total | 1,490 (86.0%) | 243 (14.0%) |
Educational Attainment by Field of Study in Emmett
Education (268 | 25.9%), business (163 | 15.7%), social sciences (138 | 13.3%), arts & humanities (102 | 9.9%), and bio, nature & agricultural (68 | 6.6%) are the most common fields of study among 1,036 individuals in Emmett who have obtained a bachelor's degree or higher.
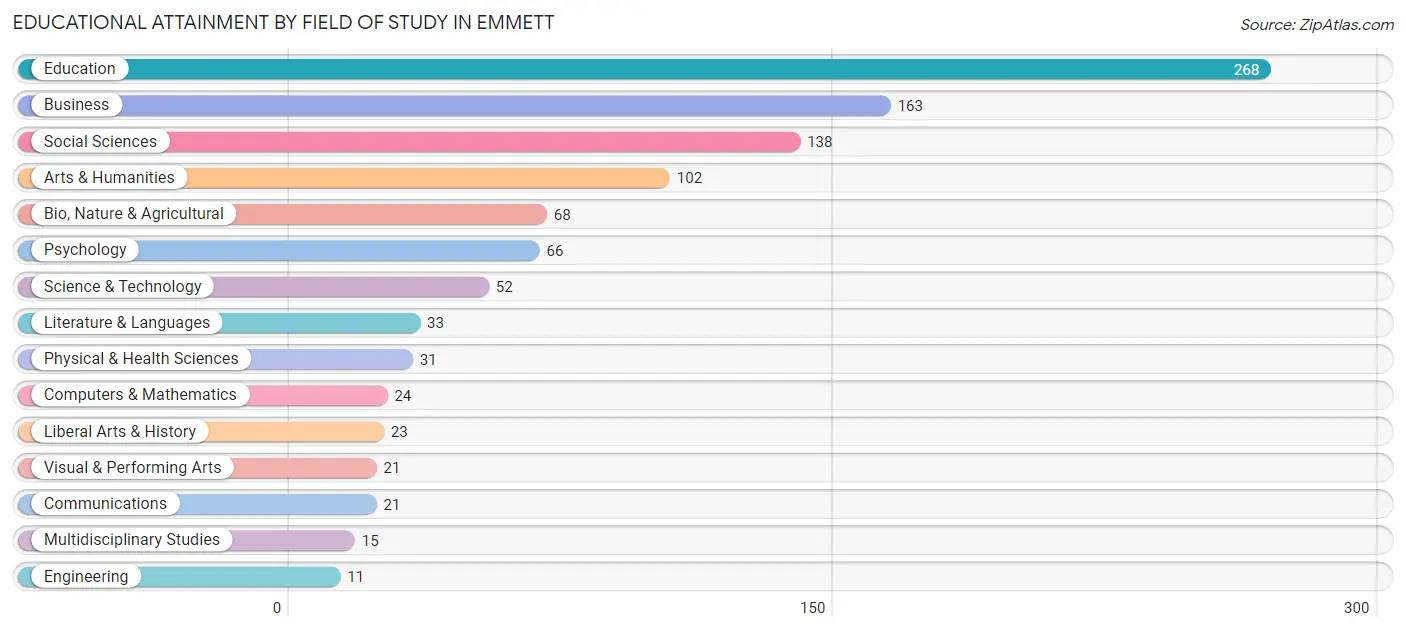
| Field of Study | # Graduates | % Graduates |
| Computers & Mathematics | 24 | 2.3% |
| Bio, Nature & Agricultural | 68 | 6.6% |
| Physical & Health Sciences | 31 | 3.0% |
| Psychology | 66 | 6.4% |
| Social Sciences | 138 | 13.3% |
| Engineering | 11 | 1.1% |
| Multidisciplinary Studies | 15 | 1.5% |
| Science & Technology | 52 | 5.0% |
| Business | 163 | 15.7% |
| Education | 268 | 25.9% |
| Literature & Languages | 33 | 3.2% |
| Liberal Arts & History | 23 | 2.2% |
| Visual & Performing Arts | 21 | 2.0% |
| Communications | 21 | 2.0% |
| Arts & Humanities | 102 | 9.9% |
| Total | 1,036 | 100.0% |
Transportation & Commute in Emmett
Vehicle Availability by Sex in Emmett
The most prevalent vehicle ownership categories in Emmett are males with 2 vehicles (643, accounting for 38.2%) and females with 2 vehicles (577, making up 43.4%).
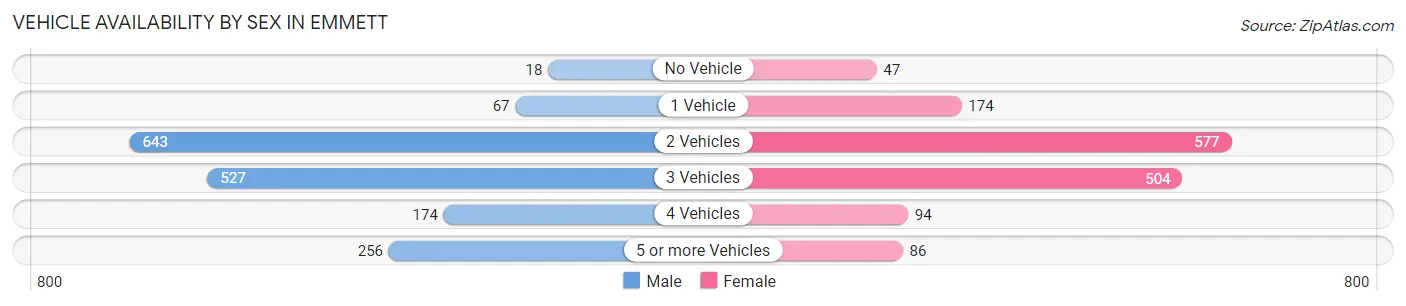
| Vehicles Available | Male | Female |
| No Vehicle | 18 (1.1%) | 47 (3.2%) |
| 1 Vehicle | 67 (4.0%) | 174 (11.7%) |
| 2 Vehicles | 643 (38.2%) | 577 (38.9%) |
| 3 Vehicles | 527 (31.3%) | 504 (34.0%) |
| 4 Vehicles | 174 (10.3%) | 94 (6.3%) |
| 5 or more Vehicles | 256 (15.2%) | 86 (5.8%) |
| Total | 1,685 (100.0%) | 1,482 (100.0%) |
Commute Time in Emmett
The most frequently occuring commute durations in Emmett are 5 to 9 minutes (884 commuters, 29.3%), 45 to 59 minutes (588 commuters, 19.5%), and 60 to 89 minutes (332 commuters, 11.0%).
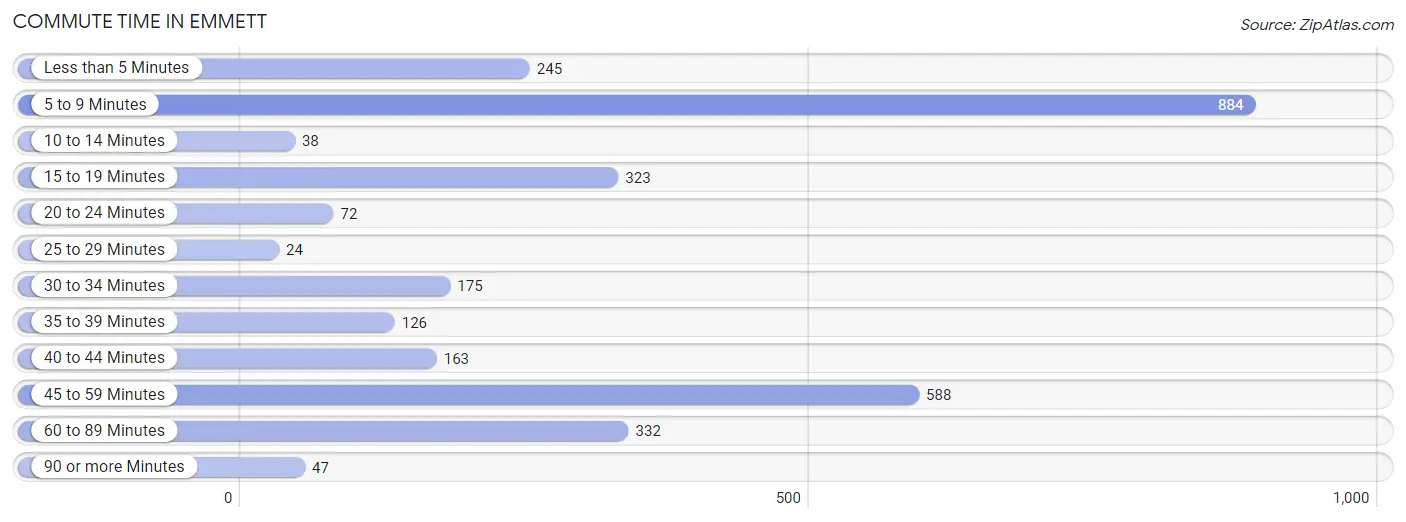
| Commute Time | # Commuters | % Commuters |
| Less than 5 Minutes | 245 | 8.1% |
| 5 to 9 Minutes | 884 | 29.3% |
| 10 to 14 Minutes | 38 | 1.3% |
| 15 to 19 Minutes | 323 | 10.7% |
| 20 to 24 Minutes | 72 | 2.4% |
| 25 to 29 Minutes | 24 | 0.8% |
| 30 to 34 Minutes | 175 | 5.8% |
| 35 to 39 Minutes | 126 | 4.2% |
| 40 to 44 Minutes | 163 | 5.4% |
| 45 to 59 Minutes | 588 | 19.5% |
| 60 to 89 Minutes | 332 | 11.0% |
| 90 or more Minutes | 47 | 1.6% |
Commute Time by Sex in Emmett
The most common commute times in Emmett are 45 to 59 minutes (437 commuters, 27.5%) for males and 5 to 9 minutes (562 commuters, 39.4%) for females.
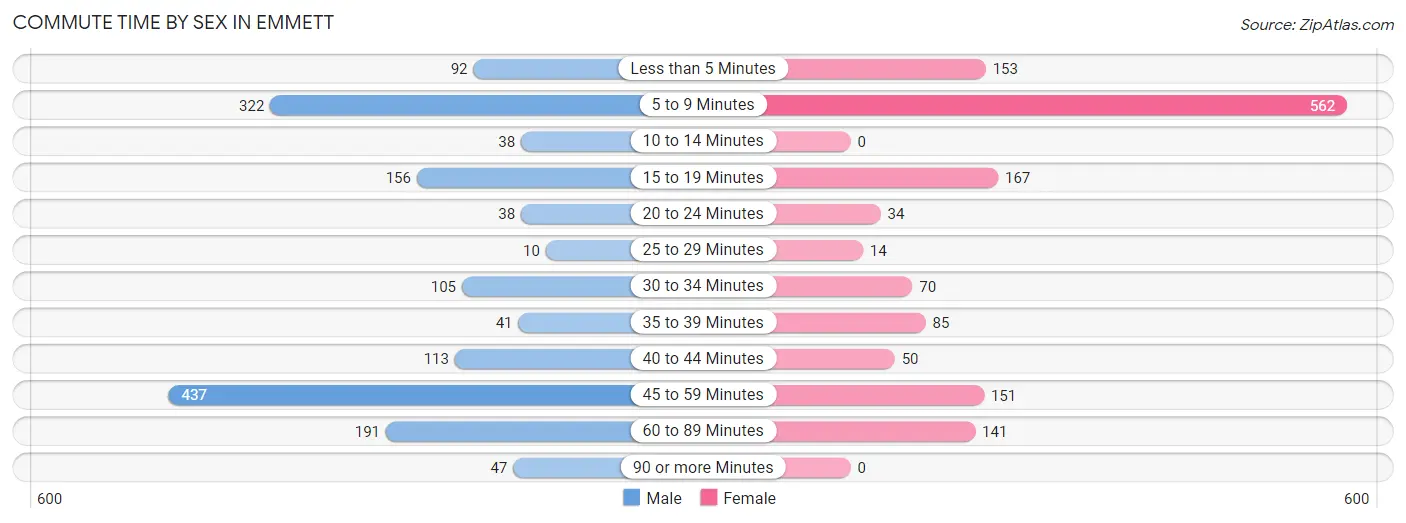
| Commute Time | Male | Female |
| Less than 5 Minutes | 92 (5.8%) | 153 (10.7%) |
| 5 to 9 Minutes | 322 (20.3%) | 562 (39.4%) |
| 10 to 14 Minutes | 38 (2.4%) | 0 (0.0%) |
| 15 to 19 Minutes | 156 (9.8%) | 167 (11.7%) |
| 20 to 24 Minutes | 38 (2.4%) | 34 (2.4%) |
| 25 to 29 Minutes | 10 (0.6%) | 14 (1.0%) |
| 30 to 34 Minutes | 105 (6.6%) | 70 (4.9%) |
| 35 to 39 Minutes | 41 (2.6%) | 85 (6.0%) |
| 40 to 44 Minutes | 113 (7.1%) | 50 (3.5%) |
| 45 to 59 Minutes | 437 (27.5%) | 151 (10.6%) |
| 60 to 89 Minutes | 191 (12.0%) | 141 (9.9%) |
| 90 or more Minutes | 47 (3.0%) | 0 (0.0%) |
Time of Departure to Work by Sex in Emmett
The most frequent times of departure to work in Emmett are 5:30 AM to 5:59 AM (272, 17.1%) for males and 7:00 AM to 7:29 AM (373, 26.1%) for females.
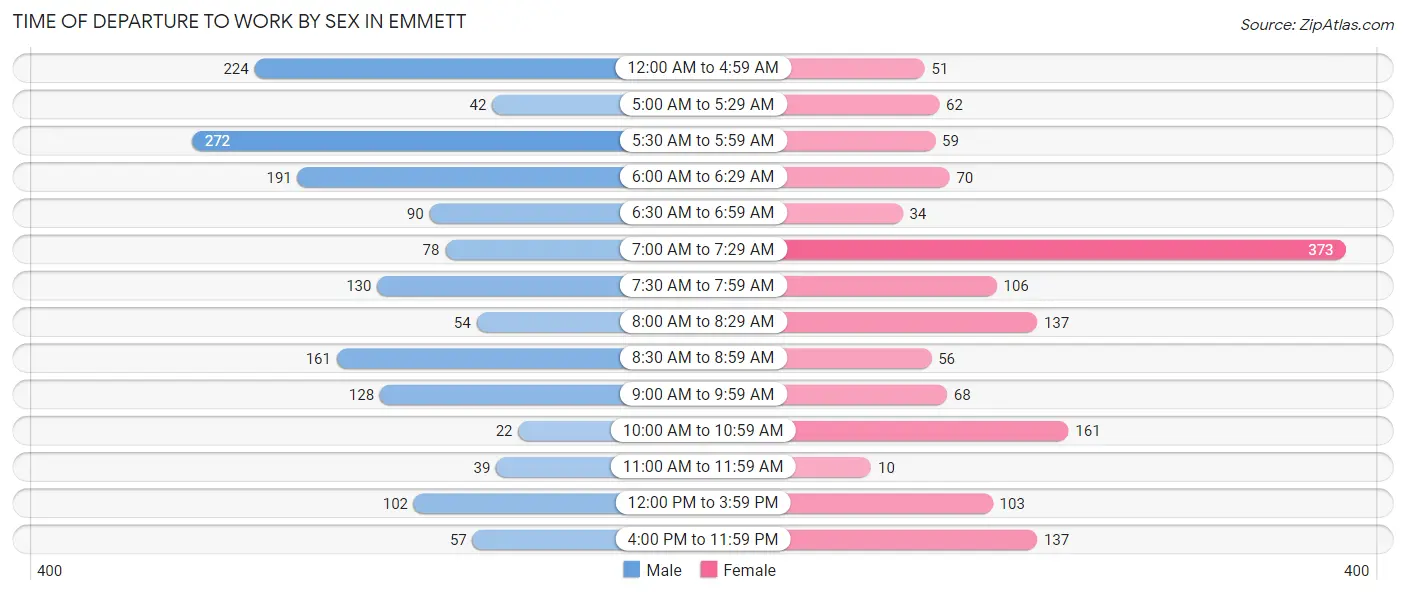
| Time of Departure | Male | Female |
| 12:00 AM to 4:59 AM | 224 (14.1%) | 51 (3.6%) |
| 5:00 AM to 5:29 AM | 42 (2.6%) | 62 (4.3%) |
| 5:30 AM to 5:59 AM | 272 (17.1%) | 59 (4.1%) |
| 6:00 AM to 6:29 AM | 191 (12.0%) | 70 (4.9%) |
| 6:30 AM to 6:59 AM | 90 (5.7%) | 34 (2.4%) |
| 7:00 AM to 7:29 AM | 78 (4.9%) | 373 (26.1%) |
| 7:30 AM to 7:59 AM | 130 (8.2%) | 106 (7.4%) |
| 8:00 AM to 8:29 AM | 54 (3.4%) | 137 (9.6%) |
| 8:30 AM to 8:59 AM | 161 (10.1%) | 56 (3.9%) |
| 9:00 AM to 9:59 AM | 128 (8.1%) | 68 (4.8%) |
| 10:00 AM to 10:59 AM | 22 (1.4%) | 161 (11.3%) |
| 11:00 AM to 11:59 AM | 39 (2.5%) | 10 (0.7%) |
| 12:00 PM to 3:59 PM | 102 (6.4%) | 103 (7.2%) |
| 4:00 PM to 11:59 PM | 57 (3.6%) | 137 (9.6%) |
| Total | 1,590 (100.0%) | 1,427 (100.0%) |
Housing Occupancy in Emmett
Occupancy by Ownership in Emmett
Of the total 2,790 dwellings in Emmett, owner-occupied units account for 1,749 (62.7%), while renter-occupied units make up 1,041 (37.3%).
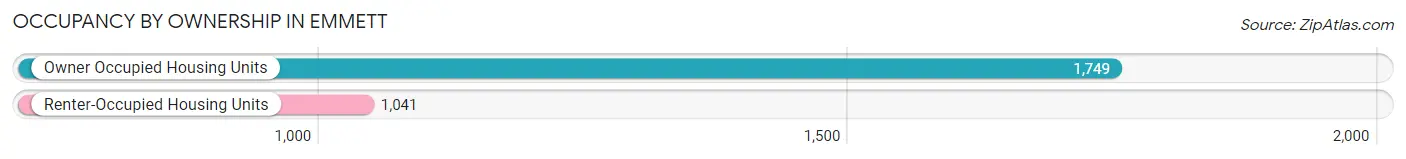
| Occupancy | # Housing Units | % Housing Units |
| Owner Occupied Housing Units | 1,749 | 62.7% |
| Renter-Occupied Housing Units | 1,041 | 37.3% |
| Total Occupied Housing Units | 2,790 | 100.0% |
Occupancy by Household Size in Emmett
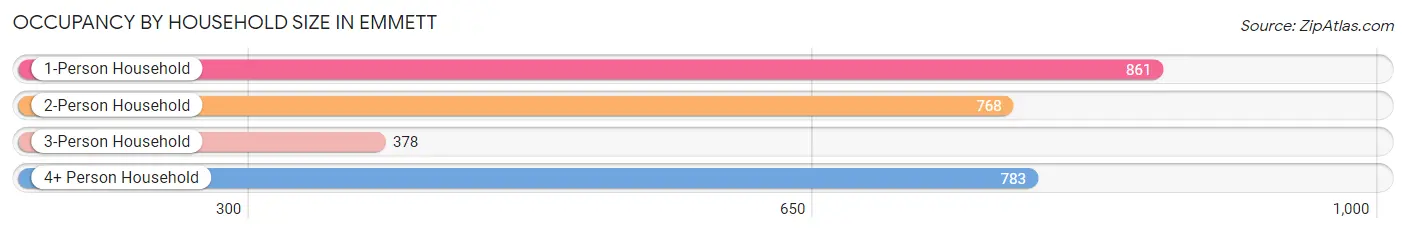
| Household Size | # Housing Units | % Housing Units |
| 1-Person Household | 861 | 30.9% |
| 2-Person Household | 768 | 27.5% |
| 3-Person Household | 378 | 13.6% |
| 4+ Person Household | 783 | 28.1% |
| Total Housing Units | 2,790 | 100.0% |
Occupancy by Ownership by Household Size in Emmett
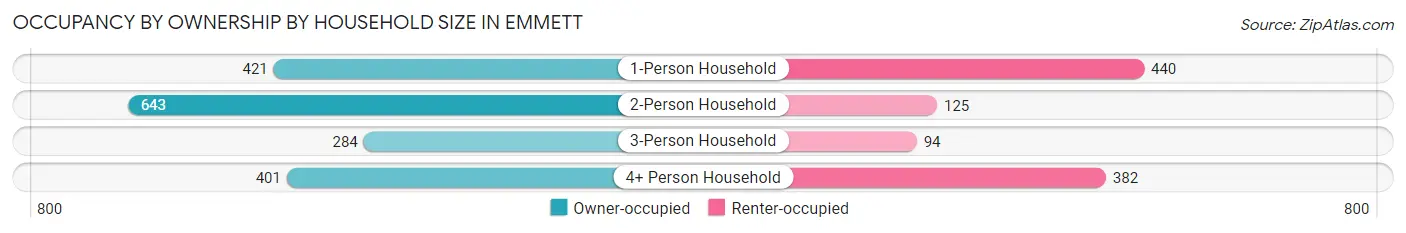
| Household Size | Owner-occupied | Renter-occupied |
| 1-Person Household | 421 (48.9%) | 440 (51.1%) |
| 2-Person Household | 643 (83.7%) | 125 (16.3%) |
| 3-Person Household | 284 (75.1%) | 94 (24.9%) |
| 4+ Person Household | 401 (51.2%) | 382 (48.8%) |
| Total Housing Units | 1,749 (62.7%) | 1,041 (37.3%) |
Occupancy by Educational Attainment in Emmett
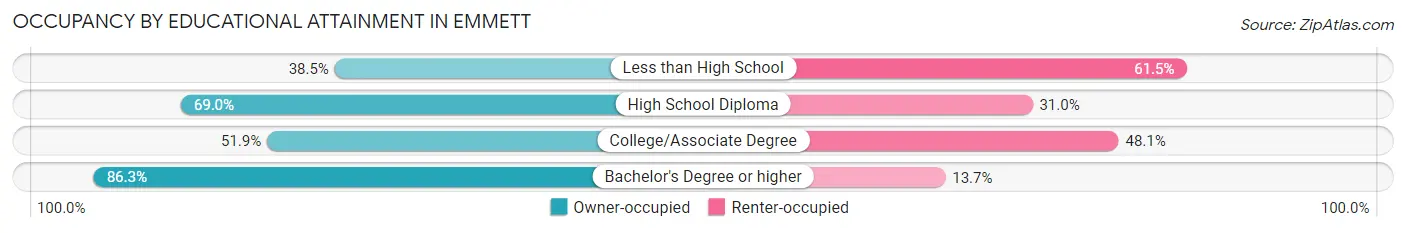
| Household Size | Owner-occupied | Renter-occupied |
| Less than High School | 141 (38.5%) | 225 (61.5%) |
| High School Diploma | 550 (69.0%) | 247 (31.0%) |
| College/Associate Degree | 523 (51.9%) | 484 (48.1%) |
| Bachelor's Degree or higher | 535 (86.3%) | 85 (13.7%) |
Occupancy by Age of Householder in Emmett
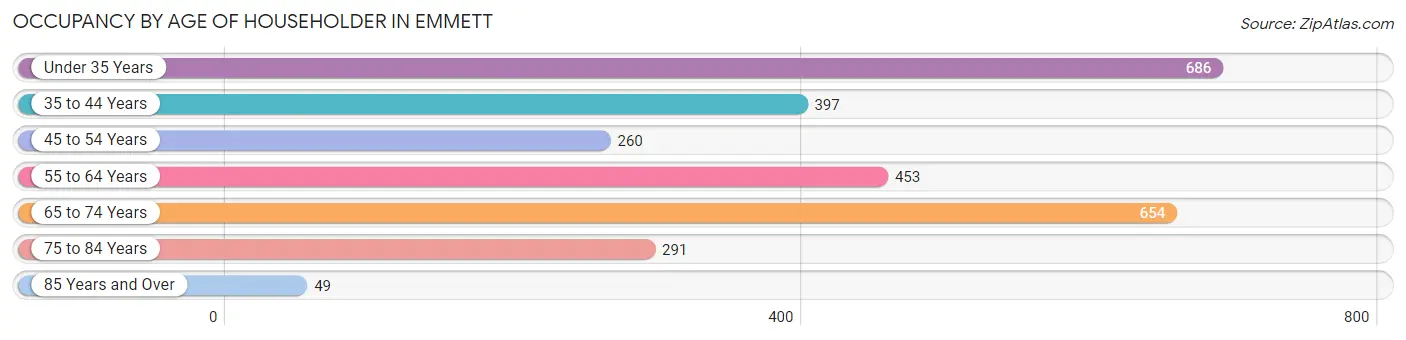
| Age Bracket | # Households | % Households |
| Under 35 Years | 686 | 24.6% |
| 35 to 44 Years | 397 | 14.2% |
| 45 to 54 Years | 260 | 9.3% |
| 55 to 64 Years | 453 | 16.2% |
| 65 to 74 Years | 654 | 23.4% |
| 75 to 84 Years | 291 | 10.4% |
| 85 Years and Over | 49 | 1.8% |
| Total | 2,790 | 100.0% |
Housing Finances in Emmett
Median Income by Occupancy in Emmett
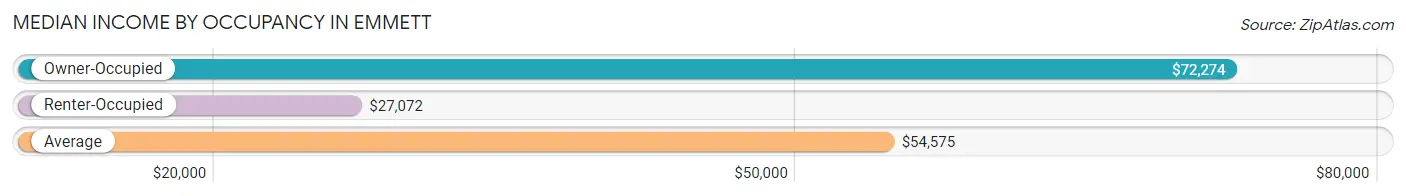
| Occupancy Type | # Households | Median Income |
| Owner-Occupied | 1,749 (62.7%) | $72,274 |
| Renter-Occupied | 1,041 (37.3%) | $27,072 |
| Average | 2,790 (100.0%) | $54,575 |
Occupancy by Householder Income Bracket in Emmett
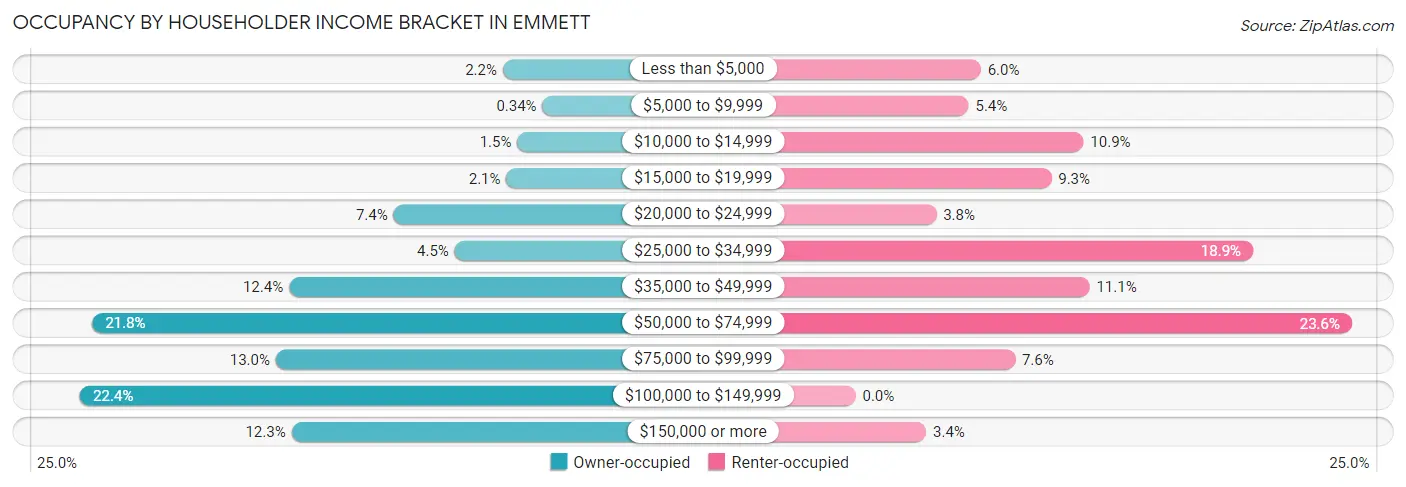
| Income Bracket | Owner-occupied | Renter-occupied |
| Less than $5,000 | 39 (2.2%) | 62 (6.0%) |
| $5,000 to $9,999 | 6 (0.3%) | 56 (5.4%) |
| $10,000 to $14,999 | 27 (1.5%) | 113 (10.8%) |
| $15,000 to $19,999 | 36 (2.1%) | 97 (9.3%) |
| $20,000 to $24,999 | 130 (7.4%) | 40 (3.8%) |
| $25,000 to $34,999 | 79 (4.5%) | 197 (18.9%) |
| $35,000 to $49,999 | 217 (12.4%) | 116 (11.1%) |
| $50,000 to $74,999 | 381 (21.8%) | 246 (23.6%) |
| $75,000 to $99,999 | 228 (13.0%) | 79 (7.6%) |
| $100,000 to $149,999 | 391 (22.4%) | 0 (0.0%) |
| $150,000 or more | 215 (12.3%) | 35 (3.4%) |
| Total | 1,749 (100.0%) | 1,041 (100.0%) |
Monthly Housing Cost Tiers in Emmett
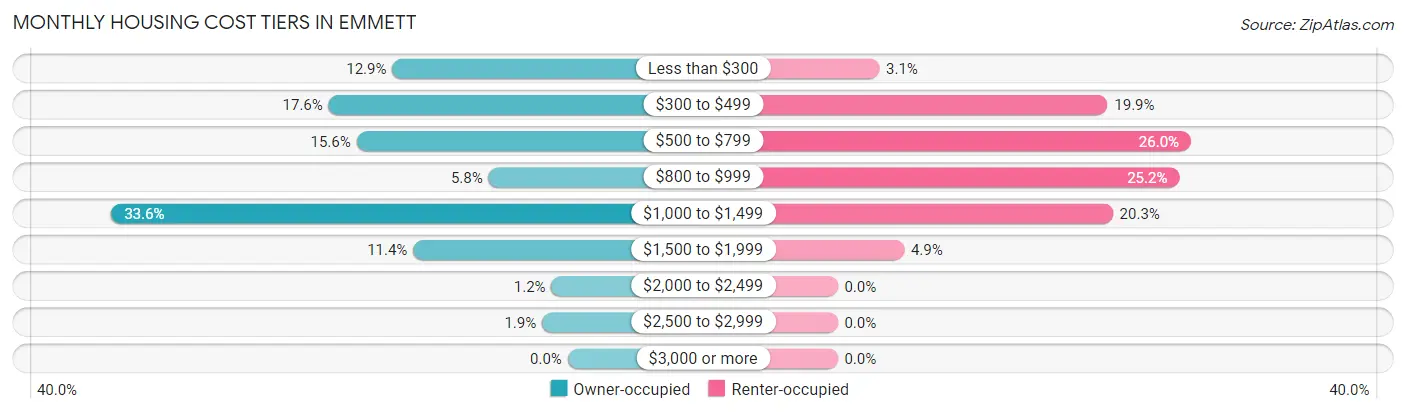
| Monthly Cost | Owner-occupied | Renter-occupied |
| Less than $300 | 226 (12.9%) | 32 (3.1%) |
| $300 to $499 | 308 (17.6%) | 207 (19.9%) |
| $500 to $799 | 272 (15.5%) | 271 (26.0%) |
| $800 to $999 | 102 (5.8%) | 262 (25.2%) |
| $1,000 to $1,499 | 588 (33.6%) | 211 (20.3%) |
| $1,500 to $1,999 | 199 (11.4%) | 51 (4.9%) |
| $2,000 to $2,499 | 21 (1.2%) | 0 (0.0%) |
| $2,500 to $2,999 | 33 (1.9%) | 0 (0.0%) |
| $3,000 or more | 0 (0.0%) | 0 (0.0%) |
| Total | 1,749 (100.0%) | 1,041 (100.0%) |
Physical Housing Characteristics in Emmett
Housing Structures in Emmett
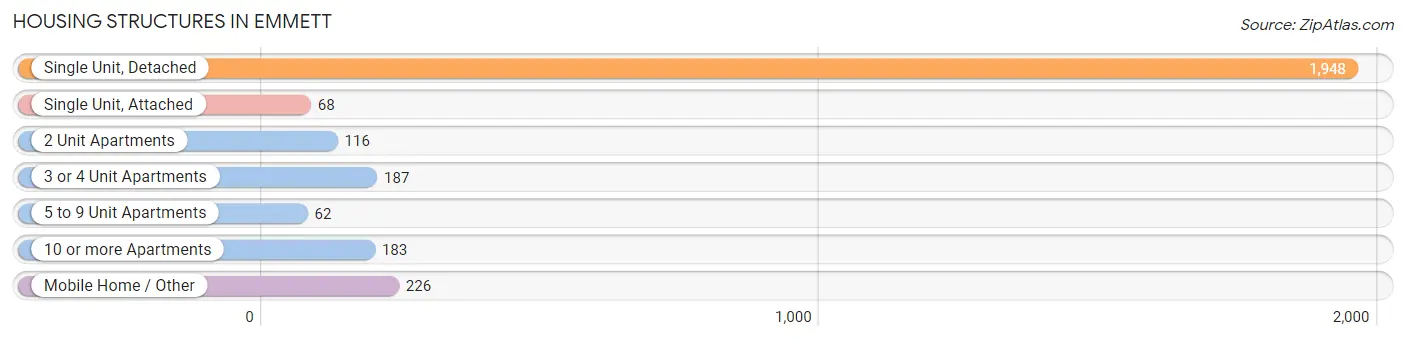
| Structure Type | # Housing Units | % Housing Units |
| Single Unit, Detached | 1,948 | 69.8% |
| Single Unit, Attached | 68 | 2.4% |
| 2 Unit Apartments | 116 | 4.2% |
| 3 or 4 Unit Apartments | 187 | 6.7% |
| 5 to 9 Unit Apartments | 62 | 2.2% |
| 10 or more Apartments | 183 | 6.6% |
| Mobile Home / Other | 226 | 8.1% |
| Total | 2,790 | 100.0% |
Housing Structures by Occupancy in Emmett
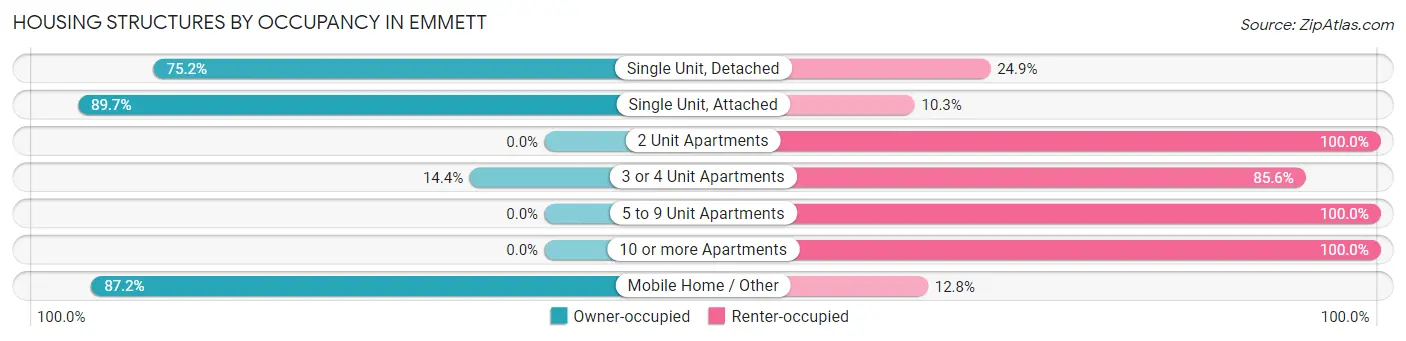
| Structure Type | Owner-occupied | Renter-occupied |
| Single Unit, Detached | 1,464 (75.1%) | 484 (24.8%) |
| Single Unit, Attached | 61 (89.7%) | 7 (10.3%) |
| 2 Unit Apartments | 0 (0.0%) | 116 (100.0%) |
| 3 or 4 Unit Apartments | 27 (14.4%) | 160 (85.6%) |
| 5 to 9 Unit Apartments | 0 (0.0%) | 62 (100.0%) |
| 10 or more Apartments | 0 (0.0%) | 183 (100.0%) |
| Mobile Home / Other | 197 (87.2%) | 29 (12.8%) |
| Total | 1,749 (62.7%) | 1,041 (37.3%) |
Housing Structures by Number of Rooms in Emmett
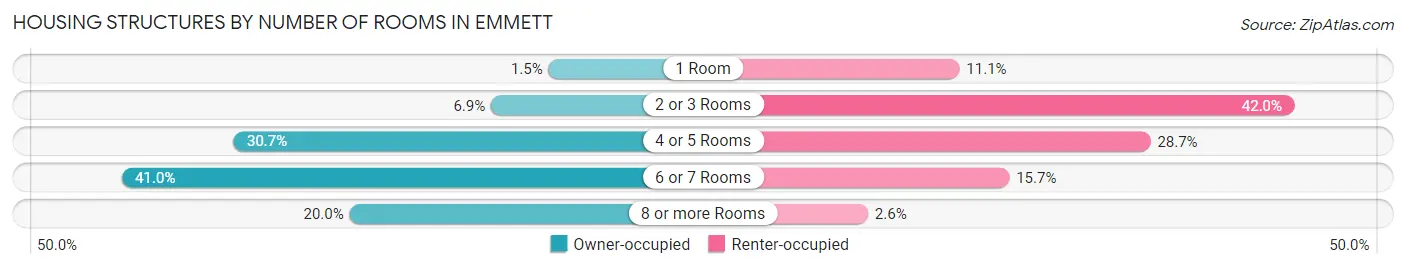
| Number of Rooms | Owner-occupied | Renter-occupied |
| 1 Room | 27 (1.5%) | 115 (11.1%) |
| 2 or 3 Rooms | 120 (6.9%) | 437 (42.0%) |
| 4 or 5 Rooms | 536 (30.6%) | 299 (28.7%) |
| 6 or 7 Rooms | 717 (41.0%) | 163 (15.7%) |
| 8 or more Rooms | 349 (20.0%) | 27 (2.6%) |
| Total | 1,749 (100.0%) | 1,041 (100.0%) |
Housing Structure by Heating Type in Emmett
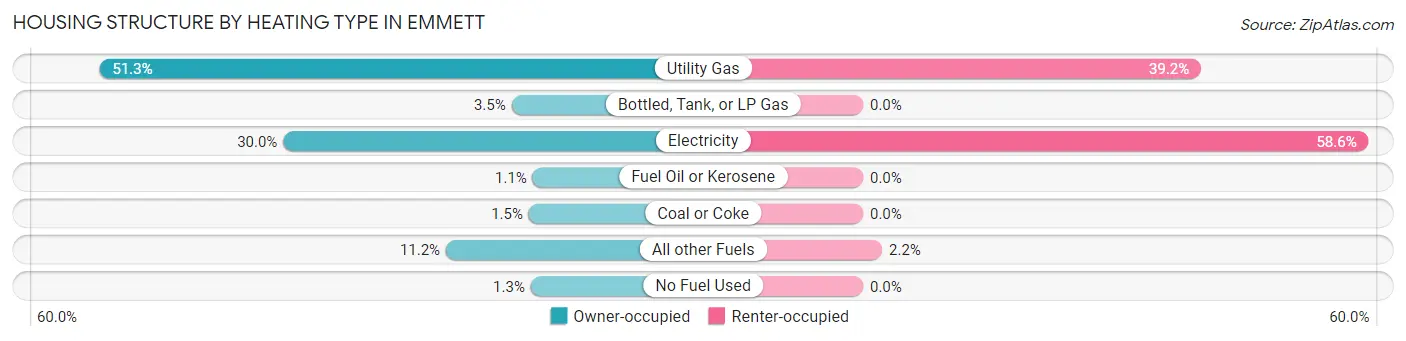
| Heating Type | Owner-occupied | Renter-occupied |
| Utility Gas | 898 (51.3%) | 408 (39.2%) |
| Bottled, Tank, or LP Gas | 62 (3.5%) | 0 (0.0%) |
| Electricity | 525 (30.0%) | 610 (58.6%) |
| Fuel Oil or Kerosene | 19 (1.1%) | 0 (0.0%) |
| Coal or Coke | 27 (1.5%) | 0 (0.0%) |
| All other Fuels | 195 (11.2%) | 23 (2.2%) |
| No Fuel Used | 23 (1.3%) | 0 (0.0%) |
| Total | 1,749 (100.0%) | 1,041 (100.0%) |
Household Vehicle Usage in Emmett
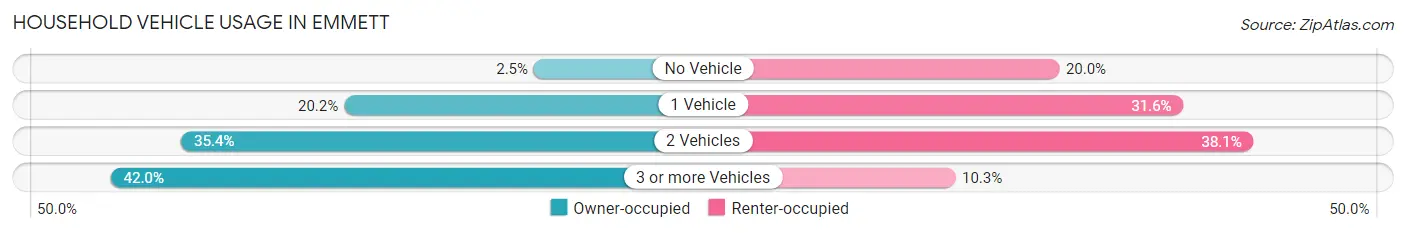
| Vehicles per Household | Owner-occupied | Renter-occupied |
| No Vehicle | 43 (2.5%) | 208 (20.0%) |
| 1 Vehicle | 353 (20.2%) | 329 (31.6%) |
| 2 Vehicles | 619 (35.4%) | 397 (38.1%) |
| 3 or more Vehicles | 734 (42.0%) | 107 (10.3%) |
| Total | 1,749 (100.0%) | 1,041 (100.0%) |
Real Estate & Mortgages in Emmett
Real Estate and Mortgage Overview in Emmett
| Characteristic | Without Mortgage | With Mortgage |
| Housing Units | 652 | 1,097 |
| Median Property Value | $250,000 | $221,500 |
| Median Household Income | $57,651 | $210 |
| Monthly Housing Costs | $340 | $0 |
| Real Estate Taxes | $1,228 | $92 |
Property Value by Mortgage Status in Emmett
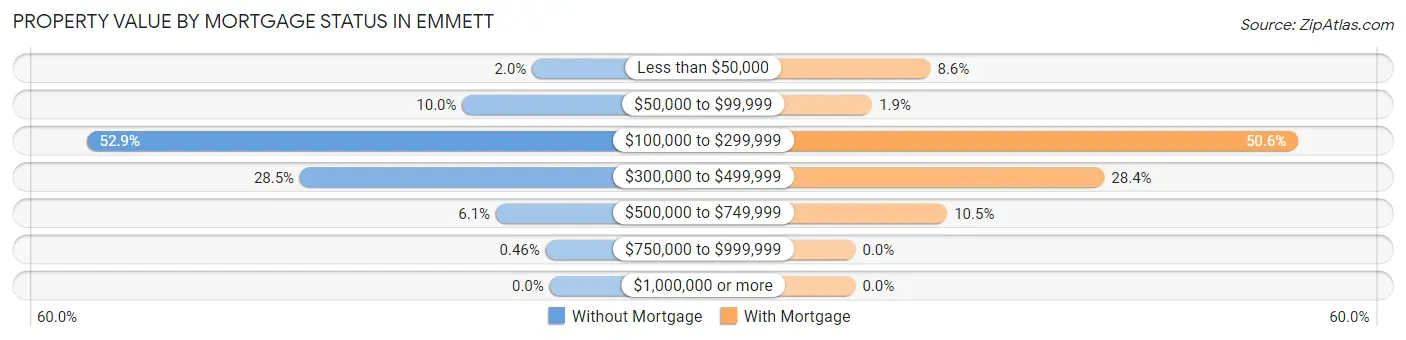
| Property Value | Without Mortgage | With Mortgage |
| Less than $50,000 | 13 (2.0%) | 94 (8.6%) |
| $50,000 to $99,999 | 65 (10.0%) | 21 (1.9%) |
| $100,000 to $299,999 | 345 (52.9%) | 555 (50.6%) |
| $300,000 to $499,999 | 186 (28.5%) | 312 (28.4%) |
| $500,000 to $749,999 | 40 (6.1%) | 115 (10.5%) |
| $750,000 to $999,999 | 3 (0.5%) | 0 (0.0%) |
| $1,000,000 or more | 0 (0.0%) | 0 (0.0%) |
| Total | 652 (100.0%) | 1,097 (100.0%) |
Household Income by Mortgage Status in Emmett
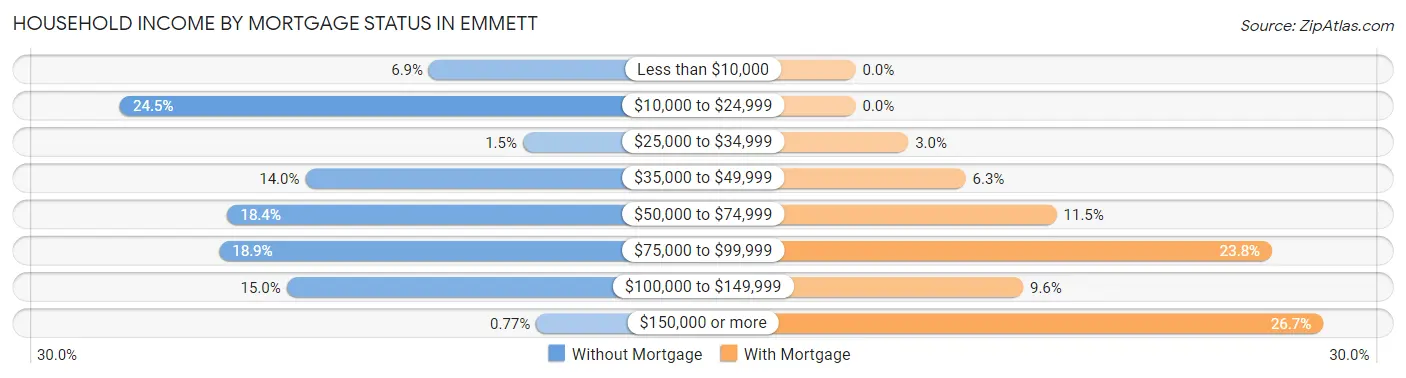
| Household Income | Without Mortgage | With Mortgage |
| Less than $10,000 | 45 (6.9%) | 0 (0.0%) |
| $10,000 to $24,999 | 160 (24.5%) | 0 (0.0%) |
| $25,000 to $34,999 | 10 (1.5%) | 33 (3.0%) |
| $35,000 to $49,999 | 91 (14.0%) | 69 (6.3%) |
| $50,000 to $74,999 | 120 (18.4%) | 126 (11.5%) |
| $75,000 to $99,999 | 123 (18.9%) | 261 (23.8%) |
| $100,000 to $149,999 | 98 (15.0%) | 105 (9.6%) |
| $150,000 or more | 5 (0.8%) | 293 (26.7%) |
| Total | 652 (100.0%) | 1,097 (100.0%) |
Property Value to Household Income Ratio in Emmett
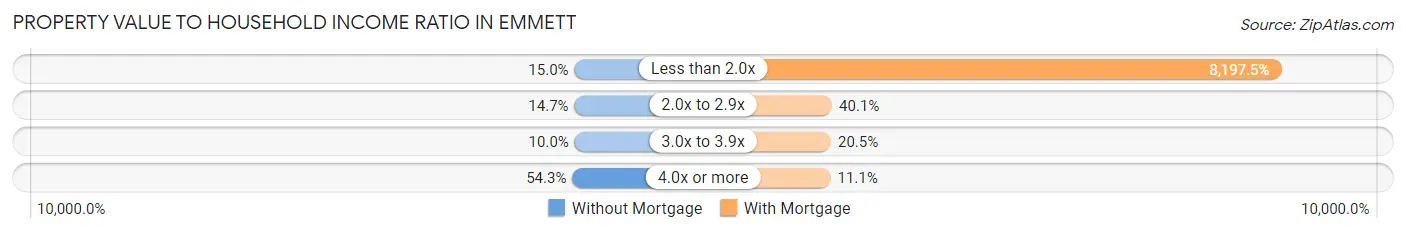
| Value-to-Income Ratio | Without Mortgage | With Mortgage |
| Less than 2.0x | 98 (15.0%) | 89,926 (8,197.5%) |
| 2.0x to 2.9x | 96 (14.7%) | 440 (40.1%) |
| 3.0x to 3.9x | 65 (10.0%) | 225 (20.5%) |
| 4.0x or more | 354 (54.3%) | 122 (11.1%) |
| Total | 652 (100.0%) | 1,097 (100.0%) |
Real Estate Taxes by Mortgage Status in Emmett
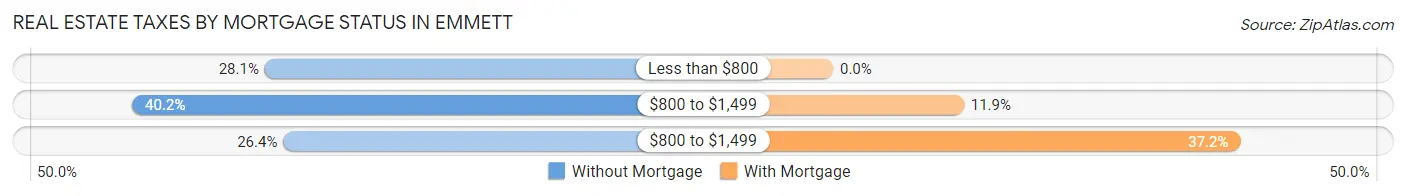
| Property Taxes | Without Mortgage | With Mortgage |
| Less than $800 | 183 (28.1%) | 0 (0.0%) |
| $800 to $1,499 | 262 (40.2%) | 131 (11.9%) |
| $800 to $1,499 | 172 (26.4%) | 408 (37.2%) |
| Total | 652 (100.0%) | 1,097 (100.0%) |
Health & Disability in Emmett
Health Insurance Coverage by Age in Emmett
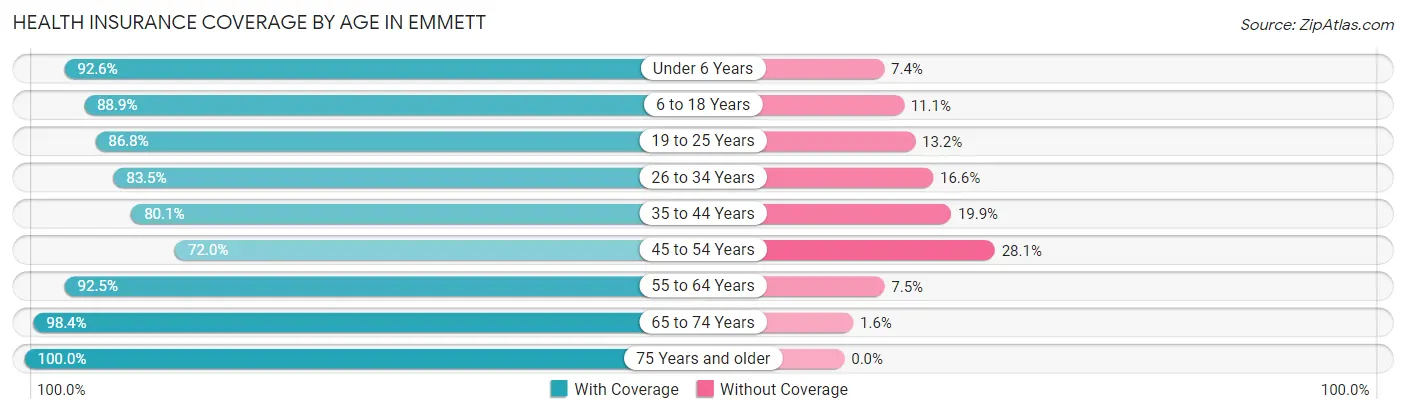
| Age Bracket | With Coverage | Without Coverage |
| Under 6 Years | 624 (92.6%) | 50 (7.4%) |
| 6 to 18 Years | 1,413 (88.9%) | 176 (11.1%) |
| 19 to 25 Years | 329 (86.8%) | 50 (13.2%) |
| 26 to 34 Years | 983 (83.5%) | 195 (16.6%) |
| 35 to 44 Years | 733 (80.1%) | 182 (19.9%) |
| 45 to 54 Years | 413 (72.0%) | 161 (28.1%) |
| 55 to 64 Years | 743 (92.5%) | 60 (7.5%) |
| 65 to 74 Years | 897 (98.4%) | 15 (1.6%) |
| 75 Years and older | 474 (100.0%) | 0 (0.0%) |
| Total | 6,609 (88.1%) | 889 (11.9%) |
Health Insurance Coverage by Citizenship Status in Emmett
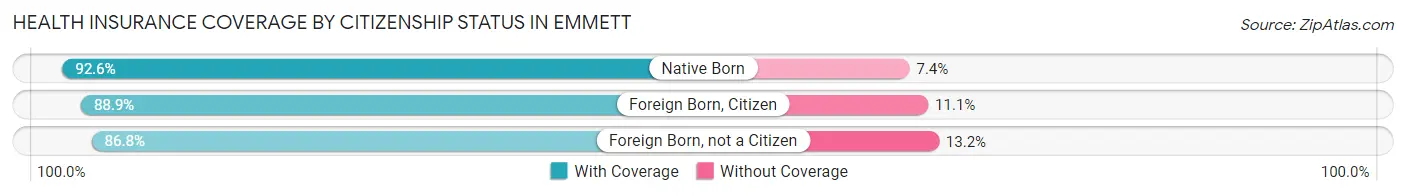
| Citizenship Status | With Coverage | Without Coverage |
| Native Born | 624 (92.6%) | 50 (7.4%) |
| Foreign Born, Citizen | 1,413 (88.9%) | 176 (11.1%) |
| Foreign Born, not a Citizen | 329 (86.8%) | 50 (13.2%) |
Health Insurance Coverage by Household Income in Emmett
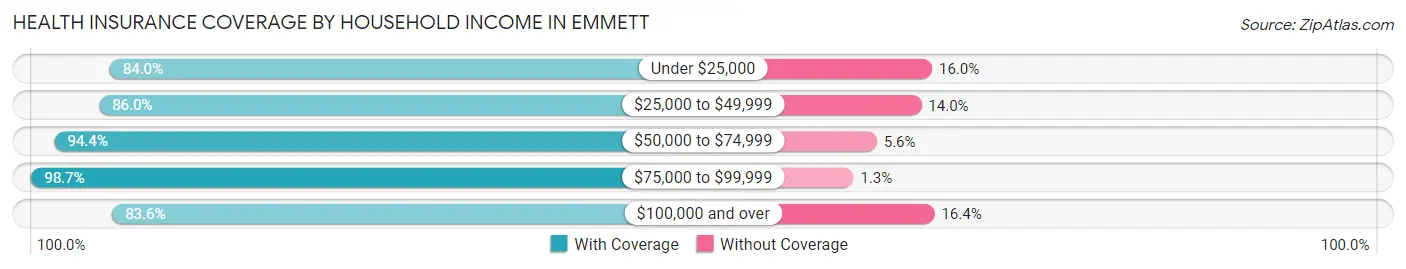
| Household Income | With Coverage | Without Coverage |
| Under $25,000 | 810 (84.0%) | 154 (16.0%) |
| $25,000 to $49,999 | 1,077 (86.0%) | 175 (14.0%) |
| $50,000 to $74,999 | 1,527 (94.4%) | 91 (5.6%) |
| $75,000 to $99,999 | 865 (98.7%) | 11 (1.3%) |
| $100,000 and over | 2,330 (83.6%) | 458 (16.4%) |
Public vs Private Health Insurance Coverage by Age in Emmett
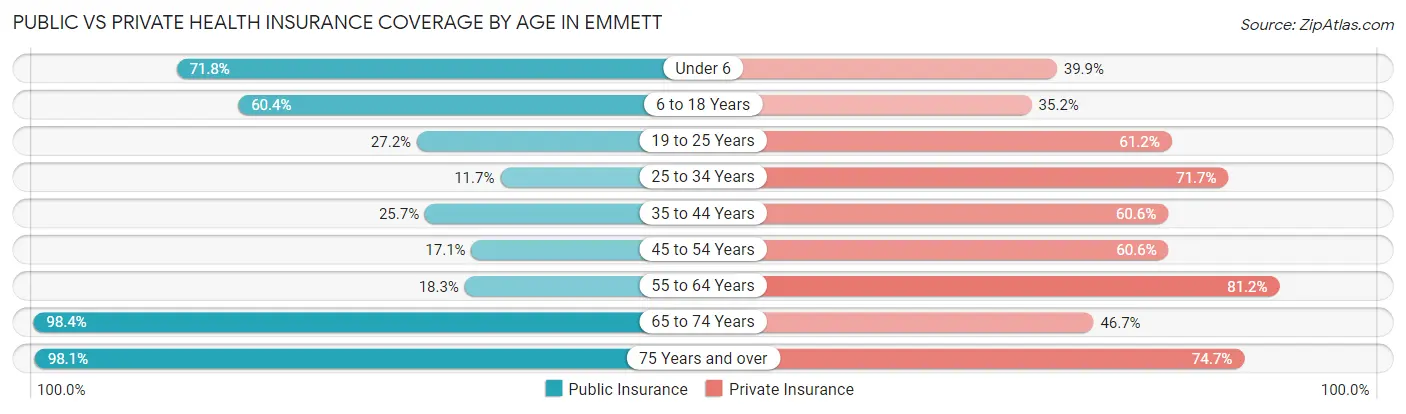
| Age Bracket | Public Insurance | Private Insurance |
| Under 6 | 484 (71.8%) | 269 (39.9%) |
| 6 to 18 Years | 959 (60.4%) | 560 (35.2%) |
| 19 to 25 Years | 103 (27.2%) | 232 (61.2%) |
| 25 to 34 Years | 138 (11.7%) | 845 (71.7%) |
| 35 to 44 Years | 235 (25.7%) | 554 (60.6%) |
| 45 to 54 Years | 98 (17.1%) | 348 (60.6%) |
| 55 to 64 Years | 147 (18.3%) | 652 (81.2%) |
| 65 to 74 Years | 897 (98.4%) | 426 (46.7%) |
| 75 Years and over | 465 (98.1%) | 354 (74.7%) |
| Total | 3,526 (47.0%) | 4,240 (56.6%) |
Disability Status by Sex by Age in Emmett
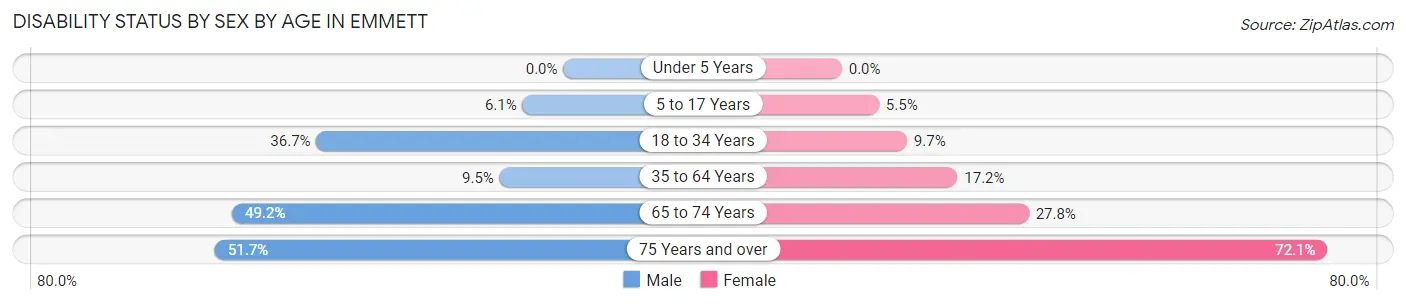
| Age Bracket | Male | Female |
| Under 5 Years | 0 (0.0%) | 0 (0.0%) |
| 5 to 17 Years | 54 (6.0%) | 41 (5.5%) |
| 18 to 34 Years | 337 (36.7%) | 77 (9.7%) |
| 35 to 64 Years | 106 (9.5%) | 201 (17.2%) |
| 65 to 74 Years | 243 (49.2%) | 116 (27.8%) |
| 75 Years and over | 134 (51.7%) | 155 (72.1%) |
Disability Class by Sex by Age in Emmett
Disability Class: Hearing Difficulty
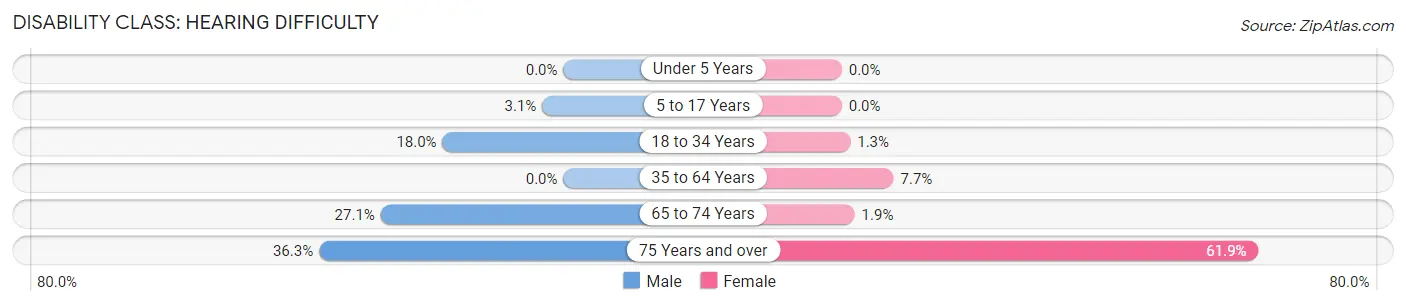
| Age Bracket | Male | Female |
| Under 5 Years | 0 (0.0%) | 0 (0.0%) |
| 5 to 17 Years | 28 (3.1%) | 0 (0.0%) |
| 18 to 34 Years | 165 (17.9%) | 10 (1.3%) |
| 35 to 64 Years | 0 (0.0%) | 90 (7.7%) |
| 65 to 74 Years | 134 (27.1%) | 8 (1.9%) |
| 75 Years and over | 94 (36.3%) | 133 (61.9%) |
Disability Class: Vision Difficulty
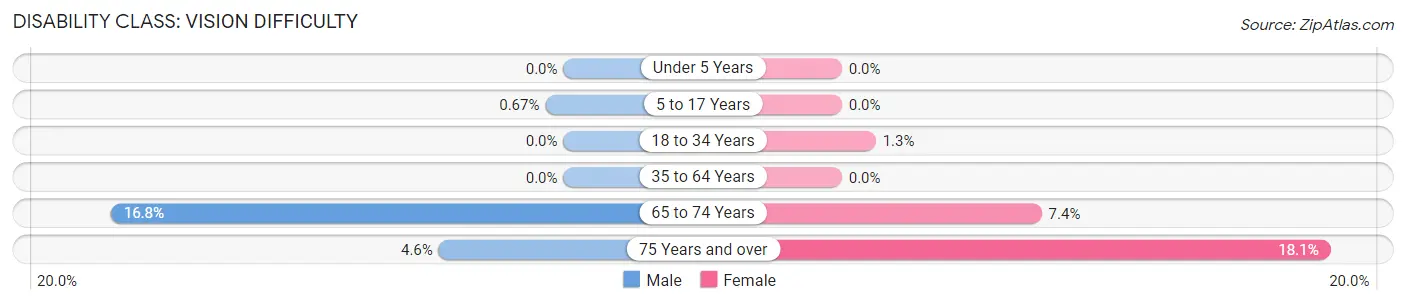
| Age Bracket | Male | Female |
| Under 5 Years | 0 (0.0%) | 0 (0.0%) |
| 5 to 17 Years | 6 (0.7%) | 0 (0.0%) |
| 18 to 34 Years | 0 (0.0%) | 10 (1.3%) |
| 35 to 64 Years | 0 (0.0%) | 0 (0.0%) |
| 65 to 74 Years | 83 (16.8%) | 31 (7.4%) |
| 75 Years and over | 12 (4.6%) | 39 (18.1%) |
Disability Class: Cognitive Difficulty
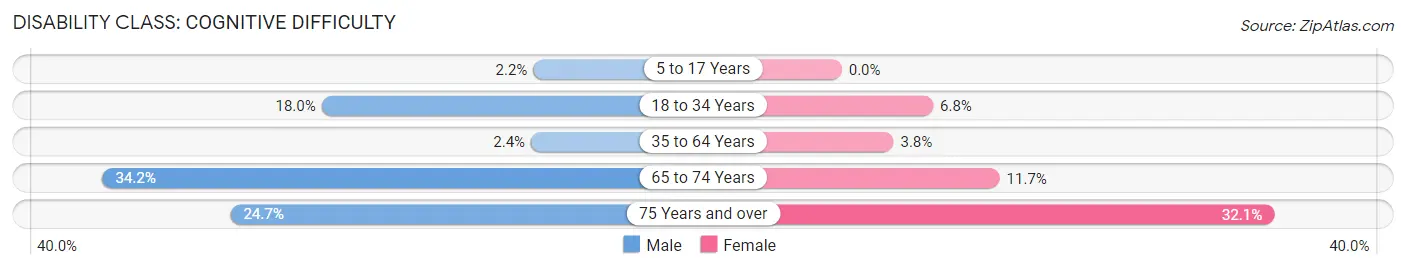
| Age Bracket | Male | Female |
| 5 to 17 Years | 20 (2.2%) | 0 (0.0%) |
| 18 to 34 Years | 165 (17.9%) | 54 (6.8%) |
| 35 to 64 Years | 27 (2.4%) | 45 (3.8%) |
| 65 to 74 Years | 169 (34.2%) | 49 (11.7%) |
| 75 Years and over | 64 (24.7%) | 69 (32.1%) |
Disability Class: Ambulatory Difficulty
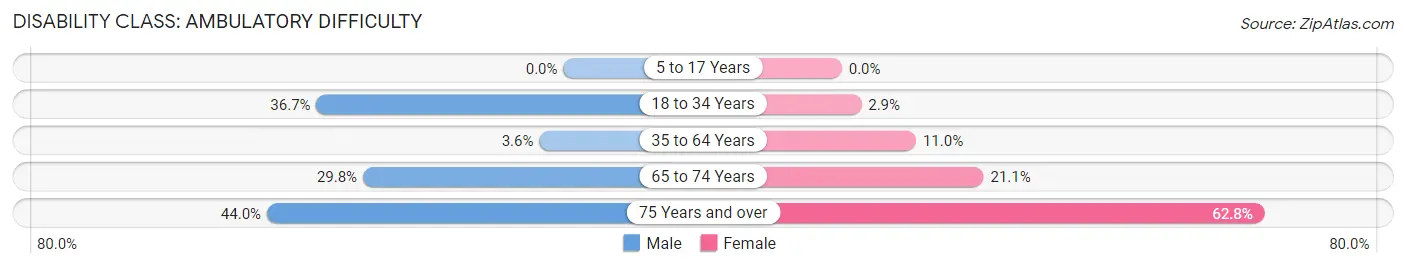
| Age Bracket | Male | Female |
| 5 to 17 Years | 0 (0.0%) | 0 (0.0%) |
| 18 to 34 Years | 337 (36.7%) | 23 (2.9%) |
| 35 to 64 Years | 40 (3.6%) | 129 (11.0%) |
| 65 to 74 Years | 147 (29.8%) | 88 (21.0%) |
| 75 Years and over | 114 (44.0%) | 135 (62.8%) |
Disability Class: Self-Care Difficulty
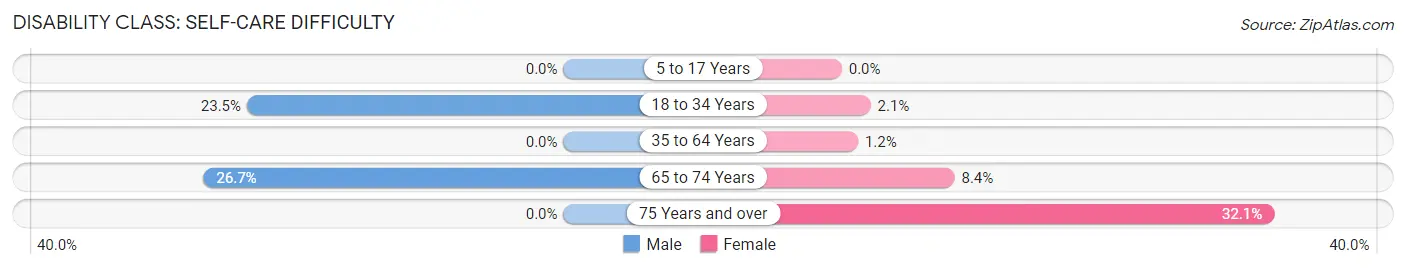
| Age Bracket | Male | Female |
| 5 to 17 Years | 0 (0.0%) | 0 (0.0%) |
| 18 to 34 Years | 216 (23.5%) | 17 (2.1%) |
| 35 to 64 Years | 0 (0.0%) | 14 (1.2%) |
| 65 to 74 Years | 132 (26.7%) | 35 (8.4%) |
| 75 Years and over | 0 (0.0%) | 69 (32.1%) |
Technology Access in Emmett
Computing Device Access in Emmett
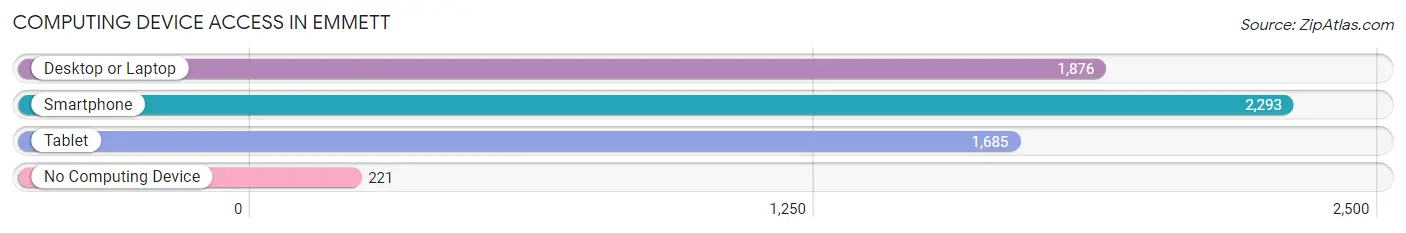
| Device Type | # Households | % Households |
| Desktop or Laptop | 1,876 | 67.2% |
| Smartphone | 2,293 | 82.2% |
| Tablet | 1,685 | 60.4% |
| No Computing Device | 221 | 7.9% |
| Total | 2,790 | 100.0% |
Internet Access in Emmett
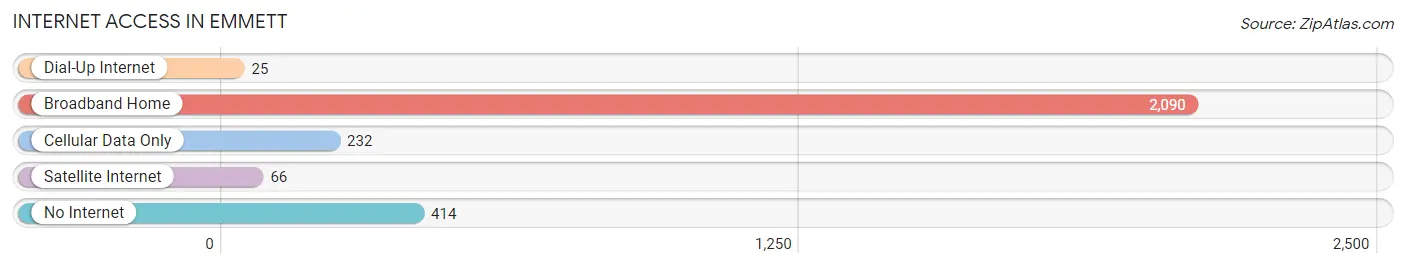
| Internet Type | # Households | % Households |
| Dial-Up Internet | 25 | 0.9% |
| Broadband Home | 2,090 | 74.9% |
| Cellular Data Only | 232 | 8.3% |
| Satellite Internet | 66 | 2.4% |
| No Internet | 414 | 14.8% |
| Total | 2,790 | 100.0% |
Emmett Summary
Emmett, Idaho is a small city located in Gem County, in the southwestern part of the state. It is situated in the Treasure Valley, a region of the state that is known for its agricultural production. The city is located about 25 miles northwest of Boise, the state capital, and is part of the Boise metropolitan area. As of the 2010 census, the population of Emmett was 7,092.
History
The area that is now Emmett was first settled in the late 1860s by ranchers and farmers. The city was officially founded in 1883 and was named after Emmett Cahalan, a local rancher. The city was incorporated in 1902.
In the early 1900s, Emmett was a thriving agricultural center, with many farmers growing potatoes, wheat, and other crops. The city was also home to several sawmills and lumber mills. In the 1920s, the city began to experience a population boom, as many people moved to the area to take advantage of the agricultural opportunities.
In the 1950s, the city began to experience a decline in population, as many people moved away to larger cities. However, in the late 1970s, the city began to experience a resurgence, as many people moved back to the area to take advantage of the agricultural opportunities.
Geography
Emmett is located in Gem County, in the southwestern part of the state. It is situated in the Treasure Valley, a region of the state that is known for its agricultural production. The city is located about 25 miles northwest of Boise, the state capital, and is part of the Boise metropolitan area.
The city is situated at an elevation of 2,717 feet above sea level. The city covers an area of 4.2 square miles, all of which is land. The city is located in a semi-arid climate zone, with hot summers and cold winters.
Economy
Emmett’s economy is largely based on agriculture. The city is home to several large farms, which produce potatoes, wheat, and other crops. The city is also home to several food processing plants, which process the crops grown in the area.
In addition to agriculture, the city is also home to several manufacturing companies, which produce a variety of products, including furniture, clothing, and electronics. The city is also home to several retail stores, which sell a variety of goods.
Demographics
As of the 2010 census, the population of Emmett was 7,092. The population is fairly evenly split between males and females, with 50.3% of the population being male and 49.7% being female. The median age of the population is 36.7 years.
The racial makeup of the city is predominantly white, with 87.3% of the population being white. The remaining 12.7% of the population is made up of other races, including Hispanic or Latino (4.3%), Asian (2.2%), African American (1.2%), and Native American (0.7%).
The median household income in Emmett is $41,945, and the median family income is $50,945. The per capita income in the city is $20,945. The unemployment rate in the city is 4.2%.
Common Questions
What is Per Capita Income in Emmett?
Per Capita income in Emmett is $32,055.
What is the Median Family Income in Emmett?
Median Family Income in Emmett is $64,038.
What is the Median Household income in Emmett?
Median Household Income in Emmett is $54,575.
What is Income or Wage Gap in Emmett?
Income or Wage Gap in Emmett is 29.7%.
Women in Emmett earn 70.3 cents for every dollar earned by a man.
What is Family Income Deficit in Emmett?
Family Income Deficit in Emmett is $8,041.
Families that are below poverty line in Emmett earn $8,041 less on average than the poverty threshold level.
What is Inequality or Gini Index in Emmett?
Inequality or Gini Index in Emmett is 0.50.
What is the Total Population of Emmett?
Total Population of Emmett is 7,694.
What is the Total Male Population of Emmett?
Total Male Population of Emmett is 3,979.
What is the Total Female Population of Emmett?
Total Female Population of Emmett is 3,715.
What is the Ratio of Males per 100 Females in Emmett?
There are 107.11 Males per 100 Females in Emmett.
What is the Ratio of Females per 100 Males in Emmett?
There are 93.37 Females per 100 Males in Emmett.
What is the Median Population Age in Emmett?
Median Population Age in Emmett is 35.0 Years.
What is the Average Family Size in Emmett
Average Family Size in Emmett is 3.1 People.
What is the Average Household Size in Emmett
Average Household Size in Emmett is 2.7 People.
How Large is the Labor Force in Emmett?
There are 3,360 People in the Labor Forcein in Emmett.
What is the Percentage of People in the Labor Force in Emmett?
57.2% of People are in the Labor Force in Emmett.
What is the Unemployment Rate in Emmett?
Unemployment Rate in Emmett is 0.3%.