Owyhee County, ID Map & Demographics
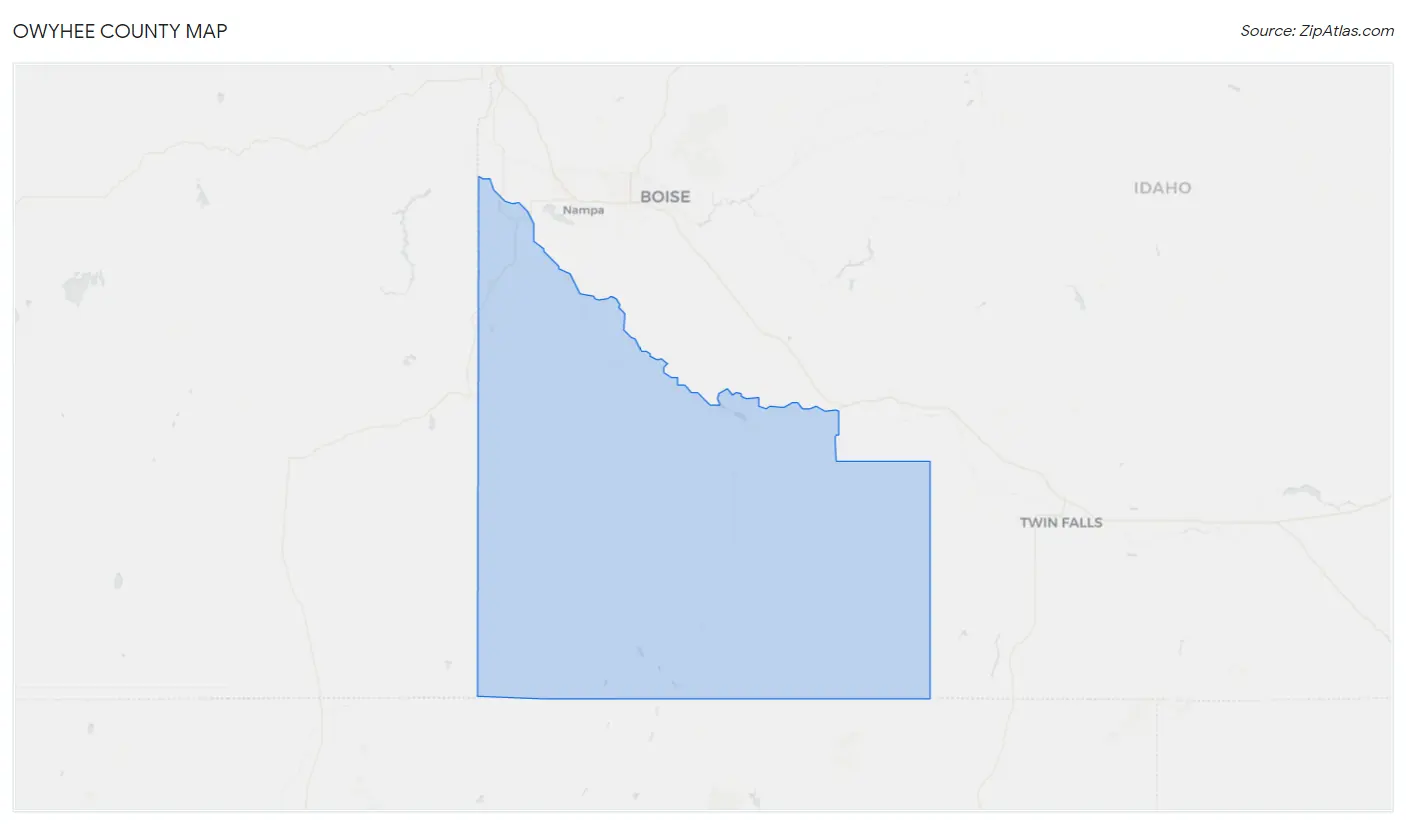
Owyhee County Map
Owyhee County Overview
$25,106
PER CAPITA INCOME
$69,387
AVG FAMILY INCOME
$58,440
AVG HOUSEHOLD INCOME
53.4%
WAGE / INCOME GAP [ % ]
46.6¢/ $1
WAGE / INCOME GAP [ $ ]
$14,639
FAMILY INCOME DEFICIT
0.39
INEQUALITY / GINI INDEX
12,043
TOTAL POPULATION
6,238
MALE POPULATION
5,805
FEMALE POPULATION
107.46
MALES / 100 FEMALES
93.06
FEMALES / 100 MALES
38.9
MEDIAN AGE
3.4
AVG FAMILY SIZE
2.8
AVG HOUSEHOLD SIZE
5,474
LABOR FORCE [ PEOPLE ]
58.4%
PERCENT IN LABOR FORCE
2.2%
UNEMPLOYMENT RATE
Owyhee County Area Codes
Income in Owyhee County
Income Overview in Owyhee County
Per Capita Income in Owyhee County is $25,106, while median incomes of families and households are $69,387 and $58,440 respectively.
| Characteristic | Number | Measure |
| Per Capita Income | 12,043 | $25,106 |
| Median Family Income | 3,053 | $69,387 |
| Mean Family Income | 3,053 | $77,744 |
| Median Household Income | 4,227 | $58,440 |
| Mean Household Income | 4,227 | $69,334 |
| Income Deficit | 3,053 | $14,639 |
| Wage / Income Gap (%) | 12,043 | 53.45% |
| Wage / Income Gap ($) | 12,043 | 46.55¢ per $1 |
| Gini / Inequality Index | 12,043 | 0.39 |
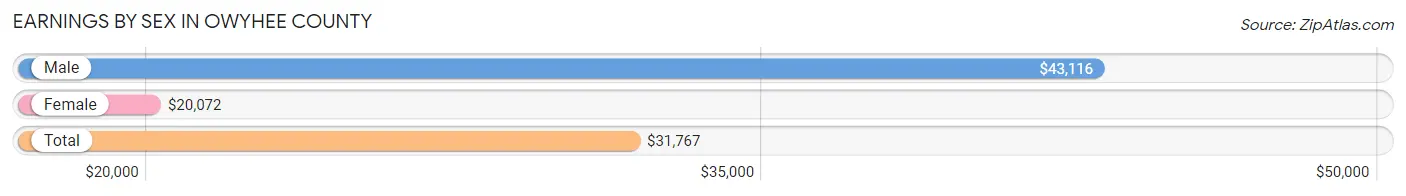
Earnings by Sex in Owyhee County
Average Earnings in Owyhee County are $31,767, $43,116 for men and $20,072 for women, a difference of 53.4%.
| Sex | Number | Average Earnings |
| Male | 3,397 (57.8%) | $43,116 |
| Female | 2,476 (42.2%) | $20,072 |
| Total | 5,873 (100.0%) | $31,767 |
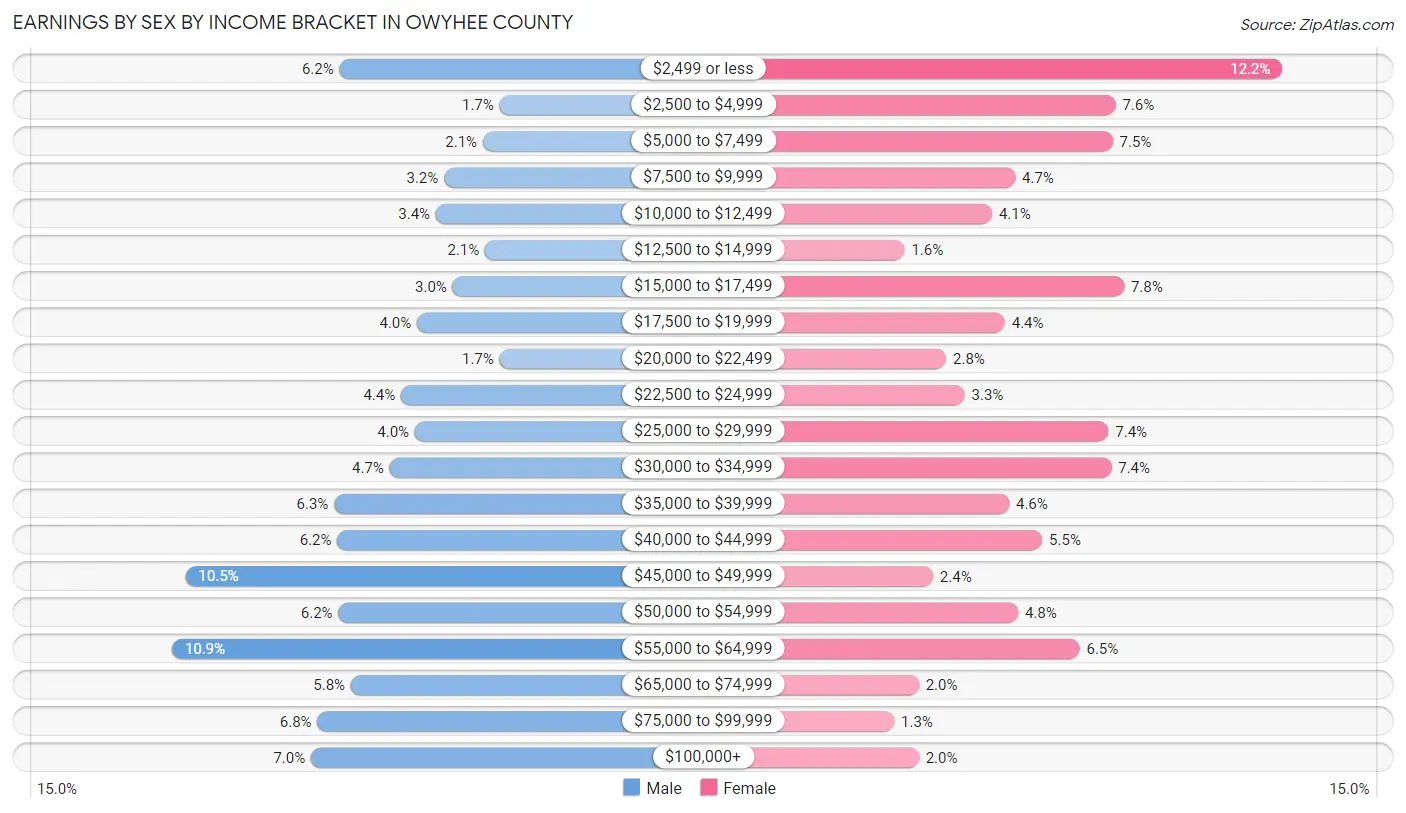
Earnings by Sex by Income Bracket in Owyhee County
The most common earnings brackets in Owyhee County are $55,000 to $64,999 for men (369 | 10.9%) and $2,499 or less for women (303 | 12.2%).
| Income | Male | Female |
| $2,499 or less | 209 (6.1%) | 303 (12.2%) |
| $2,500 to $4,999 | 56 (1.7%) | 187 (7.5%) |
| $5,000 to $7,499 | 72 (2.1%) | 185 (7.5%) |
| $7,500 to $9,999 | 109 (3.2%) | 117 (4.7%) |
| $10,000 to $12,499 | 117 (3.4%) | 101 (4.1%) |
| $12,500 to $14,999 | 70 (2.1%) | 40 (1.6%) |
| $15,000 to $17,499 | 101 (3.0%) | 193 (7.8%) |
| $17,500 to $19,999 | 135 (4.0%) | 110 (4.4%) |
| $20,000 to $22,499 | 56 (1.7%) | 69 (2.8%) |
| $22,500 to $24,999 | 150 (4.4%) | 82 (3.3%) |
| $25,000 to $29,999 | 137 (4.0%) | 182 (7.3%) |
| $30,000 to $34,999 | 161 (4.7%) | 184 (7.4%) |
| $35,000 to $39,999 | 214 (6.3%) | 113 (4.6%) |
| $40,000 to $44,999 | 211 (6.2%) | 136 (5.5%) |
| $45,000 to $49,999 | 356 (10.5%) | 60 (2.4%) |
| $50,000 to $54,999 | 210 (6.2%) | 119 (4.8%) |
| $55,000 to $64,999 | 369 (10.9%) | 162 (6.5%) |
| $65,000 to $74,999 | 198 (5.8%) | 50 (2.0%) |
| $75,000 to $99,999 | 230 (6.8%) | 33 (1.3%) |
| $100,000+ | 236 (7.0%) | 50 (2.0%) |
| Total | 3,397 (100.0%) | 2,476 (100.0%) |
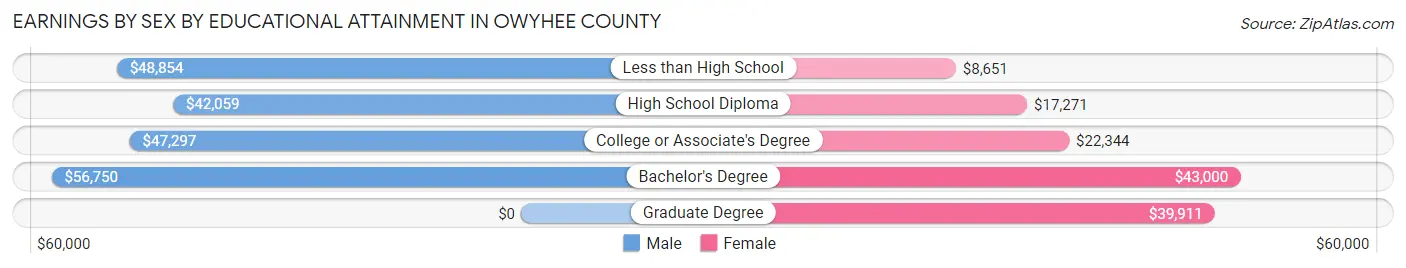
Earnings by Sex by Educational Attainment in Owyhee County
Average earnings in Owyhee County are $46,773 for men and $22,246 for women, a difference of 52.4%. Men with an educational attainment of bachelor's degree enjoy the highest average annual earnings of $56,750, while those with high school diploma education earn the least with $42,059. Women with an educational attainment of bachelor's degree earn the most with the average annual earnings of $43,000, while those with less than high school education have the smallest earnings of $8,651.
| Educational Attainment | Male Income | Female Income |
| Less than High School | $48,854 | $8,651 |
| High School Diploma | $42,059 | $17,271 |
| College or Associate's Degree | $47,297 | $22,344 |
| Bachelor's Degree | $56,750 | $43,000 |
| Graduate Degree | - | - |
| Total | $46,773 | $22,246 |
Family Income in Owyhee County
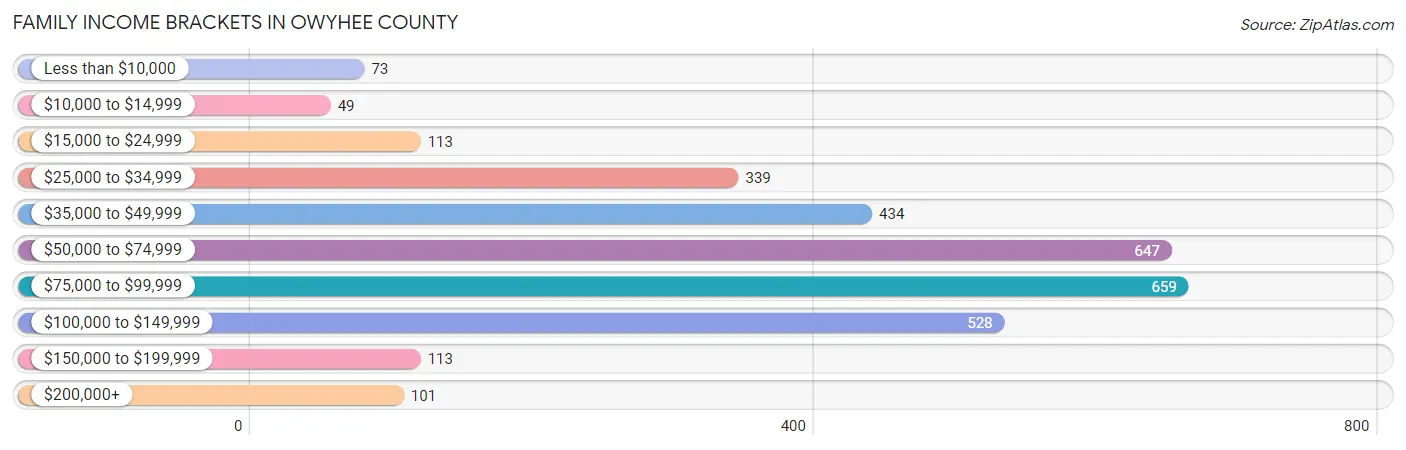
Family Income Brackets in Owyhee County
According to the Owyhee County family income data, there are 659 families falling into the $75,000 to $99,999 income range, which is the most common income bracket and makes up 21.6% of all families. Conversely, the $10,000 to $14,999 income bracket is the least frequent group with only 49 families (1.6%) belonging to this category.
| Income Bracket | # Families | % Families |
| Less than $10,000 | 73 | 2.4% |
| $10,000 to $14,999 | 49 | 1.6% |
| $15,000 to $24,999 | 113 | 3.7% |
| $25,000 to $34,999 | 339 | 11.1% |
| $35,000 to $49,999 | 434 | 14.2% |
| $50,000 to $74,999 | 647 | 21.2% |
| $75,000 to $99,999 | 659 | 21.6% |
| $100,000 to $149,999 | 528 | 17.3% |
| $150,000 to $199,999 | 113 | 3.7% |
| $200,000+ | 101 | 3.3% |
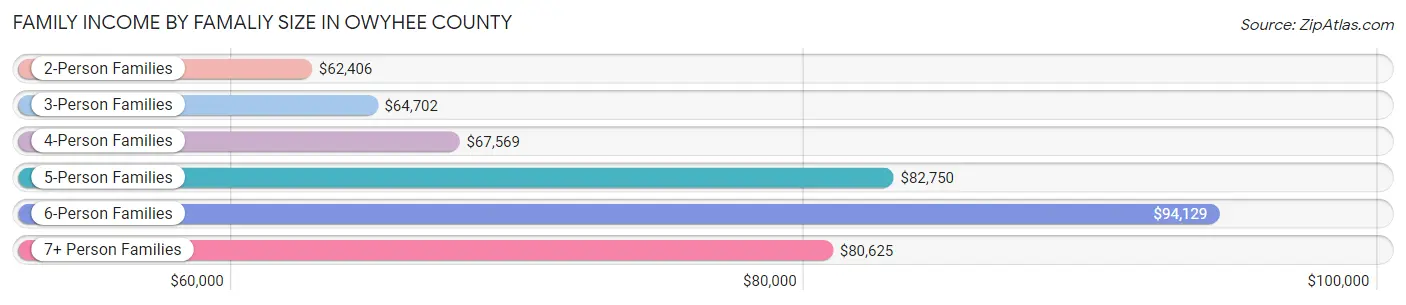
Family Income by Famaliy Size in Owyhee County
6-person families (113 | 3.7%) account for the highest median family income in Owyhee County with $94,129 per family, while 2-person families (1,241 | 40.6%) have the highest median income of $31,203 per family member.
| Income Bracket | # Families | Median Income |
| 2-Person Families | 1,241 (40.6%) | $62,406 |
| 3-Person Families | 663 (21.7%) | $64,702 |
| 4-Person Families | 481 (15.8%) | $67,569 |
| 5-Person Families | 419 (13.7%) | $82,750 |
| 6-Person Families | 113 (3.7%) | $94,129 |
| 7+ Person Families | 136 (4.4%) | $80,625 |
| Total | 3,053 (100.0%) | $69,387 |
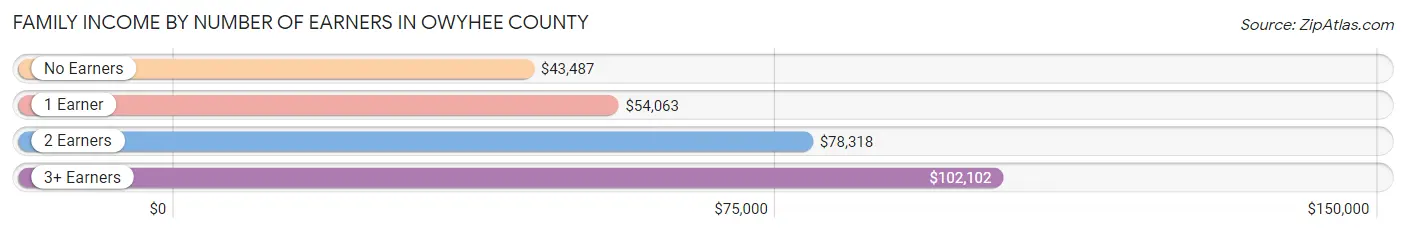
Family Income by Number of Earners in Owyhee County
The median family income in Owyhee County is $69,387, with families comprising 3+ earners (487) having the highest median family income of $102,102, while families with no earners (477) have the lowest median family income of $43,487, accounting for 16.0% and 15.6% of families, respectively.
| Number of Earners | # Families | Median Income |
| No Earners | 477 (15.6%) | $43,487 |
| 1 Earner | 1,075 (35.2%) | $54,063 |
| 2 Earners | 1,014 (33.2%) | $78,318 |
| 3+ Earners | 487 (16.0%) | $102,102 |
| Total | 3,053 (100.0%) | $69,387 |
Household Income in Owyhee County
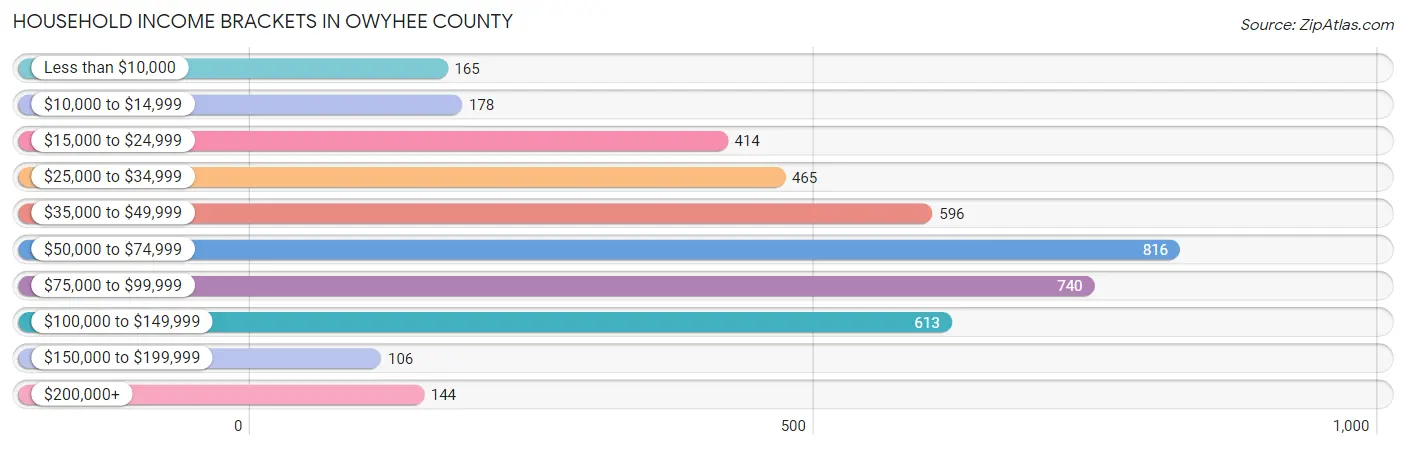
Household Income Brackets in Owyhee County
With 816 households falling in the category, the $50,000 to $74,999 income range is the most frequent in Owyhee County, accounting for 19.3% of all households. In contrast, only 106 households (2.5%) fall into the $150,000 to $199,999 income bracket, making it the least populous group.
| Income Bracket | # Households | % Households |
| Less than $10,000 | 165 | 3.9% |
| $10,000 to $14,999 | 178 | 4.2% |
| $15,000 to $24,999 | 414 | 9.8% |
| $25,000 to $34,999 | 465 | 11.0% |
| $35,000 to $49,999 | 596 | 14.1% |
| $50,000 to $74,999 | 816 | 19.3% |
| $75,000 to $99,999 | 740 | 17.5% |
| $100,000 to $149,999 | 613 | 14.5% |
| $150,000 to $199,999 | 106 | 2.5% |
| $200,000+ | 144 | 3.4% |
Household Income by Householder Age in Owyhee County
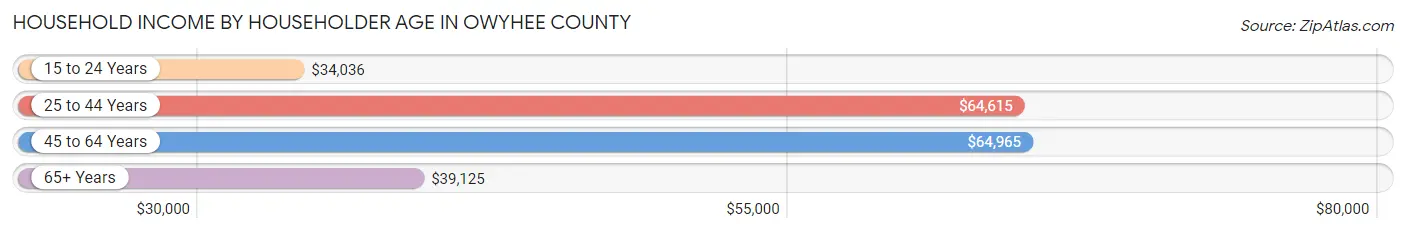
The median household income in Owyhee County is $58,440, with the highest median household income of $64,965 found in the 45 to 64 years age bracket for the primary householder. A total of 1,659 households (39.3%) fall into this category. Meanwhile, the 15 to 24 years age bracket for the primary householder has the lowest median household income of $34,036, with 107 households (2.5%) in this group.
| Income Bracket | # Households | Median Income |
| 15 to 24 Years | 107 (2.5%) | $34,036 |
| 25 to 44 Years | 1,276 (30.2%) | $64,615 |
| 45 to 64 Years | 1,659 (39.3%) | $64,965 |
| 65+ Years | 1,185 (28.0%) | $39,125 |
| Total | 4,227 (100.0%) | $58,440 |
Poverty in Owyhee County
Income Below Poverty by Sex and Age in Owyhee County
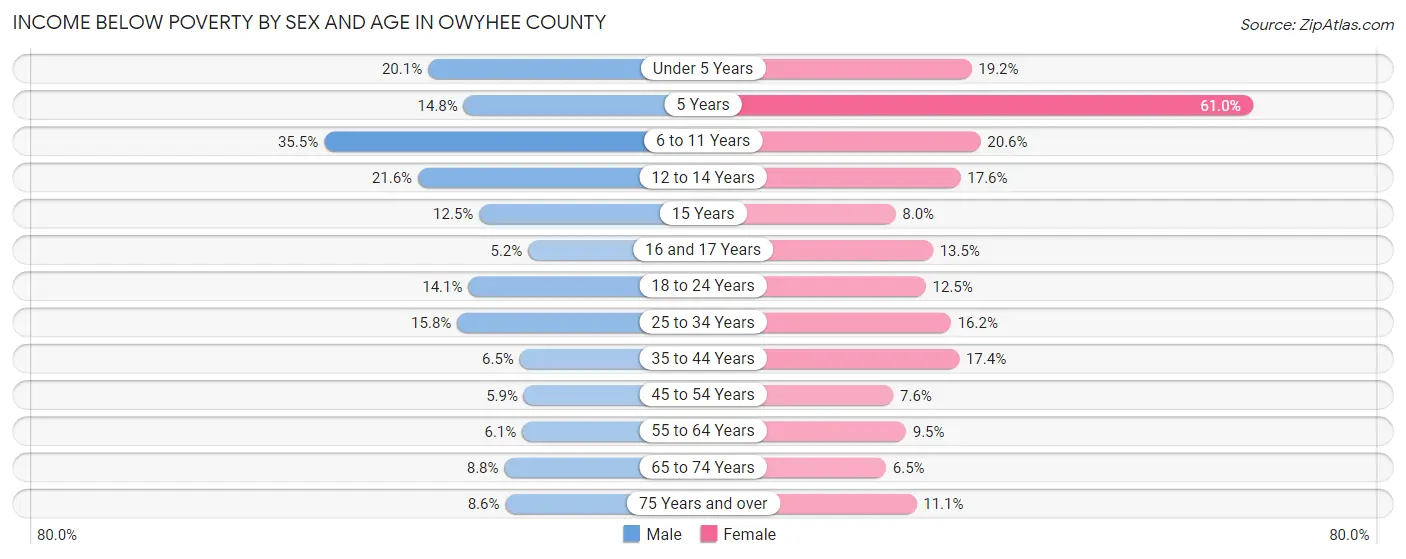
With 12.8% poverty level for males and 13.4% for females among the residents of Owyhee County, 6 to 11 year old males and 5 year old females are the most vulnerable to poverty, with 209 males (35.5%) and 25 females (61.0%) in their respective age groups living below the poverty level.
| Age Bracket | Male | Female |
| Under 5 Years | 83 (20.1%) | 66 (19.2%) |
| 5 Years | 12 (14.8%) | 25 (61.0%) |
| 6 to 11 Years | 209 (35.5%) | 93 (20.6%) |
| 12 to 14 Years | 46 (21.6%) | 53 (17.6%) |
| 15 Years | 15 (12.5%) | 7 (8.0%) |
| 16 and 17 Years | 9 (5.2%) | 22 (13.5%) |
| 18 to 24 Years | 72 (14.1%) | 61 (12.4%) |
| 25 to 34 Years | 106 (15.8%) | 106 (16.2%) |
| 35 to 44 Years | 46 (6.5%) | 130 (17.4%) |
| 45 to 54 Years | 45 (5.9%) | 49 (7.6%) |
| 55 to 64 Years | 52 (6.1%) | 69 (9.5%) |
| 65 to 74 Years | 57 (8.8%) | 44 (6.5%) |
| 75 Years and over | 35 (8.6%) | 48 (11.1%) |
| Total | 787 (12.8%) | 773 (13.4%) |
Income Above Poverty by Sex and Age in Owyhee County
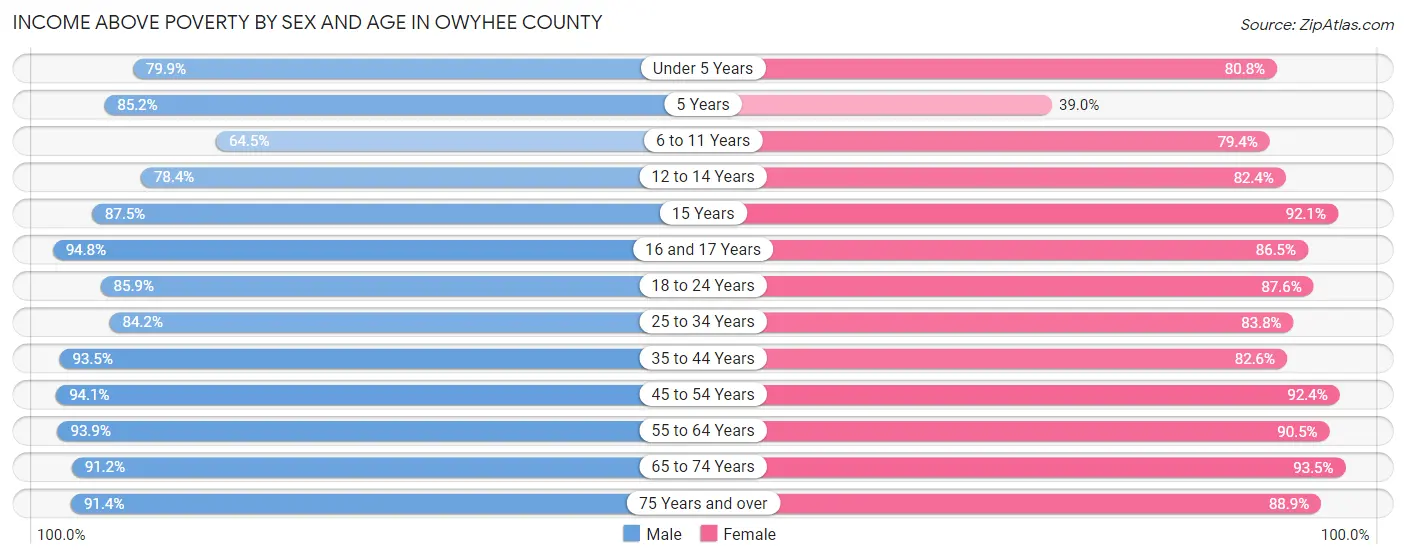
According to the poverty statistics in Owyhee County, males aged 16 and 17 years and females aged 65 to 74 years are the age groups that are most secure financially, with 94.8% of males and 93.5% of females in these age groups living above the poverty line.
| Age Bracket | Male | Female |
| Under 5 Years | 330 (79.9%) | 277 (80.8%) |
| 5 Years | 69 (85.2%) | 16 (39.0%) |
| 6 to 11 Years | 379 (64.5%) | 359 (79.4%) |
| 12 to 14 Years | 167 (78.4%) | 248 (82.4%) |
| 15 Years | 105 (87.5%) | 81 (92.0%) |
| 16 and 17 Years | 163 (94.8%) | 141 (86.5%) |
| 18 to 24 Years | 438 (85.9%) | 429 (87.5%) |
| 25 to 34 Years | 566 (84.2%) | 549 (83.8%) |
| 35 to 44 Years | 664 (93.5%) | 617 (82.6%) |
| 45 to 54 Years | 722 (94.1%) | 594 (92.4%) |
| 55 to 64 Years | 798 (93.9%) | 657 (90.5%) |
| 65 to 74 Years | 594 (91.2%) | 629 (93.5%) |
| 75 Years and over | 371 (91.4%) | 386 (88.9%) |
| Total | 5,366 (87.2%) | 4,983 (86.6%) |
Income Below Poverty Among Married-Couple Families in Owyhee County
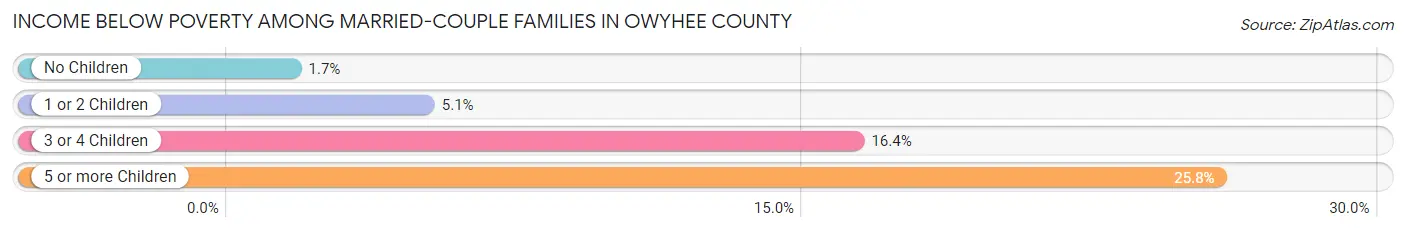
The poverty statistics for married-couple families in Owyhee County show that 5.0% or 122 of the total 2,425 families live below the poverty line. Families with 5 or more children have the highest poverty rate of 25.8%, comprising of 8 families. On the other hand, families with no children have the lowest poverty rate of 1.7%, which includes 22 families.
| Children | Above Poverty | Below Poverty |
| No Children | 1,303 (98.3%) | 22 (1.7%) |
| 1 or 2 Children | 701 (94.9%) | 38 (5.1%) |
| 3 or 4 Children | 276 (83.6%) | 54 (16.4%) |
| 5 or more Children | 23 (74.2%) | 8 (25.8%) |
| Total | 2,303 (95.0%) | 122 (5.0%) |
Income Below Poverty Among Single-Parent Households in Owyhee County
According to the poverty data in Owyhee County, 10.5% or 32 single-father households and 30.0% or 97 single-mother households are living below the poverty line. Among single-father households, those with 3 or 4 children have the highest poverty rate, with 25 households (53.2%) experiencing poverty. Likewise, among single-mother households, those with 3 or 4 children have the highest poverty rate, with 90 households (70.3%) falling below the poverty line.
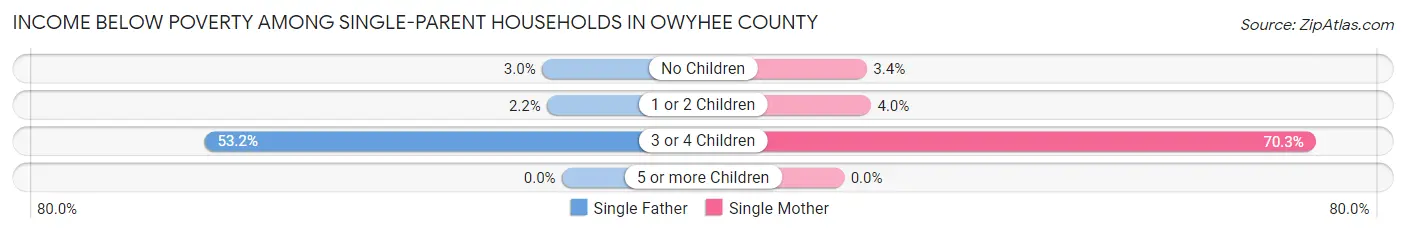
| Children | Single Father | Single Mother |
| No Children | 5 (3.0%) | 2 (3.4%) |
| 1 or 2 Children | 2 (2.2%) | 5 (4.0%) |
| 3 or 4 Children | 25 (53.2%) | 90 (70.3%) |
| 5 or more Children | 0 (0.0%) | 0 (0.0%) |
| Total | 32 (10.5%) | 97 (30.0%) |
Income Below Poverty Among Married-Couple vs Single-Parent Households in Owyhee County
The poverty data for Owyhee County shows that 122 of the married-couple family households (5.0%) and 129 of the single-parent households (20.5%) are living below the poverty level. Within the married-couple family households, those with 5 or more children have the highest poverty rate, with 8 households (25.8%) falling below the poverty line. Among the single-parent households, those with 3 or 4 children have the highest poverty rate, with 115 household (65.7%) living below poverty.
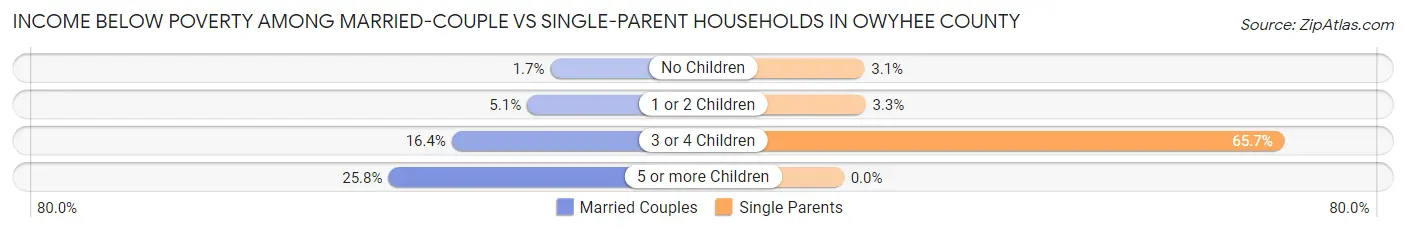
| Children | Married-Couple Families | Single-Parent Households |
| No Children | 22 (1.7%) | 7 (3.1%) |
| 1 or 2 Children | 38 (5.1%) | 7 (3.3%) |
| 3 or 4 Children | 54 (16.4%) | 115 (65.7%) |
| 5 or more Children | 8 (25.8%) | 0 (0.0%) |
| Total | 122 (5.0%) | 129 (20.5%) |
Race in Owyhee County
The most populous races in Owyhee County are White / Caucasian (8,934 | 74.2%), Hispanic or Latino (3,105 | 25.8%), and Some other Race (1,497 | 12.4%).
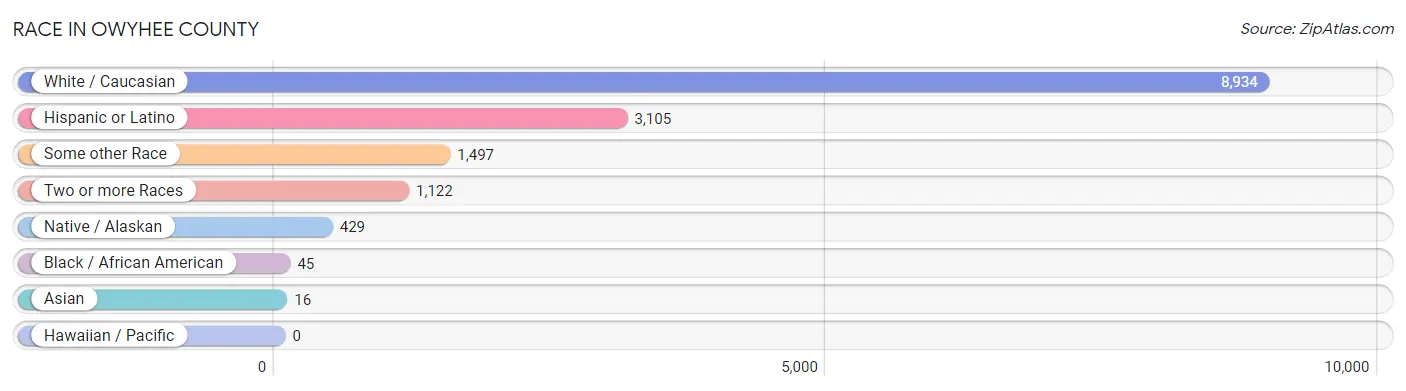
| Race | # Population | % Population |
| Asian | 16 | 0.1% |
| Black / African American | 45 | 0.4% |
| Hawaiian / Pacific | 0 | 0.0% |
| Hispanic or Latino | 3,105 | 25.8% |
| Native / Alaskan | 429 | 3.6% |
| White / Caucasian | 8,934 | 74.2% |
| Two or more Races | 1,122 | 9.3% |
| Some other Race | 1,497 | 12.4% |
| Total | 12,043 | 100.0% |
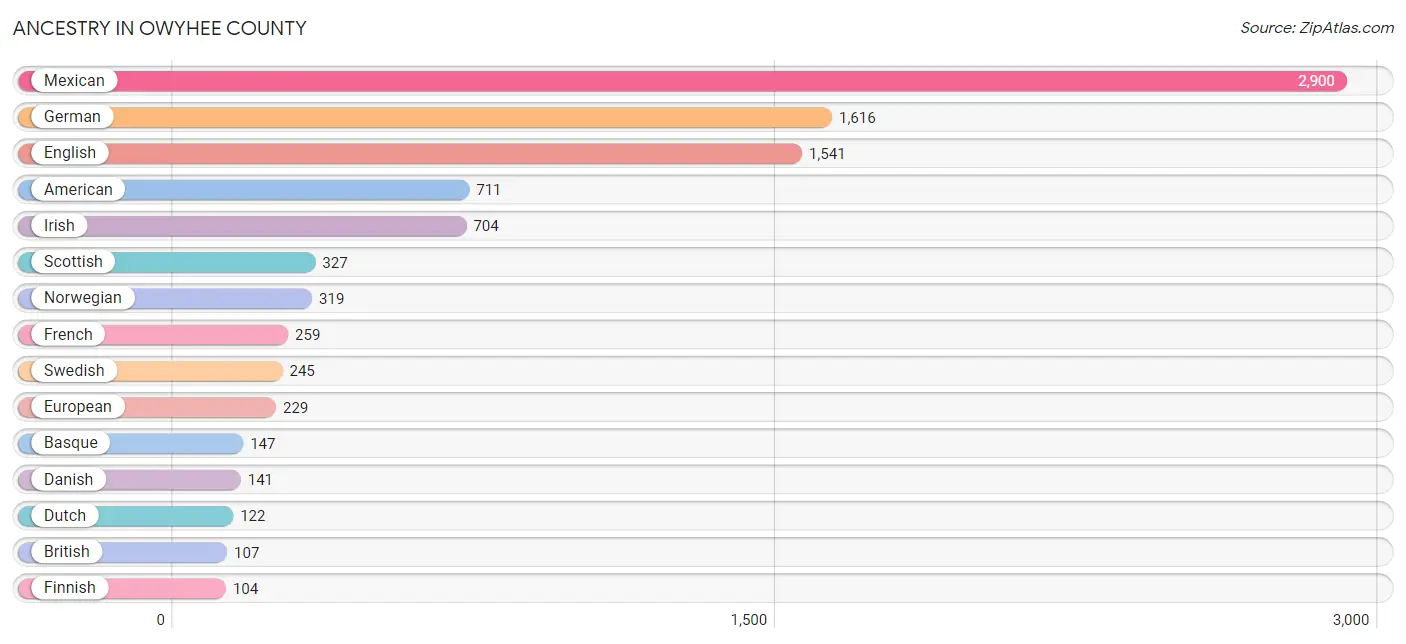
Ancestry in Owyhee County
The most populous ancestries reported in Owyhee County are Mexican (2,900 | 24.1%), German (1,616 | 13.4%), English (1,541 | 12.8%), American (711 | 5.9%), and Irish (704 | 5.9%), together accounting for 62.1% of all Owyhee County residents.
| Ancestry | # Population | % Population |
| American | 711 | 5.9% |
| Basque | 147 | 1.2% |
| Bhutanese | 11 | 0.1% |
| Blackfeet | 27 | 0.2% |
| British | 107 | 0.9% |
| Burmese | 3 | 0.0% |
| Canadian | 8 | 0.1% |
| Central American | 41 | 0.3% |
| Cherokee | 54 | 0.4% |
| Chippewa | 14 | 0.1% |
| Choctaw | 9 | 0.1% |
| Colombian | 7 | 0.1% |
| Croatian | 6 | 0.1% |
| Czech | 28 | 0.2% |
| Czechoslovakian | 7 | 0.1% |
| Danish | 141 | 1.2% |
| Dutch | 122 | 1.0% |
| English | 1,541 | 12.8% |
| European | 229 | 1.9% |
| Finnish | 104 | 0.9% |
| French | 259 | 2.1% |
| French American Indian | 8 | 0.1% |
| French Canadian | 28 | 0.2% |
| German | 1,616 | 13.4% |
| German Russian | 13 | 0.1% |
| Hungarian | 11 | 0.1% |
| Indian (Asian) | 11 | 0.1% |
| Inupiat | 4 | 0.0% |
| Irish | 704 | 5.9% |
| Israeli | 21 | 0.2% |
| Italian | 80 | 0.7% |
| Korean | 1 | 0.0% |
| Mexican | 2,900 | 24.1% |
| Mexican American Indian | 7 | 0.1% |
| Navajo | 98 | 0.8% |
| Northern European | 17 | 0.1% |
| Norwegian | 319 | 2.6% |
| Paiute | 28 | 0.2% |
| Pennsylvania German | 13 | 0.1% |
| Polish | 70 | 0.6% |
| Portuguese | 16 | 0.1% |
| Potawatomi | 70 | 0.6% |
| Puerto Rican | 80 | 0.7% |
| Russian | 32 | 0.3% |
| Salvadoran | 41 | 0.3% |
| Scandinavian | 15 | 0.1% |
| Scotch-Irish | 81 | 0.7% |
| Scottish | 327 | 2.7% |
| Shoshone | 27 | 0.2% |
| Sioux | 7 | 0.1% |
| Slavic | 10 | 0.1% |
| Slovene | 22 | 0.2% |
| South American | 7 | 0.1% |
| Spaniard | 37 | 0.3% |
| Swedish | 245 | 2.0% |
| Swiss | 56 | 0.5% |
| Tohono O'Odham | 11 | 0.1% |
| Trinidadian and Tobagonian | 56 | 0.5% |
| Welsh | 104 | 0.9% | View All 59 Rows |
Immigrants in Owyhee County
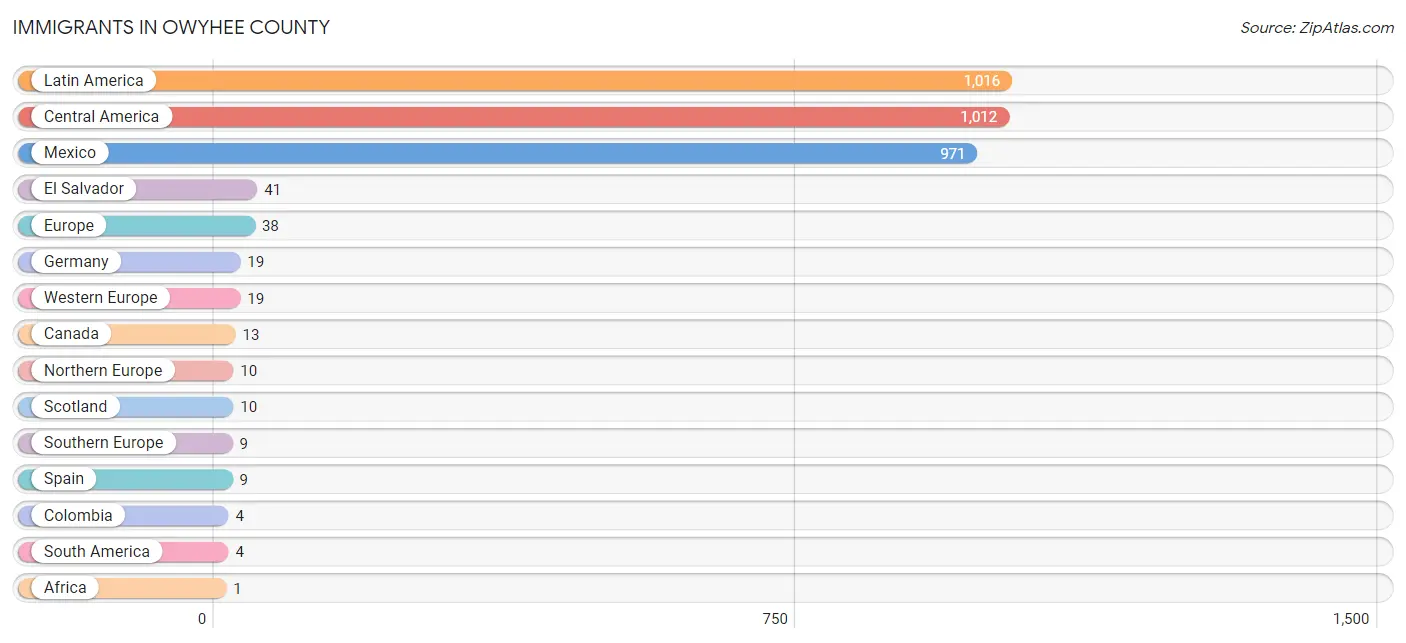
The most numerous immigrant groups reported in Owyhee County came from Latin America (1,016 | 8.4%), Central America (1,012 | 8.4%), Mexico (971 | 8.1%), El Salvador (41 | 0.3%), and Europe (38 | 0.3%), together accounting for 25.6% of all Owyhee County residents.
| Immigration Origin | # Population | % Population |
| Africa | 1 | 0.0% |
| Asia | 1 | 0.0% |
| Canada | 13 | 0.1% |
| Central America | 1,012 | 8.4% |
| Colombia | 4 | 0.0% |
| El Salvador | 41 | 0.3% |
| Europe | 38 | 0.3% |
| Germany | 19 | 0.2% |
| Latin America | 1,016 | 8.4% |
| Mexico | 971 | 8.1% |
| Northern Europe | 10 | 0.1% |
| Philippines | 1 | 0.0% |
| Scotland | 10 | 0.1% |
| South Africa | 1 | 0.0% |
| South America | 4 | 0.0% |
| South Eastern Asia | 1 | 0.0% |
| Southern Europe | 9 | 0.1% |
| Spain | 9 | 0.1% |
| Western Europe | 19 | 0.2% | View All 19 Rows |
Sex and Age in Owyhee County
Sex and Age in Owyhee County
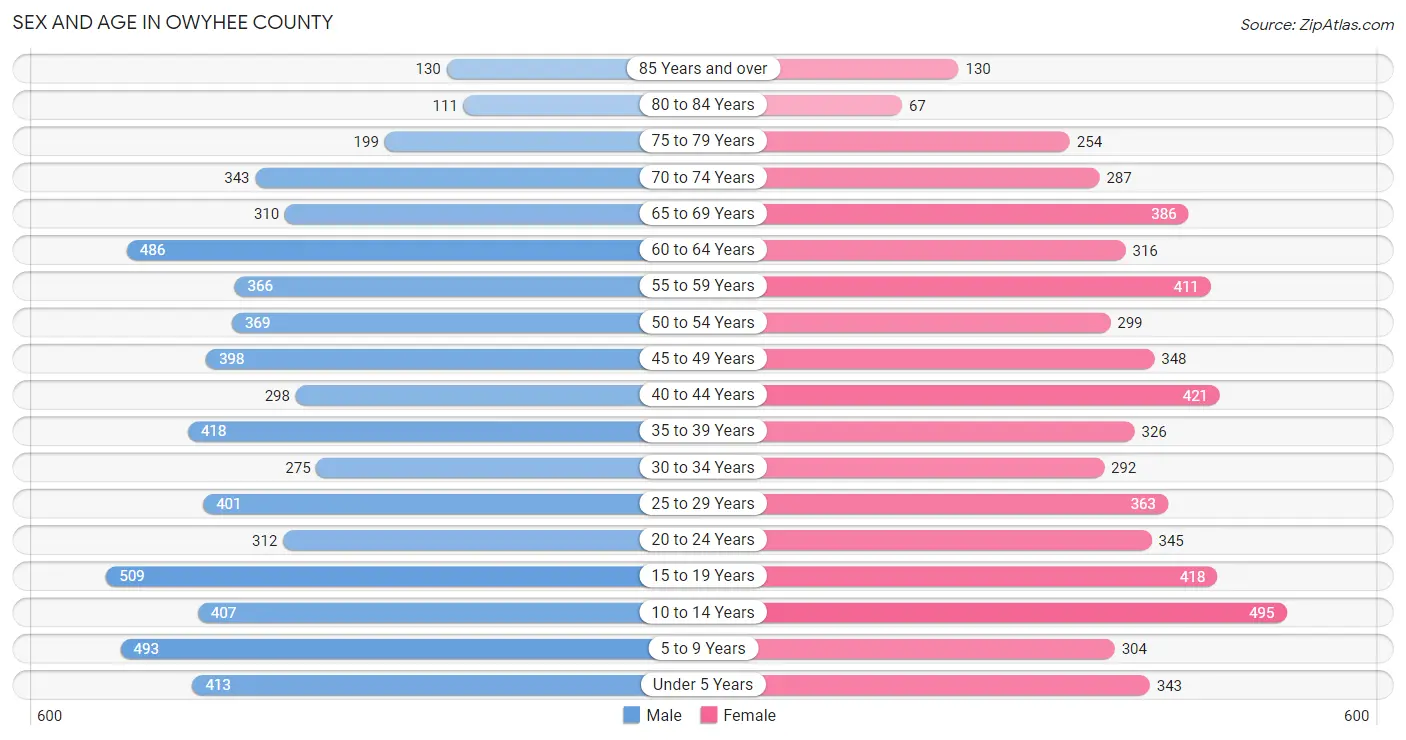
The most populous age groups in Owyhee County are 15 to 19 Years (509 | 8.2%) for men and 10 to 14 Years (495 | 8.5%) for women.
| Age Bracket | Male | Female |
| Under 5 Years | 413 (6.6%) | 343 (5.9%) |
| 5 to 9 Years | 493 (7.9%) | 304 (5.2%) |
| 10 to 14 Years | 407 (6.5%) | 495 (8.5%) |
| 15 to 19 Years | 509 (8.2%) | 418 (7.2%) |
| 20 to 24 Years | 312 (5.0%) | 345 (5.9%) |
| 25 to 29 Years | 401 (6.4%) | 363 (6.2%) |
| 30 to 34 Years | 275 (4.4%) | 292 (5.0%) |
| 35 to 39 Years | 418 (6.7%) | 326 (5.6%) |
| 40 to 44 Years | 298 (4.8%) | 421 (7.2%) |
| 45 to 49 Years | 398 (6.4%) | 348 (6.0%) |
| 50 to 54 Years | 369 (5.9%) | 299 (5.1%) |
| 55 to 59 Years | 366 (5.9%) | 411 (7.1%) |
| 60 to 64 Years | 486 (7.8%) | 316 (5.4%) |
| 65 to 69 Years | 310 (5.0%) | 386 (6.7%) |
| 70 to 74 Years | 343 (5.5%) | 287 (4.9%) |
| 75 to 79 Years | 199 (3.2%) | 254 (4.4%) |
| 80 to 84 Years | 111 (1.8%) | 67 (1.1%) |
| 85 Years and over | 130 (2.1%) | 130 (2.2%) |
| Total | 6,238 (100.0%) | 5,805 (100.0%) |
Families and Households in Owyhee County
Median Family Size in Owyhee County
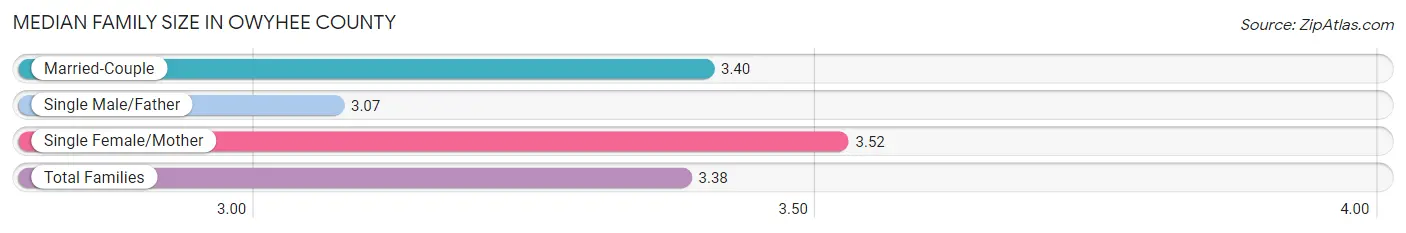
The median family size in Owyhee County is 3.38 persons per family, with single female/mother families (323 | 10.6%) accounting for the largest median family size of 3.52 persons per family. On the other hand, single male/father families (305 | 10.0%) represent the smallest median family size with 3.07 persons per family.
| Family Type | # Families | Family Size |
| Married-Couple | 2,425 (79.4%) | 3.40 |
| Single Male/Father | 305 (10.0%) | 3.07 |
| Single Female/Mother | 323 (10.6%) | 3.52 |
| Total Families | 3,053 (100.0%) | 3.38 |
Median Household Size in Owyhee County
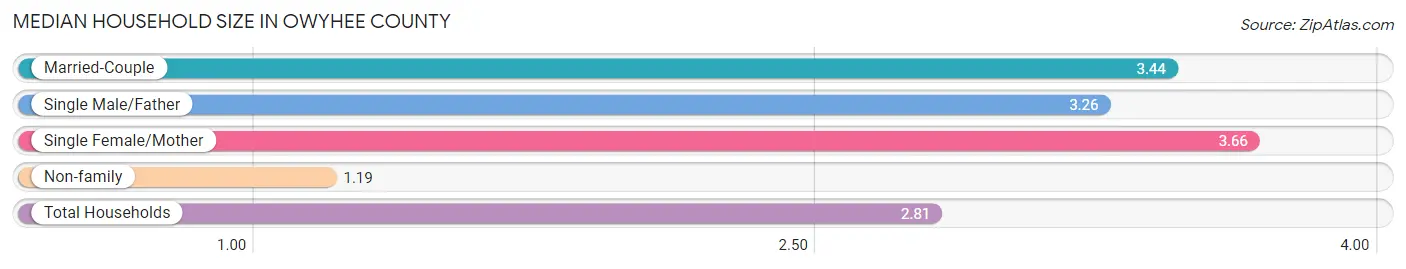
The median household size in Owyhee County is 2.81 persons per household, with single female/mother households (323 | 7.6%) accounting for the largest median household size of 3.66 persons per household. non-family households (1,174 | 27.8%) represent the smallest median household size with 1.19 persons per household.
| Household Type | # Households | Household Size |
| Married-Couple | 2,425 (57.4%) | 3.44 |
| Single Male/Father | 305 (7.2%) | 3.26 |
| Single Female/Mother | 323 (7.6%) | 3.66 |
| Non-family | 1,174 (27.8%) | 1.19 |
| Total Households | 4,227 (100.0%) | 2.81 |
Household Size by Marriage Status in Owyhee County
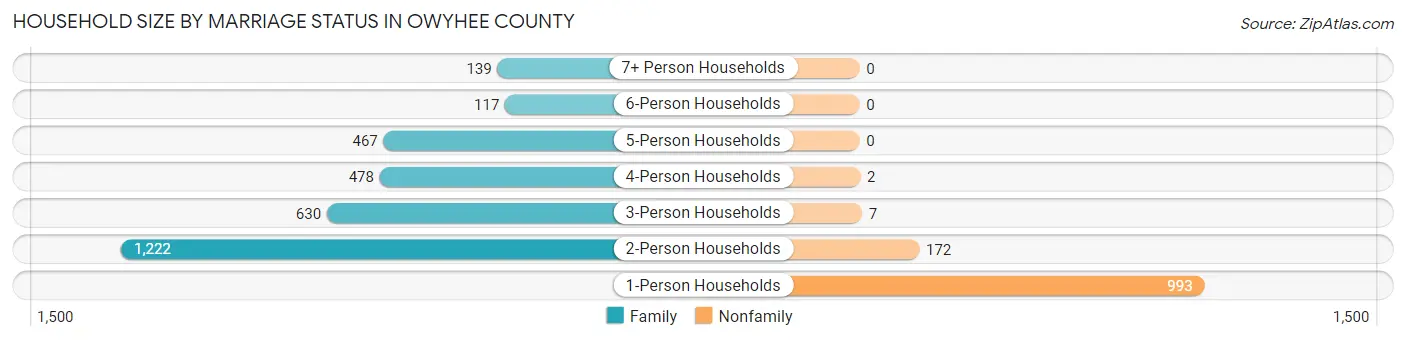
Out of a total of 4,227 households in Owyhee County, 3,053 (72.2%) are family households, while 1,174 (27.8%) are nonfamily households. The most numerous type of family households are 2-person households, comprising 1,222, and the most common type of nonfamily households are 1-person households, comprising 993.
| Household Size | Family Households | Nonfamily Households |
| 1-Person Households | - | 993 (23.5%) |
| 2-Person Households | 1,222 (28.9%) | 172 (4.1%) |
| 3-Person Households | 630 (14.9%) | 7 (0.2%) |
| 4-Person Households | 478 (11.3%) | 2 (0.1%) |
| 5-Person Households | 467 (11.1%) | 0 (0.0%) |
| 6-Person Households | 117 (2.8%) | 0 (0.0%) |
| 7+ Person Households | 139 (3.3%) | 0 (0.0%) |
| Total | 3,053 (72.2%) | 1,174 (27.8%) |
Female Fertility in Owyhee County
Fertility by Age in Owyhee County
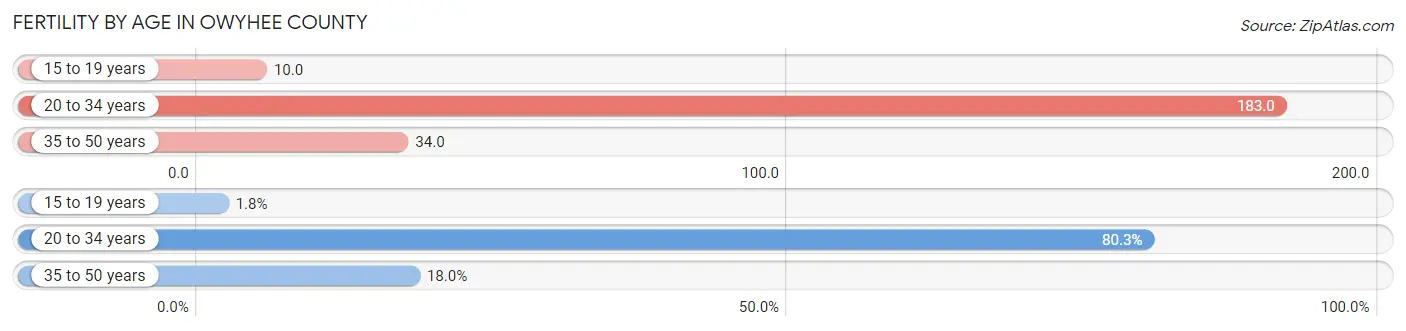
Average fertility rate in Owyhee County is 87.0 births per 1,000 women. Women in the age bracket of 20 to 34 years have the highest fertility rate with 183.0 births per 1,000 women. Women in the age bracket of 20 to 34 years acount for 80.3% of all women with births.
| Age Bracket | Women with Births | Births / 1,000 Women |
| 15 to 19 years | 4 (1.8%) | 10.0 |
| 20 to 34 years | 183 (80.3%) | 183.0 |
| 35 to 50 years | 41 (18.0%) | 34.0 |
| Total | 228 (100.0%) | 87.0 |
Fertility by Age by Marriage Status in Owyhee County
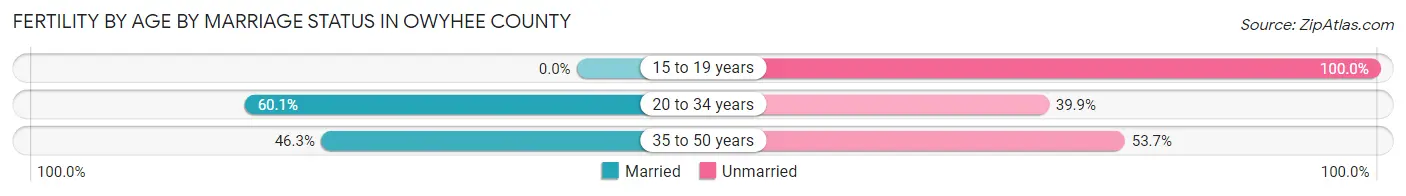
56.6% of women with births (228) in Owyhee County are married. The highest percentage of unmarried women with births falls into 15 to 19 years age bracket with 100.0% of them unmarried at the time of birth, while the lowest percentage of unmarried women with births belong to 20 to 34 years age bracket with 39.9% of them unmarried.
| Age Bracket | Married | Unmarried |
| 15 to 19 years | 0 (0.0%) | 4 (100.0%) |
| 20 to 34 years | 110 (60.1%) | 73 (39.9%) |
| 35 to 50 years | 19 (46.3%) | 22 (53.7%) |
| Total | 129 (56.6%) | 99 (43.4%) |
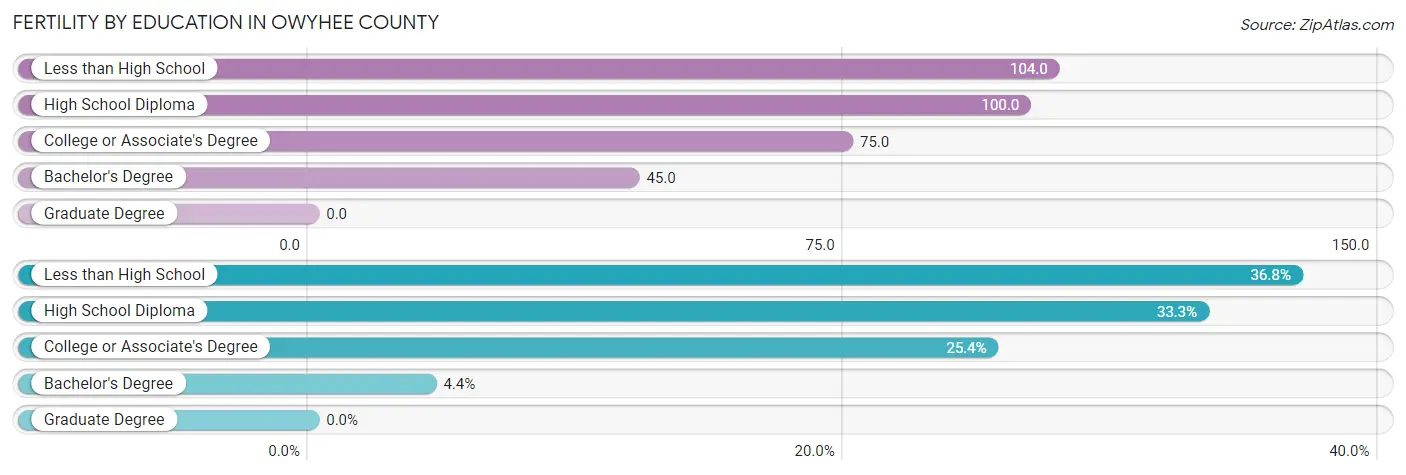
Fertility by Education in Owyhee County
| Educational Attainment | Women with Births | Births / 1,000 Women |
| Less than High School | 84 (36.8%) | 104.0 |
| High School Diploma | 76 (33.3%) | 100.0 |
| College or Associate's Degree | 58 (25.4%) | 75.0 |
| Bachelor's Degree | 10 (4.4%) | 45.0 |
| Graduate Degree | 0 (0.0%) | 0.0 |
| Total | 228 (100.0%) | 87.0 |
Fertility by Education by Marriage Status in Owyhee County
43.4% of women with births in Owyhee County are unmarried. Women with the educational attainment of bachelor's degree are most likely to be married with 100.0% of them married at childbirth, while women with the educational attainment of high school diploma are least likely to be married with 80.3% of them unmarried at childbirth.
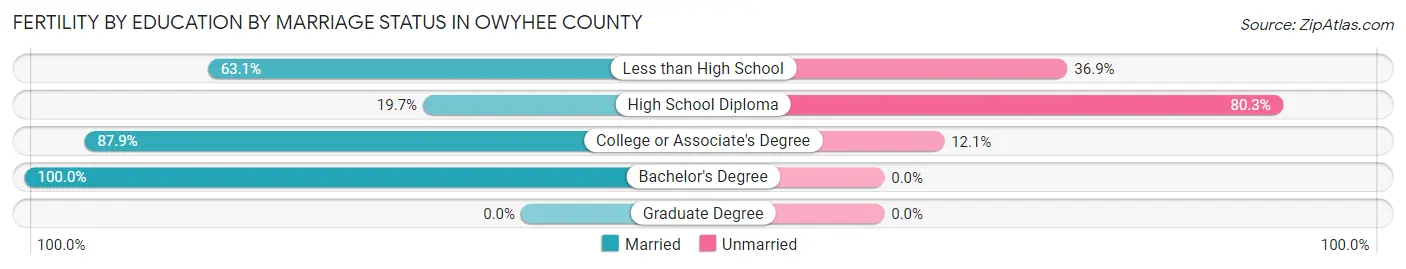
| Educational Attainment | Married | Unmarried |
| Less than High School | 53 (63.1%) | 31 (36.9%) |
| High School Diploma | 15 (19.7%) | 61 (80.3%) |
| College or Associate's Degree | 51 (87.9%) | 7 (12.1%) |
| Bachelor's Degree | 10 (100.0%) | 0 (0.0%) |
| Graduate Degree | 0 (0.0%) | 0 (0.0%) |
| Total | 129 (56.6%) | 99 (43.4%) |
Employment Characteristics in Owyhee County
Employment by Class of Employer in Owyhee County
Among the 5,214 employed individuals in Owyhee County, private company employees (3,447 | 66.1%), self-employed (not incorporated) (404 | 7.7%), and local government employees (360 | 6.9%) make up the most common classes of employment.
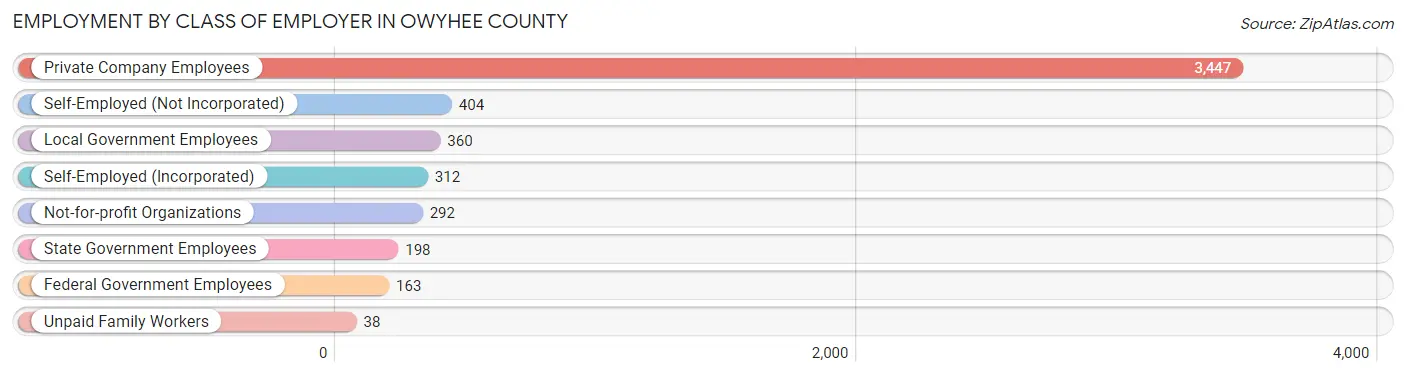
| Employer Class | # Employees | % Employees |
| Private Company Employees | 3,447 | 66.1% |
| Self-Employed (Incorporated) | 312 | 6.0% |
| Self-Employed (Not Incorporated) | 404 | 7.7% |
| Not-for-profit Organizations | 292 | 5.6% |
| Local Government Employees | 360 | 6.9% |
| State Government Employees | 198 | 3.8% |
| Federal Government Employees | 163 | 3.1% |
| Unpaid Family Workers | 38 | 0.7% |
| Total | 5,214 | 100.0% |
Employment Status by Age in Owyhee County
According to the labor force statistics for Owyhee County, out of the total population over 16 years of age (9,374), 58.4% or 5,474 individuals are in the labor force, with 2.2% or 120 of them unemployed. The age group with the highest labor force participation rate is 30 to 34 years, with 86.4% or 490 individuals in the labor force. Within the labor force, the 25 to 29 years age range has the highest percentage of unemployed individuals, with 5.0% or 30 of them being unemployed.
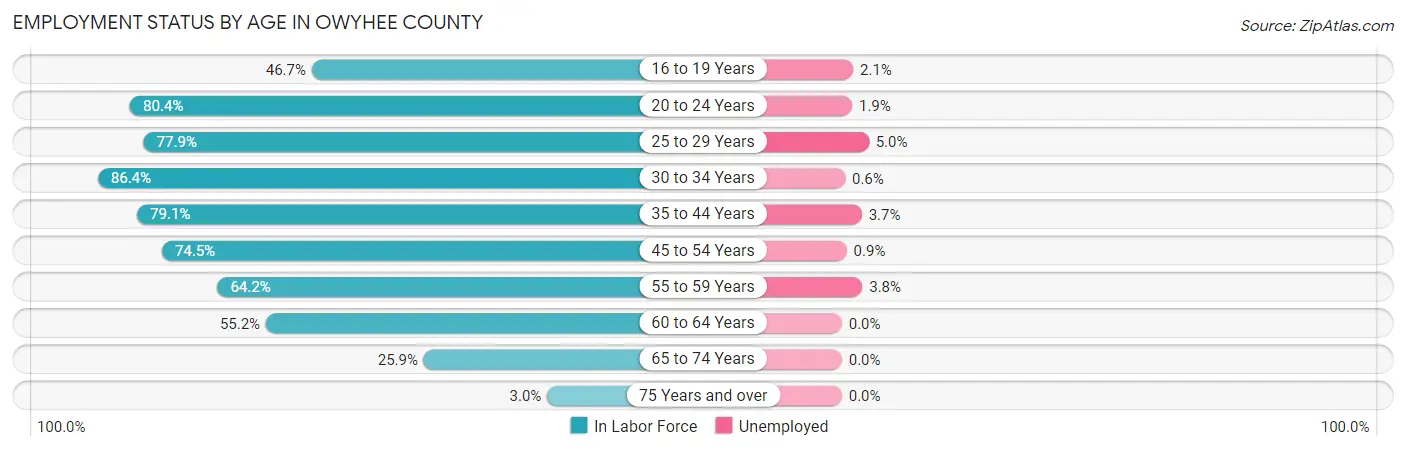
| Age Bracket | In Labor Force | Unemployed |
| 16 to 19 Years | 333 (46.7%) | 7 (2.1%) |
| 20 to 24 Years | 528 (80.4%) | 10 (1.9%) |
| 25 to 29 Years | 595 (77.9%) | 30 (5.0%) |
| 30 to 34 Years | 490 (86.4%) | 3 (0.6%) |
| 35 to 44 Years | 1,157 (79.1%) | 43 (3.7%) |
| 45 to 54 Years | 1,053 (74.5%) | 9 (0.9%) |
| 55 to 59 Years | 499 (64.2%) | 19 (3.8%) |
| 60 to 64 Years | 443 (55.2%) | 0 (0.0%) |
| 65 to 74 Years | 343 (25.9%) | 0 (0.0%) |
| 75 Years and over | 27 (3.0%) | 0 (0.0%) |
| Total | 5,474 (58.4%) | 120 (2.2%) |
Employment Status by Educational Attainment in Owyhee County
According to labor force statistics for Owyhee County, 73.2% of individuals (4,236) out of the total population between 25 and 64 years of age (5,787) are in the labor force, with 2.5% or 106 of them being unemployed. The group with the highest labor force participation rate are those with the educational attainment of bachelor's degree or higher, with 79.2% or 540 individuals in the labor force. Within the labor force, individuals with less than high school education have the highest percentage of unemployment, with 4.0% or 40 of them being unemployed.
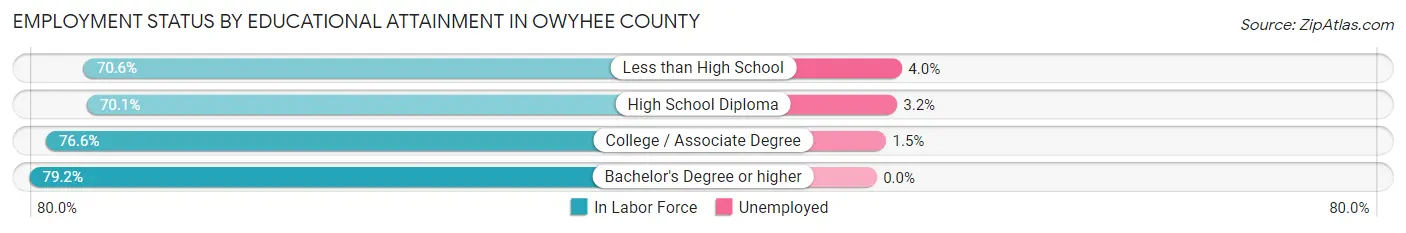
| Educational Attainment | In Labor Force | Unemployed |
| Less than High School | 1,007 (70.6%) | 57 (4.0%) |
| High School Diploma | 1,359 (70.1%) | 62 (3.2%) |
| College / Associate Degree | 1,333 (76.6%) | 26 (1.5%) |
| Bachelor's Degree or higher | 540 (79.2%) | 0 (0.0%) |
| Total | 4,236 (73.2%) | 145 (2.5%) |
Employment Occupations by Sex in Owyhee County
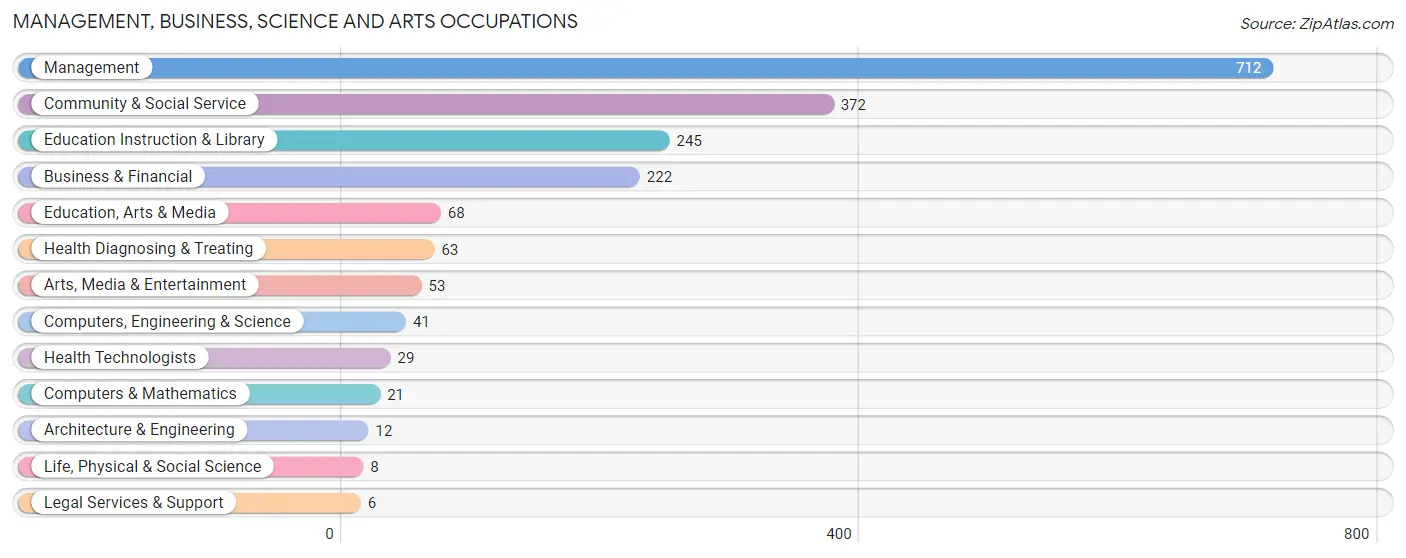
Management, Business, Science and Arts Occupations
The most common Management, Business, Science and Arts occupations in Owyhee County are Management (712 | 13.4%), Community & Social Service (372 | 7.0%), Education Instruction & Library (245 | 4.6%), Business & Financial (222 | 4.2%), and Education, Arts & Media (68 | 1.3%).
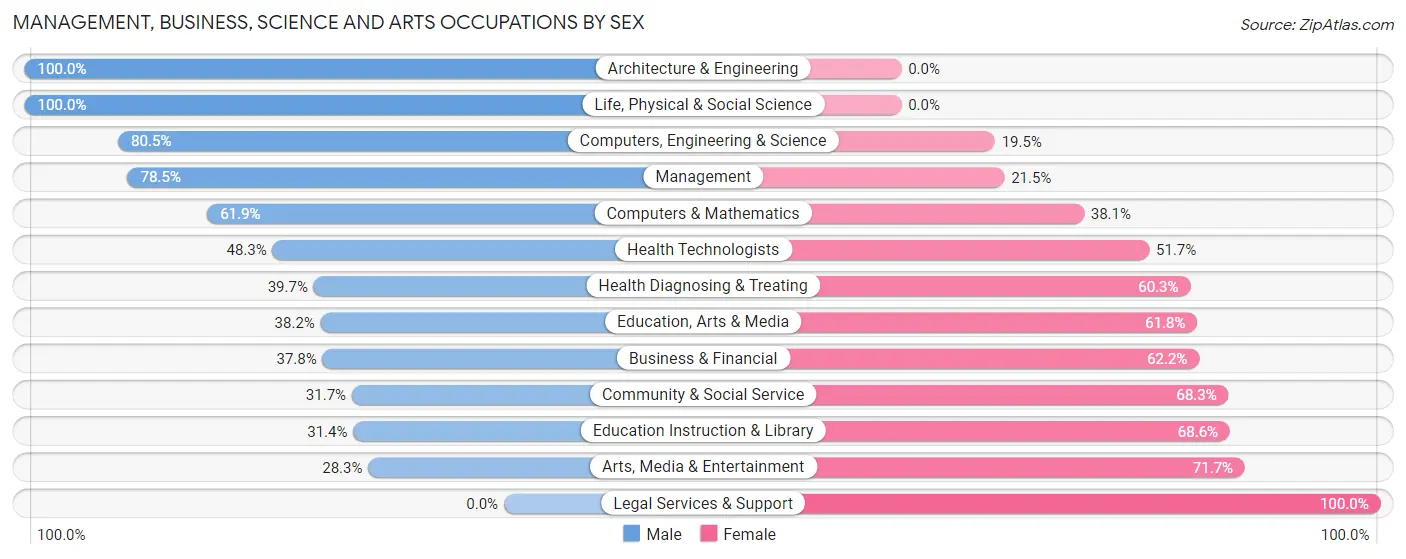
Management, Business, Science and Arts Occupations by Sex
Within the Management, Business, Science and Arts occupations in Owyhee County, the most male-oriented occupations are Architecture & Engineering (100.0%), Life, Physical & Social Science (100.0%), and Computers, Engineering & Science (80.5%), while the most female-oriented occupations are Legal Services & Support (100.0%), Arts, Media & Entertainment (71.7%), and Education Instruction & Library (68.6%).
| Occupation | Male | Female |
| Management | 559 (78.5%) | 153 (21.5%) |
| Business & Financial | 84 (37.8%) | 138 (62.2%) |
| Computers, Engineering & Science | 33 (80.5%) | 8 (19.5%) |
| Computers & Mathematics | 13 (61.9%) | 8 (38.1%) |
| Architecture & Engineering | 12 (100.0%) | 0 (0.0%) |
| Life, Physical & Social Science | 8 (100.0%) | 0 (0.0%) |
| Community & Social Service | 118 (31.7%) | 254 (68.3%) |
| Education, Arts & Media | 26 (38.2%) | 42 (61.8%) |
| Legal Services & Support | 0 (0.0%) | 6 (100.0%) |
| Education Instruction & Library | 77 (31.4%) | 168 (68.6%) |
| Arts, Media & Entertainment | 15 (28.3%) | 38 (71.7%) |
| Health Diagnosing & Treating | 25 (39.7%) | 38 (60.3%) |
| Health Technologists | 14 (48.3%) | 15 (51.7%) |
| Total (Category) | 819 (58.1%) | 591 (41.9%) |
| Total (Overall) | 3,085 (57.8%) | 2,249 (42.2%) |
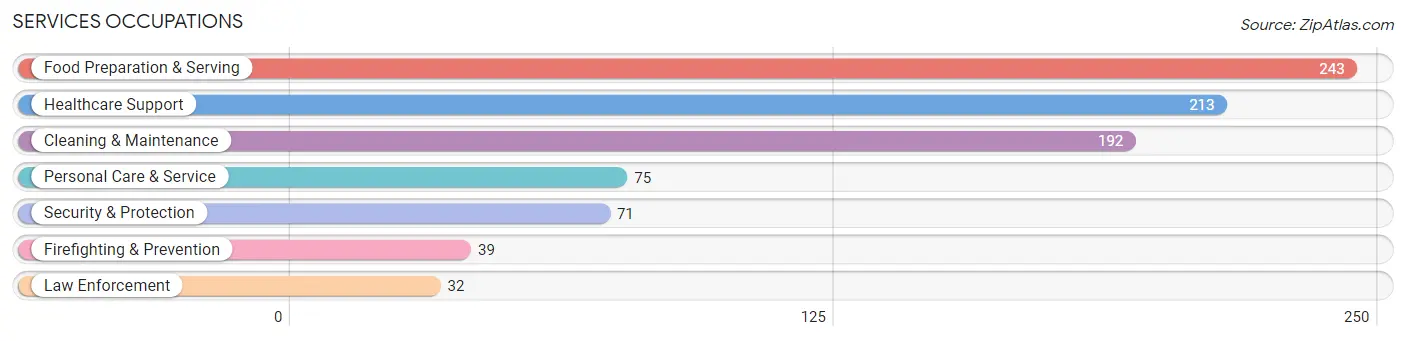
Services Occupations
The most common Services occupations in Owyhee County are Food Preparation & Serving (243 | 4.6%), Healthcare Support (213 | 4.0%), Cleaning & Maintenance (192 | 3.6%), Personal Care & Service (75 | 1.4%), and Security & Protection (71 | 1.3%).
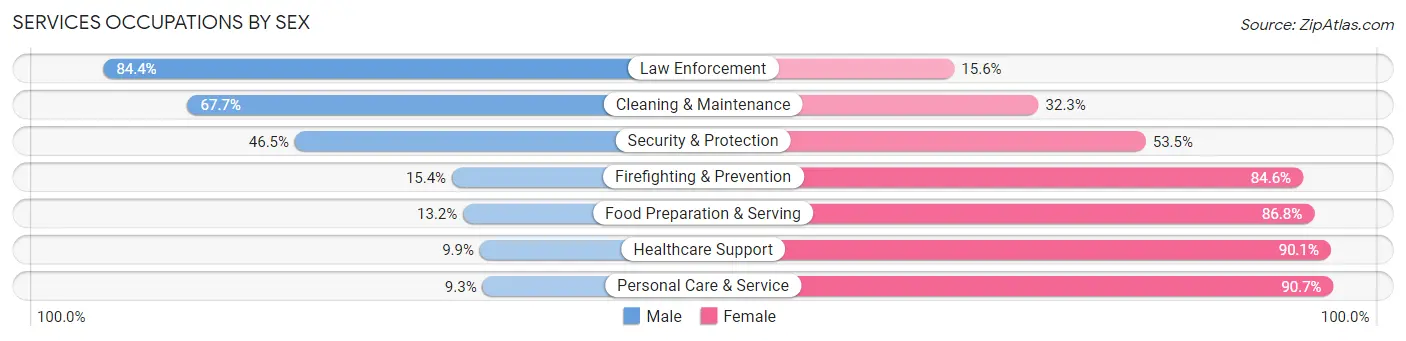
Services Occupations by Sex
Within the Services occupations in Owyhee County, the most male-oriented occupations are Law Enforcement (84.4%), Cleaning & Maintenance (67.7%), and Security & Protection (46.5%), while the most female-oriented occupations are Personal Care & Service (90.7%), Healthcare Support (90.1%), and Food Preparation & Serving (86.8%).
| Occupation | Male | Female |
| Healthcare Support | 21 (9.9%) | 192 (90.1%) |
| Security & Protection | 33 (46.5%) | 38 (53.5%) |
| Firefighting & Prevention | 6 (15.4%) | 33 (84.6%) |
| Law Enforcement | 27 (84.4%) | 5 (15.6%) |
| Food Preparation & Serving | 32 (13.2%) | 211 (86.8%) |
| Cleaning & Maintenance | 130 (67.7%) | 62 (32.3%) |
| Personal Care & Service | 7 (9.3%) | 68 (90.7%) |
| Total (Category) | 223 (28.1%) | 571 (71.9%) |
| Total (Overall) | 3,085 (57.8%) | 2,249 (42.2%) |
Sales and Office Occupations
The most common Sales and Office occupations in Owyhee County are Office & Administration (689 | 12.9%), and Sales & Related (359 | 6.7%).

Sales and Office Occupations by Sex

| Occupation | Male | Female |
| Sales & Related | 139 (38.7%) | 220 (61.3%) |
| Office & Administration | 116 (16.8%) | 573 (83.2%) |
| Total (Category) | 255 (24.3%) | 793 (75.7%) |
| Total (Overall) | 3,085 (57.8%) | 2,249 (42.2%) |
Natural Resources, Construction and Maintenance Occupations
The most common Natural Resources, Construction and Maintenance occupations in Owyhee County are Farming, Fishing & Forestry (551 | 10.3%), Construction & Extraction (468 | 8.8%), and Installation, Maintenance & Repair (203 | 3.8%).
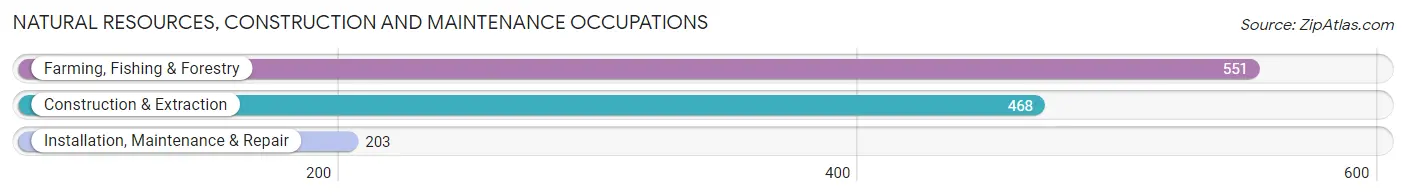
Natural Resources, Construction and Maintenance Occupations by Sex
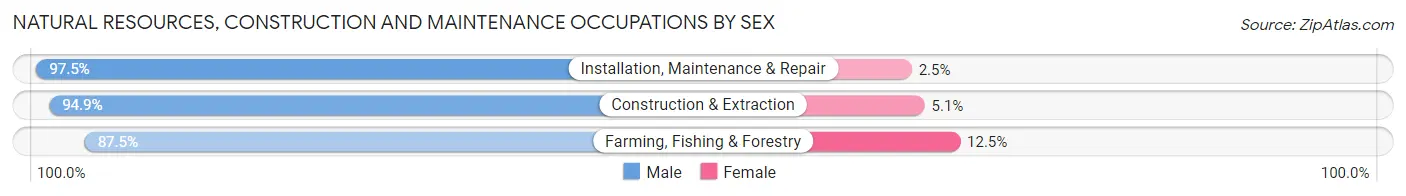
| Occupation | Male | Female |
| Farming, Fishing & Forestry | 482 (87.5%) | 69 (12.5%) |
| Construction & Extraction | 444 (94.9%) | 24 (5.1%) |
| Installation, Maintenance & Repair | 198 (97.5%) | 5 (2.5%) |
| Total (Category) | 1,124 (92.0%) | 98 (8.0%) |
| Total (Overall) | 3,085 (57.8%) | 2,249 (42.2%) |
Production, Transportation and Moving Occupations
The most common Production, Transportation and Moving occupations in Owyhee County are Production (344 | 6.5%), Material Moving (273 | 5.1%), and Transportation (243 | 4.6%).
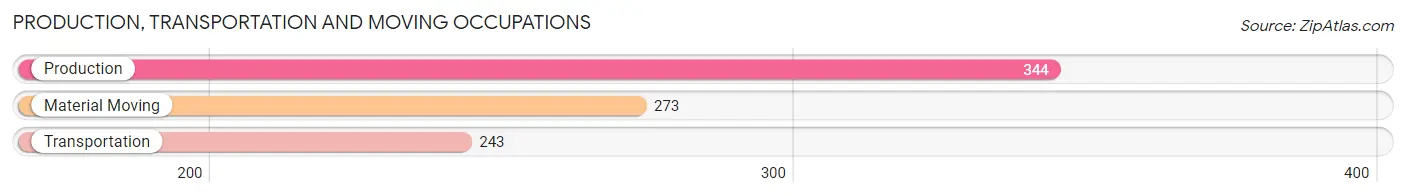
Production, Transportation and Moving Occupations by Sex
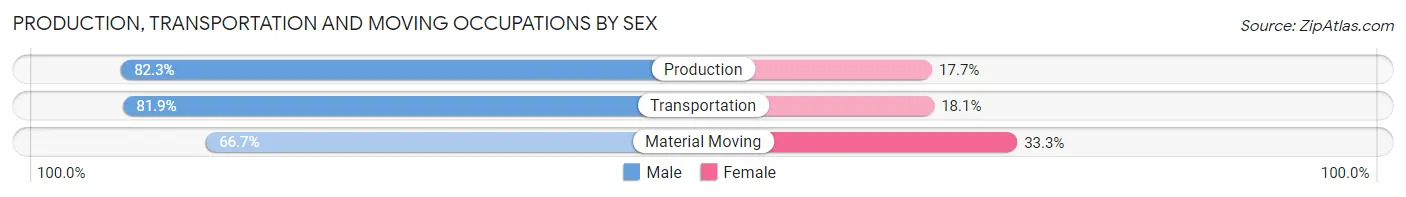
| Occupation | Male | Female |
| Production | 283 (82.3%) | 61 (17.7%) |
| Transportation | 199 (81.9%) | 44 (18.1%) |
| Material Moving | 182 (66.7%) | 91 (33.3%) |
| Total (Category) | 664 (77.2%) | 196 (22.8%) |
| Total (Overall) | 3,085 (57.8%) | 2,249 (42.2%) |
Employment Industries by Sex in Owyhee County
Employment Industries in Owyhee County
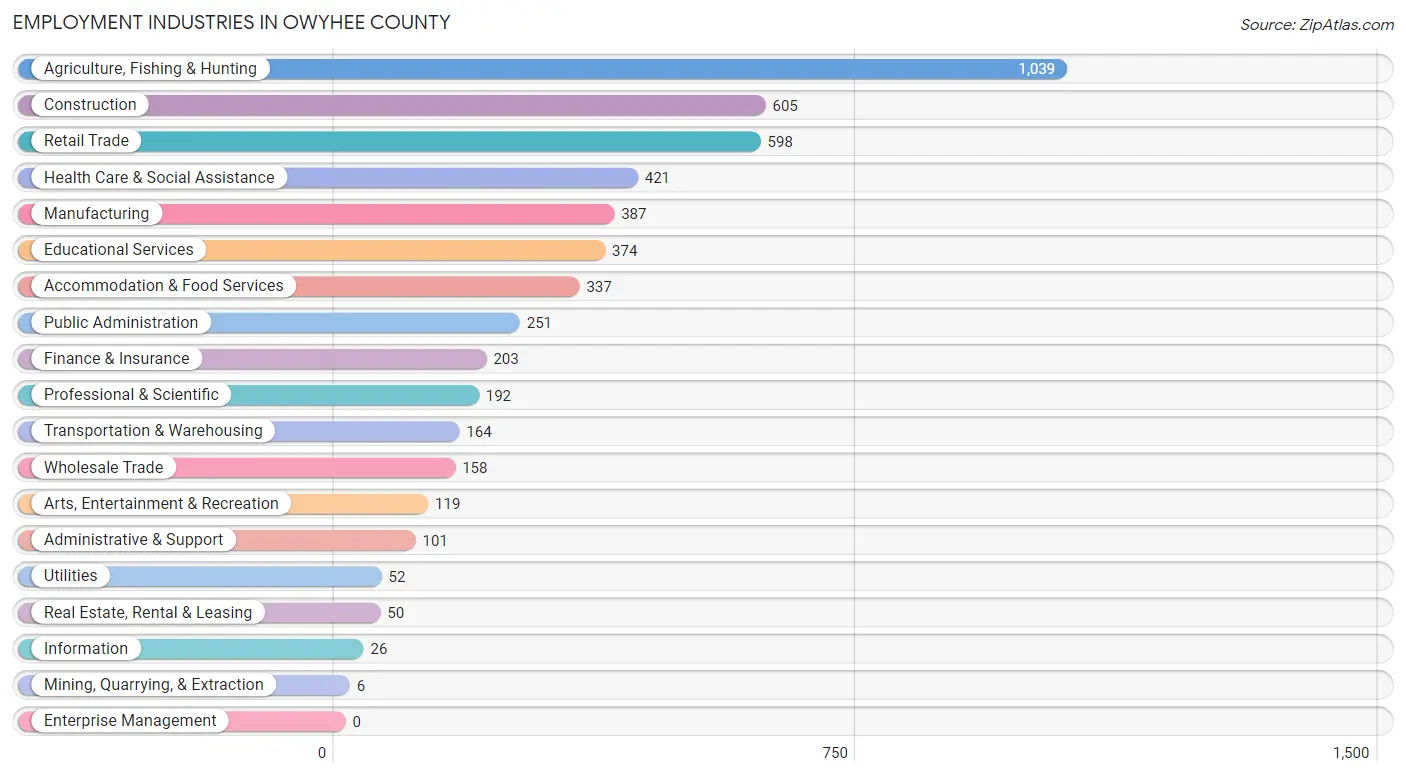
The major employment industries in Owyhee County include Agriculture, Fishing & Hunting (1,039 | 19.5%), Construction (605 | 11.3%), Retail Trade (598 | 11.2%), Health Care & Social Assistance (421 | 7.9%), and Manufacturing (387 | 7.3%).
Employment Industries by Sex in Owyhee County
The Owyhee County industries that see more men than women are Mining, Quarrying, & Extraction (100.0%), Construction (89.7%), and Utilities (88.5%), whereas the industries that tend to have a higher number of women are Information (100.0%), Finance & Insurance (94.1%), and Health Care & Social Assistance (78.6%).
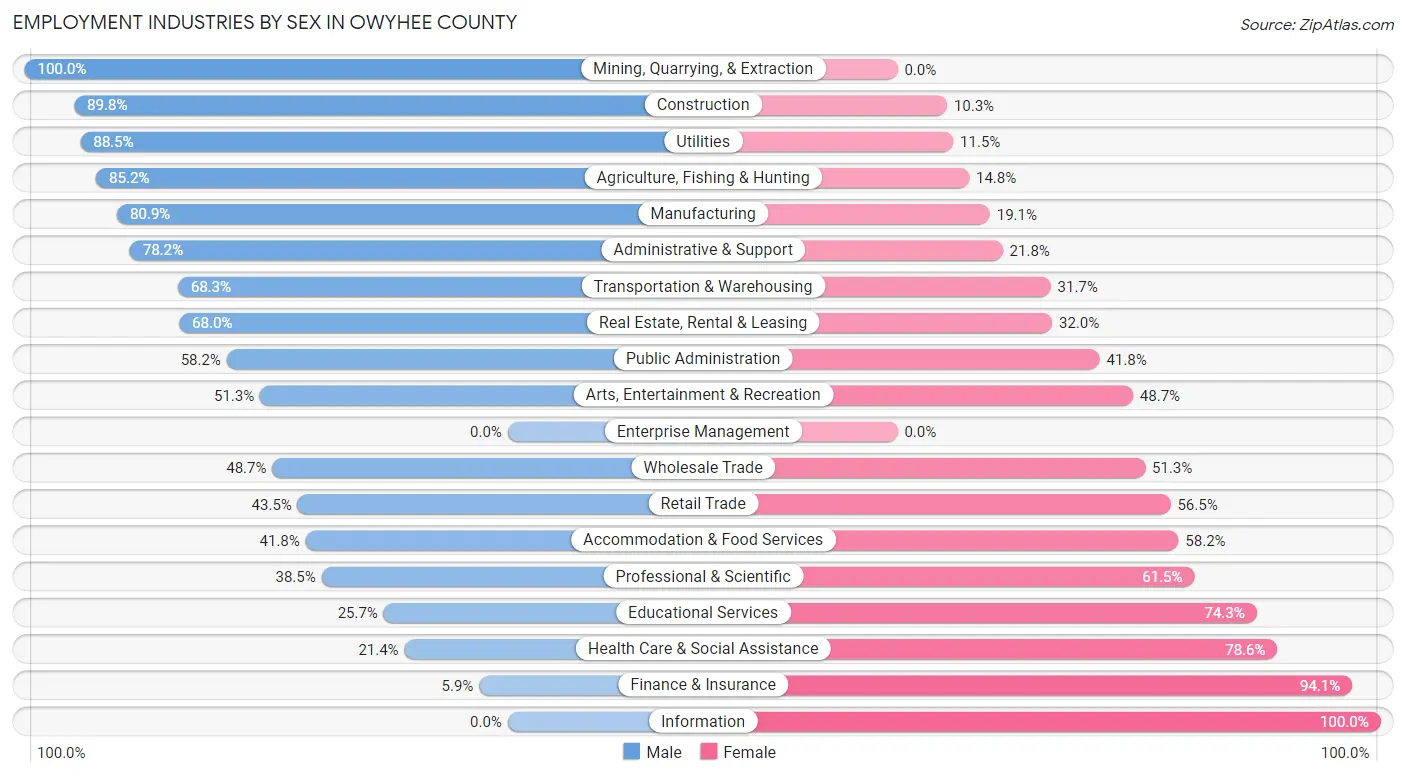
| Industry | Male | Female |
| Agriculture, Fishing & Hunting | 885 (85.2%) | 154 (14.8%) |
| Mining, Quarrying, & Extraction | 6 (100.0%) | 0 (0.0%) |
| Construction | 543 (89.7%) | 62 (10.2%) |
| Manufacturing | 313 (80.9%) | 74 (19.1%) |
| Wholesale Trade | 77 (48.7%) | 81 (51.3%) |
| Retail Trade | 260 (43.5%) | 338 (56.5%) |
| Transportation & Warehousing | 112 (68.3%) | 52 (31.7%) |
| Utilities | 46 (88.5%) | 6 (11.5%) |
| Information | 0 (0.0%) | 26 (100.0%) |
| Finance & Insurance | 12 (5.9%) | 191 (94.1%) |
| Real Estate, Rental & Leasing | 34 (68.0%) | 16 (32.0%) |
| Professional & Scientific | 74 (38.5%) | 118 (61.5%) |
| Enterprise Management | 0 (0.0%) | 0 (0.0%) |
| Administrative & Support | 79 (78.2%) | 22 (21.8%) |
| Educational Services | 96 (25.7%) | 278 (74.3%) |
| Health Care & Social Assistance | 90 (21.4%) | 331 (78.6%) |
| Arts, Entertainment & Recreation | 61 (51.3%) | 58 (48.7%) |
| Accommodation & Food Services | 141 (41.8%) | 196 (58.2%) |
| Public Administration | 146 (58.2%) | 105 (41.8%) |
| Total | 3,085 (57.8%) | 2,249 (42.2%) |
Education in Owyhee County
School Enrollment in Owyhee County
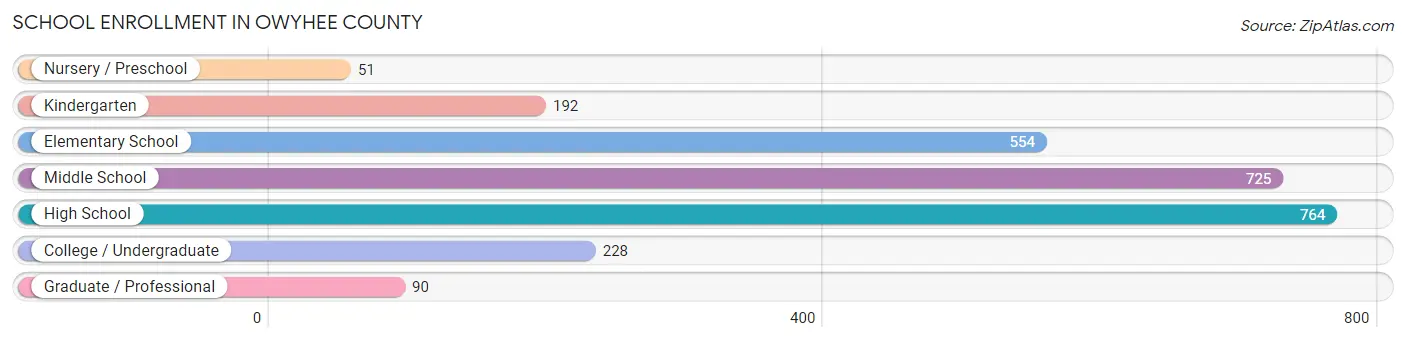
The most common levels of schooling among the 2,604 students in Owyhee County are high school (764 | 29.3%), middle school (725 | 27.8%), and elementary school (554 | 21.3%).
| School Level | # Students | % Students |
| Nursery / Preschool | 51 | 2.0% |
| Kindergarten | 192 | 7.4% |
| Elementary School | 554 | 21.3% |
| Middle School | 725 | 27.8% |
| High School | 764 | 29.3% |
| College / Undergraduate | 228 | 8.8% |
| Graduate / Professional | 90 | 3.5% |
| Total | 2,604 | 100.0% |
School Enrollment by Age by Funding Source in Owyhee County
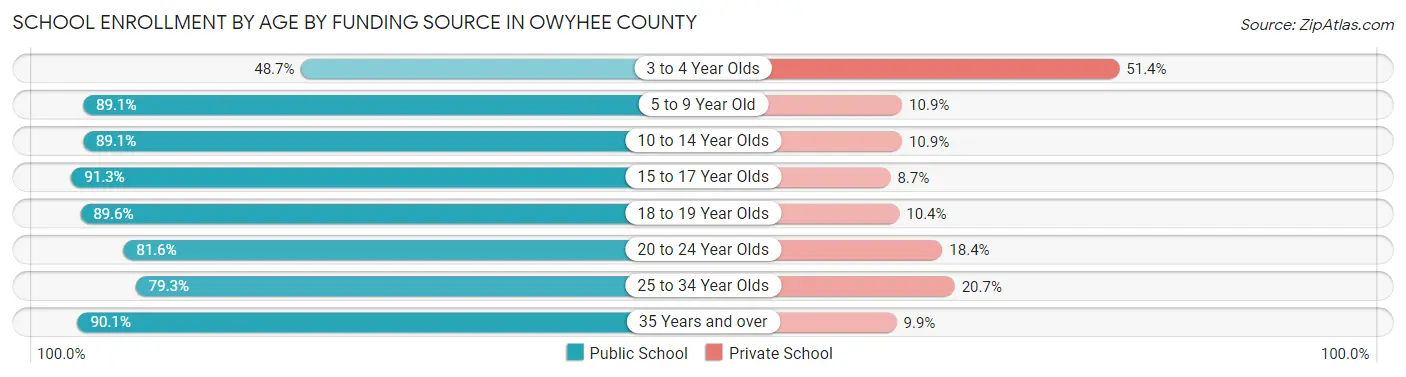
Out of a total of 2,604 students who are enrolled in schools in Owyhee County, 299 (11.5%) attend a private institution, while the remaining 2,305 (88.5%) are enrolled in public schools. The age group of 3 to 4 year olds has the highest likelihood of being enrolled in private schools, with 19 (51.3% in the age bracket) enrolled. Conversely, the age group of 15 to 17 year olds has the lowest likelihood of being enrolled in a private school, with 471 (91.3% in the age bracket) attending a public institution.
| Age Bracket | Public School | Private School |
| 3 to 4 Year Olds | 18 (48.6%) | 19 (51.3%) |
| 5 to 9 Year Old | 622 (89.1%) | 76 (10.9%) |
| 10 to 14 Year Olds | 804 (89.1%) | 98 (10.9%) |
| 15 to 17 Year Olds | 471 (91.3%) | 45 (8.7%) |
| 18 to 19 Year Olds | 121 (89.6%) | 14 (10.4%) |
| 20 to 24 Year Olds | 71 (81.6%) | 16 (18.4%) |
| 25 to 34 Year Olds | 69 (79.3%) | 18 (20.7%) |
| 35 Years and over | 128 (90.1%) | 14 (9.9%) |
| Total | 2,305 (88.5%) | 299 (11.5%) |
Educational Attainment by Field of Study in Owyhee County
Business (249 | 21.0%), education (213 | 17.9%), bio, nature & agricultural (182 | 15.3%), psychology (129 | 10.9%), and engineering (74 | 6.2%) are the most common fields of study among 1,187 individuals in Owyhee County who have obtained a bachelor's degree or higher.
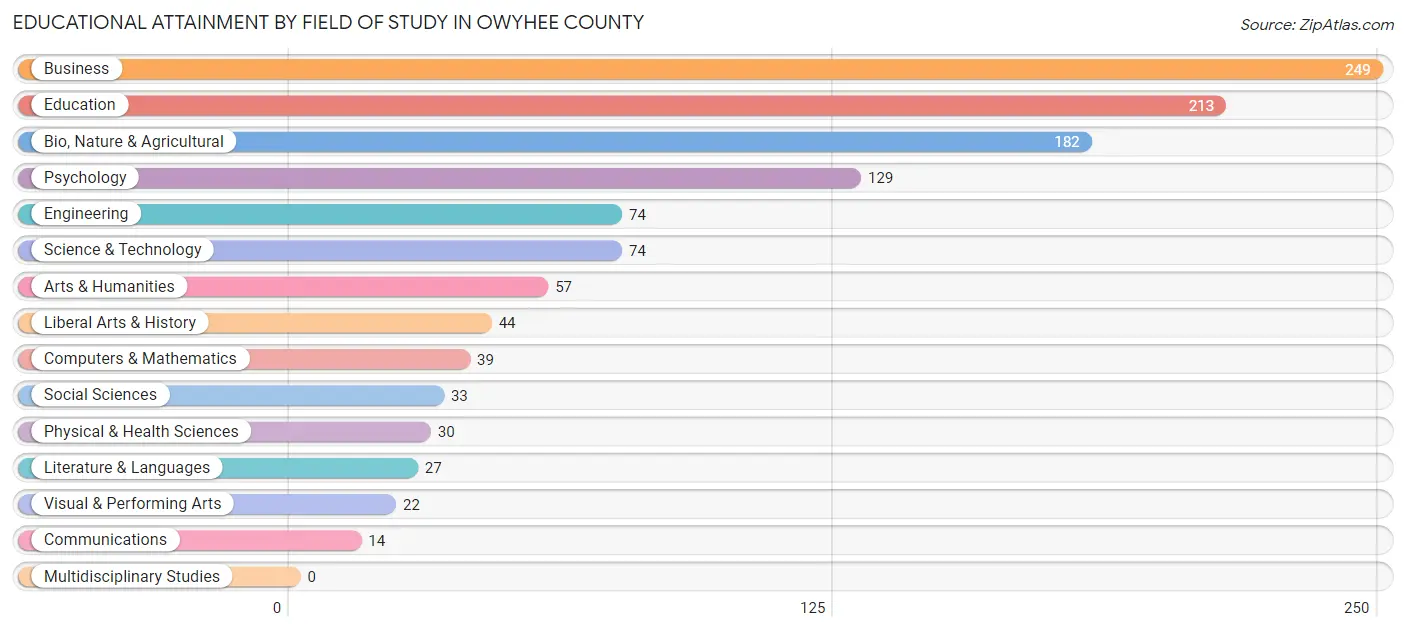
| Field of Study | # Graduates | % Graduates |
| Computers & Mathematics | 39 | 3.3% |
| Bio, Nature & Agricultural | 182 | 15.3% |
| Physical & Health Sciences | 30 | 2.5% |
| Psychology | 129 | 10.9% |
| Social Sciences | 33 | 2.8% |
| Engineering | 74 | 6.2% |
| Multidisciplinary Studies | 0 | 0.0% |
| Science & Technology | 74 | 6.2% |
| Business | 249 | 21.0% |
| Education | 213 | 17.9% |
| Literature & Languages | 27 | 2.3% |
| Liberal Arts & History | 44 | 3.7% |
| Visual & Performing Arts | 22 | 1.8% |
| Communications | 14 | 1.2% |
| Arts & Humanities | 57 | 4.8% |
| Total | 1,187 | 100.0% |
Transportation & Commute in Owyhee County
Vehicle Availability by Sex in Owyhee County
The most prevalent vehicle ownership categories in Owyhee County are males with 2 vehicles (897, accounting for 29.7%) and females with 2 vehicles (529, making up 41.3%).
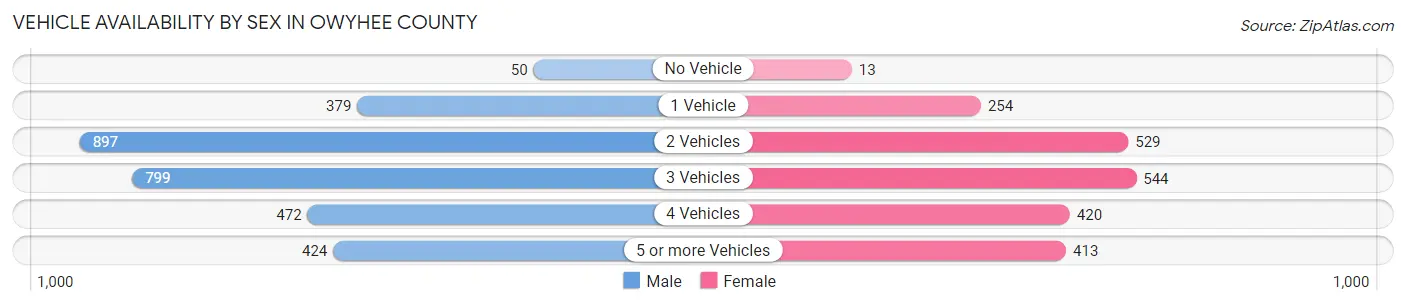
| Vehicles Available | Male | Female |
| No Vehicle | 50 (1.7%) | 13 (0.6%) |
| 1 Vehicle | 379 (12.6%) | 254 (11.7%) |
| 2 Vehicles | 897 (29.7%) | 529 (24.3%) |
| 3 Vehicles | 799 (26.5%) | 544 (25.0%) |
| 4 Vehicles | 472 (15.6%) | 420 (19.3%) |
| 5 or more Vehicles | 424 (14.0%) | 413 (19.0%) |
| Total | 3,021 (100.0%) | 2,173 (100.0%) |
Commute Time in Owyhee County
The most frequently occuring commute durations in Owyhee County are 5 to 9 minutes (681 commuters, 14.5%), 15 to 19 minutes (541 commuters, 11.5%), and 60 to 89 minutes (525 commuters, 11.2%).
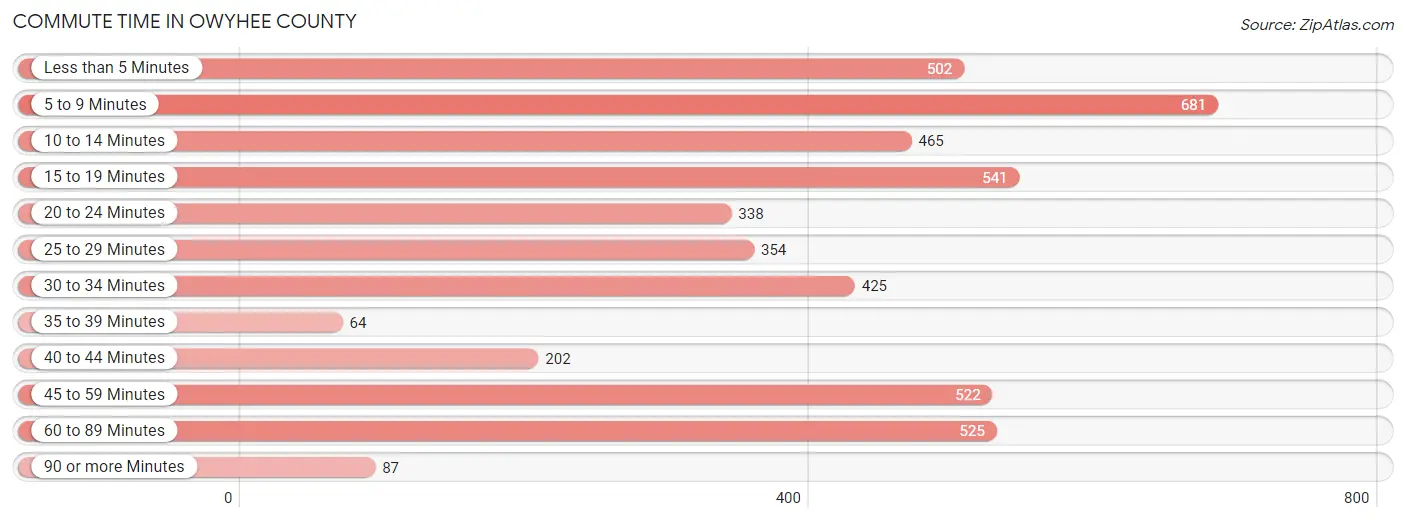
| Commute Time | # Commuters | % Commuters |
| Less than 5 Minutes | 502 | 10.7% |
| 5 to 9 Minutes | 681 | 14.5% |
| 10 to 14 Minutes | 465 | 9.9% |
| 15 to 19 Minutes | 541 | 11.5% |
| 20 to 24 Minutes | 338 | 7.2% |
| 25 to 29 Minutes | 354 | 7.5% |
| 30 to 34 Minutes | 425 | 9.0% |
| 35 to 39 Minutes | 64 | 1.4% |
| 40 to 44 Minutes | 202 | 4.3% |
| 45 to 59 Minutes | 522 | 11.1% |
| 60 to 89 Minutes | 525 | 11.2% |
| 90 or more Minutes | 87 | 1.8% |
Commute Time by Sex in Owyhee County
The most common commute times in Owyhee County are 15 to 19 minutes (423 commuters, 15.2%) for males and 5 to 9 minutes (354 commuters, 18.4%) for females.
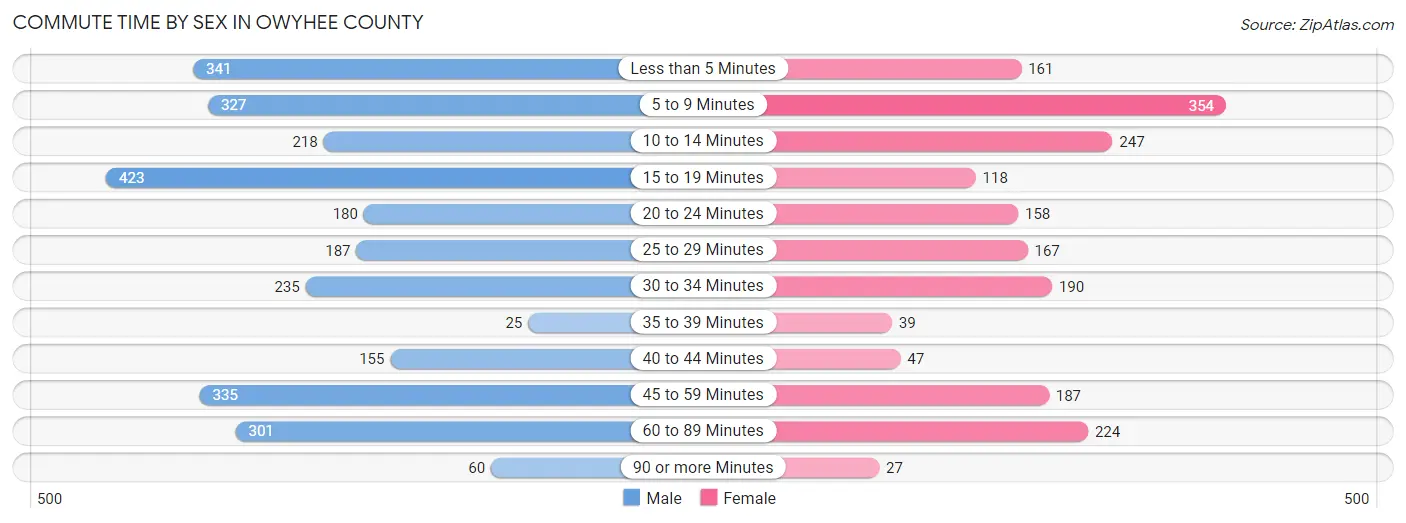
| Commute Time | Male | Female |
| Less than 5 Minutes | 341 (12.2%) | 161 (8.4%) |
| 5 to 9 Minutes | 327 (11.7%) | 354 (18.4%) |
| 10 to 14 Minutes | 218 (7.8%) | 247 (12.9%) |
| 15 to 19 Minutes | 423 (15.2%) | 118 (6.1%) |
| 20 to 24 Minutes | 180 (6.5%) | 158 (8.2%) |
| 25 to 29 Minutes | 187 (6.7%) | 167 (8.7%) |
| 30 to 34 Minutes | 235 (8.4%) | 190 (9.9%) |
| 35 to 39 Minutes | 25 (0.9%) | 39 (2.0%) |
| 40 to 44 Minutes | 155 (5.6%) | 47 (2.5%) |
| 45 to 59 Minutes | 335 (12.0%) | 187 (9.7%) |
| 60 to 89 Minutes | 301 (10.8%) | 224 (11.7%) |
| 90 or more Minutes | 60 (2.1%) | 27 (1.4%) |
Time of Departure to Work by Sex in Owyhee County
The most frequent times of departure to work in Owyhee County are 6:00 AM to 6:29 AM (580, 20.8%) for males and 7:00 AM to 7:29 AM (392, 20.4%) for females.
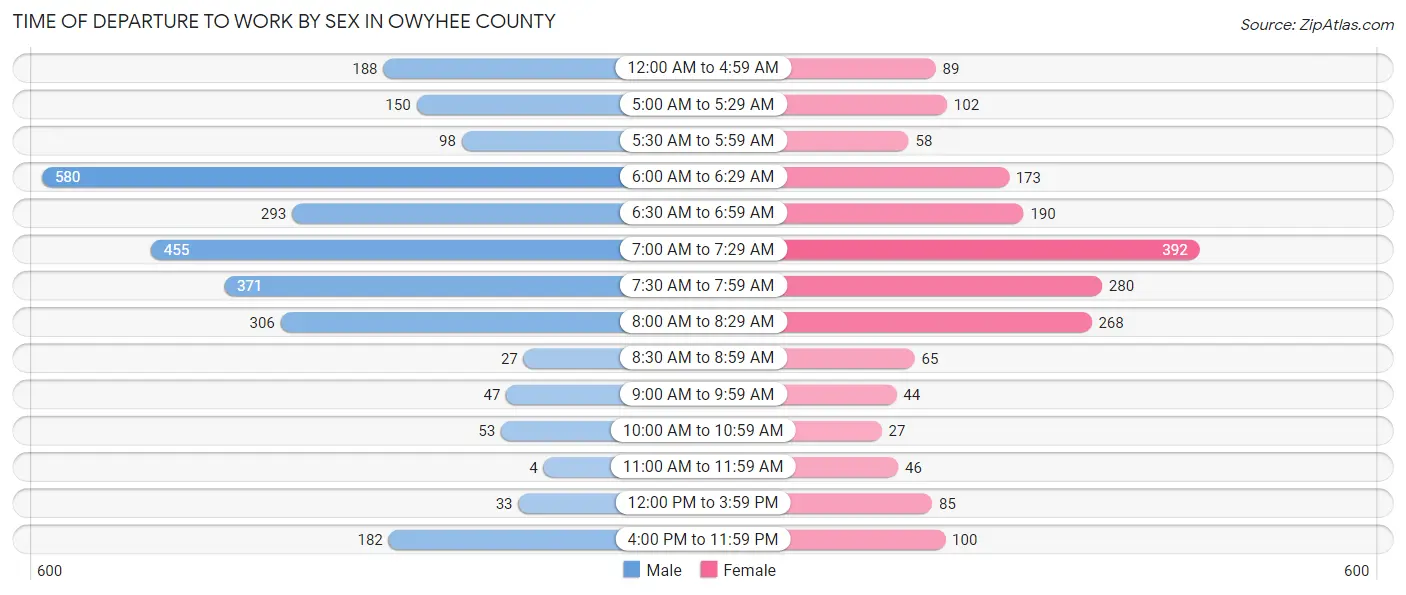
| Time of Departure | Male | Female |
| 12:00 AM to 4:59 AM | 188 (6.8%) | 89 (4.6%) |
| 5:00 AM to 5:29 AM | 150 (5.4%) | 102 (5.3%) |
| 5:30 AM to 5:59 AM | 98 (3.5%) | 58 (3.0%) |
| 6:00 AM to 6:29 AM | 580 (20.8%) | 173 (9.0%) |
| 6:30 AM to 6:59 AM | 293 (10.5%) | 190 (9.9%) |
| 7:00 AM to 7:29 AM | 455 (16.3%) | 392 (20.4%) |
| 7:30 AM to 7:59 AM | 371 (13.3%) | 280 (14.6%) |
| 8:00 AM to 8:29 AM | 306 (11.0%) | 268 (14.0%) |
| 8:30 AM to 8:59 AM | 27 (1.0%) | 65 (3.4%) |
| 9:00 AM to 9:59 AM | 47 (1.7%) | 44 (2.3%) |
| 10:00 AM to 10:59 AM | 53 (1.9%) | 27 (1.4%) |
| 11:00 AM to 11:59 AM | 4 (0.1%) | 46 (2.4%) |
| 12:00 PM to 3:59 PM | 33 (1.2%) | 85 (4.4%) |
| 4:00 PM to 11:59 PM | 182 (6.5%) | 100 (5.2%) |
| Total | 2,787 (100.0%) | 1,919 (100.0%) |
Housing Occupancy in Owyhee County
Occupancy by Ownership in Owyhee County
Of the total 4,227 dwellings in Owyhee County, owner-occupied units account for 3,005 (71.1%), while renter-occupied units make up 1,222 (28.9%).
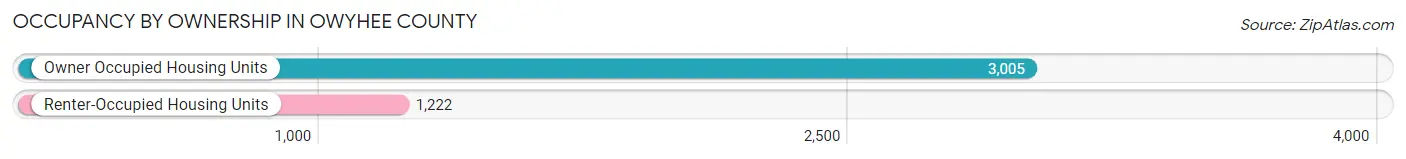
| Occupancy | # Housing Units | % Housing Units |
| Owner Occupied Housing Units | 3,005 | 71.1% |
| Renter-Occupied Housing Units | 1,222 | 28.9% |
| Total Occupied Housing Units | 4,227 | 100.0% |
Occupancy by Household Size in Owyhee County
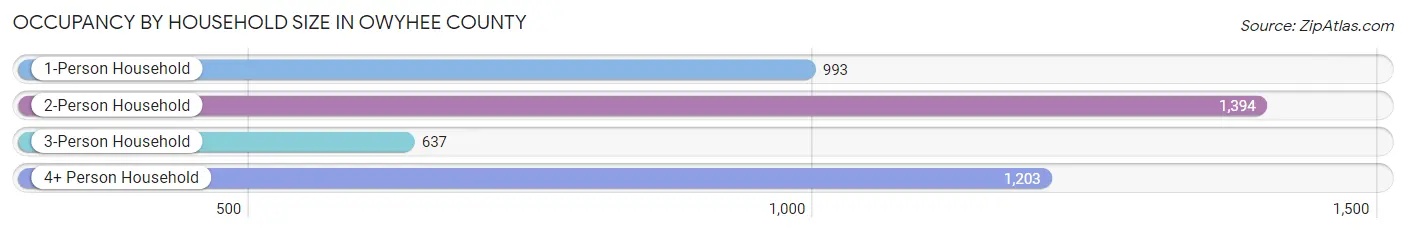
| Household Size | # Housing Units | % Housing Units |
| 1-Person Household | 993 | 23.5% |
| 2-Person Household | 1,394 | 33.0% |
| 3-Person Household | 637 | 15.1% |
| 4+ Person Household | 1,203 | 28.5% |
| Total Housing Units | 4,227 | 100.0% |
Occupancy by Ownership by Household Size in Owyhee County
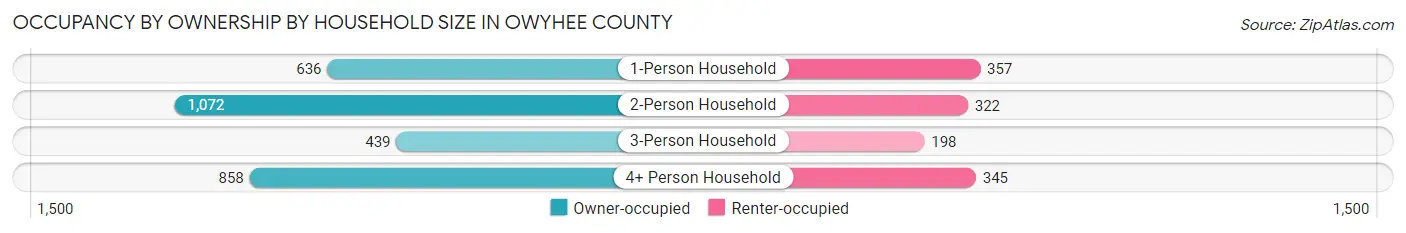
| Household Size | Owner-occupied | Renter-occupied |
| 1-Person Household | 636 (64.0%) | 357 (35.9%) |
| 2-Person Household | 1,072 (76.9%) | 322 (23.1%) |
| 3-Person Household | 439 (68.9%) | 198 (31.1%) |
| 4+ Person Household | 858 (71.3%) | 345 (28.7%) |
| Total Housing Units | 3,005 (71.1%) | 1,222 (28.9%) |
Occupancy by Educational Attainment in Owyhee County
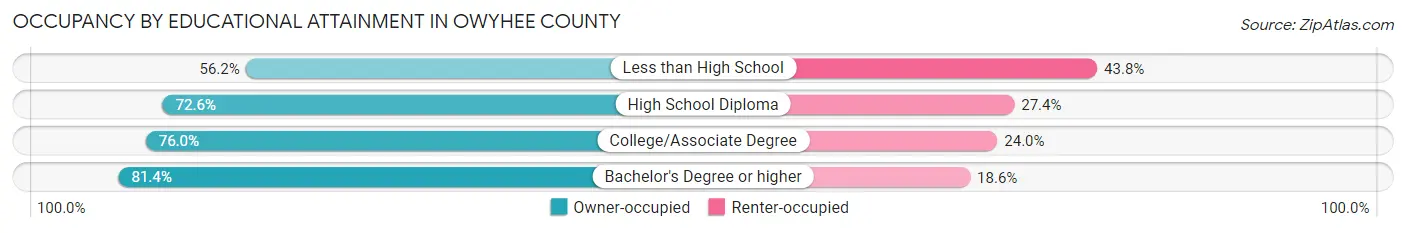
| Household Size | Owner-occupied | Renter-occupied |
| Less than High School | 545 (56.2%) | 425 (43.8%) |
| High School Diploma | 1,045 (72.6%) | 394 (27.4%) |
| College/Associate Degree | 904 (76.0%) | 286 (24.0%) |
| Bachelor's Degree or higher | 511 (81.4%) | 117 (18.6%) |
Occupancy by Age of Householder in Owyhee County
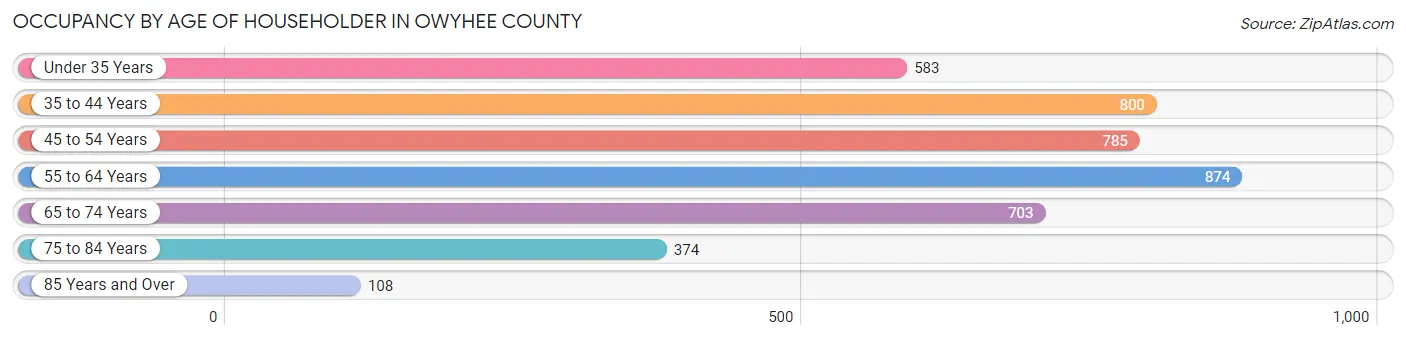
| Age Bracket | # Households | % Households |
| Under 35 Years | 583 | 13.8% |
| 35 to 44 Years | 800 | 18.9% |
| 45 to 54 Years | 785 | 18.6% |
| 55 to 64 Years | 874 | 20.7% |
| 65 to 74 Years | 703 | 16.6% |
| 75 to 84 Years | 374 | 8.8% |
| 85 Years and Over | 108 | 2.6% |
| Total | 4,227 | 100.0% |
Housing Finances in Owyhee County
Median Income by Occupancy in Owyhee County
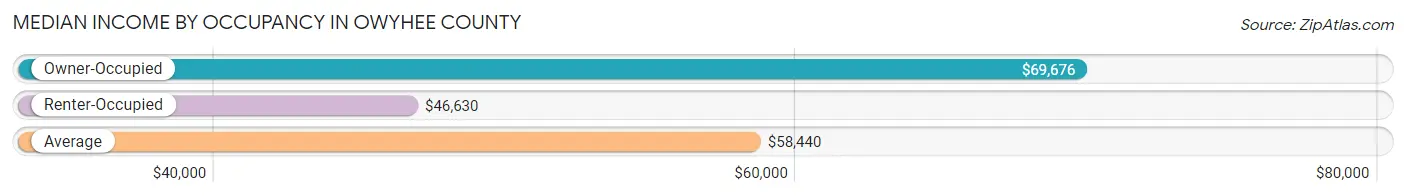
| Occupancy Type | # Households | Median Income |
| Owner-Occupied | 3,005 (71.1%) | $69,676 |
| Renter-Occupied | 1,222 (28.9%) | $46,630 |
| Average | 4,227 (100.0%) | $58,440 |
Occupancy by Householder Income Bracket in Owyhee County
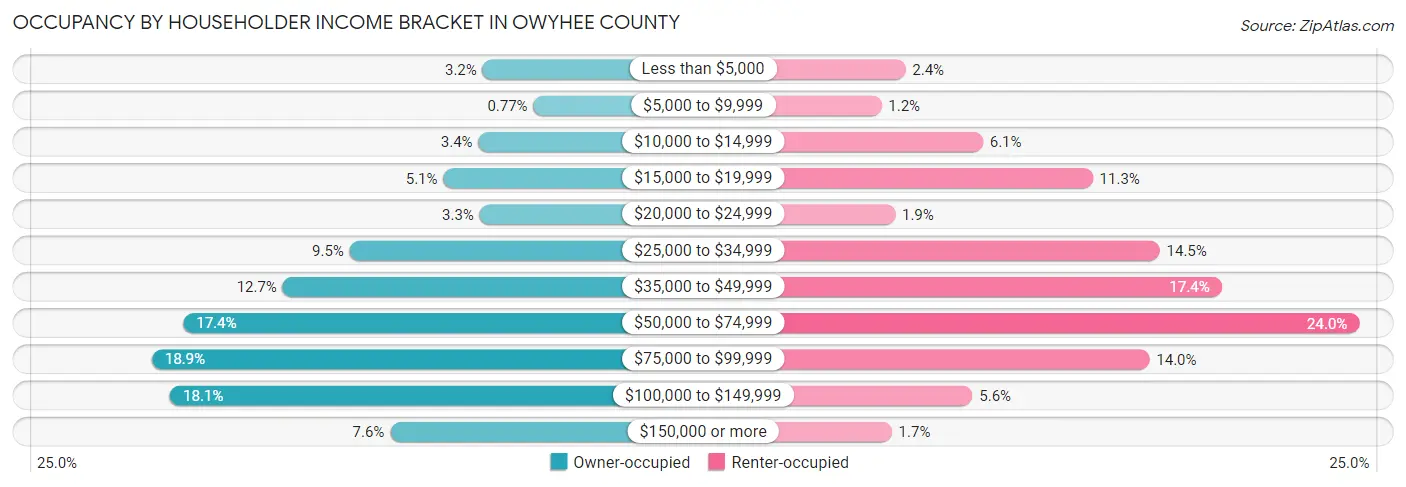
| Income Bracket | Owner-occupied | Renter-occupied |
| Less than $5,000 | 96 (3.2%) | 29 (2.4%) |
| $5,000 to $9,999 | 23 (0.8%) | 15 (1.2%) |
| $10,000 to $14,999 | 102 (3.4%) | 74 (6.1%) |
| $15,000 to $19,999 | 152 (5.1%) | 138 (11.3%) |
| $20,000 to $24,999 | 100 (3.3%) | 23 (1.9%) |
| $25,000 to $34,999 | 286 (9.5%) | 177 (14.5%) |
| $35,000 to $49,999 | 382 (12.7%) | 213 (17.4%) |
| $50,000 to $74,999 | 524 (17.4%) | 293 (24.0%) |
| $75,000 to $99,999 | 569 (18.9%) | 171 (14.0%) |
| $100,000 to $149,999 | 543 (18.1%) | 68 (5.6%) |
| $150,000 or more | 228 (7.6%) | 21 (1.7%) |
| Total | 3,005 (100.0%) | 1,222 (100.0%) |
Monthly Housing Cost Tiers in Owyhee County
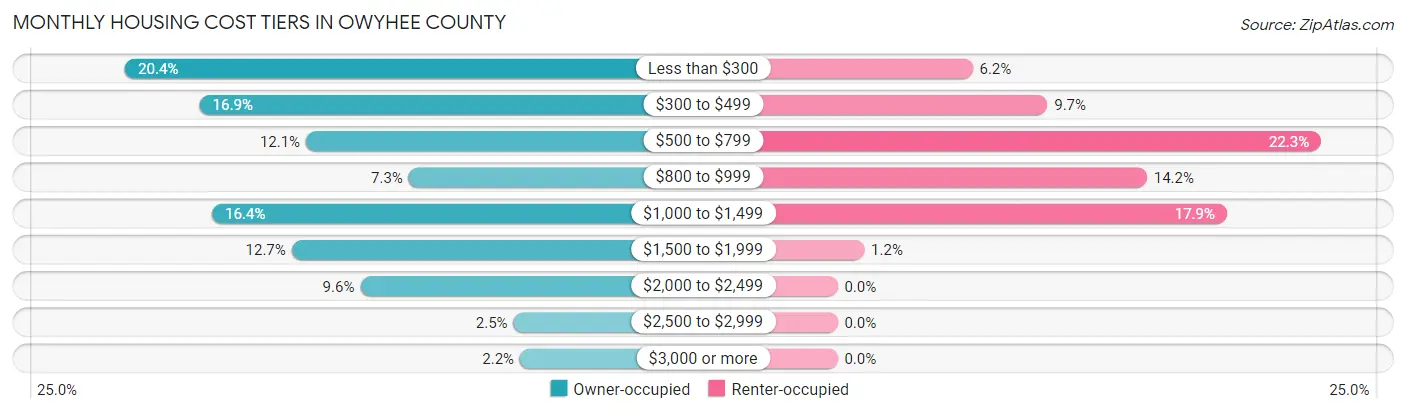
| Monthly Cost | Owner-occupied | Renter-occupied |
| Less than $300 | 612 (20.4%) | 76 (6.2%) |
| $300 to $499 | 509 (16.9%) | 118 (9.7%) |
| $500 to $799 | 362 (12.0%) | 272 (22.3%) |
| $800 to $999 | 220 (7.3%) | 174 (14.2%) |
| $1,000 to $1,499 | 492 (16.4%) | 219 (17.9%) |
| $1,500 to $1,999 | 382 (12.7%) | 15 (1.2%) |
| $2,000 to $2,499 | 287 (9.6%) | 0 (0.0%) |
| $2,500 to $2,999 | 75 (2.5%) | 0 (0.0%) |
| $3,000 or more | 66 (2.2%) | 0 (0.0%) |
| Total | 3,005 (100.0%) | 1,222 (100.0%) |
Physical Housing Characteristics in Owyhee County
Housing Structures in Owyhee County
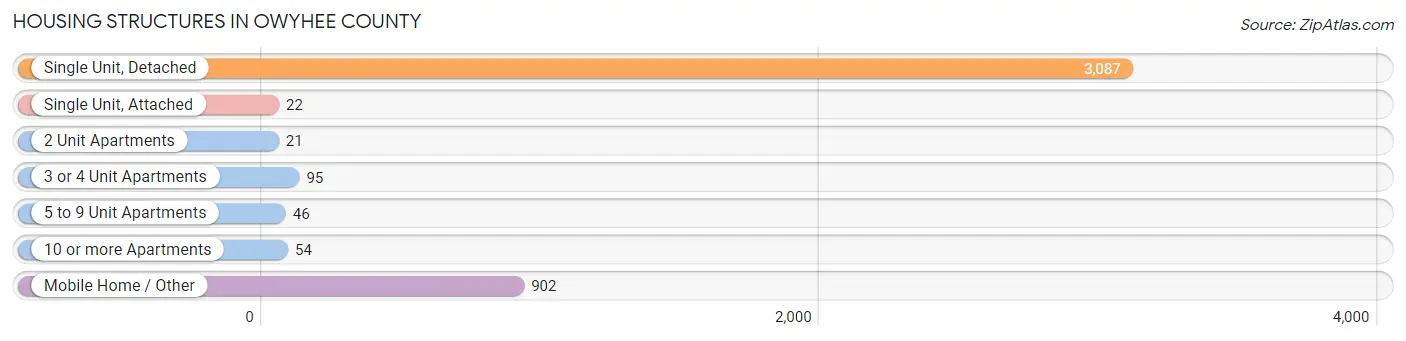
| Structure Type | # Housing Units | % Housing Units |
| Single Unit, Detached | 3,087 | 73.0% |
| Single Unit, Attached | 22 | 0.5% |
| 2 Unit Apartments | 21 | 0.5% |
| 3 or 4 Unit Apartments | 95 | 2.2% |
| 5 to 9 Unit Apartments | 46 | 1.1% |
| 10 or more Apartments | 54 | 1.3% |
| Mobile Home / Other | 902 | 21.3% |
| Total | 4,227 | 100.0% |
Housing Structures by Occupancy in Owyhee County
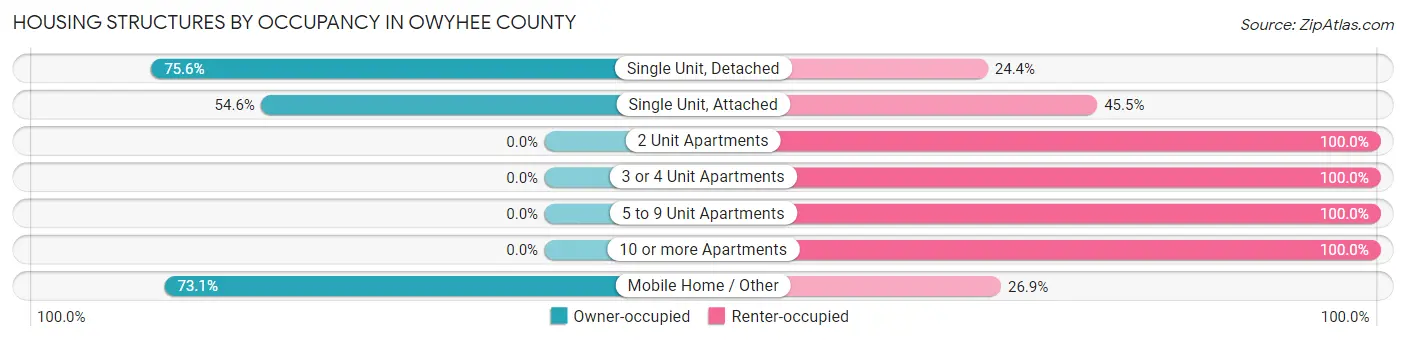
| Structure Type | Owner-occupied | Renter-occupied |
| Single Unit, Detached | 2,334 (75.6%) | 753 (24.4%) |
| Single Unit, Attached | 12 (54.5%) | 10 (45.5%) |
| 2 Unit Apartments | 0 (0.0%) | 21 (100.0%) |
| 3 or 4 Unit Apartments | 0 (0.0%) | 95 (100.0%) |
| 5 to 9 Unit Apartments | 0 (0.0%) | 46 (100.0%) |
| 10 or more Apartments | 0 (0.0%) | 54 (100.0%) |
| Mobile Home / Other | 659 (73.1%) | 243 (26.9%) |
| Total | 3,005 (71.1%) | 1,222 (28.9%) |
Housing Structures by Number of Rooms in Owyhee County
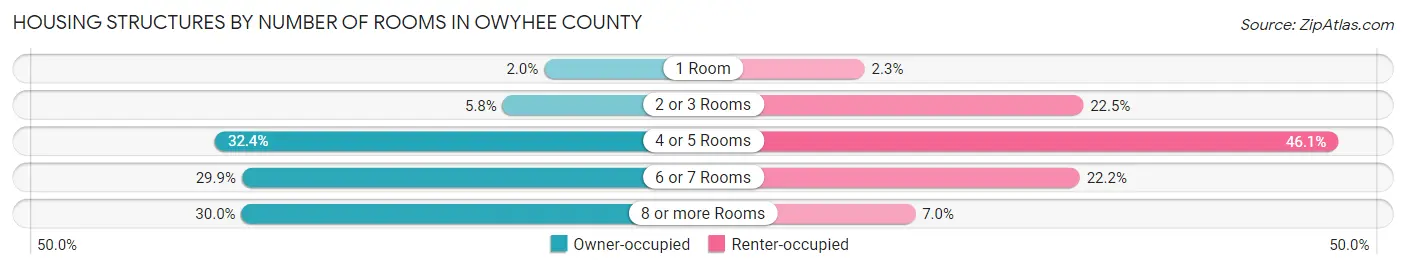
| Number of Rooms | Owner-occupied | Renter-occupied |
| 1 Room | 59 (2.0%) | 28 (2.3%) |
| 2 or 3 Rooms | 174 (5.8%) | 275 (22.5%) |
| 4 or 5 Rooms | 973 (32.4%) | 563 (46.1%) |
| 6 or 7 Rooms | 899 (29.9%) | 271 (22.2%) |
| 8 or more Rooms | 900 (29.9%) | 85 (7.0%) |
| Total | 3,005 (100.0%) | 1,222 (100.0%) |
Housing Structure by Heating Type in Owyhee County
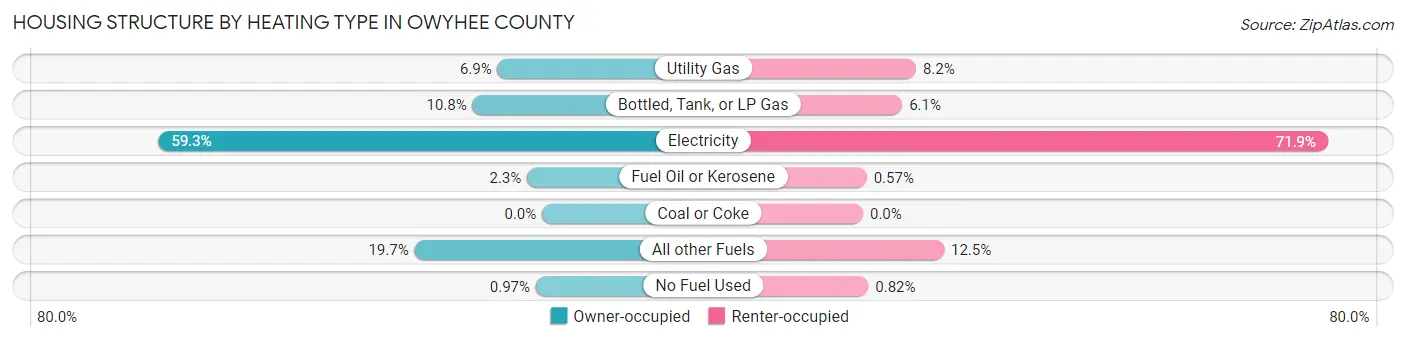
| Heating Type | Owner-occupied | Renter-occupied |
| Utility Gas | 207 (6.9%) | 100 (8.2%) |
| Bottled, Tank, or LP Gas | 323 (10.7%) | 74 (6.1%) |
| Electricity | 1,783 (59.3%) | 878 (71.9%) |
| Fuel Oil or Kerosene | 70 (2.3%) | 7 (0.6%) |
| Coal or Coke | 0 (0.0%) | 0 (0.0%) |
| All other Fuels | 593 (19.7%) | 153 (12.5%) |
| No Fuel Used | 29 (1.0%) | 10 (0.8%) |
| Total | 3,005 (100.0%) | 1,222 (100.0%) |
Household Vehicle Usage in Owyhee County
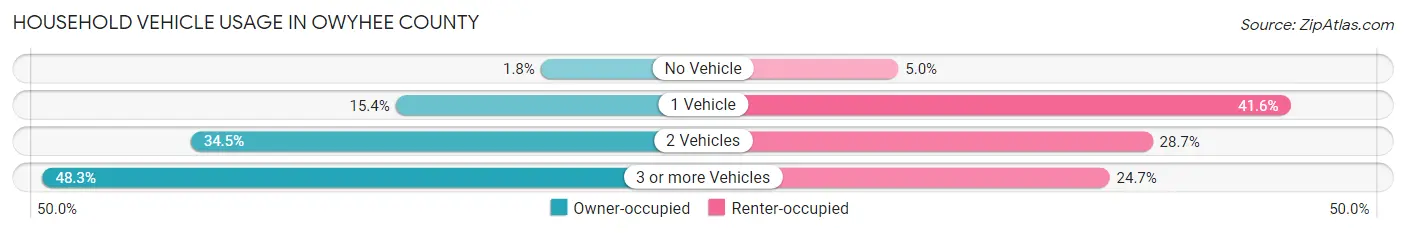
| Vehicles per Household | Owner-occupied | Renter-occupied |
| No Vehicle | 55 (1.8%) | 61 (5.0%) |
| 1 Vehicle | 462 (15.4%) | 508 (41.6%) |
| 2 Vehicles | 1,036 (34.5%) | 351 (28.7%) |
| 3 or more Vehicles | 1,452 (48.3%) | 302 (24.7%) |
| Total | 3,005 (100.0%) | 1,222 (100.0%) |
Real Estate & Mortgages in Owyhee County
Real Estate and Mortgage Overview in Owyhee County
| Characteristic | Without Mortgage | With Mortgage |
| Housing Units | 1,389 | 1,616 |
| Median Property Value | $189,000 | $307,200 |
| Median Household Income | $46,461 | $119 |
| Monthly Housing Costs | $355 | $66 |
| Real Estate Taxes | $1,025 | $60 |
Property Value by Mortgage Status in Owyhee County
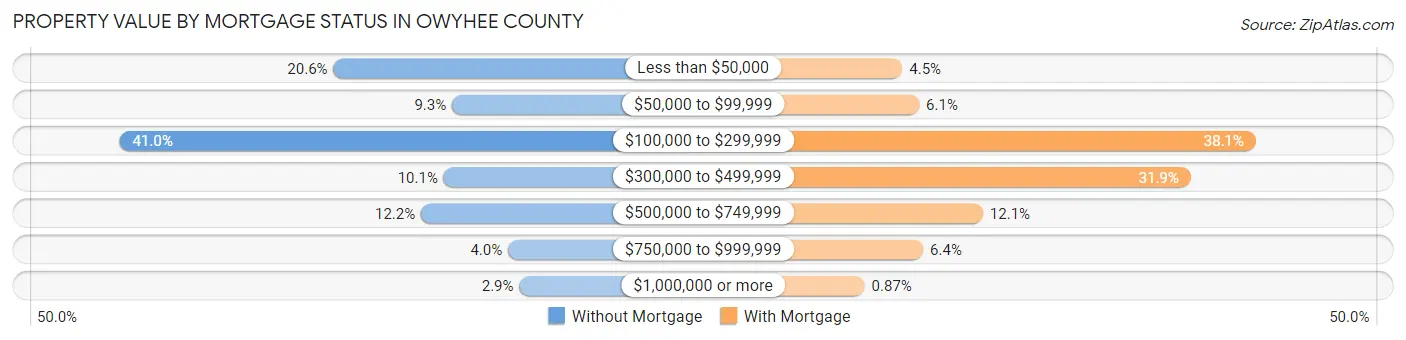
| Property Value | Without Mortgage | With Mortgage |
| Less than $50,000 | 286 (20.6%) | 72 (4.5%) |
| $50,000 to $99,999 | 129 (9.3%) | 98 (6.1%) |
| $100,000 to $299,999 | 569 (41.0%) | 616 (38.1%) |
| $300,000 to $499,999 | 140 (10.1%) | 516 (31.9%) |
| $500,000 to $749,999 | 170 (12.2%) | 196 (12.1%) |
| $750,000 to $999,999 | 55 (4.0%) | 104 (6.4%) |
| $1,000,000 or more | 40 (2.9%) | 14 (0.9%) |
| Total | 1,389 (100.0%) | 1,616 (100.0%) |
Household Income by Mortgage Status in Owyhee County
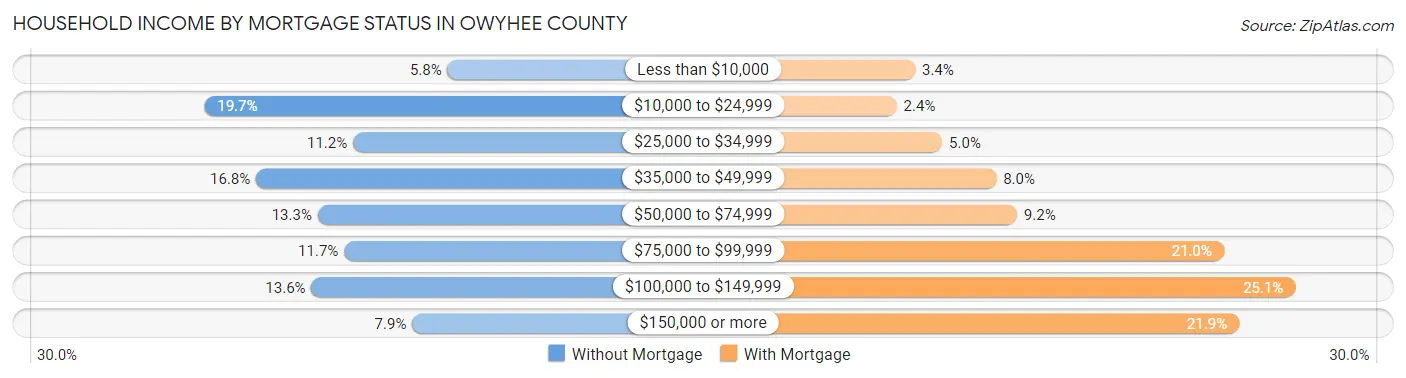
| Household Income | Without Mortgage | With Mortgage |
| Less than $10,000 | 81 (5.8%) | 55 (3.4%) |
| $10,000 to $24,999 | 274 (19.7%) | 38 (2.4%) |
| $25,000 to $34,999 | 156 (11.2%) | 80 (5.0%) |
| $35,000 to $49,999 | 233 (16.8%) | 130 (8.0%) |
| $50,000 to $74,999 | 184 (13.3%) | 149 (9.2%) |
| $75,000 to $99,999 | 163 (11.7%) | 340 (21.0%) |
| $100,000 to $149,999 | 189 (13.6%) | 406 (25.1%) |
| $150,000 or more | 109 (7.9%) | 354 (21.9%) |
| Total | 1,389 (100.0%) | 1,616 (100.0%) |
Property Value to Household Income Ratio in Owyhee County
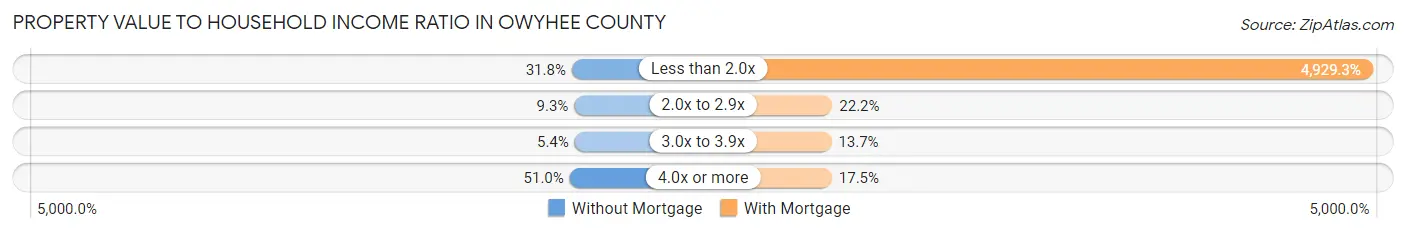
| Value-to-Income Ratio | Without Mortgage | With Mortgage |
| Less than 2.0x | 441 (31.8%) | 79,657 (4,929.3%) |
| 2.0x to 2.9x | 129 (9.3%) | 359 (22.2%) |
| 3.0x to 3.9x | 75 (5.4%) | 221 (13.7%) |
| 4.0x or more | 708 (51.0%) | 283 (17.5%) |
| Total | 1,389 (100.0%) | 1,616 (100.0%) |
Real Estate Taxes by Mortgage Status in Owyhee County
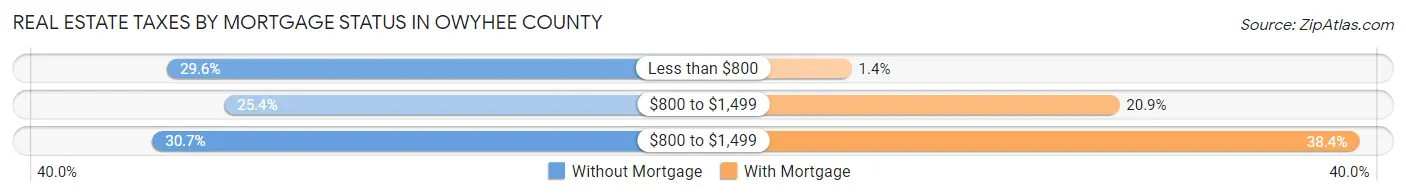
| Property Taxes | Without Mortgage | With Mortgage |
| Less than $800 | 411 (29.6%) | 22 (1.4%) |
| $800 to $1,499 | 353 (25.4%) | 338 (20.9%) |
| $800 to $1,499 | 426 (30.7%) | 621 (38.4%) |
| Total | 1,389 (100.0%) | 1,616 (100.0%) |
Health & Disability in Owyhee County
Health Insurance Coverage by Age in Owyhee County
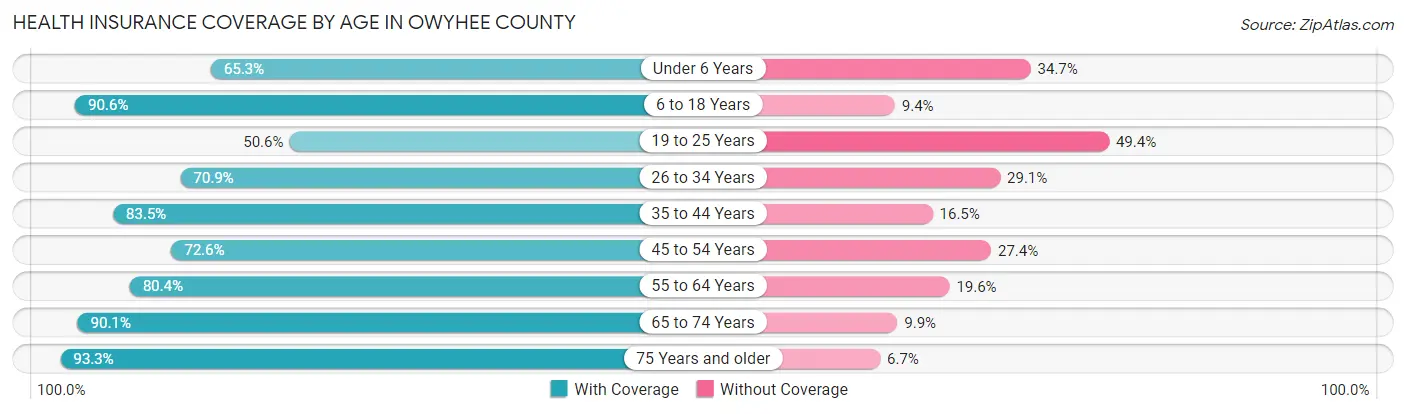
| Age Bracket | With Coverage | Without Coverage |
| Under 6 Years | 573 (65.3%) | 305 (34.7%) |
| 6 to 18 Years | 2,116 (90.6%) | 220 (9.4%) |
| 19 to 25 Years | 474 (50.6%) | 462 (49.4%) |
| 26 to 34 Years | 825 (70.9%) | 338 (29.1%) |
| 35 to 44 Years | 1,217 (83.5%) | 240 (16.5%) |
| 45 to 54 Years | 1,019 (72.6%) | 384 (27.4%) |
| 55 to 64 Years | 1,267 (80.4%) | 309 (19.6%) |
| 65 to 74 Years | 1,193 (90.1%) | 131 (9.9%) |
| 75 Years and older | 784 (93.3%) | 56 (6.7%) |
| Total | 9,468 (79.5%) | 2,445 (20.5%) |
Health Insurance Coverage by Citizenship Status in Owyhee County

| Citizenship Status | With Coverage | Without Coverage |
| Native Born | 573 (65.3%) | 305 (34.7%) |
| Foreign Born, Citizen | 2,116 (90.6%) | 220 (9.4%) |
| Foreign Born, not a Citizen | 474 (50.6%) | 462 (49.4%) |
Health Insurance Coverage by Household Income in Owyhee County
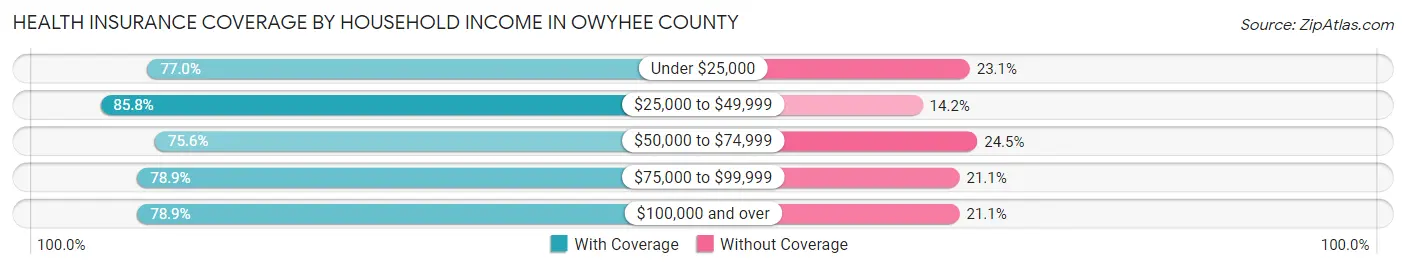
| Household Income | With Coverage | Without Coverage |
| Under $25,000 | 1,068 (76.9%) | 320 (23.1%) |
| $25,000 to $49,999 | 2,288 (85.8%) | 379 (14.2%) |
| $50,000 to $74,999 | 1,727 (75.5%) | 559 (24.4%) |
| $75,000 to $99,999 | 1,844 (78.9%) | 494 (21.1%) |
| $100,000 and over | 2,528 (78.9%) | 677 (21.1%) |
Public vs Private Health Insurance Coverage by Age in Owyhee County
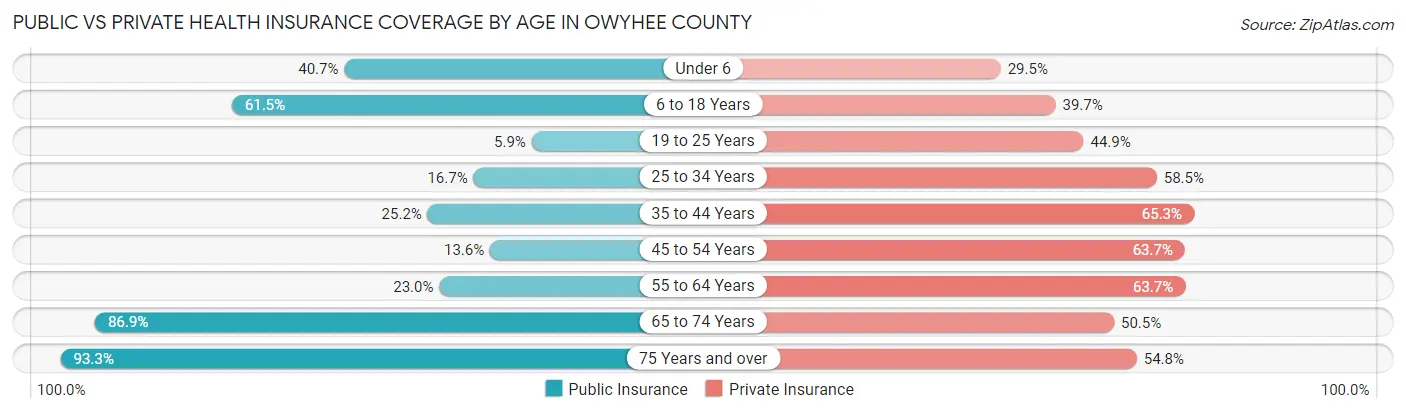
| Age Bracket | Public Insurance | Private Insurance |
| Under 6 | 357 (40.7%) | 259 (29.5%) |
| 6 to 18 Years | 1,437 (61.5%) | 927 (39.7%) |
| 19 to 25 Years | 55 (5.9%) | 420 (44.9%) |
| 25 to 34 Years | 194 (16.7%) | 680 (58.5%) |
| 35 to 44 Years | 367 (25.2%) | 952 (65.3%) |
| 45 to 54 Years | 191 (13.6%) | 893 (63.6%) |
| 55 to 64 Years | 363 (23.0%) | 1,004 (63.7%) |
| 65 to 74 Years | 1,151 (86.9%) | 669 (50.5%) |
| 75 Years and over | 784 (93.3%) | 460 (54.8%) |
| Total | 4,899 (41.1%) | 6,264 (52.6%) |
Disability Status by Sex by Age in Owyhee County
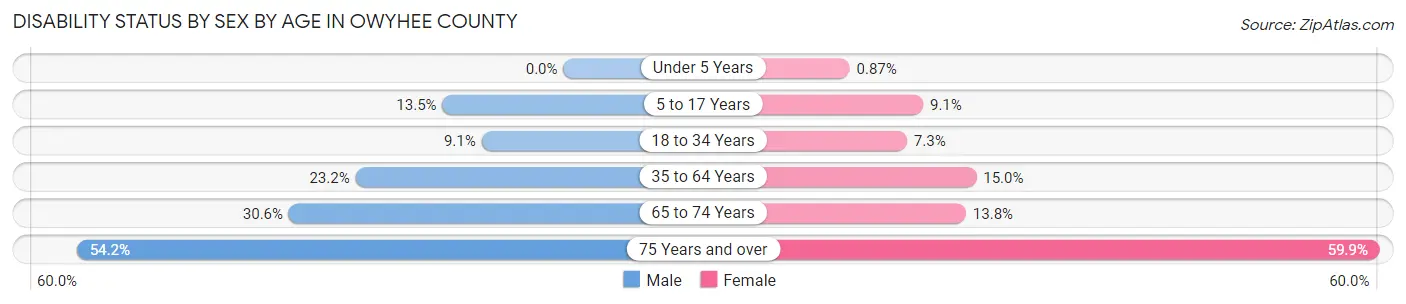
| Age Bracket | Male | Female |
| Under 5 Years | 0 (0.0%) | 3 (0.9%) |
| 5 to 17 Years | 160 (13.5%) | 95 (9.0%) |
| 18 to 34 Years | 107 (9.1%) | 83 (7.2%) |
| 35 to 64 Years | 537 (23.2%) | 317 (15.0%) |
| 65 to 74 Years | 199 (30.6%) | 93 (13.8%) |
| 75 Years and over | 220 (54.2%) | 260 (59.9%) |
Disability Class by Sex by Age in Owyhee County
Disability Class: Hearing Difficulty
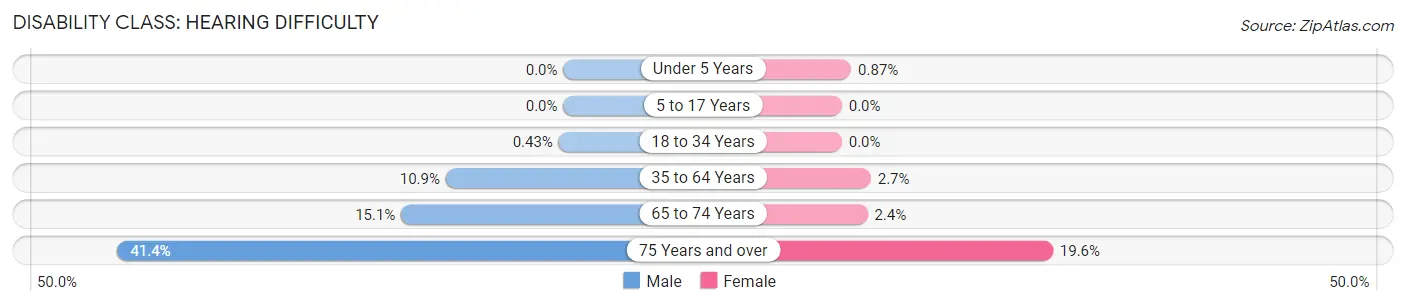
| Age Bracket | Male | Female |
| Under 5 Years | 0 (0.0%) | 3 (0.9%) |
| 5 to 17 Years | 0 (0.0%) | 0 (0.0%) |
| 18 to 34 Years | 5 (0.4%) | 0 (0.0%) |
| 35 to 64 Years | 253 (10.9%) | 57 (2.7%) |
| 65 to 74 Years | 98 (15.0%) | 16 (2.4%) |
| 75 Years and over | 168 (41.4%) | 85 (19.6%) |
Disability Class: Vision Difficulty
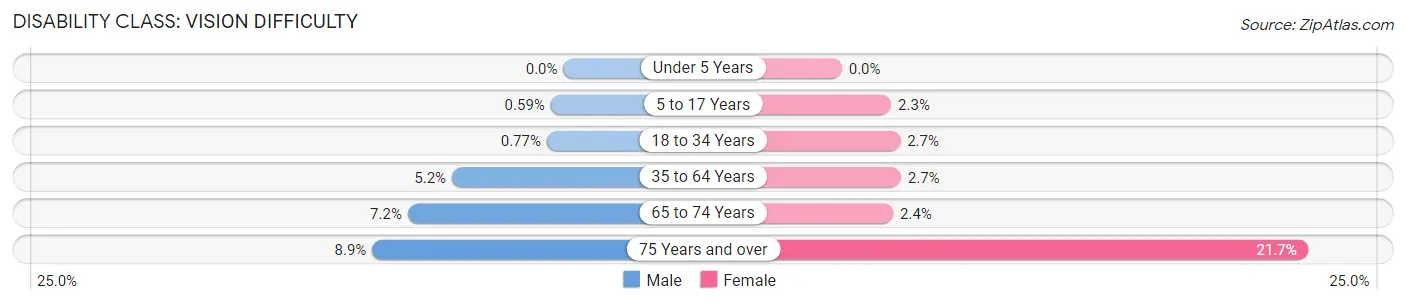
| Age Bracket | Male | Female |
| Under 5 Years | 0 (0.0%) | 0 (0.0%) |
| 5 to 17 Years | 7 (0.6%) | 24 (2.3%) |
| 18 to 34 Years | 9 (0.8%) | 31 (2.7%) |
| 35 to 64 Years | 120 (5.2%) | 58 (2.7%) |
| 65 to 74 Years | 47 (7.2%) | 16 (2.4%) |
| 75 Years and over | 36 (8.9%) | 94 (21.7%) |
Disability Class: Cognitive Difficulty
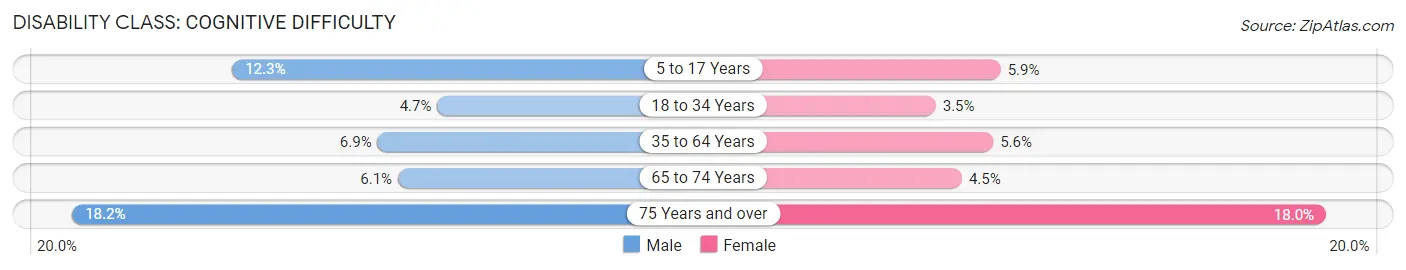
| Age Bracket | Male | Female |
| 5 to 17 Years | 146 (12.3%) | 62 (5.9%) |
| 18 to 34 Years | 55 (4.7%) | 40 (3.5%) |
| 35 to 64 Years | 160 (6.9%) | 119 (5.6%) |
| 65 to 74 Years | 40 (6.1%) | 30 (4.5%) |
| 75 Years and over | 74 (18.2%) | 78 (18.0%) |
Disability Class: Ambulatory Difficulty
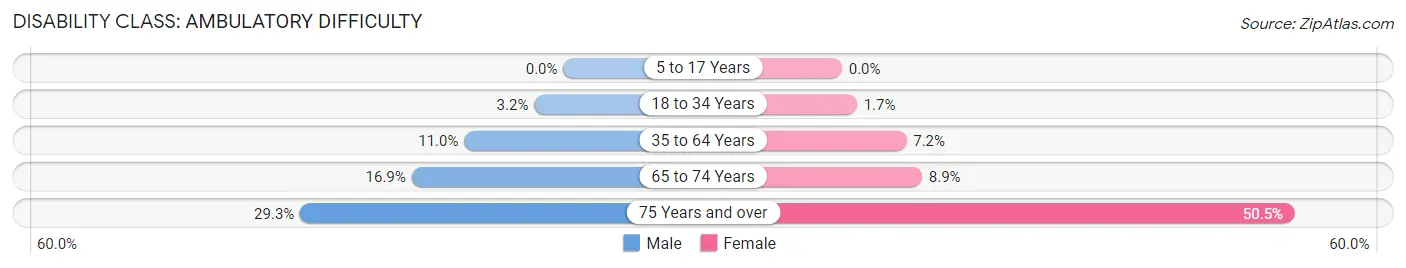
| Age Bracket | Male | Female |
| 5 to 17 Years | 0 (0.0%) | 0 (0.0%) |
| 18 to 34 Years | 38 (3.2%) | 19 (1.7%) |
| 35 to 64 Years | 256 (11.0%) | 152 (7.2%) |
| 65 to 74 Years | 110 (16.9%) | 60 (8.9%) |
| 75 Years and over | 119 (29.3%) | 219 (50.5%) |
Disability Class: Self-Care Difficulty
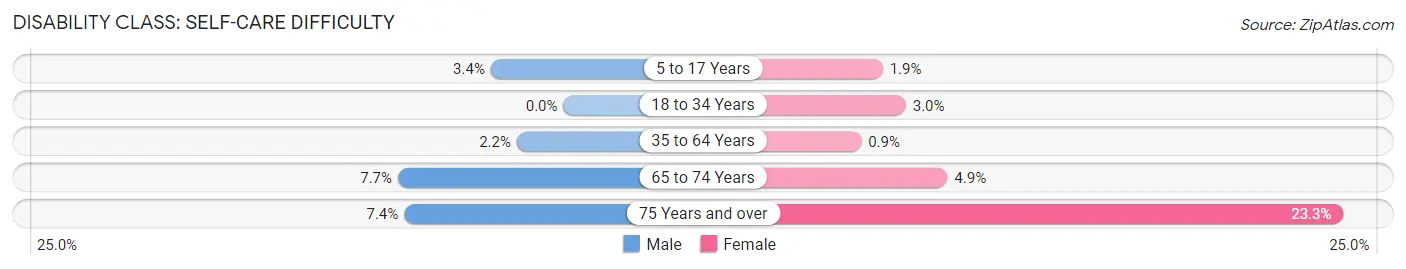
| Age Bracket | Male | Female |
| 5 to 17 Years | 40 (3.4%) | 20 (1.9%) |
| 18 to 34 Years | 0 (0.0%) | 34 (3.0%) |
| 35 to 64 Years | 50 (2.2%) | 19 (0.9%) |
| 65 to 74 Years | 50 (7.7%) | 33 (4.9%) |
| 75 Years and over | 30 (7.4%) | 101 (23.3%) |
Technology Access in Owyhee County
Computing Device Access in Owyhee County
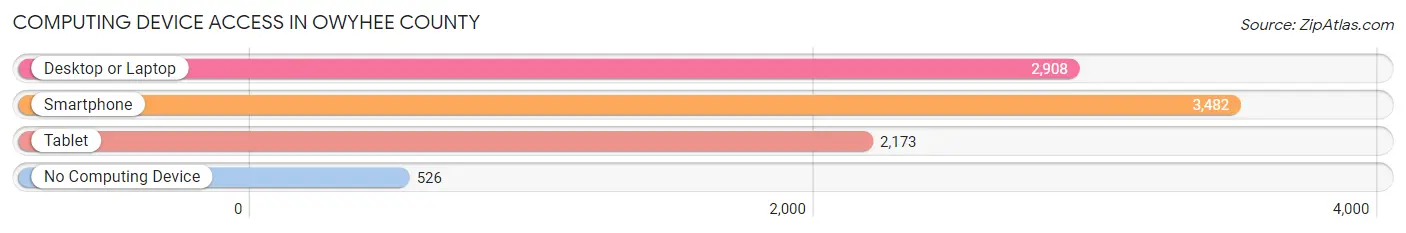
| Device Type | # Households | % Households |
| Desktop or Laptop | 2,908 | 68.8% |
| Smartphone | 3,482 | 82.4% |
| Tablet | 2,173 | 51.4% |
| No Computing Device | 526 | 12.4% |
| Total | 4,227 | 100.0% |
Internet Access in Owyhee County
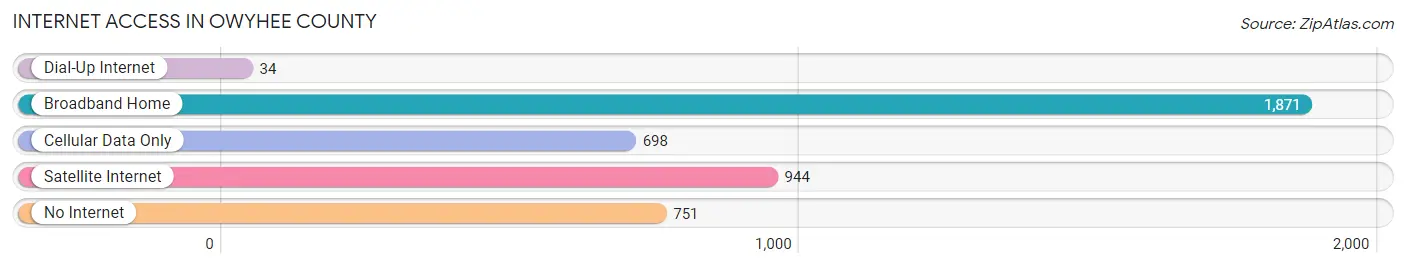
| Internet Type | # Households | % Households |
| Dial-Up Internet | 34 | 0.8% |
| Broadband Home | 1,871 | 44.3% |
| Cellular Data Only | 698 | 16.5% |
| Satellite Internet | 944 | 22.3% |
| No Internet | 751 | 17.8% |
| Total | 4,227 | 100.0% |
Owyhee County Summary
Owyhee County is located in the southwestern corner of Idaho, and is the second largest county in the state. It is bordered by Nevada to the south, Oregon to the west, and Elmore and Twin Falls counties to the north and east. The county seat is Murphy, and the largest city is Homedale. The county was named after the Owyhee River, which was named after three Hawaiian fur trappers who were part of an expedition in the area in the early 1800s.
Geography
Owyhee County covers an area of 5,856 square miles, making it the second largest county in Idaho. The terrain is mostly rugged and mountainous, with the Owyhee Mountains to the east and the Snake River Plain to the west. The highest point in the county is the summit of Pilot Peak, which rises to an elevation of 8,919 feet. The county is home to several rivers, including the Owyhee, Bruneau, and Snake rivers. The county also contains several reservoirs, including Anderson Ranch Reservoir, Lake Walcott, and Lake Lowell.
The climate of Owyhee County is semi-arid, with hot summers and cold winters. The average annual precipitation is around 10 inches, with most of it falling in the winter months.
Economy
The economy of Owyhee County is largely based on agriculture and ranching. The county is home to several large cattle ranches, and the area is known for its production of hay, wheat, and potatoes. Mining is also an important part of the economy, with gold, silver, and copper being mined in the area.
The county is also home to several manufacturing companies, including a potato processing plant and a wood products plant. Tourism is also an important part of the economy, with visitors coming to the area to enjoy the outdoor recreation opportunities, such as fishing, hunting, and camping.
Demographics
As of the 2010 census, there were 11,526 people, 4,541 households, and 3,092 families living in Owyhee County. The population density was 2 people per square mile. The racial makeup of the county was 90.3% White, 0.4% African American, 1.2% Native American, 0.3% Asian, 0.1% Pacific Islander, 5.2% from other races, and 2.5% from two or more races. Hispanic or Latino of any race were 11.3% of the population.
The median income for a household in the county was $35,938, and the median income for a family was $41,944. The per capita income for the county was $17,845. About 16.2% of families and 20.2% of the population were below the poverty line, including 28.2% of those under age 18 and 8.7% of those age 65 or over.
Overall, Owyhee County is a rural area with a strong agricultural and ranching economy. The county is home to a diverse population, and offers a variety of outdoor recreation opportunities. The county is also home to several manufacturing companies, and is a popular tourist destination.
Common Questions
What is Per Capita Income in Owyhee County?
Per Capita income in Owyhee County is $25,106.
What is the Median Family Income in Owyhee County?
Median Family Income in Owyhee County is $69,387.
What is the Median Household income in Owyhee County?
Median Household Income in Owyhee County is $58,440.
What is Income or Wage Gap in Owyhee County?
Income or Wage Gap in Owyhee County is 53.4%.
Women in Owyhee County earn 46.6 cents for every dollar earned by a man.
What is Family Income Deficit in Owyhee County?
Family Income Deficit in Owyhee County is $14,639.
Families that are below poverty line in Owyhee County earn $14,639 less on average than the poverty threshold level.
What is Inequality or Gini Index in Owyhee County?
Inequality or Gini Index in Owyhee County is 0.39.
What is the Total Population of Owyhee County?
Total Population of Owyhee County is 12,043.
What is the Total Male Population of Owyhee County?
Total Male Population of Owyhee County is 6,238.
What is the Total Female Population of Owyhee County?
Total Female Population of Owyhee County is 5,805.
What is the Ratio of Males per 100 Females in Owyhee County?
There are 107.46 Males per 100 Females in Owyhee County.
What is the Ratio of Females per 100 Males in Owyhee County?
There are 93.06 Females per 100 Males in Owyhee County.
What is the Median Population Age in Owyhee County?
Median Population Age in Owyhee County is 38.9 Years.
What is the Average Family Size in Owyhee County
Average Family Size in Owyhee County is 3.4 People.
What is the Average Household Size in Owyhee County
Average Household Size in Owyhee County is 2.8 People.
How Large is the Labor Force in Owyhee County?
There are 5,474 People in the Labor Forcein in Owyhee County.
What is the Percentage of People in the Labor Force in Owyhee County?
58.4% of People are in the Labor Force in Owyhee County.
What is the Unemployment Rate in Owyhee County?
Unemployment Rate in Owyhee County is 2.2%.