Jerome, ID Map & Demographics
Jerome Map
Jerome Overview
$26,133
PER CAPITA INCOME
$63,667
AVG FAMILY INCOME
$59,656
AVG HOUSEHOLD INCOME
48.0%
WAGE / INCOME GAP [ % ]
52.0¢/ $1
WAGE / INCOME GAP [ $ ]
$11,731
FAMILY INCOME DEFICIT
0.45
INEQUALITY / GINI INDEX
12,482
TOTAL POPULATION
6,336
MALE POPULATION
6,146
FEMALE POPULATION
103.09
MALES / 100 FEMALES
97.00
FEMALES / 100 MALES
29.6
MEDIAN AGE
3.5
AVG FAMILY SIZE
3.1
AVG HOUSEHOLD SIZE
6,002
LABOR FORCE [ PEOPLE ]
68.2%
PERCENT IN LABOR FORCE
3.6%
UNEMPLOYMENT RATE
Jerome Zip Codes
Jerome Area Codes
Income in Jerome
Income Overview in Jerome
Per Capita Income in Jerome is $26,133, while median incomes of families and households are $63,667 and $59,656 respectively.
| Characteristic | Number | Measure |
| Per Capita Income | 12,482 | $26,133 |
| Median Family Income | 3,000 | $63,667 |
| Mean Family Income | 3,000 | $84,803 |
| Median Household Income | 4,005 | $59,656 |
| Mean Household Income | 4,005 | $78,001 |
| Income Deficit | 3,000 | $11,731 |
| Wage / Income Gap (%) | 12,482 | 48.00% |
| Wage / Income Gap ($) | 12,482 | 52.00¢ per $1 |
| Gini / Inequality Index | 12,482 | 0.45 |
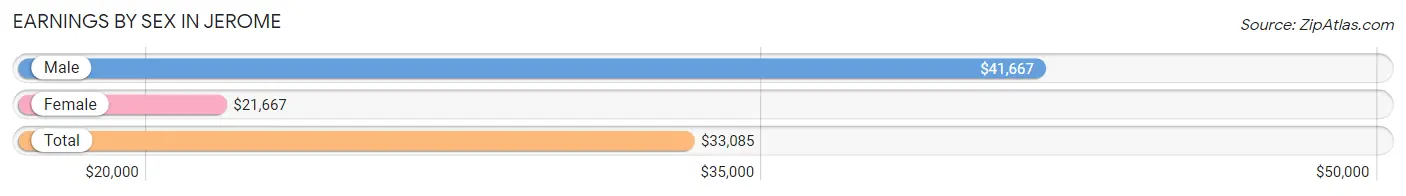
Earnings by Sex in Jerome
Average Earnings in Jerome are $33,085, $41,667 for men and $21,667 for women, a difference of 48.0%.
| Sex | Number | Average Earnings |
| Male | 3,536 (55.8%) | $41,667 |
| Female | 2,800 (44.2%) | $21,667 |
| Total | 6,336 (100.0%) | $33,085 |
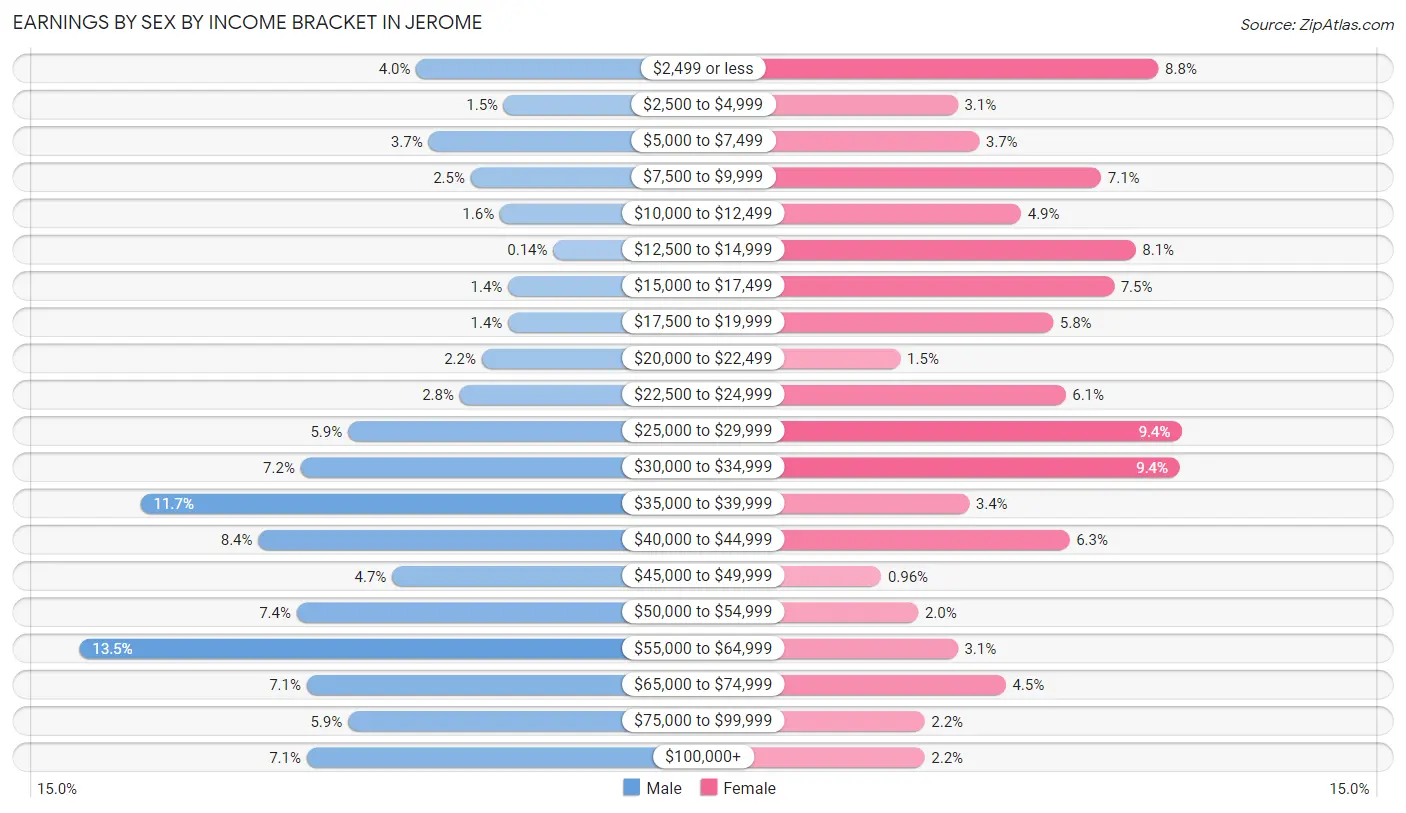
Earnings by Sex by Income Bracket in Jerome
The most common earnings brackets in Jerome are $55,000 to $64,999 for men (476 | 13.5%) and $25,000 to $29,999 for women (264 | 9.4%).
| Income | Male | Female |
| $2,499 or less | 141 (4.0%) | 245 (8.7%) |
| $2,500 to $4,999 | 54 (1.5%) | 87 (3.1%) |
| $5,000 to $7,499 | 129 (3.6%) | 104 (3.7%) |
| $7,500 to $9,999 | 87 (2.5%) | 200 (7.1%) |
| $10,000 to $12,499 | 58 (1.6%) | 137 (4.9%) |
| $12,500 to $14,999 | 5 (0.1%) | 227 (8.1%) |
| $15,000 to $17,499 | 50 (1.4%) | 210 (7.5%) |
| $17,500 to $19,999 | 50 (1.4%) | 162 (5.8%) |
| $20,000 to $22,499 | 76 (2.1%) | 42 (1.5%) |
| $22,500 to $24,999 | 98 (2.8%) | 172 (6.1%) |
| $25,000 to $29,999 | 209 (5.9%) | 264 (9.4%) |
| $30,000 to $34,999 | 256 (7.2%) | 262 (9.4%) |
| $35,000 to $39,999 | 415 (11.7%) | 96 (3.4%) |
| $40,000 to $44,999 | 298 (8.4%) | 175 (6.2%) |
| $45,000 to $49,999 | 165 (4.7%) | 27 (1.0%) |
| $50,000 to $54,999 | 260 (7.3%) | 56 (2.0%) |
| $55,000 to $64,999 | 476 (13.5%) | 87 (3.1%) |
| $65,000 to $74,999 | 250 (7.1%) | 125 (4.5%) |
| $75,000 to $99,999 | 209 (5.9%) | 61 (2.2%) |
| $100,000+ | 250 (7.1%) | 61 (2.2%) |
| Total | 3,536 (100.0%) | 2,800 (100.0%) |
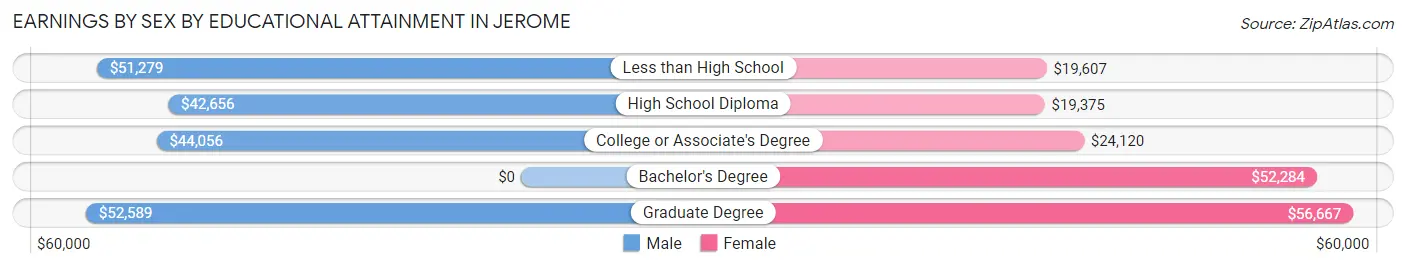
Earnings by Sex by Educational Attainment in Jerome
Average earnings in Jerome are $45,380 for men and $24,368 for women, a difference of 46.3%. Men with an educational attainment of graduate degree enjoy the highest average annual earnings of $52,589, while those with high school diploma education earn the least with $42,656. Women with an educational attainment of graduate degree earn the most with the average annual earnings of $56,667, while those with high school diploma education have the smallest earnings of $19,375.
| Educational Attainment | Male Income | Female Income |
| Less than High School | $51,279 | $19,607 |
| High School Diploma | $42,656 | $19,375 |
| College or Associate's Degree | $44,056 | $24,120 |
| Bachelor's Degree | - | - |
| Graduate Degree | $52,589 | $56,667 |
| Total | $45,380 | $24,368 |
Family Income in Jerome
Family Income Brackets in Jerome
According to the Jerome family income data, there are 894 families falling into the $50,000 to $74,999 income range, which is the most common income bracket and makes up 29.8% of all families. Conversely, the $10,000 to $14,999 income bracket is the least frequent group with only 108 families (3.6%) belonging to this category.
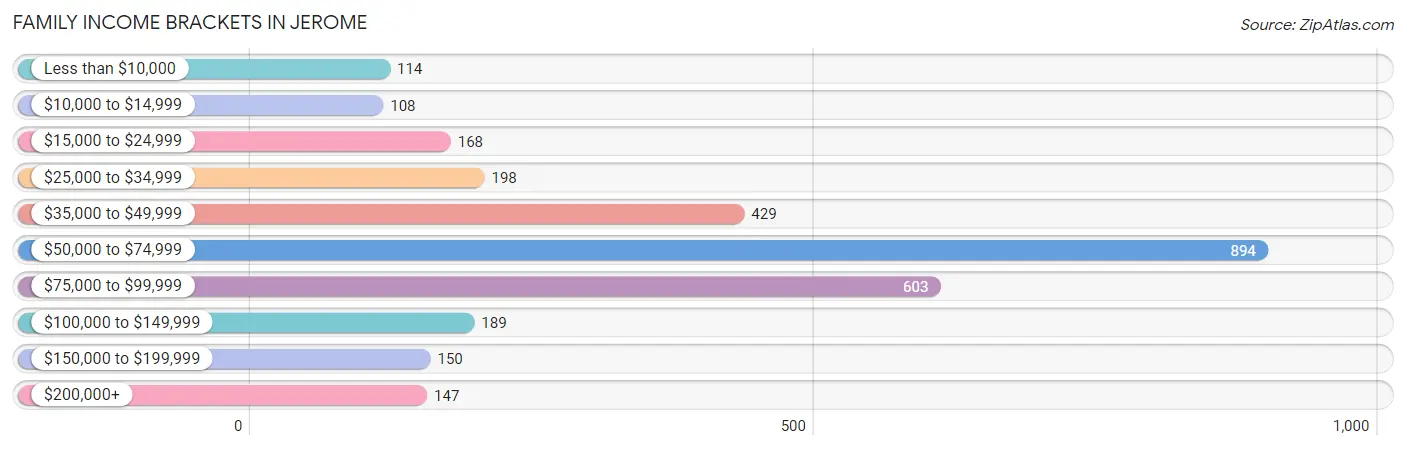
| Income Bracket | # Families | % Families |
| Less than $10,000 | 114 | 3.8% |
| $10,000 to $14,999 | 108 | 3.6% |
| $15,000 to $24,999 | 168 | 5.6% |
| $25,000 to $34,999 | 198 | 6.6% |
| $35,000 to $49,999 | 429 | 14.3% |
| $50,000 to $74,999 | 894 | 29.8% |
| $75,000 to $99,999 | 603 | 20.1% |
| $100,000 to $149,999 | 189 | 6.3% |
| $150,000 to $199,999 | 150 | 5.0% |
| $200,000+ | 147 | 4.9% |
Family Income by Famaliy Size in Jerome
7+ person families (168 | 5.6%) account for the highest median family income in Jerome with $66,625 per family, while 2-person families (931 | 31.0%) have the highest median income of $32,748 per family member.
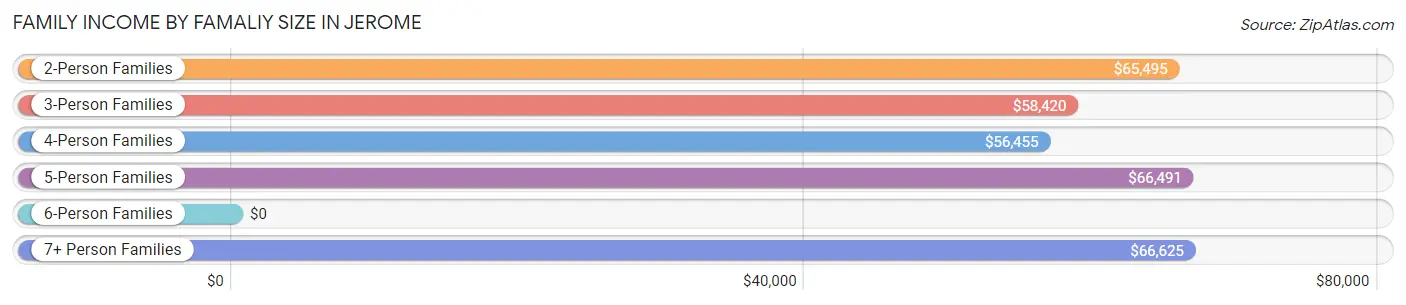
| Income Bracket | # Families | Median Income |
| 2-Person Families | 931 (31.0%) | $65,495 |
| 3-Person Families | 693 (23.1%) | $58,420 |
| 4-Person Families | 579 (19.3%) | $56,455 |
| 5-Person Families | 439 (14.6%) | $66,491 |
| 6-Person Families | 190 (6.3%) | $0 |
| 7+ Person Families | 168 (5.6%) | $66,625 |
| Total | 3,000 (100.0%) | $63,667 |
Family Income by Number of Earners in Jerome
The median family income in Jerome is $63,667, with families comprising 3+ earners (437) having the highest median family income of $127,917, while families with no earners (232) have the lowest median family income of $34,792, accounting for 14.6% and 7.7% of families, respectively.
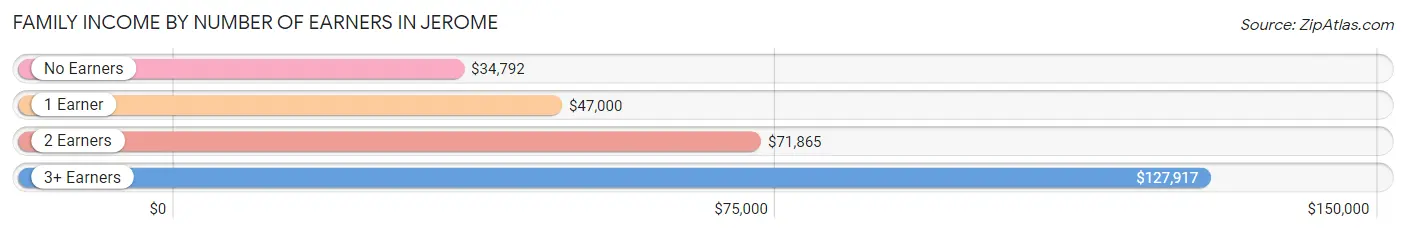
| Number of Earners | # Families | Median Income |
| No Earners | 232 (7.7%) | $34,792 |
| 1 Earner | 1,184 (39.5%) | $47,000 |
| 2 Earners | 1,147 (38.2%) | $71,865 |
| 3+ Earners | 437 (14.6%) | $127,917 |
| Total | 3,000 (100.0%) | $63,667 |
Household Income in Jerome
Household Income Brackets in Jerome
With 1,021 households falling in the category, the $50,000 to $74,999 income range is the most frequent in Jerome, accounting for 25.5% of all households. In contrast, only 156 households (3.9%) fall into the less than $10,000 income bracket, making it the least populous group.
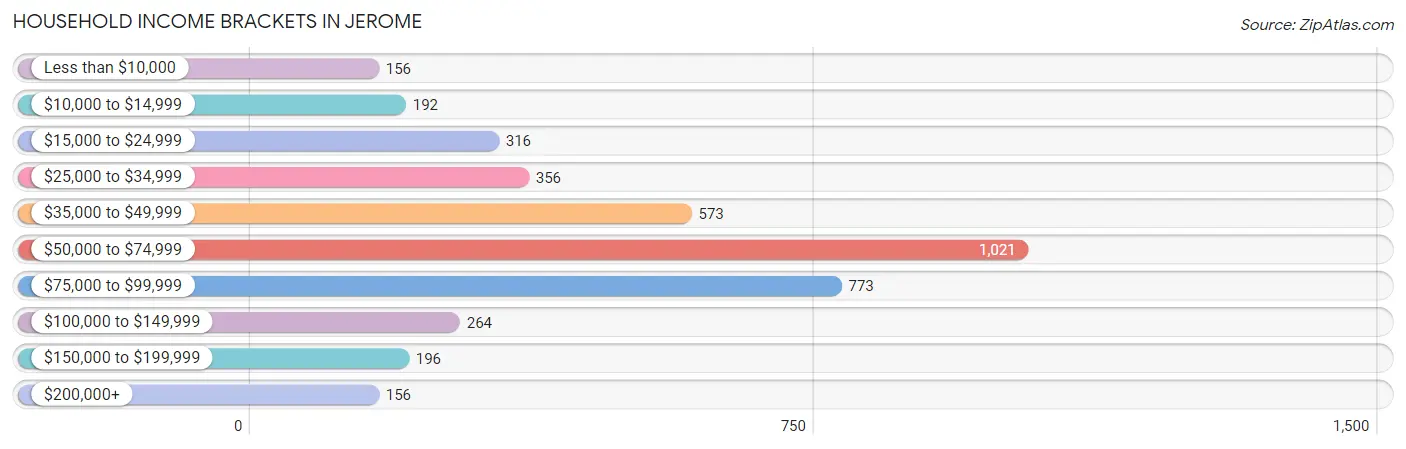
| Income Bracket | # Households | % Households |
| Less than $10,000 | 156 | 3.9% |
| $10,000 to $14,999 | 192 | 4.8% |
| $15,000 to $24,999 | 316 | 7.9% |
| $25,000 to $34,999 | 356 | 8.9% |
| $35,000 to $49,999 | 573 | 14.3% |
| $50,000 to $74,999 | 1,021 | 25.5% |
| $75,000 to $99,999 | 773 | 19.3% |
| $100,000 to $149,999 | 264 | 6.6% |
| $150,000 to $199,999 | 196 | 4.9% |
| $200,000+ | 156 | 3.9% |
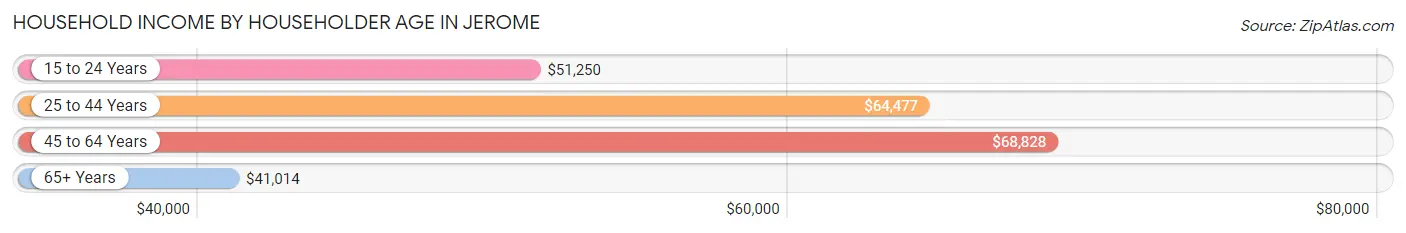
Household Income by Householder Age in Jerome
The median household income in Jerome is $59,656, with the highest median household income of $68,828 found in the 45 to 64 years age bracket for the primary householder. A total of 1,124 households (28.1%) fall into this category. Meanwhile, the 65+ years age bracket for the primary householder has the lowest median household income of $41,014, with 738 households (18.4%) in this group.
| Income Bracket | # Households | Median Income |
| 15 to 24 Years | 266 (6.6%) | $51,250 |
| 25 to 44 Years | 1,877 (46.9%) | $64,477 |
| 45 to 64 Years | 1,124 (28.1%) | $68,828 |
| 65+ Years | 738 (18.4%) | $41,014 |
| Total | 4,005 (100.0%) | $59,656 |
Poverty in Jerome
Income Below Poverty by Sex and Age in Jerome
With 15.1% poverty level for males and 20.6% for females among the residents of Jerome, 5 year old males and 15 year old females are the most vulnerable to poverty, with 52 males (55.3%) and 60 females (83.3%) in their respective age groups living below the poverty level.
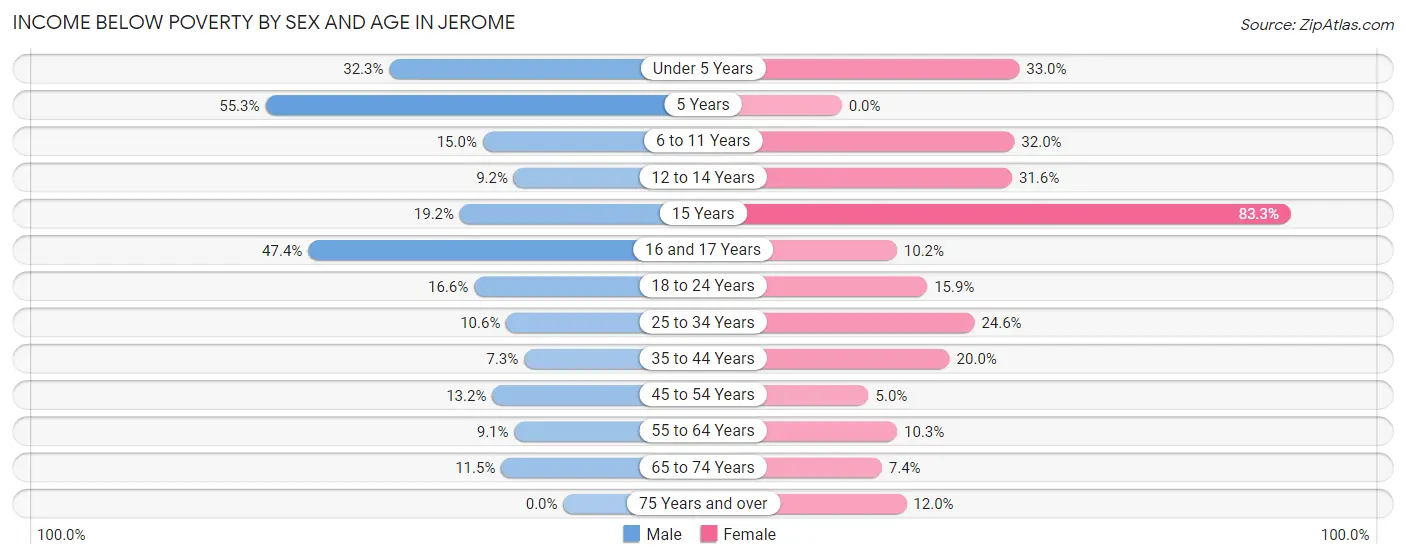
| Age Bracket | Male | Female |
| Under 5 Years | 168 (32.3%) | 205 (33.0%) |
| 5 Years | 52 (55.3%) | 0 (0.0%) |
| 6 to 11 Years | 105 (15.0%) | 223 (32.0%) |
| 12 to 14 Years | 39 (9.2%) | 79 (31.6%) |
| 15 Years | 34 (19.2%) | 60 (83.3%) |
| 16 and 17 Years | 108 (47.4%) | 23 (10.2%) |
| 18 to 24 Years | 88 (16.6%) | 103 (15.9%) |
| 25 to 34 Years | 103 (10.6%) | 227 (24.6%) |
| 35 to 44 Years | 64 (7.3%) | 190 (20.0%) |
| 45 to 54 Years | 90 (13.2%) | 19 (5.0%) |
| 55 to 64 Years | 53 (9.1%) | 66 (10.3%) |
| 65 to 74 Years | 40 (11.5%) | 22 (7.4%) |
| 75 Years and over | 0 (0.0%) | 32 (12.0%) |
| Total | 944 (15.1%) | 1,249 (20.6%) |
Income Above Poverty by Sex and Age in Jerome
According to the poverty statistics in Jerome, males aged 75 years and over and females aged 5 years are the age groups that are most secure financially, with 100.0% of males and 100.0% of females in these age groups living above the poverty line.
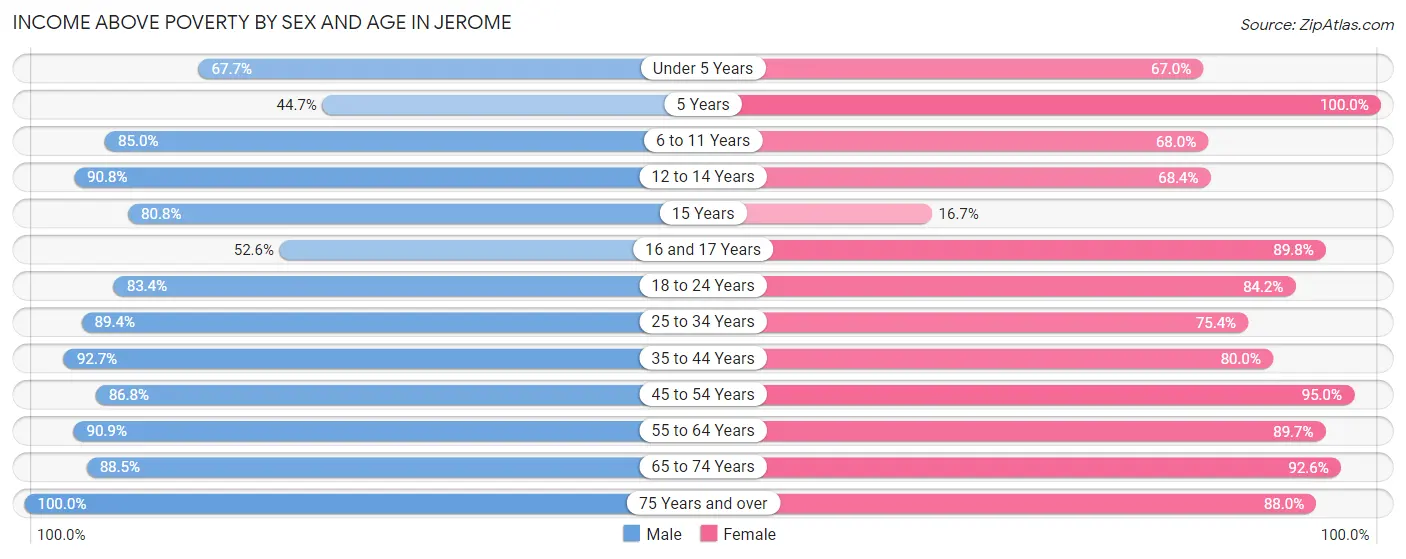
| Age Bracket | Male | Female |
| Under 5 Years | 352 (67.7%) | 417 (67.0%) |
| 5 Years | 42 (44.7%) | 88 (100.0%) |
| 6 to 11 Years | 597 (85.0%) | 473 (68.0%) |
| 12 to 14 Years | 385 (90.8%) | 171 (68.4%) |
| 15 Years | 143 (80.8%) | 12 (16.7%) |
| 16 and 17 Years | 120 (52.6%) | 202 (89.8%) |
| 18 to 24 Years | 443 (83.4%) | 547 (84.2%) |
| 25 to 34 Years | 869 (89.4%) | 695 (75.4%) |
| 35 to 44 Years | 813 (92.7%) | 759 (80.0%) |
| 45 to 54 Years | 592 (86.8%) | 363 (95.0%) |
| 55 to 64 Years | 530 (90.9%) | 577 (89.7%) |
| 65 to 74 Years | 307 (88.5%) | 274 (92.6%) |
| 75 Years and over | 129 (100.0%) | 235 (88.0%) |
| Total | 5,322 (84.9%) | 4,813 (79.4%) |
Income Below Poverty Among Married-Couple Families in Jerome
The poverty statistics for married-couple families in Jerome show that 11.1% or 216 of the total 1,941 families live below the poverty line. Families with 5 or more children have the highest poverty rate of 53.0%, comprising of 35 families. On the other hand, families with 3 or 4 children have the lowest poverty rate of 3.5%, which includes 15 families.
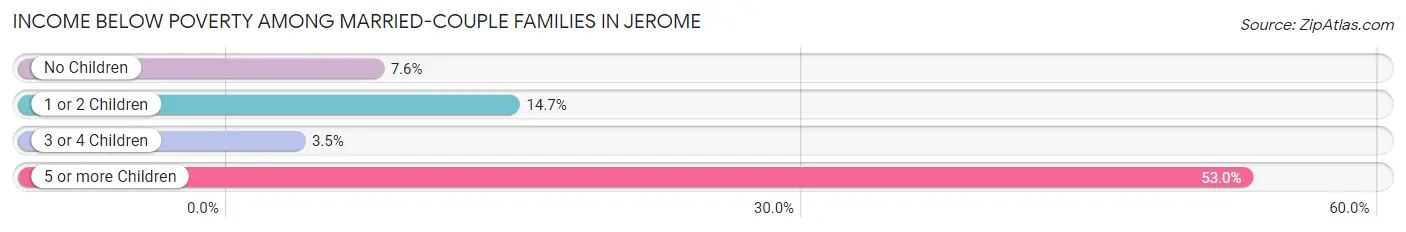
| Children | Above Poverty | Below Poverty |
| No Children | 607 (92.4%) | 50 (7.6%) |
| 1 or 2 Children | 673 (85.3%) | 116 (14.7%) |
| 3 or 4 Children | 414 (96.5%) | 15 (3.5%) |
| 5 or more Children | 31 (47.0%) | 35 (53.0%) |
| Total | 1,725 (88.9%) | 216 (11.1%) |
Income Below Poverty Among Single-Parent Households in Jerome
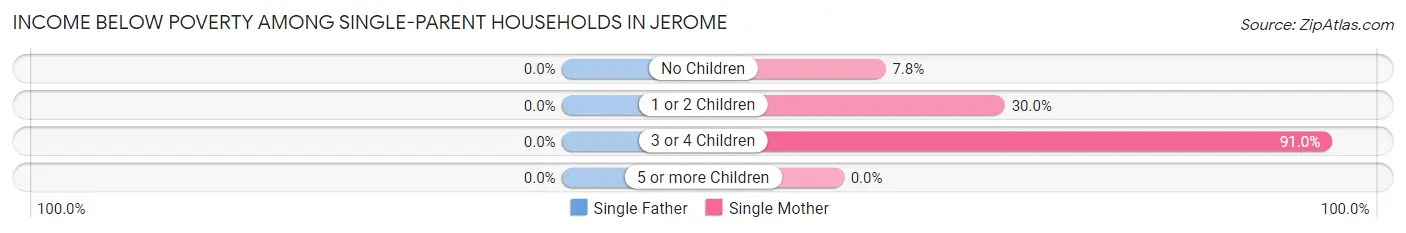
| Children | Single Father | Single Mother |
| No Children | 0 (0.0%) | 13 (7.8%) |
| 1 or 2 Children | 0 (0.0%) | 66 (30.0%) |
| 3 or 4 Children | 0 (0.0%) | 141 (91.0%) |
| 5 or more Children | 0 (0.0%) | 0 (0.0%) |
| Total | 0 (0.0%) | 220 (40.6%) |
Income Below Poverty Among Married-Couple vs Single-Parent Households in Jerome
The poverty data for Jerome shows that 216 of the married-couple family households (11.1%) and 220 of the single-parent households (20.8%) are living below the poverty level. Within the married-couple family households, those with 5 or more children have the highest poverty rate, with 35 households (53.0%) falling below the poverty line. Among the single-parent households, those with 3 or 4 children have the highest poverty rate, with 141 household (48.4%) living below poverty.
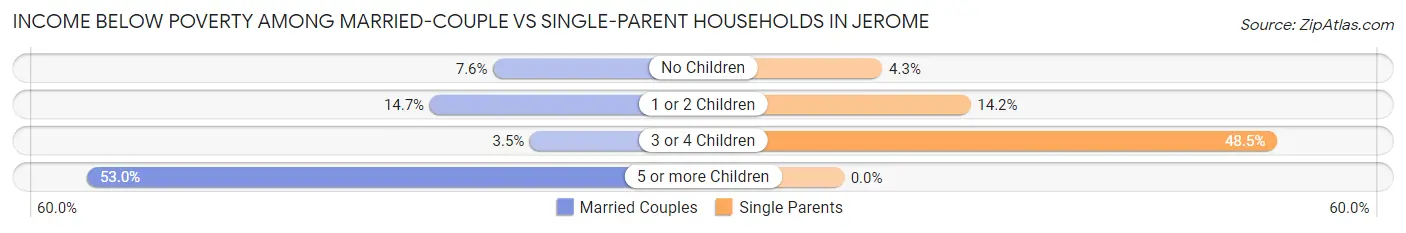
| Children | Married-Couple Families | Single-Parent Households |
| No Children | 50 (7.6%) | 13 (4.3%) |
| 1 or 2 Children | 116 (14.7%) | 66 (14.2%) |
| 3 or 4 Children | 15 (3.5%) | 141 (48.4%) |
| 5 or more Children | 35 (53.0%) | 0 (0.0%) |
| Total | 216 (11.1%) | 220 (20.8%) |
Race in Jerome
The most populous races in Jerome are White / Caucasian (7,976 | 63.9%), Hispanic or Latino (5,755 | 46.1%), and Two or more Races (3,179 | 25.5%).
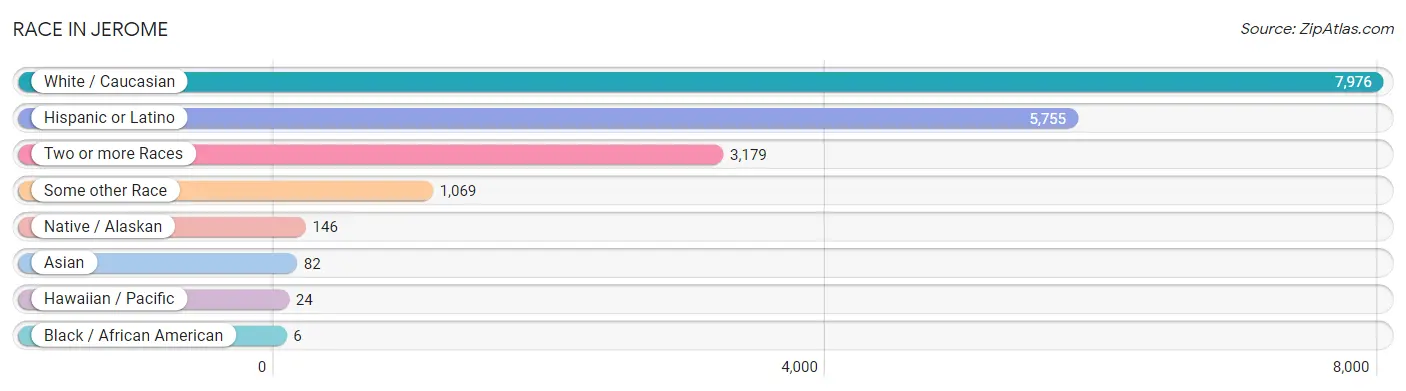
| Race | # Population | % Population |
| Asian | 82 | 0.7% |
| Black / African American | 6 | 0.1% |
| Hawaiian / Pacific | 24 | 0.2% |
| Hispanic or Latino | 5,755 | 46.1% |
| Native / Alaskan | 146 | 1.2% |
| White / Caucasian | 7,976 | 63.9% |
| Two or more Races | 3,179 | 25.5% |
| Some other Race | 1,069 | 8.6% |
| Total | 12,482 | 100.0% |
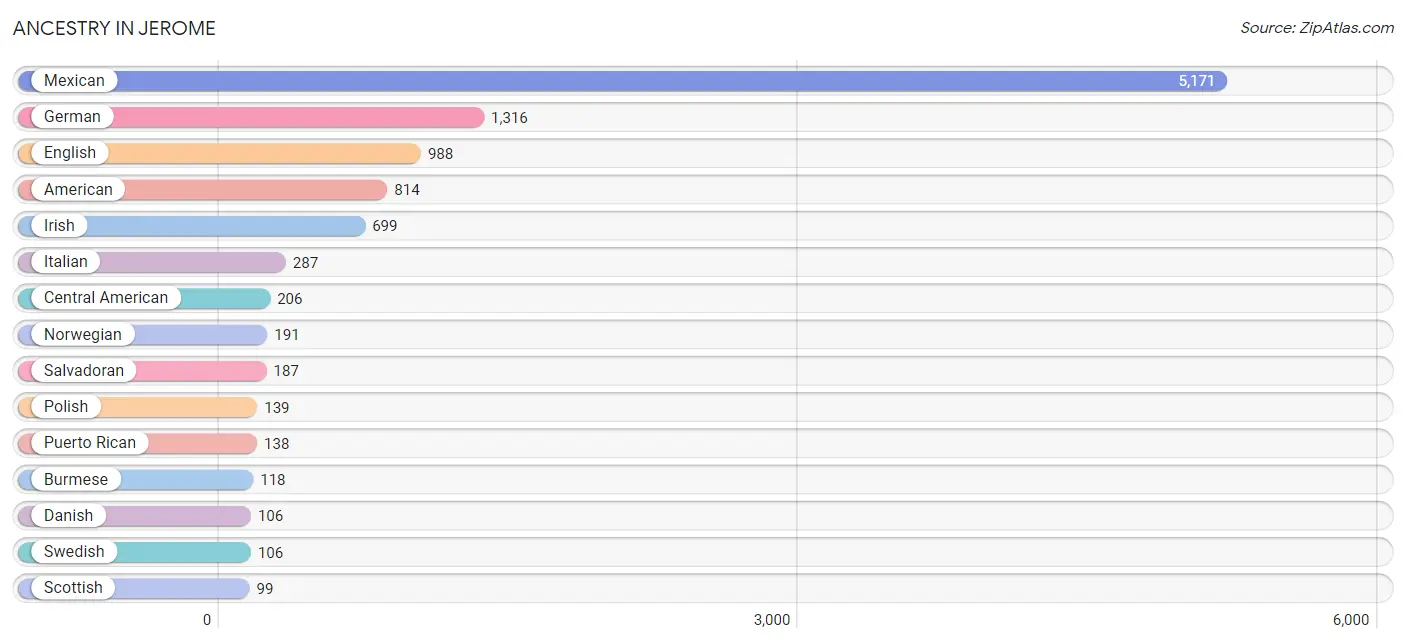
Ancestry in Jerome
The most populous ancestries reported in Jerome are Mexican (5,171 | 41.4%), German (1,316 | 10.5%), English (988 | 7.9%), American (814 | 6.5%), and Irish (699 | 5.6%), together accounting for 72.0% of all Jerome residents.
| Ancestry | # Population | % Population |
| American | 814 | 6.5% |
| Armenian | 3 | 0.0% |
| Austrian | 14 | 0.1% |
| Blackfeet | 38 | 0.3% |
| British | 97 | 0.8% |
| Burmese | 118 | 0.9% |
| Central American | 206 | 1.7% |
| Central American Indian | 5 | 0.0% |
| Chilean | 59 | 0.5% |
| Colombian | 29 | 0.2% |
| Cuban | 23 | 0.2% |
| Czech | 34 | 0.3% |
| Danish | 106 | 0.9% |
| Dominican | 33 | 0.3% |
| Dutch | 50 | 0.4% |
| Eastern European | 81 | 0.6% |
| English | 988 | 7.9% |
| European | 89 | 0.7% |
| French | 33 | 0.3% |
| German | 1,316 | 10.5% |
| Hungarian | 4 | 0.0% |
| Indian (Asian) | 10 | 0.1% |
| Irish | 699 | 5.6% |
| Italian | 287 | 2.3% |
| Korean | 36 | 0.3% |
| Lithuanian | 35 | 0.3% |
| Mexican | 5,171 | 41.4% |
| Mexican American Indian | 79 | 0.6% |
| Navajo | 13 | 0.1% |
| Nicaraguan | 19 | 0.2% |
| Norwegian | 191 | 1.5% |
| Pennsylvania German | 8 | 0.1% |
| Polish | 139 | 1.1% |
| Portuguese | 88 | 0.7% |
| Puerto Rican | 138 | 1.1% |
| Russian | 13 | 0.1% |
| Salvadoran | 187 | 1.5% |
| Scandinavian | 72 | 0.6% |
| Scotch-Irish | 48 | 0.4% |
| Scottish | 99 | 0.8% |
| Serbian | 31 | 0.3% |
| South American | 88 | 0.7% |
| Spaniard | 6 | 0.1% |
| Swedish | 106 | 0.9% |
| Swiss | 30 | 0.2% |
| Yugoslavian | 5 | 0.0% | View All 46 Rows |
Immigrants in Jerome
The most numerous immigrant groups reported in Jerome came from Latin America (2,385 | 19.1%), Central America (2,362 | 18.9%), Mexico (2,284 | 18.3%), Asia (131 | 1.1%), and Eastern Asia (128 | 1.0%), together accounting for 58.4% of all Jerome residents.
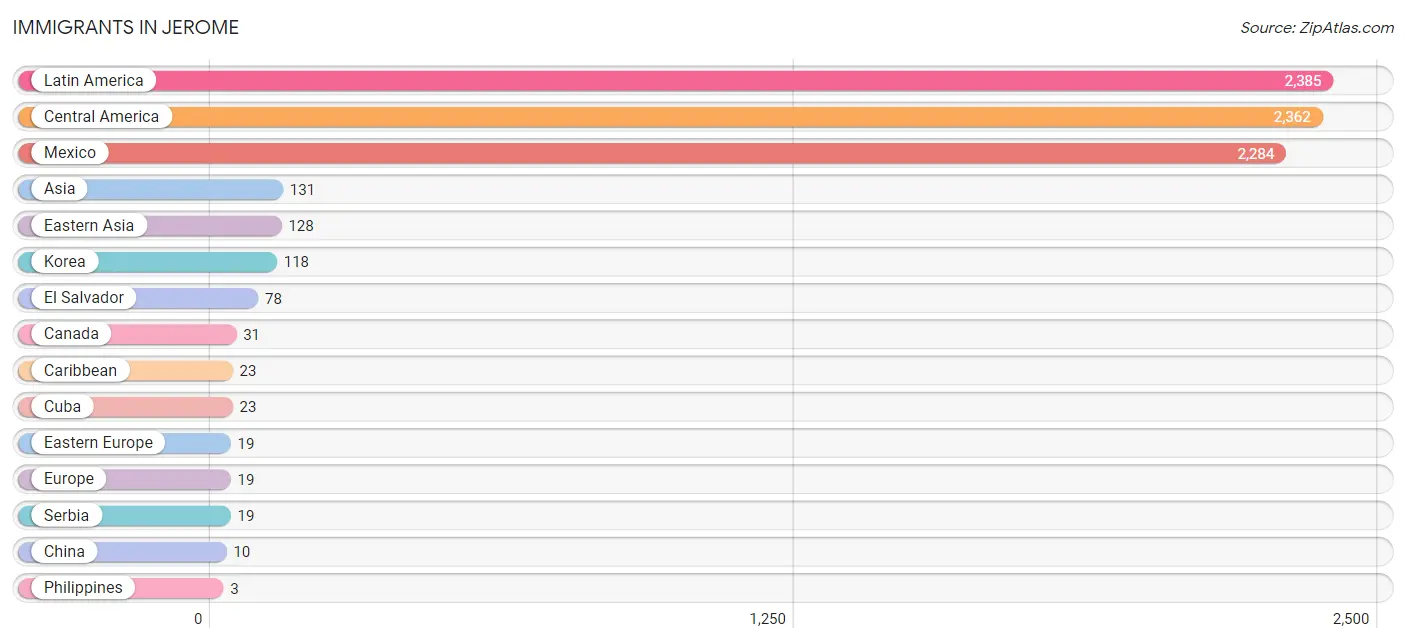
| Immigration Origin | # Population | % Population |
| Asia | 131 | 1.1% |
| Canada | 31 | 0.3% |
| Caribbean | 23 | 0.2% |
| Central America | 2,362 | 18.9% |
| China | 10 | 0.1% |
| Cuba | 23 | 0.2% |
| Eastern Asia | 128 | 1.0% |
| Eastern Europe | 19 | 0.2% |
| El Salvador | 78 | 0.6% |
| Europe | 19 | 0.2% |
| Korea | 118 | 0.9% |
| Latin America | 2,385 | 19.1% |
| Mexico | 2,284 | 18.3% |
| Philippines | 3 | 0.0% |
| Serbia | 19 | 0.2% |
| South Eastern Asia | 3 | 0.0% | View All 16 Rows |
Sex and Age in Jerome
Sex and Age in Jerome
The most populous age groups in Jerome are 10 to 14 Years (654 | 10.3%) for men and Under 5 Years (622 | 10.1%) for women.
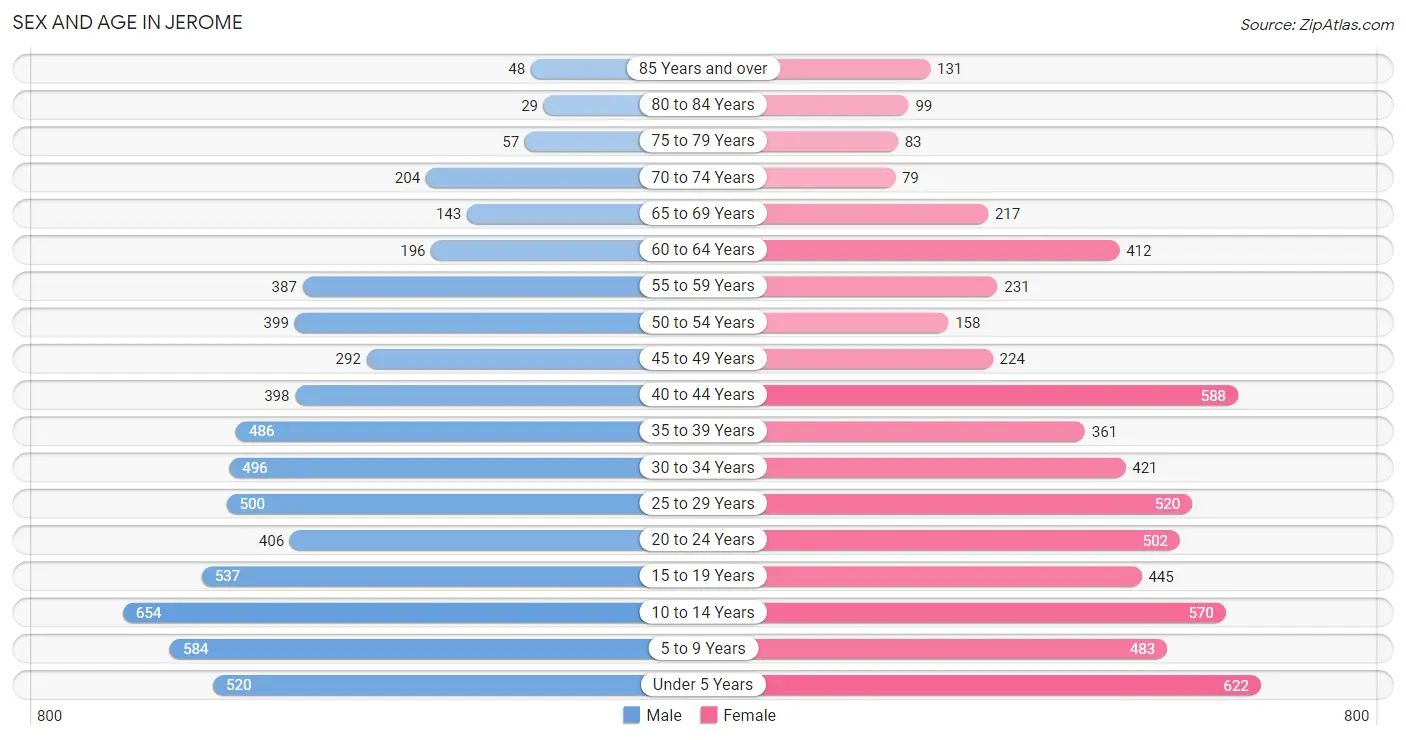
| Age Bracket | Male | Female |
| Under 5 Years | 520 (8.2%) | 622 (10.1%) |
| 5 to 9 Years | 584 (9.2%) | 483 (7.9%) |
| 10 to 14 Years | 654 (10.3%) | 570 (9.3%) |
| 15 to 19 Years | 537 (8.5%) | 445 (7.2%) |
| 20 to 24 Years | 406 (6.4%) | 502 (8.2%) |
| 25 to 29 Years | 500 (7.9%) | 520 (8.5%) |
| 30 to 34 Years | 496 (7.8%) | 421 (6.9%) |
| 35 to 39 Years | 486 (7.7%) | 361 (5.9%) |
| 40 to 44 Years | 398 (6.3%) | 588 (9.6%) |
| 45 to 49 Years | 292 (4.6%) | 224 (3.6%) |
| 50 to 54 Years | 399 (6.3%) | 158 (2.6%) |
| 55 to 59 Years | 387 (6.1%) | 231 (3.8%) |
| 60 to 64 Years | 196 (3.1%) | 412 (6.7%) |
| 65 to 69 Years | 143 (2.3%) | 217 (3.5%) |
| 70 to 74 Years | 204 (3.2%) | 79 (1.3%) |
| 75 to 79 Years | 57 (0.9%) | 83 (1.3%) |
| 80 to 84 Years | 29 (0.5%) | 99 (1.6%) |
| 85 Years and over | 48 (0.8%) | 131 (2.1%) |
| Total | 6,336 (100.0%) | 6,146 (100.0%) |
Families and Households in Jerome
Median Family Size in Jerome
The median family size in Jerome is 3.52 persons per family, with married-couple families (1,941 | 64.7%) accounting for the largest median family size of 3.82 persons per family. On the other hand, single male/father families (517 | 17.2%) represent the smallest median family size with 2.86 persons per family.
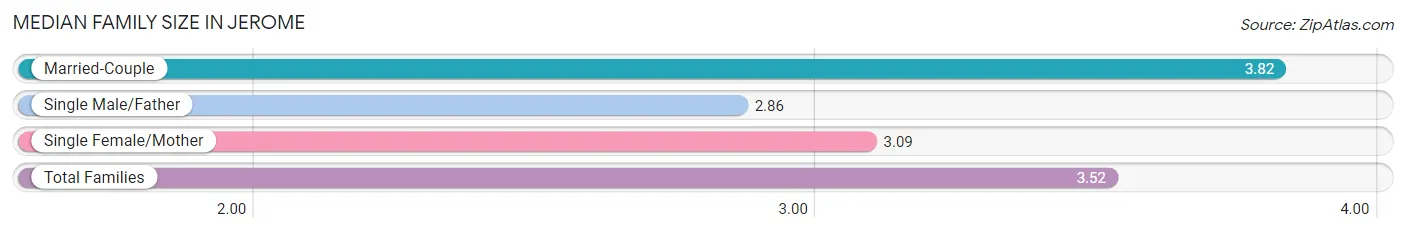
| Family Type | # Families | Family Size |
| Married-Couple | 1,941 (64.7%) | 3.82 |
| Single Male/Father | 517 (17.2%) | 2.86 |
| Single Female/Mother | 542 (18.1%) | 3.09 |
| Total Families | 3,000 (100.0%) | 3.52 |
Median Household Size in Jerome
The median household size in Jerome is 3.08 persons per household, with married-couple households (1,941 | 48.5%) accounting for the largest median household size of 3.86 persons per household. non-family households (1,005 | 25.1%) represent the smallest median household size with 1.23 persons per household.
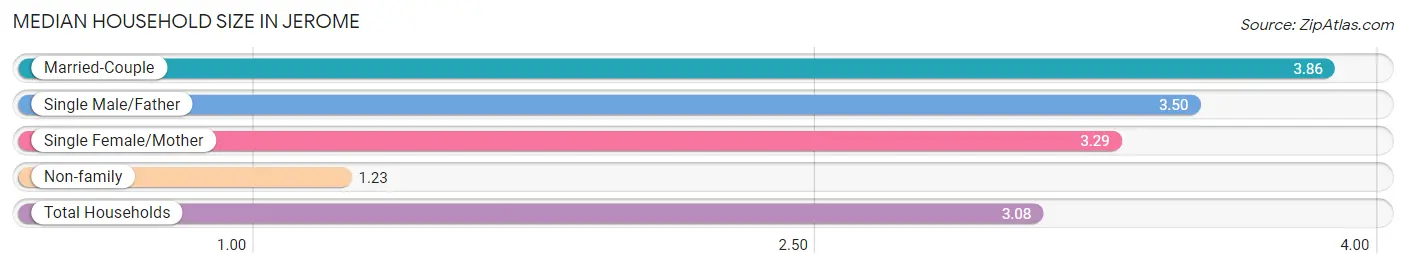
| Household Type | # Households | Household Size |
| Married-Couple | 1,941 (48.5%) | 3.86 |
| Single Male/Father | 517 (12.9%) | 3.50 |
| Single Female/Mother | 542 (13.5%) | 3.29 |
| Non-family | 1,005 (25.1%) | 1.23 |
| Total Households | 4,005 (100.0%) | 3.08 |
Household Size by Marriage Status in Jerome
Out of a total of 4,005 households in Jerome, 3,000 (74.9%) are family households, while 1,005 (25.1%) are nonfamily households. The most numerous type of family households are 2-person households, comprising 795, and the most common type of nonfamily households are 1-person households, comprising 860.
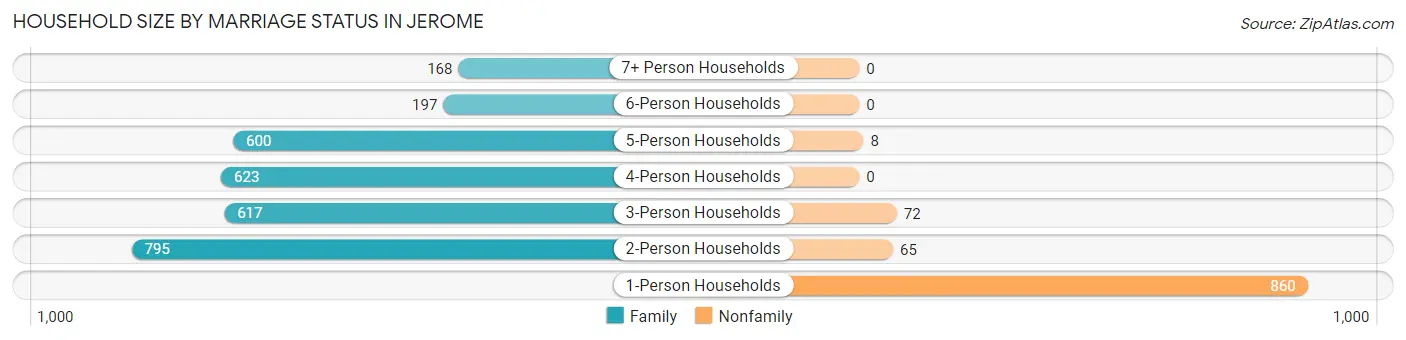
| Household Size | Family Households | Nonfamily Households |
| 1-Person Households | - | 860 (21.5%) |
| 2-Person Households | 795 (19.9%) | 65 (1.6%) |
| 3-Person Households | 617 (15.4%) | 72 (1.8%) |
| 4-Person Households | 623 (15.6%) | 0 (0.0%) |
| 5-Person Households | 600 (15.0%) | 8 (0.2%) |
| 6-Person Households | 197 (4.9%) | 0 (0.0%) |
| 7+ Person Households | 168 (4.2%) | 0 (0.0%) |
| Total | 3,000 (74.9%) | 1,005 (25.1%) |
Female Fertility in Jerome
Fertility by Age in Jerome
Average fertility rate in Jerome is 75.0 births per 1,000 women. Women in the age bracket of 20 to 34 years have the highest fertility rate with 109.0 births per 1,000 women. Women in the age bracket of 20 to 34 years acount for 67.7% of all women with births.
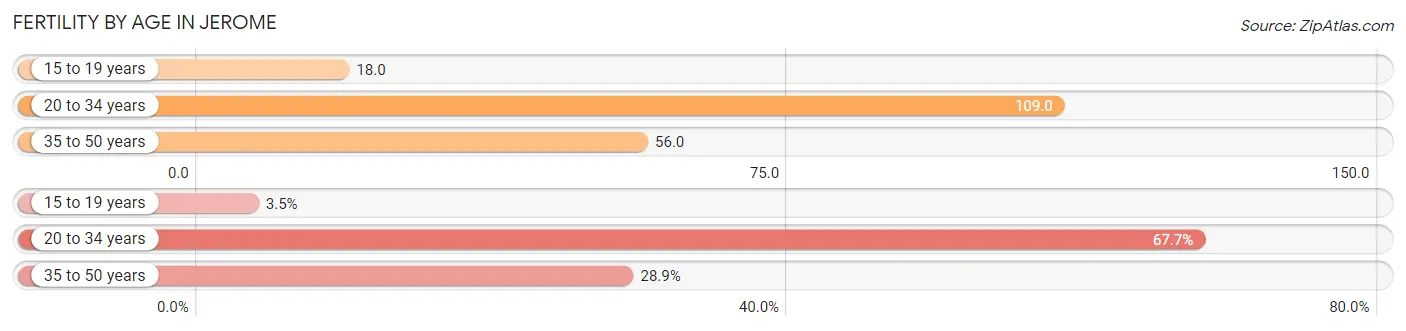
| Age Bracket | Women with Births | Births / 1,000 Women |
| 15 to 19 years | 8 (3.5%) | 18.0 |
| 20 to 34 years | 157 (67.7%) | 109.0 |
| 35 to 50 years | 67 (28.9%) | 56.0 |
| Total | 232 (100.0%) | 75.0 |
Fertility by Age by Marriage Status in Jerome
50.0% of women with births (232) in Jerome are married. The highest percentage of unmarried women with births falls into 15 to 19 years age bracket with 100.0% of them unmarried at the time of birth, while the lowest percentage of unmarried women with births belong to 20 to 34 years age bracket with 36.9% of them unmarried.
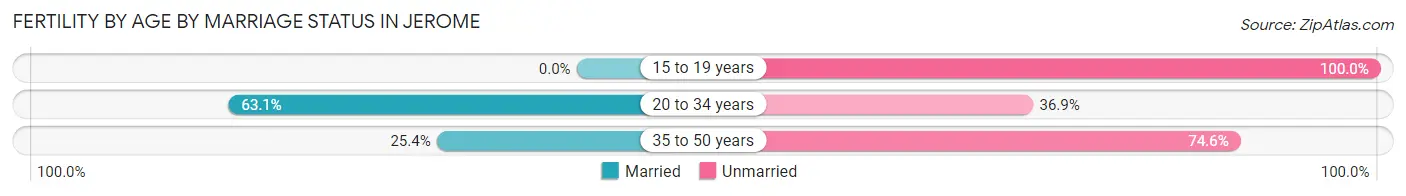
| Age Bracket | Married | Unmarried |
| 15 to 19 years | 0 (0.0%) | 8 (100.0%) |
| 20 to 34 years | 99 (63.1%) | 58 (36.9%) |
| 35 to 50 years | 17 (25.4%) | 50 (74.6%) |
| Total | 116 (50.0%) | 116 (50.0%) |
Fertility by Education in Jerome
Average fertility rate in Jerome is 75.0 births per 1,000 women. Women with the education attainment of graduate degree have the highest fertility rate of 202.0 births per 1,000 women, while women with the education attainment of high school diploma have the lowest fertility at 19.0 births per 1,000 women. Women with the education attainment of less than high school represent 55.6% of all women with births.
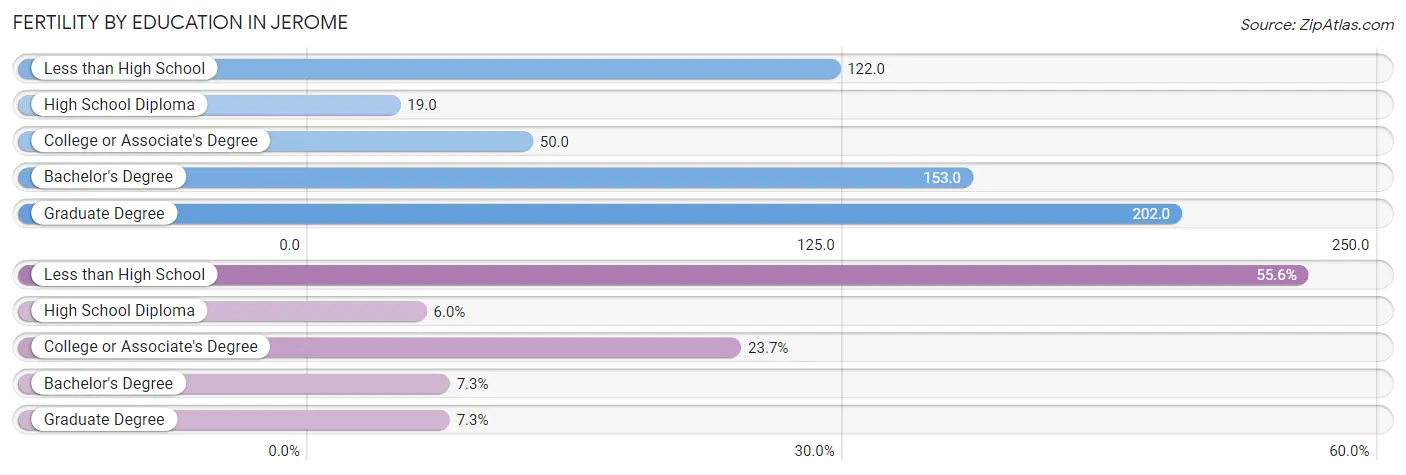
| Educational Attainment | Women with Births | Births / 1,000 Women |
| Less than High School | 129 (55.6%) | 122.0 |
| High School Diploma | 14 (6.0%) | 19.0 |
| College or Associate's Degree | 55 (23.7%) | 50.0 |
| Bachelor's Degree | 17 (7.3%) | 153.0 |
| Graduate Degree | 17 (7.3%) | 202.0 |
| Total | 232 (100.0%) | 75.0 |
Fertility by Education by Marriage Status in Jerome
50.0% of women with births in Jerome are unmarried. Women with the educational attainment of bachelor's degree are most likely to be married with 100.0% of them married at childbirth, while women with the educational attainment of high school diploma are least likely to be married with 100.0% of them unmarried at childbirth.
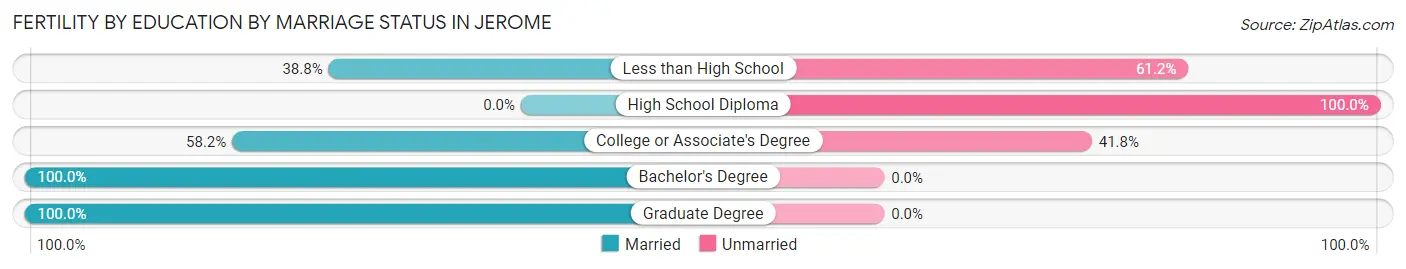
| Educational Attainment | Married | Unmarried |
| Less than High School | 50 (38.8%) | 79 (61.2%) |
| High School Diploma | 0 (0.0%) | 14 (100.0%) |
| College or Associate's Degree | 32 (58.2%) | 23 (41.8%) |
| Bachelor's Degree | 17 (100.0%) | 0 (0.0%) |
| Graduate Degree | 17 (100.0%) | 0 (0.0%) |
| Total | 116 (50.0%) | 116 (50.0%) |
Employment Characteristics in Jerome
Employment by Class of Employer in Jerome
Among the 5,712 employed individuals in Jerome, private company employees (4,354 | 76.2%), local government employees (390 | 6.8%), and self-employed (not incorporated) (370 | 6.5%) make up the most common classes of employment.
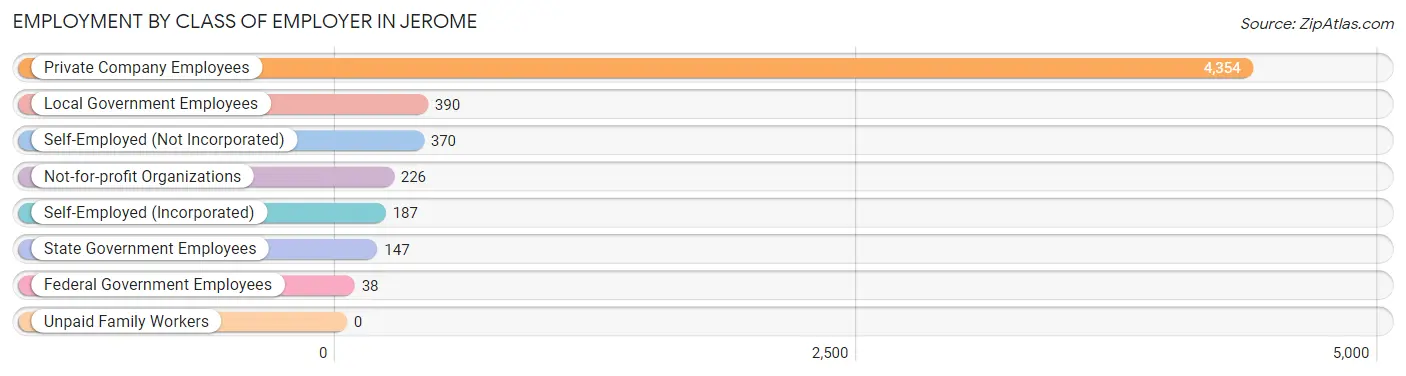
| Employer Class | # Employees | % Employees |
| Private Company Employees | 4,354 | 76.2% |
| Self-Employed (Incorporated) | 187 | 3.3% |
| Self-Employed (Not Incorporated) | 370 | 6.5% |
| Not-for-profit Organizations | 226 | 4.0% |
| Local Government Employees | 390 | 6.8% |
| State Government Employees | 147 | 2.6% |
| Federal Government Employees | 38 | 0.7% |
| Unpaid Family Workers | 0 | 0.0% |
| Total | 5,712 | 100.0% |
Employment Status by Age in Jerome
According to the labor force statistics for Jerome, out of the total population over 16 years of age (8,800), 68.2% or 6,002 individuals are in the labor force, with 3.6% or 216 of them unemployed. The age group with the highest labor force participation rate is 30 to 34 years, with 81.4% or 746 individuals in the labor force. Within the labor force, the 16 to 19 years age range has the highest percentage of unemployed individuals, with 13.8% or 47 of them being unemployed.
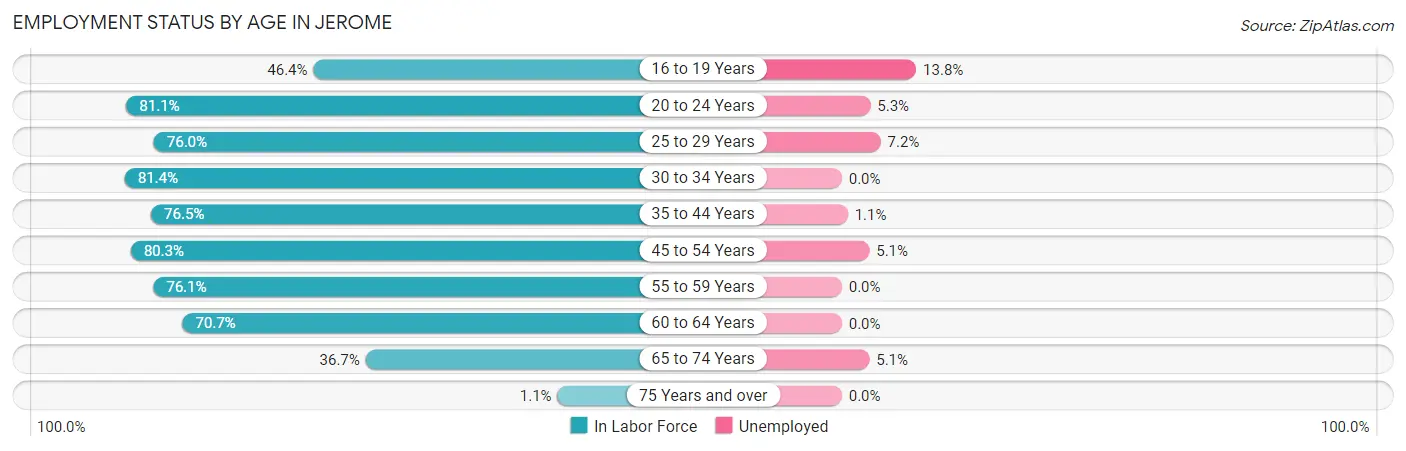
| Age Bracket | In Labor Force | Unemployed |
| 16 to 19 Years | 340 (46.4%) | 47 (13.8%) |
| 20 to 24 Years | 736 (81.1%) | 39 (5.3%) |
| 25 to 29 Years | 775 (76.0%) | 56 (7.2%) |
| 30 to 34 Years | 746 (81.4%) | 0 (0.0%) |
| 35 to 44 Years | 1,402 (76.5%) | 15 (1.1%) |
| 45 to 54 Years | 862 (80.3%) | 44 (5.1%) |
| 55 to 59 Years | 470 (76.1%) | 0 (0.0%) |
| 60 to 64 Years | 430 (70.7%) | 0 (0.0%) |
| 65 to 74 Years | 236 (36.7%) | 12 (5.1%) |
| 75 Years and over | 5 (1.1%) | 0 (0.0%) |
| Total | 6,002 (68.2%) | 216 (3.6%) |
Employment Status by Educational Attainment in Jerome
According to labor force statistics for Jerome, 77.2% of individuals (4,685) out of the total population between 25 and 64 years of age (6,069) are in the labor force, with 2.5% or 117 of them being unemployed. The group with the highest labor force participation rate are those with the educational attainment of college / associate degree, with 82.3% or 1,648 individuals in the labor force. Within the labor force, individuals with high school diploma education have the highest percentage of unemployment, with 6.8% or 80 of them being unemployed.
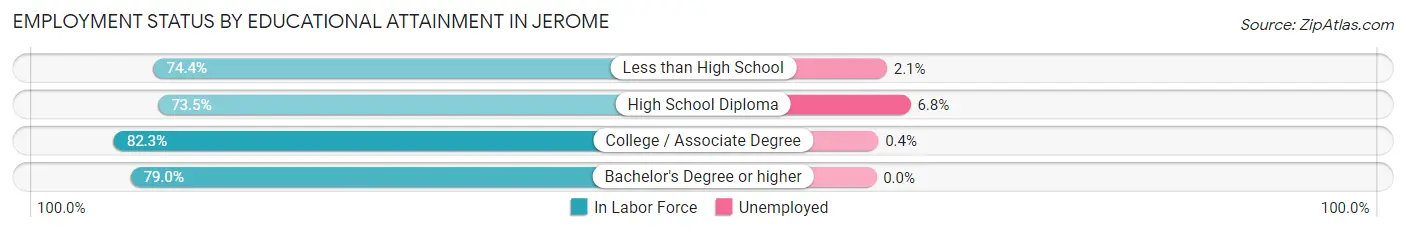
| Educational Attainment | In Labor Force | Unemployed |
| Less than High School | 1,426 (74.4%) | 40 (2.1%) |
| High School Diploma | 1,171 (73.5%) | 108 (6.8%) |
| College / Associate Degree | 1,648 (82.3%) | 8 (0.4%) |
| Bachelor's Degree or higher | 440 (79.0%) | 0 (0.0%) |
| Total | 4,685 (77.2%) | 152 (2.5%) |
Employment Occupations by Sex in Jerome
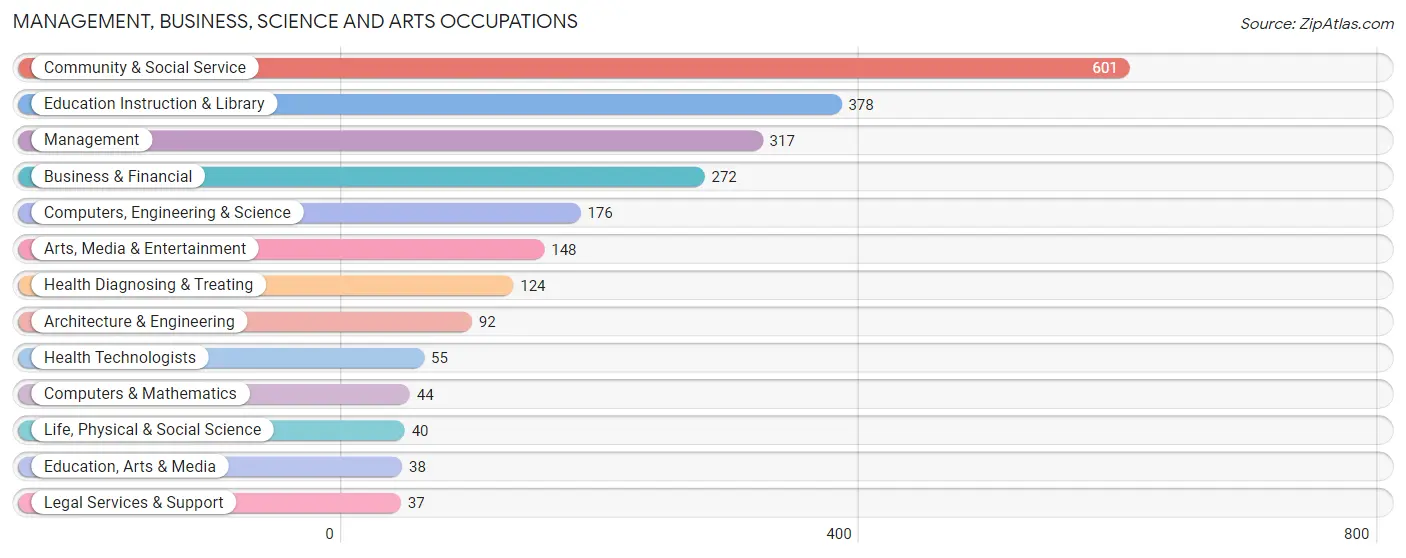
Management, Business, Science and Arts Occupations
The most common Management, Business, Science and Arts occupations in Jerome are Community & Social Service (601 | 10.4%), Education Instruction & Library (378 | 6.5%), Management (317 | 5.5%), Business & Financial (272 | 4.7%), and Computers, Engineering & Science (176 | 3.0%).
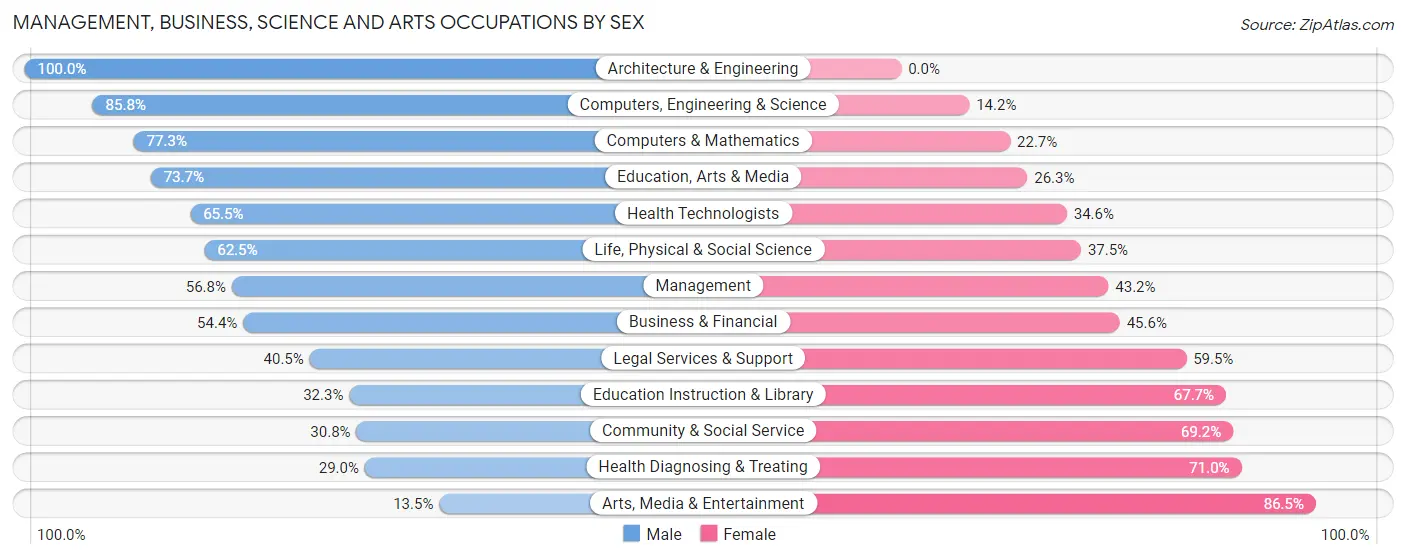
Management, Business, Science and Arts Occupations by Sex
Within the Management, Business, Science and Arts occupations in Jerome, the most male-oriented occupations are Architecture & Engineering (100.0%), Computers, Engineering & Science (85.8%), and Computers & Mathematics (77.3%), while the most female-oriented occupations are Arts, Media & Entertainment (86.5%), Health Diagnosing & Treating (71.0%), and Community & Social Service (69.2%).
| Occupation | Male | Female |
| Management | 180 (56.8%) | 137 (43.2%) |
| Business & Financial | 148 (54.4%) | 124 (45.6%) |
| Computers, Engineering & Science | 151 (85.8%) | 25 (14.2%) |
| Computers & Mathematics | 34 (77.3%) | 10 (22.7%) |
| Architecture & Engineering | 92 (100.0%) | 0 (0.0%) |
| Life, Physical & Social Science | 25 (62.5%) | 15 (37.5%) |
| Community & Social Service | 185 (30.8%) | 416 (69.2%) |
| Education, Arts & Media | 28 (73.7%) | 10 (26.3%) |
| Legal Services & Support | 15 (40.5%) | 22 (59.5%) |
| Education Instruction & Library | 122 (32.3%) | 256 (67.7%) |
| Arts, Media & Entertainment | 20 (13.5%) | 128 (86.5%) |
| Health Diagnosing & Treating | 36 (29.0%) | 88 (71.0%) |
| Health Technologists | 36 (65.4%) | 19 (34.5%) |
| Total (Category) | 700 (47.0%) | 790 (53.0%) |
| Total (Overall) | 3,317 (57.3%) | 2,472 (42.7%) |
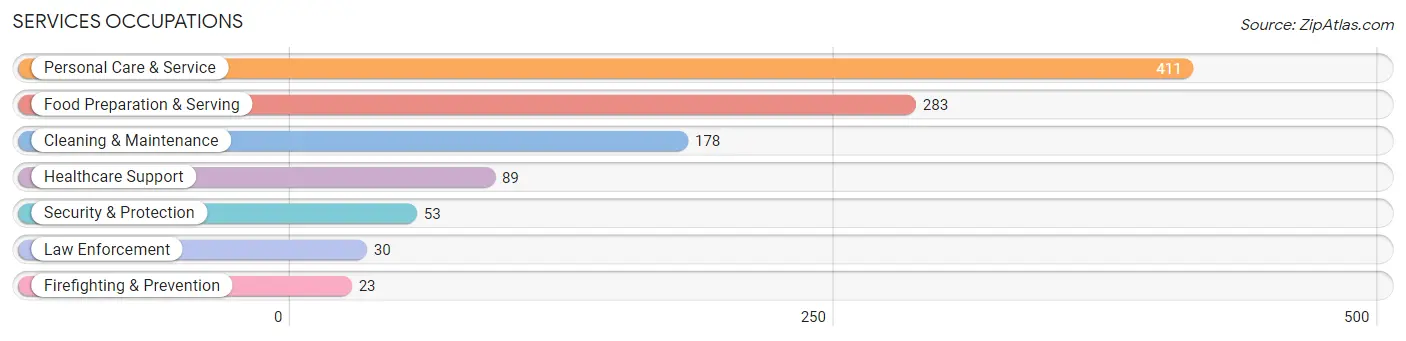
Services Occupations
The most common Services occupations in Jerome are Personal Care & Service (411 | 7.1%), Food Preparation & Serving (283 | 4.9%), Cleaning & Maintenance (178 | 3.1%), Healthcare Support (89 | 1.5%), and Security & Protection (53 | 0.9%).
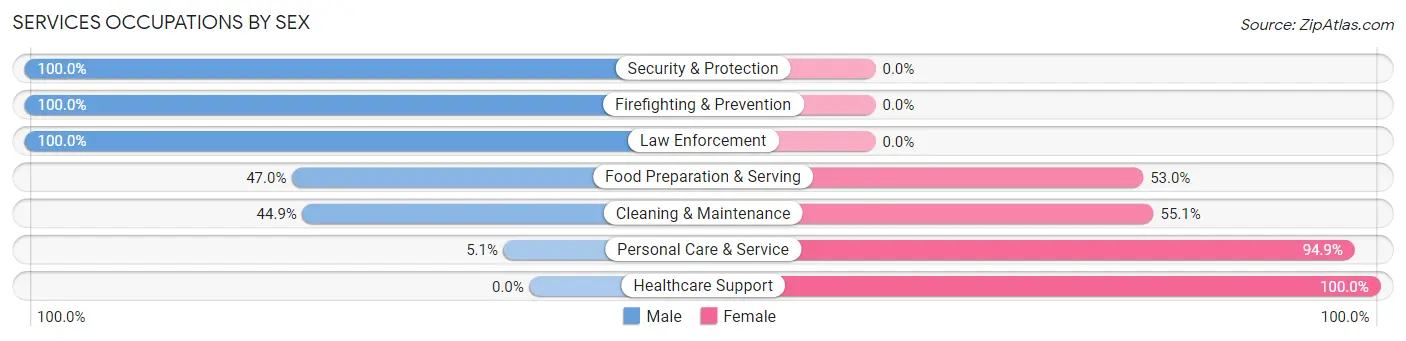
Services Occupations by Sex
Within the Services occupations in Jerome, the most male-oriented occupations are Security & Protection (100.0%), Firefighting & Prevention (100.0%), and Law Enforcement (100.0%), while the most female-oriented occupations are Healthcare Support (100.0%), Personal Care & Service (94.9%), and Cleaning & Maintenance (55.1%).
| Occupation | Male | Female |
| Healthcare Support | 0 (0.0%) | 89 (100.0%) |
| Security & Protection | 53 (100.0%) | 0 (0.0%) |
| Firefighting & Prevention | 23 (100.0%) | 0 (0.0%) |
| Law Enforcement | 30 (100.0%) | 0 (0.0%) |
| Food Preparation & Serving | 133 (47.0%) | 150 (53.0%) |
| Cleaning & Maintenance | 80 (44.9%) | 98 (55.1%) |
| Personal Care & Service | 21 (5.1%) | 390 (94.9%) |
| Total (Category) | 287 (28.3%) | 727 (71.7%) |
| Total (Overall) | 3,317 (57.3%) | 2,472 (42.7%) |
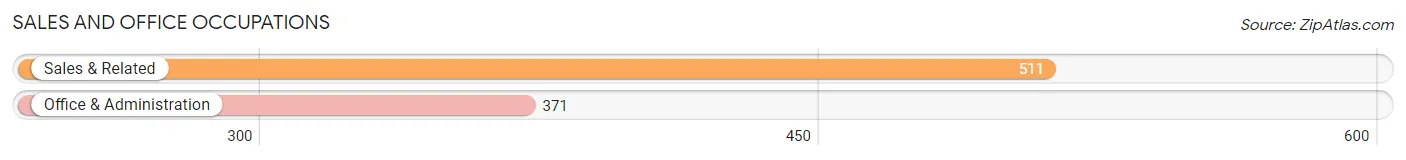
Sales and Office Occupations
The most common Sales and Office occupations in Jerome are Sales & Related (511 | 8.8%), and Office & Administration (371 | 6.4%).
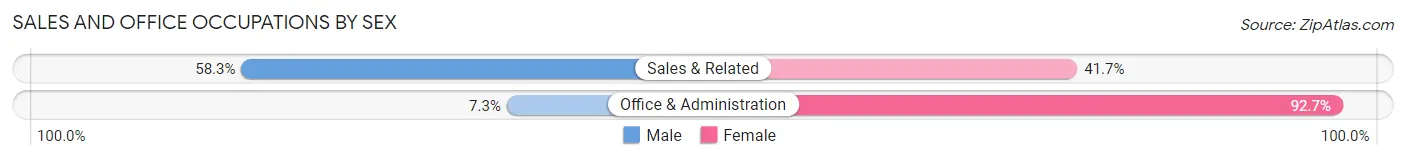
Sales and Office Occupations by Sex
| Occupation | Male | Female |
| Sales & Related | 298 (58.3%) | 213 (41.7%) |
| Office & Administration | 27 (7.3%) | 344 (92.7%) |
| Total (Category) | 325 (36.8%) | 557 (63.1%) |
| Total (Overall) | 3,317 (57.3%) | 2,472 (42.7%) |
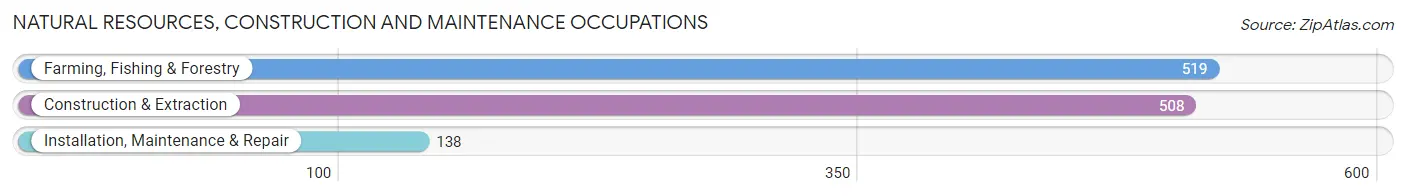
Natural Resources, Construction and Maintenance Occupations
The most common Natural Resources, Construction and Maintenance occupations in Jerome are Farming, Fishing & Forestry (519 | 9.0%), Construction & Extraction (508 | 8.8%), and Installation, Maintenance & Repair (138 | 2.4%).
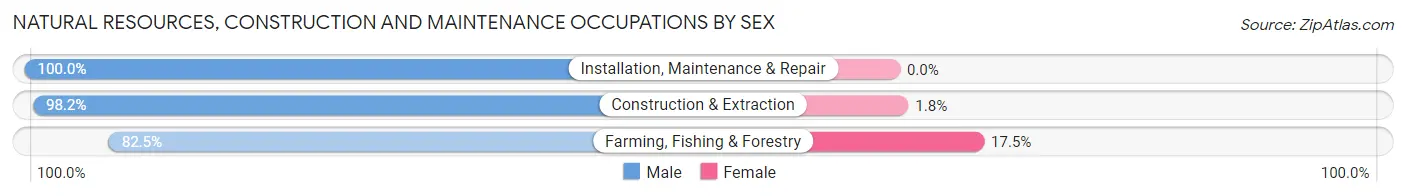
Natural Resources, Construction and Maintenance Occupations by Sex
| Occupation | Male | Female |
| Farming, Fishing & Forestry | 428 (82.5%) | 91 (17.5%) |
| Construction & Extraction | 499 (98.2%) | 9 (1.8%) |
| Installation, Maintenance & Repair | 138 (100.0%) | 0 (0.0%) |
| Total (Category) | 1,065 (91.4%) | 100 (8.6%) |
| Total (Overall) | 3,317 (57.3%) | 2,472 (42.7%) |
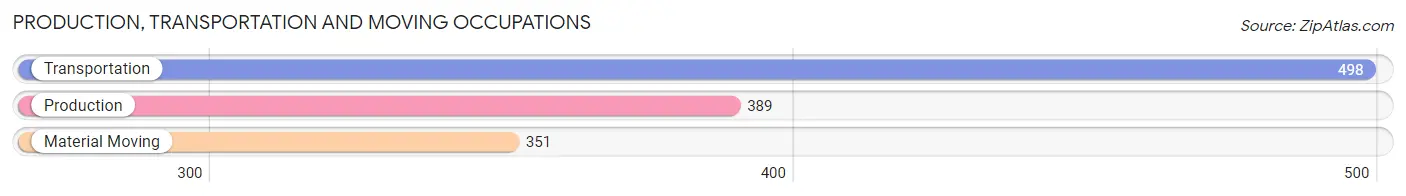
Production, Transportation and Moving Occupations
The most common Production, Transportation and Moving occupations in Jerome are Transportation (498 | 8.6%), Production (389 | 6.7%), and Material Moving (351 | 6.1%).
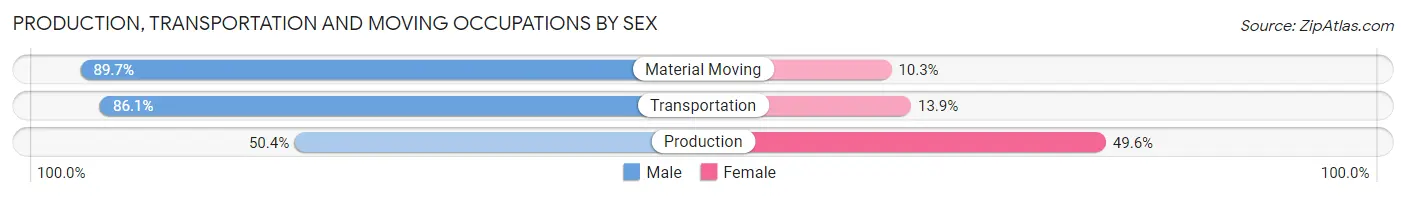
Production, Transportation and Moving Occupations by Sex
| Occupation | Male | Female |
| Production | 196 (50.4%) | 193 (49.6%) |
| Transportation | 429 (86.1%) | 69 (13.9%) |
| Material Moving | 315 (89.7%) | 36 (10.3%) |
| Total (Category) | 940 (75.9%) | 298 (24.1%) |
| Total (Overall) | 3,317 (57.3%) | 2,472 (42.7%) |
Employment Industries by Sex in Jerome
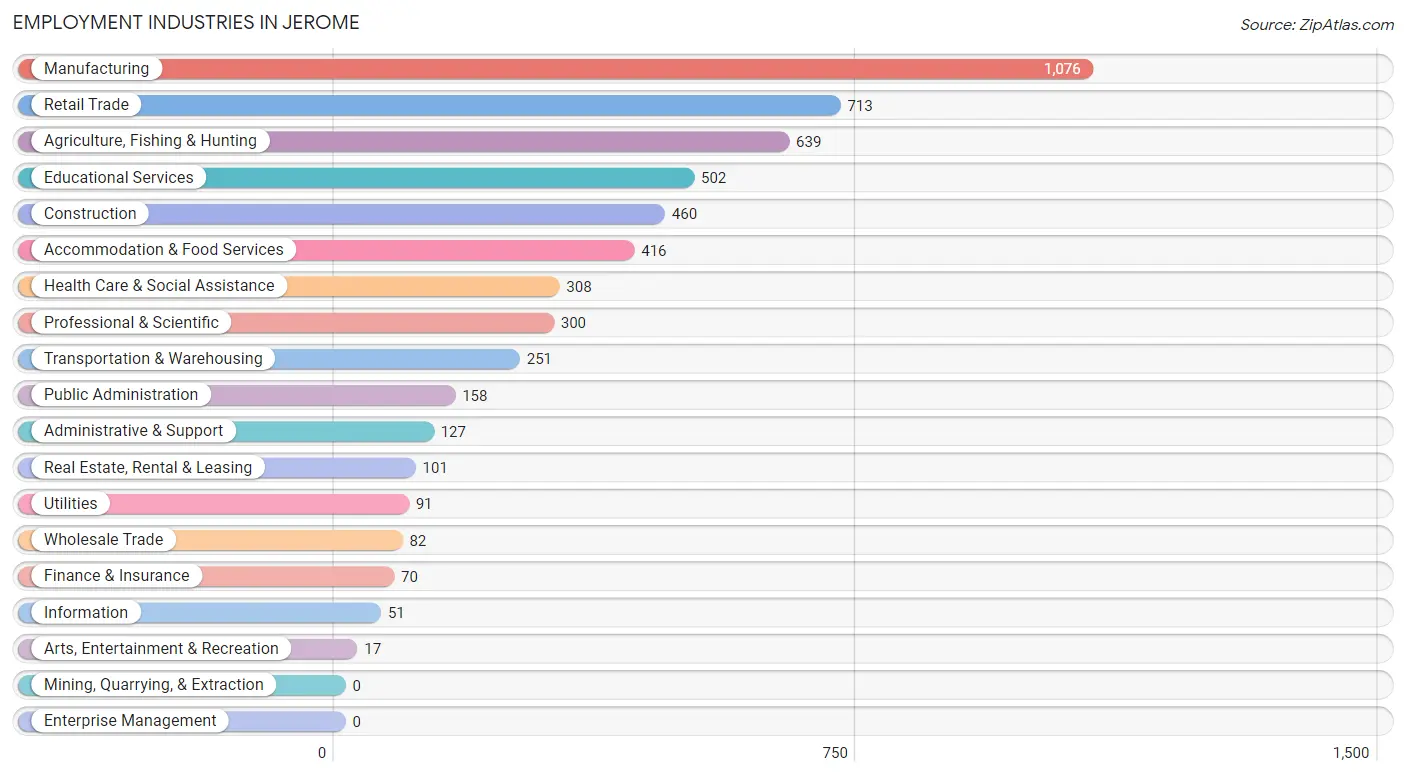
Employment Industries in Jerome
The major employment industries in Jerome include Manufacturing (1,076 | 18.6%), Retail Trade (713 | 12.3%), Agriculture, Fishing & Hunting (639 | 11.0%), Educational Services (502 | 8.7%), and Construction (460 | 8.0%).
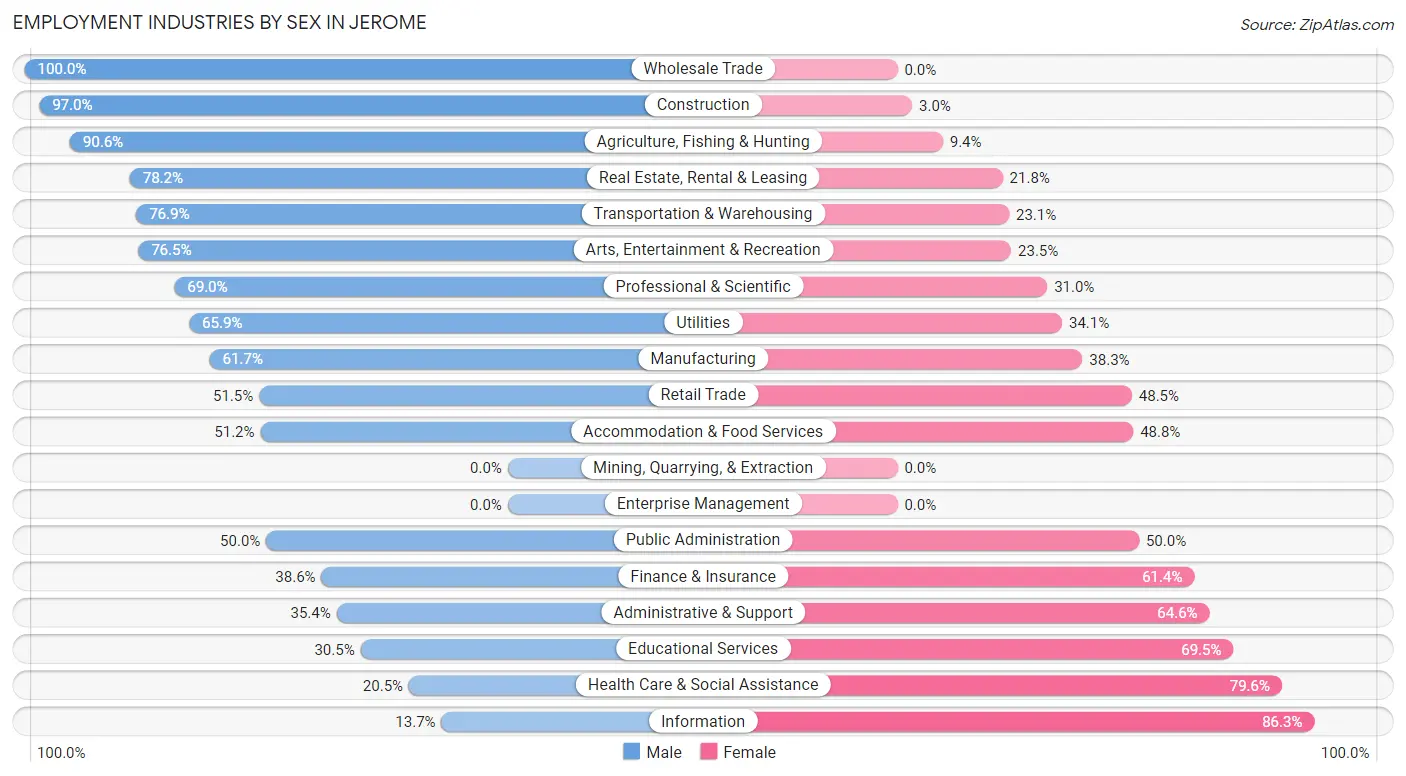
Employment Industries by Sex in Jerome
The Jerome industries that see more men than women are Wholesale Trade (100.0%), Construction (97.0%), and Agriculture, Fishing & Hunting (90.6%), whereas the industries that tend to have a higher number of women are Information (86.3%), Health Care & Social Assistance (79.5%), and Educational Services (69.5%).
| Industry | Male | Female |
| Agriculture, Fishing & Hunting | 579 (90.6%) | 60 (9.4%) |
| Mining, Quarrying, & Extraction | 0 (0.0%) | 0 (0.0%) |
| Construction | 446 (97.0%) | 14 (3.0%) |
| Manufacturing | 664 (61.7%) | 412 (38.3%) |
| Wholesale Trade | 82 (100.0%) | 0 (0.0%) |
| Retail Trade | 367 (51.5%) | 346 (48.5%) |
| Transportation & Warehousing | 193 (76.9%) | 58 (23.1%) |
| Utilities | 60 (65.9%) | 31 (34.1%) |
| Information | 7 (13.7%) | 44 (86.3%) |
| Finance & Insurance | 27 (38.6%) | 43 (61.4%) |
| Real Estate, Rental & Leasing | 79 (78.2%) | 22 (21.8%) |
| Professional & Scientific | 207 (69.0%) | 93 (31.0%) |
| Enterprise Management | 0 (0.0%) | 0 (0.0%) |
| Administrative & Support | 45 (35.4%) | 82 (64.6%) |
| Educational Services | 153 (30.5%) | 349 (69.5%) |
| Health Care & Social Assistance | 63 (20.4%) | 245 (79.5%) |
| Arts, Entertainment & Recreation | 13 (76.5%) | 4 (23.5%) |
| Accommodation & Food Services | 213 (51.2%) | 203 (48.8%) |
| Public Administration | 79 (50.0%) | 79 (50.0%) |
| Total | 3,317 (57.3%) | 2,472 (42.7%) |
Education in Jerome
School Enrollment in Jerome
The most common levels of schooling among the 3,582 students in Jerome are middle school (939 | 26.2%), elementary school (860 | 24.0%), and high school (860 | 24.0%).
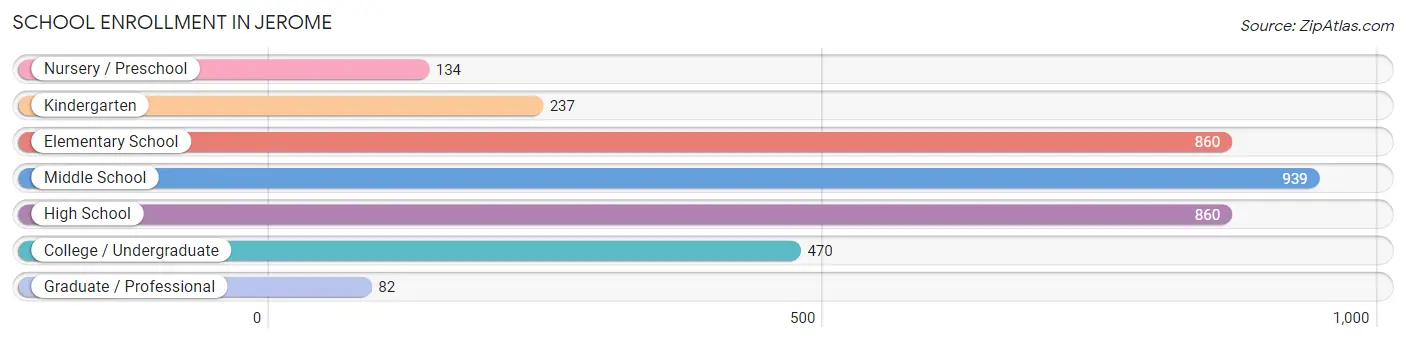
| School Level | # Students | % Students |
| Nursery / Preschool | 134 | 3.7% |
| Kindergarten | 237 | 6.6% |
| Elementary School | 860 | 24.0% |
| Middle School | 939 | 26.2% |
| High School | 860 | 24.0% |
| College / Undergraduate | 470 | 13.1% |
| Graduate / Professional | 82 | 2.3% |
| Total | 3,582 | 100.0% |
School Enrollment by Age by Funding Source in Jerome
Out of a total of 3,582 students who are enrolled in schools in Jerome, 193 (5.4%) attend a private institution, while the remaining 3,389 (94.6%) are enrolled in public schools. The age group of 25 to 34 year olds has the highest likelihood of being enrolled in private schools, with 23 (31.1% in the age bracket) enrolled. Conversely, the age group of 18 to 19 year olds has the lowest likelihood of being enrolled in a private school, with 190 (100.0% in the age bracket) attending a public institution.
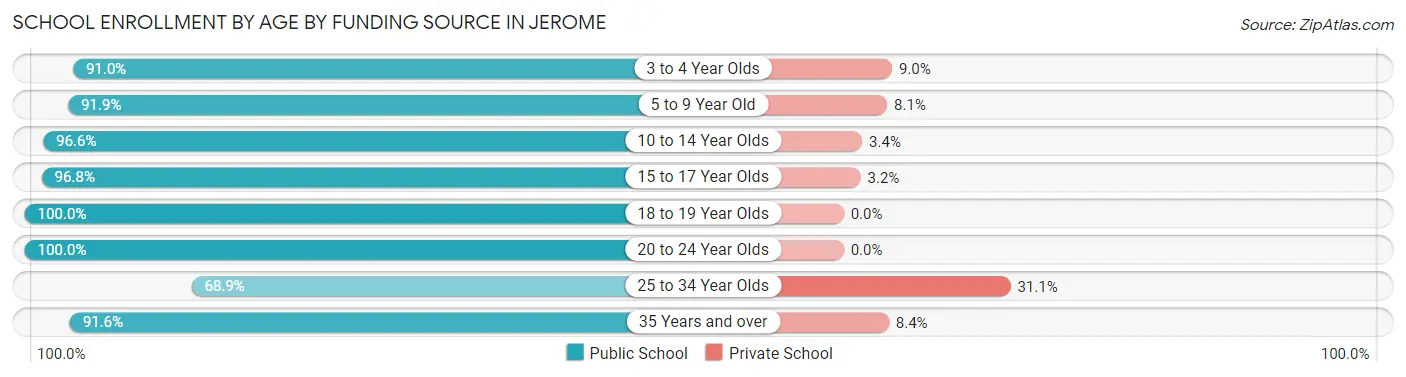
| Age Bracket | Public School | Private School |
| 3 to 4 Year Olds | 101 (91.0%) | 10 (9.0%) |
| 5 to 9 Year Old | 886 (91.9%) | 78 (8.1%) |
| 10 to 14 Year Olds | 1,151 (96.6%) | 41 (3.4%) |
| 15 to 17 Year Olds | 552 (96.8%) | 18 (3.2%) |
| 18 to 19 Year Olds | 190 (100.0%) | 0 (0.0%) |
| 20 to 24 Year Olds | 196 (100.0%) | 0 (0.0%) |
| 25 to 34 Year Olds | 51 (68.9%) | 23 (31.1%) |
| 35 Years and over | 261 (91.6%) | 24 (8.4%) |
| Total | 3,389 (94.6%) | 193 (5.4%) |
Educational Attainment by Field of Study in Jerome
Education (193 | 26.2%), business (127 | 17.2%), bio, nature & agricultural (81 | 11.0%), psychology (60 | 8.1%), and arts & humanities (50 | 6.8%) are the most common fields of study among 737 individuals in Jerome who have obtained a bachelor's degree or higher.
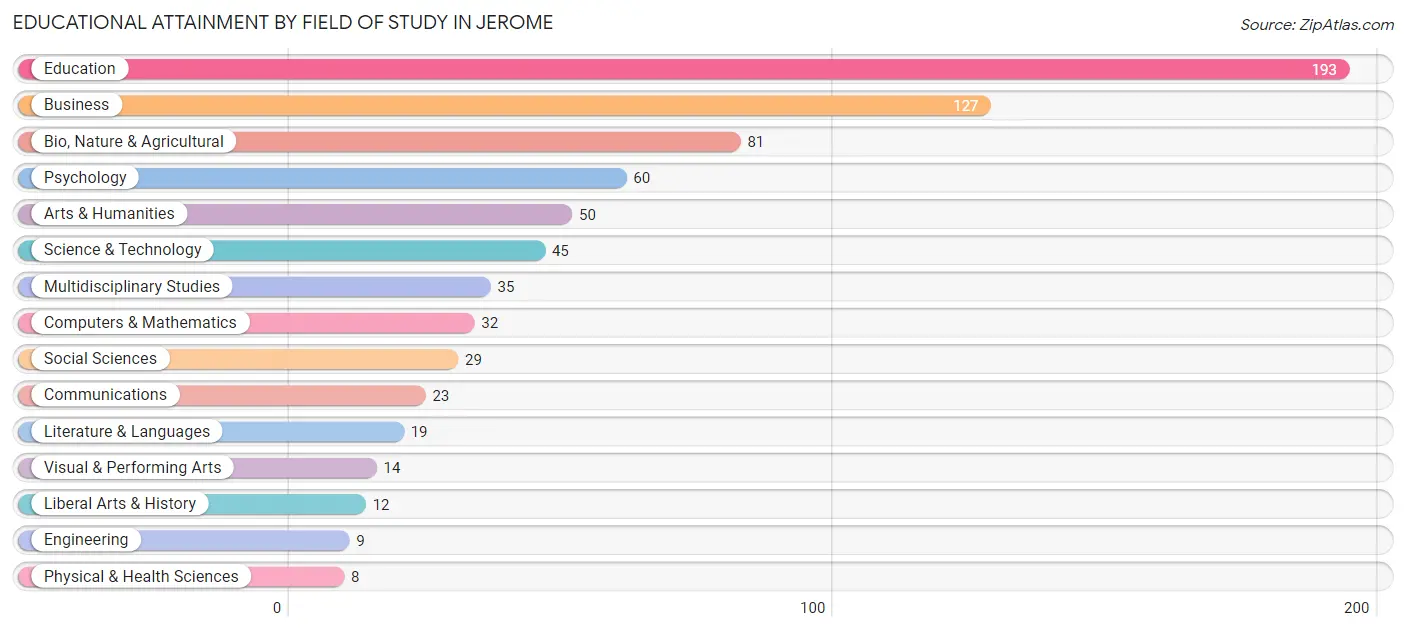
| Field of Study | # Graduates | % Graduates |
| Computers & Mathematics | 32 | 4.3% |
| Bio, Nature & Agricultural | 81 | 11.0% |
| Physical & Health Sciences | 8 | 1.1% |
| Psychology | 60 | 8.1% |
| Social Sciences | 29 | 3.9% |
| Engineering | 9 | 1.2% |
| Multidisciplinary Studies | 35 | 4.8% |
| Science & Technology | 45 | 6.1% |
| Business | 127 | 17.2% |
| Education | 193 | 26.2% |
| Literature & Languages | 19 | 2.6% |
| Liberal Arts & History | 12 | 1.6% |
| Visual & Performing Arts | 14 | 1.9% |
| Communications | 23 | 3.1% |
| Arts & Humanities | 50 | 6.8% |
| Total | 737 | 100.0% |
Transportation & Commute in Jerome
Vehicle Availability by Sex in Jerome
The most prevalent vehicle ownership categories in Jerome are males with 3 vehicles (963, accounting for 29.3%) and females with 3 vehicles (670, making up 40.0%).
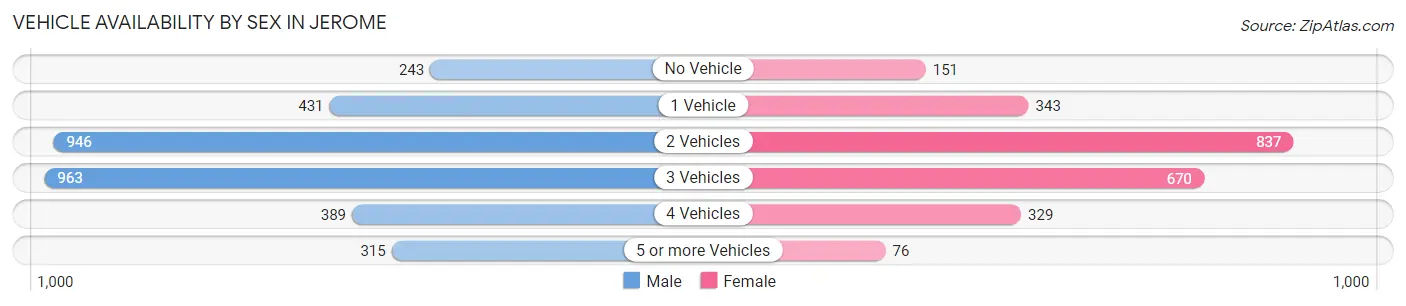
| Vehicles Available | Male | Female |
| No Vehicle | 243 (7.4%) | 151 (6.3%) |
| 1 Vehicle | 431 (13.1%) | 343 (14.3%) |
| 2 Vehicles | 946 (28.8%) | 837 (34.8%) |
| 3 Vehicles | 963 (29.3%) | 670 (27.9%) |
| 4 Vehicles | 389 (11.8%) | 329 (13.7%) |
| 5 or more Vehicles | 315 (9.6%) | 76 (3.2%) |
| Total | 3,287 (100.0%) | 2,406 (100.0%) |
Commute Time in Jerome
The most frequently occuring commute durations in Jerome are 5 to 9 minutes (1,517 commuters, 27.4%), 10 to 14 minutes (924 commuters, 16.7%), and 20 to 24 minutes (832 commuters, 15.0%).
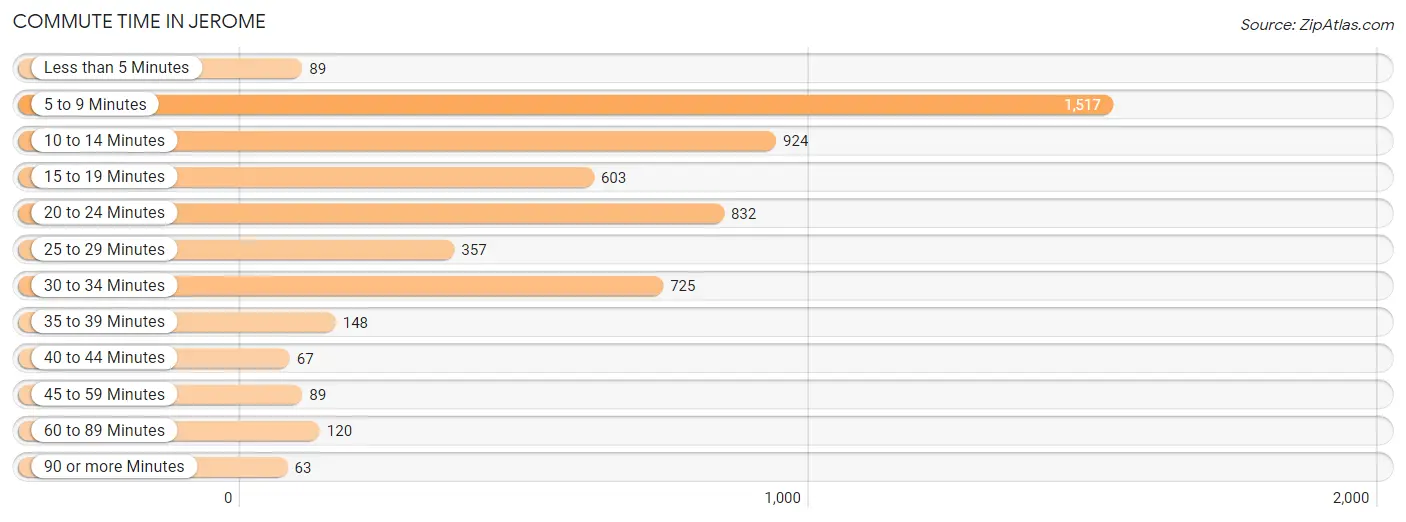
| Commute Time | # Commuters | % Commuters |
| Less than 5 Minutes | 89 | 1.6% |
| 5 to 9 Minutes | 1,517 | 27.4% |
| 10 to 14 Minutes | 924 | 16.7% |
| 15 to 19 Minutes | 603 | 10.9% |
| 20 to 24 Minutes | 832 | 15.0% |
| 25 to 29 Minutes | 357 | 6.5% |
| 30 to 34 Minutes | 725 | 13.1% |
| 35 to 39 Minutes | 148 | 2.7% |
| 40 to 44 Minutes | 67 | 1.2% |
| 45 to 59 Minutes | 89 | 1.6% |
| 60 to 89 Minutes | 120 | 2.2% |
| 90 or more Minutes | 63 | 1.1% |
Commute Time by Sex in Jerome
The most common commute times in Jerome are 5 to 9 minutes (770 commuters, 23.8%) for males and 5 to 9 minutes (747 commuters, 32.4%) for females.
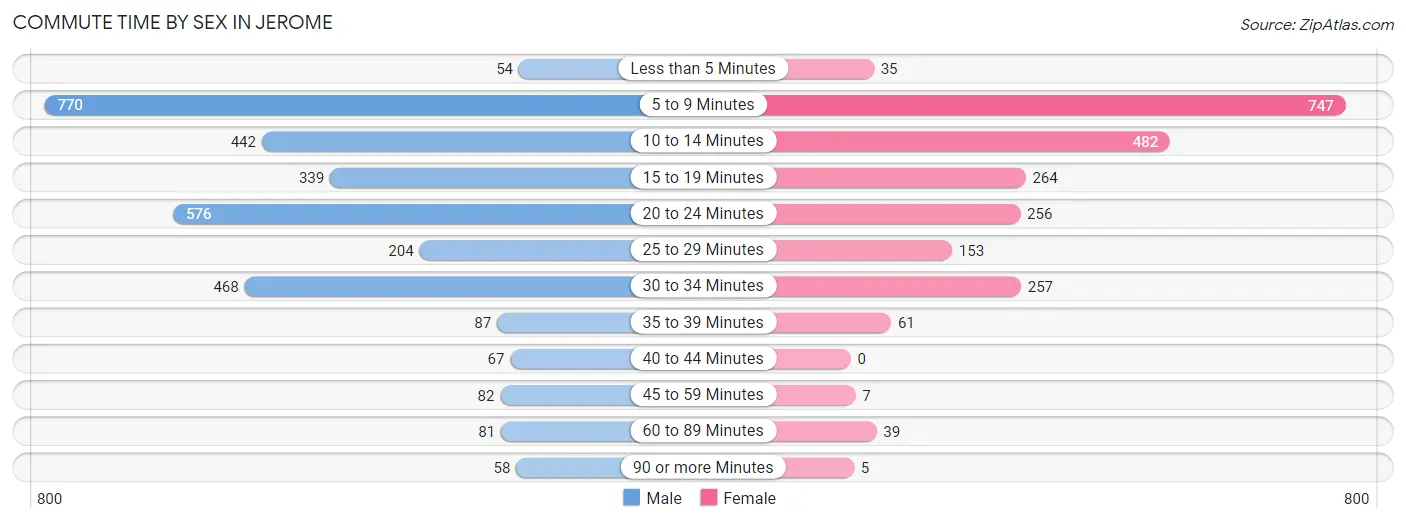
| Commute Time | Male | Female |
| Less than 5 Minutes | 54 (1.7%) | 35 (1.5%) |
| 5 to 9 Minutes | 770 (23.8%) | 747 (32.4%) |
| 10 to 14 Minutes | 442 (13.7%) | 482 (20.9%) |
| 15 to 19 Minutes | 339 (10.5%) | 264 (11.5%) |
| 20 to 24 Minutes | 576 (17.8%) | 256 (11.1%) |
| 25 to 29 Minutes | 204 (6.3%) | 153 (6.6%) |
| 30 to 34 Minutes | 468 (14.5%) | 257 (11.1%) |
| 35 to 39 Minutes | 87 (2.7%) | 61 (2.6%) |
| 40 to 44 Minutes | 67 (2.1%) | 0 (0.0%) |
| 45 to 59 Minutes | 82 (2.5%) | 7 (0.3%) |
| 60 to 89 Minutes | 81 (2.5%) | 39 (1.7%) |
| 90 or more Minutes | 58 (1.8%) | 5 (0.2%) |
Time of Departure to Work by Sex in Jerome
The most frequent times of departure to work in Jerome are 6:00 AM to 6:29 AM (605, 18.7%) for males and 9:00 AM to 9:59 AM (458, 19.9%) for females.
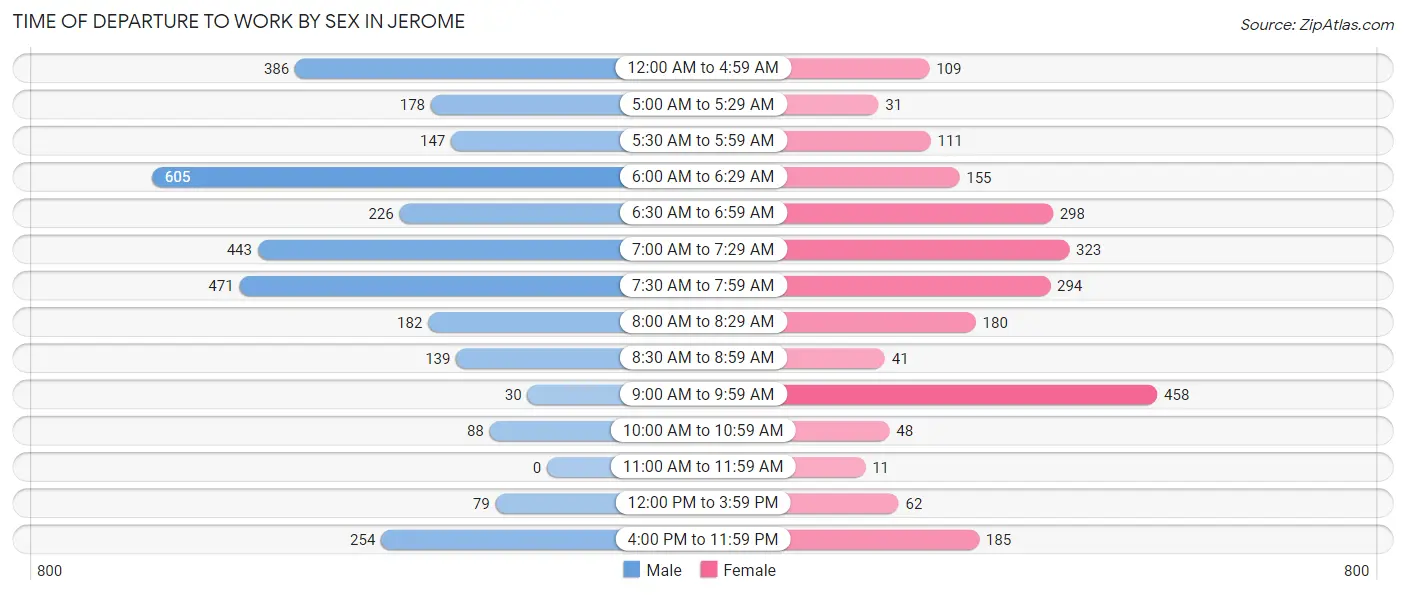
| Time of Departure | Male | Female |
| 12:00 AM to 4:59 AM | 386 (12.0%) | 109 (4.7%) |
| 5:00 AM to 5:29 AM | 178 (5.5%) | 31 (1.3%) |
| 5:30 AM to 5:59 AM | 147 (4.5%) | 111 (4.8%) |
| 6:00 AM to 6:29 AM | 605 (18.7%) | 155 (6.7%) |
| 6:30 AM to 6:59 AM | 226 (7.0%) | 298 (12.9%) |
| 7:00 AM to 7:29 AM | 443 (13.7%) | 323 (14.0%) |
| 7:30 AM to 7:59 AM | 471 (14.6%) | 294 (12.8%) |
| 8:00 AM to 8:29 AM | 182 (5.6%) | 180 (7.8%) |
| 8:30 AM to 8:59 AM | 139 (4.3%) | 41 (1.8%) |
| 9:00 AM to 9:59 AM | 30 (0.9%) | 458 (19.9%) |
| 10:00 AM to 10:59 AM | 88 (2.7%) | 48 (2.1%) |
| 11:00 AM to 11:59 AM | 0 (0.0%) | 11 (0.5%) |
| 12:00 PM to 3:59 PM | 79 (2.5%) | 62 (2.7%) |
| 4:00 PM to 11:59 PM | 254 (7.9%) | 185 (8.0%) |
| Total | 3,228 (100.0%) | 2,306 (100.0%) |
Housing Occupancy in Jerome
Occupancy by Ownership in Jerome
Of the total 4,005 dwellings in Jerome, owner-occupied units account for 2,657 (66.3%), while renter-occupied units make up 1,348 (33.7%).
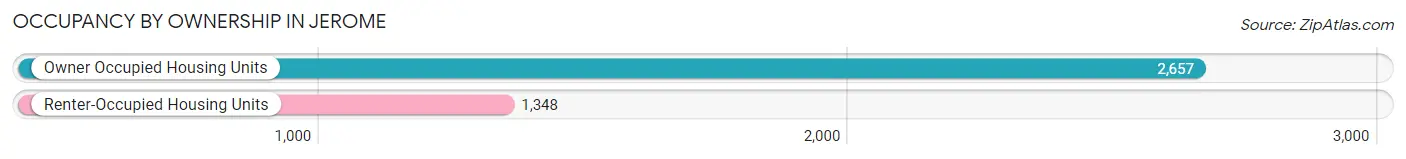
| Occupancy | # Housing Units | % Housing Units |
| Owner Occupied Housing Units | 2,657 | 66.3% |
| Renter-Occupied Housing Units | 1,348 | 33.7% |
| Total Occupied Housing Units | 4,005 | 100.0% |
Occupancy by Household Size in Jerome
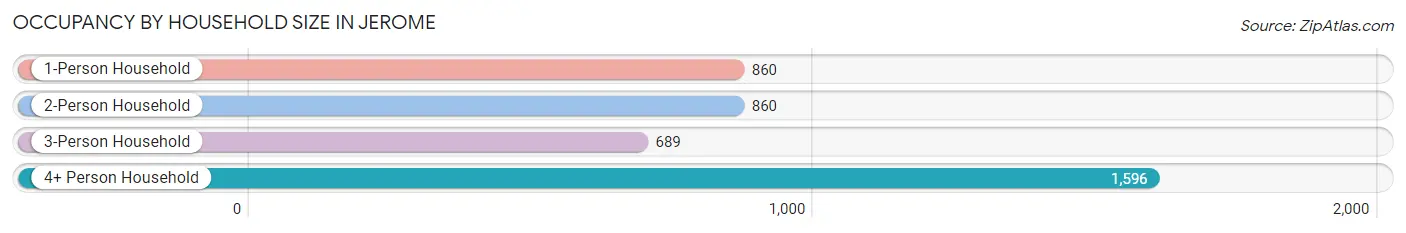
| Household Size | # Housing Units | % Housing Units |
| 1-Person Household | 860 | 21.5% |
| 2-Person Household | 860 | 21.5% |
| 3-Person Household | 689 | 17.2% |
| 4+ Person Household | 1,596 | 39.9% |
| Total Housing Units | 4,005 | 100.0% |
Occupancy by Ownership by Household Size in Jerome
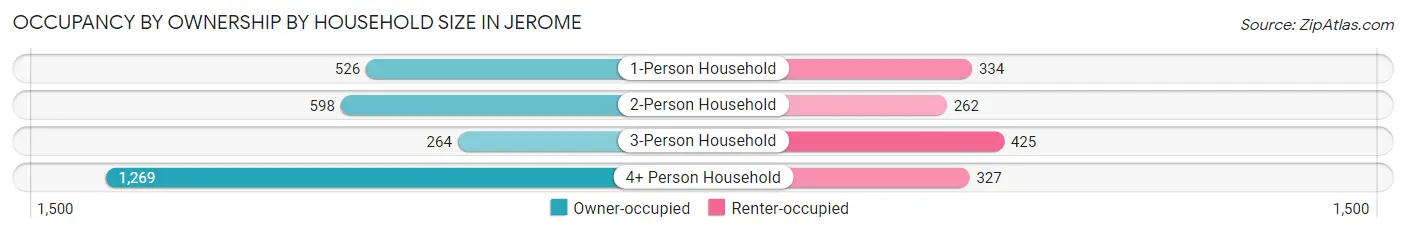
| Household Size | Owner-occupied | Renter-occupied |
| 1-Person Household | 526 (61.2%) | 334 (38.8%) |
| 2-Person Household | 598 (69.5%) | 262 (30.5%) |
| 3-Person Household | 264 (38.3%) | 425 (61.7%) |
| 4+ Person Household | 1,269 (79.5%) | 327 (20.5%) |
| Total Housing Units | 2,657 (66.3%) | 1,348 (33.7%) |
Occupancy by Educational Attainment in Jerome
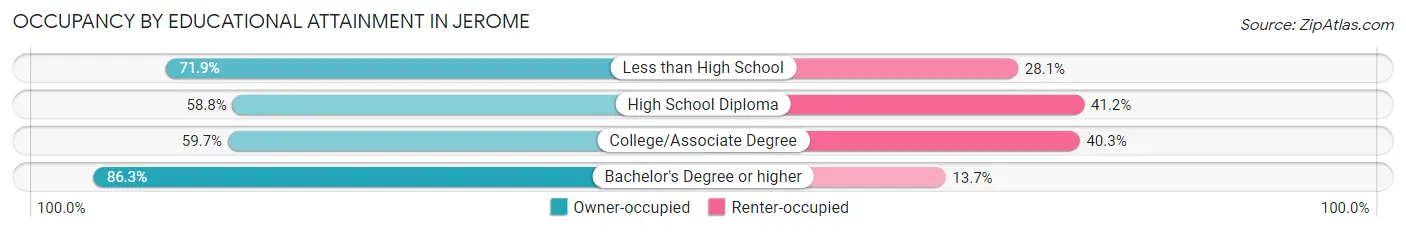
| Household Size | Owner-occupied | Renter-occupied |
| Less than High School | 778 (71.9%) | 304 (28.1%) |
| High School Diploma | 573 (58.8%) | 402 (41.2%) |
| College/Associate Degree | 841 (59.7%) | 568 (40.3%) |
| Bachelor's Degree or higher | 465 (86.3%) | 74 (13.7%) |
Occupancy by Age of Householder in Jerome
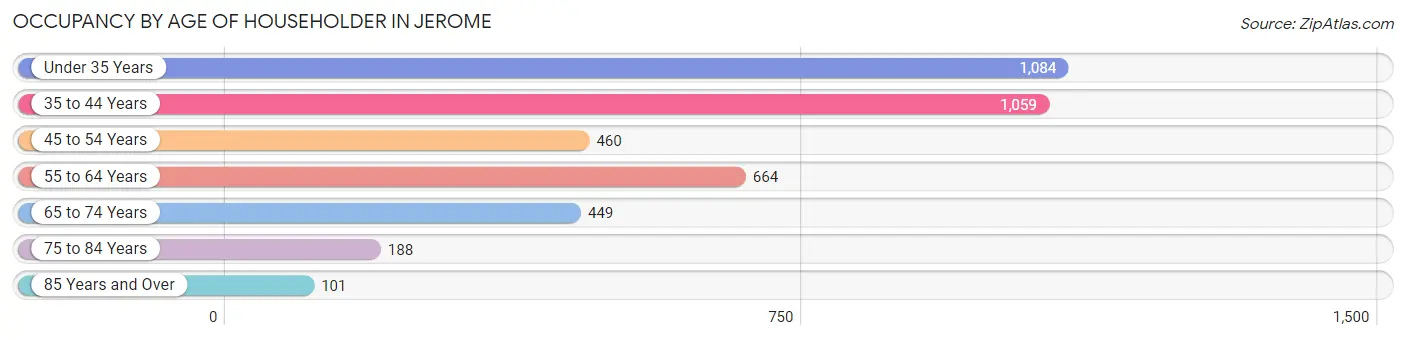
| Age Bracket | # Households | % Households |
| Under 35 Years | 1,084 | 27.1% |
| 35 to 44 Years | 1,059 | 26.4% |
| 45 to 54 Years | 460 | 11.5% |
| 55 to 64 Years | 664 | 16.6% |
| 65 to 74 Years | 449 | 11.2% |
| 75 to 84 Years | 188 | 4.7% |
| 85 Years and Over | 101 | 2.5% |
| Total | 4,005 | 100.0% |
Housing Finances in Jerome
Median Income by Occupancy in Jerome
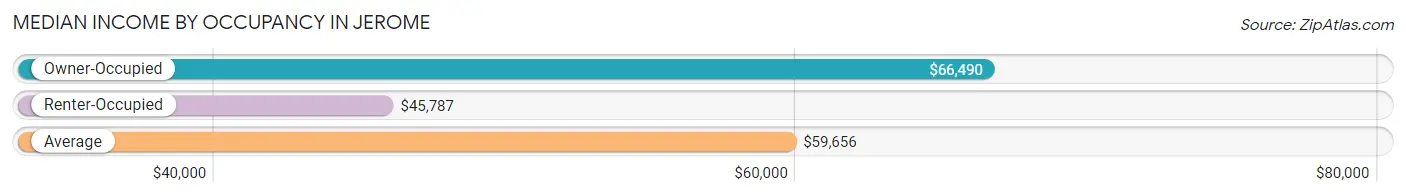
| Occupancy Type | # Households | Median Income |
| Owner-Occupied | 2,657 (66.3%) | $66,490 |
| Renter-Occupied | 1,348 (33.7%) | $45,787 |
| Average | 4,005 (100.0%) | $59,656 |
Occupancy by Householder Income Bracket in Jerome
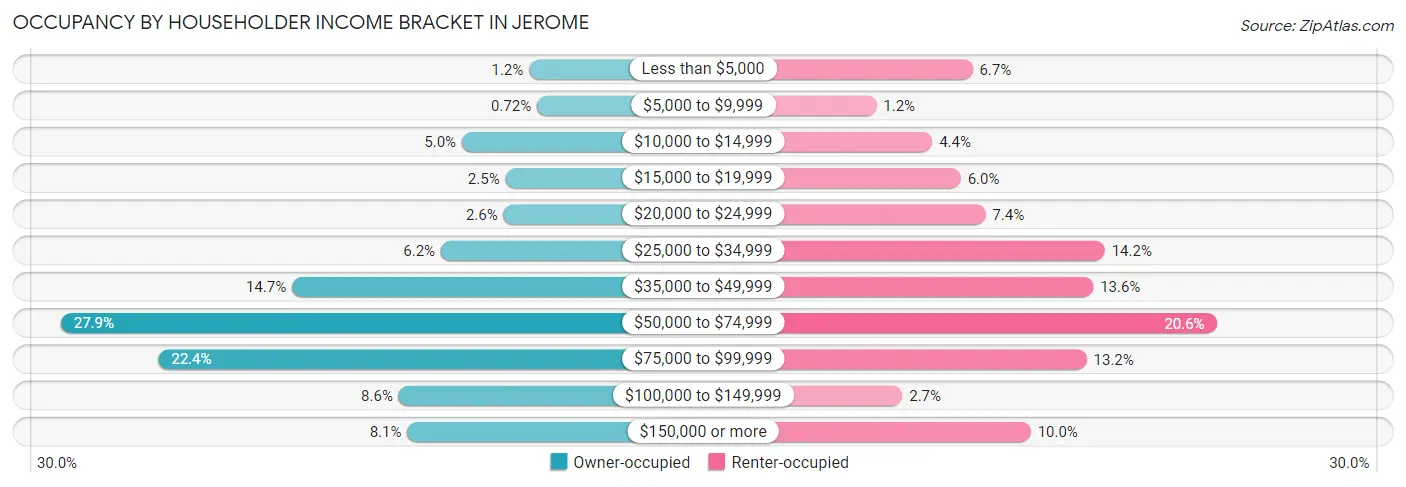
| Income Bracket | Owner-occupied | Renter-occupied |
| Less than $5,000 | 31 (1.2%) | 90 (6.7%) |
| $5,000 to $9,999 | 19 (0.7%) | 16 (1.2%) |
| $10,000 to $14,999 | 133 (5.0%) | 59 (4.4%) |
| $15,000 to $19,999 | 67 (2.5%) | 81 (6.0%) |
| $20,000 to $24,999 | 70 (2.6%) | 100 (7.4%) |
| $25,000 to $34,999 | 165 (6.2%) | 192 (14.2%) |
| $35,000 to $49,999 | 391 (14.7%) | 183 (13.6%) |
| $50,000 to $74,999 | 742 (27.9%) | 278 (20.6%) |
| $75,000 to $99,999 | 594 (22.4%) | 178 (13.2%) |
| $100,000 to $149,999 | 229 (8.6%) | 36 (2.7%) |
| $150,000 or more | 216 (8.1%) | 135 (10.0%) |
| Total | 2,657 (100.0%) | 1,348 (100.0%) |
Monthly Housing Cost Tiers in Jerome
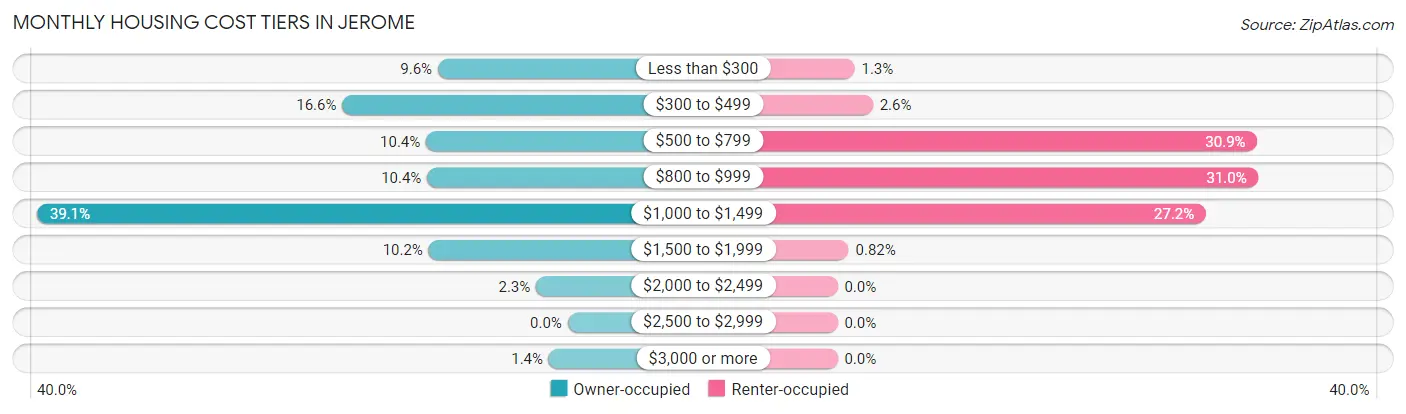
| Monthly Cost | Owner-occupied | Renter-occupied |
| Less than $300 | 254 (9.6%) | 17 (1.3%) |
| $300 to $499 | 441 (16.6%) | 35 (2.6%) |
| $500 to $799 | 277 (10.4%) | 417 (30.9%) |
| $800 to $999 | 275 (10.3%) | 418 (31.0%) |
| $1,000 to $1,499 | 1,039 (39.1%) | 366 (27.2%) |
| $1,500 to $1,999 | 272 (10.2%) | 11 (0.8%) |
| $2,000 to $2,499 | 62 (2.3%) | 0 (0.0%) |
| $2,500 to $2,999 | 0 (0.0%) | 0 (0.0%) |
| $3,000 or more | 37 (1.4%) | 0 (0.0%) |
| Total | 2,657 (100.0%) | 1,348 (100.0%) |
Physical Housing Characteristics in Jerome
Housing Structures in Jerome
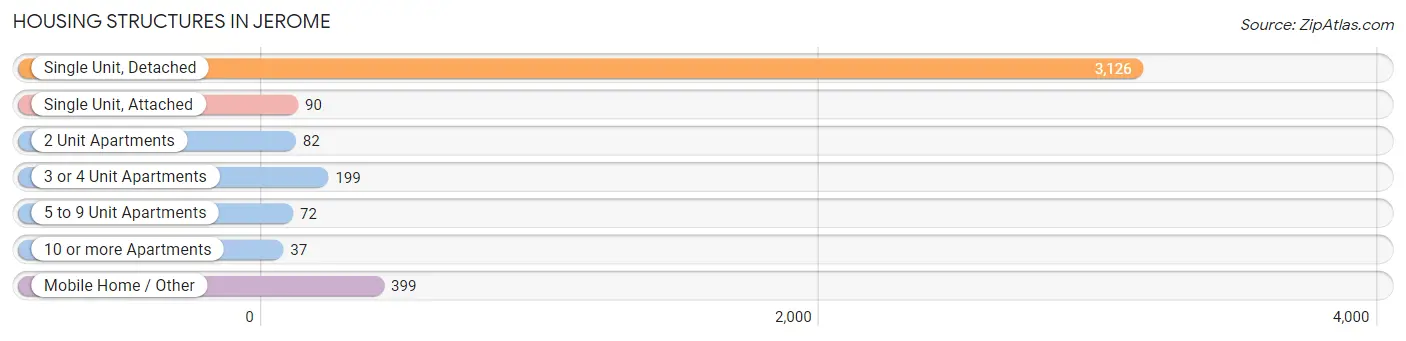
| Structure Type | # Housing Units | % Housing Units |
| Single Unit, Detached | 3,126 | 78.0% |
| Single Unit, Attached | 90 | 2.2% |
| 2 Unit Apartments | 82 | 2.1% |
| 3 or 4 Unit Apartments | 199 | 5.0% |
| 5 to 9 Unit Apartments | 72 | 1.8% |
| 10 or more Apartments | 37 | 0.9% |
| Mobile Home / Other | 399 | 10.0% |
| Total | 4,005 | 100.0% |
Housing Structures by Occupancy in Jerome
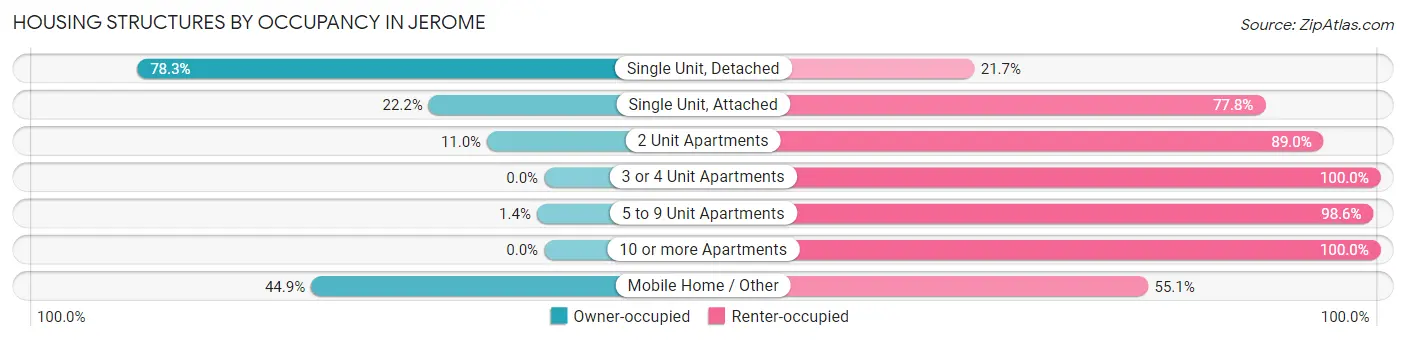
| Structure Type | Owner-occupied | Renter-occupied |
| Single Unit, Detached | 2,448 (78.3%) | 678 (21.7%) |
| Single Unit, Attached | 20 (22.2%) | 70 (77.8%) |
| 2 Unit Apartments | 9 (11.0%) | 73 (89.0%) |
| 3 or 4 Unit Apartments | 0 (0.0%) | 199 (100.0%) |
| 5 to 9 Unit Apartments | 1 (1.4%) | 71 (98.6%) |
| 10 or more Apartments | 0 (0.0%) | 37 (100.0%) |
| Mobile Home / Other | 179 (44.9%) | 220 (55.1%) |
| Total | 2,657 (66.3%) | 1,348 (33.7%) |
Housing Structures by Number of Rooms in Jerome
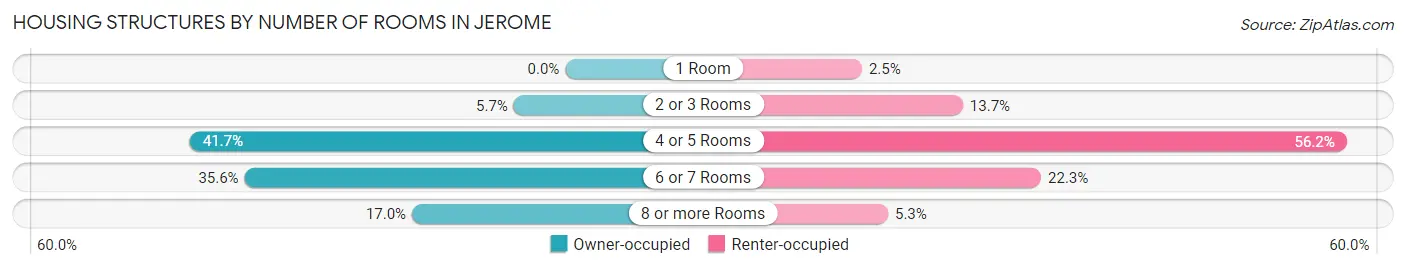
| Number of Rooms | Owner-occupied | Renter-occupied |
| 1 Room | 0 (0.0%) | 33 (2.5%) |
| 2 or 3 Rooms | 152 (5.7%) | 184 (13.7%) |
| 4 or 5 Rooms | 1,107 (41.7%) | 758 (56.2%) |
| 6 or 7 Rooms | 946 (35.6%) | 301 (22.3%) |
| 8 or more Rooms | 452 (17.0%) | 72 (5.3%) |
| Total | 2,657 (100.0%) | 1,348 (100.0%) |
Housing Structure by Heating Type in Jerome
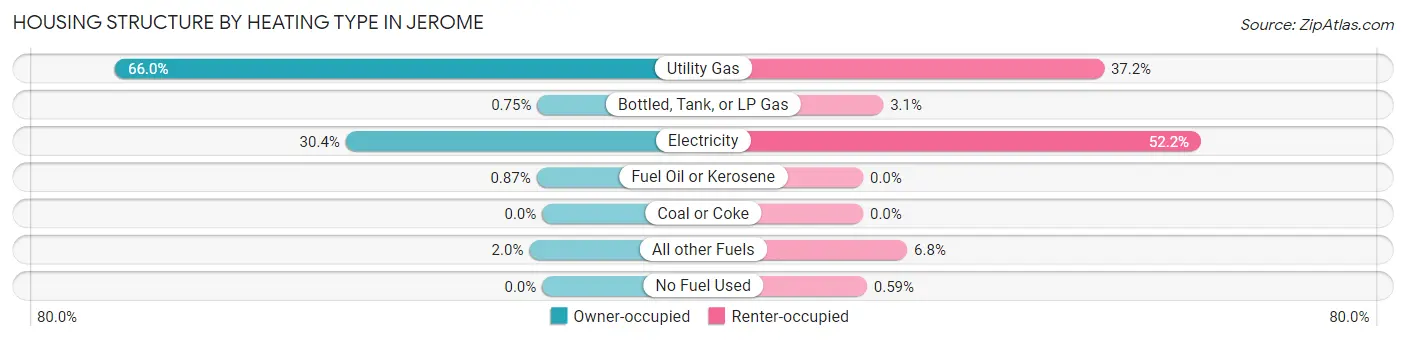
| Heating Type | Owner-occupied | Renter-occupied |
| Utility Gas | 1,754 (66.0%) | 502 (37.2%) |
| Bottled, Tank, or LP Gas | 20 (0.7%) | 42 (3.1%) |
| Electricity | 807 (30.4%) | 704 (52.2%) |
| Fuel Oil or Kerosene | 23 (0.9%) | 0 (0.0%) |
| Coal or Coke | 0 (0.0%) | 0 (0.0%) |
| All other Fuels | 53 (2.0%) | 92 (6.8%) |
| No Fuel Used | 0 (0.0%) | 8 (0.6%) |
| Total | 2,657 (100.0%) | 1,348 (100.0%) |
Household Vehicle Usage in Jerome
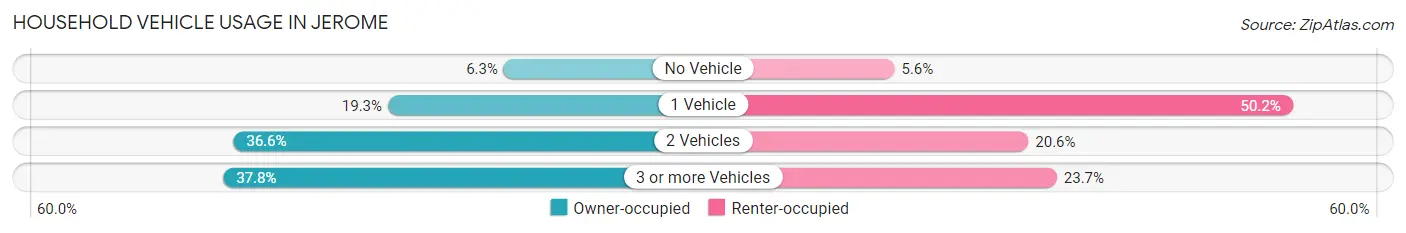
| Vehicles per Household | Owner-occupied | Renter-occupied |
| No Vehicle | 168 (6.3%) | 75 (5.6%) |
| 1 Vehicle | 513 (19.3%) | 676 (50.1%) |
| 2 Vehicles | 973 (36.6%) | 277 (20.5%) |
| 3 or more Vehicles | 1,003 (37.8%) | 320 (23.7%) |
| Total | 2,657 (100.0%) | 1,348 (100.0%) |
Real Estate & Mortgages in Jerome
Real Estate and Mortgage Overview in Jerome
| Characteristic | Without Mortgage | With Mortgage |
| Housing Units | 809 | 1,848 |
| Median Property Value | $184,000 | $194,000 |
| Median Household Income | $41,358 | $158 |
| Monthly Housing Costs | $346 | $37 |
| Real Estate Taxes | $1,245 | $171 |
Property Value by Mortgage Status in Jerome
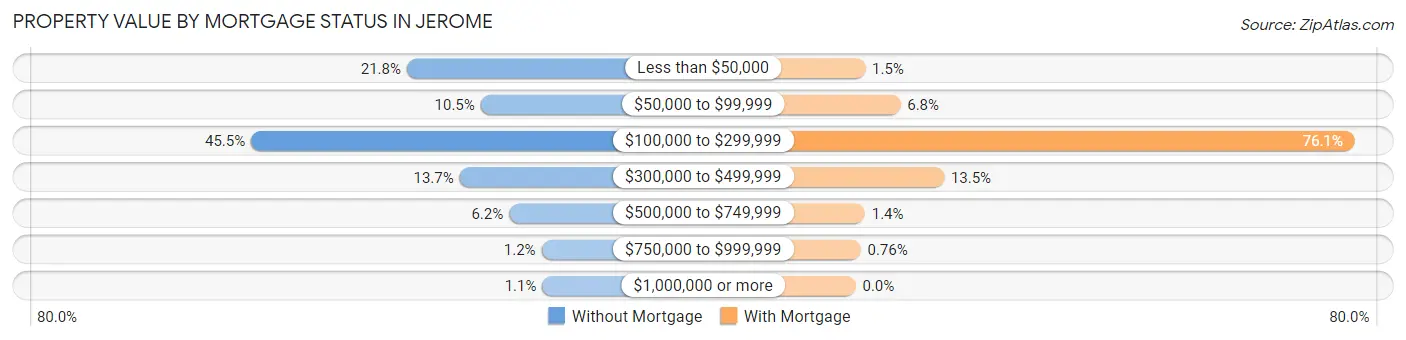
| Property Value | Without Mortgage | With Mortgage |
| Less than $50,000 | 176 (21.8%) | 27 (1.5%) |
| $50,000 to $99,999 | 85 (10.5%) | 126 (6.8%) |
| $100,000 to $299,999 | 368 (45.5%) | 1,406 (76.1%) |
| $300,000 to $499,999 | 111 (13.7%) | 249 (13.5%) |
| $500,000 to $749,999 | 50 (6.2%) | 26 (1.4%) |
| $750,000 to $999,999 | 10 (1.2%) | 14 (0.8%) |
| $1,000,000 or more | 9 (1.1%) | 0 (0.0%) |
| Total | 809 (100.0%) | 1,848 (100.0%) |
Household Income by Mortgage Status in Jerome
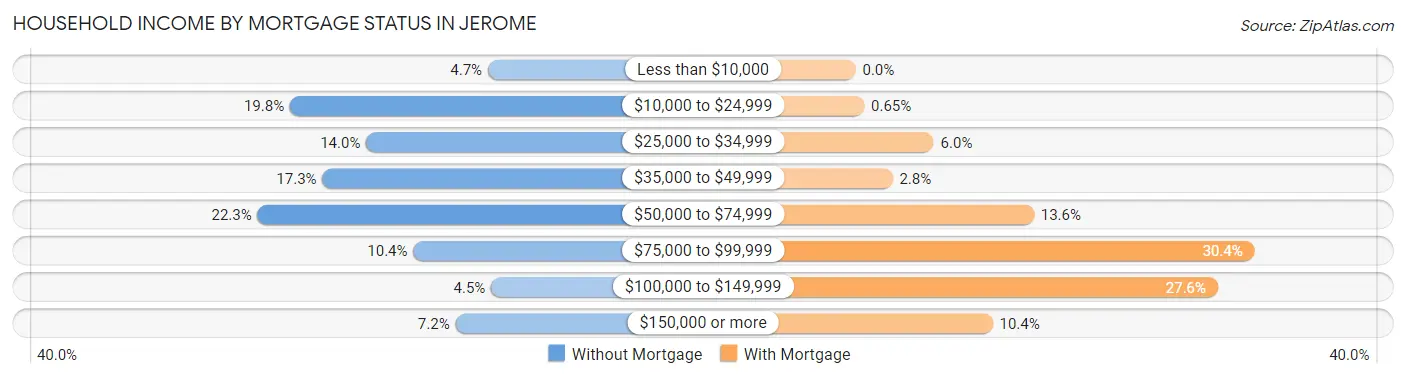
| Household Income | Without Mortgage | With Mortgage |
| Less than $10,000 | 38 (4.7%) | 0 (0.0%) |
| $10,000 to $24,999 | 160 (19.8%) | 12 (0.6%) |
| $25,000 to $34,999 | 113 (14.0%) | 110 (5.9%) |
| $35,000 to $49,999 | 140 (17.3%) | 52 (2.8%) |
| $50,000 to $74,999 | 180 (22.3%) | 251 (13.6%) |
| $75,000 to $99,999 | 84 (10.4%) | 562 (30.4%) |
| $100,000 to $149,999 | 36 (4.4%) | 510 (27.6%) |
| $150,000 or more | 58 (7.2%) | 193 (10.4%) |
| Total | 809 (100.0%) | 1,848 (100.0%) |
Property Value to Household Income Ratio in Jerome
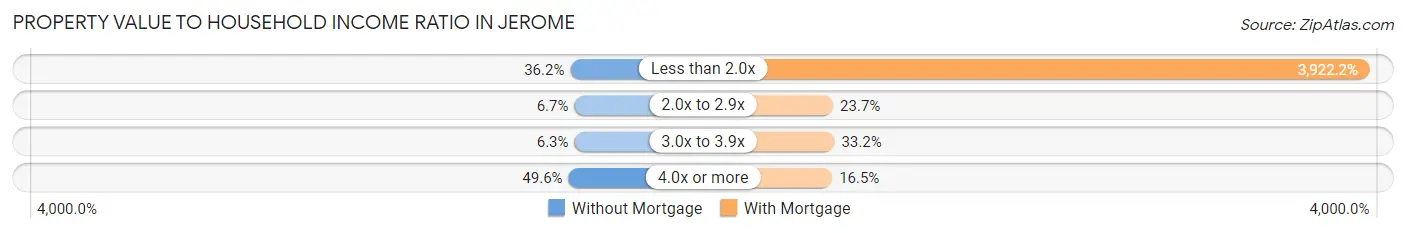
| Value-to-Income Ratio | Without Mortgage | With Mortgage |
| Less than 2.0x | 293 (36.2%) | 72,482 (3,922.2%) |
| 2.0x to 2.9x | 54 (6.7%) | 437 (23.6%) |
| 3.0x to 3.9x | 51 (6.3%) | 613 (33.2%) |
| 4.0x or more | 401 (49.6%) | 305 (16.5%) |
| Total | 809 (100.0%) | 1,848 (100.0%) |
Real Estate Taxes by Mortgage Status in Jerome
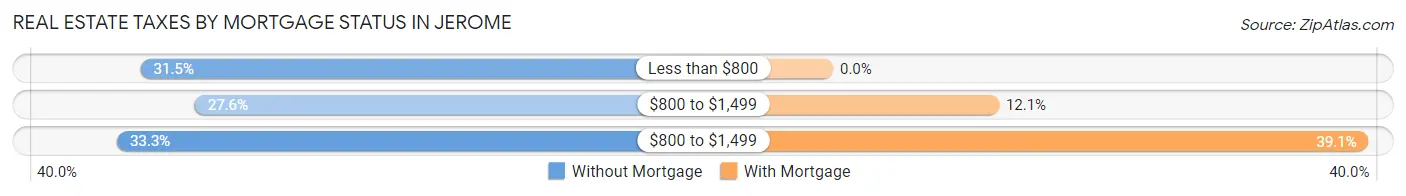
| Property Taxes | Without Mortgage | With Mortgage |
| Less than $800 | 255 (31.5%) | 0 (0.0%) |
| $800 to $1,499 | 223 (27.6%) | 224 (12.1%) |
| $800 to $1,499 | 269 (33.3%) | 723 (39.1%) |
| Total | 809 (100.0%) | 1,848 (100.0%) |
Health & Disability in Jerome
Health Insurance Coverage by Age in Jerome
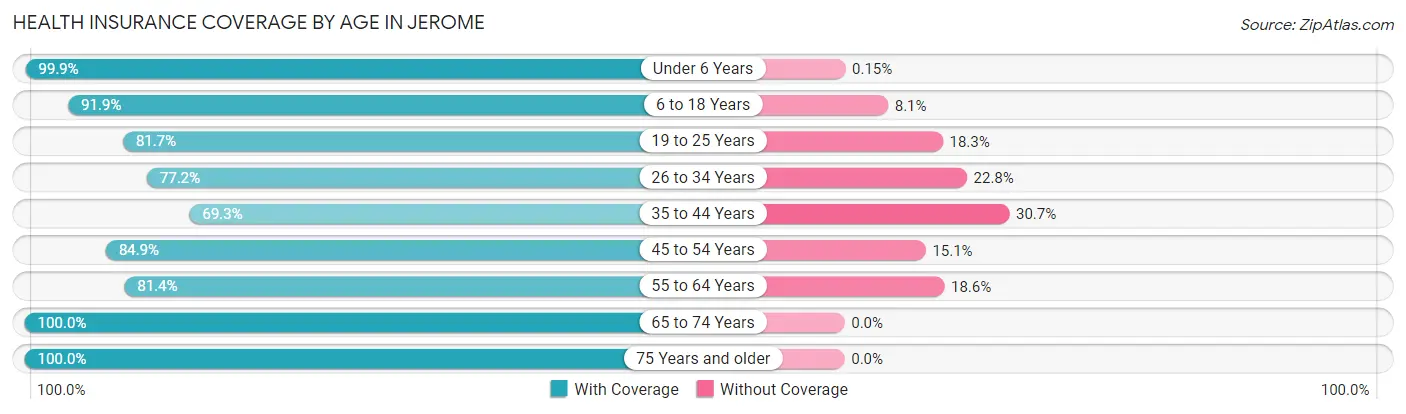
| Age Bracket | With Coverage | Without Coverage |
| Under 6 Years | 1,322 (99.9%) | 2 (0.2%) |
| 6 to 18 Years | 2,788 (91.9%) | 246 (8.1%) |
| 19 to 25 Years | 865 (81.7%) | 194 (18.3%) |
| 26 to 34 Years | 1,384 (77.2%) | 409 (22.8%) |
| 35 to 44 Years | 1,265 (69.3%) | 561 (30.7%) |
| 45 to 54 Years | 903 (84.9%) | 161 (15.1%) |
| 55 to 64 Years | 998 (81.4%) | 228 (18.6%) |
| 65 to 74 Years | 643 (100.0%) | 0 (0.0%) |
| 75 Years and older | 396 (100.0%) | 0 (0.0%) |
| Total | 10,564 (85.4%) | 1,801 (14.6%) |
Health Insurance Coverage by Citizenship Status in Jerome
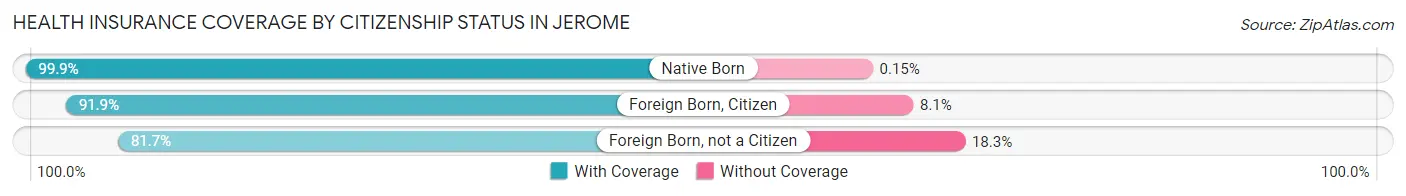
| Citizenship Status | With Coverage | Without Coverage |
| Native Born | 1,322 (99.9%) | 2 (0.2%) |
| Foreign Born, Citizen | 2,788 (91.9%) | 246 (8.1%) |
| Foreign Born, not a Citizen | 865 (81.7%) | 194 (18.3%) |
Health Insurance Coverage by Household Income in Jerome
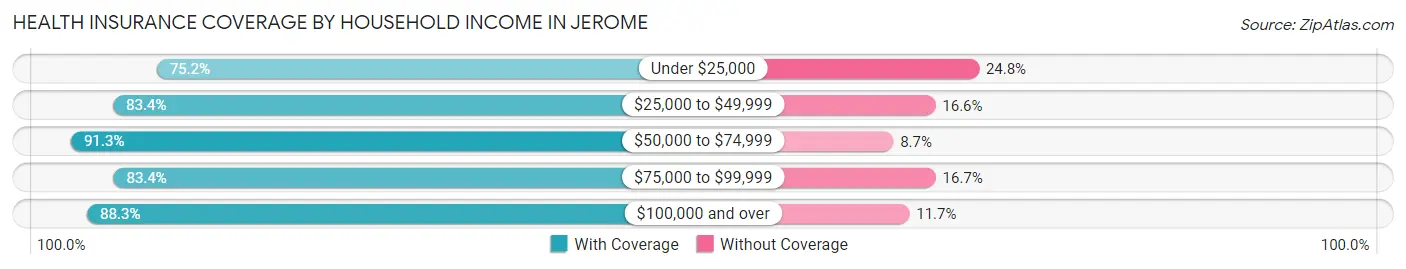
| Household Income | With Coverage | Without Coverage |
| Under $25,000 | 1,200 (75.2%) | 395 (24.8%) |
| $25,000 to $49,999 | 2,061 (83.4%) | 410 (16.6%) |
| $50,000 to $74,999 | 3,063 (91.3%) | 292 (8.7%) |
| $75,000 to $99,999 | 2,068 (83.4%) | 413 (16.7%) |
| $100,000 and over | 2,134 (88.3%) | 283 (11.7%) |
Public vs Private Health Insurance Coverage by Age in Jerome
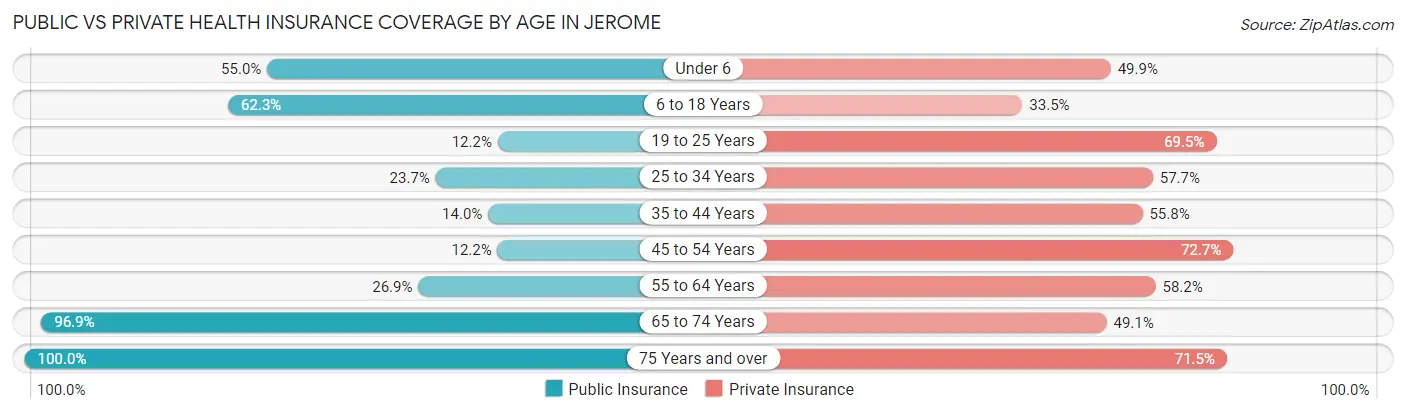
| Age Bracket | Public Insurance | Private Insurance |
| Under 6 | 728 (55.0%) | 661 (49.9%) |
| 6 to 18 Years | 1,889 (62.3%) | 1,017 (33.5%) |
| 19 to 25 Years | 129 (12.2%) | 736 (69.5%) |
| 25 to 34 Years | 425 (23.7%) | 1,035 (57.7%) |
| 35 to 44 Years | 255 (14.0%) | 1,019 (55.8%) |
| 45 to 54 Years | 130 (12.2%) | 773 (72.7%) |
| 55 to 64 Years | 330 (26.9%) | 714 (58.2%) |
| 65 to 74 Years | 623 (96.9%) | 316 (49.1%) |
| 75 Years and over | 396 (100.0%) | 283 (71.5%) |
| Total | 4,905 (39.7%) | 6,554 (53.0%) |
Disability Status by Sex by Age in Jerome
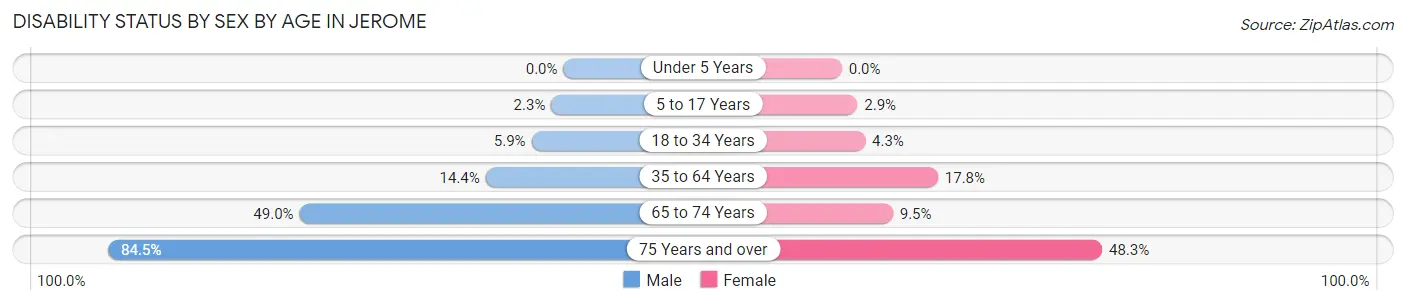
| Age Bracket | Male | Female |
| Under 5 Years | 0 (0.0%) | 0 (0.0%) |
| 5 to 17 Years | 37 (2.2%) | 39 (2.9%) |
| 18 to 34 Years | 89 (5.9%) | 68 (4.3%) |
| 35 to 64 Years | 309 (14.4%) | 352 (17.8%) |
| 65 to 74 Years | 170 (49.0%) | 28 (9.5%) |
| 75 Years and over | 109 (84.5%) | 129 (48.3%) |
Disability Class by Sex by Age in Jerome
Disability Class: Hearing Difficulty
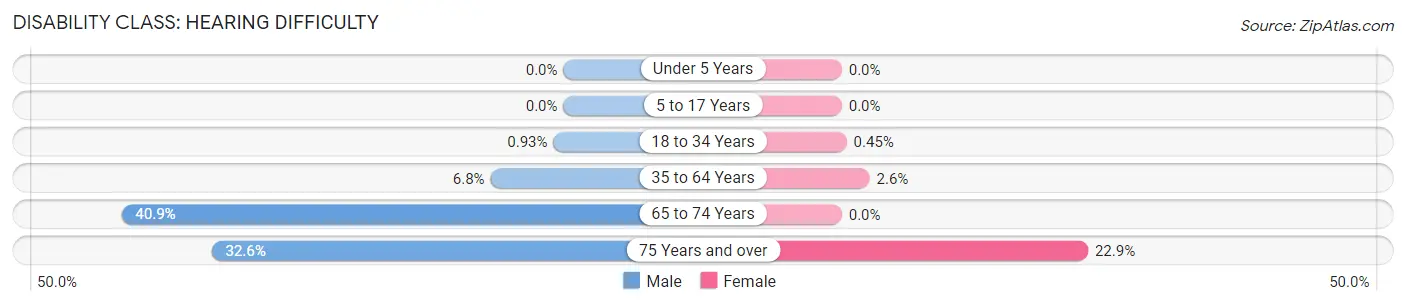
| Age Bracket | Male | Female |
| Under 5 Years | 0 (0.0%) | 0 (0.0%) |
| 5 to 17 Years | 0 (0.0%) | 0 (0.0%) |
| 18 to 34 Years | 14 (0.9%) | 7 (0.4%) |
| 35 to 64 Years | 145 (6.8%) | 51 (2.6%) |
| 65 to 74 Years | 142 (40.9%) | 0 (0.0%) |
| 75 Years and over | 42 (32.6%) | 61 (22.9%) |
Disability Class: Vision Difficulty
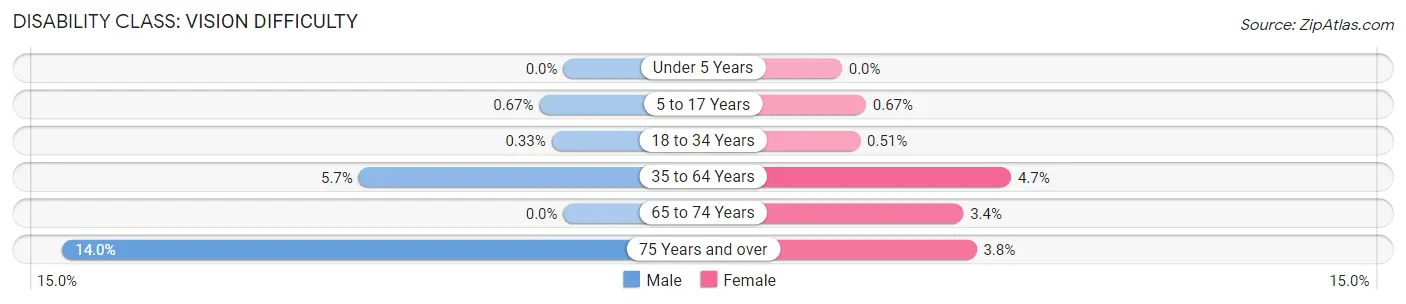
| Age Bracket | Male | Female |
| Under 5 Years | 0 (0.0%) | 0 (0.0%) |
| 5 to 17 Years | 11 (0.7%) | 9 (0.7%) |
| 18 to 34 Years | 5 (0.3%) | 8 (0.5%) |
| 35 to 64 Years | 122 (5.7%) | 93 (4.7%) |
| 65 to 74 Years | 0 (0.0%) | 10 (3.4%) |
| 75 Years and over | 18 (14.0%) | 10 (3.7%) |
Disability Class: Cognitive Difficulty
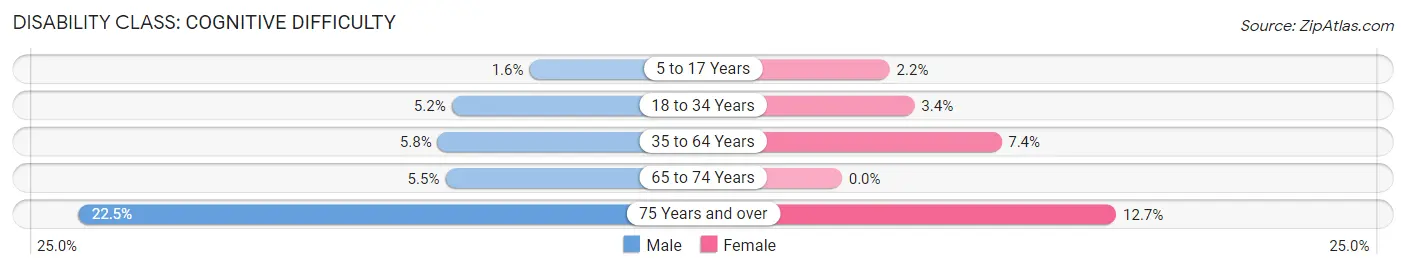
| Age Bracket | Male | Female |
| 5 to 17 Years | 26 (1.6%) | 30 (2.2%) |
| 18 to 34 Years | 78 (5.2%) | 53 (3.4%) |
| 35 to 64 Years | 125 (5.8%) | 146 (7.4%) |
| 65 to 74 Years | 19 (5.5%) | 0 (0.0%) |
| 75 Years and over | 29 (22.5%) | 34 (12.7%) |
Disability Class: Ambulatory Difficulty
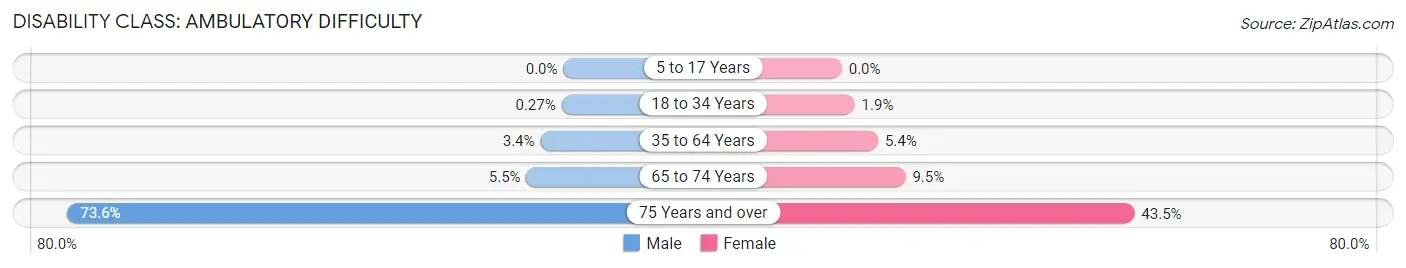
| Age Bracket | Male | Female |
| 5 to 17 Years | 0 (0.0%) | 0 (0.0%) |
| 18 to 34 Years | 4 (0.3%) | 30 (1.9%) |
| 35 to 64 Years | 73 (3.4%) | 106 (5.4%) |
| 65 to 74 Years | 19 (5.5%) | 28 (9.5%) |
| 75 Years and over | 95 (73.6%) | 116 (43.4%) |
Disability Class: Self-Care Difficulty
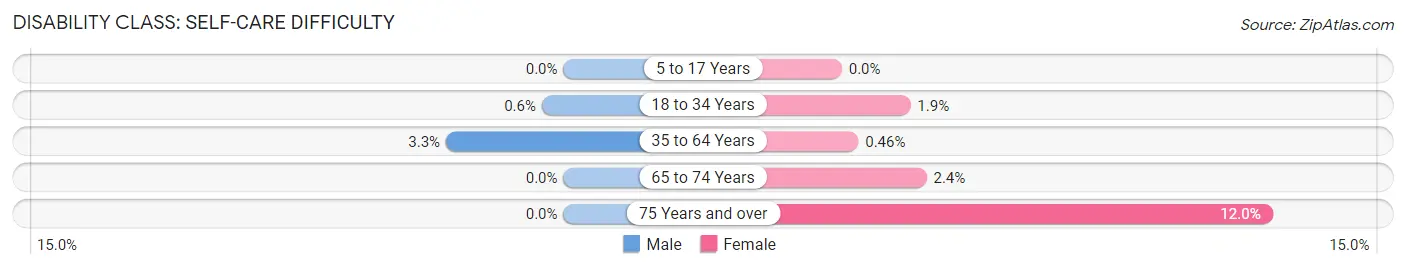
| Age Bracket | Male | Female |
| 5 to 17 Years | 0 (0.0%) | 0 (0.0%) |
| 18 to 34 Years | 9 (0.6%) | 30 (1.9%) |
| 35 to 64 Years | 70 (3.3%) | 9 (0.5%) |
| 65 to 74 Years | 0 (0.0%) | 7 (2.4%) |
| 75 Years and over | 0 (0.0%) | 32 (12.0%) |
Technology Access in Jerome
Computing Device Access in Jerome
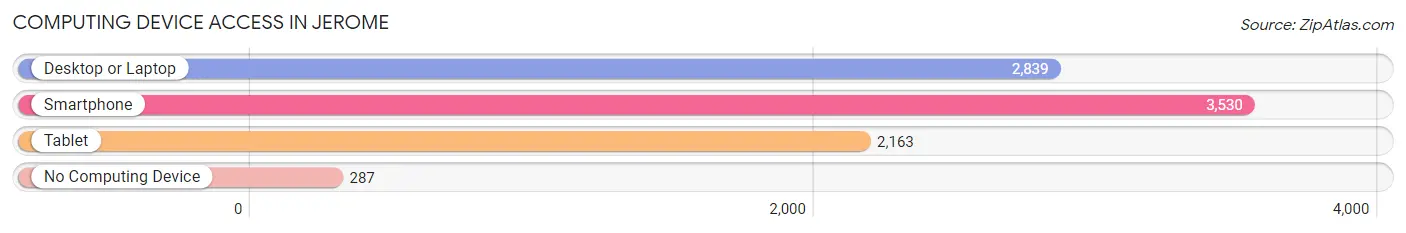
| Device Type | # Households | % Households |
| Desktop or Laptop | 2,839 | 70.9% |
| Smartphone | 3,530 | 88.1% |
| Tablet | 2,163 | 54.0% |
| No Computing Device | 287 | 7.2% |
| Total | 4,005 | 100.0% |
Internet Access in Jerome
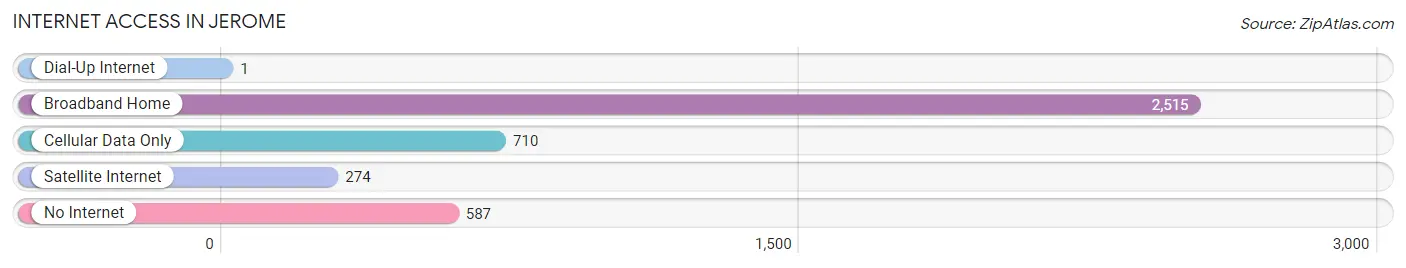
| Internet Type | # Households | % Households |
| Dial-Up Internet | 1 | 0.0% |
| Broadband Home | 2,515 | 62.8% |
| Cellular Data Only | 710 | 17.7% |
| Satellite Internet | 274 | 6.8% |
| No Internet | 587 | 14.7% |
| Total | 4,005 | 100.0% |
Jerome Summary
Jerome, Idaho is a small city located in the south-central part of the state, about 30 miles south of Twin Falls. It is the county seat of Jerome County and has a population of about 11,000 people. The city was founded in 1883 and named after Jerome, a town in France.
Geography
Jerome is located in the Snake River Plain, a large area of flat land that stretches across southern Idaho. The city is situated at an elevation of 4,000 feet and is surrounded by rolling hills and mountains. The city is located near the Snake River, which provides a source of irrigation for the area. The climate in Jerome is semi-arid, with hot summers and cold winters.
Economy
The economy of Jerome is largely based on agriculture. The area is known for its production of potatoes, sugar beets, and other crops. The city is also home to several food processing plants, including a potato chip factory and a sugar beet processing plant. In addition, Jerome is home to several manufacturing companies, including a furniture factory and a plastics plant.
Demographics
As of the 2010 census, the population of Jerome was 11,077. The racial makeup of the city was 91.3% White, 0.7% African American, 0.7% Native American, 0.7% Asian, 0.2% Pacific Islander, 4.2% from other races, and 2.2% from two or more races. Hispanic or Latino of any race were 8.2% of the population.
The median income for a household in Jerome was $37,917, and the median income for a family was $45,917. The per capita income for the city was $18,917. About 11.2% of families and 14.2% of the population were below the poverty line, including 17.2% of those under age 18 and 8.2% of those age 65 or over.
Education
Jerome is served by the Jerome School District, which includes four elementary schools, one middle school, and one high school. The city is also home to a branch of the College of Southern Idaho.
Conclusion
Jerome, Idaho is a small city located in the south-central part of the state. It is the county seat of Jerome County and has a population of about 11,000 people. The economy of Jerome is largely based on agriculture, and the city is home to several food processing plants and manufacturing companies. The racial makeup of the city is predominantly White, with a small percentage of African American, Native American, Asian, and Pacific Islander residents. The city is served by the Jerome School District and a branch of the College of Southern Idaho.
Common Questions
What is Per Capita Income in Jerome?
Per Capita income in Jerome is $26,133.
What is the Median Family Income in Jerome?
Median Family Income in Jerome is $63,667.
What is the Median Household income in Jerome?
Median Household Income in Jerome is $59,656.
What is Income or Wage Gap in Jerome?
Income or Wage Gap in Jerome is 48.0%.
Women in Jerome earn 52.0 cents for every dollar earned by a man.
What is Family Income Deficit in Jerome?
Family Income Deficit in Jerome is $11,731.
Families that are below poverty line in Jerome earn $11,731 less on average than the poverty threshold level.
What is Inequality or Gini Index in Jerome?
Inequality or Gini Index in Jerome is 0.45.
What is the Total Population of Jerome?
Total Population of Jerome is 12,482.
What is the Total Male Population of Jerome?
Total Male Population of Jerome is 6,336.
What is the Total Female Population of Jerome?
Total Female Population of Jerome is 6,146.
What is the Ratio of Males per 100 Females in Jerome?
There are 103.09 Males per 100 Females in Jerome.
What is the Ratio of Females per 100 Males in Jerome?
There are 97.00 Females per 100 Males in Jerome.
What is the Median Population Age in Jerome?
Median Population Age in Jerome is 29.6 Years.
What is the Average Family Size in Jerome
Average Family Size in Jerome is 3.5 People.
What is the Average Household Size in Jerome
Average Household Size in Jerome is 3.1 People.
How Large is the Labor Force in Jerome?
There are 6,002 People in the Labor Forcein in Jerome.
What is the Percentage of People in the Labor Force in Jerome?
68.2% of People are in the Labor Force in Jerome.
What is the Unemployment Rate in Jerome?
Unemployment Rate in Jerome is 3.6%.