Blackfoot, ID Map & Demographics
Blackfoot Map
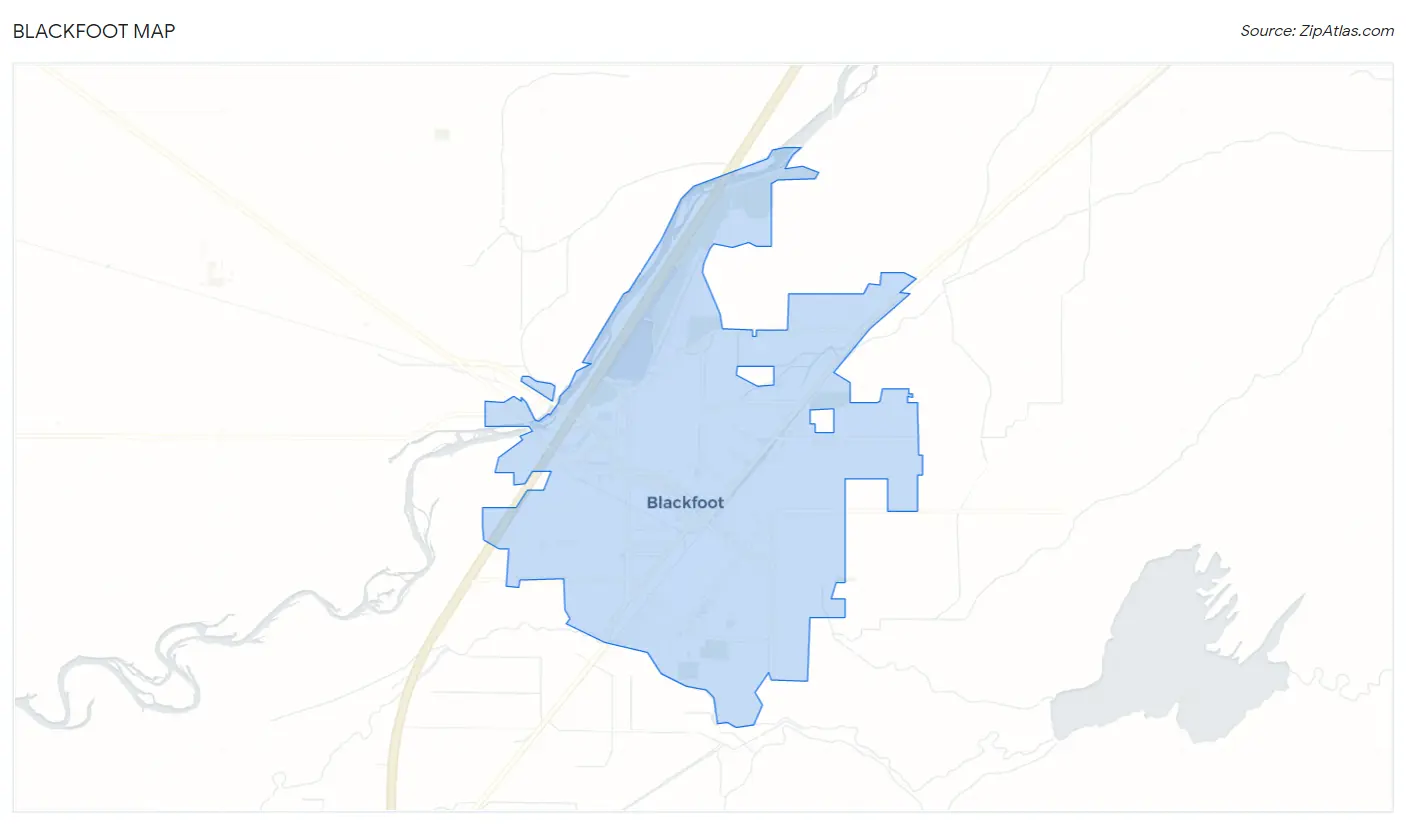
Blackfoot Overview
$25,429
PER CAPITA INCOME
$73,824
AVG FAMILY INCOME
$57,951
AVG HOUSEHOLD INCOME
39.4%
WAGE / INCOME GAP [ % ]
60.6¢/ $1
WAGE / INCOME GAP [ $ ]
0.40
INEQUALITY / GINI INDEX
12,349
TOTAL POPULATION
5,930
MALE POPULATION
6,419
FEMALE POPULATION
92.38
MALES / 100 FEMALES
108.25
FEMALES / 100 MALES
34.4
MEDIAN AGE
3.5
AVG FAMILY SIZE
2.9
AVG HOUSEHOLD SIZE
5,486
LABOR FORCE [ PEOPLE ]
59.6%
PERCENT IN LABOR FORCE
8.9%
UNEMPLOYMENT RATE
Blackfoot Zip Codes
Blackfoot Area Codes
Income in Blackfoot
Income Overview in Blackfoot
Per Capita Income in Blackfoot is $25,429, while median incomes of families and households are $73,824 and $57,951 respectively.
| Characteristic | Number | Measure |
| Per Capita Income | 12,349 | $25,429 |
| Median Family Income | 2,884 | $73,824 |
| Mean Family Income | 2,884 | $84,084 |
| Median Household Income | 4,146 | $57,951 |
| Mean Household Income | 4,146 | $72,199 |
| Income Deficit | 2,884 | $0 |
| Wage / Income Gap (%) | 12,349 | 39.41% |
| Wage / Income Gap ($) | 12,349 | 60.59¢ per $1 |
| Gini / Inequality Index | 12,349 | 0.40 |
Earnings by Sex in Blackfoot
Average Earnings in Blackfoot are $34,048, $37,018 for men and $22,429 for women, a difference of 39.4%.
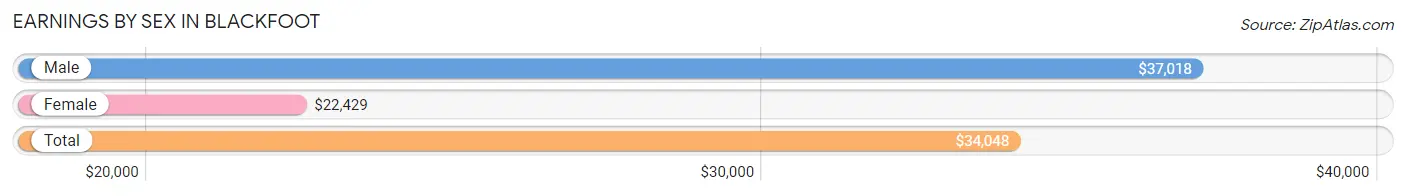
| Sex | Number | Average Earnings |
| Male | 3,204 (52.7%) | $37,018 |
| Female | 2,872 (47.3%) | $22,429 |
| Total | 6,076 (100.0%) | $34,048 |
Earnings by Sex by Income Bracket in Blackfoot
The most common earnings brackets in Blackfoot are $75,000 to $99,999 for men (390 | 12.2%) and $2,499 or less for women (443 | 15.4%).
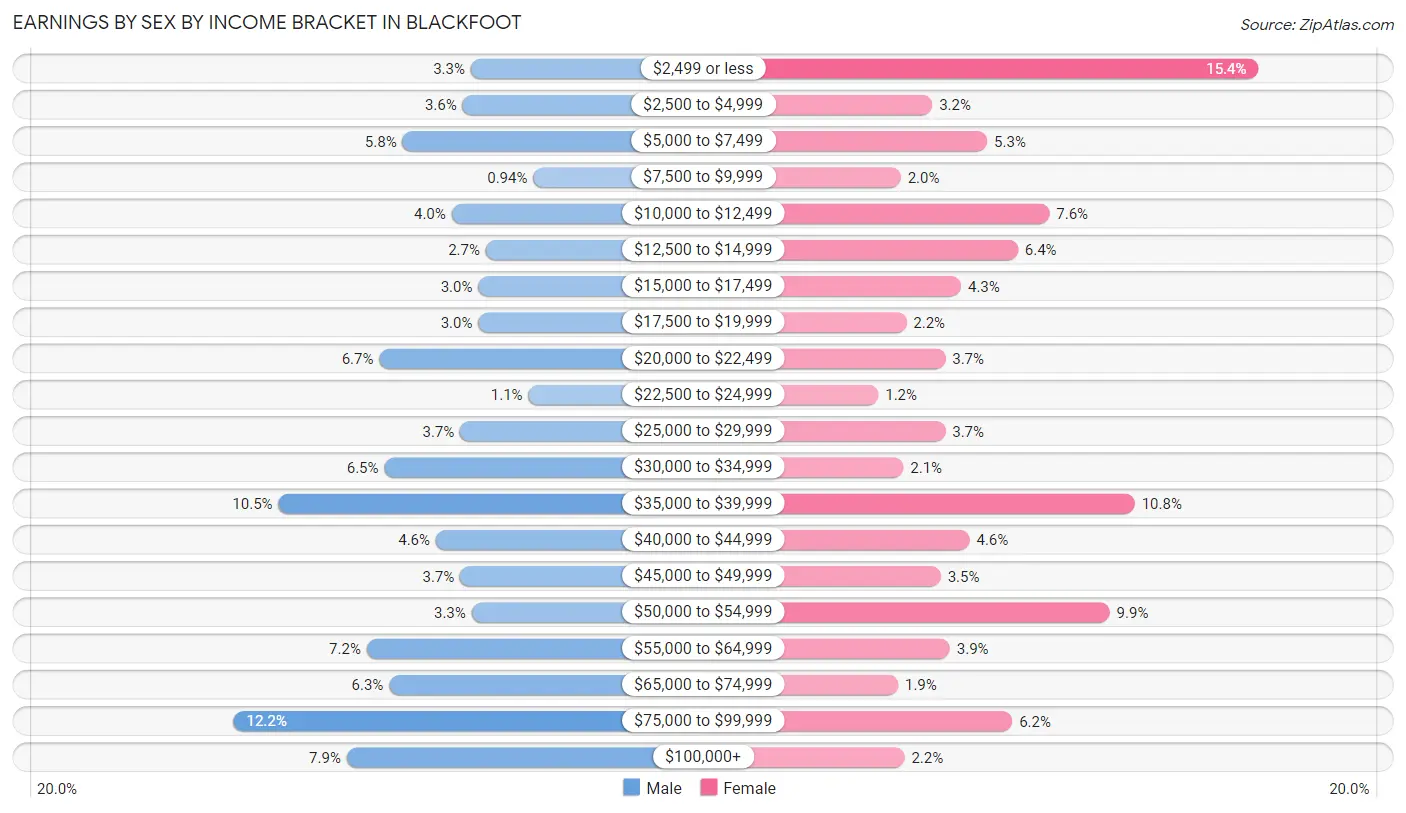
| Income | Male | Female |
| $2,499 or less | 105 (3.3%) | 443 (15.4%) |
| $2,500 to $4,999 | 115 (3.6%) | 92 (3.2%) |
| $5,000 to $7,499 | 187 (5.8%) | 151 (5.3%) |
| $7,500 to $9,999 | 30 (0.9%) | 58 (2.0%) |
| $10,000 to $12,499 | 128 (4.0%) | 218 (7.6%) |
| $12,500 to $14,999 | 87 (2.7%) | 184 (6.4%) |
| $15,000 to $17,499 | 96 (3.0%) | 123 (4.3%) |
| $17,500 to $19,999 | 96 (3.0%) | 64 (2.2%) |
| $20,000 to $22,499 | 215 (6.7%) | 106 (3.7%) |
| $22,500 to $24,999 | 36 (1.1%) | 34 (1.2%) |
| $25,000 to $29,999 | 118 (3.7%) | 106 (3.7%) |
| $30,000 to $34,999 | 209 (6.5%) | 61 (2.1%) |
| $35,000 to $39,999 | 336 (10.5%) | 310 (10.8%) |
| $40,000 to $44,999 | 147 (4.6%) | 132 (4.6%) |
| $45,000 to $49,999 | 118 (3.7%) | 101 (3.5%) |
| $50,000 to $54,999 | 104 (3.3%) | 283 (9.9%) |
| $55,000 to $64,999 | 230 (7.2%) | 111 (3.9%) |
| $65,000 to $74,999 | 203 (6.3%) | 55 (1.9%) |
| $75,000 to $99,999 | 390 (12.2%) | 178 (6.2%) |
| $100,000+ | 254 (7.9%) | 62 (2.2%) |
| Total | 3,204 (100.0%) | 2,872 (100.0%) |
Earnings by Sex by Educational Attainment in Blackfoot
Average earnings in Blackfoot are $43,636 for men and $31,058 for women, a difference of 28.8%. Men with an educational attainment of graduate degree enjoy the highest average annual earnings of $93,185, while those with less than high school education earn the least with $35,046. Women with an educational attainment of bachelor's degree earn the most with the average annual earnings of $38,393, while those with college or associate's degree education have the smallest earnings of $27,731.
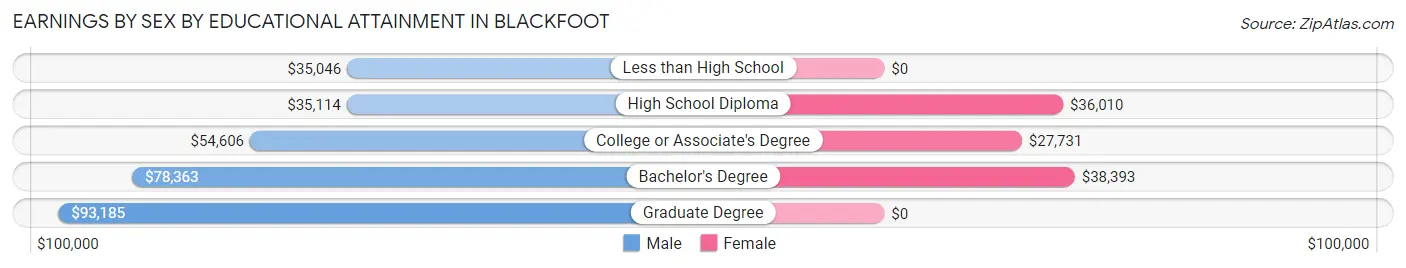
| Educational Attainment | Male Income | Female Income |
| Less than High School | $35,046 | $0 |
| High School Diploma | $35,114 | $36,010 |
| College or Associate's Degree | $54,606 | $27,731 |
| Bachelor's Degree | $78,363 | $38,393 |
| Graduate Degree | $93,185 | $0 |
| Total | $43,636 | $31,058 |
Family Income in Blackfoot
Family Income Brackets in Blackfoot
According to the Blackfoot family income data, there are 577 families falling into the $100,000 to $149,999 income range, which is the most common income bracket and makes up 20.0% of all families. Conversely, the $10,000 to $14,999 income bracket is the least frequent group with only 29 families (1.0%) belonging to this category.
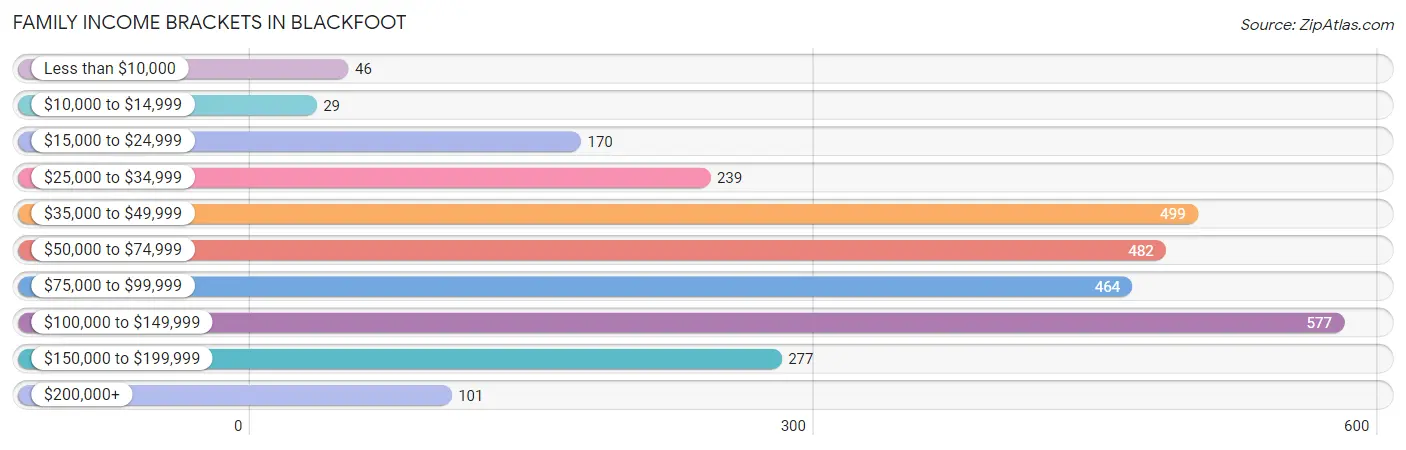
| Income Bracket | # Families | % Families |
| Less than $10,000 | 46 | 1.6% |
| $10,000 to $14,999 | 29 | 1.0% |
| $15,000 to $24,999 | 170 | 5.9% |
| $25,000 to $34,999 | 239 | 8.3% |
| $35,000 to $49,999 | 499 | 17.3% |
| $50,000 to $74,999 | 482 | 16.7% |
| $75,000 to $99,999 | 464 | 16.1% |
| $100,000 to $149,999 | 577 | 20.0% |
| $150,000 to $199,999 | 277 | 9.6% |
| $200,000+ | 101 | 3.5% |
Family Income by Famaliy Size in Blackfoot
5-person families (399 | 13.8%) account for the highest median family income in Blackfoot with $109,090 per family, while 2-person families (1,265 | 43.9%) have the highest median income of $35,366 per family member.
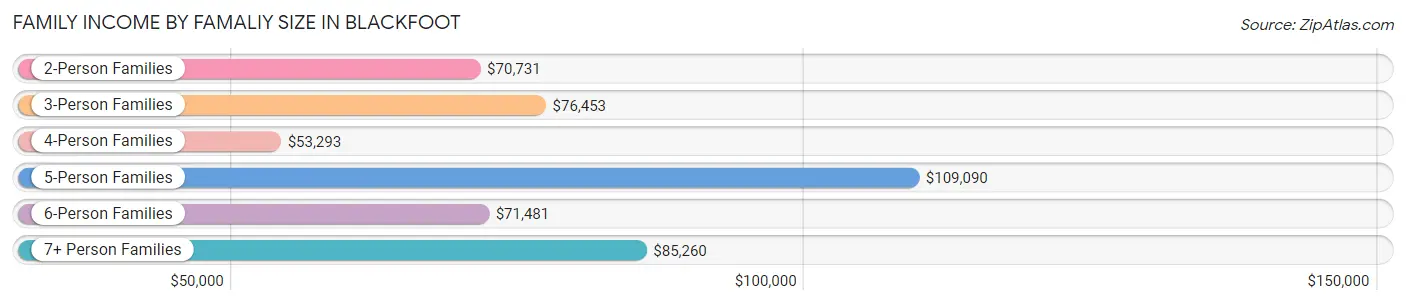
| Income Bracket | # Families | Median Income |
| 2-Person Families | 1,265 (43.9%) | $70,731 |
| 3-Person Families | 573 (19.9%) | $76,453 |
| 4-Person Families | 450 (15.6%) | $53,293 |
| 5-Person Families | 399 (13.8%) | $109,090 |
| 6-Person Families | 110 (3.8%) | $71,481 |
| 7+ Person Families | 87 (3.0%) | $85,260 |
| Total | 2,884 (100.0%) | $73,824 |
Family Income by Number of Earners in Blackfoot
The median family income in Blackfoot is $73,824, with families comprising 3+ earners (464) having the highest median family income of $122,778, while families with no earners (297) have the lowest median family income of $46,438, accounting for 16.1% and 10.3% of families, respectively.
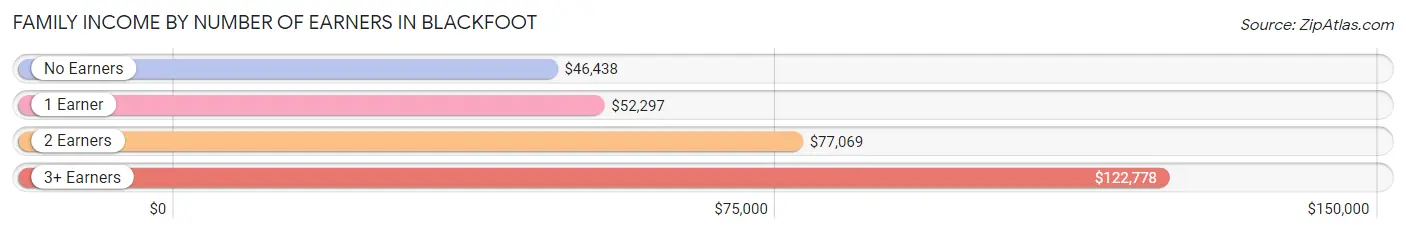
| Number of Earners | # Families | Median Income |
| No Earners | 297 (10.3%) | $46,438 |
| 1 Earner | 1,065 (36.9%) | $52,297 |
| 2 Earners | 1,058 (36.7%) | $77,069 |
| 3+ Earners | 464 (16.1%) | $122,778 |
| Total | 2,884 (100.0%) | $73,824 |
Household Income in Blackfoot
Household Income Brackets in Blackfoot
With 709 households falling in the category, the $35,000 to $49,999 income range is the most frequent in Blackfoot, accounting for 17.1% of all households. In contrast, only 129 households (3.1%) fall into the $200,000+ income bracket, making it the least populous group.
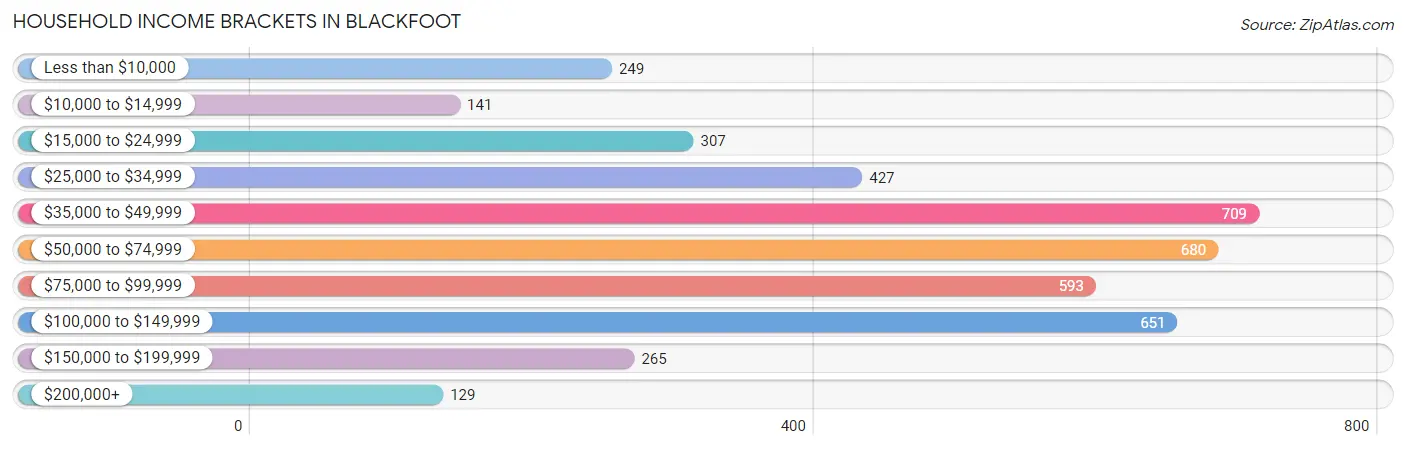
| Income Bracket | # Households | % Households |
| Less than $10,000 | 249 | 6.0% |
| $10,000 to $14,999 | 141 | 3.4% |
| $15,000 to $24,999 | 307 | 7.4% |
| $25,000 to $34,999 | 427 | 10.3% |
| $35,000 to $49,999 | 709 | 17.1% |
| $50,000 to $74,999 | 680 | 16.4% |
| $75,000 to $99,999 | 593 | 14.3% |
| $100,000 to $149,999 | 651 | 15.7% |
| $150,000 to $199,999 | 265 | 6.4% |
| $200,000+ | 129 | 3.1% |
Household Income by Householder Age in Blackfoot
The median household income in Blackfoot is $57,951, with the highest median household income of $75,970 found in the 25 to 44 years age bracket for the primary householder. A total of 1,338 households (32.3%) fall into this category. Meanwhile, the 65+ years age bracket for the primary householder has the lowest median household income of $34,710, with 1,073 households (25.9%) in this group.
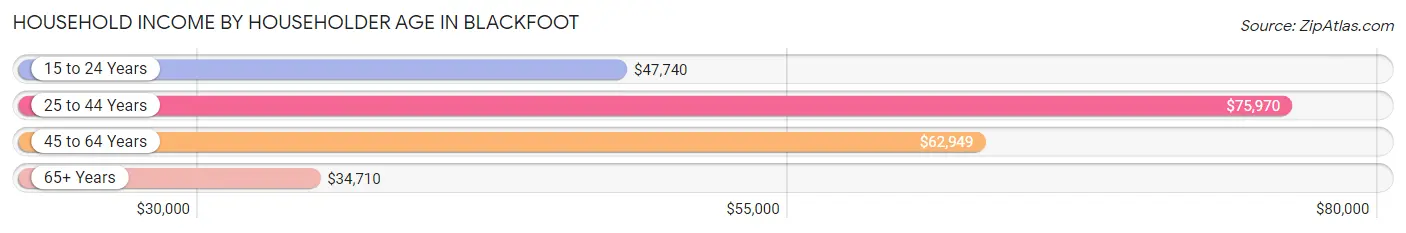
| Income Bracket | # Households | Median Income |
| 15 to 24 Years | 153 (3.7%) | $47,740 |
| 25 to 44 Years | 1,338 (32.3%) | $75,970 |
| 45 to 64 Years | 1,582 (38.2%) | $62,949 |
| 65+ Years | 1,073 (25.9%) | $34,710 |
| Total | 4,146 (100.0%) | $57,951 |
Poverty in Blackfoot
Income Below Poverty by Sex and Age in Blackfoot
With 9.2% poverty level for males and 10.8% for females among the residents of Blackfoot, 18 to 24 year old males and 5 year old females are the most vulnerable to poverty, with 101 males (23.4%) and 27 females (27.6%) in their respective age groups living below the poverty level.
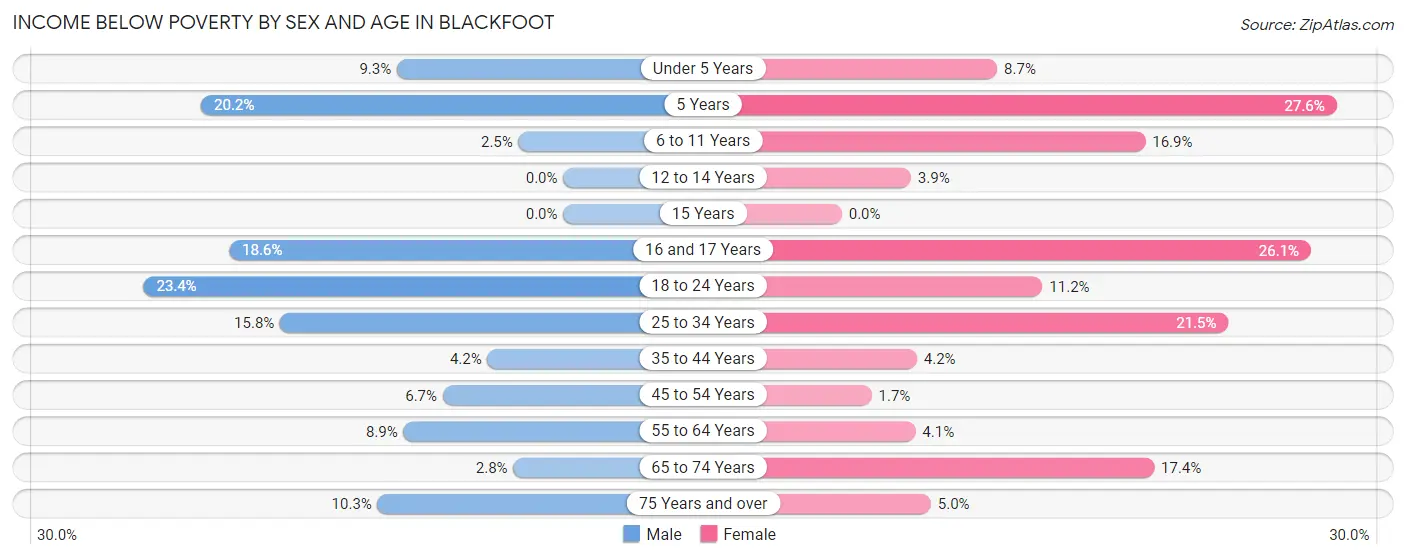
| Age Bracket | Male | Female |
| Under 5 Years | 41 (9.3%) | 48 (8.6%) |
| 5 Years | 24 (20.2%) | 27 (27.6%) |
| 6 to 11 Years | 13 (2.5%) | 98 (16.9%) |
| 12 to 14 Years | 0 (0.0%) | 10 (3.8%) |
| 15 Years | 0 (0.0%) | 0 (0.0%) |
| 16 and 17 Years | 59 (18.6%) | 35 (26.1%) |
| 18 to 24 Years | 101 (23.4%) | 60 (11.2%) |
| 25 to 34 Years | 105 (15.8%) | 198 (21.5%) |
| 35 to 44 Years | 32 (4.2%) | 25 (4.2%) |
| 45 to 54 Years | 38 (6.7%) | 8 (1.7%) |
| 55 to 64 Years | 77 (8.9%) | 32 (4.1%) |
| 65 to 74 Years | 14 (2.8%) | 92 (17.4%) |
| 75 Years and over | 18 (10.3%) | 25 (5.0%) |
| Total | 522 (9.2%) | 658 (10.8%) |
Income Above Poverty by Sex and Age in Blackfoot
According to the poverty statistics in Blackfoot, males aged 12 to 14 years and females aged 15 years are the age groups that are most secure financially, with 100.0% of males and 100.0% of females in these age groups living above the poverty line.
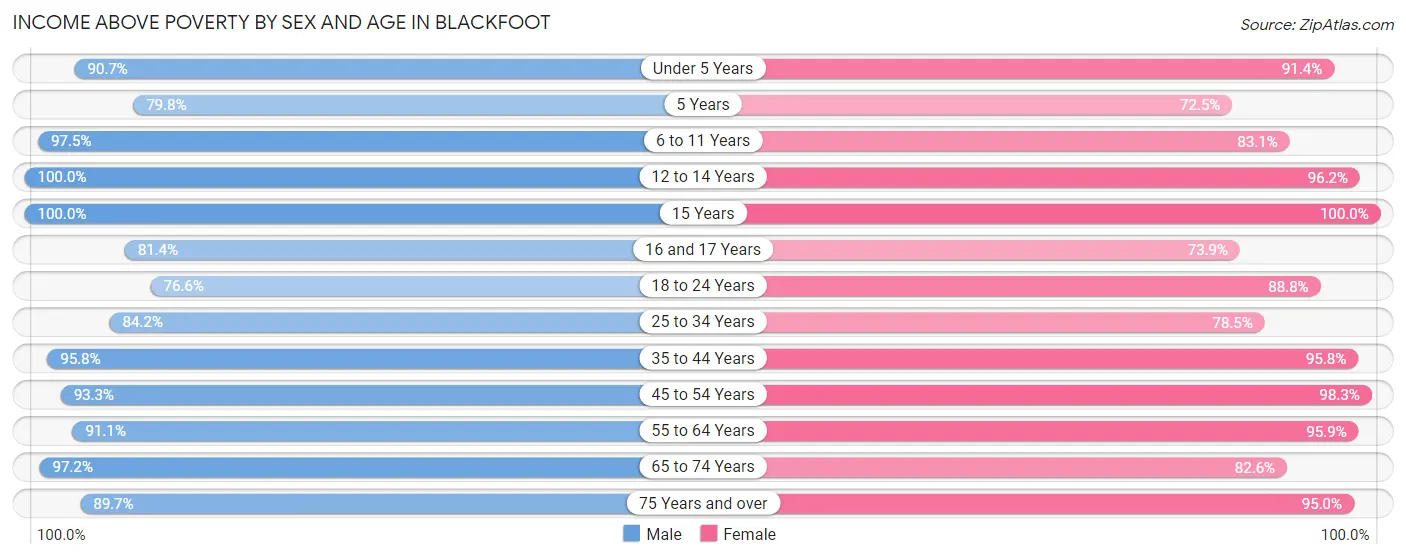
| Age Bracket | Male | Female |
| Under 5 Years | 402 (90.7%) | 507 (91.3%) |
| 5 Years | 95 (79.8%) | 71 (72.5%) |
| 6 to 11 Years | 509 (97.5%) | 482 (83.1%) |
| 12 to 14 Years | 280 (100.0%) | 250 (96.2%) |
| 15 Years | 20 (100.0%) | 92 (100.0%) |
| 16 and 17 Years | 258 (81.4%) | 99 (73.9%) |
| 18 to 24 Years | 331 (76.6%) | 477 (88.8%) |
| 25 to 34 Years | 561 (84.2%) | 722 (78.5%) |
| 35 to 44 Years | 726 (95.8%) | 573 (95.8%) |
| 45 to 54 Years | 528 (93.3%) | 475 (98.3%) |
| 55 to 64 Years | 788 (91.1%) | 748 (95.9%) |
| 65 to 74 Years | 489 (97.2%) | 437 (82.6%) |
| 75 Years and over | 156 (89.7%) | 479 (95.0%) |
| Total | 5,143 (90.8%) | 5,412 (89.2%) |
Income Below Poverty Among Married-Couple Families in Blackfoot
The poverty statistics for married-couple families in Blackfoot show that 2.1% or 44 of the total 2,059 families live below the poverty line. Families with 1 or 2 children have the highest poverty rate of 7.6%, comprising of 36 families. On the other hand, families with 3 or 4 children have the lowest poverty rate of 0.0%, which includes 0 families.
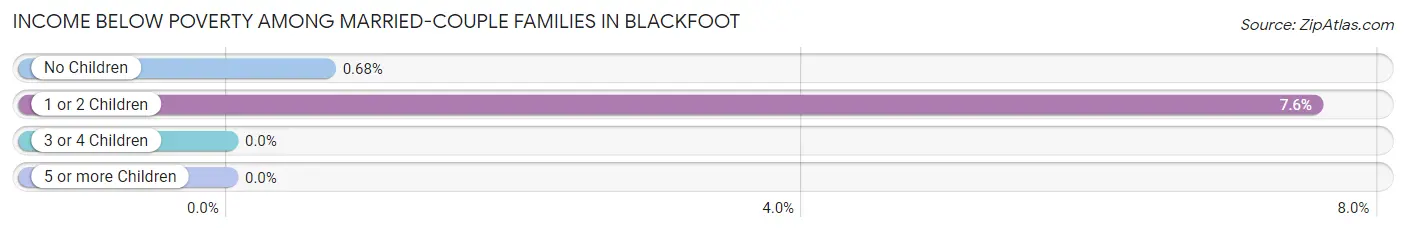
| Children | Above Poverty | Below Poverty |
| No Children | 1,163 (99.3%) | 8 (0.7%) |
| 1 or 2 Children | 440 (92.4%) | 36 (7.6%) |
| 3 or 4 Children | 325 (100.0%) | 0 (0.0%) |
| 5 or more Children | 87 (100.0%) | 0 (0.0%) |
| Total | 2,015 (97.9%) | 44 (2.1%) |
Income Below Poverty Among Single-Parent Households in Blackfoot
According to the poverty data in Blackfoot, 3.4% or 11 single-father households and 18.2% or 91 single-mother households are living below the poverty line. Among single-father households, those with 1 or 2 children have the highest poverty rate, with 11 households (6.2%) experiencing poverty. Likewise, among single-mother households, those with 3 or 4 children have the highest poverty rate, with 31 households (58.5%) falling below the poverty line.
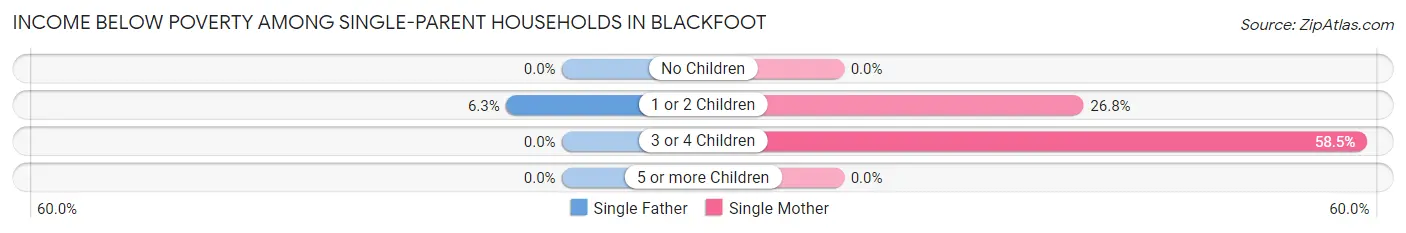
| Children | Single Father | Single Mother |
| No Children | 0 (0.0%) | 0 (0.0%) |
| 1 or 2 Children | 11 (6.2%) | 60 (26.8%) |
| 3 or 4 Children | 0 (0.0%) | 31 (58.5%) |
| 5 or more Children | 0 (0.0%) | 0 (0.0%) |
| Total | 11 (3.4%) | 91 (18.2%) |
Income Below Poverty Among Married-Couple vs Single-Parent Households in Blackfoot
The poverty data for Blackfoot shows that 44 of the married-couple family households (2.1%) and 102 of the single-parent households (12.4%) are living below the poverty level. Within the married-couple family households, those with 1 or 2 children have the highest poverty rate, with 36 households (7.6%) falling below the poverty line. Among the single-parent households, those with 3 or 4 children have the highest poverty rate, with 31 household (29.0%) living below poverty.
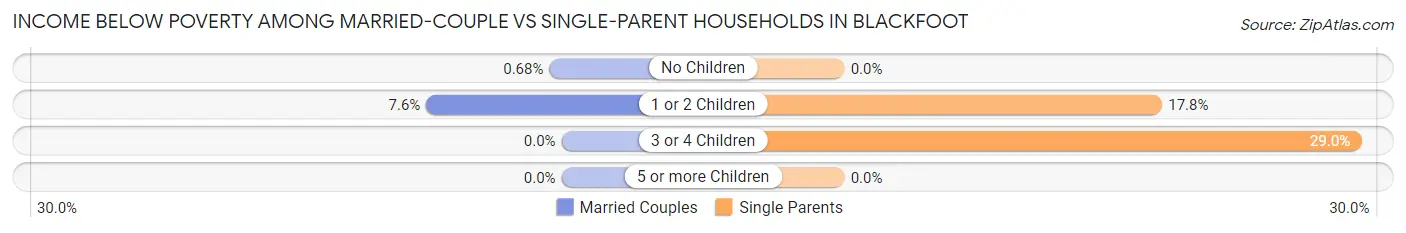
| Children | Married-Couple Families | Single-Parent Households |
| No Children | 8 (0.7%) | 0 (0.0%) |
| 1 or 2 Children | 36 (7.6%) | 71 (17.7%) |
| 3 or 4 Children | 0 (0.0%) | 31 (29.0%) |
| 5 or more Children | 0 (0.0%) | 0 (0.0%) |
| Total | 44 (2.1%) | 102 (12.4%) |
Race in Blackfoot
The most populous races in Blackfoot are White / Caucasian (9,657 | 78.2%), Hispanic or Latino (2,236 | 18.1%), and Some other Race (1,213 | 9.8%).
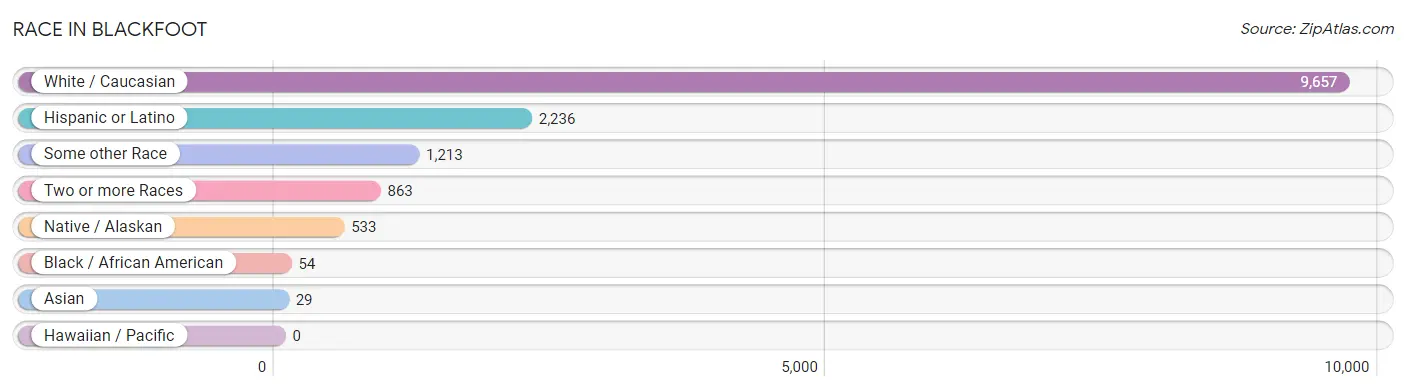
| Race | # Population | % Population |
| Asian | 29 | 0.2% |
| Black / African American | 54 | 0.4% |
| Hawaiian / Pacific | 0 | 0.0% |
| Hispanic or Latino | 2,236 | 18.1% |
| Native / Alaskan | 533 | 4.3% |
| White / Caucasian | 9,657 | 78.2% |
| Two or more Races | 863 | 7.0% |
| Some other Race | 1,213 | 9.8% |
| Total | 12,349 | 100.0% |
Ancestry in Blackfoot
The most populous ancestries reported in Blackfoot are English (2,633 | 21.3%), Mexican (2,059 | 16.7%), German (968 | 7.8%), American (748 | 6.1%), and Irish (737 | 6.0%), together accounting for 57.9% of all Blackfoot residents.
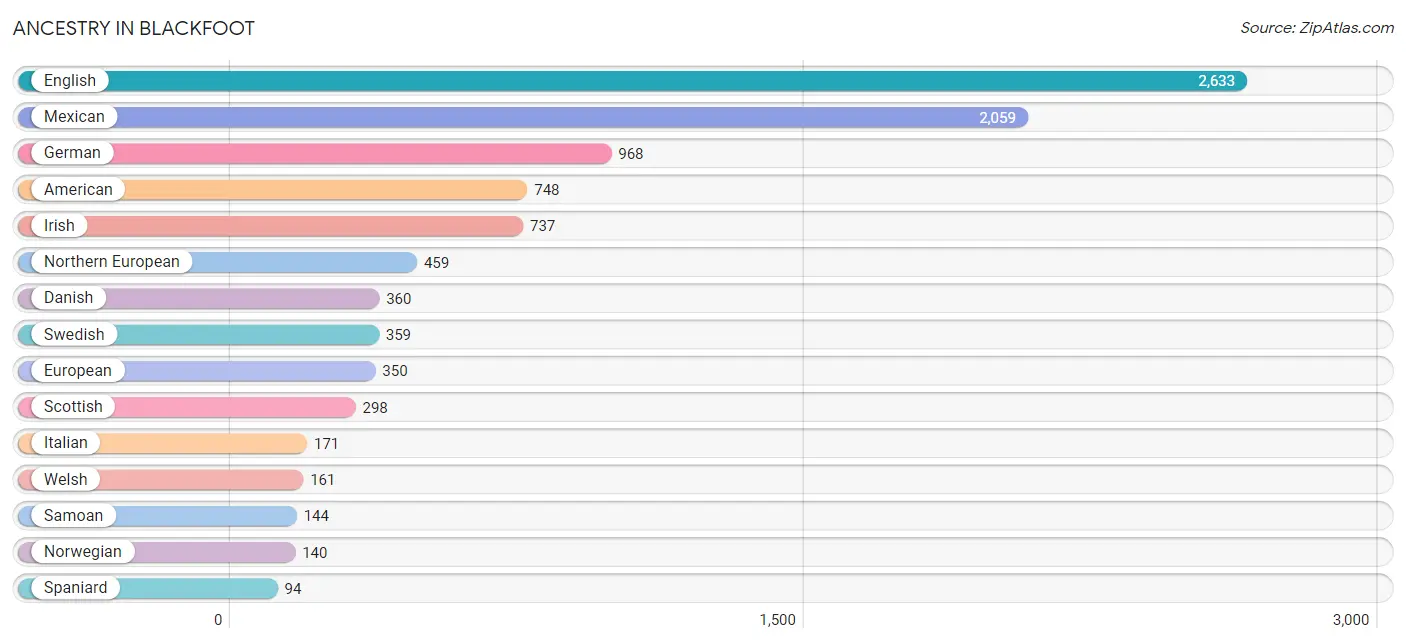
| Ancestry | # Population | % Population |
| American | 748 | 6.1% |
| Basque | 83 | 0.7% |
| Belgian | 52 | 0.4% |
| Bhutanese | 58 | 0.5% |
| Bolivian | 13 | 0.1% |
| British | 44 | 0.4% |
| Burmese | 31 | 0.3% |
| Canadian | 52 | 0.4% |
| Central American | 43 | 0.4% |
| Cherokee | 74 | 0.6% |
| Cheyenne | 1 | 0.0% |
| Czechoslovakian | 14 | 0.1% |
| Danish | 360 | 2.9% |
| Dutch | 8 | 0.1% |
| English | 2,633 | 21.3% |
| European | 350 | 2.8% |
| Finnish | 18 | 0.2% |
| French | 82 | 0.7% |
| French Canadian | 58 | 0.5% |
| German | 968 | 7.8% |
| Greek | 16 | 0.1% |
| Hungarian | 32 | 0.3% |
| Irish | 737 | 6.0% |
| Italian | 171 | 1.4% |
| Korean | 16 | 0.1% |
| Lithuanian | 18 | 0.2% |
| Lumbee | 31 | 0.3% |
| Mexican | 2,059 | 16.7% |
| Mexican American Indian | 18 | 0.2% |
| Nicaraguan | 43 | 0.4% |
| Northern European | 459 | 3.7% |
| Norwegian | 140 | 1.1% |
| Polish | 76 | 0.6% |
| Portuguese | 53 | 0.4% |
| Potawatomi | 39 | 0.3% |
| Pueblo | 52 | 0.4% |
| Puerto Rican | 19 | 0.2% |
| Russian | 46 | 0.4% |
| Samoan | 144 | 1.2% |
| Scandinavian | 50 | 0.4% |
| Scotch-Irish | 55 | 0.4% |
| Scottish | 298 | 2.4% |
| Sioux | 5 | 0.0% |
| South American | 13 | 0.1% |
| Spaniard | 94 | 0.8% |
| Swedish | 359 | 2.9% |
| Swiss | 24 | 0.2% |
| Thai | 23 | 0.2% |
| Welsh | 161 | 1.3% | View All 49 Rows |
Immigrants in Blackfoot
The most numerous immigrant groups reported in Blackfoot came from Latin America (498 | 4.0%), Central America (491 | 4.0%), Mexico (471 | 3.8%), Canada (64 | 0.5%), and Europe (45 | 0.4%), together accounting for 12.7% of all Blackfoot residents.
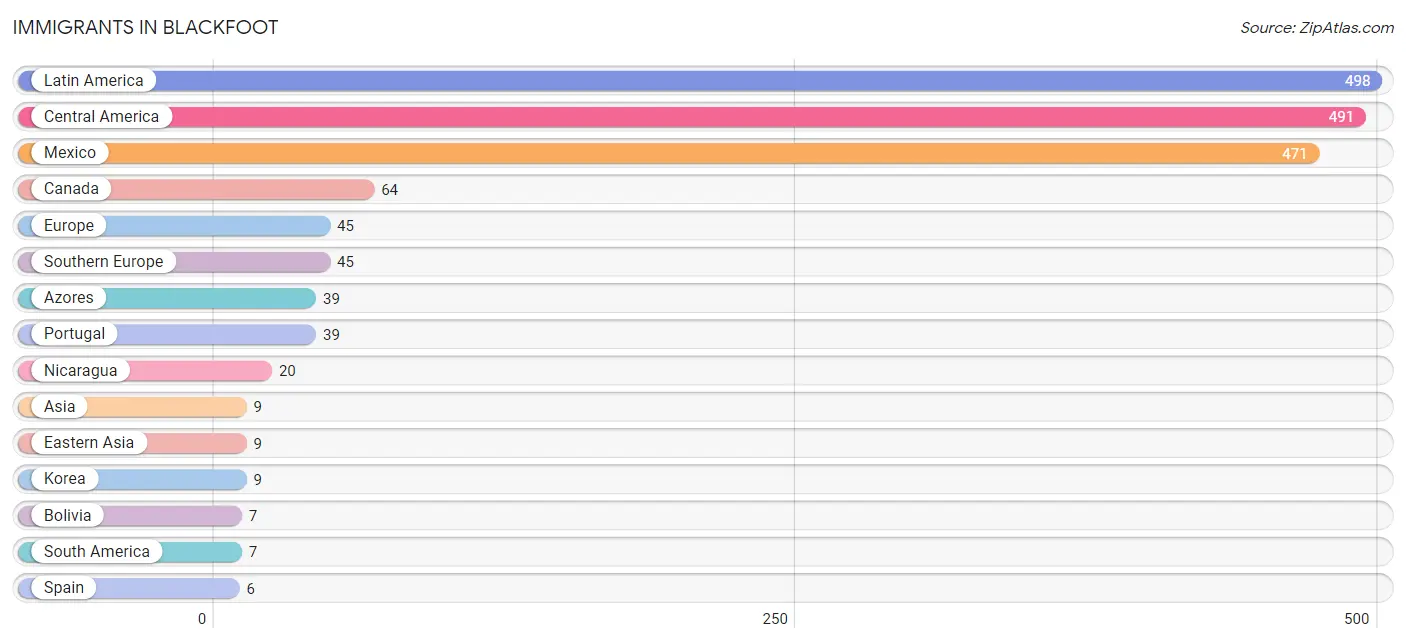
| Immigration Origin | # Population | % Population |
| Asia | 9 | 0.1% |
| Azores | 39 | 0.3% |
| Bolivia | 7 | 0.1% |
| Canada | 64 | 0.5% |
| Central America | 491 | 4.0% |
| Eastern Asia | 9 | 0.1% |
| Europe | 45 | 0.4% |
| Korea | 9 | 0.1% |
| Latin America | 498 | 4.0% |
| Mexico | 471 | 3.8% |
| Nicaragua | 20 | 0.2% |
| Portugal | 39 | 0.3% |
| South America | 7 | 0.1% |
| Southern Europe | 45 | 0.4% |
| Spain | 6 | 0.1% | View All 15 Rows |
Sex and Age in Blackfoot
Sex and Age in Blackfoot
The most populous age groups in Blackfoot are 10 to 14 Years (562 | 9.5%) for men and Under 5 Years (555 | 8.6%) for women.
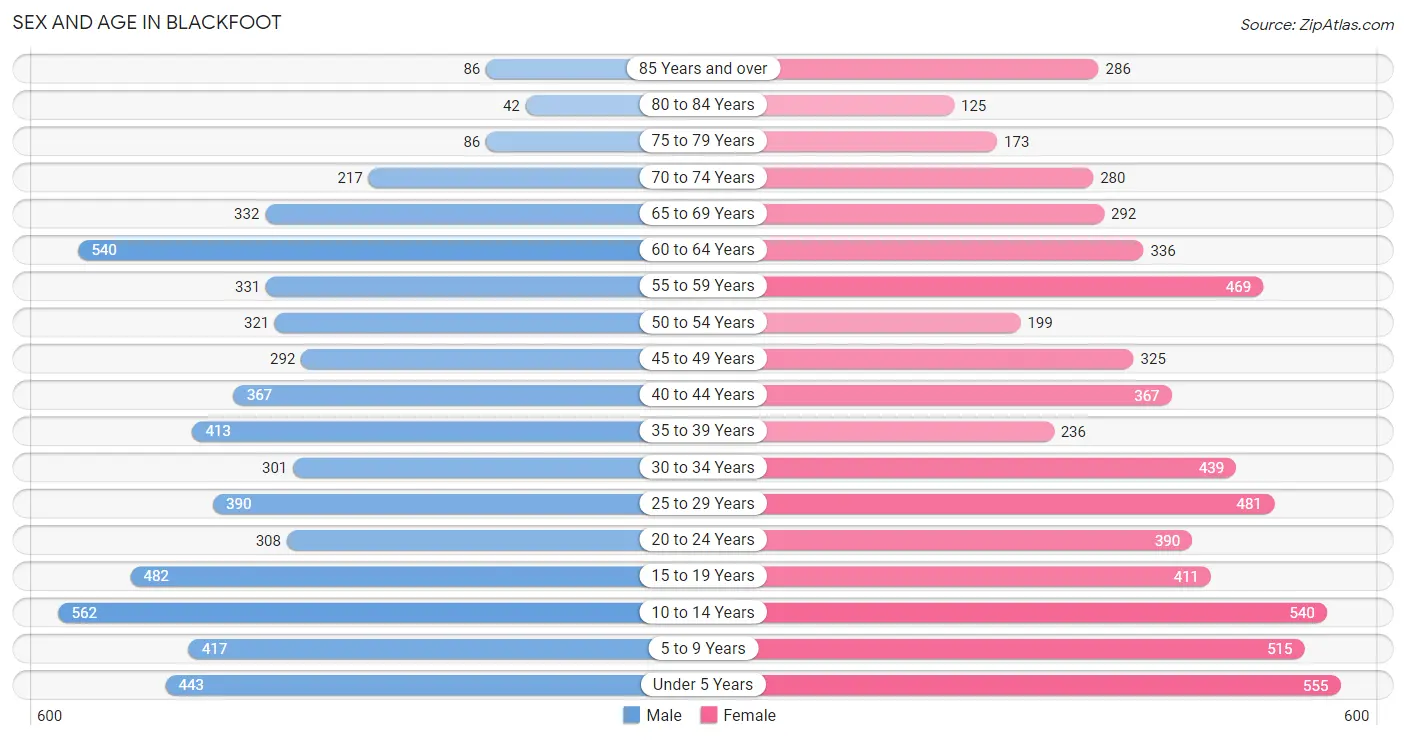
| Age Bracket | Male | Female |
| Under 5 Years | 443 (7.5%) | 555 (8.6%) |
| 5 to 9 Years | 417 (7.0%) | 515 (8.0%) |
| 10 to 14 Years | 562 (9.5%) | 540 (8.4%) |
| 15 to 19 Years | 482 (8.1%) | 411 (6.4%) |
| 20 to 24 Years | 308 (5.2%) | 390 (6.1%) |
| 25 to 29 Years | 390 (6.6%) | 481 (7.5%) |
| 30 to 34 Years | 301 (5.1%) | 439 (6.8%) |
| 35 to 39 Years | 413 (7.0%) | 236 (3.7%) |
| 40 to 44 Years | 367 (6.2%) | 367 (5.7%) |
| 45 to 49 Years | 292 (4.9%) | 325 (5.1%) |
| 50 to 54 Years | 321 (5.4%) | 199 (3.1%) |
| 55 to 59 Years | 331 (5.6%) | 469 (7.3%) |
| 60 to 64 Years | 540 (9.1%) | 336 (5.2%) |
| 65 to 69 Years | 332 (5.6%) | 292 (4.5%) |
| 70 to 74 Years | 217 (3.7%) | 280 (4.4%) |
| 75 to 79 Years | 86 (1.5%) | 173 (2.7%) |
| 80 to 84 Years | 42 (0.7%) | 125 (1.9%) |
| 85 Years and over | 86 (1.5%) | 286 (4.5%) |
| Total | 5,930 (100.0%) | 6,419 (100.0%) |
Families and Households in Blackfoot
Median Family Size in Blackfoot
The median family size in Blackfoot is 3.45 persons per family, with single female/mother families (501 | 17.4%) accounting for the largest median family size of 3.59 persons per family. On the other hand, married-couple families (2,059 | 71.4%) represent the smallest median family size with 3.42 persons per family.
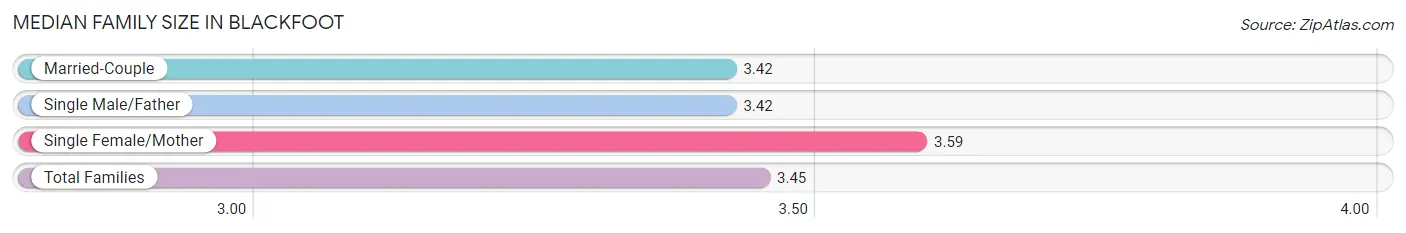
| Family Type | # Families | Family Size |
| Married-Couple | 2,059 (71.4%) | 3.42 |
| Single Male/Father | 324 (11.2%) | 3.42 |
| Single Female/Mother | 501 (17.4%) | 3.59 |
| Total Families | 2,884 (100.0%) | 3.45 |
Median Household Size in Blackfoot
The median household size in Blackfoot is 2.87 persons per household, with single male/father households (324 | 7.8%) accounting for the largest median household size of 4.04 persons per household. non-family households (1,262 | 30.4%) represent the smallest median household size with 1.14 persons per household.
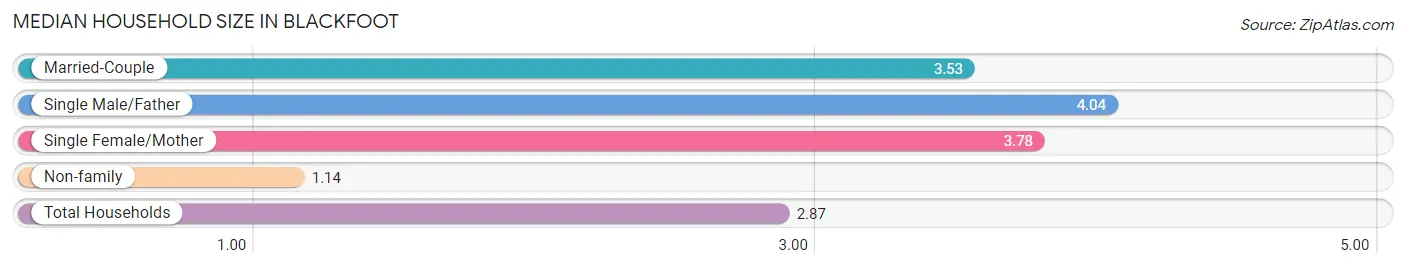
| Household Type | # Households | Household Size |
| Married-Couple | 2,059 (49.7%) | 3.53 |
| Single Male/Father | 324 (7.8%) | 4.04 |
| Single Female/Mother | 501 (12.1%) | 3.78 |
| Non-family | 1,262 (30.4%) | 1.14 |
| Total Households | 4,146 (100.0%) | 2.87 |
Household Size by Marriage Status in Blackfoot
Out of a total of 4,146 households in Blackfoot, 2,884 (69.6%) are family households, while 1,262 (30.4%) are nonfamily households. The most numerous type of family households are 2-person households, comprising 1,079, and the most common type of nonfamily households are 1-person households, comprising 1,105.
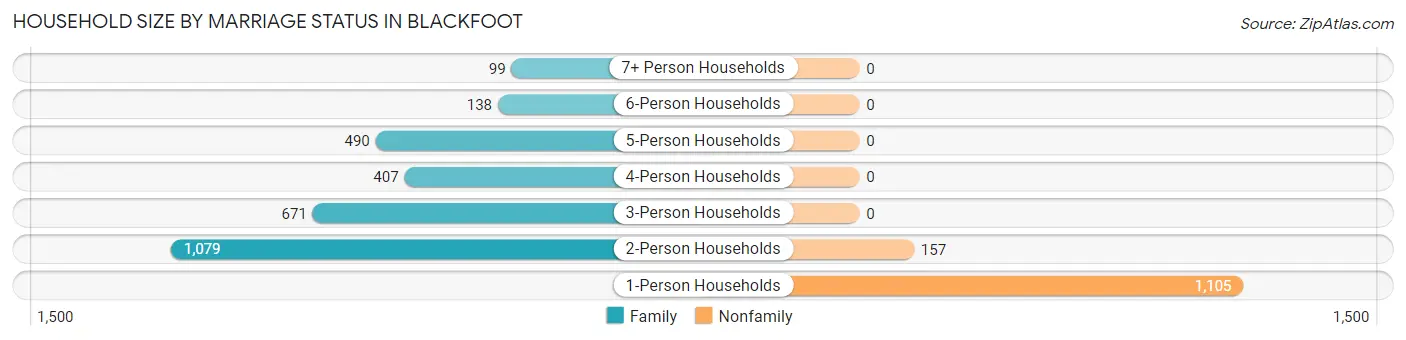
| Household Size | Family Households | Nonfamily Households |
| 1-Person Households | - | 1,105 (26.7%) |
| 2-Person Households | 1,079 (26.0%) | 157 (3.8%) |
| 3-Person Households | 671 (16.2%) | 0 (0.0%) |
| 4-Person Households | 407 (9.8%) | 0 (0.0%) |
| 5-Person Households | 490 (11.8%) | 0 (0.0%) |
| 6-Person Households | 138 (3.3%) | 0 (0.0%) |
| 7+ Person Households | 99 (2.4%) | 0 (0.0%) |
| Total | 2,884 (69.6%) | 1,262 (30.4%) |
Female Fertility in Blackfoot
Fertility by Age in Blackfoot
Average fertility rate in Blackfoot is 117.0 births per 1,000 women. Women in the age bracket of 20 to 34 years have the highest fertility rate with 241.0 births per 1,000 women. Women in the age bracket of 20 to 34 years acount for 100.0% of all women with births.
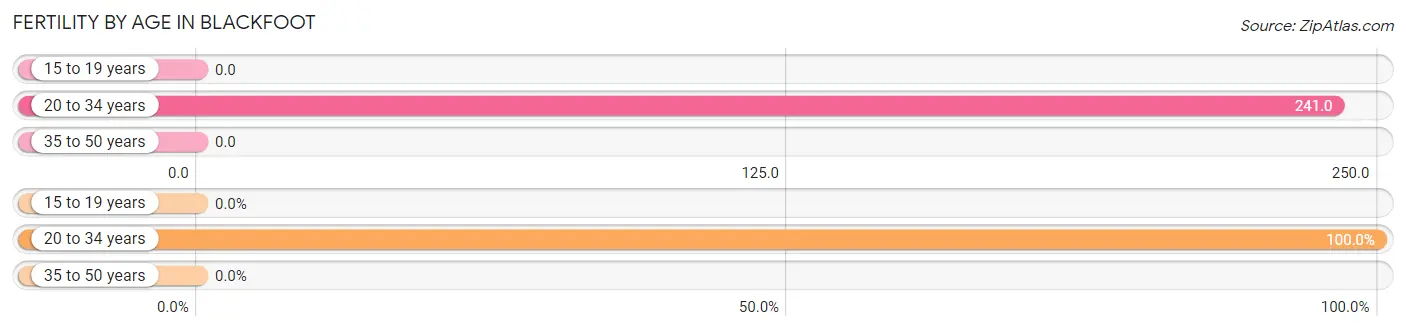
| Age Bracket | Women with Births | Births / 1,000 Women |
| 15 to 19 years | 0 (0.0%) | 0.0 |
| 20 to 34 years | 316 (100.0%) | 241.0 |
| 35 to 50 years | 0 (0.0%) | 0.0 |
| Total | 316 (100.0%) | 117.0 |
Fertility by Age by Marriage Status in Blackfoot
43.7% of women with births (316) in Blackfoot are married. The highest percentage of unmarried women with births falls into 20 to 34 years age bracket with 56.3% of them unmarried at the time of birth, while the lowest percentage of unmarried women with births belong to 20 to 34 years age bracket with 56.3% of them unmarried.
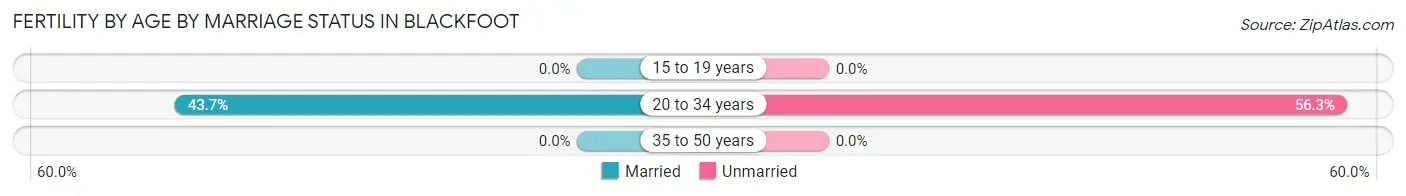
| Age Bracket | Married | Unmarried |
| 15 to 19 years | 0 (0.0%) | 0 (0.0%) |
| 20 to 34 years | 138 (43.7%) | 178 (56.3%) |
| 35 to 50 years | 0 (0.0%) | 0 (0.0%) |
| Total | 138 (43.7%) | 178 (56.3%) |
Fertility by Education in Blackfoot
Average fertility rate in Blackfoot is 117.0 births per 1,000 women. Women with the education attainment of graduate degree have the highest fertility rate of 475.0 births per 1,000 women, while women with the education attainment of less than high school have the lowest fertility at 32.0 births per 1,000 women. Women with the education attainment of bachelor's degree represent 38.3% of all women with births.
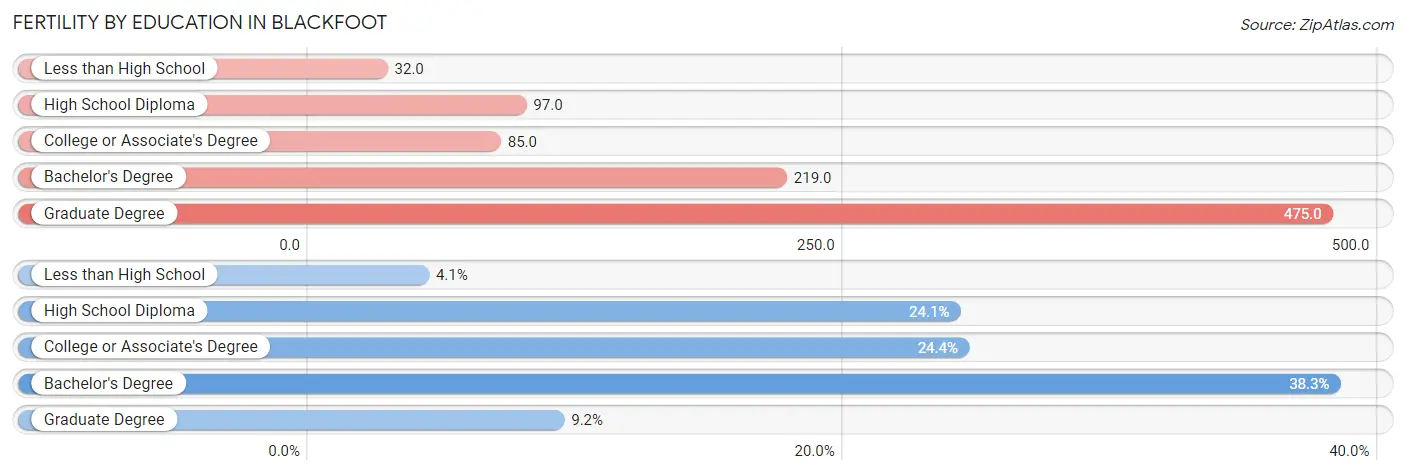
| Educational Attainment | Women with Births | Births / 1,000 Women |
| Less than High School | 13 (4.1%) | 32.0 |
| High School Diploma | 76 (24.0%) | 97.0 |
| College or Associate's Degree | 77 (24.4%) | 85.0 |
| Bachelor's Degree | 121 (38.3%) | 219.0 |
| Graduate Degree | 29 (9.2%) | 475.0 |
| Total | 316 (100.0%) | 117.0 |
Fertility by Education by Marriage Status in Blackfoot
56.3% of women with births in Blackfoot are unmarried. Women with the educational attainment of graduate degree are most likely to be married with 100.0% of them married at childbirth, while women with the educational attainment of less than high school are least likely to be married with 100.0% of them unmarried at childbirth.
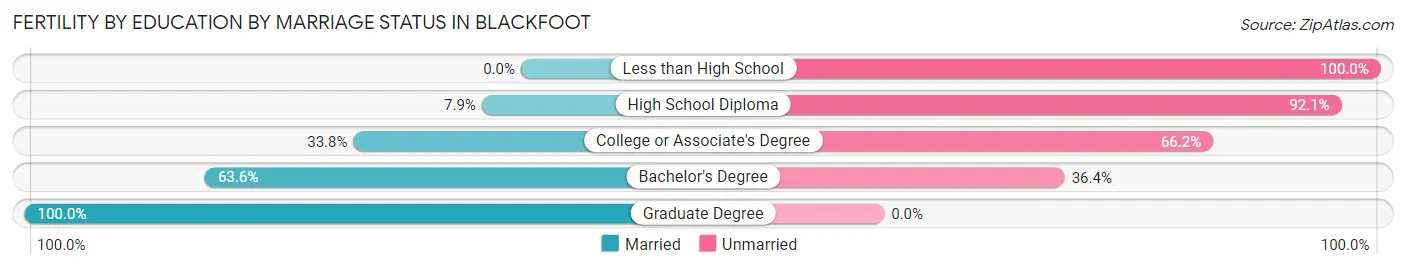
| Educational Attainment | Married | Unmarried |
| Less than High School | 0 (0.0%) | 13 (100.0%) |
| High School Diploma | 6 (7.9%) | 70 (92.1%) |
| College or Associate's Degree | 26 (33.8%) | 51 (66.2%) |
| Bachelor's Degree | 77 (63.6%) | 44 (36.4%) |
| Graduate Degree | 29 (100.0%) | 0 (0.0%) |
| Total | 138 (43.7%) | 178 (56.3%) |
Employment Characteristics in Blackfoot
Employment by Class of Employer in Blackfoot
Among the 4,930 employed individuals in Blackfoot, private company employees (3,129 | 63.5%), local government employees (431 | 8.7%), and not-for-profit organizations (361 | 7.3%) make up the most common classes of employment.
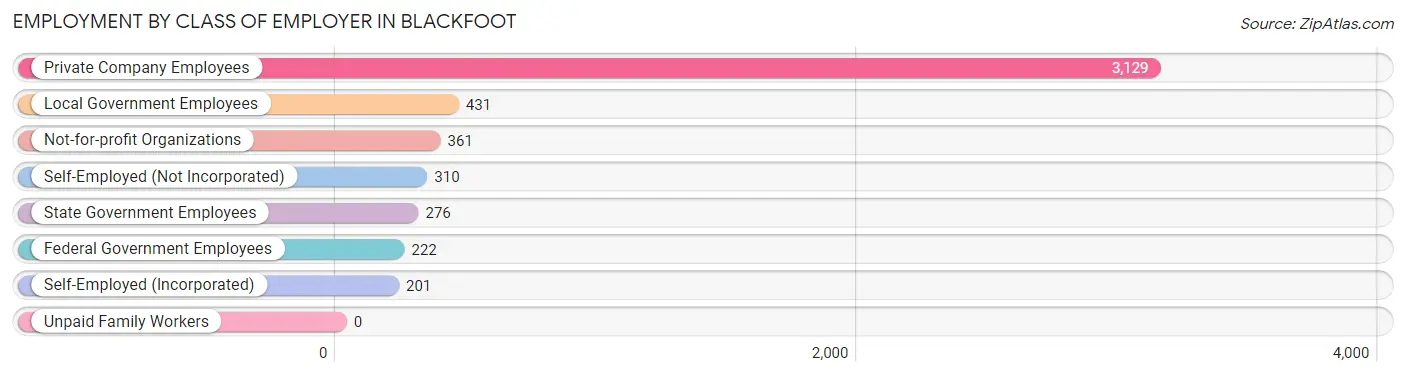
| Employer Class | # Employees | % Employees |
| Private Company Employees | 3,129 | 63.5% |
| Self-Employed (Incorporated) | 201 | 4.1% |
| Self-Employed (Not Incorporated) | 310 | 6.3% |
| Not-for-profit Organizations | 361 | 7.3% |
| Local Government Employees | 431 | 8.7% |
| State Government Employees | 276 | 5.6% |
| Federal Government Employees | 222 | 4.5% |
| Unpaid Family Workers | 0 | 0.0% |
| Total | 4,930 | 100.0% |
Employment Status by Age in Blackfoot
According to the labor force statistics for Blackfoot, out of the total population over 16 years of age (9,204), 59.6% or 5,486 individuals are in the labor force, with 8.9% or 488 of them unemployed. The age group with the highest labor force participation rate is 20 to 24 years, with 89.5% or 625 individuals in the labor force. Within the labor force, the 16 to 19 years age range has the highest percentage of unemployed individuals, with 36.0% or 140 of them being unemployed.
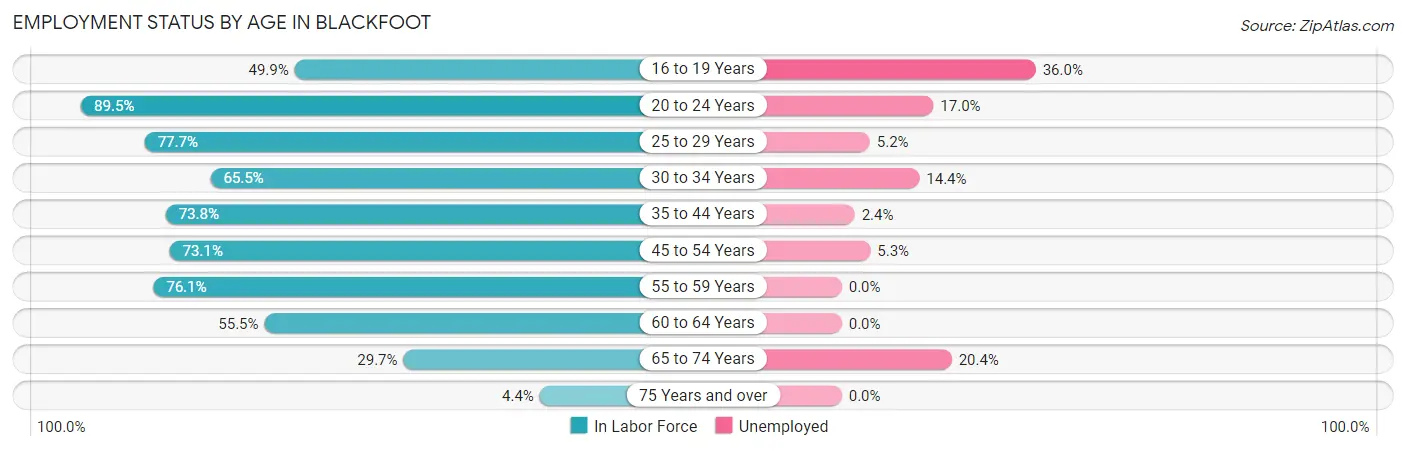
| Age Bracket | In Labor Force | Unemployed |
| 16 to 19 Years | 389 (49.9%) | 140 (36.0%) |
| 20 to 24 Years | 625 (89.5%) | 106 (17.0%) |
| 25 to 29 Years | 677 (77.7%) | 35 (5.2%) |
| 30 to 34 Years | 485 (65.5%) | 70 (14.4%) |
| 35 to 44 Years | 1,021 (73.8%) | 25 (2.4%) |
| 45 to 54 Years | 831 (73.1%) | 44 (5.3%) |
| 55 to 59 Years | 609 (76.1%) | 0 (0.0%) |
| 60 to 64 Years | 486 (55.5%) | 0 (0.0%) |
| 65 to 74 Years | 333 (29.7%) | 68 (20.4%) |
| 75 Years and over | 35 (4.4%) | 0 (0.0%) |
| Total | 5,486 (59.6%) | 488 (8.9%) |
Employment Status by Educational Attainment in Blackfoot
According to labor force statistics for Blackfoot, 70.7% of individuals (4,106) out of the total population between 25 and 64 years of age (5,807) are in the labor force, with 4.2% or 172 of them being unemployed. The group with the highest labor force participation rate are those with the educational attainment of college / associate degree, with 72.4% or 1,384 individuals in the labor force. Within the labor force, individuals with less than high school education have the highest percentage of unemployment, with 9.9% or 50 of them being unemployed.
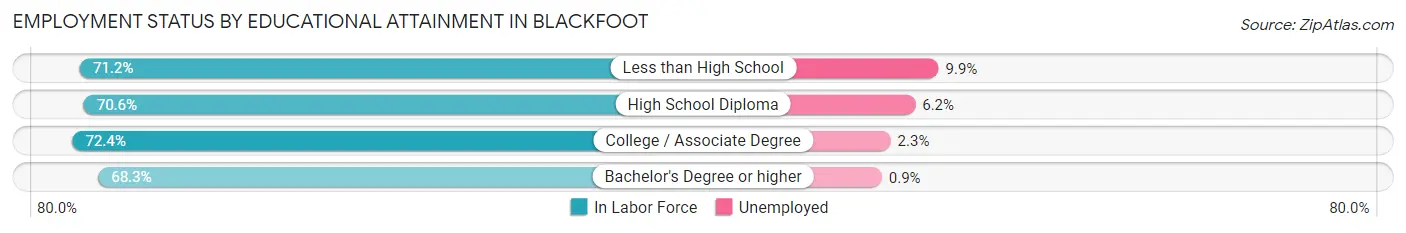
| Educational Attainment | In Labor Force | Unemployed |
| Less than High School | 505 (71.2%) | 70 (9.9%) |
| High School Diploma | 1,338 (70.6%) | 117 (6.2%) |
| College / Associate Degree | 1,384 (72.4%) | 44 (2.3%) |
| Bachelor's Degree or higher | 882 (68.3%) | 12 (0.9%) |
| Total | 4,106 (70.7%) | 244 (4.2%) |
Employment Occupations by Sex in Blackfoot
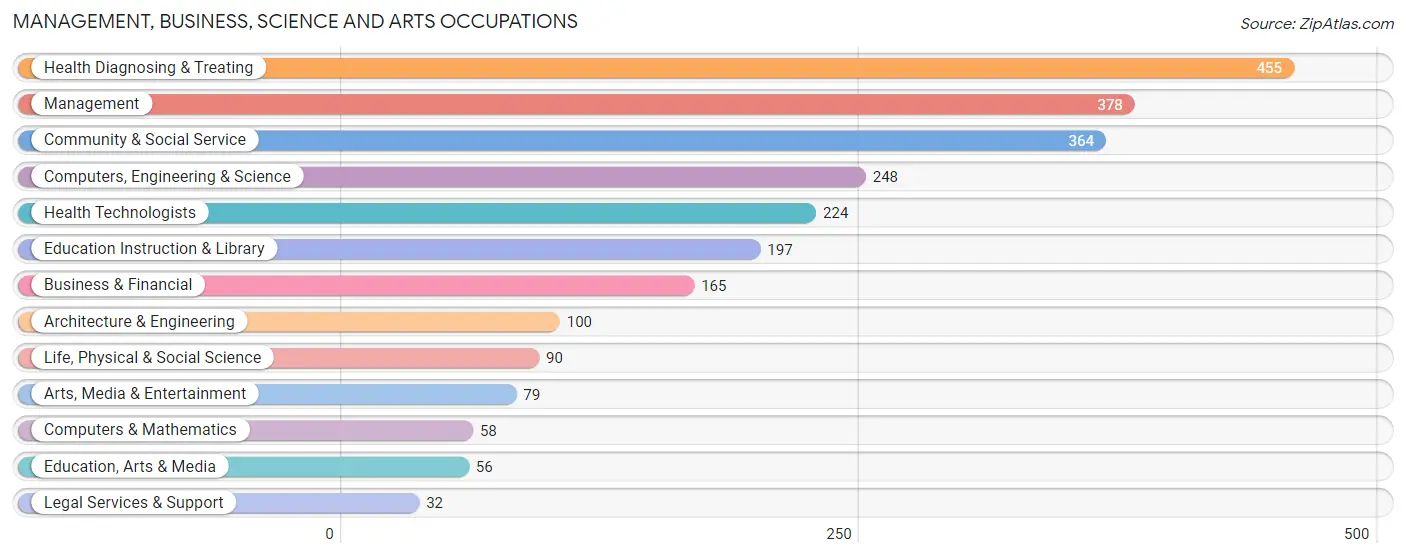
Management, Business, Science and Arts Occupations
The most common Management, Business, Science and Arts occupations in Blackfoot are Health Diagnosing & Treating (455 | 9.1%), Management (378 | 7.6%), Community & Social Service (364 | 7.3%), Computers, Engineering & Science (248 | 5.0%), and Health Technologists (224 | 4.5%).
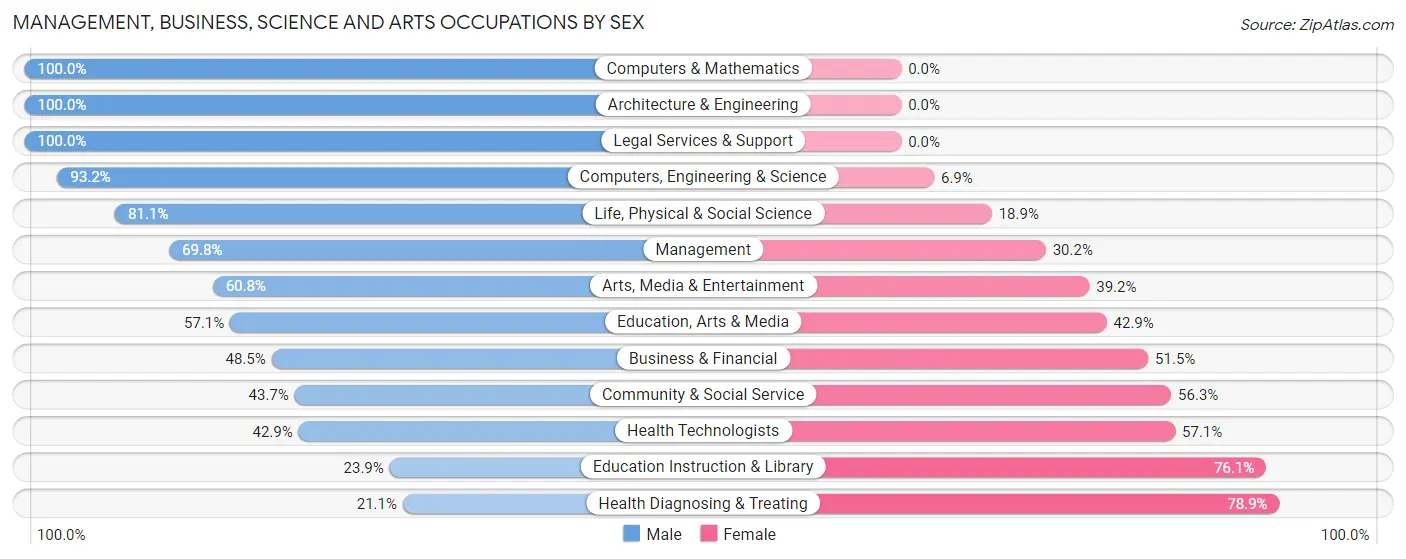
Management, Business, Science and Arts Occupations by Sex
Within the Management, Business, Science and Arts occupations in Blackfoot, the most male-oriented occupations are Computers & Mathematics (100.0%), Architecture & Engineering (100.0%), and Legal Services & Support (100.0%), while the most female-oriented occupations are Health Diagnosing & Treating (78.9%), Education Instruction & Library (76.1%), and Health Technologists (57.1%).
| Occupation | Male | Female |
| Management | 264 (69.8%) | 114 (30.2%) |
| Business & Financial | 80 (48.5%) | 85 (51.5%) |
| Computers, Engineering & Science | 231 (93.1%) | 17 (6.9%) |
| Computers & Mathematics | 58 (100.0%) | 0 (0.0%) |
| Architecture & Engineering | 100 (100.0%) | 0 (0.0%) |
| Life, Physical & Social Science | 73 (81.1%) | 17 (18.9%) |
| Community & Social Service | 159 (43.7%) | 205 (56.3%) |
| Education, Arts & Media | 32 (57.1%) | 24 (42.9%) |
| Legal Services & Support | 32 (100.0%) | 0 (0.0%) |
| Education Instruction & Library | 47 (23.9%) | 150 (76.1%) |
| Arts, Media & Entertainment | 48 (60.8%) | 31 (39.2%) |
| Health Diagnosing & Treating | 96 (21.1%) | 359 (78.9%) |
| Health Technologists | 96 (42.9%) | 128 (57.1%) |
| Total (Category) | 830 (51.5%) | 780 (48.4%) |
| Total (Overall) | 2,745 (54.9%) | 2,258 (45.1%) |
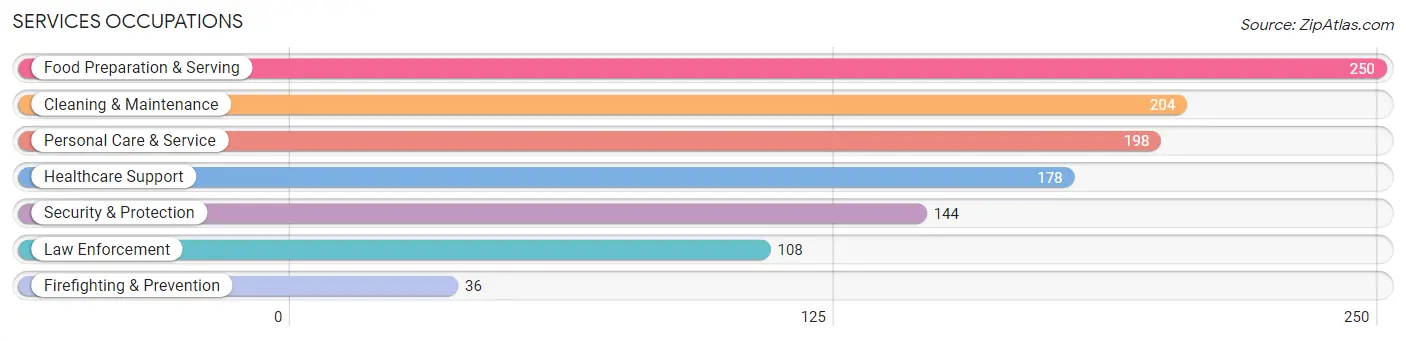
Services Occupations
The most common Services occupations in Blackfoot are Food Preparation & Serving (250 | 5.0%), Cleaning & Maintenance (204 | 4.1%), Personal Care & Service (198 | 4.0%), Healthcare Support (178 | 3.6%), and Security & Protection (144 | 2.9%).
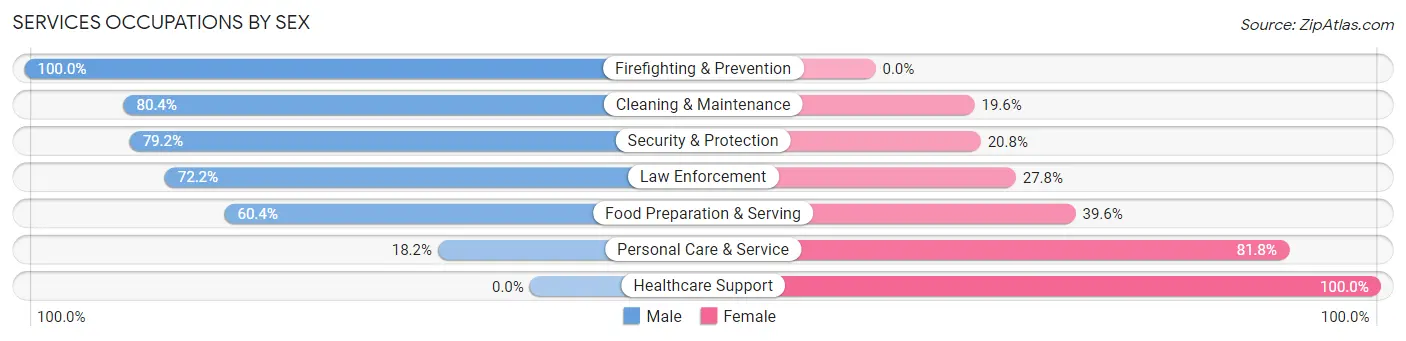
Services Occupations by Sex
Within the Services occupations in Blackfoot, the most male-oriented occupations are Firefighting & Prevention (100.0%), Cleaning & Maintenance (80.4%), and Security & Protection (79.2%), while the most female-oriented occupations are Healthcare Support (100.0%), Personal Care & Service (81.8%), and Food Preparation & Serving (39.6%).
| Occupation | Male | Female |
| Healthcare Support | 0 (0.0%) | 178 (100.0%) |
| Security & Protection | 114 (79.2%) | 30 (20.8%) |
| Firefighting & Prevention | 36 (100.0%) | 0 (0.0%) |
| Law Enforcement | 78 (72.2%) | 30 (27.8%) |
| Food Preparation & Serving | 151 (60.4%) | 99 (39.6%) |
| Cleaning & Maintenance | 164 (80.4%) | 40 (19.6%) |
| Personal Care & Service | 36 (18.2%) | 162 (81.8%) |
| Total (Category) | 465 (47.7%) | 509 (52.3%) |
| Total (Overall) | 2,745 (54.9%) | 2,258 (45.1%) |
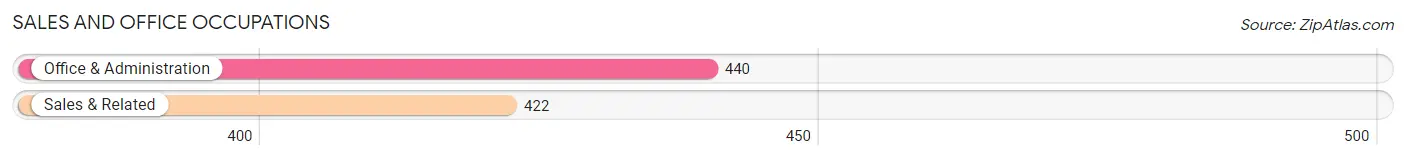
Sales and Office Occupations
The most common Sales and Office occupations in Blackfoot are Office & Administration (440 | 8.8%), and Sales & Related (422 | 8.4%).
Sales and Office Occupations by Sex
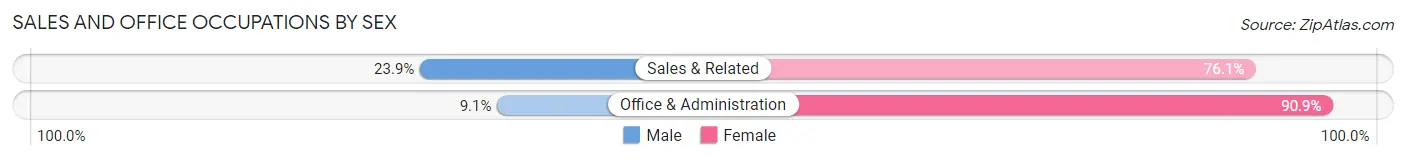
| Occupation | Male | Female |
| Sales & Related | 101 (23.9%) | 321 (76.1%) |
| Office & Administration | 40 (9.1%) | 400 (90.9%) |
| Total (Category) | 141 (16.4%) | 721 (83.6%) |
| Total (Overall) | 2,745 (54.9%) | 2,258 (45.1%) |
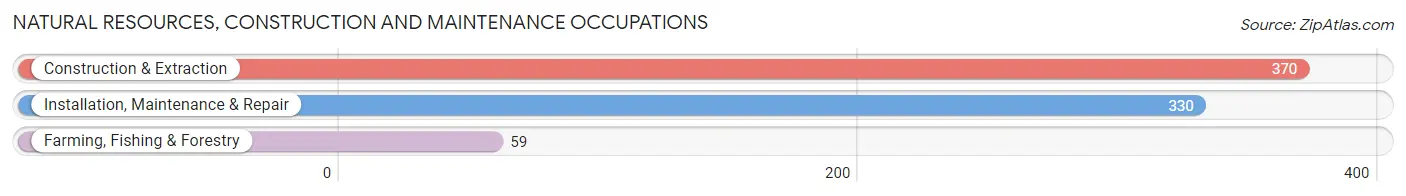
Natural Resources, Construction and Maintenance Occupations
The most common Natural Resources, Construction and Maintenance occupations in Blackfoot are Construction & Extraction (370 | 7.4%), Installation, Maintenance & Repair (330 | 6.6%), and Farming, Fishing & Forestry (59 | 1.2%).
Natural Resources, Construction and Maintenance Occupations by Sex
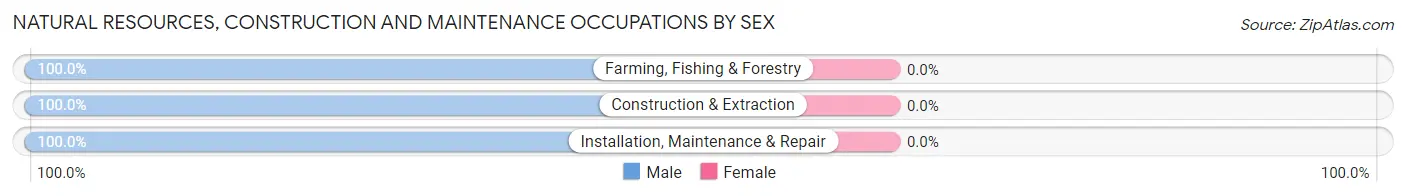
| Occupation | Male | Female |
| Farming, Fishing & Forestry | 59 (100.0%) | 0 (0.0%) |
| Construction & Extraction | 370 (100.0%) | 0 (0.0%) |
| Installation, Maintenance & Repair | 330 (100.0%) | 0 (0.0%) |
| Total (Category) | 759 (100.0%) | 0 (0.0%) |
| Total (Overall) | 2,745 (54.9%) | 2,258 (45.1%) |
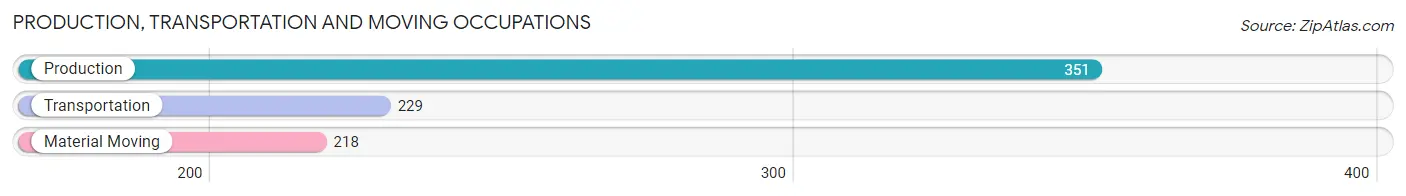
Production, Transportation and Moving Occupations
The most common Production, Transportation and Moving occupations in Blackfoot are Production (351 | 7.0%), Transportation (229 | 4.6%), and Material Moving (218 | 4.4%).
Production, Transportation and Moving Occupations by Sex
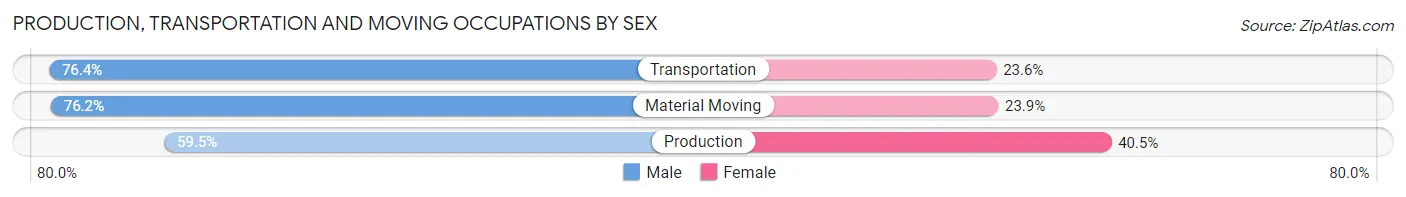
| Occupation | Male | Female |
| Production | 209 (59.5%) | 142 (40.5%) |
| Transportation | 175 (76.4%) | 54 (23.6%) |
| Material Moving | 166 (76.1%) | 52 (23.8%) |
| Total (Category) | 550 (68.9%) | 248 (31.1%) |
| Total (Overall) | 2,745 (54.9%) | 2,258 (45.1%) |
Employment Industries by Sex in Blackfoot
Employment Industries in Blackfoot
The major employment industries in Blackfoot include Retail Trade (765 | 15.3%), Health Care & Social Assistance (758 | 15.1%), Manufacturing (617 | 12.3%), Construction (409 | 8.2%), and Educational Services (315 | 6.3%).
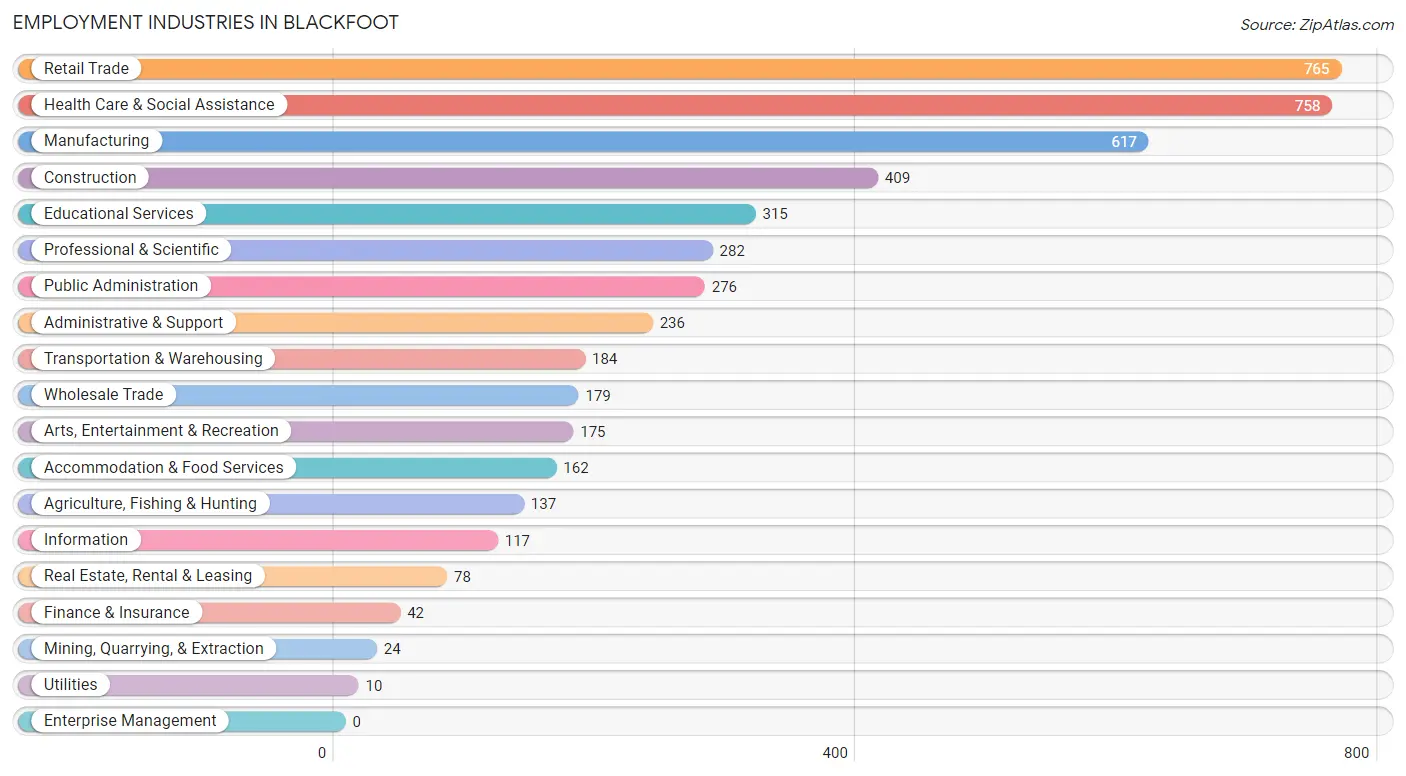
Employment Industries by Sex in Blackfoot
The Blackfoot industries that see more men than women are Agriculture, Fishing & Hunting (100.0%), Mining, Quarrying, & Extraction (100.0%), and Construction (100.0%), whereas the industries that tend to have a higher number of women are Utilities (100.0%), Finance & Insurance (100.0%), and Health Care & Social Assistance (83.9%).
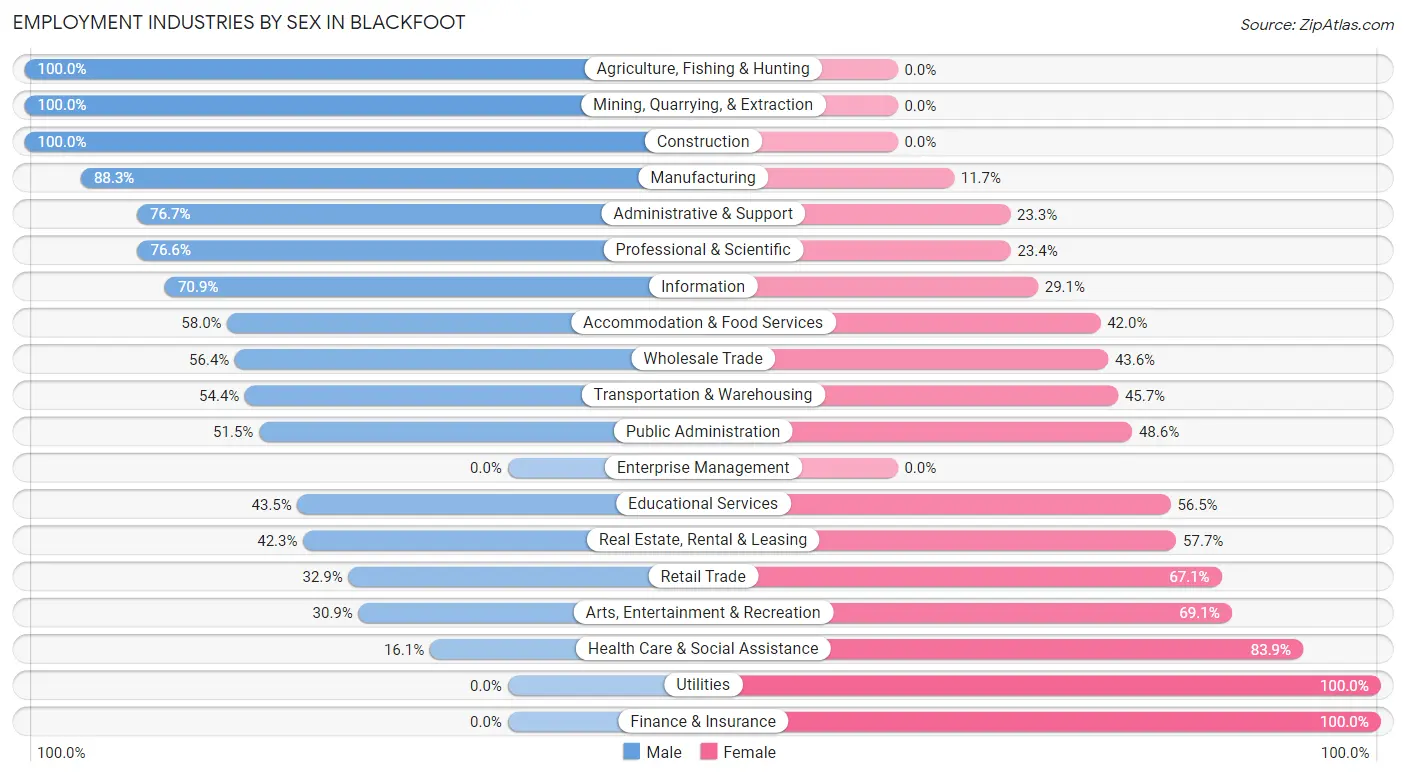
| Industry | Male | Female |
| Agriculture, Fishing & Hunting | 137 (100.0%) | 0 (0.0%) |
| Mining, Quarrying, & Extraction | 24 (100.0%) | 0 (0.0%) |
| Construction | 409 (100.0%) | 0 (0.0%) |
| Manufacturing | 545 (88.3%) | 72 (11.7%) |
| Wholesale Trade | 101 (56.4%) | 78 (43.6%) |
| Retail Trade | 252 (32.9%) | 513 (67.1%) |
| Transportation & Warehousing | 100 (54.3%) | 84 (45.7%) |
| Utilities | 0 (0.0%) | 10 (100.0%) |
| Information | 83 (70.9%) | 34 (29.1%) |
| Finance & Insurance | 0 (0.0%) | 42 (100.0%) |
| Real Estate, Rental & Leasing | 33 (42.3%) | 45 (57.7%) |
| Professional & Scientific | 216 (76.6%) | 66 (23.4%) |
| Enterprise Management | 0 (0.0%) | 0 (0.0%) |
| Administrative & Support | 181 (76.7%) | 55 (23.3%) |
| Educational Services | 137 (43.5%) | 178 (56.5%) |
| Health Care & Social Assistance | 122 (16.1%) | 636 (83.9%) |
| Arts, Entertainment & Recreation | 54 (30.9%) | 121 (69.1%) |
| Accommodation & Food Services | 94 (58.0%) | 68 (42.0%) |
| Public Administration | 142 (51.4%) | 134 (48.5%) |
| Total | 2,745 (54.9%) | 2,258 (45.1%) |
Education in Blackfoot
School Enrollment in Blackfoot
The most common levels of schooling among the 3,417 students in Blackfoot are middle school (909 | 26.6%), elementary school (753 | 22.0%), and high school (740 | 21.7%).
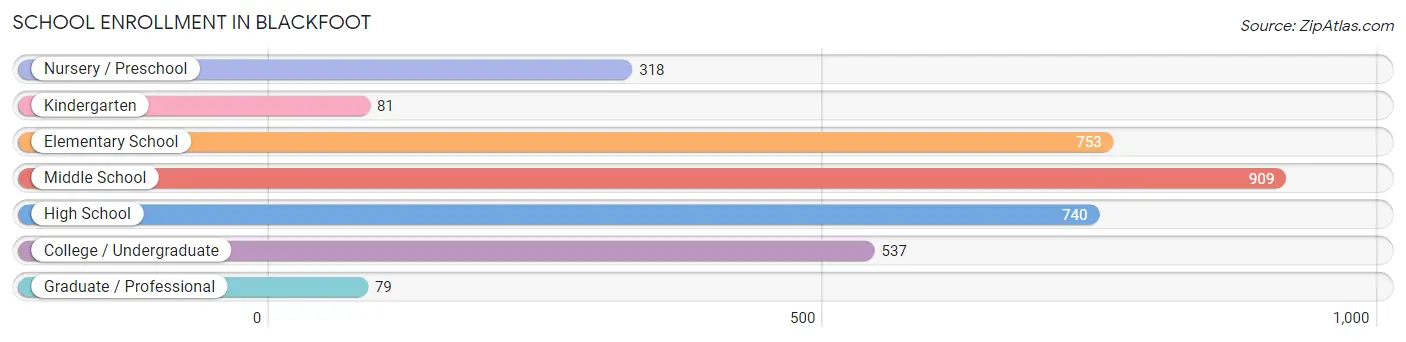
| School Level | # Students | % Students |
| Nursery / Preschool | 318 | 9.3% |
| Kindergarten | 81 | 2.4% |
| Elementary School | 753 | 22.0% |
| Middle School | 909 | 26.6% |
| High School | 740 | 21.7% |
| College / Undergraduate | 537 | 15.7% |
| Graduate / Professional | 79 | 2.3% |
| Total | 3,417 | 100.0% |
School Enrollment by Age by Funding Source in Blackfoot
Out of a total of 3,417 students who are enrolled in schools in Blackfoot, 400 (11.7%) attend a private institution, while the remaining 3,017 (88.3%) are enrolled in public schools. The age group of 3 to 4 year olds has the highest likelihood of being enrolled in private schools, with 97 (66.4% in the age bracket) enrolled. Conversely, the age group of 10 to 14 year olds has the lowest likelihood of being enrolled in a private school, with 1,041 (97.1% in the age bracket) attending a public institution.
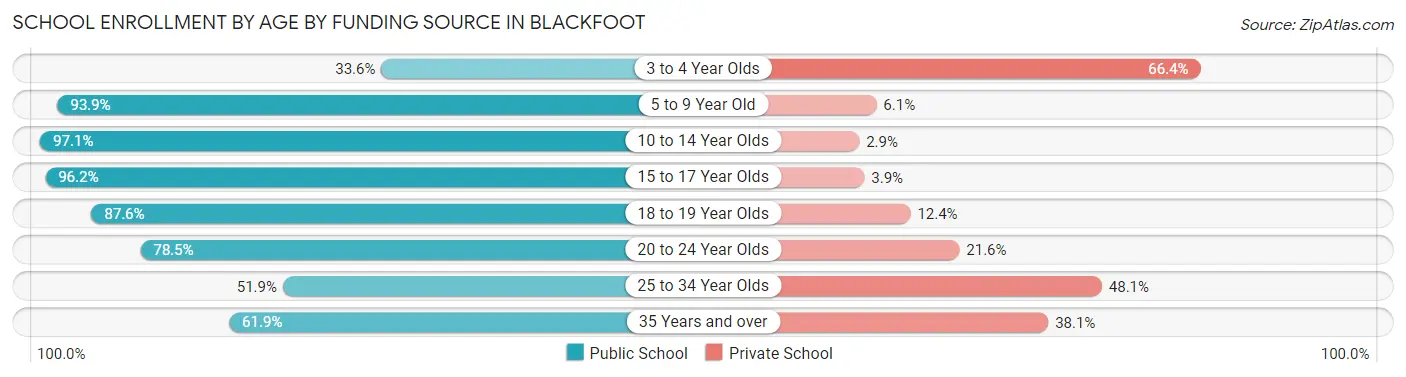
| Age Bracket | Public School | Private School |
| 3 to 4 Year Olds | 49 (33.6%) | 97 (66.4%) |
| 5 to 9 Year Old | 816 (93.9%) | 53 (6.1%) |
| 10 to 14 Year Olds | 1,041 (97.1%) | 31 (2.9%) |
| 15 to 17 Year Olds | 574 (96.2%) | 23 (3.8%) |
| 18 to 19 Year Olds | 169 (87.6%) | 24 (12.4%) |
| 20 to 24 Year Olds | 222 (78.4%) | 61 (21.5%) |
| 25 to 34 Year Olds | 68 (51.9%) | 63 (48.1%) |
| 35 Years and over | 78 (61.9%) | 48 (38.1%) |
| Total | 3,017 (88.3%) | 400 (11.7%) |
Educational Attainment by Field of Study in Blackfoot
Business (306 | 16.2%), science & technology (304 | 16.1%), arts & humanities (276 | 14.6%), education (211 | 11.2%), and engineering (169 | 8.9%) are the most common fields of study among 1,889 individuals in Blackfoot who have obtained a bachelor's degree or higher.
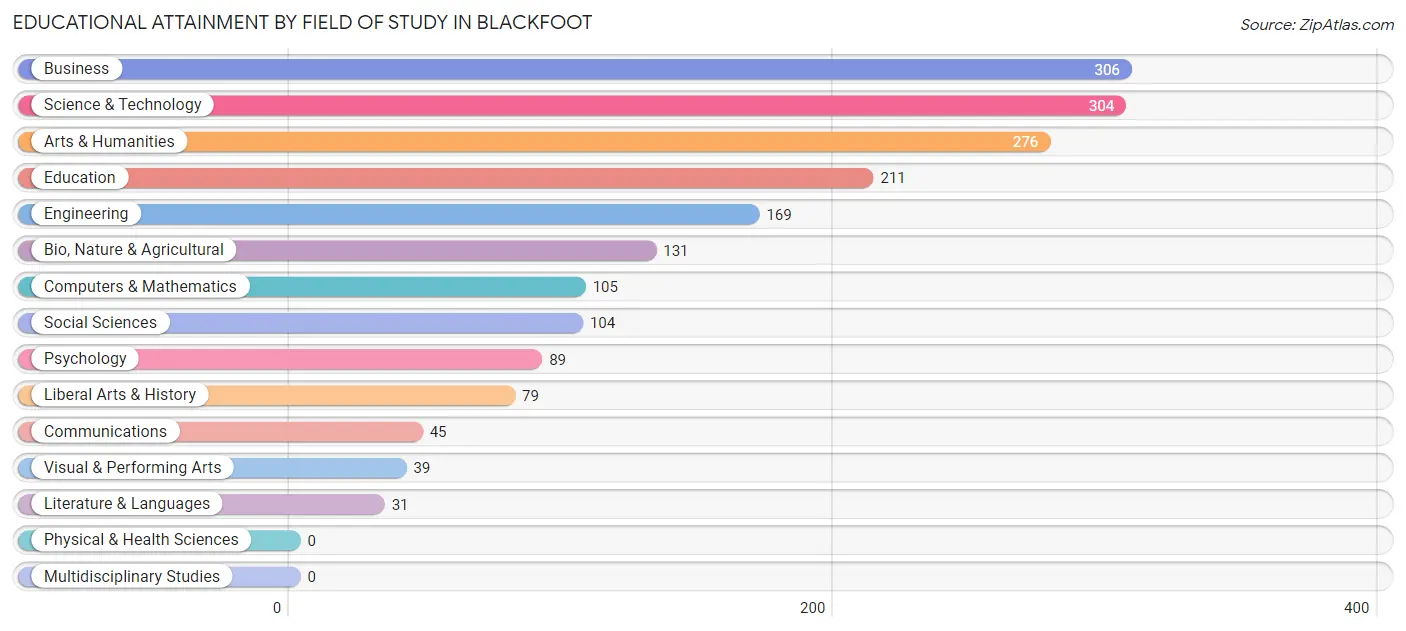
| Field of Study | # Graduates | % Graduates |
| Computers & Mathematics | 105 | 5.6% |
| Bio, Nature & Agricultural | 131 | 6.9% |
| Physical & Health Sciences | 0 | 0.0% |
| Psychology | 89 | 4.7% |
| Social Sciences | 104 | 5.5% |
| Engineering | 169 | 8.9% |
| Multidisciplinary Studies | 0 | 0.0% |
| Science & Technology | 304 | 16.1% |
| Business | 306 | 16.2% |
| Education | 211 | 11.2% |
| Literature & Languages | 31 | 1.6% |
| Liberal Arts & History | 79 | 4.2% |
| Visual & Performing Arts | 39 | 2.1% |
| Communications | 45 | 2.4% |
| Arts & Humanities | 276 | 14.6% |
| Total | 1,889 | 100.0% |
Transportation & Commute in Blackfoot
Vehicle Availability by Sex in Blackfoot
The most prevalent vehicle ownership categories in Blackfoot are males with 2 vehicles (1,005, accounting for 37.6%) and females with 2 vehicles (821, making up 44.7%).
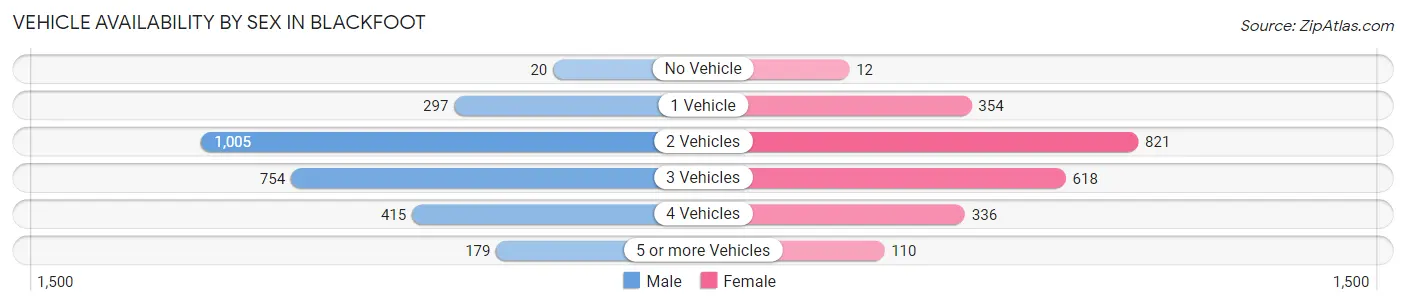
| Vehicles Available | Male | Female |
| No Vehicle | 20 (0.7%) | 12 (0.5%) |
| 1 Vehicle | 297 (11.1%) | 354 (15.7%) |
| 2 Vehicles | 1,005 (37.6%) | 821 (36.5%) |
| 3 Vehicles | 754 (28.2%) | 618 (27.5%) |
| 4 Vehicles | 415 (15.5%) | 336 (14.9%) |
| 5 or more Vehicles | 179 (6.7%) | 110 (4.9%) |
| Total | 2,670 (100.0%) | 2,251 (100.0%) |
Commute Time in Blackfoot
The most frequently occuring commute durations in Blackfoot are 10 to 14 minutes (1,012 commuters, 21.5%), 5 to 9 minutes (731 commuters, 15.6%), and 30 to 34 minutes (627 commuters, 13.4%).
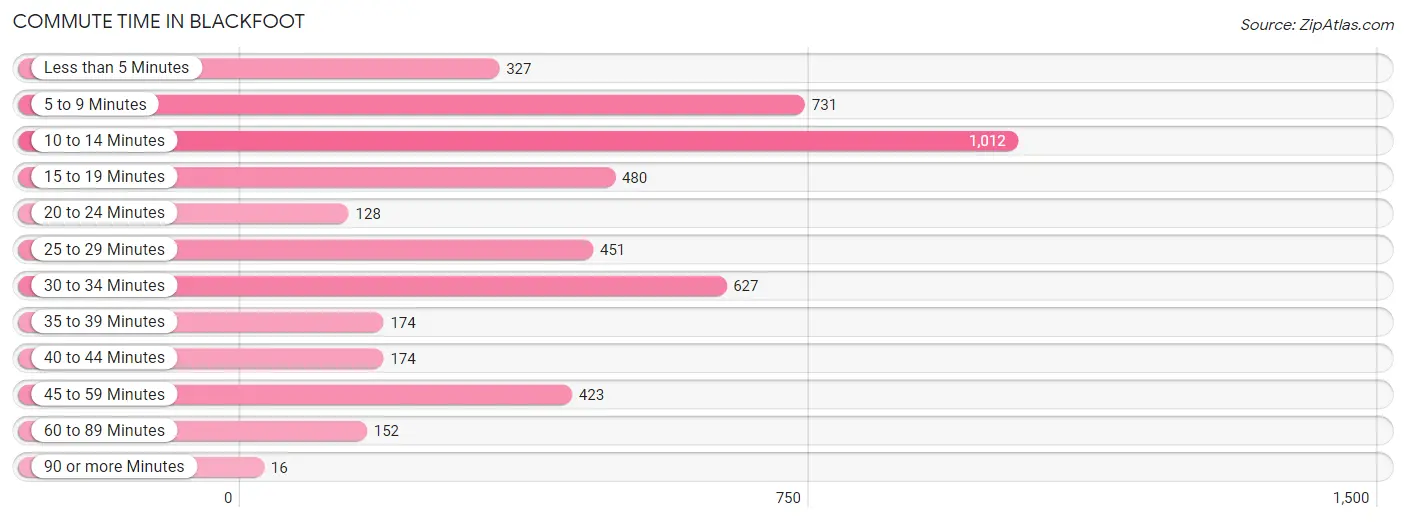
| Commute Time | # Commuters | % Commuters |
| Less than 5 Minutes | 327 | 7.0% |
| 5 to 9 Minutes | 731 | 15.6% |
| 10 to 14 Minutes | 1,012 | 21.5% |
| 15 to 19 Minutes | 480 | 10.2% |
| 20 to 24 Minutes | 128 | 2.7% |
| 25 to 29 Minutes | 451 | 9.6% |
| 30 to 34 Minutes | 627 | 13.4% |
| 35 to 39 Minutes | 174 | 3.7% |
| 40 to 44 Minutes | 174 | 3.7% |
| 45 to 59 Minutes | 423 | 9.0% |
| 60 to 89 Minutes | 152 | 3.2% |
| 90 or more Minutes | 16 | 0.3% |
Commute Time by Sex in Blackfoot
The most common commute times in Blackfoot are 10 to 14 minutes (593 commuters, 22.8%) for males and 10 to 14 minutes (419 commuters, 20.1%) for females.
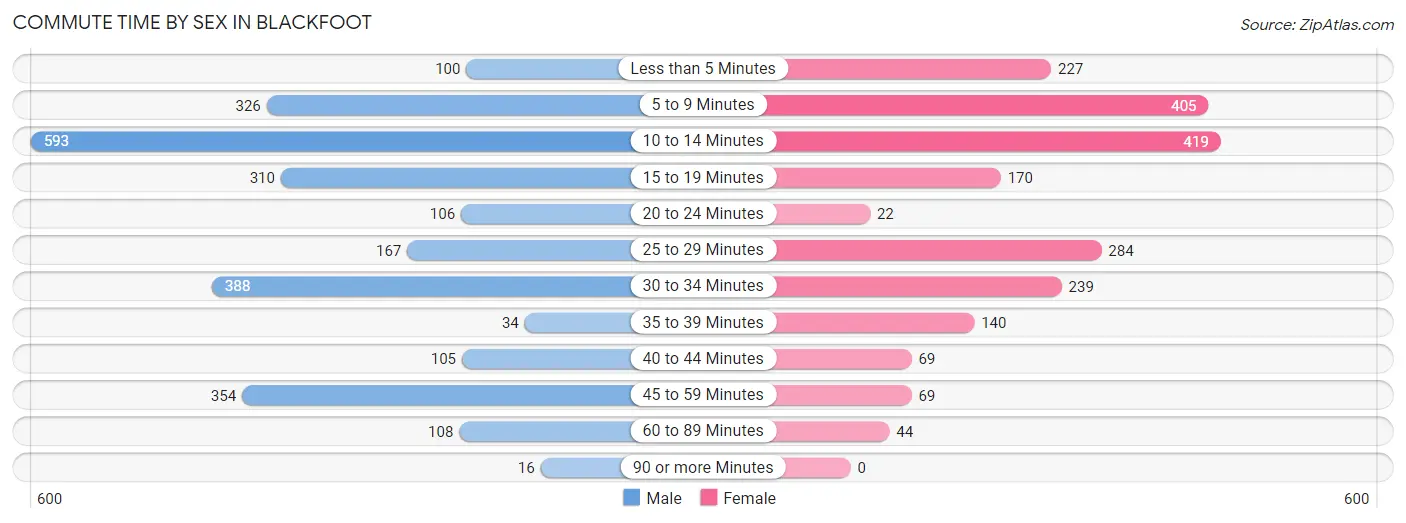
| Commute Time | Male | Female |
| Less than 5 Minutes | 100 (3.8%) | 227 (10.9%) |
| 5 to 9 Minutes | 326 (12.5%) | 405 (19.4%) |
| 10 to 14 Minutes | 593 (22.8%) | 419 (20.1%) |
| 15 to 19 Minutes | 310 (11.9%) | 170 (8.1%) |
| 20 to 24 Minutes | 106 (4.1%) | 22 (1.1%) |
| 25 to 29 Minutes | 167 (6.4%) | 284 (13.6%) |
| 30 to 34 Minutes | 388 (14.9%) | 239 (11.5%) |
| 35 to 39 Minutes | 34 (1.3%) | 140 (6.7%) |
| 40 to 44 Minutes | 105 (4.0%) | 69 (3.3%) |
| 45 to 59 Minutes | 354 (13.6%) | 69 (3.3%) |
| 60 to 89 Minutes | 108 (4.1%) | 44 (2.1%) |
| 90 or more Minutes | 16 (0.6%) | 0 (0.0%) |
Time of Departure to Work by Sex in Blackfoot
The most frequent times of departure to work in Blackfoot are 6:00 AM to 6:29 AM (467, 17.9%) for males and 7:30 AM to 7:59 AM (437, 20.9%) for females.
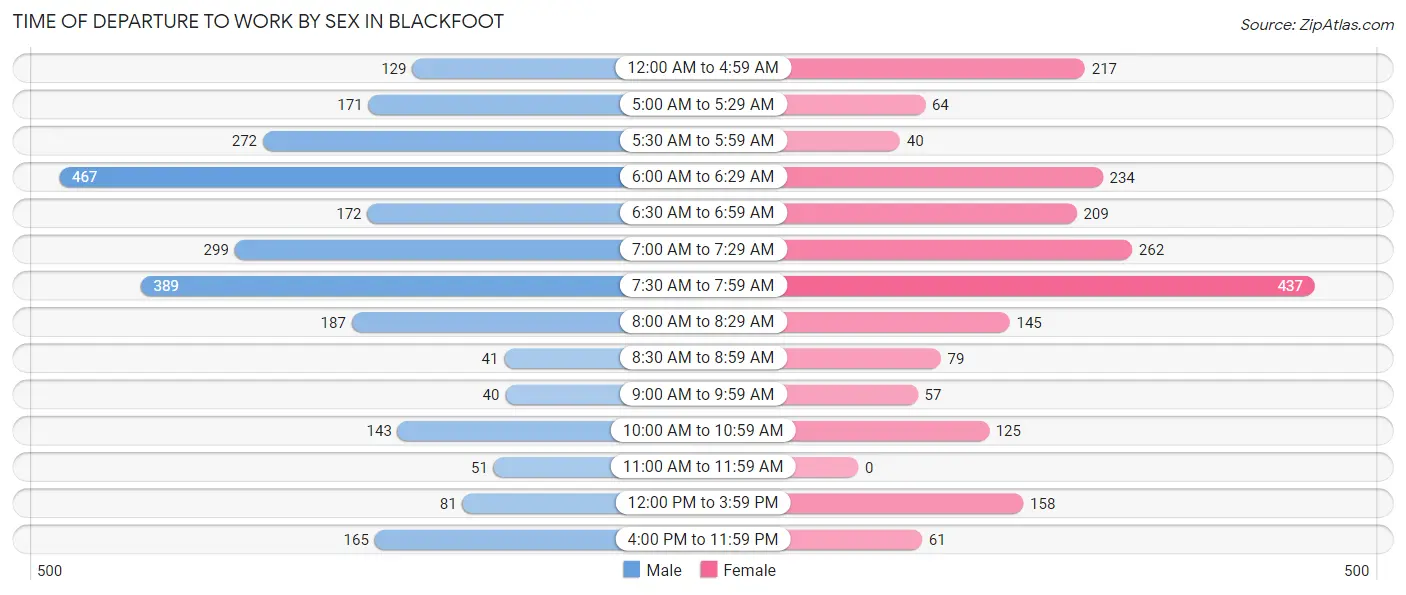
| Time of Departure | Male | Female |
| 12:00 AM to 4:59 AM | 129 (5.0%) | 217 (10.4%) |
| 5:00 AM to 5:29 AM | 171 (6.6%) | 64 (3.1%) |
| 5:30 AM to 5:59 AM | 272 (10.4%) | 40 (1.9%) |
| 6:00 AM to 6:29 AM | 467 (17.9%) | 234 (11.2%) |
| 6:30 AM to 6:59 AM | 172 (6.6%) | 209 (10.0%) |
| 7:00 AM to 7:29 AM | 299 (11.5%) | 262 (12.6%) |
| 7:30 AM to 7:59 AM | 389 (14.9%) | 437 (20.9%) |
| 8:00 AM to 8:29 AM | 187 (7.2%) | 145 (6.9%) |
| 8:30 AM to 8:59 AM | 41 (1.6%) | 79 (3.8%) |
| 9:00 AM to 9:59 AM | 40 (1.5%) | 57 (2.7%) |
| 10:00 AM to 10:59 AM | 143 (5.5%) | 125 (6.0%) |
| 11:00 AM to 11:59 AM | 51 (2.0%) | 0 (0.0%) |
| 12:00 PM to 3:59 PM | 81 (3.1%) | 158 (7.6%) |
| 4:00 PM to 11:59 PM | 165 (6.3%) | 61 (2.9%) |
| Total | 2,607 (100.0%) | 2,088 (100.0%) |
Housing Occupancy in Blackfoot
Occupancy by Ownership in Blackfoot
Of the total 4,146 dwellings in Blackfoot, owner-occupied units account for 2,838 (68.4%), while renter-occupied units make up 1,308 (31.6%).
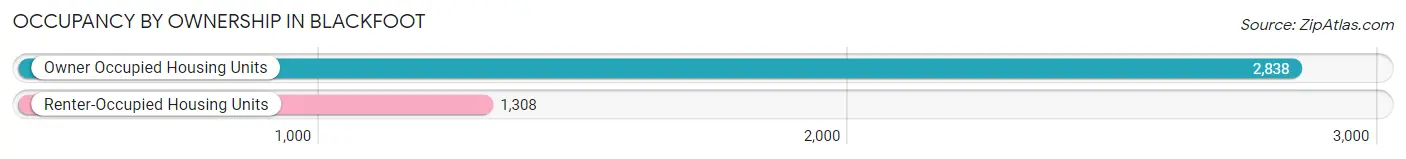
| Occupancy | # Housing Units | % Housing Units |
| Owner Occupied Housing Units | 2,838 | 68.4% |
| Renter-Occupied Housing Units | 1,308 | 31.6% |
| Total Occupied Housing Units | 4,146 | 100.0% |
Occupancy by Household Size in Blackfoot
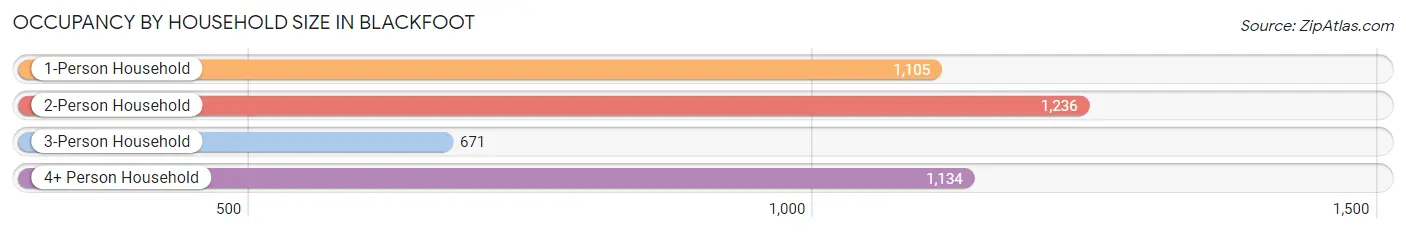
| Household Size | # Housing Units | % Housing Units |
| 1-Person Household | 1,105 | 26.7% |
| 2-Person Household | 1,236 | 29.8% |
| 3-Person Household | 671 | 16.2% |
| 4+ Person Household | 1,134 | 27.4% |
| Total Housing Units | 4,146 | 100.0% |
Occupancy by Ownership by Household Size in Blackfoot
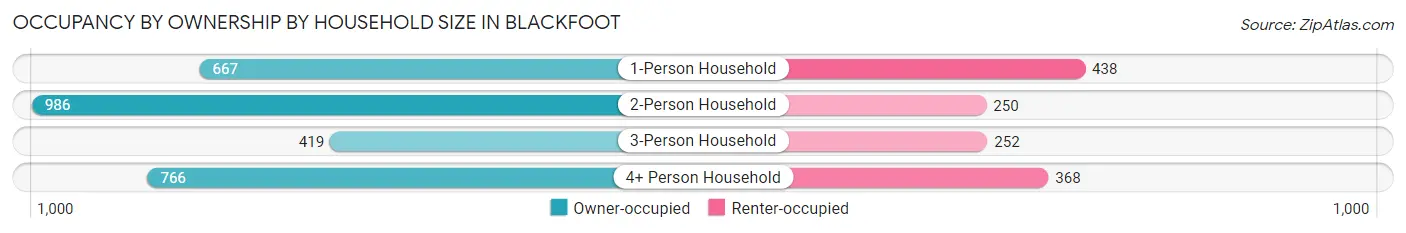
| Household Size | Owner-occupied | Renter-occupied |
| 1-Person Household | 667 (60.4%) | 438 (39.6%) |
| 2-Person Household | 986 (79.8%) | 250 (20.2%) |
| 3-Person Household | 419 (62.4%) | 252 (37.6%) |
| 4+ Person Household | 766 (67.5%) | 368 (32.5%) |
| Total Housing Units | 2,838 (68.4%) | 1,308 (31.6%) |
Occupancy by Educational Attainment in Blackfoot
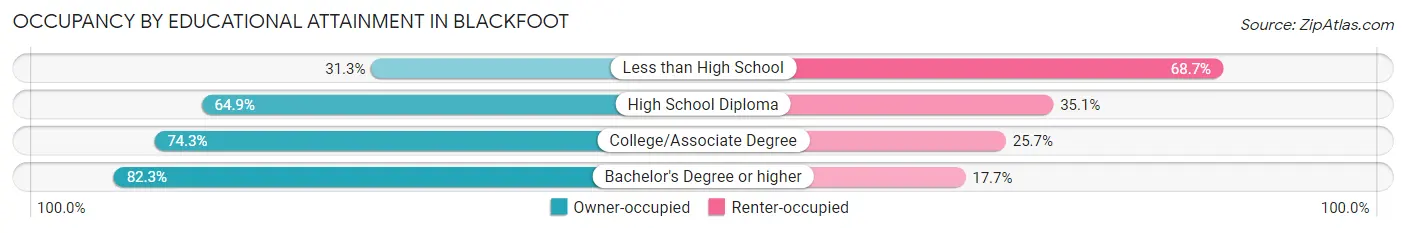
| Household Size | Owner-occupied | Renter-occupied |
| Less than High School | 146 (31.3%) | 321 (68.7%) |
| High School Diploma | 819 (64.9%) | 443 (35.1%) |
| College/Associate Degree | 1,081 (74.3%) | 374 (25.7%) |
| Bachelor's Degree or higher | 792 (82.3%) | 170 (17.7%) |
Occupancy by Age of Householder in Blackfoot
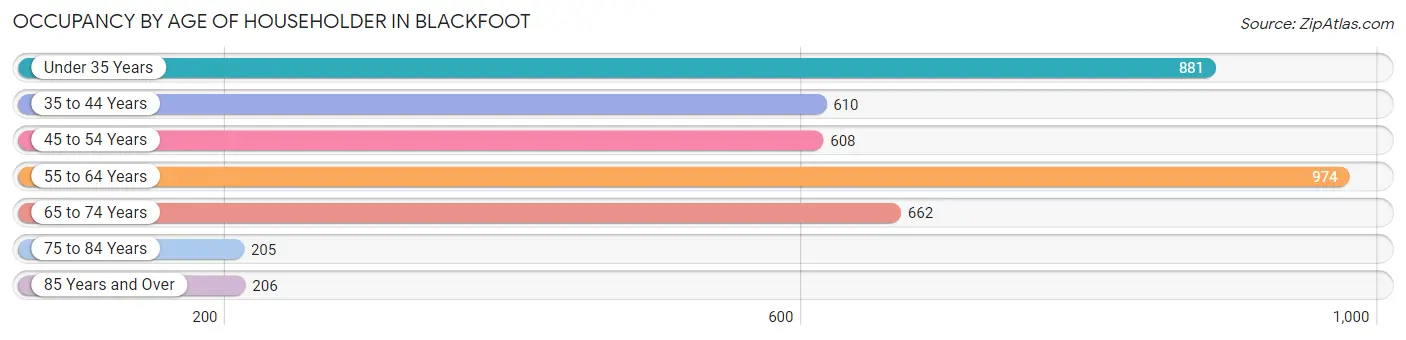
| Age Bracket | # Households | % Households |
| Under 35 Years | 881 | 21.2% |
| 35 to 44 Years | 610 | 14.7% |
| 45 to 54 Years | 608 | 14.7% |
| 55 to 64 Years | 974 | 23.5% |
| 65 to 74 Years | 662 | 16.0% |
| 75 to 84 Years | 205 | 4.9% |
| 85 Years and Over | 206 | 5.0% |
| Total | 4,146 | 100.0% |
Housing Finances in Blackfoot
Median Income by Occupancy in Blackfoot
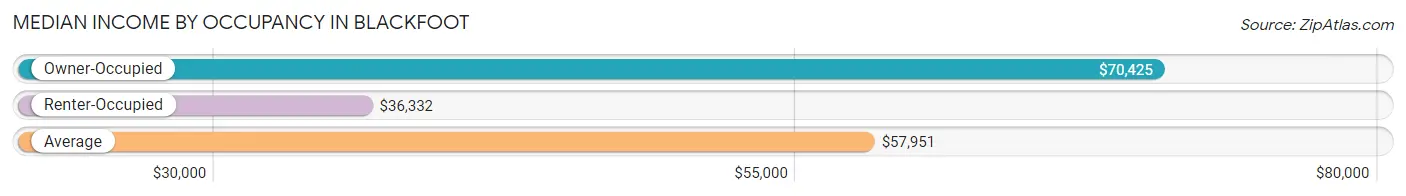
| Occupancy Type | # Households | Median Income |
| Owner-Occupied | 2,838 (68.4%) | $70,425 |
| Renter-Occupied | 1,308 (31.6%) | $36,332 |
| Average | 4,146 (100.0%) | $57,951 |
Occupancy by Householder Income Bracket in Blackfoot
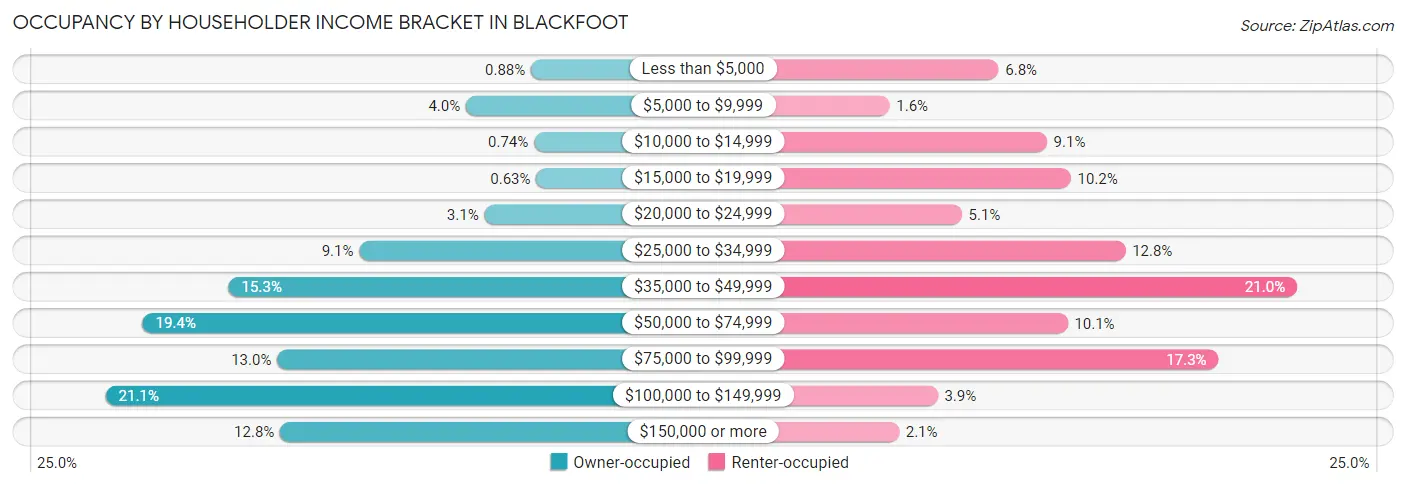
| Income Bracket | Owner-occupied | Renter-occupied |
| Less than $5,000 | 25 (0.9%) | 89 (6.8%) |
| $5,000 to $9,999 | 113 (4.0%) | 21 (1.6%) |
| $10,000 to $14,999 | 21 (0.7%) | 119 (9.1%) |
| $15,000 to $19,999 | 18 (0.6%) | 134 (10.2%) |
| $20,000 to $24,999 | 88 (3.1%) | 66 (5.1%) |
| $25,000 to $34,999 | 257 (9.1%) | 168 (12.8%) |
| $35,000 to $49,999 | 434 (15.3%) | 275 (21.0%) |
| $50,000 to $74,999 | 550 (19.4%) | 132 (10.1%) |
| $75,000 to $99,999 | 368 (13.0%) | 226 (17.3%) |
| $100,000 to $149,999 | 600 (21.1%) | 51 (3.9%) |
| $150,000 or more | 364 (12.8%) | 27 (2.1%) |
| Total | 2,838 (100.0%) | 1,308 (100.0%) |
Monthly Housing Cost Tiers in Blackfoot
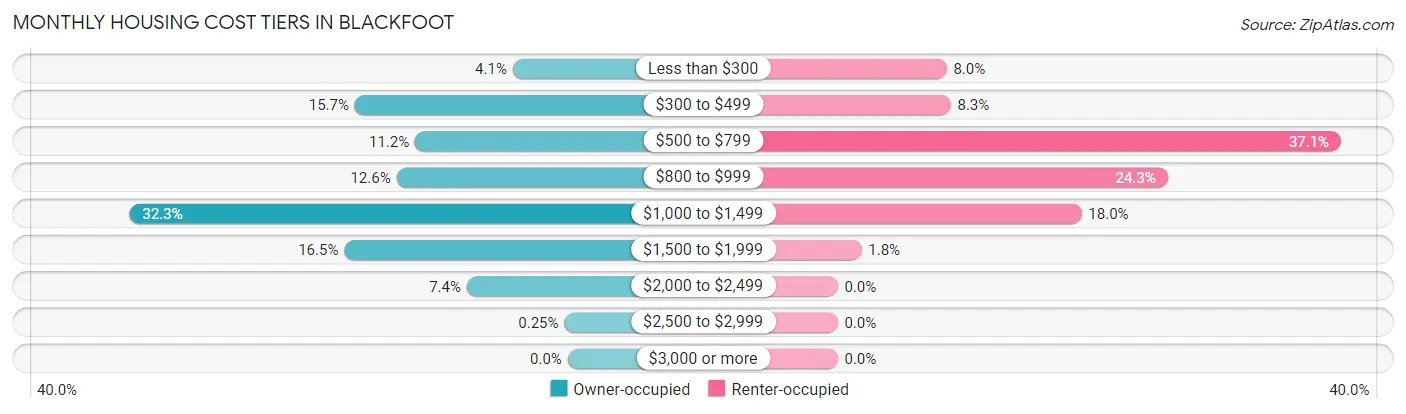
| Monthly Cost | Owner-occupied | Renter-occupied |
| Less than $300 | 115 (4.1%) | 105 (8.0%) |
| $300 to $499 | 445 (15.7%) | 109 (8.3%) |
| $500 to $799 | 319 (11.2%) | 485 (37.1%) |
| $800 to $999 | 358 (12.6%) | 318 (24.3%) |
| $1,000 to $1,499 | 916 (32.3%) | 235 (18.0%) |
| $1,500 to $1,999 | 467 (16.5%) | 23 (1.8%) |
| $2,000 to $2,499 | 211 (7.4%) | 0 (0.0%) |
| $2,500 to $2,999 | 7 (0.3%) | 0 (0.0%) |
| $3,000 or more | 0 (0.0%) | 0 (0.0%) |
| Total | 2,838 (100.0%) | 1,308 (100.0%) |
Physical Housing Characteristics in Blackfoot
Housing Structures in Blackfoot
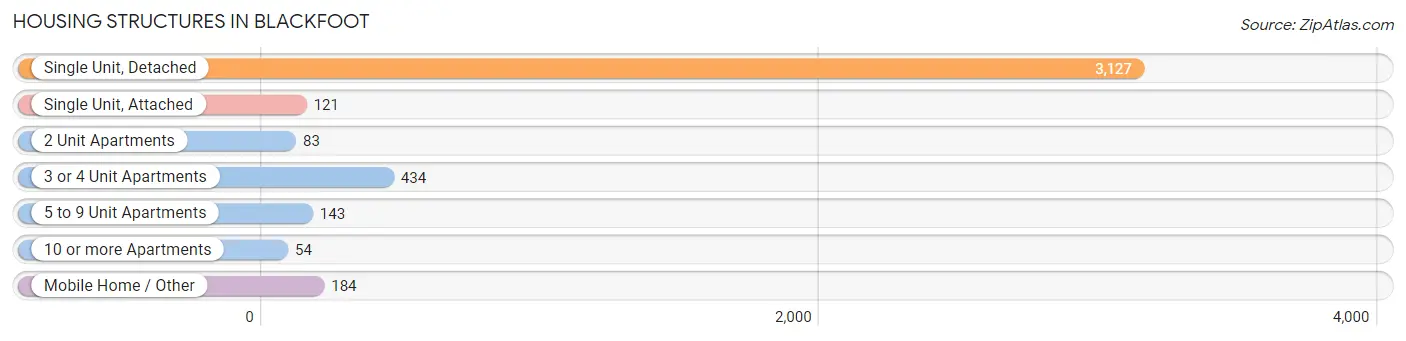
| Structure Type | # Housing Units | % Housing Units |
| Single Unit, Detached | 3,127 | 75.4% |
| Single Unit, Attached | 121 | 2.9% |
| 2 Unit Apartments | 83 | 2.0% |
| 3 or 4 Unit Apartments | 434 | 10.5% |
| 5 to 9 Unit Apartments | 143 | 3.5% |
| 10 or more Apartments | 54 | 1.3% |
| Mobile Home / Other | 184 | 4.4% |
| Total | 4,146 | 100.0% |
Housing Structures by Occupancy in Blackfoot
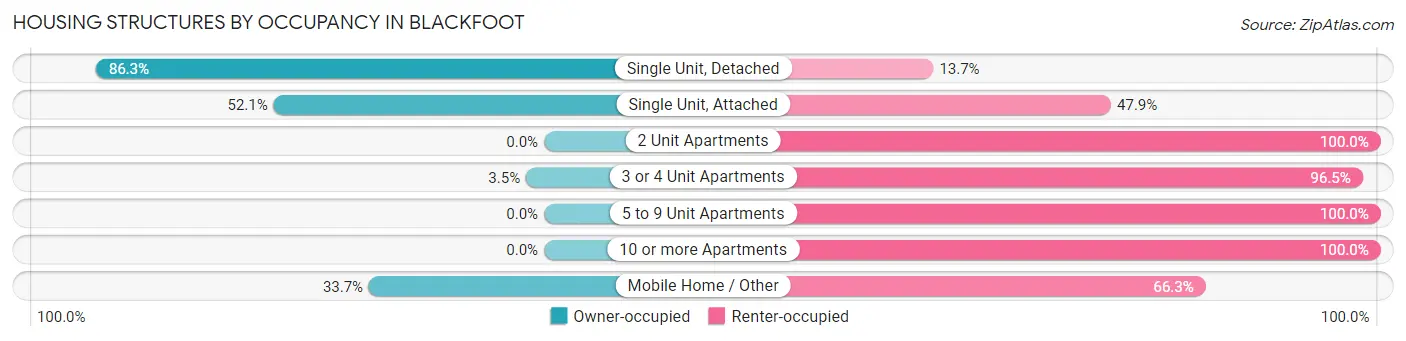
| Structure Type | Owner-occupied | Renter-occupied |
| Single Unit, Detached | 2,698 (86.3%) | 429 (13.7%) |
| Single Unit, Attached | 63 (52.1%) | 58 (47.9%) |
| 2 Unit Apartments | 0 (0.0%) | 83 (100.0%) |
| 3 or 4 Unit Apartments | 15 (3.5%) | 419 (96.5%) |
| 5 to 9 Unit Apartments | 0 (0.0%) | 143 (100.0%) |
| 10 or more Apartments | 0 (0.0%) | 54 (100.0%) |
| Mobile Home / Other | 62 (33.7%) | 122 (66.3%) |
| Total | 2,838 (68.4%) | 1,308 (31.6%) |
Housing Structures by Number of Rooms in Blackfoot
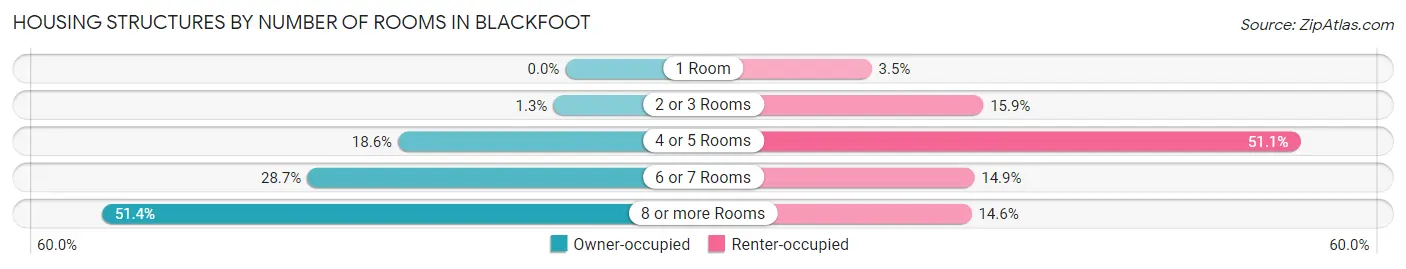
| Number of Rooms | Owner-occupied | Renter-occupied |
| 1 Room | 0 (0.0%) | 46 (3.5%) |
| 2 or 3 Rooms | 38 (1.3%) | 208 (15.9%) |
| 4 or 5 Rooms | 527 (18.6%) | 668 (51.1%) |
| 6 or 7 Rooms | 813 (28.6%) | 195 (14.9%) |
| 8 or more Rooms | 1,460 (51.4%) | 191 (14.6%) |
| Total | 2,838 (100.0%) | 1,308 (100.0%) |
Housing Structure by Heating Type in Blackfoot
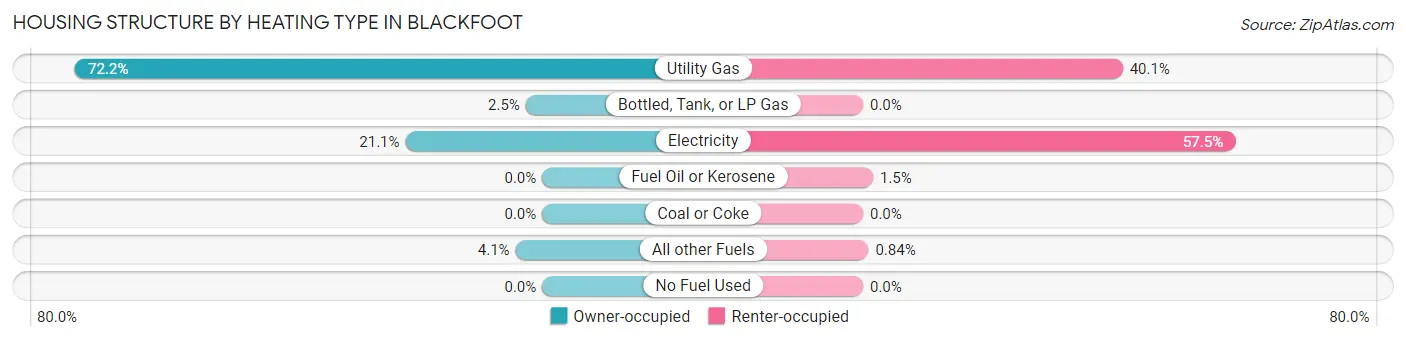
| Heating Type | Owner-occupied | Renter-occupied |
| Utility Gas | 2,049 (72.2%) | 525 (40.1%) |
| Bottled, Tank, or LP Gas | 72 (2.5%) | 0 (0.0%) |
| Electricity | 600 (21.1%) | 752 (57.5%) |
| Fuel Oil or Kerosene | 0 (0.0%) | 20 (1.5%) |
| Coal or Coke | 0 (0.0%) | 0 (0.0%) |
| All other Fuels | 117 (4.1%) | 11 (0.8%) |
| No Fuel Used | 0 (0.0%) | 0 (0.0%) |
| Total | 2,838 (100.0%) | 1,308 (100.0%) |
Household Vehicle Usage in Blackfoot
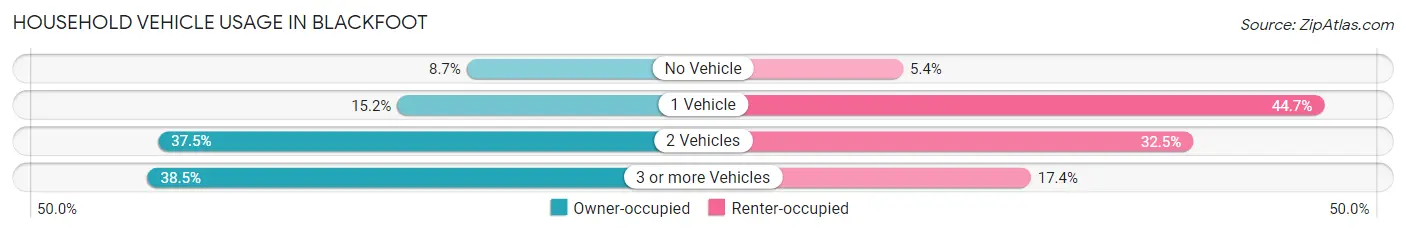
| Vehicles per Household | Owner-occupied | Renter-occupied |
| No Vehicle | 248 (8.7%) | 71 (5.4%) |
| 1 Vehicle | 432 (15.2%) | 585 (44.7%) |
| 2 Vehicles | 1,065 (37.5%) | 425 (32.5%) |
| 3 or more Vehicles | 1,093 (38.5%) | 227 (17.3%) |
| Total | 2,838 (100.0%) | 1,308 (100.0%) |
Real Estate & Mortgages in Blackfoot
Real Estate and Mortgage Overview in Blackfoot
| Characteristic | Without Mortgage | With Mortgage |
| Housing Units | 748 | 2,090 |
| Median Property Value | $182,700 | $223,100 |
| Median Household Income | $60,000 | $276 |
| Monthly Housing Costs | $437 | $0 |
| Real Estate Taxes | $1,545 | $118 |
Property Value by Mortgage Status in Blackfoot
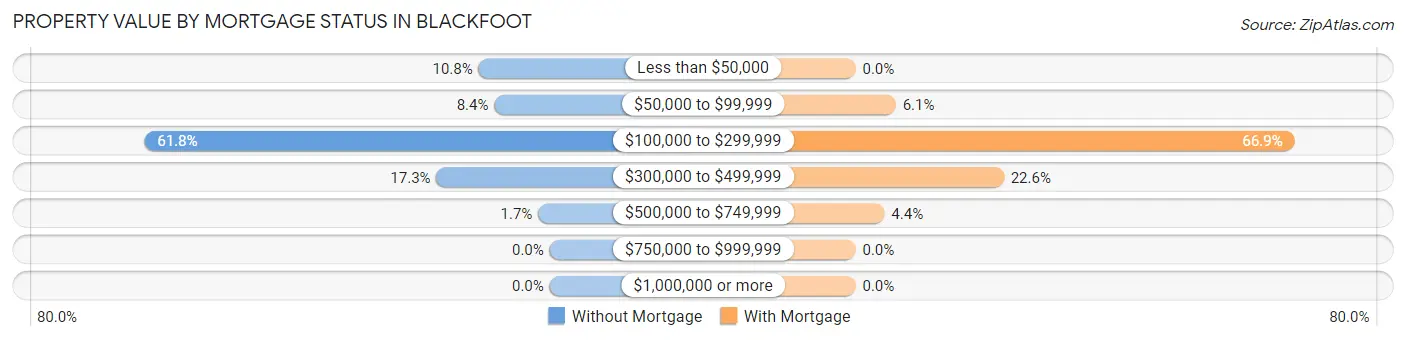
| Property Value | Without Mortgage | With Mortgage |
| Less than $50,000 | 81 (10.8%) | 0 (0.0%) |
| $50,000 to $99,999 | 63 (8.4%) | 128 (6.1%) |
| $100,000 to $299,999 | 462 (61.8%) | 1,398 (66.9%) |
| $300,000 to $499,999 | 129 (17.2%) | 472 (22.6%) |
| $500,000 to $749,999 | 13 (1.7%) | 92 (4.4%) |
| $750,000 to $999,999 | 0 (0.0%) | 0 (0.0%) |
| $1,000,000 or more | 0 (0.0%) | 0 (0.0%) |
| Total | 748 (100.0%) | 2,090 (100.0%) |
Household Income by Mortgage Status in Blackfoot
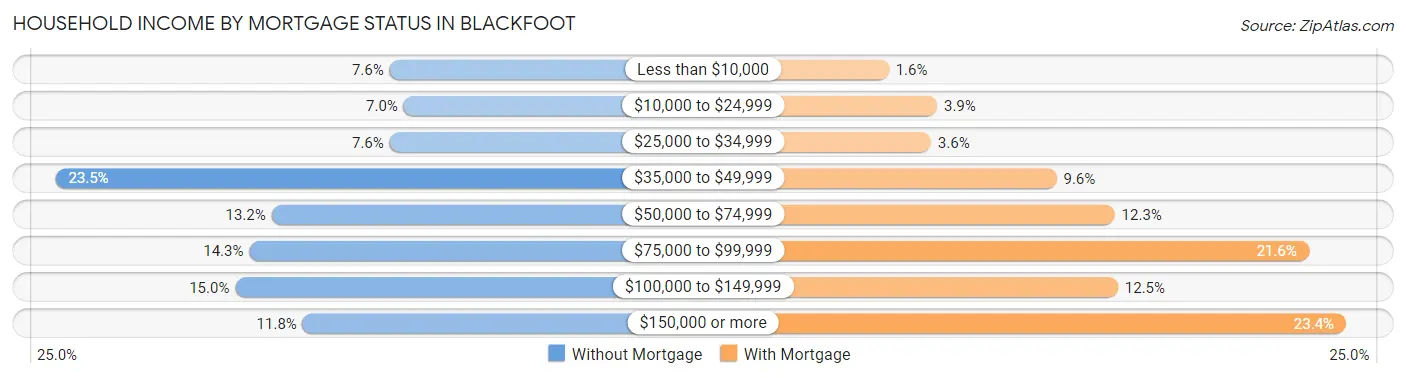
| Household Income | Without Mortgage | With Mortgage |
| Less than $10,000 | 57 (7.6%) | 33 (1.6%) |
| $10,000 to $24,999 | 52 (7.0%) | 81 (3.9%) |
| $25,000 to $34,999 | 57 (7.6%) | 75 (3.6%) |
| $35,000 to $49,999 | 176 (23.5%) | 200 (9.6%) |
| $50,000 to $74,999 | 99 (13.2%) | 258 (12.3%) |
| $75,000 to $99,999 | 107 (14.3%) | 451 (21.6%) |
| $100,000 to $149,999 | 112 (15.0%) | 261 (12.5%) |
| $150,000 or more | 88 (11.8%) | 488 (23.4%) |
| Total | 748 (100.0%) | 2,090 (100.0%) |
Property Value to Household Income Ratio in Blackfoot
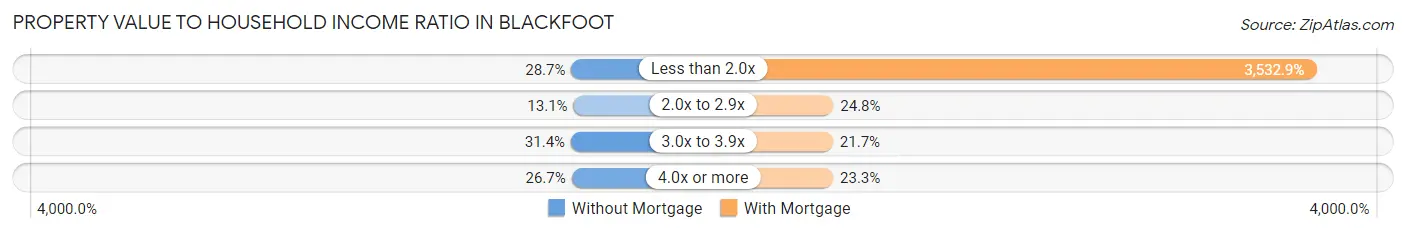
| Value-to-Income Ratio | Without Mortgage | With Mortgage |
| Less than 2.0x | 215 (28.7%) | 73,837 (3,532.9%) |
| 2.0x to 2.9x | 98 (13.1%) | 519 (24.8%) |
| 3.0x to 3.9x | 235 (31.4%) | 454 (21.7%) |
| 4.0x or more | 200 (26.7%) | 486 (23.3%) |
| Total | 748 (100.0%) | 2,090 (100.0%) |
Real Estate Taxes by Mortgage Status in Blackfoot
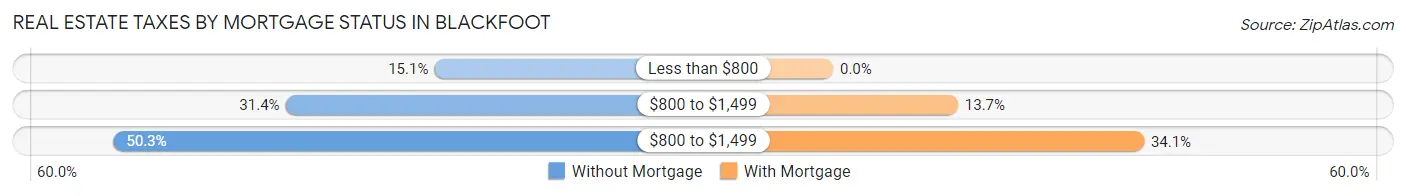
| Property Taxes | Without Mortgage | With Mortgage |
| Less than $800 | 113 (15.1%) | 0 (0.0%) |
| $800 to $1,499 | 235 (31.4%) | 286 (13.7%) |
| $800 to $1,499 | 376 (50.3%) | 712 (34.1%) |
| Total | 748 (100.0%) | 2,090 (100.0%) |
Health & Disability in Blackfoot
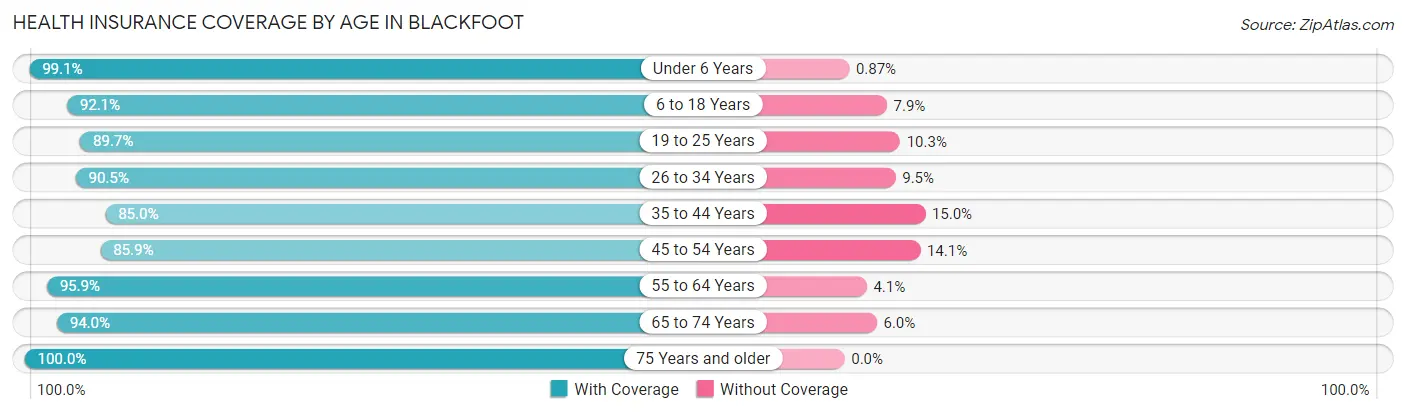
Health Insurance Coverage by Age in Blackfoot
| Age Bracket | With Coverage | Without Coverage |
| Under 6 Years | 1,253 (99.1%) | 11 (0.9%) |
| 6 to 18 Years | 2,310 (92.1%) | 198 (7.9%) |
| 19 to 25 Years | 850 (89.7%) | 98 (10.3%) |
| 26 to 34 Years | 1,294 (90.5%) | 136 (9.5%) |
| 35 to 44 Years | 1,152 (85.0%) | 204 (15.0%) |
| 45 to 54 Years | 901 (85.9%) | 148 (14.1%) |
| 55 to 64 Years | 1,577 (95.9%) | 68 (4.1%) |
| 65 to 74 Years | 970 (94.0%) | 62 (6.0%) |
| 75 Years and older | 678 (100.0%) | 0 (0.0%) |
| Total | 10,985 (92.2%) | 925 (7.8%) |
Health Insurance Coverage by Citizenship Status in Blackfoot
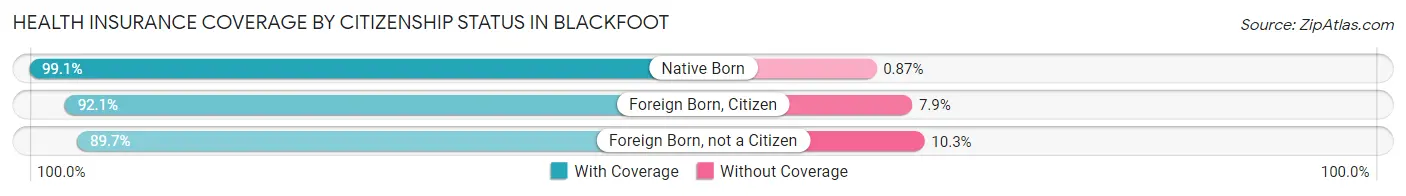
| Citizenship Status | With Coverage | Without Coverage |
| Native Born | 1,253 (99.1%) | 11 (0.9%) |
| Foreign Born, Citizen | 2,310 (92.1%) | 198 (7.9%) |
| Foreign Born, not a Citizen | 850 (89.7%) | 98 (10.3%) |
Health Insurance Coverage by Household Income in Blackfoot
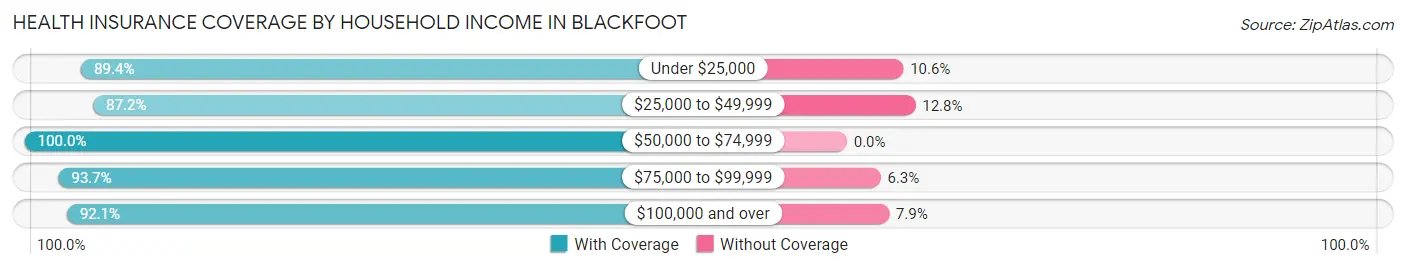
| Household Income | With Coverage | Without Coverage |
| Under $25,000 | 1,185 (89.4%) | 140 (10.6%) |
| $25,000 to $49,999 | 2,372 (87.2%) | 349 (12.8%) |
| $50,000 to $74,999 | 2,064 (100.0%) | 0 (0.0%) |
| $75,000 to $99,999 | 1,763 (93.7%) | 119 (6.3%) |
| $100,000 and over | 3,598 (92.1%) | 308 (7.9%) |
Public vs Private Health Insurance Coverage by Age in Blackfoot
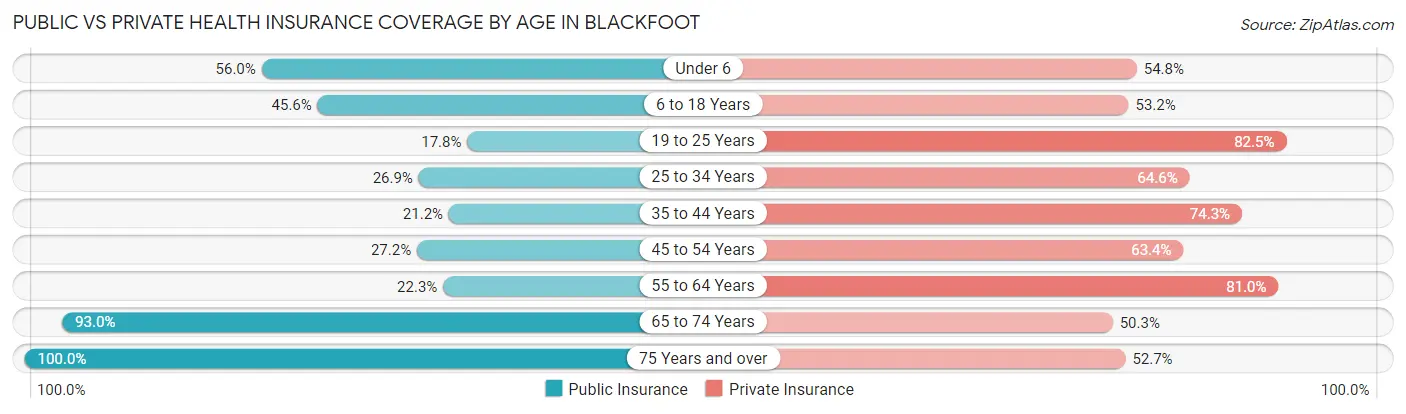
| Age Bracket | Public Insurance | Private Insurance |
| Under 6 | 708 (56.0%) | 692 (54.7%) |
| 6 to 18 Years | 1,144 (45.6%) | 1,335 (53.2%) |
| 19 to 25 Years | 169 (17.8%) | 782 (82.5%) |
| 25 to 34 Years | 384 (26.9%) | 923 (64.5%) |
| 35 to 44 Years | 288 (21.2%) | 1,007 (74.3%) |
| 45 to 54 Years | 285 (27.2%) | 665 (63.4%) |
| 55 to 64 Years | 367 (22.3%) | 1,333 (81.0%) |
| 65 to 74 Years | 960 (93.0%) | 519 (50.3%) |
| 75 Years and over | 678 (100.0%) | 357 (52.6%) |
| Total | 4,983 (41.8%) | 7,613 (63.9%) |
Disability Status by Sex by Age in Blackfoot
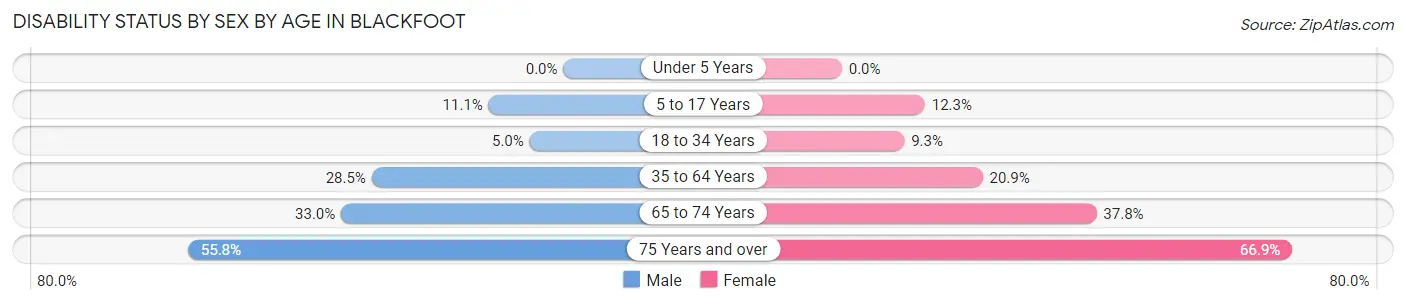
| Age Bracket | Male | Female |
| Under 5 Years | 0 (0.0%) | 0 (0.0%) |
| 5 to 17 Years | 146 (11.1%) | 158 (12.3%) |
| 18 to 34 Years | 55 (5.0%) | 135 (9.3%) |
| 35 to 64 Years | 623 (28.5%) | 389 (20.9%) |
| 65 to 74 Years | 166 (33.0%) | 200 (37.8%) |
| 75 Years and over | 97 (55.7%) | 337 (66.9%) |
Disability Class by Sex by Age in Blackfoot
Disability Class: Hearing Difficulty
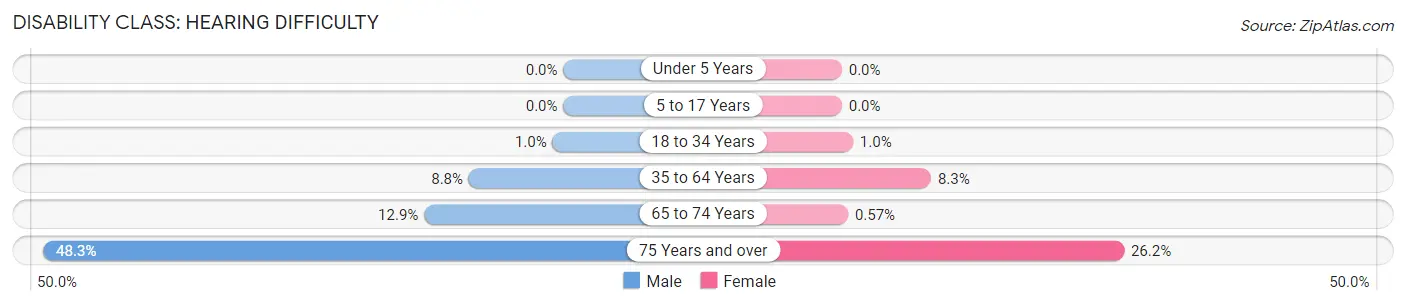
| Age Bracket | Male | Female |
| Under 5 Years | 0 (0.0%) | 0 (0.0%) |
| 5 to 17 Years | 0 (0.0%) | 0 (0.0%) |
| 18 to 34 Years | 11 (1.0%) | 15 (1.0%) |
| 35 to 64 Years | 192 (8.8%) | 154 (8.3%) |
| 65 to 74 Years | 65 (12.9%) | 3 (0.6%) |
| 75 Years and over | 84 (48.3%) | 132 (26.2%) |
Disability Class: Vision Difficulty
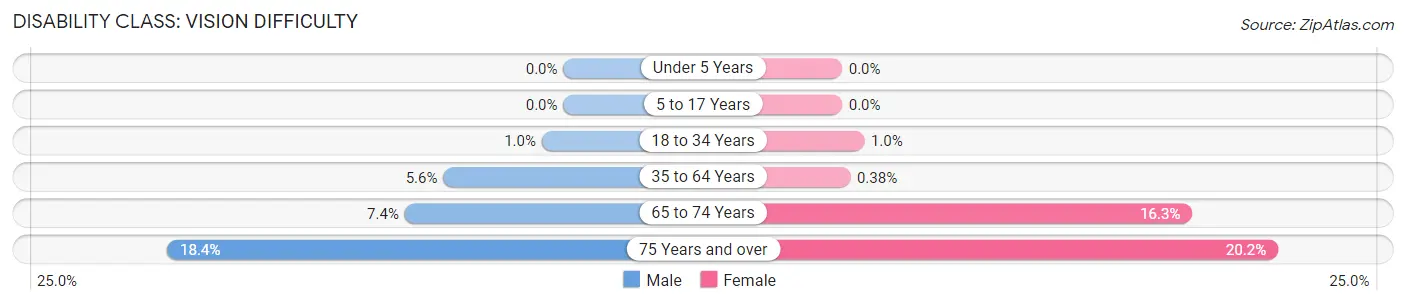
| Age Bracket | Male | Female |
| Under 5 Years | 0 (0.0%) | 0 (0.0%) |
| 5 to 17 Years | 0 (0.0%) | 0 (0.0%) |
| 18 to 34 Years | 11 (1.0%) | 15 (1.0%) |
| 35 to 64 Years | 122 (5.6%) | 7 (0.4%) |
| 65 to 74 Years | 37 (7.4%) | 86 (16.3%) |
| 75 Years and over | 32 (18.4%) | 102 (20.2%) |
Disability Class: Cognitive Difficulty

| Age Bracket | Male | Female |
| 5 to 17 Years | 146 (11.1%) | 158 (12.3%) |
| 18 to 34 Years | 55 (5.0%) | 87 (6.0%) |
| 35 to 64 Years | 195 (8.9%) | 217 (11.7%) |
| 65 to 74 Years | 49 (9.7%) | 54 (10.2%) |
| 75 Years and over | 25 (14.4%) | 133 (26.4%) |
Disability Class: Ambulatory Difficulty
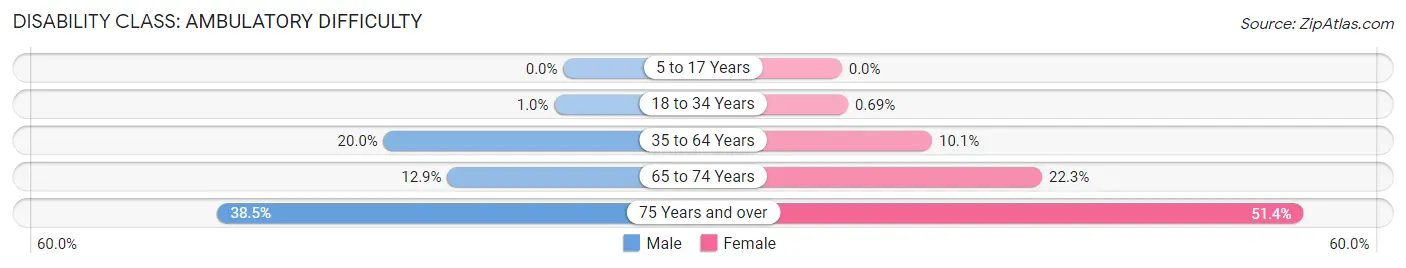
| Age Bracket | Male | Female |
| 5 to 17 Years | 0 (0.0%) | 0 (0.0%) |
| 18 to 34 Years | 11 (1.0%) | 10 (0.7%) |
| 35 to 64 Years | 438 (20.0%) | 187 (10.1%) |
| 65 to 74 Years | 65 (12.9%) | 118 (22.3%) |
| 75 Years and over | 67 (38.5%) | 259 (51.4%) |
Disability Class: Self-Care Difficulty
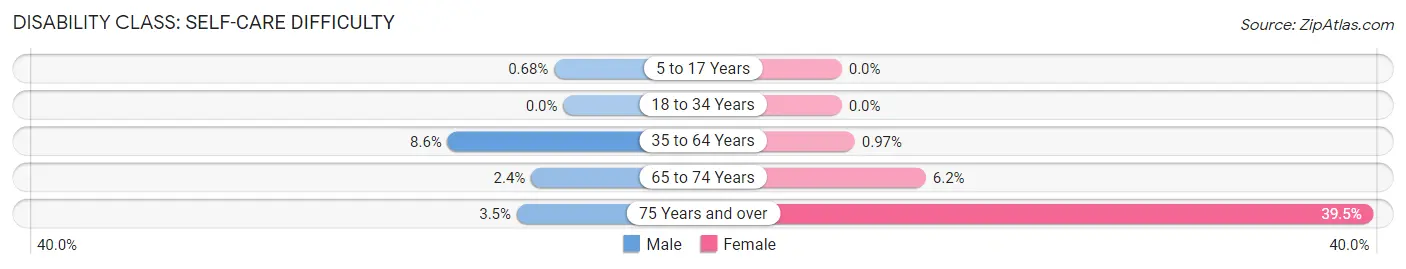
| Age Bracket | Male | Female |
| 5 to 17 Years | 9 (0.7%) | 0 (0.0%) |
| 18 to 34 Years | 0 (0.0%) | 0 (0.0%) |
| 35 to 64 Years | 188 (8.6%) | 18 (1.0%) |
| 65 to 74 Years | 12 (2.4%) | 33 (6.2%) |
| 75 Years and over | 6 (3.5%) | 199 (39.5%) |
Technology Access in Blackfoot
Computing Device Access in Blackfoot
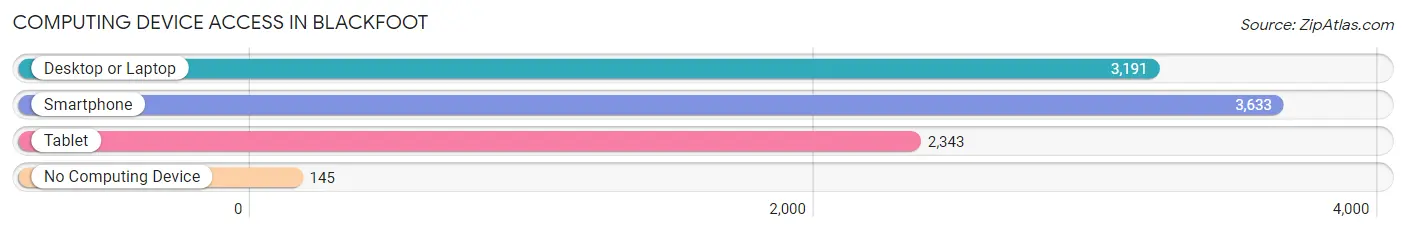
| Device Type | # Households | % Households |
| Desktop or Laptop | 3,191 | 77.0% |
| Smartphone | 3,633 | 87.6% |
| Tablet | 2,343 | 56.5% |
| No Computing Device | 145 | 3.5% |
| Total | 4,146 | 100.0% |
Internet Access in Blackfoot
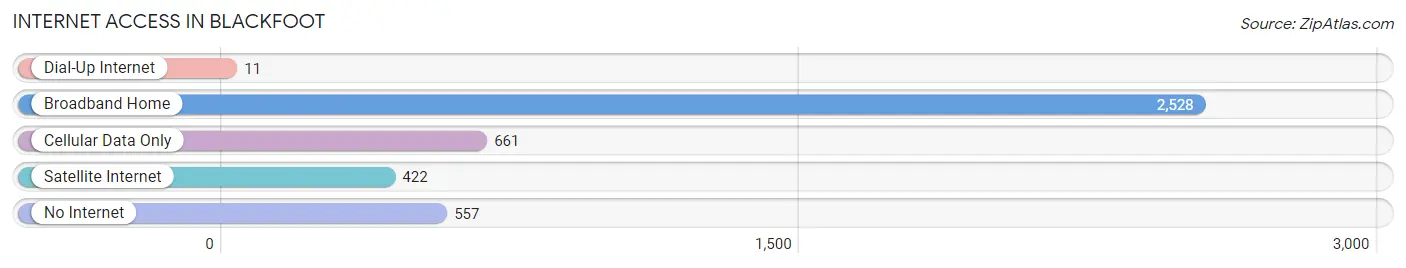
| Internet Type | # Households | % Households |
| Dial-Up Internet | 11 | 0.3% |
| Broadband Home | 2,528 | 61.0% |
| Cellular Data Only | 661 | 15.9% |
| Satellite Internet | 422 | 10.2% |
| No Internet | 557 | 13.4% |
| Total | 4,146 | 100.0% |
Blackfoot Summary
Blackfoot, Idaho is a small city located in Bingham County in the southeastern part of the state. It is the county seat and the largest city in the county. The city is located on the Snake River and is home to a population of approximately 11,000 people.
History
Blackfoot was founded in 1878 by a group of settlers from the Church of Jesus Christ of Latter-day Saints. The city was named after the Blackfoot Indians, who had lived in the area for centuries. The city was incorporated in 1885 and has since grown to become the largest city in Bingham County.
Geography
Blackfoot is located in the southeastern part of Idaho, in the Snake River Plain. The city is situated at an elevation of 4,890 feet above sea level. The city is surrounded by agricultural land and is located near the Snake River. The city is also close to the Grand Teton National Park and Yellowstone National Park.
Economy
Blackfoot’s economy is largely based on agriculture. The city is home to several large farms and ranches, as well as a number of smaller farms. The city is also home to several manufacturing companies, including a potato processing plant and a cheese factory. The city is also home to a number of retail stores, restaurants, and other businesses.
Demographics
As of the 2010 census, the population of Blackfoot was 11,899. The racial makeup of the city was 90.2% White, 0.3% African American, 0.7% Native American, 0.7% Asian, 0.1% Pacific Islander, 5.3% from other races, and 2.1% from two or more races. Hispanic or Latino of any race were 8.3% of the population.
The median income for a household in Blackfoot was $37,945, and the median income for a family was $45,945. The per capita income for the city was $18,945. About 11.2% of families and 14.2% of the population were below the poverty line, including 18.2% of those under age 18 and 8.2% of those age 65 or over.
Blackfoot is a small city with a rich history and a diverse population. The city is home to a number of businesses and industries, and is a great place to live and work. The city is also close to some of the most beautiful natural attractions in the country, making it a great place to visit and explore.
Common Questions
What is Per Capita Income in Blackfoot?
Per Capita income in Blackfoot is $25,429.
What is the Median Family Income in Blackfoot?
Median Family Income in Blackfoot is $73,824.
What is the Median Household income in Blackfoot?
Median Household Income in Blackfoot is $57,951.
What is Income or Wage Gap in Blackfoot?
Income or Wage Gap in Blackfoot is 39.4%.
Women in Blackfoot earn 60.6 cents for every dollar earned by a man.
What is Inequality or Gini Index in Blackfoot?
Inequality or Gini Index in Blackfoot is 0.40.
What is the Total Population of Blackfoot?
Total Population of Blackfoot is 12,349.
What is the Total Male Population of Blackfoot?
Total Male Population of Blackfoot is 5,930.
What is the Total Female Population of Blackfoot?
Total Female Population of Blackfoot is 6,419.
What is the Ratio of Males per 100 Females in Blackfoot?
There are 92.38 Males per 100 Females in Blackfoot.
What is the Ratio of Females per 100 Males in Blackfoot?
There are 108.25 Females per 100 Males in Blackfoot.
What is the Median Population Age in Blackfoot?
Median Population Age in Blackfoot is 34.4 Years.
What is the Average Family Size in Blackfoot
Average Family Size in Blackfoot is 3.5 People.
What is the Average Household Size in Blackfoot
Average Household Size in Blackfoot is 2.9 People.
How Large is the Labor Force in Blackfoot?
There are 5,486 People in the Labor Forcein in Blackfoot.
What is the Percentage of People in the Labor Force in Blackfoot?
59.6% of People are in the Labor Force in Blackfoot.
What is the Unemployment Rate in Blackfoot?
Unemployment Rate in Blackfoot is 8.9%.