Middleton, ID Map & Demographics
Middleton Map
Middleton Overview
$28,518
PER CAPITA INCOME
$86,739
AVG FAMILY INCOME
$68,947
AVG HOUSEHOLD INCOME
43.0%
WAGE / INCOME GAP [ % ]
57.0¢/ $1
WAGE / INCOME GAP [ $ ]
0.36
INEQUALITY / GINI INDEX
9,614
TOTAL POPULATION
4,945
MALE POPULATION
4,669
FEMALE POPULATION
105.91
MALES / 100 FEMALES
94.42
FEMALES / 100 MALES
34.9
MEDIAN AGE
3.5
AVG FAMILY SIZE
2.9
AVG HOUSEHOLD SIZE
4,567
LABOR FORCE [ PEOPLE ]
63.7%
PERCENT IN LABOR FORCE
2.5%
UNEMPLOYMENT RATE
Middleton Zip Codes
Middleton Area Codes
Income in Middleton
Income Overview in Middleton
Per Capita Income in Middleton is $28,518, while median incomes of families and households are $86,739 and $68,947 respectively.
| Characteristic | Number | Measure |
| Per Capita Income | 9,614 | $28,518 |
| Median Family Income | 2,410 | $86,739 |
| Mean Family Income | 2,410 | $93,937 |
| Median Household Income | 3,310 | $68,947 |
| Mean Household Income | 3,310 | $82,564 |
| Income Deficit | 2,410 | $0 |
| Wage / Income Gap (%) | 9,614 | 43.04% |
| Wage / Income Gap ($) | 9,614 | 56.96¢ per $1 |
| Gini / Inequality Index | 9,614 | 0.36 |
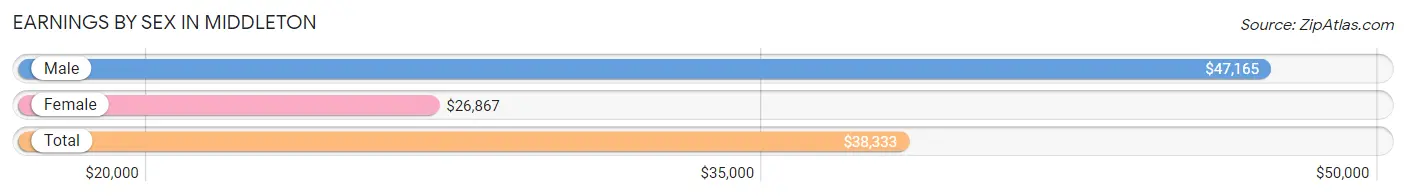
Earnings by Sex in Middleton
Average Earnings in Middleton are $38,333, $47,165 for men and $26,867 for women, a difference of 43.0%.
| Sex | Number | Average Earnings |
| Male | 2,546 (53.3%) | $47,165 |
| Female | 2,228 (46.7%) | $26,867 |
| Total | 4,774 (100.0%) | $38,333 |
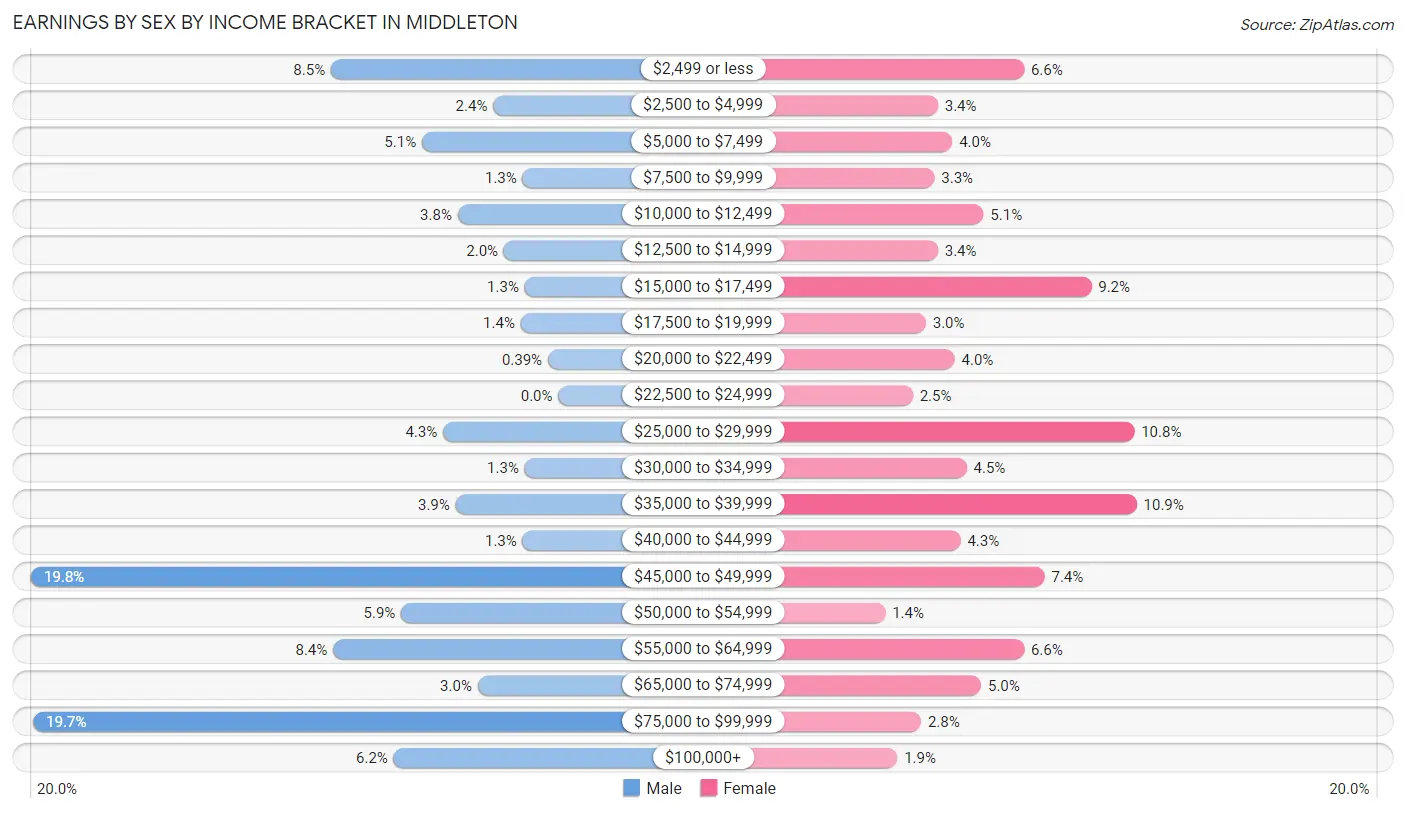
Earnings by Sex by Income Bracket in Middleton
The most common earnings brackets in Middleton are $45,000 to $49,999 for men (503 | 19.8%) and $35,000 to $39,999 for women (242 | 10.9%).
| Income | Male | Female |
| $2,499 or less | 217 (8.5%) | 148 (6.6%) |
| $2,500 to $4,999 | 62 (2.4%) | 76 (3.4%) |
| $5,000 to $7,499 | 130 (5.1%) | 88 (4.0%) |
| $7,500 to $9,999 | 34 (1.3%) | 73 (3.3%) |
| $10,000 to $12,499 | 96 (3.8%) | 114 (5.1%) |
| $12,500 to $14,999 | 52 (2.0%) | 76 (3.4%) |
| $15,000 to $17,499 | 32 (1.3%) | 204 (9.2%) |
| $17,500 to $19,999 | 36 (1.4%) | 66 (3.0%) |
| $20,000 to $22,499 | 10 (0.4%) | 90 (4.0%) |
| $22,500 to $24,999 | 0 (0.0%) | 55 (2.5%) |
| $25,000 to $29,999 | 110 (4.3%) | 240 (10.8%) |
| $30,000 to $34,999 | 32 (1.3%) | 100 (4.5%) |
| $35,000 to $39,999 | 98 (3.8%) | 242 (10.9%) |
| $40,000 to $44,999 | 34 (1.3%) | 95 (4.3%) |
| $45,000 to $49,999 | 503 (19.8%) | 165 (7.4%) |
| $50,000 to $54,999 | 150 (5.9%) | 32 (1.4%) |
| $55,000 to $64,999 | 215 (8.4%) | 148 (6.6%) |
| $65,000 to $74,999 | 77 (3.0%) | 112 (5.0%) |
| $75,000 to $99,999 | 501 (19.7%) | 62 (2.8%) |
| $100,000+ | 157 (6.2%) | 42 (1.9%) |
| Total | 2,546 (100.0%) | 2,228 (100.0%) |
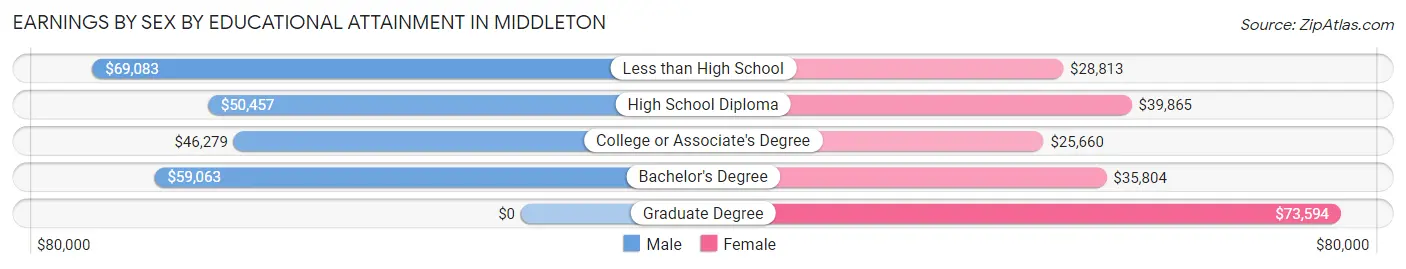
Earnings by Sex by Educational Attainment in Middleton
Average earnings in Middleton are $48,823 for men and $35,955 for women, a difference of 26.4%. Men with an educational attainment of less than high school enjoy the highest average annual earnings of $69,083, while those with college or associate's degree education earn the least with $46,279. Women with an educational attainment of graduate degree earn the most with the average annual earnings of $73,594, while those with college or associate's degree education have the smallest earnings of $25,660.
| Educational Attainment | Male Income | Female Income |
| Less than High School | $69,083 | $28,813 |
| High School Diploma | $50,457 | $39,865 |
| College or Associate's Degree | $46,279 | $25,660 |
| Bachelor's Degree | $59,063 | $35,804 |
| Graduate Degree | - | - |
| Total | $48,823 | $35,955 |
Family Income in Middleton
Family Income Brackets in Middleton
According to the Middleton family income data, there are 612 families falling into the $100,000 to $149,999 income range, which is the most common income bracket and makes up 25.4% of all families. Conversely, the $10,000 to $14,999 income bracket is the least frequent group with only 19 families (0.8%) belonging to this category.
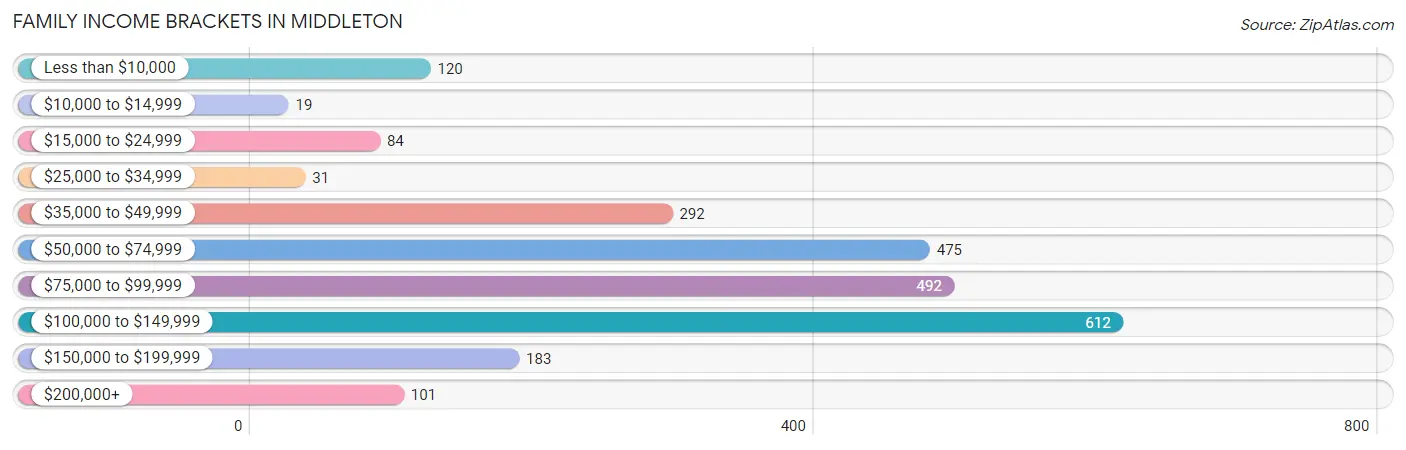
| Income Bracket | # Families | % Families |
| Less than $10,000 | 120 | 5.0% |
| $10,000 to $14,999 | 19 | 0.8% |
| $15,000 to $24,999 | 84 | 3.5% |
| $25,000 to $34,999 | 31 | 1.3% |
| $35,000 to $49,999 | 292 | 12.1% |
| $50,000 to $74,999 | 475 | 19.7% |
| $75,000 to $99,999 | 492 | 20.4% |
| $100,000 to $149,999 | 612 | 25.4% |
| $150,000 to $199,999 | 183 | 7.6% |
| $200,000+ | 101 | 4.2% |
Family Income by Famaliy Size in Middleton
7+ person families (189 | 7.8%) account for the highest median family income in Middleton with $144,100 per family, while 2-person families (952 | 39.5%) have the highest median income of $37,778 per family member.
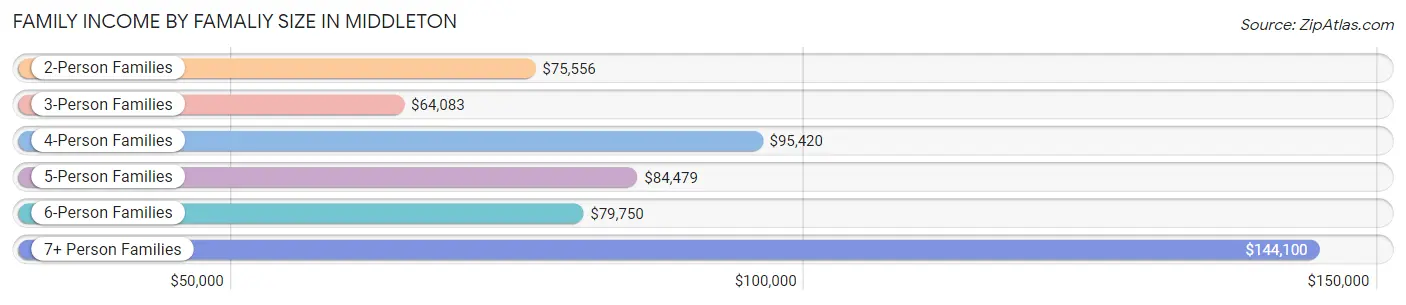
| Income Bracket | # Families | Median Income |
| 2-Person Families | 952 (39.5%) | $75,556 |
| 3-Person Families | 380 (15.8%) | $64,083 |
| 4-Person Families | 449 (18.6%) | $95,420 |
| 5-Person Families | 330 (13.7%) | $84,479 |
| 6-Person Families | 110 (4.6%) | $79,750 |
| 7+ Person Families | 189 (7.8%) | $144,100 |
| Total | 2,410 (100.0%) | $86,739 |
Family Income by Number of Earners in Middleton
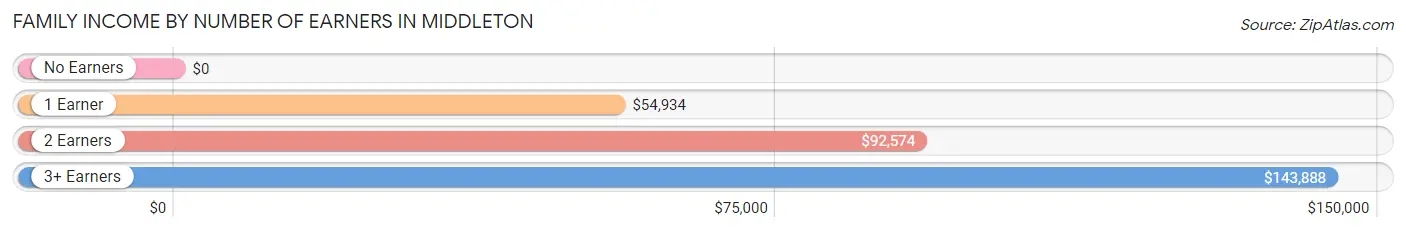
| Number of Earners | # Families | Median Income |
| No Earners | 305 (12.7%) | $0 |
| 1 Earner | 853 (35.4%) | $54,934 |
| 2 Earners | 863 (35.8%) | $92,574 |
| 3+ Earners | 389 (16.1%) | $143,888 |
| Total | 2,410 (100.0%) | $86,739 |
Household Income in Middleton
Household Income Brackets in Middleton
With 705 households falling in the category, the $100,000 to $149,999 income range is the most frequent in Middleton, accounting for 21.3% of all households. In contrast, only 36 households (1.1%) fall into the $10,000 to $14,999 income bracket, making it the least populous group.
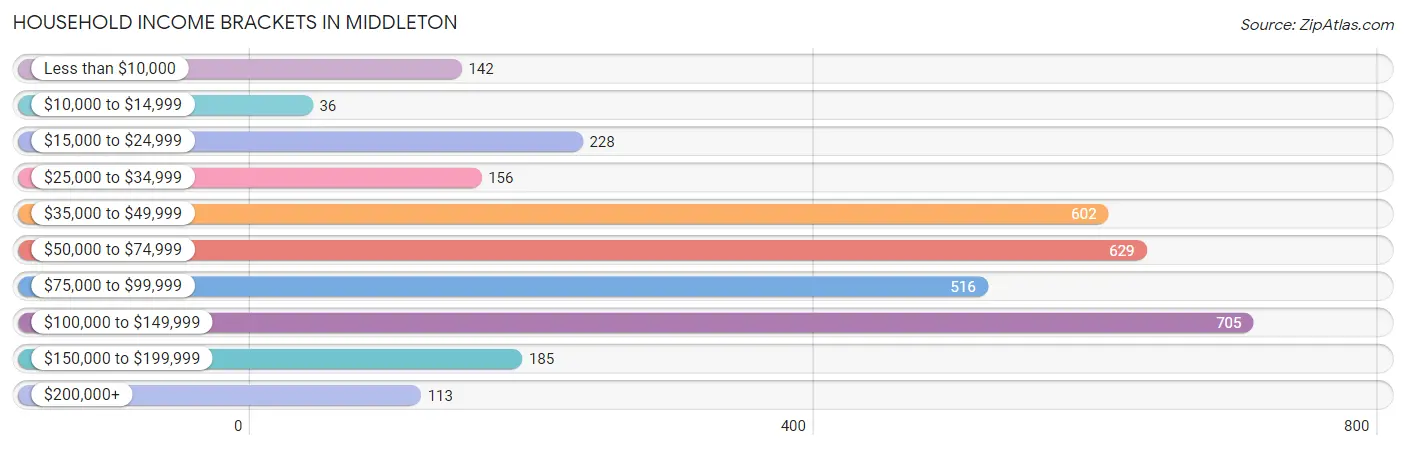
| Income Bracket | # Households | % Households |
| Less than $10,000 | 142 | 4.3% |
| $10,000 to $14,999 | 36 | 1.1% |
| $15,000 to $24,999 | 228 | 6.9% |
| $25,000 to $34,999 | 156 | 4.7% |
| $35,000 to $49,999 | 602 | 18.2% |
| $50,000 to $74,999 | 629 | 19.0% |
| $75,000 to $99,999 | 516 | 15.6% |
| $100,000 to $149,999 | 705 | 21.3% |
| $150,000 to $199,999 | 185 | 5.6% |
| $200,000+ | 113 | 3.4% |
Household Income by Householder Age in Middleton
The median household income in Middleton is $68,947, with the highest median household income of $143,189 found in the 15 to 24 years age bracket for the primary householder. A total of 171 households (5.2%) fall into this category. Meanwhile, the 65+ years age bracket for the primary householder has the lowest median household income of $61,228, with 939 households (28.4%) in this group.
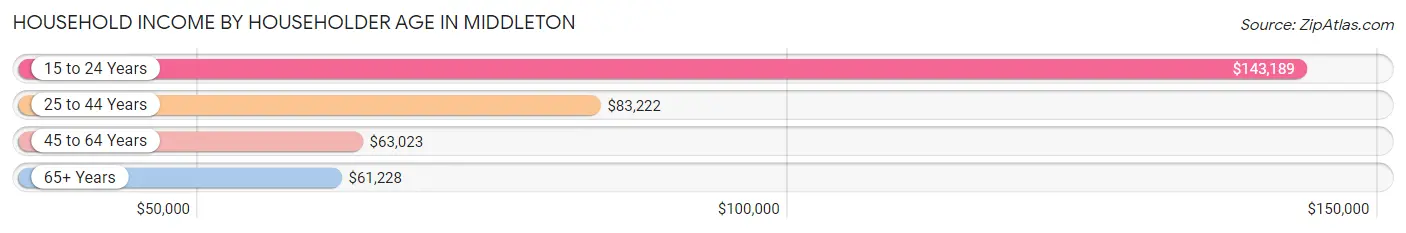
| Income Bracket | # Households | Median Income |
| 15 to 24 Years | 171 (5.2%) | $143,189 |
| 25 to 44 Years | 1,138 (34.4%) | $83,222 |
| 45 to 64 Years | 1,062 (32.1%) | $63,023 |
| 65+ Years | 939 (28.4%) | $61,228 |
| Total | 3,310 (100.0%) | $68,947 |
Poverty in Middleton
Income Below Poverty by Sex and Age in Middleton
With 10.9% poverty level for males and 8.6% for females among the residents of Middleton, under 5 year old males and 15 year old females are the most vulnerable to poverty, with 76 males (17.6%) and 27 females (61.4%) in their respective age groups living below the poverty level.
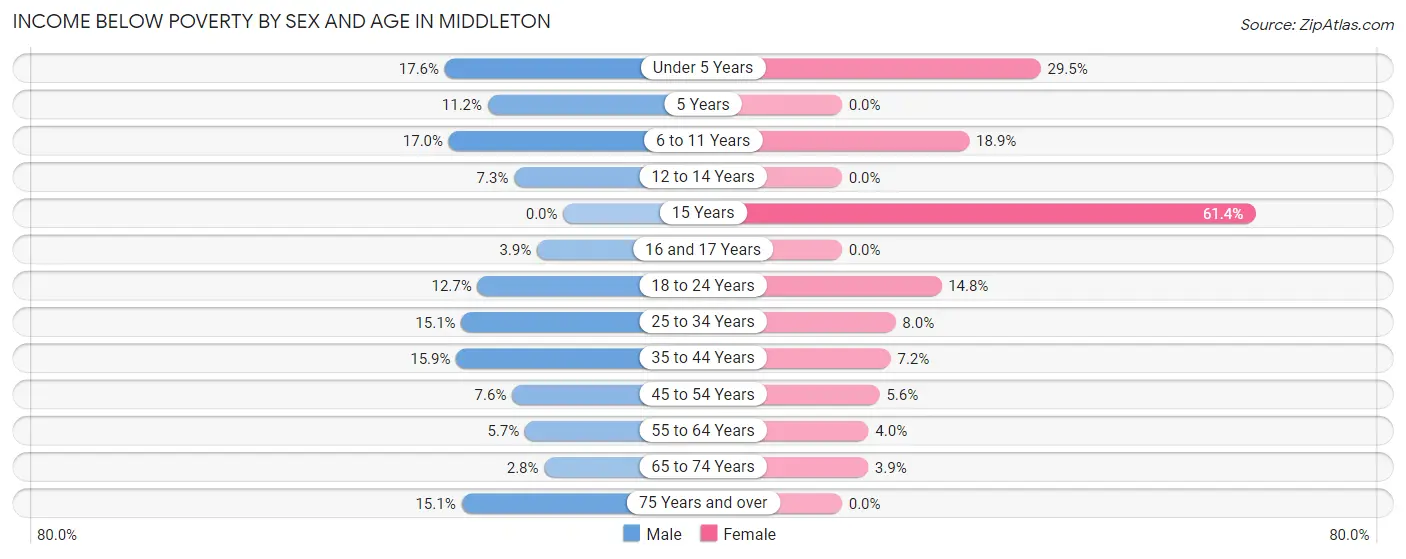
| Age Bracket | Male | Female |
| Under 5 Years | 76 (17.6%) | 85 (29.5%) |
| 5 Years | 12 (11.2%) | 0 (0.0%) |
| 6 to 11 Years | 86 (17.0%) | 52 (18.9%) |
| 12 to 14 Years | 24 (7.3%) | 0 (0.0%) |
| 15 Years | 0 (0.0%) | 27 (61.4%) |
| 16 and 17 Years | 11 (3.9%) | 0 (0.0%) |
| 18 to 24 Years | 59 (12.7%) | 80 (14.8%) |
| 25 to 34 Years | 66 (15.1%) | 37 (8.0%) |
| 35 to 44 Years | 104 (15.9%) | 66 (7.2%) |
| 45 to 54 Years | 35 (7.6%) | 20 (5.6%) |
| 55 to 64 Years | 30 (5.7%) | 18 (4.0%) |
| 65 to 74 Years | 16 (2.8%) | 17 (3.9%) |
| 75 Years and over | 18 (15.1%) | 0 (0.0%) |
| Total | 537 (10.9%) | 402 (8.6%) |
Income Above Poverty by Sex and Age in Middleton
According to the poverty statistics in Middleton, males aged 15 years and females aged 5 years are the age groups that are most secure financially, with 100.0% of males and 100.0% of females in these age groups living above the poverty line.
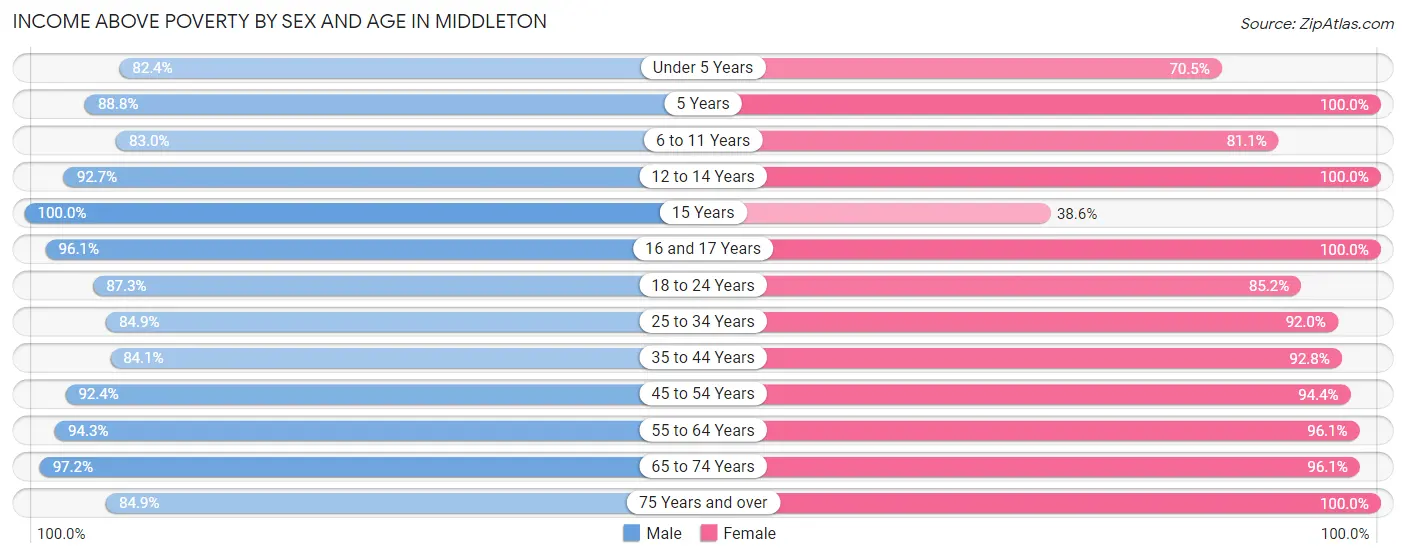
| Age Bracket | Male | Female |
| Under 5 Years | 356 (82.4%) | 203 (70.5%) |
| 5 Years | 95 (88.8%) | 25 (100.0%) |
| 6 to 11 Years | 420 (83.0%) | 223 (81.1%) |
| 12 to 14 Years | 305 (92.7%) | 381 (100.0%) |
| 15 Years | 58 (100.0%) | 17 (38.6%) |
| 16 and 17 Years | 270 (96.1%) | 181 (100.0%) |
| 18 to 24 Years | 404 (87.3%) | 462 (85.2%) |
| 25 to 34 Years | 370 (84.9%) | 428 (92.0%) |
| 35 to 44 Years | 550 (84.1%) | 846 (92.8%) |
| 45 to 54 Years | 426 (92.4%) | 337 (94.4%) |
| 55 to 64 Years | 498 (94.3%) | 438 (96.1%) |
| 65 to 74 Years | 552 (97.2%) | 421 (96.1%) |
| 75 Years and over | 101 (84.9%) | 305 (100.0%) |
| Total | 4,405 (89.1%) | 4,267 (91.4%) |
Income Below Poverty Among Married-Couple Families in Middleton
The poverty statistics for married-couple families in Middleton show that 7.2% or 125 of the total 1,744 families live below the poverty line. Families with 3 or 4 children have the highest poverty rate of 22.0%, comprising of 66 families. On the other hand, families with 5 or more children have the lowest poverty rate of 0.0%, which includes 0 families.
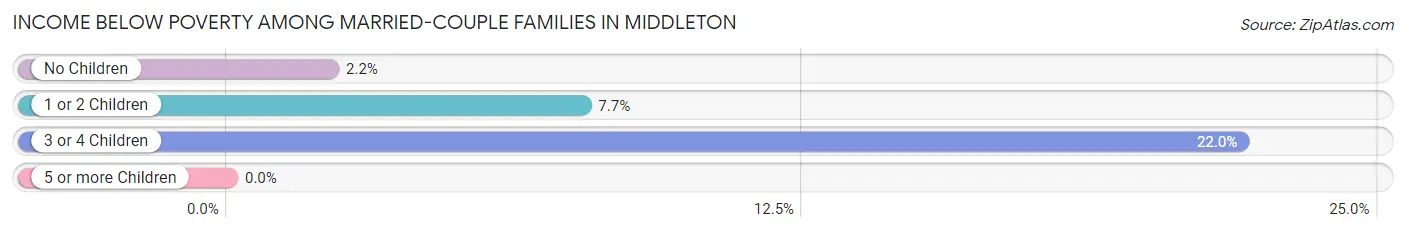
| Children | Above Poverty | Below Poverty |
| No Children | 843 (97.8%) | 19 (2.2%) |
| 1 or 2 Children | 480 (92.3%) | 40 (7.7%) |
| 3 or 4 Children | 234 (78.0%) | 66 (22.0%) |
| 5 or more Children | 62 (100.0%) | 0 (0.0%) |
| Total | 1,619 (92.8%) | 125 (7.2%) |
Income Below Poverty Among Single-Parent Households in Middleton
According to the poverty data in Middleton, 15.7% or 62 single-father households and 4.1% or 11 single-mother households are living below the poverty line. Among single-father households, those with no children have the highest poverty rate, with 19 households (32.2%) experiencing poverty. Likewise, among single-mother households, those with 3 or 4 children have the highest poverty rate, with 11 households (35.5%) falling below the poverty line.
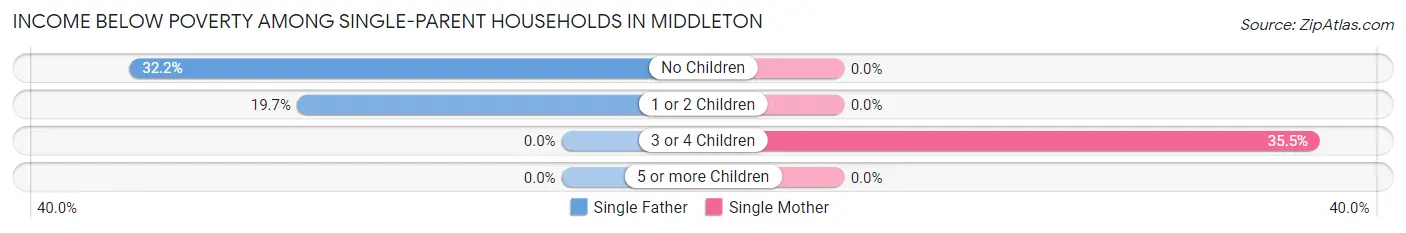
| Children | Single Father | Single Mother |
| No Children | 19 (32.2%) | 0 (0.0%) |
| 1 or 2 Children | 43 (19.7%) | 0 (0.0%) |
| 3 or 4 Children | 0 (0.0%) | 11 (35.5%) |
| 5 or more Children | 0 (0.0%) | 0 (0.0%) |
| Total | 62 (15.7%) | 11 (4.1%) |
Income Below Poverty Among Married-Couple vs Single-Parent Households in Middleton
The poverty data for Middleton shows that 125 of the married-couple family households (7.2%) and 73 of the single-parent households (11.0%) are living below the poverty level. Within the married-couple family households, those with 3 or 4 children have the highest poverty rate, with 66 households (22.0%) falling below the poverty line. Among the single-parent households, those with no children have the highest poverty rate, with 19 household (12.7%) living below poverty.
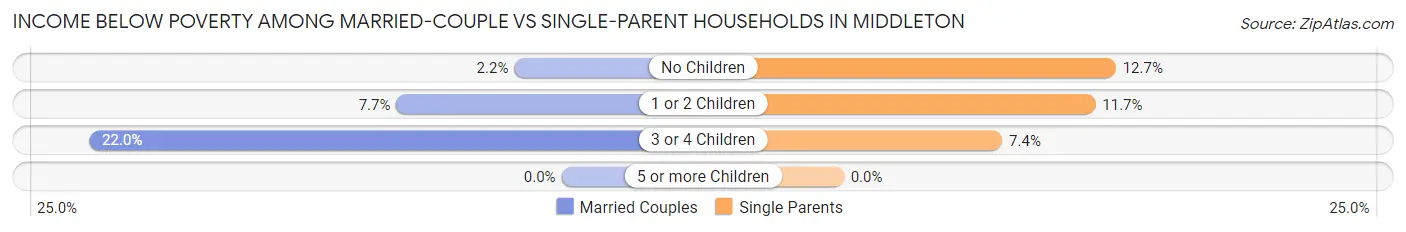
| Children | Married-Couple Families | Single-Parent Households |
| No Children | 19 (2.2%) | 19 (12.7%) |
| 1 or 2 Children | 40 (7.7%) | 43 (11.7%) |
| 3 or 4 Children | 66 (22.0%) | 11 (7.4%) |
| 5 or more Children | 0 (0.0%) | 0 (0.0%) |
| Total | 125 (7.2%) | 73 (11.0%) |
Race in Middleton
The most populous races in Middleton are White / Caucasian (7,823 | 81.4%), Hispanic or Latino (1,147 | 11.9%), and Some other Race (887 | 9.2%).
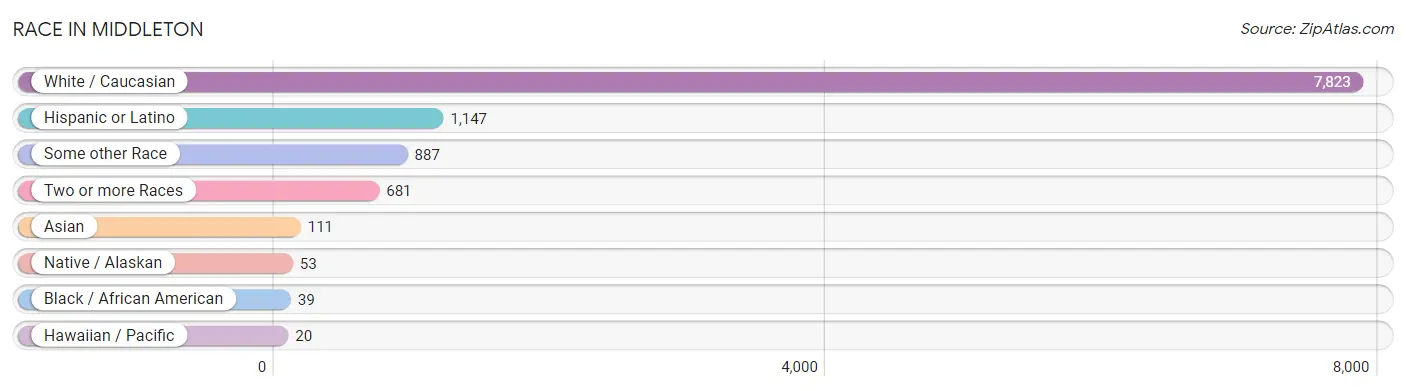
| Race | # Population | % Population |
| Asian | 111 | 1.1% |
| Black / African American | 39 | 0.4% |
| Hawaiian / Pacific | 20 | 0.2% |
| Hispanic or Latino | 1,147 | 11.9% |
| Native / Alaskan | 53 | 0.5% |
| White / Caucasian | 7,823 | 81.4% |
| Two or more Races | 681 | 7.1% |
| Some other Race | 887 | 9.2% |
| Total | 9,614 | 100.0% |
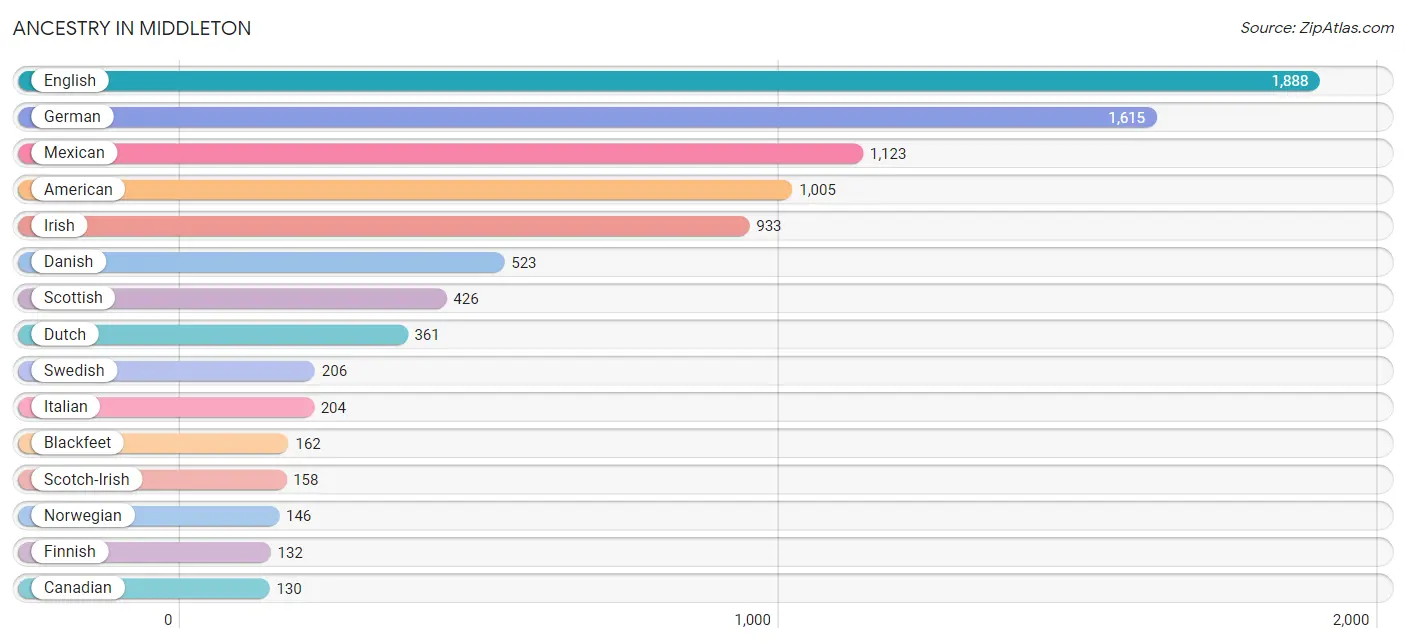
Ancestry in Middleton
The most populous ancestries reported in Middleton are English (1,888 | 19.6%), German (1,615 | 16.8%), Mexican (1,123 | 11.7%), American (1,005 | 10.4%), and Irish (933 | 9.7%), together accounting for 68.3% of all Middleton residents.
| Ancestry | # Population | % Population |
| American | 1,005 | 10.4% |
| Apache | 76 | 0.8% |
| Austrian | 27 | 0.3% |
| Basque | 19 | 0.2% |
| Blackfeet | 162 | 1.7% |
| Brazilian | 9 | 0.1% |
| British | 28 | 0.3% |
| Canadian | 130 | 1.3% |
| Cherokee | 24 | 0.3% |
| Chickasaw | 22 | 0.2% |
| Choctaw | 24 | 0.3% |
| Croatian | 7 | 0.1% |
| Czech | 51 | 0.5% |
| Czechoslovakian | 30 | 0.3% |
| Danish | 523 | 5.4% |
| Dutch | 361 | 3.7% |
| Eastern European | 28 | 0.3% |
| English | 1,888 | 19.6% |
| European | 52 | 0.5% |
| Finnish | 132 | 1.4% |
| French | 110 | 1.1% |
| German | 1,615 | 16.8% |
| Irish | 933 | 9.7% |
| Italian | 204 | 2.1% |
| Korean | 55 | 0.6% |
| Mexican | 1,123 | 11.7% |
| Native Hawaiian | 20 | 0.2% |
| New Zealander | 31 | 0.3% |
| Northern European | 10 | 0.1% |
| Norwegian | 146 | 1.5% |
| Polish | 37 | 0.4% |
| Portuguese | 11 | 0.1% |
| Russian | 57 | 0.6% |
| Scandinavian | 30 | 0.3% |
| Scotch-Irish | 158 | 1.6% |
| Scottish | 426 | 4.4% |
| Spaniard | 12 | 0.1% |
| Swedish | 206 | 2.1% |
| Swiss | 28 | 0.3% |
| Thai | 65 | 0.7% |
| Ukrainian | 10 | 0.1% |
| Welsh | 32 | 0.3% |
| Yugoslavian | 31 | 0.3% | View All 43 Rows |
Immigrants in Middleton
The most numerous immigrant groups reported in Middleton came from Latin America (81 | 0.8%), Central America (72 | 0.7%), Mexico (72 | 0.7%), Asia (45 | 0.5%), and Philippines (45 | 0.5%), together accounting for 3.3% of all Middleton residents.
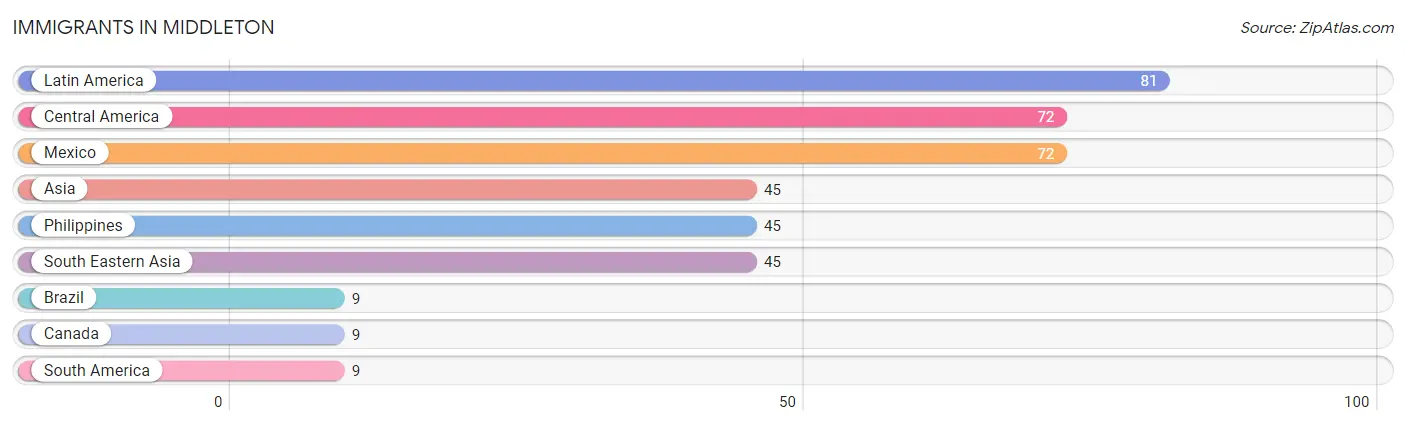
| Immigration Origin | # Population | % Population |
| Asia | 45 | 0.5% |
| Brazil | 9 | 0.1% |
| Canada | 9 | 0.1% |
| Central America | 72 | 0.7% |
| Latin America | 81 | 0.8% |
| Mexico | 72 | 0.7% |
| Philippines | 45 | 0.5% |
| South America | 9 | 0.1% |
| South Eastern Asia | 45 | 0.5% | View All 9 Rows |
Sex and Age in Middleton
Sex and Age in Middleton
The most populous age groups in Middleton are 15 to 19 Years (677 | 13.7%) for men and 40 to 44 Years (538 | 11.5%) for women.
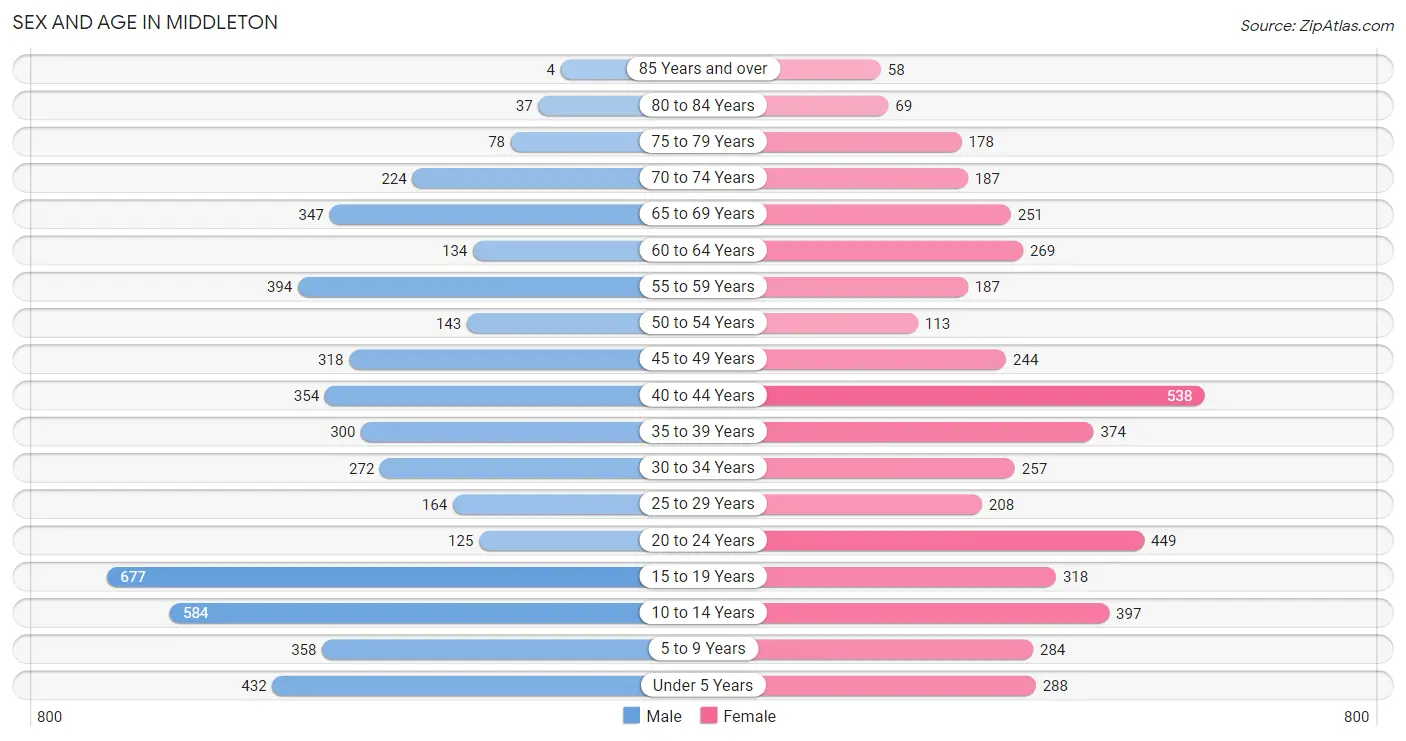
| Age Bracket | Male | Female |
| Under 5 Years | 432 (8.7%) | 288 (6.2%) |
| 5 to 9 Years | 358 (7.2%) | 284 (6.1%) |
| 10 to 14 Years | 584 (11.8%) | 397 (8.5%) |
| 15 to 19 Years | 677 (13.7%) | 318 (6.8%) |
| 20 to 24 Years | 125 (2.5%) | 449 (9.6%) |
| 25 to 29 Years | 164 (3.3%) | 208 (4.4%) |
| 30 to 34 Years | 272 (5.5%) | 257 (5.5%) |
| 35 to 39 Years | 300 (6.1%) | 374 (8.0%) |
| 40 to 44 Years | 354 (7.2%) | 538 (11.5%) |
| 45 to 49 Years | 318 (6.4%) | 244 (5.2%) |
| 50 to 54 Years | 143 (2.9%) | 113 (2.4%) |
| 55 to 59 Years | 394 (8.0%) | 187 (4.0%) |
| 60 to 64 Years | 134 (2.7%) | 269 (5.8%) |
| 65 to 69 Years | 347 (7.0%) | 251 (5.4%) |
| 70 to 74 Years | 224 (4.5%) | 187 (4.0%) |
| 75 to 79 Years | 78 (1.6%) | 178 (3.8%) |
| 80 to 84 Years | 37 (0.7%) | 69 (1.5%) |
| 85 Years and over | 4 (0.1%) | 58 (1.2%) |
| Total | 4,945 (100.0%) | 4,669 (100.0%) |
Families and Households in Middleton
Median Family Size in Middleton
The median family size in Middleton is 3.52 persons per family, with single male/father families (395 | 16.4%) accounting for the largest median family size of 3.79 persons per family. On the other hand, single female/mother families (271 | 11.2%) represent the smallest median family size with 2.93 persons per family.
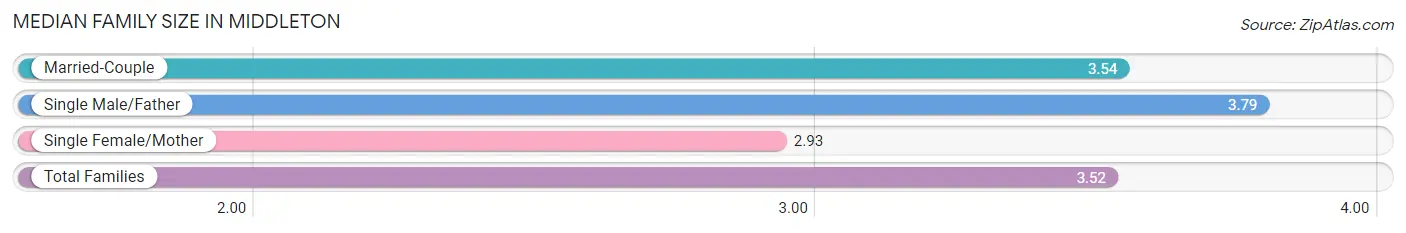
| Family Type | # Families | Family Size |
| Married-Couple | 1,744 (72.4%) | 3.54 |
| Single Male/Father | 395 (16.4%) | 3.79 |
| Single Female/Mother | 271 (11.2%) | 2.93 |
| Total Families | 2,410 (100.0%) | 3.52 |
Median Household Size in Middleton
The median household size in Middleton is 2.90 persons per household, with single male/father households (395 | 11.9%) accounting for the largest median household size of 4.11 persons per household. non-family households (900 | 27.2%) represent the smallest median household size with 1.06 persons per household.
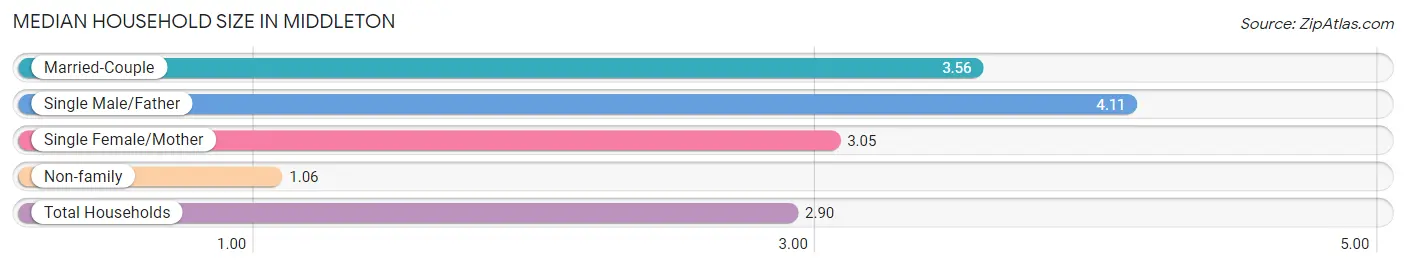
| Household Type | # Households | Household Size |
| Married-Couple | 1,744 (52.7%) | 3.56 |
| Single Male/Father | 395 (11.9%) | 4.11 |
| Single Female/Mother | 271 (8.2%) | 3.05 |
| Non-family | 900 (27.2%) | 1.06 |
| Total Households | 3,310 (100.0%) | 2.90 |
Household Size by Marriage Status in Middleton
Out of a total of 3,310 households in Middleton, 2,410 (72.8%) are family households, while 900 (27.2%) are nonfamily households. The most numerous type of family households are 2-person households, comprising 855, and the most common type of nonfamily households are 1-person households, comprising 815.
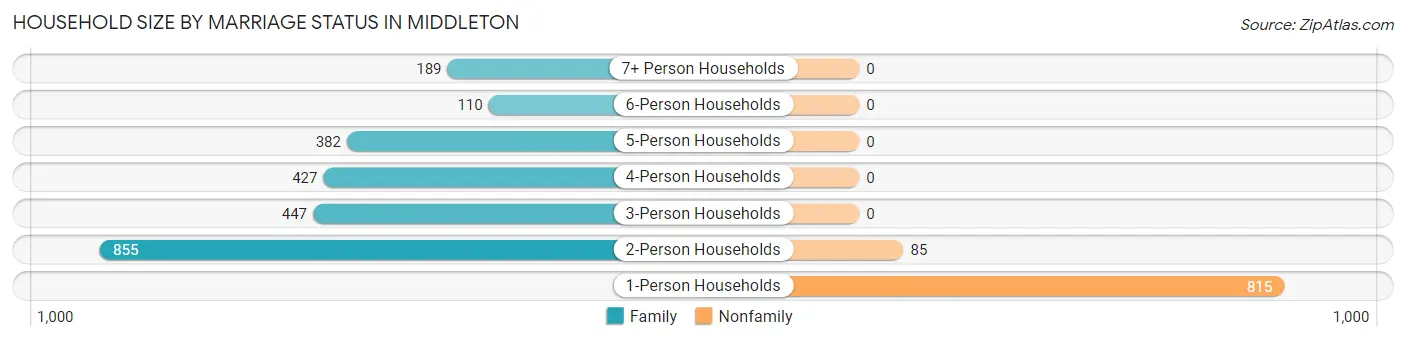
| Household Size | Family Households | Nonfamily Households |
| 1-Person Households | - | 815 (24.6%) |
| 2-Person Households | 855 (25.8%) | 85 (2.6%) |
| 3-Person Households | 447 (13.5%) | 0 (0.0%) |
| 4-Person Households | 427 (12.9%) | 0 (0.0%) |
| 5-Person Households | 382 (11.5%) | 0 (0.0%) |
| 6-Person Households | 110 (3.3%) | 0 (0.0%) |
| 7+ Person Households | 189 (5.7%) | 0 (0.0%) |
| Total | 2,410 (72.8%) | 900 (27.2%) |
Female Fertility in Middleton
Fertility by Age in Middleton
Average fertility rate in Middleton is 72.0 births per 1,000 women. Women in the age bracket of 20 to 34 years have the highest fertility rate with 165.0 births per 1,000 women. Women in the age bracket of 20 to 34 years acount for 85.3% of all women with births.
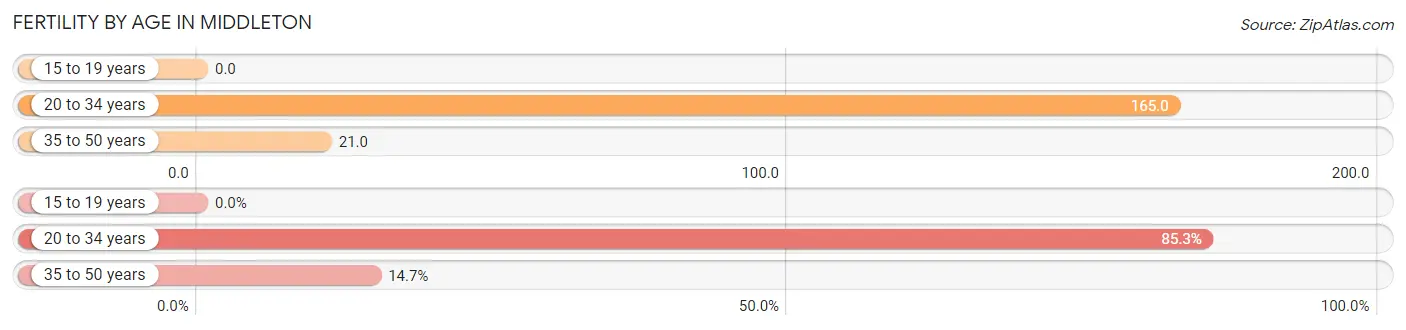
| Age Bracket | Women with Births | Births / 1,000 Women |
| 15 to 19 years | 0 (0.0%) | 0.0 |
| 20 to 34 years | 151 (85.3%) | 165.0 |
| 35 to 50 years | 26 (14.7%) | 21.0 |
| Total | 177 (100.0%) | 72.0 |
Fertility by Age by Marriage Status in Middleton
93.8% of women with births (177) in Middleton are married. The highest percentage of unmarried women with births falls into 20 to 34 years age bracket with 7.3% of them unmarried at the time of birth, while the lowest percentage of unmarried women with births belong to 35 to 50 years age bracket with 0.0% of them unmarried.
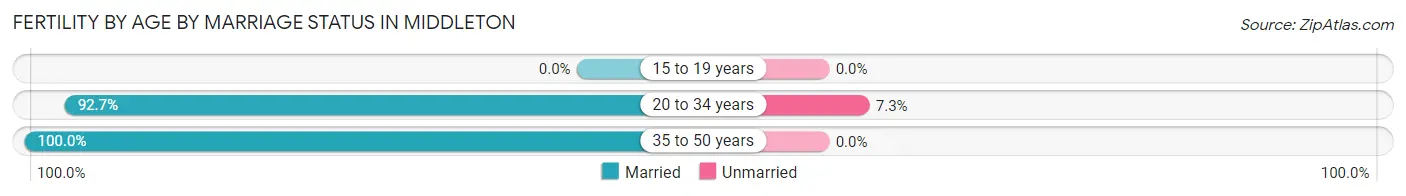
| Age Bracket | Married | Unmarried |
| 15 to 19 years | 0 (0.0%) | 0 (0.0%) |
| 20 to 34 years | 140 (92.7%) | 11 (7.3%) |
| 35 to 50 years | 26 (100.0%) | 0 (0.0%) |
| Total | 166 (93.8%) | 11 (6.2%) |
Fertility by Education in Middleton
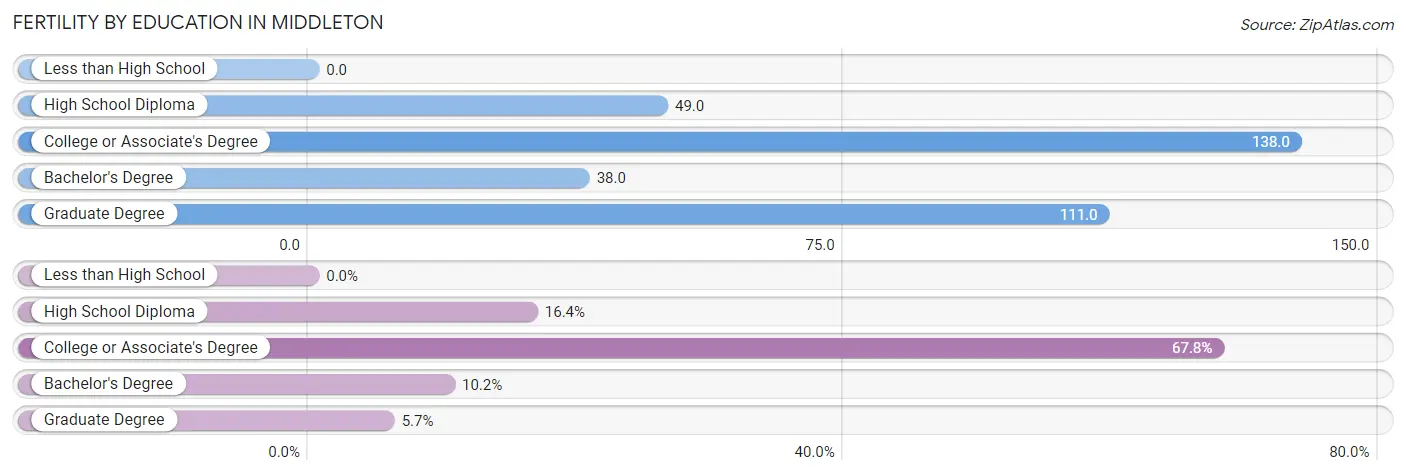
| Educational Attainment | Women with Births | Births / 1,000 Women |
| Less than High School | 0 (0.0%) | 0.0 |
| High School Diploma | 29 (16.4%) | 49.0 |
| College or Associate's Degree | 120 (67.8%) | 138.0 |
| Bachelor's Degree | 18 (10.2%) | 38.0 |
| Graduate Degree | 10 (5.7%) | 111.0 |
| Total | 177 (100.0%) | 72.0 |
Fertility by Education by Marriage Status in Middleton
6.2% of women with births in Middleton are unmarried. Women with the educational attainment of college or associate's degree are most likely to be married with 100.0% of them married at childbirth, while women with the educational attainment of high school diploma are least likely to be married with 37.9% of them unmarried at childbirth.
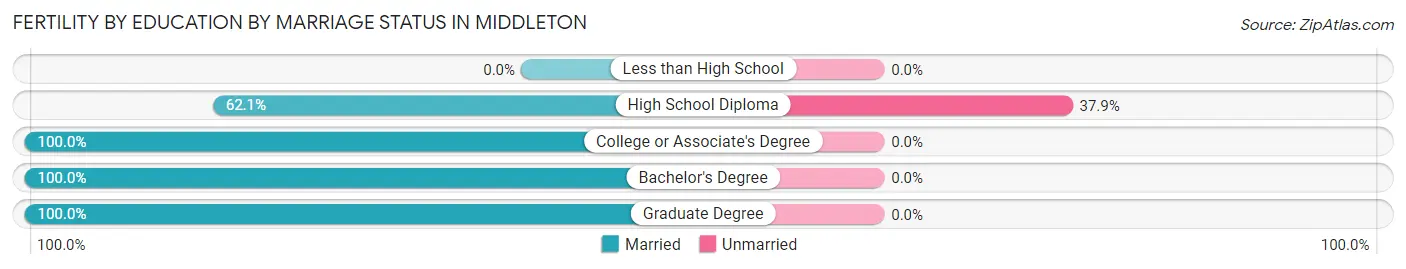
| Educational Attainment | Married | Unmarried |
| Less than High School | 0 (0.0%) | 0 (0.0%) |
| High School Diploma | 18 (62.1%) | 11 (37.9%) |
| College or Associate's Degree | 120 (100.0%) | 0 (0.0%) |
| Bachelor's Degree | 18 (100.0%) | 0 (0.0%) |
| Graduate Degree | 10 (100.0%) | 0 (0.0%) |
| Total | 166 (93.8%) | 11 (6.2%) |
Employment Characteristics in Middleton
Employment by Class of Employer in Middleton
Among the 4,443 employed individuals in Middleton, private company employees (3,203 | 72.1%), self-employed (not incorporated) (441 | 9.9%), and not-for-profit organizations (333 | 7.5%) make up the most common classes of employment.
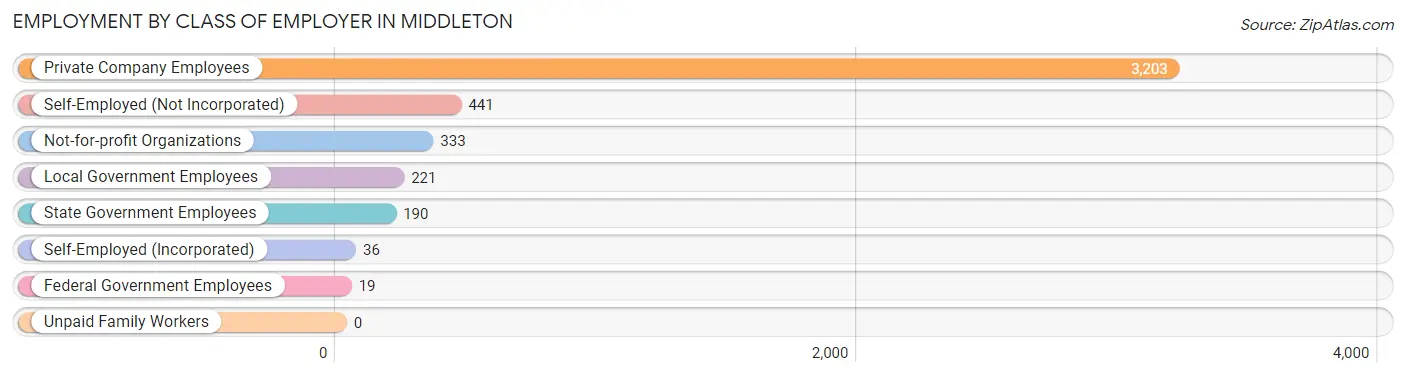
| Employer Class | # Employees | % Employees |
| Private Company Employees | 3,203 | 72.1% |
| Self-Employed (Incorporated) | 36 | 0.8% |
| Self-Employed (Not Incorporated) | 441 | 9.9% |
| Not-for-profit Organizations | 333 | 7.5% |
| Local Government Employees | 221 | 5.0% |
| State Government Employees | 190 | 4.3% |
| Federal Government Employees | 19 | 0.4% |
| Unpaid Family Workers | 0 | 0.0% |
| Total | 4,443 | 100.0% |
Employment Status by Age in Middleton
According to the labor force statistics for Middleton, out of the total population over 16 years of age (7,169), 63.7% or 4,567 individuals are in the labor force, with 2.5% or 114 of them unemployed. The age group with the highest labor force participation rate is 20 to 24 years, with 96.9% or 556 individuals in the labor force. Within the labor force, the 20 to 24 years age range has the highest percentage of unemployed individuals, with 6.1% or 34 of them being unemployed.
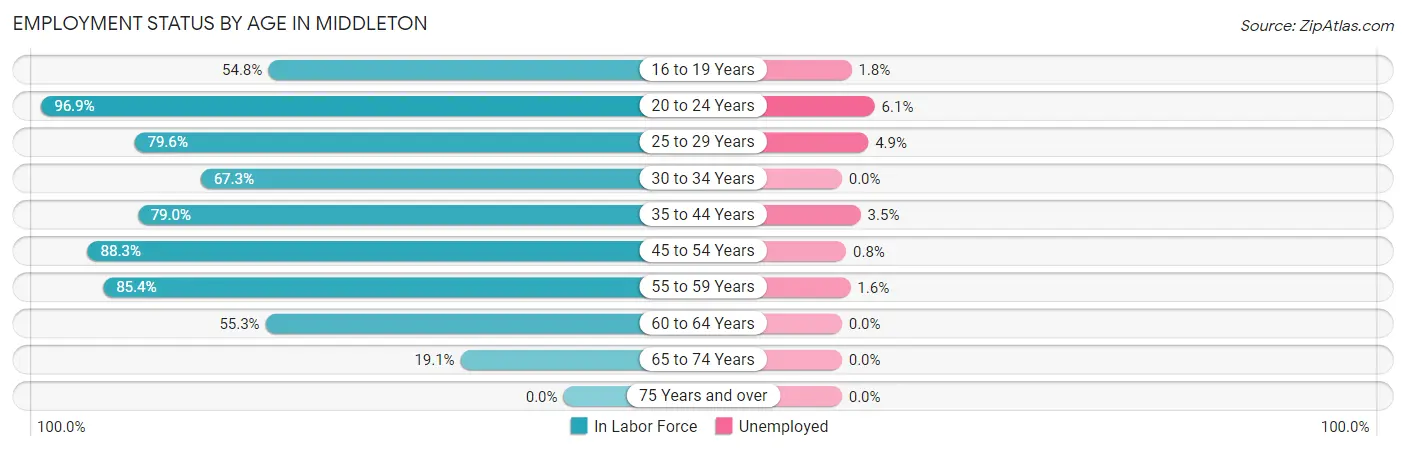
| Age Bracket | In Labor Force | Unemployed |
| 16 to 19 Years | 489 (54.8%) | 9 (1.8%) |
| 20 to 24 Years | 556 (96.9%) | 34 (6.1%) |
| 25 to 29 Years | 296 (79.6%) | 15 (4.9%) |
| 30 to 34 Years | 356 (67.3%) | 0 (0.0%) |
| 35 to 44 Years | 1,237 (79.0%) | 43 (3.5%) |
| 45 to 54 Years | 722 (88.3%) | 6 (0.8%) |
| 55 to 59 Years | 496 (85.4%) | 8 (1.6%) |
| 60 to 64 Years | 223 (55.3%) | 0 (0.0%) |
| 65 to 74 Years | 193 (19.1%) | 0 (0.0%) |
| 75 Years and over | 0 (0.0%) | 0 (0.0%) |
| Total | 4,567 (63.7%) | 114 (2.5%) |
Employment Status by Educational Attainment in Middleton
According to labor force statistics for Middleton, 78.0% of individuals (3,330) out of the total population between 25 and 64 years of age (4,269) are in the labor force, with 2.1% or 70 of them being unemployed. The group with the highest labor force participation rate are those with the educational attainment of college / associate degree, with 82.2% or 1,617 individuals in the labor force. Within the labor force, individuals with college / associate degree education have the highest percentage of unemployment, with 3.2% or 52 of them being unemployed.
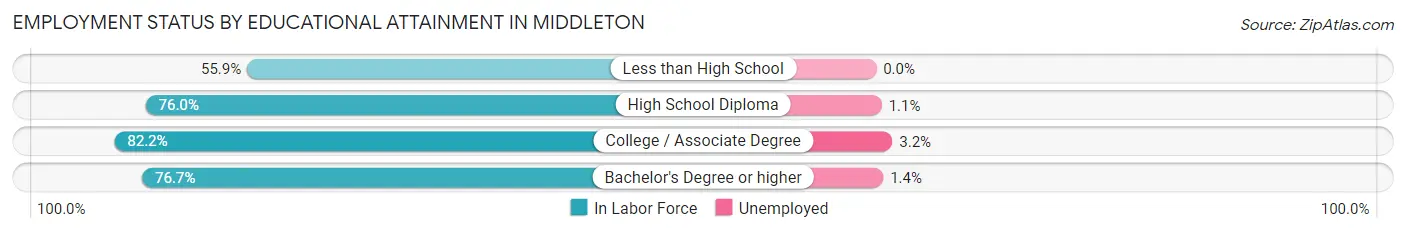
| Educational Attainment | In Labor Force | Unemployed |
| Less than High School | 128 (55.9%) | 0 (0.0%) |
| High School Diploma | 565 (76.0%) | 8 (1.1%) |
| College / Associate Degree | 1,617 (82.2%) | 63 (3.2%) |
| Bachelor's Degree or higher | 1,020 (76.7%) | 19 (1.4%) |
| Total | 3,330 (78.0%) | 90 (2.1%) |
Employment Occupations by Sex in Middleton
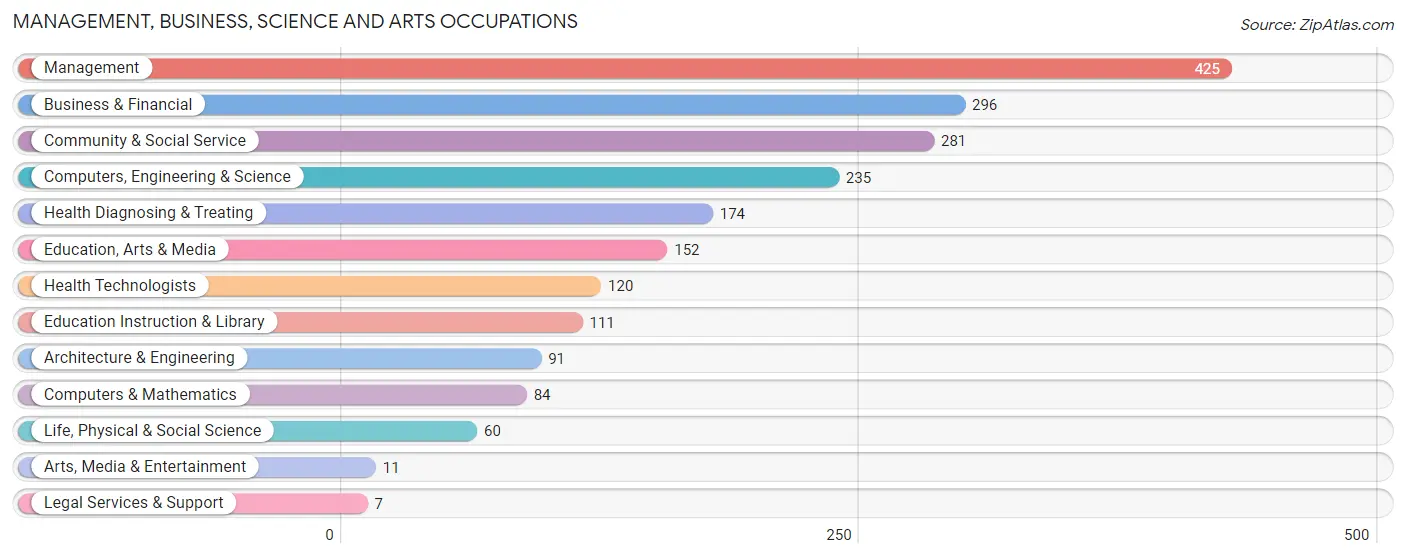
Management, Business, Science and Arts Occupations
The most common Management, Business, Science and Arts occupations in Middleton are Management (425 | 9.6%), Business & Financial (296 | 6.7%), Community & Social Service (281 | 6.3%), Computers, Engineering & Science (235 | 5.3%), and Health Diagnosing & Treating (174 | 3.9%).
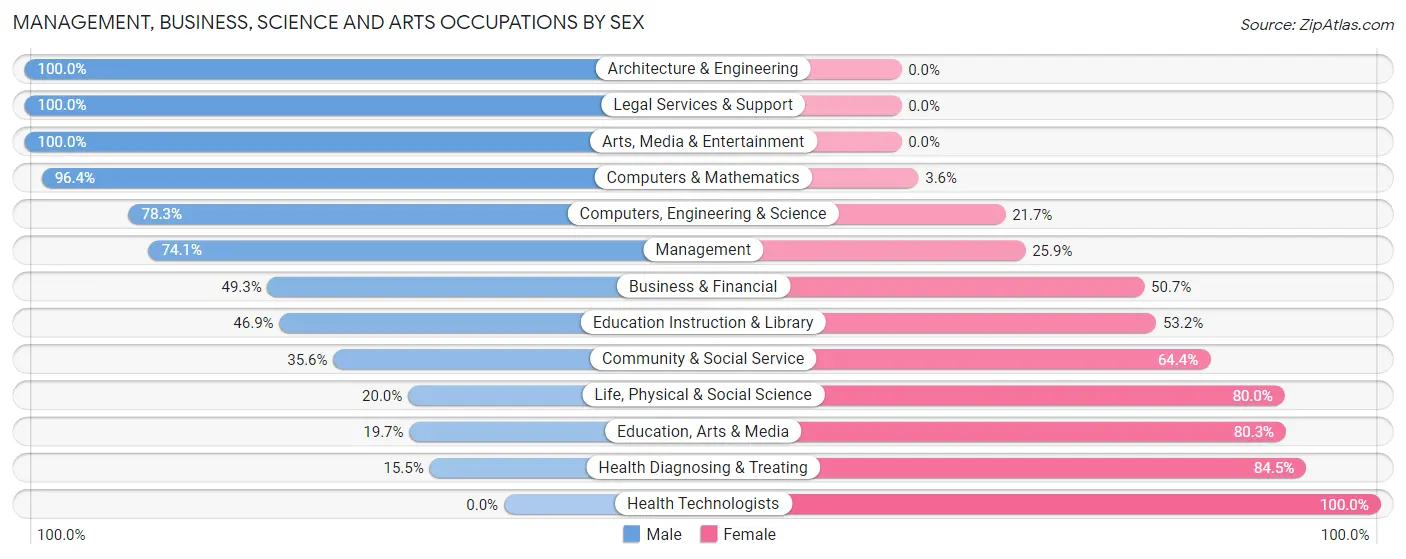
Management, Business, Science and Arts Occupations by Sex
Within the Management, Business, Science and Arts occupations in Middleton, the most male-oriented occupations are Architecture & Engineering (100.0%), Legal Services & Support (100.0%), and Arts, Media & Entertainment (100.0%), while the most female-oriented occupations are Health Technologists (100.0%), Health Diagnosing & Treating (84.5%), and Education, Arts & Media (80.3%).
| Occupation | Male | Female |
| Management | 315 (74.1%) | 110 (25.9%) |
| Business & Financial | 146 (49.3%) | 150 (50.7%) |
| Computers, Engineering & Science | 184 (78.3%) | 51 (21.7%) |
| Computers & Mathematics | 81 (96.4%) | 3 (3.6%) |
| Architecture & Engineering | 91 (100.0%) | 0 (0.0%) |
| Life, Physical & Social Science | 12 (20.0%) | 48 (80.0%) |
| Community & Social Service | 100 (35.6%) | 181 (64.4%) |
| Education, Arts & Media | 30 (19.7%) | 122 (80.3%) |
| Legal Services & Support | 7 (100.0%) | 0 (0.0%) |
| Education Instruction & Library | 52 (46.9%) | 59 (53.1%) |
| Arts, Media & Entertainment | 11 (100.0%) | 0 (0.0%) |
| Health Diagnosing & Treating | 27 (15.5%) | 147 (84.5%) |
| Health Technologists | 0 (0.0%) | 120 (100.0%) |
| Total (Category) | 772 (54.7%) | 639 (45.3%) |
| Total (Overall) | 2,410 (54.2%) | 2,035 (45.8%) |
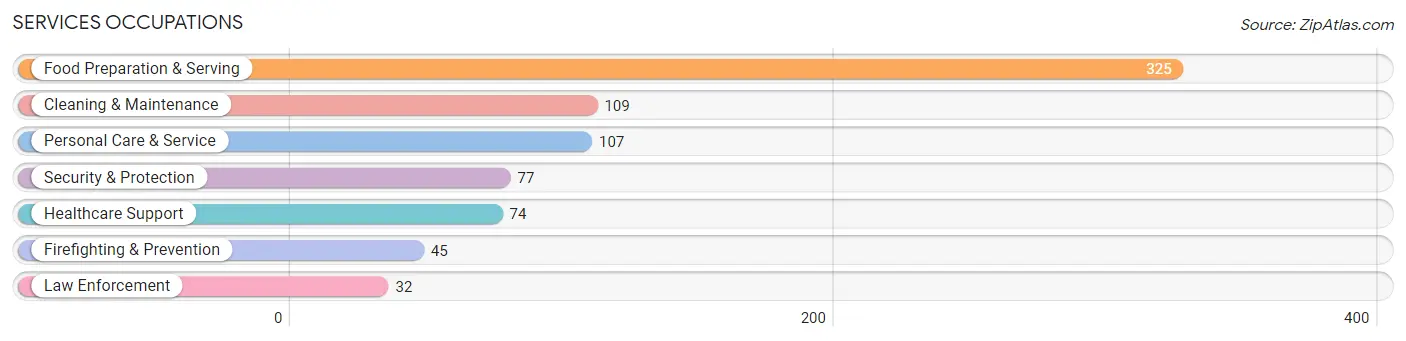
Services Occupations
The most common Services occupations in Middleton are Food Preparation & Serving (325 | 7.3%), Cleaning & Maintenance (109 | 2.5%), Personal Care & Service (107 | 2.4%), Security & Protection (77 | 1.7%), and Healthcare Support (74 | 1.7%).
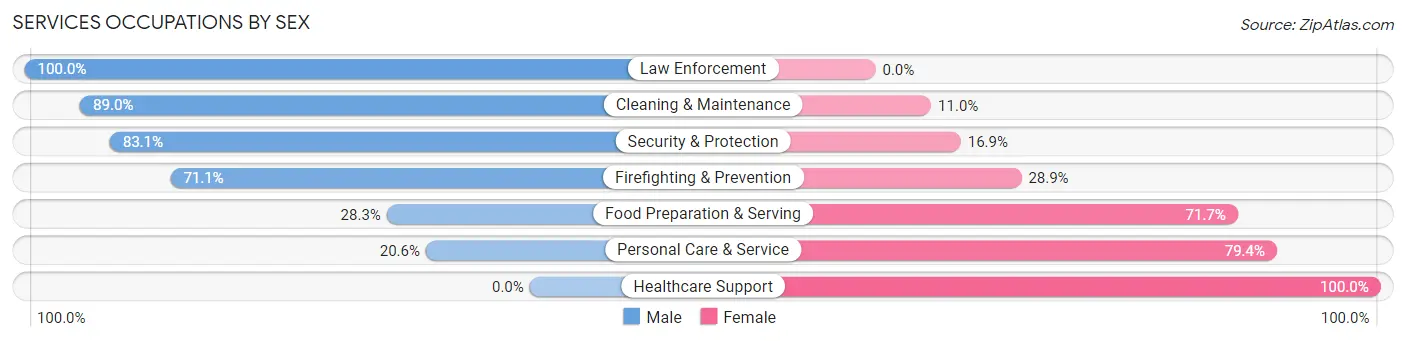
Services Occupations by Sex
Within the Services occupations in Middleton, the most male-oriented occupations are Law Enforcement (100.0%), Cleaning & Maintenance (89.0%), and Security & Protection (83.1%), while the most female-oriented occupations are Healthcare Support (100.0%), Personal Care & Service (79.4%), and Food Preparation & Serving (71.7%).
| Occupation | Male | Female |
| Healthcare Support | 0 (0.0%) | 74 (100.0%) |
| Security & Protection | 64 (83.1%) | 13 (16.9%) |
| Firefighting & Prevention | 32 (71.1%) | 13 (28.9%) |
| Law Enforcement | 32 (100.0%) | 0 (0.0%) |
| Food Preparation & Serving | 92 (28.3%) | 233 (71.7%) |
| Cleaning & Maintenance | 97 (89.0%) | 12 (11.0%) |
| Personal Care & Service | 22 (20.6%) | 85 (79.4%) |
| Total (Category) | 275 (39.7%) | 417 (60.3%) |
| Total (Overall) | 2,410 (54.2%) | 2,035 (45.8%) |
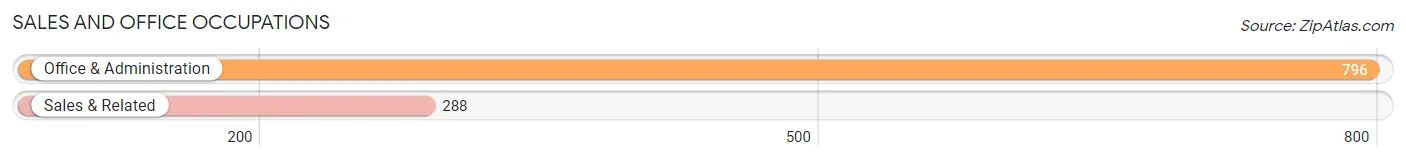
Sales and Office Occupations
The most common Sales and Office occupations in Middleton are Office & Administration (796 | 17.9%), and Sales & Related (288 | 6.5%).
Sales and Office Occupations by Sex
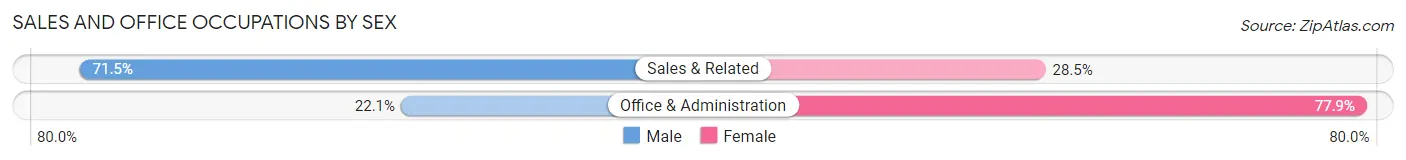
| Occupation | Male | Female |
| Sales & Related | 206 (71.5%) | 82 (28.5%) |
| Office & Administration | 176 (22.1%) | 620 (77.9%) |
| Total (Category) | 382 (35.2%) | 702 (64.8%) |
| Total (Overall) | 2,410 (54.2%) | 2,035 (45.8%) |
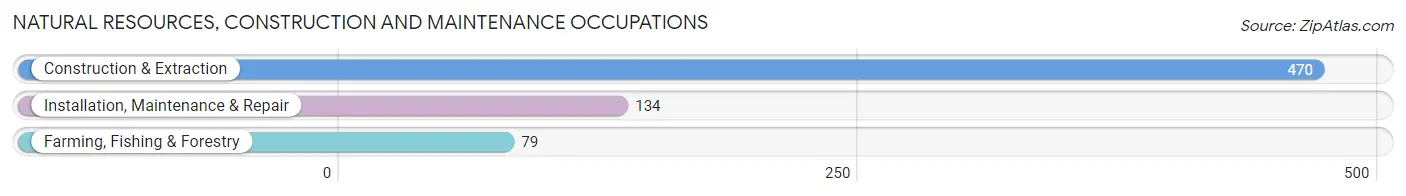
Natural Resources, Construction and Maintenance Occupations
The most common Natural Resources, Construction and Maintenance occupations in Middleton are Construction & Extraction (470 | 10.6%), Installation, Maintenance & Repair (134 | 3.0%), and Farming, Fishing & Forestry (79 | 1.8%).
Natural Resources, Construction and Maintenance Occupations by Sex
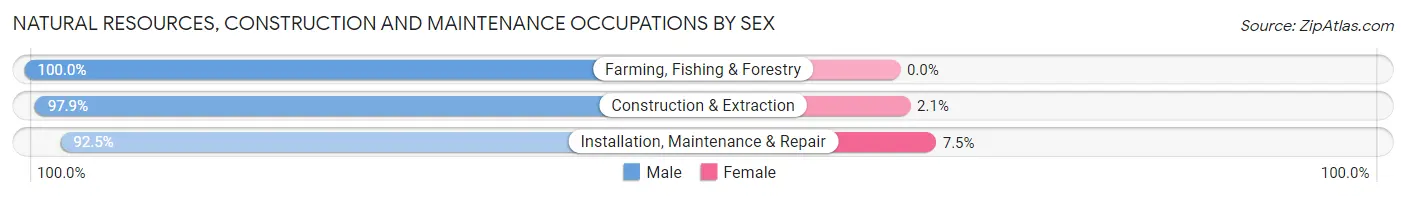
| Occupation | Male | Female |
| Farming, Fishing & Forestry | 79 (100.0%) | 0 (0.0%) |
| Construction & Extraction | 460 (97.9%) | 10 (2.1%) |
| Installation, Maintenance & Repair | 124 (92.5%) | 10 (7.5%) |
| Total (Category) | 663 (97.1%) | 20 (2.9%) |
| Total (Overall) | 2,410 (54.2%) | 2,035 (45.8%) |
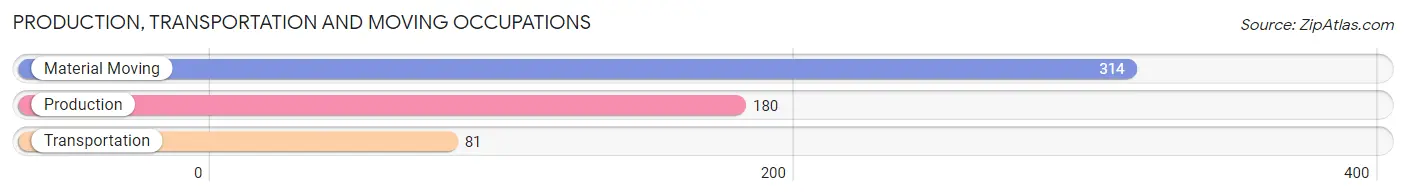
Production, Transportation and Moving Occupations
The most common Production, Transportation and Moving occupations in Middleton are Material Moving (314 | 7.1%), Production (180 | 4.1%), and Transportation (81 | 1.8%).
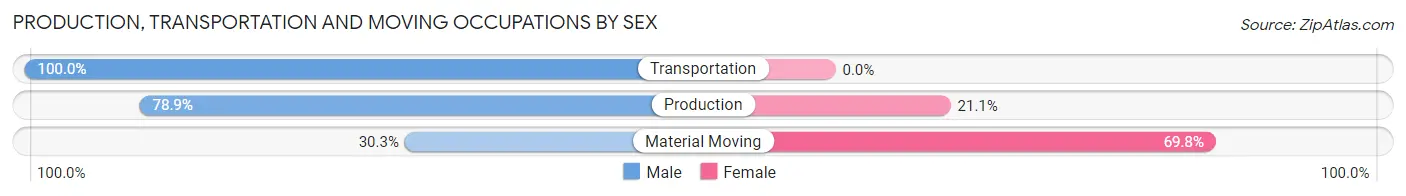
Production, Transportation and Moving Occupations by Sex
| Occupation | Male | Female |
| Production | 142 (78.9%) | 38 (21.1%) |
| Transportation | 81 (100.0%) | 0 (0.0%) |
| Material Moving | 95 (30.2%) | 219 (69.8%) |
| Total (Category) | 318 (55.3%) | 257 (44.7%) |
| Total (Overall) | 2,410 (54.2%) | 2,035 (45.8%) |
Employment Industries by Sex in Middleton
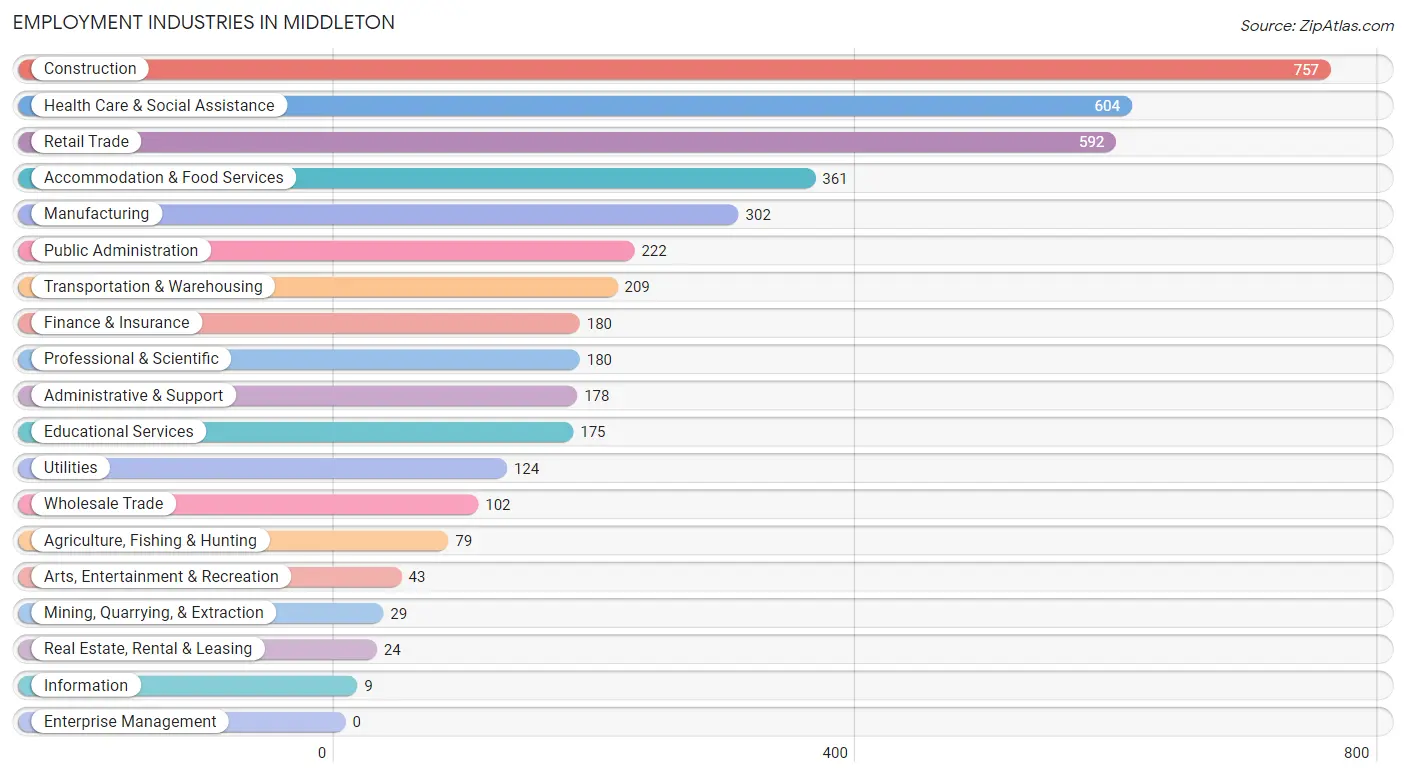
Employment Industries in Middleton
The major employment industries in Middleton include Construction (757 | 17.0%), Health Care & Social Assistance (604 | 13.6%), Retail Trade (592 | 13.3%), Accommodation & Food Services (361 | 8.1%), and Manufacturing (302 | 6.8%).
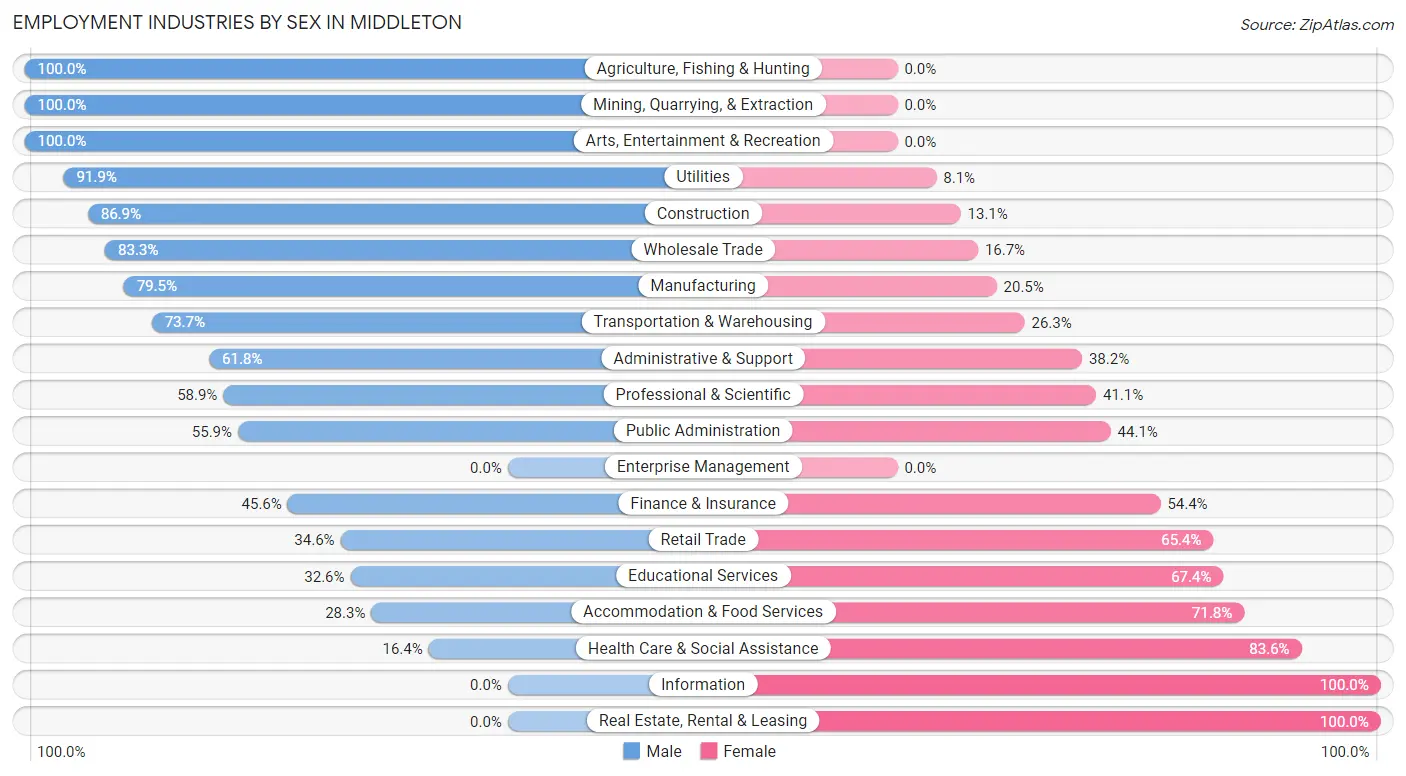
Employment Industries by Sex in Middleton
The Middleton industries that see more men than women are Agriculture, Fishing & Hunting (100.0%), Mining, Quarrying, & Extraction (100.0%), and Arts, Entertainment & Recreation (100.0%), whereas the industries that tend to have a higher number of women are Information (100.0%), Real Estate, Rental & Leasing (100.0%), and Health Care & Social Assistance (83.6%).
| Industry | Male | Female |
| Agriculture, Fishing & Hunting | 79 (100.0%) | 0 (0.0%) |
| Mining, Quarrying, & Extraction | 29 (100.0%) | 0 (0.0%) |
| Construction | 658 (86.9%) | 99 (13.1%) |
| Manufacturing | 240 (79.5%) | 62 (20.5%) |
| Wholesale Trade | 85 (83.3%) | 17 (16.7%) |
| Retail Trade | 205 (34.6%) | 387 (65.4%) |
| Transportation & Warehousing | 154 (73.7%) | 55 (26.3%) |
| Utilities | 114 (91.9%) | 10 (8.1%) |
| Information | 0 (0.0%) | 9 (100.0%) |
| Finance & Insurance | 82 (45.6%) | 98 (54.4%) |
| Real Estate, Rental & Leasing | 0 (0.0%) | 24 (100.0%) |
| Professional & Scientific | 106 (58.9%) | 74 (41.1%) |
| Enterprise Management | 0 (0.0%) | 0 (0.0%) |
| Administrative & Support | 110 (61.8%) | 68 (38.2%) |
| Educational Services | 57 (32.6%) | 118 (67.4%) |
| Health Care & Social Assistance | 99 (16.4%) | 505 (83.6%) |
| Arts, Entertainment & Recreation | 43 (100.0%) | 0 (0.0%) |
| Accommodation & Food Services | 102 (28.2%) | 259 (71.8%) |
| Public Administration | 124 (55.9%) | 98 (44.1%) |
| Total | 2,410 (54.2%) | 2,035 (45.8%) |
Education in Middleton
School Enrollment in Middleton
The most common levels of schooling among the 2,605 students in Middleton are high school (899 | 34.5%), middle school (764 | 29.3%), and elementary school (517 | 19.9%).
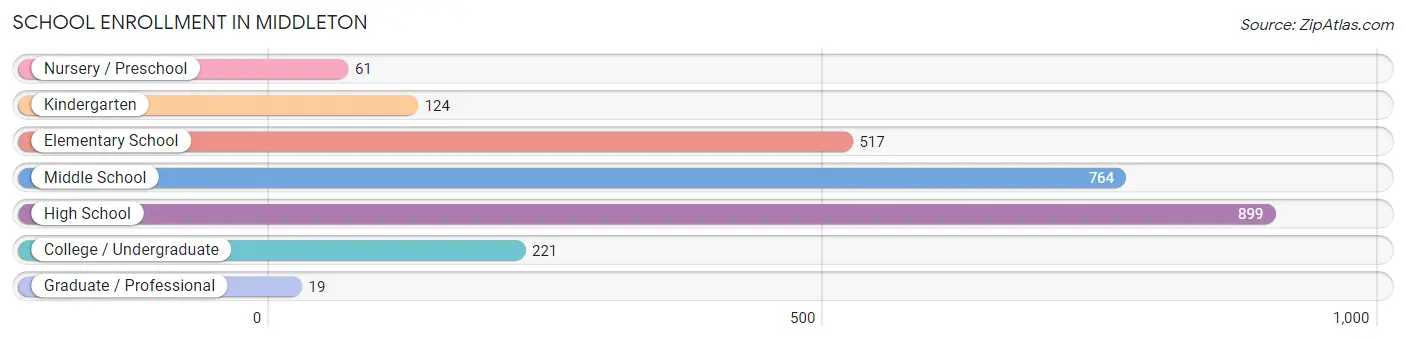
| School Level | # Students | % Students |
| Nursery / Preschool | 61 | 2.3% |
| Kindergarten | 124 | 4.8% |
| Elementary School | 517 | 19.9% |
| Middle School | 764 | 29.3% |
| High School | 899 | 34.5% |
| College / Undergraduate | 221 | 8.5% |
| Graduate / Professional | 19 | 0.7% |
| Total | 2,605 | 100.0% |
School Enrollment by Age by Funding Source in Middleton
Out of a total of 2,605 students who are enrolled in schools in Middleton, 352 (13.5%) attend a private institution, while the remaining 2,253 (86.5%) are enrolled in public schools. The age group of 3 to 4 year olds has the highest likelihood of being enrolled in private schools, with 23 (37.7% in the age bracket) enrolled. Conversely, the age group of 20 to 24 year olds has the lowest likelihood of being enrolled in a private school, with 106 (100.0% in the age bracket) attending a public institution.
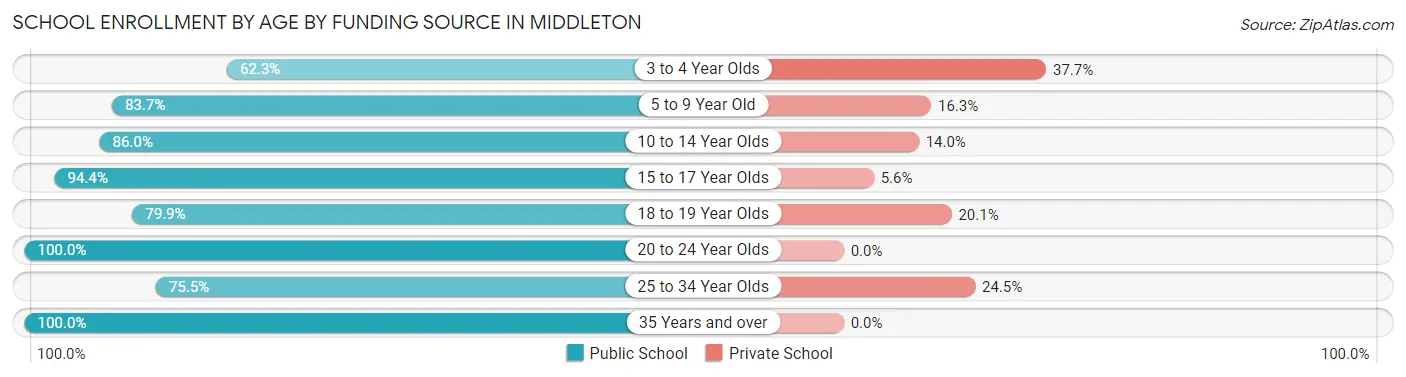
| Age Bracket | Public School | Private School |
| 3 to 4 Year Olds | 38 (62.3%) | 23 (37.7%) |
| 5 to 9 Year Old | 468 (83.7%) | 91 (16.3%) |
| 10 to 14 Year Olds | 825 (86.0%) | 134 (14.0%) |
| 15 to 17 Year Olds | 524 (94.4%) | 31 (5.6%) |
| 18 to 19 Year Olds | 195 (79.9%) | 49 (20.1%) |
| 20 to 24 Year Olds | 106 (100.0%) | 0 (0.0%) |
| 25 to 34 Year Olds | 71 (75.5%) | 23 (24.5%) |
| 35 Years and over | 27 (100.0%) | 0 (0.0%) |
| Total | 2,253 (86.5%) | 352 (13.5%) |
Educational Attainment by Field of Study in Middleton
Business (329 | 17.8%), science & technology (233 | 12.6%), visual & performing arts (218 | 11.8%), social sciences (180 | 9.8%), and bio, nature & agricultural (145 | 7.9%) are the most common fields of study among 1,844 individuals in Middleton who have obtained a bachelor's degree or higher.
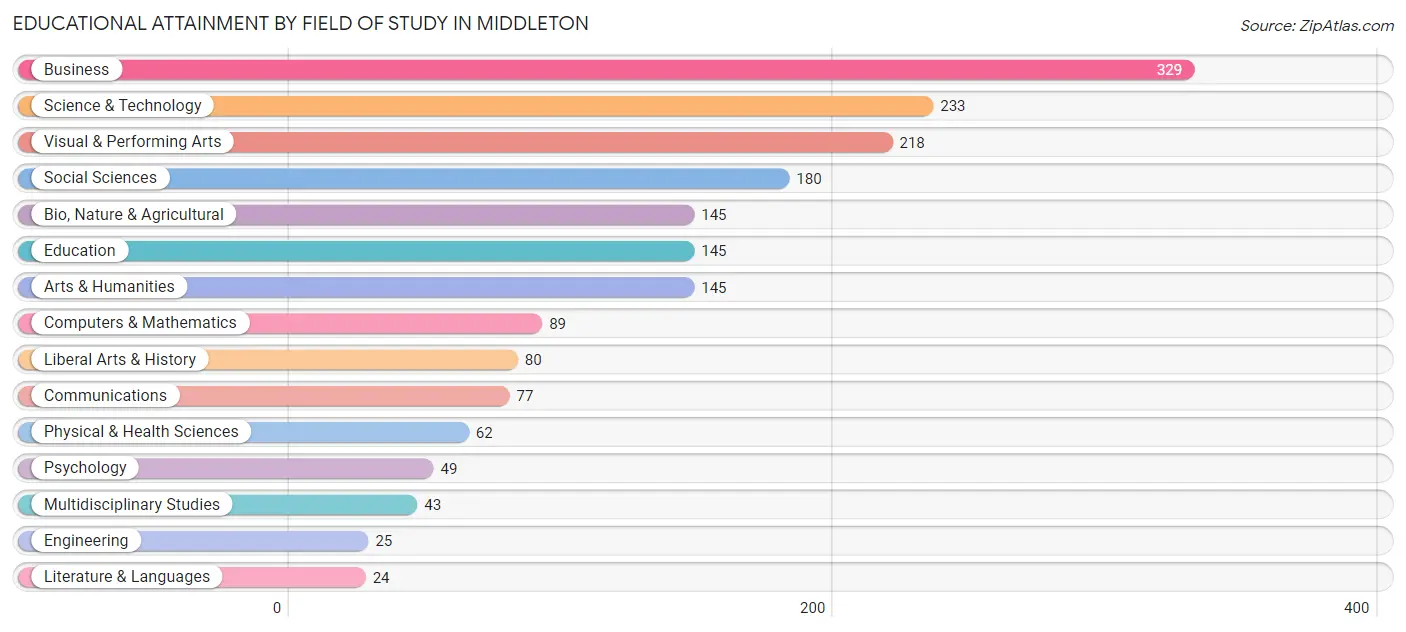
| Field of Study | # Graduates | % Graduates |
| Computers & Mathematics | 89 | 4.8% |
| Bio, Nature & Agricultural | 145 | 7.9% |
| Physical & Health Sciences | 62 | 3.4% |
| Psychology | 49 | 2.7% |
| Social Sciences | 180 | 9.8% |
| Engineering | 25 | 1.4% |
| Multidisciplinary Studies | 43 | 2.3% |
| Science & Technology | 233 | 12.6% |
| Business | 329 | 17.8% |
| Education | 145 | 7.9% |
| Literature & Languages | 24 | 1.3% |
| Liberal Arts & History | 80 | 4.3% |
| Visual & Performing Arts | 218 | 11.8% |
| Communications | 77 | 4.2% |
| Arts & Humanities | 145 | 7.9% |
| Total | 1,844 | 100.0% |
Transportation & Commute in Middleton
Vehicle Availability by Sex in Middleton
The most prevalent vehicle ownership categories in Middleton are males with 2 vehicles (703, accounting for 29.1%) and females with 2 vehicles (623, making up 34.8%).
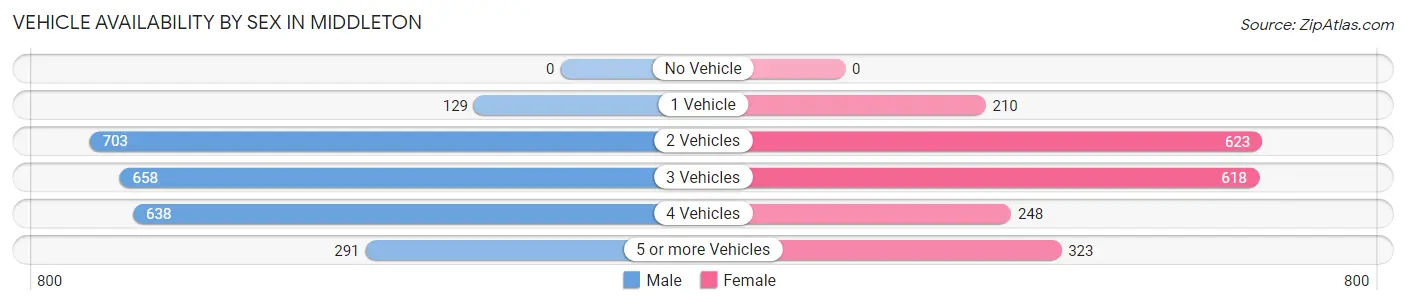
| Vehicles Available | Male | Female |
| No Vehicle | 0 (0.0%) | 0 (0.0%) |
| 1 Vehicle | 129 (5.3%) | 210 (10.4%) |
| 2 Vehicles | 703 (29.1%) | 623 (30.8%) |
| 3 Vehicles | 658 (27.2%) | 618 (30.6%) |
| 4 Vehicles | 638 (26.4%) | 248 (12.3%) |
| 5 or more Vehicles | 291 (12.0%) | 323 (16.0%) |
| Total | 2,419 (100.0%) | 2,022 (100.0%) |
Commute Time in Middleton
The most frequently occuring commute durations in Middleton are 45 to 59 minutes (802 commuters, 19.5%), 20 to 24 minutes (691 commuters, 16.8%), and 15 to 19 minutes (582 commuters, 14.1%).
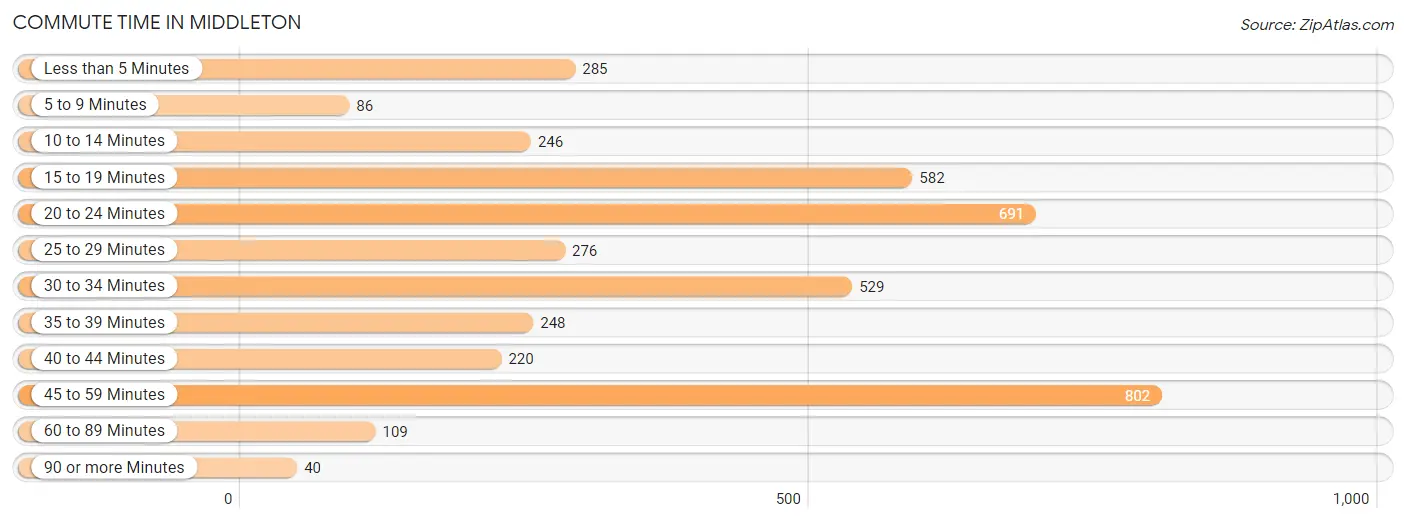
| Commute Time | # Commuters | % Commuters |
| Less than 5 Minutes | 285 | 6.9% |
| 5 to 9 Minutes | 86 | 2.1% |
| 10 to 14 Minutes | 246 | 6.0% |
| 15 to 19 Minutes | 582 | 14.1% |
| 20 to 24 Minutes | 691 | 16.8% |
| 25 to 29 Minutes | 276 | 6.7% |
| 30 to 34 Minutes | 529 | 12.9% |
| 35 to 39 Minutes | 248 | 6.0% |
| 40 to 44 Minutes | 220 | 5.3% |
| 45 to 59 Minutes | 802 | 19.5% |
| 60 to 89 Minutes | 109 | 2.6% |
| 90 or more Minutes | 40 | 1.0% |
Commute Time by Sex in Middleton
The most common commute times in Middleton are 45 to 59 minutes (568 commuters, 25.2%) for males and 20 to 24 minutes (432 commuters, 23.3%) for females.
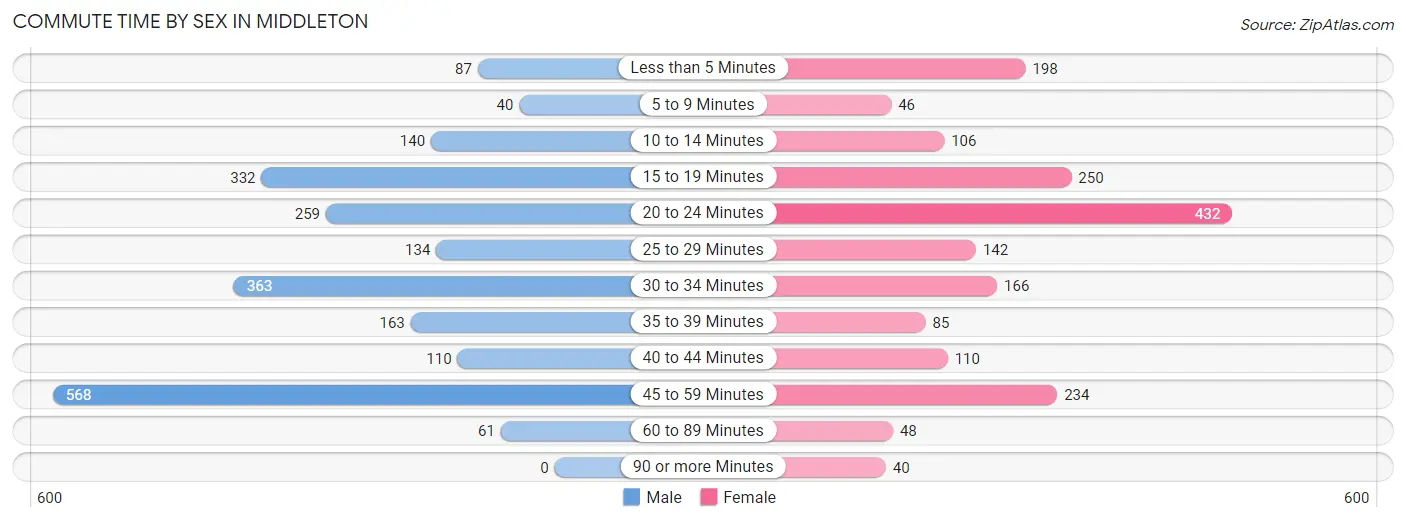
| Commute Time | Male | Female |
| Less than 5 Minutes | 87 (3.8%) | 198 (10.7%) |
| 5 to 9 Minutes | 40 (1.8%) | 46 (2.5%) |
| 10 to 14 Minutes | 140 (6.2%) | 106 (5.7%) |
| 15 to 19 Minutes | 332 (14.7%) | 250 (13.5%) |
| 20 to 24 Minutes | 259 (11.5%) | 432 (23.3%) |
| 25 to 29 Minutes | 134 (5.9%) | 142 (7.6%) |
| 30 to 34 Minutes | 363 (16.1%) | 166 (8.9%) |
| 35 to 39 Minutes | 163 (7.2%) | 85 (4.6%) |
| 40 to 44 Minutes | 110 (4.9%) | 110 (5.9%) |
| 45 to 59 Minutes | 568 (25.2%) | 234 (12.6%) |
| 60 to 89 Minutes | 61 (2.7%) | 48 (2.6%) |
| 90 or more Minutes | 0 (0.0%) | 40 (2.1%) |
Time of Departure to Work by Sex in Middleton
The most frequent times of departure to work in Middleton are 7:00 AM to 7:29 AM (382, 16.9%) for males and 7:30 AM to 7:59 AM (302, 16.3%) for females.
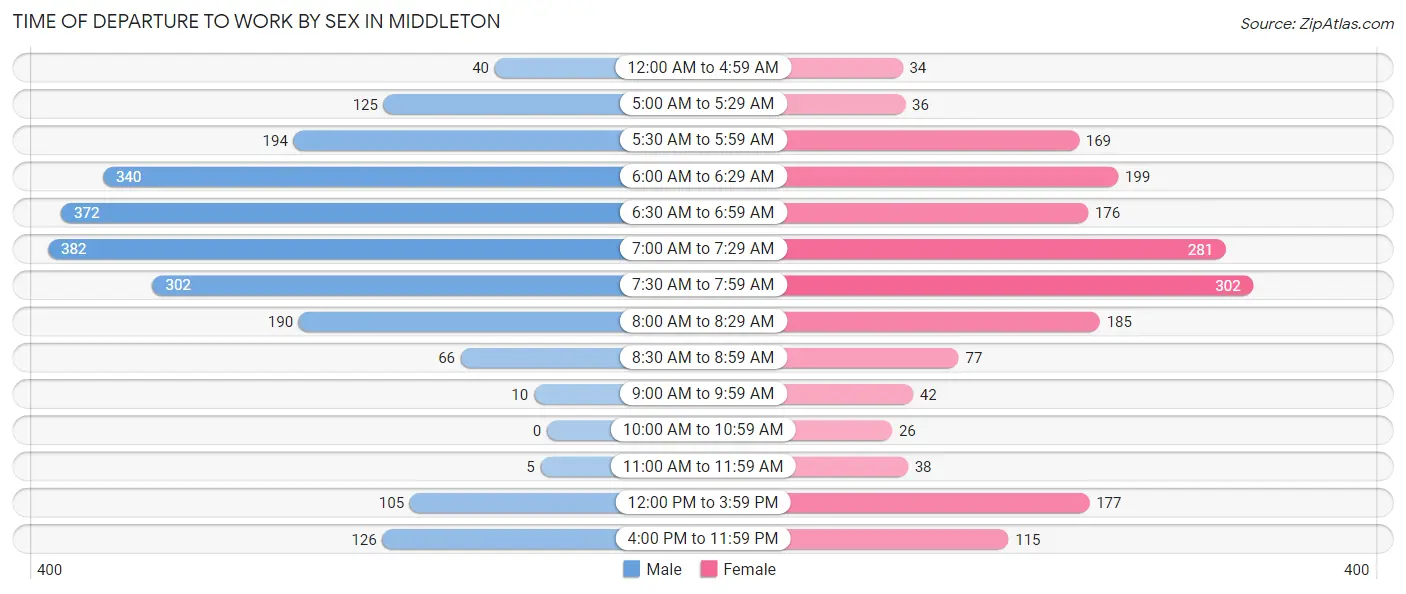
| Time of Departure | Male | Female |
| 12:00 AM to 4:59 AM | 40 (1.8%) | 34 (1.8%) |
| 5:00 AM to 5:29 AM | 125 (5.5%) | 36 (1.9%) |
| 5:30 AM to 5:59 AM | 194 (8.6%) | 169 (9.1%) |
| 6:00 AM to 6:29 AM | 340 (15.1%) | 199 (10.7%) |
| 6:30 AM to 6:59 AM | 372 (16.5%) | 176 (9.5%) |
| 7:00 AM to 7:29 AM | 382 (16.9%) | 281 (15.1%) |
| 7:30 AM to 7:59 AM | 302 (13.4%) | 302 (16.3%) |
| 8:00 AM to 8:29 AM | 190 (8.4%) | 185 (10.0%) |
| 8:30 AM to 8:59 AM | 66 (2.9%) | 77 (4.2%) |
| 9:00 AM to 9:59 AM | 10 (0.4%) | 42 (2.3%) |
| 10:00 AM to 10:59 AM | 0 (0.0%) | 26 (1.4%) |
| 11:00 AM to 11:59 AM | 5 (0.2%) | 38 (2.1%) |
| 12:00 PM to 3:59 PM | 105 (4.6%) | 177 (9.5%) |
| 4:00 PM to 11:59 PM | 126 (5.6%) | 115 (6.2%) |
| Total | 2,257 (100.0%) | 1,857 (100.0%) |
Housing Occupancy in Middleton
Occupancy by Ownership in Middleton
Of the total 3,310 dwellings in Middleton, owner-occupied units account for 2,857 (86.3%), while renter-occupied units make up 453 (13.7%).
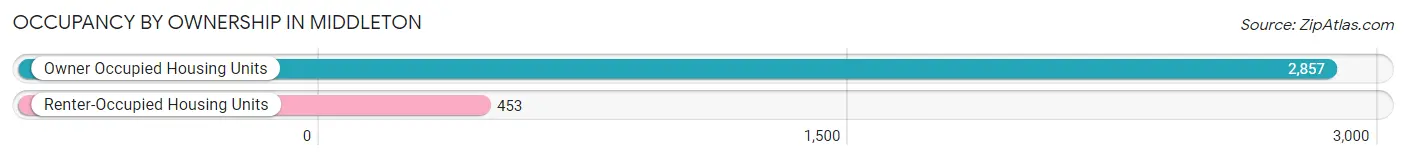
| Occupancy | # Housing Units | % Housing Units |
| Owner Occupied Housing Units | 2,857 | 86.3% |
| Renter-Occupied Housing Units | 453 | 13.7% |
| Total Occupied Housing Units | 3,310 | 100.0% |
Occupancy by Household Size in Middleton
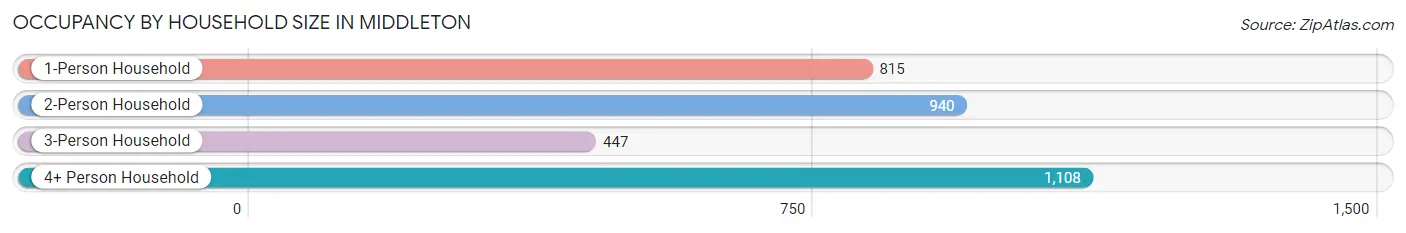
| Household Size | # Housing Units | % Housing Units |
| 1-Person Household | 815 | 24.6% |
| 2-Person Household | 940 | 28.4% |
| 3-Person Household | 447 | 13.5% |
| 4+ Person Household | 1,108 | 33.5% |
| Total Housing Units | 3,310 | 100.0% |
Occupancy by Ownership by Household Size in Middleton
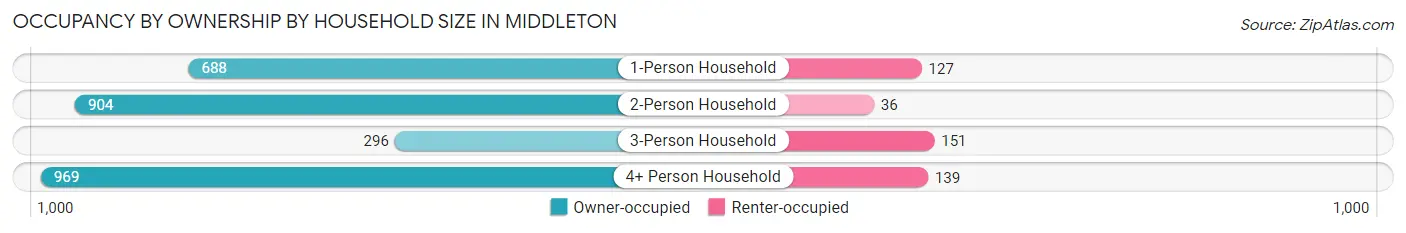
| Household Size | Owner-occupied | Renter-occupied |
| 1-Person Household | 688 (84.4%) | 127 (15.6%) |
| 2-Person Household | 904 (96.2%) | 36 (3.8%) |
| 3-Person Household | 296 (66.2%) | 151 (33.8%) |
| 4+ Person Household | 969 (87.5%) | 139 (12.6%) |
| Total Housing Units | 2,857 (86.3%) | 453 (13.7%) |
Occupancy by Educational Attainment in Middleton
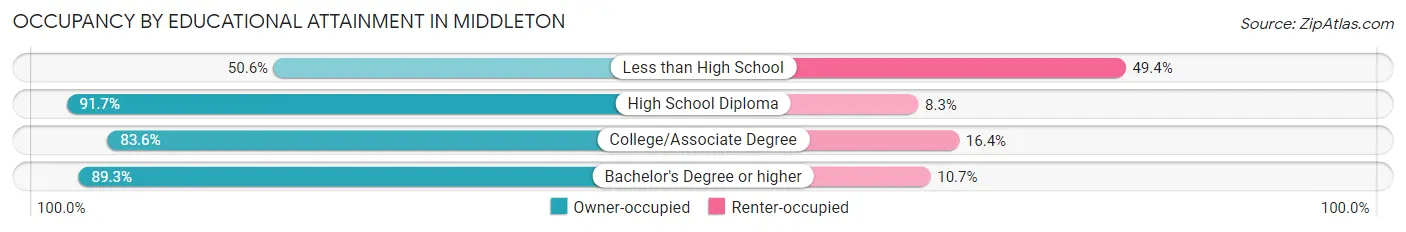
| Household Size | Owner-occupied | Renter-occupied |
| Less than High School | 44 (50.6%) | 43 (49.4%) |
| High School Diploma | 705 (91.7%) | 64 (8.3%) |
| College/Associate Degree | 1,218 (83.6%) | 239 (16.4%) |
| Bachelor's Degree or higher | 890 (89.3%) | 107 (10.7%) |
Occupancy by Age of Householder in Middleton
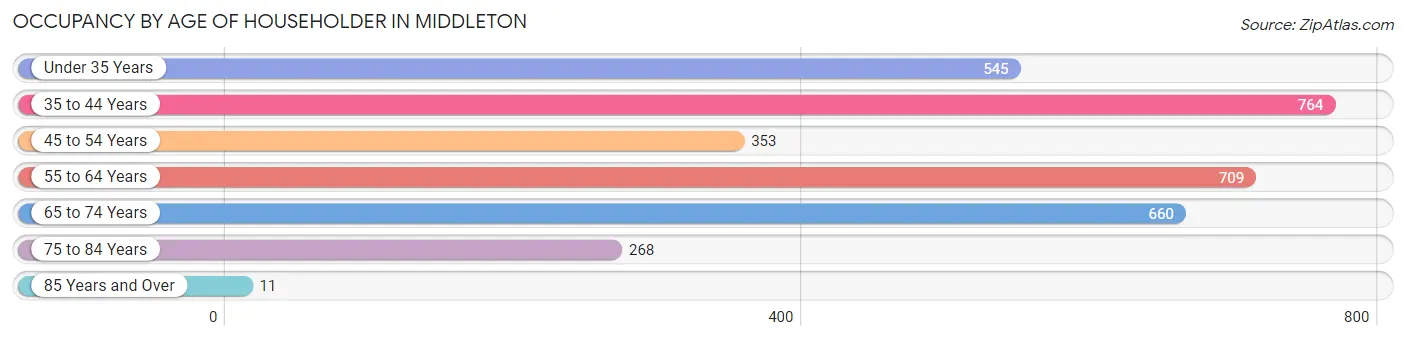
| Age Bracket | # Households | % Households |
| Under 35 Years | 545 | 16.5% |
| 35 to 44 Years | 764 | 23.1% |
| 45 to 54 Years | 353 | 10.7% |
| 55 to 64 Years | 709 | 21.4% |
| 65 to 74 Years | 660 | 19.9% |
| 75 to 84 Years | 268 | 8.1% |
| 85 Years and Over | 11 | 0.3% |
| Total | 3,310 | 100.0% |
Housing Finances in Middleton
Median Income by Occupancy in Middleton
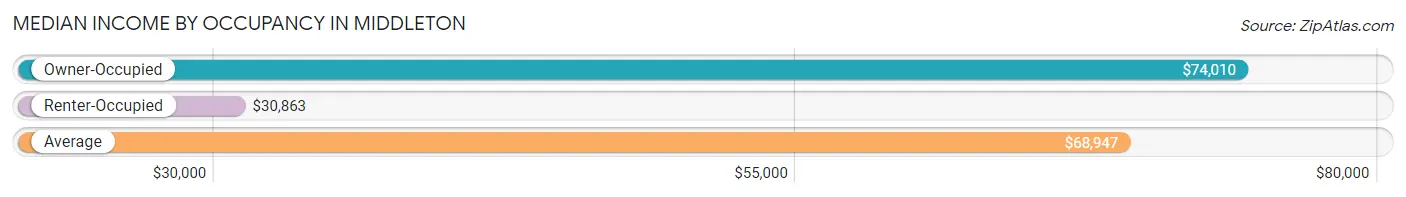
| Occupancy Type | # Households | Median Income |
| Owner-Occupied | 2,857 (86.3%) | $74,010 |
| Renter-Occupied | 453 (13.7%) | $30,863 |
| Average | 3,310 (100.0%) | $68,947 |
Occupancy by Householder Income Bracket in Middleton
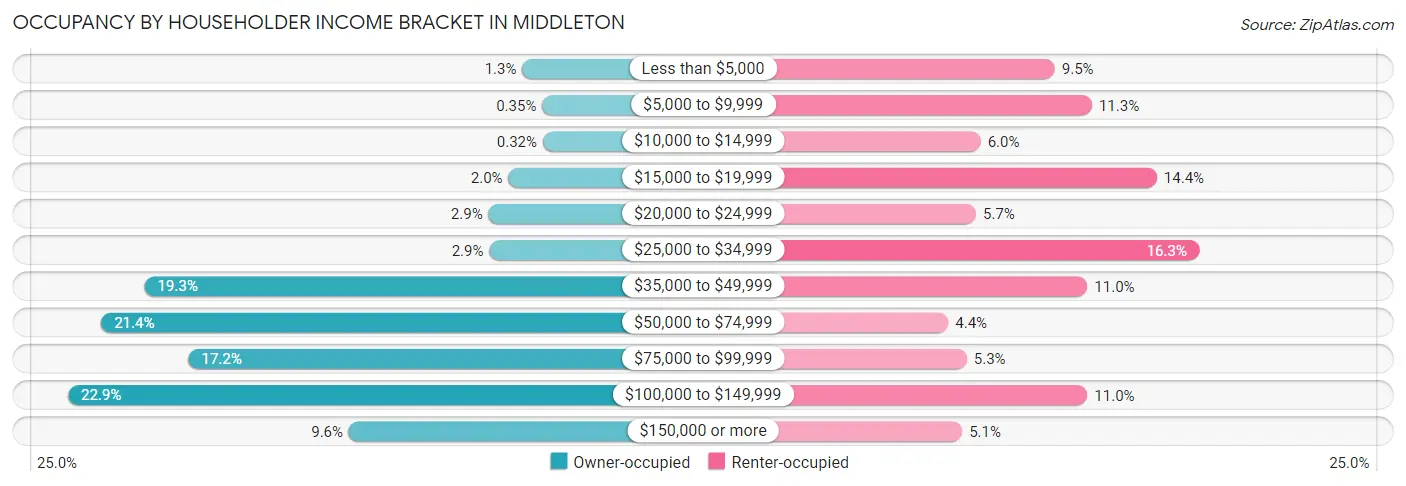
| Income Bracket | Owner-occupied | Renter-occupied |
| Less than $5,000 | 37 (1.3%) | 43 (9.5%) |
| $5,000 to $9,999 | 10 (0.4%) | 51 (11.3%) |
| $10,000 to $14,999 | 9 (0.3%) | 27 (6.0%) |
| $15,000 to $19,999 | 56 (2.0%) | 65 (14.3%) |
| $20,000 to $24,999 | 83 (2.9%) | 26 (5.7%) |
| $25,000 to $34,999 | 82 (2.9%) | 74 (16.3%) |
| $35,000 to $49,999 | 551 (19.3%) | 50 (11.0%) |
| $50,000 to $74,999 | 610 (21.3%) | 20 (4.4%) |
| $75,000 to $99,999 | 491 (17.2%) | 24 (5.3%) |
| $100,000 to $149,999 | 655 (22.9%) | 50 (11.0%) |
| $150,000 or more | 273 (9.6%) | 23 (5.1%) |
| Total | 2,857 (100.0%) | 453 (100.0%) |
Monthly Housing Cost Tiers in Middleton
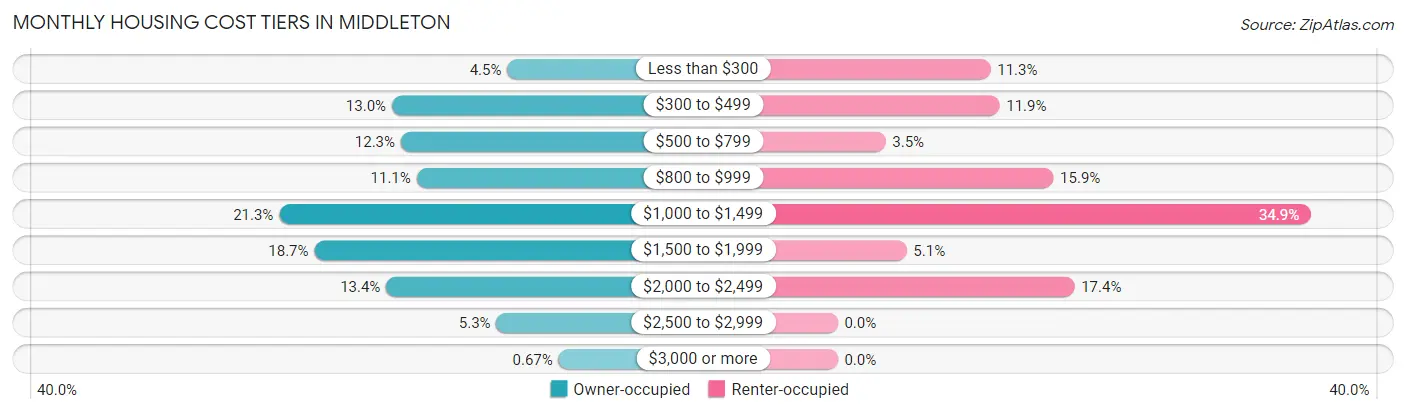
| Monthly Cost | Owner-occupied | Renter-occupied |
| Less than $300 | 127 (4.4%) | 51 (11.3%) |
| $300 to $499 | 370 (13.0%) | 54 (11.9%) |
| $500 to $799 | 351 (12.3%) | 16 (3.5%) |
| $800 to $999 | 318 (11.1%) | 72 (15.9%) |
| $1,000 to $1,499 | 607 (21.2%) | 158 (34.9%) |
| $1,500 to $1,999 | 533 (18.7%) | 23 (5.1%) |
| $2,000 to $2,499 | 382 (13.4%) | 79 (17.4%) |
| $2,500 to $2,999 | 150 (5.2%) | 0 (0.0%) |
| $3,000 or more | 19 (0.7%) | 0 (0.0%) |
| Total | 2,857 (100.0%) | 453 (100.0%) |
Physical Housing Characteristics in Middleton
Housing Structures in Middleton
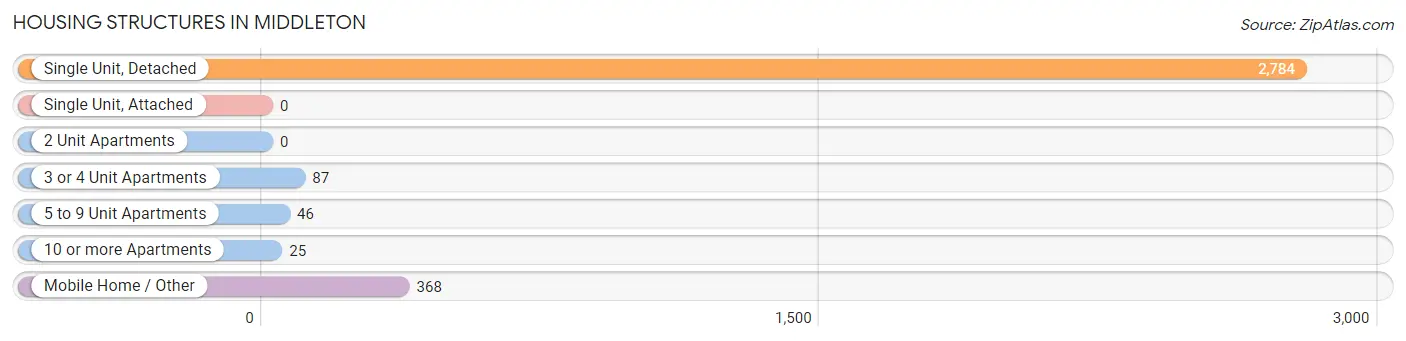
| Structure Type | # Housing Units | % Housing Units |
| Single Unit, Detached | 2,784 | 84.1% |
| Single Unit, Attached | 0 | 0.0% |
| 2 Unit Apartments | 0 | 0.0% |
| 3 or 4 Unit Apartments | 87 | 2.6% |
| 5 to 9 Unit Apartments | 46 | 1.4% |
| 10 or more Apartments | 25 | 0.8% |
| Mobile Home / Other | 368 | 11.1% |
| Total | 3,310 | 100.0% |
Housing Structures by Occupancy in Middleton
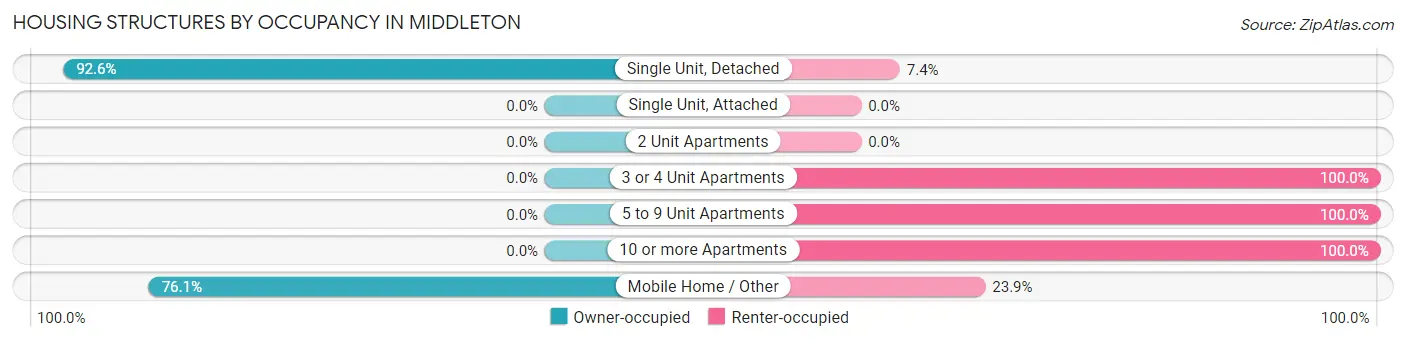
| Structure Type | Owner-occupied | Renter-occupied |
| Single Unit, Detached | 2,577 (92.6%) | 207 (7.4%) |
| Single Unit, Attached | 0 (0.0%) | 0 (0.0%) |
| 2 Unit Apartments | 0 (0.0%) | 0 (0.0%) |
| 3 or 4 Unit Apartments | 0 (0.0%) | 87 (100.0%) |
| 5 to 9 Unit Apartments | 0 (0.0%) | 46 (100.0%) |
| 10 or more Apartments | 0 (0.0%) | 25 (100.0%) |
| Mobile Home / Other | 280 (76.1%) | 88 (23.9%) |
| Total | 2,857 (86.3%) | 453 (13.7%) |
Housing Structures by Number of Rooms in Middleton
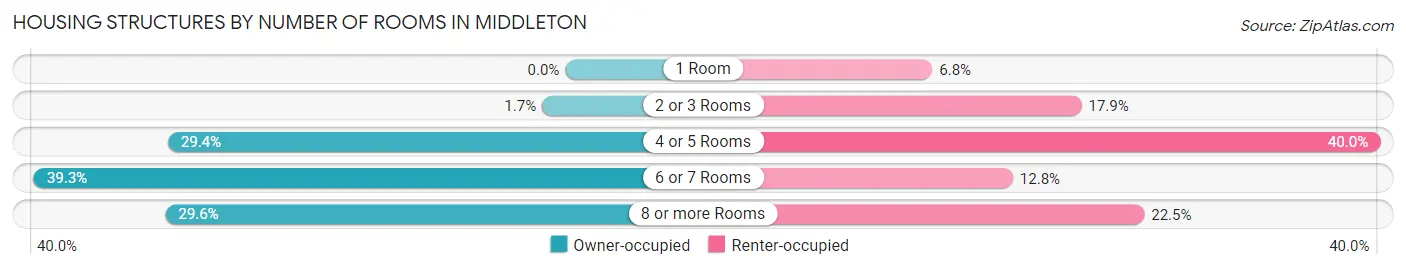
| Number of Rooms | Owner-occupied | Renter-occupied |
| 1 Room | 0 (0.0%) | 31 (6.8%) |
| 2 or 3 Rooms | 49 (1.7%) | 81 (17.9%) |
| 4 or 5 Rooms | 840 (29.4%) | 181 (40.0%) |
| 6 or 7 Rooms | 1,123 (39.3%) | 58 (12.8%) |
| 8 or more Rooms | 845 (29.6%) | 102 (22.5%) |
| Total | 2,857 (100.0%) | 453 (100.0%) |
Housing Structure by Heating Type in Middleton
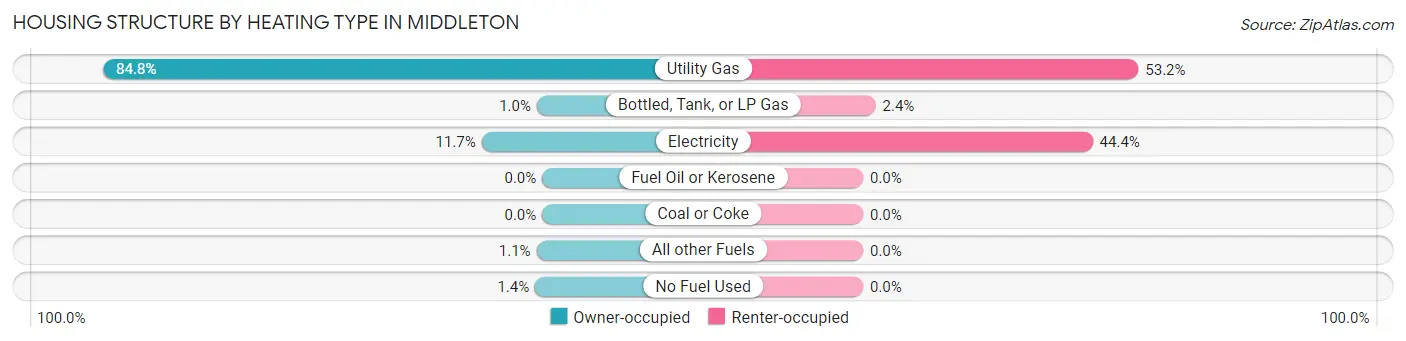
| Heating Type | Owner-occupied | Renter-occupied |
| Utility Gas | 2,424 (84.8%) | 241 (53.2%) |
| Bottled, Tank, or LP Gas | 29 (1.0%) | 11 (2.4%) |
| Electricity | 334 (11.7%) | 201 (44.4%) |
| Fuel Oil or Kerosene | 0 (0.0%) | 0 (0.0%) |
| Coal or Coke | 0 (0.0%) | 0 (0.0%) |
| All other Fuels | 31 (1.1%) | 0 (0.0%) |
| No Fuel Used | 39 (1.4%) | 0 (0.0%) |
| Total | 2,857 (100.0%) | 453 (100.0%) |
Household Vehicle Usage in Middleton
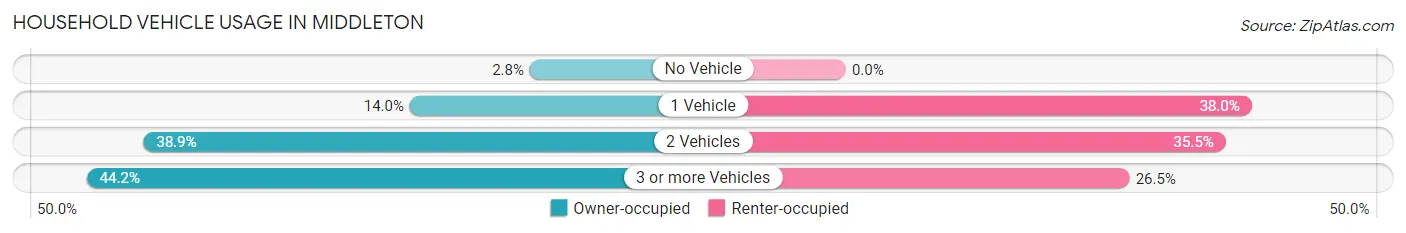
| Vehicles per Household | Owner-occupied | Renter-occupied |
| No Vehicle | 81 (2.8%) | 0 (0.0%) |
| 1 Vehicle | 401 (14.0%) | 172 (38.0%) |
| 2 Vehicles | 1,112 (38.9%) | 161 (35.5%) |
| 3 or more Vehicles | 1,263 (44.2%) | 120 (26.5%) |
| Total | 2,857 (100.0%) | 453 (100.0%) |
Real Estate & Mortgages in Middleton
Real Estate and Mortgage Overview in Middleton
| Characteristic | Without Mortgage | With Mortgage |
| Housing Units | 786 | 2,071 |
| Median Property Value | $280,600 | $300,600 |
| Median Household Income | $47,017 | $249 |
| Monthly Housing Costs | $447 | $19 |
| Real Estate Taxes | $1,886 | $15 |
Property Value by Mortgage Status in Middleton
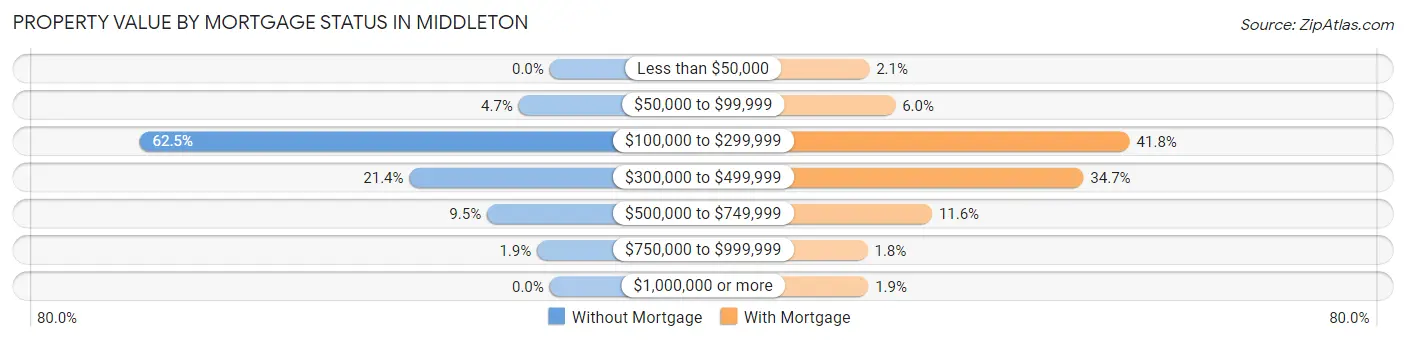
| Property Value | Without Mortgage | With Mortgage |
| Less than $50,000 | 0 (0.0%) | 43 (2.1%) |
| $50,000 to $99,999 | 37 (4.7%) | 125 (6.0%) |
| $100,000 to $299,999 | 491 (62.5%) | 865 (41.8%) |
| $300,000 to $499,999 | 168 (21.4%) | 719 (34.7%) |
| $500,000 to $749,999 | 75 (9.5%) | 241 (11.6%) |
| $750,000 to $999,999 | 15 (1.9%) | 38 (1.8%) |
| $1,000,000 or more | 0 (0.0%) | 40 (1.9%) |
| Total | 786 (100.0%) | 2,071 (100.0%) |
Household Income by Mortgage Status in Middleton
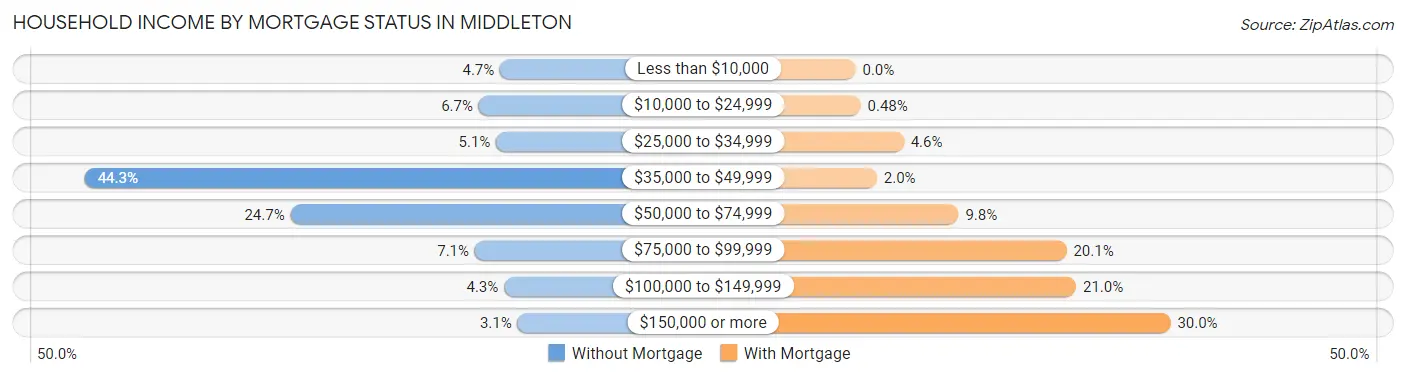
| Household Income | Without Mortgage | With Mortgage |
| Less than $10,000 | 37 (4.7%) | 0 (0.0%) |
| $10,000 to $24,999 | 53 (6.7%) | 10 (0.5%) |
| $25,000 to $34,999 | 40 (5.1%) | 95 (4.6%) |
| $35,000 to $49,999 | 348 (44.3%) | 42 (2.0%) |
| $50,000 to $74,999 | 194 (24.7%) | 203 (9.8%) |
| $75,000 to $99,999 | 56 (7.1%) | 416 (20.1%) |
| $100,000 to $149,999 | 34 (4.3%) | 435 (21.0%) |
| $150,000 or more | 24 (3.0%) | 621 (30.0%) |
| Total | 786 (100.0%) | 2,071 (100.0%) |
Property Value to Household Income Ratio in Middleton
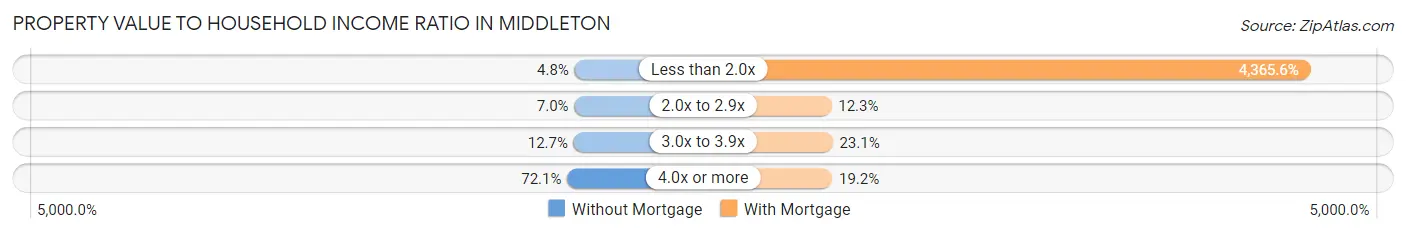
| Value-to-Income Ratio | Without Mortgage | With Mortgage |
| Less than 2.0x | 38 (4.8%) | 90,411 (4,365.6%) |
| 2.0x to 2.9x | 55 (7.0%) | 255 (12.3%) |
| 3.0x to 3.9x | 100 (12.7%) | 479 (23.1%) |
| 4.0x or more | 567 (72.1%) | 398 (19.2%) |
| Total | 786 (100.0%) | 2,071 (100.0%) |
Real Estate Taxes by Mortgage Status in Middleton
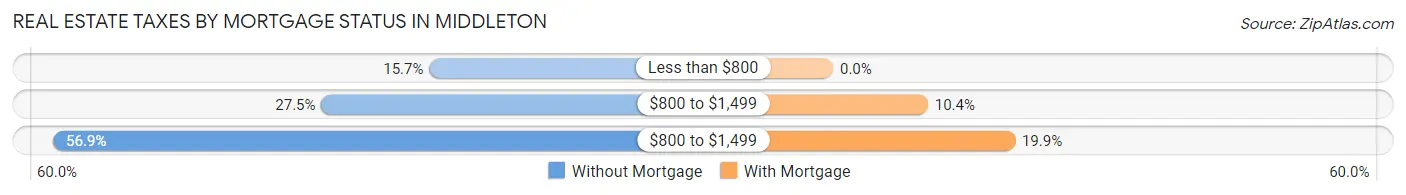
| Property Taxes | Without Mortgage | With Mortgage |
| Less than $800 | 123 (15.7%) | 0 (0.0%) |
| $800 to $1,499 | 216 (27.5%) | 215 (10.4%) |
| $800 to $1,499 | 447 (56.9%) | 413 (19.9%) |
| Total | 786 (100.0%) | 2,071 (100.0%) |
Health & Disability in Middleton
Health Insurance Coverage by Age in Middleton
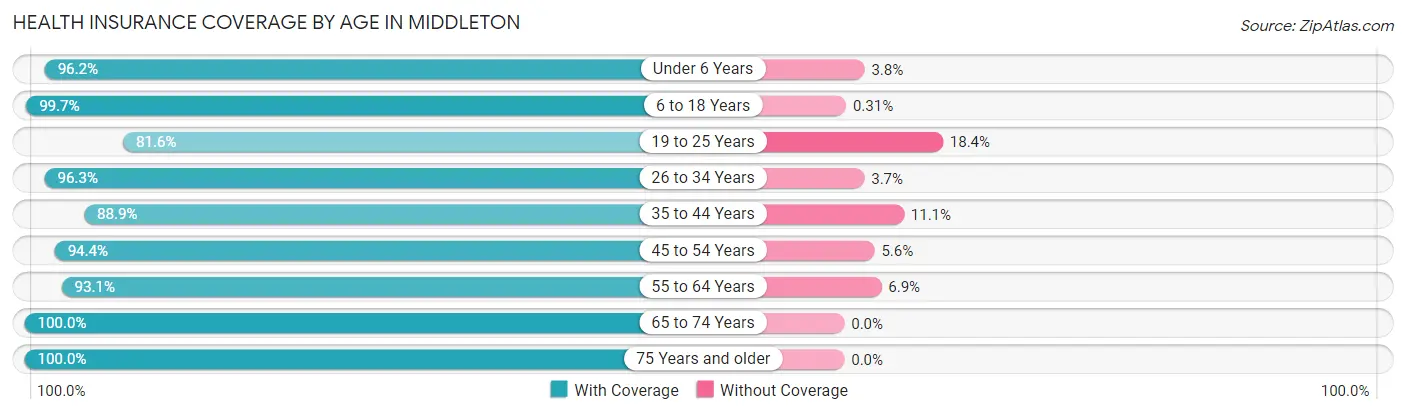
| Age Bracket | With Coverage | Without Coverage |
| Under 6 Years | 820 (96.2%) | 32 (3.8%) |
| 6 to 18 Years | 2,226 (99.7%) | 7 (0.3%) |
| 19 to 25 Years | 724 (81.6%) | 163 (18.4%) |
| 26 to 34 Years | 801 (96.3%) | 31 (3.7%) |
| 35 to 44 Years | 1,392 (88.9%) | 174 (11.1%) |
| 45 to 54 Years | 772 (94.4%) | 46 (5.6%) |
| 55 to 64 Years | 916 (93.1%) | 68 (6.9%) |
| 65 to 74 Years | 1,006 (100.0%) | 0 (0.0%) |
| 75 Years and older | 424 (100.0%) | 0 (0.0%) |
| Total | 9,081 (94.6%) | 521 (5.4%) |
Health Insurance Coverage by Citizenship Status in Middleton
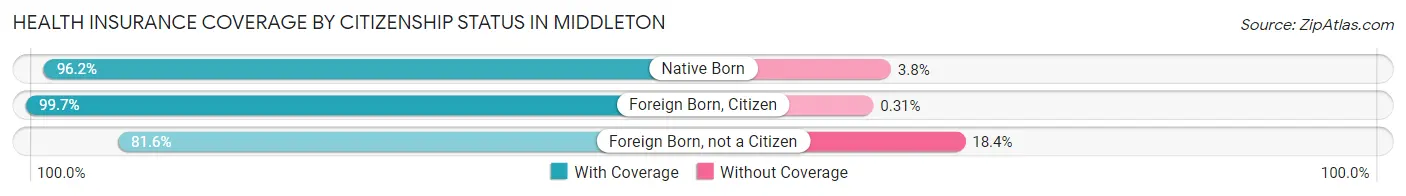
| Citizenship Status | With Coverage | Without Coverage |
| Native Born | 820 (96.2%) | 32 (3.8%) |
| Foreign Born, Citizen | 2,226 (99.7%) | 7 (0.3%) |
| Foreign Born, not a Citizen | 724 (81.6%) | 163 (18.4%) |
Health Insurance Coverage by Household Income in Middleton
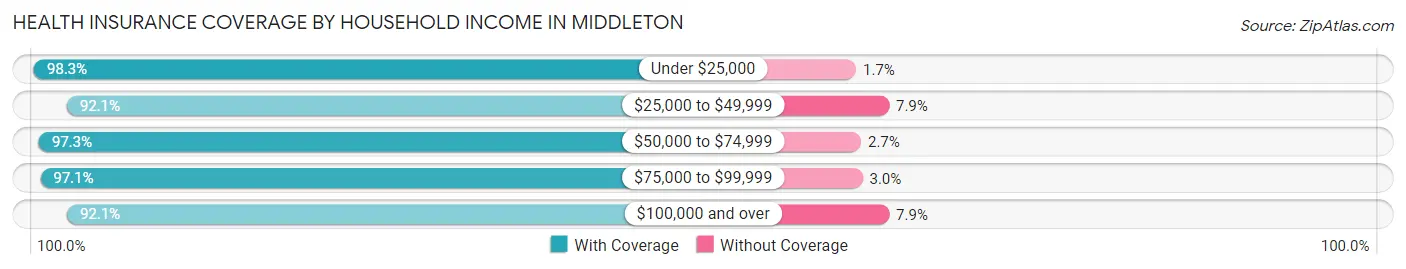
| Household Income | With Coverage | Without Coverage |
| Under $25,000 | 1,072 (98.3%) | 19 (1.7%) |
| $25,000 to $49,999 | 1,269 (92.1%) | 109 (7.9%) |
| $50,000 to $74,999 | 1,570 (97.3%) | 43 (2.7%) |
| $75,000 to $99,999 | 1,711 (97.1%) | 52 (2.9%) |
| $100,000 and over | 3,455 (92.1%) | 298 (7.9%) |
Public vs Private Health Insurance Coverage by Age in Middleton
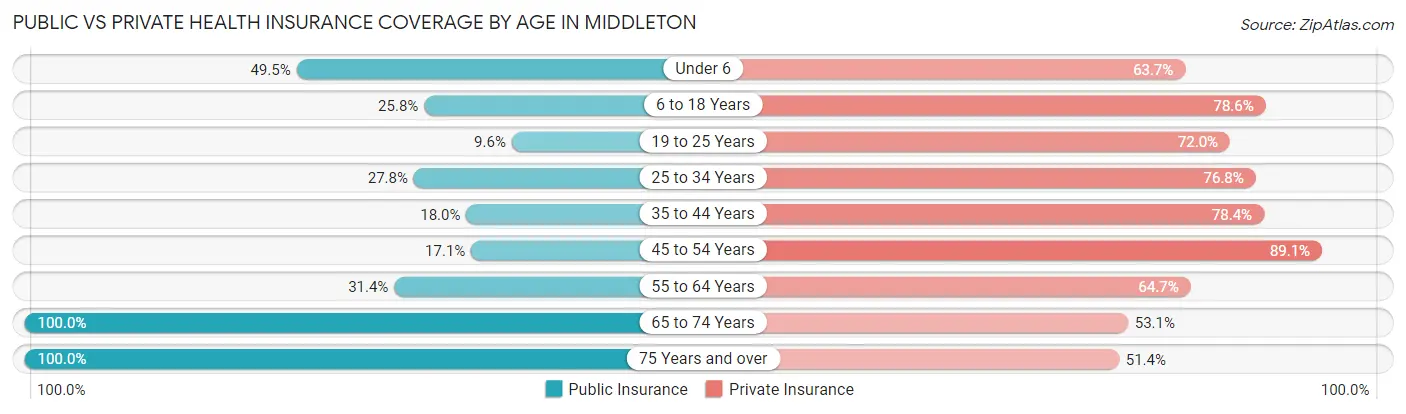
| Age Bracket | Public Insurance | Private Insurance |
| Under 6 | 422 (49.5%) | 543 (63.7%) |
| 6 to 18 Years | 577 (25.8%) | 1,756 (78.6%) |
| 19 to 25 Years | 85 (9.6%) | 639 (72.0%) |
| 25 to 34 Years | 231 (27.8%) | 639 (76.8%) |
| 35 to 44 Years | 282 (18.0%) | 1,227 (78.3%) |
| 45 to 54 Years | 140 (17.1%) | 729 (89.1%) |
| 55 to 64 Years | 309 (31.4%) | 637 (64.7%) |
| 65 to 74 Years | 1,006 (100.0%) | 534 (53.1%) |
| 75 Years and over | 424 (100.0%) | 218 (51.4%) |
| Total | 3,476 (36.2%) | 6,922 (72.1%) |
Disability Status by Sex by Age in Middleton
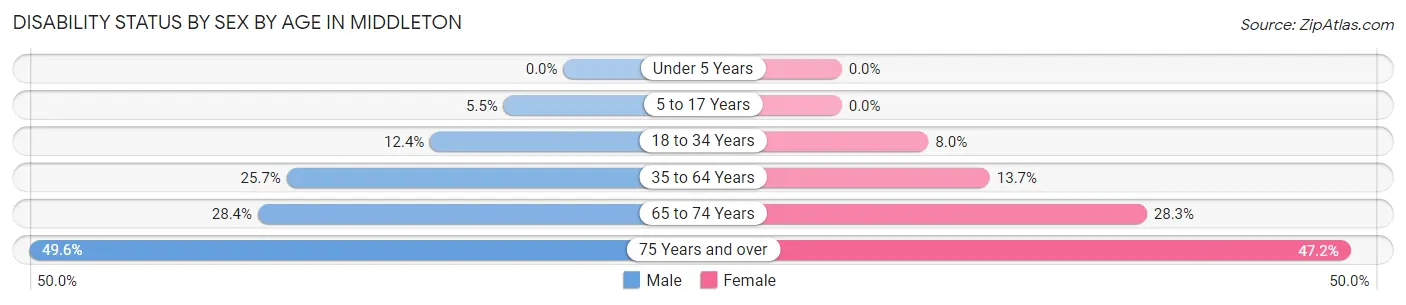
| Age Bracket | Male | Female |
| Under 5 Years | 0 (0.0%) | 0 (0.0%) |
| 5 to 17 Years | 71 (5.5%) | 0 (0.0%) |
| 18 to 34 Years | 110 (12.4%) | 81 (8.0%) |
| 35 to 64 Years | 422 (25.7%) | 237 (13.7%) |
| 65 to 74 Years | 161 (28.3%) | 124 (28.3%) |
| 75 Years and over | 59 (49.6%) | 144 (47.2%) |
Disability Class by Sex by Age in Middleton
Disability Class: Hearing Difficulty
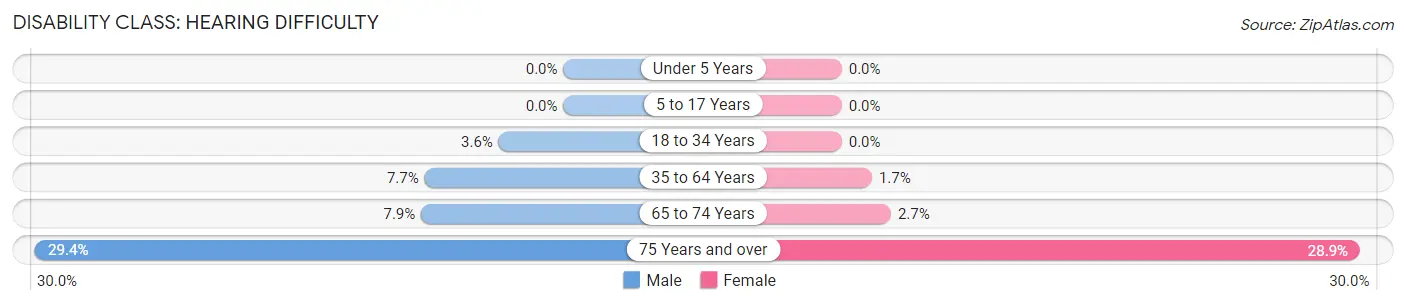
| Age Bracket | Male | Female |
| Under 5 Years | 0 (0.0%) | 0 (0.0%) |
| 5 to 17 Years | 0 (0.0%) | 0 (0.0%) |
| 18 to 34 Years | 32 (3.6%) | 0 (0.0%) |
| 35 to 64 Years | 127 (7.7%) | 29 (1.7%) |
| 65 to 74 Years | 45 (7.9%) | 12 (2.7%) |
| 75 Years and over | 35 (29.4%) | 88 (28.8%) |
Disability Class: Vision Difficulty
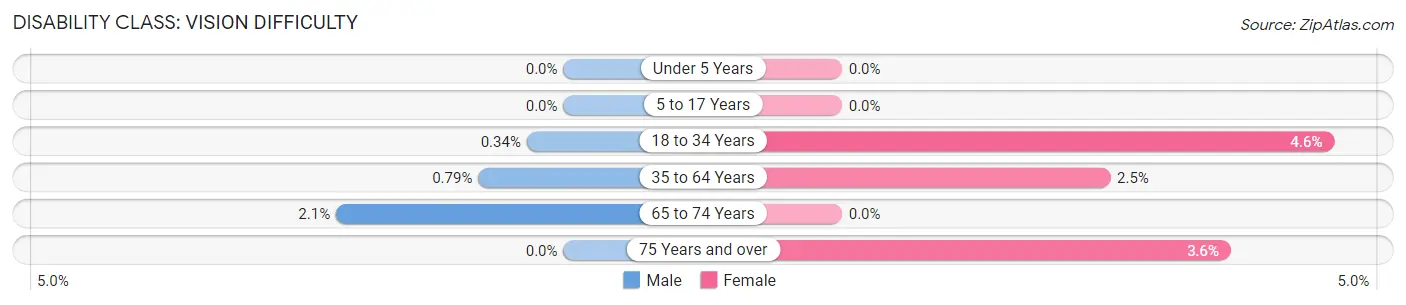
| Age Bracket | Male | Female |
| Under 5 Years | 0 (0.0%) | 0 (0.0%) |
| 5 to 17 Years | 0 (0.0%) | 0 (0.0%) |
| 18 to 34 Years | 3 (0.3%) | 46 (4.6%) |
| 35 to 64 Years | 13 (0.8%) | 43 (2.5%) |
| 65 to 74 Years | 12 (2.1%) | 0 (0.0%) |
| 75 Years and over | 0 (0.0%) | 11 (3.6%) |
Disability Class: Cognitive Difficulty
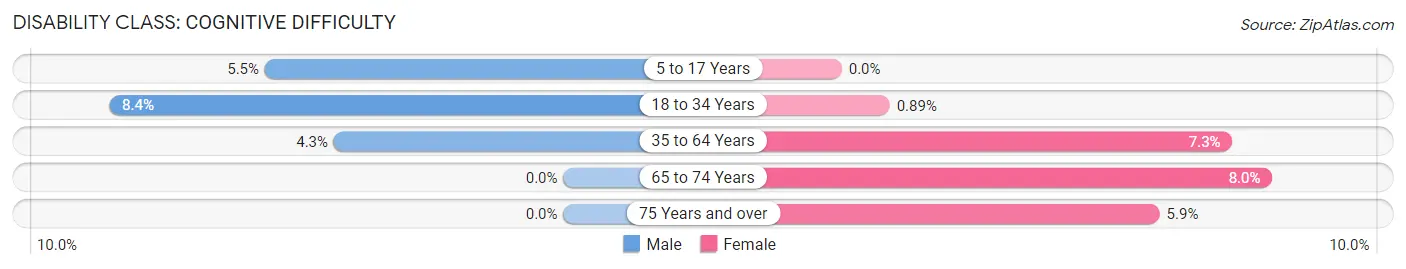
| Age Bracket | Male | Female |
| 5 to 17 Years | 71 (5.5%) | 0 (0.0%) |
| 18 to 34 Years | 75 (8.4%) | 9 (0.9%) |
| 35 to 64 Years | 70 (4.3%) | 125 (7.2%) |
| 65 to 74 Years | 0 (0.0%) | 35 (8.0%) |
| 75 Years and over | 0 (0.0%) | 18 (5.9%) |
Disability Class: Ambulatory Difficulty
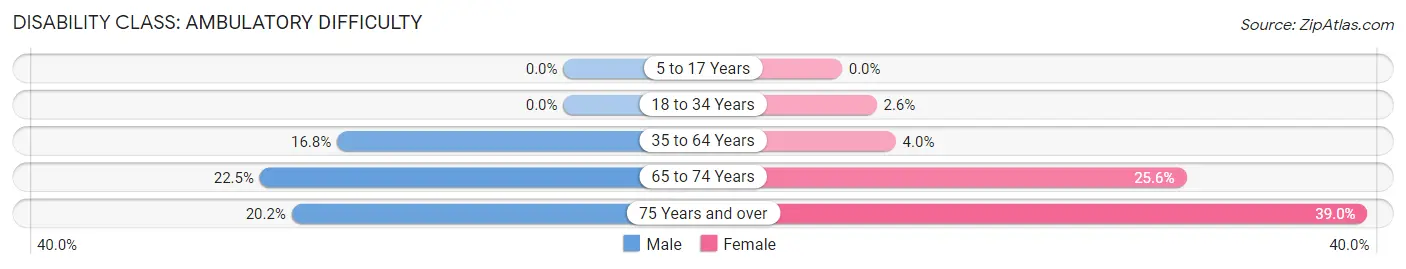
| Age Bracket | Male | Female |
| 5 to 17 Years | 0 (0.0%) | 0 (0.0%) |
| 18 to 34 Years | 0 (0.0%) | 26 (2.6%) |
| 35 to 64 Years | 276 (16.8%) | 69 (4.0%) |
| 65 to 74 Years | 128 (22.5%) | 112 (25.6%) |
| 75 Years and over | 24 (20.2%) | 119 (39.0%) |
Disability Class: Self-Care Difficulty
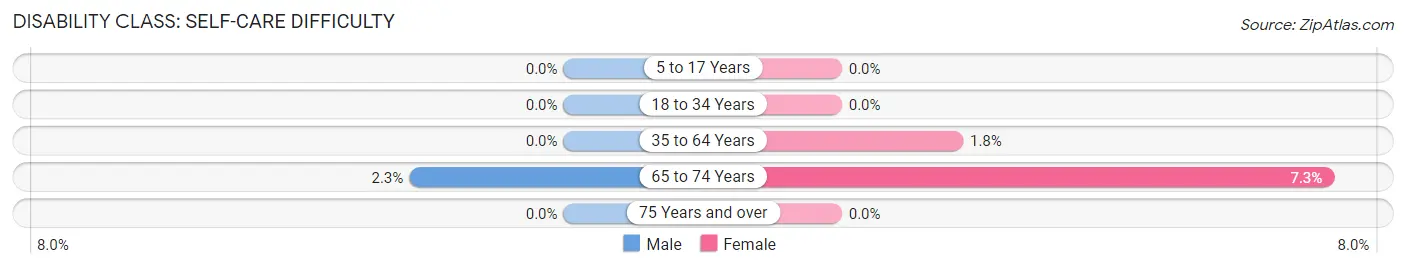
| Age Bracket | Male | Female |
| 5 to 17 Years | 0 (0.0%) | 0 (0.0%) |
| 18 to 34 Years | 0 (0.0%) | 0 (0.0%) |
| 35 to 64 Years | 0 (0.0%) | 31 (1.8%) |
| 65 to 74 Years | 13 (2.3%) | 32 (7.3%) |
| 75 Years and over | 0 (0.0%) | 0 (0.0%) |
Technology Access in Middleton
Computing Device Access in Middleton
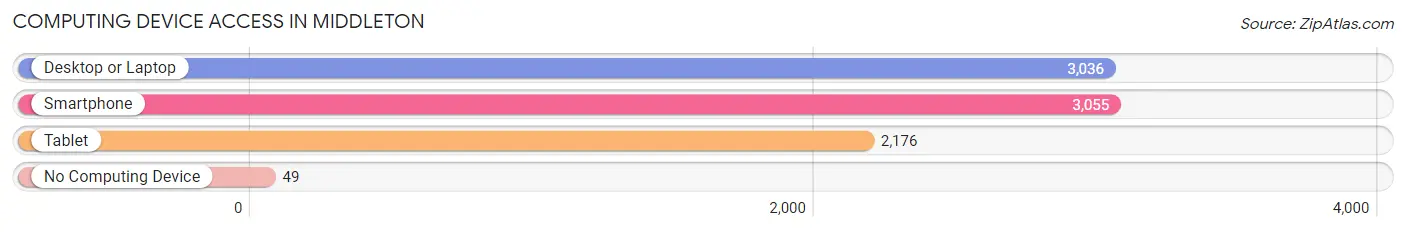
| Device Type | # Households | % Households |
| Desktop or Laptop | 3,036 | 91.7% |
| Smartphone | 3,055 | 92.3% |
| Tablet | 2,176 | 65.7% |
| No Computing Device | 49 | 1.5% |
| Total | 3,310 | 100.0% |
Internet Access in Middleton
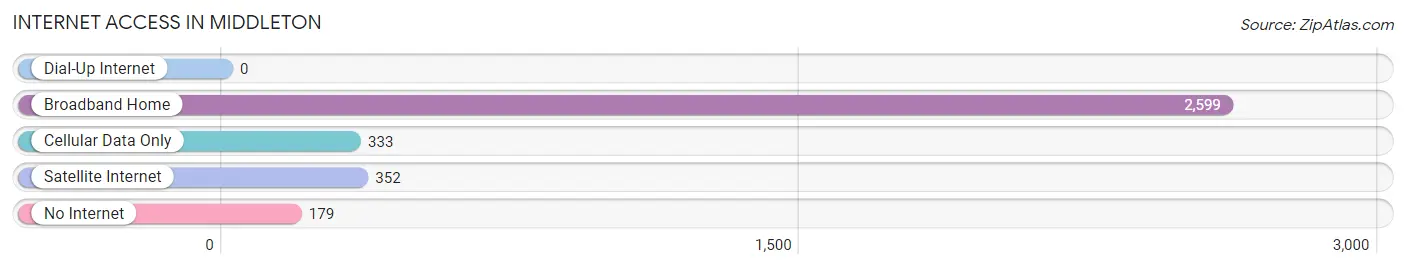
| Internet Type | # Households | % Households |
| Dial-Up Internet | 0 | 0.0% |
| Broadband Home | 2,599 | 78.5% |
| Cellular Data Only | 333 | 10.1% |
| Satellite Internet | 352 | 10.6% |
| No Internet | 179 | 5.4% |
| Total | 3,310 | 100.0% |
Middleton Summary
Middleton, Idaho is a small city located in Canyon County, Idaho. It is situated in the Treasure Valley, approximately 20 miles west of Boise. The city has a population of approximately 8,000 people and is part of the Boise metropolitan area.
History
Middleton was founded in 1883 by a group of settlers from the Midwest. The city was named after the Middleton family, who were among the first settlers. The city was incorporated in 1891 and has since grown to become a thriving community.
Geography
Middleton is located in the Treasure Valley, which is a region of the Snake River Plain. The city is situated in a flat area, with the Boise River running through it. The city is surrounded by agricultural land, with the Boise Mountains to the east and the Owyhee Mountains to the west.
Economy
Middleton’s economy is largely based on agriculture and manufacturing. The city is home to several large agricultural companies, including J.R. Simplot Company, which is one of the largest potato producers in the world. The city also has a number of manufacturing companies, including Boise Cascade, which produces wood products.
Demographics
As of the 2010 census, Middleton had a population of 8,000 people. The racial makeup of the city was 90.2% White, 0.7% African American, 0.7% Native American, 0.7% Asian, 0.2% Pacific Islander, and 6.2% from other races. The median household income was $45,000, and the median family income was $50,000.
Conclusion
Middleton, Idaho is a small city located in Canyon County, Idaho. It is situated in the Treasure Valley, approximately 20 miles west of Boise. The city has a population of approximately 8,000 people and is part of the Boise metropolitan area. Middleton’s economy is largely based on agriculture and manufacturing, and the city is home to several large agricultural companies and manufacturing companies. As of the 2010 census, Middleton had a population of 8,000 people, with a median household income of $45,000 and a median family income of $50,000.
Common Questions
What is Per Capita Income in Middleton?
Per Capita income in Middleton is $28,518.
What is the Median Family Income in Middleton?
Median Family Income in Middleton is $86,739.
What is the Median Household income in Middleton?
Median Household Income in Middleton is $68,947.
What is Income or Wage Gap in Middleton?
Income or Wage Gap in Middleton is 43.0%.
Women in Middleton earn 57.0 cents for every dollar earned by a man.
What is Inequality or Gini Index in Middleton?
Inequality or Gini Index in Middleton is 0.36.
What is the Total Population of Middleton?
Total Population of Middleton is 9,614.
What is the Total Male Population of Middleton?
Total Male Population of Middleton is 4,945.
What is the Total Female Population of Middleton?
Total Female Population of Middleton is 4,669.
What is the Ratio of Males per 100 Females in Middleton?
There are 105.91 Males per 100 Females in Middleton.
What is the Ratio of Females per 100 Males in Middleton?
There are 94.42 Females per 100 Males in Middleton.
What is the Median Population Age in Middleton?
Median Population Age in Middleton is 34.9 Years.
What is the Average Family Size in Middleton
Average Family Size in Middleton is 3.5 People.
What is the Average Household Size in Middleton
Average Household Size in Middleton is 2.9 People.
How Large is the Labor Force in Middleton?
There are 4,567 People in the Labor Forcein in Middleton.
What is the Percentage of People in the Labor Force in Middleton?
63.7% of People are in the Labor Force in Middleton.
What is the Unemployment Rate in Middleton?
Unemployment Rate in Middleton is 2.5%.