Idaho County, ID Map & Demographics
Idaho County Map
Idaho County Overview
$29,657
PER CAPITA INCOME
$66,406
AVG FAMILY INCOME
$54,745
AVG HOUSEHOLD INCOME
29.9%
WAGE / INCOME GAP [ % ]
70.1¢/ $1
WAGE / INCOME GAP [ $ ]
$7,512
FAMILY INCOME DEFICIT
0.43
INEQUALITY / GINI INDEX
16,787
TOTAL POPULATION
8,835
MALE POPULATION
7,952
FEMALE POPULATION
111.10
MALES / 100 FEMALES
90.01
FEMALES / 100 MALES
49.5
MEDIAN AGE
3.0
AVG FAMILY SIZE
2.4
AVG HOUSEHOLD SIZE
6,889
LABOR FORCE [ PEOPLE ]
49.6%
PERCENT IN LABOR FORCE
4.3%
UNEMPLOYMENT RATE
Idaho County Area Codes
Income in Idaho County
Income Overview in Idaho County
Per Capita Income in Idaho County is $29,657, while median incomes of families and households are $66,406 and $54,745 respectively.
| Characteristic | Number | Measure |
| Per Capita Income | 16,787 | $29,657 |
| Median Family Income | 4,556 | $66,406 |
| Mean Family Income | 4,556 | $84,431 |
| Median Household Income | 6,603 | $54,745 |
| Mean Household Income | 6,603 | $70,728 |
| Income Deficit | 4,556 | $7,512 |
| Wage / Income Gap (%) | 16,787 | 29.92% |
| Wage / Income Gap ($) | 16,787 | 70.08¢ per $1 |
| Gini / Inequality Index | 16,787 | 0.43 |
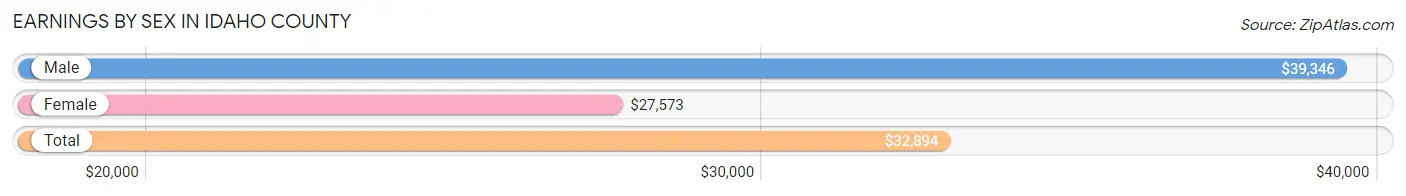
Earnings by Sex in Idaho County
Average Earnings in Idaho County are $32,894, $39,346 for men and $27,573 for women, a difference of 29.9%.
| Sex | Number | Average Earnings |
| Male | 4,388 (57.2%) | $39,346 |
| Female | 3,280 (42.8%) | $27,573 |
| Total | 7,668 (100.0%) | $32,894 |
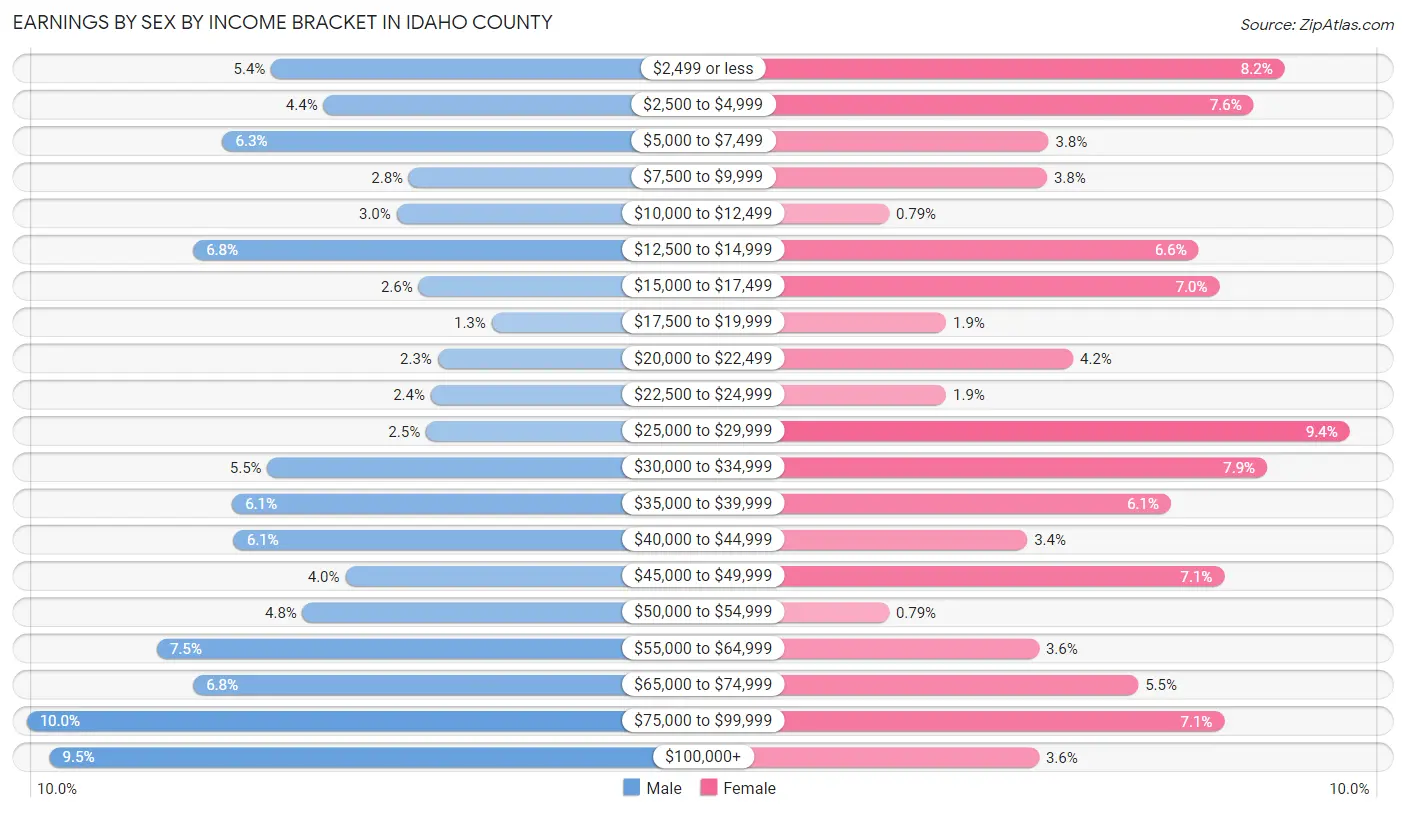
Earnings by Sex by Income Bracket in Idaho County
The most common earnings brackets in Idaho County are $75,000 to $99,999 for men (437 | 10.0%) and $25,000 to $29,999 for women (309 | 9.4%).
| Income | Male | Female |
| $2,499 or less | 236 (5.4%) | 269 (8.2%) |
| $2,500 to $4,999 | 193 (4.4%) | 250 (7.6%) |
| $5,000 to $7,499 | 276 (6.3%) | 124 (3.8%) |
| $7,500 to $9,999 | 123 (2.8%) | 123 (3.7%) |
| $10,000 to $12,499 | 133 (3.0%) | 26 (0.8%) |
| $12,500 to $14,999 | 300 (6.8%) | 216 (6.6%) |
| $15,000 to $17,499 | 115 (2.6%) | 229 (7.0%) |
| $17,500 to $19,999 | 55 (1.3%) | 61 (1.9%) |
| $20,000 to $22,499 | 99 (2.3%) | 139 (4.2%) |
| $22,500 to $24,999 | 105 (2.4%) | 61 (1.9%) |
| $25,000 to $29,999 | 109 (2.5%) | 309 (9.4%) |
| $30,000 to $34,999 | 239 (5.4%) | 258 (7.9%) |
| $35,000 to $39,999 | 268 (6.1%) | 199 (6.1%) |
| $40,000 to $44,999 | 267 (6.1%) | 111 (3.4%) |
| $45,000 to $49,999 | 175 (4.0%) | 232 (7.1%) |
| $50,000 to $54,999 | 210 (4.8%) | 26 (0.8%) |
| $55,000 to $64,999 | 330 (7.5%) | 118 (3.6%) |
| $65,000 to $74,999 | 300 (6.8%) | 179 (5.5%) |
| $75,000 to $99,999 | 437 (10.0%) | 232 (7.1%) |
| $100,000+ | 418 (9.5%) | 118 (3.6%) |
| Total | 4,388 (100.0%) | 3,280 (100.0%) |
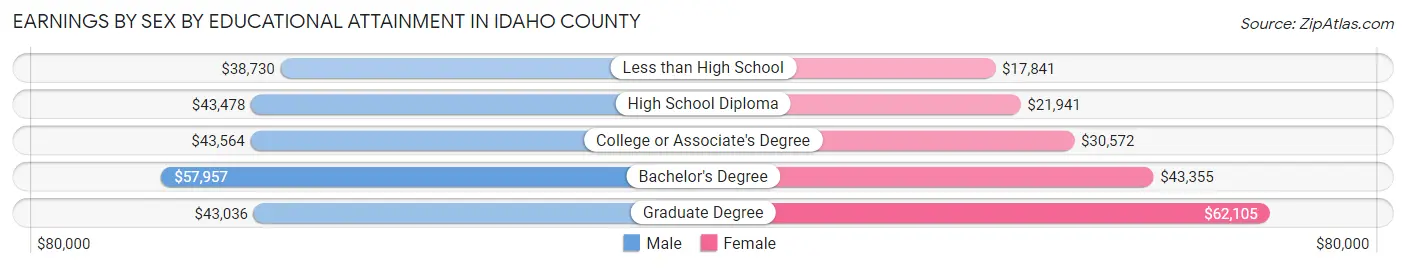
Earnings by Sex by Educational Attainment in Idaho County
Average earnings in Idaho County are $43,959 for men and $30,293 for women, a difference of 31.1%. Men with an educational attainment of bachelor's degree enjoy the highest average annual earnings of $57,957, while those with less than high school education earn the least with $38,730. Women with an educational attainment of graduate degree earn the most with the average annual earnings of $62,105, while those with less than high school education have the smallest earnings of $17,841.
| Educational Attainment | Male Income | Female Income |
| Less than High School | $38,730 | $17,841 |
| High School Diploma | $43,478 | $21,941 |
| College or Associate's Degree | $43,564 | $30,572 |
| Bachelor's Degree | $57,957 | $43,355 |
| Graduate Degree | $43,036 | $62,105 |
| Total | $43,959 | $30,293 |
Family Income in Idaho County
Family Income Brackets in Idaho County
According to the Idaho County family income data, there are 879 families falling into the $50,000 to $74,999 income range, which is the most common income bracket and makes up 19.3% of all families. Conversely, the less than $10,000 income bracket is the least frequent group with only 91 families (2.0%) belonging to this category.
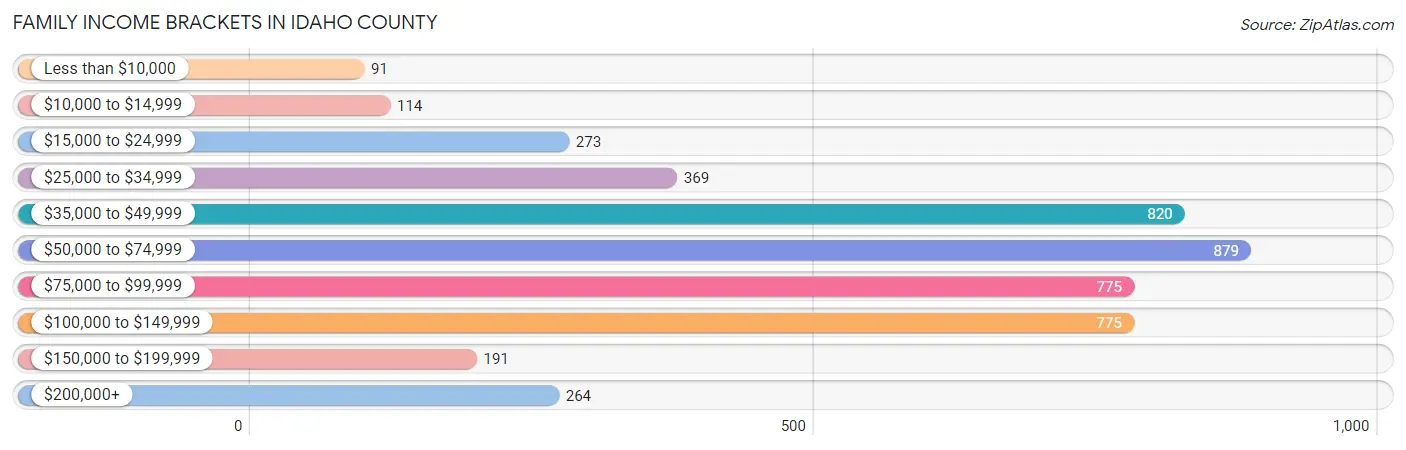
| Income Bracket | # Families | % Families |
| Less than $10,000 | 91 | 2.0% |
| $10,000 to $14,999 | 114 | 2.5% |
| $15,000 to $24,999 | 273 | 6.0% |
| $25,000 to $34,999 | 369 | 8.1% |
| $35,000 to $49,999 | 820 | 18.0% |
| $50,000 to $74,999 | 879 | 19.3% |
| $75,000 to $99,999 | 775 | 17.0% |
| $100,000 to $149,999 | 775 | 17.0% |
| $150,000 to $199,999 | 191 | 4.2% |
| $200,000+ | 264 | 5.8% |
Family Income by Famaliy Size in Idaho County
7+ person families (125 | 2.7%) account for the highest median family income in Idaho County with $93,750 per family, while 2-person families (2,688 | 59.0%) have the highest median income of $29,458 per family member.
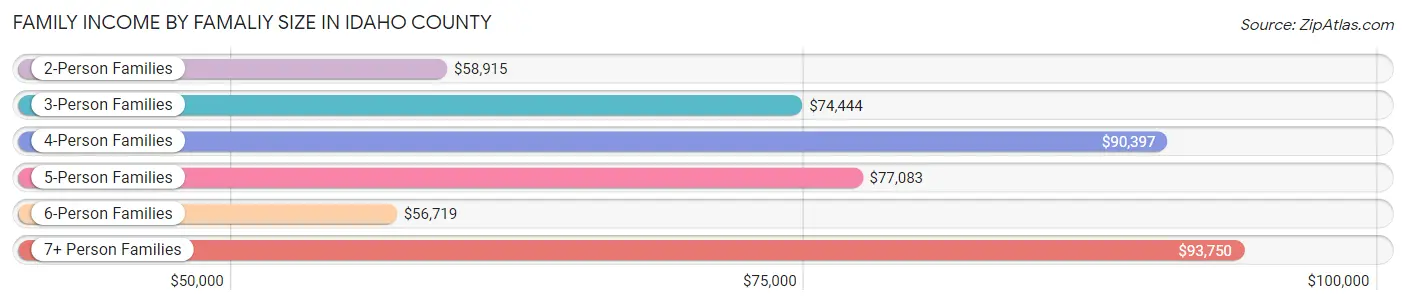
| Income Bracket | # Families | Median Income |
| 2-Person Families | 2,688 (59.0%) | $58,915 |
| 3-Person Families | 652 (14.3%) | $74,444 |
| 4-Person Families | 722 (15.9%) | $90,397 |
| 5-Person Families | 314 (6.9%) | $77,083 |
| 6-Person Families | 55 (1.2%) | $56,719 |
| 7+ Person Families | 125 (2.7%) | $93,750 |
| Total | 4,556 (100.0%) | $66,406 |
Family Income by Number of Earners in Idaho County
The median family income in Idaho County is $66,406, with families comprising 3+ earners (245) having the highest median family income of $125,865, while families with no earners (1,075) have the lowest median family income of $46,384, accounting for 5.4% and 23.6% of families, respectively.
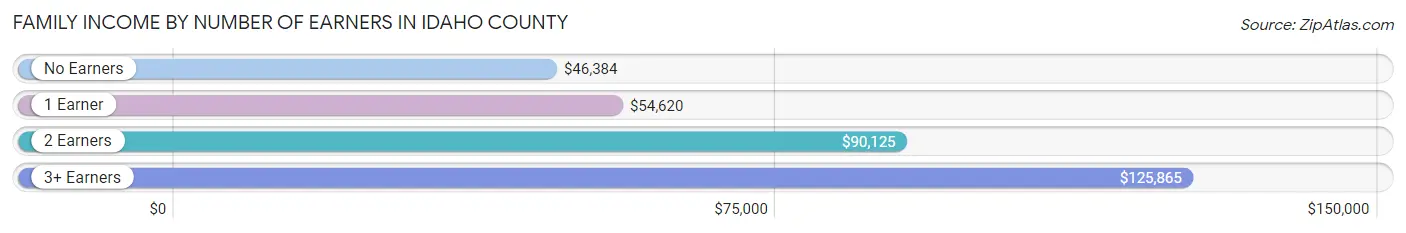
| Number of Earners | # Families | Median Income |
| No Earners | 1,075 (23.6%) | $46,384 |
| 1 Earner | 1,515 (33.3%) | $54,620 |
| 2 Earners | 1,721 (37.8%) | $90,125 |
| 3+ Earners | 245 (5.4%) | $125,865 |
| Total | 4,556 (100.0%) | $66,406 |
Household Income in Idaho County
Household Income Brackets in Idaho County
With 1,175 households falling in the category, the $35,000 to $49,999 income range is the most frequent in Idaho County, accounting for 17.8% of all households. In contrast, only 198 households (3.0%) fall into the $150,000 to $199,999 income bracket, making it the least populous group.
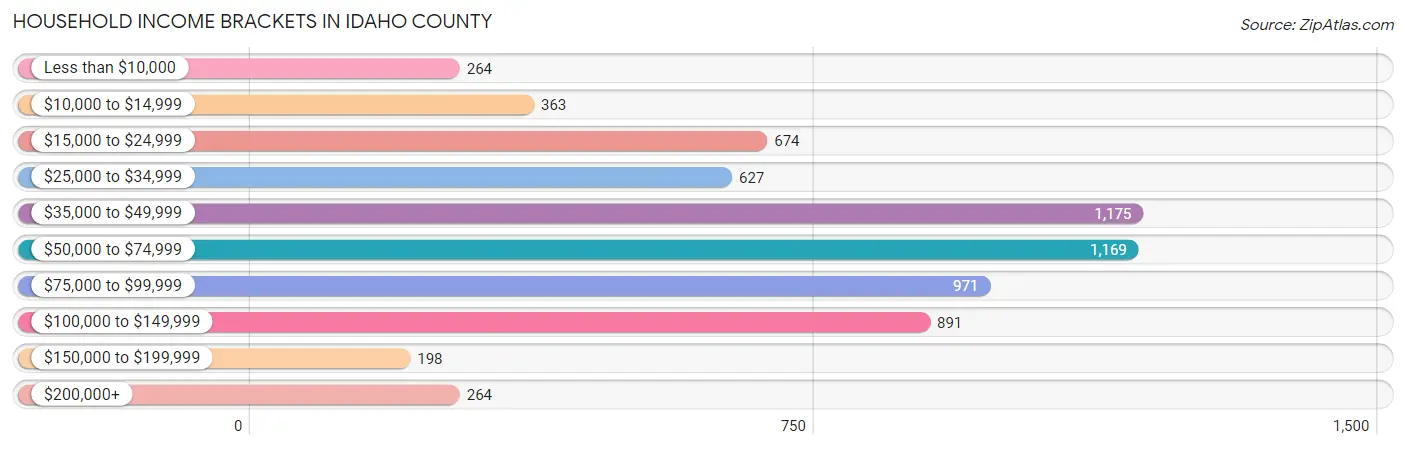
| Income Bracket | # Households | % Households |
| Less than $10,000 | 264 | 4.0% |
| $10,000 to $14,999 | 363 | 5.5% |
| $15,000 to $24,999 | 674 | 10.2% |
| $25,000 to $34,999 | 627 | 9.5% |
| $35,000 to $49,999 | 1,175 | 17.8% |
| $50,000 to $74,999 | 1,169 | 17.7% |
| $75,000 to $99,999 | 971 | 14.7% |
| $100,000 to $149,999 | 891 | 13.5% |
| $150,000 to $199,999 | 198 | 3.0% |
| $200,000+ | 264 | 4.0% |
Household Income by Householder Age in Idaho County
The median household income in Idaho County is $54,745, with the highest median household income of $71,589 found in the 45 to 64 years age bracket for the primary householder. A total of 2,196 households (33.3%) fall into this category. Meanwhile, the 15 to 24 years age bracket for the primary householder has the lowest median household income of $28,816, with 124 households (1.9%) in this group.
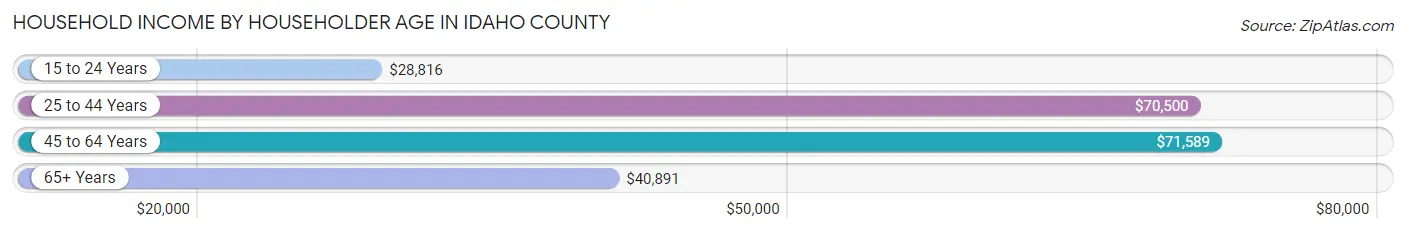
| Income Bracket | # Households | Median Income |
| 15 to 24 Years | 124 (1.9%) | $28,816 |
| 25 to 44 Years | 1,492 (22.6%) | $70,500 |
| 45 to 64 Years | 2,196 (33.3%) | $71,589 |
| 65+ Years | 2,791 (42.3%) | $40,891 |
| Total | 6,603 (100.0%) | $54,745 |
Poverty in Idaho County
Income Below Poverty by Sex and Age in Idaho County
With 9.9% poverty level for males and 10.9% for females among the residents of Idaho County, 12 to 14 year old males and 18 to 24 year old females are the most vulnerable to poverty, with 28 males (19.3%) and 91 females (23.2%) in their respective age groups living below the poverty level.
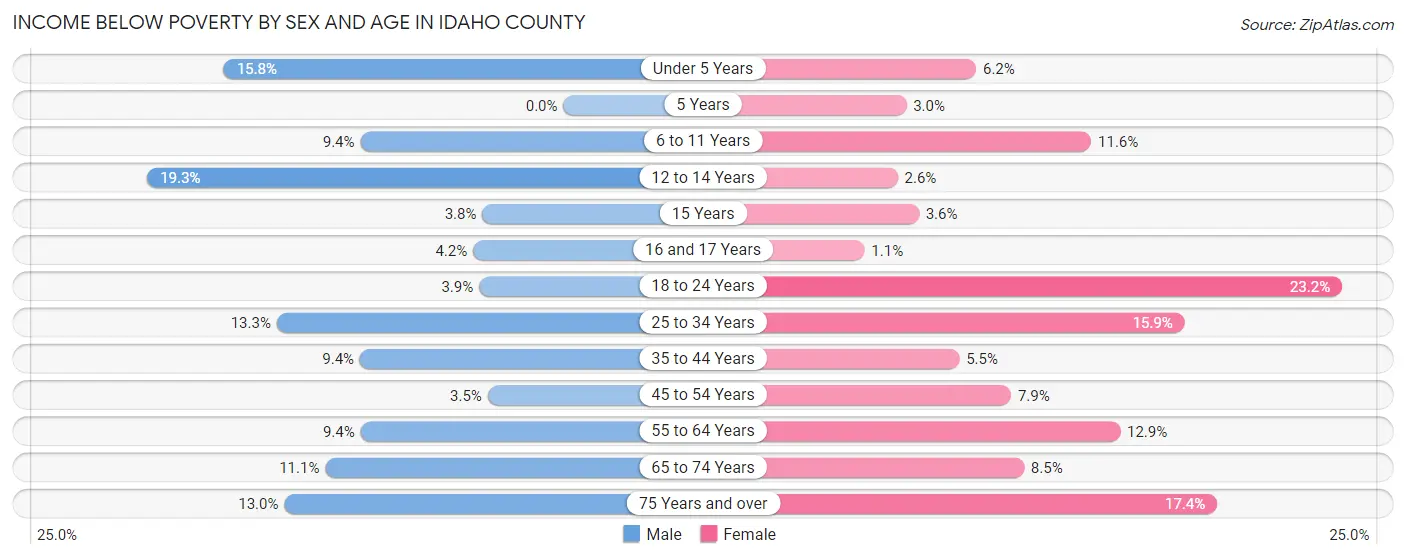
| Age Bracket | Male | Female |
| Under 5 Years | 78 (15.8%) | 21 (6.2%) |
| 5 Years | 0 (0.0%) | 4 (3.0%) |
| 6 to 11 Years | 66 (9.4%) | 64 (11.6%) |
| 12 to 14 Years | 28 (19.3%) | 6 (2.6%) |
| 15 Years | 5 (3.8%) | 4 (3.6%) |
| 16 and 17 Years | 7 (4.2%) | 2 (1.1%) |
| 18 to 24 Years | 20 (3.9%) | 91 (23.2%) |
| 25 to 34 Years | 102 (13.3%) | 122 (15.9%) |
| 35 to 44 Years | 74 (9.4%) | 41 (5.4%) |
| 45 to 54 Years | 28 (3.5%) | 67 (7.9%) |
| 55 to 64 Years | 122 (9.4%) | 182 (12.9%) |
| 65 to 74 Years | 170 (11.1%) | 111 (8.5%) |
| 75 Years and over | 125 (13.0%) | 148 (17.4%) |
| Total | 825 (9.9%) | 863 (10.9%) |
Income Above Poverty by Sex and Age in Idaho County
According to the poverty statistics in Idaho County, males aged 5 years and females aged 16 and 17 years are the age groups that are most secure financially, with 100.0% of males and 99.0% of females in these age groups living above the poverty line.
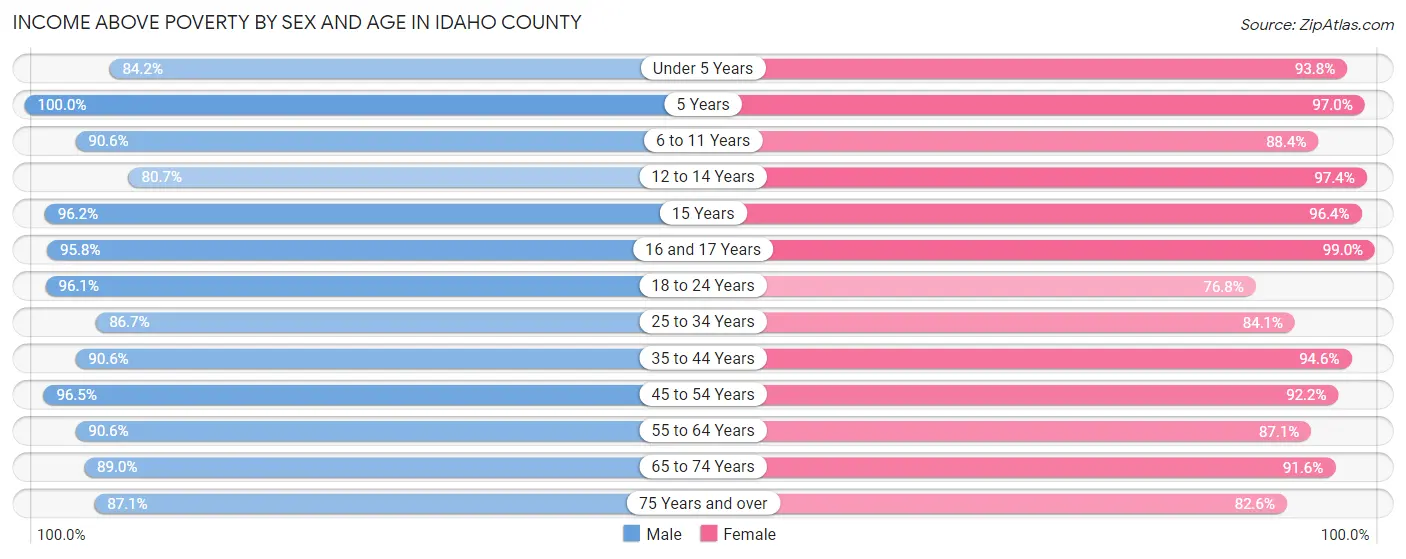
| Age Bracket | Male | Female |
| Under 5 Years | 417 (84.2%) | 316 (93.8%) |
| 5 Years | 46 (100.0%) | 130 (97.0%) |
| 6 to 11 Years | 635 (90.6%) | 489 (88.4%) |
| 12 to 14 Years | 117 (80.7%) | 226 (97.4%) |
| 15 Years | 128 (96.2%) | 108 (96.4%) |
| 16 and 17 Years | 160 (95.8%) | 188 (99.0%) |
| 18 to 24 Years | 492 (96.1%) | 301 (76.8%) |
| 25 to 34 Years | 665 (86.7%) | 645 (84.1%) |
| 35 to 44 Years | 710 (90.6%) | 711 (94.6%) |
| 45 to 54 Years | 769 (96.5%) | 786 (92.1%) |
| 55 to 64 Years | 1,175 (90.6%) | 1,228 (87.1%) |
| 65 to 74 Years | 1,368 (88.9%) | 1,203 (91.5%) |
| 75 Years and over | 840 (87.1%) | 702 (82.6%) |
| Total | 7,522 (90.1%) | 7,033 (89.1%) |
Income Below Poverty Among Married-Couple Families in Idaho County
The poverty statistics for married-couple families in Idaho County show that 6.7% or 270 of the total 4,046 families live below the poverty line. Families with 5 or more children have the highest poverty rate of 19.5%, comprising of 16 families. On the other hand, families with 3 or 4 children have the lowest poverty rate of 4.7%, which includes 14 families.
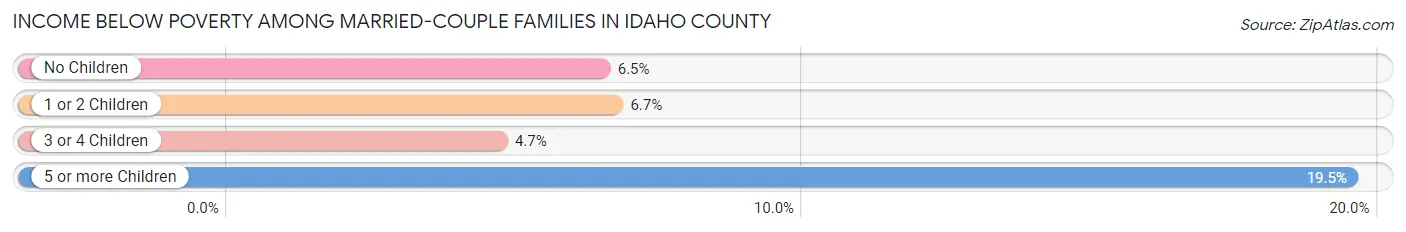
| Children | Above Poverty | Below Poverty |
| No Children | 2,480 (93.5%) | 172 (6.5%) |
| 1 or 2 Children | 946 (93.3%) | 68 (6.7%) |
| 3 or 4 Children | 284 (95.3%) | 14 (4.7%) |
| 5 or more Children | 66 (80.5%) | 16 (19.5%) |
| Total | 3,776 (93.3%) | 270 (6.7%) |
Income Below Poverty Among Single-Parent Households in Idaho County
According to the poverty data in Idaho County, 10.7% or 16 single-father households and 19.1% or 69 single-mother households are living below the poverty line. Among single-father households, those with 1 or 2 children have the highest poverty rate, with 12 households (35.3%) experiencing poverty. Likewise, among single-mother households, those with 1 or 2 children have the highest poverty rate, with 49 households (22.6%) falling below the poverty line.
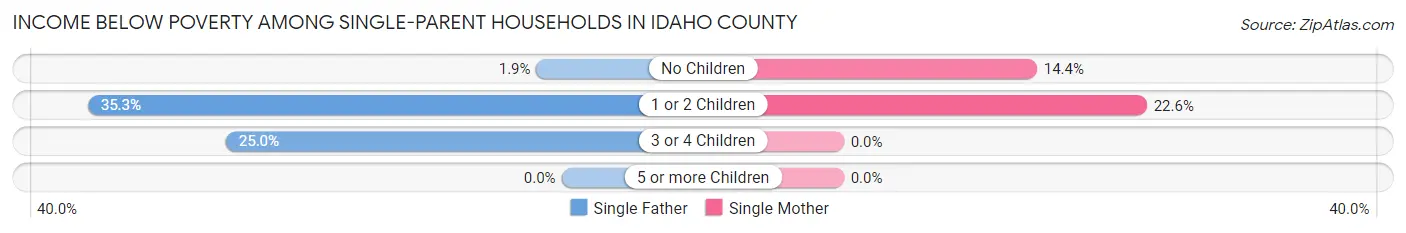
| Children | Single Father | Single Mother |
| No Children | 2 (1.9%) | 20 (14.4%) |
| 1 or 2 Children | 12 (35.3%) | 49 (22.6%) |
| 3 or 4 Children | 2 (25.0%) | 0 (0.0%) |
| 5 or more Children | 0 (0.0%) | 0 (0.0%) |
| Total | 16 (10.7%) | 69 (19.1%) |
Income Below Poverty Among Married-Couple vs Single-Parent Households in Idaho County
The poverty data for Idaho County shows that 270 of the married-couple family households (6.7%) and 85 of the single-parent households (16.7%) are living below the poverty level. Within the married-couple family households, those with 5 or more children have the highest poverty rate, with 16 households (19.5%) falling below the poverty line. Among the single-parent households, those with 1 or 2 children have the highest poverty rate, with 61 household (24.3%) living below poverty.
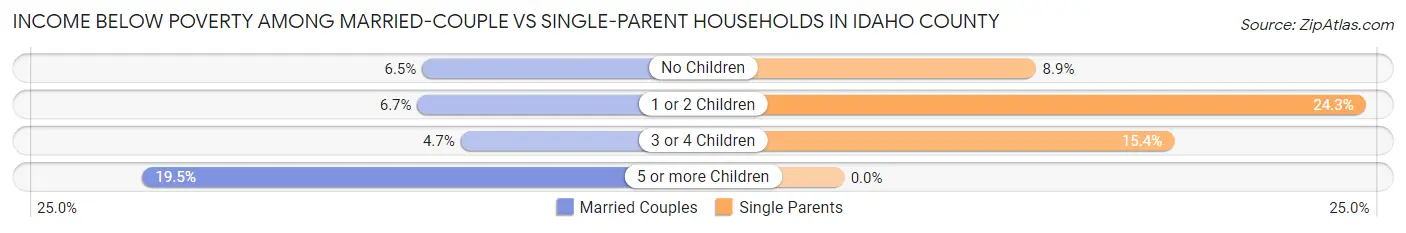
| Children | Married-Couple Families | Single-Parent Households |
| No Children | 172 (6.5%) | 22 (8.9%) |
| 1 or 2 Children | 68 (6.7%) | 61 (24.3%) |
| 3 or 4 Children | 14 (4.7%) | 2 (15.4%) |
| 5 or more Children | 16 (19.5%) | 0 (0.0%) |
| Total | 270 (6.7%) | 85 (16.7%) |
Race in Idaho County
The most populous races in Idaho County are White / Caucasian (15,496 | 92.3%), Hispanic or Latino (616 | 3.7%), and Two or more Races (548 | 3.3%).
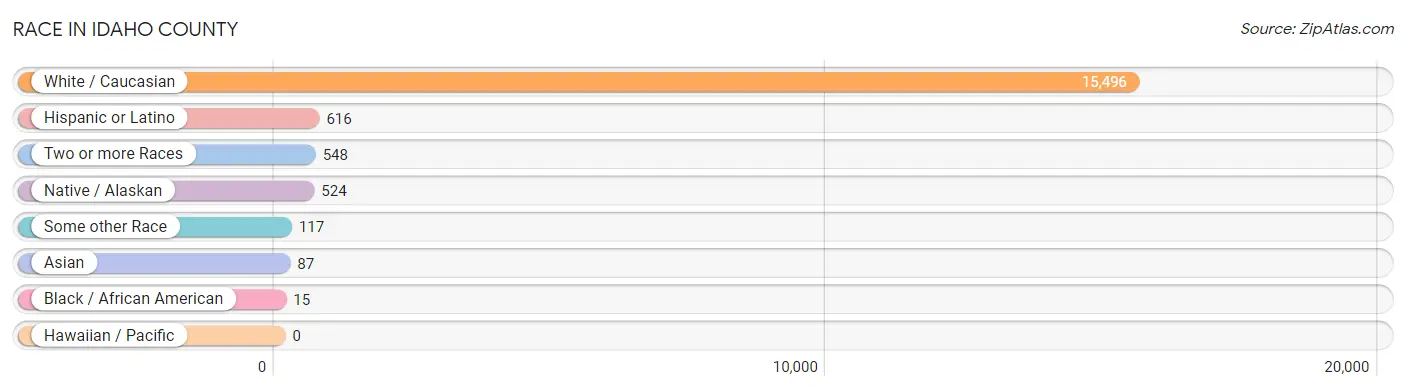
| Race | # Population | % Population |
| Asian | 87 | 0.5% |
| Black / African American | 15 | 0.1% |
| Hawaiian / Pacific | 0 | 0.0% |
| Hispanic or Latino | 616 | 3.7% |
| Native / Alaskan | 524 | 3.1% |
| White / Caucasian | 15,496 | 92.3% |
| Two or more Races | 548 | 3.3% |
| Some other Race | 117 | 0.7% |
| Total | 16,787 | 100.0% |
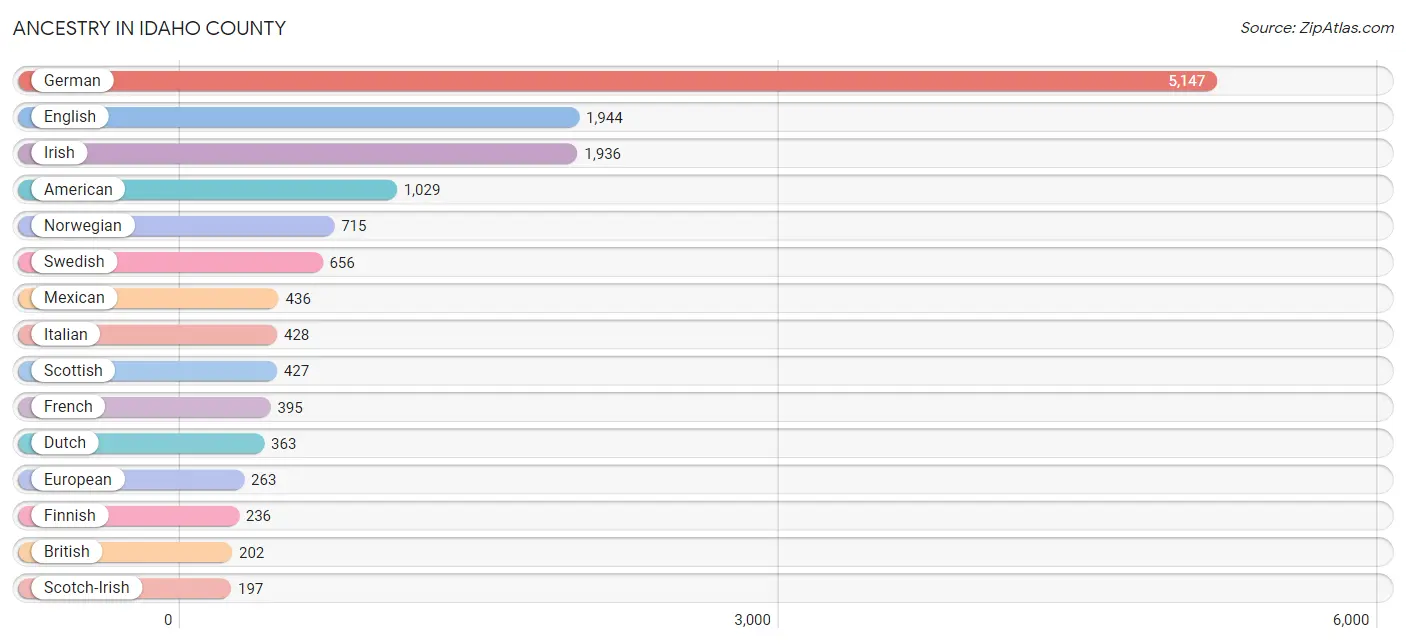
Ancestry in Idaho County
The most populous ancestries reported in Idaho County are German (5,147 | 30.7%), English (1,944 | 11.6%), Irish (1,936 | 11.5%), American (1,029 | 6.1%), and Norwegian (715 | 4.3%), together accounting for 64.2% of all Idaho County residents.
| Ancestry | # Population | % Population |
| American | 1,029 | 6.1% |
| Apache | 7 | 0.0% |
| Arab | 22 | 0.1% |
| Armenian | 7 | 0.0% |
| Australian | 5 | 0.0% |
| Austrian | 35 | 0.2% |
| Basque | 32 | 0.2% |
| Belgian | 18 | 0.1% |
| Bhutanese | 44 | 0.3% |
| Blackfeet | 16 | 0.1% |
| British | 202 | 1.2% |
| Burmese | 9 | 0.1% |
| Cambodian | 10 | 0.1% |
| Canadian | 15 | 0.1% |
| Celtic | 1 | 0.0% |
| Cherokee | 91 | 0.5% |
| Cheyenne | 9 | 0.1% |
| Chippewa | 8 | 0.1% |
| Choctaw | 19 | 0.1% |
| Creek | 70 | 0.4% |
| Croatian | 8 | 0.1% |
| Czech | 139 | 0.8% |
| Czechoslovakian | 13 | 0.1% |
| Danish | 92 | 0.5% |
| Dutch | 363 | 2.2% |
| Eastern European | 55 | 0.3% |
| Ecuadorian | 44 | 0.3% |
| English | 1,944 | 11.6% |
| European | 263 | 1.6% |
| Finnish | 236 | 1.4% |
| French | 395 | 2.4% |
| French Canadian | 128 | 0.8% |
| German | 5,147 | 30.7% |
| Greek | 40 | 0.2% |
| Hungarian | 27 | 0.2% |
| Icelander | 2 | 0.0% |
| Indian (Asian) | 10 | 0.1% |
| Irish | 1,936 | 11.5% |
| Italian | 428 | 2.5% |
| Korean | 53 | 0.3% |
| Latvian | 40 | 0.2% |
| Lebanese | 8 | 0.1% |
| Lithuanian | 2 | 0.0% |
| Luxembourger | 14 | 0.1% |
| Macedonian | 3 | 0.0% |
| Mexican | 436 | 2.6% |
| Northern European | 47 | 0.3% |
| Norwegian | 715 | 4.3% |
| Osage | 195 | 1.2% |
| Paiute | 9 | 0.1% |
| Peruvian | 3 | 0.0% |
| Polish | 173 | 1.0% |
| Portuguese | 36 | 0.2% |
| Puerto Rican | 25 | 0.2% |
| Puget Sound Salish | 30 | 0.2% |
| Romanian | 31 | 0.2% |
| Russian | 102 | 0.6% |
| Scandinavian | 92 | 0.5% |
| Scotch-Irish | 197 | 1.2% |
| Scottish | 427 | 2.5% |
| Sioux | 10 | 0.1% |
| Slovak | 4 | 0.0% |
| South American | 47 | 0.3% |
| Spaniard | 53 | 0.3% |
| Spanish | 8 | 0.1% |
| Swedish | 656 | 3.9% |
| Swiss | 177 | 1.1% |
| Syrian | 14 | 0.1% |
| Thai | 15 | 0.1% |
| Tlingit-Haida | 16 | 0.1% |
| Tsimshian | 7 | 0.0% |
| Ukrainian | 6 | 0.0% |
| Welsh | 91 | 0.5% |
| Yakama | 3 | 0.0% |
| Yaqui | 8 | 0.1% |
| Yugoslavian | 4 | 0.0% | View All 76 Rows |
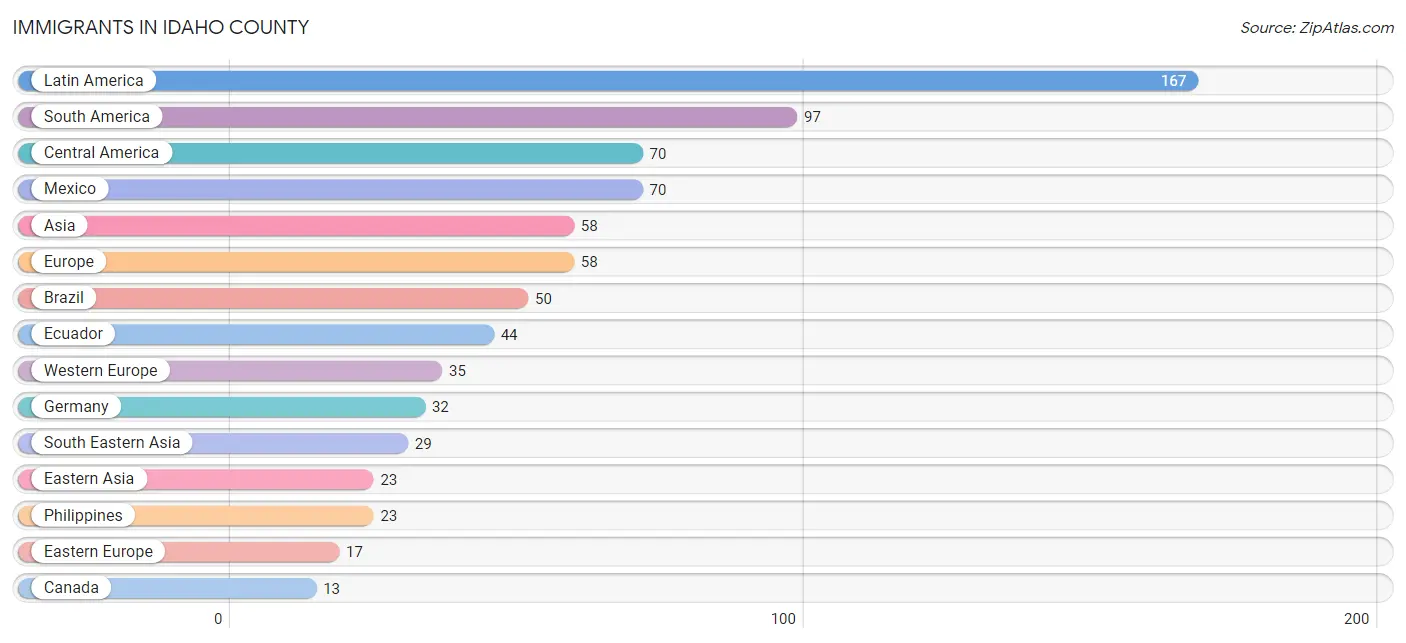
Immigrants in Idaho County
The most numerous immigrant groups reported in Idaho County came from Latin America (167 | 1.0%), South America (97 | 0.6%), Central America (70 | 0.4%), Mexico (70 | 0.4%), and Asia (58 | 0.4%), together accounting for 2.8% of all Idaho County residents.
| Immigration Origin | # Population | % Population |
| Africa | 3 | 0.0% |
| Asia | 58 | 0.4% |
| Austria | 3 | 0.0% |
| Brazil | 50 | 0.3% |
| Canada | 13 | 0.1% |
| Central America | 70 | 0.4% |
| China | 10 | 0.1% |
| Eastern Asia | 23 | 0.1% |
| Eastern Europe | 17 | 0.1% |
| Ecuador | 44 | 0.3% |
| England | 6 | 0.0% |
| Europe | 58 | 0.4% |
| Germany | 32 | 0.2% |
| Hong Kong | 7 | 0.0% |
| Hungary | 1 | 0.0% |
| Korea | 13 | 0.1% |
| Latin America | 167 | 1.0% |
| Malaysia | 4 | 0.0% |
| Mexico | 70 | 0.4% |
| North Macedonia | 3 | 0.0% |
| Northern Europe | 6 | 0.0% |
| Peru | 3 | 0.0% |
| Philippines | 23 | 0.1% |
| Romania | 8 | 0.1% |
| Russia | 5 | 0.0% |
| South Africa | 3 | 0.0% |
| South America | 97 | 0.6% |
| South Central Asia | 6 | 0.0% |
| South Eastern Asia | 29 | 0.2% |
| Thailand | 2 | 0.0% |
| Uzbekistan | 6 | 0.0% |
| Western Europe | 35 | 0.2% | View All 32 Rows |
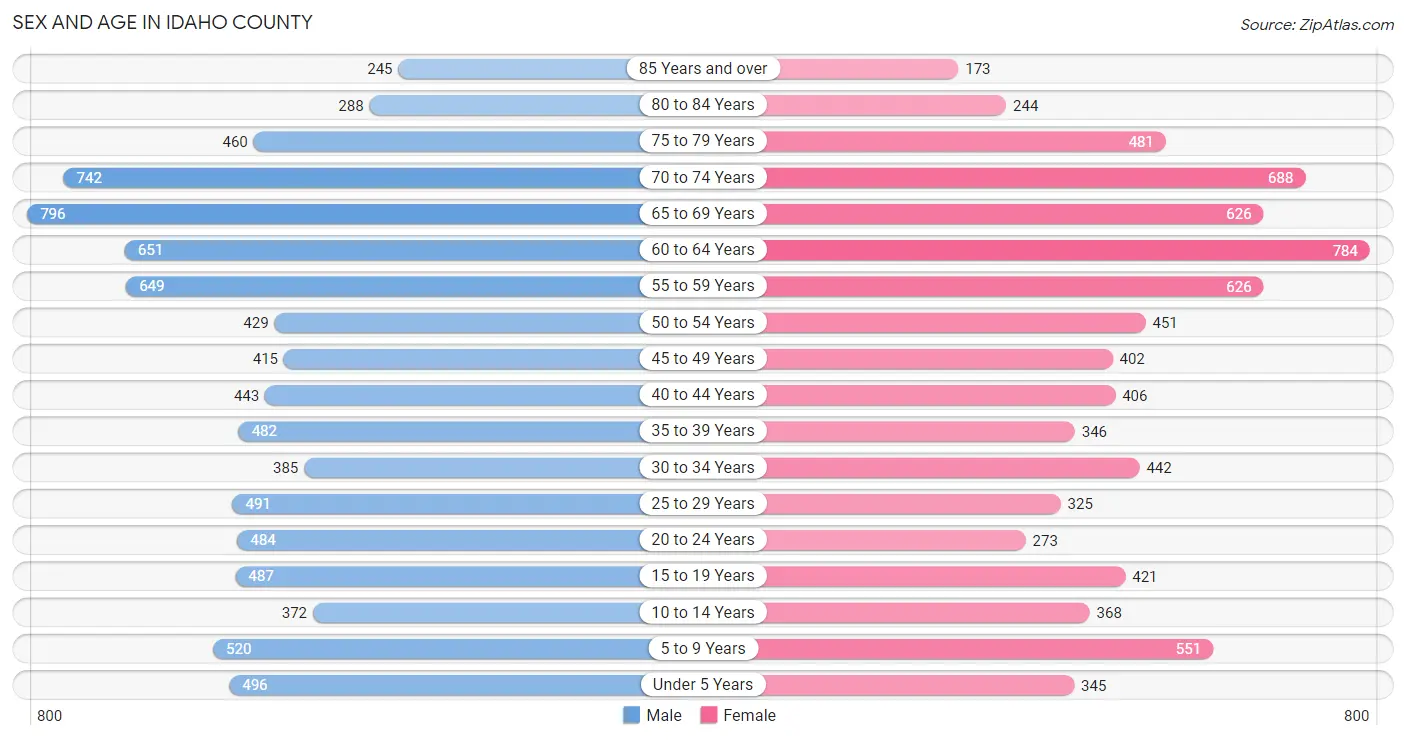
Sex and Age in Idaho County
Sex and Age in Idaho County
The most populous age groups in Idaho County are 65 to 69 Years (796 | 9.0%) for men and 60 to 64 Years (784 | 9.9%) for women.
| Age Bracket | Male | Female |
| Under 5 Years | 496 (5.6%) | 345 (4.3%) |
| 5 to 9 Years | 520 (5.9%) | 551 (6.9%) |
| 10 to 14 Years | 372 (4.2%) | 368 (4.6%) |
| 15 to 19 Years | 487 (5.5%) | 421 (5.3%) |
| 20 to 24 Years | 484 (5.5%) | 273 (3.4%) |
| 25 to 29 Years | 491 (5.6%) | 325 (4.1%) |
| 30 to 34 Years | 385 (4.4%) | 442 (5.6%) |
| 35 to 39 Years | 482 (5.5%) | 346 (4.3%) |
| 40 to 44 Years | 443 (5.0%) | 406 (5.1%) |
| 45 to 49 Years | 415 (4.7%) | 402 (5.1%) |
| 50 to 54 Years | 429 (4.9%) | 451 (5.7%) |
| 55 to 59 Years | 649 (7.3%) | 626 (7.9%) |
| 60 to 64 Years | 651 (7.4%) | 784 (9.9%) |
| 65 to 69 Years | 796 (9.0%) | 626 (7.9%) |
| 70 to 74 Years | 742 (8.4%) | 688 (8.6%) |
| 75 to 79 Years | 460 (5.2%) | 481 (6.0%) |
| 80 to 84 Years | 288 (3.3%) | 244 (3.1%) |
| 85 Years and over | 245 (2.8%) | 173 (2.2%) |
| Total | 8,835 (100.0%) | 7,952 (100.0%) |
Families and Households in Idaho County
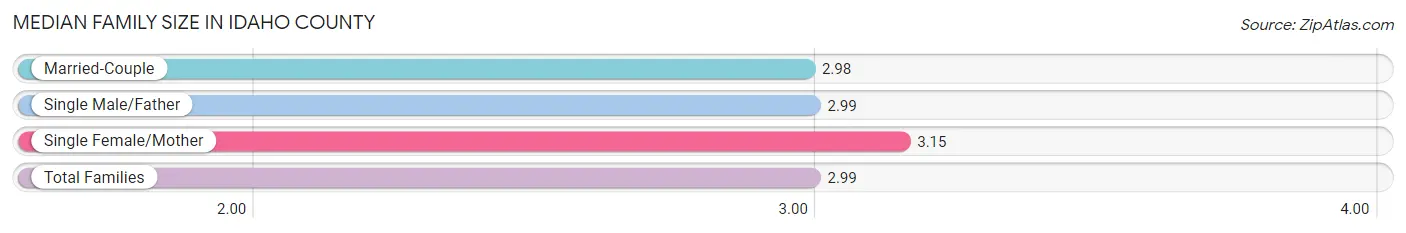
Median Family Size in Idaho County
The median family size in Idaho County is 2.99 persons per family, with single female/mother families (361 | 7.9%) accounting for the largest median family size of 3.15 persons per family. On the other hand, married-couple families (4,046 | 88.8%) represent the smallest median family size with 2.98 persons per family.
| Family Type | # Families | Family Size |
| Married-Couple | 4,046 (88.8%) | 2.98 |
| Single Male/Father | 149 (3.3%) | 2.99 |
| Single Female/Mother | 361 (7.9%) | 3.15 |
| Total Families | 4,556 (100.0%) | 2.99 |
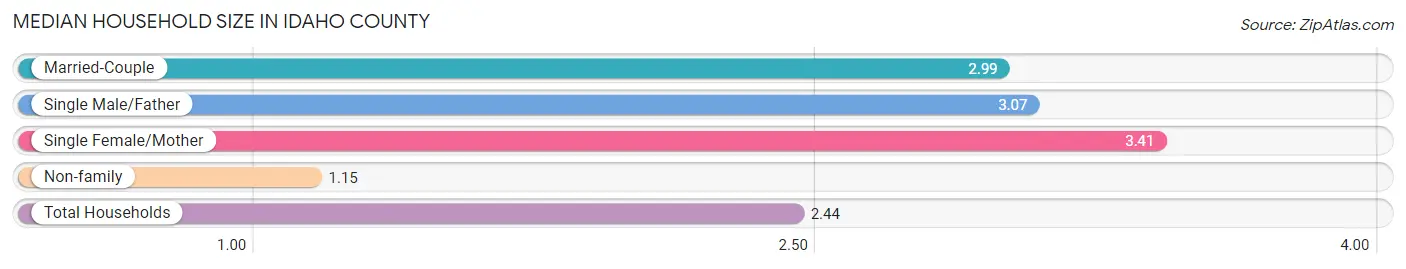
Median Household Size in Idaho County
The median household size in Idaho County is 2.44 persons per household, with single female/mother households (361 | 5.5%) accounting for the largest median household size of 3.41 persons per household. non-family households (2,047 | 31.0%) represent the smallest median household size with 1.15 persons per household.
| Household Type | # Households | Household Size |
| Married-Couple | 4,046 (61.3%) | 2.99 |
| Single Male/Father | 149 (2.3%) | 3.07 |
| Single Female/Mother | 361 (5.5%) | 3.41 |
| Non-family | 2,047 (31.0%) | 1.15 |
| Total Households | 6,603 (100.0%) | 2.44 |
Household Size by Marriage Status in Idaho County
Out of a total of 6,603 households in Idaho County, 4,556 (69.0%) are family households, while 2,047 (31.0%) are nonfamily households. The most numerous type of family households are 2-person households, comprising 2,667, and the most common type of nonfamily households are 1-person households, comprising 1,779.
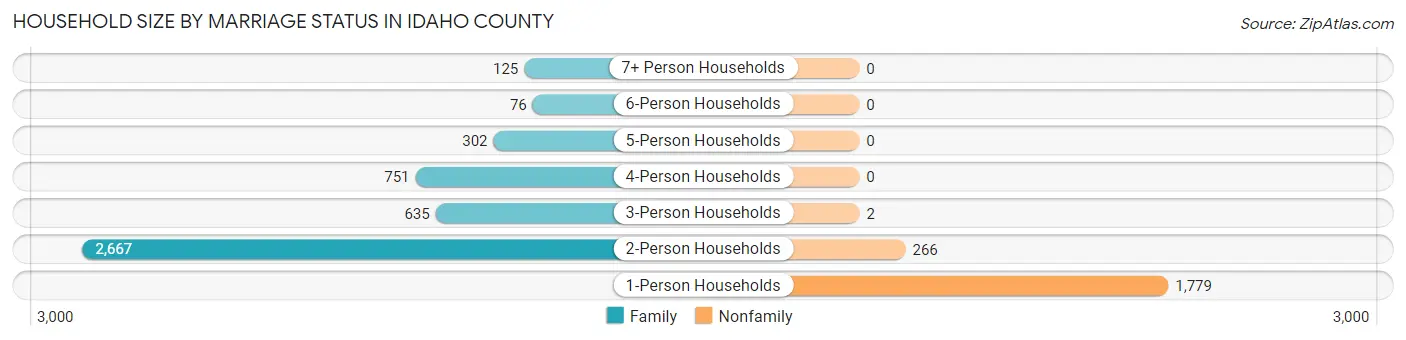
| Household Size | Family Households | Nonfamily Households |
| 1-Person Households | - | 1,779 (26.9%) |
| 2-Person Households | 2,667 (40.4%) | 266 (4.0%) |
| 3-Person Households | 635 (9.6%) | 2 (0.0%) |
| 4-Person Households | 751 (11.4%) | 0 (0.0%) |
| 5-Person Households | 302 (4.6%) | 0 (0.0%) |
| 6-Person Households | 76 (1.1%) | 0 (0.0%) |
| 7+ Person Households | 125 (1.9%) | 0 (0.0%) |
| Total | 4,556 (69.0%) | 2,047 (31.0%) |
Female Fertility in Idaho County
Fertility by Age in Idaho County
Average fertility rate in Idaho County is 87.0 births per 1,000 women. Women in the age bracket of 20 to 34 years have the highest fertility rate with 146.0 births per 1,000 women. Women in the age bracket of 20 to 34 years acount for 65.8% of all women with births.
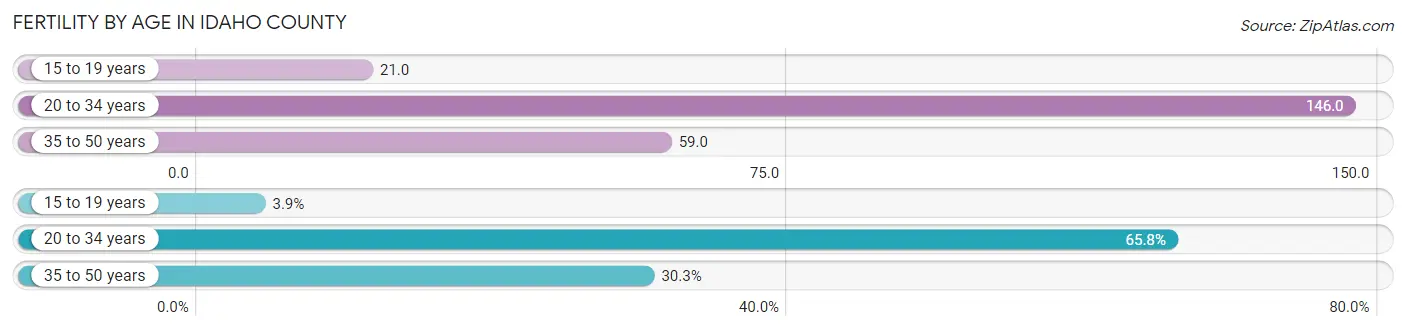
| Age Bracket | Women with Births | Births / 1,000 Women |
| 15 to 19 years | 9 (3.9%) | 21.0 |
| 20 to 34 years | 152 (65.8%) | 146.0 |
| 35 to 50 years | 70 (30.3%) | 59.0 |
| Total | 231 (100.0%) | 87.0 |
Fertility by Age by Marriage Status in Idaho County
92.6% of women with births (231) in Idaho County are married. The highest percentage of unmarried women with births falls into 15 to 19 years age bracket with 100.0% of them unmarried at the time of birth, while the lowest percentage of unmarried women with births belong to 20 to 34 years age bracket with 1.3% of them unmarried.
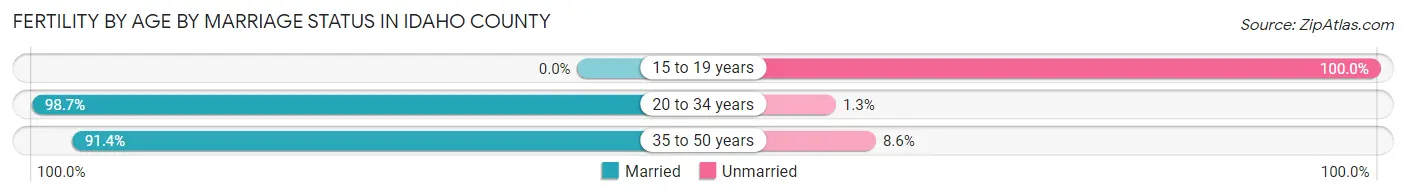
| Age Bracket | Married | Unmarried |
| 15 to 19 years | 0 (0.0%) | 9 (100.0%) |
| 20 to 34 years | 150 (98.7%) | 2 (1.3%) |
| 35 to 50 years | 64 (91.4%) | 6 (8.6%) |
| Total | 214 (92.6%) | 17 (7.4%) |
Fertility by Education in Idaho County
Average fertility rate in Idaho County is 87.0 births per 1,000 women. Women with the education attainment of graduate degree have the highest fertility rate of 481.0 births per 1,000 women, while women with the education attainment of less than high school have the lowest fertility at 4.0 births per 1,000 women. Women with the education attainment of college or associate's degree represent 42.9% of all women with births.
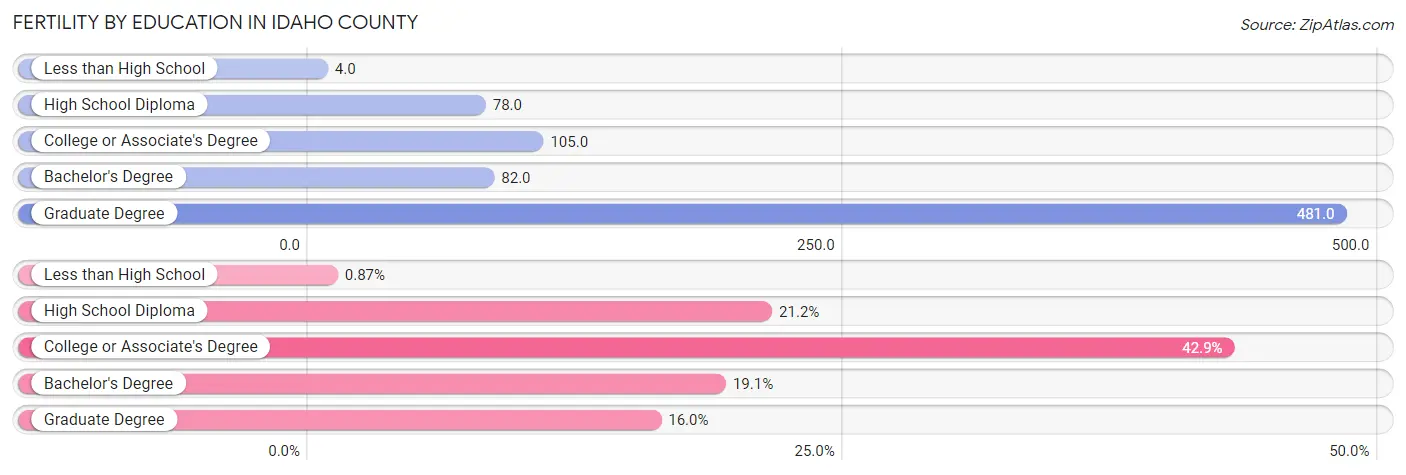
| Educational Attainment | Women with Births | Births / 1,000 Women |
| Less than High School | 2 (0.9%) | 4.0 |
| High School Diploma | 49 (21.2%) | 78.0 |
| College or Associate's Degree | 99 (42.9%) | 105.0 |
| Bachelor's Degree | 44 (19.1%) | 82.0 |
| Graduate Degree | 37 (16.0%) | 481.0 |
| Total | 231 (100.0%) | 87.0 |
Fertility by Education by Marriage Status in Idaho County
7.4% of women with births in Idaho County are unmarried. Women with the educational attainment of high school diploma are most likely to be married with 100.0% of them married at childbirth, while women with the educational attainment of less than high school are least likely to be married with 100.0% of them unmarried at childbirth.
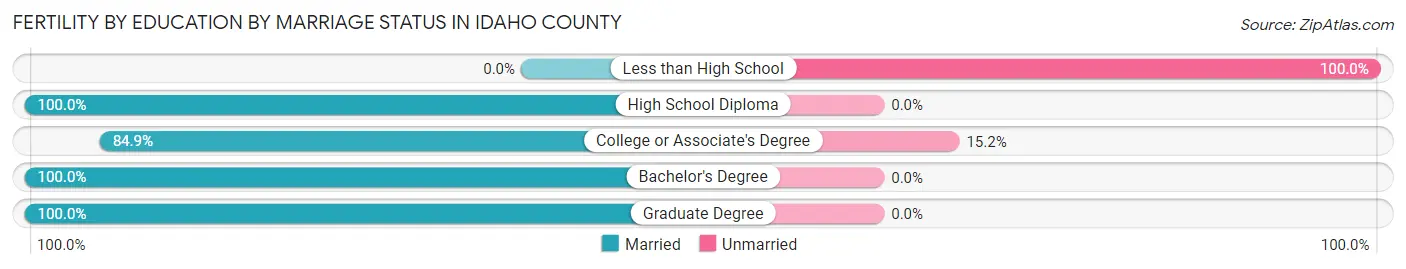
| Educational Attainment | Married | Unmarried |
| Less than High School | 0 (0.0%) | 2 (100.0%) |
| High School Diploma | 49 (100.0%) | 0 (0.0%) |
| College or Associate's Degree | 84 (84.9%) | 15 (15.1%) |
| Bachelor's Degree | 44 (100.0%) | 0 (0.0%) |
| Graduate Degree | 37 (100.0%) | 0 (0.0%) |
| Total | 214 (92.6%) | 17 (7.4%) |
Employment Characteristics in Idaho County
Employment by Class of Employer in Idaho County
Among the 6,403 employed individuals in Idaho County, private company employees (3,427 | 53.5%), self-employed (not incorporated) (701 | 11.0%), and self-employed (incorporated) (618 | 9.7%) make up the most common classes of employment.
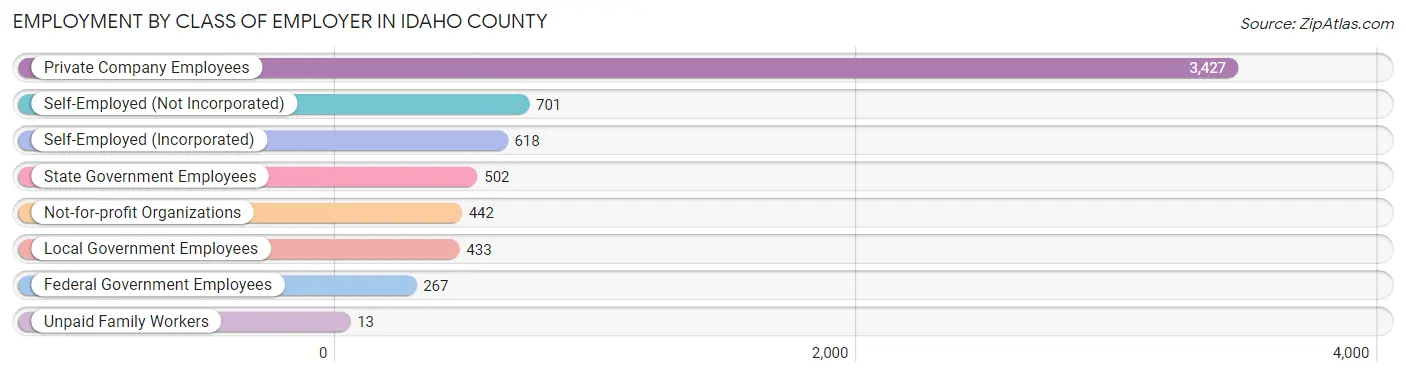
| Employer Class | # Employees | % Employees |
| Private Company Employees | 3,427 | 53.5% |
| Self-Employed (Incorporated) | 618 | 9.7% |
| Self-Employed (Not Incorporated) | 701 | 11.0% |
| Not-for-profit Organizations | 442 | 6.9% |
| Local Government Employees | 433 | 6.8% |
| State Government Employees | 502 | 7.8% |
| Federal Government Employees | 267 | 4.2% |
| Unpaid Family Workers | 13 | 0.2% |
| Total | 6,403 | 100.0% |
Employment Status by Age in Idaho County
According to the labor force statistics for Idaho County, out of the total population over 16 years of age (13,890), 49.6% or 6,889 individuals are in the labor force, with 4.3% or 296 of them unemployed. The age group with the highest labor force participation rate is 35 to 44 years, with 80.0% or 1,342 individuals in the labor force. Within the labor force, the 20 to 24 years age range has the highest percentage of unemployed individuals, with 9.9% or 59 of them being unemployed.
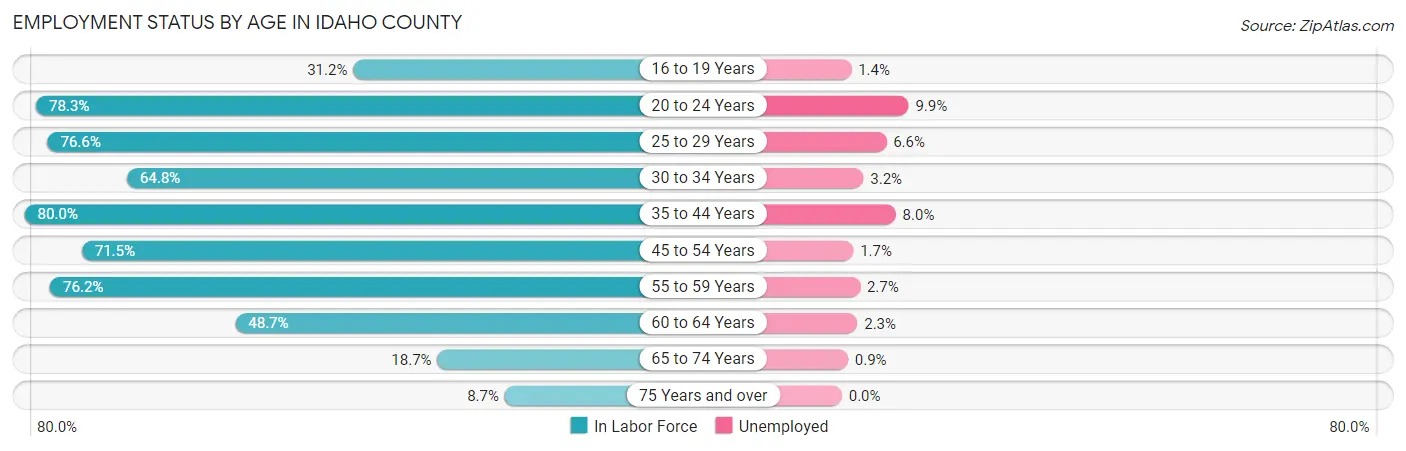
| Age Bracket | In Labor Force | Unemployed |
| 16 to 19 Years | 207 (31.2%) | 3 (1.4%) |
| 20 to 24 Years | 593 (78.3%) | 59 (9.9%) |
| 25 to 29 Years | 625 (76.6%) | 41 (6.6%) |
| 30 to 34 Years | 536 (64.8%) | 17 (3.2%) |
| 35 to 44 Years | 1,342 (80.0%) | 107 (8.0%) |
| 45 to 54 Years | 1,213 (71.5%) | 21 (1.7%) |
| 55 to 59 Years | 972 (76.2%) | 26 (2.7%) |
| 60 to 64 Years | 699 (48.7%) | 16 (2.3%) |
| 65 to 74 Years | 533 (18.7%) | 5 (0.9%) |
| 75 Years and over | 165 (8.7%) | 0 (0.0%) |
| Total | 6,889 (49.6%) | 296 (4.3%) |
Employment Status by Educational Attainment in Idaho County
According to labor force statistics for Idaho County, 69.7% of individuals (5,386) out of the total population between 25 and 64 years of age (7,727) are in the labor force, with 4.2% or 226 of them being unemployed. The group with the highest labor force participation rate are those with the educational attainment of bachelor's degree or higher, with 79.6% or 1,366 individuals in the labor force. Within the labor force, individuals with college / associate degree education have the highest percentage of unemployment, with 7.9% or 157 of them being unemployed.
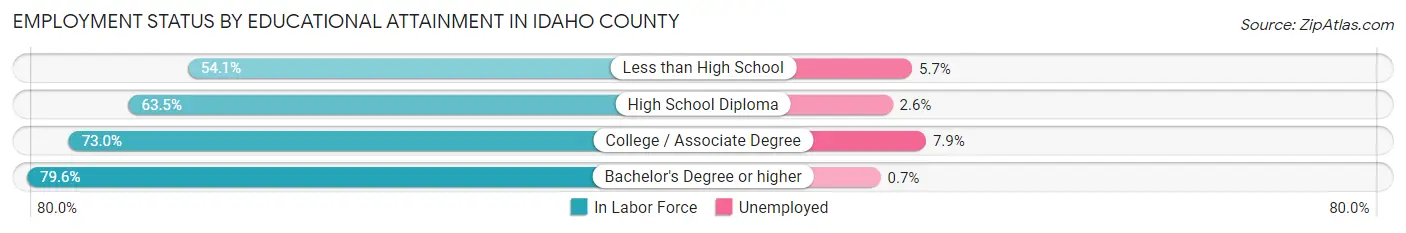
| Educational Attainment | In Labor Force | Unemployed |
| Less than High School | 318 (54.1%) | 34 (5.7%) |
| High School Diploma | 1,718 (63.5%) | 70 (2.6%) |
| College / Associate Degree | 1,983 (73.0%) | 215 (7.9%) |
| Bachelor's Degree or higher | 1,366 (79.6%) | 12 (0.7%) |
| Total | 5,386 (69.7%) | 325 (4.2%) |
Employment Occupations by Sex in Idaho County
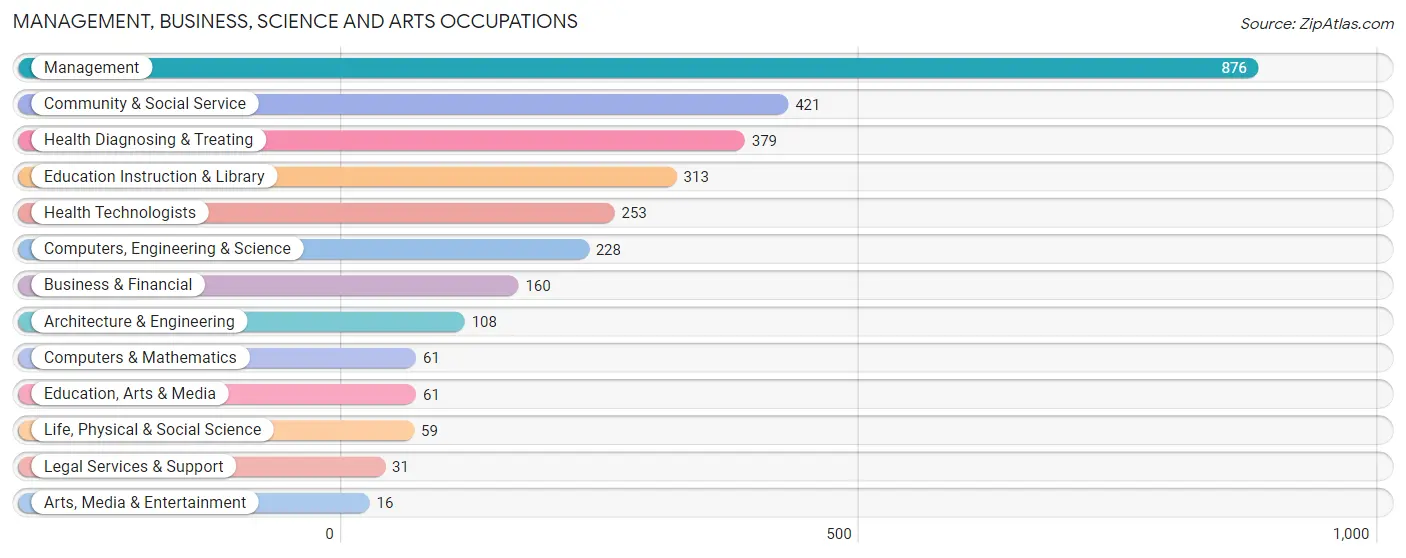
Management, Business, Science and Arts Occupations
The most common Management, Business, Science and Arts occupations in Idaho County are Management (876 | 13.3%), Community & Social Service (421 | 6.4%), Health Diagnosing & Treating (379 | 5.8%), Education Instruction & Library (313 | 4.8%), and Health Technologists (253 | 3.8%).
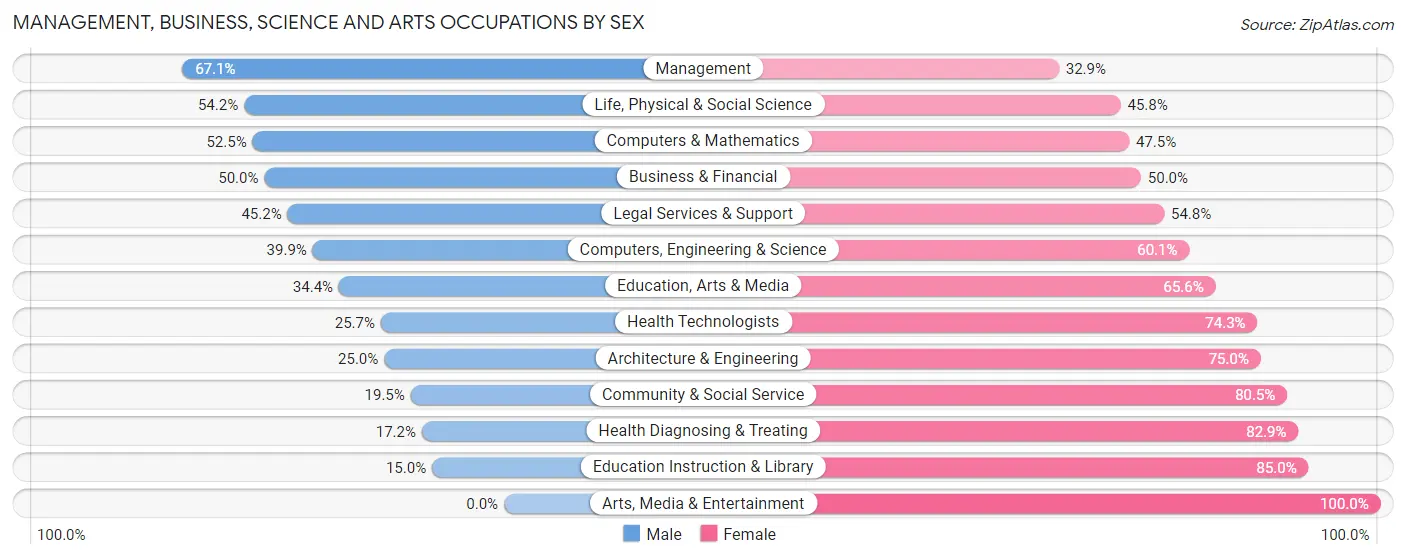
Management, Business, Science and Arts Occupations by Sex
Within the Management, Business, Science and Arts occupations in Idaho County, the most male-oriented occupations are Management (67.1%), Life, Physical & Social Science (54.2%), and Computers & Mathematics (52.5%), while the most female-oriented occupations are Arts, Media & Entertainment (100.0%), Education Instruction & Library (85.0%), and Health Diagnosing & Treating (82.9%).
| Occupation | Male | Female |
| Management | 588 (67.1%) | 288 (32.9%) |
| Business & Financial | 80 (50.0%) | 80 (50.0%) |
| Computers, Engineering & Science | 91 (39.9%) | 137 (60.1%) |
| Computers & Mathematics | 32 (52.5%) | 29 (47.5%) |
| Architecture & Engineering | 27 (25.0%) | 81 (75.0%) |
| Life, Physical & Social Science | 32 (54.2%) | 27 (45.8%) |
| Community & Social Service | 82 (19.5%) | 339 (80.5%) |
| Education, Arts & Media | 21 (34.4%) | 40 (65.6%) |
| Legal Services & Support | 14 (45.2%) | 17 (54.8%) |
| Education Instruction & Library | 47 (15.0%) | 266 (85.0%) |
| Arts, Media & Entertainment | 0 (0.0%) | 16 (100.0%) |
| Health Diagnosing & Treating | 65 (17.2%) | 314 (82.9%) |
| Health Technologists | 65 (25.7%) | 188 (74.3%) |
| Total (Category) | 906 (43.9%) | 1,158 (56.1%) |
| Total (Overall) | 3,530 (53.6%) | 3,059 (46.4%) |
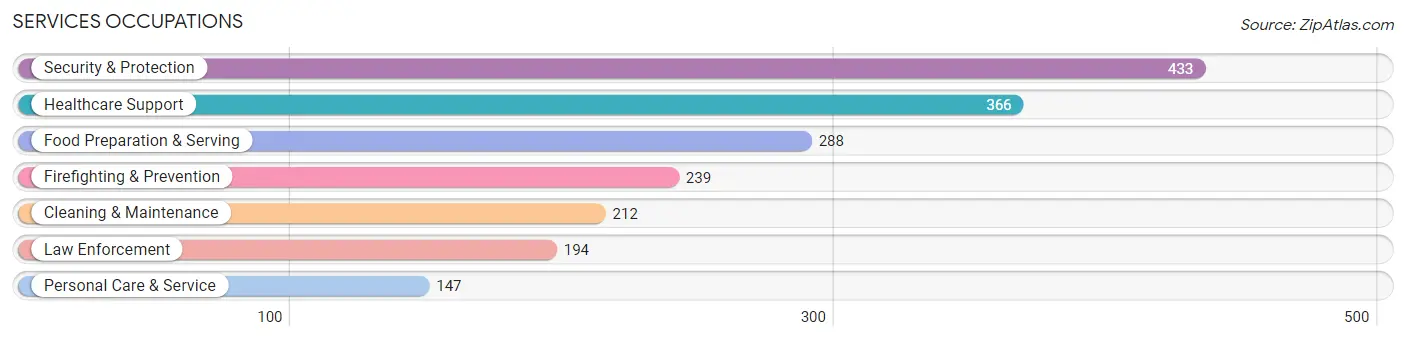
Services Occupations
The most common Services occupations in Idaho County are Security & Protection (433 | 6.6%), Healthcare Support (366 | 5.6%), Food Preparation & Serving (288 | 4.4%), Firefighting & Prevention (239 | 3.6%), and Cleaning & Maintenance (212 | 3.2%).
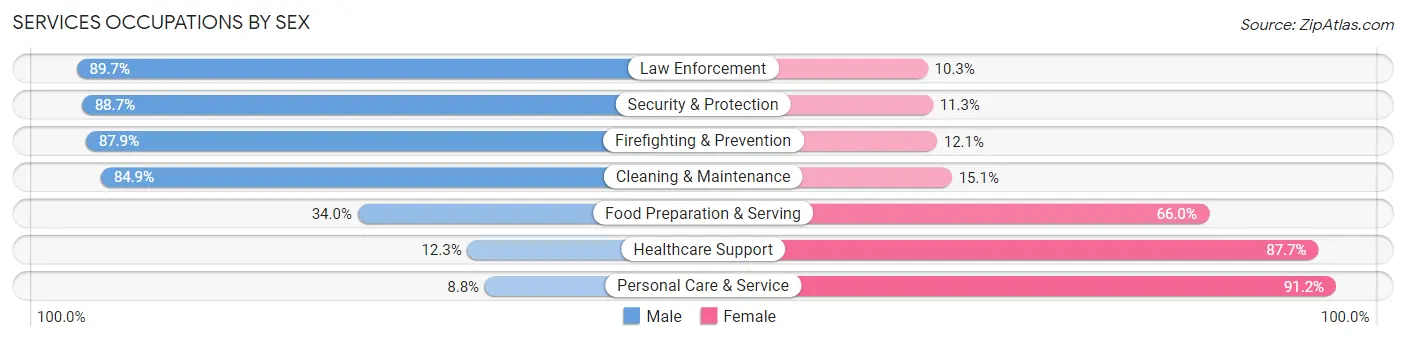
Services Occupations by Sex
Within the Services occupations in Idaho County, the most male-oriented occupations are Law Enforcement (89.7%), Security & Protection (88.7%), and Firefighting & Prevention (87.9%), while the most female-oriented occupations are Personal Care & Service (91.2%), Healthcare Support (87.7%), and Food Preparation & Serving (66.0%).
| Occupation | Male | Female |
| Healthcare Support | 45 (12.3%) | 321 (87.7%) |
| Security & Protection | 384 (88.7%) | 49 (11.3%) |
| Firefighting & Prevention | 210 (87.9%) | 29 (12.1%) |
| Law Enforcement | 174 (89.7%) | 20 (10.3%) |
| Food Preparation & Serving | 98 (34.0%) | 190 (66.0%) |
| Cleaning & Maintenance | 180 (84.9%) | 32 (15.1%) |
| Personal Care & Service | 13 (8.8%) | 134 (91.2%) |
| Total (Category) | 720 (49.8%) | 726 (50.2%) |
| Total (Overall) | 3,530 (53.6%) | 3,059 (46.4%) |
Sales and Office Occupations
The most common Sales and Office occupations in Idaho County are Office & Administration (842 | 12.8%), and Sales & Related (368 | 5.6%).
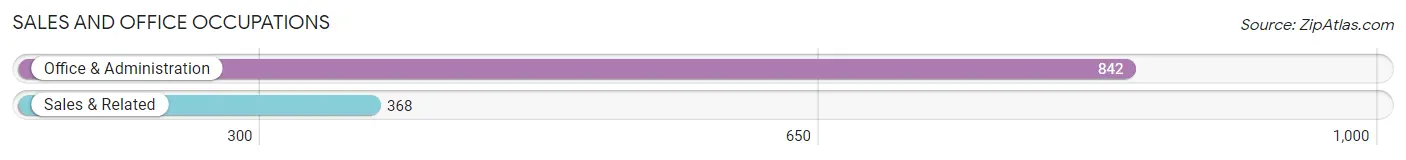
Sales and Office Occupations by Sex
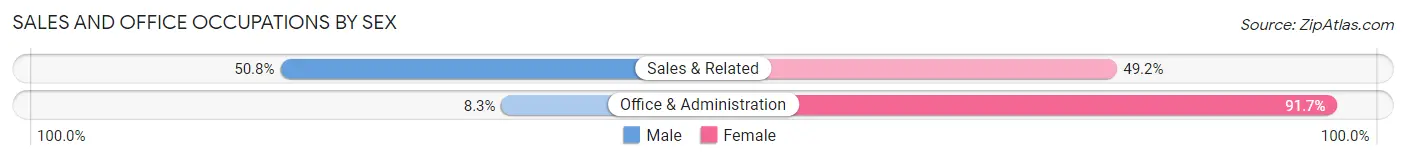
| Occupation | Male | Female |
| Sales & Related | 187 (50.8%) | 181 (49.2%) |
| Office & Administration | 70 (8.3%) | 772 (91.7%) |
| Total (Category) | 257 (21.2%) | 953 (78.8%) |
| Total (Overall) | 3,530 (53.6%) | 3,059 (46.4%) |
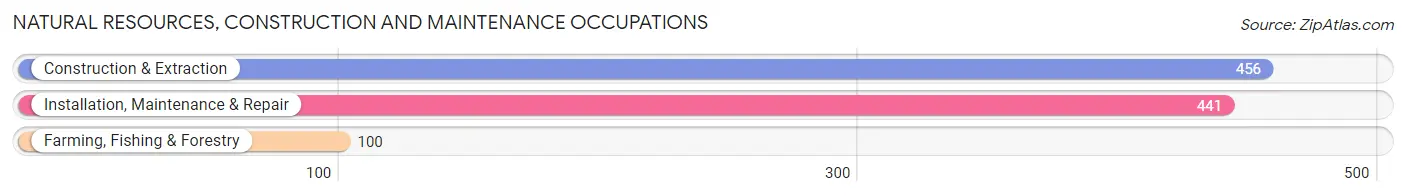
Natural Resources, Construction and Maintenance Occupations
The most common Natural Resources, Construction and Maintenance occupations in Idaho County are Construction & Extraction (456 | 6.9%), Installation, Maintenance & Repair (441 | 6.7%), and Farming, Fishing & Forestry (100 | 1.5%).
Natural Resources, Construction and Maintenance Occupations by Sex
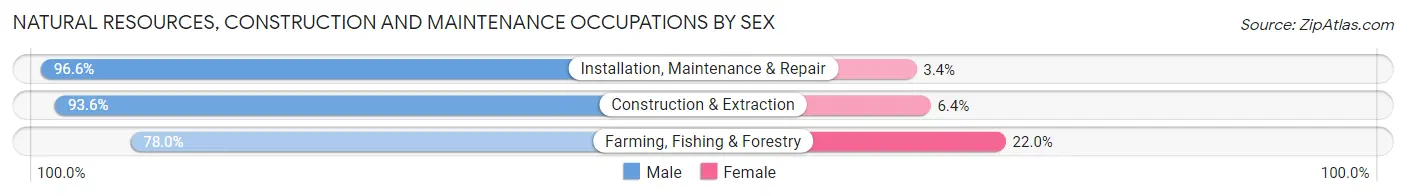
| Occupation | Male | Female |
| Farming, Fishing & Forestry | 78 (78.0%) | 22 (22.0%) |
| Construction & Extraction | 427 (93.6%) | 29 (6.4%) |
| Installation, Maintenance & Repair | 426 (96.6%) | 15 (3.4%) |
| Total (Category) | 931 (93.4%) | 66 (6.6%) |
| Total (Overall) | 3,530 (53.6%) | 3,059 (46.4%) |
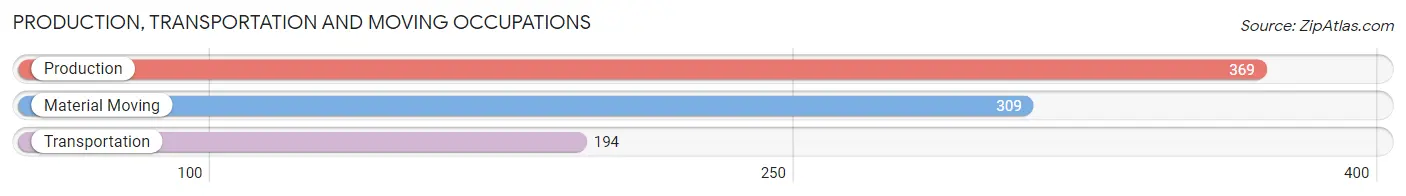
Production, Transportation and Moving Occupations
The most common Production, Transportation and Moving occupations in Idaho County are Production (369 | 5.6%), Material Moving (309 | 4.7%), and Transportation (194 | 2.9%).
Production, Transportation and Moving Occupations by Sex
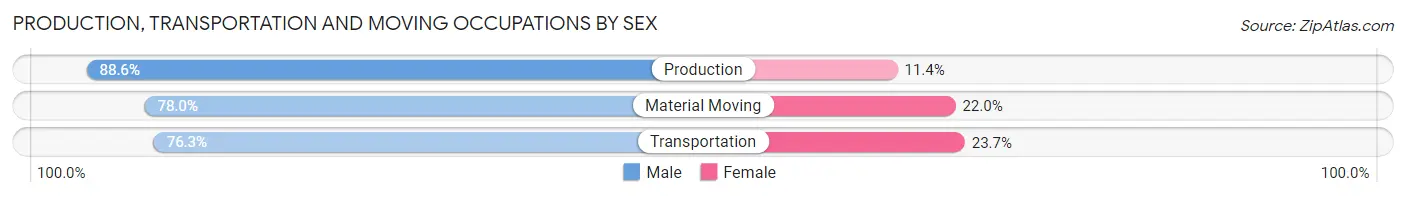
| Occupation | Male | Female |
| Production | 327 (88.6%) | 42 (11.4%) |
| Transportation | 148 (76.3%) | 46 (23.7%) |
| Material Moving | 241 (78.0%) | 68 (22.0%) |
| Total (Category) | 716 (82.1%) | 156 (17.9%) |
| Total (Overall) | 3,530 (53.6%) | 3,059 (46.4%) |
Employment Industries by Sex in Idaho County
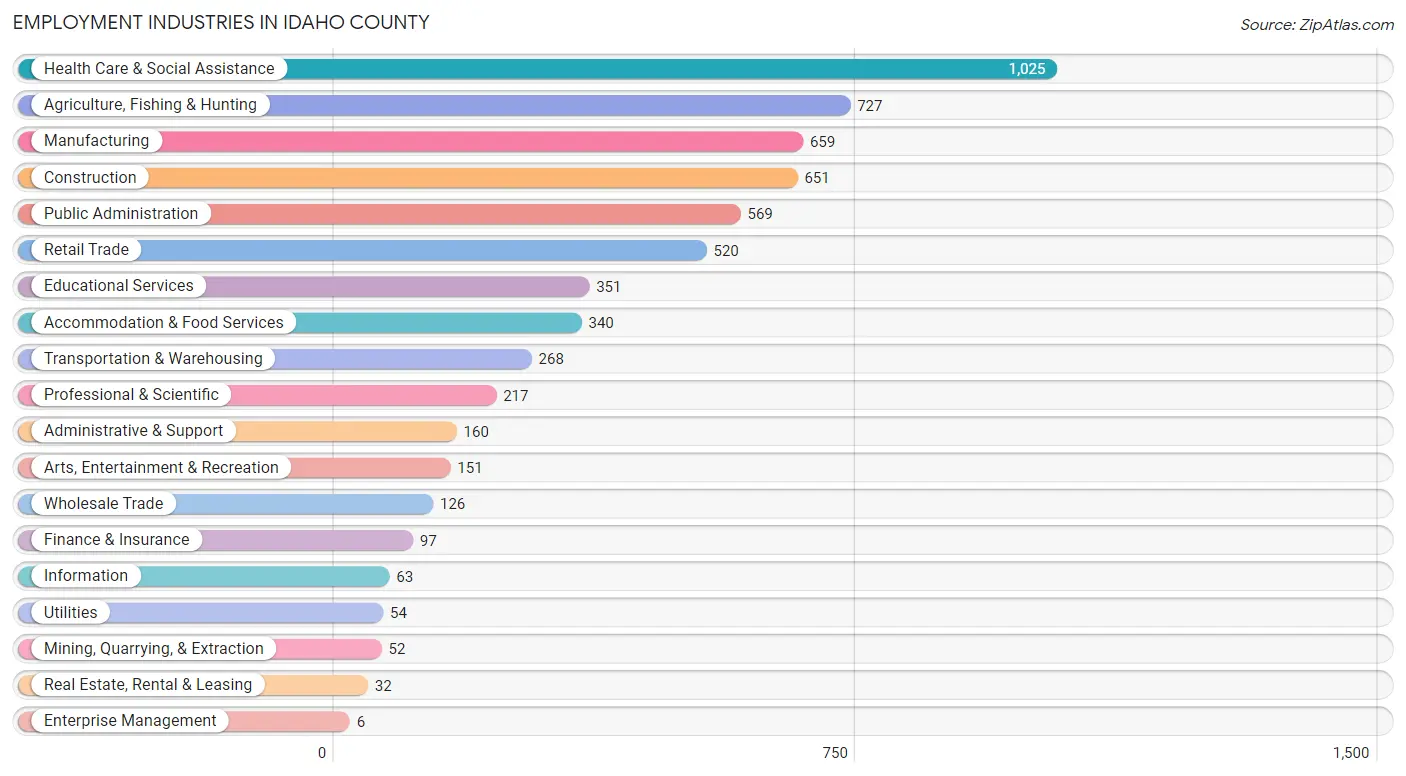
Employment Industries in Idaho County
The major employment industries in Idaho County include Health Care & Social Assistance (1,025 | 15.6%), Agriculture, Fishing & Hunting (727 | 11.0%), Manufacturing (659 | 10.0%), Construction (651 | 9.9%), and Public Administration (569 | 8.6%).
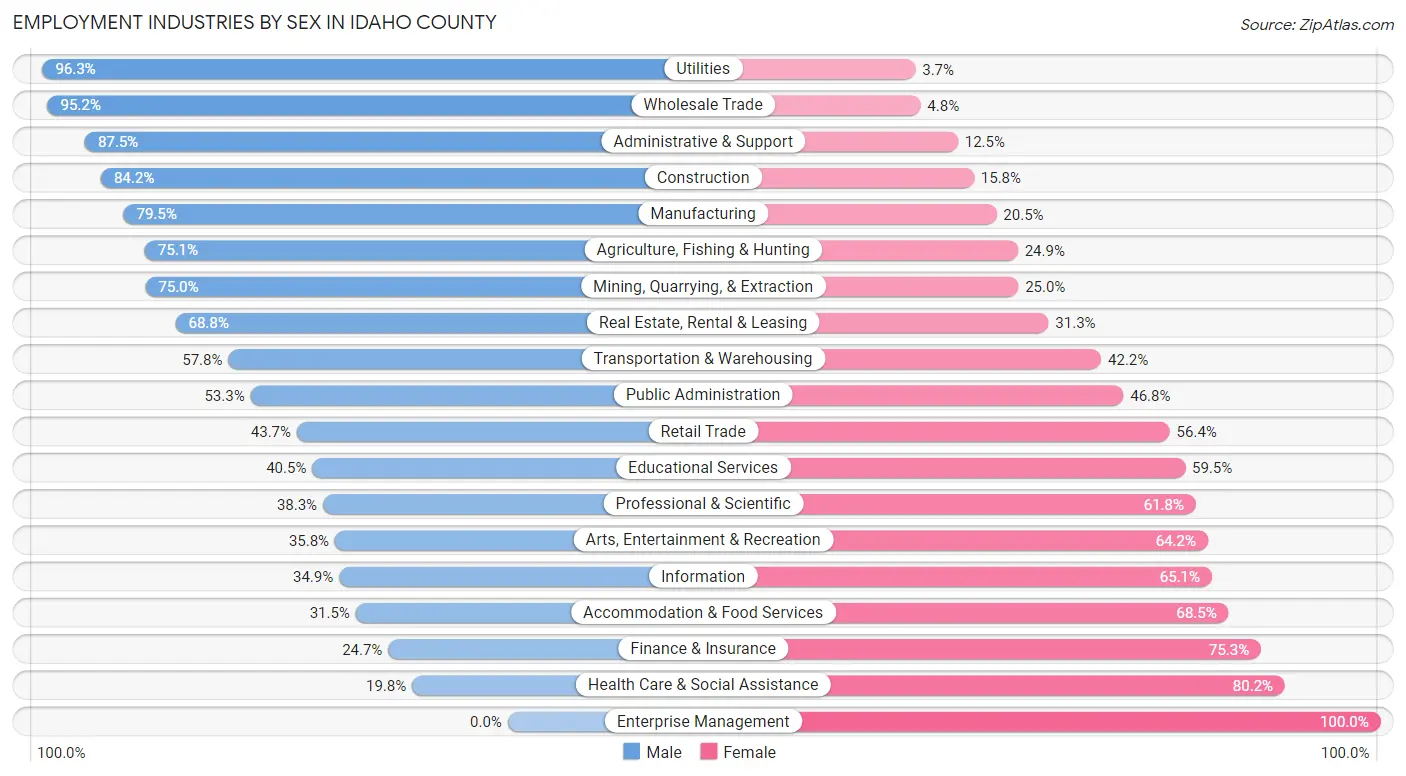
Employment Industries by Sex in Idaho County
The Idaho County industries that see more men than women are Utilities (96.3%), Wholesale Trade (95.2%), and Administrative & Support (87.5%), whereas the industries that tend to have a higher number of women are Enterprise Management (100.0%), Health Care & Social Assistance (80.2%), and Finance & Insurance (75.3%).
| Industry | Male | Female |
| Agriculture, Fishing & Hunting | 546 (75.1%) | 181 (24.9%) |
| Mining, Quarrying, & Extraction | 39 (75.0%) | 13 (25.0%) |
| Construction | 548 (84.2%) | 103 (15.8%) |
| Manufacturing | 524 (79.5%) | 135 (20.5%) |
| Wholesale Trade | 120 (95.2%) | 6 (4.8%) |
| Retail Trade | 227 (43.6%) | 293 (56.4%) |
| Transportation & Warehousing | 155 (57.8%) | 113 (42.2%) |
| Utilities | 52 (96.3%) | 2 (3.7%) |
| Information | 22 (34.9%) | 41 (65.1%) |
| Finance & Insurance | 24 (24.7%) | 73 (75.3%) |
| Real Estate, Rental & Leasing | 22 (68.8%) | 10 (31.2%) |
| Professional & Scientific | 83 (38.3%) | 134 (61.8%) |
| Enterprise Management | 0 (0.0%) | 6 (100.0%) |
| Administrative & Support | 140 (87.5%) | 20 (12.5%) |
| Educational Services | 142 (40.5%) | 209 (59.5%) |
| Health Care & Social Assistance | 203 (19.8%) | 822 (80.2%) |
| Arts, Entertainment & Recreation | 54 (35.8%) | 97 (64.2%) |
| Accommodation & Food Services | 107 (31.5%) | 233 (68.5%) |
| Public Administration | 303 (53.2%) | 266 (46.8%) |
| Total | 3,530 (53.6%) | 3,059 (46.4%) |
Education in Idaho County
School Enrollment in Idaho County
The most common levels of schooling among the 3,046 students in Idaho County are elementary school (795 | 26.1%), high school (754 | 24.7%), and middle school (635 | 20.8%).
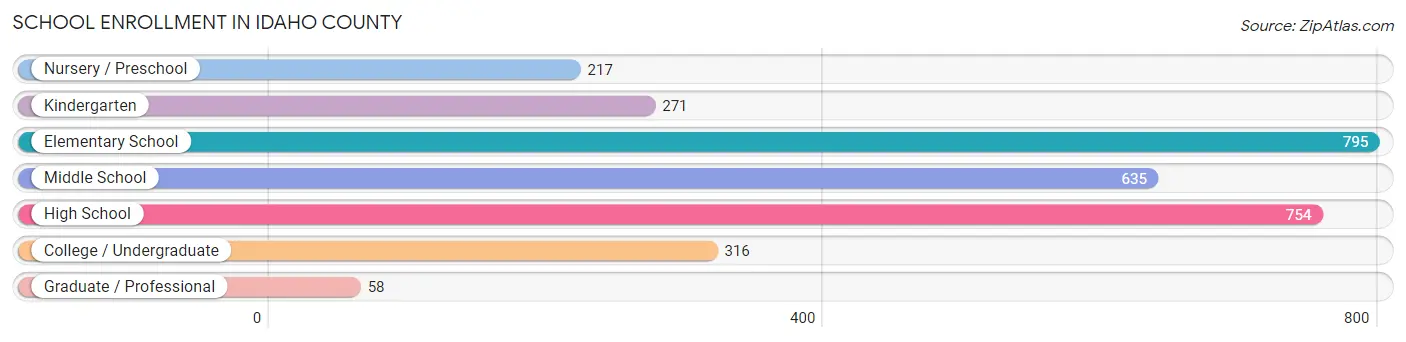
| School Level | # Students | % Students |
| Nursery / Preschool | 217 | 7.1% |
| Kindergarten | 271 | 8.9% |
| Elementary School | 795 | 26.1% |
| Middle School | 635 | 20.8% |
| High School | 754 | 24.7% |
| College / Undergraduate | 316 | 10.4% |
| Graduate / Professional | 58 | 1.9% |
| Total | 3,046 | 100.0% |
School Enrollment by Age by Funding Source in Idaho County
Out of a total of 3,046 students who are enrolled in schools in Idaho County, 719 (23.6%) attend a private institution, while the remaining 2,327 (76.4%) are enrolled in public schools. The age group of 20 to 24 year olds has the highest likelihood of being enrolled in private schools, with 49 (56.3% in the age bracket) enrolled. Conversely, the age group of 25 to 34 year olds has the lowest likelihood of being enrolled in a private school, with 135 (100.0% in the age bracket) attending a public institution.
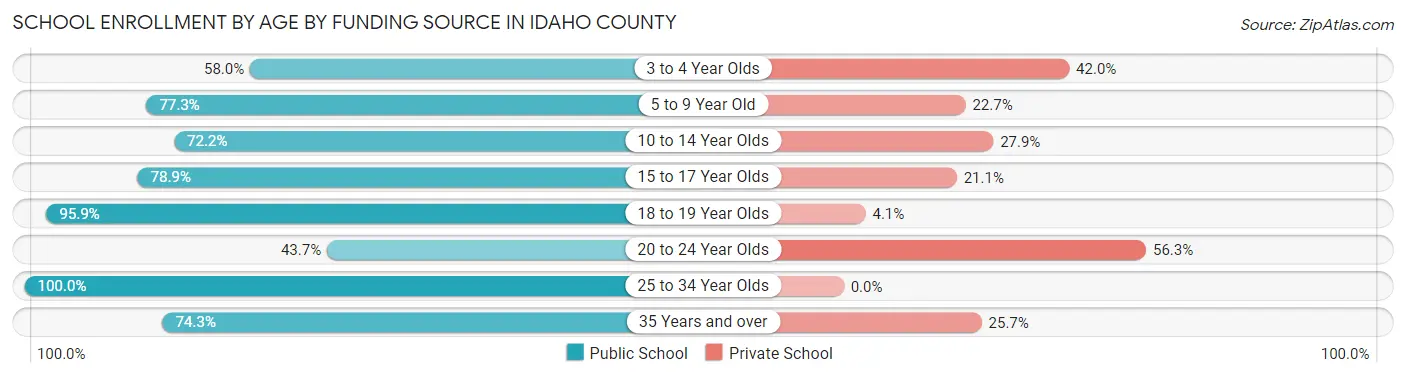
| Age Bracket | Public School | Private School |
| 3 to 4 Year Olds | 87 (58.0%) | 63 (42.0%) |
| 5 to 9 Year Old | 821 (77.3%) | 241 (22.7%) |
| 10 to 14 Year Olds | 474 (72.2%) | 183 (27.9%) |
| 15 to 17 Year Olds | 446 (78.9%) | 119 (21.1%) |
| 18 to 19 Year Olds | 165 (95.9%) | 7 (4.1%) |
| 20 to 24 Year Olds | 38 (43.7%) | 49 (56.3%) |
| 25 to 34 Year Olds | 135 (100.0%) | 0 (0.0%) |
| 35 Years and over | 162 (74.3%) | 56 (25.7%) |
| Total | 2,327 (76.4%) | 719 (23.6%) |
Educational Attainment by Field of Study in Idaho County
Bio, nature & agricultural (562 | 19.8%), education (490 | 17.3%), science & technology (317 | 11.2%), business (286 | 10.1%), and physical & health sciences (228 | 8.0%) are the most common fields of study among 2,838 individuals in Idaho County who have obtained a bachelor's degree or higher.
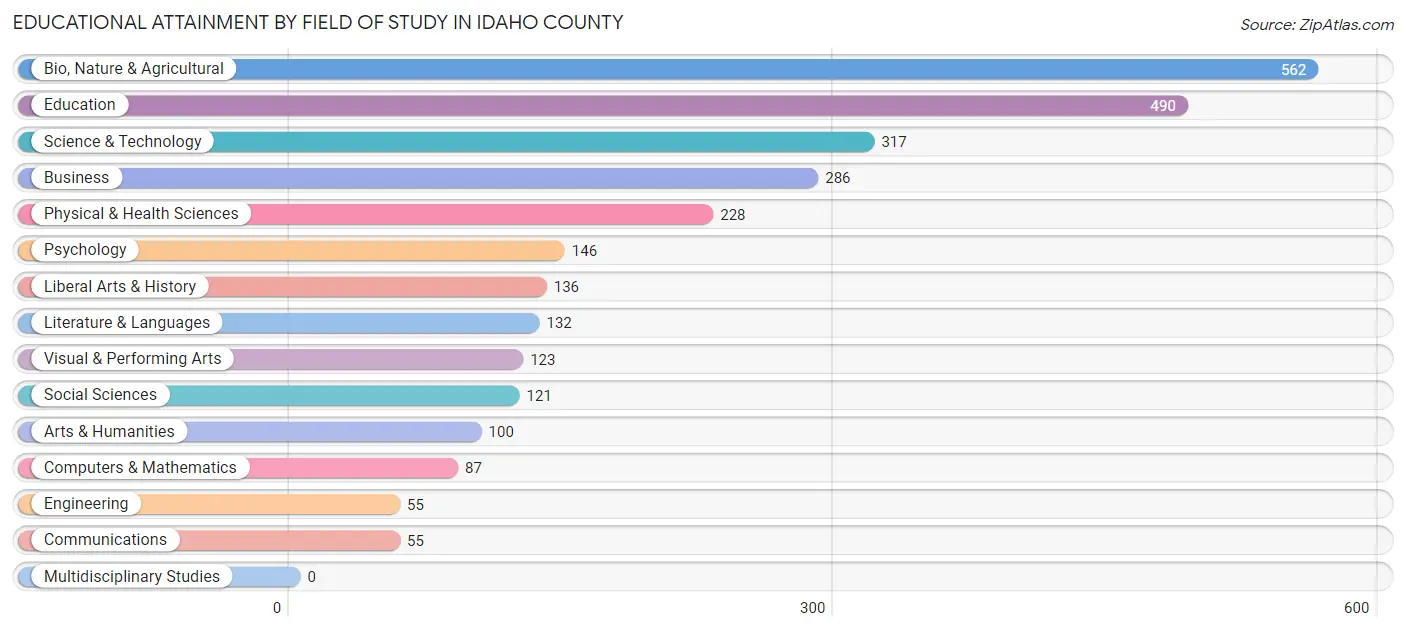
| Field of Study | # Graduates | % Graduates |
| Computers & Mathematics | 87 | 3.1% |
| Bio, Nature & Agricultural | 562 | 19.8% |
| Physical & Health Sciences | 228 | 8.0% |
| Psychology | 146 | 5.1% |
| Social Sciences | 121 | 4.3% |
| Engineering | 55 | 1.9% |
| Multidisciplinary Studies | 0 | 0.0% |
| Science & Technology | 317 | 11.2% |
| Business | 286 | 10.1% |
| Education | 490 | 17.3% |
| Literature & Languages | 132 | 4.6% |
| Liberal Arts & History | 136 | 4.8% |
| Visual & Performing Arts | 123 | 4.3% |
| Communications | 55 | 1.9% |
| Arts & Humanities | 100 | 3.5% |
| Total | 2,838 | 100.0% |
Transportation & Commute in Idaho County
Vehicle Availability by Sex in Idaho County
The most prevalent vehicle ownership categories in Idaho County are males with 3 vehicles (1,022, accounting for 29.5%) and females with 3 vehicles (859, making up 35.3%).
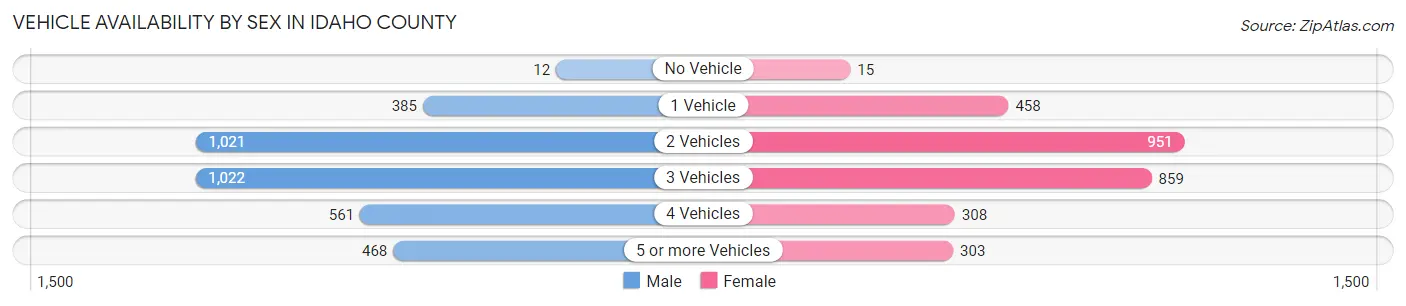
| Vehicles Available | Male | Female |
| No Vehicle | 12 (0.4%) | 15 (0.5%) |
| 1 Vehicle | 385 (11.1%) | 458 (15.8%) |
| 2 Vehicles | 1,021 (29.4%) | 951 (32.9%) |
| 3 Vehicles | 1,022 (29.5%) | 859 (29.7%) |
| 4 Vehicles | 561 (16.2%) | 308 (10.6%) |
| 5 or more Vehicles | 468 (13.5%) | 303 (10.5%) |
| Total | 3,469 (100.0%) | 2,894 (100.0%) |
Commute Time in Idaho County
The most frequently occuring commute durations in Idaho County are 5 to 9 minutes (1,812 commuters, 30.6%), less than 5 minutes (845 commuters, 14.3%), and 10 to 14 minutes (785 commuters, 13.3%).
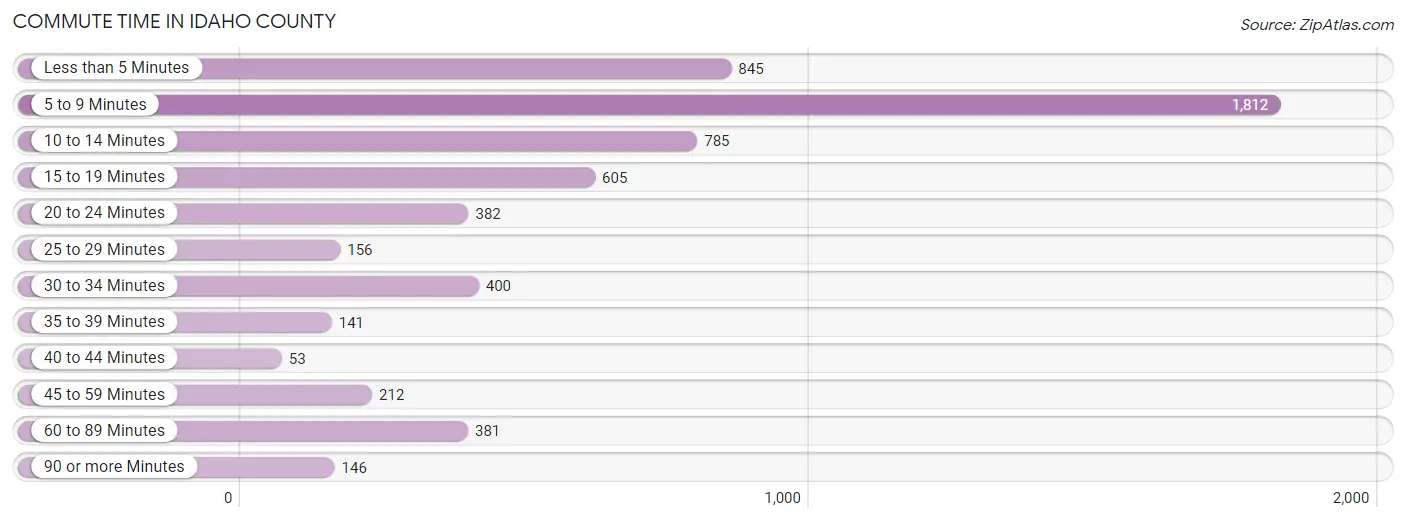
| Commute Time | # Commuters | % Commuters |
| Less than 5 Minutes | 845 | 14.3% |
| 5 to 9 Minutes | 1,812 | 30.6% |
| 10 to 14 Minutes | 785 | 13.3% |
| 15 to 19 Minutes | 605 | 10.2% |
| 20 to 24 Minutes | 382 | 6.5% |
| 25 to 29 Minutes | 156 | 2.6% |
| 30 to 34 Minutes | 400 | 6.8% |
| 35 to 39 Minutes | 141 | 2.4% |
| 40 to 44 Minutes | 53 | 0.9% |
| 45 to 59 Minutes | 212 | 3.6% |
| 60 to 89 Minutes | 381 | 6.4% |
| 90 or more Minutes | 146 | 2.5% |
Commute Time by Sex in Idaho County
The most common commute times in Idaho County are 5 to 9 minutes (901 commuters, 27.9%) for males and 5 to 9 minutes (911 commuters, 33.9%) for females.
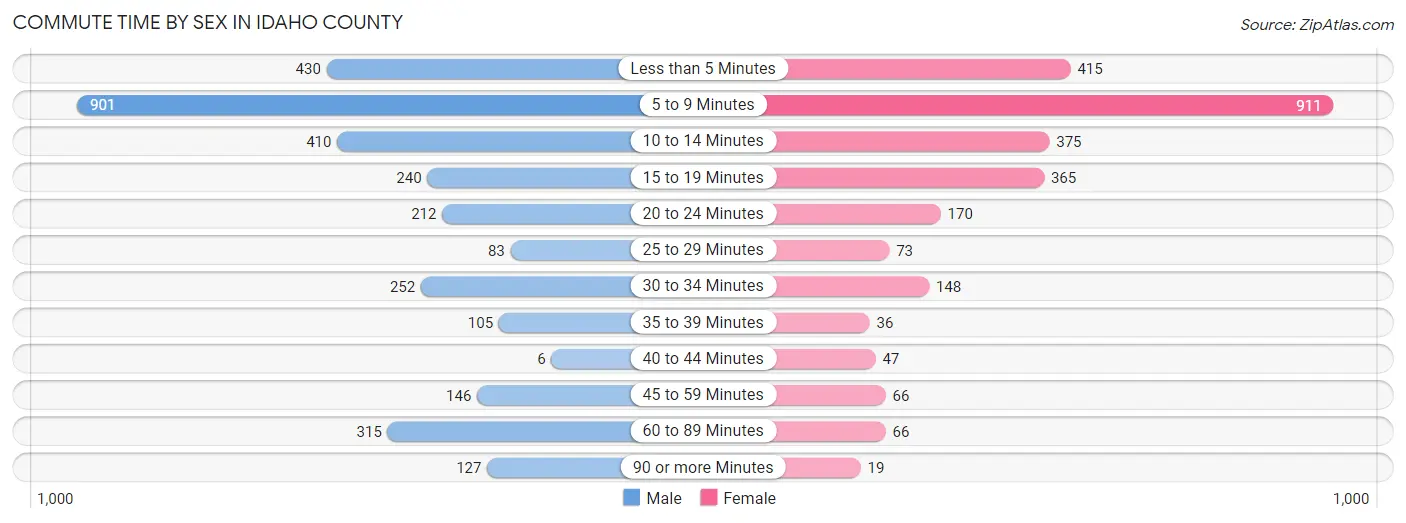
| Commute Time | Male | Female |
| Less than 5 Minutes | 430 (13.3%) | 415 (15.4%) |
| 5 to 9 Minutes | 901 (27.9%) | 911 (33.9%) |
| 10 to 14 Minutes | 410 (12.7%) | 375 (13.9%) |
| 15 to 19 Minutes | 240 (7.4%) | 365 (13.6%) |
| 20 to 24 Minutes | 212 (6.6%) | 170 (6.3%) |
| 25 to 29 Minutes | 83 (2.6%) | 73 (2.7%) |
| 30 to 34 Minutes | 252 (7.8%) | 148 (5.5%) |
| 35 to 39 Minutes | 105 (3.3%) | 36 (1.3%) |
| 40 to 44 Minutes | 6 (0.2%) | 47 (1.8%) |
| 45 to 59 Minutes | 146 (4.5%) | 66 (2.5%) |
| 60 to 89 Minutes | 315 (9.8%) | 66 (2.5%) |
| 90 or more Minutes | 127 (3.9%) | 19 (0.7%) |
Time of Departure to Work by Sex in Idaho County
The most frequent times of departure to work in Idaho County are 12:00 AM to 4:59 AM (614, 19.0%) for males and 7:30 AM to 7:59 AM (584, 21.7%) for females.
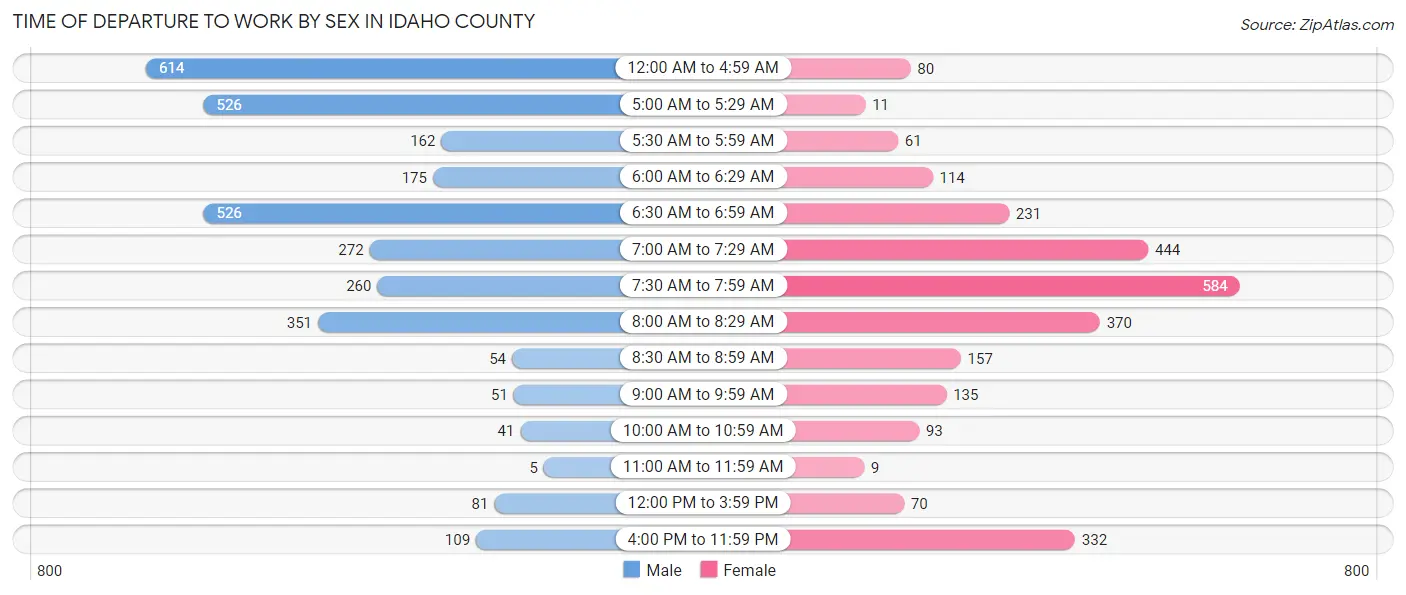
| Time of Departure | Male | Female |
| 12:00 AM to 4:59 AM | 614 (19.0%) | 80 (3.0%) |
| 5:00 AM to 5:29 AM | 526 (16.3%) | 11 (0.4%) |
| 5:30 AM to 5:59 AM | 162 (5.0%) | 61 (2.3%) |
| 6:00 AM to 6:29 AM | 175 (5.4%) | 114 (4.2%) |
| 6:30 AM to 6:59 AM | 526 (16.3%) | 231 (8.6%) |
| 7:00 AM to 7:29 AM | 272 (8.4%) | 444 (16.5%) |
| 7:30 AM to 7:59 AM | 260 (8.1%) | 584 (21.7%) |
| 8:00 AM to 8:29 AM | 351 (10.9%) | 370 (13.8%) |
| 8:30 AM to 8:59 AM | 54 (1.7%) | 157 (5.8%) |
| 9:00 AM to 9:59 AM | 51 (1.6%) | 135 (5.0%) |
| 10:00 AM to 10:59 AM | 41 (1.3%) | 93 (3.5%) |
| 11:00 AM to 11:59 AM | 5 (0.2%) | 9 (0.3%) |
| 12:00 PM to 3:59 PM | 81 (2.5%) | 70 (2.6%) |
| 4:00 PM to 11:59 PM | 109 (3.4%) | 332 (12.3%) |
| Total | 3,227 (100.0%) | 2,691 (100.0%) |
Housing Occupancy in Idaho County
Occupancy by Ownership in Idaho County
Of the total 6,603 dwellings in Idaho County, owner-occupied units account for 5,170 (78.3%), while renter-occupied units make up 1,433 (21.7%).
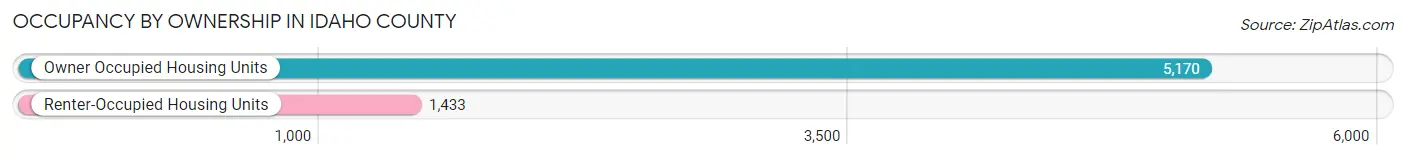
| Occupancy | # Housing Units | % Housing Units |
| Owner Occupied Housing Units | 5,170 | 78.3% |
| Renter-Occupied Housing Units | 1,433 | 21.7% |
| Total Occupied Housing Units | 6,603 | 100.0% |
Occupancy by Household Size in Idaho County
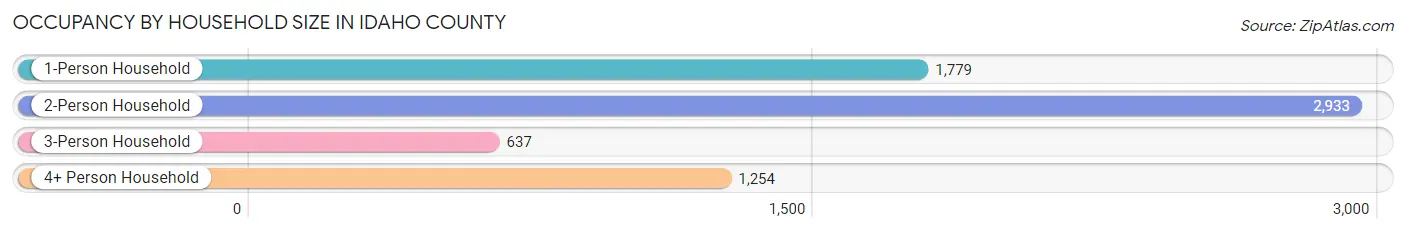
| Household Size | # Housing Units | % Housing Units |
| 1-Person Household | 1,779 | 26.9% |
| 2-Person Household | 2,933 | 44.4% |
| 3-Person Household | 637 | 9.7% |
| 4+ Person Household | 1,254 | 19.0% |
| Total Housing Units | 6,603 | 100.0% |
Occupancy by Ownership by Household Size in Idaho County
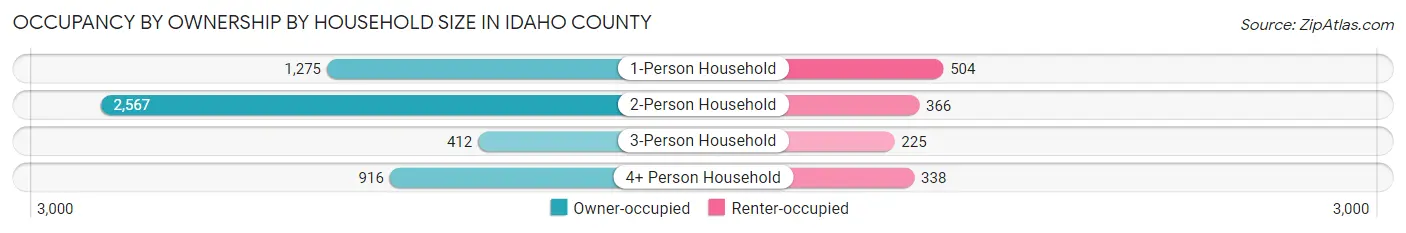
| Household Size | Owner-occupied | Renter-occupied |
| 1-Person Household | 1,275 (71.7%) | 504 (28.3%) |
| 2-Person Household | 2,567 (87.5%) | 366 (12.5%) |
| 3-Person Household | 412 (64.7%) | 225 (35.3%) |
| 4+ Person Household | 916 (73.1%) | 338 (27.0%) |
| Total Housing Units | 5,170 (78.3%) | 1,433 (21.7%) |
Occupancy by Educational Attainment in Idaho County
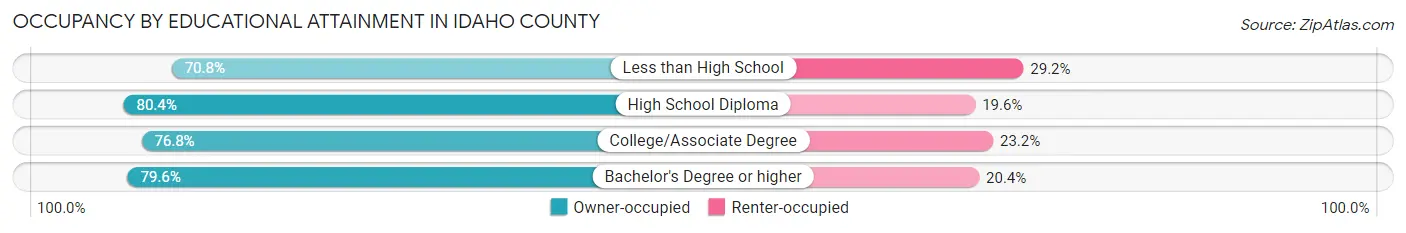
| Household Size | Owner-occupied | Renter-occupied |
| Less than High School | 284 (70.8%) | 117 (29.2%) |
| High School Diploma | 1,748 (80.4%) | 427 (19.6%) |
| College/Associate Degree | 1,867 (76.8%) | 563 (23.2%) |
| Bachelor's Degree or higher | 1,271 (79.6%) | 326 (20.4%) |
Occupancy by Age of Householder in Idaho County
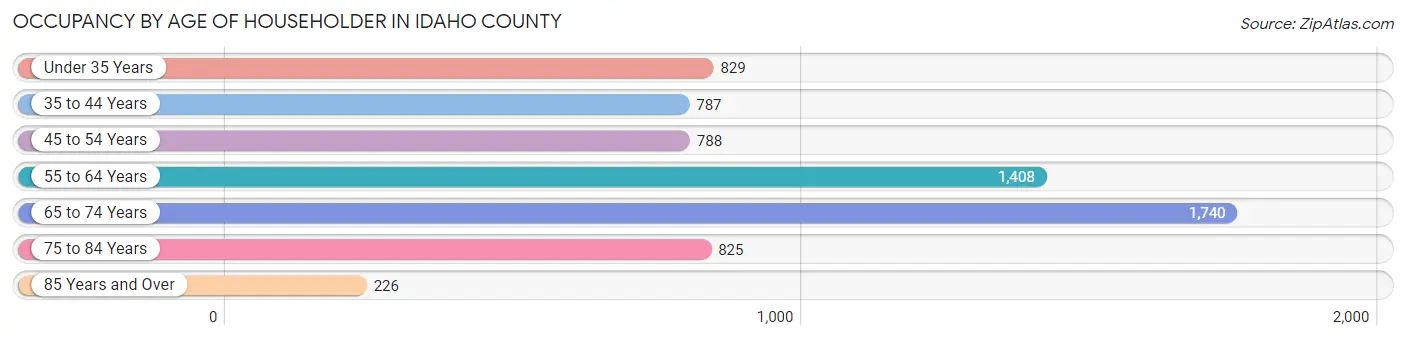
| Age Bracket | # Households | % Households |
| Under 35 Years | 829 | 12.6% |
| 35 to 44 Years | 787 | 11.9% |
| 45 to 54 Years | 788 | 11.9% |
| 55 to 64 Years | 1,408 | 21.3% |
| 65 to 74 Years | 1,740 | 26.4% |
| 75 to 84 Years | 825 | 12.5% |
| 85 Years and Over | 226 | 3.4% |
| Total | 6,603 | 100.0% |
Housing Finances in Idaho County
Median Income by Occupancy in Idaho County
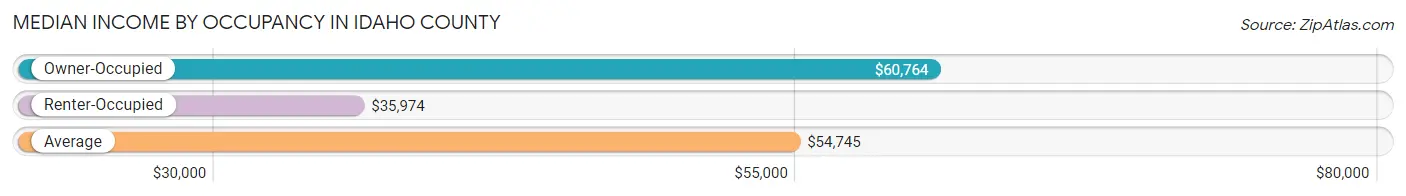
| Occupancy Type | # Households | Median Income |
| Owner-Occupied | 5,170 (78.3%) | $60,764 |
| Renter-Occupied | 1,433 (21.7%) | $35,974 |
| Average | 6,603 (100.0%) | $54,745 |
Occupancy by Householder Income Bracket in Idaho County
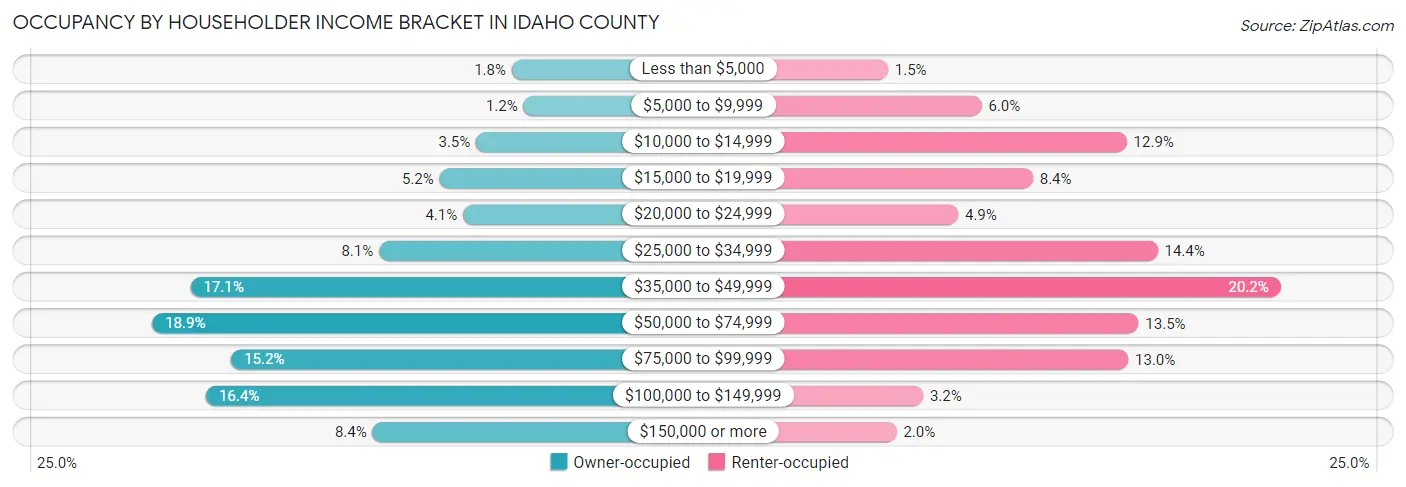
| Income Bracket | Owner-occupied | Renter-occupied |
| Less than $5,000 | 93 (1.8%) | 22 (1.5%) |
| $5,000 to $9,999 | 64 (1.2%) | 86 (6.0%) |
| $10,000 to $14,999 | 181 (3.5%) | 185 (12.9%) |
| $15,000 to $19,999 | 271 (5.2%) | 121 (8.4%) |
| $20,000 to $24,999 | 213 (4.1%) | 70 (4.9%) |
| $25,000 to $34,999 | 420 (8.1%) | 206 (14.4%) |
| $35,000 to $49,999 | 884 (17.1%) | 290 (20.2%) |
| $50,000 to $74,999 | 978 (18.9%) | 193 (13.5%) |
| $75,000 to $99,999 | 784 (15.2%) | 186 (13.0%) |
| $100,000 to $149,999 | 846 (16.4%) | 46 (3.2%) |
| $150,000 or more | 436 (8.4%) | 28 (1.9%) |
| Total | 5,170 (100.0%) | 1,433 (100.0%) |
Monthly Housing Cost Tiers in Idaho County

| Monthly Cost | Owner-occupied | Renter-occupied |
| Less than $300 | 1,032 (20.0%) | 29 (2.0%) |
| $300 to $499 | 1,342 (26.0%) | 148 (10.3%) |
| $500 to $799 | 631 (12.2%) | 520 (36.3%) |
| $800 to $999 | 278 (5.4%) | 94 (6.6%) |
| $1,000 to $1,499 | 1,065 (20.6%) | 377 (26.3%) |
| $1,500 to $1,999 | 490 (9.5%) | 13 (0.9%) |
| $2,000 to $2,499 | 194 (3.7%) | 3 (0.2%) |
| $2,500 to $2,999 | 41 (0.8%) | 0 (0.0%) |
| $3,000 or more | 97 (1.9%) | 0 (0.0%) |
| Total | 5,170 (100.0%) | 1,433 (100.0%) |
Physical Housing Characteristics in Idaho County
Housing Structures in Idaho County
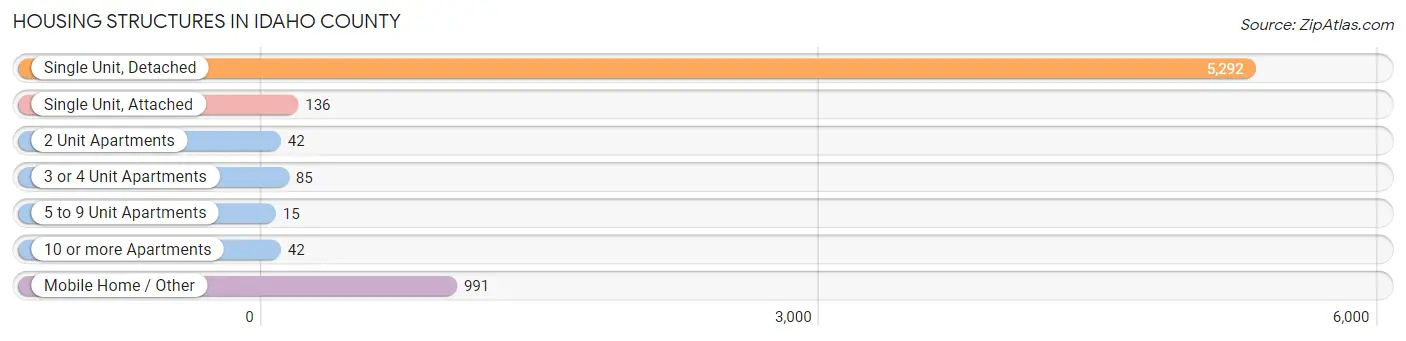
| Structure Type | # Housing Units | % Housing Units |
| Single Unit, Detached | 5,292 | 80.1% |
| Single Unit, Attached | 136 | 2.1% |
| 2 Unit Apartments | 42 | 0.6% |
| 3 or 4 Unit Apartments | 85 | 1.3% |
| 5 to 9 Unit Apartments | 15 | 0.2% |
| 10 or more Apartments | 42 | 0.6% |
| Mobile Home / Other | 991 | 15.0% |
| Total | 6,603 | 100.0% |
Housing Structures by Occupancy in Idaho County
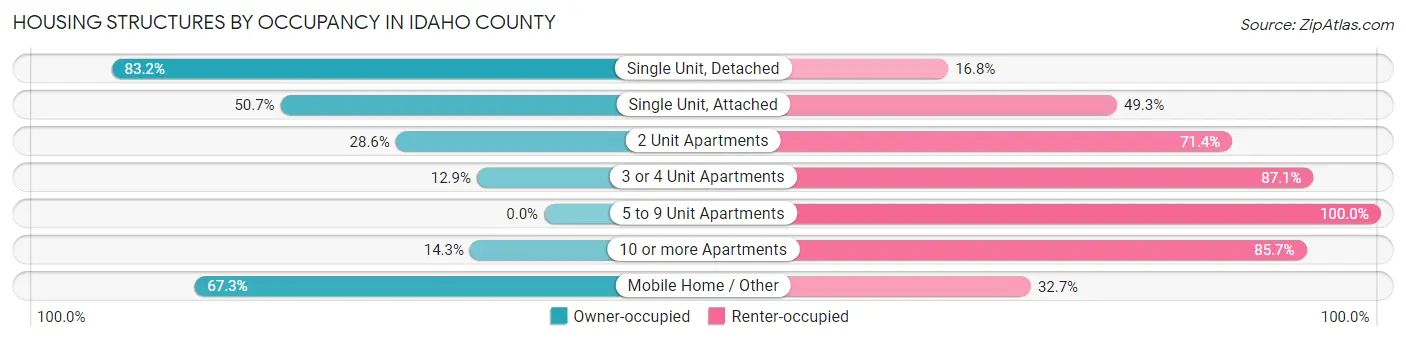
| Structure Type | Owner-occupied | Renter-occupied |
| Single Unit, Detached | 4,405 (83.2%) | 887 (16.8%) |
| Single Unit, Attached | 69 (50.7%) | 67 (49.3%) |
| 2 Unit Apartments | 12 (28.6%) | 30 (71.4%) |
| 3 or 4 Unit Apartments | 11 (12.9%) | 74 (87.1%) |
| 5 to 9 Unit Apartments | 0 (0.0%) | 15 (100.0%) |
| 10 or more Apartments | 6 (14.3%) | 36 (85.7%) |
| Mobile Home / Other | 667 (67.3%) | 324 (32.7%) |
| Total | 5,170 (78.3%) | 1,433 (21.7%) |
Housing Structures by Number of Rooms in Idaho County
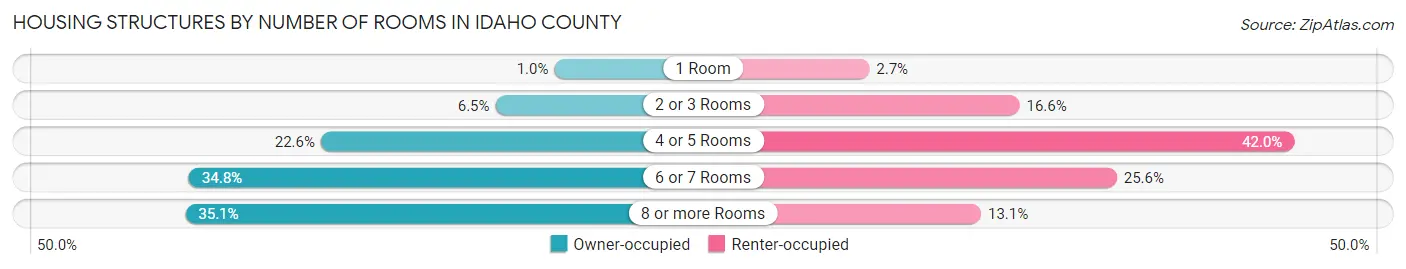
| Number of Rooms | Owner-occupied | Renter-occupied |
| 1 Room | 52 (1.0%) | 39 (2.7%) |
| 2 or 3 Rooms | 334 (6.5%) | 238 (16.6%) |
| 4 or 5 Rooms | 1,169 (22.6%) | 602 (42.0%) |
| 6 or 7 Rooms | 1,799 (34.8%) | 367 (25.6%) |
| 8 or more Rooms | 1,816 (35.1%) | 187 (13.1%) |
| Total | 5,170 (100.0%) | 1,433 (100.0%) |
Housing Structure by Heating Type in Idaho County
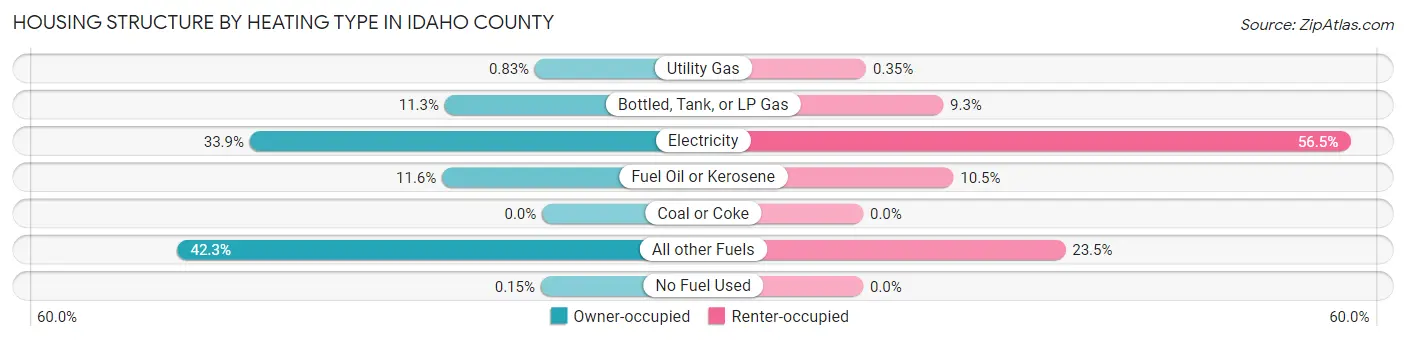
| Heating Type | Owner-occupied | Renter-occupied |
| Utility Gas | 43 (0.8%) | 5 (0.4%) |
| Bottled, Tank, or LP Gas | 583 (11.3%) | 133 (9.3%) |
| Electricity | 1,752 (33.9%) | 809 (56.5%) |
| Fuel Oil or Kerosene | 599 (11.6%) | 150 (10.5%) |
| Coal or Coke | 0 (0.0%) | 0 (0.0%) |
| All other Fuels | 2,185 (42.3%) | 336 (23.4%) |
| No Fuel Used | 8 (0.2%) | 0 (0.0%) |
| Total | 5,170 (100.0%) | 1,433 (100.0%) |
Household Vehicle Usage in Idaho County
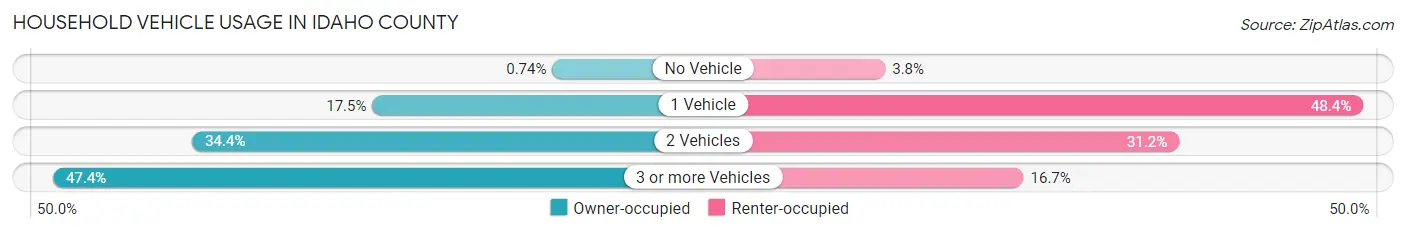
| Vehicles per Household | Owner-occupied | Renter-occupied |
| No Vehicle | 38 (0.7%) | 54 (3.8%) |
| 1 Vehicle | 907 (17.5%) | 693 (48.4%) |
| 2 Vehicles | 1,777 (34.4%) | 447 (31.2%) |
| 3 or more Vehicles | 2,448 (47.3%) | 239 (16.7%) |
| Total | 5,170 (100.0%) | 1,433 (100.0%) |
Real Estate & Mortgages in Idaho County
Real Estate and Mortgage Overview in Idaho County
| Characteristic | Without Mortgage | With Mortgage |
| Housing Units | 2,949 | 2,221 |
| Median Property Value | $247,600 | $272,200 |
| Median Household Income | $54,351 | $175 |
| Monthly Housing Costs | $357 | $68 |
| Real Estate Taxes | $916 | $45 |
Property Value by Mortgage Status in Idaho County
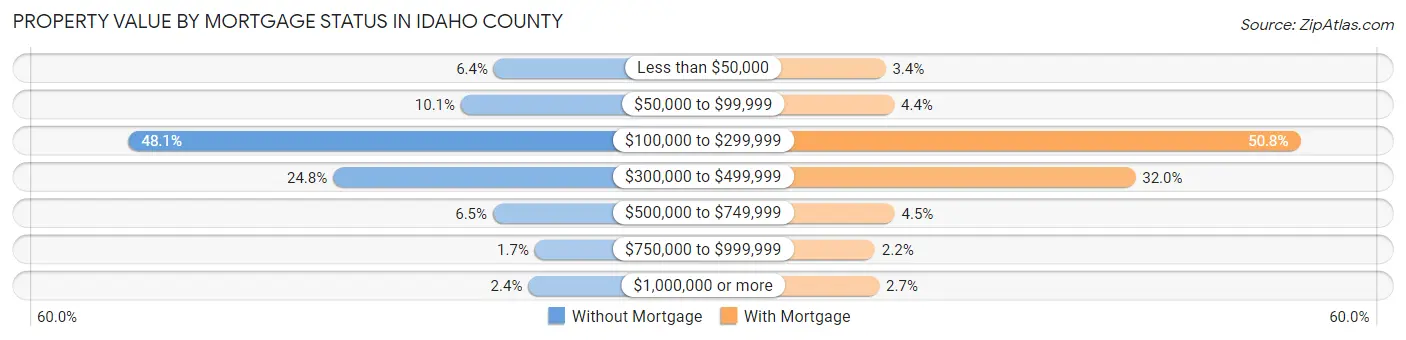
| Property Value | Without Mortgage | With Mortgage |
| Less than $50,000 | 188 (6.4%) | 76 (3.4%) |
| $50,000 to $99,999 | 299 (10.1%) | 98 (4.4%) |
| $100,000 to $299,999 | 1,419 (48.1%) | 1,129 (50.8%) |
| $300,000 to $499,999 | 730 (24.7%) | 710 (32.0%) |
| $500,000 to $749,999 | 191 (6.5%) | 99 (4.5%) |
| $750,000 to $999,999 | 50 (1.7%) | 49 (2.2%) |
| $1,000,000 or more | 72 (2.4%) | 60 (2.7%) |
| Total | 2,949 (100.0%) | 2,221 (100.0%) |
Household Income by Mortgage Status in Idaho County
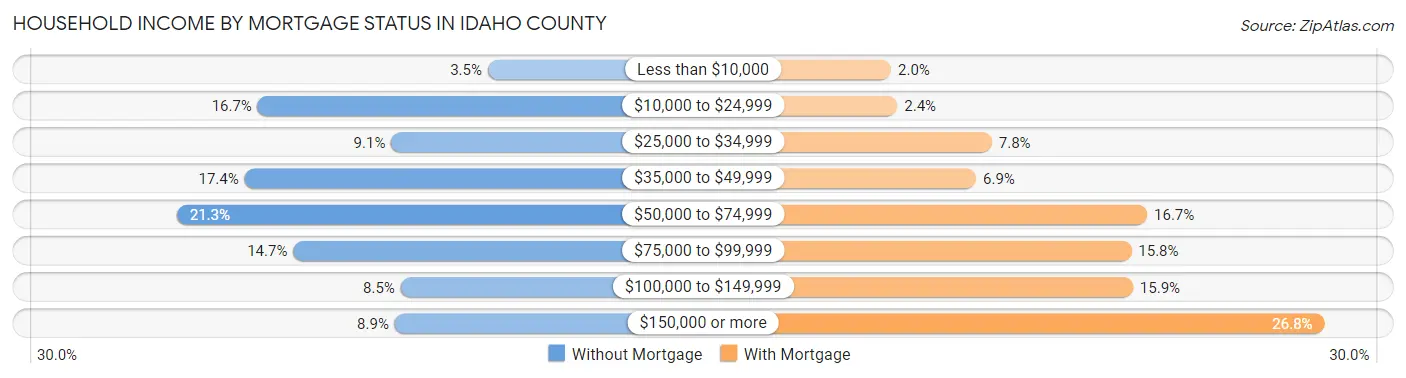
| Household Income | Without Mortgage | With Mortgage |
| Less than $10,000 | 104 (3.5%) | 45 (2.0%) |
| $10,000 to $24,999 | 492 (16.7%) | 53 (2.4%) |
| $25,000 to $34,999 | 267 (9.0%) | 173 (7.8%) |
| $35,000 to $49,999 | 514 (17.4%) | 153 (6.9%) |
| $50,000 to $74,999 | 628 (21.3%) | 370 (16.7%) |
| $75,000 to $99,999 | 432 (14.6%) | 350 (15.8%) |
| $100,000 to $149,999 | 251 (8.5%) | 352 (15.9%) |
| $150,000 or more | 261 (8.8%) | 595 (26.8%) |
| Total | 2,949 (100.0%) | 2,221 (100.0%) |
Property Value to Household Income Ratio in Idaho County
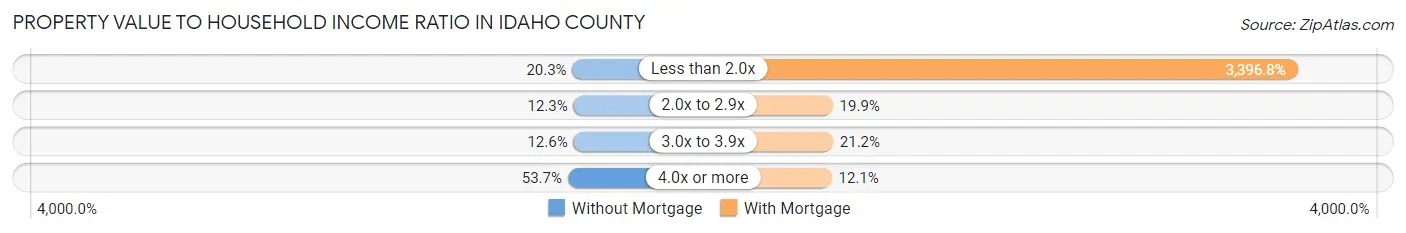
| Value-to-Income Ratio | Without Mortgage | With Mortgage |
| Less than 2.0x | 598 (20.3%) | 75,442 (3,396.8%) |
| 2.0x to 2.9x | 362 (12.3%) | 442 (19.9%) |
| 3.0x to 3.9x | 371 (12.6%) | 471 (21.2%) |
| 4.0x or more | 1,582 (53.6%) | 269 (12.1%) |
| Total | 2,949 (100.0%) | 2,221 (100.0%) |
Real Estate Taxes by Mortgage Status in Idaho County
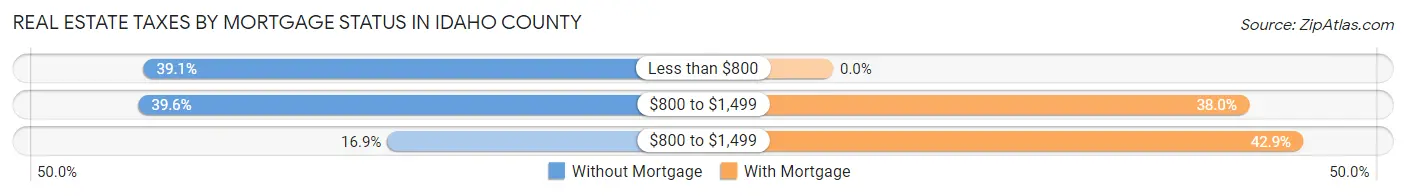
| Property Taxes | Without Mortgage | With Mortgage |
| Less than $800 | 1,154 (39.1%) | 0 (0.0%) |
| $800 to $1,499 | 1,168 (39.6%) | 843 (38.0%) |
| $800 to $1,499 | 498 (16.9%) | 953 (42.9%) |
| Total | 2,949 (100.0%) | 2,221 (100.0%) |
Health & Disability in Idaho County
Health Insurance Coverage by Age in Idaho County
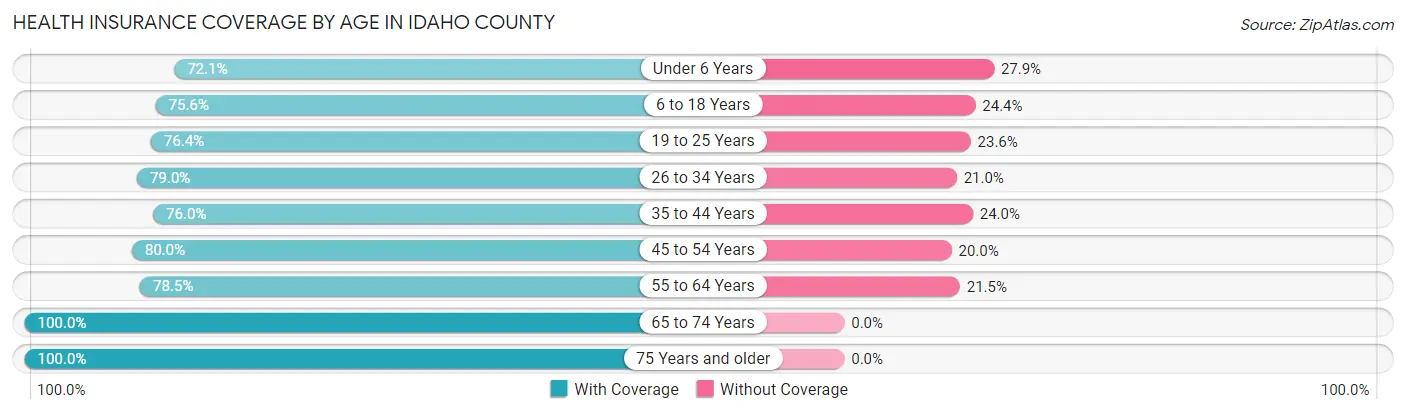
| Age Bracket | With Coverage | Without Coverage |
| Under 6 Years | 736 (72.1%) | 285 (27.9%) |
| 6 to 18 Years | 1,812 (75.6%) | 586 (24.4%) |
| 19 to 25 Years | 691 (76.4%) | 213 (23.6%) |
| 26 to 34 Years | 1,082 (79.0%) | 287 (21.0%) |
| 35 to 44 Years | 1,168 (76.0%) | 368 (24.0%) |
| 45 to 54 Years | 1,320 (80.0%) | 330 (20.0%) |
| 55 to 64 Years | 2,124 (78.5%) | 583 (21.5%) |
| 65 to 74 Years | 2,852 (100.0%) | 0 (0.0%) |
| 75 Years and older | 1,815 (100.0%) | 0 (0.0%) |
| Total | 13,600 (83.7%) | 2,652 (16.3%) |
Health Insurance Coverage by Citizenship Status in Idaho County
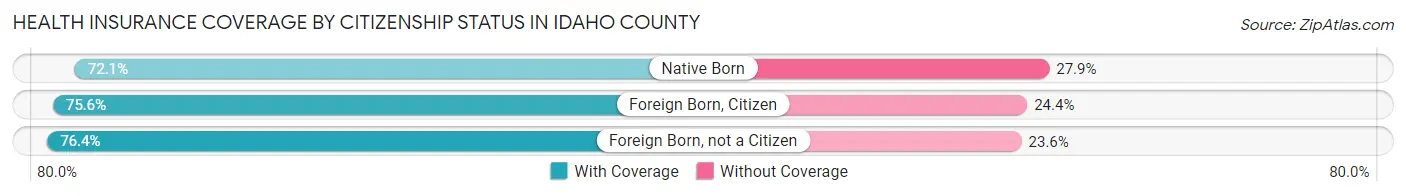
| Citizenship Status | With Coverage | Without Coverage |
| Native Born | 736 (72.1%) | 285 (27.9%) |
| Foreign Born, Citizen | 1,812 (75.6%) | 586 (24.4%) |
| Foreign Born, not a Citizen | 691 (76.4%) | 213 (23.6%) |
Health Insurance Coverage by Household Income in Idaho County
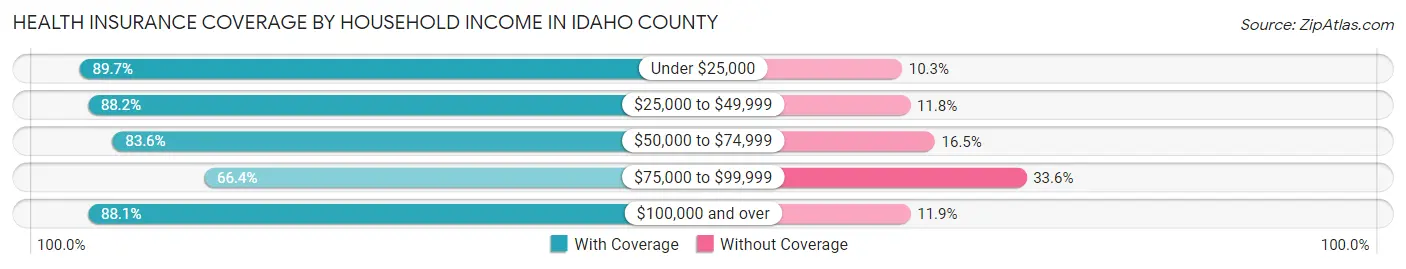
| Household Income | With Coverage | Without Coverage |
| Under $25,000 | 1,748 (89.7%) | 201 (10.3%) |
| $25,000 to $49,999 | 3,514 (88.2%) | 472 (11.8%) |
| $50,000 to $74,999 | 2,443 (83.6%) | 481 (16.5%) |
| $75,000 to $99,999 | 1,862 (66.4%) | 943 (33.6%) |
| $100,000 and over | 3,944 (88.1%) | 532 (11.9%) |
Public vs Private Health Insurance Coverage by Age in Idaho County
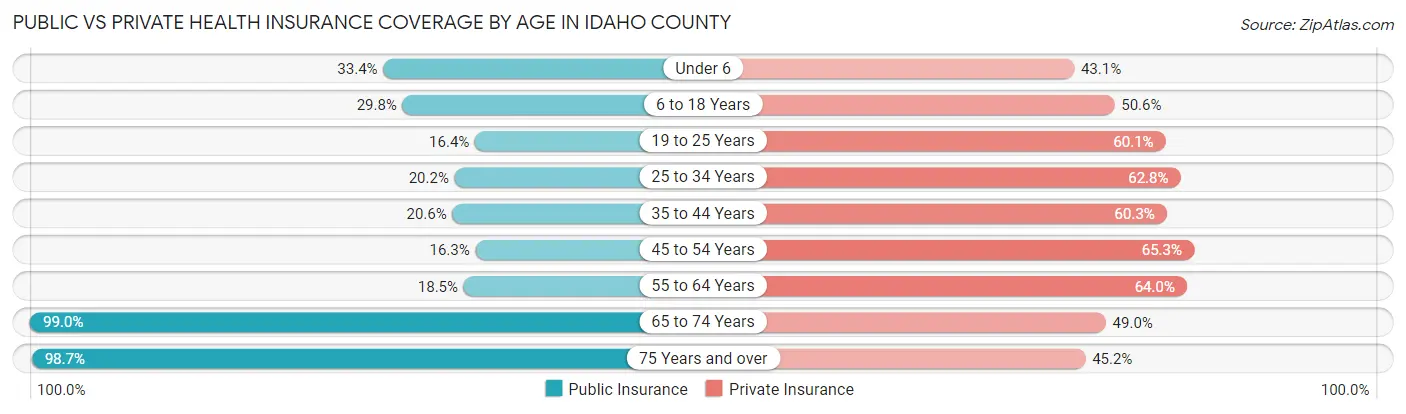
| Age Bracket | Public Insurance | Private Insurance |
| Under 6 | 341 (33.4%) | 440 (43.1%) |
| 6 to 18 Years | 715 (29.8%) | 1,213 (50.6%) |
| 19 to 25 Years | 148 (16.4%) | 543 (60.1%) |
| 25 to 34 Years | 276 (20.2%) | 860 (62.8%) |
| 35 to 44 Years | 316 (20.6%) | 926 (60.3%) |
| 45 to 54 Years | 269 (16.3%) | 1,078 (65.3%) |
| 55 to 64 Years | 500 (18.5%) | 1,733 (64.0%) |
| 65 to 74 Years | 2,823 (99.0%) | 1,397 (49.0%) |
| 75 Years and over | 1,791 (98.7%) | 820 (45.2%) |
| Total | 7,179 (44.2%) | 9,010 (55.4%) |
Disability Status by Sex by Age in Idaho County
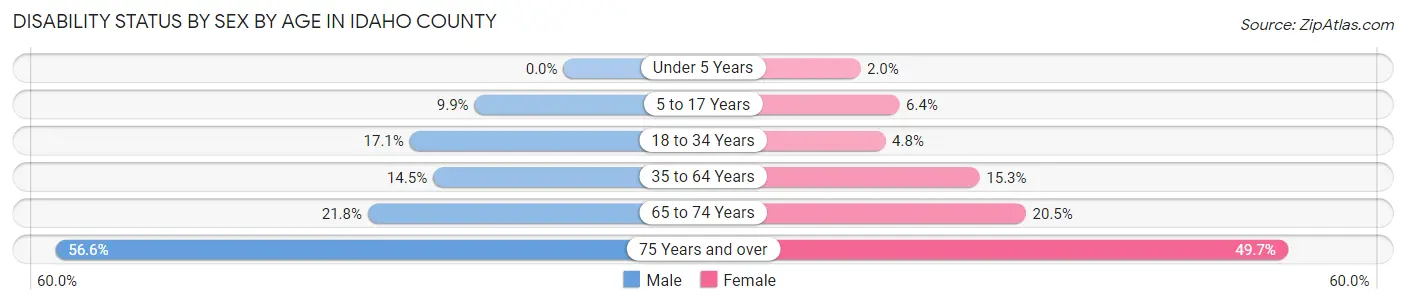
| Age Bracket | Male | Female |
| Under 5 Years | 0 (0.0%) | 7 (2.0%) |
| 5 to 17 Years | 118 (9.9%) | 78 (6.4%) |
| 18 to 34 Years | 219 (17.1%) | 56 (4.8%) |
| 35 to 64 Years | 418 (14.5%) | 462 (15.3%) |
| 65 to 74 Years | 335 (21.8%) | 269 (20.5%) |
| 75 Years and over | 546 (56.6%) | 422 (49.6%) |
Disability Class by Sex by Age in Idaho County
Disability Class: Hearing Difficulty
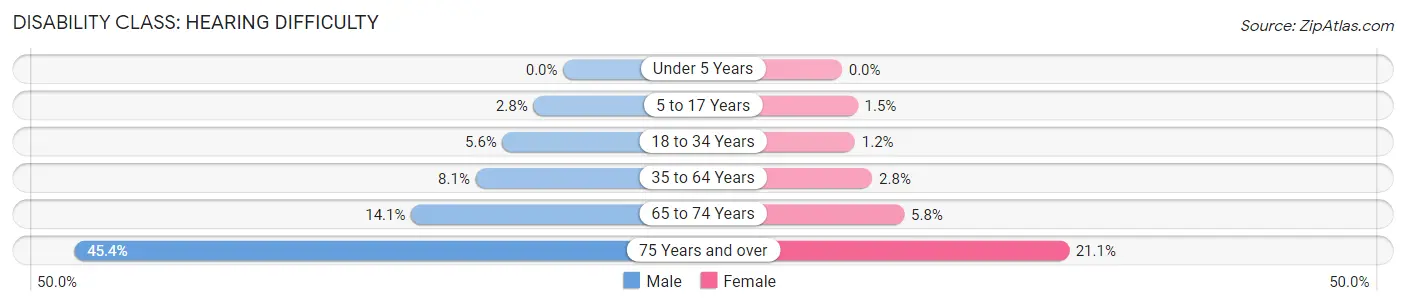
| Age Bracket | Male | Female |
| Under 5 Years | 0 (0.0%) | 0 (0.0%) |
| 5 to 17 Years | 33 (2.8%) | 18 (1.5%) |
| 18 to 34 Years | 72 (5.6%) | 14 (1.2%) |
| 35 to 64 Years | 234 (8.1%) | 85 (2.8%) |
| 65 to 74 Years | 217 (14.1%) | 76 (5.8%) |
| 75 Years and over | 438 (45.4%) | 179 (21.1%) |
Disability Class: Vision Difficulty
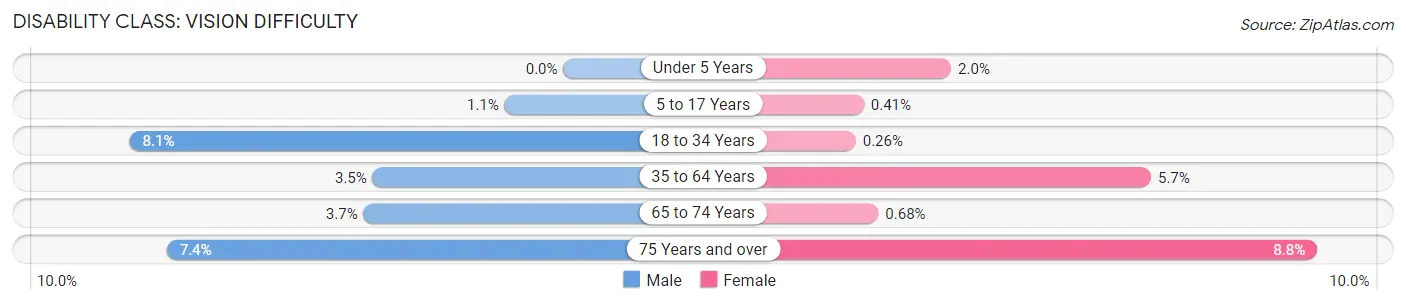
| Age Bracket | Male | Female |
| Under 5 Years | 0 (0.0%) | 7 (2.0%) |
| 5 to 17 Years | 13 (1.1%) | 5 (0.4%) |
| 18 to 34 Years | 103 (8.1%) | 3 (0.3%) |
| 35 to 64 Years | 102 (3.5%) | 173 (5.7%) |
| 65 to 74 Years | 57 (3.7%) | 9 (0.7%) |
| 75 Years and over | 71 (7.4%) | 75 (8.8%) |
Disability Class: Cognitive Difficulty
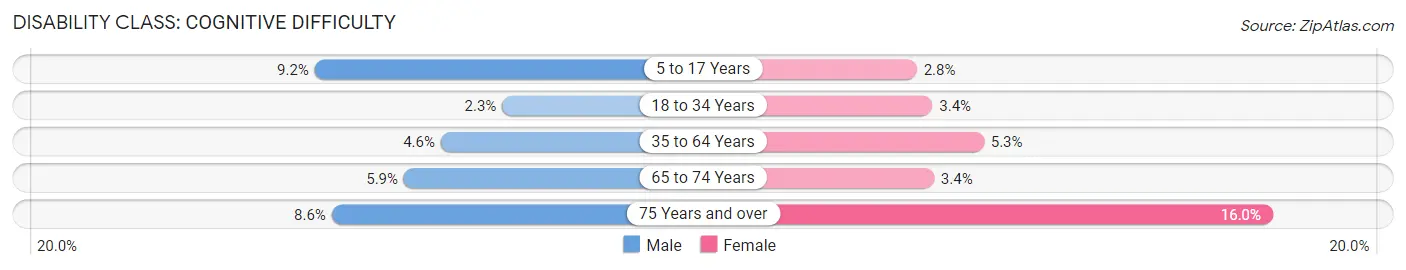
| Age Bracket | Male | Female |
| 5 to 17 Years | 110 (9.2%) | 34 (2.8%) |
| 18 to 34 Years | 29 (2.3%) | 39 (3.4%) |
| 35 to 64 Years | 131 (4.5%) | 159 (5.3%) |
| 65 to 74 Years | 91 (5.9%) | 45 (3.4%) |
| 75 Years and over | 83 (8.6%) | 136 (16.0%) |
Disability Class: Ambulatory Difficulty
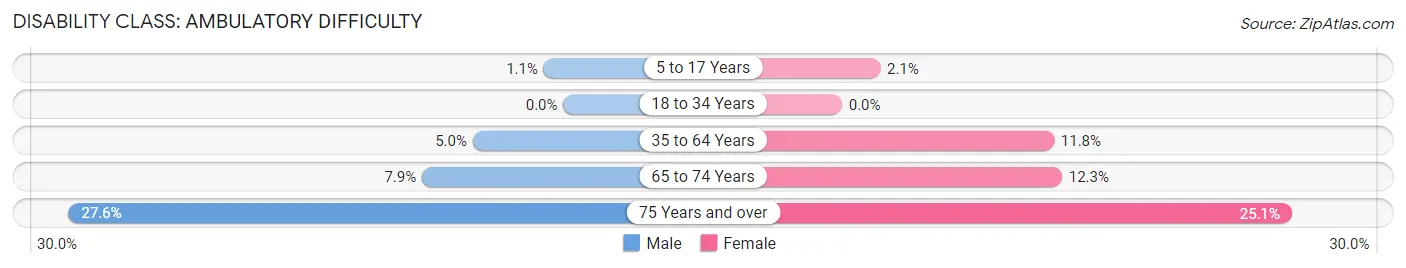
| Age Bracket | Male | Female |
| 5 to 17 Years | 13 (1.1%) | 26 (2.1%) |
| 18 to 34 Years | 0 (0.0%) | 0 (0.0%) |
| 35 to 64 Years | 145 (5.0%) | 356 (11.8%) |
| 65 to 74 Years | 121 (7.9%) | 161 (12.2%) |
| 75 Years and over | 266 (27.6%) | 213 (25.1%) |
Disability Class: Self-Care Difficulty
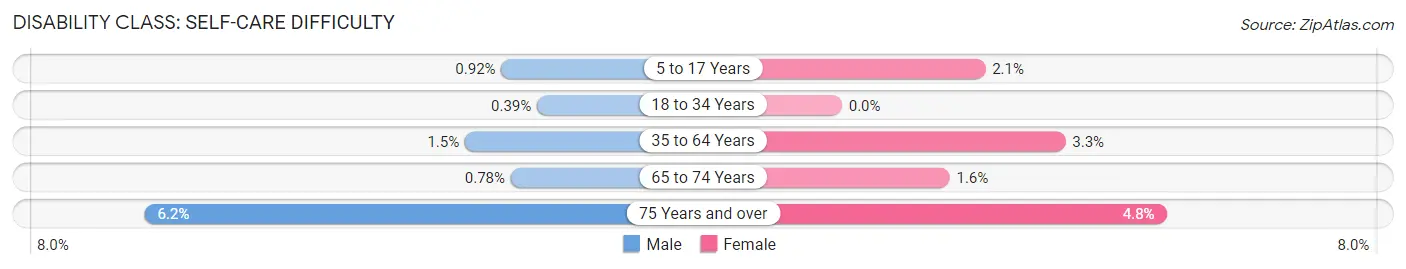
| Age Bracket | Male | Female |
| 5 to 17 Years | 11 (0.9%) | 26 (2.1%) |
| 18 to 34 Years | 5 (0.4%) | 0 (0.0%) |
| 35 to 64 Years | 42 (1.5%) | 100 (3.3%) |
| 65 to 74 Years | 12 (0.8%) | 21 (1.6%) |
| 75 Years and over | 60 (6.2%) | 41 (4.8%) |
Technology Access in Idaho County
Computing Device Access in Idaho County
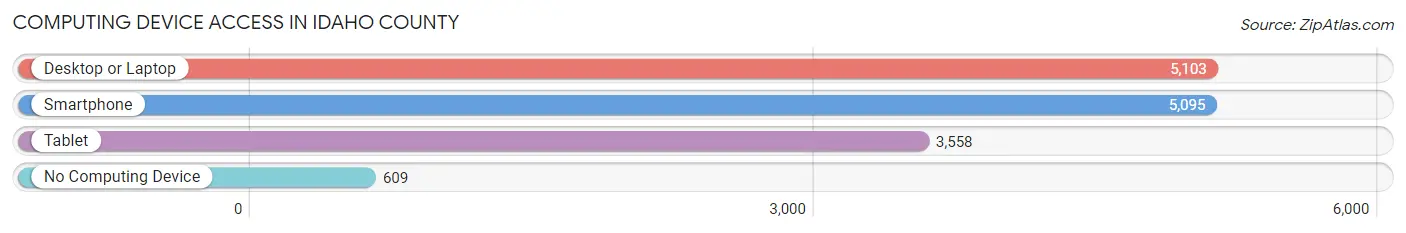
| Device Type | # Households | % Households |
| Desktop or Laptop | 5,103 | 77.3% |
| Smartphone | 5,095 | 77.2% |
| Tablet | 3,558 | 53.9% |
| No Computing Device | 609 | 9.2% |
| Total | 6,603 | 100.0% |
Internet Access in Idaho County
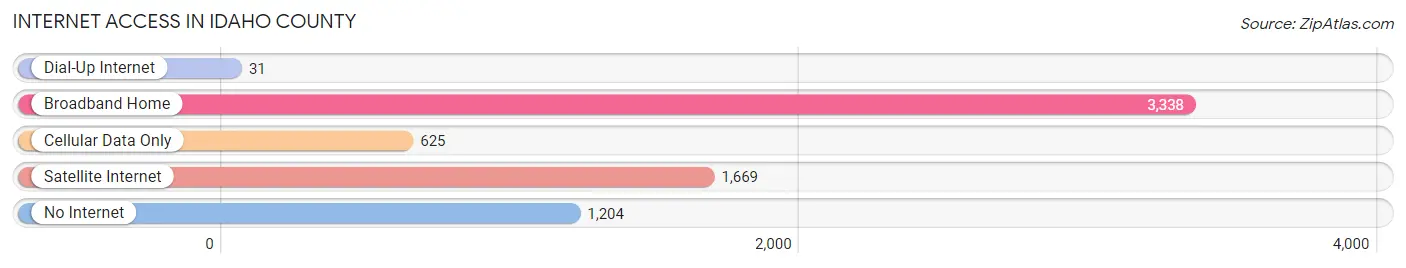
| Internet Type | # Households | % Households |
| Dial-Up Internet | 31 | 0.5% |
| Broadband Home | 3,338 | 50.5% |
| Cellular Data Only | 625 | 9.5% |
| Satellite Internet | 1,669 | 25.3% |
| No Internet | 1,204 | 18.2% |
| Total | 6,603 | 100.0% |
Idaho County Summary
Idaho County is located in the north-central region of the U.S. state of Idaho. It is the largest county in the state, covering an area of 8,503 square miles. The county seat is Grangeville, and the largest city is Riggins. As of the 2010 census, the population was 16,267.
Geography
Idaho County is located in the north-central region of Idaho, bordered by Clearwater County to the north, Nez Perce County to the east, Adams County to the south, and Lewis County to the west. The county is mountainous, with the Salmon River Mountains to the west and the Bitterroot Mountains to the east. The highest point in the county is the summit of Mount Idaho, at 9,890 feet. The county also contains the Frank Church-River of No Return Wilderness, the largest wilderness area in the contiguous United States.
The county is home to several rivers, including the Salmon River, the Clearwater River, the Selway River, and the Lochsa River. The county also contains several lakes, including Lake Cascade, Lake Walcott, and Lake Lowell.
Economy
The economy of Idaho County is largely based on agriculture and timber. The county is home to several large timber companies, including Potlatch Corporation and Boise Cascade. Agriculture is also important to the economy, with the county producing hay, wheat, barley, and potatoes.
The county is also home to several recreational activities, including fishing, hunting, camping, and hiking. The county is home to several ski resorts, including Tamarack Resort and Brundage Mountain Resort.
Demographics
As of the 2010 census, there were 16,267 people, 6,717 households, and 4,717 families residing in the county. The population density was 2 people per square mile. There were 8,845 housing units at an average density of 1 per square mile. The racial makeup of the county was 95.3% White, 0.3% Native American, 0.2% Asian, 0.1% Black or African American, 0.1% Pacific Islander, 2.2% from other races, and 1.8% from two or more races. Hispanic or Latino of any race were 4.2% of the population.
The median income for a household in the county was $32,917, and the median income for a family was $39,813. Males had a median income of $30,917 versus $21,917 for females. The per capita income for the county was $17,845. About 11.2% of families and 15.2% of the population were below the poverty line, including 19.2% of those under age 18 and 8.7% of those age 65 or over.
Conclusion
Idaho County is the largest county in the state of Idaho, covering an area of 8,503 square miles. The county is home to several rivers and lakes, and is known for its timber and agricultural industries. The population of the county is 16,267, with the median income for a household being $32,917. The county is also home to several recreational activities, including fishing, hunting, camping, and skiing.
Common Questions
What is Per Capita Income in Idaho County?
Per Capita income in Idaho County is $29,657.
What is the Median Family Income in Idaho County?
Median Family Income in Idaho County is $66,406.
What is the Median Household income in Idaho County?
Median Household Income in Idaho County is $54,745.
What is Income or Wage Gap in Idaho County?
Income or Wage Gap in Idaho County is 29.9%.
Women in Idaho County earn 70.1 cents for every dollar earned by a man.
What is Family Income Deficit in Idaho County?
Family Income Deficit in Idaho County is $7,512.
Families that are below poverty line in Idaho County earn $7,512 less on average than the poverty threshold level.
What is Inequality or Gini Index in Idaho County?
Inequality or Gini Index in Idaho County is 0.43.
What is the Total Population of Idaho County?
Total Population of Idaho County is 16,787.
What is the Total Male Population of Idaho County?
Total Male Population of Idaho County is 8,835.
What is the Total Female Population of Idaho County?
Total Female Population of Idaho County is 7,952.
What is the Ratio of Males per 100 Females in Idaho County?
There are 111.10 Males per 100 Females in Idaho County.
What is the Ratio of Females per 100 Males in Idaho County?
There are 90.01 Females per 100 Males in Idaho County.
What is the Median Population Age in Idaho County?
Median Population Age in Idaho County is 49.5 Years.
What is the Average Family Size in Idaho County
Average Family Size in Idaho County is 3.0 People.
What is the Average Household Size in Idaho County
Average Household Size in Idaho County is 2.4 People.
How Large is the Labor Force in Idaho County?
There are 6,889 People in the Labor Forcein in Idaho County.
What is the Percentage of People in the Labor Force in Idaho County?
49.6% of People are in the Labor Force in Idaho County.
What is the Unemployment Rate in Idaho County?
Unemployment Rate in Idaho County is 4.3%.