Star, ID Map & Demographics
Star Map
Star Overview
$41,965
PER CAPITA INCOME
$100,565
AVG FAMILY INCOME
$88,625
AVG HOUSEHOLD INCOME
28.7%
WAGE / INCOME GAP [ % ]
71.3¢/ $1
WAGE / INCOME GAP [ $ ]
$15,479
FAMILY INCOME DEFICIT
0.41
INEQUALITY / GINI INDEX
11,971
TOTAL POPULATION
6,221
MALE POPULATION
5,750
FEMALE POPULATION
108.19
MALES / 100 FEMALES
92.43
FEMALES / 100 MALES
41.4
MEDIAN AGE
3.4
AVG FAMILY SIZE
2.8
AVG HOUSEHOLD SIZE
6,159
LABOR FORCE [ PEOPLE ]
64.5%
PERCENT IN LABOR FORCE
7.3%
UNEMPLOYMENT RATE
Star Zip Codes
Star Area Codes
Income in Star
Income Overview in Star
Per Capita Income in Star is $41,965, while median incomes of families and households are $100,565 and $88,625 respectively.
| Characteristic | Number | Measure |
| Per Capita Income | 11,971 | $41,965 |
| Median Family Income | 3,078 | $100,565 |
| Mean Family Income | 3,078 | $122,569 |
| Median Household Income | 4,258 | $88,625 |
| Mean Household Income | 4,258 | $112,302 |
| Income Deficit | 3,078 | $15,479 |
| Wage / Income Gap (%) | 11,971 | 28.73% |
| Wage / Income Gap ($) | 11,971 | 71.27¢ per $1 |
| Gini / Inequality Index | 11,971 | 0.41 |
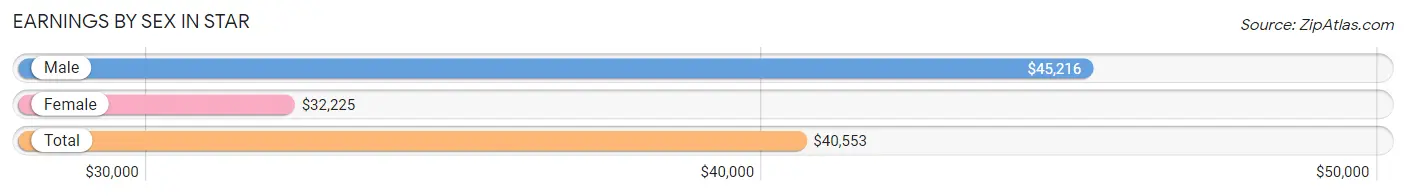
Earnings by Sex in Star
Average Earnings in Star are $40,553, $45,216 for men and $32,225 for women, a difference of 28.7%.
| Sex | Number | Average Earnings |
| Male | 3,767 (60.0%) | $45,216 |
| Female | 2,508 (40.0%) | $32,225 |
| Total | 6,275 (100.0%) | $40,553 |
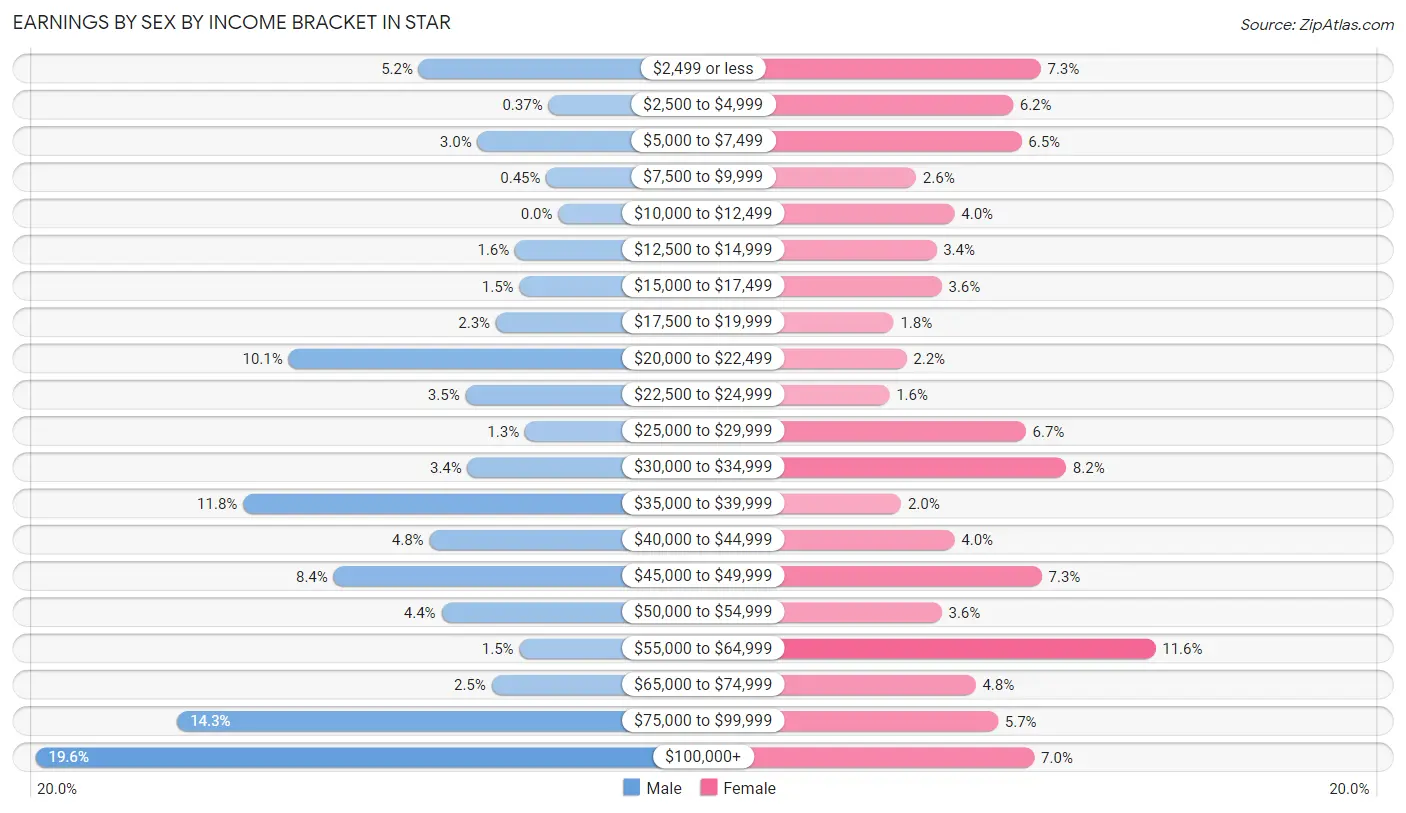
Earnings by Sex by Income Bracket in Star
The most common earnings brackets in Star are $100,000+ for men (738 | 19.6%) and $55,000 to $64,999 for women (290 | 11.6%).
| Income | Male | Female |
| $2,499 or less | 197 (5.2%) | 182 (7.3%) |
| $2,500 to $4,999 | 14 (0.4%) | 156 (6.2%) |
| $5,000 to $7,499 | 114 (3.0%) | 164 (6.5%) |
| $7,500 to $9,999 | 17 (0.4%) | 65 (2.6%) |
| $10,000 to $12,499 | 0 (0.0%) | 101 (4.0%) |
| $12,500 to $14,999 | 61 (1.6%) | 84 (3.4%) |
| $15,000 to $17,499 | 55 (1.5%) | 89 (3.5%) |
| $17,500 to $19,999 | 88 (2.3%) | 44 (1.8%) |
| $20,000 to $22,499 | 381 (10.1%) | 56 (2.2%) |
| $22,500 to $24,999 | 131 (3.5%) | 40 (1.6%) |
| $25,000 to $29,999 | 47 (1.3%) | 168 (6.7%) |
| $30,000 to $34,999 | 128 (3.4%) | 206 (8.2%) |
| $35,000 to $39,999 | 445 (11.8%) | 51 (2.0%) |
| $40,000 to $44,999 | 182 (4.8%) | 101 (4.0%) |
| $45,000 to $49,999 | 317 (8.4%) | 183 (7.3%) |
| $50,000 to $54,999 | 165 (4.4%) | 89 (3.5%) |
| $55,000 to $64,999 | 55 (1.5%) | 290 (11.6%) |
| $65,000 to $74,999 | 94 (2.5%) | 121 (4.8%) |
| $75,000 to $99,999 | 538 (14.3%) | 142 (5.7%) |
| $100,000+ | 738 (19.6%) | 176 (7.0%) |
| Total | 3,767 (100.0%) | 2,508 (100.0%) |
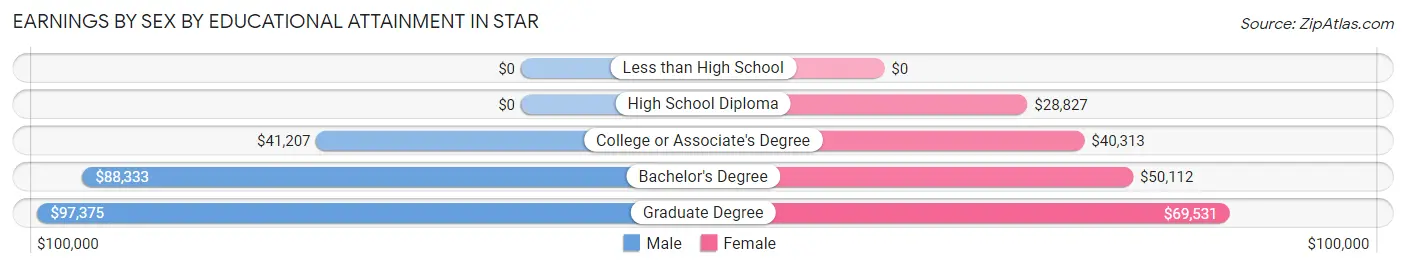
Earnings by Sex by Educational Attainment in Star
Average earnings in Star are $52,808 for men and $39,141 for women, a difference of 25.9%. Men with an educational attainment of graduate degree enjoy the highest average annual earnings of $97,375, while those with college or associate's degree education earn the least with $41,207. Women with an educational attainment of graduate degree earn the most with the average annual earnings of $69,531, while those with high school diploma education have the smallest earnings of $28,827.
| Educational Attainment | Male Income | Female Income |
| Less than High School | - | - |
| High School Diploma | - | - |
| College or Associate's Degree | $41,207 | $40,313 |
| Bachelor's Degree | $88,333 | $50,112 |
| Graduate Degree | $97,375 | $69,531 |
| Total | $52,808 | $39,141 |
Family Income in Star
Family Income Brackets in Star
According to the Star family income data, there are 886 families falling into the $100,000 to $149,999 income range, which is the most common income bracket and makes up 28.8% of all families. Conversely, the less than $10,000 income bracket is the least frequent group with only 18 families (0.6%) belonging to this category.
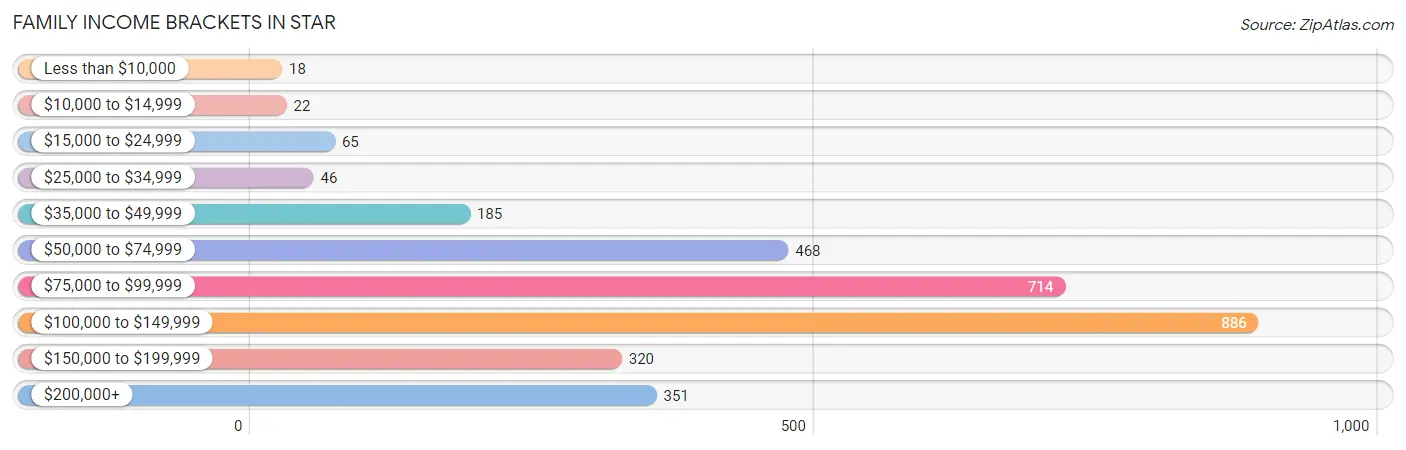
| Income Bracket | # Families | % Families |
| Less than $10,000 | 18 | 0.6% |
| $10,000 to $14,999 | 22 | 0.7% |
| $15,000 to $24,999 | 65 | 2.1% |
| $25,000 to $34,999 | 46 | 1.5% |
| $35,000 to $49,999 | 185 | 6.0% |
| $50,000 to $74,999 | 468 | 15.2% |
| $75,000 to $99,999 | 714 | 23.2% |
| $100,000 to $149,999 | 886 | 28.8% |
| $150,000 to $199,999 | 320 | 10.4% |
| $200,000+ | 351 | 11.4% |
Family Income by Famaliy Size in Star
4-person families (581 | 18.9%) account for the highest median family income in Star with $131,269 per family, while 2-person families (1,483 | 48.2%) have the highest median income of $39,612 per family member.
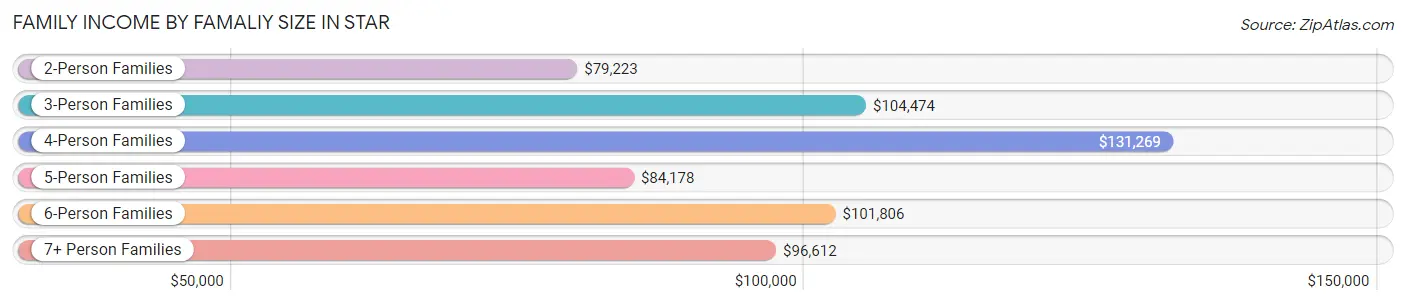
| Income Bracket | # Families | Median Income |
| 2-Person Families | 1,483 (48.2%) | $79,223 |
| 3-Person Families | 498 (16.2%) | $104,474 |
| 4-Person Families | 581 (18.9%) | $131,269 |
| 5-Person Families | 266 (8.6%) | $84,178 |
| 6-Person Families | 161 (5.2%) | $101,806 |
| 7+ Person Families | 89 (2.9%) | $96,612 |
| Total | 3,078 (100.0%) | $100,565 |
Family Income by Number of Earners in Star
The median family income in Star is $100,565, with families comprising 3+ earners (600) having the highest median family income of $131,288, while families with no earners (898) have the lowest median family income of $75,051, accounting for 19.5% and 29.2% of families, respectively.
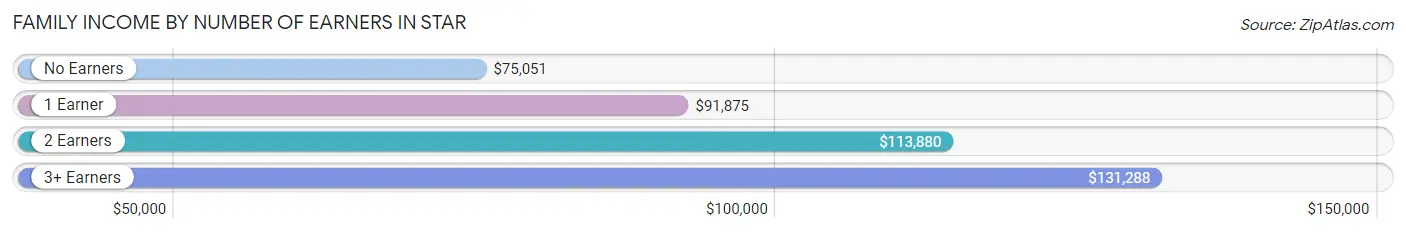
| Number of Earners | # Families | Median Income |
| No Earners | 898 (29.2%) | $75,051 |
| 1 Earner | 543 (17.6%) | $91,875 |
| 2 Earners | 1,037 (33.7%) | $113,880 |
| 3+ Earners | 600 (19.5%) | $131,288 |
| Total | 3,078 (100.0%) | $100,565 |
Household Income in Star
Household Income Brackets in Star
With 988 households falling in the category, the $100,000 to $149,999 income range is the most frequent in Star, accounting for 23.2% of all households. In contrast, only 34 households (0.8%) fall into the $10,000 to $14,999 income bracket, making it the least populous group.
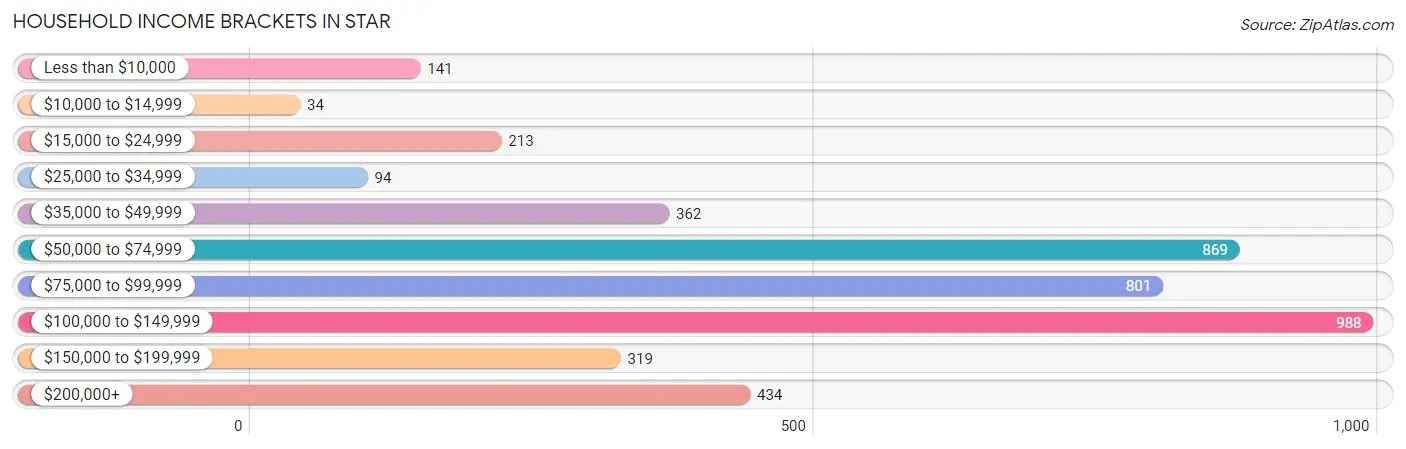
| Income Bracket | # Households | % Households |
| Less than $10,000 | 141 | 3.3% |
| $10,000 to $14,999 | 34 | 0.8% |
| $15,000 to $24,999 | 213 | 5.0% |
| $25,000 to $34,999 | 94 | 2.2% |
| $35,000 to $49,999 | 362 | 8.5% |
| $50,000 to $74,999 | 869 | 20.4% |
| $75,000 to $99,999 | 801 | 18.8% |
| $100,000 to $149,999 | 988 | 23.2% |
| $150,000 to $199,999 | 319 | 7.5% |
| $200,000+ | 434 | 10.2% |
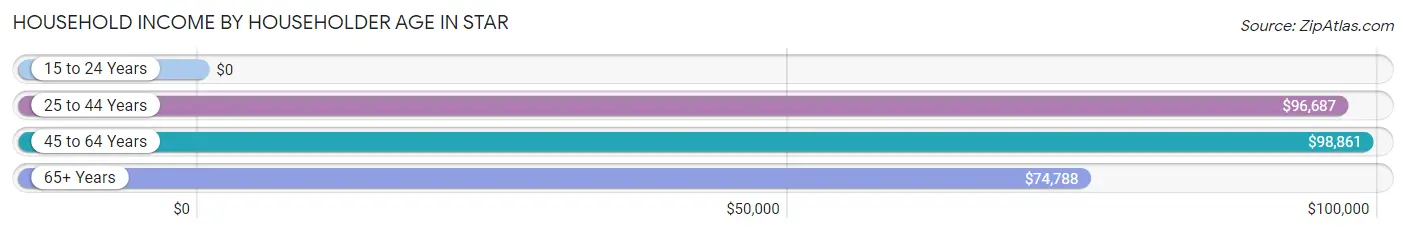
Household Income by Householder Age in Star
The median household income in Star is $88,625, with the highest median household income of $98,861 found in the 45 to 64 years age bracket for the primary householder. A total of 1,528 households (35.9%) fall into this category. Meanwhile, the 15 to 24 years age bracket for the primary householder has the lowest median household income of $0, with 6 households (0.1%) in this group.
| Income Bracket | # Households | Median Income |
| 15 to 24 Years | 6 (0.1%) | $0 |
| 25 to 44 Years | 1,261 (29.6%) | $96,687 |
| 45 to 64 Years | 1,528 (35.9%) | $98,861 |
| 65+ Years | 1,463 (34.4%) | $74,788 |
| Total | 4,258 (100.0%) | $88,625 |
Poverty in Star
Income Below Poverty by Sex and Age in Star
With 2.0% poverty level for males and 6.0% for females among the residents of Star, 16 and 17 year old males and under 5 year old females are the most vulnerable to poverty, with 16 males (8.2%) and 44 females (15.5%) in their respective age groups living below the poverty level.
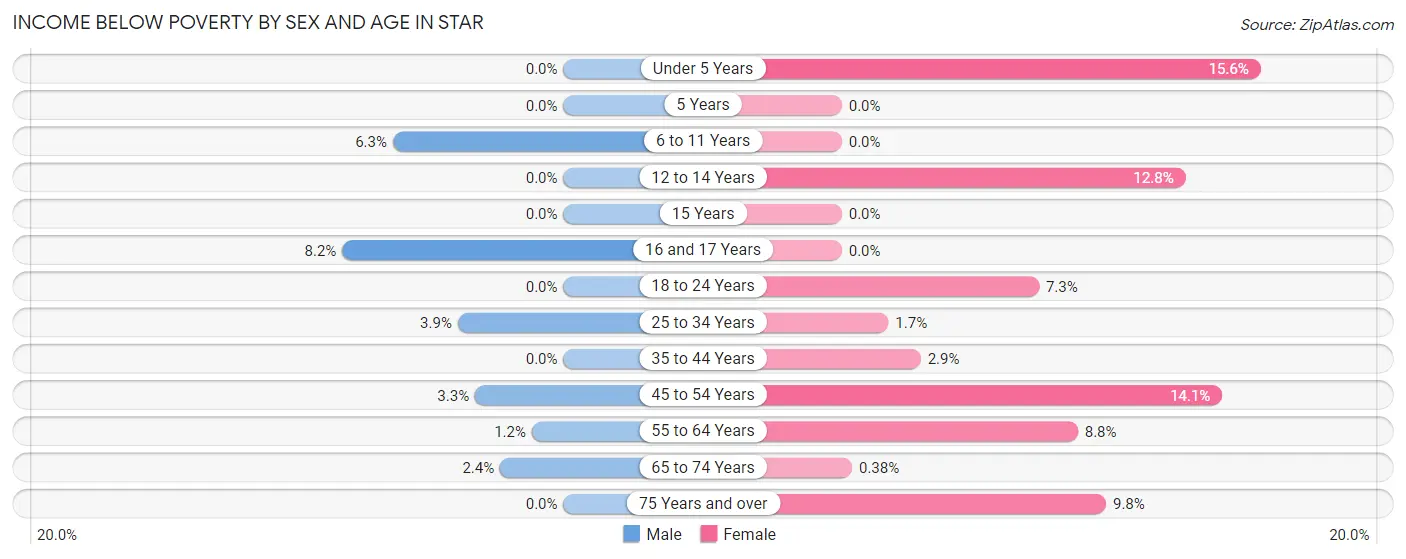
| Age Bracket | Male | Female |
| Under 5 Years | 0 (0.0%) | 44 (15.5%) |
| 5 Years | 0 (0.0%) | 0 (0.0%) |
| 6 to 11 Years | 24 (6.3%) | 0 (0.0%) |
| 12 to 14 Years | 0 (0.0%) | 43 (12.8%) |
| 15 Years | 0 (0.0%) | 0 (0.0%) |
| 16 and 17 Years | 16 (8.2%) | 0 (0.0%) |
| 18 to 24 Years | 0 (0.0%) | 27 (7.3%) |
| 25 to 34 Years | 34 (3.9%) | 9 (1.7%) |
| 35 to 44 Years | 0 (0.0%) | 22 (2.9%) |
| 45 to 54 Years | 24 (3.3%) | 75 (14.1%) |
| 55 to 64 Years | 9 (1.2%) | 74 (8.8%) |
| 65 to 74 Years | 20 (2.4%) | 3 (0.4%) |
| 75 Years and over | 0 (0.0%) | 47 (9.8%) |
| Total | 127 (2.0%) | 344 (6.0%) |
Income Above Poverty by Sex and Age in Star
According to the poverty statistics in Star, males aged under 5 years and females aged 5 years are the age groups that are most secure financially, with 100.0% of males and 100.0% of females in these age groups living above the poverty line.
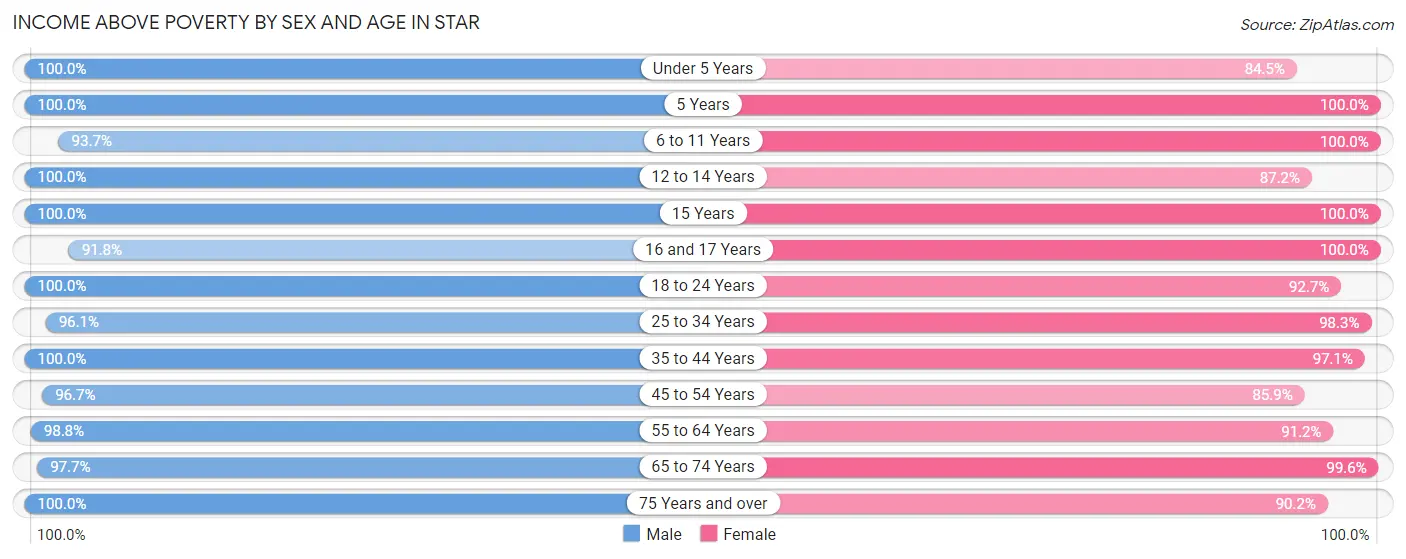
| Age Bracket | Male | Female |
| Under 5 Years | 188 (100.0%) | 239 (84.5%) |
| 5 Years | 110 (100.0%) | 74 (100.0%) |
| 6 to 11 Years | 355 (93.7%) | 550 (100.0%) |
| 12 to 14 Years | 382 (100.0%) | 294 (87.2%) |
| 15 Years | 19 (100.0%) | 100 (100.0%) |
| 16 and 17 Years | 179 (91.8%) | 129 (100.0%) |
| 18 to 24 Years | 647 (100.0%) | 342 (92.7%) |
| 25 to 34 Years | 834 (96.1%) | 510 (98.3%) |
| 35 to 44 Years | 547 (100.0%) | 730 (97.1%) |
| 45 to 54 Years | 708 (96.7%) | 456 (85.9%) |
| 55 to 64 Years | 758 (98.8%) | 771 (91.2%) |
| 65 to 74 Years | 832 (97.7%) | 779 (99.6%) |
| 75 Years and over | 532 (100.0%) | 432 (90.2%) |
| Total | 6,091 (98.0%) | 5,406 (94.0%) |
Income Below Poverty Among Married-Couple Families in Star
The poverty statistics for married-couple families in Star show that 2.6% or 73 of the total 2,787 families live below the poverty line. Families with 3 or 4 children have the highest poverty rate of 5.4%, comprising of 22 families. On the other hand, families with no children have the lowest poverty rate of 1.1%, which includes 20 families.
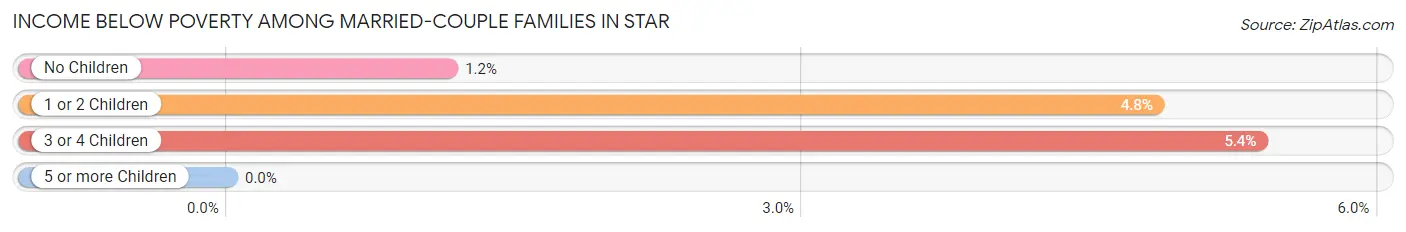
| Children | Above Poverty | Below Poverty |
| No Children | 1,718 (98.9%) | 20 (1.1%) |
| 1 or 2 Children | 609 (95.2%) | 31 (4.8%) |
| 3 or 4 Children | 387 (94.6%) | 22 (5.4%) |
| 5 or more Children | 0 (0.0%) | 0 (0.0%) |
| Total | 2,714 (97.4%) | 73 (2.6%) |
Income Below Poverty Among Single-Parent Households in Star
| Children | Single Father | Single Mother |
| No Children | 0 (0.0%) | 0 (0.0%) |
| 1 or 2 Children | 0 (0.0%) | 0 (0.0%) |
| 3 or 4 Children | 0 (0.0%) | 0 (0.0%) |
| 5 or more Children | 0 (0.0%) | 0 (0.0%) |
| Total | 0 (0.0%) | 0 (0.0%) |
Income Below Poverty Among Married-Couple vs Single-Parent Households in Star
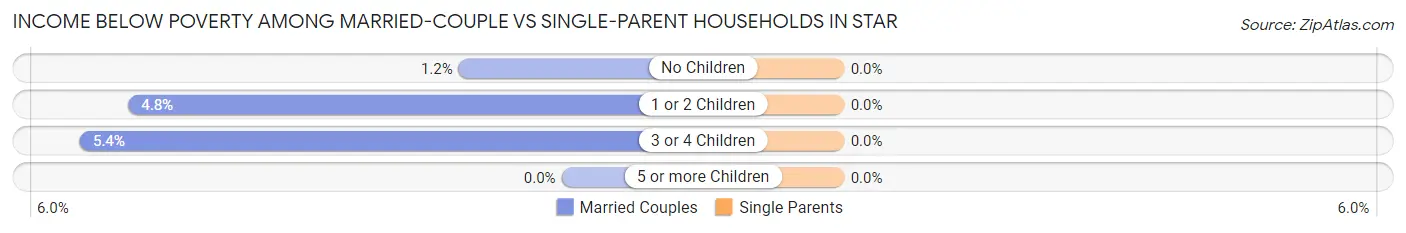
| Children | Married-Couple Families | Single-Parent Households |
| No Children | 20 (1.1%) | 0 (0.0%) |
| 1 or 2 Children | 31 (4.8%) | 0 (0.0%) |
| 3 or 4 Children | 22 (5.4%) | 0 (0.0%) |
| 5 or more Children | 0 (0.0%) | 0 (0.0%) |
| Total | 73 (2.6%) | 0 (0.0%) |
Race in Star
The most populous races in Star are White / Caucasian (10,117 | 84.5%), Two or more Races (1,390 | 11.6%), and Hispanic or Latino (1,106 | 9.2%).
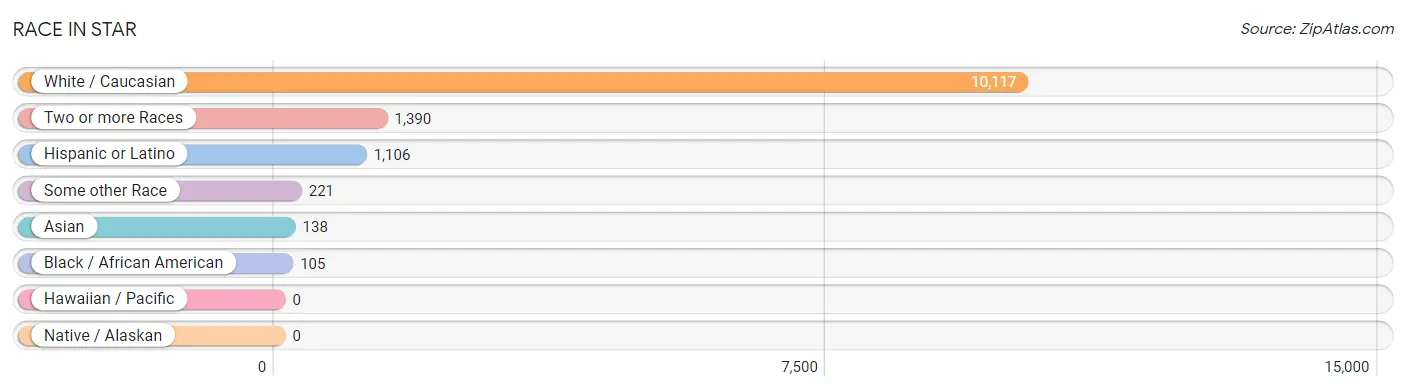
| Race | # Population | % Population |
| Asian | 138 | 1.1% |
| Black / African American | 105 | 0.9% |
| Hawaiian / Pacific | 0 | 0.0% |
| Hispanic or Latino | 1,106 | 9.2% |
| Native / Alaskan | 0 | 0.0% |
| White / Caucasian | 10,117 | 84.5% |
| Two or more Races | 1,390 | 11.6% |
| Some other Race | 221 | 1.8% |
| Total | 11,971 | 100.0% |
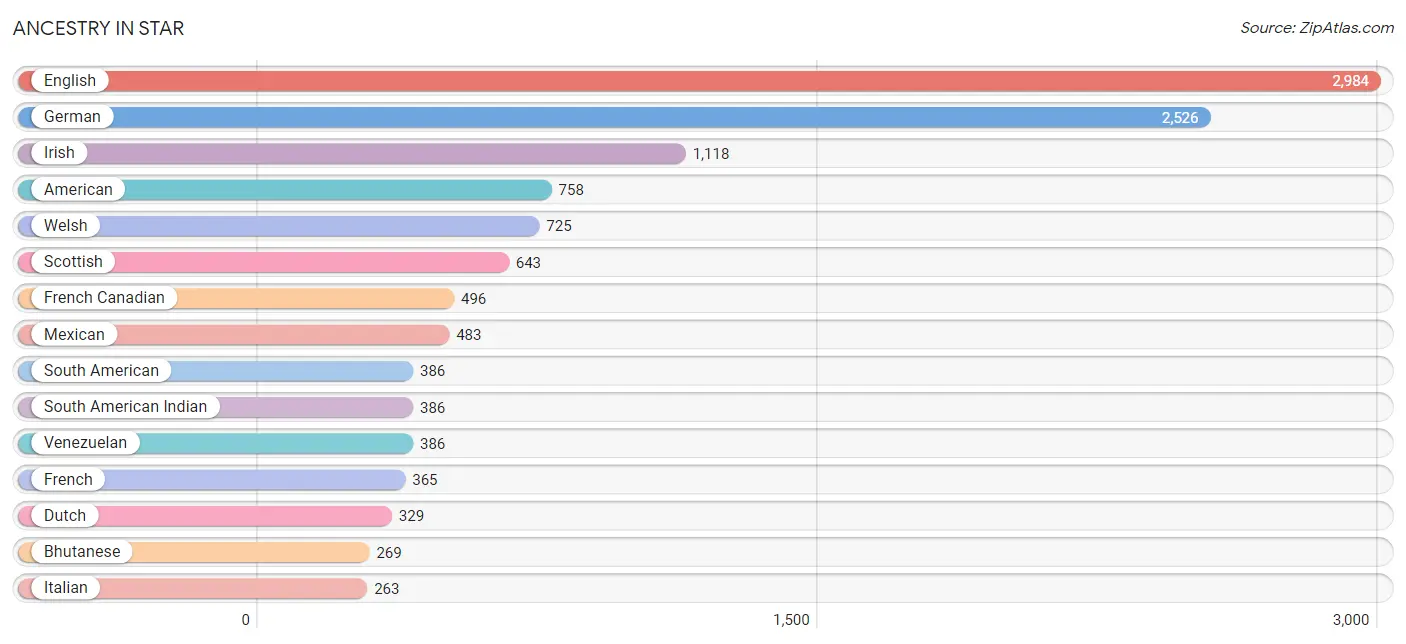
Ancestry in Star
The most populous ancestries reported in Star are English (2,984 | 24.9%), German (2,526 | 21.1%), Irish (1,118 | 9.3%), American (758 | 6.3%), and Welsh (725 | 6.1%), together accounting for 67.8% of all Star residents.
| Ancestry | # Population | % Population |
| African | 1 | 0.0% |
| American | 758 | 6.3% |
| Austrian | 18 | 0.2% |
| Bhutanese | 269 | 2.2% |
| Burmese | 120 | 1.0% |
| Canadian | 21 | 0.2% |
| Central American | 75 | 0.6% |
| Cherokee | 12 | 0.1% |
| Czechoslovakian | 16 | 0.1% |
| Danish | 44 | 0.4% |
| Dutch | 329 | 2.8% |
| English | 2,984 | 24.9% |
| European | 162 | 1.3% |
| Finnish | 32 | 0.3% |
| French | 365 | 3.0% |
| French Canadian | 496 | 4.1% |
| German | 2,526 | 21.1% |
| Guatemalan | 75 | 0.6% |
| Hungarian | 159 | 1.3% |
| Irish | 1,118 | 9.3% |
| Italian | 263 | 2.2% |
| Korean | 78 | 0.6% |
| Lithuanian | 12 | 0.1% |
| Mexican | 483 | 4.0% |
| Mexican American Indian | 177 | 1.5% |
| Northern European | 26 | 0.2% |
| Norwegian | 146 | 1.2% |
| Pakistani | 24 | 0.2% |
| Polish | 82 | 0.7% |
| Portuguese | 193 | 1.6% |
| Puerto Rican | 127 | 1.1% |
| Russian | 32 | 0.3% |
| Scandinavian | 14 | 0.1% |
| Scotch-Irish | 33 | 0.3% |
| Scottish | 643 | 5.4% |
| Sioux | 8 | 0.1% |
| Slavic | 44 | 0.4% |
| South African | 63 | 0.5% |
| South American | 386 | 3.2% |
| South American Indian | 386 | 3.2% |
| Spanish | 35 | 0.3% |
| Subsaharan African | 64 | 0.5% |
| Swedish | 214 | 1.8% |
| Swiss | 93 | 0.8% |
| Venezuelan | 386 | 3.2% |
| Welsh | 725 | 6.1% | View All 46 Rows |
Immigrants in Star
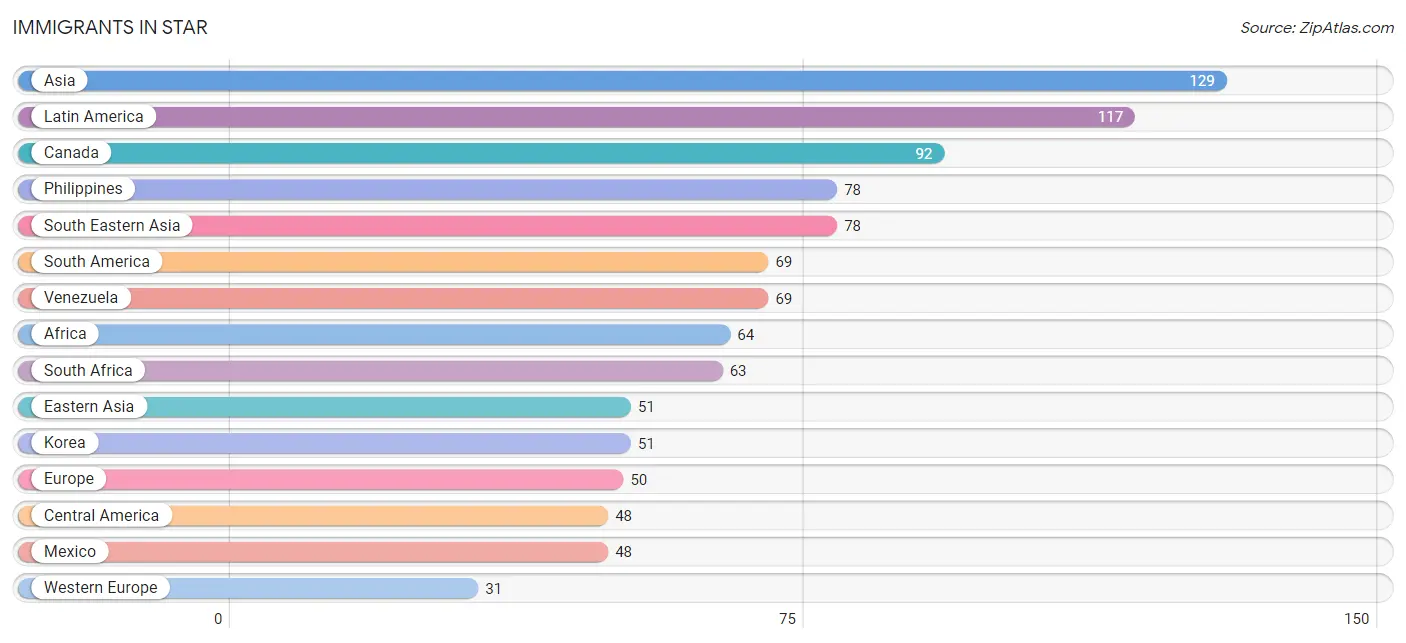
The most numerous immigrant groups reported in Star came from Asia (129 | 1.1%), Latin America (117 | 1.0%), Canada (92 | 0.8%), Philippines (78 | 0.6%), and South Eastern Asia (78 | 0.6%), together accounting for 4.1% of all Star residents.
| Immigration Origin | # Population | % Population |
| Africa | 64 | 0.5% |
| Asia | 129 | 1.1% |
| Canada | 92 | 0.8% |
| Central America | 48 | 0.4% |
| Congo | 1 | 0.0% |
| Eastern Asia | 51 | 0.4% |
| Europe | 50 | 0.4% |
| France | 9 | 0.1% |
| Germany | 22 | 0.2% |
| Korea | 51 | 0.4% |
| Latin America | 117 | 1.0% |
| Mexico | 48 | 0.4% |
| Middle Africa | 1 | 0.0% |
| Northern Europe | 19 | 0.2% |
| Philippines | 78 | 0.6% |
| South Africa | 63 | 0.5% |
| South America | 69 | 0.6% |
| South Eastern Asia | 78 | 0.6% |
| Venezuela | 69 | 0.6% |
| Western Europe | 31 | 0.3% | View All 20 Rows |
Sex and Age in Star
Sex and Age in Star
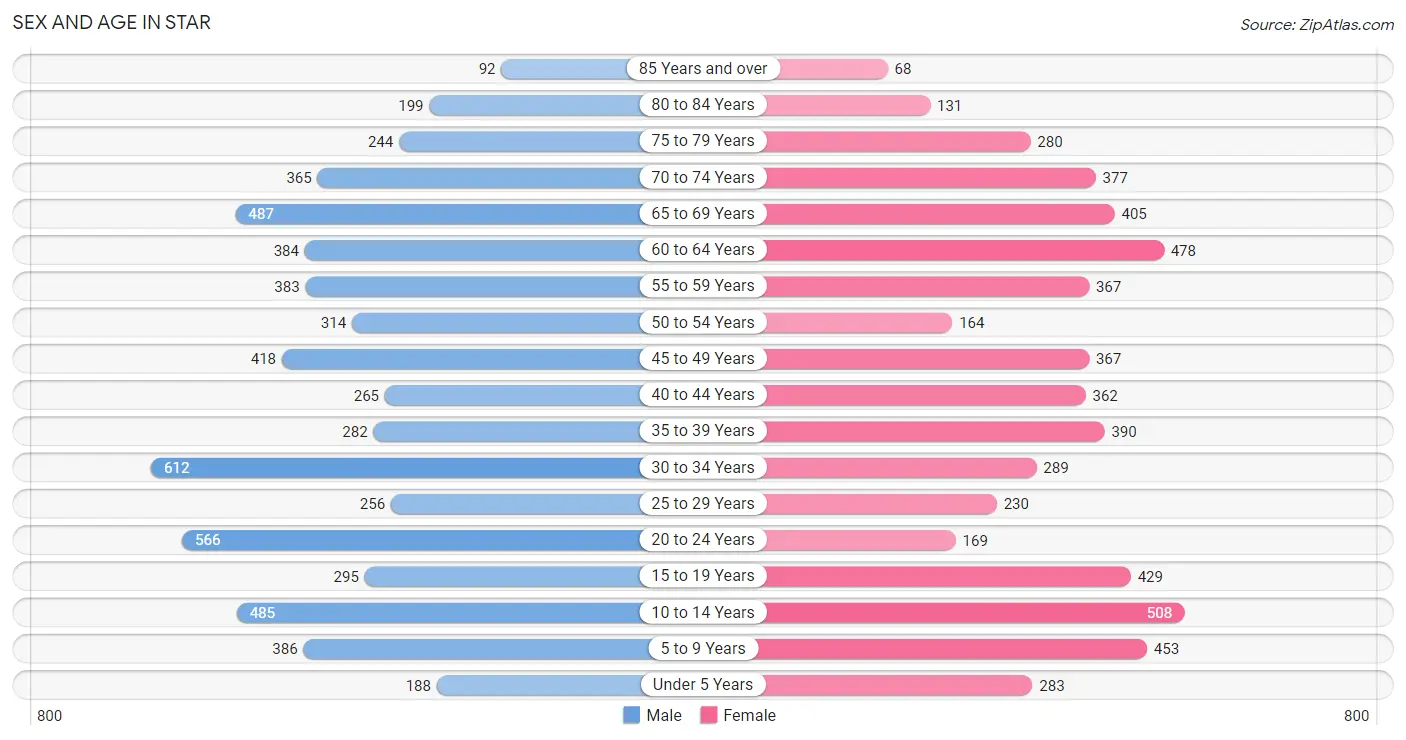
The most populous age groups in Star are 30 to 34 Years (612 | 9.8%) for men and 10 to 14 Years (508 | 8.8%) for women.
| Age Bracket | Male | Female |
| Under 5 Years | 188 (3.0%) | 283 (4.9%) |
| 5 to 9 Years | 386 (6.2%) | 453 (7.9%) |
| 10 to 14 Years | 485 (7.8%) | 508 (8.8%) |
| 15 to 19 Years | 295 (4.7%) | 429 (7.5%) |
| 20 to 24 Years | 566 (9.1%) | 169 (2.9%) |
| 25 to 29 Years | 256 (4.1%) | 230 (4.0%) |
| 30 to 34 Years | 612 (9.8%) | 289 (5.0%) |
| 35 to 39 Years | 282 (4.5%) | 390 (6.8%) |
| 40 to 44 Years | 265 (4.3%) | 362 (6.3%) |
| 45 to 49 Years | 418 (6.7%) | 367 (6.4%) |
| 50 to 54 Years | 314 (5.1%) | 164 (2.9%) |
| 55 to 59 Years | 383 (6.2%) | 367 (6.4%) |
| 60 to 64 Years | 384 (6.2%) | 478 (8.3%) |
| 65 to 69 Years | 487 (7.8%) | 405 (7.0%) |
| 70 to 74 Years | 365 (5.9%) | 377 (6.6%) |
| 75 to 79 Years | 244 (3.9%) | 280 (4.9%) |
| 80 to 84 Years | 199 (3.2%) | 131 (2.3%) |
| 85 Years and over | 92 (1.5%) | 68 (1.2%) |
| Total | 6,221 (100.0%) | 5,750 (100.0%) |
Families and Households in Star
Median Family Size in Star
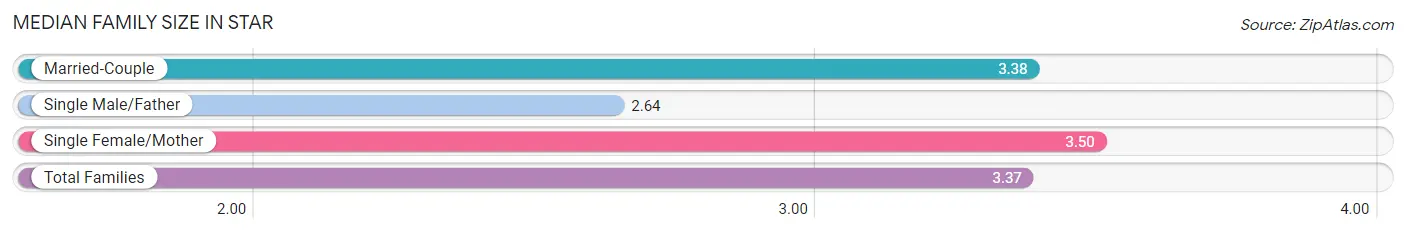
The median family size in Star is 3.37 persons per family, with single female/mother families (213 | 6.9%) accounting for the largest median family size of 3.5 persons per family. On the other hand, single male/father families (78 | 2.5%) represent the smallest median family size with 2.64 persons per family.
| Family Type | # Families | Family Size |
| Married-Couple | 2,787 (90.5%) | 3.38 |
| Single Male/Father | 78 (2.5%) | 2.64 |
| Single Female/Mother | 213 (6.9%) | 3.50 |
| Total Families | 3,078 (100.0%) | 3.37 |
Median Household Size in Star
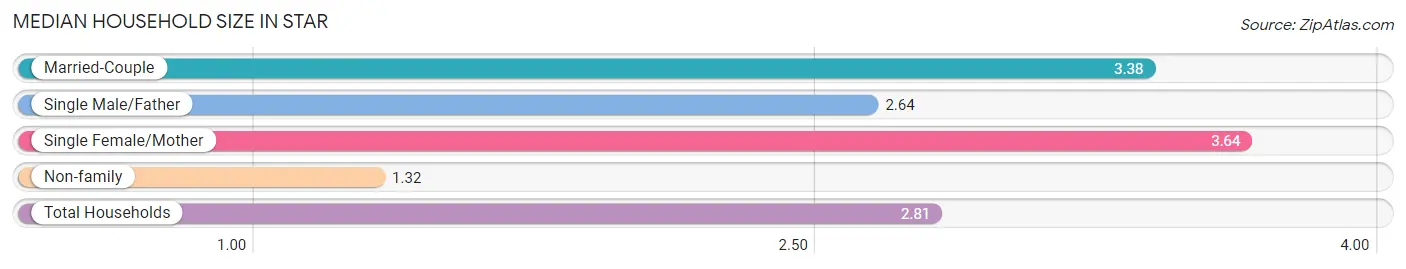
The median household size in Star is 2.81 persons per household, with single female/mother households (213 | 5.0%) accounting for the largest median household size of 3.64 persons per household. non-family households (1,180 | 27.7%) represent the smallest median household size with 1.32 persons per household.
| Household Type | # Households | Household Size |
| Married-Couple | 2,787 (65.4%) | 3.38 |
| Single Male/Father | 78 (1.8%) | 2.64 |
| Single Female/Mother | 213 (5.0%) | 3.64 |
| Non-family | 1,180 (27.7%) | 1.32 |
| Total Households | 4,258 (100.0%) | 2.81 |
Household Size by Marriage Status in Star
Out of a total of 4,258 households in Star, 3,078 (72.3%) are family households, while 1,180 (27.7%) are nonfamily households. The most numerous type of family households are 2-person households, comprising 1,456, and the most common type of nonfamily households are 1-person households, comprising 861.
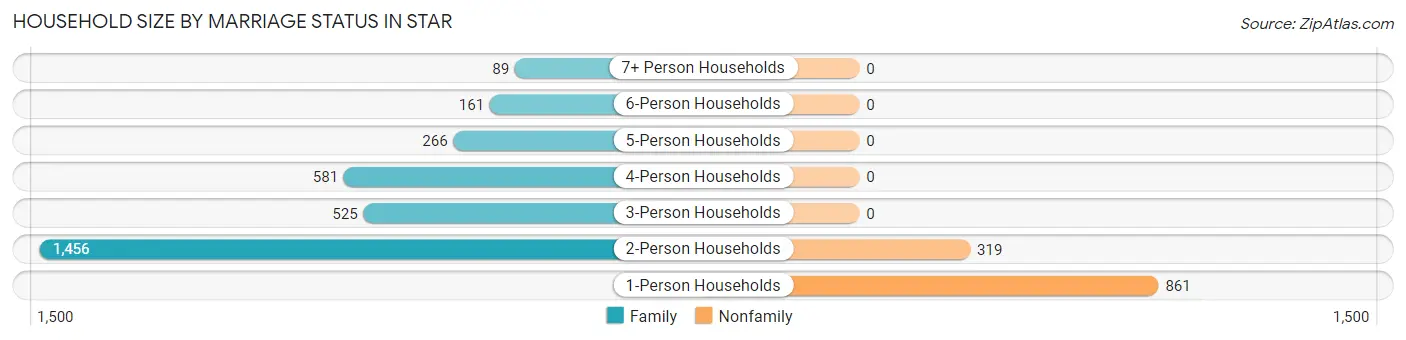
| Household Size | Family Households | Nonfamily Households |
| 1-Person Households | - | 861 (20.2%) |
| 2-Person Households | 1,456 (34.2%) | 319 (7.5%) |
| 3-Person Households | 525 (12.3%) | 0 (0.0%) |
| 4-Person Households | 581 (13.6%) | 0 (0.0%) |
| 5-Person Households | 266 (6.2%) | 0 (0.0%) |
| 6-Person Households | 161 (3.8%) | 0 (0.0%) |
| 7+ Person Households | 89 (2.1%) | 0 (0.0%) |
| Total | 3,078 (72.3%) | 1,180 (27.7%) |
Female Fertility in Star
Fertility by Age in Star
Average fertility rate in Star is 23.0 births per 1,000 women. Women in the age bracket of 20 to 34 years have the highest fertility rate with 74.0 births per 1,000 women. Women in the age bracket of 20 to 34 years acount for 100.0% of all women with births.
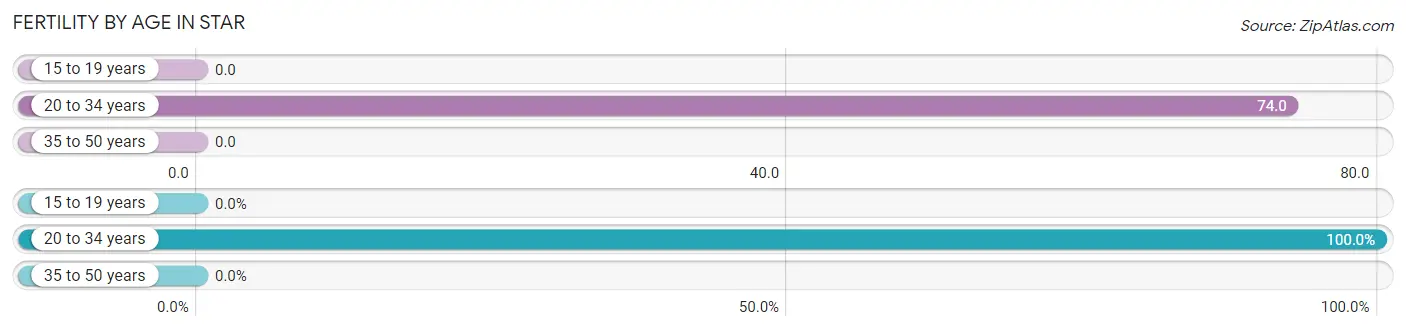
| Age Bracket | Women with Births | Births / 1,000 Women |
| 15 to 19 years | 0 (0.0%) | 0.0 |
| 20 to 34 years | 51 (100.0%) | 74.0 |
| 35 to 50 years | 0 (0.0%) | 0.0 |
| Total | 51 (100.0%) | 23.0 |
Fertility by Age by Marriage Status in Star
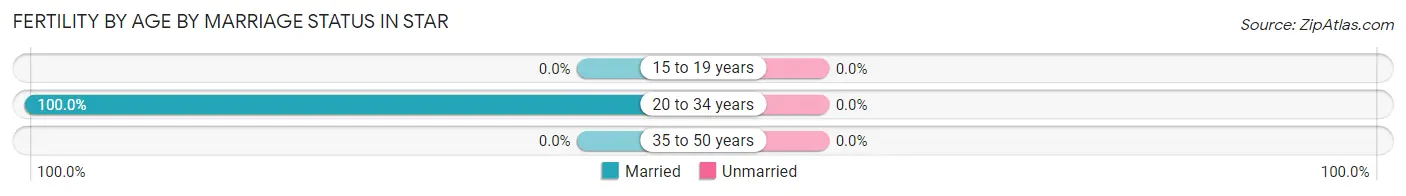
| Age Bracket | Married | Unmarried |
| 15 to 19 years | 0 (0.0%) | 0 (0.0%) |
| 20 to 34 years | 51 (100.0%) | 0 (0.0%) |
| 35 to 50 years | 0 (0.0%) | 0 (0.0%) |
| Total | 51 (100.0%) | 0 (0.0%) |
Fertility by Education in Star
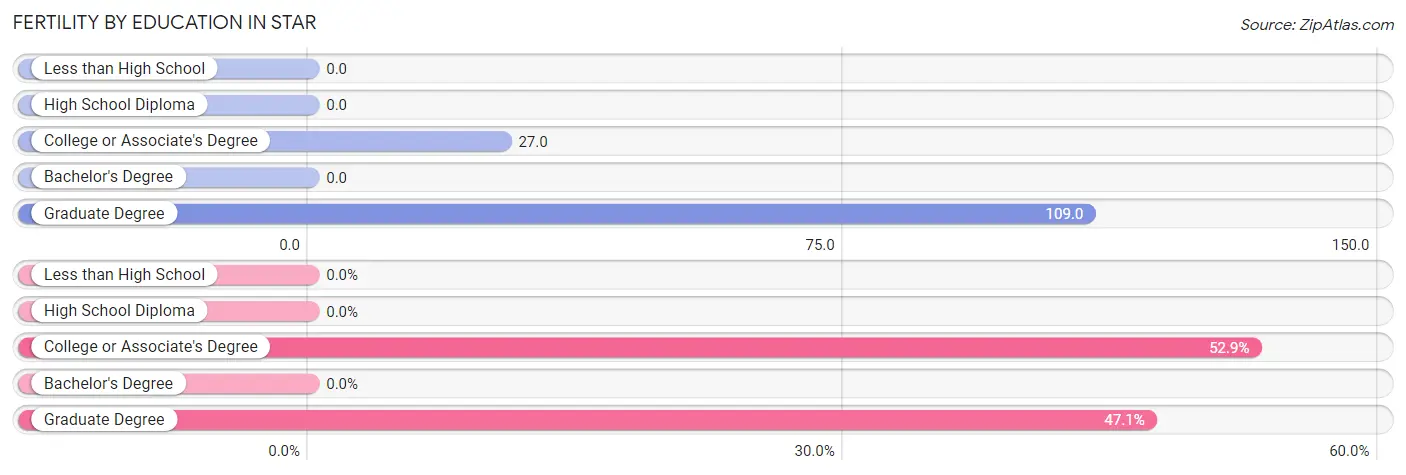
| Educational Attainment | Women with Births | Births / 1,000 Women |
| Less than High School | 0 (0.0%) | 0.0 |
| High School Diploma | 0 (0.0%) | 0.0 |
| College or Associate's Degree | 27 (52.9%) | 27.0 |
| Bachelor's Degree | 0 (0.0%) | 0.0 |
| Graduate Degree | 24 (47.1%) | 109.0 |
| Total | 51 (100.0%) | 23.0 |
Fertility by Education by Marriage Status in Star
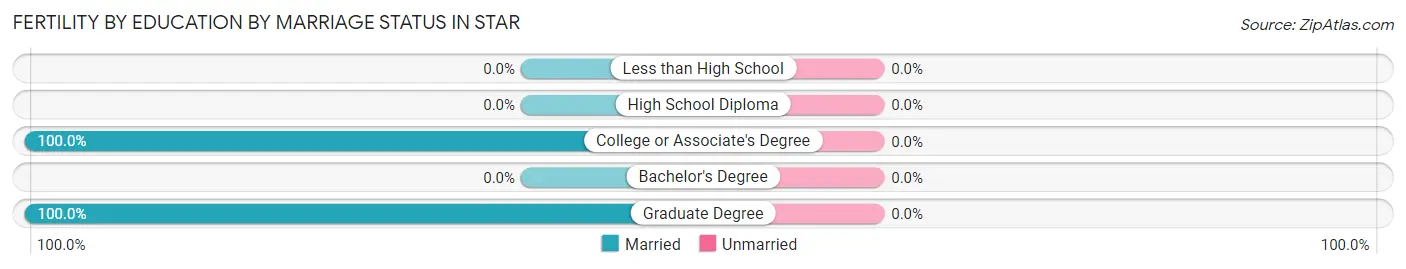
| Educational Attainment | Married | Unmarried |
| Less than High School | 0 (0.0%) | 0 (0.0%) |
| High School Diploma | 0 (0.0%) | 0 (0.0%) |
| College or Associate's Degree | 27 (100.0%) | 0 (0.0%) |
| Bachelor's Degree | 0 (0.0%) | 0 (0.0%) |
| Graduate Degree | 24 (100.0%) | 0 (0.0%) |
| Total | 51 (100.0%) | 0 (0.0%) |
Employment Characteristics in Star
Employment by Class of Employer in Star
Among the 5,637 employed individuals in Star, private company employees (3,586 | 63.6%), local government employees (635 | 11.3%), and self-employed (not incorporated) (531 | 9.4%) make up the most common classes of employment.
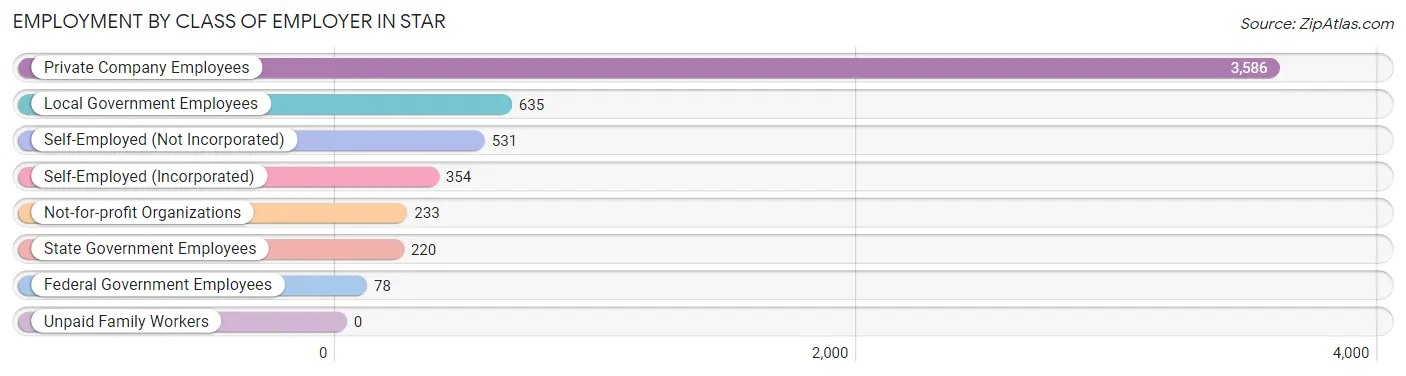
| Employer Class | # Employees | % Employees |
| Private Company Employees | 3,586 | 63.6% |
| Self-Employed (Incorporated) | 354 | 6.3% |
| Self-Employed (Not Incorporated) | 531 | 9.4% |
| Not-for-profit Organizations | 233 | 4.1% |
| Local Government Employees | 635 | 11.3% |
| State Government Employees | 220 | 3.9% |
| Federal Government Employees | 78 | 1.4% |
| Unpaid Family Workers | 0 | 0.0% |
| Total | 5,637 | 100.0% |
Employment Status by Age in Star
According to the labor force statistics for Star, out of the total population over 16 years of age (9,549), 64.5% or 6,159 individuals are in the labor force, with 7.3% or 450 of them unemployed. The age group with the highest labor force participation rate is 30 to 34 years, with 97.0% or 874 individuals in the labor force. Within the labor force, the 25 to 29 years age range has the highest percentage of unemployed individuals, with 29.6% or 136 of them being unemployed.
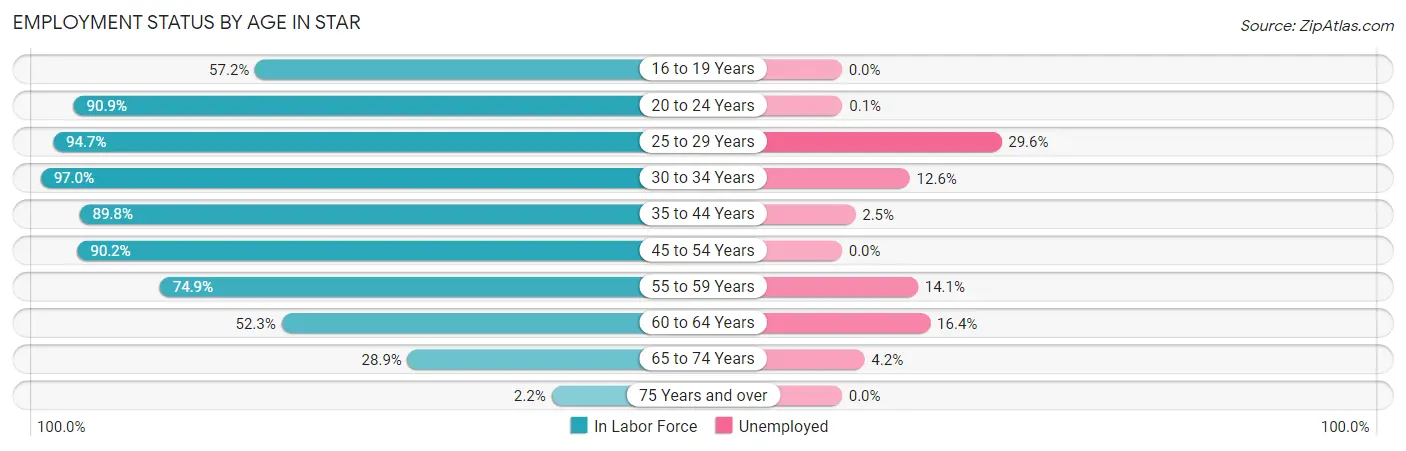
| Age Bracket | In Labor Force | Unemployed |
| 16 to 19 Years | 346 (57.2%) | 0 (0.0%) |
| 20 to 24 Years | 668 (90.9%) | 1 (0.1%) |
| 25 to 29 Years | 460 (94.7%) | 136 (29.6%) |
| 30 to 34 Years | 874 (97.0%) | 110 (12.6%) |
| 35 to 44 Years | 1,167 (89.8%) | 29 (2.5%) |
| 45 to 54 Years | 1,139 (90.2%) | 0 (0.0%) |
| 55 to 59 Years | 562 (74.9%) | 79 (14.1%) |
| 60 to 64 Years | 451 (52.3%) | 74 (16.4%) |
| 65 to 74 Years | 472 (28.9%) | 20 (4.2%) |
| 75 Years and over | 22 (2.2%) | 0 (0.0%) |
| Total | 6,159 (64.5%) | 450 (7.3%) |
Employment Status by Educational Attainment in Star
According to labor force statistics for Star, 83.7% of individuals (4,655) out of the total population between 25 and 64 years of age (5,561) are in the labor force, with 9.2% or 428 of them being unemployed. The group with the highest labor force participation rate are those with the educational attainment of bachelor's degree or higher, with 88.3% or 1,838 individuals in the labor force. Within the labor force, individuals with college / associate degree education have the highest percentage of unemployment, with 13.1% or 238 of them being unemployed.
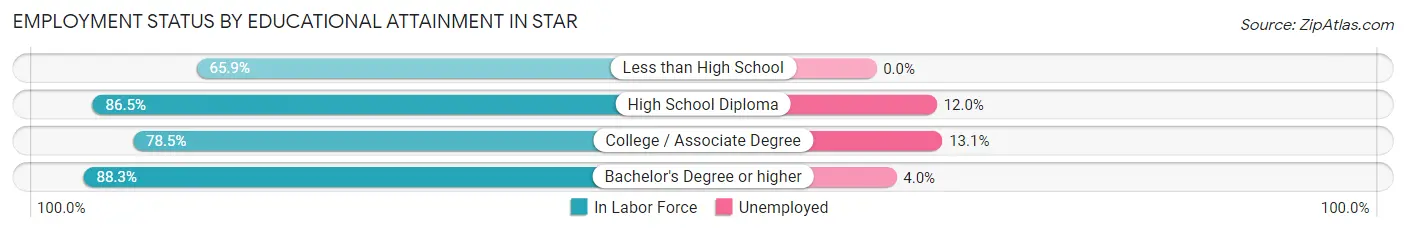
| Educational Attainment | In Labor Force | Unemployed |
| Less than High School | 27 (65.9%) | 0 (0.0%) |
| High School Diploma | 969 (86.5%) | 134 (12.0%) |
| College / Associate Degree | 1,820 (78.5%) | 304 (13.1%) |
| Bachelor's Degree or higher | 1,838 (88.3%) | 83 (4.0%) |
| Total | 4,655 (83.7%) | 512 (9.2%) |
Employment Occupations by Sex in Star
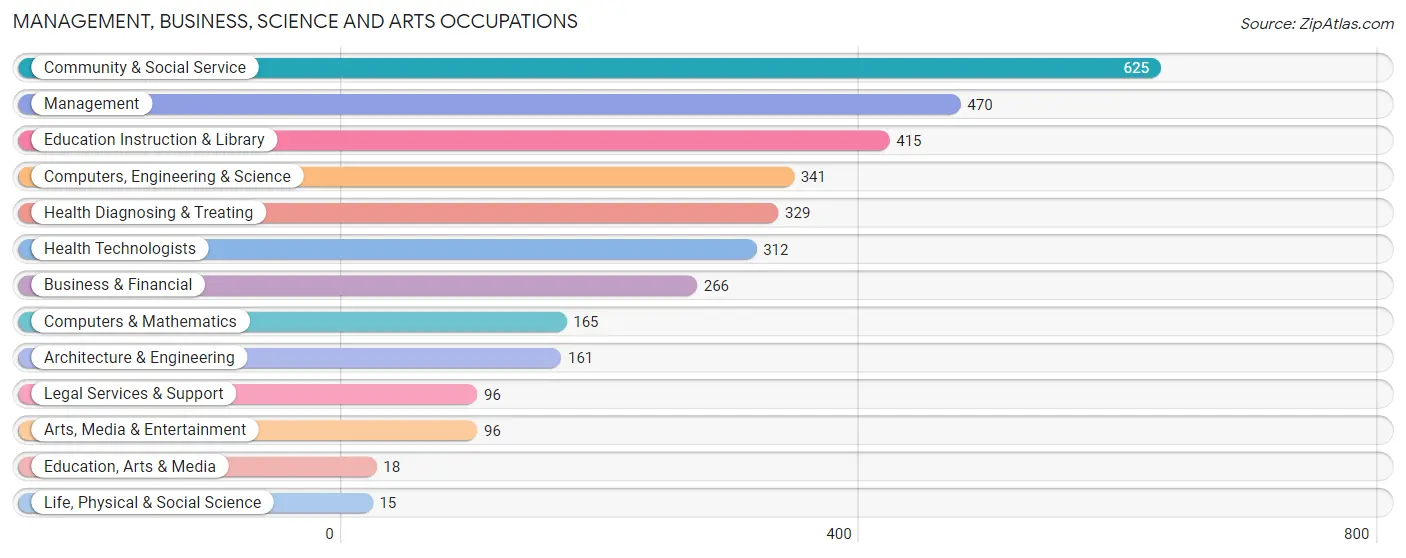
Management, Business, Science and Arts Occupations
The most common Management, Business, Science and Arts occupations in Star are Community & Social Service (625 | 10.9%), Management (470 | 8.2%), Education Instruction & Library (415 | 7.3%), Computers, Engineering & Science (341 | 6.0%), and Health Diagnosing & Treating (329 | 5.8%).
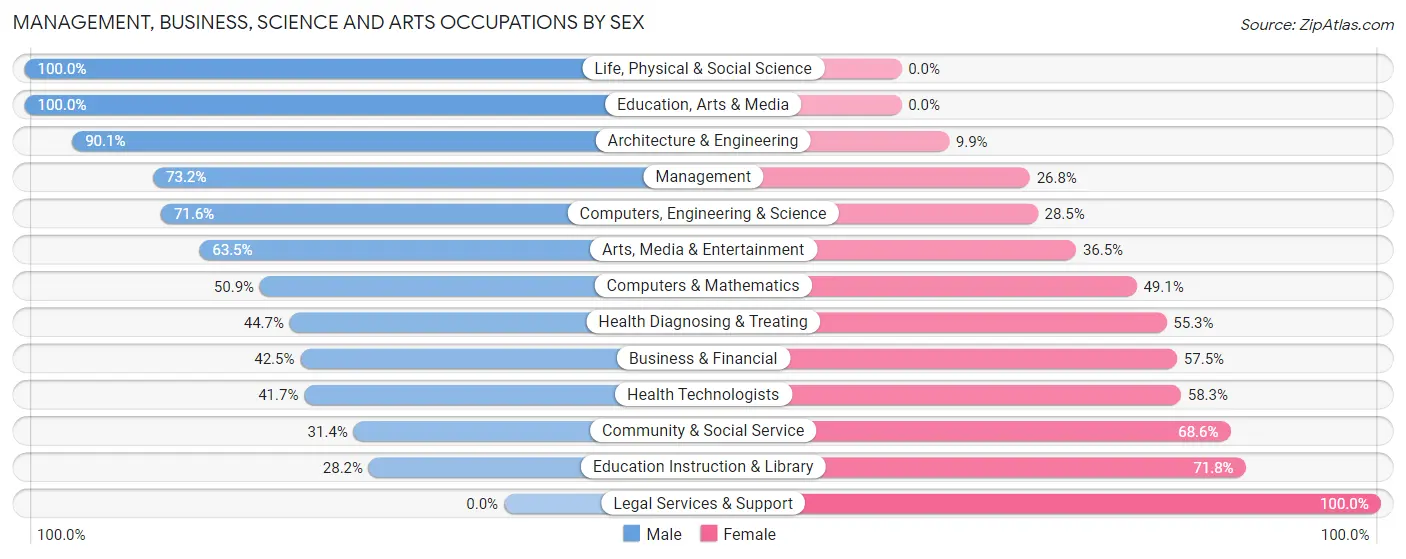
Management, Business, Science and Arts Occupations by Sex
Within the Management, Business, Science and Arts occupations in Star, the most male-oriented occupations are Life, Physical & Social Science (100.0%), Education, Arts & Media (100.0%), and Architecture & Engineering (90.1%), while the most female-oriented occupations are Legal Services & Support (100.0%), Education Instruction & Library (71.8%), and Community & Social Service (68.6%).
| Occupation | Male | Female |
| Management | 344 (73.2%) | 126 (26.8%) |
| Business & Financial | 113 (42.5%) | 153 (57.5%) |
| Computers, Engineering & Science | 244 (71.6%) | 97 (28.4%) |
| Computers & Mathematics | 84 (50.9%) | 81 (49.1%) |
| Architecture & Engineering | 145 (90.1%) | 16 (9.9%) |
| Life, Physical & Social Science | 15 (100.0%) | 0 (0.0%) |
| Community & Social Service | 196 (31.4%) | 429 (68.6%) |
| Education, Arts & Media | 18 (100.0%) | 0 (0.0%) |
| Legal Services & Support | 0 (0.0%) | 96 (100.0%) |
| Education Instruction & Library | 117 (28.2%) | 298 (71.8%) |
| Arts, Media & Entertainment | 61 (63.5%) | 35 (36.5%) |
| Health Diagnosing & Treating | 147 (44.7%) | 182 (55.3%) |
| Health Technologists | 130 (41.7%) | 182 (58.3%) |
| Total (Category) | 1,044 (51.4%) | 987 (48.6%) |
| Total (Overall) | 3,417 (59.8%) | 2,295 (40.2%) |
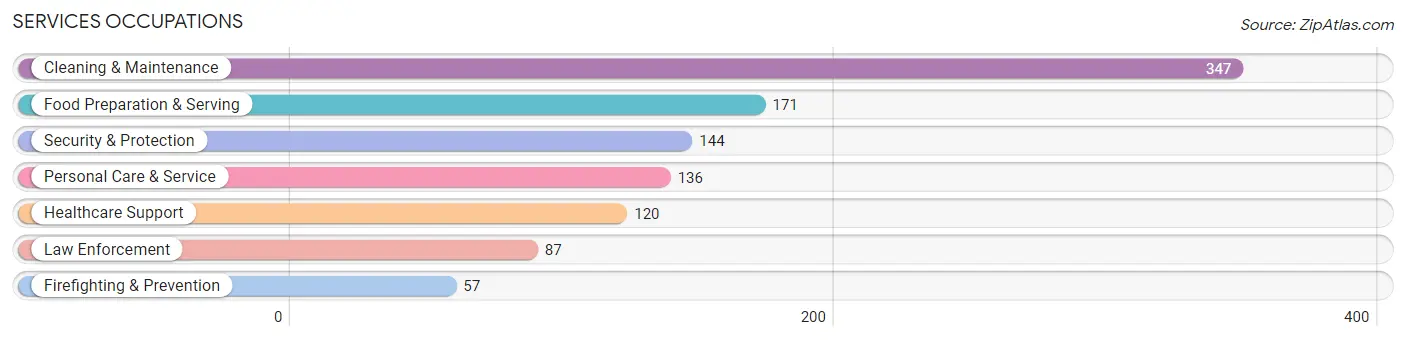
Services Occupations
The most common Services occupations in Star are Cleaning & Maintenance (347 | 6.1%), Food Preparation & Serving (171 | 3.0%), Security & Protection (144 | 2.5%), Personal Care & Service (136 | 2.4%), and Healthcare Support (120 | 2.1%).
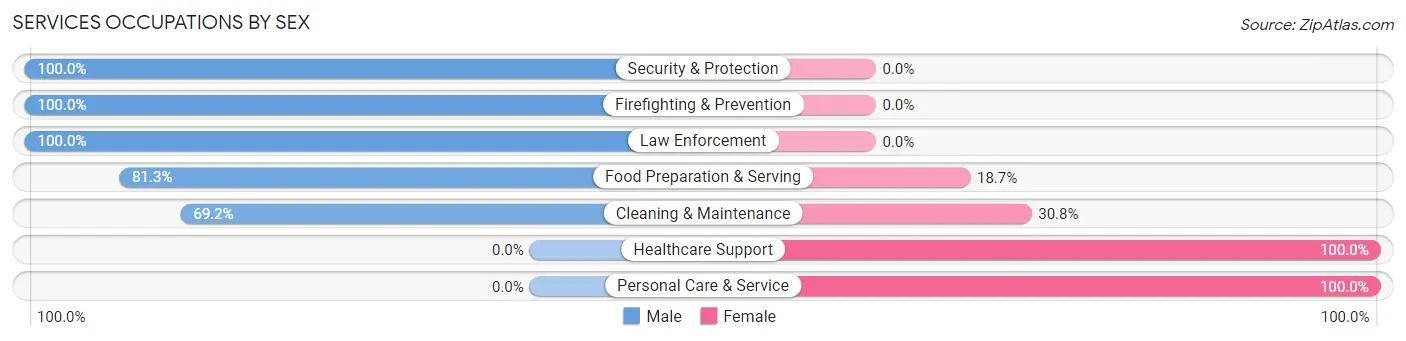
Services Occupations by Sex
Within the Services occupations in Star, the most male-oriented occupations are Security & Protection (100.0%), Firefighting & Prevention (100.0%), and Law Enforcement (100.0%), while the most female-oriented occupations are Healthcare Support (100.0%), Personal Care & Service (100.0%), and Cleaning & Maintenance (30.8%).
| Occupation | Male | Female |
| Healthcare Support | 0 (0.0%) | 120 (100.0%) |
| Security & Protection | 144 (100.0%) | 0 (0.0%) |
| Firefighting & Prevention | 57 (100.0%) | 0 (0.0%) |
| Law Enforcement | 87 (100.0%) | 0 (0.0%) |
| Food Preparation & Serving | 139 (81.3%) | 32 (18.7%) |
| Cleaning & Maintenance | 240 (69.2%) | 107 (30.8%) |
| Personal Care & Service | 0 (0.0%) | 136 (100.0%) |
| Total (Category) | 523 (57.0%) | 395 (43.0%) |
| Total (Overall) | 3,417 (59.8%) | 2,295 (40.2%) |
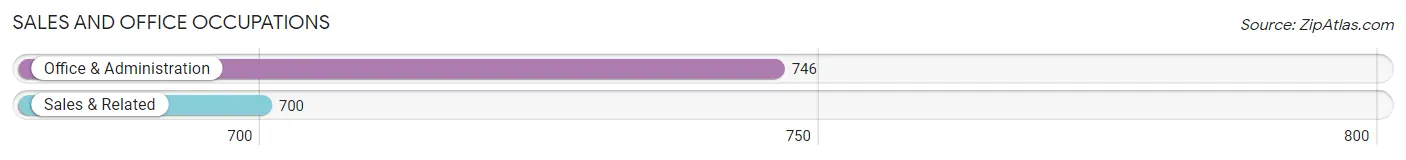
Sales and Office Occupations
The most common Sales and Office occupations in Star are Office & Administration (746 | 13.1%), and Sales & Related (700 | 12.2%).
Sales and Office Occupations by Sex
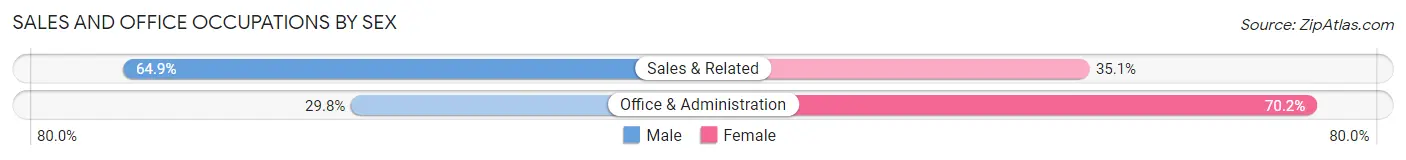
| Occupation | Male | Female |
| Sales & Related | 454 (64.9%) | 246 (35.1%) |
| Office & Administration | 222 (29.8%) | 524 (70.2%) |
| Total (Category) | 676 (46.8%) | 770 (53.2%) |
| Total (Overall) | 3,417 (59.8%) | 2,295 (40.2%) |
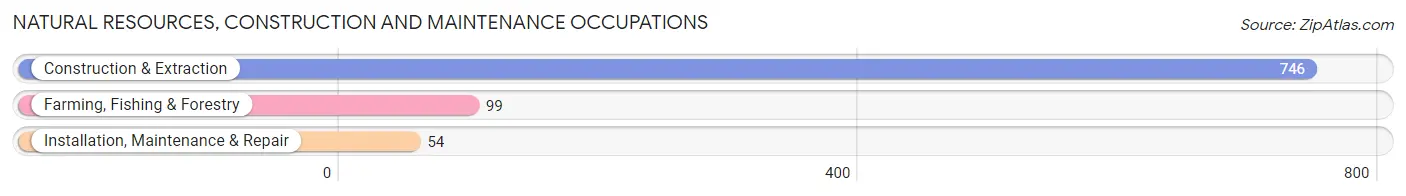
Natural Resources, Construction and Maintenance Occupations
The most common Natural Resources, Construction and Maintenance occupations in Star are Construction & Extraction (746 | 13.1%), Farming, Fishing & Forestry (99 | 1.7%), and Installation, Maintenance & Repair (54 | 0.9%).
Natural Resources, Construction and Maintenance Occupations by Sex
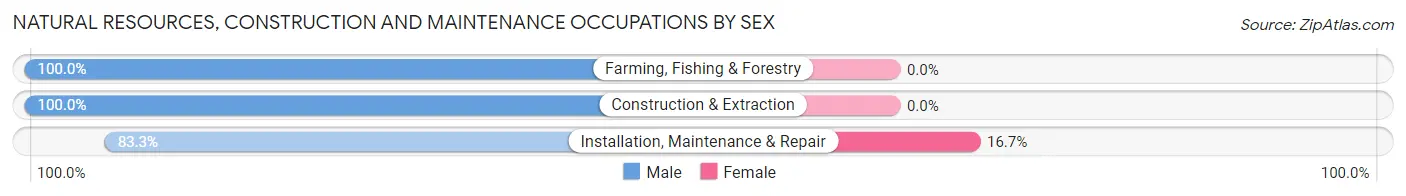
| Occupation | Male | Female |
| Farming, Fishing & Forestry | 99 (100.0%) | 0 (0.0%) |
| Construction & Extraction | 746 (100.0%) | 0 (0.0%) |
| Installation, Maintenance & Repair | 45 (83.3%) | 9 (16.7%) |
| Total (Category) | 890 (99.0%) | 9 (1.0%) |
| Total (Overall) | 3,417 (59.8%) | 2,295 (40.2%) |
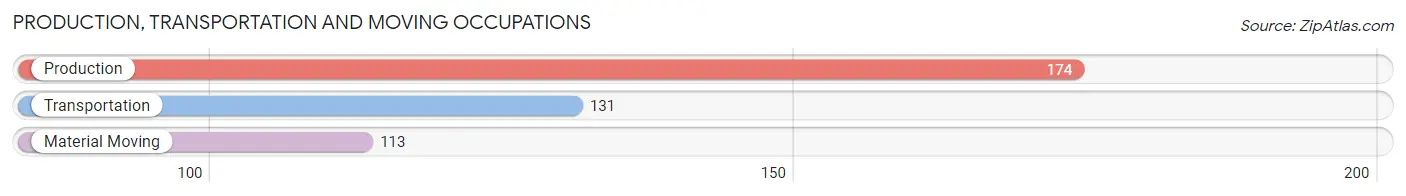
Production, Transportation and Moving Occupations
The most common Production, Transportation and Moving occupations in Star are Production (174 | 3.0%), Transportation (131 | 2.3%), and Material Moving (113 | 2.0%).
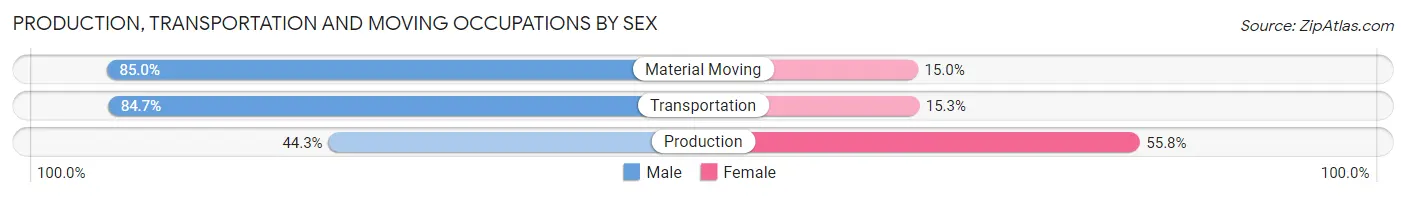
Production, Transportation and Moving Occupations by Sex
| Occupation | Male | Female |
| Production | 77 (44.3%) | 97 (55.7%) |
| Transportation | 111 (84.7%) | 20 (15.3%) |
| Material Moving | 96 (85.0%) | 17 (15.0%) |
| Total (Category) | 284 (67.9%) | 134 (32.1%) |
| Total (Overall) | 3,417 (59.8%) | 2,295 (40.2%) |
Employment Industries by Sex in Star
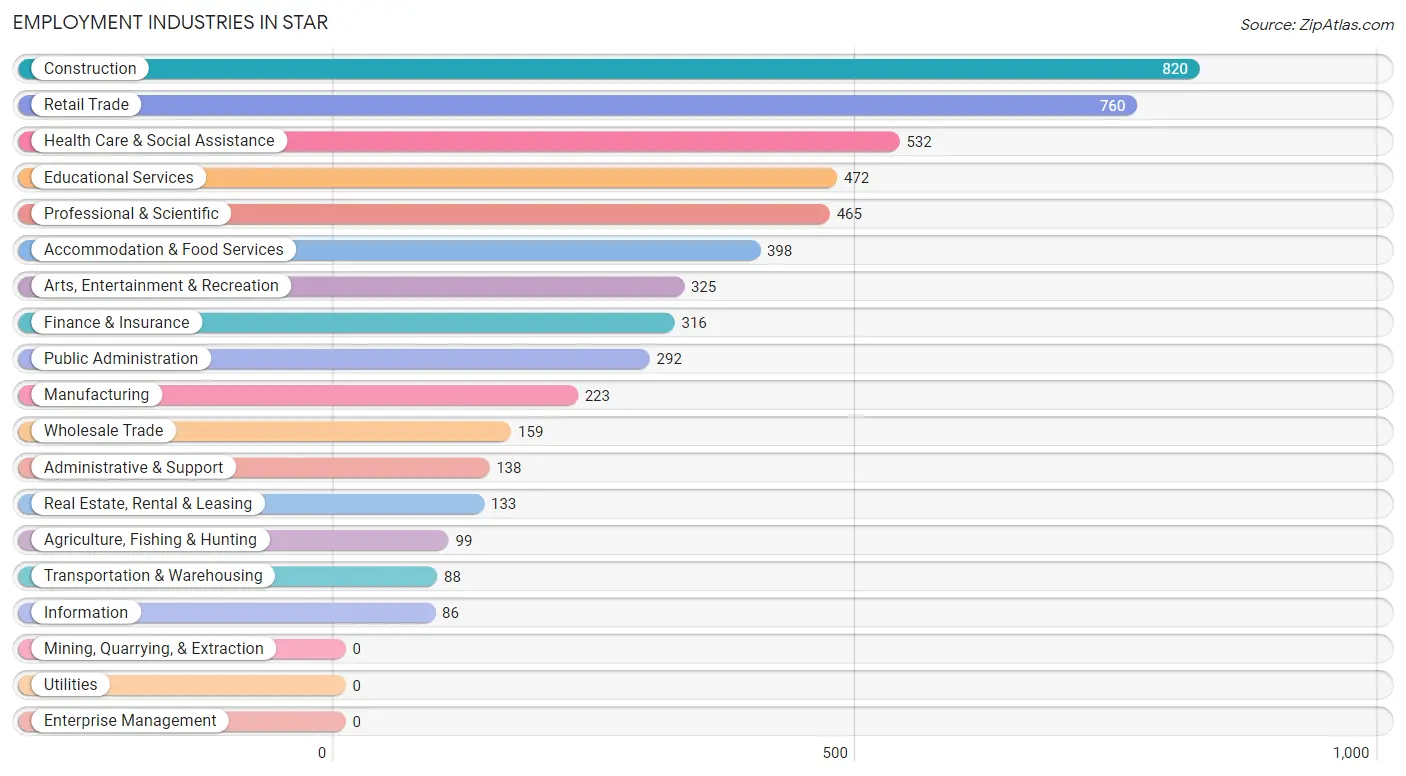
Employment Industries in Star
The major employment industries in Star include Construction (820 | 14.4%), Retail Trade (760 | 13.3%), Health Care & Social Assistance (532 | 9.3%), Educational Services (472 | 8.3%), and Professional & Scientific (465 | 8.1%).
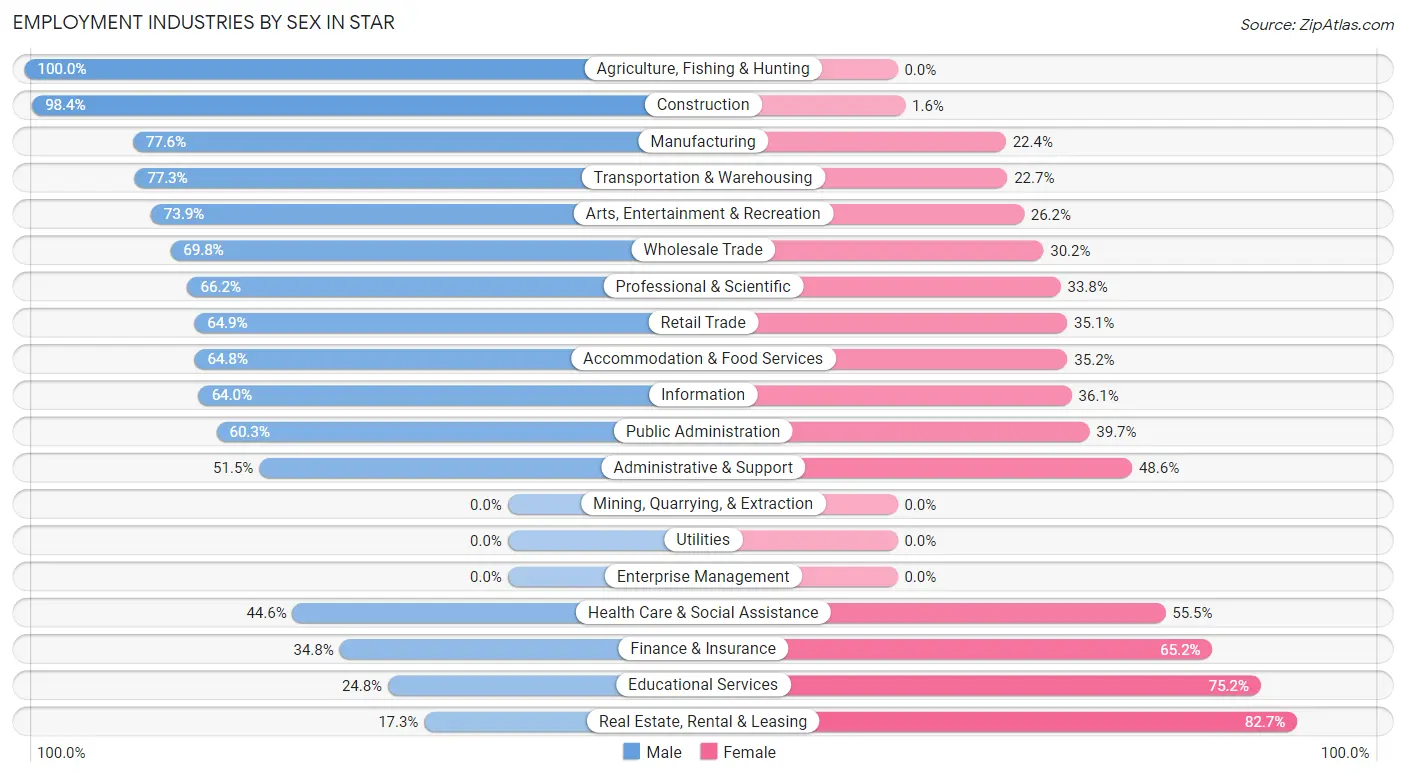
Employment Industries by Sex in Star
The Star industries that see more men than women are Agriculture, Fishing & Hunting (100.0%), Construction (98.4%), and Manufacturing (77.6%), whereas the industries that tend to have a higher number of women are Real Estate, Rental & Leasing (82.7%), Educational Services (75.2%), and Finance & Insurance (65.2%).
| Industry | Male | Female |
| Agriculture, Fishing & Hunting | 99 (100.0%) | 0 (0.0%) |
| Mining, Quarrying, & Extraction | 0 (0.0%) | 0 (0.0%) |
| Construction | 807 (98.4%) | 13 (1.6%) |
| Manufacturing | 173 (77.6%) | 50 (22.4%) |
| Wholesale Trade | 111 (69.8%) | 48 (30.2%) |
| Retail Trade | 493 (64.9%) | 267 (35.1%) |
| Transportation & Warehousing | 68 (77.3%) | 20 (22.7%) |
| Utilities | 0 (0.0%) | 0 (0.0%) |
| Information | 55 (63.9%) | 31 (36.0%) |
| Finance & Insurance | 110 (34.8%) | 206 (65.2%) |
| Real Estate, Rental & Leasing | 23 (17.3%) | 110 (82.7%) |
| Professional & Scientific | 308 (66.2%) | 157 (33.8%) |
| Enterprise Management | 0 (0.0%) | 0 (0.0%) |
| Administrative & Support | 71 (51.4%) | 67 (48.5%) |
| Educational Services | 117 (24.8%) | 355 (75.2%) |
| Health Care & Social Assistance | 237 (44.6%) | 295 (55.4%) |
| Arts, Entertainment & Recreation | 240 (73.9%) | 85 (26.2%) |
| Accommodation & Food Services | 258 (64.8%) | 140 (35.2%) |
| Public Administration | 176 (60.3%) | 116 (39.7%) |
| Total | 3,417 (59.8%) | 2,295 (40.2%) |
Education in Star
School Enrollment in Star
The most common levels of schooling among the 3,126 students in Star are elementary school (741 | 23.7%), high school (730 | 23.4%), and college / undergraduate (635 | 20.3%).
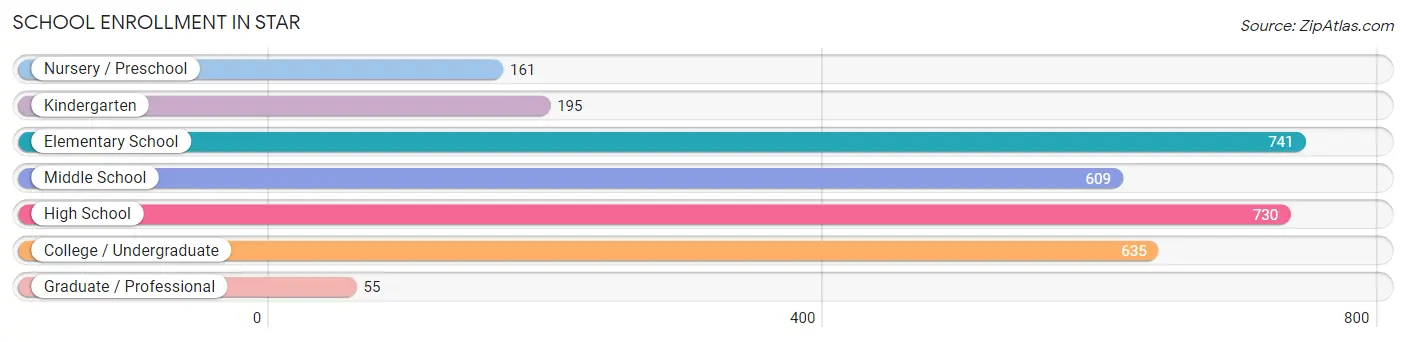
| School Level | # Students | % Students |
| Nursery / Preschool | 161 | 5.1% |
| Kindergarten | 195 | 6.2% |
| Elementary School | 741 | 23.7% |
| Middle School | 609 | 19.5% |
| High School | 730 | 23.4% |
| College / Undergraduate | 635 | 20.3% |
| Graduate / Professional | 55 | 1.8% |
| Total | 3,126 | 100.0% |
School Enrollment by Age by Funding Source in Star
Out of a total of 3,126 students who are enrolled in schools in Star, 353 (11.3%) attend a private institution, while the remaining 2,773 (88.7%) are enrolled in public schools. The age group of 3 to 4 year olds has the highest likelihood of being enrolled in private schools, with 72 (61.5% in the age bracket) enrolled. Conversely, the age group of 18 to 19 year olds has the lowest likelihood of being enrolled in a private school, with 261 (100.0% in the age bracket) attending a public institution.
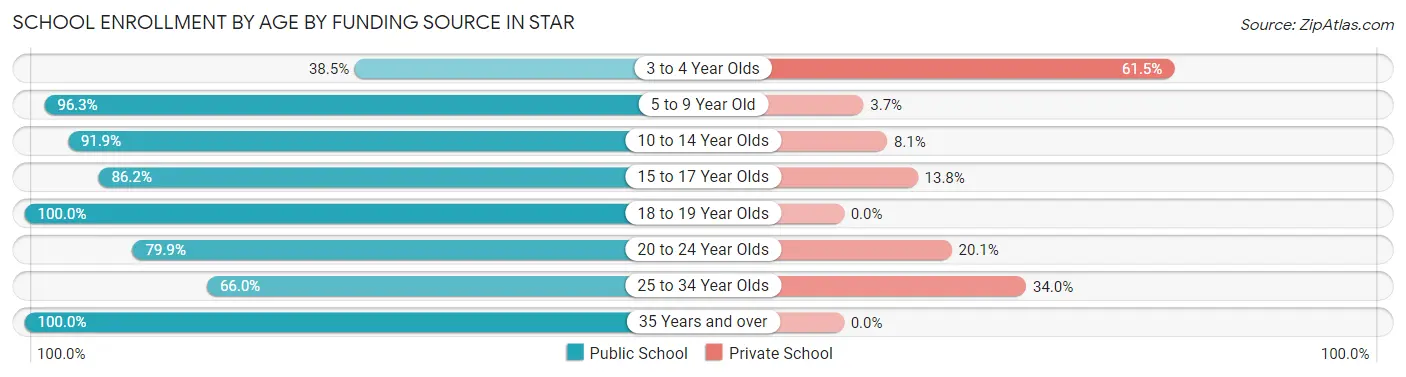
| Age Bracket | Public School | Private School |
| 3 to 4 Year Olds | 45 (38.5%) | 72 (61.5%) |
| 5 to 9 Year Old | 787 (96.3%) | 30 (3.7%) |
| 10 to 14 Year Olds | 913 (91.9%) | 80 (8.1%) |
| 15 to 17 Year Olds | 382 (86.2%) | 61 (13.8%) |
| 18 to 19 Year Olds | 261 (100.0%) | 0 (0.0%) |
| 20 to 24 Year Olds | 159 (79.9%) | 40 (20.1%) |
| 25 to 34 Year Olds | 138 (66.0%) | 71 (34.0%) |
| 35 Years and over | 87 (100.0%) | 0 (0.0%) |
| Total | 2,773 (88.7%) | 353 (11.3%) |
Educational Attainment by Field of Study in Star
Business (467 | 16.0%), education (409 | 14.0%), visual & performing arts (324 | 11.1%), science & technology (311 | 10.7%), and bio, nature & agricultural (232 | 8.0%) are the most common fields of study among 2,913 individuals in Star who have obtained a bachelor's degree or higher.
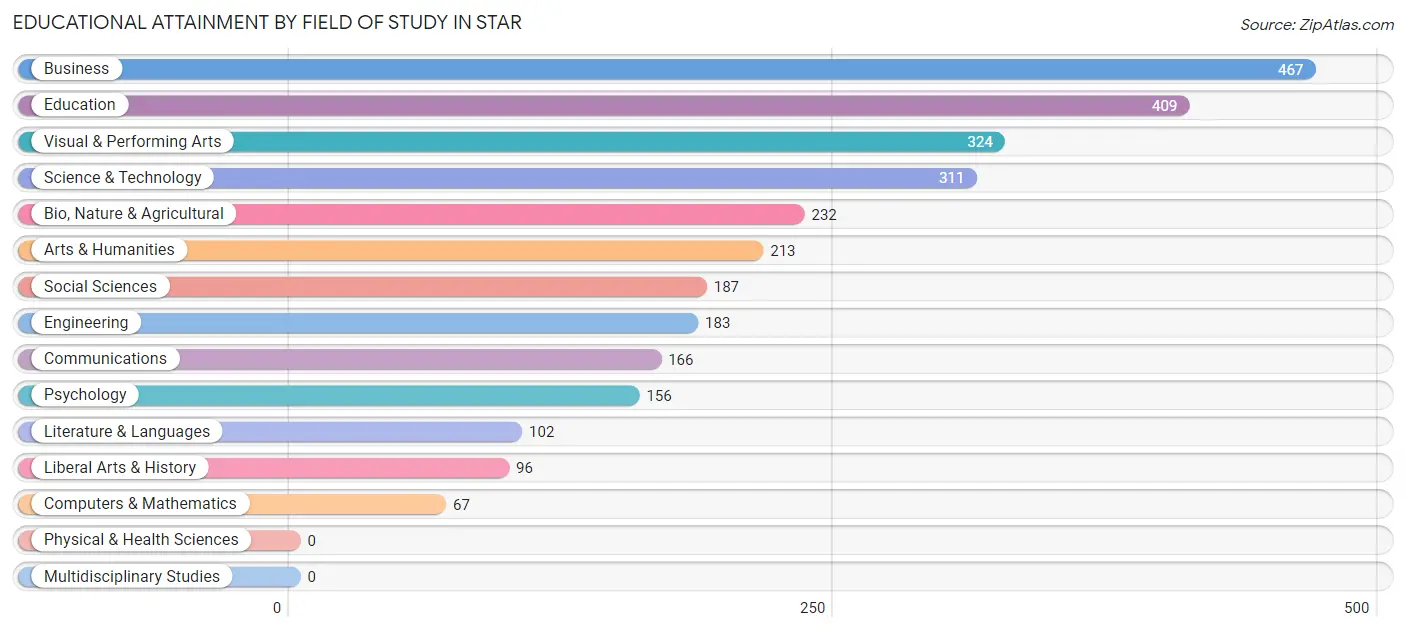
| Field of Study | # Graduates | % Graduates |
| Computers & Mathematics | 67 | 2.3% |
| Bio, Nature & Agricultural | 232 | 8.0% |
| Physical & Health Sciences | 0 | 0.0% |
| Psychology | 156 | 5.4% |
| Social Sciences | 187 | 6.4% |
| Engineering | 183 | 6.3% |
| Multidisciplinary Studies | 0 | 0.0% |
| Science & Technology | 311 | 10.7% |
| Business | 467 | 16.0% |
| Education | 409 | 14.0% |
| Literature & Languages | 102 | 3.5% |
| Liberal Arts & History | 96 | 3.3% |
| Visual & Performing Arts | 324 | 11.1% |
| Communications | 166 | 5.7% |
| Arts & Humanities | 213 | 7.3% |
| Total | 2,913 | 100.0% |
Transportation & Commute in Star
Vehicle Availability by Sex in Star
The most prevalent vehicle ownership categories in Star are males with 2 vehicles (1,665, accounting for 49.3%) and females with 2 vehicles (814, making up 73.8%).
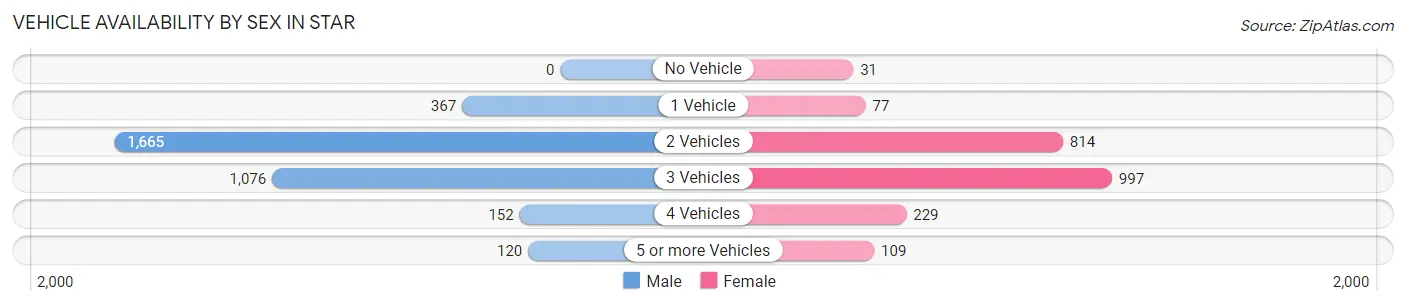
| Vehicles Available | Male | Female |
| No Vehicle | 0 (0.0%) | 31 (1.4%) |
| 1 Vehicle | 367 (10.9%) | 77 (3.4%) |
| 2 Vehicles | 1,665 (49.3%) | 814 (36.1%) |
| 3 Vehicles | 1,076 (31.8%) | 997 (44.2%) |
| 4 Vehicles | 152 (4.5%) | 229 (10.2%) |
| 5 or more Vehicles | 120 (3.5%) | 109 (4.8%) |
| Total | 3,380 (100.0%) | 2,257 (100.0%) |
Commute Time in Star
The most frequently occuring commute durations in Star are 30 to 34 minutes (1,232 commuters, 26.6%), 15 to 19 minutes (706 commuters, 15.3%), and 20 to 24 minutes (636 commuters, 13.8%).
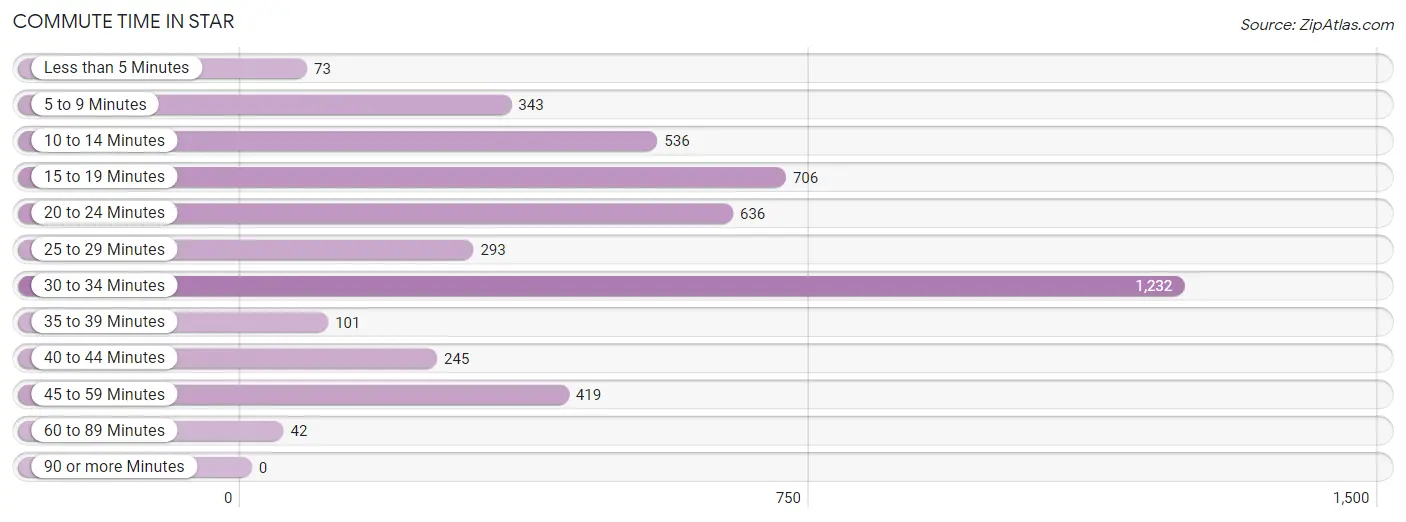
| Commute Time | # Commuters | % Commuters |
| Less than 5 Minutes | 73 | 1.6% |
| 5 to 9 Minutes | 343 | 7.4% |
| 10 to 14 Minutes | 536 | 11.6% |
| 15 to 19 Minutes | 706 | 15.3% |
| 20 to 24 Minutes | 636 | 13.8% |
| 25 to 29 Minutes | 293 | 6.3% |
| 30 to 34 Minutes | 1,232 | 26.6% |
| 35 to 39 Minutes | 101 | 2.2% |
| 40 to 44 Minutes | 245 | 5.3% |
| 45 to 59 Minutes | 419 | 9.1% |
| 60 to 89 Minutes | 42 | 0.9% |
| 90 or more Minutes | 0 | 0.0% |
Commute Time by Sex in Star
The most common commute times in Star are 30 to 34 minutes (752 commuters, 26.8%) for males and 30 to 34 minutes (480 commuters, 26.4%) for females.
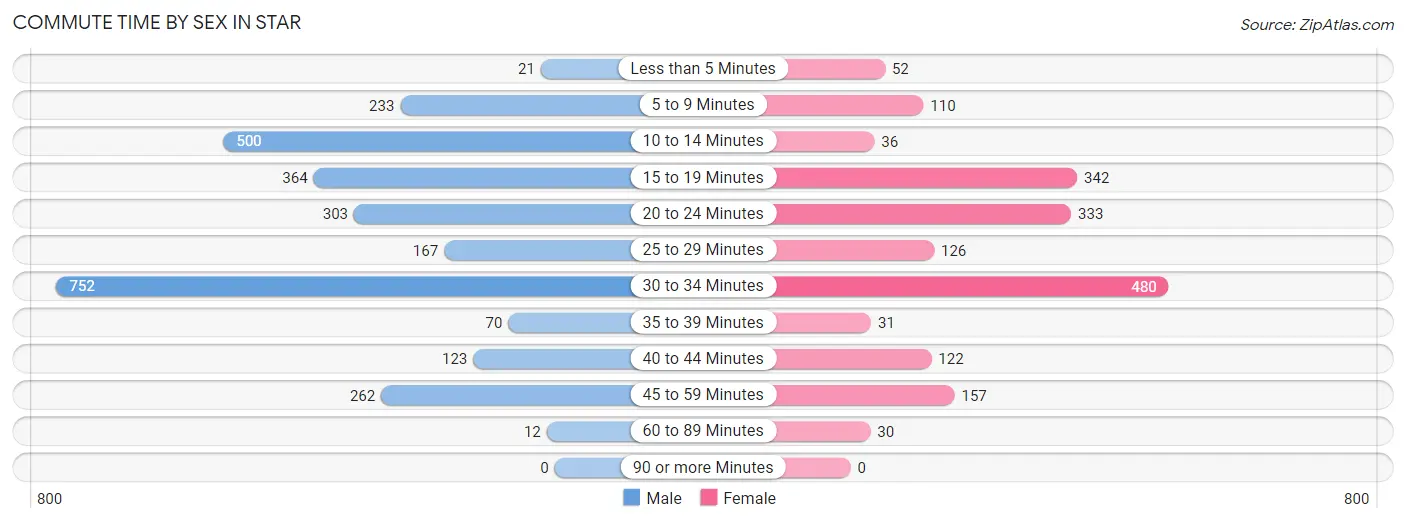
| Commute Time | Male | Female |
| Less than 5 Minutes | 21 (0.7%) | 52 (2.9%) |
| 5 to 9 Minutes | 233 (8.3%) | 110 (6.0%) |
| 10 to 14 Minutes | 500 (17.8%) | 36 (2.0%) |
| 15 to 19 Minutes | 364 (13.0%) | 342 (18.8%) |
| 20 to 24 Minutes | 303 (10.8%) | 333 (18.3%) |
| 25 to 29 Minutes | 167 (5.9%) | 126 (6.9%) |
| 30 to 34 Minutes | 752 (26.8%) | 480 (26.4%) |
| 35 to 39 Minutes | 70 (2.5%) | 31 (1.7%) |
| 40 to 44 Minutes | 123 (4.4%) | 122 (6.7%) |
| 45 to 59 Minutes | 262 (9.3%) | 157 (8.6%) |
| 60 to 89 Minutes | 12 (0.4%) | 30 (1.7%) |
| 90 or more Minutes | 0 (0.0%) | 0 (0.0%) |
Time of Departure to Work by Sex in Star
The most frequent times of departure to work in Star are 7:00 AM to 7:29 AM (804, 28.6%) for males and 7:00 AM to 7:29 AM (607, 33.4%) for females.
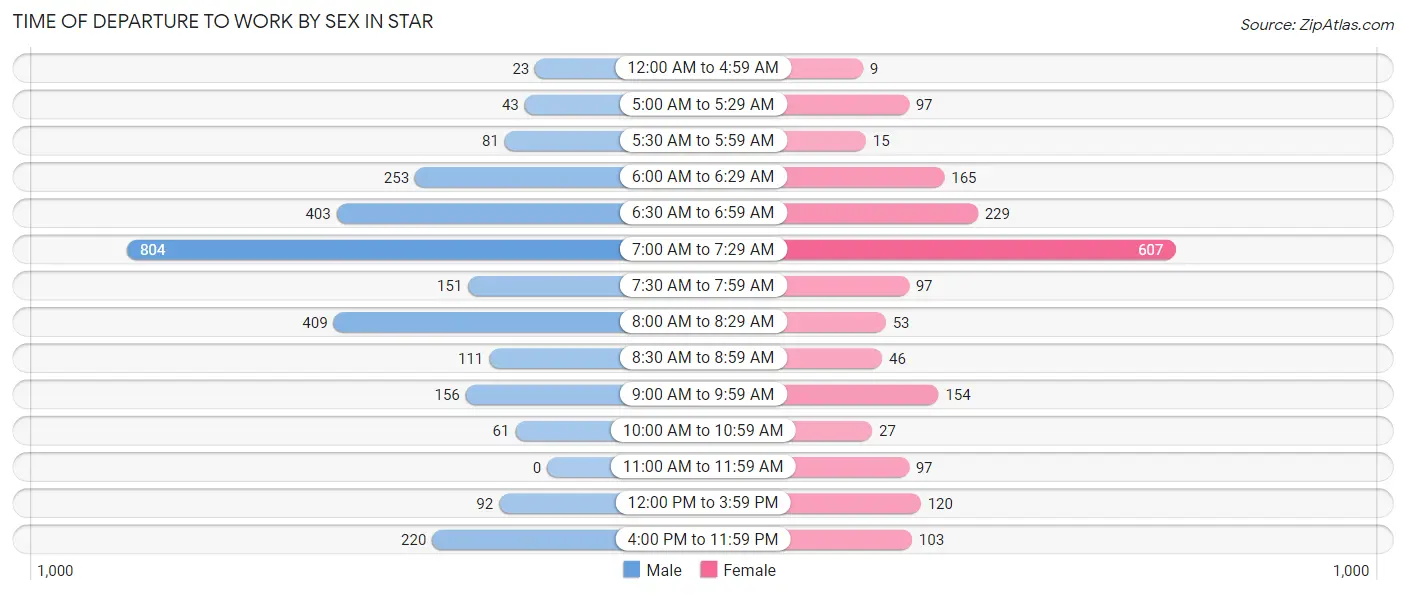
| Time of Departure | Male | Female |
| 12:00 AM to 4:59 AM | 23 (0.8%) | 9 (0.5%) |
| 5:00 AM to 5:29 AM | 43 (1.5%) | 97 (5.3%) |
| 5:30 AM to 5:59 AM | 81 (2.9%) | 15 (0.8%) |
| 6:00 AM to 6:29 AM | 253 (9.0%) | 165 (9.1%) |
| 6:30 AM to 6:59 AM | 403 (14.4%) | 229 (12.6%) |
| 7:00 AM to 7:29 AM | 804 (28.6%) | 607 (33.4%) |
| 7:30 AM to 7:59 AM | 151 (5.4%) | 97 (5.3%) |
| 8:00 AM to 8:29 AM | 409 (14.6%) | 53 (2.9%) |
| 8:30 AM to 8:59 AM | 111 (4.0%) | 46 (2.5%) |
| 9:00 AM to 9:59 AM | 156 (5.6%) | 154 (8.5%) |
| 10:00 AM to 10:59 AM | 61 (2.2%) | 27 (1.5%) |
| 11:00 AM to 11:59 AM | 0 (0.0%) | 97 (5.3%) |
| 12:00 PM to 3:59 PM | 92 (3.3%) | 120 (6.6%) |
| 4:00 PM to 11:59 PM | 220 (7.8%) | 103 (5.7%) |
| Total | 2,807 (100.0%) | 1,819 (100.0%) |
Housing Occupancy in Star
Occupancy by Ownership in Star
Of the total 4,258 dwellings in Star, owner-occupied units account for 3,475 (81.6%), while renter-occupied units make up 783 (18.4%).
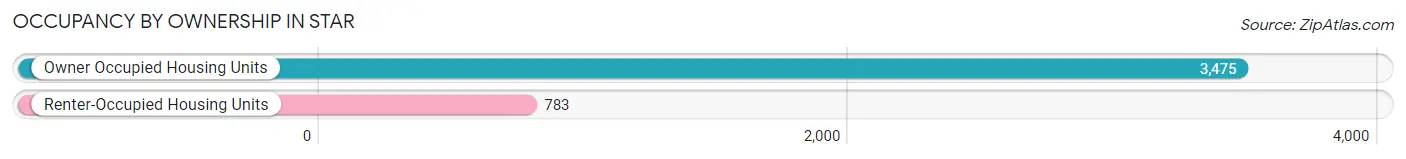
| Occupancy | # Housing Units | % Housing Units |
| Owner Occupied Housing Units | 3,475 | 81.6% |
| Renter-Occupied Housing Units | 783 | 18.4% |
| Total Occupied Housing Units | 4,258 | 100.0% |
Occupancy by Household Size in Star
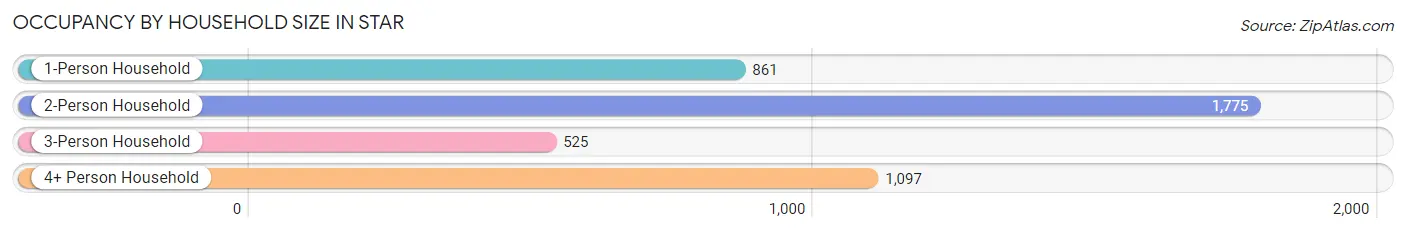
| Household Size | # Housing Units | % Housing Units |
| 1-Person Household | 861 | 20.2% |
| 2-Person Household | 1,775 | 41.7% |
| 3-Person Household | 525 | 12.3% |
| 4+ Person Household | 1,097 | 25.8% |
| Total Housing Units | 4,258 | 100.0% |
Occupancy by Ownership by Household Size in Star
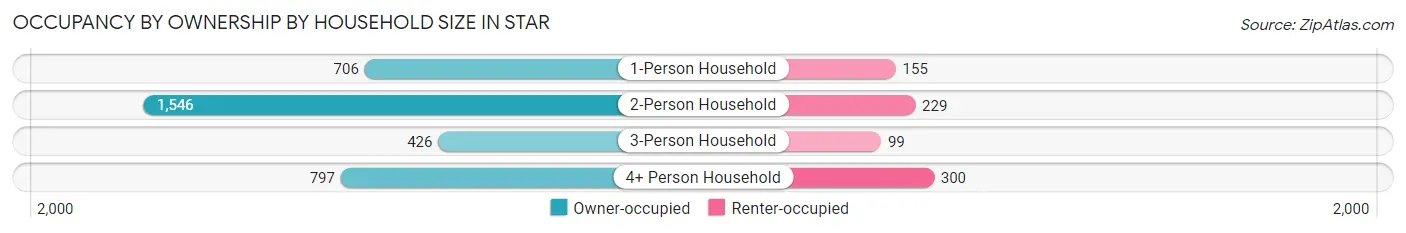
| Household Size | Owner-occupied | Renter-occupied |
| 1-Person Household | 706 (82.0%) | 155 (18.0%) |
| 2-Person Household | 1,546 (87.1%) | 229 (12.9%) |
| 3-Person Household | 426 (81.1%) | 99 (18.9%) |
| 4+ Person Household | 797 (72.7%) | 300 (27.4%) |
| Total Housing Units | 3,475 (81.6%) | 783 (18.4%) |
Occupancy by Educational Attainment in Star
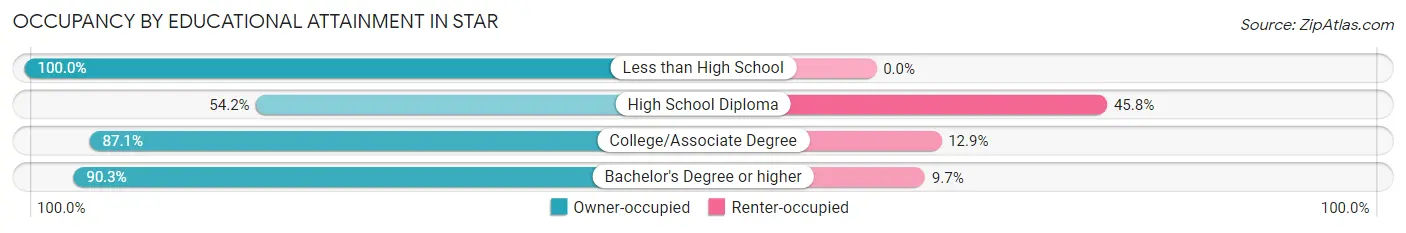
| Household Size | Owner-occupied | Renter-occupied |
| Less than High School | 8 (100.0%) | 0 (0.0%) |
| High School Diploma | 467 (54.2%) | 394 (45.8%) |
| College/Associate Degree | 1,654 (87.1%) | 245 (12.9%) |
| Bachelor's Degree or higher | 1,346 (90.3%) | 144 (9.7%) |
Occupancy by Age of Householder in Star
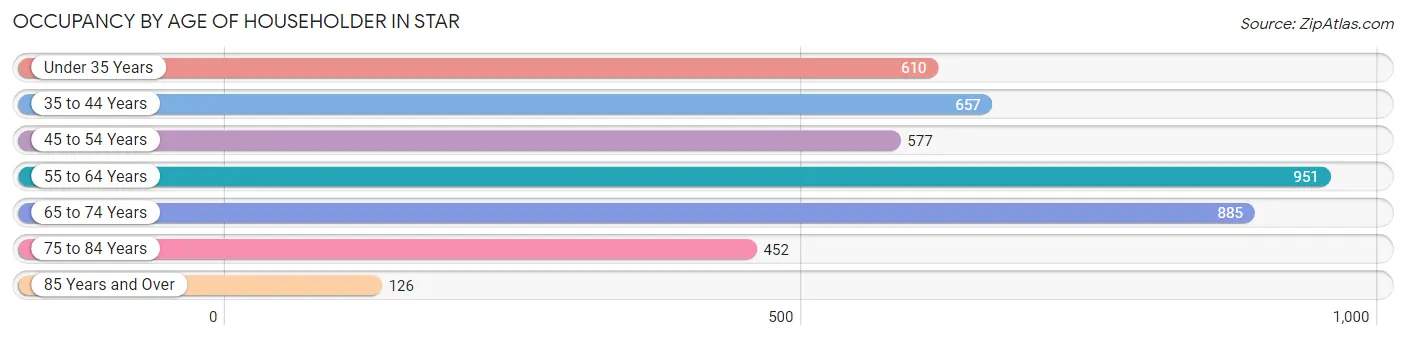
| Age Bracket | # Households | % Households |
| Under 35 Years | 610 | 14.3% |
| 35 to 44 Years | 657 | 15.4% |
| 45 to 54 Years | 577 | 13.6% |
| 55 to 64 Years | 951 | 22.3% |
| 65 to 74 Years | 885 | 20.8% |
| 75 to 84 Years | 452 | 10.6% |
| 85 Years and Over | 126 | 3.0% |
| Total | 4,258 | 100.0% |
Housing Finances in Star
Median Income by Occupancy in Star
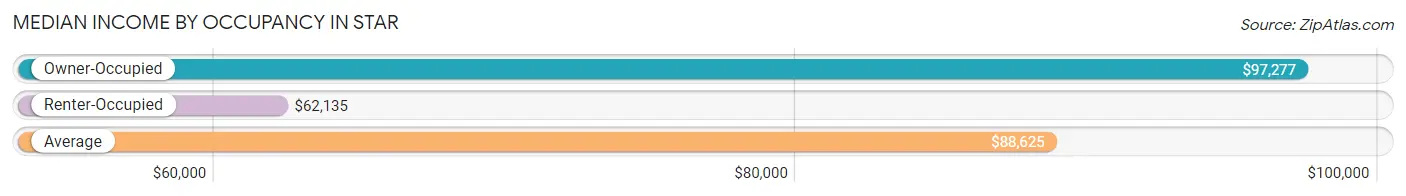
| Occupancy Type | # Households | Median Income |
| Owner-Occupied | 3,475 (81.6%) | $97,277 |
| Renter-Occupied | 783 (18.4%) | $62,135 |
| Average | 4,258 (100.0%) | $88,625 |
Occupancy by Householder Income Bracket in Star
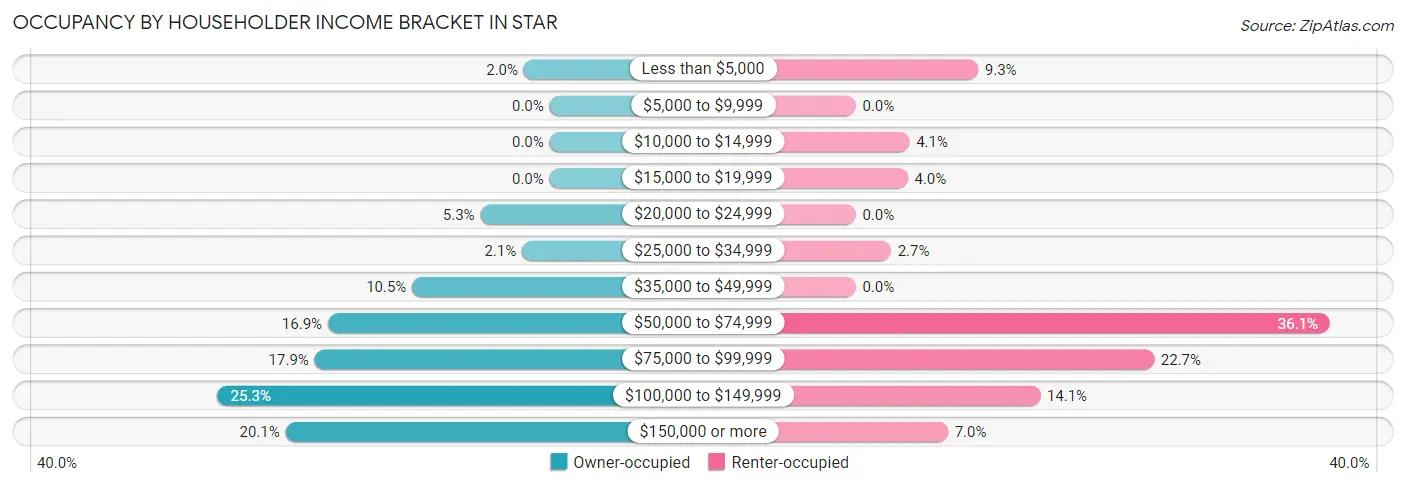
| Income Bracket | Owner-occupied | Renter-occupied |
| Less than $5,000 | 68 (2.0%) | 73 (9.3%) |
| $5,000 to $9,999 | 0 (0.0%) | 0 (0.0%) |
| $10,000 to $14,999 | 0 (0.0%) | 32 (4.1%) |
| $15,000 to $19,999 | 0 (0.0%) | 31 (4.0%) |
| $20,000 to $24,999 | 183 (5.3%) | 0 (0.0%) |
| $25,000 to $34,999 | 73 (2.1%) | 21 (2.7%) |
| $35,000 to $49,999 | 364 (10.5%) | 0 (0.0%) |
| $50,000 to $74,999 | 587 (16.9%) | 283 (36.1%) |
| $75,000 to $99,999 | 622 (17.9%) | 178 (22.7%) |
| $100,000 to $149,999 | 879 (25.3%) | 110 (14.1%) |
| $150,000 or more | 699 (20.1%) | 55 (7.0%) |
| Total | 3,475 (100.0%) | 783 (100.0%) |
Monthly Housing Cost Tiers in Star
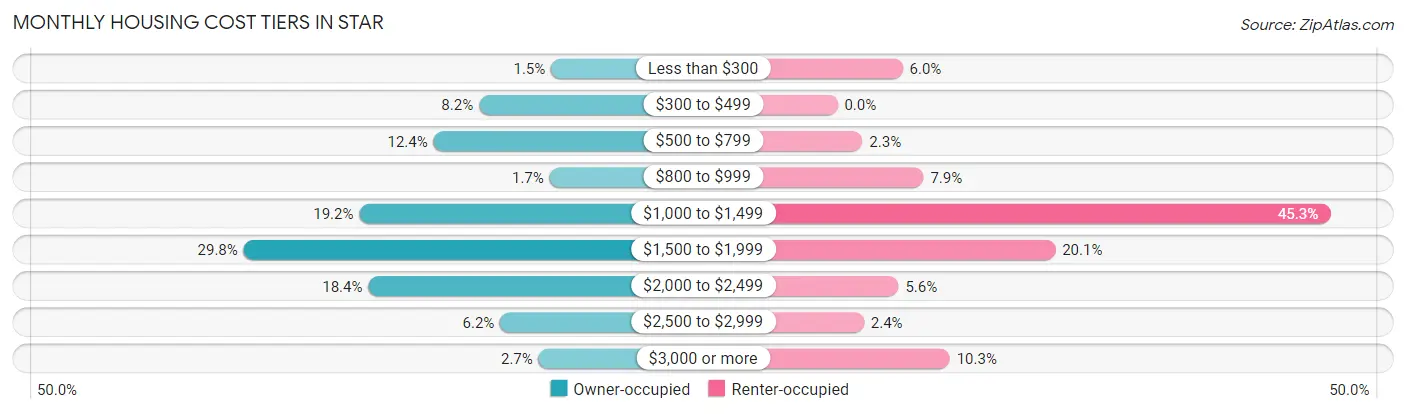
| Monthly Cost | Owner-occupied | Renter-occupied |
| Less than $300 | 53 (1.5%) | 47 (6.0%) |
| $300 to $499 | 284 (8.2%) | 0 (0.0%) |
| $500 to $799 | 429 (12.3%) | 18 (2.3%) |
| $800 to $999 | 58 (1.7%) | 62 (7.9%) |
| $1,000 to $1,499 | 667 (19.2%) | 355 (45.3%) |
| $1,500 to $1,999 | 1,037 (29.8%) | 157 (20.1%) |
| $2,000 to $2,499 | 638 (18.4%) | 44 (5.6%) |
| $2,500 to $2,999 | 216 (6.2%) | 19 (2.4%) |
| $3,000 or more | 93 (2.7%) | 81 (10.3%) |
| Total | 3,475 (100.0%) | 783 (100.0%) |
Physical Housing Characteristics in Star
Housing Structures in Star
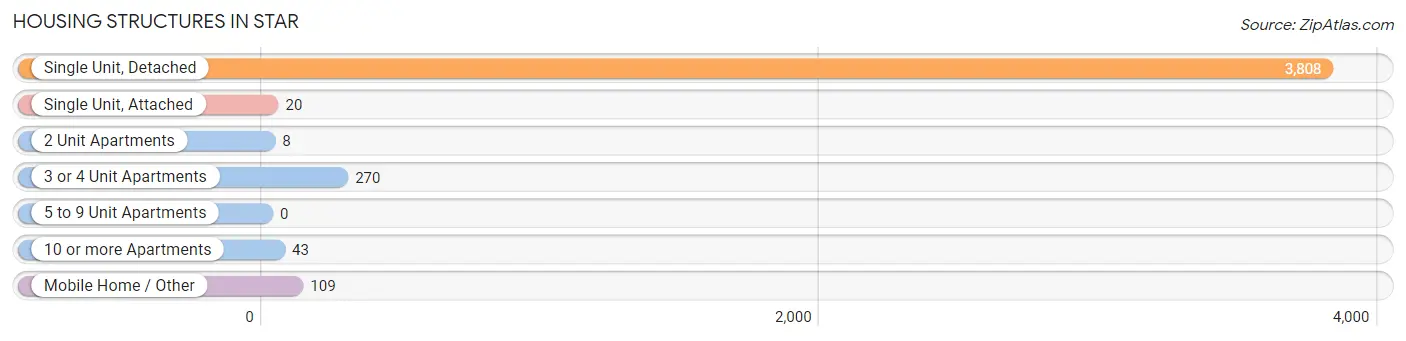
| Structure Type | # Housing Units | % Housing Units |
| Single Unit, Detached | 3,808 | 89.4% |
| Single Unit, Attached | 20 | 0.5% |
| 2 Unit Apartments | 8 | 0.2% |
| 3 or 4 Unit Apartments | 270 | 6.3% |
| 5 to 9 Unit Apartments | 0 | 0.0% |
| 10 or more Apartments | 43 | 1.0% |
| Mobile Home / Other | 109 | 2.6% |
| Total | 4,258 | 100.0% |
Housing Structures by Occupancy in Star
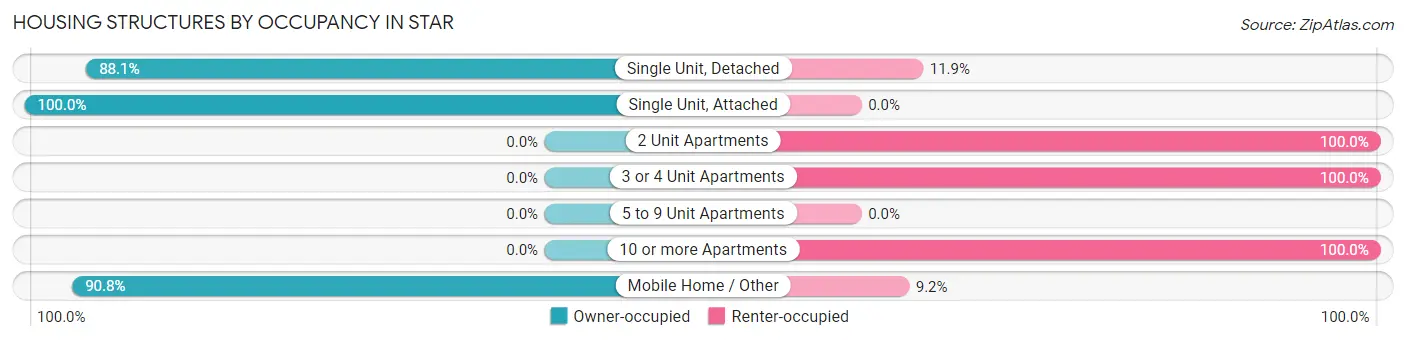
| Structure Type | Owner-occupied | Renter-occupied |
| Single Unit, Detached | 3,356 (88.1%) | 452 (11.9%) |
| Single Unit, Attached | 20 (100.0%) | 0 (0.0%) |
| 2 Unit Apartments | 0 (0.0%) | 8 (100.0%) |
| 3 or 4 Unit Apartments | 0 (0.0%) | 270 (100.0%) |
| 5 to 9 Unit Apartments | 0 (0.0%) | 0 (0.0%) |
| 10 or more Apartments | 0 (0.0%) | 43 (100.0%) |
| Mobile Home / Other | 99 (90.8%) | 10 (9.2%) |
| Total | 3,475 (81.6%) | 783 (18.4%) |
Housing Structures by Number of Rooms in Star
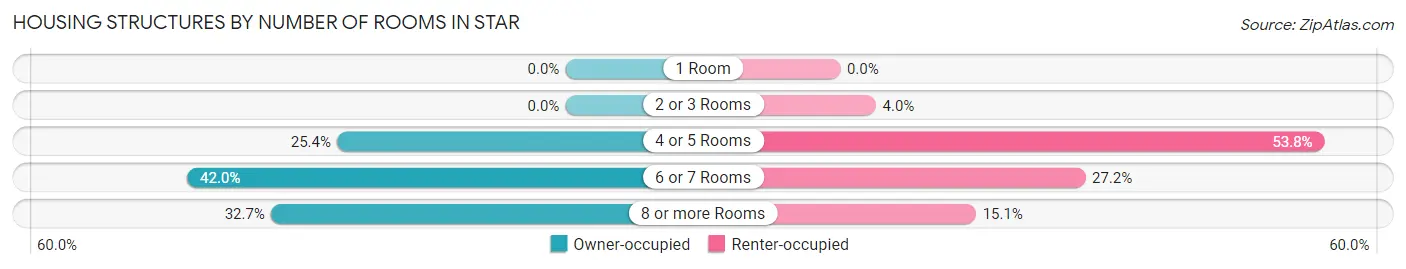
| Number of Rooms | Owner-occupied | Renter-occupied |
| 1 Room | 0 (0.0%) | 0 (0.0%) |
| 2 or 3 Rooms | 0 (0.0%) | 31 (4.0%) |
| 4 or 5 Rooms | 881 (25.4%) | 421 (53.8%) |
| 6 or 7 Rooms | 1,458 (42.0%) | 213 (27.2%) |
| 8 or more Rooms | 1,136 (32.7%) | 118 (15.1%) |
| Total | 3,475 (100.0%) | 783 (100.0%) |
Housing Structure by Heating Type in Star
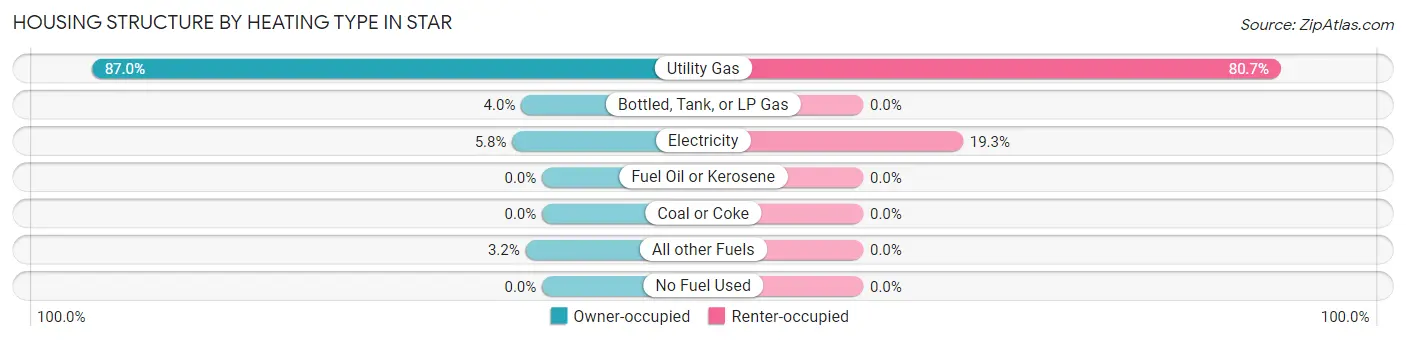
| Heating Type | Owner-occupied | Renter-occupied |
| Utility Gas | 3,024 (87.0%) | 632 (80.7%) |
| Bottled, Tank, or LP Gas | 140 (4.0%) | 0 (0.0%) |
| Electricity | 200 (5.8%) | 151 (19.3%) |
| Fuel Oil or Kerosene | 0 (0.0%) | 0 (0.0%) |
| Coal or Coke | 0 (0.0%) | 0 (0.0%) |
| All other Fuels | 111 (3.2%) | 0 (0.0%) |
| No Fuel Used | 0 (0.0%) | 0 (0.0%) |
| Total | 3,475 (100.0%) | 783 (100.0%) |
Household Vehicle Usage in Star
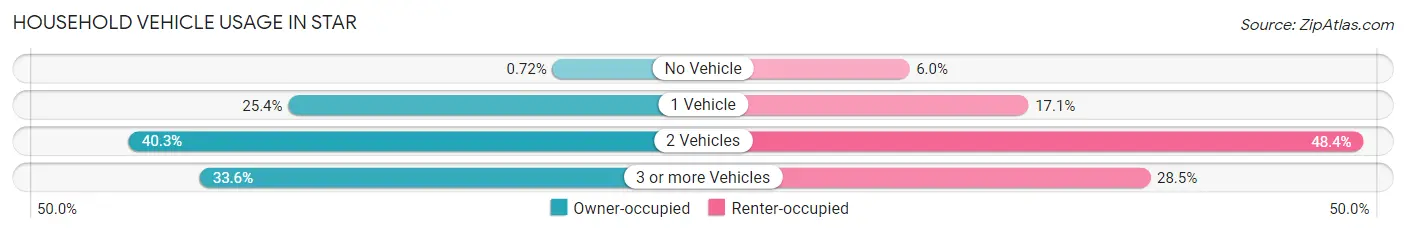
| Vehicles per Household | Owner-occupied | Renter-occupied |
| No Vehicle | 25 (0.7%) | 47 (6.0%) |
| 1 Vehicle | 882 (25.4%) | 134 (17.1%) |
| 2 Vehicles | 1,399 (40.3%) | 379 (48.4%) |
| 3 or more Vehicles | 1,169 (33.6%) | 223 (28.5%) |
| Total | 3,475 (100.0%) | 783 (100.0%) |
Real Estate & Mortgages in Star
Real Estate and Mortgage Overview in Star
| Characteristic | Without Mortgage | With Mortgage |
| Housing Units | 826 | 2,649 |
| Median Property Value | $498,500 | $422,100 |
| Median Household Income | $106,136 | $495 |
| Monthly Housing Costs | $575 | $85 |
| Real Estate Taxes | $3,051 | $0 |
Property Value by Mortgage Status in Star
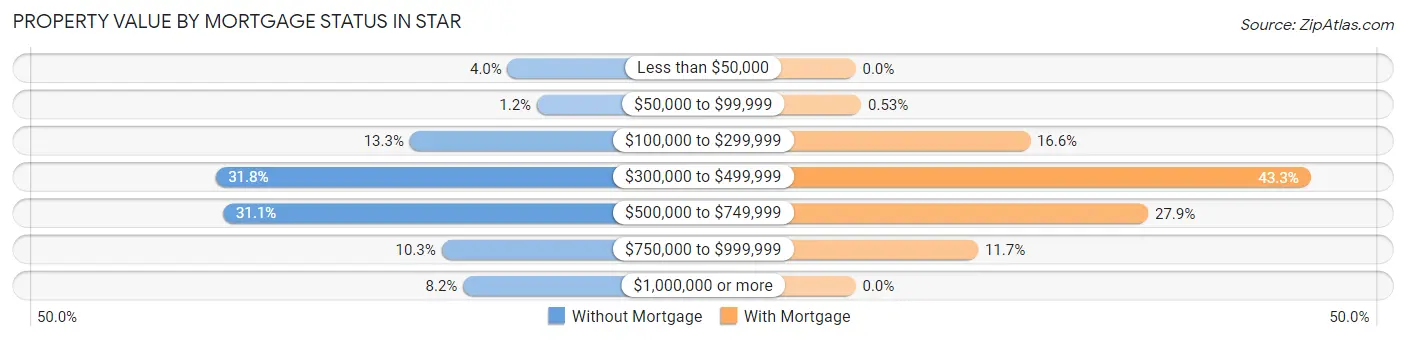
| Property Value | Without Mortgage | With Mortgage |
| Less than $50,000 | 33 (4.0%) | 0 (0.0%) |
| $50,000 to $99,999 | 10 (1.2%) | 14 (0.5%) |
| $100,000 to $299,999 | 110 (13.3%) | 440 (16.6%) |
| $300,000 to $499,999 | 263 (31.8%) | 1,148 (43.3%) |
| $500,000 to $749,999 | 257 (31.1%) | 738 (27.9%) |
| $750,000 to $999,999 | 85 (10.3%) | 309 (11.7%) |
| $1,000,000 or more | 68 (8.2%) | 0 (0.0%) |
| Total | 826 (100.0%) | 2,649 (100.0%) |
Household Income by Mortgage Status in Star
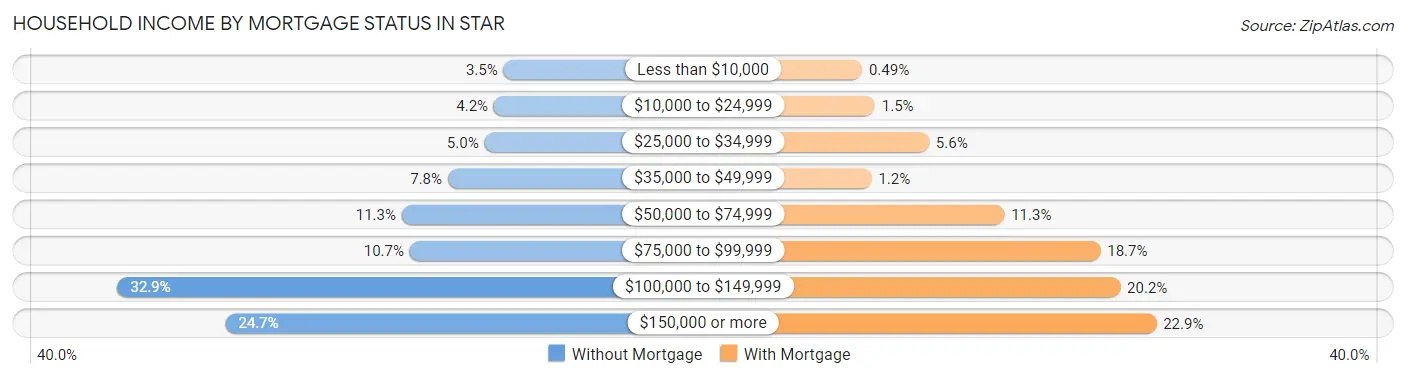
| Household Income | Without Mortgage | With Mortgage |
| Less than $10,000 | 29 (3.5%) | 13 (0.5%) |
| $10,000 to $24,999 | 35 (4.2%) | 39 (1.5%) |
| $25,000 to $34,999 | 41 (5.0%) | 148 (5.6%) |
| $35,000 to $49,999 | 64 (7.7%) | 32 (1.2%) |
| $50,000 to $74,999 | 93 (11.3%) | 300 (11.3%) |
| $75,000 to $99,999 | 88 (10.6%) | 494 (18.6%) |
| $100,000 to $149,999 | 272 (32.9%) | 534 (20.2%) |
| $150,000 or more | 204 (24.7%) | 607 (22.9%) |
| Total | 826 (100.0%) | 2,649 (100.0%) |
Property Value to Household Income Ratio in Star
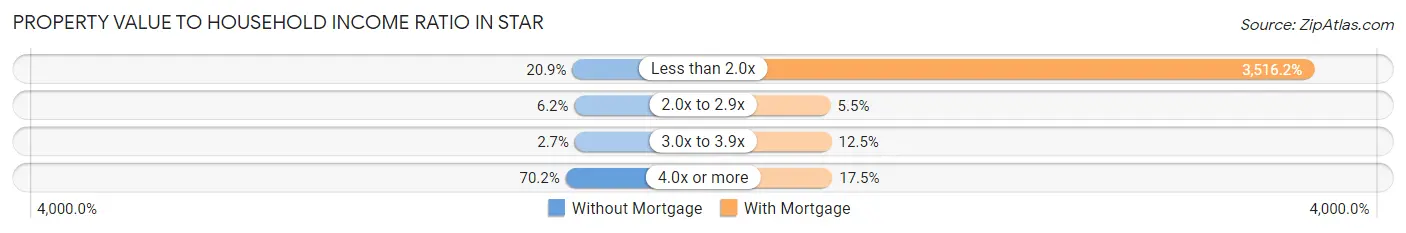
| Value-to-Income Ratio | Without Mortgage | With Mortgage |
| Less than 2.0x | 173 (20.9%) | 93,144 (3,516.2%) |
| 2.0x to 2.9x | 51 (6.2%) | 146 (5.5%) |
| 3.0x to 3.9x | 22 (2.7%) | 332 (12.5%) |
| 4.0x or more | 580 (70.2%) | 463 (17.5%) |
| Total | 826 (100.0%) | 2,649 (100.0%) |
Real Estate Taxes by Mortgage Status in Star
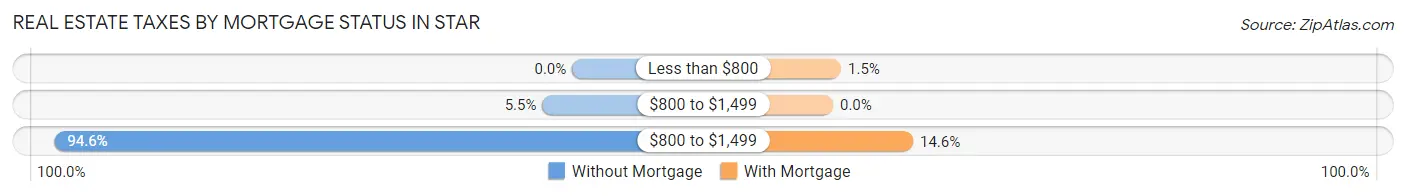
| Property Taxes | Without Mortgage | With Mortgage |
| Less than $800 | 0 (0.0%) | 39 (1.5%) |
| $800 to $1,499 | 45 (5.4%) | 0 (0.0%) |
| $800 to $1,499 | 781 (94.6%) | 387 (14.6%) |
| Total | 826 (100.0%) | 2,649 (100.0%) |
Health & Disability in Star
Health Insurance Coverage by Age in Star
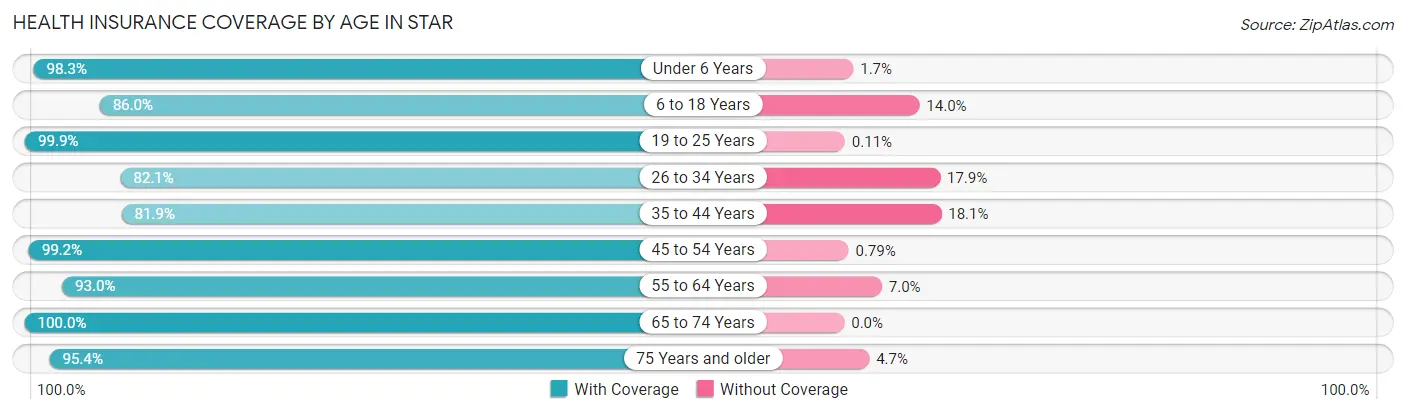
| Age Bracket | With Coverage | Without Coverage |
| Under 6 Years | 644 (98.3%) | 11 (1.7%) |
| 6 to 18 Years | 2,013 (86.0%) | 328 (14.0%) |
| 19 to 25 Years | 881 (99.9%) | 1 (0.1%) |
| 26 to 34 Years | 1,044 (82.1%) | 227 (17.9%) |
| 35 to 44 Years | 1,064 (81.9%) | 235 (18.1%) |
| 45 to 54 Years | 1,253 (99.2%) | 10 (0.8%) |
| 55 to 64 Years | 1,499 (93.0%) | 113 (7.0%) |
| 65 to 74 Years | 1,634 (100.0%) | 0 (0.0%) |
| 75 Years and older | 964 (95.4%) | 47 (4.6%) |
| Total | 10,996 (91.9%) | 972 (8.1%) |
Health Insurance Coverage by Citizenship Status in Star
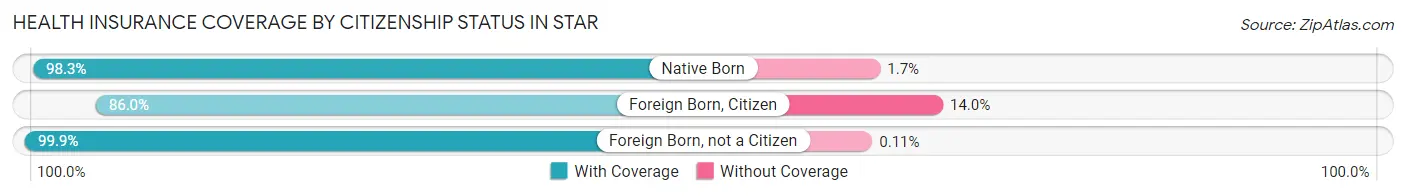
| Citizenship Status | With Coverage | Without Coverage |
| Native Born | 644 (98.3%) | 11 (1.7%) |
| Foreign Born, Citizen | 2,013 (86.0%) | 328 (14.0%) |
| Foreign Born, not a Citizen | 881 (99.9%) | 1 (0.1%) |
Health Insurance Coverage by Household Income in Star
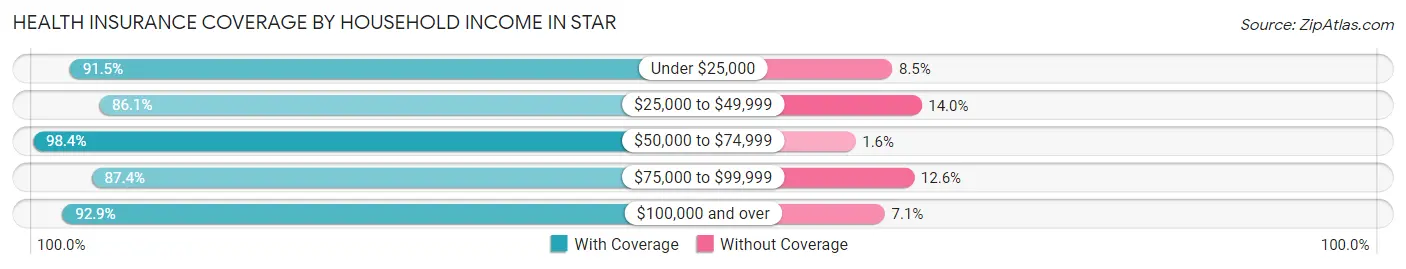
| Household Income | With Coverage | Without Coverage |
| Under $25,000 | 615 (91.5%) | 57 (8.5%) |
| $25,000 to $49,999 | 660 (86.1%) | 107 (14.0%) |
| $50,000 to $74,999 | 1,799 (98.4%) | 29 (1.6%) |
| $75,000 to $99,999 | 2,539 (87.4%) | 365 (12.6%) |
| $100,000 and over | 5,379 (92.9%) | 410 (7.1%) |
Public vs Private Health Insurance Coverage by Age in Star
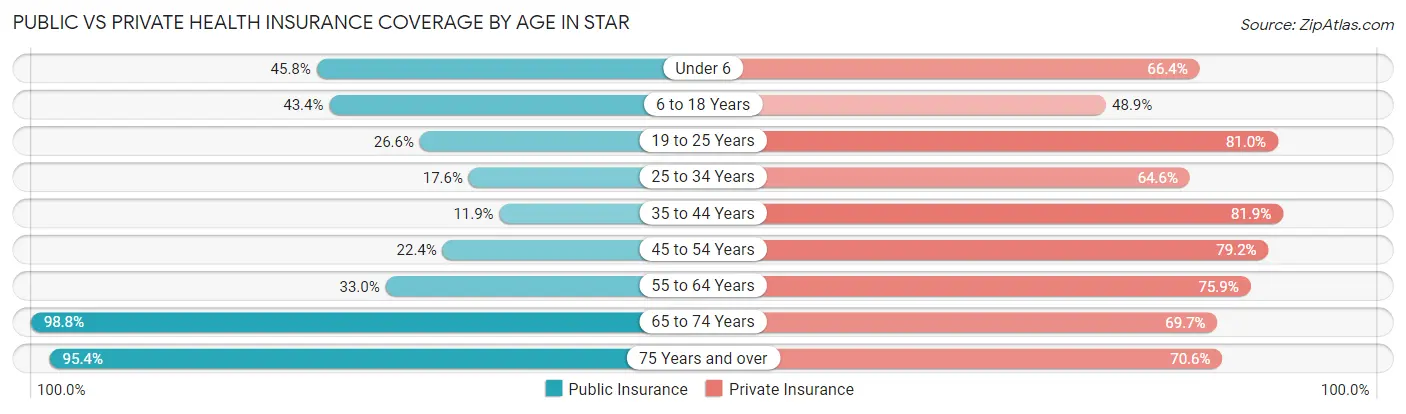
| Age Bracket | Public Insurance | Private Insurance |
| Under 6 | 300 (45.8%) | 435 (66.4%) |
| 6 to 18 Years | 1,017 (43.4%) | 1,144 (48.9%) |
| 19 to 25 Years | 235 (26.6%) | 714 (80.9%) |
| 25 to 34 Years | 223 (17.5%) | 821 (64.6%) |
| 35 to 44 Years | 154 (11.9%) | 1,064 (81.9%) |
| 45 to 54 Years | 283 (22.4%) | 1,000 (79.2%) |
| 55 to 64 Years | 532 (33.0%) | 1,223 (75.9%) |
| 65 to 74 Years | 1,615 (98.8%) | 1,139 (69.7%) |
| 75 Years and over | 964 (95.4%) | 714 (70.6%) |
| Total | 5,323 (44.5%) | 8,254 (69.0%) |
Disability Status by Sex by Age in Star
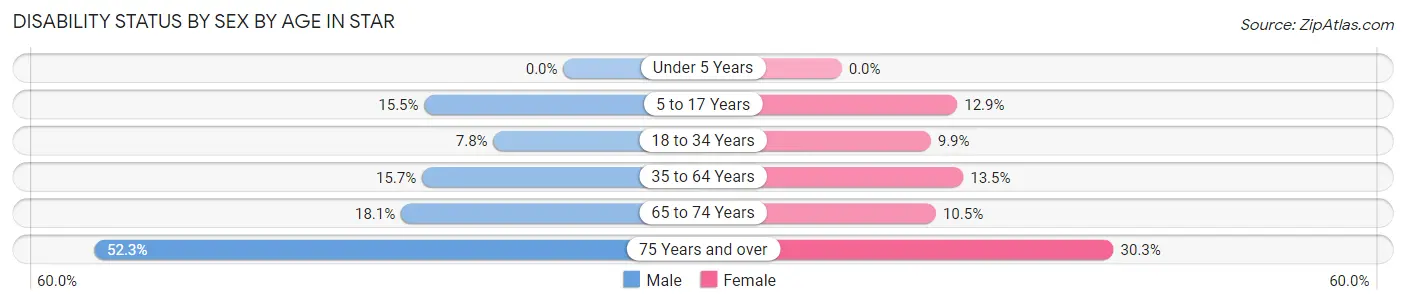
| Age Bracket | Male | Female |
| Under 5 Years | 0 (0.0%) | 0 (0.0%) |
| 5 to 17 Years | 168 (15.5%) | 153 (12.9%) |
| 18 to 34 Years | 118 (7.8%) | 88 (9.9%) |
| 35 to 64 Years | 322 (15.7%) | 288 (13.5%) |
| 65 to 74 Years | 154 (18.1%) | 82 (10.5%) |
| 75 Years and over | 278 (52.3%) | 145 (30.3%) |
Disability Class by Sex by Age in Star
Disability Class: Hearing Difficulty
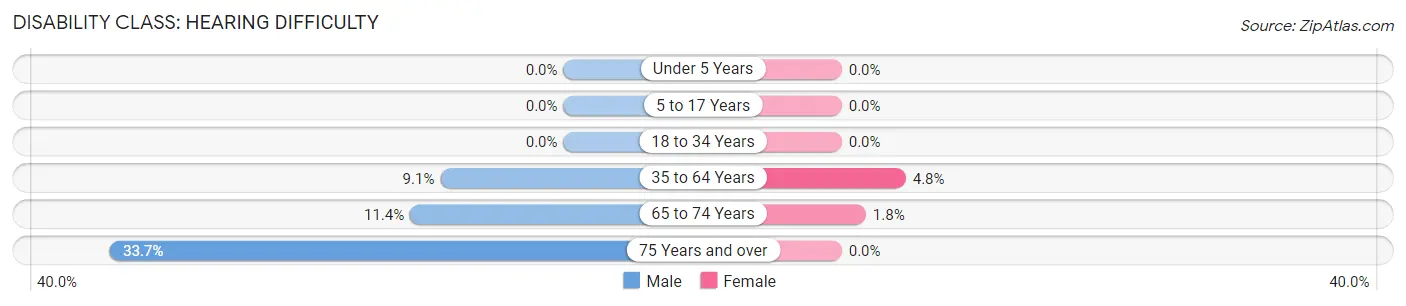
| Age Bracket | Male | Female |
| Under 5 Years | 0 (0.0%) | 0 (0.0%) |
| 5 to 17 Years | 0 (0.0%) | 0 (0.0%) |
| 18 to 34 Years | 0 (0.0%) | 0 (0.0%) |
| 35 to 64 Years | 187 (9.1%) | 101 (4.8%) |
| 65 to 74 Years | 97 (11.4%) | 14 (1.8%) |
| 75 Years and over | 179 (33.7%) | 0 (0.0%) |
Disability Class: Vision Difficulty
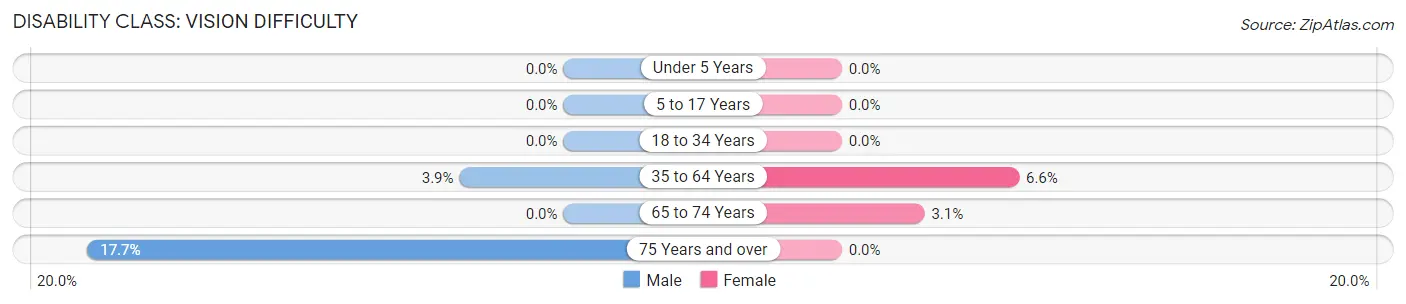
| Age Bracket | Male | Female |
| Under 5 Years | 0 (0.0%) | 0 (0.0%) |
| 5 to 17 Years | 0 (0.0%) | 0 (0.0%) |
| 18 to 34 Years | 0 (0.0%) | 0 (0.0%) |
| 35 to 64 Years | 79 (3.9%) | 140 (6.6%) |
| 65 to 74 Years | 0 (0.0%) | 24 (3.1%) |
| 75 Years and over | 94 (17.7%) | 0 (0.0%) |
Disability Class: Cognitive Difficulty
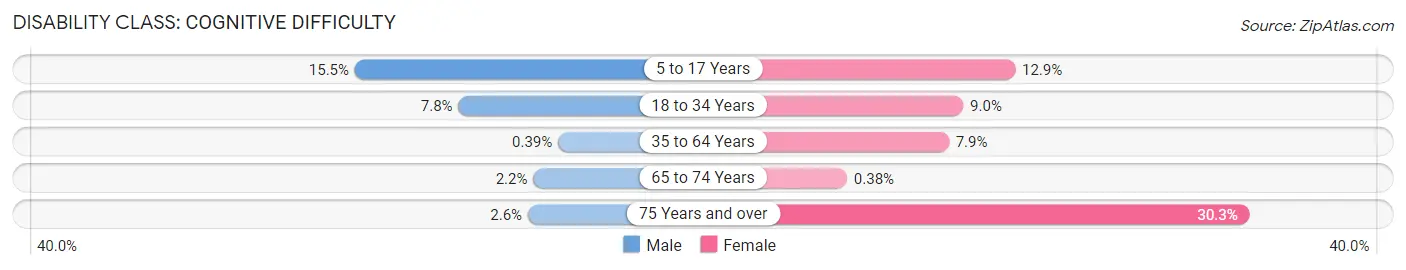
| Age Bracket | Male | Female |
| 5 to 17 Years | 168 (15.5%) | 153 (12.9%) |
| 18 to 34 Years | 118 (7.8%) | 80 (9.0%) |
| 35 to 64 Years | 8 (0.4%) | 169 (7.9%) |
| 65 to 74 Years | 19 (2.2%) | 3 (0.4%) |
| 75 Years and over | 14 (2.6%) | 145 (30.3%) |
Disability Class: Ambulatory Difficulty
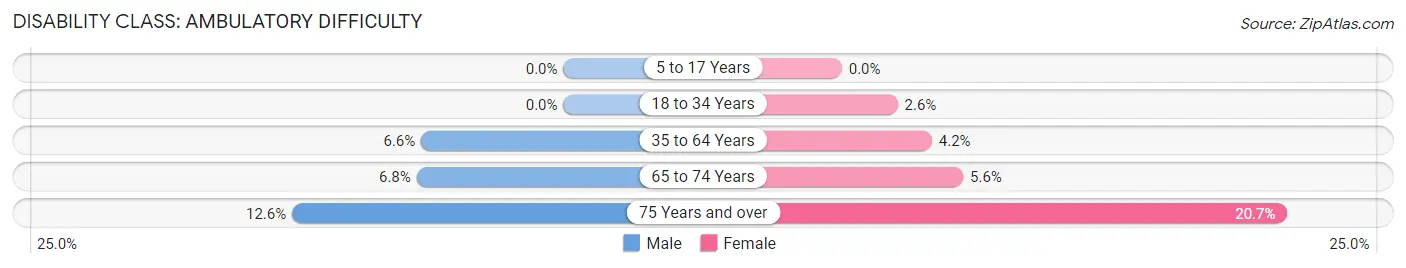
| Age Bracket | Male | Female |
| 5 to 17 Years | 0 (0.0%) | 0 (0.0%) |
| 18 to 34 Years | 0 (0.0%) | 23 (2.6%) |
| 35 to 64 Years | 135 (6.6%) | 89 (4.2%) |
| 65 to 74 Years | 58 (6.8%) | 44 (5.6%) |
| 75 Years and over | 67 (12.6%) | 99 (20.7%) |
Disability Class: Self-Care Difficulty
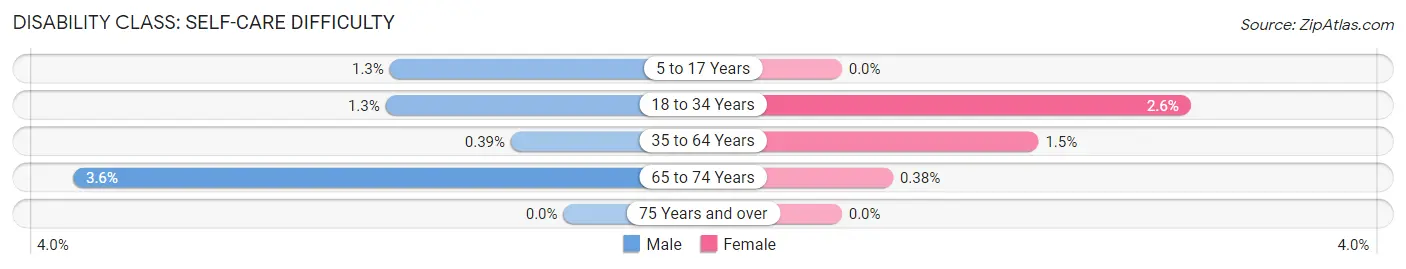
| Age Bracket | Male | Female |
| 5 to 17 Years | 14 (1.3%) | 0 (0.0%) |
| 18 to 34 Years | 20 (1.3%) | 23 (2.6%) |
| 35 to 64 Years | 8 (0.4%) | 31 (1.5%) |
| 65 to 74 Years | 31 (3.6%) | 3 (0.4%) |
| 75 Years and over | 0 (0.0%) | 0 (0.0%) |
Technology Access in Star
Computing Device Access in Star
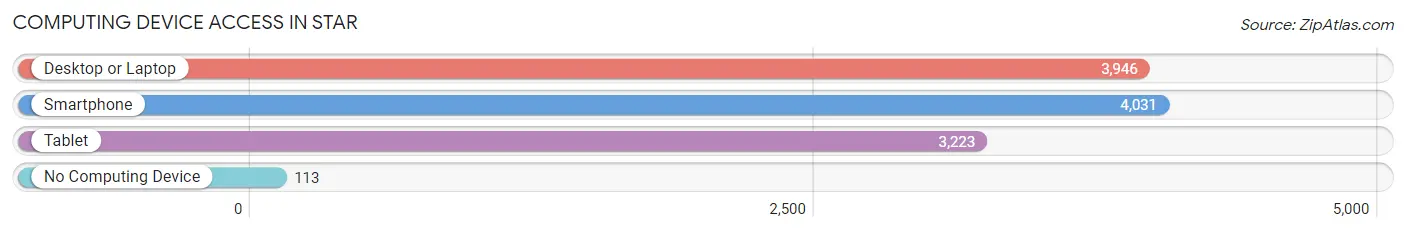
| Device Type | # Households | % Households |
| Desktop or Laptop | 3,946 | 92.7% |
| Smartphone | 4,031 | 94.7% |
| Tablet | 3,223 | 75.7% |
| No Computing Device | 113 | 2.6% |
| Total | 4,258 | 100.0% |
Internet Access in Star
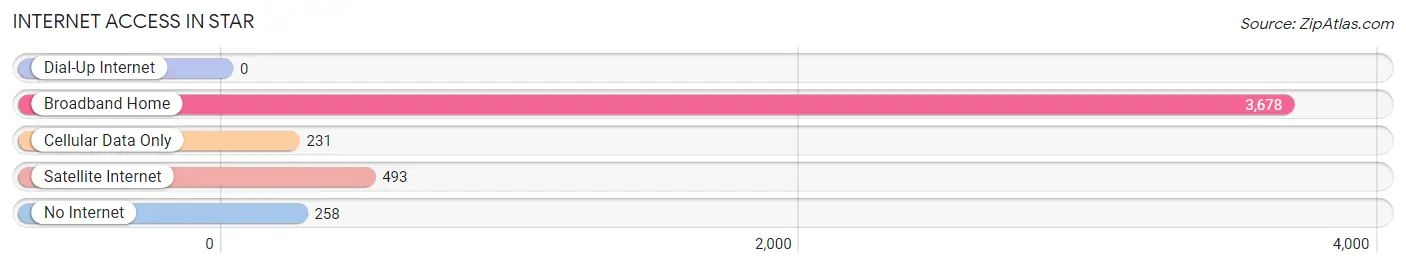
| Internet Type | # Households | % Households |
| Dial-Up Internet | 0 | 0.0% |
| Broadband Home | 3,678 | 86.4% |
| Cellular Data Only | 231 | 5.4% |
| Satellite Internet | 493 | 11.6% |
| No Internet | 258 | 6.1% |
| Total | 4,258 | 100.0% |
Star Summary
Star is a city located in the state of Idaho in the United States of America. It is located in the southwestern part of the state, about 20 miles west of Boise. The city has a population of approximately 7,000 people, making it the second largest city in Ada County.
Geography
Star is located in the Treasure Valley, a region of the Snake River Plain in southwestern Idaho. The city is situated at an elevation of 2,845 feet above sea level and is surrounded by rolling hills and farmland. The city is located on the Boise River, which flows through the city and provides a source of recreation for the residents. The city is also located near the Boise National Forest, which provides a variety of outdoor activities for residents and visitors.
Climate
Star has a semi-arid climate, with hot summers and cold winters. The average high temperature in the summer is around 90 degrees Fahrenheit, while the average low temperature in the winter is around 20 degrees Fahrenheit. The city receives an average of 12 inches of precipitation per year, with most of it falling in the winter months.
History
Star was founded in 1883 by a group of settlers from the nearby town of Eagle. The settlers chose the name Star because of the star-shaped formation of the nearby hills. The city was incorporated in 1890 and quickly grew to become a thriving agricultural community. In the early 1900s, the city was home to several large farms and ranches, as well as a number of small businesses.
In the 1950s, the city began to experience a population boom as people moved to the area to take advantage of the booming economy. The city continued to grow throughout the 1960s and 1970s, and by the 1980s, it had become a popular destination for tourists and outdoor enthusiasts.
Economy
Star’s economy is largely based on agriculture and tourism. The city is home to several large farms and ranches, as well as a number of small businesses. The city is also home to several wineries and breweries, which attract tourists from all over the world.
The city is also home to several manufacturing companies, including a large paper mill and a number of food processing plants. The city is also home to a number of technology companies, which provide jobs for many of the city’s residents.
Demographics
Star has a population of approximately 7,000 people, with a median age of 36. The city is predominantly white, with a small Hispanic population. The city also has a large number of Native Americans, who make up about 5% of the population. The city has a median household income of $50,000, and the unemployment rate is around 4%.
Common Questions
What is Per Capita Income in Star?
Per Capita income in Star is $41,965.
What is the Median Family Income in Star?
Median Family Income in Star is $100,565.
What is the Median Household income in Star?
Median Household Income in Star is $88,625.
What is Income or Wage Gap in Star?
Income or Wage Gap in Star is 28.7%.
Women in Star earn 71.3 cents for every dollar earned by a man.
What is Family Income Deficit in Star?
Family Income Deficit in Star is $15,479.
Families that are below poverty line in Star earn $15,479 less on average than the poverty threshold level.
What is Inequality or Gini Index in Star?
Inequality or Gini Index in Star is 0.41.
What is the Total Population of Star?
Total Population of Star is 11,971.
What is the Total Male Population of Star?
Total Male Population of Star is 6,221.
What is the Total Female Population of Star?
Total Female Population of Star is 5,750.
What is the Ratio of Males per 100 Females in Star?
There are 108.19 Males per 100 Females in Star.
What is the Ratio of Females per 100 Males in Star?
There are 92.43 Females per 100 Males in Star.
What is the Median Population Age in Star?
Median Population Age in Star is 41.4 Years.
What is the Average Family Size in Star
Average Family Size in Star is 3.4 People.
What is the Average Household Size in Star
Average Household Size in Star is 2.8 People.
How Large is the Labor Force in Star?
There are 6,159 People in the Labor Forcein in Star.
What is the Percentage of People in the Labor Force in Star?
64.5% of People are in the Labor Force in Star.
What is the Unemployment Rate in Star?
Unemployment Rate in Star is 7.3%.