Area Code 208 Map & Demographics
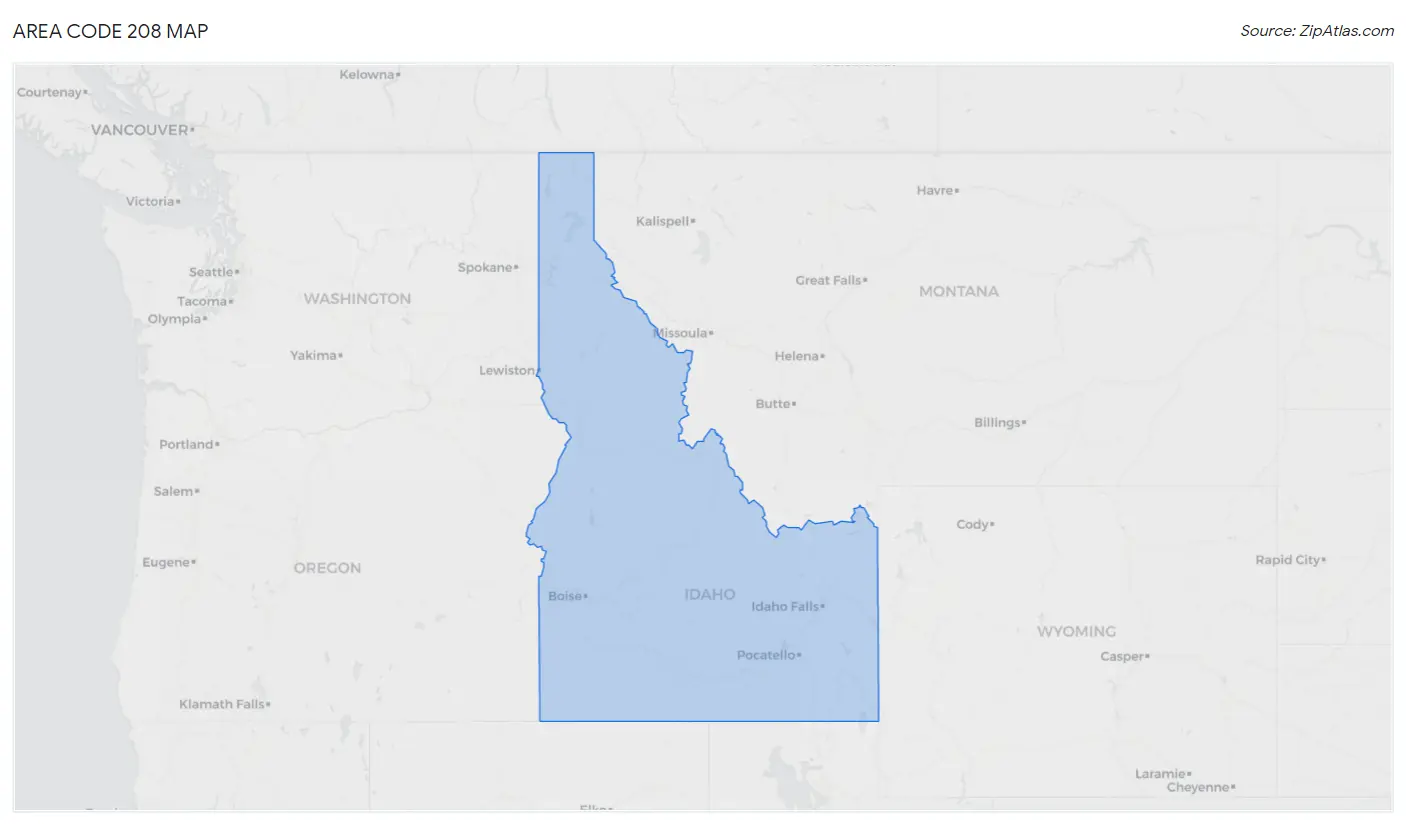
Area Code 208 Map
Area Code 208 Overview
$32,751
PER CAPITA INCOME
$78,414
AVG FAMILY INCOME
$66,158
AVG HOUSEHOLD INCOME
38.5%
WAGE / INCOME GAP [ % ]
61.5¢/ $1
WAGE / INCOME GAP [ $ ]
$10,404
FAMILY INCOME DEFICIT
104.03
INEQUALITY / GINI INDEX
1,853,879
TOTAL POPULATION
933,627
MALE POPULATION
920,252
FEMALE POPULATION
101.45
MALES / 100 FEMALES
98.57
FEMALES / 100 MALES
44.2
MEDIAN AGE
3.2
AVG FAMILY SIZE
2.7
AVG HOUSEHOLD SIZE
827,688
LABOR FORCE [ PEOPLE ]
57.0%
PERCENT IN LABOR FORCE
5.0%
UNEMPLOYMENT RATE
Income in Area Code 208
Income Overview in Area Code 208
Per Capita Income in Area Code 208 is $32,751, while median incomes of families and households are $78,414 and $66,158 respectively.
| Characteristic | Number | Measure |
| Per Capita Income | 1,853,879 | $32,751 |
| Median Family Income | 462,023 | $78,414 |
| Mean Family Income | 462,023 | $24,312,920 |
| Median Household Income | 675,151 | $66,158 |
| Mean Household Income | 675,151 | $21,752,130 |
| Income Deficit | 462,023 | $10,404 |
| Wage / Income Gap (%) | 1,853,879 | 38.49% |
| Wage / Income Gap ($) | 1,853,879 | 61.51¢ per $1 |
| Gini / Inequality Index | 1,853,879 | 104.03 |
Earnings by Sex in Area Code 208
Average Earnings in Area Code 208 are $35,451, $44,446 for men and $27,211 for women, a difference of 38.8%.
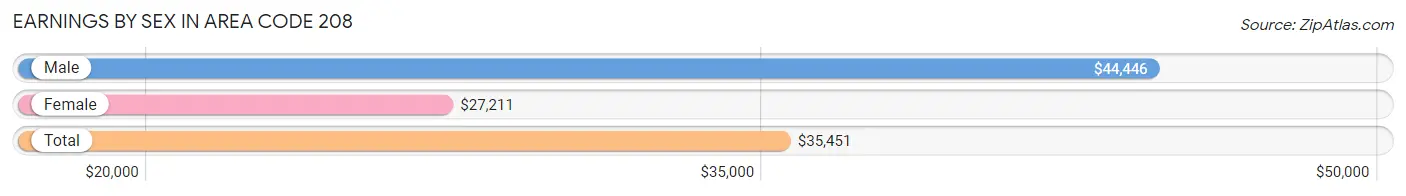
| Sex | Number | Average Earnings |
| Male | 535,388 (54.3%) | $44,446 |
| Female | 450,090 (45.7%) | $27,211 |
| Total | 985,478 (100.0%) | $35,451 |
Earnings by Sex by Income Bracket in Area Code 208
The most common earnings brackets in Area Code 208 are $100,000+ for men (78,881 | 14.7%) and $2,499 or less for women (37,110 | 8.3%).
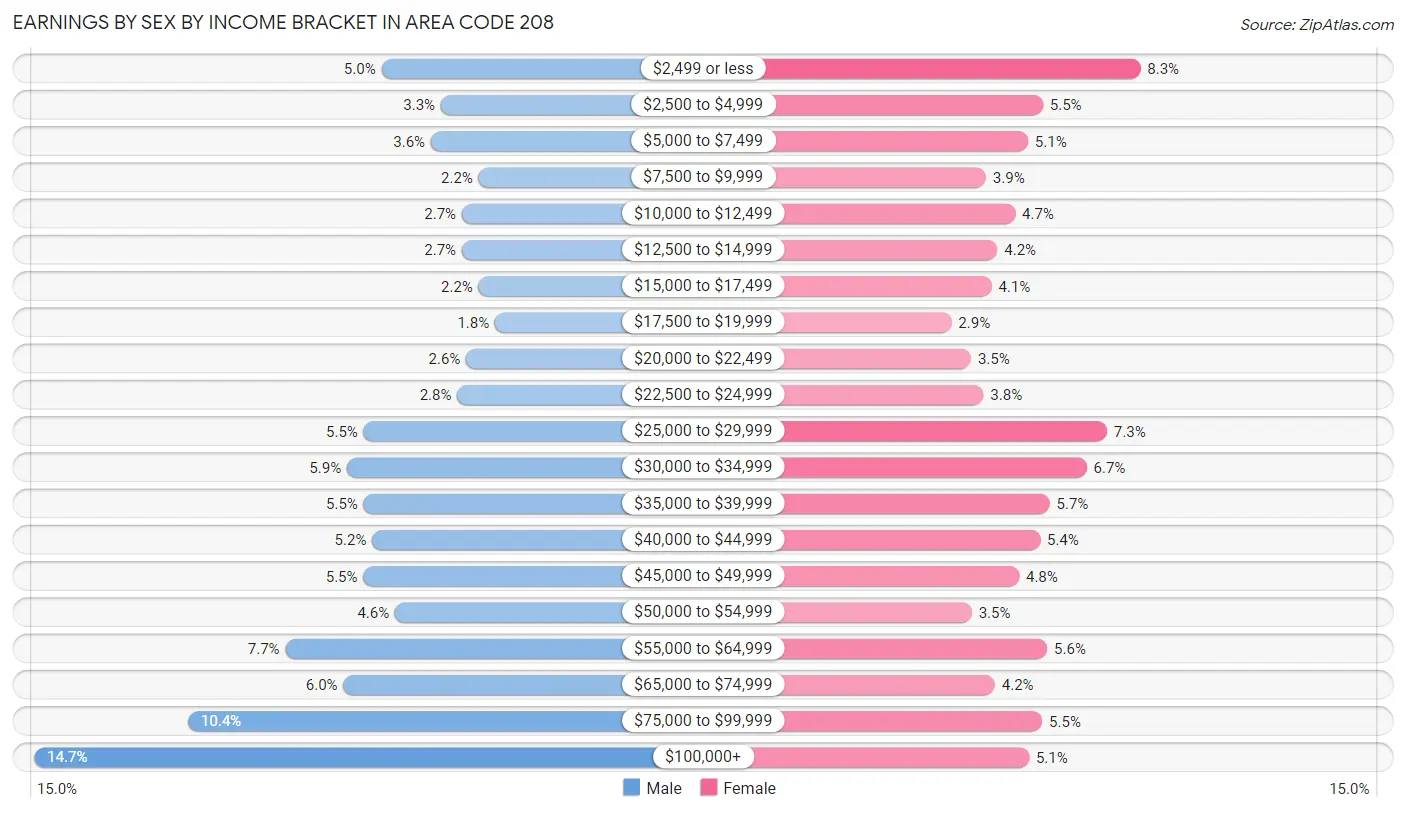
| Income | Male | Female |
| $2,499 or less | 26,621 (5.0%) | 37,110 (8.3%) |
| $2,500 to $4,999 | 17,646 (3.3%) | 24,801 (5.5%) |
| $5,000 to $7,499 | 19,190 (3.6%) | 22,924 (5.1%) |
| $7,500 to $9,999 | 12,005 (2.2%) | 17,600 (3.9%) |
| $10,000 to $12,499 | 14,483 (2.7%) | 21,300 (4.7%) |
| $12,500 to $14,999 | 14,489 (2.7%) | 19,055 (4.2%) |
| $15,000 to $17,499 | 12,015 (2.2%) | 18,325 (4.1%) |
| $17,500 to $19,999 | 9,516 (1.8%) | 13,232 (2.9%) |
| $20,000 to $22,499 | 13,875 (2.6%) | 15,715 (3.5%) |
| $22,500 to $24,999 | 15,231 (2.8%) | 17,280 (3.8%) |
| $25,000 to $29,999 | 29,271 (5.5%) | 32,924 (7.3%) |
| $30,000 to $34,999 | 31,826 (5.9%) | 30,321 (6.7%) |
| $35,000 to $39,999 | 29,299 (5.5%) | 25,652 (5.7%) |
| $40,000 to $44,999 | 28,010 (5.2%) | 24,457 (5.4%) |
| $45,000 to $49,999 | 29,346 (5.5%) | 21,769 (4.8%) |
| $50,000 to $54,999 | 24,560 (4.6%) | 15,779 (3.5%) |
| $55,000 to $64,999 | 41,081 (7.7%) | 25,345 (5.6%) |
| $65,000 to $74,999 | 32,318 (6.0%) | 18,735 (4.2%) |
| $75,000 to $99,999 | 55,725 (10.4%) | 24,716 (5.5%) |
| $100,000+ | 78,881 (14.7%) | 23,050 (5.1%) |
| Total | 535,388 (100.0%) | 450,090 (100.0%) |
Earnings by Sex by Educational Attainment in Area Code 208
Average earnings in Area Code 208 are $11,640,110 for men and $6,765,154 for women, a difference of 41.9%. Men with an educational attainment of bachelor's degree enjoy the highest average annual earnings of $10,671,921, while those with less than high school education earn the least with $5,111,132. Women with an educational attainment of graduate degree earn the most with the average annual earnings of $6,981,269, while those with less than high school education have the smallest earnings of $1,803,895.
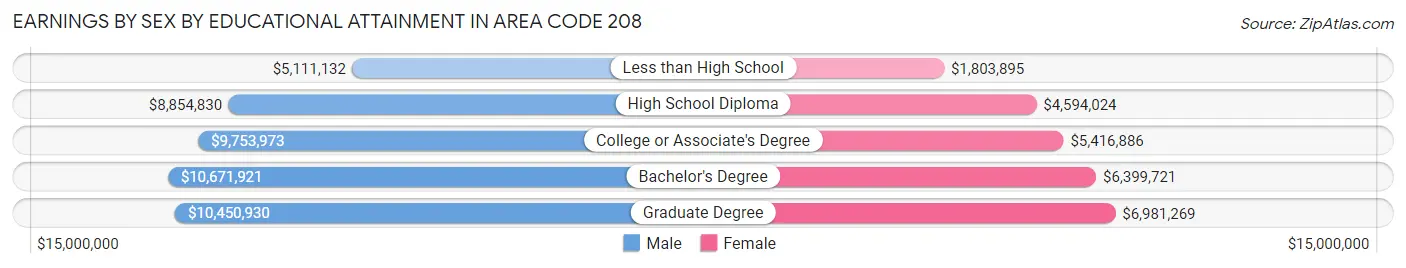
| Educational Attainment | Male Income | Female Income |
| Less than High School | $5,111,132 | $1,803,895 |
| High School Diploma | $8,854,830 | $4,594,024 |
| College or Associate's Degree | $9,753,973 | $5,416,886 |
| Bachelor's Degree | $10,671,921 | $6,399,721 |
| Graduate Degree | $10,450,930 | $6,981,269 |
| Total | $11,640,110 | $6,765,154 |
Family Income in Area Code 208
Family Income Brackets in Area Code 208
According to the Area Code 208 family income data, there are 25,740,225 families falling into the $50,000 to $74,999 income range, which is the most common income bracket and makes up 5,571.2% of all families. Conversely, the $10,000 to $14,999 income bracket is the least frequent group with only 2,000,560 families (433.0%) belonging to this category.
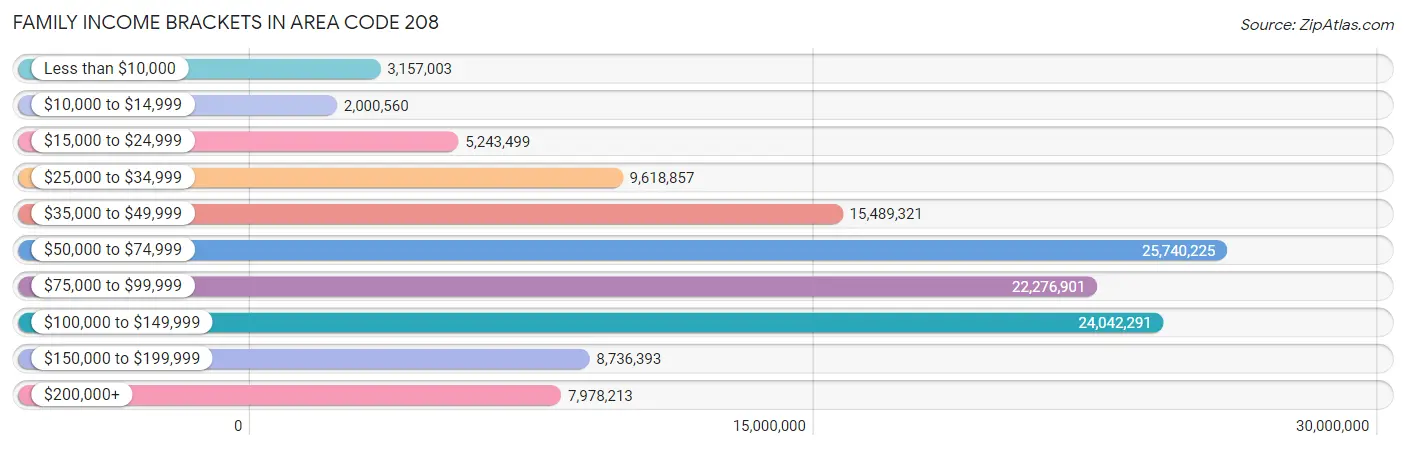
| Income Bracket | # Families | % Families |
| Less than $10,000 | 3,157,003 | 683.3% |
| $10,000 to $14,999 | 2,000,560 | 433.0% |
| $15,000 to $24,999 | 5,243,499 | 1,134.9% |
| $25,000 to $34,999 | 9,618,857 | 2,081.9% |
| $35,000 to $49,999 | 15,489,321 | 3,352.5% |
| $50,000 to $74,999 | 25,740,225 | 5,571.2% |
| $75,000 to $99,999 | 22,276,901 | 4,821.6% |
| $100,000 to $149,999 | 24,042,291 | 5,203.7% |
| $150,000 to $199,999 | 8,736,393 | 1,890.9% |
| $200,000+ | 7,978,213 | 1,726.8% |
Family Income by Famaliy Size in Area Code 208
7+ person families (12,258 | 2.6%) account for the highest median family income in Area Code 208 with $107,601 per family, while 2-person families (223,631 | 48.4%) have the highest median income of $36,219 per family member.
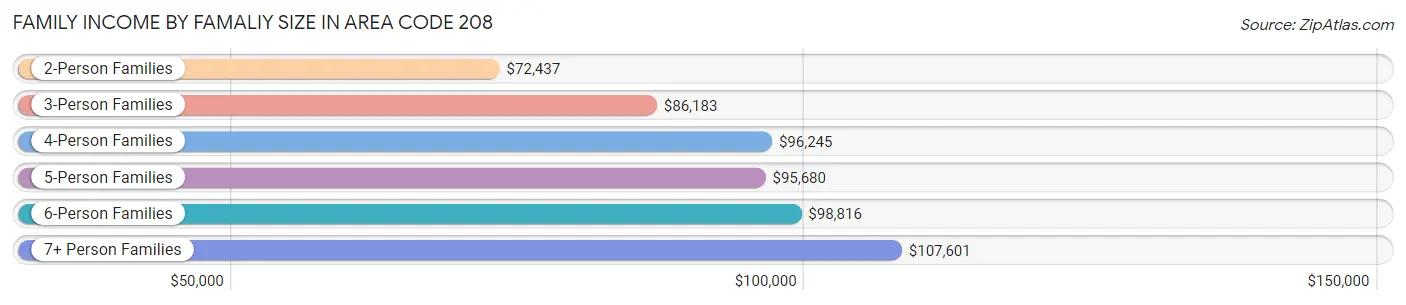
| Income Bracket | # Families | Median Income |
| 2-Person Families | 223,631 (48.4%) | $72,437 |
| 3-Person Families | 90,494 (19.6%) | $86,183 |
| 4-Person Families | 74,202 (16.1%) | $96,245 |
| 5-Person Families | 41,401 (9.0%) | $95,680 |
| 6-Person Families | 20,037 (4.3%) | $98,816 |
| 7+ Person Families | 12,258 (2.6%) | $107,601 |
| Total | 462,023 (100.0%) | $78,414 |
Family Income by Number of Earners in Area Code 208
The median family income in Area Code 208 is $78,414, with families comprising 3+ earners (55,401) having the highest median family income of $123,726, while families with no earners (71,050) have the lowest median family income of $56,884, accounting for 12.0% and 15.4% of families, respectively.
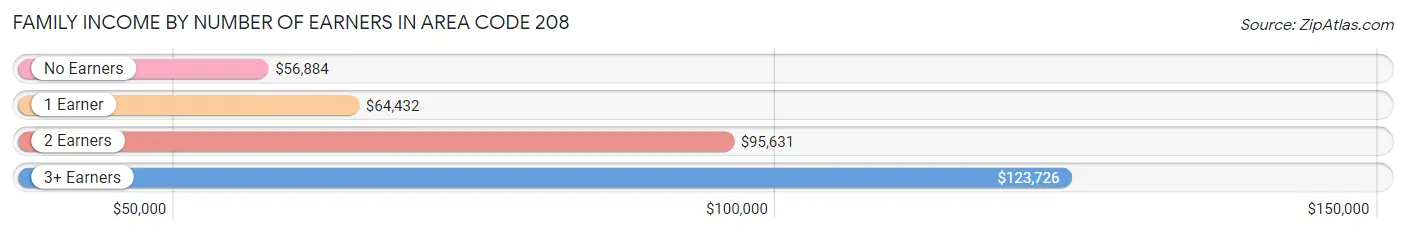
| Number of Earners | # Families | Median Income |
| No Earners | 71,050 (15.4%) | $56,884 |
| 1 Earner | 140,408 (30.4%) | $64,432 |
| 2 Earners | 195,164 (42.2%) | $95,631 |
| 3+ Earners | 55,401 (12.0%) | $123,726 |
| Total | 462,023 (100.0%) | $78,414 |
Household Income in Area Code 208
Household Income Brackets in Area Code 208
With 37,897,576 households falling in the category, the $50,000 to $74,999 income range is the most frequent in Area Code 208, accounting for 5,613.2% of all households. In contrast, only 6,698,848 households (992.2%) fall into the less than $10,000 income bracket, making it the least populous group.
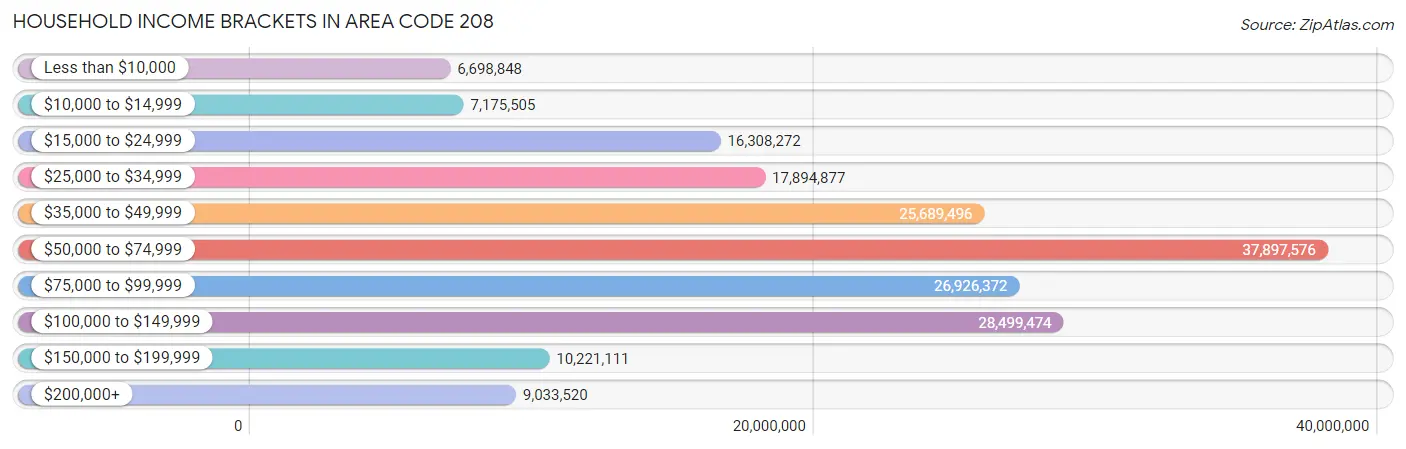
| Income Bracket | # Households | % Households |
| Less than $10,000 | 6,698,848 | 992.2% |
| $10,000 to $14,999 | 7,175,505 | 1,062.8% |
| $15,000 to $24,999 | 16,308,272 | 2,415.5% |
| $25,000 to $34,999 | 17,894,877 | 2,650.5% |
| $35,000 to $49,999 | 25,689,496 | 3,805.0% |
| $50,000 to $74,999 | 37,897,576 | 5,613.2% |
| $75,000 to $99,999 | 26,926,372 | 3,988.2% |
| $100,000 to $149,999 | 28,499,474 | 4,221.2% |
| $150,000 to $199,999 | 10,221,111 | 1,513.9% |
| $200,000+ | 9,033,520 | 1,338.0% |
Household Income by Householder Age in Area Code 208
The median household income in Area Code 208 is $66,158, with the highest median household income of $79,265 found in the 45 to 64 years age bracket for the primary householder. A total of 235,260 households (34.8%) fall into this category. Meanwhile, the 15 to 24 years age bracket for the primary householder has the lowest median household income of $50,919, with 33,605 households (5.0%) in this group.
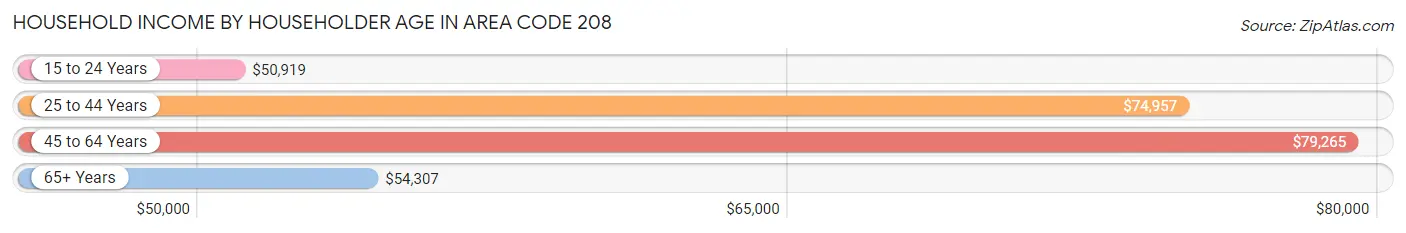
| Income Bracket | # Households | Median Income |
| 15 to 24 Years | 33,605 (5.0%) | $50,919 |
| 25 to 44 Years | 222,981 (33.0%) | $74,957 |
| 45 to 64 Years | 235,260 (34.8%) | $79,265 |
| 65+ Years | 183,305 (27.2%) | $54,307 |
| Total | 675,151 (100.0%) | $66,158 |
Poverty in Area Code 208
Income Below Poverty by Sex and Age in Area Code 208
With 9.8% poverty level for males and 12.2% for females among the residents of Area Code 208, under 5 year old males and 18 to 24 year old females are the most vulnerable to poverty, with 9,289 males (16.5%) and 22,285 females (27.4%) in their respective age groups living below the poverty level.
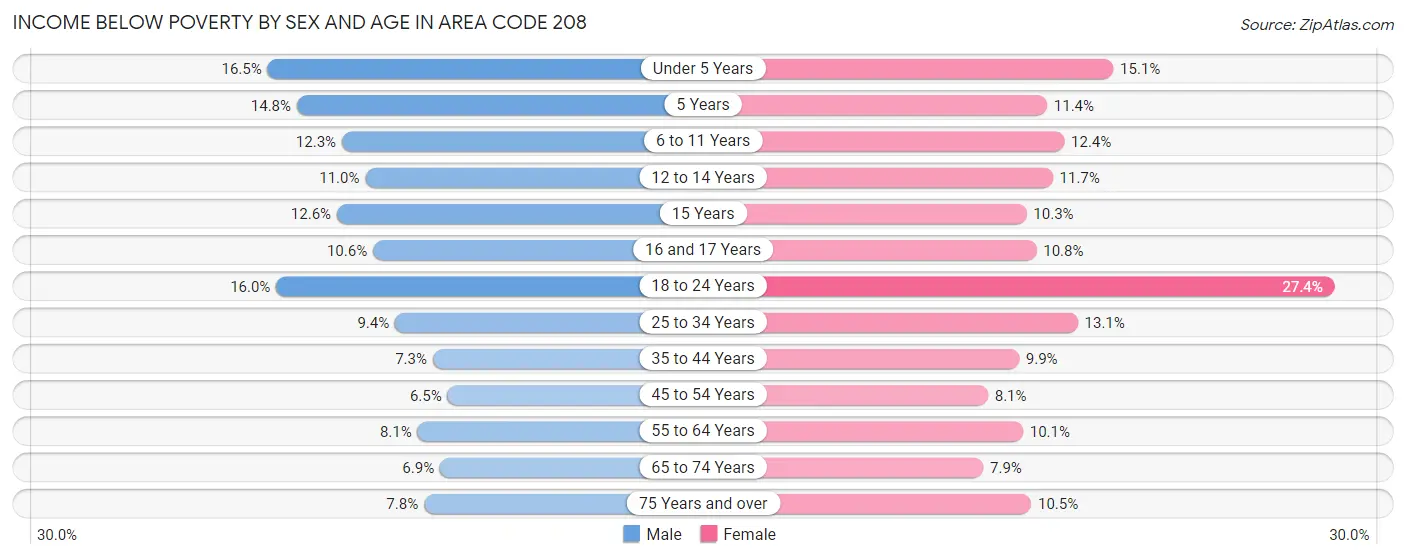
| Age Bracket | Male | Female |
| Under 5 Years | 9,289 (16.5%) | 8,232 (15.1%) |
| 5 Years | 1,876 (14.8%) | 1,353 (11.4%) |
| 6 to 11 Years | 9,571 (12.3%) | 9,066 (12.4%) |
| 12 to 14 Years | 4,554 (11.0%) | 4,731 (11.7%) |
| 15 Years | 1,836 (12.6%) | 1,480 (10.3%) |
| 16 and 17 Years | 2,872 (10.6%) | 2,645 (10.8%) |
| 18 to 24 Years | 13,377 (16.0%) | 22,285 (27.4%) |
| 25 to 34 Years | 11,140 (9.4%) | 15,226 (13.1%) |
| 35 to 44 Years | 8,662 (7.3%) | 11,422 (9.9%) |
| 45 to 54 Years | 6,811 (6.5%) | 8,236 (8.1%) |
| 55 to 64 Years | 8,851 (8.1%) | 11,215 (10.1%) |
| 65 to 74 Years | 6,131 (6.9%) | 7,314 (7.9%) |
| 75 Years and over | 3,977 (7.8%) | 6,476 (10.5%) |
| Total | 88,947 (9.8%) | 109,681 (12.2%) |
Income Above Poverty by Sex and Age in Area Code 208
According to the poverty statistics in Area Code 208, males aged 45 to 54 years and females aged 65 to 74 years are the age groups that are most secure financially, with 93.5% of males and 92.1% of females in these age groups living above the poverty line.
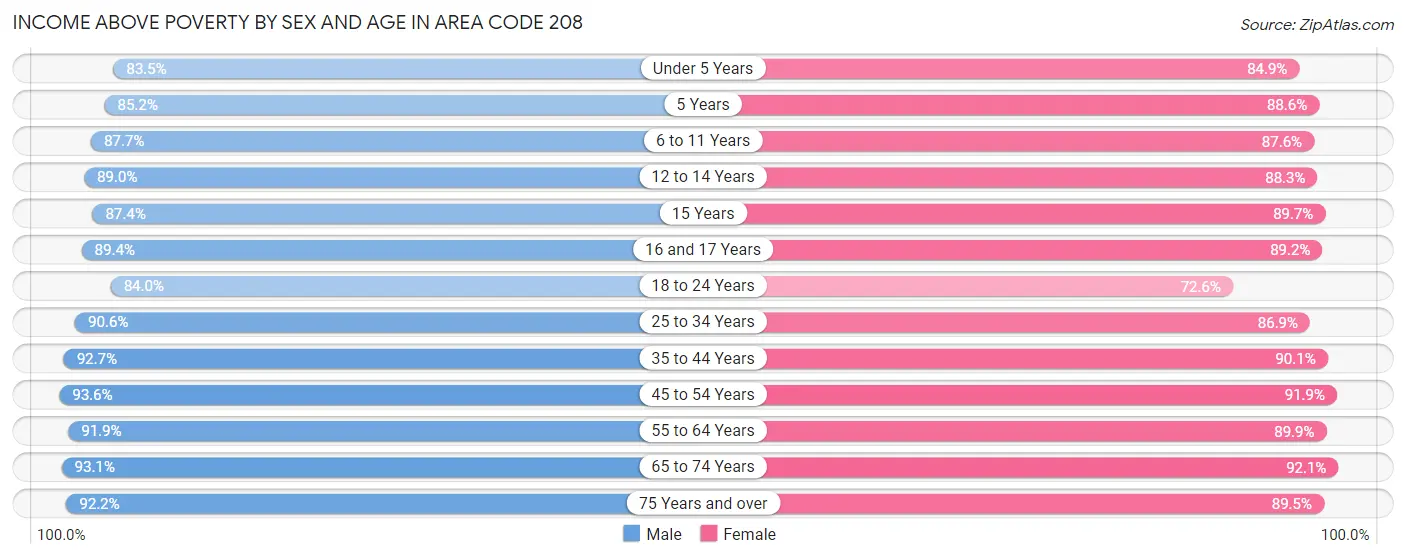
| Age Bracket | Male | Female |
| Under 5 Years | 47,112 (83.5%) | 46,262 (84.9%) |
| 5 Years | 10,768 (85.2%) | 10,492 (88.6%) |
| 6 to 11 Years | 68,046 (87.7%) | 64,180 (87.6%) |
| 12 to 14 Years | 36,715 (89.0%) | 35,573 (88.3%) |
| 15 Years | 12,719 (87.4%) | 12,912 (89.7%) |
| 16 and 17 Years | 24,221 (89.4%) | 21,773 (89.2%) |
| 18 to 24 Years | 70,279 (84.0%) | 58,922 (72.6%) |
| 25 to 34 Years | 107,810 (90.6%) | 100,771 (86.9%) |
| 35 to 44 Years | 110,531 (92.7%) | 104,445 (90.1%) |
| 45 to 54 Years | 98,743 (93.5%) | 93,057 (91.9%) |
| 55 to 64 Years | 100,091 (91.9%) | 100,021 (89.9%) |
| 65 to 74 Years | 83,126 (93.1%) | 85,565 (92.1%) |
| 75 Years and over | 47,303 (92.2%) | 54,943 (89.5%) |
| Total | 817,464 (90.2%) | 788,916 (87.8%) |
Income Below Poverty Among Married-Couple Families in Area Code 208
The poverty statistics for married-couple families in Area Code 208 show that 4.6% or 16,999 of the total 372,058 families live below the poverty line. Families with 5 or more children have the highest poverty rate of 15.2%, comprising of 1,030 families. On the other hand, families with no children have the lowest poverty rate of 3.4%, which includes 7,361 families.
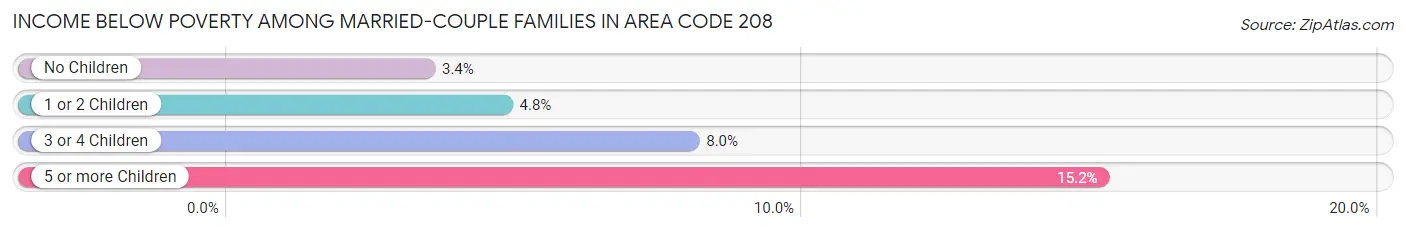
| Children | Above Poverty | Below Poverty |
| No Children | 206,967 (96.6%) | 7,361 (3.4%) |
| 1 or 2 Children | 102,787 (95.2%) | 5,157 (4.8%) |
| 3 or 4 Children | 39,545 (92.0%) | 3,451 (8.0%) |
| 5 or more Children | 5,760 (84.8%) | 1,030 (15.2%) |
| Total | 355,059 (95.4%) | 16,999 (4.6%) |
Income Below Poverty Among Single-Parent Households in Area Code 208
According to the poverty data in Area Code 208, 10.9% or 3,451 single-father households and 22.8% or 13,327 single-mother households are living below the poverty line. Among single-father households, those with 5 or more children have the highest poverty rate, with 42 households (27.3%) experiencing poverty. Likewise, among single-mother households, those with 3 or 4 children have the highest poverty rate, with 3,219 households (49.2%) falling below the poverty line.
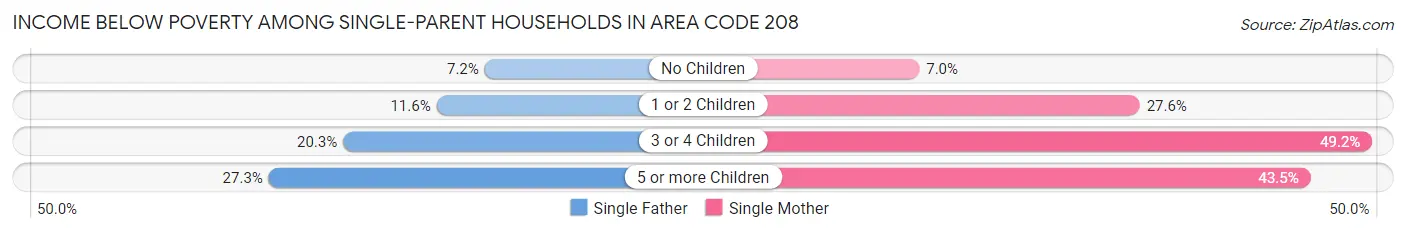
| Children | Single Father | Single Mother |
| No Children | 833 (7.2%) | 1,482 (7.0%) |
| 1 or 2 Children | 1,935 (11.6%) | 8,266 (27.6%) |
| 3 or 4 Children | 641 (20.3%) | 3,219 (49.2%) |
| 5 or more Children | 42 (27.3%) | 360 (43.5%) |
| Total | 3,451 (10.9%) | 13,327 (22.8%) |
Income Below Poverty Among Married-Couple vs Single-Parent Households in Area Code 208
The poverty data for Area Code 208 shows that 16,999 of the married-couple family households (4.6%) and 16,778 of the single-parent households (18.6%) are living below the poverty level. Within the married-couple family households, those with 5 or more children have the highest poverty rate, with 1,030 households (15.2%) falling below the poverty line. Among the single-parent households, those with 5 or more children have the highest poverty rate, with 402 household (40.9%) living below poverty.
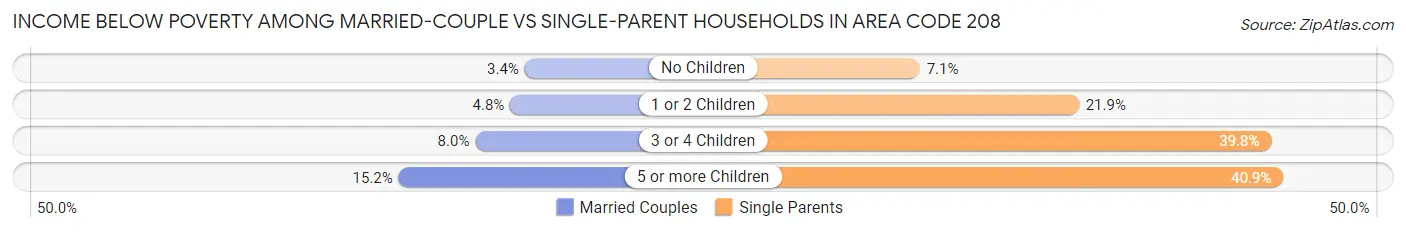
| Children | Married-Couple Families | Single-Parent Households |
| No Children | 7,361 (3.4%) | 2,315 (7.1%) |
| 1 or 2 Children | 5,157 (4.8%) | 10,201 (21.9%) |
| 3 or 4 Children | 3,451 (8.0%) | 3,860 (39.8%) |
| 5 or more Children | 1,030 (15.2%) | 402 (40.9%) |
| Total | 16,999 (4.6%) | 16,778 (18.6%) |
Race in Area Code 208
The most populous races in Area Code 208 are White / Caucasian (1,574,890 | 85.0%), Hispanic or Latino (242,202 | 13.1%), and Two or more Races (132,577 | 7.1%).
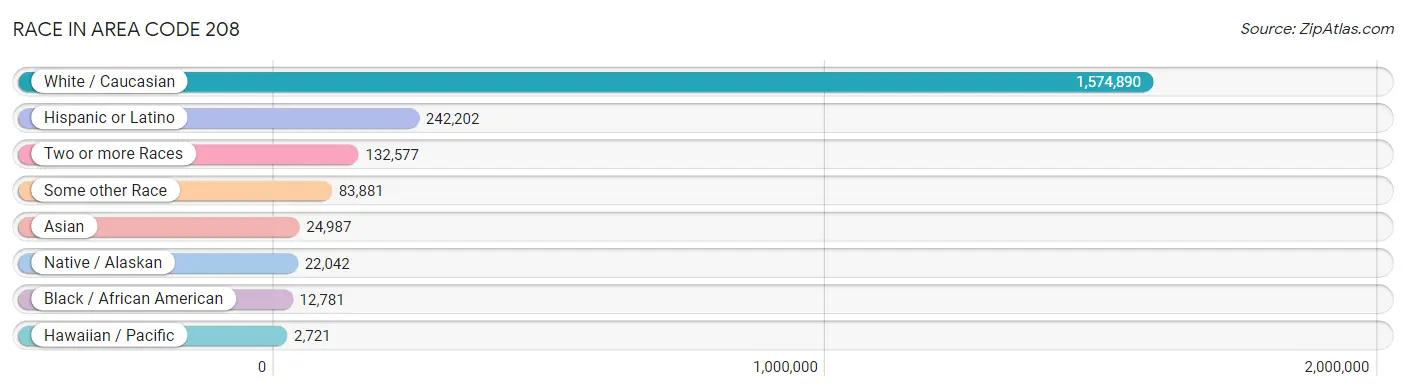
| Race | # Population | % Population |
| Asian | 24,987 | 1.3% |
| Black / African American | 12,781 | 0.7% |
| Hawaiian / Pacific | 2,721 | 0.2% |
| Hispanic or Latino | 242,202 | 13.1% |
| Native / Alaskan | 22,042 | 1.2% |
| White / Caucasian | 1,574,890 | 85.0% |
| Two or more Races | 132,577 | 7.1% |
| Some other Race | 83,881 | 4.5% |
| Total | 1,853,879 | 100.0% |
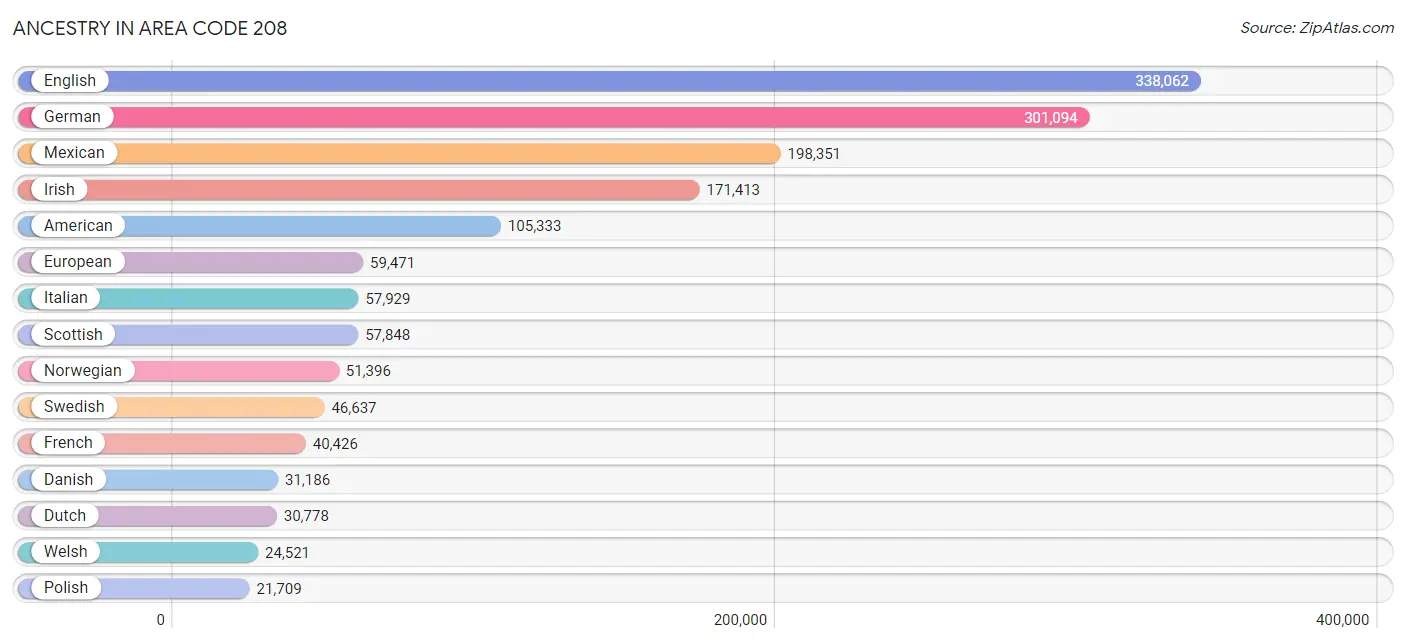
Ancestry in Area Code 208
The most populous ancestries reported in Area Code 208 are English (338,062 | 18.2%), German (301,094 | 16.2%), Mexican (198,351 | 10.7%), Irish (171,413 | 9.2%), and American (105,333 | 5.7%), together accounting for 60.1% of all Area Code 208 residents.
| Ancestry | # Population | % Population |
| Afghan | 496 | 0.0% |
| African | 1,553 | 0.1% |
| Alaska Native | 85 | 0.0% |
| Alaskan Athabascan | 12 | 0.0% |
| Albanian | 126 | 0.0% |
| Aleut | 86 | 0.0% |
| American | 105,333 | 5.7% |
| Apache | 1,175 | 0.1% |
| Arab | 5,084 | 0.3% |
| Arapaho | 27 | 0.0% |
| Argentinean | 690 | 0.0% |
| Armenian | 928 | 0.1% |
| Assyrian / Chaldean / Syriac | 44 | 0.0% |
| Australian | 705 | 0.0% |
| Austrian | 2,960 | 0.2% |
| Bahamian | 4 | 0.0% |
| Bangladeshi | 233 | 0.0% |
| Barbadian | 9 | 0.0% |
| Basque | 8,431 | 0.4% |
| Belgian | 1,319 | 0.1% |
| Belizean | 28 | 0.0% |
| Bhutanese | 9,926 | 0.5% |
| Blackfeet | 1,394 | 0.1% |
| Bolivian | 75 | 0.0% |
| Brazilian | 953 | 0.1% |
| British | 15,852 | 0.9% |
| Bulgarian | 695 | 0.0% |
| Burmese | 4,665 | 0.3% |
| Cajun | 95 | 0.0% |
| Cambodian | 52 | 0.0% |
| Canadian | 4,791 | 0.3% |
| Cape Verdean | 43 | 0.0% |
| Carpatho Rusyn | 60 | 0.0% |
| Celtic | 395 | 0.0% |
| Central American | 7,915 | 0.4% |
| Central American Indian | 974 | 0.1% |
| Cherokee | 7,114 | 0.4% |
| Cheyenne | 137 | 0.0% |
| Chickasaw | 237 | 0.0% |
| Chilean | 653 | 0.0% |
| Chinese | 104 | 0.0% |
| Chippewa | 1,185 | 0.1% |
| Choctaw | 1,433 | 0.1% |
| Colombian | 1,997 | 0.1% |
| Colville | 344 | 0.0% |
| Comanche | 197 | 0.0% |
| Costa Rican | 390 | 0.0% |
| Cree | 687 | 0.0% |
| Creek | 320 | 0.0% |
| Croatian | 1,921 | 0.1% |
| Crow | 170 | 0.0% |
| Cuban | 1,185 | 0.1% |
| Czech | 5,883 | 0.3% |
| Czechoslovakian | 1,629 | 0.1% |
| Danish | 31,186 | 1.7% |
| Delaware | 140 | 0.0% |
| Dominican | 707 | 0.0% |
| Dutch | 30,778 | 1.7% |
| Dutch West Indian | 32 | 0.0% |
| Eastern European | 2,743 | 0.2% |
| Ecuadorian | 766 | 0.0% |
| Egyptian | 286 | 0.0% |
| English | 338,062 | 18.2% |
| Estonian | 11 | 0.0% |
| Ethiopian | 298 | 0.0% |
| European | 59,471 | 3.2% |
| Fijian | 244 | 0.0% |
| Filipino | 220 | 0.0% |
| Finnish | 5,505 | 0.3% |
| French | 40,426 | 2.2% |
| French American Indian | 197 | 0.0% |
| French Canadian | 8,405 | 0.4% |
| German | 301,094 | 16.2% |
| German Russian | 224 | 0.0% |
| Ghanaian | 150 | 0.0% |
| Greek | 4,895 | 0.3% |
| Guamanian / Chamorro | 646 | 0.0% |
| Guatemalan | 2,951 | 0.2% |
| Haitian | 460 | 0.0% |
| Hmong | 314 | 0.0% |
| Honduran | 858 | 0.1% |
| Hopi | 176 | 0.0% |
| Houma | 7 | 0.0% |
| Hungarian | 4,575 | 0.3% |
| Icelander | 557 | 0.0% |
| Indian (Asian) | 7,795 | 0.4% |
| Indonesian | 393 | 0.0% |
| Inupiat | 558 | 0.0% |
| Iranian | 955 | 0.1% |
| Iraqi | 1,023 | 0.1% |
| Irish | 171,413 | 9.2% |
| Iroquois | 296 | 0.0% |
| Israeli | 282 | 0.0% |
| Italian | 57,929 | 3.1% |
| Jamaican | 266 | 0.0% |
| Japanese | 153 | 0.0% |
| Jordanian | 76 | 0.0% |
| Kenyan | 8 | 0.0% |
| Kiowa | 11 | 0.0% |
| Korean | 10,612 | 0.6% |
| Laotian | 585 | 0.0% |
| Latvian | 259 | 0.0% |
| Lebanese | 1,429 | 0.1% |
| Lithuanian | 1,603 | 0.1% |
| Lumbee | 40 | 0.0% |
| Luxembourger | 288 | 0.0% |
| Macedonian | 136 | 0.0% |
| Malaysian | 1,634 | 0.1% |
| Maltese | 84 | 0.0% |
| Marshallese | 3 | 0.0% |
| Menominee | 7 | 0.0% |
| Mexican | 198,351 | 10.7% |
| Mexican American Indian | 3,130 | 0.2% |
| Mongolian | 102 | 0.0% |
| Moroccan | 97 | 0.0% |
| Native Hawaiian | 3,431 | 0.2% |
| Navajo | 1,927 | 0.1% |
| New Zealander | 247 | 0.0% |
| Nicaraguan | 589 | 0.0% |
| Nigerian | 597 | 0.0% |
| Northern European | 6,350 | 0.3% |
| Norwegian | 51,396 | 2.8% |
| Okinawan | 92 | 0.0% |
| Osage | 329 | 0.0% |
| Ottawa | 55 | 0.0% |
| Paiute | 185 | 0.0% |
| Pakistani | 1,775 | 0.1% |
| Palestinian | 17 | 0.0% |
| Panamanian | 280 | 0.0% |
| Paraguayan | 145 | 0.0% |
| Pennsylvania German | 290 | 0.0% |
| Peruvian | 2,398 | 0.1% |
| Pima | 25 | 0.0% |
| Polish | 21,709 | 1.2% |
| Portuguese | 7,168 | 0.4% |
| Potawatomi | 306 | 0.0% |
| Pueblo | 400 | 0.0% |
| Puerto Rican | 6,536 | 0.4% |
| Puget Sound Salish | 228 | 0.0% |
| Romanian | 2,414 | 0.1% |
| Russian | 9,464 | 0.5% |
| Salvadoran | 2,763 | 0.2% |
| Samoan | 1,079 | 0.1% |
| Scandinavian | 16,794 | 0.9% |
| Scotch-Irish | 16,371 | 0.9% |
| Scottish | 57,848 | 3.1% |
| Seminole | 153 | 0.0% |
| Senegalese | 21 | 0.0% |
| Serbian | 498 | 0.0% |
| Shoshone | 1,089 | 0.1% |
| Sierra Leonean | 72 | 0.0% |
| Sioux | 2,030 | 0.1% |
| Slavic | 463 | 0.0% |
| Slovak | 1,167 | 0.1% |
| Slovene | 488 | 0.0% |
| Somali | 376 | 0.0% |
| South African | 222 | 0.0% |
| South American | 8,121 | 0.4% |
| South American Indian | 455 | 0.0% |
| Spaniard | 6,178 | 0.3% |
| Spanish | 4,682 | 0.3% |
| Spanish American | 197 | 0.0% |
| Spanish American Indian | 258 | 0.0% |
| Sri Lankan | 2,573 | 0.1% |
| Subsaharan African | 4,247 | 0.2% |
| Sudanese | 522 | 0.0% |
| Swedish | 46,637 | 2.5% |
| Swiss | 11,891 | 0.6% |
| Syrian | 523 | 0.0% |
| Taiwanese | 72 | 0.0% |
| Thai | 3,760 | 0.2% |
| Tlingit-Haida | 293 | 0.0% |
| Tohono O'Odham | 11 | 0.0% |
| Tongan | 646 | 0.0% |
| Trinidadian and Tobagonian | 163 | 0.0% |
| Tsimshian | 60 | 0.0% |
| Turkish | 251 | 0.0% |
| U.S. Virgin Islander | 1 | 0.0% |
| Ugandan | 10 | 0.0% |
| Ukrainian | 4,213 | 0.2% |
| Uruguayan | 29 | 0.0% |
| Ute | 39 | 0.0% |
| Venezuelan | 1,326 | 0.1% |
| Welsh | 24,521 | 1.3% |
| West Indian | 154 | 0.0% |
| Yakama | 247 | 0.0% |
| Yaqui | 433 | 0.0% |
| Yugoslavian | 1,812 | 0.1% |
| Yuman | 14 | 0.0% |
| Yup'ik | 7 | 0.0% | View All 190 Rows |
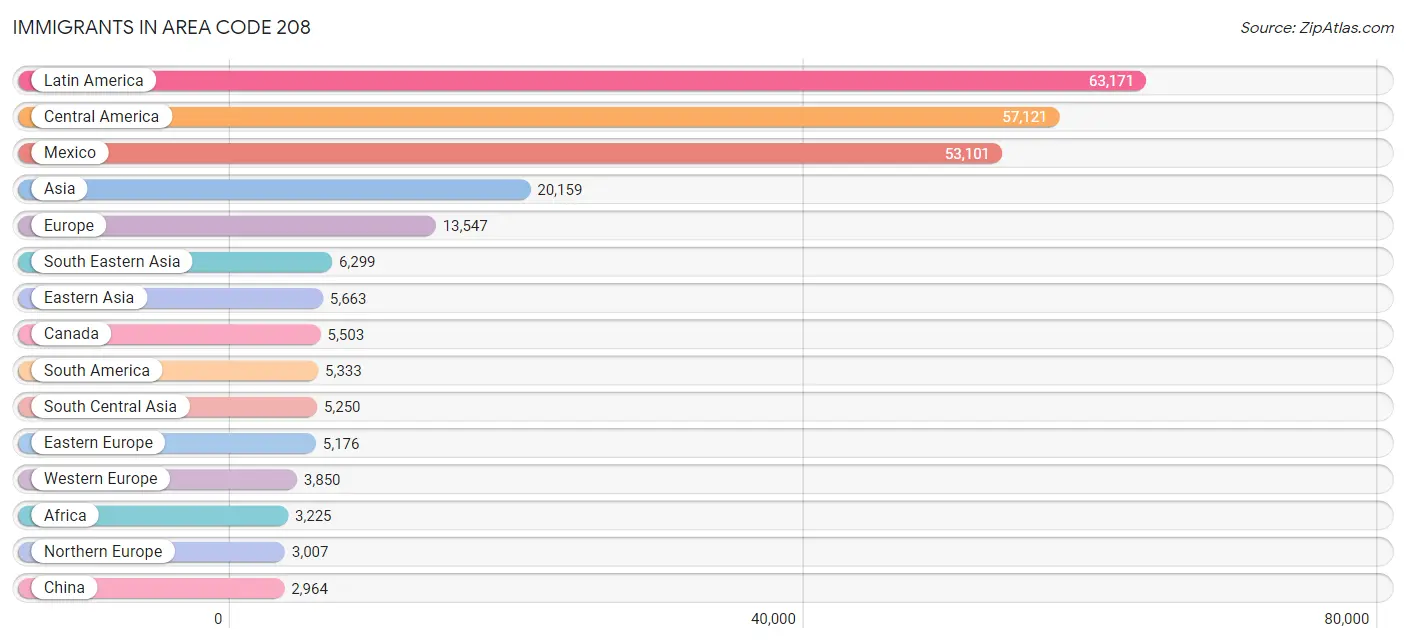
Immigrants in Area Code 208
The most numerous immigrant groups reported in Area Code 208 came from Latin America (63,171 | 3.4%), Central America (57,121 | 3.1%), Mexico (53,101 | 2.9%), Asia (20,159 | 1.1%), and Europe (13,547 | 0.7%), together accounting for 11.2% of all Area Code 208 residents.
| Immigration Origin | # Population | % Population |
| Afghanistan | 465 | 0.0% |
| Africa | 3,225 | 0.2% |
| Albania | 13 | 0.0% |
| Argentina | 384 | 0.0% |
| Armenia | 10 | 0.0% |
| Asia | 20,159 | 1.1% |
| Australia | 434 | 0.0% |
| Austria | 293 | 0.0% |
| Azores | 139 | 0.0% |
| Bangladesh | 76 | 0.0% |
| Belarus | 50 | 0.0% |
| Belgium | 96 | 0.0% |
| Bolivia | 29 | 0.0% |
| Bosnia and Herzegovina | 675 | 0.0% |
| Brazil | 816 | 0.0% |
| Bulgaria | 273 | 0.0% |
| Cabo Verde | 12 | 0.0% |
| Cambodia | 77 | 0.0% |
| Cameroon | 4 | 0.0% |
| Canada | 5,503 | 0.3% |
| Caribbean | 717 | 0.0% |
| Central America | 57,121 | 3.1% |
| Chile | 322 | 0.0% |
| China | 2,964 | 0.2% |
| Colombia | 1,289 | 0.1% |
| Congo | 226 | 0.0% |
| Costa Rica | 340 | 0.0% |
| Croatia | 195 | 0.0% |
| Cuba | 253 | 0.0% |
| Czechoslovakia | 166 | 0.0% |
| Denmark | 49 | 0.0% |
| Dominican Republic | 77 | 0.0% |
| Eastern Africa | 1,135 | 0.1% |
| Eastern Asia | 5,663 | 0.3% |
| Eastern Europe | 5,176 | 0.3% |
| Ecuador | 363 | 0.0% |
| Egypt | 235 | 0.0% |
| El Salvador | 861 | 0.1% |
| England | 1,595 | 0.1% |
| Eritrea | 65 | 0.0% |
| Ethiopia | 295 | 0.0% |
| Europe | 13,547 | 0.7% |
| Fiji | 9 | 0.0% |
| France | 397 | 0.0% |
| Germany | 2,535 | 0.1% |
| Ghana | 97 | 0.0% |
| Greece | 142 | 0.0% |
| Guatemala | 2,023 | 0.1% |
| Guyana | 32 | 0.0% |
| Haiti | 283 | 0.0% |
| Honduras | 547 | 0.0% |
| Hong Kong | 313 | 0.0% |
| Hungary | 226 | 0.0% |
| India | 2,143 | 0.1% |
| Indonesia | 307 | 0.0% |
| Iran | 622 | 0.0% |
| Iraq | 1,626 | 0.1% |
| Ireland | 96 | 0.0% |
| Israel | 126 | 0.0% |
| Italy | 378 | 0.0% |
| Jamaica | 64 | 0.0% |
| Japan | 867 | 0.1% |
| Jordan | 37 | 0.0% |
| Kazakhstan | 83 | 0.0% |
| Kenya | 80 | 0.0% |
| Korea | 1,802 | 0.1% |
| Kuwait | 166 | 0.0% |
| Laos | 956 | 0.1% |
| Latin America | 63,171 | 3.4% |
| Latvia | 38 | 0.0% |
| Lebanon | 184 | 0.0% |
| Liberia | 5 | 0.0% |
| Lithuania | 24 | 0.0% |
| Malaysia | 211 | 0.0% |
| Mexico | 53,101 | 2.9% |
| Micronesia | 3 | 0.0% |
| Middle Africa | 807 | 0.0% |
| Moldova | 119 | 0.0% |
| Morocco | 14 | 0.0% |
| Nepal | 1,091 | 0.1% |
| Netherlands | 373 | 0.0% |
| Nicaragua | 95 | 0.0% |
| Nigeria | 246 | 0.0% |
| North Macedonia | 121 | 0.0% |
| Northern Africa | 454 | 0.0% |
| Northern Europe | 3,007 | 0.2% |
| Norway | 165 | 0.0% |
| Oceania | 753 | 0.0% |
| Pakistan | 173 | 0.0% |
| Panama | 142 | 0.0% |
| Peru | 1,398 | 0.1% |
| Philippines | 2,230 | 0.1% |
| Poland | 216 | 0.0% |
| Portugal | 346 | 0.0% |
| Romania | 520 | 0.0% |
| Russia | 1,012 | 0.1% |
| Saudi Arabia | 318 | 0.0% |
| Scotland | 158 | 0.0% |
| Serbia | 77 | 0.0% |
| Sierra Leone | 50 | 0.0% |
| Singapore | 331 | 0.0% |
| Somalia | 201 | 0.0% |
| South Africa | 314 | 0.0% |
| South America | 5,333 | 0.3% |
| South Central Asia | 5,250 | 0.3% |
| South Eastern Asia | 6,299 | 0.3% |
| Southern Europe | 1,342 | 0.1% |
| Spain | 465 | 0.0% |
| Sri Lanka | 72 | 0.0% |
| Sudan | 134 | 0.0% |
| Sweden | 63 | 0.0% |
| Switzerland | 156 | 0.0% |
| Syria | 294 | 0.0% |
| Taiwan | 432 | 0.0% |
| Thailand | 679 | 0.0% |
| Trinidad and Tobago | 17 | 0.0% |
| Turkey | 36 | 0.0% |
| Ukraine | 1,274 | 0.1% |
| Uruguay | 25 | 0.0% |
| Uzbekistan | 118 | 0.0% |
| Venezuela | 389 | 0.0% |
| Vietnam | 1,257 | 0.1% |
| West Indies | 23 | 0.0% |
| Western Africa | 410 | 0.0% |
| Western Asia | 2,947 | 0.2% |
| Western Europe | 3,850 | 0.2% |
| Yemen | 31 | 0.0% |
| Zaire | 577 | 0.0% |
| Zimbabwe | 50 | 0.0% | View All 129 Rows |
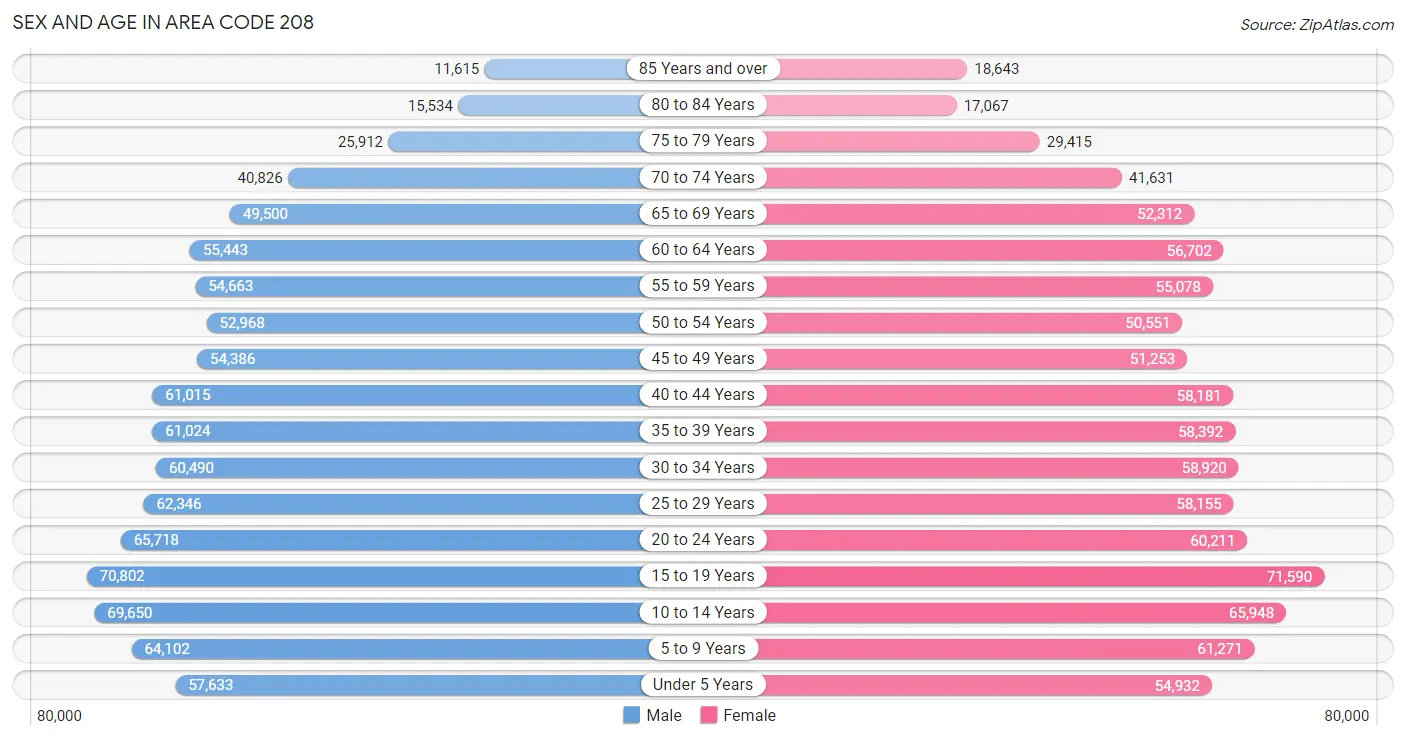
Sex and Age in Area Code 208
Sex and Age in Area Code 208
The most populous age groups in Area Code 208 are 15 to 19 Years (70,802 | 7.6%) for men and 15 to 19 Years (71,590 | 7.8%) for women.
| Age Bracket | Male | Female |
| Under 5 Years | 57,633 (6.2%) | 54,932 (6.0%) |
| 5 to 9 Years | 64,102 (6.9%) | 61,271 (6.7%) |
| 10 to 14 Years | 69,650 (7.5%) | 65,948 (7.2%) |
| 15 to 19 Years | 70,802 (7.6%) | 71,590 (7.8%) |
| 20 to 24 Years | 65,718 (7.0%) | 60,211 (6.5%) |
| 25 to 29 Years | 62,346 (6.7%) | 58,155 (6.3%) |
| 30 to 34 Years | 60,490 (6.5%) | 58,920 (6.4%) |
| 35 to 39 Years | 61,024 (6.5%) | 58,392 (6.4%) |
| 40 to 44 Years | 61,015 (6.5%) | 58,181 (6.3%) |
| 45 to 49 Years | 54,386 (5.8%) | 51,253 (5.6%) |
| 50 to 54 Years | 52,968 (5.7%) | 50,551 (5.5%) |
| 55 to 59 Years | 54,663 (5.9%) | 55,078 (6.0%) |
| 60 to 64 Years | 55,443 (5.9%) | 56,702 (6.2%) |
| 65 to 69 Years | 49,500 (5.3%) | 52,312 (5.7%) |
| 70 to 74 Years | 40,826 (4.4%) | 41,631 (4.5%) |
| 75 to 79 Years | 25,912 (2.8%) | 29,415 (3.2%) |
| 80 to 84 Years | 15,534 (1.7%) | 17,067 (1.8%) |
| 85 Years and over | 11,615 (1.2%) | 18,643 (2.0%) |
| Total | 933,627 (100.0%) | 920,252 (100.0%) |
Families and Households in Area Code 208
Median Family Size in Area Code 208
The median family size in Area Code 208 is 3.16 persons per family, with single female/mother families (58,404 | 12.6%) accounting for the largest median family size of 3.45967 persons per family. On the other hand, married-couple families (372,058 | 80.5%) represent the smallest median family size with 3.13 persons per family.
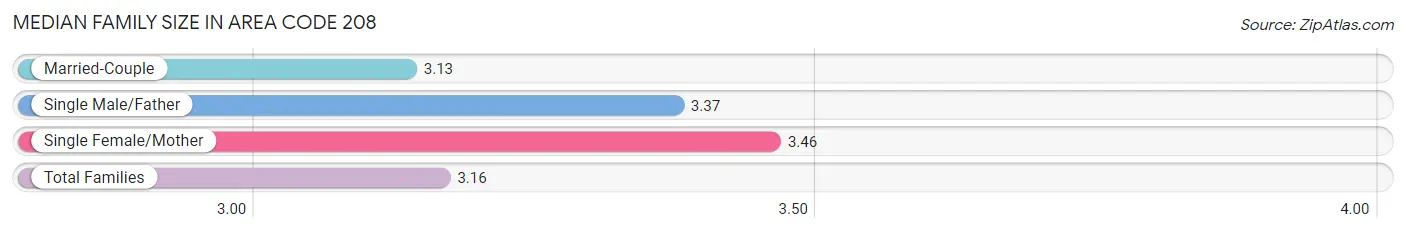
| Family Type | # Families | Family Size |
| Married-Couple | 372,058 (80.5%) | 3.13 |
| Single Male/Father | 31,561 (6.8%) | 3.37 |
| Single Female/Mother | 58,404 (12.6%) | 3.46 |
| Total Families | 462,023 (100.0%) | 3.16 |
Median Household Size in Area Code 208
The median household size in Area Code 208 is 2.66 persons per household, with single male/father households (31,561 | 4.7%) accounting for the largest median household size of 3.81656 persons per household. non-family households (213,128 | 31.6%) represent the smallest median household size with 1.30 persons per household.
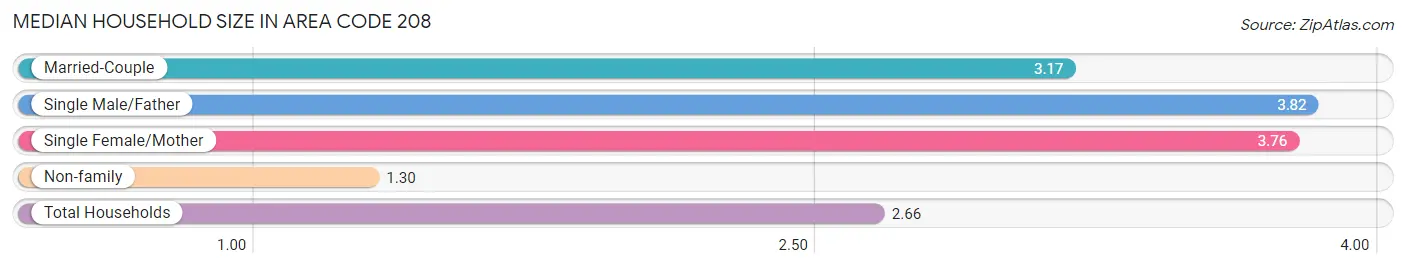
| Household Type | # Households | Household Size |
| Married-Couple | 372,058 (55.1%) | 3.17 |
| Single Male/Father | 31,561 (4.7%) | 3.82 |
| Single Female/Mother | 58,404 (8.6%) | 3.76 |
| Non-family | 213,128 (31.6%) | 1.30 |
| Total Households | 675,151 (100.0%) | 2.66 |
Household Size by Marriage Status in Area Code 208
Out of a total of 675,151 households in Area Code 208, 462,023 (68.4%) are family households, while 213,128 (31.6%) are nonfamily households. The most numerous type of family households are 2-person households, comprising 210,879, and the most common type of nonfamily households are 1-person households, comprising 166,957.
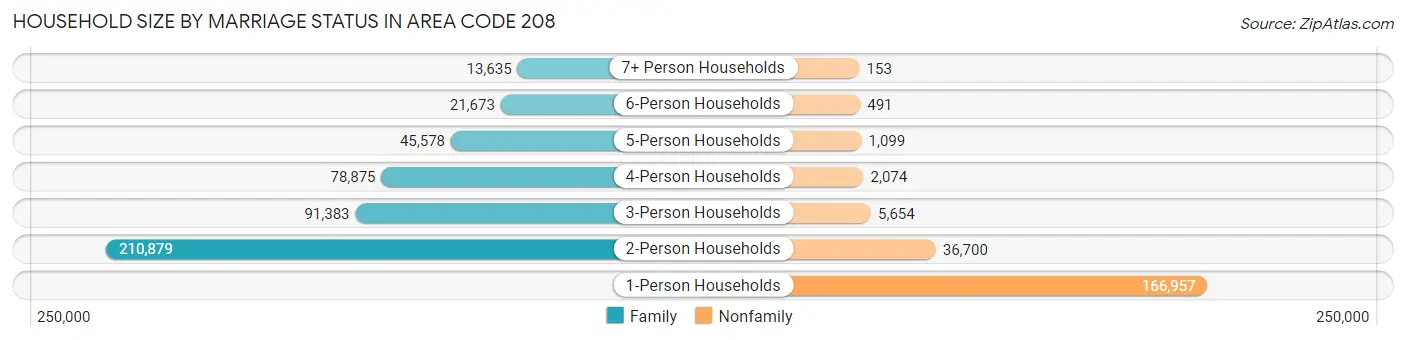
| Household Size | Family Households | Nonfamily Households |
| 1-Person Households | - | 166,957 (24.7%) |
| 2-Person Households | 210,879 (31.2%) | 36,700 (5.4%) |
| 3-Person Households | 91,383 (13.5%) | 5,654 (0.8%) |
| 4-Person Households | 78,875 (11.7%) | 2,074 (0.3%) |
| 5-Person Households | 45,578 (6.8%) | 1,099 (0.2%) |
| 6-Person Households | 21,673 (3.2%) | 491 (0.1%) |
| 7+ Person Households | 13,635 (2.0%) | 153 (0.0%) |
| Total | 462,023 (68.4%) | 213,128 (31.6%) |
Female Fertility in Area Code 208
Fertility by Age in Area Code 208
Average fertility rate in Area Code 208 is 84.3 births per 1,000 women. Women in the age bracket of 20 to 34 years have the highest fertility rate with 166.5 births per 1,000 women. Women in the age bracket of 20 to 34 years acount for 75.3% of all women with births.
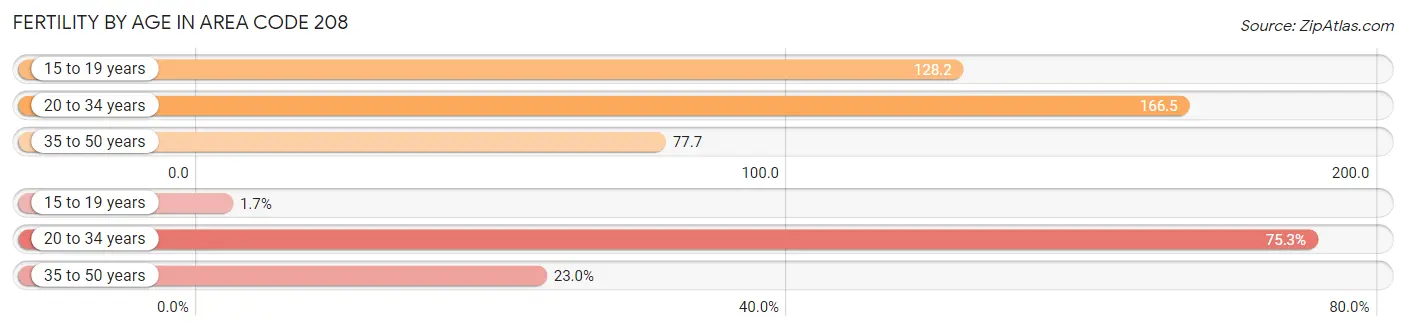
| Age Bracket | Women with Births | Births / 1,000 Women |
| 15 to 19 years | 407 (1.7%) | 128.2 |
| 20 to 34 years | 18,144 (75.3%) | 166.5 |
| 35 to 50 years | 5,537 (23.0%) | 77.7 |
| Total | 24,088 (100.0%) | 84.3 |
Fertility by Age by Marriage Status in Area Code 208
65.6% of women with births (24,088) in Area Code 208 are married. The highest percentage of unmarried women with births falls into 15 to 19 years age bracket with 99.5% of them unmarried at the time of birth, while the lowest percentage of unmarried women with births belong to 20 to 34 years age bracket with 36.3% of them unmarried.
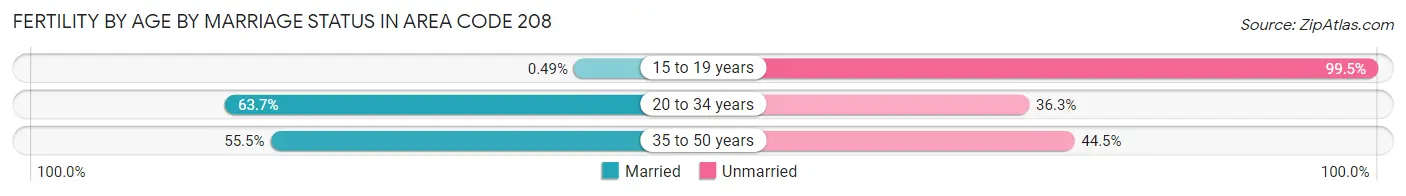
| Age Bracket | Married | Unmarried |
| 15 to 19 years | 2 (0.5%) | 405 (99.5%) |
| 20 to 34 years | 11,552 (63.7%) | 6,592 (36.3%) |
| 35 to 50 years | 3,072 (55.5%) | 2,465 (44.5%) |
| Total | 15,802 (65.6%) | 8,286 (34.4%) |
Fertility by Education in Area Code 208
Average fertility rate in Area Code 208 is 84.3 births per 1,000 women. Women with the education attainment of graduate degree have the highest fertility rate of 203.6 births per 1,000 women, while women with the education attainment of less than high school have the lowest fertility at 90.2 births per 1,000 women. Women with the education attainment of college or associate's degree represent 33.0% of all women with births.
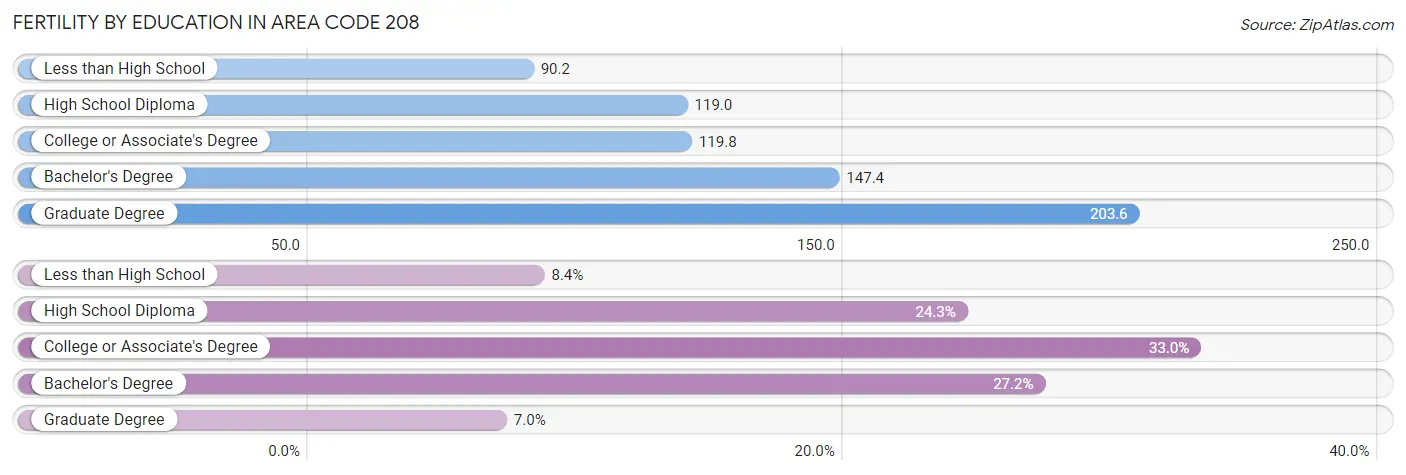
| Educational Attainment | Women with Births | Births / 1,000 Women |
| Less than High School | 2,033 (8.4%) | 90.2 |
| High School Diploma | 5,850 (24.3%) | 119.0 |
| College or Associate's Degree | 7,959 (33.0%) | 119.8 |
| Bachelor's Degree | 6,553 (27.2%) | 147.4 |
| Graduate Degree | 1,693 (7.0%) | 203.6 |
| Total | 24,088 (100.0%) | 84.3 |
Fertility by Education by Marriage Status in Area Code 208
34.4% of women with births in Area Code 208 are unmarried. Women with the educational attainment of bachelor's degree are most likely to be married with 64.1% of them married at childbirth, while women with the educational attainment of less than high school are least likely to be married with 77.4% of them unmarried at childbirth.
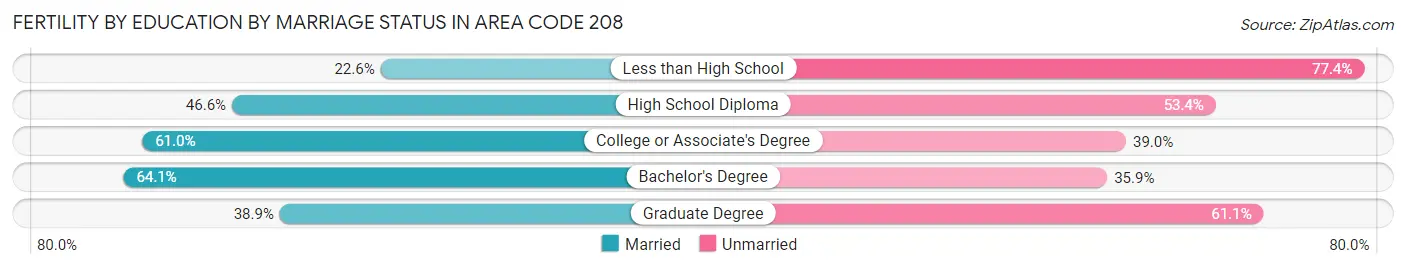
| Educational Attainment | Married | Unmarried |
| Less than High School | 460 (22.6%) | 1,573 (77.4%) |
| High School Diploma | 2,725 (46.6%) | 3,125 (53.4%) |
| College or Associate's Degree | 4,857 (61.0%) | 3,102 (39.0%) |
| Bachelor's Degree | 4,198 (64.1%) | 2,355 (35.9%) |
| Graduate Degree | 658 (38.9%) | 1,035 (61.1%) |
| Total | 15,802 (65.6%) | 8,286 (34.4%) |
Employment Characteristics in Area Code 208
Employment by Class of Employer in Area Code 208
Among the 862,556 employed individuals in Area Code 208, private company employees (560,715 | 65.0%), self-employed (not incorporated) (64,236 | 7.4%), and not-for-profit organizations (62,017 | 7.2%) make up the most common classes of employment.
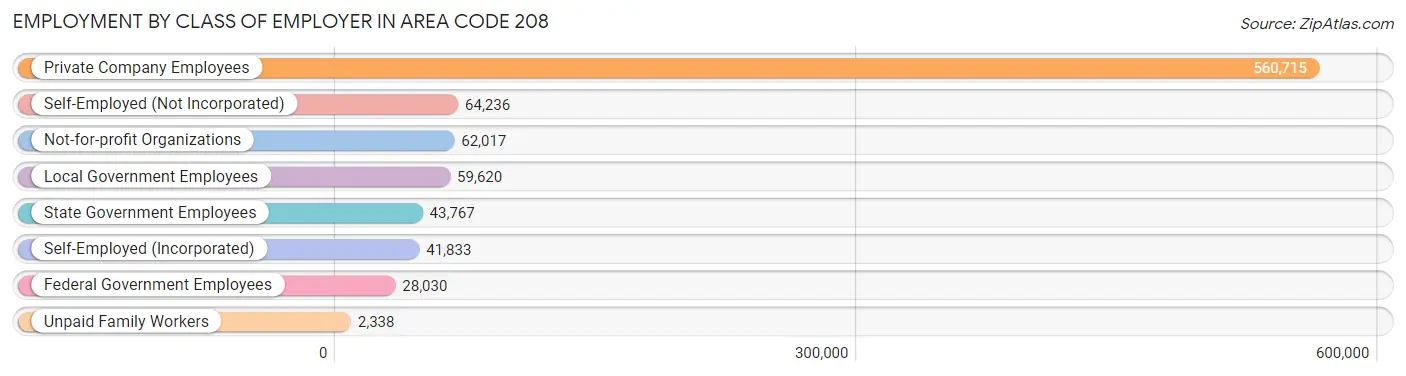
| Employer Class | # Employees | % Employees |
| Private Company Employees | 560,715 | 65.0% |
| Self-Employed (Incorporated) | 41,833 | 4.9% |
| Self-Employed (Not Incorporated) | 64,236 | 7.4% |
| Not-for-profit Organizations | 62,017 | 7.2% |
| Local Government Employees | 59,620 | 6.9% |
| State Government Employees | 43,767 | 5.1% |
| Federal Government Employees | 28,030 | 3.3% |
| Unpaid Family Workers | 2,338 | 0.3% |
| Total | 862,556 | 100.0% |
Employment Status by Age in Area Code 208
According to the labor force statistics for Area Code 208, out of the total population over 16 years of age (1,451,251), 57.0% or 827,648 individuals are in the labor force, with 5.0% or 41,382 of them unemployed. The age group with the highest labor force participation rate is 35 to 44 years, with 82.0% or 195,590 individuals in the labor force. Within the labor force, the 16 to 19 years age range has the highest percentage of unemployed individuals, with 2,924.3% or 1,753,030 of them being unemployed.
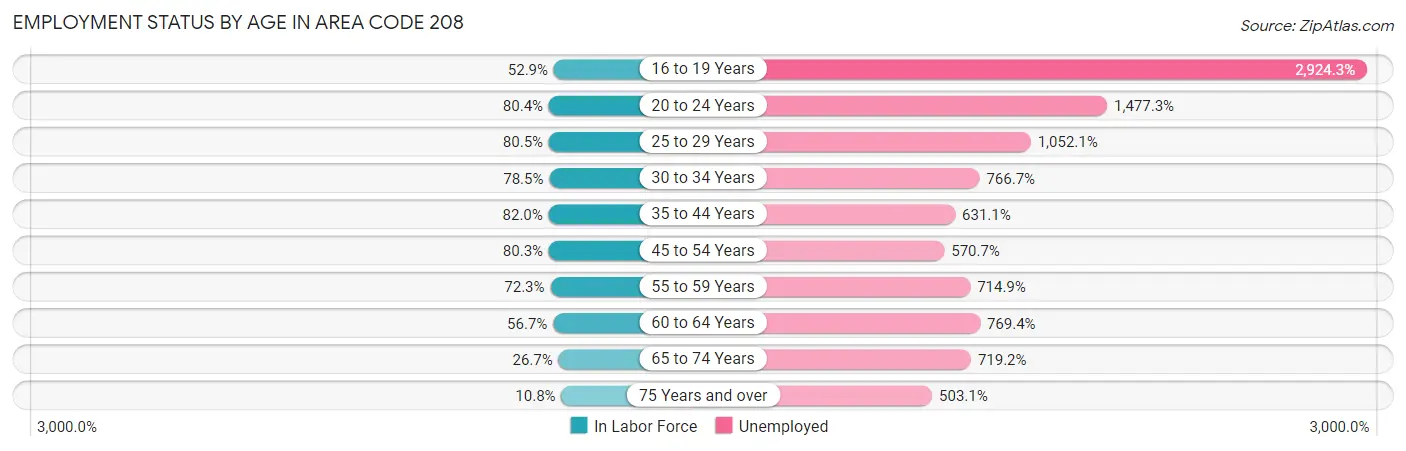
| Age Bracket | In Labor Force | Unemployed |
| 16 to 19 Years | 59,950 (52.9%) | 1,753,030 (2,924.3%) |
| 20 to 24 Years | 101,253 (80.4%) | 1,495,722 (1,477.3%) |
| 25 to 29 Years | 96,963 (80.5%) | 1,020,190 (1,052.1%) |
| 30 to 34 Years | 93,724 (78.5%) | 718,590 (766.7%) |
| 35 to 44 Years | 195,601 (82.0%) | 1,234,368 (631.1%) |
| 45 to 54 Years | 168,037 (80.3%) | 958,993 (570.7%) |
| 55 to 59 Years | 79,343 (72.3%) | 567,223 (714.9%) |
| 60 to 64 Years | 63,569 (56.7%) | 489,061 (769.4%) |
| 65 to 74 Years | 49,279 (26.7%) | 354,379 (719.2%) |
| 75 Years and over | 12,761 (10.8%) | 64,216 (503.1%) |
| Total | 827,688 (57.0%) | 41,394 (5.0%) |
Employment Status by Educational Attainment in Area Code 208
According to labor force statistics for Area Code 208, 73.1% of individuals (664,893) out of the total population between 25 and 64 years of age (909,567) are in the labor force, with 840.8% or 5,590,420 of them being unemployed. The group with the highest labor force participation rate are those with the educational attainment of bachelor's degree or higher, with 81.8% or 227,618 individuals in the labor force. Within the labor force, individuals with high school diploma education have the highest percentage of unemployment, with 919.4% or 1,552,830 of them being unemployed.
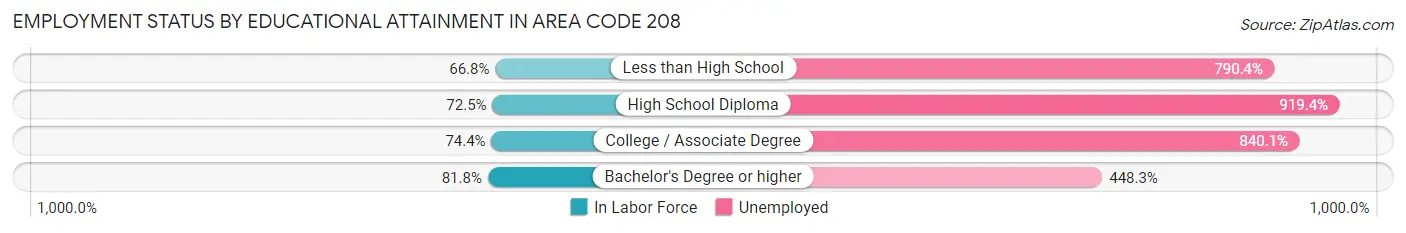
| Educational Attainment | In Labor Force | Unemployed |
| Less than High School | 53,178 (66.8%) | 629,348 (790.4%) |
| High School Diploma | 168,890 (72.5%) | 2,141,246 (919.4%) |
| College / Associate Degree | 237,214 (74.4%) | 2,678,692 (840.1%) |
| Bachelor's Degree or higher | 227,615 (81.8%) | 1,247,139 (448.3%) |
| Total | 664,853 (73.1%) | 7,647,639 (840.8%) |
Employment Occupations by Sex in Area Code 208
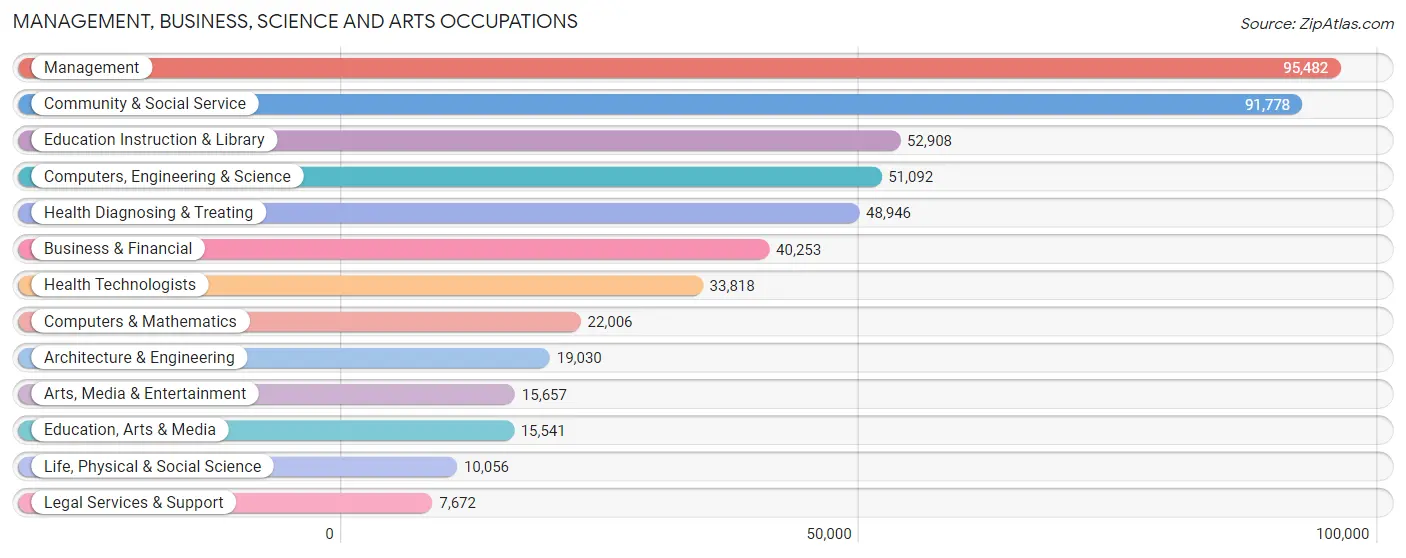
Management, Business, Science and Arts Occupations
The most common Management, Business, Science and Arts occupations in Area Code 208 are Management (95,482 | 10.9%), Community & Social Service (91,778 | 10.5%), Education Instruction & Library (52,908 | 6.1%), Computers, Engineering & Science (51,092 | 5.9%), and Health Diagnosing & Treating (48,946 | 5.6%).
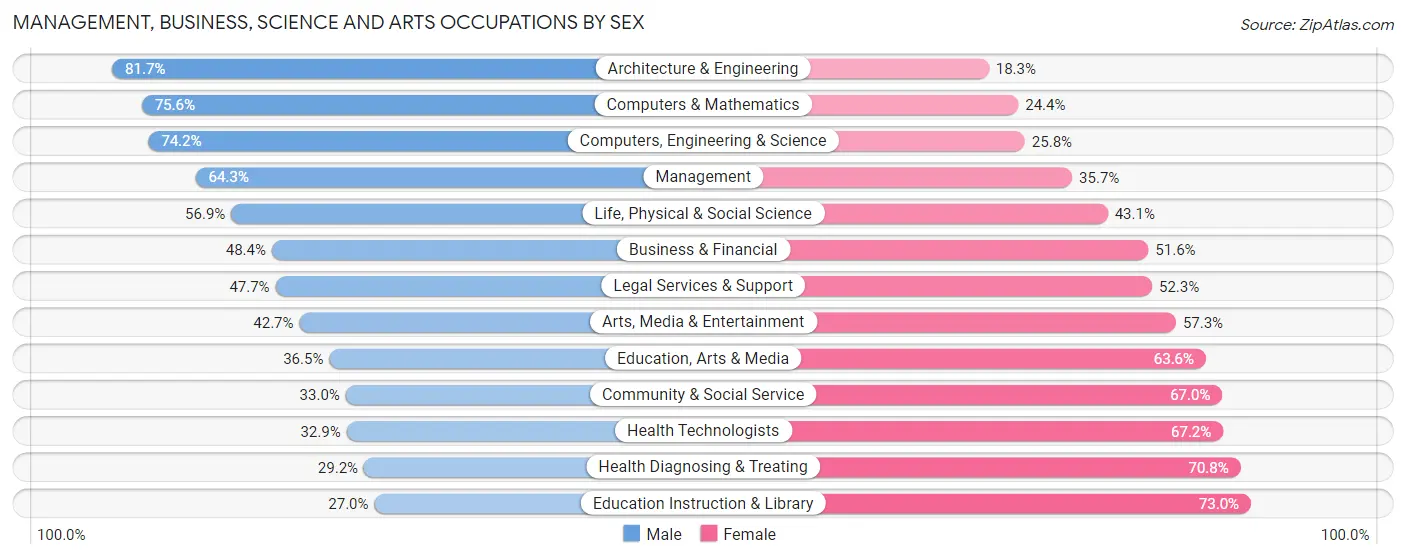
Management, Business, Science and Arts Occupations by Sex
Within the Management, Business, Science and Arts occupations in Area Code 208, the most male-oriented occupations are Architecture & Engineering (81.7%), Computers & Mathematics (75.6%), and Computers, Engineering & Science (74.2%), while the most female-oriented occupations are Education Instruction & Library (73.0%), Health Diagnosing & Treating (70.8%), and Health Technologists (67.1%).
| Occupation | Male | Female |
| Management | 61,424 (64.3%) | 34,058 (35.7%) |
| Business & Financial | 19,493 (48.4%) | 20,760 (51.6%) |
| Computers, Engineering & Science | 37,903 (74.2%) | 13,189 (25.8%) |
| Computers & Mathematics | 16,627 (75.6%) | 5,379 (24.4%) |
| Architecture & Engineering | 15,553 (81.7%) | 3,477 (18.3%) |
| Life, Physical & Social Science | 5,723 (56.9%) | 4,333 (43.1%) |
| Community & Social Service | 30,311 (33.0%) | 61,467 (67.0%) |
| Education, Arts & Media | 5,664 (36.4%) | 9,877 (63.5%) |
| Legal Services & Support | 3,657 (47.7%) | 4,015 (52.3%) |
| Education Instruction & Library | 14,308 (27.0%) | 38,600 (73.0%) |
| Arts, Media & Entertainment | 6,682 (42.7%) | 8,975 (57.3%) |
| Health Diagnosing & Treating | 14,300 (29.2%) | 34,646 (70.8%) |
| Health Technologists | 11,110 (32.9%) | 22,708 (67.1%) |
| Total (Category) | 163,431 (49.9%) | 164,120 (50.1%) |
| Total (Overall) | 475,125 (54.4%) | 398,184 (45.6%) |
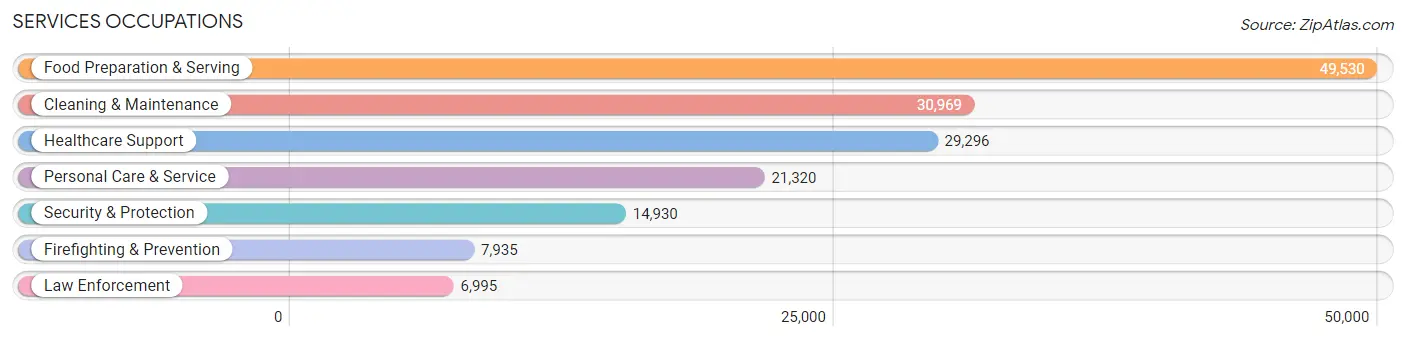
Services Occupations
The most common Services occupations in Area Code 208 are Food Preparation & Serving (49,530 | 5.7%), Cleaning & Maintenance (30,969 | 3.5%), Healthcare Support (29,296 | 3.4%), Personal Care & Service (21,320 | 2.4%), and Security & Protection (14,930 | 1.7%).
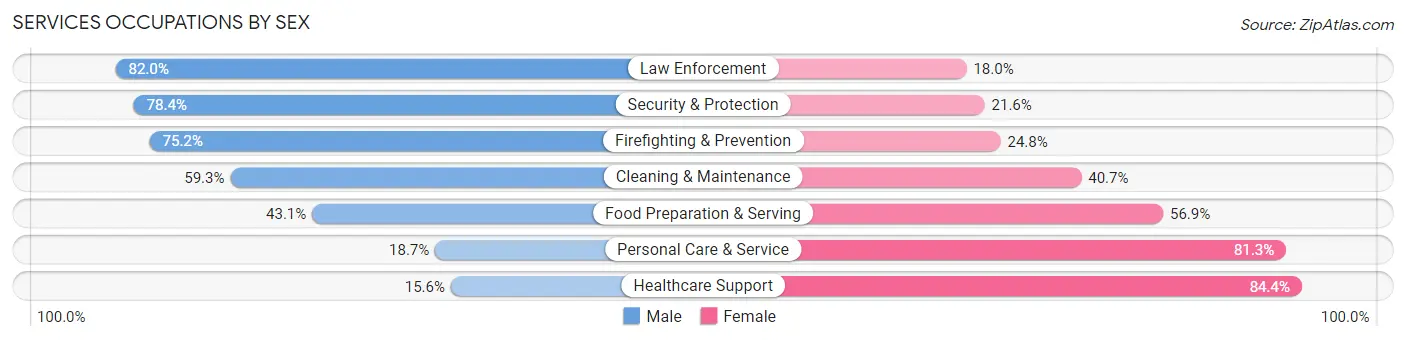
Services Occupations by Sex
Within the Services occupations in Area Code 208, the most male-oriented occupations are Law Enforcement (82.0%), Security & Protection (78.4%), and Firefighting & Prevention (75.2%), while the most female-oriented occupations are Healthcare Support (84.4%), Personal Care & Service (81.3%), and Food Preparation & Serving (56.9%).
| Occupation | Male | Female |
| Healthcare Support | 4,574 (15.6%) | 24,722 (84.4%) |
| Security & Protection | 11,705 (78.4%) | 3,225 (21.6%) |
| Firefighting & Prevention | 5,970 (75.2%) | 1,965 (24.8%) |
| Law Enforcement | 5,735 (82.0%) | 1,260 (18.0%) |
| Food Preparation & Serving | 21,335 (43.1%) | 28,195 (56.9%) |
| Cleaning & Maintenance | 18,351 (59.3%) | 12,618 (40.7%) |
| Personal Care & Service | 3,988 (18.7%) | 17,332 (81.3%) |
| Total (Category) | 59,953 (41.0%) | 86,092 (59.0%) |
| Total (Overall) | 475,125 (54.4%) | 398,184 (45.6%) |
Sales and Office Occupations
The most common Sales and Office occupations in Area Code 208 are Office & Administration (97,475 | 11.2%), and Sales & Related (84,695 | 9.7%).
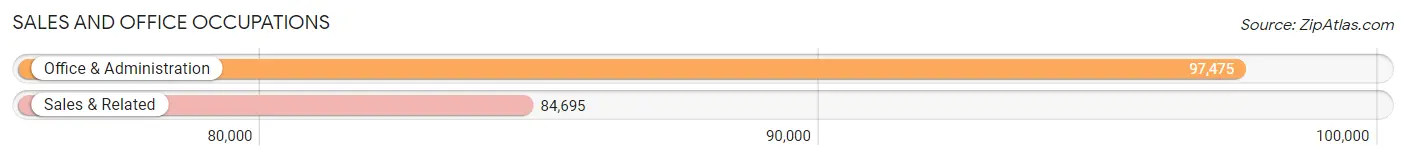
Sales and Office Occupations by Sex
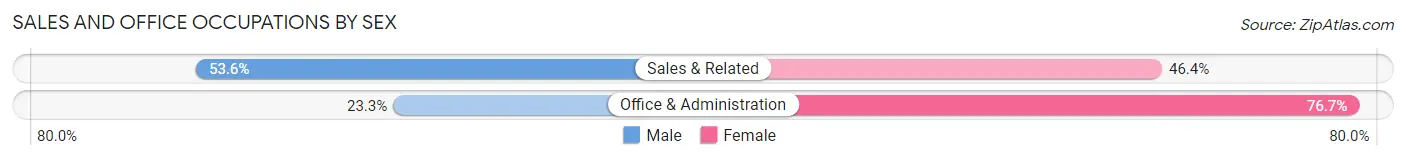
| Occupation | Male | Female |
| Sales & Related | 45,417 (53.6%) | 39,278 (46.4%) |
| Office & Administration | 22,735 (23.3%) | 74,740 (76.7%) |
| Total (Category) | 68,152 (37.4%) | 114,018 (62.6%) |
| Total (Overall) | 475,125 (54.4%) | 398,184 (45.6%) |
Natural Resources, Construction and Maintenance Occupations
The most common Natural Resources, Construction and Maintenance occupations in Area Code 208 are Construction & Extraction (56,616 | 6.5%), Installation, Maintenance & Repair (30,900 | 3.5%), and Farming, Fishing & Forestry (17,364 | 2.0%).
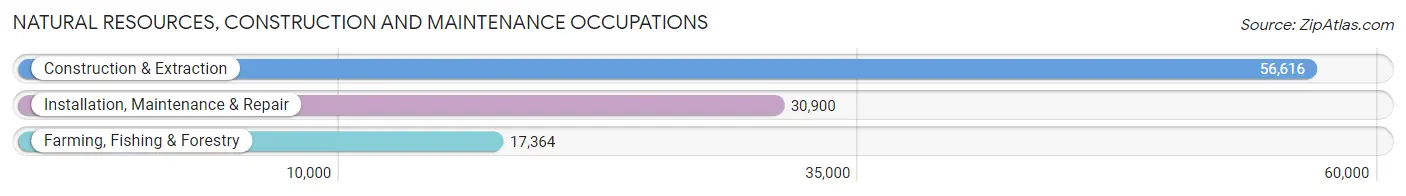
Natural Resources, Construction and Maintenance Occupations by Sex
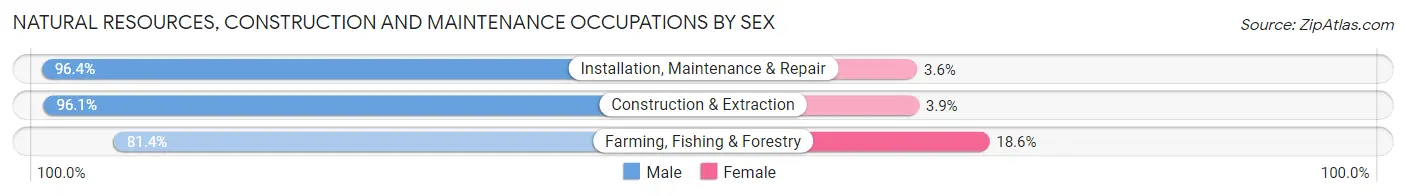
| Occupation | Male | Female |
| Farming, Fishing & Forestry | 14,136 (81.4%) | 3,228 (18.6%) |
| Construction & Extraction | 54,383 (96.1%) | 2,233 (3.9%) |
| Installation, Maintenance & Repair | 29,798 (96.4%) | 1,102 (3.6%) |
| Total (Category) | 98,317 (93.7%) | 6,563 (6.3%) |
| Total (Overall) | 475,125 (54.4%) | 398,184 (45.6%) |
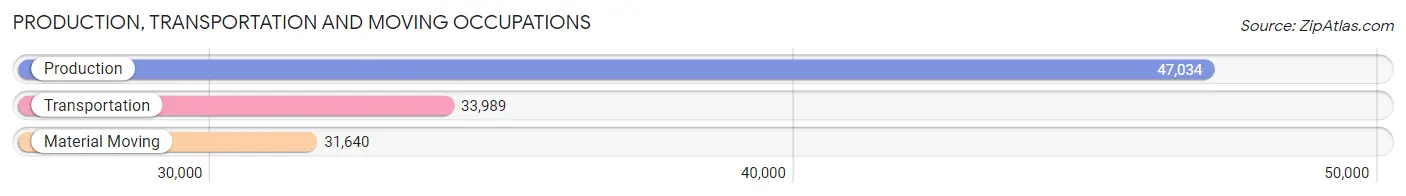
Production, Transportation and Moving Occupations
The most common Production, Transportation and Moving occupations in Area Code 208 are Production (47,034 | 5.4%), Transportation (33,989 | 3.9%), and Material Moving (31,640 | 3.6%).
Production, Transportation and Moving Occupations by Sex
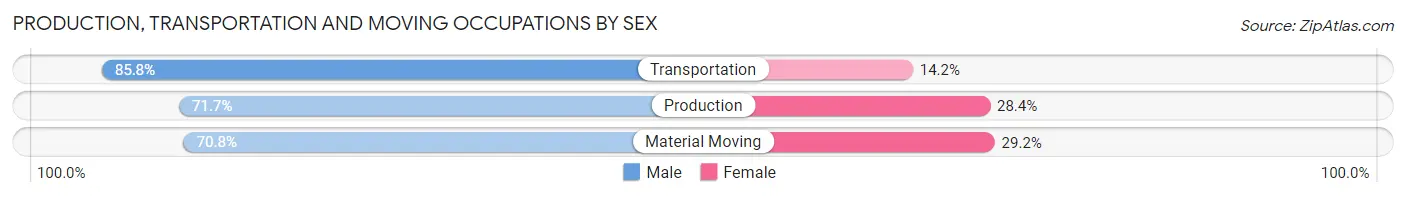
| Occupation | Male | Female |
| Production | 33,700 (71.7%) | 13,334 (28.3%) |
| Transportation | 29,169 (85.8%) | 4,820 (14.2%) |
| Material Moving | 22,403 (70.8%) | 9,237 (29.2%) |
| Total (Category) | 85,272 (75.7%) | 27,391 (24.3%) |
| Total (Overall) | 475,125 (54.4%) | 398,184 (45.6%) |
Employment Industries by Sex in Area Code 208
Employment Industries in Area Code 208
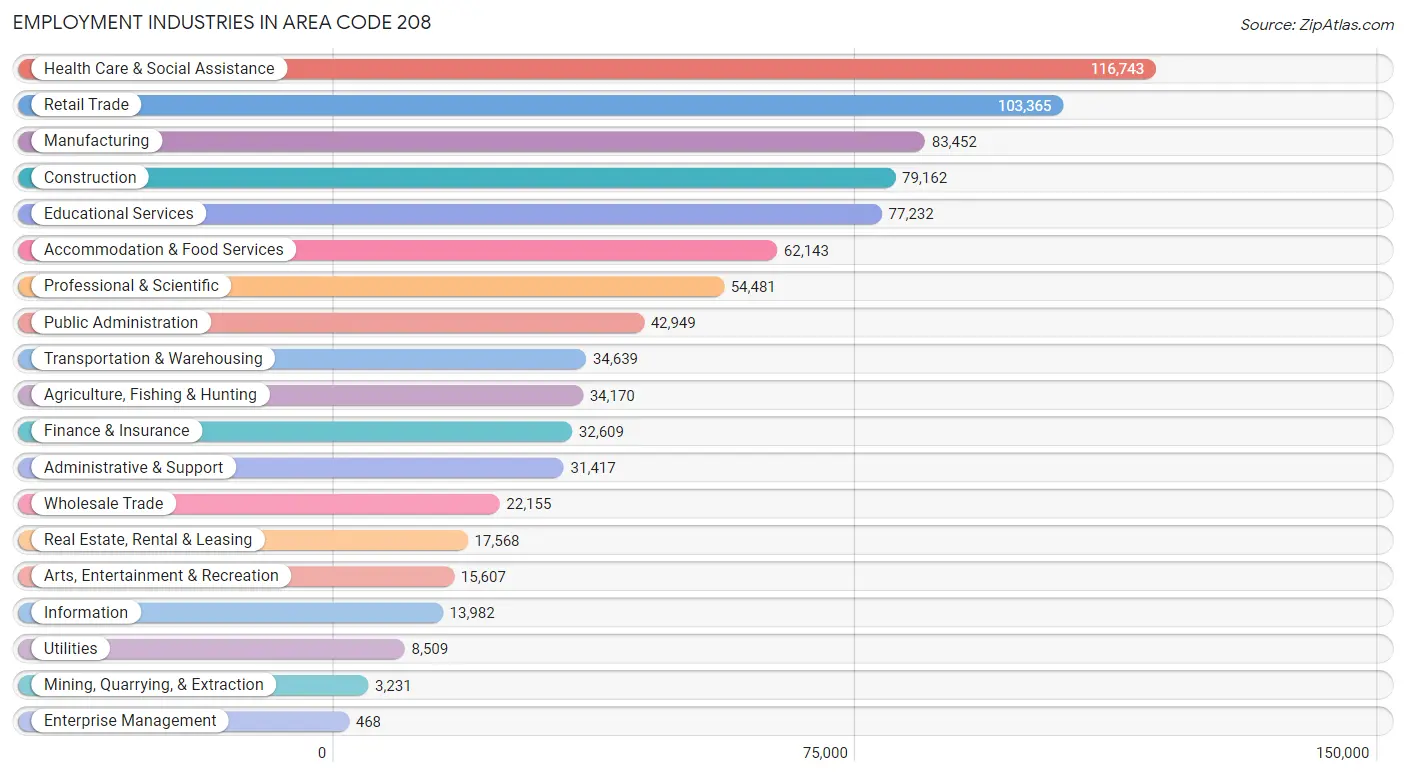
The major employment industries in Area Code 208 include Health Care & Social Assistance (116,743 | 13.4%), Retail Trade (103,365 | 11.8%), Manufacturing (83,452 | 9.6%), Construction (79,162 | 9.1%), and Educational Services (77,232 | 8.8%).
Employment Industries by Sex in Area Code 208
The Area Code 208 industries that see more men than women are Mining, Quarrying, & Extraction (93.5%), Construction (88.0%), and Agriculture, Fishing & Hunting (80.9%), whereas the industries that tend to have a higher number of women are Health Care & Social Assistance (76.1%), Educational Services (68.7%), and Finance & Insurance (60.0%).
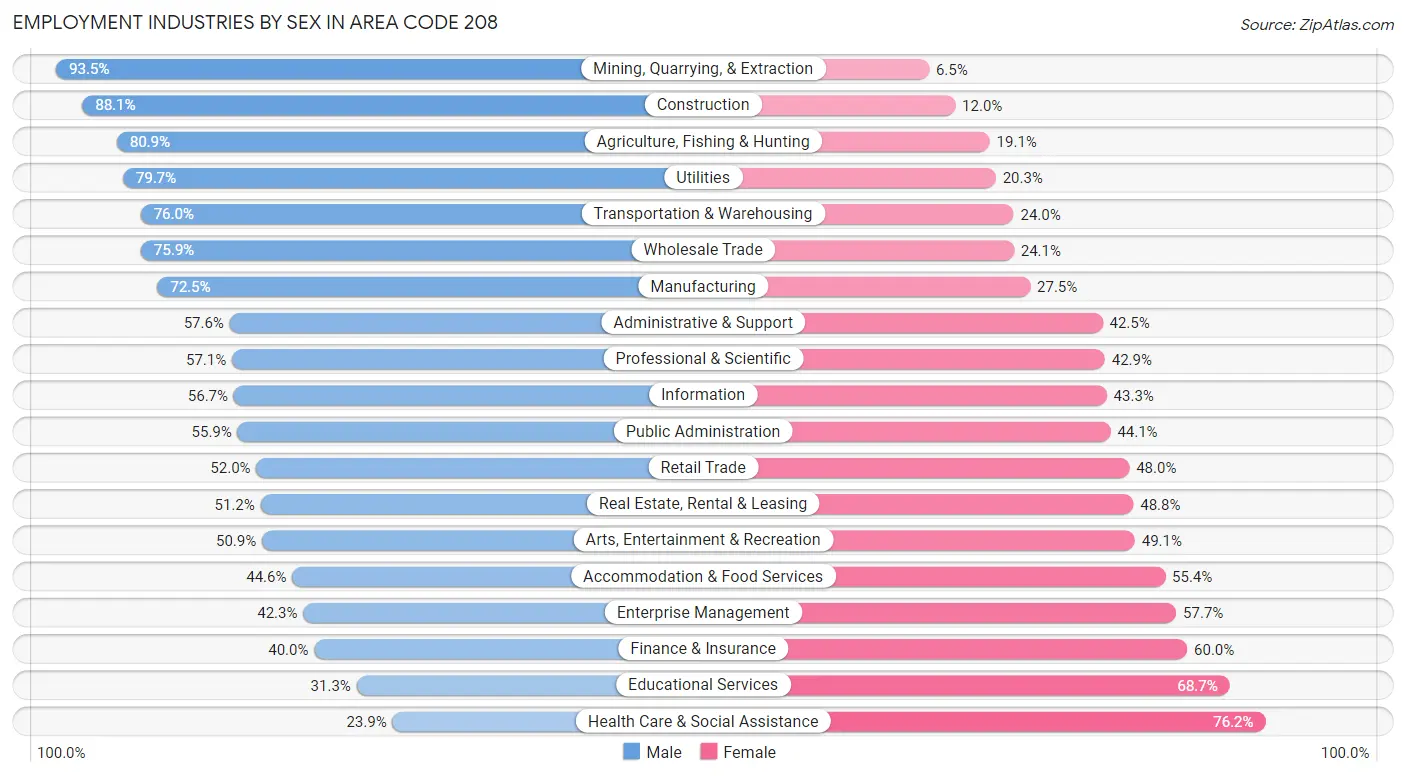
| Industry | Male | Female |
| Agriculture, Fishing & Hunting | 27,648 (80.9%) | 6,522 (19.1%) |
| Mining, Quarrying, & Extraction | 3,020 (93.5%) | 211 (6.5%) |
| Construction | 69,700 (88.0%) | 9,462 (11.9%) |
| Manufacturing | 60,531 (72.5%) | 22,921 (27.5%) |
| Wholesale Trade | 16,819 (75.9%) | 5,336 (24.1%) |
| Retail Trade | 53,766 (52.0%) | 49,599 (48.0%) |
| Transportation & Warehousing | 26,311 (76.0%) | 8,328 (24.0%) |
| Utilities | 6,778 (79.7%) | 1,731 (20.3%) |
| Information | 7,926 (56.7%) | 6,056 (43.3%) |
| Finance & Insurance | 13,058 (40.0%) | 19,551 (60.0%) |
| Real Estate, Rental & Leasing | 8,989 (51.2%) | 8,579 (48.8%) |
| Professional & Scientific | 31,093 (57.1%) | 23,388 (42.9%) |
| Enterprise Management | 198 (42.3%) | 270 (57.7%) |
| Administrative & Support | 18,079 (57.6%) | 13,338 (42.4%) |
| Educational Services | 24,150 (31.3%) | 53,082 (68.7%) |
| Health Care & Social Assistance | 27,846 (23.8%) | 88,897 (76.1%) |
| Arts, Entertainment & Recreation | 7,938 (50.9%) | 7,669 (49.1%) |
| Accommodation & Food Services | 27,708 (44.6%) | 34,435 (55.4%) |
| Public Administration | 24,011 (55.9%) | 18,938 (44.1%) |
| Total | 475,125 (54.4%) | 398,184 (45.6%) |
Education in Area Code 208
School Enrollment in Area Code 208
The most common levels of schooling among the 484,148 students in Area Code 208 are middle school (107,955 | 22.3%), high school (105,943 | 21.9%), and college / undergraduate (105,505 | 21.8%).
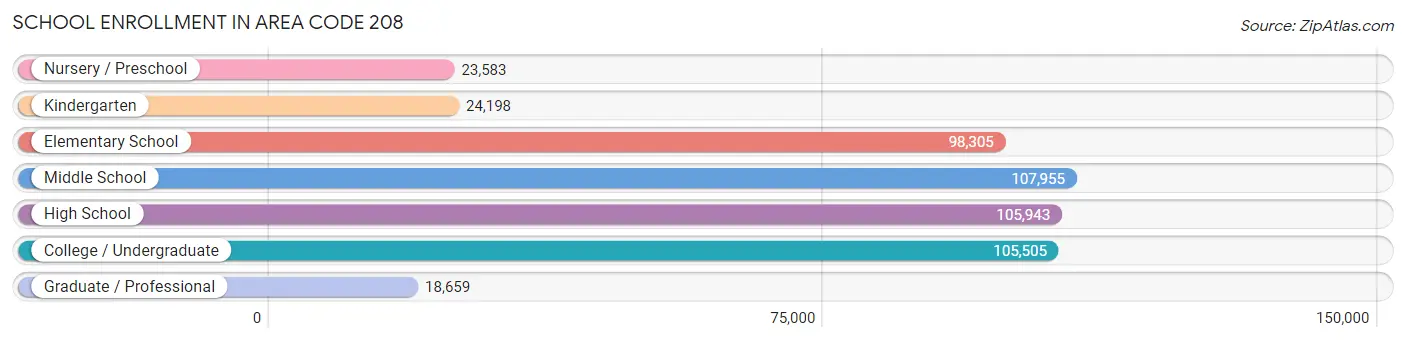
| School Level | # Students | % Students |
| Nursery / Preschool | 23,583 | 4.9% |
| Kindergarten | 24,198 | 5.0% |
| Elementary School | 98,305 | 20.3% |
| Middle School | 107,955 | 22.3% |
| High School | 105,943 | 21.9% |
| College / Undergraduate | 105,505 | 21.8% |
| Graduate / Professional | 18,659 | 3.8% |
| Total | 484,148 | 100.0% |
School Enrollment by Age by Funding Source in Area Code 208
Out of a total of 484,148 students who are enrolled in schools in Area Code 208, 86,631 (17.9%) attend a private institution, while the remaining 397,517 (82.1%) are enrolled in public schools. The age group of 3 to 4 year olds has the highest likelihood of being enrolled in private schools, with 9,330 (53.8% in the age bracket) enrolled. Conversely, the age group of 15 to 17 year olds has the lowest likelihood of being enrolled in a private school, with 70,387 (90.6% in the age bracket) attending a public institution.
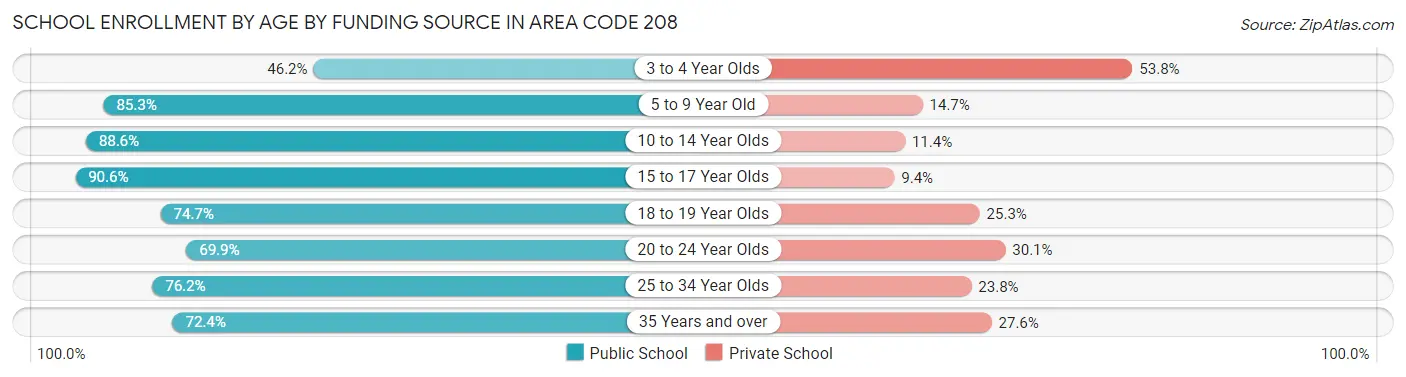
| Age Bracket | Public School | Private School |
| 3 to 4 Year Olds | 8,019 (46.2%) | 9,330 (53.8%) |
| 5 to 9 Year Old | 99,106 (85.3%) | 17,078 (14.7%) |
| 10 to 14 Year Olds | 117,863 (88.6%) | 15,192 (11.4%) |
| 15 to 17 Year Olds | 70,387 (90.6%) | 7,341 (9.4%) |
| 18 to 19 Year Olds | 31,917 (74.7%) | 10,825 (25.3%) |
| 20 to 24 Year Olds | 32,431 (69.9%) | 13,976 (30.1%) |
| 25 to 34 Year Olds | 22,066 (76.2%) | 6,890 (23.8%) |
| 35 Years and over | 15,740 (72.4%) | 5,987 (27.6%) |
| Total | 397,517 (82.1%) | 86,631 (17.9%) |
Educational Attainment by Field of Study in Area Code 208
Business (70,427 | 17.8%), education (55,010 | 13.9%), science & technology (46,792 | 11.8%), bio, nature & agricultural (34,738 | 8.8%), and arts & humanities (27,151 | 6.9%) are the most common fields of study among 395,802 individuals in Area Code 208 who have obtained a bachelor's degree or higher.
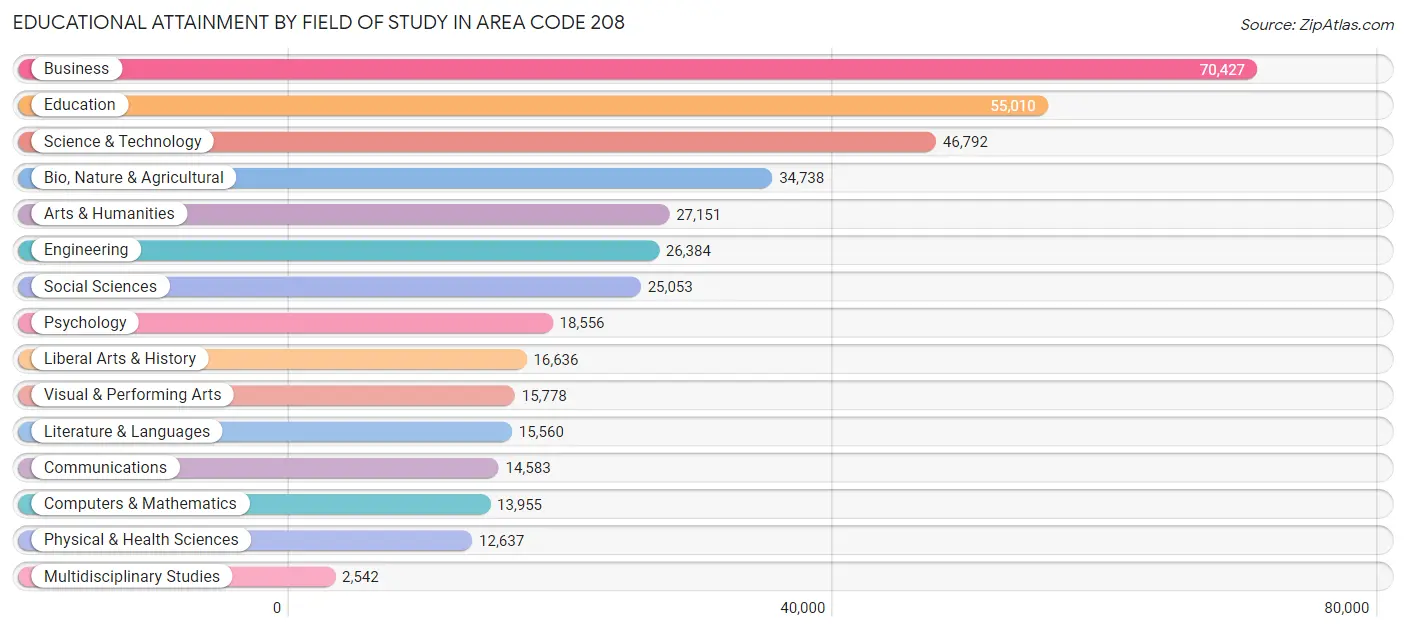
| Field of Study | # Graduates | % Graduates |
| Computers & Mathematics | 13,955 | 3.5% |
| Bio, Nature & Agricultural | 34,738 | 8.8% |
| Physical & Health Sciences | 12,637 | 3.2% |
| Psychology | 18,556 | 4.7% |
| Social Sciences | 25,053 | 6.3% |
| Engineering | 26,384 | 6.7% |
| Multidisciplinary Studies | 2,542 | 0.6% |
| Science & Technology | 46,792 | 11.8% |
| Business | 70,427 | 17.8% |
| Education | 55,010 | 13.9% |
| Literature & Languages | 15,560 | 3.9% |
| Liberal Arts & History | 16,636 | 4.2% |
| Visual & Performing Arts | 15,778 | 4.0% |
| Communications | 14,583 | 3.7% |
| Arts & Humanities | 27,151 | 6.9% |
| Total | 395,802 | 100.0% |
Transportation & Commute in Area Code 208
Vehicle Availability by Sex in Area Code 208
The most prevalent vehicle ownership categories in Area Code 208 are males with 2 vehicles (179,418, accounting for 38.4%) and females with 2 vehicles (144,295, making up 46.8%).
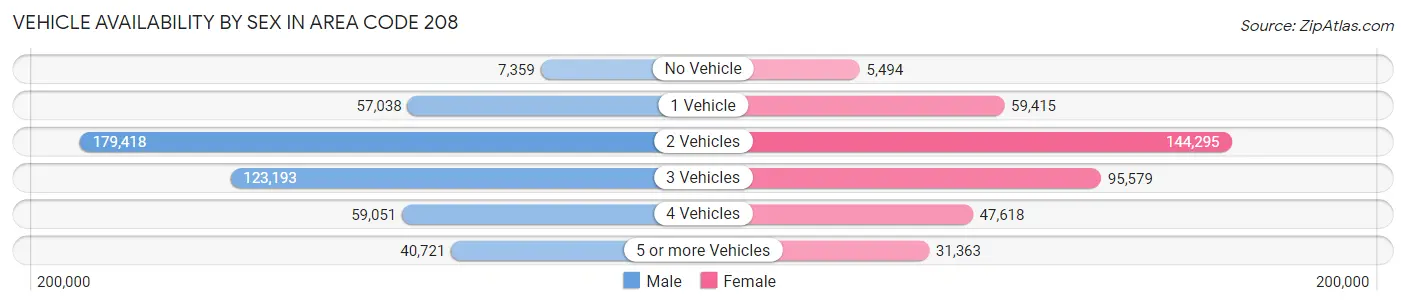
| Vehicles Available | Male | Female |
| No Vehicle | 7,359 (1.6%) | 5,494 (1.4%) |
| 1 Vehicle | 57,038 (12.2%) | 59,415 (15.5%) |
| 2 Vehicles | 179,418 (38.4%) | 144,295 (37.6%) |
| 3 Vehicles | 123,193 (26.4%) | 95,579 (24.9%) |
| 4 Vehicles | 59,051 (12.7%) | 47,618 (12.4%) |
| 5 or more Vehicles | 40,721 (8.7%) | 31,363 (8.2%) |
| Total | 466,780 (100.0%) | 383,764 (100.0%) |
Commute Time in Area Code 208
The most frequently occuring commute durations in Area Code 208 are 10 to 14 minutes (134,621 commuters, 17.5%), 15 to 19 minutes (131,201 commuters, 17.1%), and 5 to 9 minutes (114,883 commuters, 14.9%).
| Commute Time | # Commuters | % Commuters |
| Less than 5 Minutes | 41,506 | 5.4% |
| 5 to 9 Minutes | 114,883 | 14.9% |
| 10 to 14 Minutes | 134,621 | 17.5% |
| 15 to 19 Minutes | 131,201 | 17.1% |
| 20 to 24 Minutes | 105,990 | 13.8% |
| 25 to 29 Minutes | 44,913 | 5.8% |
| 30 to 34 Minutes | 80,899 | 10.5% |
| 35 to 39 Minutes | 18,217 | 2.4% |
| 40 to 44 Minutes | 18,303 | 2.4% |
| 45 to 59 Minutes | 40,661 | 5.3% |
| 60 to 89 Minutes | 24,196 | 3.2% |
| 90 or more Minutes | 13,703 | 1.8% |
Commute Time by Sex in Area Code 208
The most common commute times in Area Code 208 are 10 to 14 minutes (71,396 commuters, 16.7%) for males and 10 to 14 minutes (63,225 commuters, 18.5%) for females.
| Commute Time | Male | Female |
| Less than 5 Minutes | 23,029 (5.4%) | 18,477 (5.4%) |
| 5 to 9 Minutes | 58,044 (13.6%) | 56,839 (16.6%) |
| 10 to 14 Minutes | 71,396 (16.7%) | 63,225 (18.5%) |
| 15 to 19 Minutes | 71,252 (16.7%) | 59,949 (17.5%) |
| 20 to 24 Minutes | 58,965 (13.8%) | 47,025 (13.7%) |
| 25 to 29 Minutes | 24,228 (5.7%) | 20,685 (6.0%) |
| 30 to 34 Minutes | 47,980 (11.2%) | 32,919 (9.6%) |
| 35 to 39 Minutes | 10,439 (2.5%) | 7,778 (2.3%) |
| 40 to 44 Minutes | 10,376 (2.4%) | 7,927 (2.3%) |
| 45 to 59 Minutes | 24,981 (5.9%) | 15,680 (4.6%) |
| 60 to 89 Minutes | 16,464 (3.9%) | 7,732 (2.3%) |
| 90 or more Minutes | 9,645 (2.3%) | 4,058 (1.2%) |
Time of Departure to Work by Sex in Area Code 208
The most frequent times of departure to work in Area Code 208 are 7:00 AM to 7:29 AM (61,798, 14.5%) for males and 7:30 AM to 7:59 AM (56,864, 16.6%) for females.
| Time of Departure | Male | Female |
| 12:00 AM to 4:59 AM | 26,429 (6.2%) | 11,652 (3.4%) |
| 5:00 AM to 5:29 AM | 19,156 (4.5%) | 7,588 (2.2%) |
| 5:30 AM to 5:59 AM | 26,290 (6.2%) | 12,460 (3.6%) |
| 6:00 AM to 6:29 AM | 41,112 (9.6%) | 18,184 (5.3%) |
| 6:30 AM to 6:59 AM | 45,195 (10.6%) | 32,896 (9.6%) |
| 7:00 AM to 7:29 AM | 61,798 (14.5%) | 48,993 (14.3%) |
| 7:30 AM to 7:59 AM | 55,189 (12.9%) | 56,864 (16.6%) |
| 8:00 AM to 8:29 AM | 44,492 (10.4%) | 37,447 (10.9%) |
| 8:30 AM to 8:59 AM | 18,538 (4.3%) | 22,781 (6.7%) |
| 9:00 AM to 9:59 AM | 22,956 (5.4%) | 26,224 (7.7%) |
| 10:00 AM to 10:59 AM | 11,637 (2.7%) | 13,802 (4.0%) |
| 11:00 AM to 11:59 AM | 5,143 (1.2%) | 7,195 (2.1%) |
| 12:00 PM to 3:59 PM | 23,953 (5.6%) | 23,521 (6.9%) |
| 4:00 PM to 11:59 PM | 24,911 (5.8%) | 22,687 (6.6%) |
| Total | 426,799 (100.0%) | 342,294 (100.0%) |
Housing Occupancy in Area Code 208
Occupancy by Ownership in Area Code 208
Of the total 675,151 dwellings in Area Code 208, owner-occupied units account for 486,197 (72.0%), while renter-occupied units make up 188,954 (28.0%).
| Occupancy | # Housing Units | % Housing Units |
| Owner Occupied Housing Units | 486,197 | 72.0% |
| Renter-Occupied Housing Units | 188,954 | 28.0% |
| Total Occupied Housing Units | 675,151 | 100.0% |
Occupancy by Household Size in Area Code 208
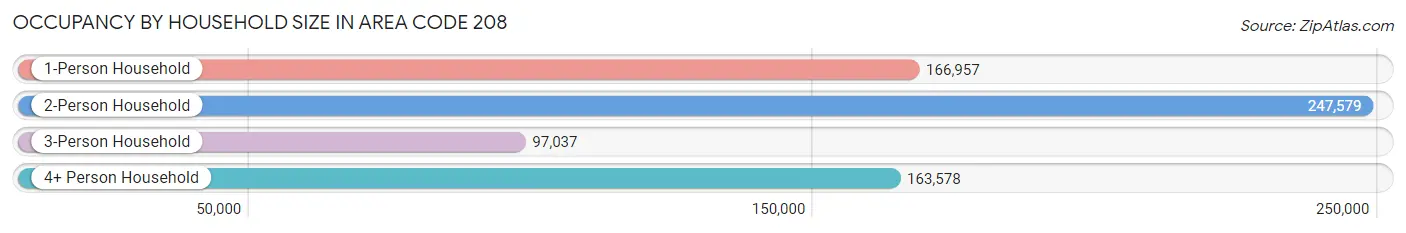
| Household Size | # Housing Units | % Housing Units |
| 1-Person Household | 166,957 | 24.7% |
| 2-Person Household | 247,579 | 36.7% |
| 3-Person Household | 97,037 | 14.4% |
| 4+ Person Household | 163,578 | 24.2% |
| Total Housing Units | 675,151 | 100.0% |
Occupancy by Ownership by Household Size in Area Code 208
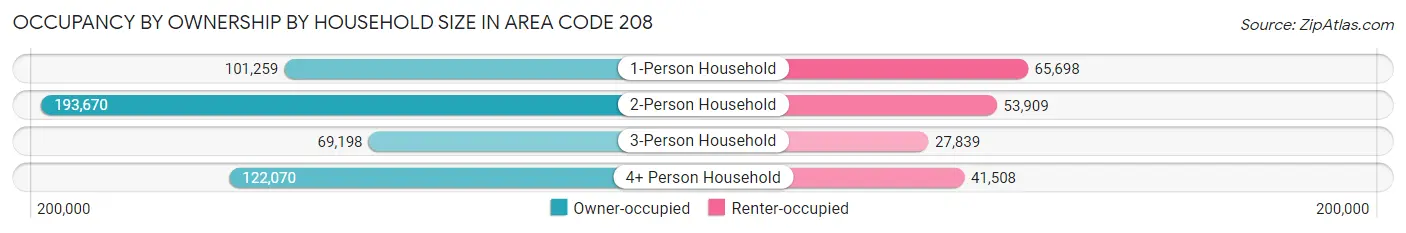
| Household Size | Owner-occupied | Renter-occupied |
| 1-Person Household | 101,259 (60.7%) | 65,698 (39.4%) |
| 2-Person Household | 193,670 (78.2%) | 53,909 (21.8%) |
| 3-Person Household | 69,198 (71.3%) | 27,839 (28.7%) |
| 4+ Person Household | 122,070 (74.6%) | 41,508 (25.4%) |
| Total Housing Units | 486,197 (72.0%) | 188,954 (28.0%) |
Occupancy by Educational Attainment in Area Code 208
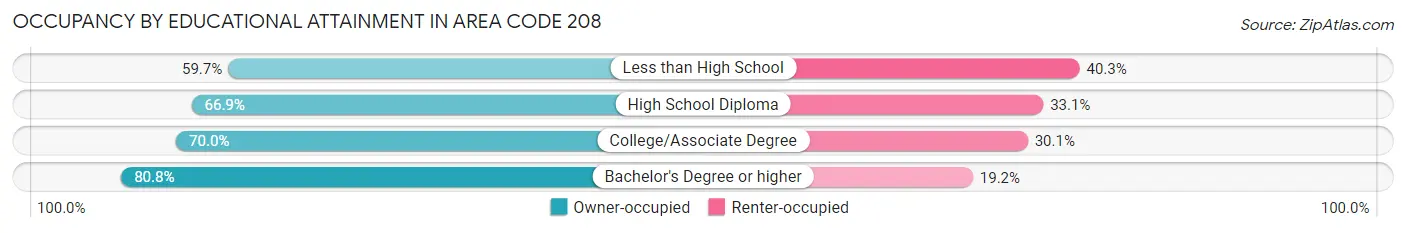
| Household Size | Owner-occupied | Renter-occupied |
| Less than High School | 28,885 (59.7%) | 19,522 (40.3%) |
| High School Diploma | 106,299 (66.9%) | 52,648 (33.1%) |
| College/Associate Degree | 174,276 (70.0%) | 74,875 (30.0%) |
| Bachelor's Degree or higher | 176,737 (80.8%) | 41,909 (19.2%) |
Occupancy by Age of Householder in Area Code 208
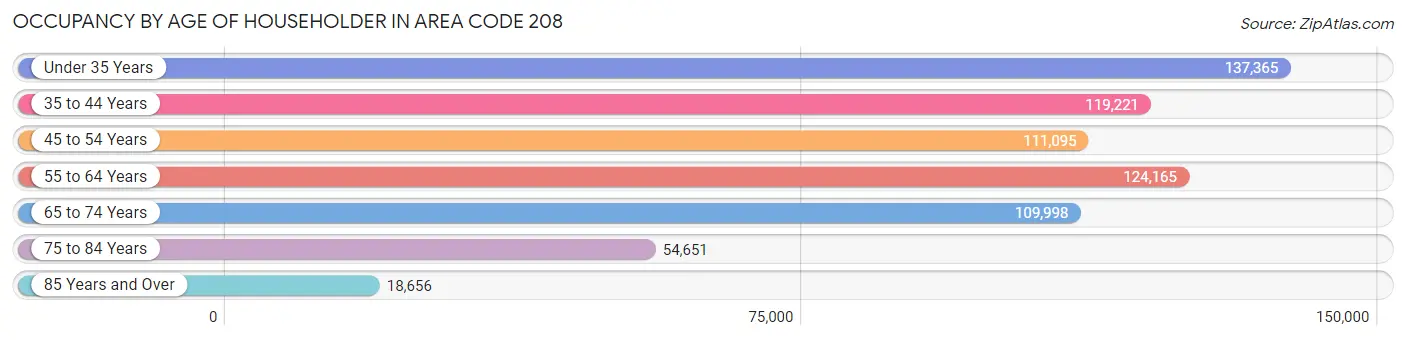
| Age Bracket | # Households | % Households |
| Under 35 Years | 137,365 | 20.3% |
| 35 to 44 Years | 119,221 | 17.7% |
| 45 to 54 Years | 111,095 | 16.5% |
| 55 to 64 Years | 124,165 | 18.4% |
| 65 to 74 Years | 109,998 | 16.3% |
| 75 to 84 Years | 54,651 | 8.1% |
| 85 Years and Over | 18,656 | 2.8% |
| Total | 675,151 | 100.0% |
Housing Finances in Area Code 208
Median Income by Occupancy in Area Code 208
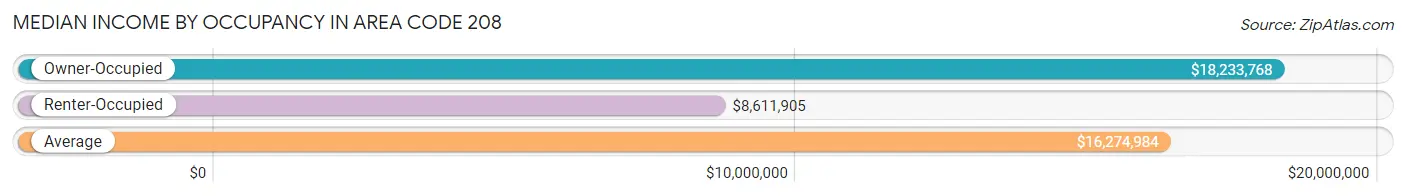
| Occupancy Type | # Households | Median Income |
| Owner-Occupied | 486,197 (72.0%) | $18,233,768 |
| Renter-Occupied | 188,954 (28.0%) | $8,611,905 |
| Average | 675,151 (100.0%) | $16,274,984 |
Occupancy by Householder Income Bracket in Area Code 208
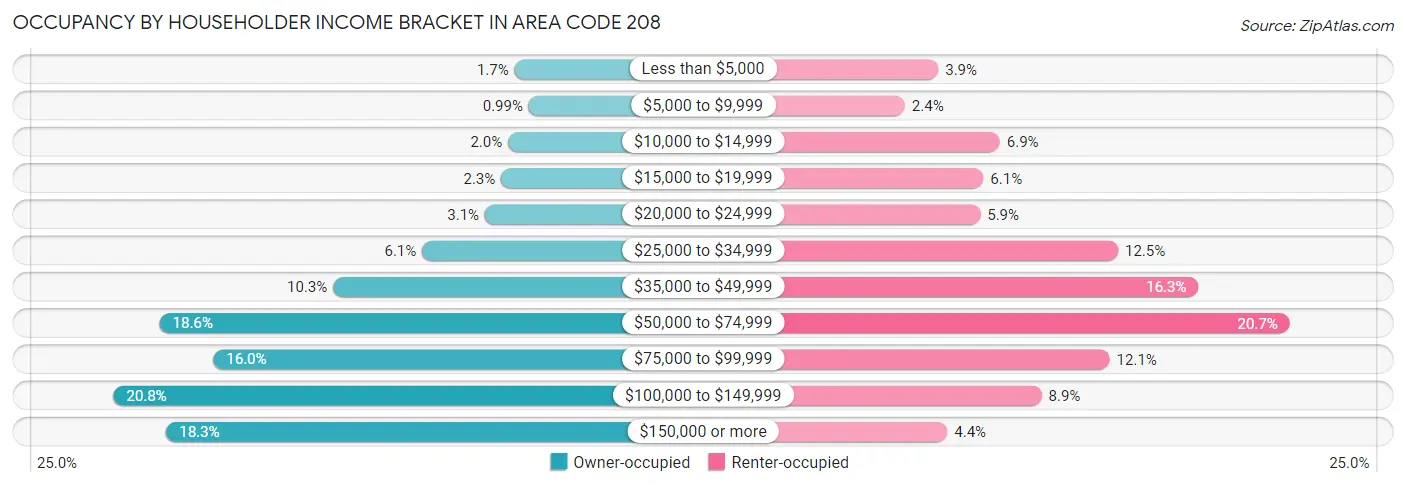
| Income Bracket | Owner-occupied | Renter-occupied |
| Less than $5,000 | 8,128 (1.7%) | 7,452 (3.9%) |
| $5,000 to $9,999 | 4,812 (1.0%) | 4,431 (2.4%) |
| $10,000 to $14,999 | 9,622 (2.0%) | 12,984 (6.9%) |
| $15,000 to $19,999 | 11,223 (2.3%) | 11,499 (6.1%) |
| $20,000 to $24,999 | 14,974 (3.1%) | 11,224 (5.9%) |
| $25,000 to $34,999 | 29,520 (6.1%) | 23,613 (12.5%) |
| $35,000 to $49,999 | 50,104 (10.3%) | 30,834 (16.3%) |
| $50,000 to $74,999 | 90,304 (18.6%) | 39,051 (20.7%) |
| $75,000 to $99,999 | 77,816 (16.0%) | 22,868 (12.1%) |
| $100,000 to $149,999 | 100,968 (20.8%) | 16,741 (8.9%) |
| $150,000 or more | 88,726 (18.2%) | 8,257 (4.4%) |
| Total | 486,197 (100.0%) | 188,954 (100.0%) |
Monthly Housing Cost Tiers in Area Code 208
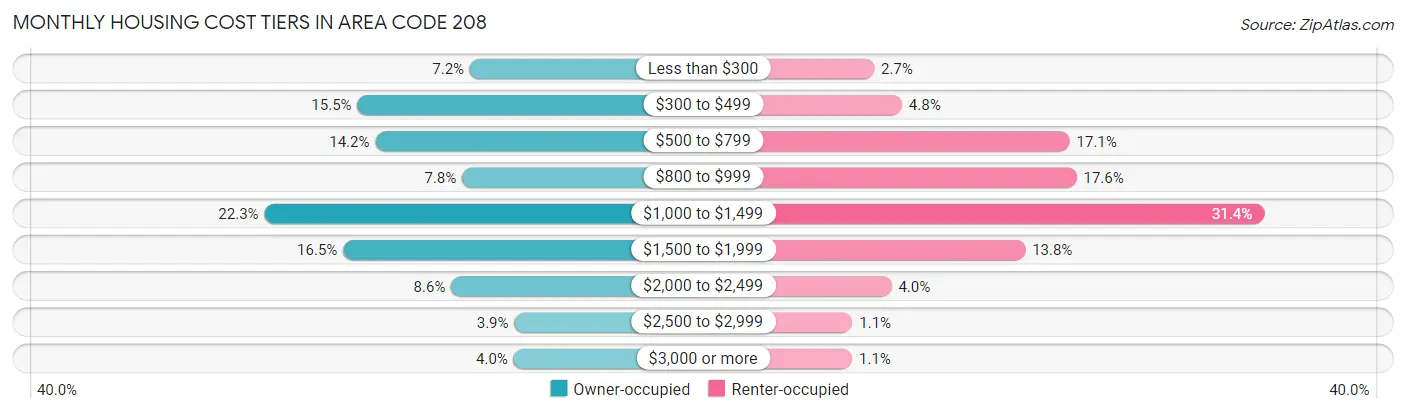
| Monthly Cost | Owner-occupied | Renter-occupied |
| Less than $300 | 34,998 (7.2%) | 5,085 (2.7%) |
| $300 to $499 | 75,290 (15.5%) | 8,978 (4.8%) |
| $500 to $799 | 68,872 (14.2%) | 32,302 (17.1%) |
| $800 to $999 | 37,810 (7.8%) | 33,272 (17.6%) |
| $1,000 to $1,499 | 108,633 (22.3%) | 59,366 (31.4%) |
| $1,500 to $1,999 | 80,396 (16.5%) | 26,136 (13.8%) |
| $2,000 to $2,499 | 41,726 (8.6%) | 7,526 (4.0%) |
| $2,500 to $2,999 | 19,120 (3.9%) | 2,080 (1.1%) |
| $3,000 or more | 19,352 (4.0%) | 2,037 (1.1%) |
| Total | 486,197 (100.0%) | 188,954 (100.0%) |
Physical Housing Characteristics in Area Code 208
Housing Structures in Area Code 208
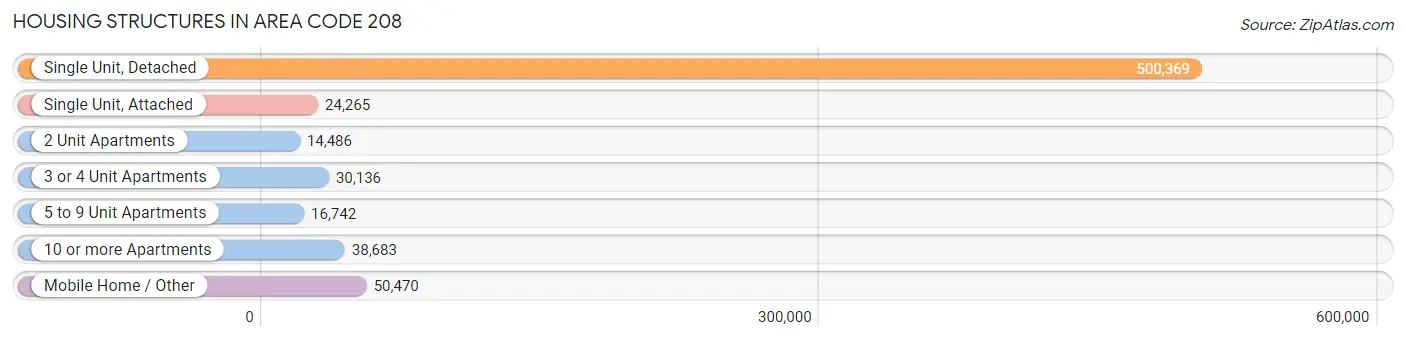
| Structure Type | # Housing Units | % Housing Units |
| Single Unit, Detached | 500,369 | 74.1% |
| Single Unit, Attached | 24,265 | 3.6% |
| 2 Unit Apartments | 14,486 | 2.1% |
| 3 or 4 Unit Apartments | 30,136 | 4.5% |
| 5 to 9 Unit Apartments | 16,742 | 2.5% |
| 10 or more Apartments | 38,683 | 5.7% |
| Mobile Home / Other | 50,470 | 7.5% |
| Total | 675,151 | 100.0% |
Housing Structures by Occupancy in Area Code 208
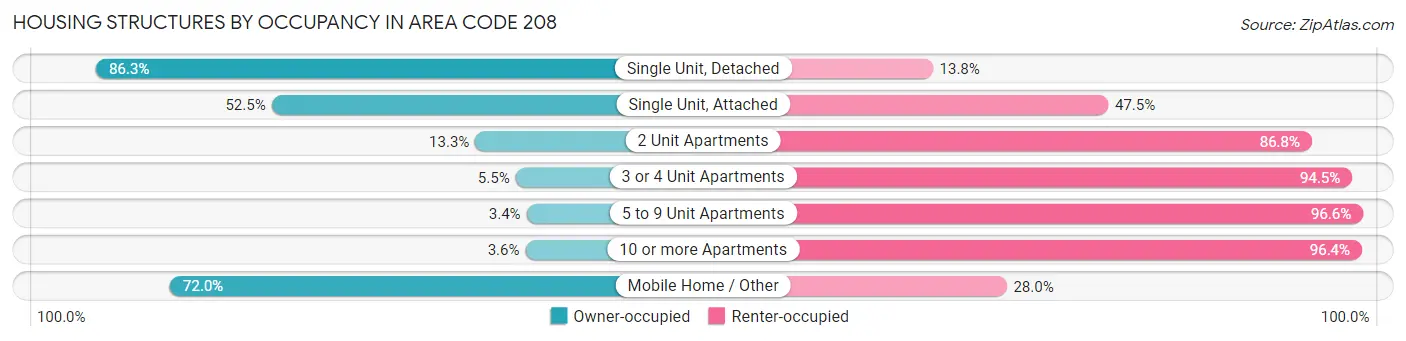
| Structure Type | Owner-occupied | Renter-occupied |
| Single Unit, Detached | 431,592 (86.3%) | 68,777 (13.8%) |
| Single Unit, Attached | 12,732 (52.5%) | 11,533 (47.5%) |
| 2 Unit Apartments | 1,919 (13.3%) | 12,567 (86.8%) |
| 3 or 4 Unit Apartments | 1,650 (5.5%) | 28,486 (94.5%) |
| 5 to 9 Unit Apartments | 564 (3.4%) | 16,178 (96.6%) |
| 10 or more Apartments | 1,393 (3.6%) | 37,290 (96.4%) |
| Mobile Home / Other | 36,347 (72.0%) | 14,123 (28.0%) |
| Total | 486,197 (72.0%) | 188,954 (28.0%) |
Housing Structures by Number of Rooms in Area Code 208
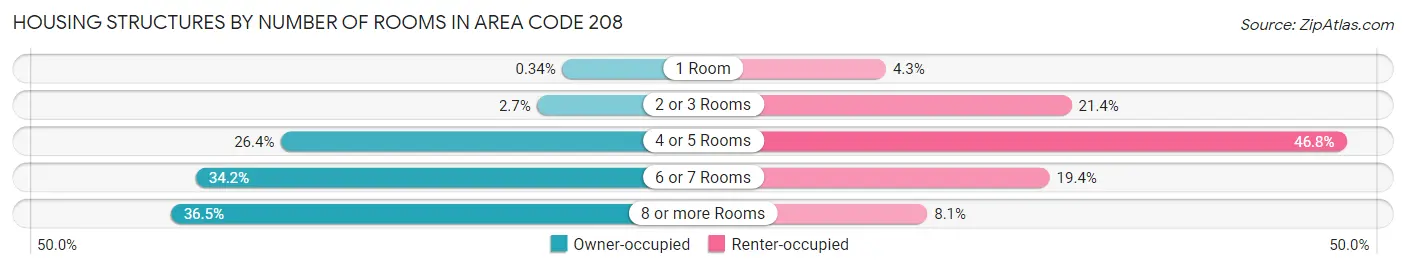
| Number of Rooms | Owner-occupied | Renter-occupied |
| 1 Room | 1,655 (0.3%) | 8,045 (4.3%) |
| 2 or 3 Rooms | 12,906 (2.6%) | 40,484 (21.4%) |
| 4 or 5 Rooms | 128,173 (26.4%) | 88,485 (46.8%) |
| 6 or 7 Rooms | 166,088 (34.2%) | 36,666 (19.4%) |
| 8 or more Rooms | 177,375 (36.5%) | 15,274 (8.1%) |
| Total | 486,197 (100.0%) | 188,954 (100.0%) |
Housing Structure by Heating Type in Area Code 208
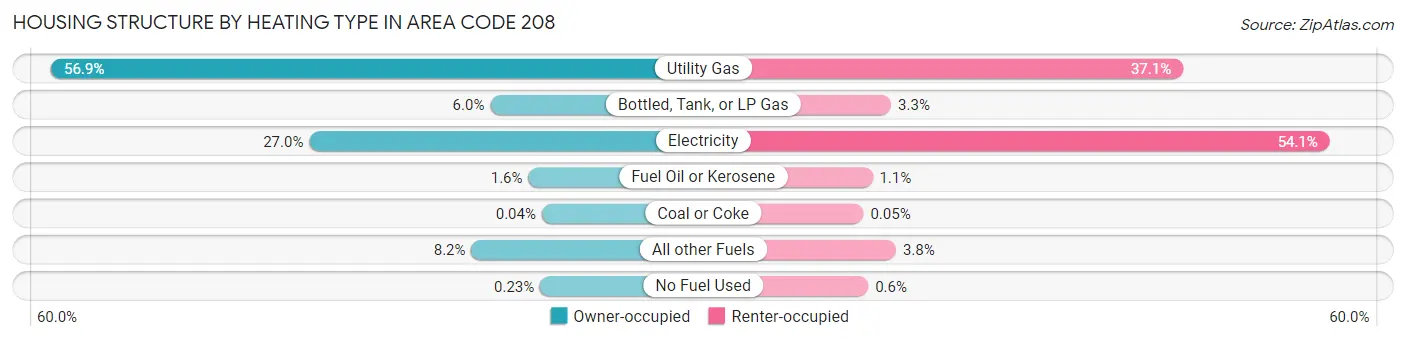
| Heating Type | Owner-occupied | Renter-occupied |
| Utility Gas | 276,795 (56.9%) | 70,080 (37.1%) |
| Bottled, Tank, or LP Gas | 29,216 (6.0%) | 6,165 (3.3%) |
| Electricity | 131,261 (27.0%) | 102,223 (54.1%) |
| Fuel Oil or Kerosene | 7,741 (1.6%) | 2,051 (1.1%) |
| Coal or Coke | 199 (0.0%) | 88 (0.1%) |
| All other Fuels | 39,856 (8.2%) | 7,217 (3.8%) |
| No Fuel Used | 1,129 (0.2%) | 1,130 (0.6%) |
| Total | 486,197 (100.0%) | 188,954 (100.0%) |
Household Vehicle Usage in Area Code 208
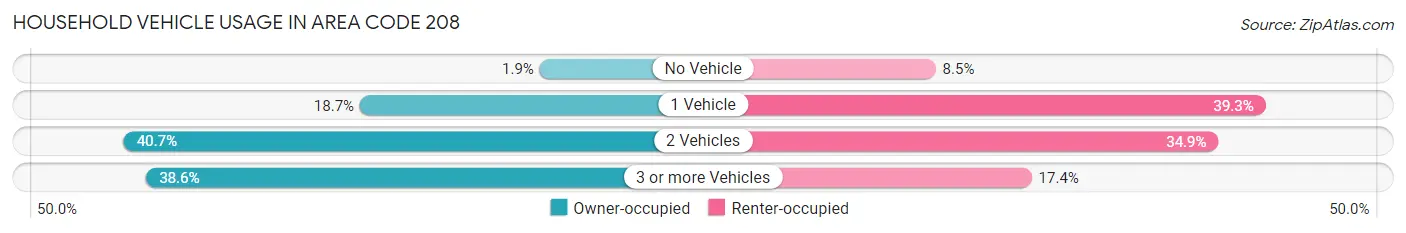
| Vehicles per Household | Owner-occupied | Renter-occupied |
| No Vehicle | 9,326 (1.9%) | 15,999 (8.5%) |
| 1 Vehicle | 90,907 (18.7%) | 74,175 (39.3%) |
| 2 Vehicles | 198,082 (40.7%) | 65,842 (34.8%) |
| 3 or more Vehicles | 187,882 (38.6%) | 32,938 (17.4%) |
| Total | 486,197 (100.0%) | 188,954 (100.0%) |
Real Estate & Mortgages in Area Code 208
Real Estate and Mortgage Overview in Area Code 208
| Characteristic | Without Mortgage | With Mortgage |
| Housing Units | 176,762 | 309,435 |
| Median Property Value | $63,319,299 | $69,556,900 |
| Median Household Income | $14,054,357 | $65,022 |
| Monthly Housing Costs | $104,870 | $19,012 |
| Real Estate Taxes | $350,334 | $8,341 |
Property Value by Mortgage Status in Area Code 208
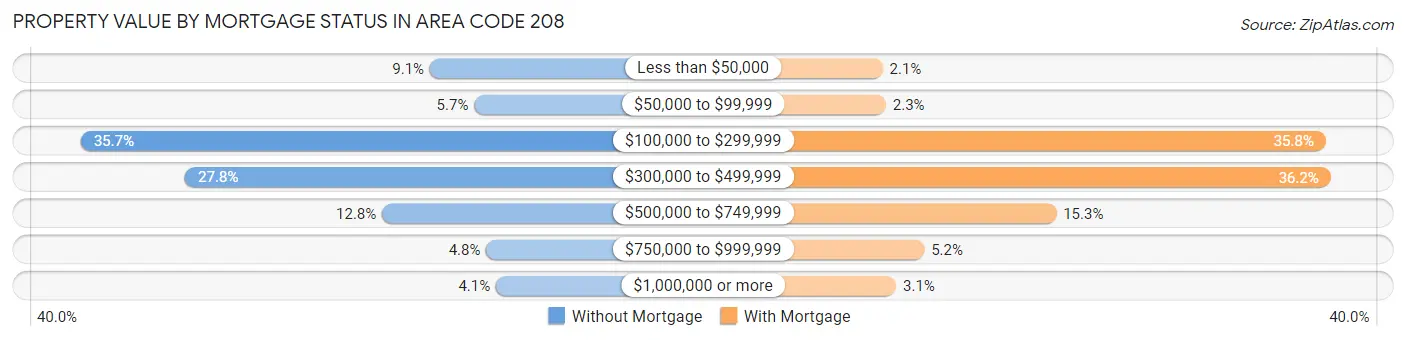
| Property Value | Without Mortgage | With Mortgage |
| Less than $50,000 | 16,129 (9.1%) | 6,372 (2.1%) |
| $50,000 to $99,999 | 10,139 (5.7%) | 7,134 (2.3%) |
| $100,000 to $299,999 | 63,131 (35.7%) | 110,832 (35.8%) |
| $300,000 to $499,999 | 49,081 (27.8%) | 112,018 (36.2%) |
| $500,000 to $749,999 | 22,546 (12.8%) | 47,319 (15.3%) |
| $750,000 to $999,999 | 8,526 (4.8%) | 16,184 (5.2%) |
| $1,000,000 or more | 7,210 (4.1%) | 9,576 (3.1%) |
| Total | 176,762 (100.0%) | 309,435 (100.0%) |
Household Income by Mortgage Status in Area Code 208
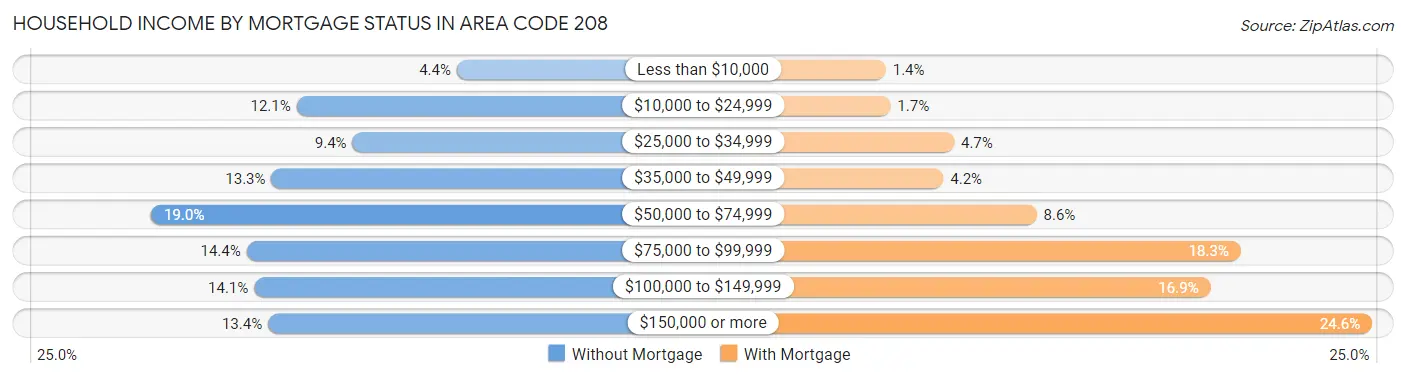
| Household Income | Without Mortgage | With Mortgage |
| Less than $10,000 | 7,811 (4.4%) | 4,470 (1.4%) |
| $10,000 to $24,999 | 21,293 (12.0%) | 5,129 (1.7%) |
| $25,000 to $34,999 | 16,594 (9.4%) | 14,526 (4.7%) |
| $35,000 to $49,999 | 23,417 (13.3%) | 12,926 (4.2%) |
| $50,000 to $74,999 | 33,552 (19.0%) | 26,687 (8.6%) |
| $75,000 to $99,999 | 25,512 (14.4%) | 56,752 (18.3%) |
| $100,000 to $149,999 | 24,879 (14.1%) | 52,304 (16.9%) |
| $150,000 or more | 23,704 (13.4%) | 76,089 (24.6%) |
| Total | 176,762 (100.0%) | 309,435 (100.0%) |
Property Value to Household Income Ratio in Area Code 208
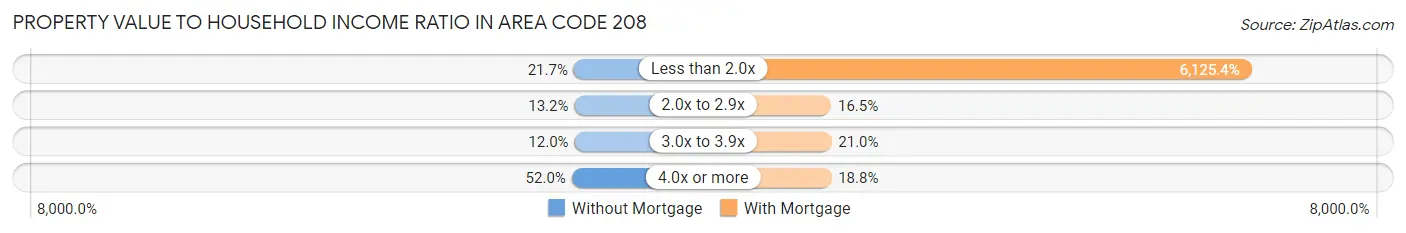
| Value-to-Income Ratio | Without Mortgage | With Mortgage |
| Less than 2.0x | 38,290 (21.7%) | 18,953,973 (6,125.4%) |
| 2.0x to 2.9x | 23,269 (13.2%) | 51,027 (16.5%) |
| 3.0x to 3.9x | 21,203 (12.0%) | 64,983 (21.0%) |
| 4.0x or more | 91,932 (52.0%) | 58,266 (18.8%) |
| Total | 176,762 (100.0%) | 309,435 (100.0%) |
Real Estate Taxes by Mortgage Status in Area Code 208
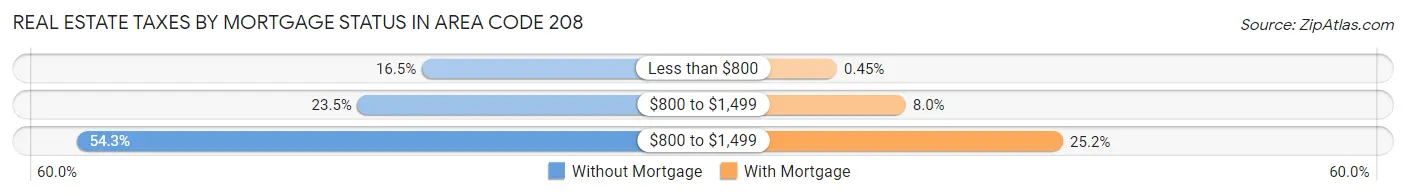
| Property Taxes | Without Mortgage | With Mortgage |
| Less than $800 | 29,074 (16.5%) | 1,401 (0.4%) |
| $800 to $1,499 | 41,532 (23.5%) | 24,696 (8.0%) |
| $800 to $1,499 | 95,973 (54.3%) | 78,042 (25.2%) |
| Total | 176,762 (100.0%) | 309,435 (100.0%) |
Health & Disability in Area Code 208
Health Insurance Coverage by Age in Area Code 208
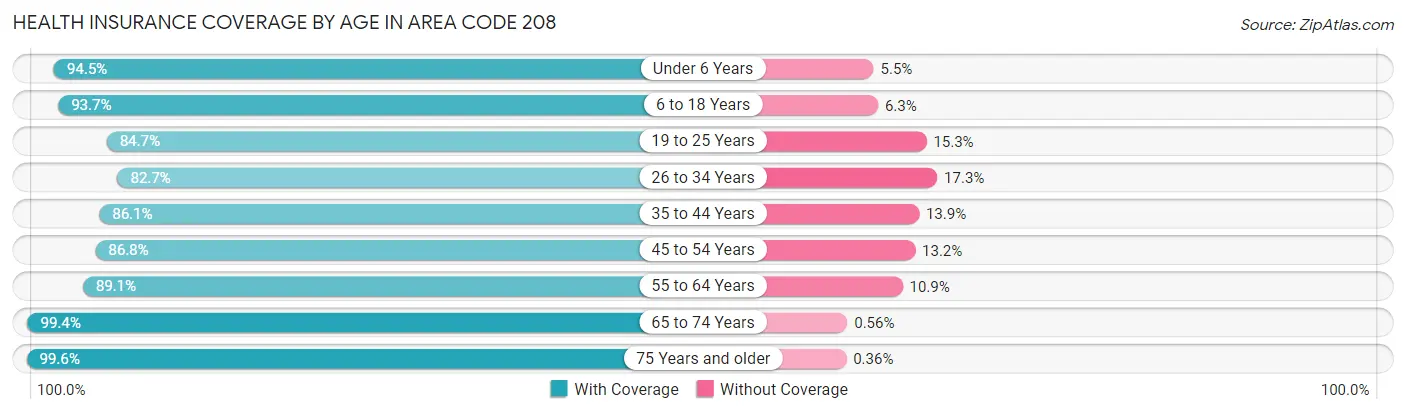
| Age Bracket | With Coverage | Without Coverage |
| Under 6 Years | 129,951 (94.5%) | 7,515 (5.5%) |
| 6 to 18 Years | 327,718 (93.7%) | 21,957 (6.3%) |
| 19 to 25 Years | 147,352 (84.7%) | 26,659 (15.3%) |
| 26 to 34 Years | 174,130 (82.7%) | 36,473 (17.3%) |
| 35 to 44 Years | 201,600 (86.1%) | 32,628 (13.9%) |
| 45 to 54 Years | 179,348 (86.8%) | 27,285 (13.2%) |
| 55 to 64 Years | 196,268 (89.1%) | 23,910 (10.9%) |
| 65 to 74 Years | 181,110 (99.4%) | 1,026 (0.6%) |
| 75 Years and older | 112,296 (99.6%) | 403 (0.4%) |
| Total | 1,649,773 (90.3%) | 177,856 (9.7%) |
Health Insurance Coverage by Citizenship Status in Area Code 208
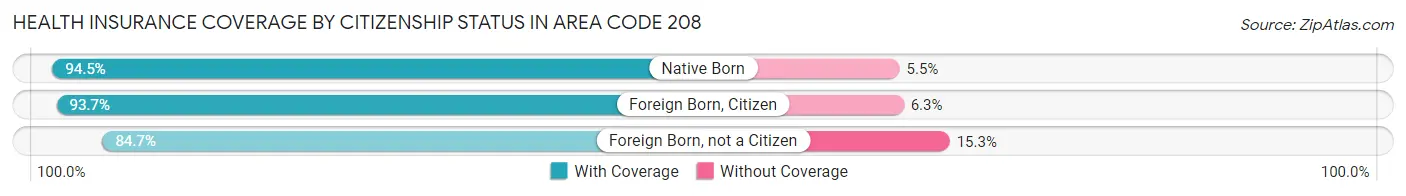
| Citizenship Status | With Coverage | Without Coverage |
| Native Born | 129,951 (94.5%) | 7,515 (5.5%) |
| Foreign Born, Citizen | 327,718 (93.7%) | 21,957 (6.3%) |
| Foreign Born, not a Citizen | 147,352 (84.7%) | 26,659 (15.3%) |
Health Insurance Coverage by Household Income in Area Code 208
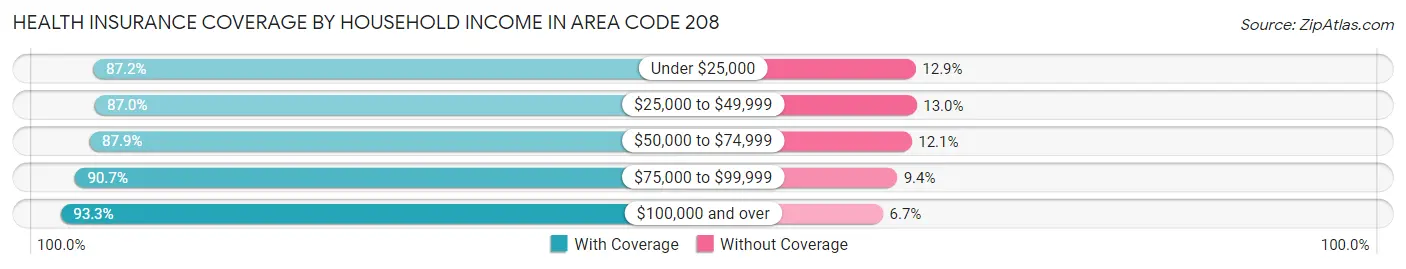
| Household Income | With Coverage | Without Coverage |
| Under $25,000 | 146,671 (87.2%) | 21,634 (12.9%) |
| $25,000 to $49,999 | 252,084 (87.0%) | 37,743 (13.0%) |
| $50,000 to $74,999 | 301,820 (87.9%) | 41,498 (12.1%) |
| $75,000 to $99,999 | 266,776 (90.6%) | 27,510 (9.3%) |
| $100,000 and over | 657,894 (93.3%) | 47,309 (6.7%) |
Public vs Private Health Insurance Coverage by Age in Area Code 208
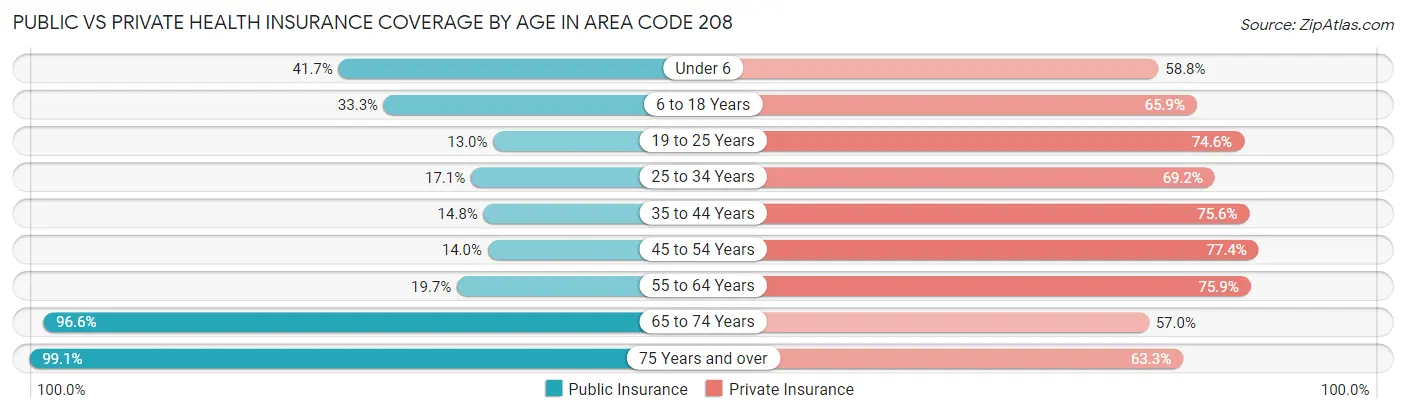
| Age Bracket | Public Insurance | Private Insurance |
| Under 6 | 57,335 (41.7%) | 80,774 (58.8%) |
| 6 to 18 Years | 116,460 (33.3%) | 230,372 (65.9%) |
| 19 to 25 Years | 22,605 (13.0%) | 129,877 (74.6%) |
| 25 to 34 Years | 36,083 (17.1%) | 145,757 (69.2%) |
| 35 to 44 Years | 34,649 (14.8%) | 177,177 (75.6%) |
| 45 to 54 Years | 28,974 (14.0%) | 159,876 (77.4%) |
| 55 to 64 Years | 43,422 (19.7%) | 167,024 (75.9%) |
| 65 to 74 Years | 175,861 (96.6%) | 103,759 (57.0%) |
| 75 Years and over | 111,735 (99.1%) | 71,389 (63.3%) |
| Total | 627,124 (34.3%) | 1,266,005 (69.3%) |
Disability Status by Sex by Age in Area Code 208
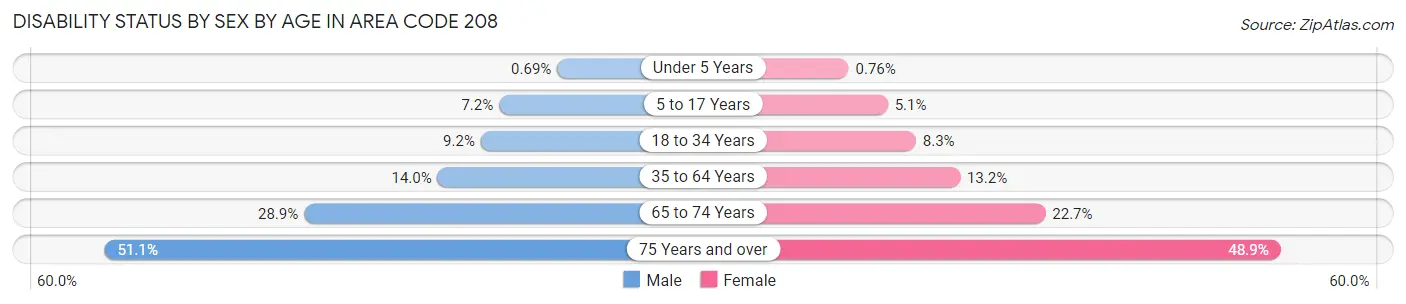
| Age Bracket | Male | Female |
| Under 5 Years | 398 (0.7%) | 416 (0.8%) |
| 5 to 17 Years | 12,567 (7.2%) | 8,490 (5.1%) |
| 18 to 34 Years | 19,280 (9.2%) | 17,156 (8.3%) |
| 35 to 64 Years | 46,616 (14.0%) | 43,194 (13.2%) |
| 65 to 74 Years | 25,779 (28.9%) | 21,055 (22.7%) |
| 75 Years and over | 26,202 (51.1%) | 30,008 (48.9%) |
Disability Class by Sex by Age in Area Code 208
Disability Class: Hearing Difficulty
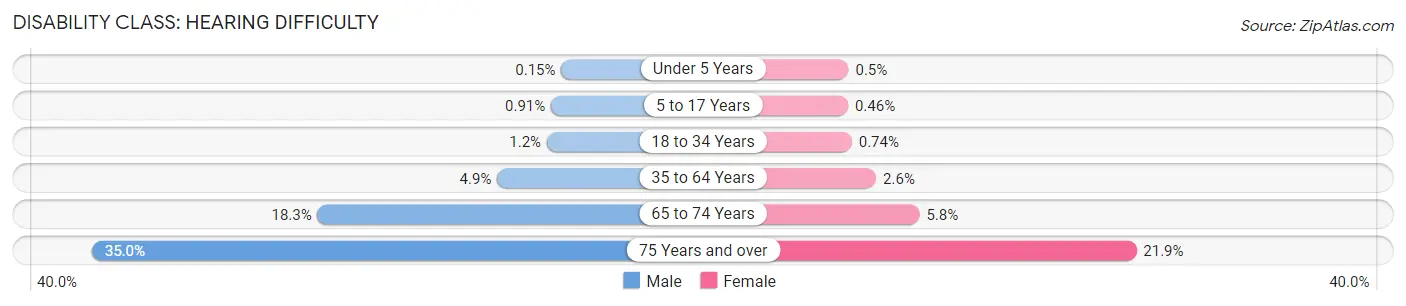
| Age Bracket | Male | Female |
| Under 5 Years | 88 (0.2%) | 276 (0.5%) |
| 5 to 17 Years | 1,603 (0.9%) | 756 (0.5%) |
| 18 to 34 Years | 2,550 (1.2%) | 1,549 (0.7%) |
| 35 to 64 Years | 16,337 (4.9%) | 8,373 (2.5%) |
| 65 to 74 Years | 16,287 (18.2%) | 5,356 (5.8%) |
| 75 Years and over | 17,955 (35.0%) | 13,431 (21.9%) |
Disability Class: Vision Difficulty
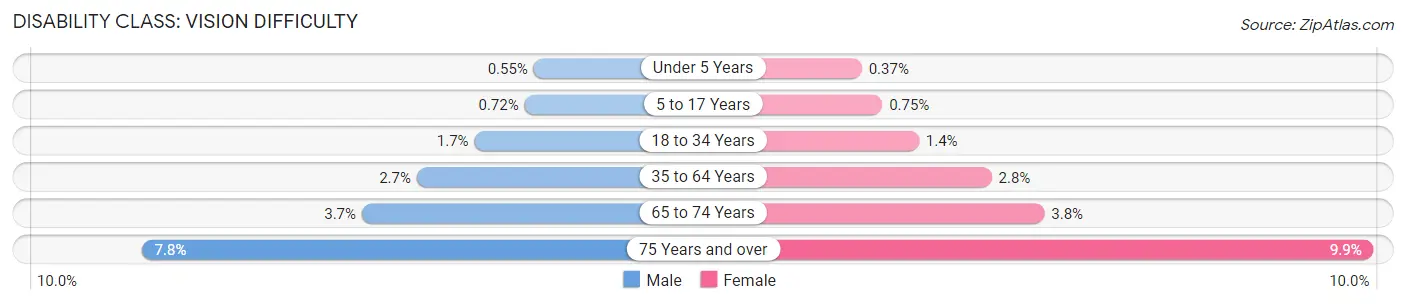
| Age Bracket | Male | Female |
| Under 5 Years | 317 (0.5%) | 201 (0.4%) |
| 5 to 17 Years | 1,256 (0.7%) | 1,241 (0.7%) |
| 18 to 34 Years | 3,458 (1.7%) | 2,967 (1.4%) |
| 35 to 64 Years | 9,047 (2.7%) | 9,136 (2.8%) |
| 65 to 74 Years | 3,335 (3.7%) | 3,496 (3.8%) |
| 75 Years and over | 4,017 (7.8%) | 6,061 (9.9%) |
Disability Class: Cognitive Difficulty
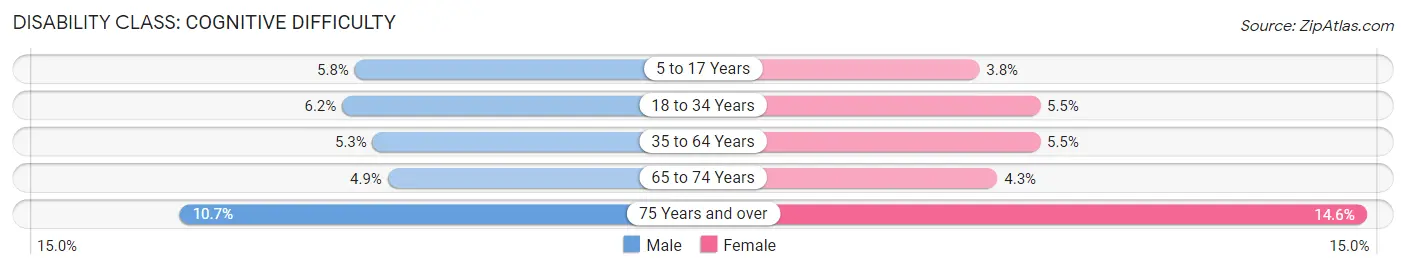
| Age Bracket | Male | Female |
| 5 to 17 Years | 10,200 (5.8%) | 6,354 (3.8%) |
| 18 to 34 Years | 12,924 (6.2%) | 11,486 (5.5%) |
| 35 to 64 Years | 17,666 (5.3%) | 18,115 (5.5%) |
| 65 to 74 Years | 4,364 (4.9%) | 4,021 (4.3%) |
| 75 Years and over | 5,477 (10.7%) | 8,973 (14.6%) |
Disability Class: Ambulatory Difficulty
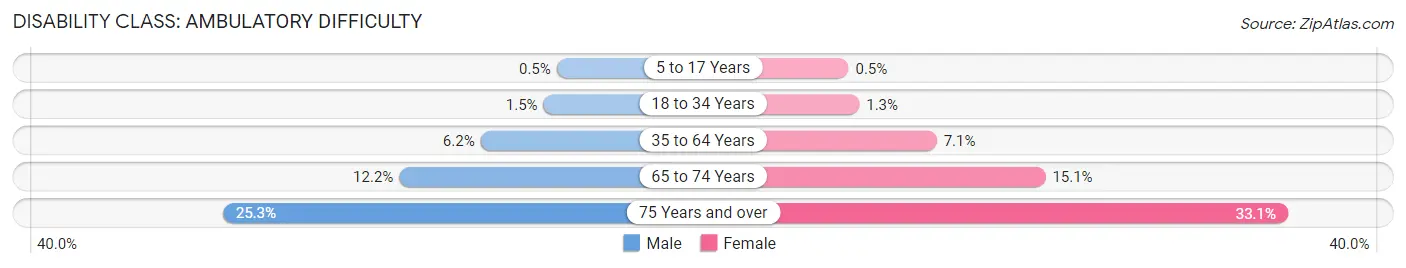
| Age Bracket | Male | Female |
| 5 to 17 Years | 878 (0.5%) | 829 (0.5%) |
| 18 to 34 Years | 3,101 (1.5%) | 2,713 (1.3%) |
| 35 to 64 Years | 20,472 (6.1%) | 23,143 (7.0%) |
| 65 to 74 Years | 10,877 (12.2%) | 14,045 (15.1%) |
| 75 Years and over | 12,965 (25.3%) | 20,336 (33.1%) |
Disability Class: Self-Care Difficulty
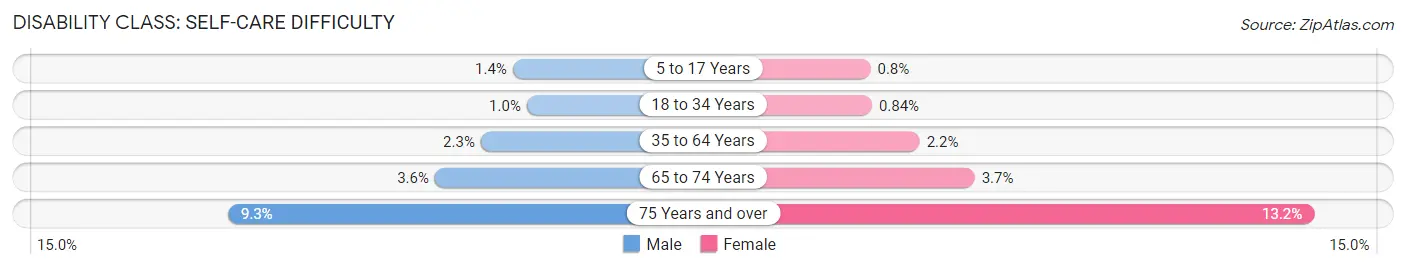
| Age Bracket | Male | Female |
| 5 to 17 Years | 2,478 (1.4%) | 1,330 (0.8%) |
| 18 to 34 Years | 2,129 (1.0%) | 1,754 (0.8%) |
| 35 to 64 Years | 7,657 (2.3%) | 7,127 (2.2%) |
| 65 to 74 Years | 3,194 (3.6%) | 3,435 (3.7%) |
| 75 Years and over | 4,787 (9.3%) | 8,078 (13.2%) |
Technology Access in Area Code 208
Computing Device Access in Area Code 208
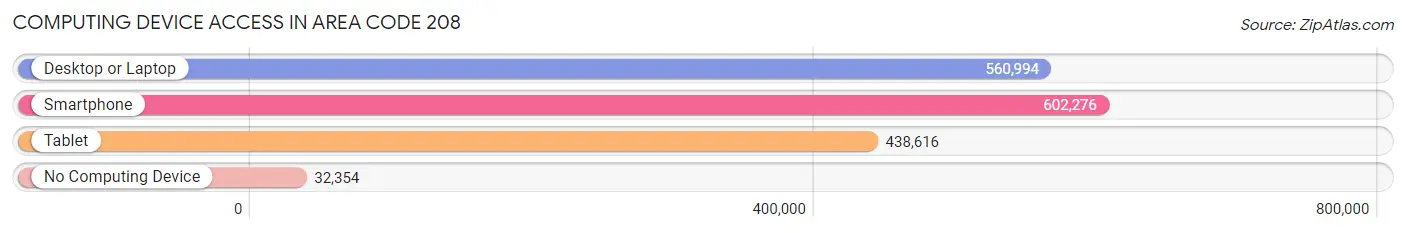
| Device Type | # Households | % Households |
| Desktop or Laptop | 560,994 | 83.1% |
| Smartphone | 602,276 | 89.2% |
| Tablet | 438,616 | 65.0% |
| No Computing Device | 32,354 | 4.8% |
| Total | 675,151 | 100.0% |
Internet Access in Area Code 208
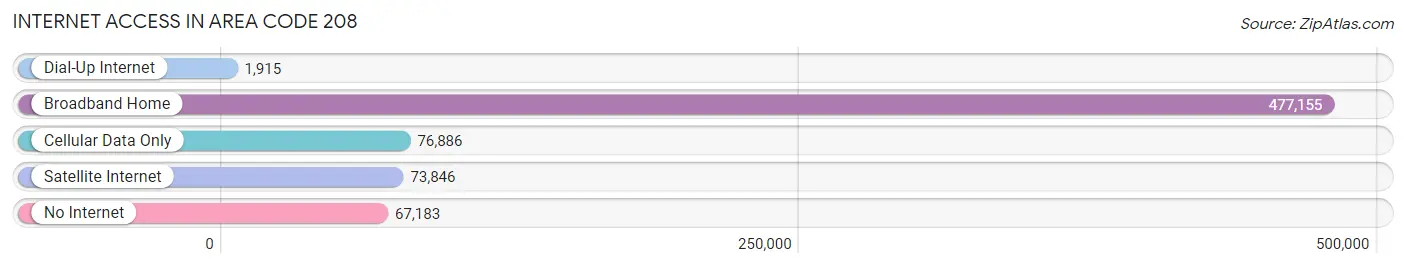
| Internet Type | # Households | % Households |
| Dial-Up Internet | 1,915 | 0.3% |
| Broadband Home | 477,155 | 70.7% |
| Cellular Data Only | 76,886 | 11.4% |
| Satellite Internet | 73,846 | 10.9% |
| No Internet | 67,183 | 10.0% |
| Total | 675,151 | 100.0% |
Area Code 208 Summary
Geography
Area code 208 is located in the northwestern United States, covering the state of Idaho. It is bordered by the states of Montana, Wyoming, Utah, and Nevada, as well as the Canadian province of British Columbia.
Social
Area code 208 is home to a variety of cultures and lifestyles. The state of Idaho is known for its outdoor recreation opportunities, and the area code is home to many outdoor enthusiasts. The area is also home to a variety of religious and ethnic backgrounds, making it a diverse and welcoming place to live.
Economics
Area code 208 is home to a variety of industries, including agriculture, manufacturing, and technology. The area is also home to a number of universities and colleges, making it a great place for students to pursue higher education.
Demographics
Area code 208 is home to a population of over 1.7 million people. The population is largely white, with a smaller percentage of African Americans, Asians, and Hispanics. The median household income in the area is around $50,000, and the unemployment rate is around 4%.
Common Questions
What is Per Capita Income in Area Code 208?
Per Capita income in Area Code 208 is $32,751.
What is the Median Family Income in Area Code 208?
Median Family Income in Area Code 208 is $78,414.
What is the Median Household income in Area Code 208?
Median Household Income in Area Code 208 is $66,158.
What is Income or Wage Gap in Area Code 208?
Income or Wage Gap in Area Code 208 is 38.5%.
Women in Area Code 208 earn 61.5 cents for every dollar earned by a man.
What is Family Income Deficit in Area Code 208?
Family Income Deficit in Area Code 208 is $10,404.
Families that are below poverty line in Area Code 208 earn $10,404 less on average than the poverty threshold level.
What is Inequality or Gini Index in Area Code 208?
Inequality or Gini Index in Area Code 208 is 104.03.
What is the Total Population of Area Code 208?
Total Population of Area Code 208 is 1,853,879.
What is the Total Male Population of Area Code 208?
Total Male Population of Area Code 208 is 933,627.
What is the Total Female Population of Area Code 208?
Total Female Population of Area Code 208 is 920,252.
What is the Ratio of Males per 100 Females in Area Code 208?
There are 101.45 Males per 100 Females in Area Code 208.
What is the Ratio of Females per 100 Males in Area Code 208?
There are 98.57 Females per 100 Males in Area Code 208.
What is the Median Population Age in Area Code 208?
Median Population Age in Area Code 208 is 44.2 Years.
What is the Average Family Size in Area Code 208
Average Family Size in Area Code 208 is 3.2 People.
What is the Average Household Size in Area Code 208
Average Household Size in Area Code 208 is 2.7 People.
How Large is the Labor Force in Area Code 208?
There are 827,688 People in the Labor Forcein in Area Code 208.
What is the Percentage of People in the Labor Force in Area Code 208?
57.0% of People are in the Labor Force in Area Code 208.
What is the Unemployment Rate in Area Code 208?
Unemployment Rate in Area Code 208 is 5.0%.