Rathdrum, ID Map & Demographics
Rathdrum Map
Rathdrum Overview
$34,508
PER CAPITA INCOME
$83,827
AVG FAMILY INCOME
$80,934
AVG HOUSEHOLD INCOME
31.3%
WAGE / INCOME GAP [ % ]
68.7¢/ $1
WAGE / INCOME GAP [ $ ]
0.36
INEQUALITY / GINI INDEX
9,556
TOTAL POPULATION
5,228
MALE POPULATION
4,328
FEMALE POPULATION
120.79
MALES / 100 FEMALES
82.79
FEMALES / 100 MALES
36.2
MEDIAN AGE
3.1
AVG FAMILY SIZE
2.8
AVG HOUSEHOLD SIZE
5,232
LABOR FORCE [ PEOPLE ]
69.1%
PERCENT IN LABOR FORCE
4.6%
UNEMPLOYMENT RATE
Rathdrum Zip Codes
Rathdrum Area Codes
Income in Rathdrum
Income Overview in Rathdrum
Per Capita Income in Rathdrum is $34,508, while median incomes of families and households are $83,827 and $80,934 respectively.
| Characteristic | Number | Measure |
| Per Capita Income | 9,556 | $34,508 |
| Median Family Income | 2,570 | $83,827 |
| Mean Family Income | 2,570 | $97,058 |
| Median Household Income | 3,454 | $80,934 |
| Mean Household Income | 3,454 | $92,689 |
| Income Deficit | 2,570 | $0 |
| Wage / Income Gap (%) | 9,556 | 31.29% |
| Wage / Income Gap ($) | 9,556 | 68.71¢ per $1 |
| Gini / Inequality Index | 9,556 | 0.36 |
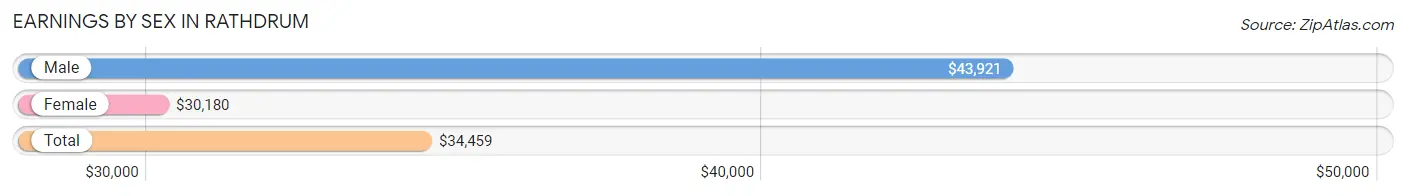
Earnings by Sex in Rathdrum
Average Earnings in Rathdrum are $34,459, $43,921 for men and $30,180 for women, a difference of 31.3%.
| Sex | Number | Average Earnings |
| Male | 3,336 (60.9%) | $43,921 |
| Female | 2,146 (39.2%) | $30,180 |
| Total | 5,482 (100.0%) | $34,459 |
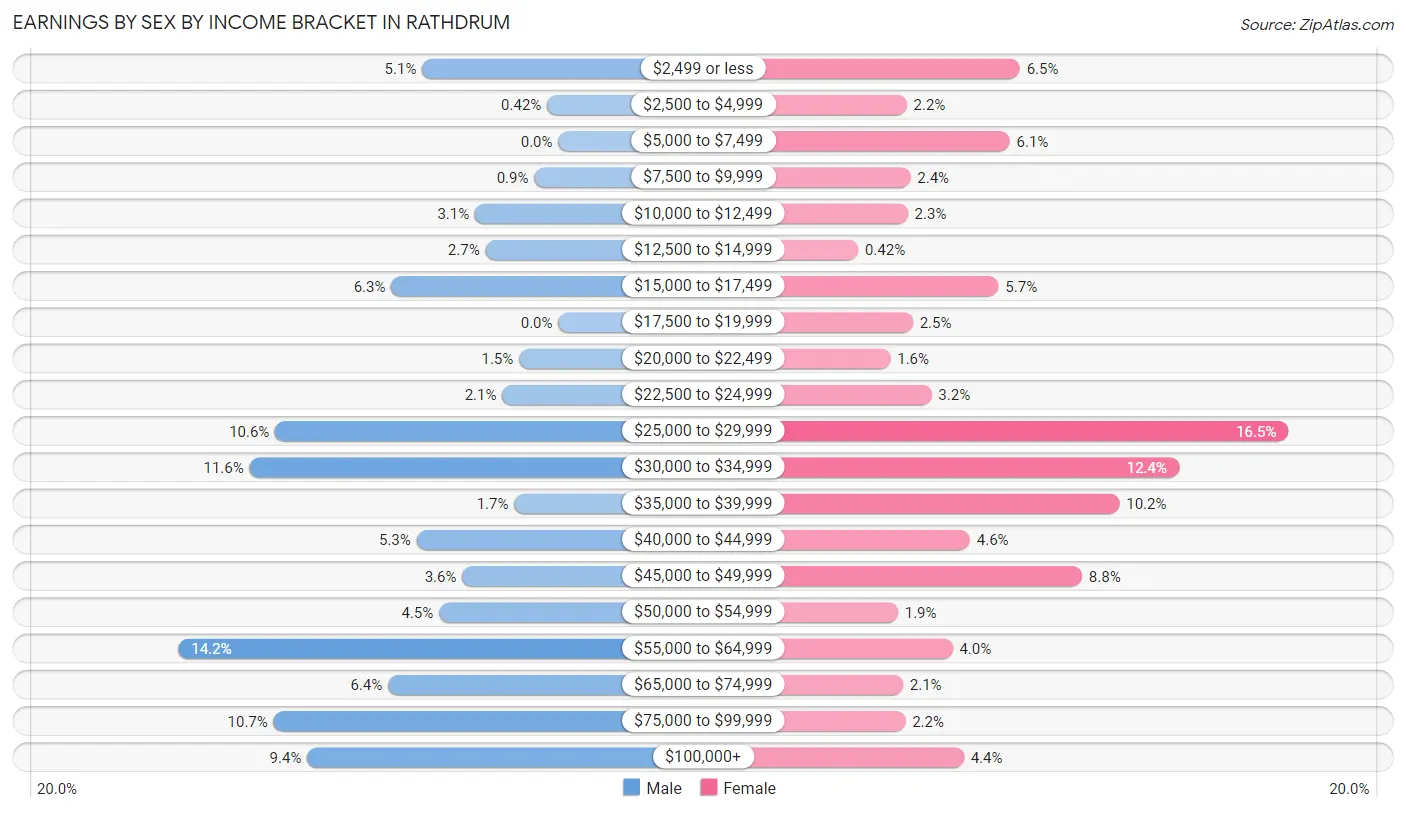
Earnings by Sex by Income Bracket in Rathdrum
The most common earnings brackets in Rathdrum are $55,000 to $64,999 for men (475 | 14.2%) and $25,000 to $29,999 for women (355 | 16.5%).
| Income | Male | Female |
| $2,499 or less | 170 (5.1%) | 139 (6.5%) |
| $2,500 to $4,999 | 14 (0.4%) | 48 (2.2%) |
| $5,000 to $7,499 | 0 (0.0%) | 131 (6.1%) |
| $7,500 to $9,999 | 30 (0.9%) | 51 (2.4%) |
| $10,000 to $12,499 | 104 (3.1%) | 49 (2.3%) |
| $12,500 to $14,999 | 91 (2.7%) | 9 (0.4%) |
| $15,000 to $17,499 | 209 (6.3%) | 122 (5.7%) |
| $17,500 to $19,999 | 0 (0.0%) | 53 (2.5%) |
| $20,000 to $22,499 | 49 (1.5%) | 35 (1.6%) |
| $22,500 to $24,999 | 70 (2.1%) | 68 (3.2%) |
| $25,000 to $29,999 | 354 (10.6%) | 355 (16.5%) |
| $30,000 to $34,999 | 386 (11.6%) | 267 (12.4%) |
| $35,000 to $39,999 | 55 (1.7%) | 219 (10.2%) |
| $40,000 to $44,999 | 177 (5.3%) | 99 (4.6%) |
| $45,000 to $49,999 | 120 (3.6%) | 189 (8.8%) |
| $50,000 to $54,999 | 149 (4.5%) | 41 (1.9%) |
| $55,000 to $64,999 | 475 (14.2%) | 85 (4.0%) |
| $65,000 to $74,999 | 213 (6.4%) | 45 (2.1%) |
| $75,000 to $99,999 | 356 (10.7%) | 47 (2.2%) |
| $100,000+ | 314 (9.4%) | 94 (4.4%) |
| Total | 3,336 (100.0%) | 2,146 (100.0%) |
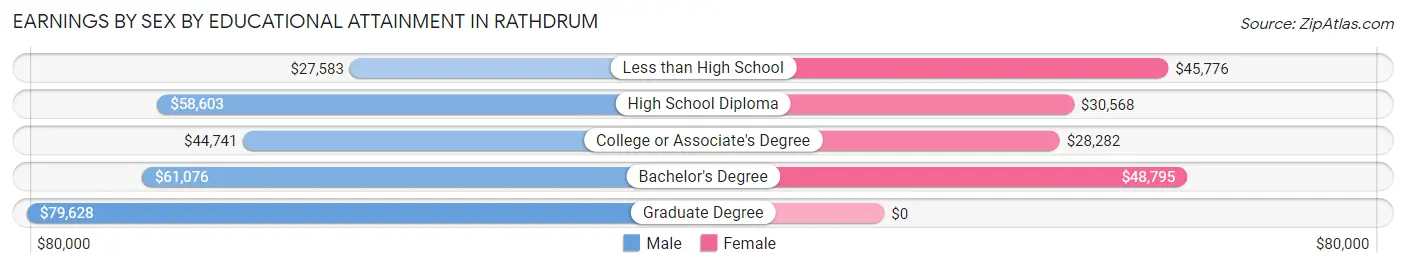
Earnings by Sex by Educational Attainment in Rathdrum
Average earnings in Rathdrum are $52,042 for men and $30,724 for women, a difference of 41.0%. Men with an educational attainment of graduate degree enjoy the highest average annual earnings of $79,628, while those with less than high school education earn the least with $27,583. Women with an educational attainment of bachelor's degree earn the most with the average annual earnings of $48,795, while those with college or associate's degree education have the smallest earnings of $28,282.
| Educational Attainment | Male Income | Female Income |
| Less than High School | $27,583 | $45,776 |
| High School Diploma | $58,603 | $30,568 |
| College or Associate's Degree | $44,741 | $28,282 |
| Bachelor's Degree | $61,076 | $48,795 |
| Graduate Degree | $79,628 | $0 |
| Total | $52,042 | $30,724 |
Family Income in Rathdrum
Family Income Brackets in Rathdrum
According to the Rathdrum family income data, there are 589 families falling into the $75,000 to $99,999 income range, which is the most common income bracket and makes up 22.9% of all families. Conversely, the $10,000 to $14,999 income bracket is the least frequent group with only 21 families (0.8%) belonging to this category.
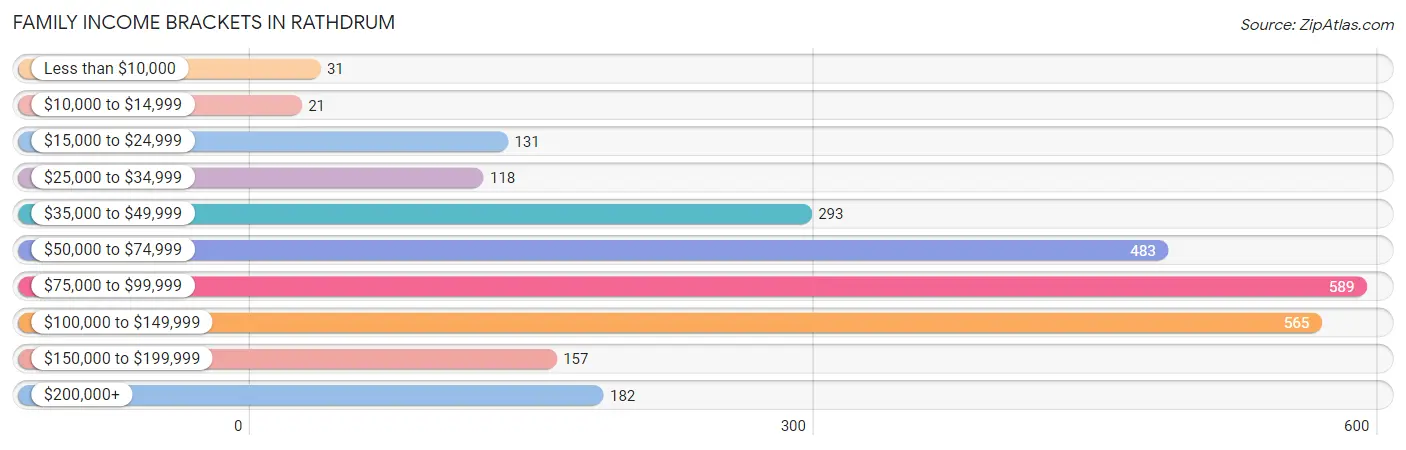
| Income Bracket | # Families | % Families |
| Less than $10,000 | 31 | 1.2% |
| $10,000 to $14,999 | 21 | 0.8% |
| $15,000 to $24,999 | 131 | 5.1% |
| $25,000 to $34,999 | 118 | 4.6% |
| $35,000 to $49,999 | 293 | 11.4% |
| $50,000 to $74,999 | 483 | 18.8% |
| $75,000 to $99,999 | 589 | 22.9% |
| $100,000 to $149,999 | 565 | 22.0% |
| $150,000 to $199,999 | 157 | 6.1% |
| $200,000+ | 182 | 7.1% |
Family Income by Famaliy Size in Rathdrum
6-person families (46 | 1.8%) account for the highest median family income in Rathdrum with $204,375 per family, while 2-person families (1,177 | 45.8%) have the highest median income of $35,070 per family member.
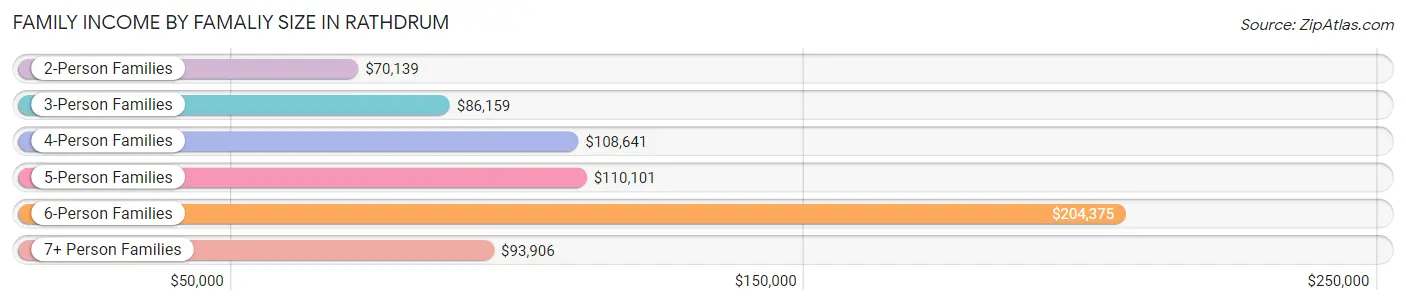
| Income Bracket | # Families | Median Income |
| 2-Person Families | 1,177 (45.8%) | $70,139 |
| 3-Person Families | 666 (25.9%) | $86,159 |
| 4-Person Families | 433 (16.9%) | $108,641 |
| 5-Person Families | 209 (8.1%) | $110,101 |
| 6-Person Families | 46 (1.8%) | $204,375 |
| 7+ Person Families | 39 (1.5%) | $93,906 |
| Total | 2,570 (100.0%) | $83,827 |
Family Income by Number of Earners in Rathdrum
The median family income in Rathdrum is $83,827, with families comprising 3+ earners (345) having the highest median family income of $123,125, while families with no earners (425) have the lowest median family income of $57,031, accounting for 13.4% and 16.5% of families, respectively.
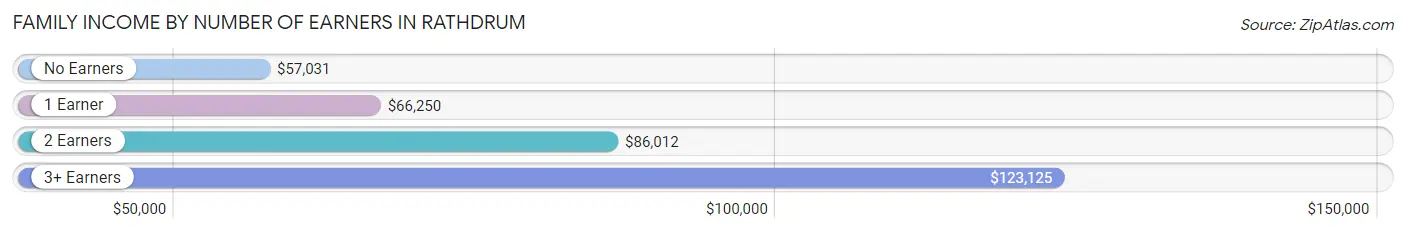
| Number of Earners | # Families | Median Income |
| No Earners | 425 (16.5%) | $57,031 |
| 1 Earner | 620 (24.1%) | $66,250 |
| 2 Earners | 1,180 (45.9%) | $86,012 |
| 3+ Earners | 345 (13.4%) | $123,125 |
| Total | 2,570 (100.0%) | $83,827 |
Household Income in Rathdrum
Household Income Brackets in Rathdrum
With 715 households falling in the category, the $100,000 to $149,999 income range is the most frequent in Rathdrum, accounting for 20.7% of all households. In contrast, only 48 households (1.4%) fall into the $10,000 to $14,999 income bracket, making it the least populous group.
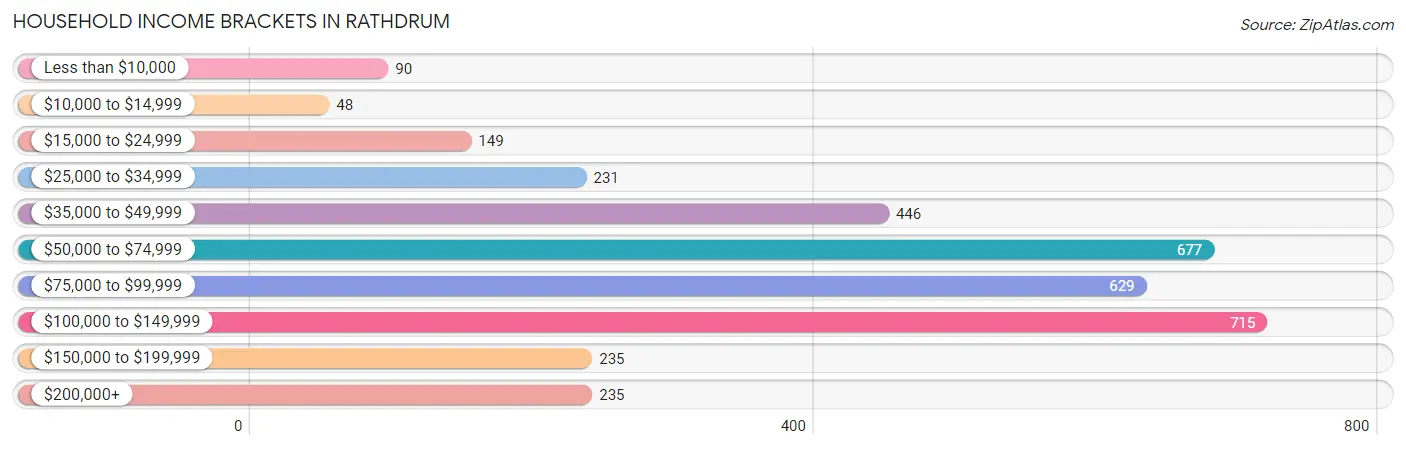
| Income Bracket | # Households | % Households |
| Less than $10,000 | 90 | 2.6% |
| $10,000 to $14,999 | 48 | 1.4% |
| $15,000 to $24,999 | 149 | 4.3% |
| $25,000 to $34,999 | 231 | 6.7% |
| $35,000 to $49,999 | 446 | 12.9% |
| $50,000 to $74,999 | 677 | 19.6% |
| $75,000 to $99,999 | 629 | 18.2% |
| $100,000 to $149,999 | 715 | 20.7% |
| $150,000 to $199,999 | 235 | 6.8% |
| $200,000+ | 235 | 6.8% |
Household Income by Householder Age in Rathdrum
The median household income in Rathdrum is $80,934, with the highest median household income of $86,232 found in the 25 to 44 years age bracket for the primary householder. A total of 1,305 households (37.8%) fall into this category. Meanwhile, the 15 to 24 years age bracket for the primary householder has the lowest median household income of $0, with 106 households (3.1%) in this group.
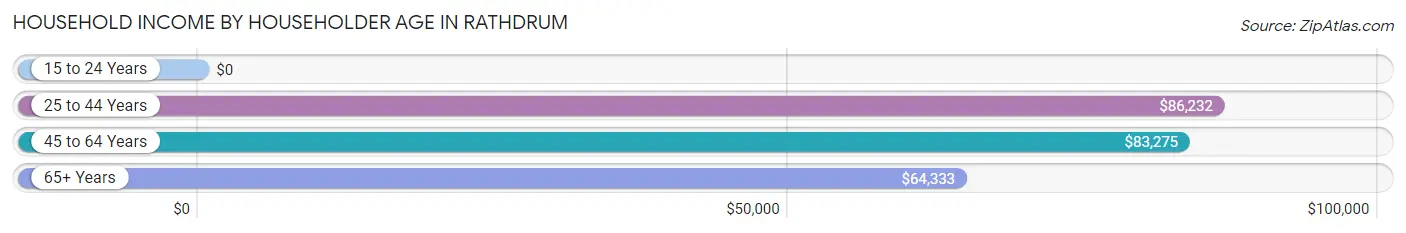
| Income Bracket | # Households | Median Income |
| 15 to 24 Years | 106 (3.1%) | $0 |
| 25 to 44 Years | 1,305 (37.8%) | $86,232 |
| 45 to 64 Years | 1,273 (36.9%) | $83,275 |
| 65+ Years | 770 (22.3%) | $64,333 |
| Total | 3,454 (100.0%) | $80,934 |
Poverty in Rathdrum
Income Below Poverty by Sex and Age in Rathdrum
With 7.2% poverty level for males and 7.2% for females among the residents of Rathdrum, under 5 year old males and 16 and 17 year old females are the most vulnerable to poverty, with 73 males (23.0%) and 27 females (29.7%) in their respective age groups living below the poverty level.
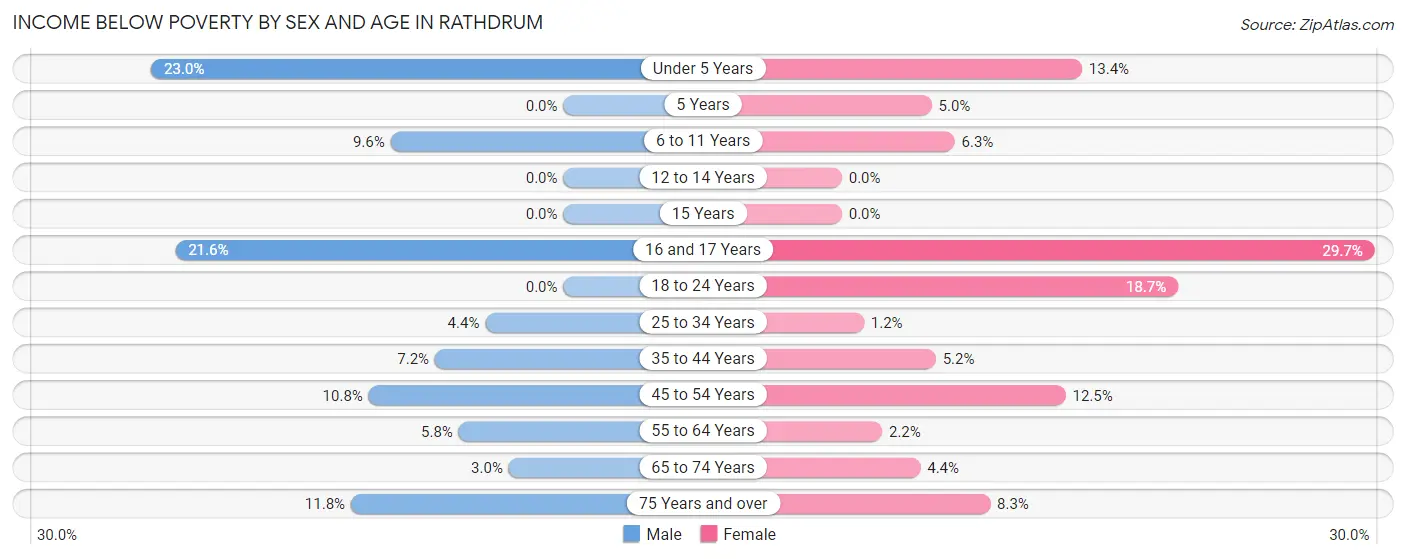
| Age Bracket | Male | Female |
| Under 5 Years | 73 (23.0%) | 50 (13.4%) |
| 5 Years | 0 (0.0%) | 7 (5.0%) |
| 6 to 11 Years | 23 (9.6%) | 25 (6.3%) |
| 12 to 14 Years | 0 (0.0%) | 0 (0.0%) |
| 15 Years | 0 (0.0%) | 0 (0.0%) |
| 16 and 17 Years | 43 (21.6%) | 27 (29.7%) |
| 18 to 24 Years | 0 (0.0%) | 41 (18.7%) |
| 25 to 34 Years | 34 (4.3%) | 7 (1.2%) |
| 35 to 44 Years | 56 (7.1%) | 34 (5.2%) |
| 45 to 54 Years | 72 (10.8%) | 71 (12.5%) |
| 55 to 64 Years | 33 (5.8%) | 9 (2.2%) |
| 65 to 74 Years | 12 (3.0%) | 21 (4.4%) |
| 75 Years and over | 31 (11.8%) | 20 (8.3%) |
| Total | 377 (7.2%) | 312 (7.2%) |
Income Above Poverty by Sex and Age in Rathdrum
According to the poverty statistics in Rathdrum, males aged 5 years and females aged 12 to 14 years are the age groups that are most secure financially, with 100.0% of males and 100.0% of females in these age groups living above the poverty line.
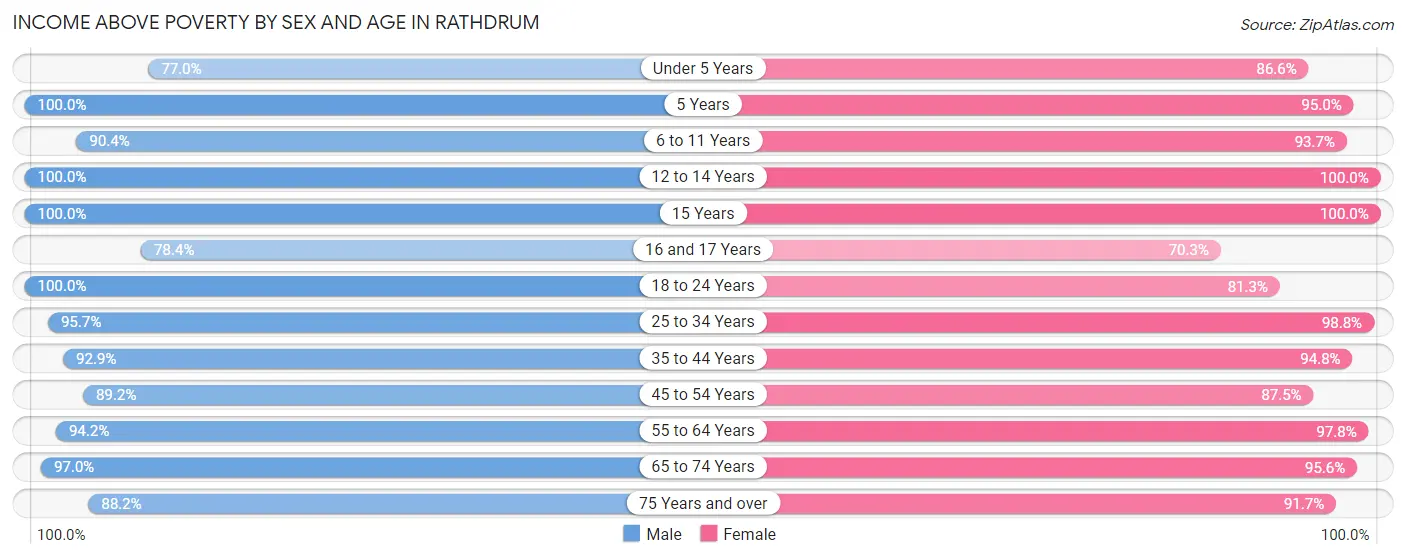
| Age Bracket | Male | Female |
| Under 5 Years | 245 (77.0%) | 324 (86.6%) |
| 5 Years | 43 (100.0%) | 133 (95.0%) |
| 6 to 11 Years | 216 (90.4%) | 373 (93.7%) |
| 12 to 14 Years | 172 (100.0%) | 164 (100.0%) |
| 15 Years | 79 (100.0%) | 30 (100.0%) |
| 16 and 17 Years | 156 (78.4%) | 64 (70.3%) |
| 18 to 24 Years | 699 (100.0%) | 178 (81.3%) |
| 25 to 34 Years | 747 (95.7%) | 560 (98.8%) |
| 35 to 44 Years | 727 (92.8%) | 616 (94.8%) |
| 45 to 54 Years | 592 (89.2%) | 499 (87.5%) |
| 55 to 64 Years | 533 (94.2%) | 393 (97.8%) |
| 65 to 74 Years | 383 (97.0%) | 460 (95.6%) |
| 75 Years and over | 231 (88.2%) | 222 (91.7%) |
| Total | 4,823 (92.7%) | 4,016 (92.8%) |
Income Below Poverty Among Married-Couple Families in Rathdrum
The poverty statistics for married-couple families in Rathdrum show that 2.4% or 54 of the total 2,211 families live below the poverty line. Families with 5 or more children have the highest poverty rate of 40.0%, comprising of 6 families. On the other hand, families with 1 or 2 children have the lowest poverty rate of 0.0%, which includes 0 families.
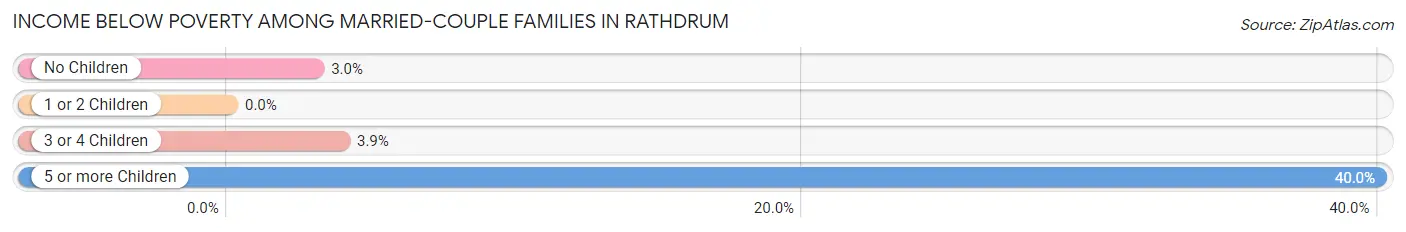
| Children | Above Poverty | Below Poverty |
| No Children | 1,294 (97.0%) | 40 (3.0%) |
| 1 or 2 Children | 657 (100.0%) | 0 (0.0%) |
| 3 or 4 Children | 197 (96.1%) | 8 (3.9%) |
| 5 or more Children | 9 (60.0%) | 6 (40.0%) |
| Total | 2,157 (97.6%) | 54 (2.4%) |
Income Below Poverty Among Single-Parent Households in Rathdrum
According to the poverty data in Rathdrum, 17.8% or 28 single-father households and 35.1% or 71 single-mother households are living below the poverty line. Among single-father households, those with 1 or 2 children have the highest poverty rate, with 28 households (19.9%) experiencing poverty. Likewise, among single-mother households, those with 1 or 2 children have the highest poverty rate, with 71 households (42.3%) falling below the poverty line.
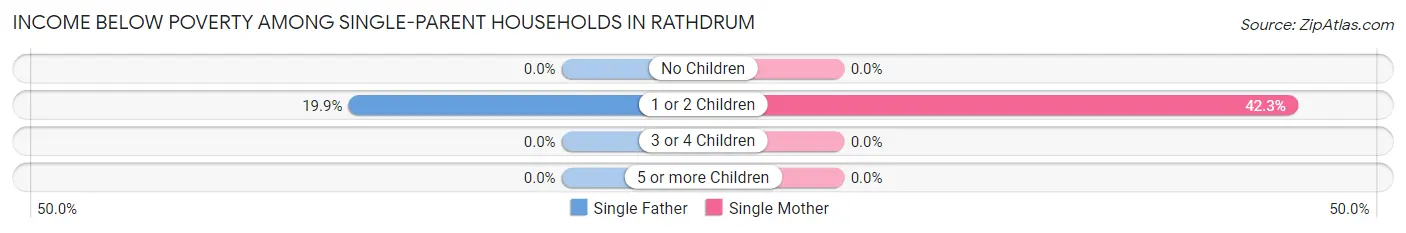
| Children | Single Father | Single Mother |
| No Children | 0 (0.0%) | 0 (0.0%) |
| 1 or 2 Children | 28 (19.9%) | 71 (42.3%) |
| 3 or 4 Children | 0 (0.0%) | 0 (0.0%) |
| 5 or more Children | 0 (0.0%) | 0 (0.0%) |
| Total | 28 (17.8%) | 71 (35.1%) |
Income Below Poverty Among Married-Couple vs Single-Parent Households in Rathdrum
The poverty data for Rathdrum shows that 54 of the married-couple family households (2.4%) and 99 of the single-parent households (27.6%) are living below the poverty level. Within the married-couple family households, those with 5 or more children have the highest poverty rate, with 6 households (40.0%) falling below the poverty line. Among the single-parent households, those with 1 or 2 children have the highest poverty rate, with 99 household (32.0%) living below poverty.
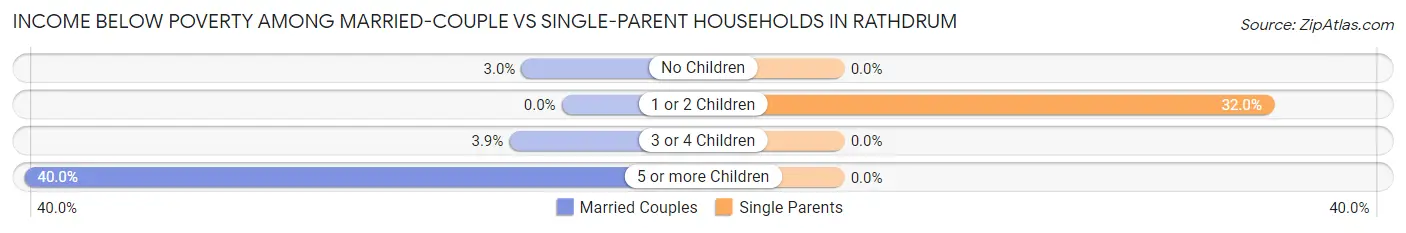
| Children | Married-Couple Families | Single-Parent Households |
| No Children | 40 (3.0%) | 0 (0.0%) |
| 1 or 2 Children | 0 (0.0%) | 99 (32.0%) |
| 3 or 4 Children | 8 (3.9%) | 0 (0.0%) |
| 5 or more Children | 6 (40.0%) | 0 (0.0%) |
| Total | 54 (2.4%) | 99 (27.6%) |
Race in Rathdrum
The most populous races in Rathdrum are White / Caucasian (8,374 | 87.6%), Two or more Races (617 | 6.5%), and Hispanic or Latino (459 | 4.8%).
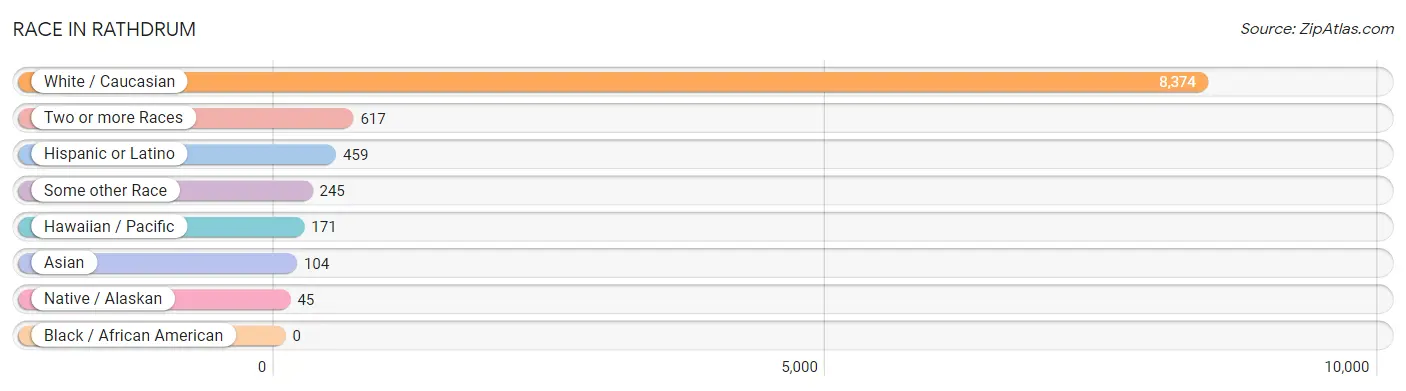
| Race | # Population | % Population |
| Asian | 104 | 1.1% |
| Black / African American | 0 | 0.0% |
| Hawaiian / Pacific | 171 | 1.8% |
| Hispanic or Latino | 459 | 4.8% |
| Native / Alaskan | 45 | 0.5% |
| White / Caucasian | 8,374 | 87.6% |
| Two or more Races | 617 | 6.5% |
| Some other Race | 245 | 2.6% |
| Total | 9,556 | 100.0% |
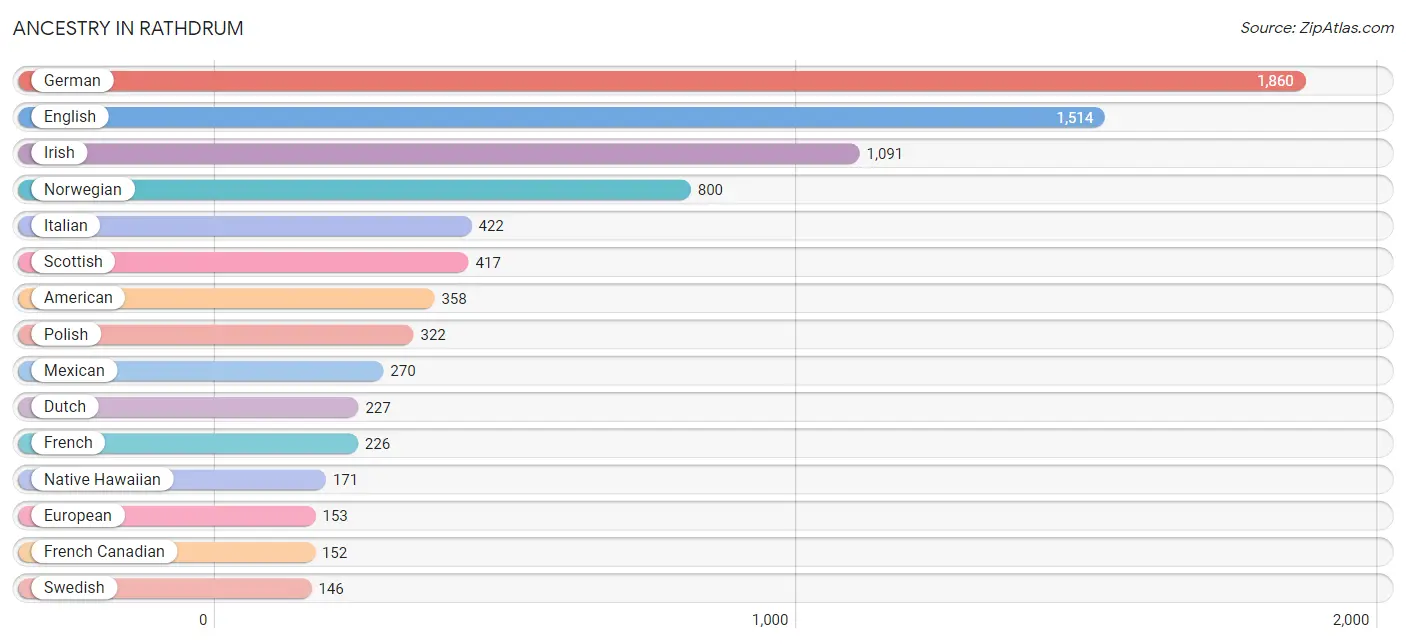
Ancestry in Rathdrum
The most populous ancestries reported in Rathdrum are German (1,860 | 19.5%), English (1,514 | 15.8%), Irish (1,091 | 11.4%), Norwegian (800 | 8.4%), and Italian (422 | 4.4%), together accounting for 59.5% of all Rathdrum residents.
| Ancestry | # Population | % Population |
| American | 358 | 3.7% |
| Australian | 15 | 0.2% |
| Blackfeet | 41 | 0.4% |
| British | 59 | 0.6% |
| Canadian | 9 | 0.1% |
| Central American | 56 | 0.6% |
| Cherokee | 52 | 0.5% |
| Cree | 27 | 0.3% |
| Croatian | 10 | 0.1% |
| Czech | 13 | 0.1% |
| Danish | 35 | 0.4% |
| Dutch | 227 | 2.4% |
| Eastern European | 69 | 0.7% |
| English | 1,514 | 15.8% |
| Estonian | 11 | 0.1% |
| European | 153 | 1.6% |
| Finnish | 15 | 0.2% |
| French | 226 | 2.4% |
| French Canadian | 152 | 1.6% |
| German | 1,860 | 19.5% |
| Greek | 39 | 0.4% |
| Hungarian | 22 | 0.2% |
| Inupiat | 15 | 0.2% |
| Irish | 1,091 | 11.4% |
| Italian | 422 | 4.4% |
| Korean | 49 | 0.5% |
| Lithuanian | 13 | 0.1% |
| Mexican | 270 | 2.8% |
| Mexican American Indian | 45 | 0.5% |
| Native Hawaiian | 171 | 1.8% |
| Nicaraguan | 56 | 0.6% |
| Northern European | 48 | 0.5% |
| Norwegian | 800 | 8.4% |
| Polish | 322 | 3.4% |
| Portuguese | 97 | 1.0% |
| Puerto Rican | 41 | 0.4% |
| Romanian | 24 | 0.3% |
| Russian | 89 | 0.9% |
| Scandinavian | 60 | 0.6% |
| Scottish | 417 | 4.4% |
| Spanish | 92 | 1.0% |
| Swedish | 146 | 1.5% |
| Thai | 55 | 0.6% |
| Ukrainian | 28 | 0.3% |
| Welsh | 27 | 0.3% | View All 45 Rows |
Immigrants in Rathdrum
The most numerous immigrant groups reported in Rathdrum came from Central America (83 | 0.9%), Latin America (83 | 0.9%), Mexico (83 | 0.9%), Asia (35 | 0.4%), and Europe (26 | 0.3%), together accounting for 3.3% of all Rathdrum residents.
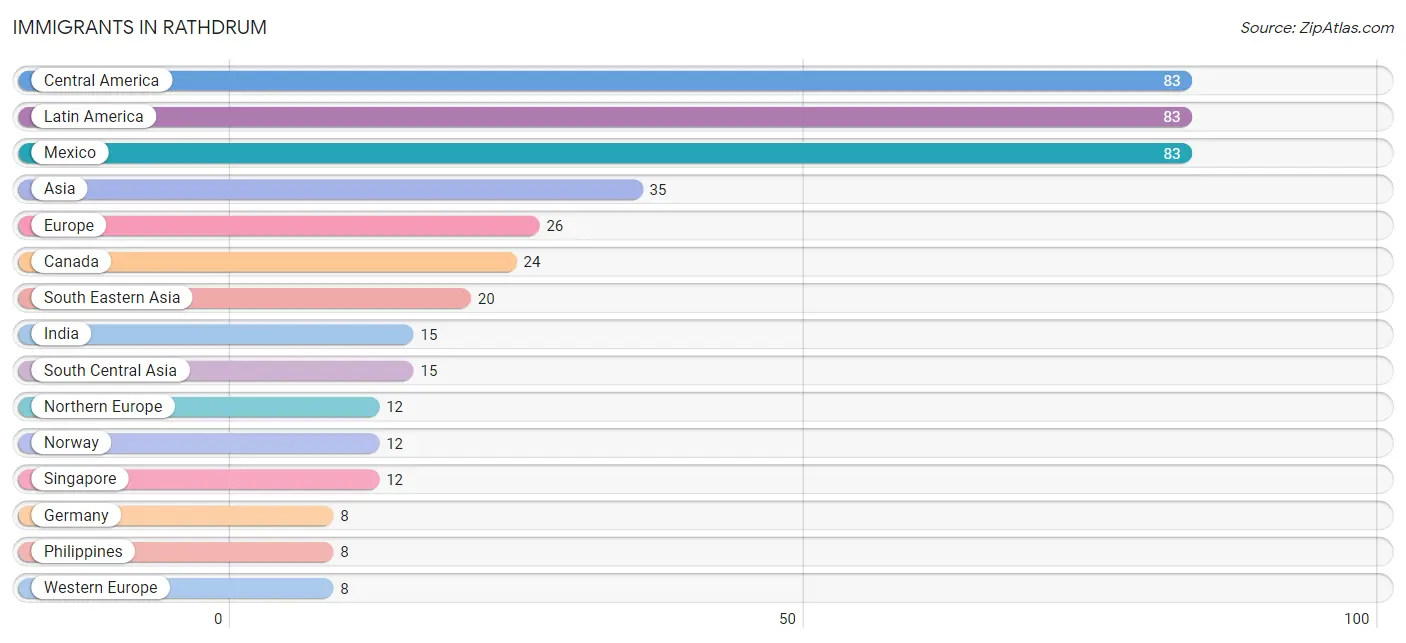
| Immigration Origin | # Population | % Population |
| Asia | 35 | 0.4% |
| Canada | 24 | 0.3% |
| Central America | 83 | 0.9% |
| Eastern Europe | 6 | 0.1% |
| Europe | 26 | 0.3% |
| Germany | 8 | 0.1% |
| India | 15 | 0.2% |
| Latin America | 83 | 0.9% |
| Mexico | 83 | 0.9% |
| Northern Europe | 12 | 0.1% |
| Norway | 12 | 0.1% |
| Philippines | 8 | 0.1% |
| Singapore | 12 | 0.1% |
| South Central Asia | 15 | 0.2% |
| South Eastern Asia | 20 | 0.2% |
| Ukraine | 6 | 0.1% |
| Western Europe | 8 | 0.1% | View All 17 Rows |
Sex and Age in Rathdrum
Sex and Age in Rathdrum
The most populous age groups in Rathdrum are 15 to 19 Years (594 | 11.4%) for men and 5 to 9 Years (400 | 9.2%) for women.
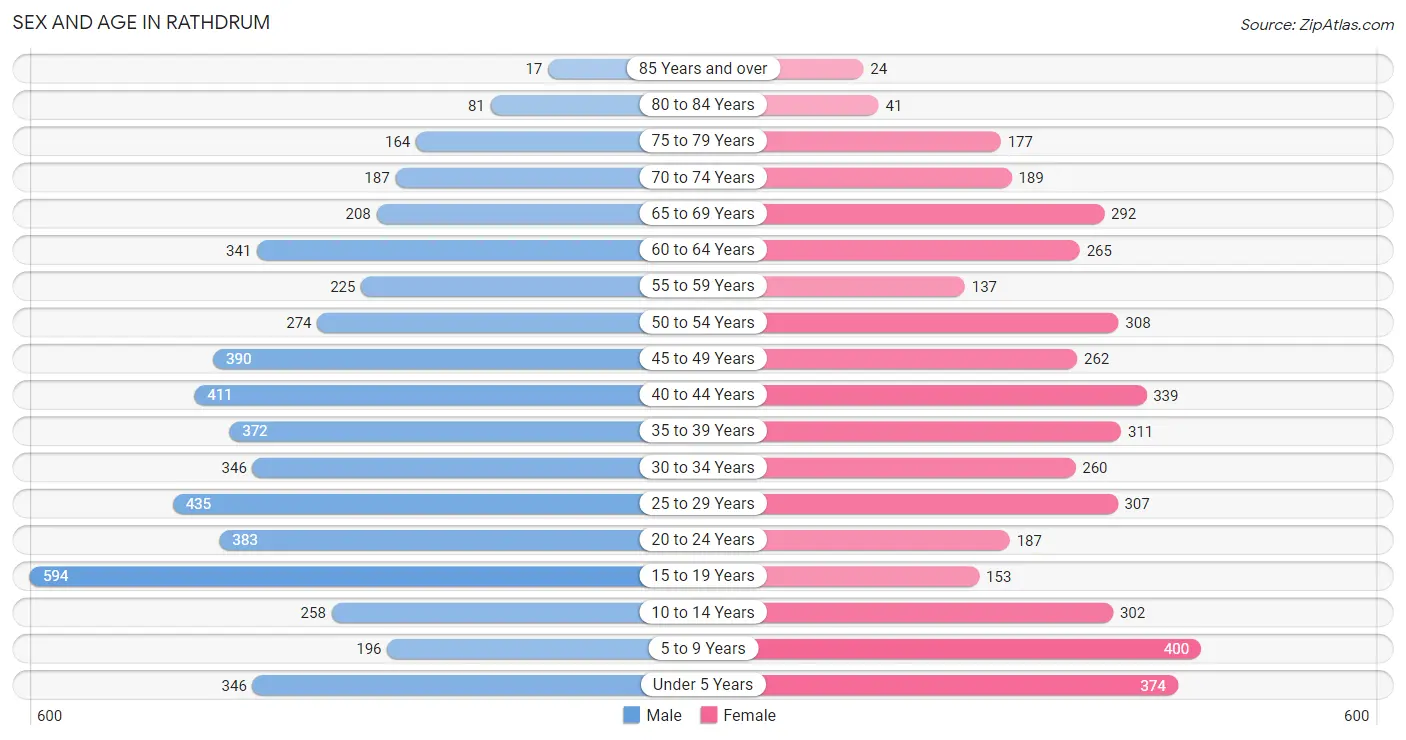
| Age Bracket | Male | Female |
| Under 5 Years | 346 (6.6%) | 374 (8.6%) |
| 5 to 9 Years | 196 (3.7%) | 400 (9.2%) |
| 10 to 14 Years | 258 (4.9%) | 302 (7.0%) |
| 15 to 19 Years | 594 (11.4%) | 153 (3.5%) |
| 20 to 24 Years | 383 (7.3%) | 187 (4.3%) |
| 25 to 29 Years | 435 (8.3%) | 307 (7.1%) |
| 30 to 34 Years | 346 (6.6%) | 260 (6.0%) |
| 35 to 39 Years | 372 (7.1%) | 311 (7.2%) |
| 40 to 44 Years | 411 (7.9%) | 339 (7.8%) |
| 45 to 49 Years | 390 (7.5%) | 262 (6.0%) |
| 50 to 54 Years | 274 (5.2%) | 308 (7.1%) |
| 55 to 59 Years | 225 (4.3%) | 137 (3.2%) |
| 60 to 64 Years | 341 (6.5%) | 265 (6.1%) |
| 65 to 69 Years | 208 (4.0%) | 292 (6.8%) |
| 70 to 74 Years | 187 (3.6%) | 189 (4.4%) |
| 75 to 79 Years | 164 (3.1%) | 177 (4.1%) |
| 80 to 84 Years | 81 (1.5%) | 41 (0.9%) |
| 85 Years and over | 17 (0.3%) | 24 (0.5%) |
| Total | 5,228 (100.0%) | 4,328 (100.0%) |
Families and Households in Rathdrum
Median Family Size in Rathdrum
The median family size in Rathdrum is 3.14 persons per family, with single female/mother families (202 | 7.9%) accounting for the largest median family size of 3.41 persons per family. On the other hand, single male/father families (157 | 6.1%) represent the smallest median family size with 2.69 persons per family.
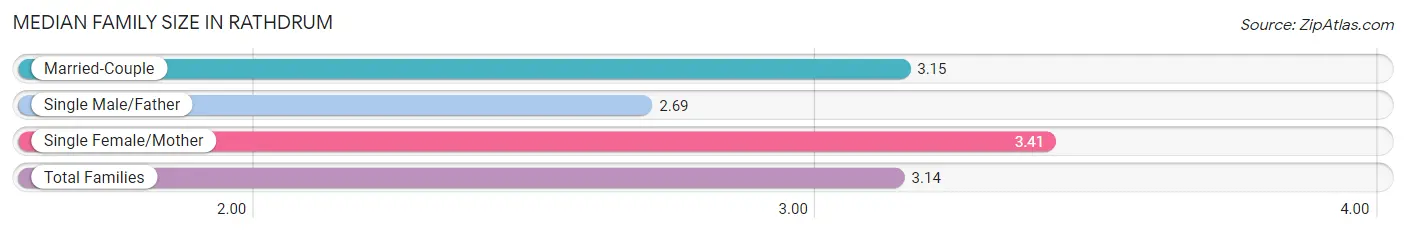
| Family Type | # Families | Family Size |
| Married-Couple | 2,211 (86.0%) | 3.15 |
| Single Male/Father | 157 (6.1%) | 2.69 |
| Single Female/Mother | 202 (7.9%) | 3.41 |
| Total Families | 2,570 (100.0%) | 3.14 |
Median Household Size in Rathdrum
The median household size in Rathdrum is 2.77 persons per household, with single female/mother households (202 | 5.9%) accounting for the largest median household size of 3.85 persons per household. non-family households (884 | 25.6%) represent the smallest median household size with 1.55 persons per household.
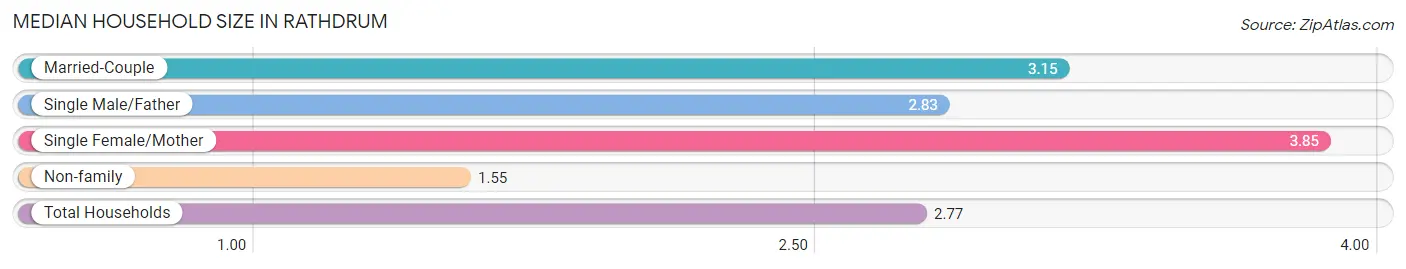
| Household Type | # Households | Household Size |
| Married-Couple | 2,211 (64.0%) | 3.15 |
| Single Male/Father | 157 (4.5%) | 2.83 |
| Single Female/Mother | 202 (5.9%) | 3.85 |
| Non-family | 884 (25.6%) | 1.55 |
| Total Households | 3,454 (100.0%) | 2.77 |
Household Size by Marriage Status in Rathdrum
Out of a total of 3,454 households in Rathdrum, 2,570 (74.4%) are family households, while 884 (25.6%) are nonfamily households. The most numerous type of family households are 2-person households, comprising 1,136, and the most common type of nonfamily households are 1-person households, comprising 581.
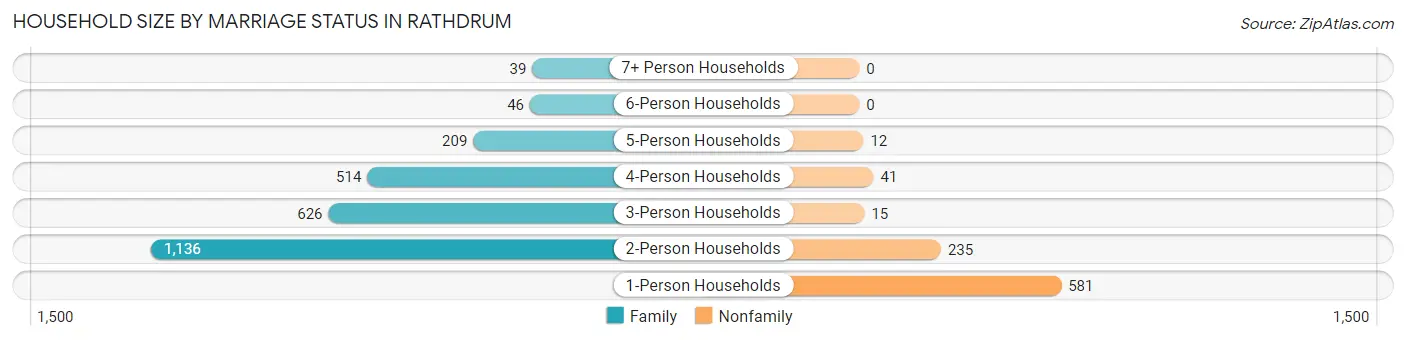
| Household Size | Family Households | Nonfamily Households |
| 1-Person Households | - | 581 (16.8%) |
| 2-Person Households | 1,136 (32.9%) | 235 (6.8%) |
| 3-Person Households | 626 (18.1%) | 15 (0.4%) |
| 4-Person Households | 514 (14.9%) | 41 (1.2%) |
| 5-Person Households | 209 (6.0%) | 12 (0.4%) |
| 6-Person Households | 46 (1.3%) | 0 (0.0%) |
| 7+ Person Households | 39 (1.1%) | 0 (0.0%) |
| Total | 2,570 (74.4%) | 884 (25.6%) |
Female Fertility in Rathdrum
Fertility by Age in Rathdrum
Average fertility rate in Rathdrum is 25.0 births per 1,000 women. Women in the age bracket of 20 to 34 years have the highest fertility rate with 61.0 births per 1,000 women. Women in the age bracket of 20 to 34 years acount for 100.0% of all women with births.
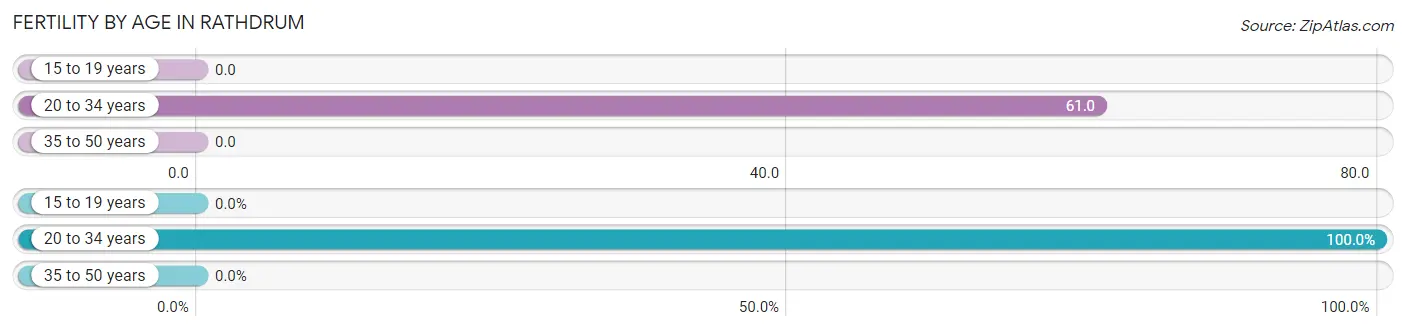
| Age Bracket | Women with Births | Births / 1,000 Women |
| 15 to 19 years | 0 (0.0%) | 0.0 |
| 20 to 34 years | 46 (100.0%) | 61.0 |
| 35 to 50 years | 0 (0.0%) | 0.0 |
| Total | 46 (100.0%) | 25.0 |
Fertility by Age by Marriage Status in Rathdrum
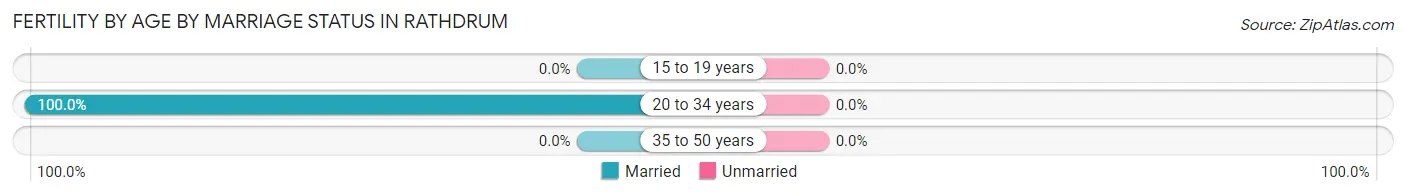
| Age Bracket | Married | Unmarried |
| 15 to 19 years | 0 (0.0%) | 0 (0.0%) |
| 20 to 34 years | 46 (100.0%) | 0 (0.0%) |
| 35 to 50 years | 0 (0.0%) | 0 (0.0%) |
| Total | 46 (100.0%) | 0 (0.0%) |
Fertility by Education in Rathdrum
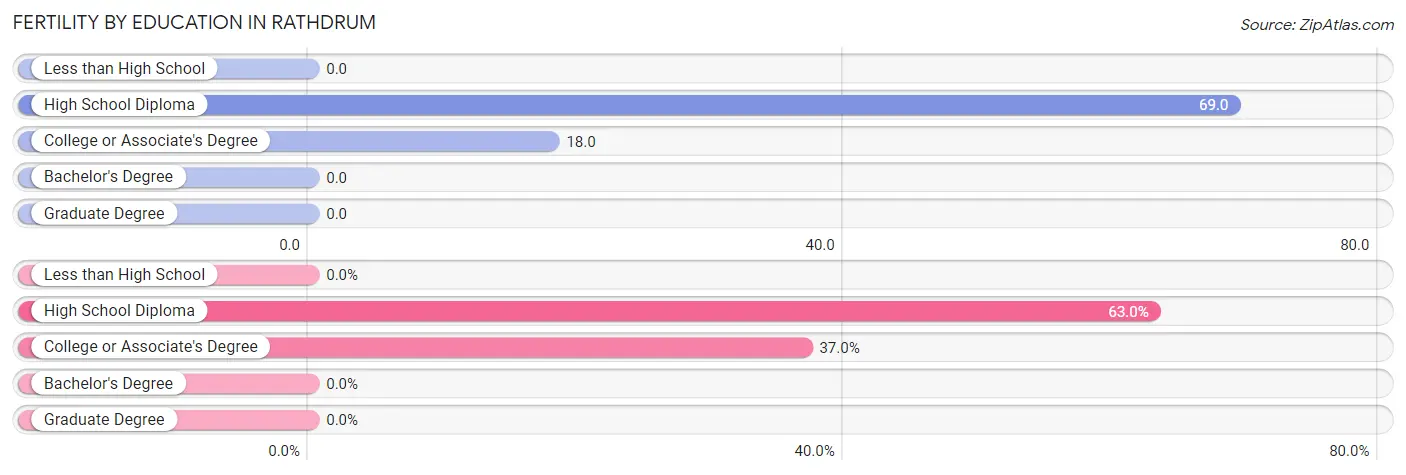
| Educational Attainment | Women with Births | Births / 1,000 Women |
| Less than High School | 0 (0.0%) | 0.0 |
| High School Diploma | 29 (63.0%) | 69.0 |
| College or Associate's Degree | 17 (37.0%) | 18.0 |
| Bachelor's Degree | 0 (0.0%) | 0.0 |
| Graduate Degree | 0 (0.0%) | 0.0 |
| Total | 46 (100.0%) | 25.0 |
Fertility by Education by Marriage Status in Rathdrum
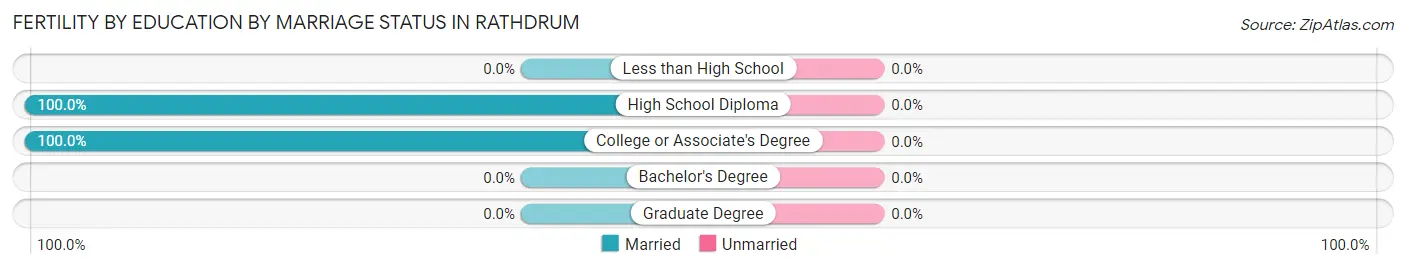
| Educational Attainment | Married | Unmarried |
| Less than High School | 0 (0.0%) | 0 (0.0%) |
| High School Diploma | 29 (100.0%) | 0 (0.0%) |
| College or Associate's Degree | 17 (100.0%) | 0 (0.0%) |
| Bachelor's Degree | 0 (0.0%) | 0 (0.0%) |
| Graduate Degree | 0 (0.0%) | 0 (0.0%) |
| Total | 46 (100.0%) | 0 (0.0%) |
Employment Characteristics in Rathdrum
Employment by Class of Employer in Rathdrum
Among the 4,972 employed individuals in Rathdrum, private company employees (4,029 | 81.0%), self-employed (not incorporated) (278 | 5.6%), and local government employees (213 | 4.3%) make up the most common classes of employment.
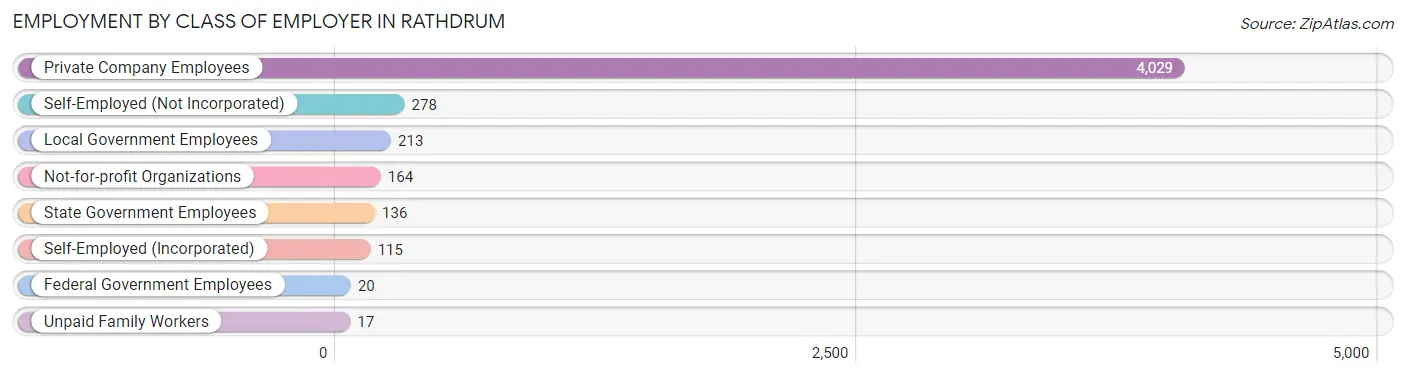
| Employer Class | # Employees | % Employees |
| Private Company Employees | 4,029 | 81.0% |
| Self-Employed (Incorporated) | 115 | 2.3% |
| Self-Employed (Not Incorporated) | 278 | 5.6% |
| Not-for-profit Organizations | 164 | 3.3% |
| Local Government Employees | 213 | 4.3% |
| State Government Employees | 136 | 2.7% |
| Federal Government Employees | 20 | 0.4% |
| Unpaid Family Workers | 17 | 0.3% |
| Total | 4,972 | 100.0% |
Employment Status by Age in Rathdrum
According to the labor force statistics for Rathdrum, out of the total population over 16 years of age (7,571), 69.1% or 5,232 individuals are in the labor force, with 4.6% or 241 of them unemployed. The age group with the highest labor force participation rate is 20 to 24 years, with 96.5% or 550 individuals in the labor force. Within the labor force, the 25 to 29 years age range has the highest percentage of unemployed individuals, with 11.1% or 77 of them being unemployed.
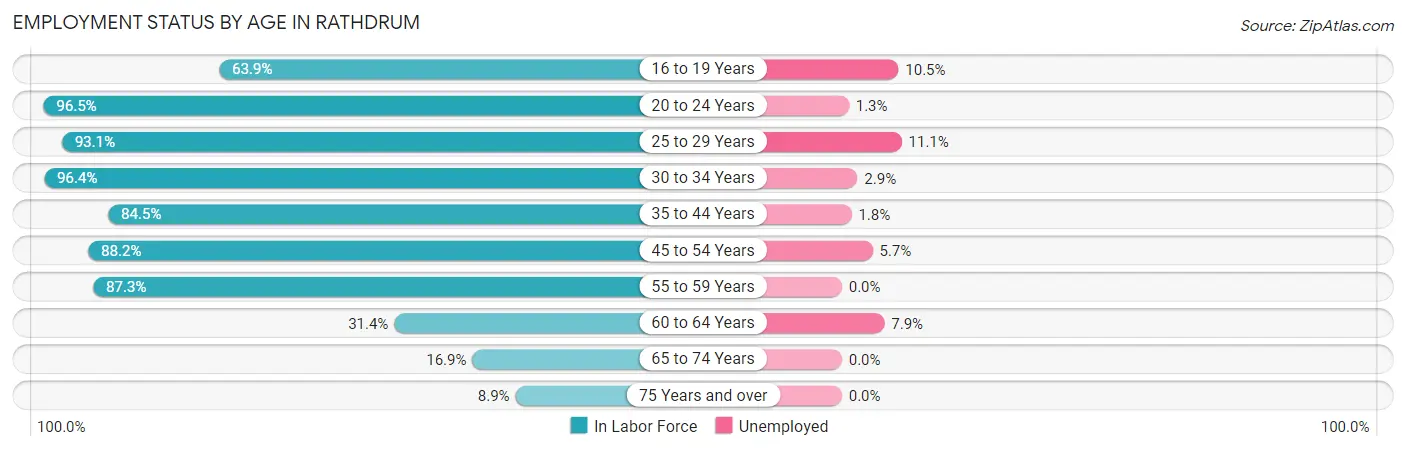
| Age Bracket | In Labor Force | Unemployed |
| 16 to 19 Years | 408 (63.9%) | 43 (10.5%) |
| 20 to 24 Years | 550 (96.5%) | 7 (1.3%) |
| 25 to 29 Years | 691 (93.1%) | 77 (11.1%) |
| 30 to 34 Years | 584 (96.4%) | 17 (2.9%) |
| 35 to 44 Years | 1,211 (84.5%) | 22 (1.8%) |
| 45 to 54 Years | 1,088 (88.2%) | 62 (5.7%) |
| 55 to 59 Years | 316 (87.3%) | 0 (0.0%) |
| 60 to 64 Years | 190 (31.4%) | 15 (7.9%) |
| 65 to 74 Years | 148 (16.9%) | 0 (0.0%) |
| 75 Years and over | 45 (8.9%) | 0 (0.0%) |
| Total | 5,232 (69.1%) | 241 (4.6%) |
Employment Status by Educational Attainment in Rathdrum
According to labor force statistics for Rathdrum, 81.9% of individuals (4,081) out of the total population between 25 and 64 years of age (4,983) are in the labor force, with 4.7% or 192 of them being unemployed. The group with the highest labor force participation rate are those with the educational attainment of college / associate degree, with 85.0% or 1,868 individuals in the labor force. Within the labor force, individuals with less than high school education have the highest percentage of unemployment, with 9.5% or 41 of them being unemployed.
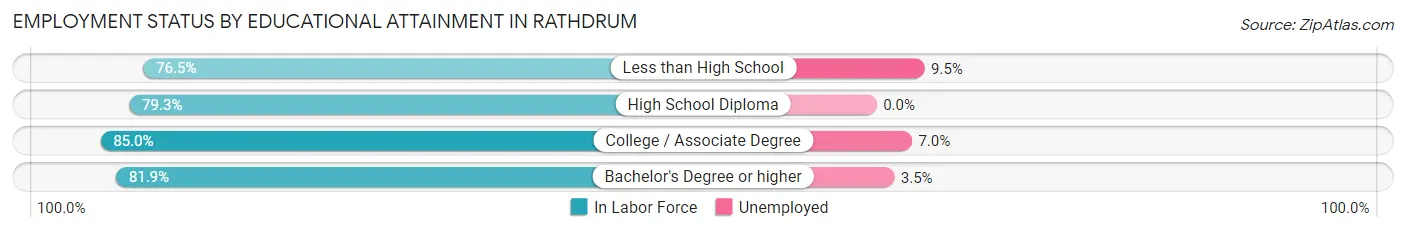
| Educational Attainment | In Labor Force | Unemployed |
| Less than High School | 432 (76.5%) | 54 (9.5%) |
| High School Diploma | 1,153 (79.3%) | 0 (0.0%) |
| College / Associate Degree | 1,868 (85.0%) | 154 (7.0%) |
| Bachelor's Degree or higher | 627 (81.9%) | 27 (3.5%) |
| Total | 4,081 (81.9%) | 234 (4.7%) |
Employment Occupations by Sex in Rathdrum
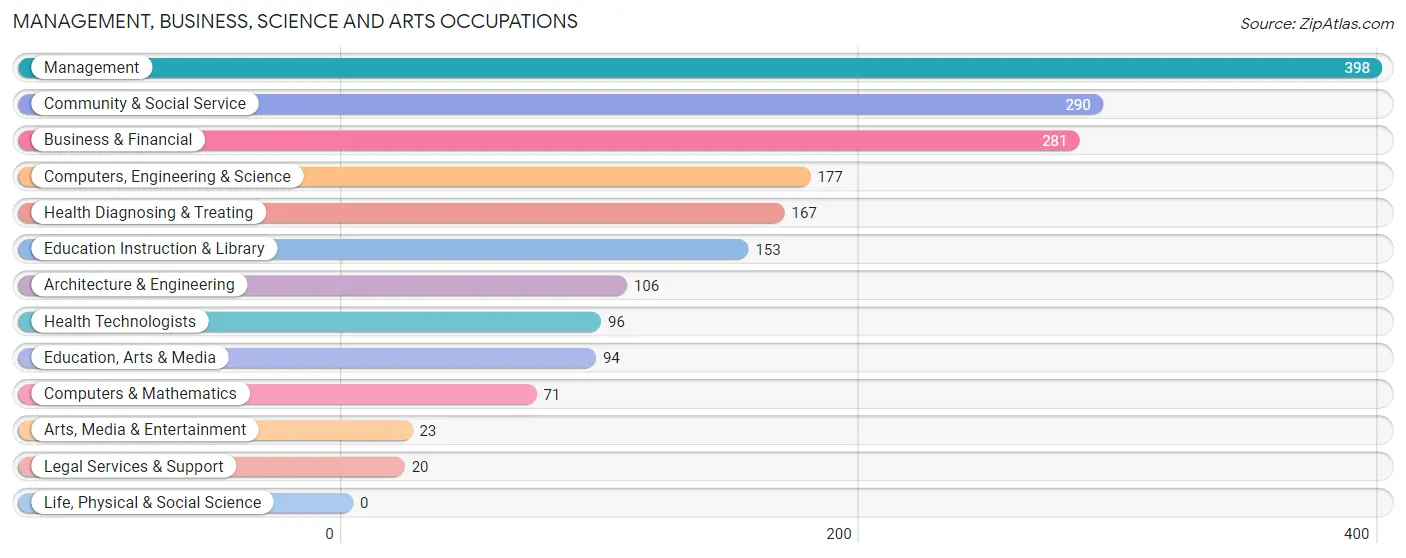
Management, Business, Science and Arts Occupations
The most common Management, Business, Science and Arts occupations in Rathdrum are Management (398 | 8.0%), Community & Social Service (290 | 5.8%), Business & Financial (281 | 5.6%), Computers, Engineering & Science (177 | 3.5%), and Health Diagnosing & Treating (167 | 3.4%).
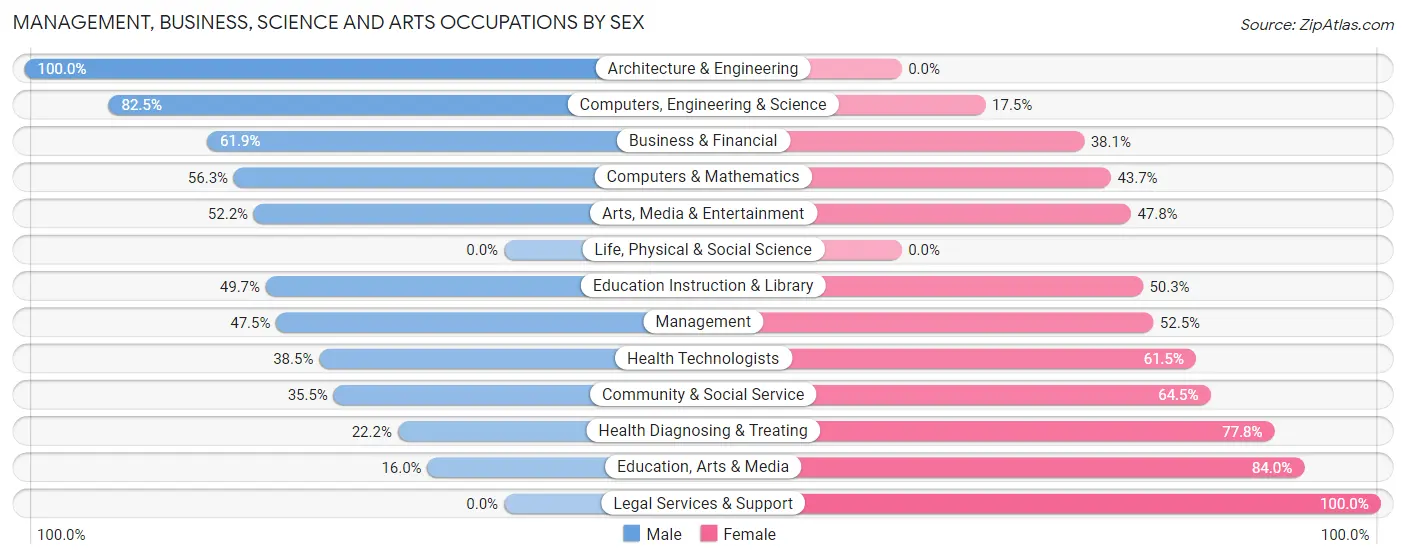
Management, Business, Science and Arts Occupations by Sex
Within the Management, Business, Science and Arts occupations in Rathdrum, the most male-oriented occupations are Architecture & Engineering (100.0%), Computers, Engineering & Science (82.5%), and Business & Financial (61.9%), while the most female-oriented occupations are Legal Services & Support (100.0%), Education, Arts & Media (84.0%), and Health Diagnosing & Treating (77.8%).
| Occupation | Male | Female |
| Management | 189 (47.5%) | 209 (52.5%) |
| Business & Financial | 174 (61.9%) | 107 (38.1%) |
| Computers, Engineering & Science | 146 (82.5%) | 31 (17.5%) |
| Computers & Mathematics | 40 (56.3%) | 31 (43.7%) |
| Architecture & Engineering | 106 (100.0%) | 0 (0.0%) |
| Life, Physical & Social Science | 0 (0.0%) | 0 (0.0%) |
| Community & Social Service | 103 (35.5%) | 187 (64.5%) |
| Education, Arts & Media | 15 (16.0%) | 79 (84.0%) |
| Legal Services & Support | 0 (0.0%) | 20 (100.0%) |
| Education Instruction & Library | 76 (49.7%) | 77 (50.3%) |
| Arts, Media & Entertainment | 12 (52.2%) | 11 (47.8%) |
| Health Diagnosing & Treating | 37 (22.2%) | 130 (77.8%) |
| Health Technologists | 37 (38.5%) | 59 (61.5%) |
| Total (Category) | 649 (49.4%) | 664 (50.6%) |
| Total (Overall) | 3,066 (61.5%) | 1,922 (38.5%) |
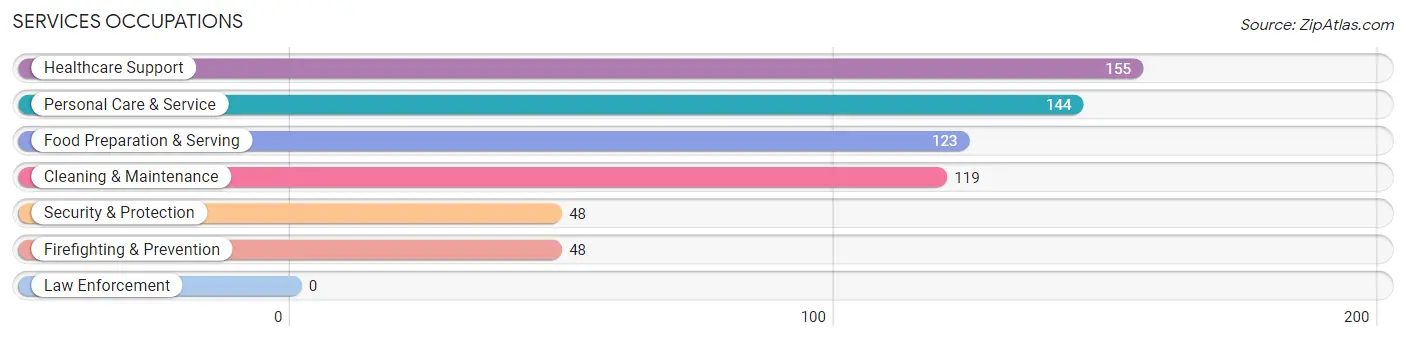
Services Occupations
The most common Services occupations in Rathdrum are Healthcare Support (155 | 3.1%), Personal Care & Service (144 | 2.9%), Food Preparation & Serving (123 | 2.5%), Cleaning & Maintenance (119 | 2.4%), and Security & Protection (48 | 1.0%).
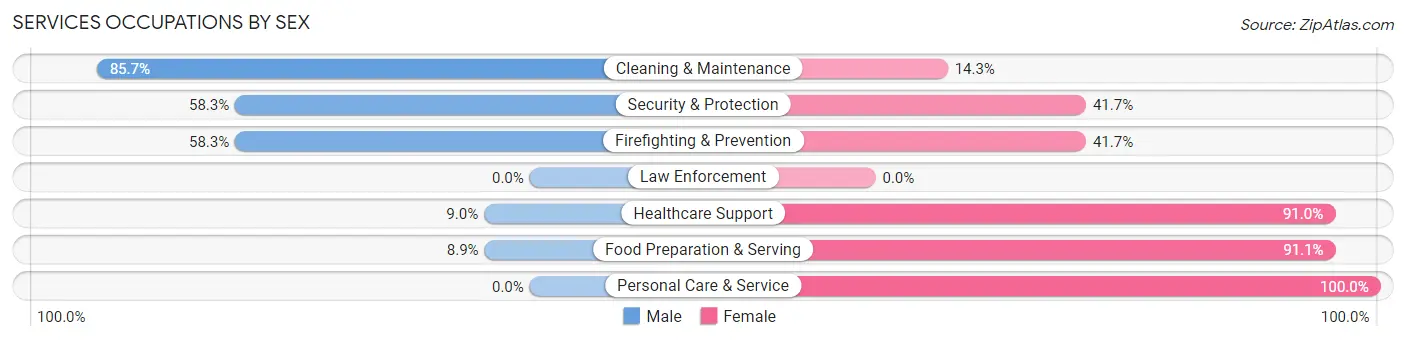
Services Occupations by Sex
Within the Services occupations in Rathdrum, the most male-oriented occupations are Cleaning & Maintenance (85.7%), Security & Protection (58.3%), and Firefighting & Prevention (58.3%), while the most female-oriented occupations are Personal Care & Service (100.0%), Food Preparation & Serving (91.1%), and Healthcare Support (91.0%).
| Occupation | Male | Female |
| Healthcare Support | 14 (9.0%) | 141 (91.0%) |
| Security & Protection | 28 (58.3%) | 20 (41.7%) |
| Firefighting & Prevention | 28 (58.3%) | 20 (41.7%) |
| Law Enforcement | 0 (0.0%) | 0 (0.0%) |
| Food Preparation & Serving | 11 (8.9%) | 112 (91.1%) |
| Cleaning & Maintenance | 102 (85.7%) | 17 (14.3%) |
| Personal Care & Service | 0 (0.0%) | 144 (100.0%) |
| Total (Category) | 155 (26.3%) | 434 (73.7%) |
| Total (Overall) | 3,066 (61.5%) | 1,922 (38.5%) |
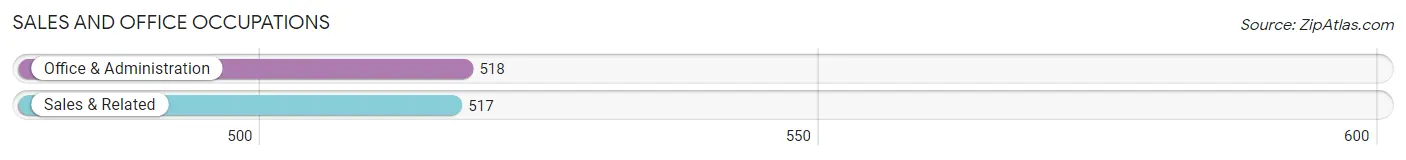
Sales and Office Occupations
The most common Sales and Office occupations in Rathdrum are Office & Administration (518 | 10.4%), and Sales & Related (517 | 10.4%).
Sales and Office Occupations by Sex
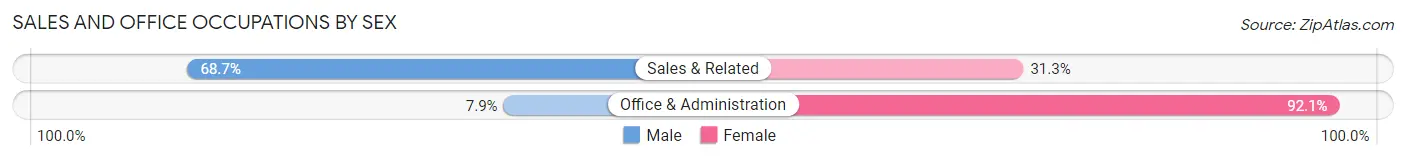
| Occupation | Male | Female |
| Sales & Related | 355 (68.7%) | 162 (31.3%) |
| Office & Administration | 41 (7.9%) | 477 (92.1%) |
| Total (Category) | 396 (38.3%) | 639 (61.7%) |
| Total (Overall) | 3,066 (61.5%) | 1,922 (38.5%) |
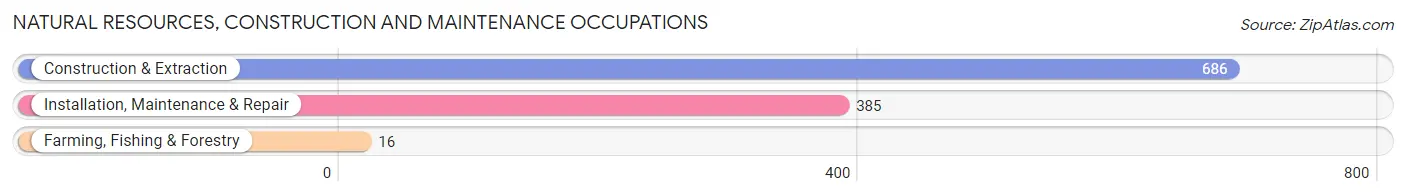
Natural Resources, Construction and Maintenance Occupations
The most common Natural Resources, Construction and Maintenance occupations in Rathdrum are Construction & Extraction (686 | 13.8%), Installation, Maintenance & Repair (385 | 7.7%), and Farming, Fishing & Forestry (16 | 0.3%).
Natural Resources, Construction and Maintenance Occupations by Sex
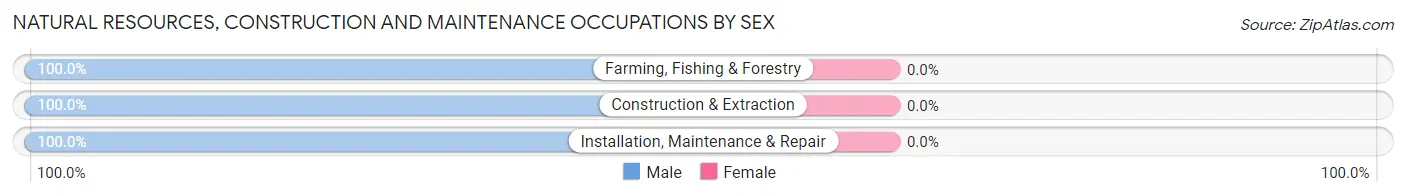
| Occupation | Male | Female |
| Farming, Fishing & Forestry | 16 (100.0%) | 0 (0.0%) |
| Construction & Extraction | 686 (100.0%) | 0 (0.0%) |
| Installation, Maintenance & Repair | 385 (100.0%) | 0 (0.0%) |
| Total (Category) | 1,087 (100.0%) | 0 (0.0%) |
| Total (Overall) | 3,066 (61.5%) | 1,922 (38.5%) |
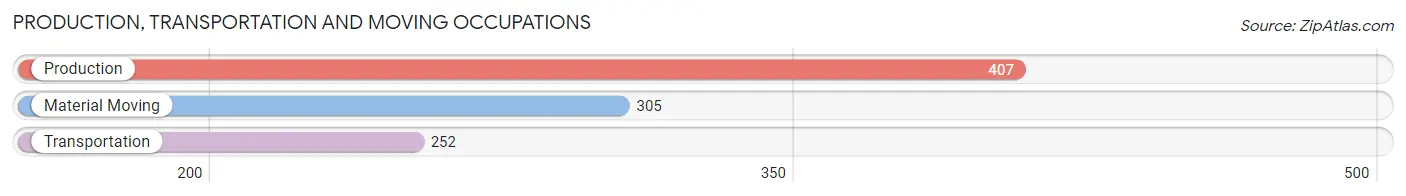
Production, Transportation and Moving Occupations
The most common Production, Transportation and Moving occupations in Rathdrum are Production (407 | 8.2%), Material Moving (305 | 6.1%), and Transportation (252 | 5.1%).
Production, Transportation and Moving Occupations by Sex
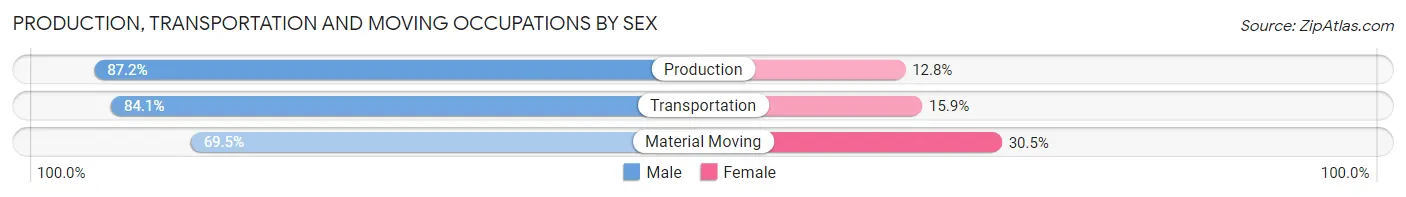
| Occupation | Male | Female |
| Production | 355 (87.2%) | 52 (12.8%) |
| Transportation | 212 (84.1%) | 40 (15.9%) |
| Material Moving | 212 (69.5%) | 93 (30.5%) |
| Total (Category) | 779 (80.8%) | 185 (19.2%) |
| Total (Overall) | 3,066 (61.5%) | 1,922 (38.5%) |
Employment Industries by Sex in Rathdrum
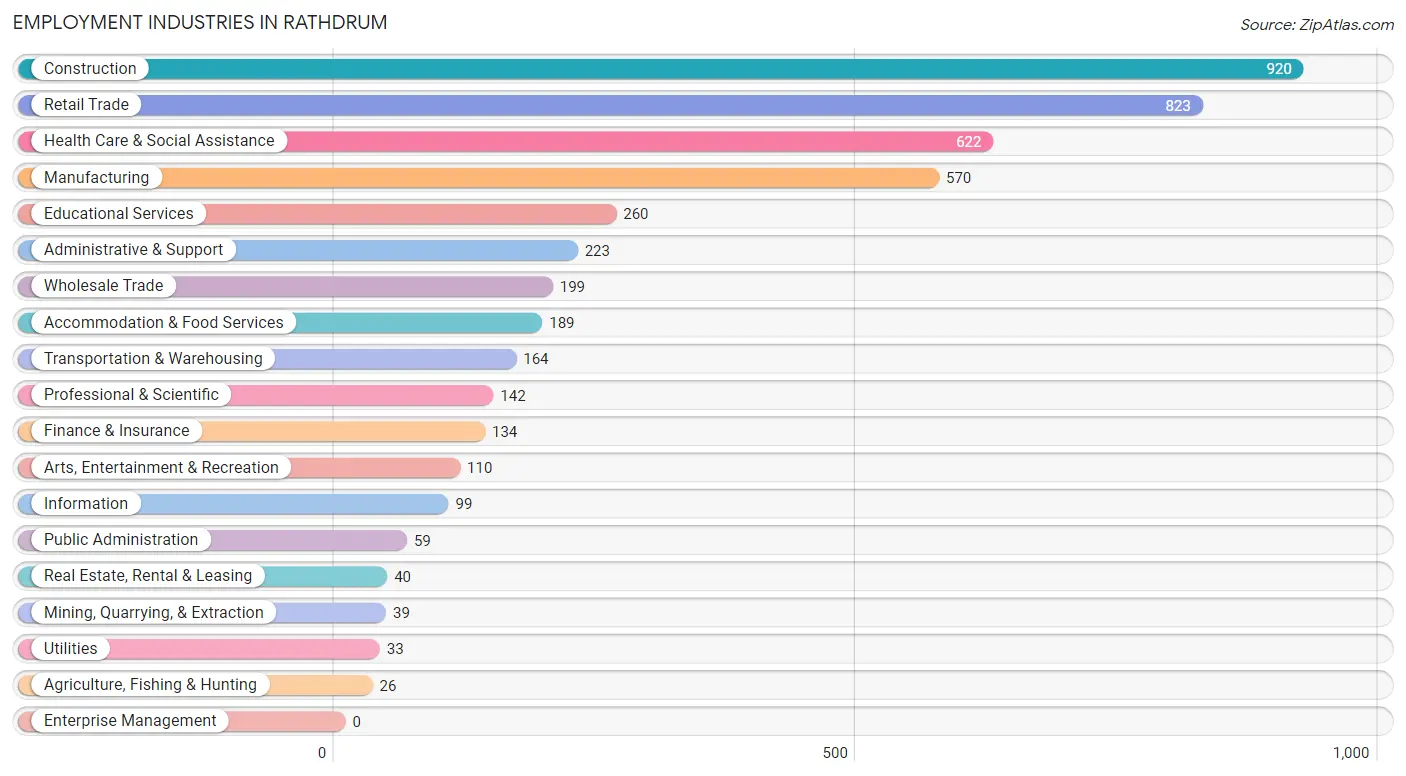
Employment Industries in Rathdrum
The major employment industries in Rathdrum include Construction (920 | 18.4%), Retail Trade (823 | 16.5%), Health Care & Social Assistance (622 | 12.5%), Manufacturing (570 | 11.4%), and Educational Services (260 | 5.2%).
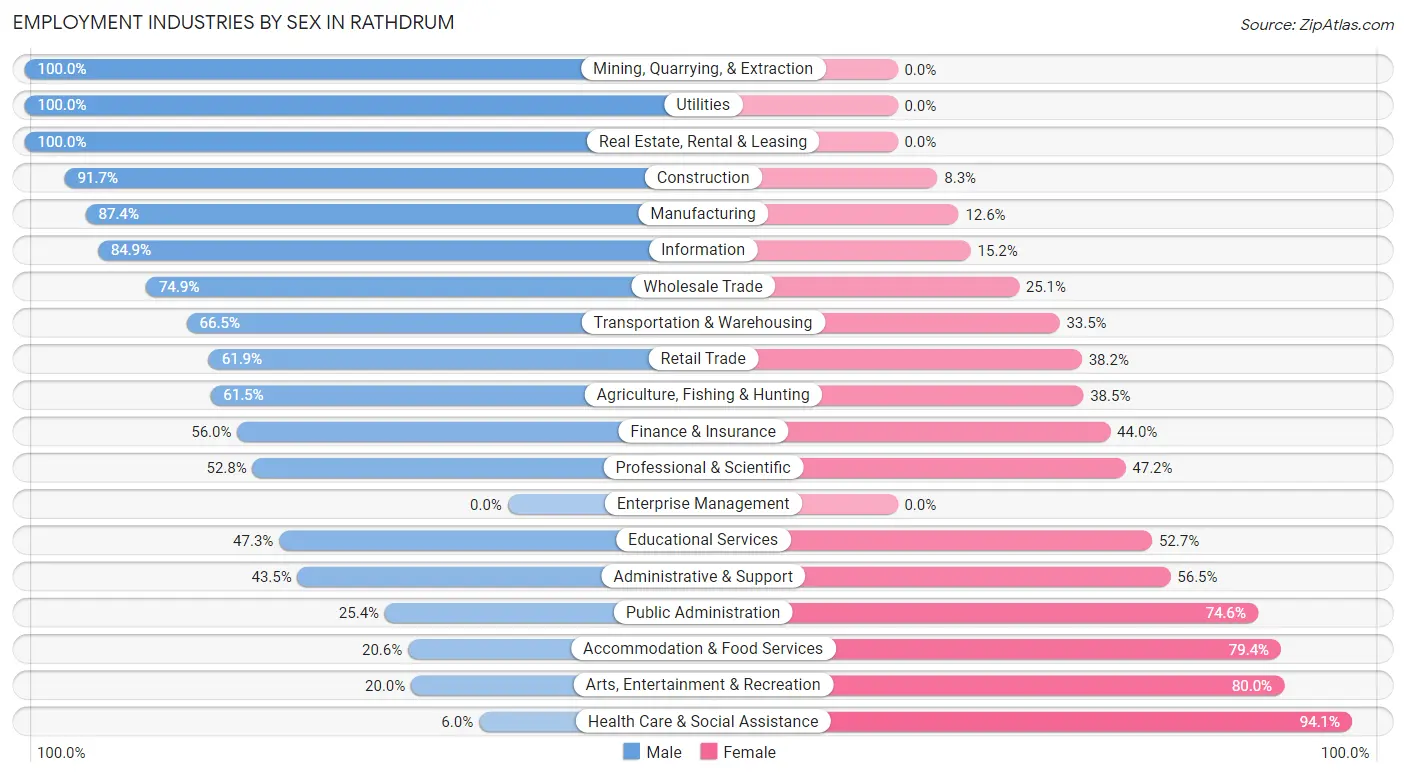
Employment Industries by Sex in Rathdrum
The Rathdrum industries that see more men than women are Mining, Quarrying, & Extraction (100.0%), Utilities (100.0%), and Real Estate, Rental & Leasing (100.0%), whereas the industries that tend to have a higher number of women are Health Care & Social Assistance (94.1%), Arts, Entertainment & Recreation (80.0%), and Accommodation & Food Services (79.4%).
| Industry | Male | Female |
| Agriculture, Fishing & Hunting | 16 (61.5%) | 10 (38.5%) |
| Mining, Quarrying, & Extraction | 39 (100.0%) | 0 (0.0%) |
| Construction | 844 (91.7%) | 76 (8.3%) |
| Manufacturing | 498 (87.4%) | 72 (12.6%) |
| Wholesale Trade | 149 (74.9%) | 50 (25.1%) |
| Retail Trade | 509 (61.9%) | 314 (38.2%) |
| Transportation & Warehousing | 109 (66.5%) | 55 (33.5%) |
| Utilities | 33 (100.0%) | 0 (0.0%) |
| Information | 84 (84.9%) | 15 (15.1%) |
| Finance & Insurance | 75 (56.0%) | 59 (44.0%) |
| Real Estate, Rental & Leasing | 40 (100.0%) | 0 (0.0%) |
| Professional & Scientific | 75 (52.8%) | 67 (47.2%) |
| Enterprise Management | 0 (0.0%) | 0 (0.0%) |
| Administrative & Support | 97 (43.5%) | 126 (56.5%) |
| Educational Services | 123 (47.3%) | 137 (52.7%) |
| Health Care & Social Assistance | 37 (5.9%) | 585 (94.1%) |
| Arts, Entertainment & Recreation | 22 (20.0%) | 88 (80.0%) |
| Accommodation & Food Services | 39 (20.6%) | 150 (79.4%) |
| Public Administration | 15 (25.4%) | 44 (74.6%) |
| Total | 3,066 (61.5%) | 1,922 (38.5%) |
Education in Rathdrum
School Enrollment in Rathdrum
The most common levels of schooling among the 1,946 students in Rathdrum are high school (535 | 27.5%), elementary school (492 | 25.3%), and college / undergraduate (293 | 15.1%).
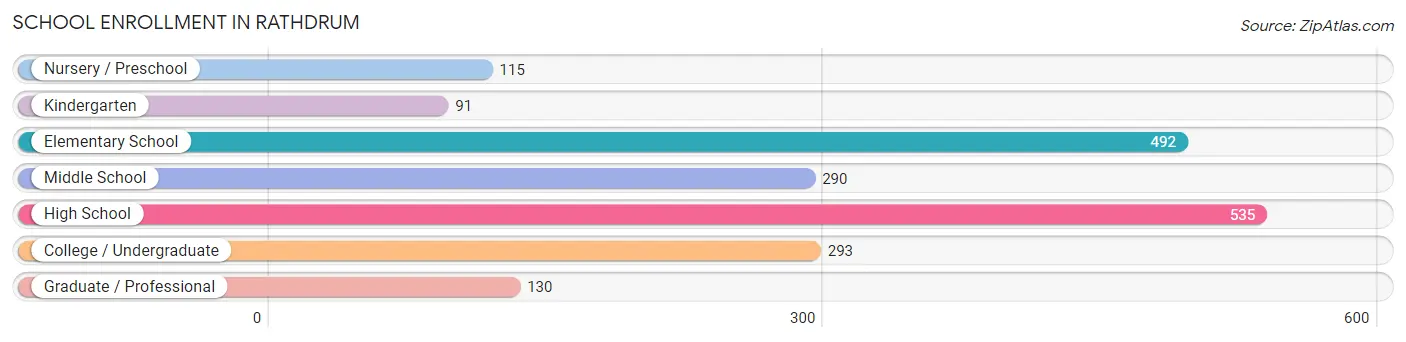
| School Level | # Students | % Students |
| Nursery / Preschool | 115 | 5.9% |
| Kindergarten | 91 | 4.7% |
| Elementary School | 492 | 25.3% |
| Middle School | 290 | 14.9% |
| High School | 535 | 27.5% |
| College / Undergraduate | 293 | 15.1% |
| Graduate / Professional | 130 | 6.7% |
| Total | 1,946 | 100.0% |
School Enrollment by Age by Funding Source in Rathdrum
Out of a total of 1,946 students who are enrolled in schools in Rathdrum, 430 (22.1%) attend a private institution, while the remaining 1,516 (77.9%) are enrolled in public schools. The age group of 3 to 4 year olds has the highest likelihood of being enrolled in private schools, with 79 (100.0% in the age bracket) enrolled. Conversely, the age group of 20 to 24 year olds has the lowest likelihood of being enrolled in a private school, with 41 (100.0% in the age bracket) attending a public institution.
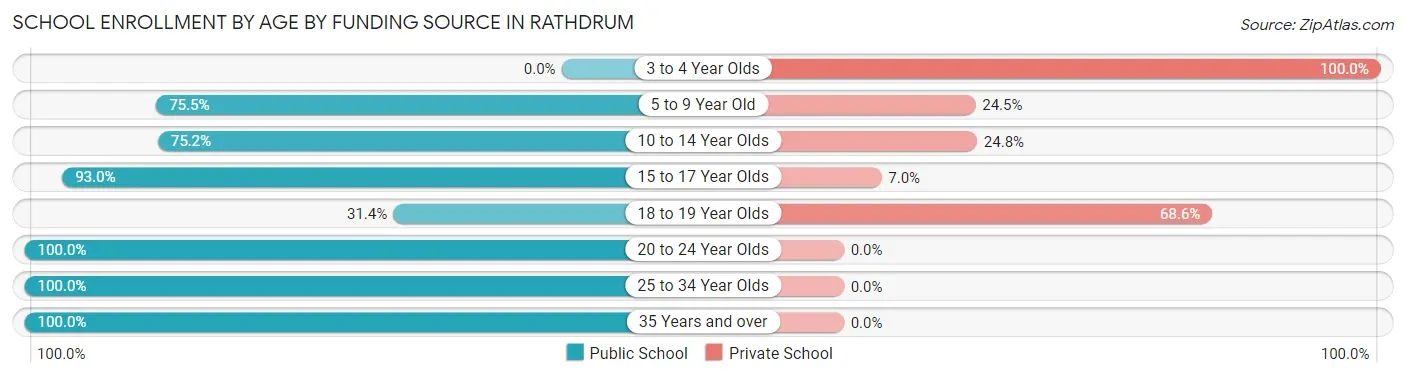
| Age Bracket | Public School | Private School |
| 3 to 4 Year Olds | 0 (0.0%) | 79 (100.0%) |
| 5 to 9 Year Old | 354 (75.5%) | 115 (24.5%) |
| 10 to 14 Year Olds | 421 (75.2%) | 139 (24.8%) |
| 15 to 17 Year Olds | 371 (93.0%) | 28 (7.0%) |
| 18 to 19 Year Olds | 32 (31.4%) | 70 (68.6%) |
| 20 to 24 Year Olds | 41 (100.0%) | 0 (0.0%) |
| 25 to 34 Year Olds | 163 (100.0%) | 0 (0.0%) |
| 35 Years and over | 133 (100.0%) | 0 (0.0%) |
| Total | 1,516 (77.9%) | 430 (22.1%) |
Educational Attainment by Field of Study in Rathdrum
Education (273 | 21.7%), science & technology (271 | 21.5%), business (123 | 9.8%), physical & health sciences (118 | 9.4%), and bio, nature & agricultural (109 | 8.7%) are the most common fields of study among 1,258 individuals in Rathdrum who have obtained a bachelor's degree or higher.
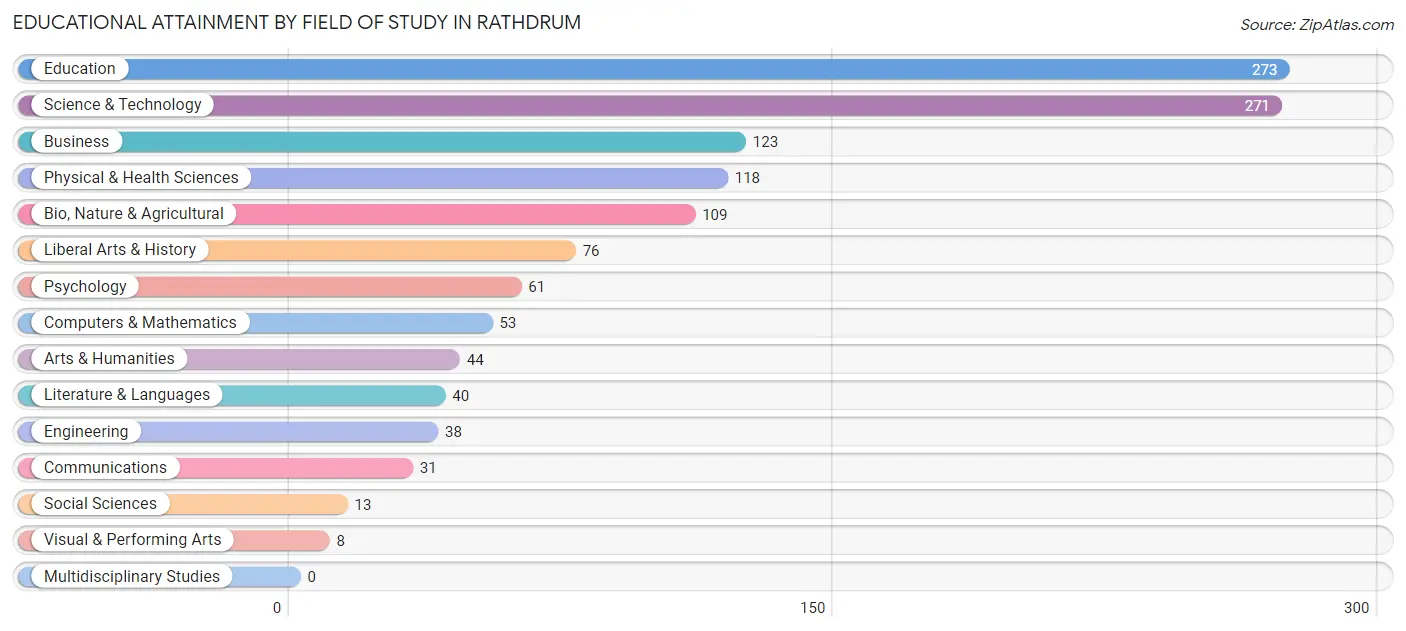
| Field of Study | # Graduates | % Graduates |
| Computers & Mathematics | 53 | 4.2% |
| Bio, Nature & Agricultural | 109 | 8.7% |
| Physical & Health Sciences | 118 | 9.4% |
| Psychology | 61 | 4.9% |
| Social Sciences | 13 | 1.0% |
| Engineering | 38 | 3.0% |
| Multidisciplinary Studies | 0 | 0.0% |
| Science & Technology | 271 | 21.5% |
| Business | 123 | 9.8% |
| Education | 273 | 21.7% |
| Literature & Languages | 40 | 3.2% |
| Liberal Arts & History | 76 | 6.0% |
| Visual & Performing Arts | 8 | 0.6% |
| Communications | 31 | 2.5% |
| Arts & Humanities | 44 | 3.5% |
| Total | 1,258 | 100.0% |
Transportation & Commute in Rathdrum
Vehicle Availability by Sex in Rathdrum
The most prevalent vehicle ownership categories in Rathdrum are males with 2 vehicles (1,193, accounting for 38.9%) and females with 2 vehicles (893, making up 62.6%).
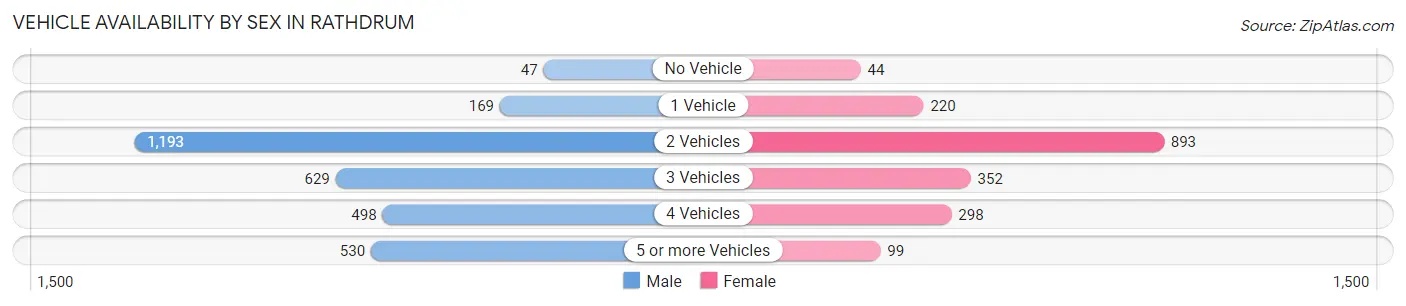
| Vehicles Available | Male | Female |
| No Vehicle | 47 (1.5%) | 44 (2.3%) |
| 1 Vehicle | 169 (5.5%) | 220 (11.5%) |
| 2 Vehicles | 1,193 (38.9%) | 893 (46.9%) |
| 3 Vehicles | 629 (20.5%) | 352 (18.5%) |
| 4 Vehicles | 498 (16.2%) | 298 (15.6%) |
| 5 or more Vehicles | 530 (17.3%) | 99 (5.2%) |
| Total | 3,066 (100.0%) | 1,906 (100.0%) |
Commute Time in Rathdrum
The most frequently occuring commute durations in Rathdrum are 15 to 19 minutes (823 commuters, 17.8%), 20 to 24 minutes (779 commuters, 16.9%), and 30 to 34 minutes (768 commuters, 16.6%).
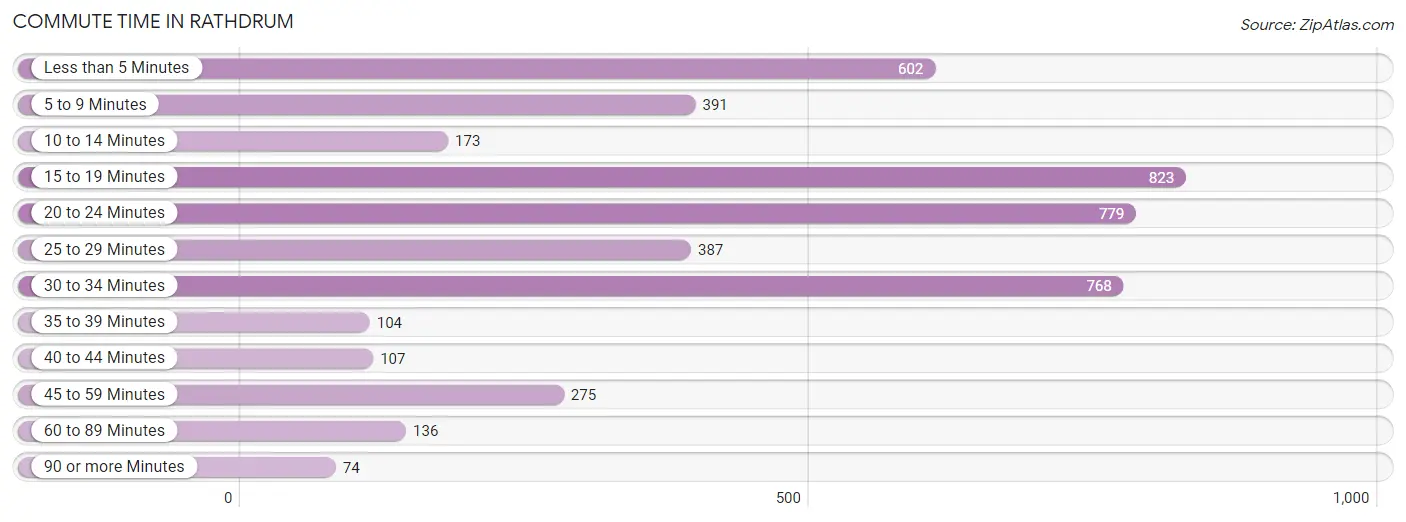
| Commute Time | # Commuters | % Commuters |
| Less than 5 Minutes | 602 | 13.0% |
| 5 to 9 Minutes | 391 | 8.5% |
| 10 to 14 Minutes | 173 | 3.7% |
| 15 to 19 Minutes | 823 | 17.8% |
| 20 to 24 Minutes | 779 | 16.9% |
| 25 to 29 Minutes | 387 | 8.4% |
| 30 to 34 Minutes | 768 | 16.6% |
| 35 to 39 Minutes | 104 | 2.2% |
| 40 to 44 Minutes | 107 | 2.3% |
| 45 to 59 Minutes | 275 | 5.9% |
| 60 to 89 Minutes | 136 | 2.9% |
| 90 or more Minutes | 74 | 1.6% |
Commute Time by Sex in Rathdrum
The most common commute times in Rathdrum are 15 to 19 minutes (565 commuters, 19.9%) for males and 20 to 24 minutes (430 commuters, 24.1%) for females.
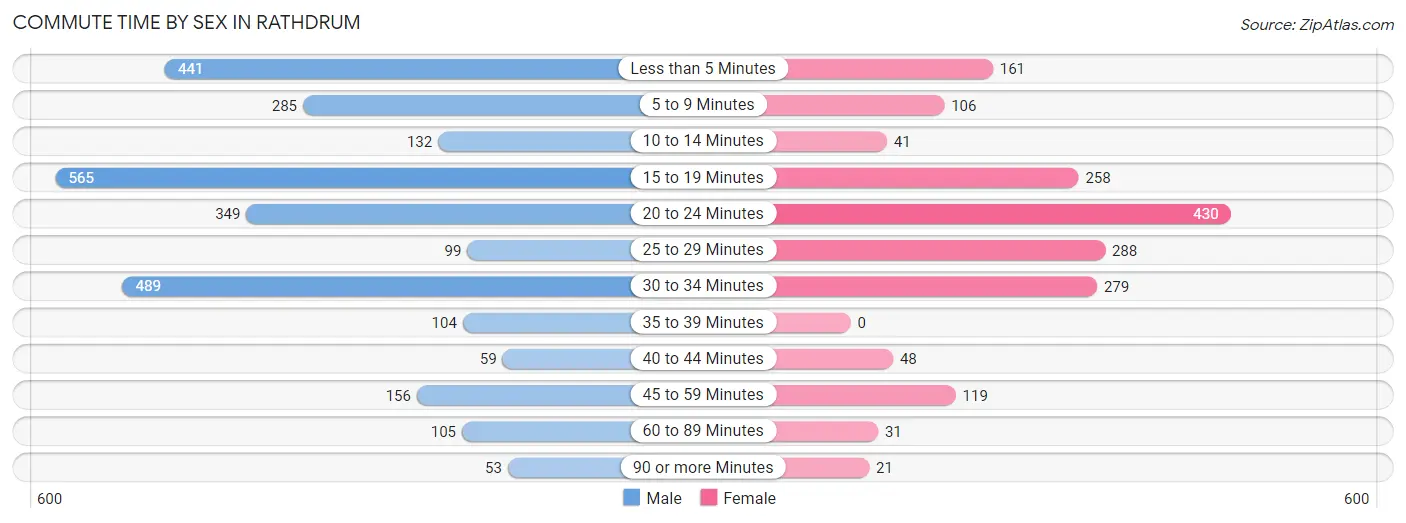
| Commute Time | Male | Female |
| Less than 5 Minutes | 441 (15.5%) | 161 (9.0%) |
| 5 to 9 Minutes | 285 (10.1%) | 106 (5.9%) |
| 10 to 14 Minutes | 132 (4.6%) | 41 (2.3%) |
| 15 to 19 Minutes | 565 (19.9%) | 258 (14.5%) |
| 20 to 24 Minutes | 349 (12.3%) | 430 (24.1%) |
| 25 to 29 Minutes | 99 (3.5%) | 288 (16.2%) |
| 30 to 34 Minutes | 489 (17.2%) | 279 (15.7%) |
| 35 to 39 Minutes | 104 (3.7%) | 0 (0.0%) |
| 40 to 44 Minutes | 59 (2.1%) | 48 (2.7%) |
| 45 to 59 Minutes | 156 (5.5%) | 119 (6.7%) |
| 60 to 89 Minutes | 105 (3.7%) | 31 (1.7%) |
| 90 or more Minutes | 53 (1.9%) | 21 (1.2%) |
Time of Departure to Work by Sex in Rathdrum
The most frequent times of departure to work in Rathdrum are 6:00 AM to 6:29 AM (425, 15.0%) for males and 7:00 AM to 7:29 AM (311, 17.4%) for females.
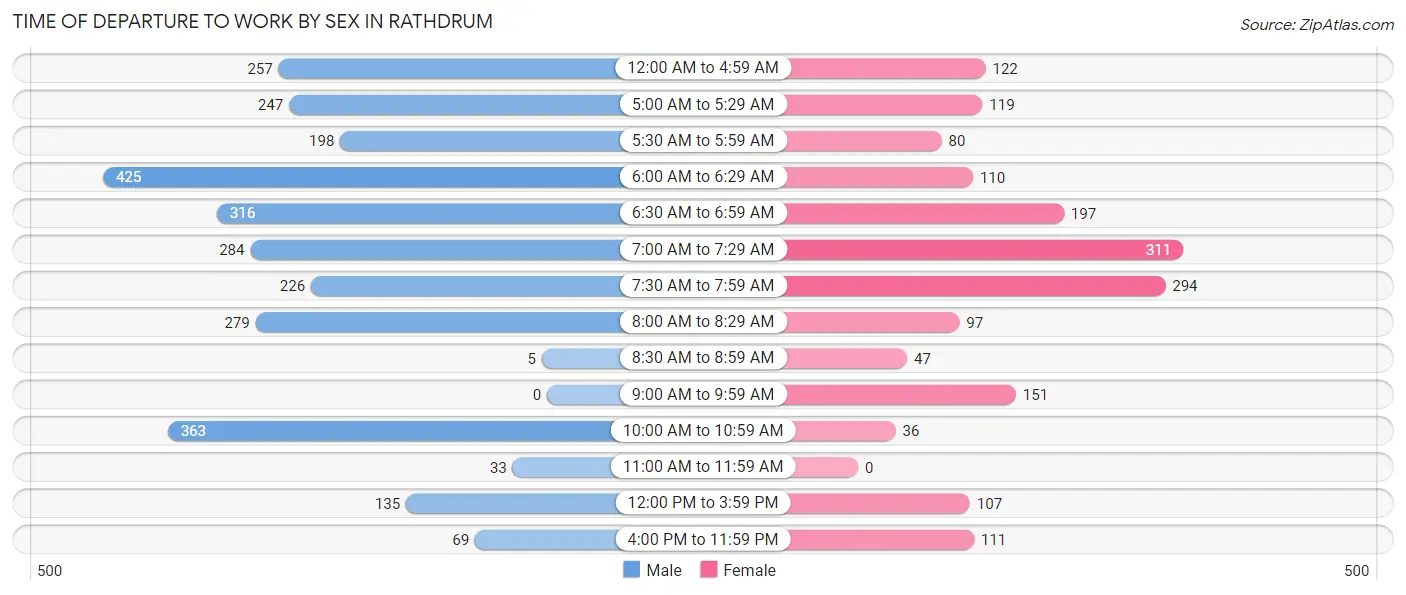
| Time of Departure | Male | Female |
| 12:00 AM to 4:59 AM | 257 (9.1%) | 122 (6.9%) |
| 5:00 AM to 5:29 AM | 247 (8.7%) | 119 (6.7%) |
| 5:30 AM to 5:59 AM | 198 (7.0%) | 80 (4.5%) |
| 6:00 AM to 6:29 AM | 425 (15.0%) | 110 (6.2%) |
| 6:30 AM to 6:59 AM | 316 (11.1%) | 197 (11.1%) |
| 7:00 AM to 7:29 AM | 284 (10.0%) | 311 (17.4%) |
| 7:30 AM to 7:59 AM | 226 (8.0%) | 294 (16.5%) |
| 8:00 AM to 8:29 AM | 279 (9.8%) | 97 (5.4%) |
| 8:30 AM to 8:59 AM | 5 (0.2%) | 47 (2.6%) |
| 9:00 AM to 9:59 AM | 0 (0.0%) | 151 (8.5%) |
| 10:00 AM to 10:59 AM | 363 (12.8%) | 36 (2.0%) |
| 11:00 AM to 11:59 AM | 33 (1.2%) | 0 (0.0%) |
| 12:00 PM to 3:59 PM | 135 (4.8%) | 107 (6.0%) |
| 4:00 PM to 11:59 PM | 69 (2.4%) | 111 (6.2%) |
| Total | 2,837 (100.0%) | 1,782 (100.0%) |
Housing Occupancy in Rathdrum
Occupancy by Ownership in Rathdrum
Of the total 3,454 dwellings in Rathdrum, owner-occupied units account for 2,747 (79.5%), while renter-occupied units make up 707 (20.5%).
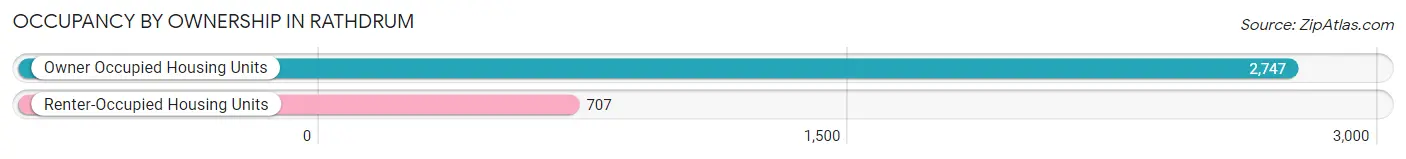
| Occupancy | # Housing Units | % Housing Units |
| Owner Occupied Housing Units | 2,747 | 79.5% |
| Renter-Occupied Housing Units | 707 | 20.5% |
| Total Occupied Housing Units | 3,454 | 100.0% |
Occupancy by Household Size in Rathdrum
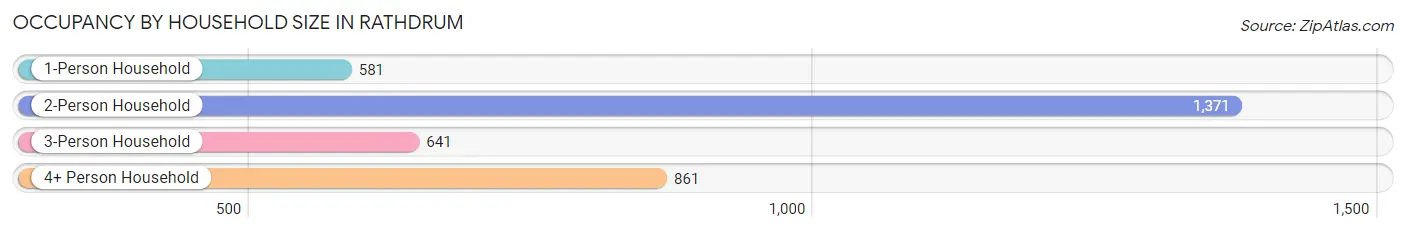
| Household Size | # Housing Units | % Housing Units |
| 1-Person Household | 581 | 16.8% |
| 2-Person Household | 1,371 | 39.7% |
| 3-Person Household | 641 | 18.6% |
| 4+ Person Household | 861 | 24.9% |
| Total Housing Units | 3,454 | 100.0% |
Occupancy by Ownership by Household Size in Rathdrum
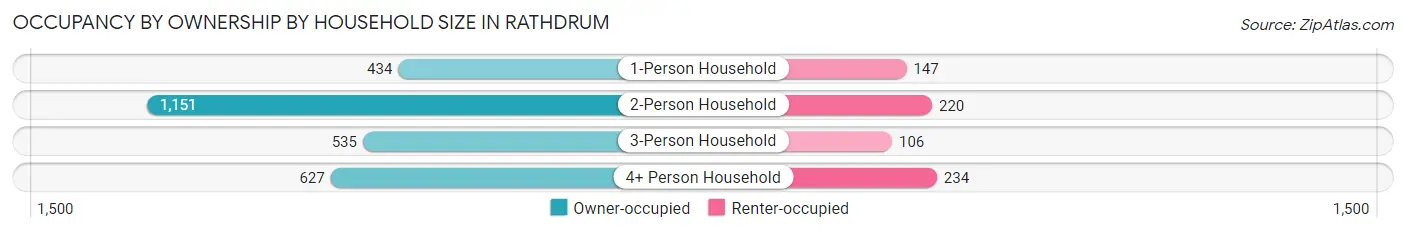
| Household Size | Owner-occupied | Renter-occupied |
| 1-Person Household | 434 (74.7%) | 147 (25.3%) |
| 2-Person Household | 1,151 (84.0%) | 220 (16.1%) |
| 3-Person Household | 535 (83.5%) | 106 (16.5%) |
| 4+ Person Household | 627 (72.8%) | 234 (27.2%) |
| Total Housing Units | 2,747 (79.5%) | 707 (20.5%) |
Occupancy by Educational Attainment in Rathdrum
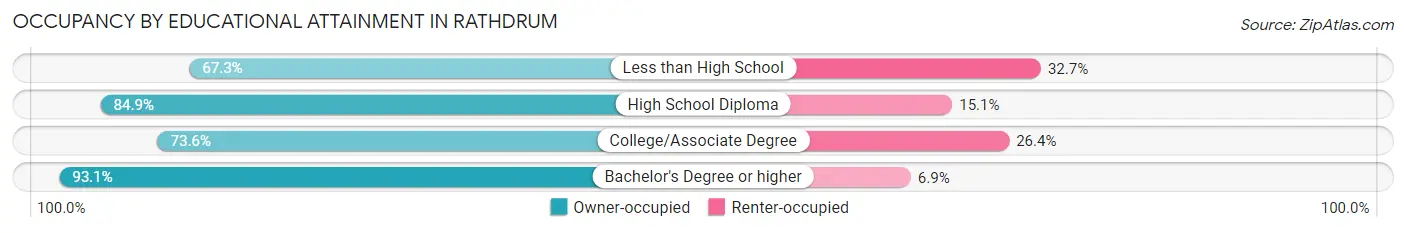
| Household Size | Owner-occupied | Renter-occupied |
| Less than High School | 241 (67.3%) | 117 (32.7%) |
| High School Diploma | 726 (84.9%) | 129 (15.1%) |
| College/Associate Degree | 1,158 (73.6%) | 415 (26.4%) |
| Bachelor's Degree or higher | 622 (93.1%) | 46 (6.9%) |
Occupancy by Age of Householder in Rathdrum
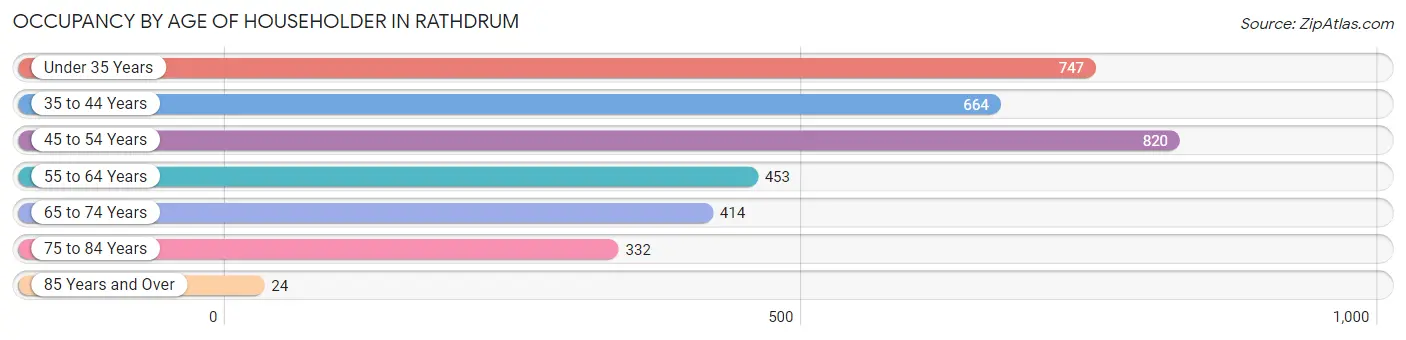
| Age Bracket | # Households | % Households |
| Under 35 Years | 747 | 21.6% |
| 35 to 44 Years | 664 | 19.2% |
| 45 to 54 Years | 820 | 23.7% |
| 55 to 64 Years | 453 | 13.1% |
| 65 to 74 Years | 414 | 12.0% |
| 75 to 84 Years | 332 | 9.6% |
| 85 Years and Over | 24 | 0.7% |
| Total | 3,454 | 100.0% |
Housing Finances in Rathdrum
Median Income by Occupancy in Rathdrum
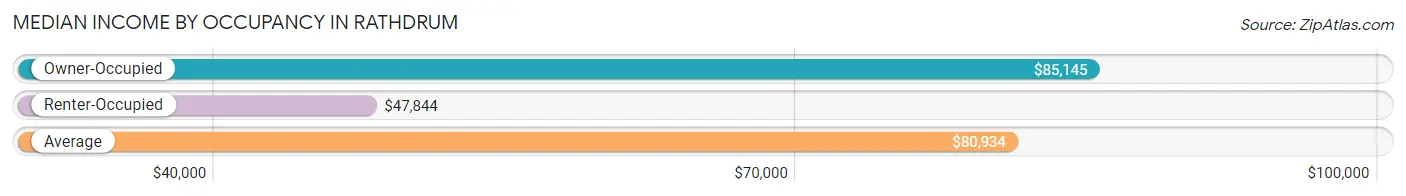
| Occupancy Type | # Households | Median Income |
| Owner-Occupied | 2,747 (79.5%) | $85,145 |
| Renter-Occupied | 707 (20.5%) | $47,844 |
| Average | 3,454 (100.0%) | $80,934 |
Occupancy by Householder Income Bracket in Rathdrum
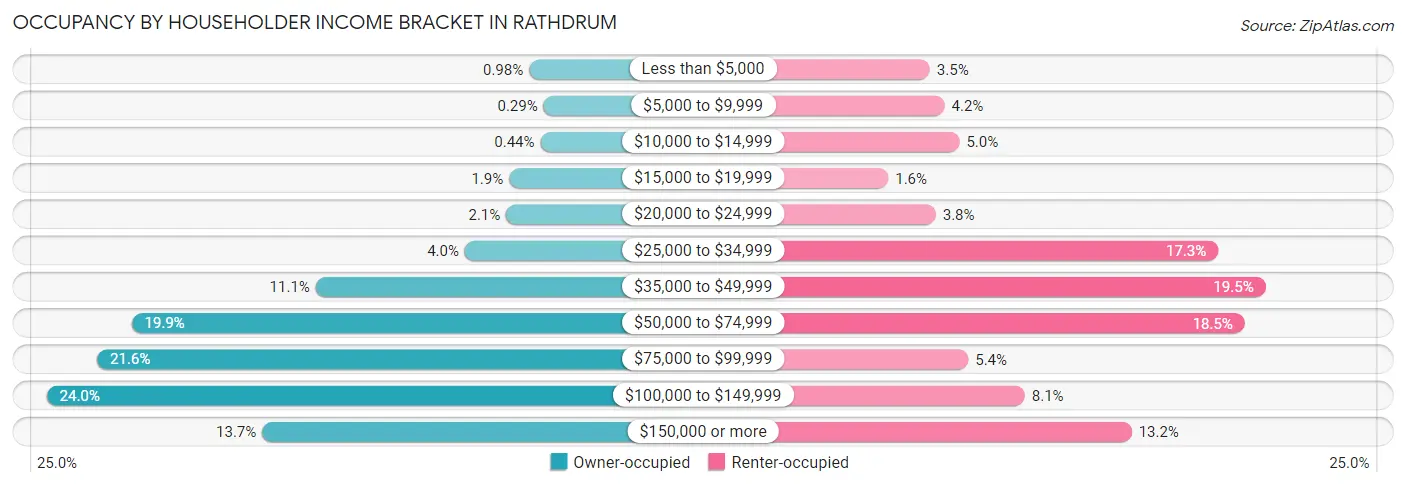
| Income Bracket | Owner-occupied | Renter-occupied |
| Less than $5,000 | 27 (1.0%) | 25 (3.5%) |
| $5,000 to $9,999 | 8 (0.3%) | 30 (4.2%) |
| $10,000 to $14,999 | 12 (0.4%) | 35 (5.0%) |
| $15,000 to $19,999 | 53 (1.9%) | 11 (1.6%) |
| $20,000 to $24,999 | 57 (2.1%) | 27 (3.8%) |
| $25,000 to $34,999 | 111 (4.0%) | 122 (17.3%) |
| $35,000 to $49,999 | 306 (11.1%) | 138 (19.5%) |
| $50,000 to $74,999 | 547 (19.9%) | 131 (18.5%) |
| $75,000 to $99,999 | 592 (21.5%) | 38 (5.4%) |
| $100,000 to $149,999 | 658 (23.9%) | 57 (8.1%) |
| $150,000 or more | 376 (13.7%) | 93 (13.2%) |
| Total | 2,747 (100.0%) | 707 (100.0%) |
Monthly Housing Cost Tiers in Rathdrum
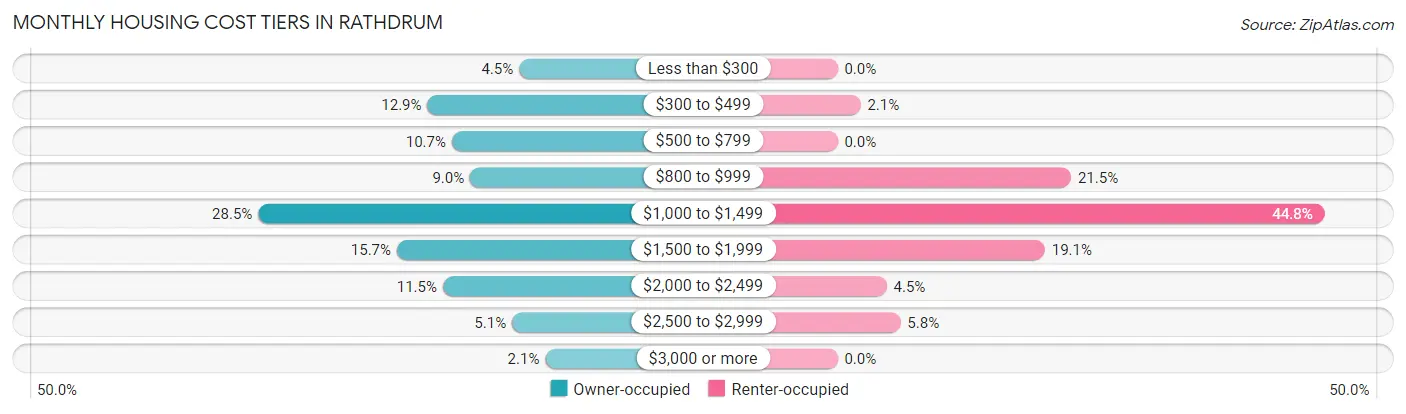
| Monthly Cost | Owner-occupied | Renter-occupied |
| Less than $300 | 123 (4.5%) | 0 (0.0%) |
| $300 to $499 | 355 (12.9%) | 15 (2.1%) |
| $500 to $799 | 293 (10.7%) | 0 (0.0%) |
| $800 to $999 | 247 (9.0%) | 152 (21.5%) |
| $1,000 to $1,499 | 783 (28.5%) | 317 (44.8%) |
| $1,500 to $1,999 | 432 (15.7%) | 135 (19.1%) |
| $2,000 to $2,499 | 316 (11.5%) | 32 (4.5%) |
| $2,500 to $2,999 | 141 (5.1%) | 41 (5.8%) |
| $3,000 or more | 57 (2.1%) | 0 (0.0%) |
| Total | 2,747 (100.0%) | 707 (100.0%) |
Physical Housing Characteristics in Rathdrum
Housing Structures in Rathdrum
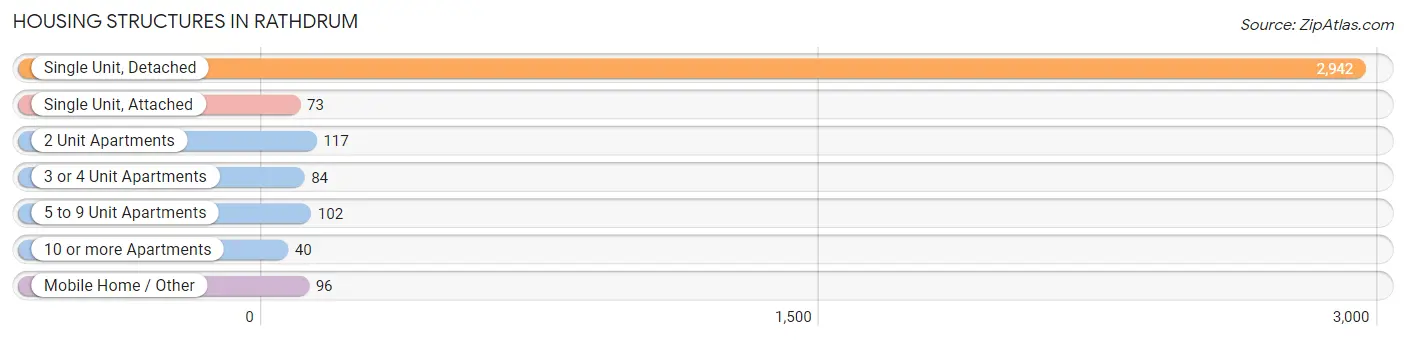
| Structure Type | # Housing Units | % Housing Units |
| Single Unit, Detached | 2,942 | 85.2% |
| Single Unit, Attached | 73 | 2.1% |
| 2 Unit Apartments | 117 | 3.4% |
| 3 or 4 Unit Apartments | 84 | 2.4% |
| 5 to 9 Unit Apartments | 102 | 2.9% |
| 10 or more Apartments | 40 | 1.2% |
| Mobile Home / Other | 96 | 2.8% |
| Total | 3,454 | 100.0% |
Housing Structures by Occupancy in Rathdrum
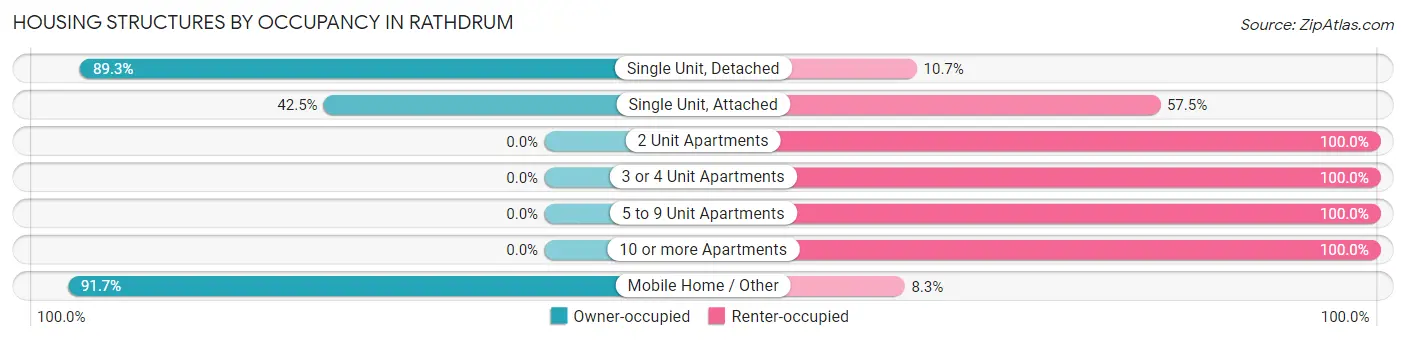
| Structure Type | Owner-occupied | Renter-occupied |
| Single Unit, Detached | 2,628 (89.3%) | 314 (10.7%) |
| Single Unit, Attached | 31 (42.5%) | 42 (57.5%) |
| 2 Unit Apartments | 0 (0.0%) | 117 (100.0%) |
| 3 or 4 Unit Apartments | 0 (0.0%) | 84 (100.0%) |
| 5 to 9 Unit Apartments | 0 (0.0%) | 102 (100.0%) |
| 10 or more Apartments | 0 (0.0%) | 40 (100.0%) |
| Mobile Home / Other | 88 (91.7%) | 8 (8.3%) |
| Total | 2,747 (79.5%) | 707 (20.5%) |
Housing Structures by Number of Rooms in Rathdrum
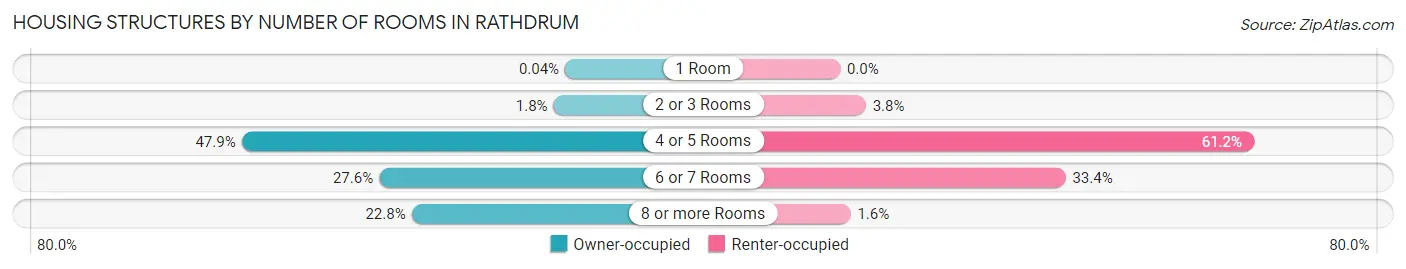
| Number of Rooms | Owner-occupied | Renter-occupied |
| 1 Room | 1 (0.0%) | 0 (0.0%) |
| 2 or 3 Rooms | 48 (1.8%) | 27 (3.8%) |
| 4 or 5 Rooms | 1,316 (47.9%) | 433 (61.2%) |
| 6 or 7 Rooms | 757 (27.6%) | 236 (33.4%) |
| 8 or more Rooms | 625 (22.8%) | 11 (1.6%) |
| Total | 2,747 (100.0%) | 707 (100.0%) |
Housing Structure by Heating Type in Rathdrum
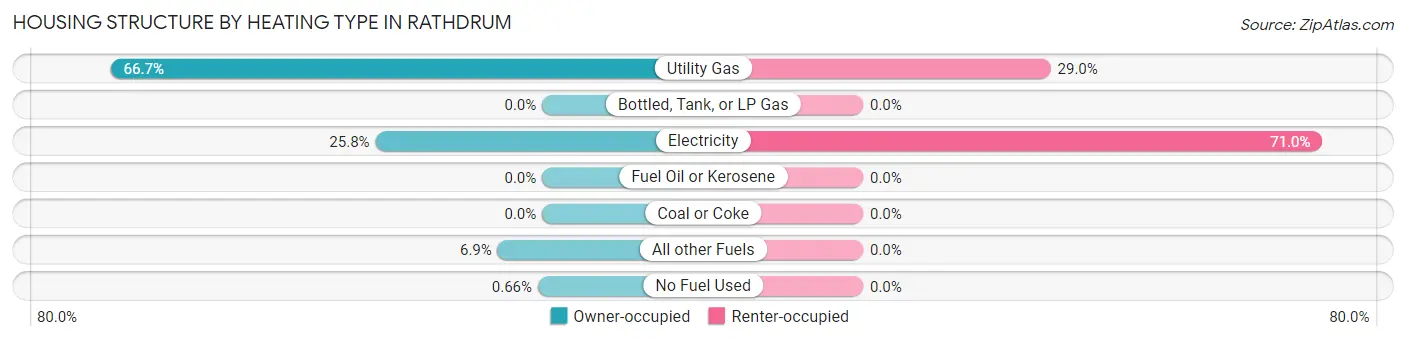
| Heating Type | Owner-occupied | Renter-occupied |
| Utility Gas | 1,832 (66.7%) | 205 (29.0%) |
| Bottled, Tank, or LP Gas | 0 (0.0%) | 0 (0.0%) |
| Electricity | 708 (25.8%) | 502 (71.0%) |
| Fuel Oil or Kerosene | 0 (0.0%) | 0 (0.0%) |
| Coal or Coke | 0 (0.0%) | 0 (0.0%) |
| All other Fuels | 189 (6.9%) | 0 (0.0%) |
| No Fuel Used | 18 (0.7%) | 0 (0.0%) |
| Total | 2,747 (100.0%) | 707 (100.0%) |
Household Vehicle Usage in Rathdrum
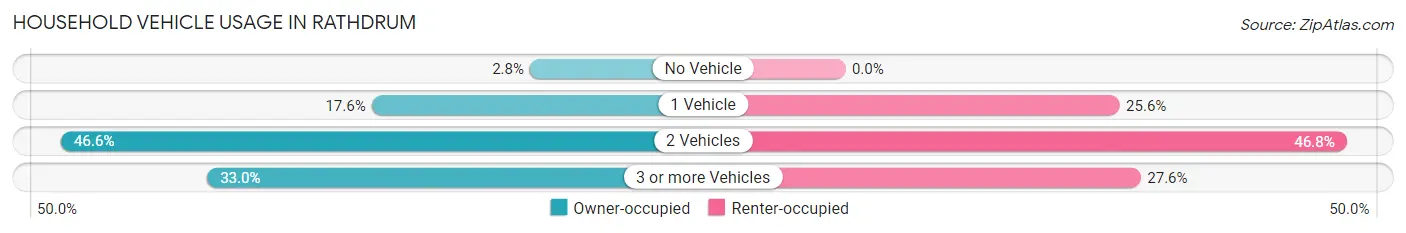
| Vehicles per Household | Owner-occupied | Renter-occupied |
| No Vehicle | 78 (2.8%) | 0 (0.0%) |
| 1 Vehicle | 484 (17.6%) | 181 (25.6%) |
| 2 Vehicles | 1,280 (46.6%) | 331 (46.8%) |
| 3 or more Vehicles | 905 (33.0%) | 195 (27.6%) |
| Total | 2,747 (100.0%) | 707 (100.0%) |
Real Estate & Mortgages in Rathdrum
Real Estate and Mortgage Overview in Rathdrum
| Characteristic | Without Mortgage | With Mortgage |
| Housing Units | 793 | 1,954 |
| Median Property Value | $300,300 | $344,900 |
| Median Household Income | $74,495 | $309 |
| Monthly Housing Costs | $468 | $57 |
| Real Estate Taxes | $1,863 | $21 |
Property Value by Mortgage Status in Rathdrum
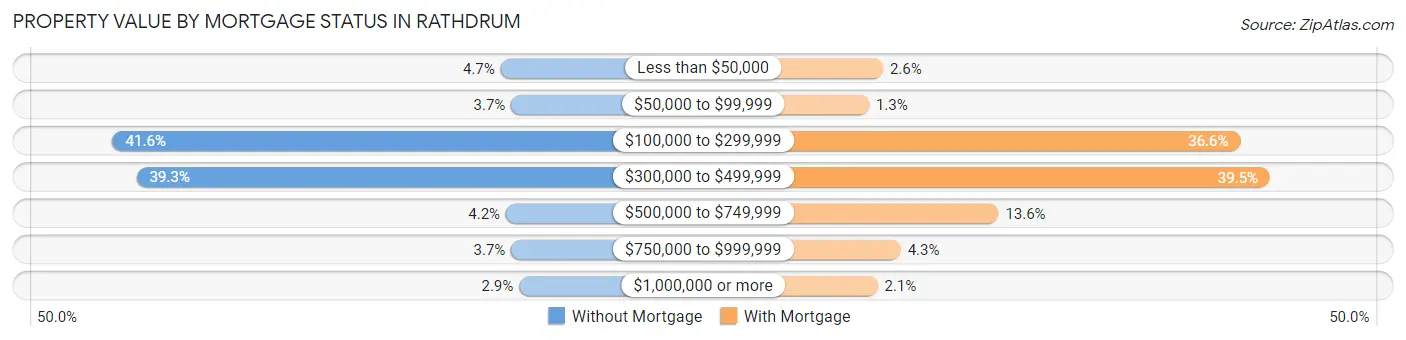
| Property Value | Without Mortgage | With Mortgage |
| Less than $50,000 | 37 (4.7%) | 51 (2.6%) |
| $50,000 to $99,999 | 29 (3.7%) | 25 (1.3%) |
| $100,000 to $299,999 | 330 (41.6%) | 716 (36.6%) |
| $300,000 to $499,999 | 312 (39.3%) | 771 (39.5%) |
| $500,000 to $749,999 | 33 (4.2%) | 266 (13.6%) |
| $750,000 to $999,999 | 29 (3.7%) | 84 (4.3%) |
| $1,000,000 or more | 23 (2.9%) | 41 (2.1%) |
| Total | 793 (100.0%) | 1,954 (100.0%) |
Household Income by Mortgage Status in Rathdrum
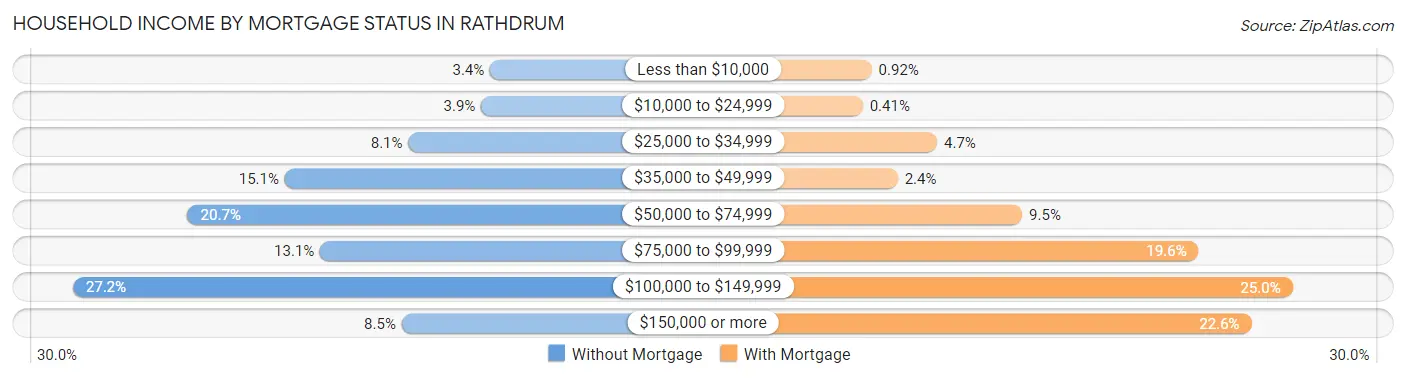
| Household Income | Without Mortgage | With Mortgage |
| Less than $10,000 | 27 (3.4%) | 18 (0.9%) |
| $10,000 to $24,999 | 31 (3.9%) | 8 (0.4%) |
| $25,000 to $34,999 | 64 (8.1%) | 91 (4.7%) |
| $35,000 to $49,999 | 120 (15.1%) | 47 (2.4%) |
| $50,000 to $74,999 | 164 (20.7%) | 186 (9.5%) |
| $75,000 to $99,999 | 104 (13.1%) | 383 (19.6%) |
| $100,000 to $149,999 | 216 (27.2%) | 488 (25.0%) |
| $150,000 or more | 67 (8.5%) | 442 (22.6%) |
| Total | 793 (100.0%) | 1,954 (100.0%) |
Property Value to Household Income Ratio in Rathdrum
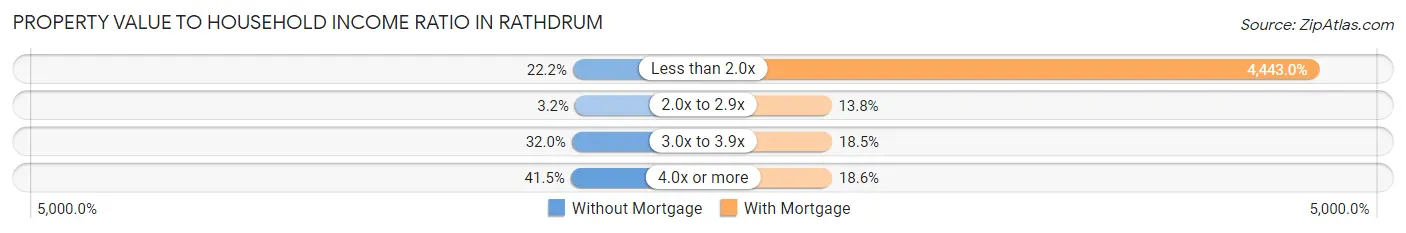
| Value-to-Income Ratio | Without Mortgage | With Mortgage |
| Less than 2.0x | 176 (22.2%) | 86,816 (4,443.0%) |
| 2.0x to 2.9x | 25 (3.2%) | 269 (13.8%) |
| 3.0x to 3.9x | 254 (32.0%) | 362 (18.5%) |
| 4.0x or more | 329 (41.5%) | 363 (18.6%) |
| Total | 793 (100.0%) | 1,954 (100.0%) |
Real Estate Taxes by Mortgage Status in Rathdrum
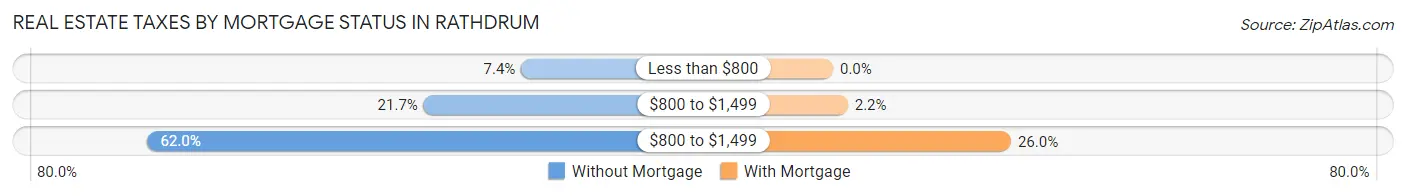
| Property Taxes | Without Mortgage | With Mortgage |
| Less than $800 | 59 (7.4%) | 0 (0.0%) |
| $800 to $1,499 | 172 (21.7%) | 42 (2.1%) |
| $800 to $1,499 | 492 (62.0%) | 508 (26.0%) |
| Total | 793 (100.0%) | 1,954 (100.0%) |
Health & Disability in Rathdrum
Health Insurance Coverage by Age in Rathdrum
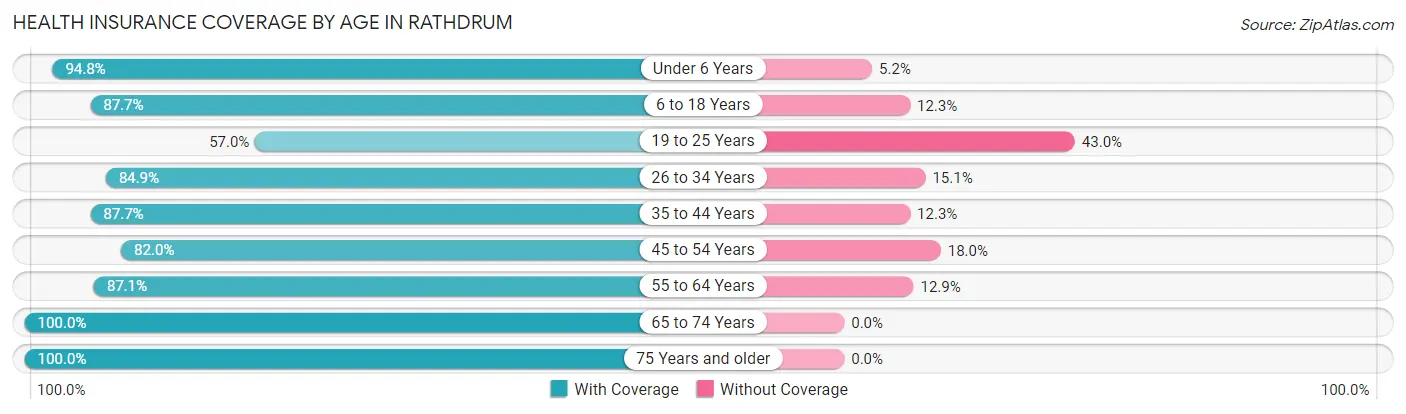
| Age Bracket | With Coverage | Without Coverage |
| Under 6 Years | 856 (94.8%) | 47 (5.2%) |
| 6 to 18 Years | 1,231 (87.7%) | 172 (12.3%) |
| 19 to 25 Years | 525 (57.0%) | 396 (43.0%) |
| 26 to 34 Years | 1,115 (84.9%) | 199 (15.1%) |
| 35 to 44 Years | 1,257 (87.7%) | 176 (12.3%) |
| 45 to 54 Years | 1,012 (82.0%) | 222 (18.0%) |
| 55 to 64 Years | 843 (87.1%) | 125 (12.9%) |
| 65 to 74 Years | 876 (100.0%) | 0 (0.0%) |
| 75 Years and older | 504 (100.0%) | 0 (0.0%) |
| Total | 8,219 (86.0%) | 1,337 (14.0%) |
Health Insurance Coverage by Citizenship Status in Rathdrum
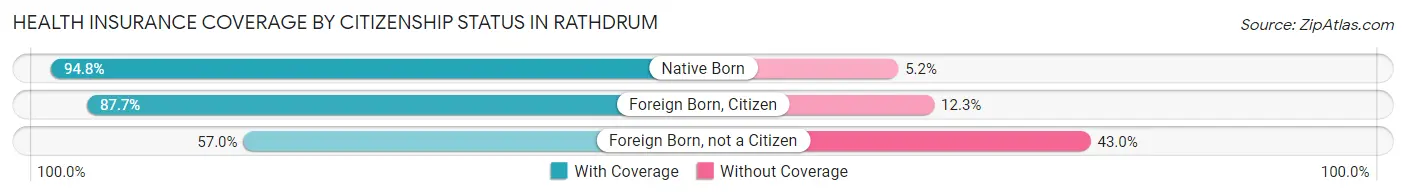
| Citizenship Status | With Coverage | Without Coverage |
| Native Born | 856 (94.8%) | 47 (5.2%) |
| Foreign Born, Citizen | 1,231 (87.7%) | 172 (12.3%) |
| Foreign Born, not a Citizen | 525 (57.0%) | 396 (43.0%) |
Health Insurance Coverage by Household Income in Rathdrum
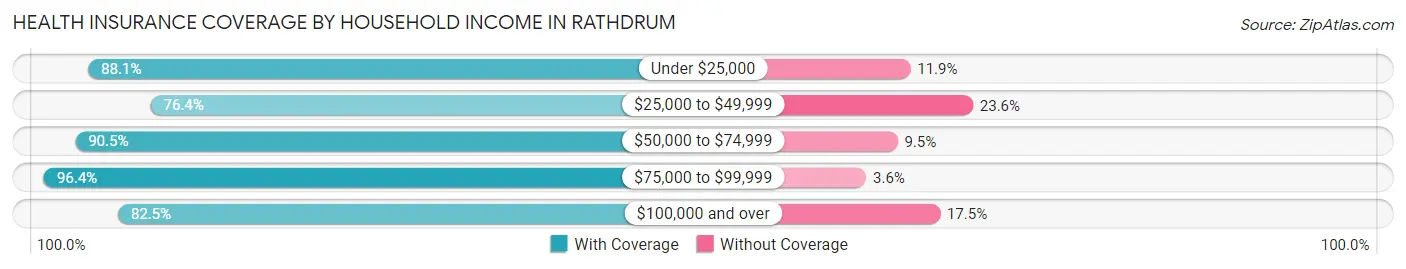
| Household Income | With Coverage | Without Coverage |
| Under $25,000 | 511 (88.1%) | 69 (11.9%) |
| $25,000 to $49,999 | 1,048 (76.4%) | 324 (23.6%) |
| $50,000 to $74,999 | 1,450 (90.5%) | 152 (9.5%) |
| $75,000 to $99,999 | 1,782 (96.4%) | 67 (3.6%) |
| $100,000 and over | 3,428 (82.5%) | 725 (17.5%) |
Public vs Private Health Insurance Coverage by Age in Rathdrum
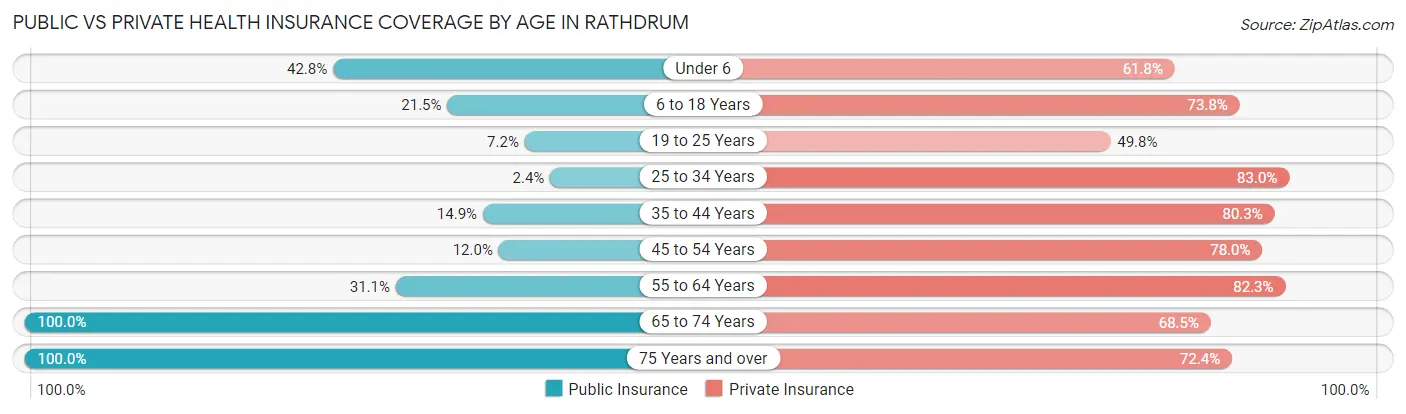
| Age Bracket | Public Insurance | Private Insurance |
| Under 6 | 386 (42.7%) | 558 (61.8%) |
| 6 to 18 Years | 302 (21.5%) | 1,036 (73.8%) |
| 19 to 25 Years | 66 (7.2%) | 459 (49.8%) |
| 25 to 34 Years | 32 (2.4%) | 1,091 (83.0%) |
| 35 to 44 Years | 214 (14.9%) | 1,151 (80.3%) |
| 45 to 54 Years | 148 (12.0%) | 963 (78.0%) |
| 55 to 64 Years | 301 (31.1%) | 797 (82.3%) |
| 65 to 74 Years | 876 (100.0%) | 600 (68.5%) |
| 75 Years and over | 504 (100.0%) | 365 (72.4%) |
| Total | 2,829 (29.6%) | 7,020 (73.5%) |
Disability Status by Sex by Age in Rathdrum
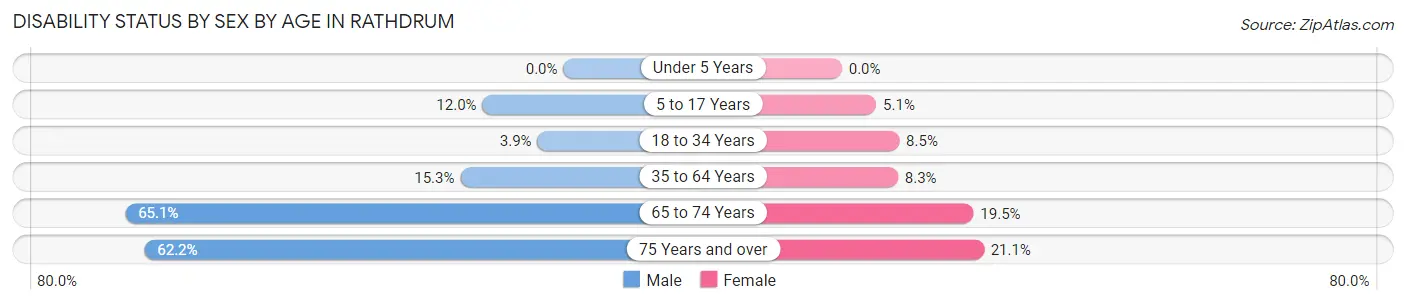
| Age Bracket | Male | Female |
| Under 5 Years | 0 (0.0%) | 0 (0.0%) |
| 5 to 17 Years | 88 (12.0%) | 42 (5.1%) |
| 18 to 34 Years | 57 (3.8%) | 67 (8.5%) |
| 35 to 64 Years | 308 (15.3%) | 135 (8.3%) |
| 65 to 74 Years | 257 (65.1%) | 94 (19.5%) |
| 75 Years and over | 163 (62.2%) | 51 (21.1%) |
Disability Class by Sex by Age in Rathdrum
Disability Class: Hearing Difficulty
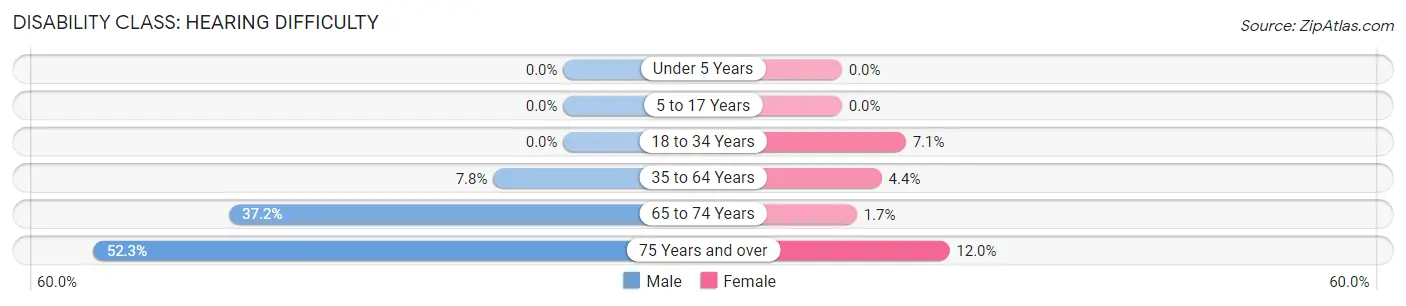
| Age Bracket | Male | Female |
| Under 5 Years | 0 (0.0%) | 0 (0.0%) |
| 5 to 17 Years | 0 (0.0%) | 0 (0.0%) |
| 18 to 34 Years | 0 (0.0%) | 56 (7.1%) |
| 35 to 64 Years | 157 (7.8%) | 72 (4.4%) |
| 65 to 74 Years | 147 (37.2%) | 8 (1.7%) |
| 75 Years and over | 137 (52.3%) | 29 (12.0%) |
Disability Class: Vision Difficulty
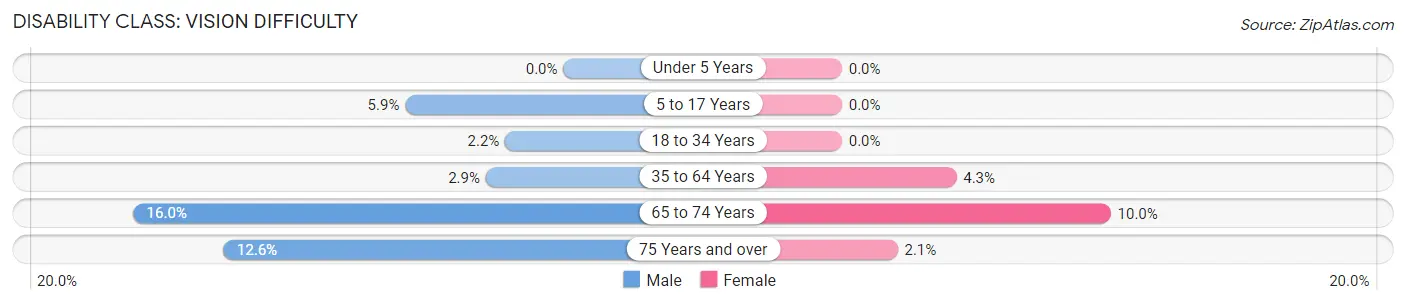
| Age Bracket | Male | Female |
| Under 5 Years | 0 (0.0%) | 0 (0.0%) |
| 5 to 17 Years | 43 (5.9%) | 0 (0.0%) |
| 18 to 34 Years | 32 (2.2%) | 0 (0.0%) |
| 35 to 64 Years | 58 (2.9%) | 69 (4.3%) |
| 65 to 74 Years | 63 (16.0%) | 48 (10.0%) |
| 75 Years and over | 33 (12.6%) | 5 (2.1%) |
Disability Class: Cognitive Difficulty
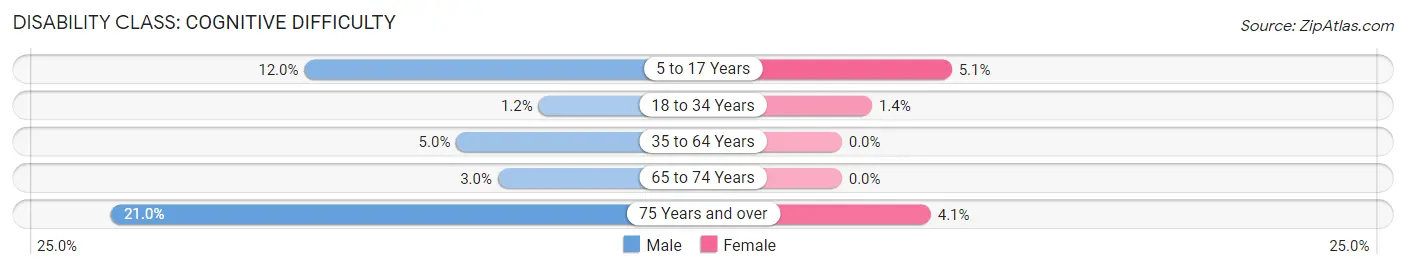
| Age Bracket | Male | Female |
| 5 to 17 Years | 88 (12.0%) | 42 (5.1%) |
| 18 to 34 Years | 17 (1.1%) | 11 (1.4%) |
| 35 to 64 Years | 100 (5.0%) | 0 (0.0%) |
| 65 to 74 Years | 12 (3.0%) | 0 (0.0%) |
| 75 Years and over | 55 (21.0%) | 10 (4.1%) |
Disability Class: Ambulatory Difficulty
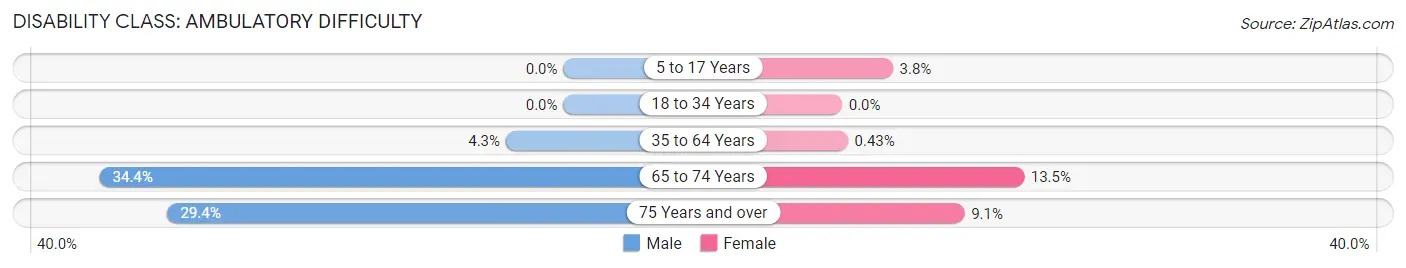
| Age Bracket | Male | Female |
| 5 to 17 Years | 0 (0.0%) | 31 (3.8%) |
| 18 to 34 Years | 0 (0.0%) | 0 (0.0%) |
| 35 to 64 Years | 86 (4.3%) | 7 (0.4%) |
| 65 to 74 Years | 136 (34.4%) | 65 (13.5%) |
| 75 Years and over | 77 (29.4%) | 22 (9.1%) |
Disability Class: Self-Care Difficulty
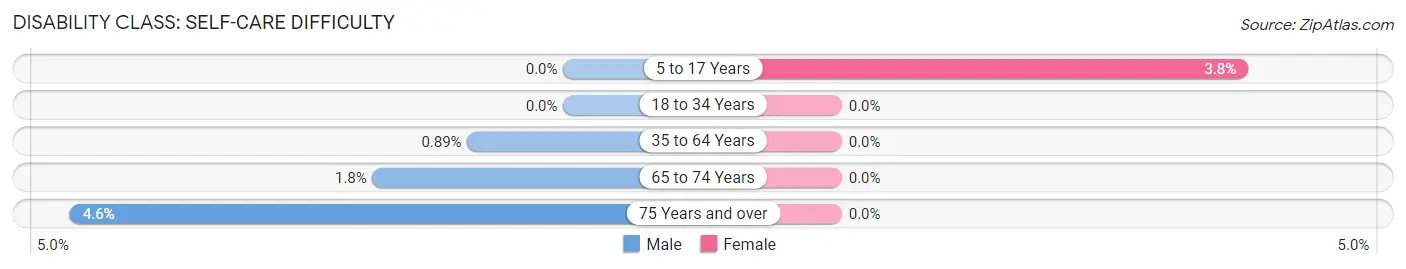
| Age Bracket | Male | Female |
| 5 to 17 Years | 0 (0.0%) | 31 (3.8%) |
| 18 to 34 Years | 0 (0.0%) | 0 (0.0%) |
| 35 to 64 Years | 18 (0.9%) | 0 (0.0%) |
| 65 to 74 Years | 7 (1.8%) | 0 (0.0%) |
| 75 Years and over | 12 (4.6%) | 0 (0.0%) |
Technology Access in Rathdrum
Computing Device Access in Rathdrum
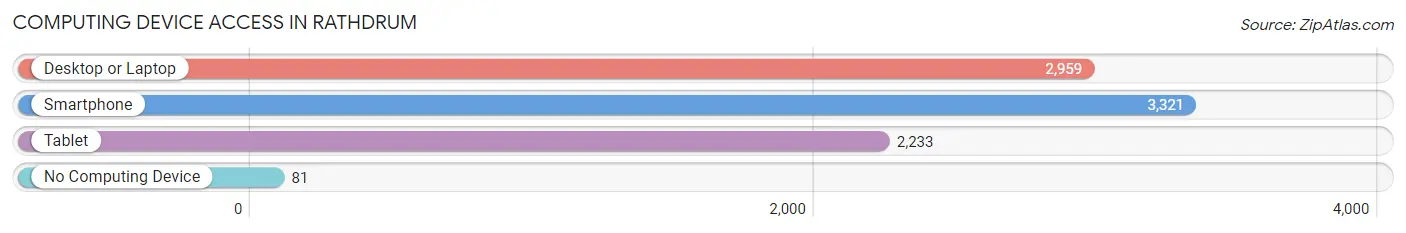
| Device Type | # Households | % Households |
| Desktop or Laptop | 2,959 | 85.7% |
| Smartphone | 3,321 | 96.2% |
| Tablet | 2,233 | 64.6% |
| No Computing Device | 81 | 2.4% |
| Total | 3,454 | 100.0% |
Internet Access in Rathdrum
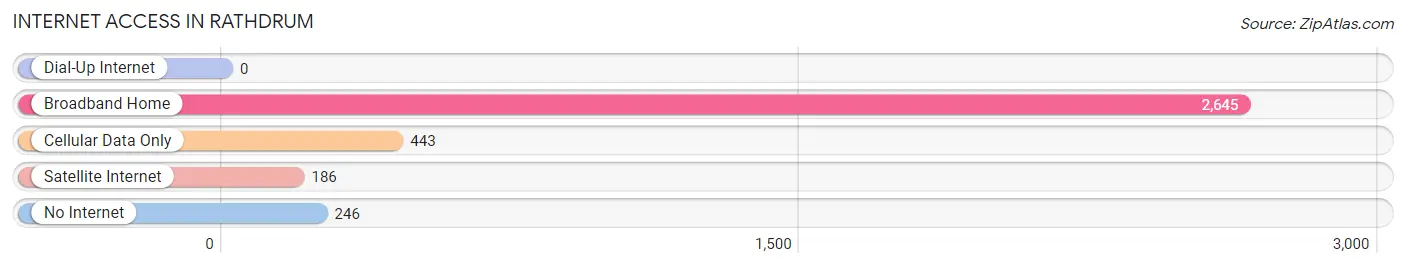
| Internet Type | # Households | % Households |
| Dial-Up Internet | 0 | 0.0% |
| Broadband Home | 2,645 | 76.6% |
| Cellular Data Only | 443 | 12.8% |
| Satellite Internet | 186 | 5.4% |
| No Internet | 246 | 7.1% |
| Total | 3,454 | 100.0% |
Rathdrum Summary
Rathdrum is a city located in Kootenai County, Idaho, United States. The population was 4,494 at the 2010 census. Rathdrum is located in the northern part of the state, approximately 20 miles east of Coeur d'Alene and 30 miles west of Spokane, Washington.
History
Rathdrum was first settled in 1879 by a group of Irish immigrants led by John and Mary O'Rourke. The O'Rourkes named the settlement after their hometown of Rathdrum, County Wicklow, Ireland. The settlement was officially incorporated as a city in 1901.
Rathdrum was an important stop on the Spokane and Northern Railway, which connected Spokane to the mining towns of the Coeur d'Alene Mountains. The railway was completed in 1887 and was the first rail line to connect the Coeur d'Alene region to the rest of the country.
Geography
Rathdrum is located at an elevation of 2,541 feet (774 m) above sea level. The city is situated in the Rathdrum Prairie, a large grassland that stretches from the Coeur d'Alene Mountains to the Idaho-Washington border. The prairie is home to a variety of wildlife, including elk, deer, and moose.
The city is located at the intersection of U.S. Route 41 and Idaho State Highway 53. The Spokane River is located approximately 10 miles to the east of Rathdrum.
Economy
Rathdrum is home to a variety of businesses, including manufacturing, retail, and service industries. The city is also home to a number of agricultural operations, including dairy farms, cattle ranches, and hay farms.
The city is also home to a number of recreational activities, including golf courses, parks, and trails. The nearby Coeur d'Alene Mountains offer a variety of outdoor activities, including hiking, camping, and fishing.
Demographics
As of the 2010 census, there were 4,494 people, 1,845 households, and 1,213 families residing in the city. The population density was 1,092.3 people per square mile (421.7/km2). The racial makeup of the city was 94.2% White, 0.4% African American, 0.7% Native American, 0.7% Asian, 0.1% Pacific Islander, 1.2% from other races, and 2.7% from two or more races. Hispanic or Latino of any race were 4.2% of the population.
The median income for a household in the city was $41,944, and the median income for a family was $50,938. Males had a median income of $37,917 versus $25,917 for females. The per capita income for the city was $20,945. About 8.2% of families and 10.3% of the population were below the poverty line, including 14.2% of those under age 18 and 6.2% of those age 65 or over.
Conclusion
Rathdrum is a city located in Kootenai County, Idaho, United States. The city has a rich history, having been settled by Irish immigrants in 1879 and officially incorporated as a city in 1901. The city is situated in the Rathdrum Prairie, a large grassland that stretches from the Coeur d'Alene Mountains to the Idaho-Washington border. The city is home to a variety of businesses, including manufacturing, retail, and service industries, as well as a number of agricultural operations. The population of Rathdrum was 4,494 at the 2010 census, with a median household income of $41,944 and a median family income of $50,938. The city is home to a variety of recreational activities, including golf courses, parks, and trails, as well as outdoor activities in the nearby Coeur d'Alene Mountains.
Common Questions
What is Per Capita Income in Rathdrum?
Per Capita income in Rathdrum is $34,508.
What is the Median Family Income in Rathdrum?
Median Family Income in Rathdrum is $83,827.
What is the Median Household income in Rathdrum?
Median Household Income in Rathdrum is $80,934.
What is Income or Wage Gap in Rathdrum?
Income or Wage Gap in Rathdrum is 31.3%.
Women in Rathdrum earn 68.7 cents for every dollar earned by a man.
What is Inequality or Gini Index in Rathdrum?
Inequality or Gini Index in Rathdrum is 0.36.
What is the Total Population of Rathdrum?
Total Population of Rathdrum is 9,556.
What is the Total Male Population of Rathdrum?
Total Male Population of Rathdrum is 5,228.
What is the Total Female Population of Rathdrum?
Total Female Population of Rathdrum is 4,328.
What is the Ratio of Males per 100 Females in Rathdrum?
There are 120.79 Males per 100 Females in Rathdrum.
What is the Ratio of Females per 100 Males in Rathdrum?
There are 82.79 Females per 100 Males in Rathdrum.
What is the Median Population Age in Rathdrum?
Median Population Age in Rathdrum is 36.2 Years.
What is the Average Family Size in Rathdrum
Average Family Size in Rathdrum is 3.1 People.
What is the Average Household Size in Rathdrum
Average Household Size in Rathdrum is 2.8 People.
How Large is the Labor Force in Rathdrum?
There are 5,232 People in the Labor Forcein in Rathdrum.
What is the Percentage of People in the Labor Force in Rathdrum?
69.1% of People are in the Labor Force in Rathdrum.
What is the Unemployment Rate in Rathdrum?
Unemployment Rate in Rathdrum is 4.6%.