Burley, ID Map & Demographics
Burley Map
Burley Overview
$26,596
PER CAPITA INCOME
$64,788
AVG FAMILY INCOME
$58,889
AVG HOUSEHOLD INCOME
33.5%
WAGE / INCOME GAP [ % ]
66.5¢/ $1
WAGE / INCOME GAP [ $ ]
$13,190
FAMILY INCOME DEFICIT
0.45
INEQUALITY / GINI INDEX
11,506
TOTAL POPULATION
6,118
MALE POPULATION
5,388
FEMALE POPULATION
113.55
MALES / 100 FEMALES
88.07
FEMALES / 100 MALES
30.2
MEDIAN AGE
3.4
AVG FAMILY SIZE
2.9
AVG HOUSEHOLD SIZE
5,703
LABOR FORCE [ PEOPLE ]
66.9%
PERCENT IN LABOR FORCE
3.7%
UNEMPLOYMENT RATE
Burley Zip Codes
Burley Area Codes
Income in Burley
Income Overview in Burley
Per Capita Income in Burley is $26,596, while median incomes of families and households are $64,788 and $58,889 respectively.
| Characteristic | Number | Measure |
| Per Capita Income | 11,506 | $26,596 |
| Median Family Income | 2,789 | $64,788 |
| Mean Family Income | 2,789 | $73,749 |
| Median Household Income | 3,900 | $58,889 |
| Mean Household Income | 3,900 | $72,889 |
| Income Deficit | 2,789 | $13,190 |
| Wage / Income Gap (%) | 11,506 | 33.53% |
| Wage / Income Gap ($) | 11,506 | 66.47¢ per $1 |
| Gini / Inequality Index | 11,506 | 0.45 |
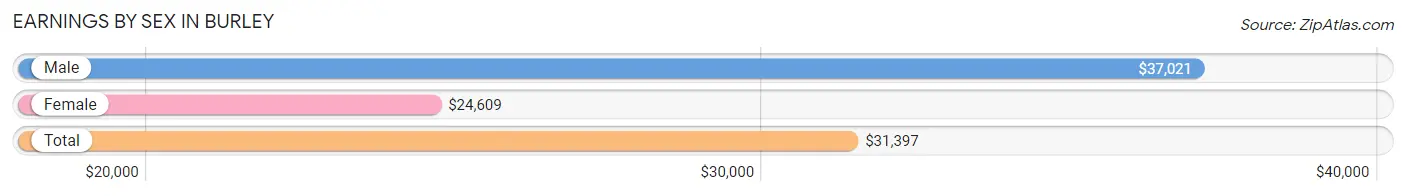
Earnings by Sex in Burley
Average Earnings in Burley are $31,397, $37,021 for men and $24,609 for women, a difference of 33.5%.
| Sex | Number | Average Earnings |
| Male | 3,427 (56.7%) | $37,021 |
| Female | 2,615 (43.3%) | $24,609 |
| Total | 6,042 (100.0%) | $31,397 |
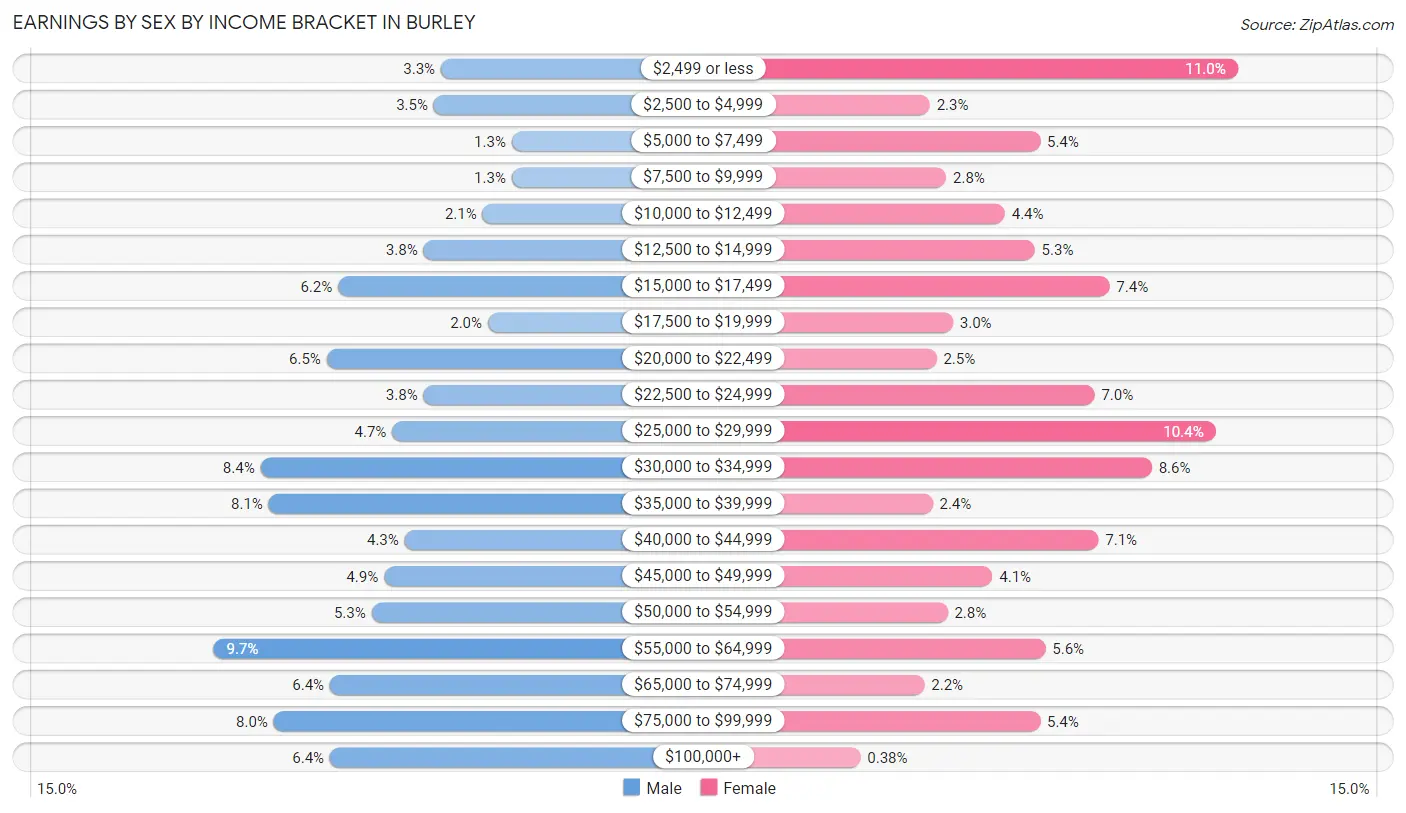
Earnings by Sex by Income Bracket in Burley
The most common earnings brackets in Burley are $55,000 to $64,999 for men (332 | 9.7%) and $2,499 or less for women (287 | 11.0%).
| Income | Male | Female |
| $2,499 or less | 113 (3.3%) | 287 (11.0%) |
| $2,500 to $4,999 | 120 (3.5%) | 61 (2.3%) |
| $5,000 to $7,499 | 45 (1.3%) | 142 (5.4%) |
| $7,500 to $9,999 | 45 (1.3%) | 73 (2.8%) |
| $10,000 to $12,499 | 73 (2.1%) | 116 (4.4%) |
| $12,500 to $14,999 | 130 (3.8%) | 138 (5.3%) |
| $15,000 to $17,499 | 212 (6.2%) | 193 (7.4%) |
| $17,500 to $19,999 | 68 (2.0%) | 78 (3.0%) |
| $20,000 to $22,499 | 223 (6.5%) | 66 (2.5%) |
| $22,500 to $24,999 | 130 (3.8%) | 182 (7.0%) |
| $25,000 to $29,999 | 160 (4.7%) | 271 (10.4%) |
| $30,000 to $34,999 | 287 (8.4%) | 224 (8.6%) |
| $35,000 to $39,999 | 279 (8.1%) | 63 (2.4%) |
| $40,000 to $44,999 | 148 (4.3%) | 185 (7.1%) |
| $45,000 to $49,999 | 168 (4.9%) | 107 (4.1%) |
| $50,000 to $54,999 | 180 (5.2%) | 74 (2.8%) |
| $55,000 to $64,999 | 332 (9.7%) | 146 (5.6%) |
| $65,000 to $74,999 | 220 (6.4%) | 57 (2.2%) |
| $75,000 to $99,999 | 274 (8.0%) | 142 (5.4%) |
| $100,000+ | 220 (6.4%) | 10 (0.4%) |
| Total | 3,427 (100.0%) | 2,615 (100.0%) |
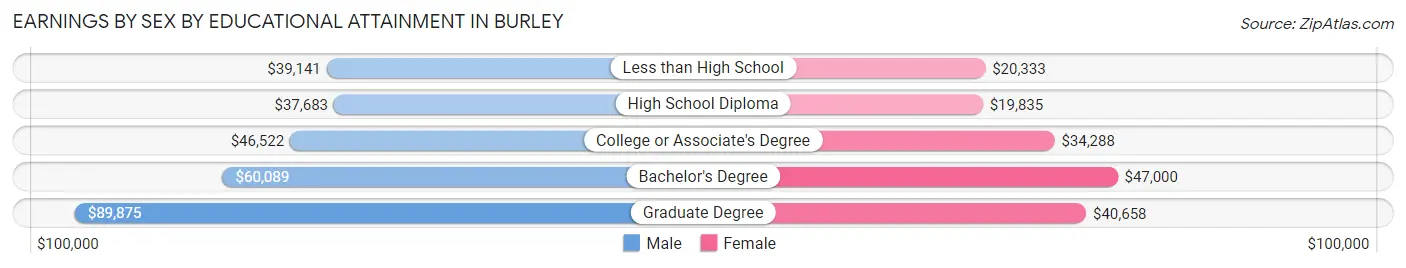
Earnings by Sex by Educational Attainment in Burley
Average earnings in Burley are $44,390 for men and $28,571 for women, a difference of 35.6%. Men with an educational attainment of graduate degree enjoy the highest average annual earnings of $89,875, while those with high school diploma education earn the least with $37,683. Women with an educational attainment of bachelor's degree earn the most with the average annual earnings of $47,000, while those with high school diploma education have the smallest earnings of $19,835.
| Educational Attainment | Male Income | Female Income |
| Less than High School | $39,141 | $20,333 |
| High School Diploma | $37,683 | $19,835 |
| College or Associate's Degree | $46,522 | $34,288 |
| Bachelor's Degree | $60,089 | $47,000 |
| Graduate Degree | $89,875 | $40,658 |
| Total | $44,390 | $28,571 |
Family Income in Burley
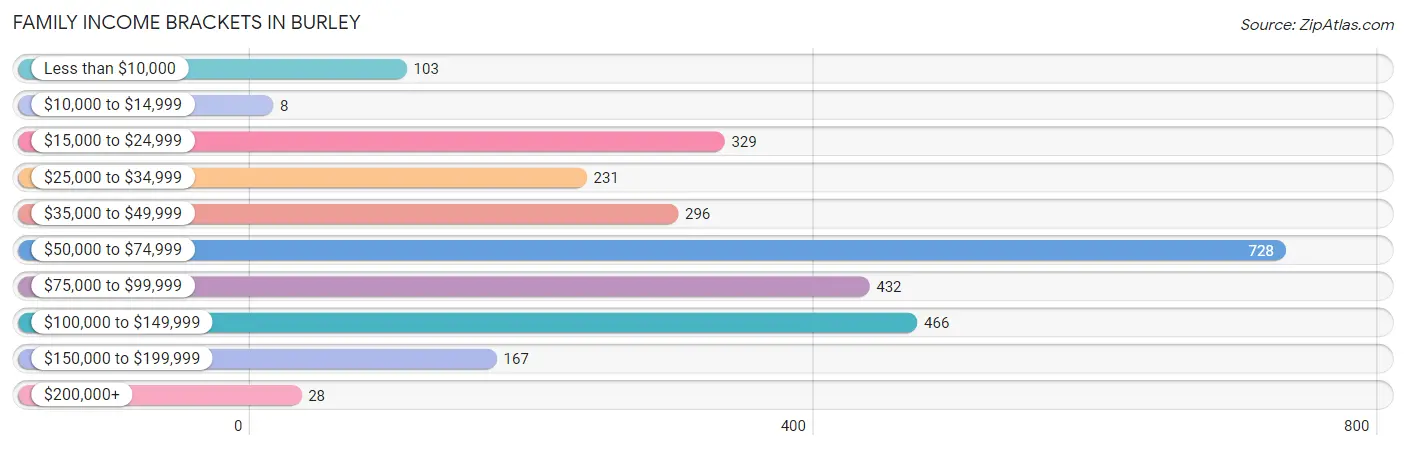
Family Income Brackets in Burley
According to the Burley family income data, there are 728 families falling into the $50,000 to $74,999 income range, which is the most common income bracket and makes up 26.1% of all families. Conversely, the $10,000 to $14,999 income bracket is the least frequent group with only 8 families (0.3%) belonging to this category.
| Income Bracket | # Families | % Families |
| Less than $10,000 | 103 | 3.7% |
| $10,000 to $14,999 | 8 | 0.3% |
| $15,000 to $24,999 | 329 | 11.8% |
| $25,000 to $34,999 | 231 | 8.3% |
| $35,000 to $49,999 | 296 | 10.6% |
| $50,000 to $74,999 | 728 | 26.1% |
| $75,000 to $99,999 | 432 | 15.5% |
| $100,000 to $149,999 | 466 | 16.7% |
| $150,000 to $199,999 | 167 | 6.0% |
| $200,000+ | 28 | 1.0% |
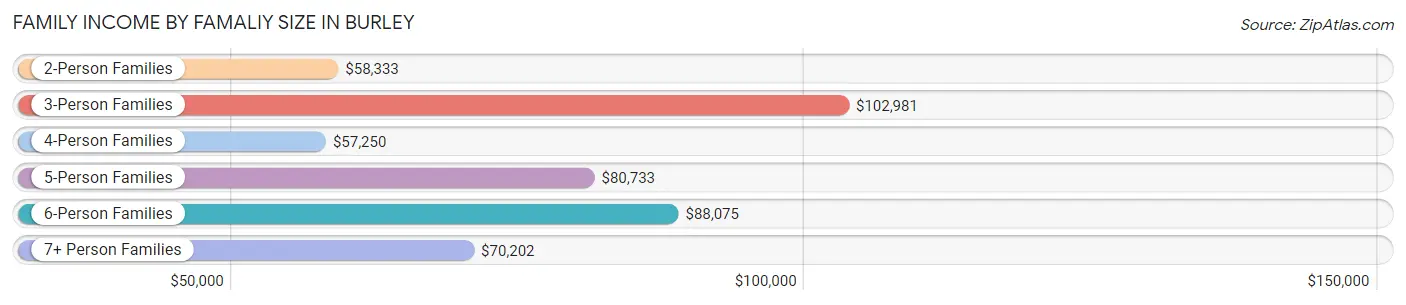
Family Income by Famaliy Size in Burley
3-person families (421 | 15.1%) account for the highest median family income in Burley with $102,981 per family, while 3-person families (421 | 15.1%) have the highest median income of $34,327 per family member.
| Income Bracket | # Families | Median Income |
| 2-Person Families | 1,360 (48.8%) | $58,333 |
| 3-Person Families | 421 (15.1%) | $102,981 |
| 4-Person Families | 395 (14.2%) | $57,250 |
| 5-Person Families | 351 (12.6%) | $80,733 |
| 6-Person Families | 125 (4.5%) | $88,075 |
| 7+ Person Families | 137 (4.9%) | $70,202 |
| Total | 2,789 (100.0%) | $64,788 |
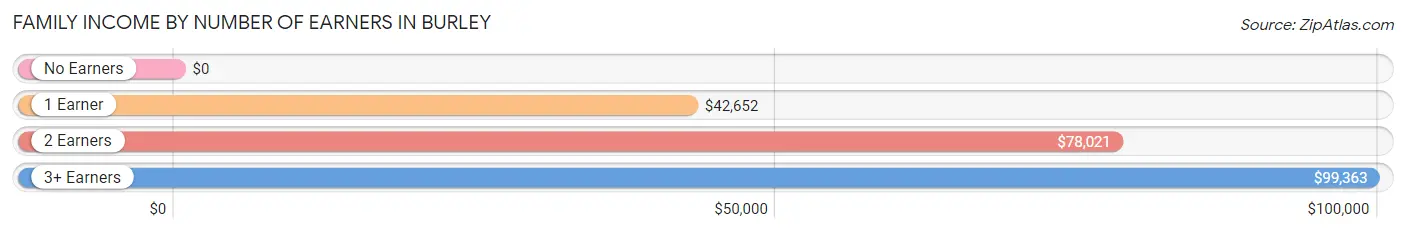
Family Income by Number of Earners in Burley
| Number of Earners | # Families | Median Income |
| No Earners | 309 (11.1%) | $0 |
| 1 Earner | 1,088 (39.0%) | $42,652 |
| 2 Earners | 995 (35.7%) | $78,021 |
| 3+ Earners | 397 (14.2%) | $99,363 |
| Total | 2,789 (100.0%) | $64,788 |
Household Income in Burley
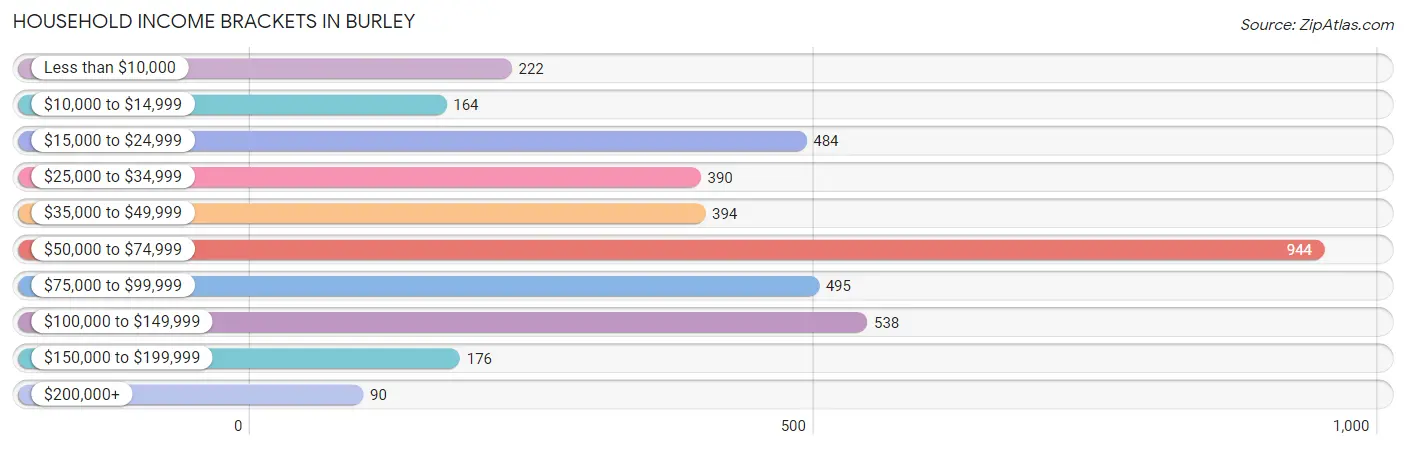
Household Income Brackets in Burley
With 944 households falling in the category, the $50,000 to $74,999 income range is the most frequent in Burley, accounting for 24.2% of all households. In contrast, only 90 households (2.3%) fall into the $200,000+ income bracket, making it the least populous group.
| Income Bracket | # Households | % Households |
| Less than $10,000 | 222 | 5.7% |
| $10,000 to $14,999 | 164 | 4.2% |
| $15,000 to $24,999 | 484 | 12.4% |
| $25,000 to $34,999 | 390 | 10.0% |
| $35,000 to $49,999 | 394 | 10.1% |
| $50,000 to $74,999 | 944 | 24.2% |
| $75,000 to $99,999 | 495 | 12.7% |
| $100,000 to $149,999 | 538 | 13.8% |
| $150,000 to $199,999 | 176 | 4.5% |
| $200,000+ | 90 | 2.3% |
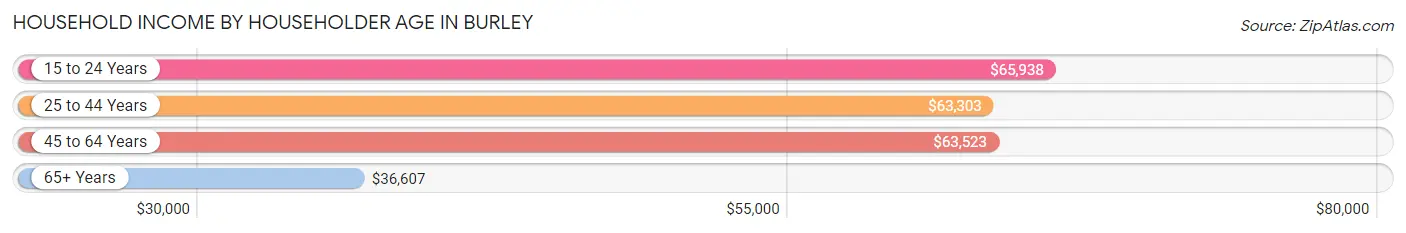
Household Income by Householder Age in Burley
The median household income in Burley is $58,889, with the highest median household income of $65,938 found in the 15 to 24 years age bracket for the primary householder. A total of 305 households (7.8%) fall into this category. Meanwhile, the 65+ years age bracket for the primary householder has the lowest median household income of $36,607, with 796 households (20.4%) in this group.
| Income Bracket | # Households | Median Income |
| 15 to 24 Years | 305 (7.8%) | $65,938 |
| 25 to 44 Years | 1,430 (36.7%) | $63,303 |
| 45 to 64 Years | 1,369 (35.1%) | $63,523 |
| 65+ Years | 796 (20.4%) | $36,607 |
| Total | 3,900 (100.0%) | $58,889 |
Poverty in Burley
Income Below Poverty by Sex and Age in Burley
With 14.4% poverty level for males and 11.5% for females among the residents of Burley, 6 to 11 year old males and 45 to 54 year old females are the most vulnerable to poverty, with 141 males (24.2%) and 100 females (20.6%) in their respective age groups living below the poverty level.
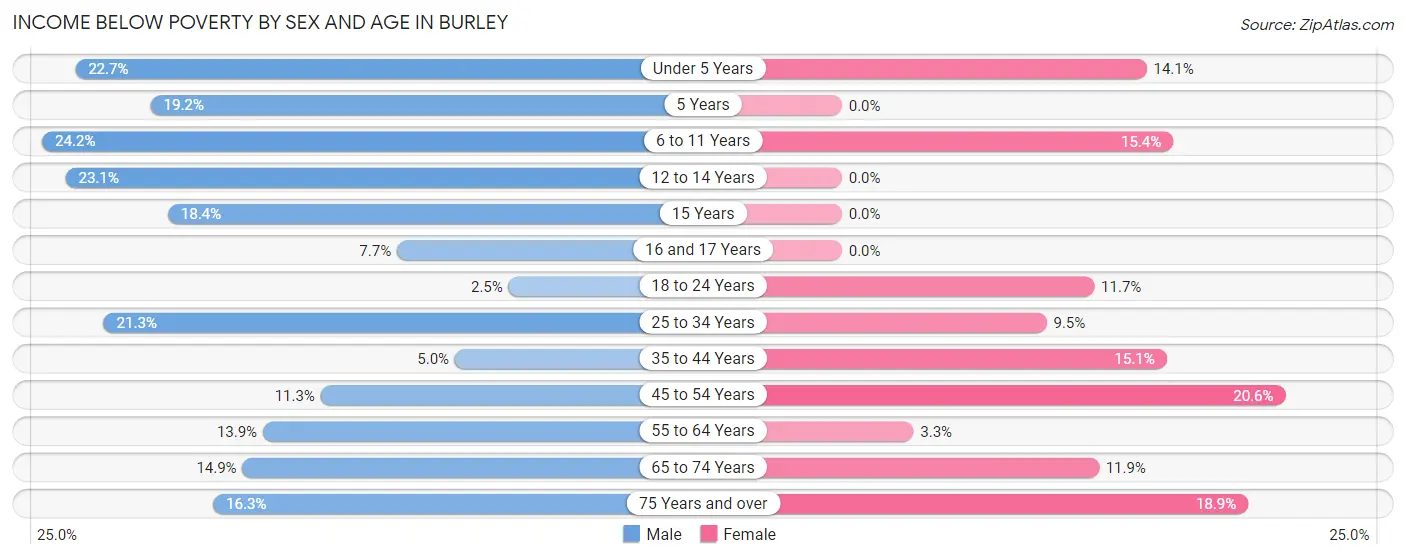
| Age Bracket | Male | Female |
| Under 5 Years | 111 (22.7%) | 57 (14.1%) |
| 5 Years | 27 (19.2%) | 0 (0.0%) |
| 6 to 11 Years | 141 (24.2%) | 83 (15.4%) |
| 12 to 14 Years | 70 (23.1%) | 0 (0.0%) |
| 15 Years | 20 (18.3%) | 0 (0.0%) |
| 16 and 17 Years | 20 (7.7%) | 0 (0.0%) |
| 18 to 24 Years | 18 (2.5%) | 67 (11.7%) |
| 25 to 34 Years | 160 (21.3%) | 61 (9.5%) |
| 35 to 44 Years | 40 (5.0%) | 112 (15.1%) |
| 45 to 54 Years | 59 (11.3%) | 100 (20.6%) |
| 55 to 64 Years | 93 (13.9%) | 16 (3.3%) |
| 65 to 74 Years | 49 (14.9%) | 57 (11.9%) |
| 75 Years and over | 39 (16.3%) | 49 (18.9%) |
| Total | 847 (14.4%) | 602 (11.5%) |
Income Above Poverty by Sex and Age in Burley
According to the poverty statistics in Burley, males aged 18 to 24 years and females aged 5 years are the age groups that are most secure financially, with 97.5% of males and 100.0% of females in these age groups living above the poverty line.
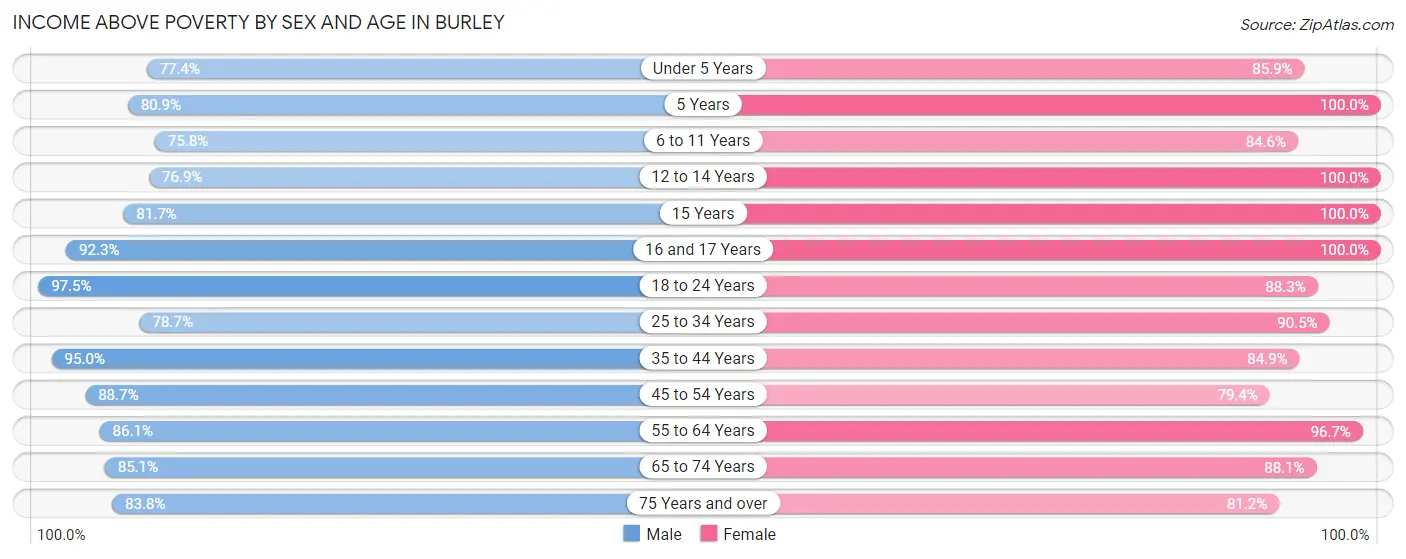
| Age Bracket | Male | Female |
| Under 5 Years | 379 (77.3%) | 346 (85.9%) |
| 5 Years | 114 (80.8%) | 57 (100.0%) |
| 6 to 11 Years | 442 (75.8%) | 457 (84.6%) |
| 12 to 14 Years | 233 (76.9%) | 335 (100.0%) |
| 15 Years | 89 (81.7%) | 20 (100.0%) |
| 16 and 17 Years | 239 (92.3%) | 229 (100.0%) |
| 18 to 24 Years | 691 (97.5%) | 505 (88.3%) |
| 25 to 34 Years | 590 (78.7%) | 581 (90.5%) |
| 35 to 44 Years | 756 (95.0%) | 631 (84.9%) |
| 45 to 54 Years | 465 (88.7%) | 386 (79.4%) |
| 55 to 64 Years | 574 (86.1%) | 466 (96.7%) |
| 65 to 74 Years | 280 (85.1%) | 421 (88.1%) |
| 75 Years and over | 201 (83.8%) | 211 (81.1%) |
| Total | 5,053 (85.6%) | 4,645 (88.5%) |
Income Below Poverty Among Married-Couple Families in Burley
The poverty statistics for married-couple families in Burley show that 6.4% or 129 of the total 2,018 families live below the poverty line. Families with 3 or 4 children have the highest poverty rate of 9.5%, comprising of 28 families. On the other hand, families with 5 or more children have the lowest poverty rate of 0.0%, which includes 0 families.
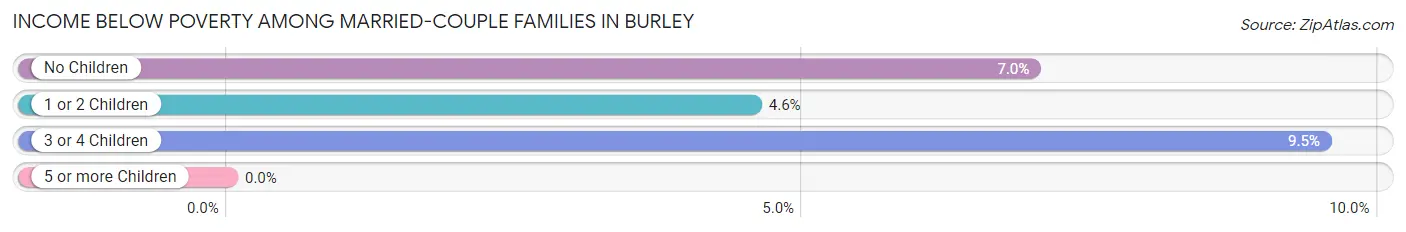
| Children | Above Poverty | Below Poverty |
| No Children | 1,051 (93.0%) | 79 (7.0%) |
| 1 or 2 Children | 460 (95.4%) | 22 (4.6%) |
| 3 or 4 Children | 266 (90.5%) | 28 (9.5%) |
| 5 or more Children | 112 (100.0%) | 0 (0.0%) |
| Total | 1,889 (93.6%) | 129 (6.4%) |
Income Below Poverty Among Single-Parent Households in Burley
According to the poverty data in Burley, 21.0% or 82 single-father households and 20.2% or 77 single-mother households are living below the poverty line. Among single-father households, those with 3 or 4 children have the highest poverty rate, with 82 households (71.3%) experiencing poverty. Likewise, among single-mother households, those with 3 or 4 children have the highest poverty rate, with 49 households (62.8%) falling below the poverty line.
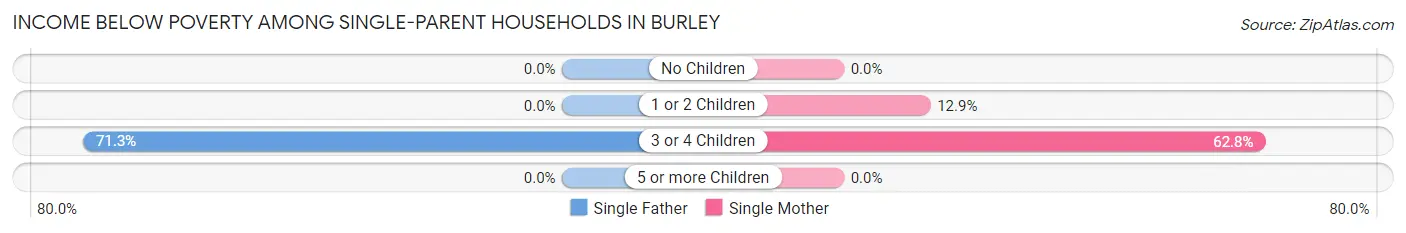
| Children | Single Father | Single Mother |
| No Children | 0 (0.0%) | 0 (0.0%) |
| 1 or 2 Children | 0 (0.0%) | 28 (12.9%) |
| 3 or 4 Children | 82 (71.3%) | 49 (62.8%) |
| 5 or more Children | 0 (0.0%) | 0 (0.0%) |
| Total | 82 (21.0%) | 77 (20.2%) |
Income Below Poverty Among Married-Couple vs Single-Parent Households in Burley
The poverty data for Burley shows that 129 of the married-couple family households (6.4%) and 159 of the single-parent households (20.6%) are living below the poverty level. Within the married-couple family households, those with 3 or 4 children have the highest poverty rate, with 28 households (9.5%) falling below the poverty line. Among the single-parent households, those with 3 or 4 children have the highest poverty rate, with 131 household (67.9%) living below poverty.
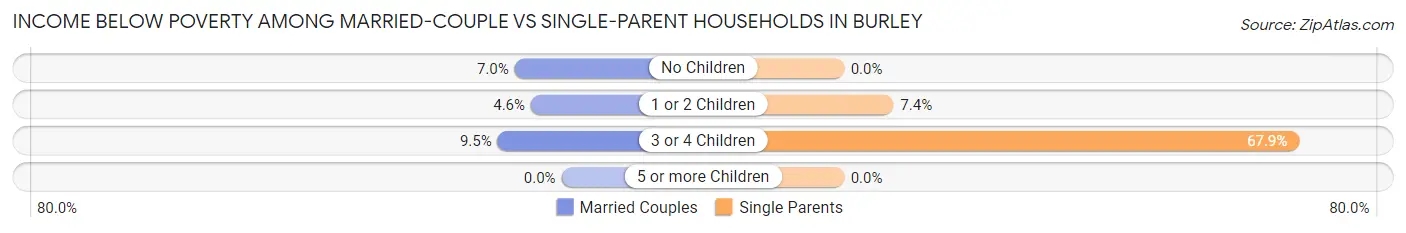
| Children | Married-Couple Families | Single-Parent Households |
| No Children | 79 (7.0%) | 0 (0.0%) |
| 1 or 2 Children | 22 (4.6%) | 28 (7.4%) |
| 3 or 4 Children | 28 (9.5%) | 131 (67.9%) |
| 5 or more Children | 0 (0.0%) | 0 (0.0%) |
| Total | 129 (6.4%) | 159 (20.6%) |
Race in Burley
The most populous races in Burley are White / Caucasian (8,473 | 73.6%), Hispanic or Latino (4,002 | 34.8%), and Two or more Races (1,461 | 12.7%).
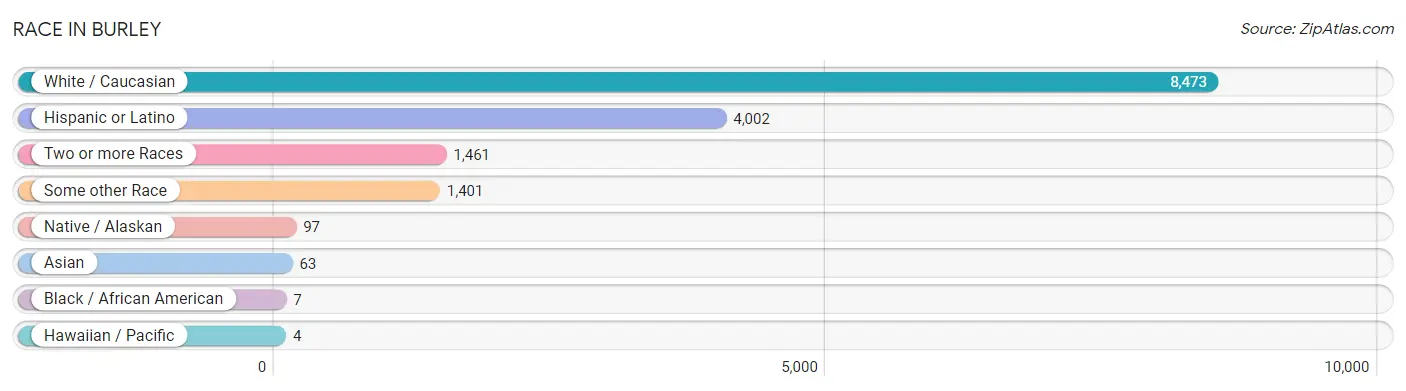
| Race | # Population | % Population |
| Asian | 63 | 0.5% |
| Black / African American | 7 | 0.1% |
| Hawaiian / Pacific | 4 | 0.0% |
| Hispanic or Latino | 4,002 | 34.8% |
| Native / Alaskan | 97 | 0.8% |
| White / Caucasian | 8,473 | 73.6% |
| Two or more Races | 1,461 | 12.7% |
| Some other Race | 1,401 | 12.2% |
| Total | 11,506 | 100.0% |
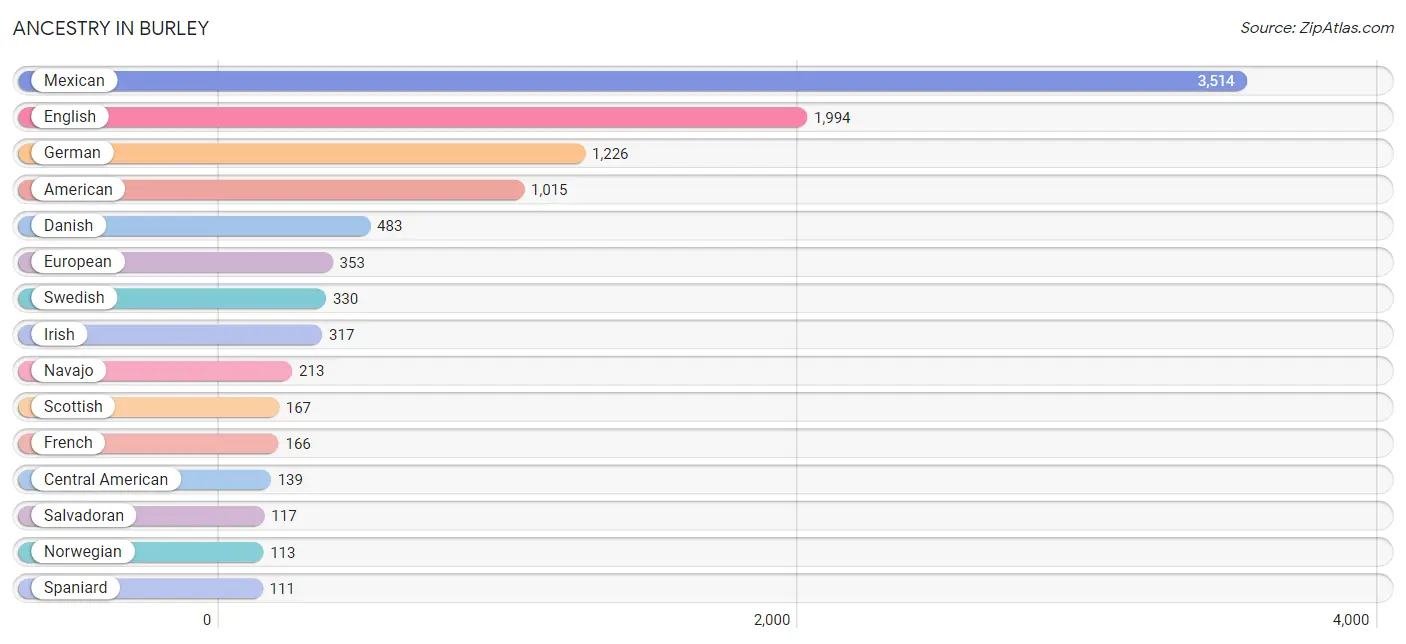
Ancestry in Burley
The most populous ancestries reported in Burley are Mexican (3,514 | 30.5%), English (1,994 | 17.3%), German (1,226 | 10.7%), American (1,015 | 8.8%), and Danish (483 | 4.2%), together accounting for 71.6% of all Burley residents.
| Ancestry | # Population | % Population |
| American | 1,015 | 8.8% |
| Basque | 5 | 0.0% |
| Bhutanese | 49 | 0.4% |
| Blackfeet | 4 | 0.0% |
| British | 62 | 0.5% |
| Burmese | 4 | 0.0% |
| Canadian | 14 | 0.1% |
| Central American | 139 | 1.2% |
| Central American Indian | 22 | 0.2% |
| Cherokee | 53 | 0.5% |
| Czech | 18 | 0.2% |
| Danish | 483 | 4.2% |
| Dutch | 42 | 0.4% |
| English | 1,994 | 17.3% |
| European | 353 | 3.1% |
| Finnish | 13 | 0.1% |
| French | 166 | 1.4% |
| French Canadian | 23 | 0.2% |
| German | 1,226 | 10.7% |
| Guatemalan | 22 | 0.2% |
| Icelander | 51 | 0.4% |
| Indian (Asian) | 16 | 0.1% |
| Indonesian | 73 | 0.6% |
| Irish | 317 | 2.8% |
| Italian | 58 | 0.5% |
| Korean | 13 | 0.1% |
| Laotian | 35 | 0.3% |
| Mexican | 3,514 | 30.5% |
| Mexican American Indian | 75 | 0.6% |
| Navajo | 213 | 1.8% |
| Northern European | 15 | 0.1% |
| Norwegian | 113 | 1.0% |
| Polish | 101 | 0.9% |
| Potawatomi | 10 | 0.1% |
| Puerto Rican | 70 | 0.6% |
| Salvadoran | 117 | 1.0% |
| Scandinavian | 53 | 0.5% |
| Scotch-Irish | 49 | 0.4% |
| Scottish | 167 | 1.5% |
| Sioux | 3 | 0.0% |
| Slovak | 13 | 0.1% |
| Spaniard | 111 | 1.0% |
| Spanish | 68 | 0.6% |
| Swedish | 330 | 2.9% |
| Swiss | 24 | 0.2% |
| Welsh | 79 | 0.7% |
| Yugoslavian | 10 | 0.1% | View All 47 Rows |
Immigrants in Burley
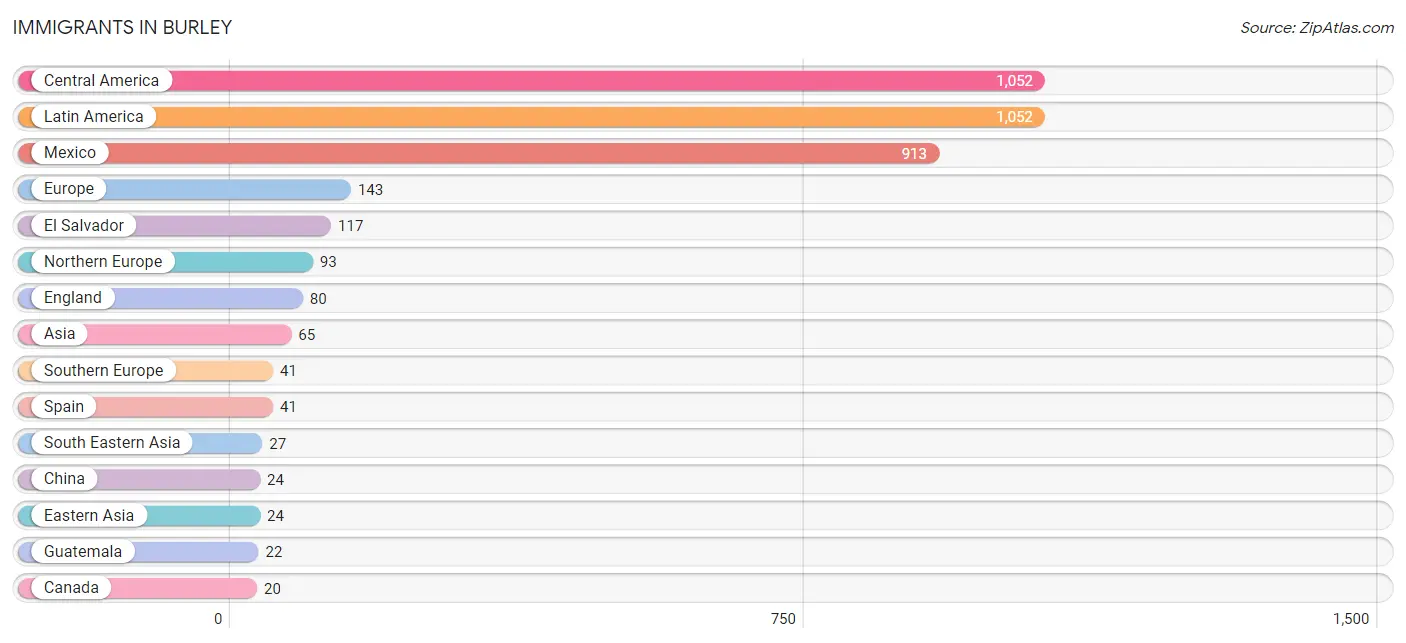
The most numerous immigrant groups reported in Burley came from Central America (1,052 | 9.1%), Latin America (1,052 | 9.1%), Mexico (913 | 7.9%), Europe (143 | 1.2%), and El Salvador (117 | 1.0%), together accounting for 28.5% of all Burley residents.
| Immigration Origin | # Population | % Population |
| Asia | 65 | 0.6% |
| Canada | 20 | 0.2% |
| Central America | 1,052 | 9.1% |
| China | 24 | 0.2% |
| Eastern Asia | 24 | 0.2% |
| El Salvador | 117 | 1.0% |
| England | 80 | 0.7% |
| Europe | 143 | 1.2% |
| Guatemala | 22 | 0.2% |
| Latin America | 1,052 | 9.1% |
| Mexico | 913 | 7.9% |
| Nepal | 14 | 0.1% |
| Netherlands | 9 | 0.1% |
| Northern Europe | 93 | 0.8% |
| Philippines | 13 | 0.1% |
| South Central Asia | 14 | 0.1% |
| South Eastern Asia | 27 | 0.2% |
| Southern Europe | 41 | 0.4% |
| Spain | 41 | 0.4% |
| Western Europe | 9 | 0.1% | View All 20 Rows |
Sex and Age in Burley
Sex and Age in Burley
The most populous age groups in Burley are 5 to 9 Years (632 | 10.3%) for men and 10 to 14 Years (536 | 10.0%) for women.

| Age Bracket | Male | Female |
| Under 5 Years | 490 (8.0%) | 403 (7.5%) |
| 5 to 9 Years | 632 (10.3%) | 396 (7.3%) |
| 10 to 14 Years | 395 (6.5%) | 536 (10.0%) |
| 15 to 19 Years | 542 (8.9%) | 432 (8.0%) |
| 20 to 24 Years | 566 (9.2%) | 393 (7.3%) |
| 25 to 29 Years | 579 (9.5%) | 356 (6.6%) |
| 30 to 34 Years | 205 (3.4%) | 291 (5.4%) |
| 35 to 39 Years | 368 (6.0%) | 468 (8.7%) |
| 40 to 44 Years | 471 (7.7%) | 275 (5.1%) |
| 45 to 49 Years | 258 (4.2%) | 260 (4.8%) |
| 50 to 54 Years | 278 (4.5%) | 241 (4.5%) |
| 55 to 59 Years | 299 (4.9%) | 247 (4.6%) |
| 60 to 64 Years | 422 (6.9%) | 245 (4.5%) |
| 65 to 69 Years | 154 (2.5%) | 256 (4.8%) |
| 70 to 74 Years | 193 (3.2%) | 252 (4.7%) |
| 75 to 79 Years | 142 (2.3%) | 78 (1.5%) |
| 80 to 84 Years | 53 (0.9%) | 151 (2.8%) |
| 85 Years and over | 71 (1.2%) | 108 (2.0%) |
| Total | 6,118 (100.0%) | 5,388 (100.0%) |
Families and Households in Burley
Median Family Size in Burley
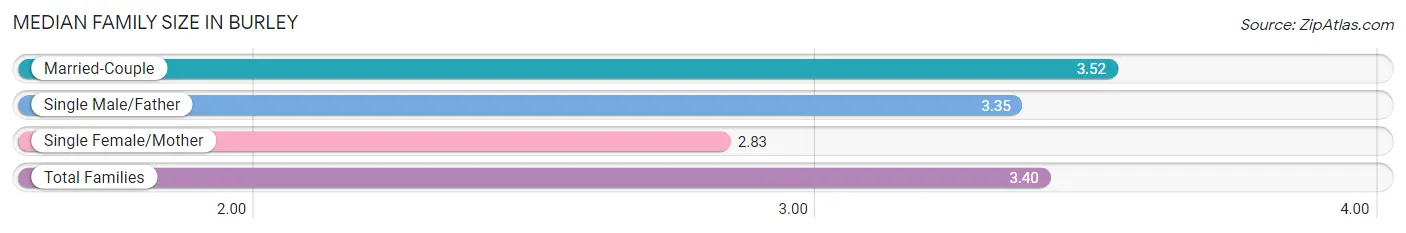
The median family size in Burley is 3.40 persons per family, with married-couple families (2,018 | 72.4%) accounting for the largest median family size of 3.52 persons per family. On the other hand, single female/mother families (381 | 13.7%) represent the smallest median family size with 2.83 persons per family.
| Family Type | # Families | Family Size |
| Married-Couple | 2,018 (72.4%) | 3.52 |
| Single Male/Father | 390 (14.0%) | 3.35 |
| Single Female/Mother | 381 (13.7%) | 2.83 |
| Total Families | 2,789 (100.0%) | 3.40 |
Median Household Size in Burley
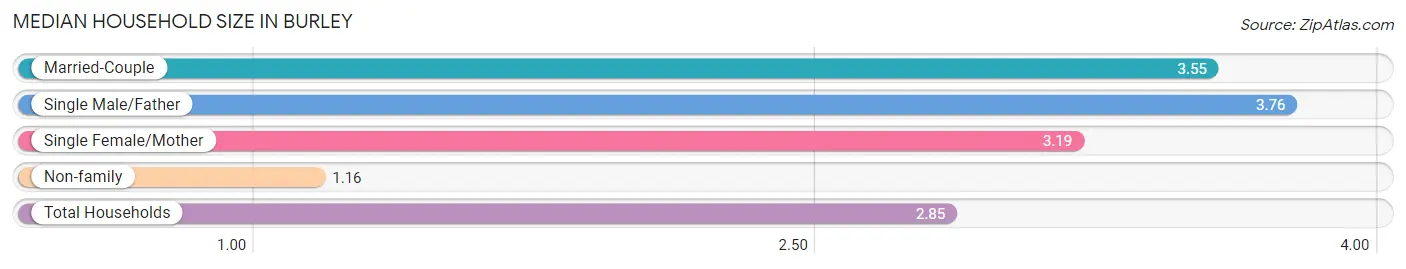
The median household size in Burley is 2.85 persons per household, with single male/father households (390 | 10.0%) accounting for the largest median household size of 3.76 persons per household. non-family households (1,111 | 28.5%) represent the smallest median household size with 1.16 persons per household.
| Household Type | # Households | Household Size |
| Married-Couple | 2,018 (51.7%) | 3.55 |
| Single Male/Father | 390 (10.0%) | 3.76 |
| Single Female/Mother | 381 (9.8%) | 3.19 |
| Non-family | 1,111 (28.5%) | 1.16 |
| Total Households | 3,900 (100.0%) | 2.85 |
Household Size by Marriage Status in Burley
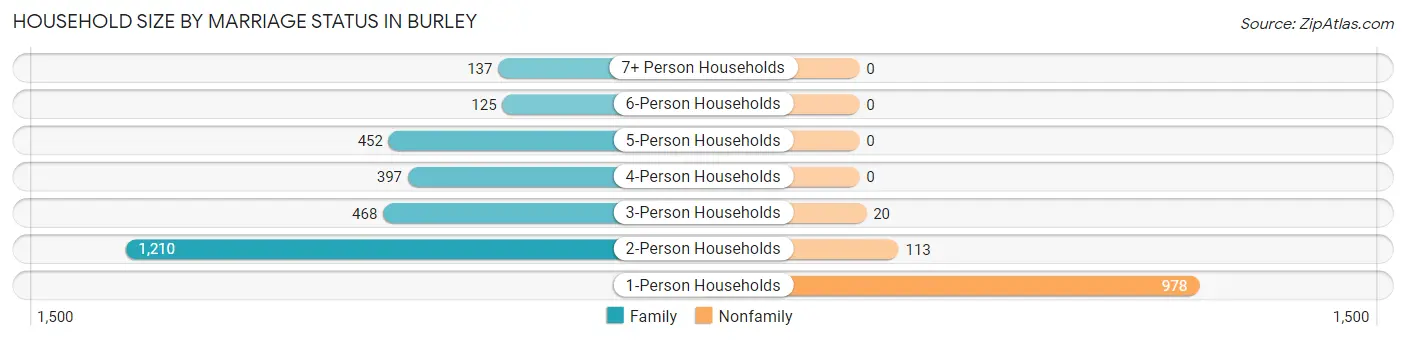
Out of a total of 3,900 households in Burley, 2,789 (71.5%) are family households, while 1,111 (28.5%) are nonfamily households. The most numerous type of family households are 2-person households, comprising 1,210, and the most common type of nonfamily households are 1-person households, comprising 978.
| Household Size | Family Households | Nonfamily Households |
| 1-Person Households | - | 978 (25.1%) |
| 2-Person Households | 1,210 (31.0%) | 113 (2.9%) |
| 3-Person Households | 468 (12.0%) | 20 (0.5%) |
| 4-Person Households | 397 (10.2%) | 0 (0.0%) |
| 5-Person Households | 452 (11.6%) | 0 (0.0%) |
| 6-Person Households | 125 (3.2%) | 0 (0.0%) |
| 7+ Person Households | 137 (3.5%) | 0 (0.0%) |
| Total | 2,789 (71.5%) | 1,111 (28.5%) |
Female Fertility in Burley
Fertility by Age in Burley
Average fertility rate in Burley is 116.0 births per 1,000 women. Women in the age bracket of 20 to 34 years have the highest fertility rate with 247.0 births per 1,000 women. Women in the age bracket of 20 to 34 years acount for 89.2% of all women with births.
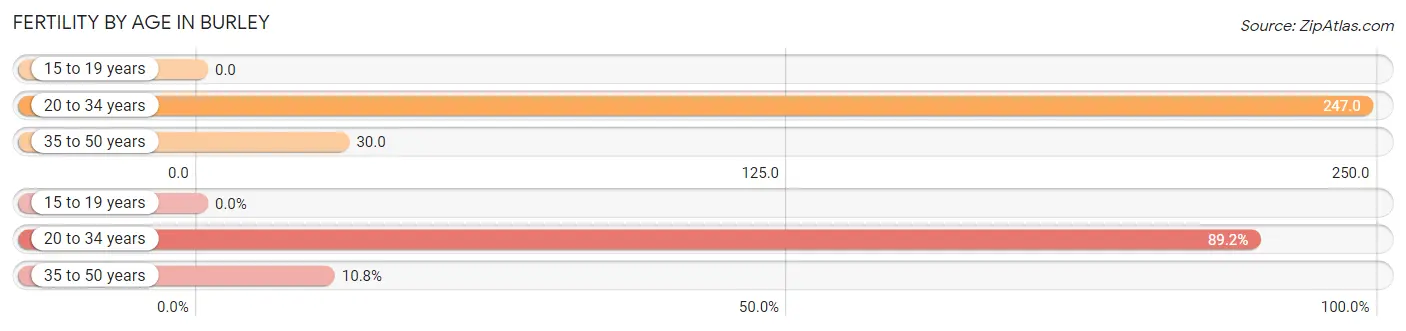
| Age Bracket | Women with Births | Births / 1,000 Women |
| 15 to 19 years | 0 (0.0%) | 0.0 |
| 20 to 34 years | 257 (89.2%) | 247.0 |
| 35 to 50 years | 31 (10.8%) | 30.0 |
| Total | 288 (100.0%) | 116.0 |
Fertility by Age by Marriage Status in Burley
55.2% of women with births (288) in Burley are married. The highest percentage of unmarried women with births falls into 20 to 34 years age bracket with 50.2% of them unmarried at the time of birth, while the lowest percentage of unmarried women with births belong to 35 to 50 years age bracket with 0.0% of them unmarried.
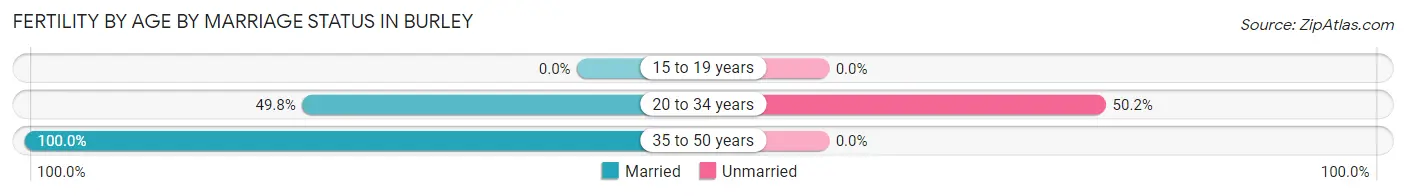
| Age Bracket | Married | Unmarried |
| 15 to 19 years | 0 (0.0%) | 0 (0.0%) |
| 20 to 34 years | 128 (49.8%) | 129 (50.2%) |
| 35 to 50 years | 31 (100.0%) | 0 (0.0%) |
| Total | 159 (55.2%) | 129 (44.8%) |
Fertility by Education in Burley
Average fertility rate in Burley is 116.0 births per 1,000 women. Women with the education attainment of graduate degree have the highest fertility rate of 217.0 births per 1,000 women, while women with the education attainment of less than high school have the lowest fertility at 75.0 births per 1,000 women. Women with the education attainment of college or associate's degree represent 42.7% of all women with births.
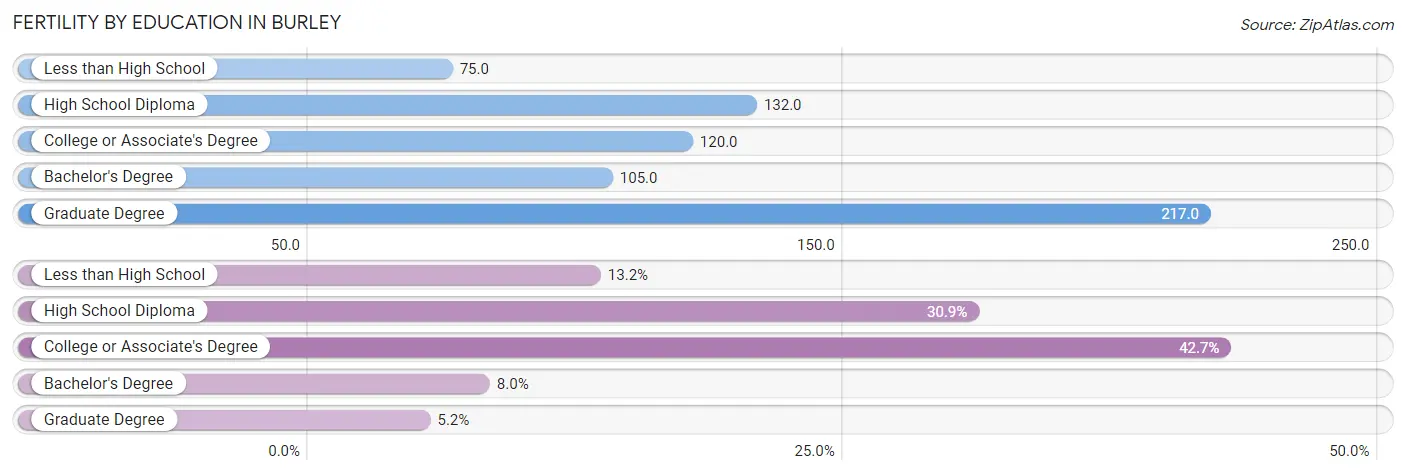
| Educational Attainment | Women with Births | Births / 1,000 Women |
| Less than High School | 38 (13.2%) | 75.0 |
| High School Diploma | 89 (30.9%) | 132.0 |
| College or Associate's Degree | 123 (42.7%) | 120.0 |
| Bachelor's Degree | 23 (8.0%) | 105.0 |
| Graduate Degree | 15 (5.2%) | 217.0 |
| Total | 288 (100.0%) | 116.0 |
Fertility by Education by Marriage Status in Burley
44.8% of women with births in Burley are unmarried. Women with the educational attainment of bachelor's degree are most likely to be married with 100.0% of them married at childbirth, while women with the educational attainment of college or associate's degree are least likely to be married with 57.7% of them unmarried at childbirth.
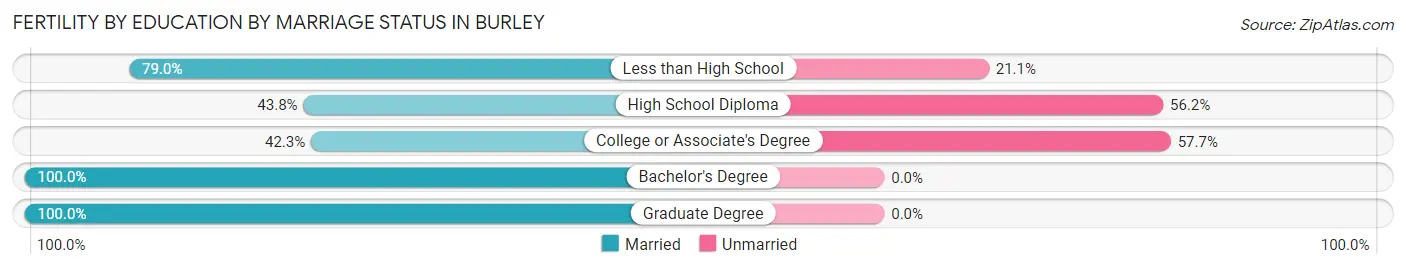
| Educational Attainment | Married | Unmarried |
| Less than High School | 30 (78.9%) | 8 (21.0%) |
| High School Diploma | 39 (43.8%) | 50 (56.2%) |
| College or Associate's Degree | 52 (42.3%) | 71 (57.7%) |
| Bachelor's Degree | 23 (100.0%) | 0 (0.0%) |
| Graduate Degree | 15 (100.0%) | 0 (0.0%) |
| Total | 159 (55.2%) | 129 (44.8%) |
Employment Characteristics in Burley
Employment by Class of Employer in Burley
Among the 5,360 employed individuals in Burley, private company employees (4,415 | 82.4%), local government employees (408 | 7.6%), and self-employed (not incorporated) (193 | 3.6%) make up the most common classes of employment.
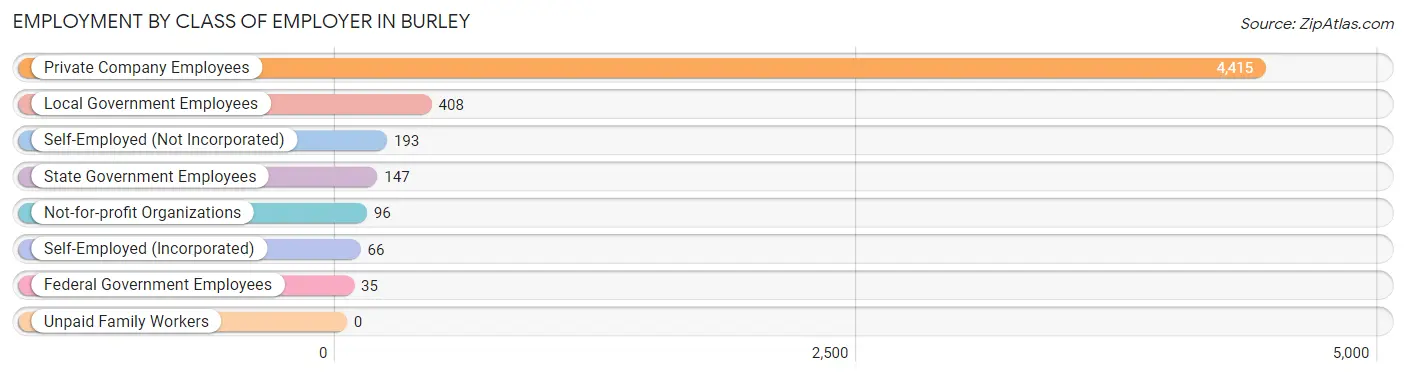
| Employer Class | # Employees | % Employees |
| Private Company Employees | 4,415 | 82.4% |
| Self-Employed (Incorporated) | 66 | 1.2% |
| Self-Employed (Not Incorporated) | 193 | 3.6% |
| Not-for-profit Organizations | 96 | 1.8% |
| Local Government Employees | 408 | 7.6% |
| State Government Employees | 147 | 2.7% |
| Federal Government Employees | 35 | 0.6% |
| Unpaid Family Workers | 0 | 0.0% |
| Total | 5,360 | 100.0% |
Employment Status by Age in Burley
According to the labor force statistics for Burley, out of the total population over 16 years of age (8,525), 66.9% or 5,703 individuals are in the labor force, with 3.7% or 211 of them unemployed. The age group with the highest labor force participation rate is 30 to 34 years, with 87.3% or 433 individuals in the labor force. Within the labor force, the 30 to 34 years age range has the highest percentage of unemployed individuals, with 18.0% or 78 of them being unemployed.
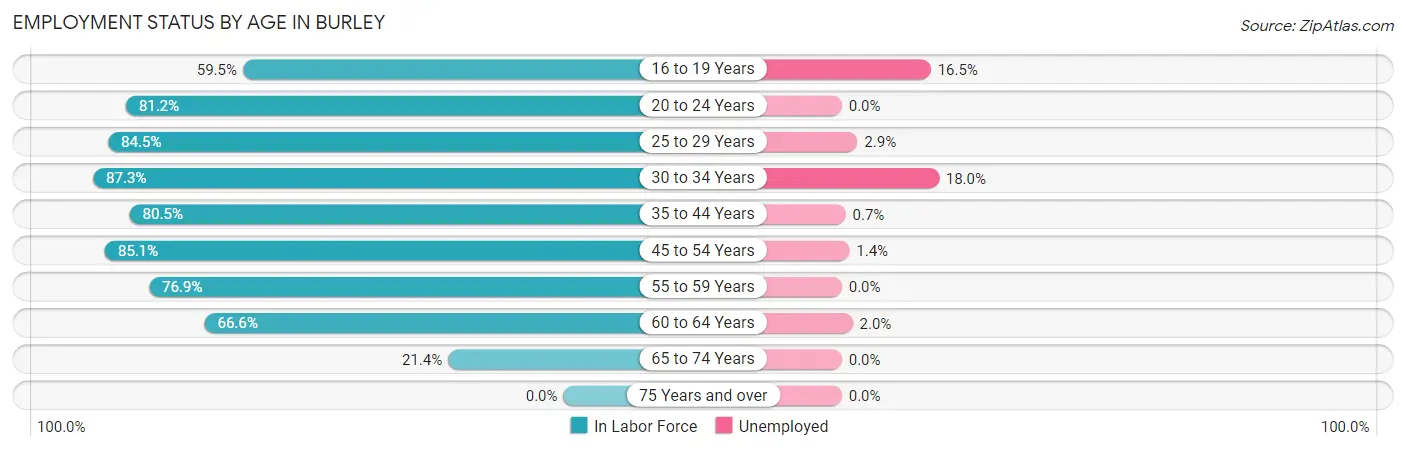
| Age Bracket | In Labor Force | Unemployed |
| 16 to 19 Years | 503 (59.5%) | 83 (16.5%) |
| 20 to 24 Years | 779 (81.2%) | 0 (0.0%) |
| 25 to 29 Years | 790 (84.5%) | 23 (2.9%) |
| 30 to 34 Years | 433 (87.3%) | 78 (18.0%) |
| 35 to 44 Years | 1,274 (80.5%) | 9 (0.7%) |
| 45 to 54 Years | 882 (85.1%) | 12 (1.4%) |
| 55 to 59 Years | 420 (76.9%) | 0 (0.0%) |
| 60 to 64 Years | 444 (66.6%) | 9 (2.0%) |
| 65 to 74 Years | 183 (21.4%) | 0 (0.0%) |
| 75 Years and over | 0 (0.0%) | 0 (0.0%) |
| Total | 5,703 (66.9%) | 211 (3.7%) |
Employment Status by Educational Attainment in Burley
According to labor force statistics for Burley, 80.6% of individuals (4,242) out of the total population between 25 and 64 years of age (5,263) are in the labor force, with 3.1% or 132 of them being unemployed. The group with the highest labor force participation rate are those with the educational attainment of bachelor's degree or higher, with 88.1% or 848 individuals in the labor force. Within the labor force, individuals with college / associate degree education have the highest percentage of unemployment, with 5.6% or 79 of them being unemployed.
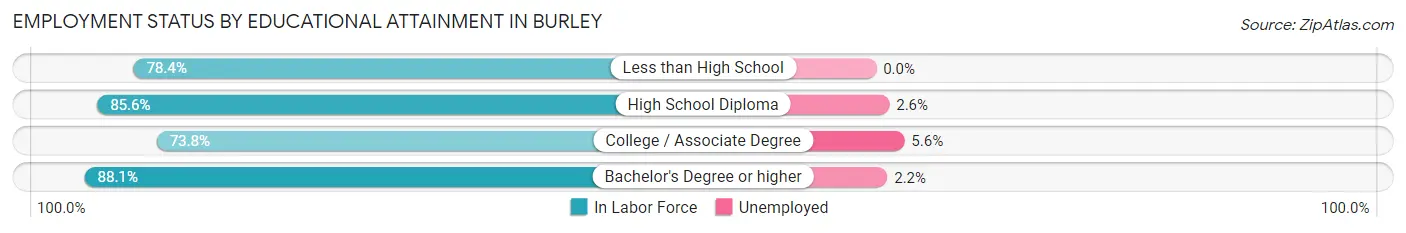
| Educational Attainment | In Labor Force | Unemployed |
| Less than High School | 668 (78.4%) | 0 (0.0%) |
| High School Diploma | 1,323 (85.6%) | 40 (2.6%) |
| College / Associate Degree | 1,404 (73.8%) | 107 (5.6%) |
| Bachelor's Degree or higher | 848 (88.1%) | 21 (2.2%) |
| Total | 4,242 (80.6%) | 163 (3.1%) |
Employment Occupations by Sex in Burley
Management, Business, Science and Arts Occupations
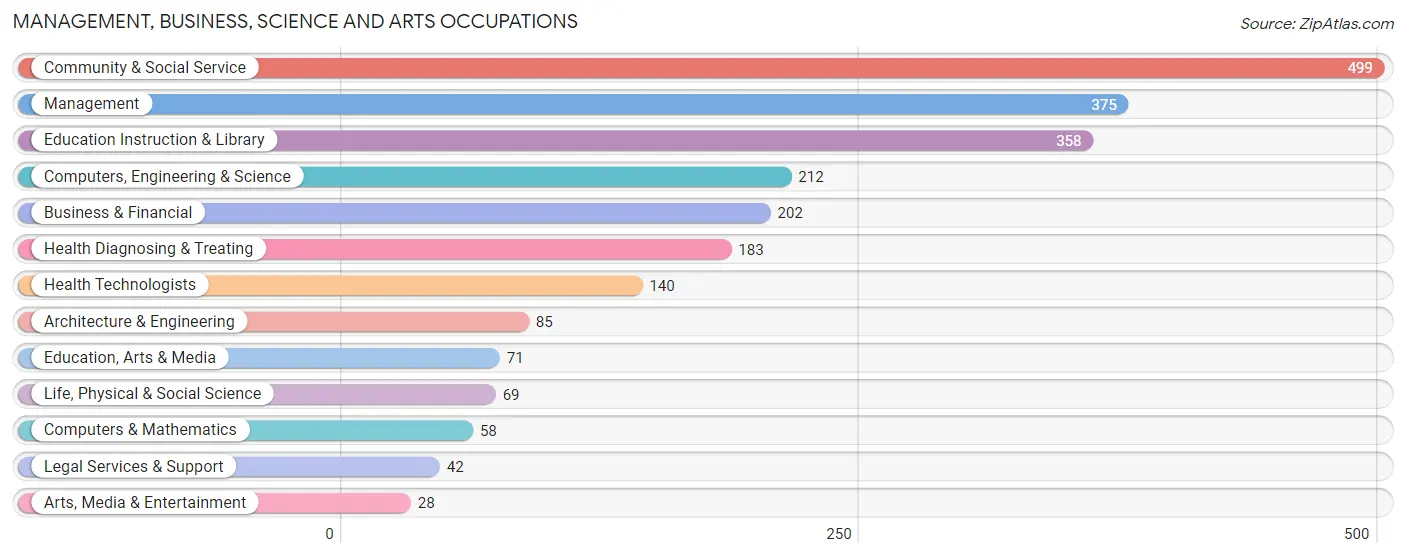
The most common Management, Business, Science and Arts occupations in Burley are Community & Social Service (499 | 9.1%), Management (375 | 6.8%), Education Instruction & Library (358 | 6.5%), Computers, Engineering & Science (212 | 3.9%), and Business & Financial (202 | 3.7%).
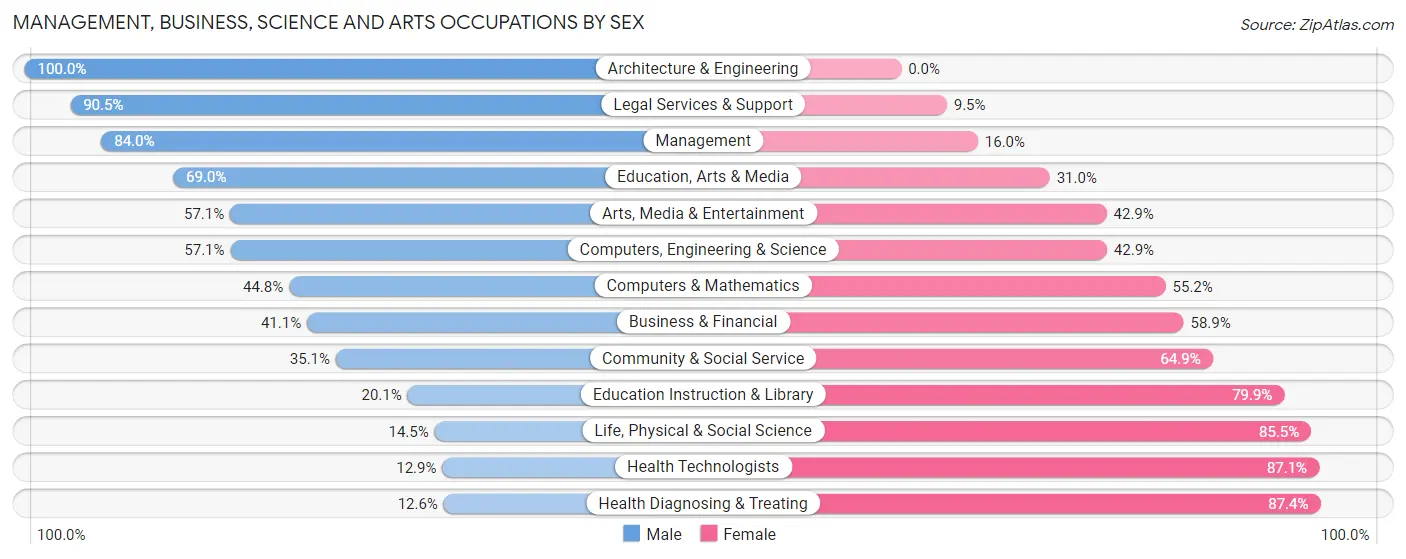
Management, Business, Science and Arts Occupations by Sex
Within the Management, Business, Science and Arts occupations in Burley, the most male-oriented occupations are Architecture & Engineering (100.0%), Legal Services & Support (90.5%), and Management (84.0%), while the most female-oriented occupations are Health Diagnosing & Treating (87.4%), Health Technologists (87.1%), and Life, Physical & Social Science (85.5%).
| Occupation | Male | Female |
| Management | 315 (84.0%) | 60 (16.0%) |
| Business & Financial | 83 (41.1%) | 119 (58.9%) |
| Computers, Engineering & Science | 121 (57.1%) | 91 (42.9%) |
| Computers & Mathematics | 26 (44.8%) | 32 (55.2%) |
| Architecture & Engineering | 85 (100.0%) | 0 (0.0%) |
| Life, Physical & Social Science | 10 (14.5%) | 59 (85.5%) |
| Community & Social Service | 175 (35.1%) | 324 (64.9%) |
| Education, Arts & Media | 49 (69.0%) | 22 (31.0%) |
| Legal Services & Support | 38 (90.5%) | 4 (9.5%) |
| Education Instruction & Library | 72 (20.1%) | 286 (79.9%) |
| Arts, Media & Entertainment | 16 (57.1%) | 12 (42.9%) |
| Health Diagnosing & Treating | 23 (12.6%) | 160 (87.4%) |
| Health Technologists | 18 (12.9%) | 122 (87.1%) |
| Total (Category) | 717 (48.7%) | 754 (51.3%) |
| Total (Overall) | 3,166 (57.6%) | 2,327 (42.4%) |
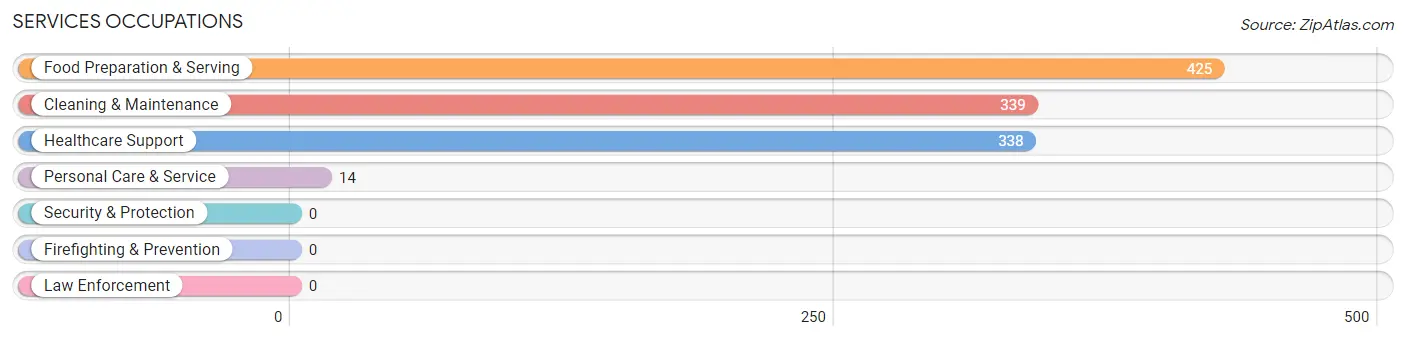
Services Occupations
The most common Services occupations in Burley are Food Preparation & Serving (425 | 7.7%), Cleaning & Maintenance (339 | 6.2%), Healthcare Support (338 | 6.1%), and Personal Care & Service (14 | 0.3%).
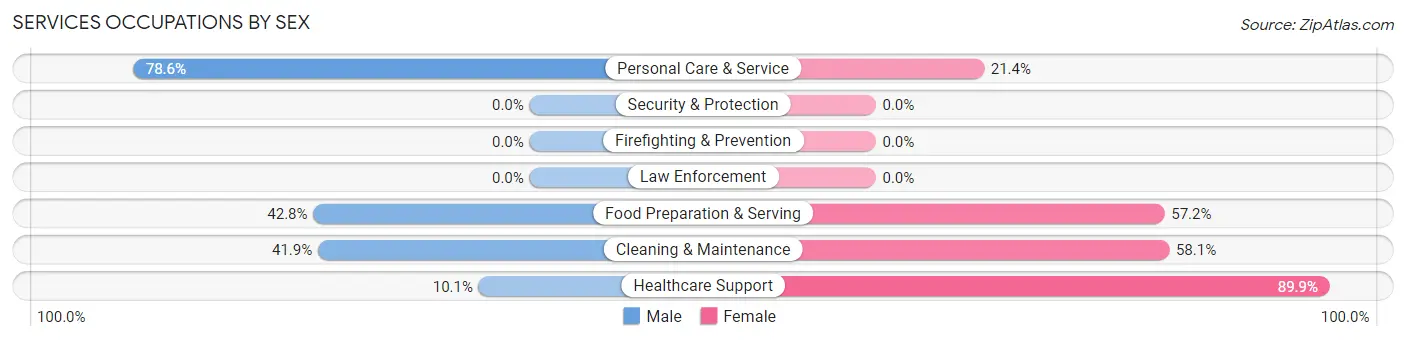
Services Occupations by Sex
Within the Services occupations in Burley, the most male-oriented occupations are Personal Care & Service (78.6%), Food Preparation & Serving (42.8%), and Cleaning & Maintenance (41.9%), while the most female-oriented occupations are Healthcare Support (89.9%), Cleaning & Maintenance (58.1%), and Food Preparation & Serving (57.2%).
| Occupation | Male | Female |
| Healthcare Support | 34 (10.1%) | 304 (89.9%) |
| Security & Protection | 0 (0.0%) | 0 (0.0%) |
| Firefighting & Prevention | 0 (0.0%) | 0 (0.0%) |
| Law Enforcement | 0 (0.0%) | 0 (0.0%) |
| Food Preparation & Serving | 182 (42.8%) | 243 (57.2%) |
| Cleaning & Maintenance | 142 (41.9%) | 197 (58.1%) |
| Personal Care & Service | 11 (78.6%) | 3 (21.4%) |
| Total (Category) | 369 (33.1%) | 747 (66.9%) |
| Total (Overall) | 3,166 (57.6%) | 2,327 (42.4%) |
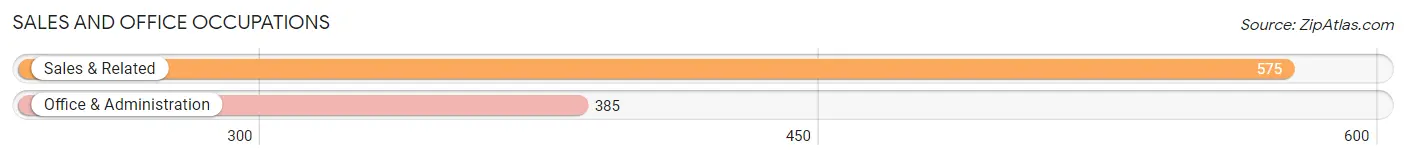
Sales and Office Occupations
The most common Sales and Office occupations in Burley are Sales & Related (575 | 10.5%), and Office & Administration (385 | 7.0%).
Sales and Office Occupations by Sex
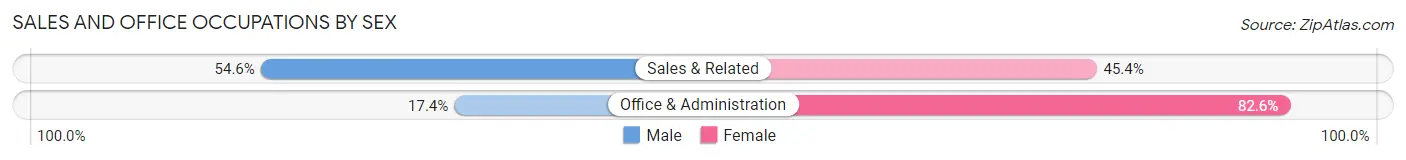
| Occupation | Male | Female |
| Sales & Related | 314 (54.6%) | 261 (45.4%) |
| Office & Administration | 67 (17.4%) | 318 (82.6%) |
| Total (Category) | 381 (39.7%) | 579 (60.3%) |
| Total (Overall) | 3,166 (57.6%) | 2,327 (42.4%) |
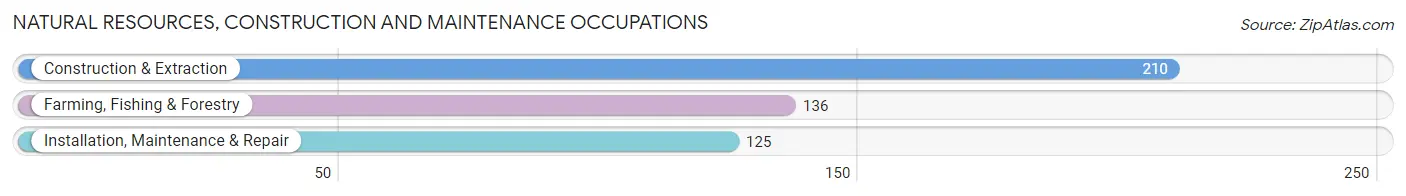
Natural Resources, Construction and Maintenance Occupations
The most common Natural Resources, Construction and Maintenance occupations in Burley are Construction & Extraction (210 | 3.8%), Farming, Fishing & Forestry (136 | 2.5%), and Installation, Maintenance & Repair (125 | 2.3%).
Natural Resources, Construction and Maintenance Occupations by Sex
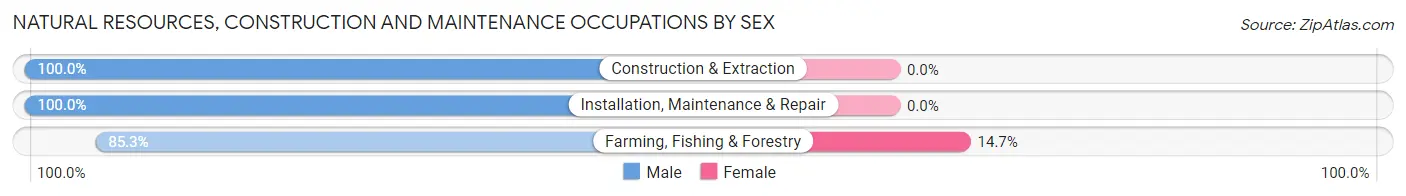
| Occupation | Male | Female |
| Farming, Fishing & Forestry | 116 (85.3%) | 20 (14.7%) |
| Construction & Extraction | 210 (100.0%) | 0 (0.0%) |
| Installation, Maintenance & Repair | 125 (100.0%) | 0 (0.0%) |
| Total (Category) | 451 (95.8%) | 20 (4.3%) |
| Total (Overall) | 3,166 (57.6%) | 2,327 (42.4%) |
Production, Transportation and Moving Occupations
The most common Production, Transportation and Moving occupations in Burley are Production (770 | 14.0%), Material Moving (370 | 6.7%), and Transportation (335 | 6.1%).
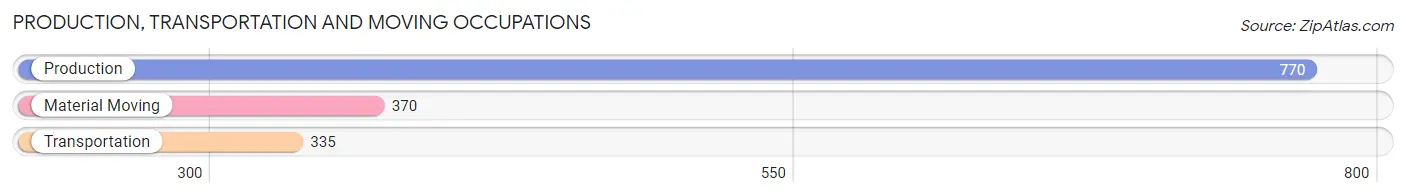
Production, Transportation and Moving Occupations by Sex
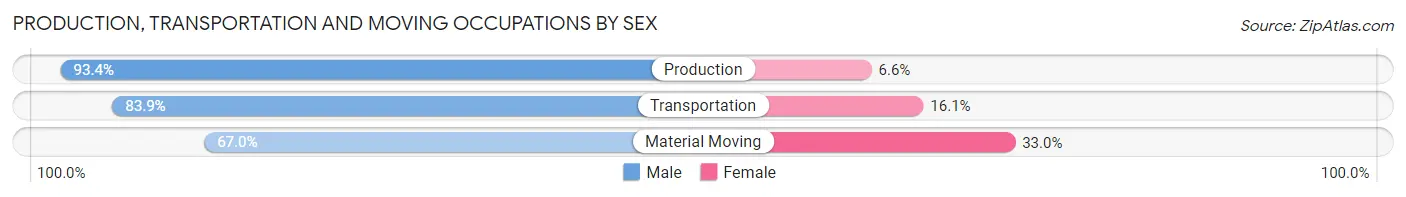
| Occupation | Male | Female |
| Production | 719 (93.4%) | 51 (6.6%) |
| Transportation | 281 (83.9%) | 54 (16.1%) |
| Material Moving | 248 (67.0%) | 122 (33.0%) |
| Total (Category) | 1,248 (84.6%) | 227 (15.4%) |
| Total (Overall) | 3,166 (57.6%) | 2,327 (42.4%) |
Employment Industries by Sex in Burley
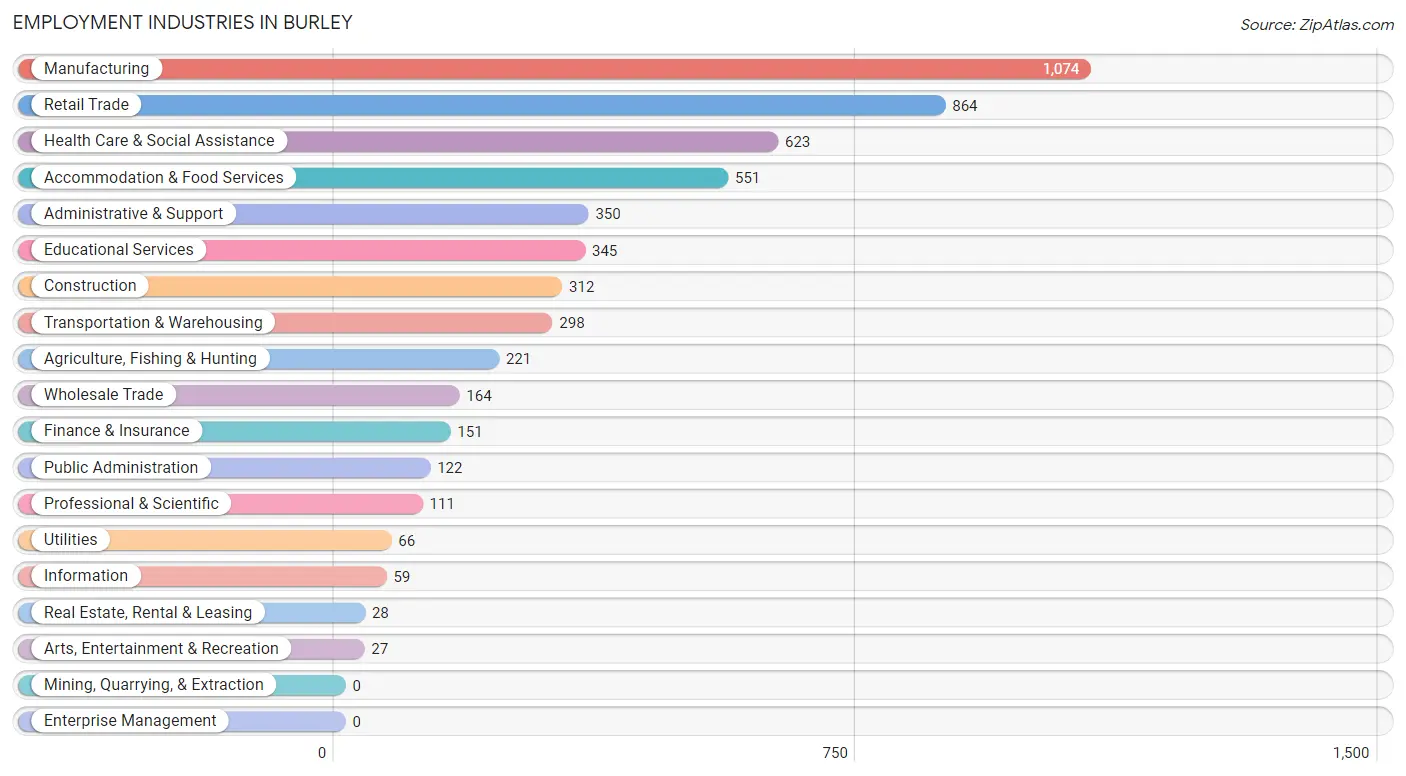
Employment Industries in Burley
The major employment industries in Burley include Manufacturing (1,074 | 19.6%), Retail Trade (864 | 15.7%), Health Care & Social Assistance (623 | 11.3%), Accommodation & Food Services (551 | 10.0%), and Administrative & Support (350 | 6.4%).
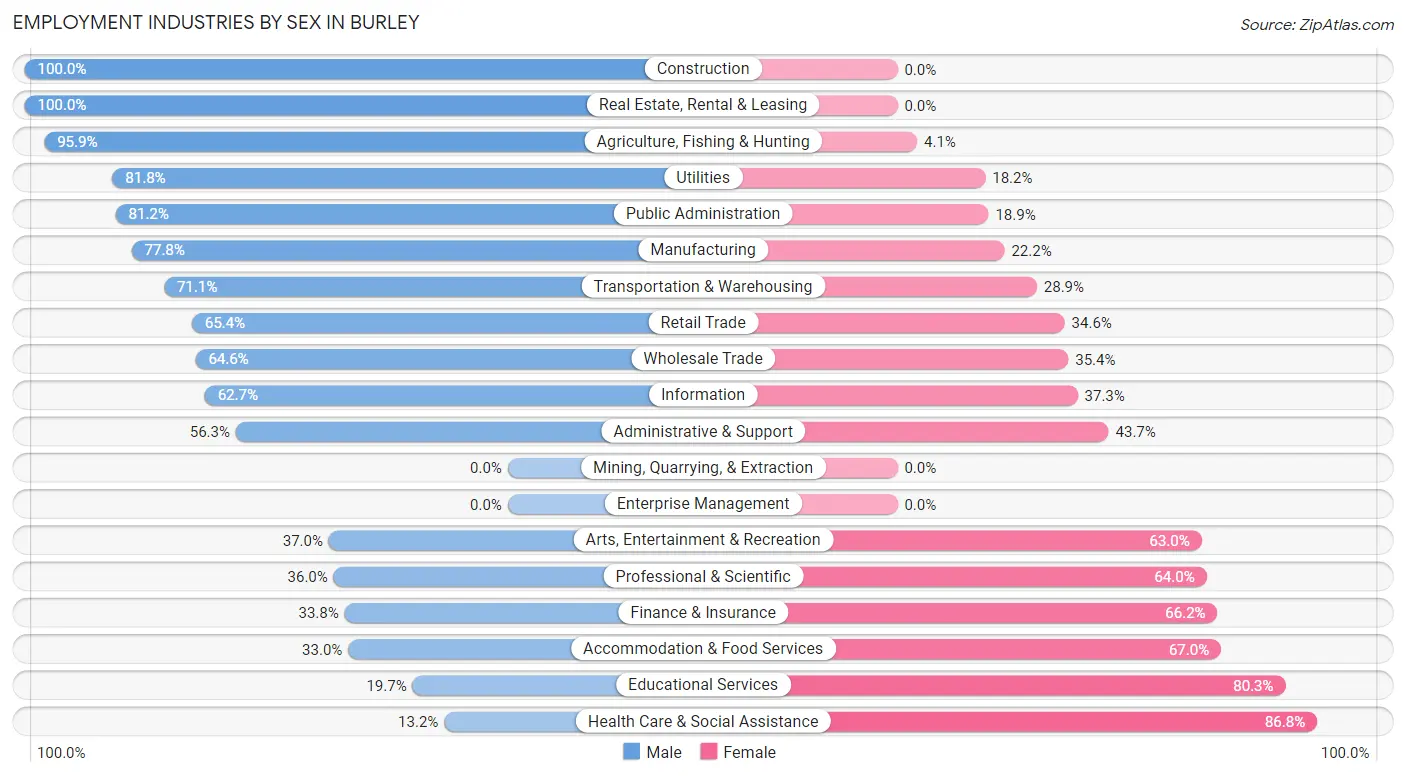
Employment Industries by Sex in Burley
The Burley industries that see more men than women are Construction (100.0%), Real Estate, Rental & Leasing (100.0%), and Agriculture, Fishing & Hunting (95.9%), whereas the industries that tend to have a higher number of women are Health Care & Social Assistance (86.8%), Educational Services (80.3%), and Accommodation & Food Services (67.0%).
| Industry | Male | Female |
| Agriculture, Fishing & Hunting | 212 (95.9%) | 9 (4.1%) |
| Mining, Quarrying, & Extraction | 0 (0.0%) | 0 (0.0%) |
| Construction | 312 (100.0%) | 0 (0.0%) |
| Manufacturing | 836 (77.8%) | 238 (22.2%) |
| Wholesale Trade | 106 (64.6%) | 58 (35.4%) |
| Retail Trade | 565 (65.4%) | 299 (34.6%) |
| Transportation & Warehousing | 212 (71.1%) | 86 (28.9%) |
| Utilities | 54 (81.8%) | 12 (18.2%) |
| Information | 37 (62.7%) | 22 (37.3%) |
| Finance & Insurance | 51 (33.8%) | 100 (66.2%) |
| Real Estate, Rental & Leasing | 28 (100.0%) | 0 (0.0%) |
| Professional & Scientific | 40 (36.0%) | 71 (64.0%) |
| Enterprise Management | 0 (0.0%) | 0 (0.0%) |
| Administrative & Support | 197 (56.3%) | 153 (43.7%) |
| Educational Services | 68 (19.7%) | 277 (80.3%) |
| Health Care & Social Assistance | 82 (13.2%) | 541 (86.8%) |
| Arts, Entertainment & Recreation | 10 (37.0%) | 17 (63.0%) |
| Accommodation & Food Services | 182 (33.0%) | 369 (67.0%) |
| Public Administration | 99 (81.1%) | 23 (18.9%) |
| Total | 3,166 (57.6%) | 2,327 (42.4%) |
Education in Burley
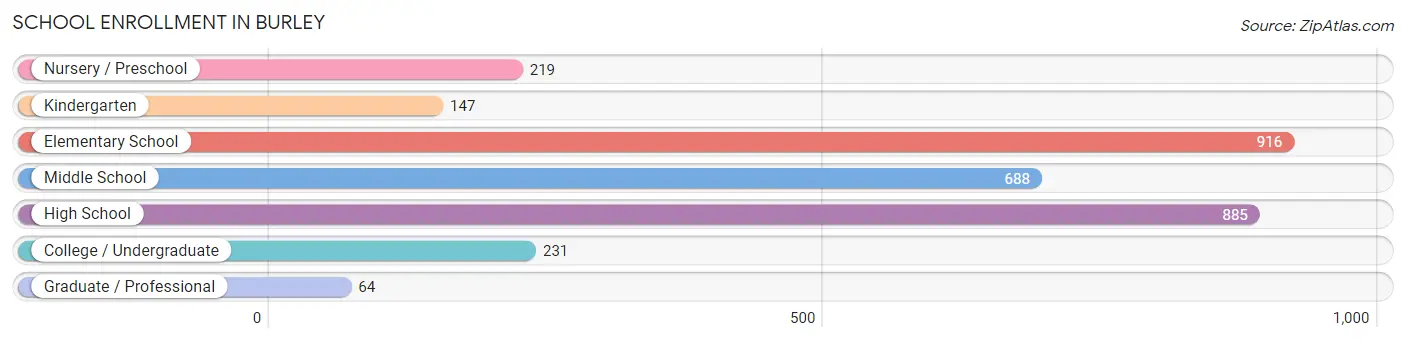
School Enrollment in Burley
The most common levels of schooling among the 3,150 students in Burley are elementary school (916 | 29.1%), high school (885 | 28.1%), and middle school (688 | 21.8%).
| School Level | # Students | % Students |
| Nursery / Preschool | 219 | 7.0% |
| Kindergarten | 147 | 4.7% |
| Elementary School | 916 | 29.1% |
| Middle School | 688 | 21.8% |
| High School | 885 | 28.1% |
| College / Undergraduate | 231 | 7.3% |
| Graduate / Professional | 64 | 2.0% |
| Total | 3,150 | 100.0% |
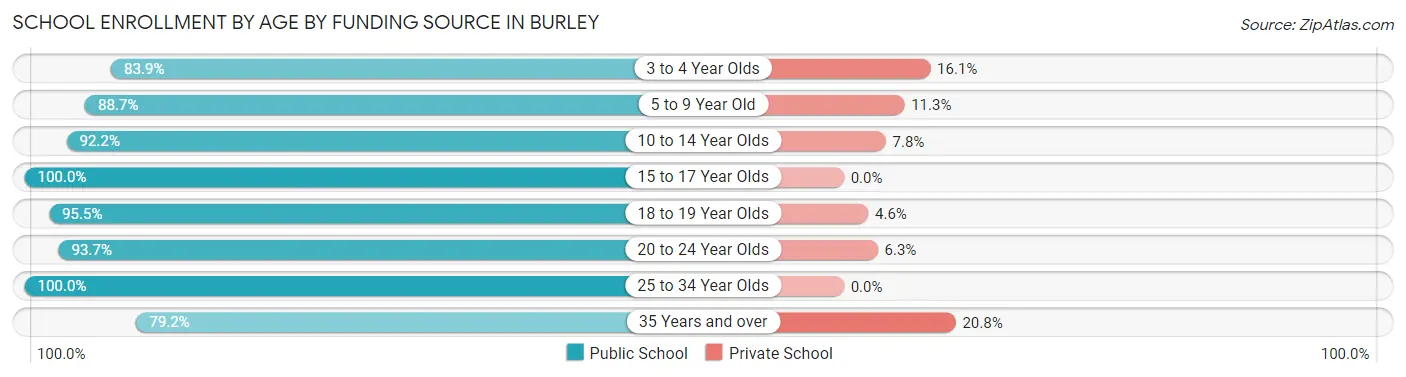
School Enrollment by Age by Funding Source in Burley
Out of a total of 3,150 students who are enrolled in schools in Burley, 255 (8.1%) attend a private institution, while the remaining 2,895 (91.9%) are enrolled in public schools. The age group of 35 years and over has the highest likelihood of being enrolled in private schools, with 30 (20.8% in the age bracket) enrolled. Conversely, the age group of 15 to 17 year olds has the lowest likelihood of being enrolled in a private school, with 583 (100.0% in the age bracket) attending a public institution.
| Age Bracket | Public School | Private School |
| 3 to 4 Year Olds | 125 (83.9%) | 24 (16.1%) |
| 5 to 9 Year Old | 897 (88.7%) | 114 (11.3%) |
| 10 to 14 Year Olds | 850 (92.2%) | 72 (7.8%) |
| 15 to 17 Year Olds | 583 (100.0%) | 0 (0.0%) |
| 18 to 19 Year Olds | 189 (95.5%) | 9 (4.5%) |
| 20 to 24 Year Olds | 89 (93.7%) | 6 (6.3%) |
| 25 to 34 Year Olds | 48 (100.0%) | 0 (0.0%) |
| 35 Years and over | 114 (79.2%) | 30 (20.8%) |
| Total | 2,895 (91.9%) | 255 (8.1%) |
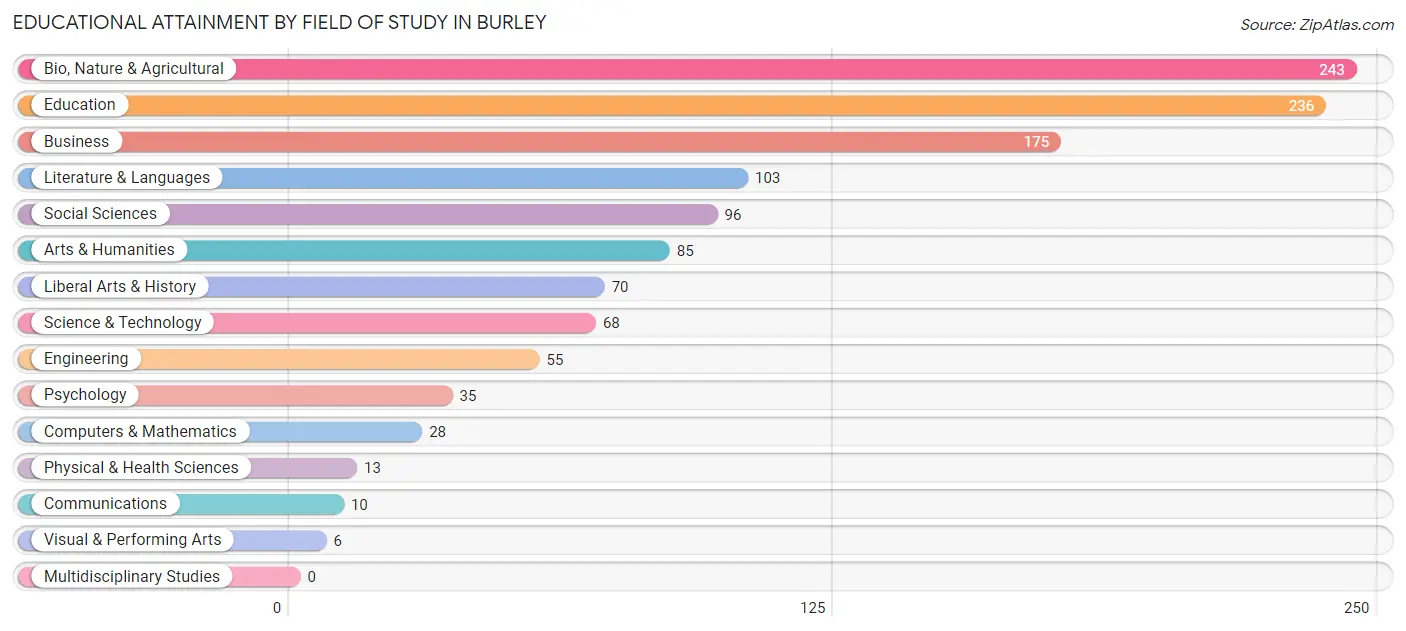
Educational Attainment by Field of Study in Burley
Bio, nature & agricultural (243 | 19.9%), education (236 | 19.3%), business (175 | 14.3%), literature & languages (103 | 8.4%), and social sciences (96 | 7.9%) are the most common fields of study among 1,223 individuals in Burley who have obtained a bachelor's degree or higher.
| Field of Study | # Graduates | % Graduates |
| Computers & Mathematics | 28 | 2.3% |
| Bio, Nature & Agricultural | 243 | 19.9% |
| Physical & Health Sciences | 13 | 1.1% |
| Psychology | 35 | 2.9% |
| Social Sciences | 96 | 7.9% |
| Engineering | 55 | 4.5% |
| Multidisciplinary Studies | 0 | 0.0% |
| Science & Technology | 68 | 5.6% |
| Business | 175 | 14.3% |
| Education | 236 | 19.3% |
| Literature & Languages | 103 | 8.4% |
| Liberal Arts & History | 70 | 5.7% |
| Visual & Performing Arts | 6 | 0.5% |
| Communications | 10 | 0.8% |
| Arts & Humanities | 85 | 7.0% |
| Total | 1,223 | 100.0% |
Transportation & Commute in Burley
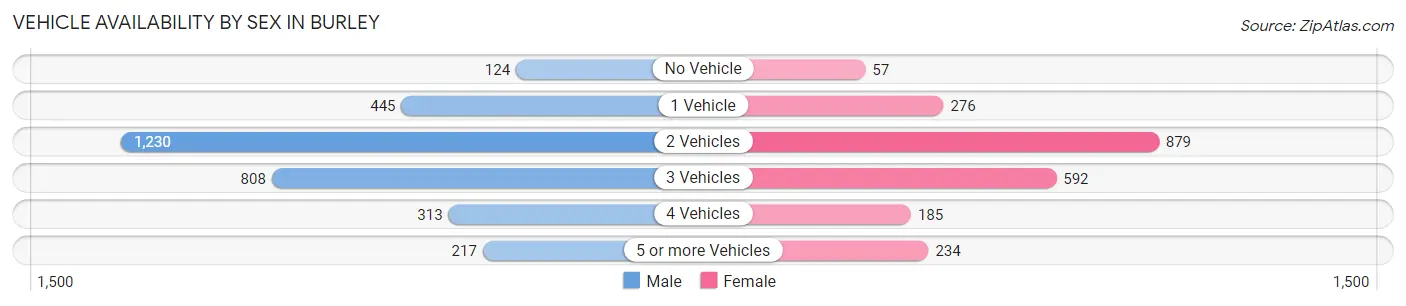
Vehicle Availability by Sex in Burley
The most prevalent vehicle ownership categories in Burley are males with 2 vehicles (1,230, accounting for 39.2%) and females with 2 vehicles (879, making up 55.3%).
| Vehicles Available | Male | Female |
| No Vehicle | 124 (4.0%) | 57 (2.6%) |
| 1 Vehicle | 445 (14.2%) | 276 (12.4%) |
| 2 Vehicles | 1,230 (39.2%) | 879 (39.5%) |
| 3 Vehicles | 808 (25.8%) | 592 (26.6%) |
| 4 Vehicles | 313 (10.0%) | 185 (8.3%) |
| 5 or more Vehicles | 217 (6.9%) | 234 (10.5%) |
| Total | 3,137 (100.0%) | 2,223 (100.0%) |
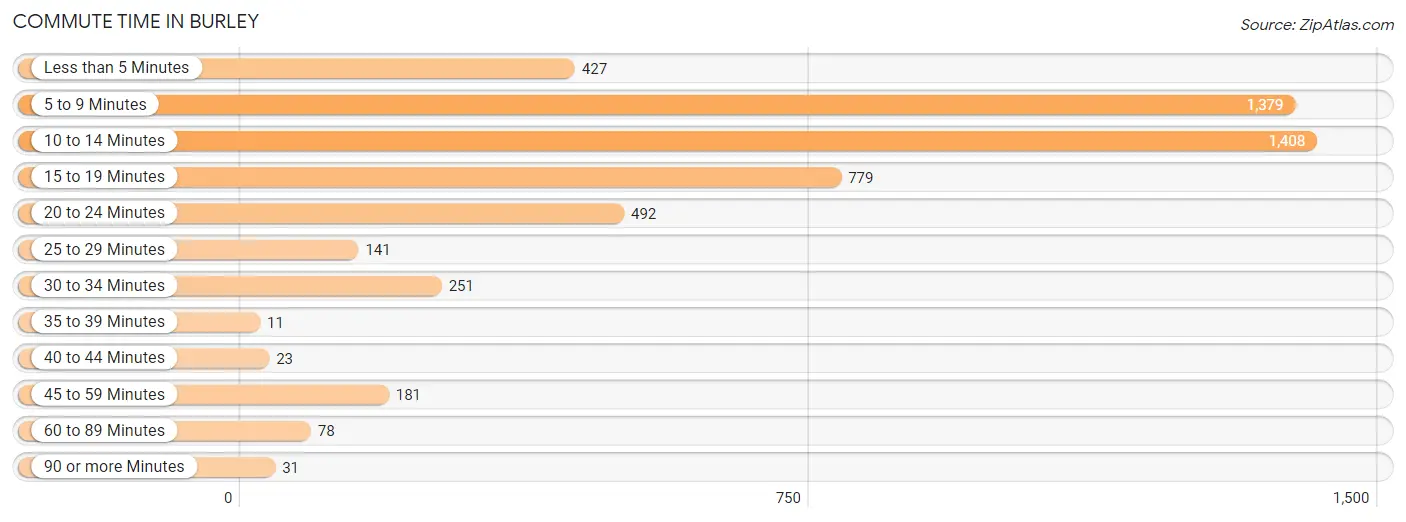
Commute Time in Burley
The most frequently occuring commute durations in Burley are 10 to 14 minutes (1,408 commuters, 27.1%), 5 to 9 minutes (1,379 commuters, 26.5%), and 15 to 19 minutes (779 commuters, 15.0%).
| Commute Time | # Commuters | % Commuters |
| Less than 5 Minutes | 427 | 8.2% |
| 5 to 9 Minutes | 1,379 | 26.5% |
| 10 to 14 Minutes | 1,408 | 27.1% |
| 15 to 19 Minutes | 779 | 15.0% |
| 20 to 24 Minutes | 492 | 9.5% |
| 25 to 29 Minutes | 141 | 2.7% |
| 30 to 34 Minutes | 251 | 4.8% |
| 35 to 39 Minutes | 11 | 0.2% |
| 40 to 44 Minutes | 23 | 0.4% |
| 45 to 59 Minutes | 181 | 3.5% |
| 60 to 89 Minutes | 78 | 1.5% |
| 90 or more Minutes | 31 | 0.6% |
Commute Time by Sex in Burley
The most common commute times in Burley are 10 to 14 minutes (836 commuters, 27.0%) for males and 5 to 9 minutes (694 commuters, 33.0%) for females.
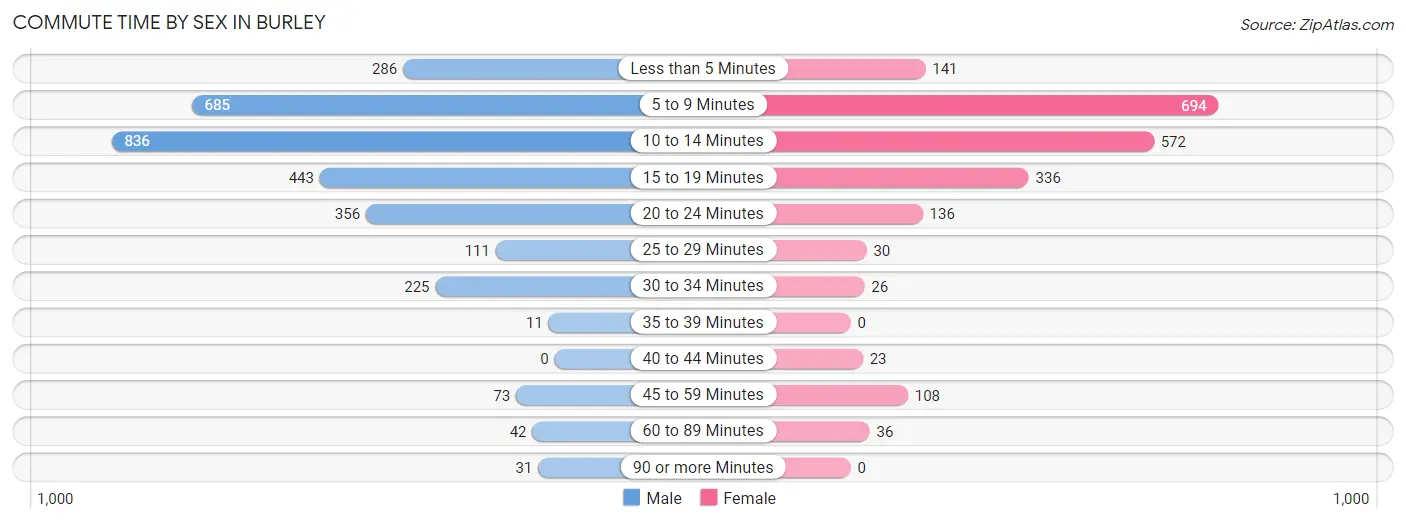
| Commute Time | Male | Female |
| Less than 5 Minutes | 286 (9.2%) | 141 (6.7%) |
| 5 to 9 Minutes | 685 (22.1%) | 694 (33.0%) |
| 10 to 14 Minutes | 836 (27.0%) | 572 (27.2%) |
| 15 to 19 Minutes | 443 (14.3%) | 336 (16.0%) |
| 20 to 24 Minutes | 356 (11.5%) | 136 (6.5%) |
| 25 to 29 Minutes | 111 (3.6%) | 30 (1.4%) |
| 30 to 34 Minutes | 225 (7.3%) | 26 (1.2%) |
| 35 to 39 Minutes | 11 (0.4%) | 0 (0.0%) |
| 40 to 44 Minutes | 0 (0.0%) | 23 (1.1%) |
| 45 to 59 Minutes | 73 (2.4%) | 108 (5.1%) |
| 60 to 89 Minutes | 42 (1.4%) | 36 (1.7%) |
| 90 or more Minutes | 31 (1.0%) | 0 (0.0%) |
Time of Departure to Work by Sex in Burley
The most frequent times of departure to work in Burley are 7:30 AM to 7:59 AM (695, 22.4%) for males and 7:30 AM to 7:59 AM (453, 21.5%) for females.
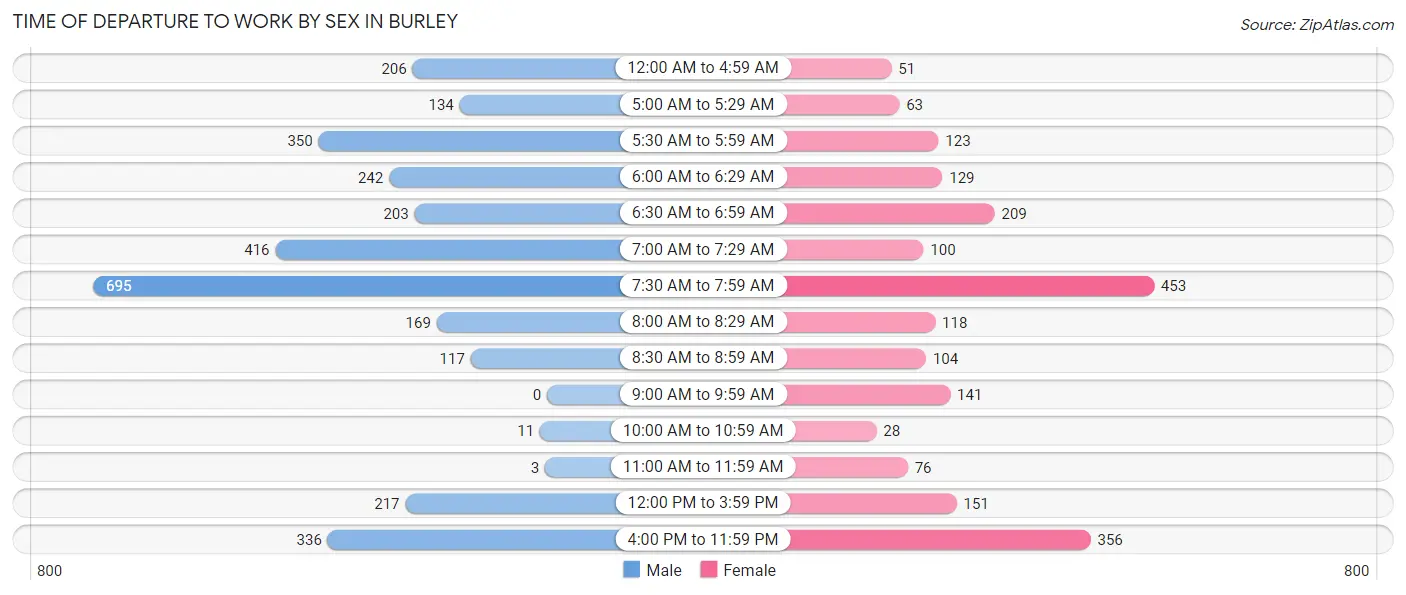
| Time of Departure | Male | Female |
| 12:00 AM to 4:59 AM | 206 (6.7%) | 51 (2.4%) |
| 5:00 AM to 5:29 AM | 134 (4.3%) | 63 (3.0%) |
| 5:30 AM to 5:59 AM | 350 (11.3%) | 123 (5.9%) |
| 6:00 AM to 6:29 AM | 242 (7.8%) | 129 (6.1%) |
| 6:30 AM to 6:59 AM | 203 (6.6%) | 209 (9.9%) |
| 7:00 AM to 7:29 AM | 416 (13.4%) | 100 (4.8%) |
| 7:30 AM to 7:59 AM | 695 (22.4%) | 453 (21.5%) |
| 8:00 AM to 8:29 AM | 169 (5.4%) | 118 (5.6%) |
| 8:30 AM to 8:59 AM | 117 (3.8%) | 104 (5.0%) |
| 9:00 AM to 9:59 AM | 0 (0.0%) | 141 (6.7%) |
| 10:00 AM to 10:59 AM | 11 (0.4%) | 28 (1.3%) |
| 11:00 AM to 11:59 AM | 3 (0.1%) | 76 (3.6%) |
| 12:00 PM to 3:59 PM | 217 (7.0%) | 151 (7.2%) |
| 4:00 PM to 11:59 PM | 336 (10.8%) | 356 (16.9%) |
| Total | 3,099 (100.0%) | 2,102 (100.0%) |
Housing Occupancy in Burley
Occupancy by Ownership in Burley
Of the total 3,900 dwellings in Burley, owner-occupied units account for 2,368 (60.7%), while renter-occupied units make up 1,532 (39.3%).
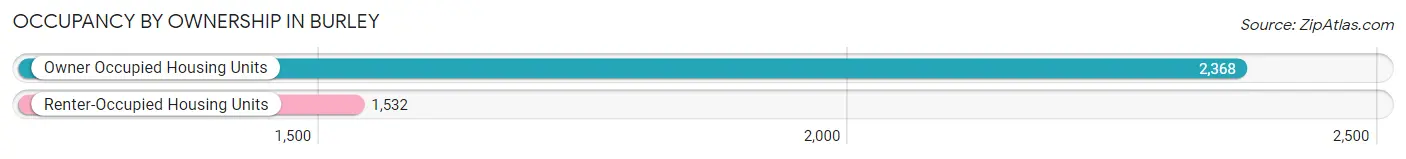
| Occupancy | # Housing Units | % Housing Units |
| Owner Occupied Housing Units | 2,368 | 60.7% |
| Renter-Occupied Housing Units | 1,532 | 39.3% |
| Total Occupied Housing Units | 3,900 | 100.0% |
Occupancy by Household Size in Burley
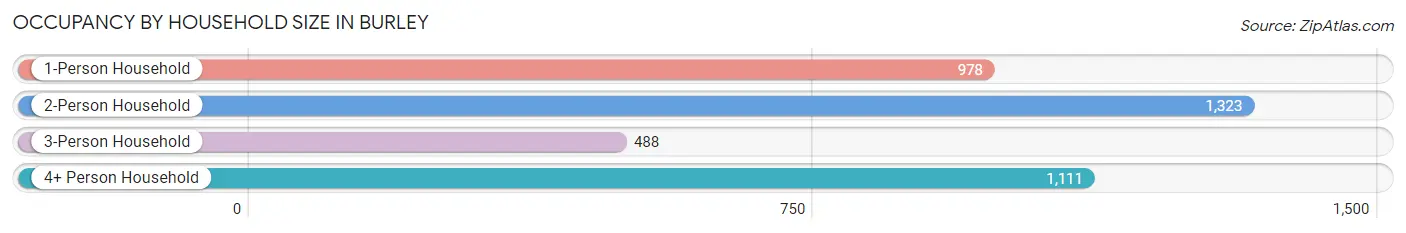
| Household Size | # Housing Units | % Housing Units |
| 1-Person Household | 978 | 25.1% |
| 2-Person Household | 1,323 | 33.9% |
| 3-Person Household | 488 | 12.5% |
| 4+ Person Household | 1,111 | 28.5% |
| Total Housing Units | 3,900 | 100.0% |
Occupancy by Ownership by Household Size in Burley
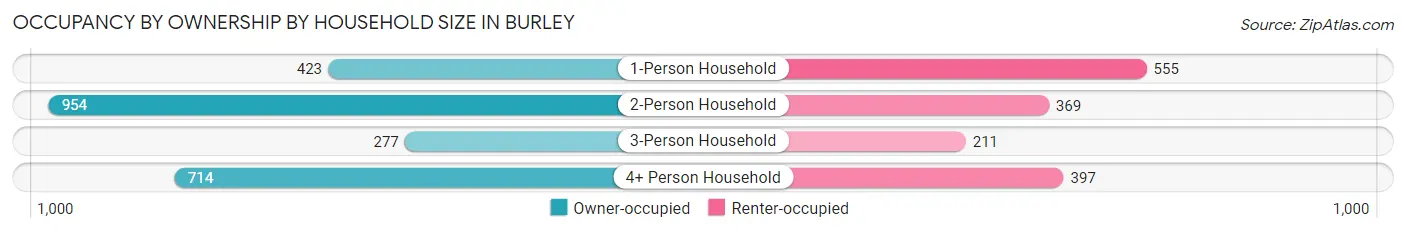
| Household Size | Owner-occupied | Renter-occupied |
| 1-Person Household | 423 (43.2%) | 555 (56.8%) |
| 2-Person Household | 954 (72.1%) | 369 (27.9%) |
| 3-Person Household | 277 (56.8%) | 211 (43.2%) |
| 4+ Person Household | 714 (64.3%) | 397 (35.7%) |
| Total Housing Units | 2,368 (60.7%) | 1,532 (39.3%) |
Occupancy by Educational Attainment in Burley
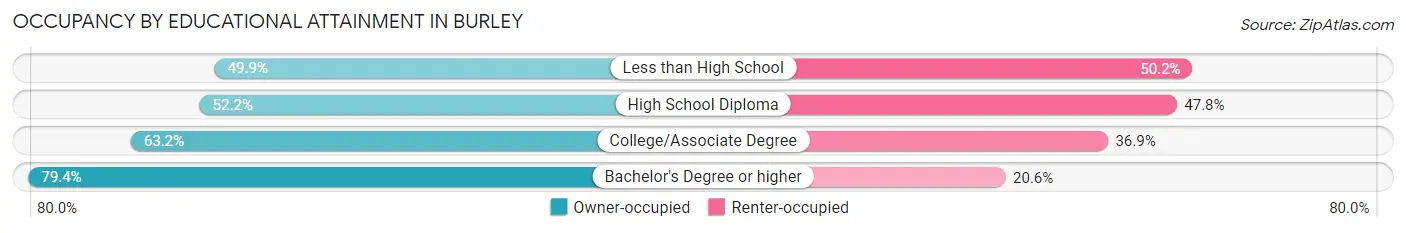
| Household Size | Owner-occupied | Renter-occupied |
| Less than High School | 324 (49.8%) | 326 (50.1%) |
| High School Diploma | 575 (52.2%) | 526 (47.8%) |
| College/Associate Degree | 922 (63.1%) | 538 (36.8%) |
| Bachelor's Degree or higher | 547 (79.4%) | 142 (20.6%) |
Occupancy by Age of Householder in Burley

| Age Bracket | # Households | % Households |
| Under 35 Years | 902 | 23.1% |
| 35 to 44 Years | 833 | 21.4% |
| 45 to 54 Years | 621 | 15.9% |
| 55 to 64 Years | 748 | 19.2% |
| 65 to 74 Years | 482 | 12.4% |
| 75 to 84 Years | 232 | 5.9% |
| 85 Years and Over | 82 | 2.1% |
| Total | 3,900 | 100.0% |
Housing Finances in Burley
Median Income by Occupancy in Burley
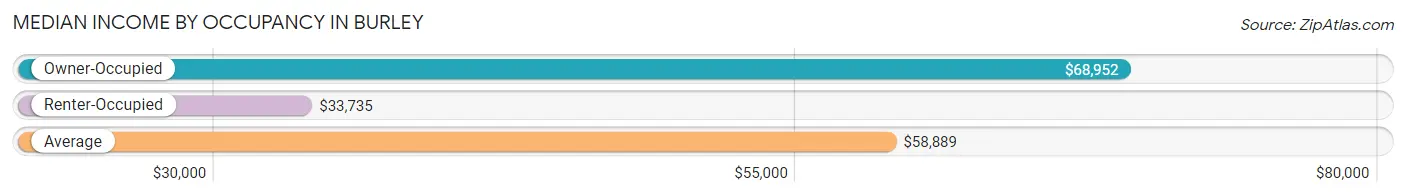
| Occupancy Type | # Households | Median Income |
| Owner-Occupied | 2,368 (60.7%) | $68,952 |
| Renter-Occupied | 1,532 (39.3%) | $33,735 |
| Average | 3,900 (100.0%) | $58,889 |
Occupancy by Householder Income Bracket in Burley
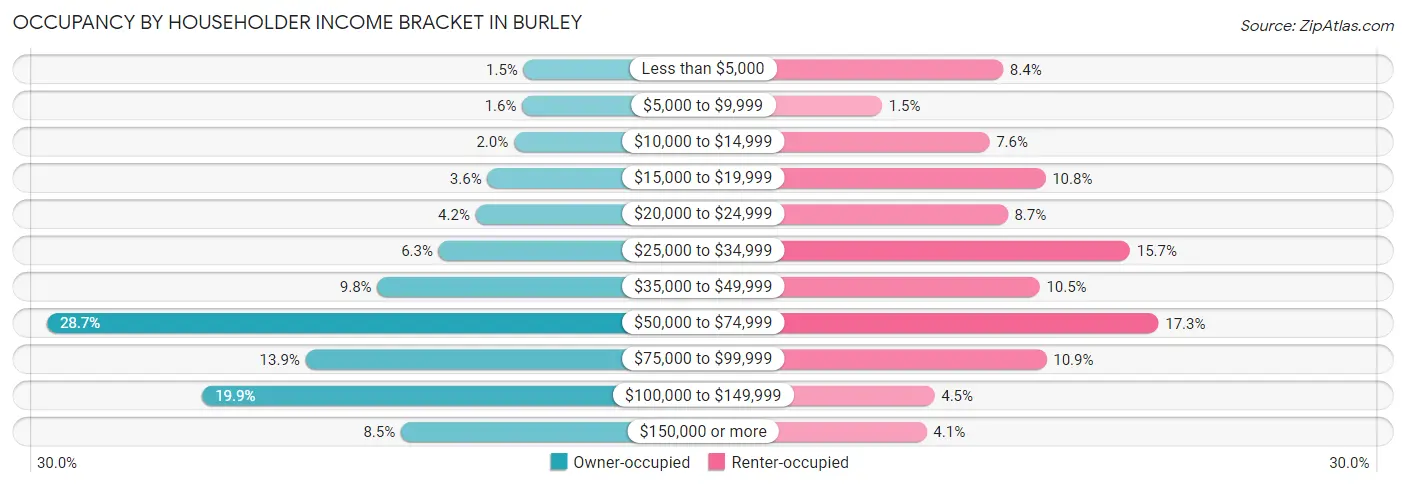
| Income Bracket | Owner-occupied | Renter-occupied |
| Less than $5,000 | 35 (1.5%) | 129 (8.4%) |
| $5,000 to $9,999 | 37 (1.6%) | 23 (1.5%) |
| $10,000 to $14,999 | 48 (2.0%) | 117 (7.6%) |
| $15,000 to $19,999 | 84 (3.5%) | 166 (10.8%) |
| $20,000 to $24,999 | 100 (4.2%) | 133 (8.7%) |
| $25,000 to $34,999 | 150 (6.3%) | 240 (15.7%) |
| $35,000 to $49,999 | 233 (9.8%) | 161 (10.5%) |
| $50,000 to $74,999 | 680 (28.7%) | 265 (17.3%) |
| $75,000 to $99,999 | 330 (13.9%) | 167 (10.9%) |
| $100,000 to $149,999 | 470 (19.9%) | 69 (4.5%) |
| $150,000 or more | 201 (8.5%) | 62 (4.1%) |
| Total | 2,368 (100.0%) | 1,532 (100.0%) |
Monthly Housing Cost Tiers in Burley
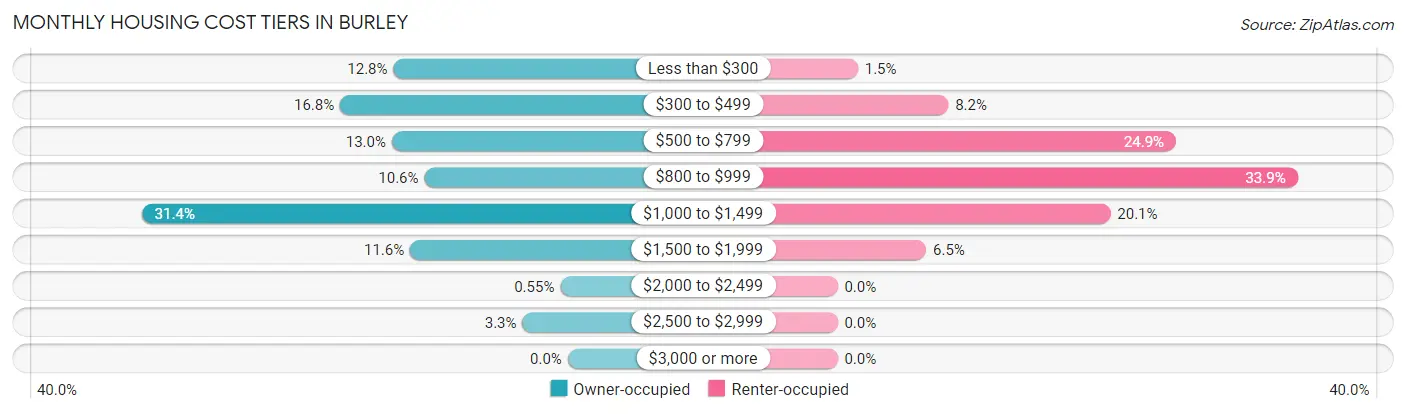
| Monthly Cost | Owner-occupied | Renter-occupied |
| Less than $300 | 304 (12.8%) | 23 (1.5%) |
| $300 to $499 | 397 (16.8%) | 125 (8.2%) |
| $500 to $799 | 307 (13.0%) | 382 (24.9%) |
| $800 to $999 | 250 (10.6%) | 519 (33.9%) |
| $1,000 to $1,499 | 743 (31.4%) | 308 (20.1%) |
| $1,500 to $1,999 | 275 (11.6%) | 100 (6.5%) |
| $2,000 to $2,499 | 13 (0.5%) | 0 (0.0%) |
| $2,500 to $2,999 | 79 (3.3%) | 0 (0.0%) |
| $3,000 or more | 0 (0.0%) | 0 (0.0%) |
| Total | 2,368 (100.0%) | 1,532 (100.0%) |
Physical Housing Characteristics in Burley
Housing Structures in Burley
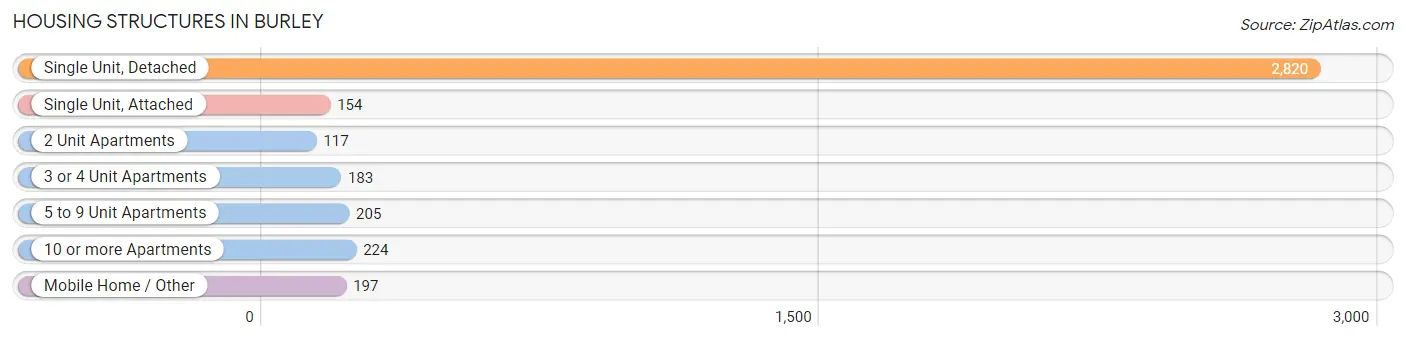
| Structure Type | # Housing Units | % Housing Units |
| Single Unit, Detached | 2,820 | 72.3% |
| Single Unit, Attached | 154 | 4.0% |
| 2 Unit Apartments | 117 | 3.0% |
| 3 or 4 Unit Apartments | 183 | 4.7% |
| 5 to 9 Unit Apartments | 205 | 5.3% |
| 10 or more Apartments | 224 | 5.7% |
| Mobile Home / Other | 197 | 5.1% |
| Total | 3,900 | 100.0% |
Housing Structures by Occupancy in Burley
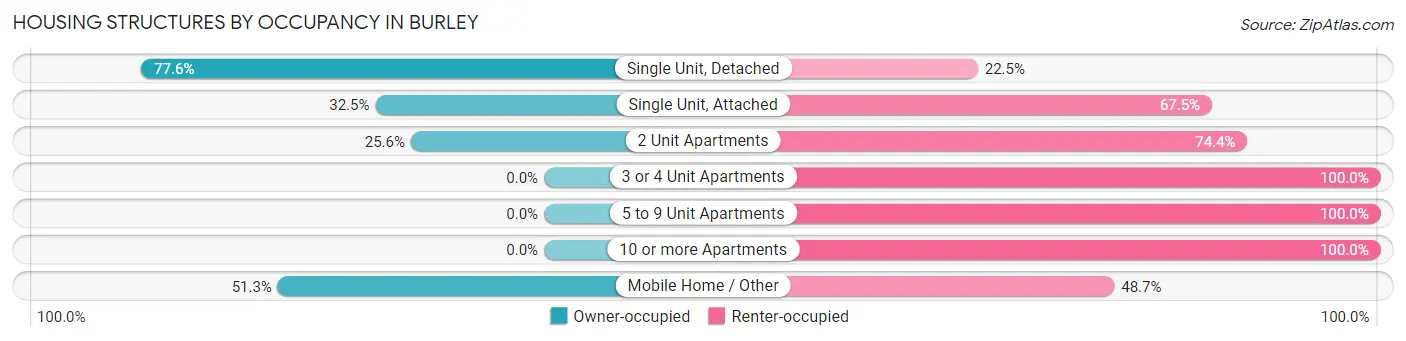
| Structure Type | Owner-occupied | Renter-occupied |
| Single Unit, Detached | 2,187 (77.5%) | 633 (22.5%) |
| Single Unit, Attached | 50 (32.5%) | 104 (67.5%) |
| 2 Unit Apartments | 30 (25.6%) | 87 (74.4%) |
| 3 or 4 Unit Apartments | 0 (0.0%) | 183 (100.0%) |
| 5 to 9 Unit Apartments | 0 (0.0%) | 205 (100.0%) |
| 10 or more Apartments | 0 (0.0%) | 224 (100.0%) |
| Mobile Home / Other | 101 (51.3%) | 96 (48.7%) |
| Total | 2,368 (60.7%) | 1,532 (39.3%) |
Housing Structures by Number of Rooms in Burley
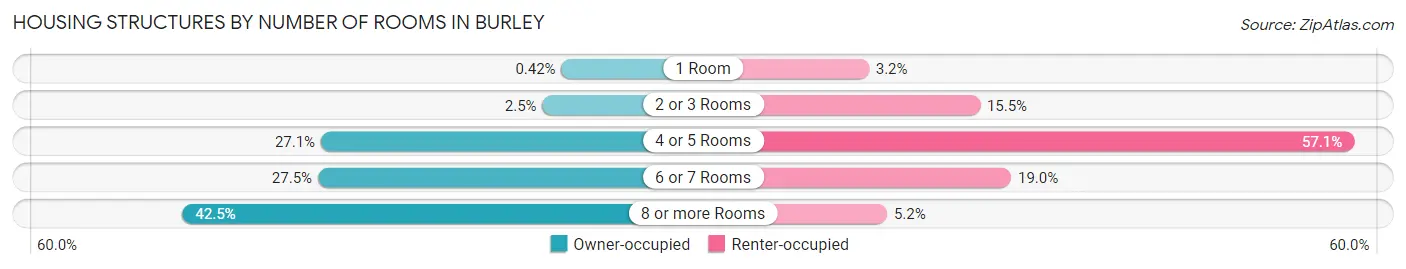
| Number of Rooms | Owner-occupied | Renter-occupied |
| 1 Room | 10 (0.4%) | 49 (3.2%) |
| 2 or 3 Rooms | 60 (2.5%) | 238 (15.5%) |
| 4 or 5 Rooms | 642 (27.1%) | 874 (57.1%) |
| 6 or 7 Rooms | 650 (27.5%) | 291 (19.0%) |
| 8 or more Rooms | 1,006 (42.5%) | 80 (5.2%) |
| Total | 2,368 (100.0%) | 1,532 (100.0%) |
Housing Structure by Heating Type in Burley
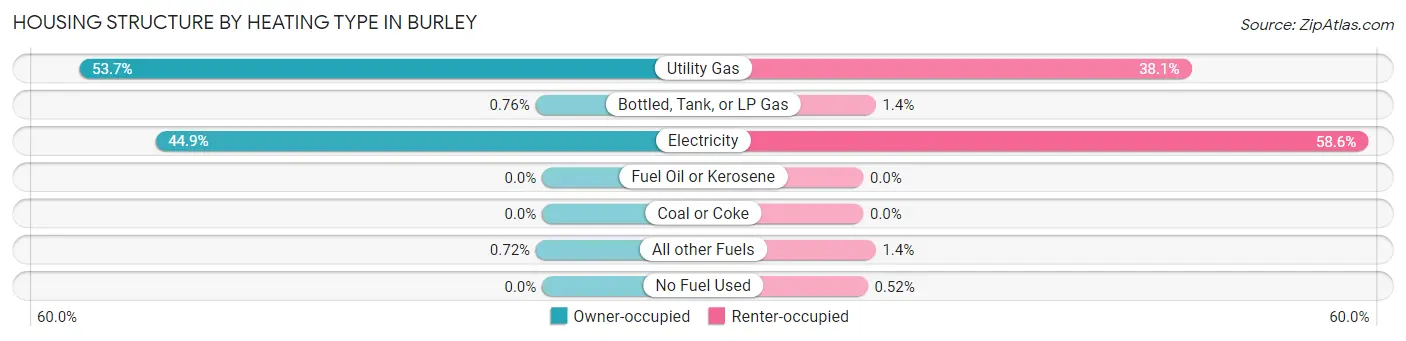
| Heating Type | Owner-occupied | Renter-occupied |
| Utility Gas | 1,271 (53.7%) | 583 (38.1%) |
| Bottled, Tank, or LP Gas | 18 (0.8%) | 22 (1.4%) |
| Electricity | 1,062 (44.9%) | 897 (58.6%) |
| Fuel Oil or Kerosene | 0 (0.0%) | 0 (0.0%) |
| Coal or Coke | 0 (0.0%) | 0 (0.0%) |
| All other Fuels | 17 (0.7%) | 22 (1.4%) |
| No Fuel Used | 0 (0.0%) | 8 (0.5%) |
| Total | 2,368 (100.0%) | 1,532 (100.0%) |
Household Vehicle Usage in Burley
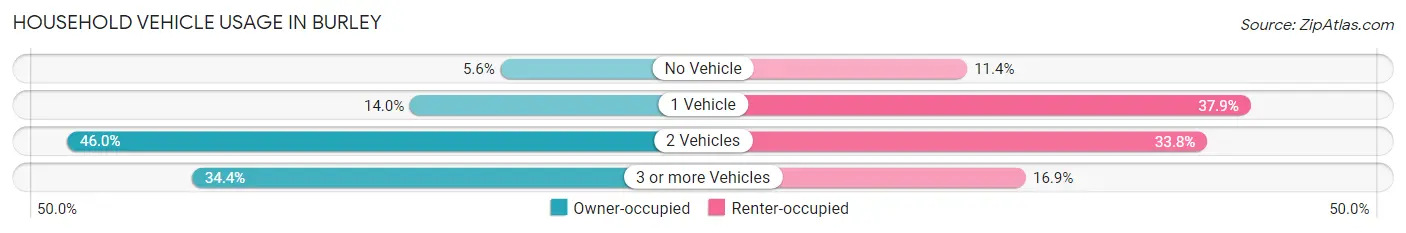
| Vehicles per Household | Owner-occupied | Renter-occupied |
| No Vehicle | 132 (5.6%) | 175 (11.4%) |
| 1 Vehicle | 332 (14.0%) | 580 (37.9%) |
| 2 Vehicles | 1,090 (46.0%) | 518 (33.8%) |
| 3 or more Vehicles | 814 (34.4%) | 259 (16.9%) |
| Total | 2,368 (100.0%) | 1,532 (100.0%) |
Real Estate & Mortgages in Burley
Real Estate and Mortgage Overview in Burley
| Characteristic | Without Mortgage | With Mortgage |
| Housing Units | 817 | 1,551 |
| Median Property Value | $118,900 | $211,300 |
| Median Household Income | $58,689 | $185 |
| Monthly Housing Costs | $360 | $0 |
| Real Estate Taxes | $737 | $48 |
Property Value by Mortgage Status in Burley
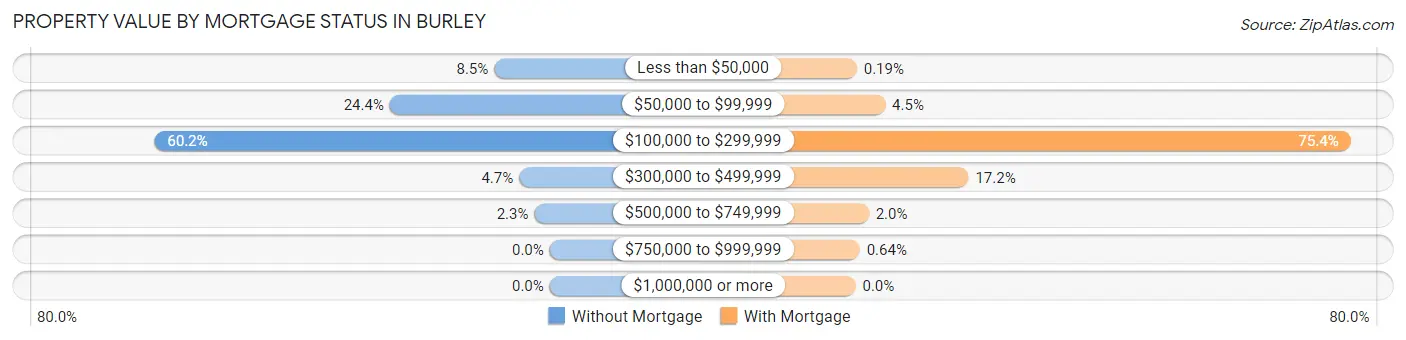
| Property Value | Without Mortgage | With Mortgage |
| Less than $50,000 | 69 (8.5%) | 3 (0.2%) |
| $50,000 to $99,999 | 199 (24.4%) | 70 (4.5%) |
| $100,000 to $299,999 | 492 (60.2%) | 1,170 (75.4%) |
| $300,000 to $499,999 | 38 (4.6%) | 267 (17.2%) |
| $500,000 to $749,999 | 19 (2.3%) | 31 (2.0%) |
| $750,000 to $999,999 | 0 (0.0%) | 10 (0.6%) |
| $1,000,000 or more | 0 (0.0%) | 0 (0.0%) |
| Total | 817 (100.0%) | 1,551 (100.0%) |
Household Income by Mortgage Status in Burley
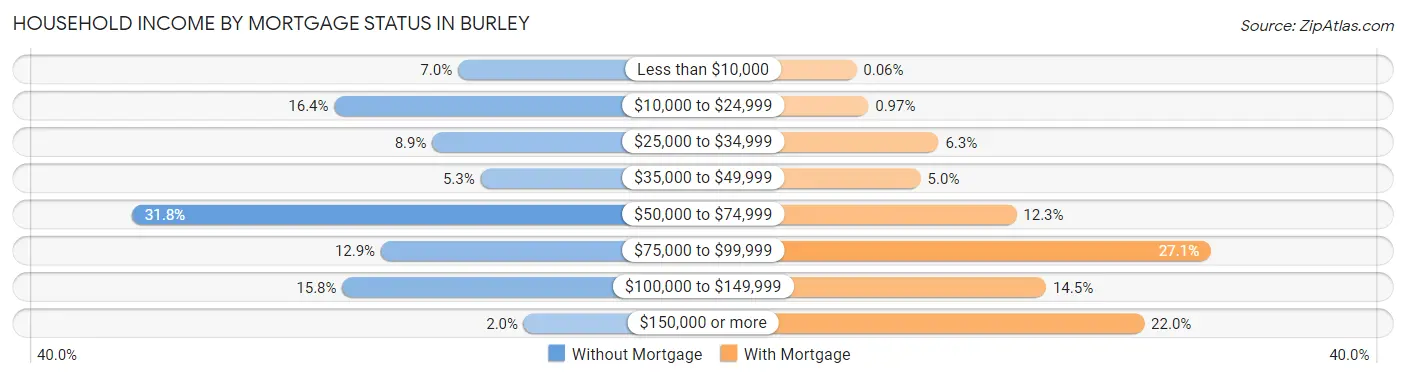
| Household Income | Without Mortgage | With Mortgage |
| Less than $10,000 | 57 (7.0%) | 1 (0.1%) |
| $10,000 to $24,999 | 134 (16.4%) | 15 (1.0%) |
| $25,000 to $34,999 | 73 (8.9%) | 98 (6.3%) |
| $35,000 to $49,999 | 43 (5.3%) | 77 (5.0%) |
| $50,000 to $74,999 | 260 (31.8%) | 190 (12.2%) |
| $75,000 to $99,999 | 105 (12.9%) | 420 (27.1%) |
| $100,000 to $149,999 | 129 (15.8%) | 225 (14.5%) |
| $150,000 or more | 16 (2.0%) | 341 (22.0%) |
| Total | 817 (100.0%) | 1,551 (100.0%) |
Property Value to Household Income Ratio in Burley
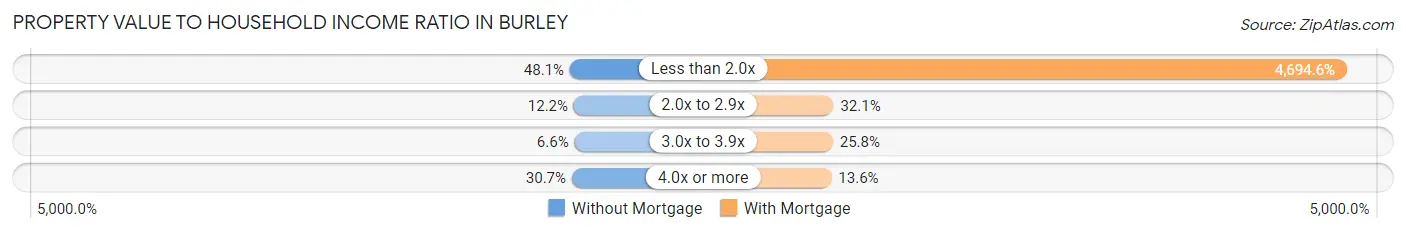
| Value-to-Income Ratio | Without Mortgage | With Mortgage |
| Less than 2.0x | 393 (48.1%) | 72,813 (4,694.6%) |
| 2.0x to 2.9x | 100 (12.2%) | 498 (32.1%) |
| 3.0x to 3.9x | 54 (6.6%) | 400 (25.8%) |
| 4.0x or more | 251 (30.7%) | 211 (13.6%) |
| Total | 817 (100.0%) | 1,551 (100.0%) |
Real Estate Taxes by Mortgage Status in Burley
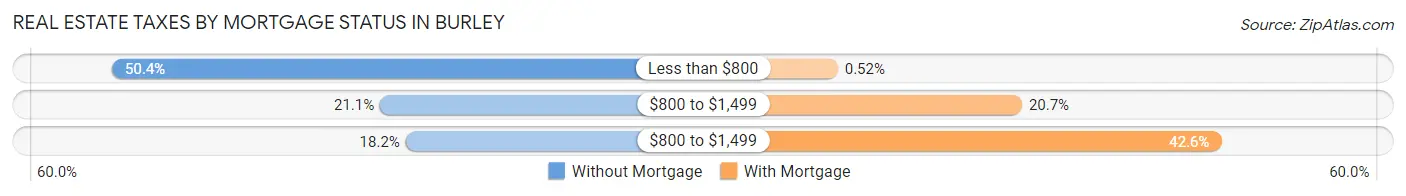
| Property Taxes | Without Mortgage | With Mortgage |
| Less than $800 | 412 (50.4%) | 8 (0.5%) |
| $800 to $1,499 | 172 (21.0%) | 321 (20.7%) |
| $800 to $1,499 | 149 (18.2%) | 660 (42.5%) |
| Total | 817 (100.0%) | 1,551 (100.0%) |
Health & Disability in Burley
Health Insurance Coverage by Age in Burley
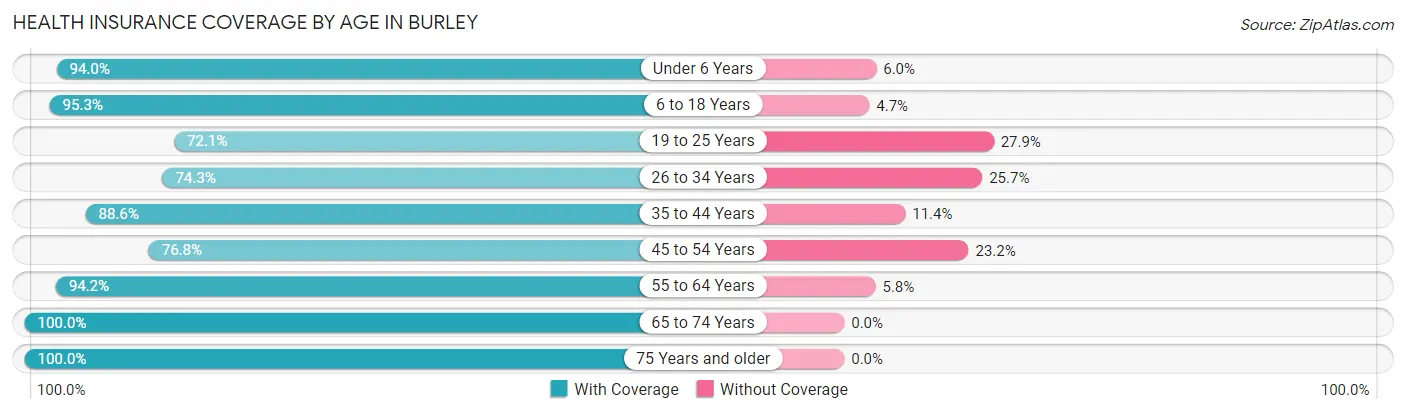
| Age Bracket | With Coverage | Without Coverage |
| Under 6 Years | 1,026 (94.0%) | 65 (6.0%) |
| 6 to 18 Years | 2,465 (95.3%) | 121 (4.7%) |
| 19 to 25 Years | 878 (72.1%) | 339 (27.9%) |
| 26 to 34 Years | 927 (74.3%) | 321 (25.7%) |
| 35 to 44 Years | 1,364 (88.6%) | 175 (11.4%) |
| 45 to 54 Years | 776 (76.8%) | 234 (23.2%) |
| 55 to 64 Years | 1,082 (94.2%) | 67 (5.8%) |
| 65 to 74 Years | 807 (100.0%) | 0 (0.0%) |
| 75 Years and older | 500 (100.0%) | 0 (0.0%) |
| Total | 9,825 (88.1%) | 1,322 (11.9%) |
Health Insurance Coverage by Citizenship Status in Burley
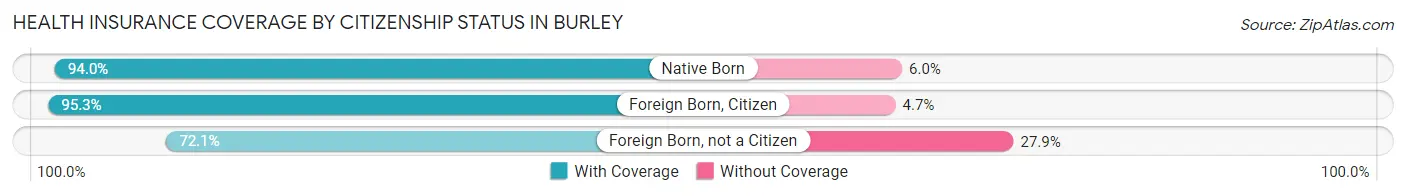
| Citizenship Status | With Coverage | Without Coverage |
| Native Born | 1,026 (94.0%) | 65 (6.0%) |
| Foreign Born, Citizen | 2,465 (95.3%) | 121 (4.7%) |
| Foreign Born, not a Citizen | 878 (72.1%) | 339 (27.9%) |
Health Insurance Coverage by Household Income in Burley
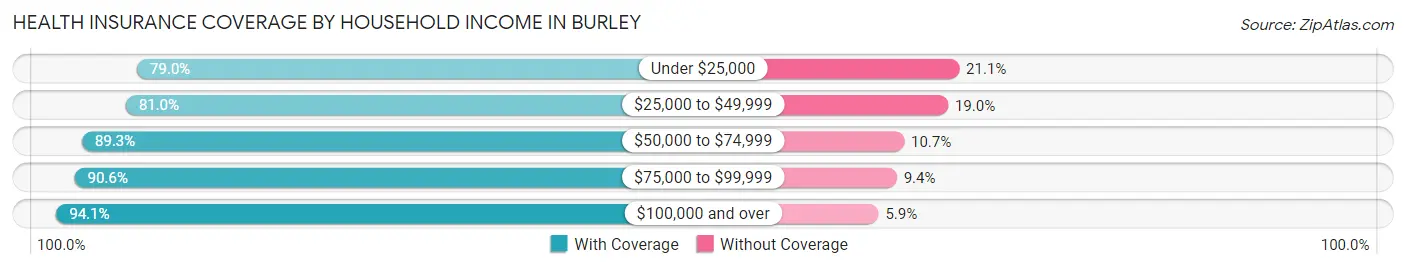
| Household Income | With Coverage | Without Coverage |
| Under $25,000 | 1,238 (78.9%) | 330 (21.0%) |
| $25,000 to $49,999 | 1,227 (81.0%) | 287 (19.0%) |
| $50,000 to $74,999 | 3,052 (89.3%) | 367 (10.7%) |
| $75,000 to $99,999 | 1,666 (90.6%) | 172 (9.4%) |
| $100,000 and over | 2,629 (94.1%) | 166 (5.9%) |
Public vs Private Health Insurance Coverage by Age in Burley
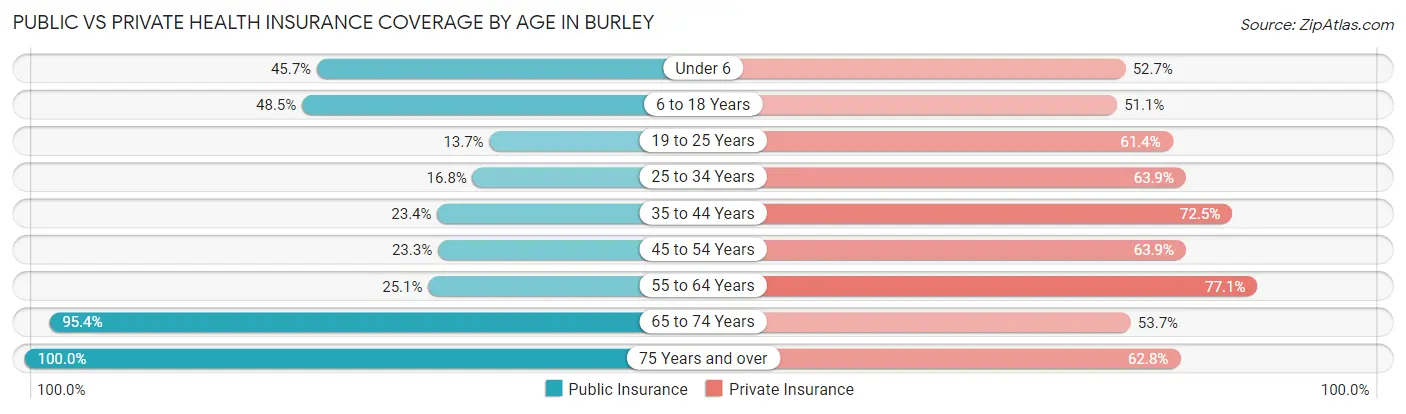
| Age Bracket | Public Insurance | Private Insurance |
| Under 6 | 499 (45.7%) | 575 (52.7%) |
| 6 to 18 Years | 1,254 (48.5%) | 1,322 (51.1%) |
| 19 to 25 Years | 167 (13.7%) | 747 (61.4%) |
| 25 to 34 Years | 210 (16.8%) | 797 (63.9%) |
| 35 to 44 Years | 360 (23.4%) | 1,115 (72.5%) |
| 45 to 54 Years | 235 (23.3%) | 645 (63.9%) |
| 55 to 64 Years | 288 (25.1%) | 886 (77.1%) |
| 65 to 74 Years | 770 (95.4%) | 433 (53.7%) |
| 75 Years and over | 500 (100.0%) | 314 (62.8%) |
| Total | 4,283 (38.4%) | 6,834 (61.3%) |
Disability Status by Sex by Age in Burley
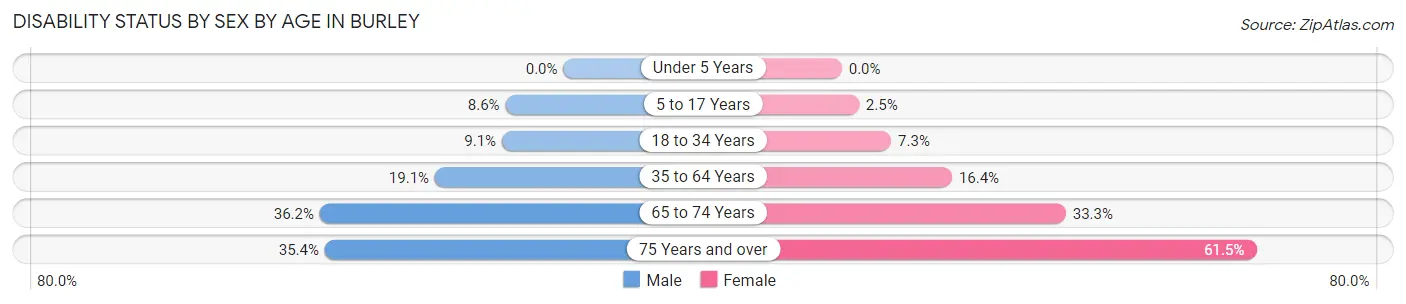
| Age Bracket | Male | Female |
| Under 5 Years | 0 (0.0%) | 0 (0.0%) |
| 5 to 17 Years | 120 (8.6%) | 30 (2.5%) |
| 18 to 34 Years | 133 (9.1%) | 89 (7.3%) |
| 35 to 64 Years | 379 (19.1%) | 280 (16.4%) |
| 65 to 74 Years | 119 (36.2%) | 159 (33.3%) |
| 75 Years and over | 85 (35.4%) | 160 (61.5%) |
Disability Class by Sex by Age in Burley
Disability Class: Hearing Difficulty
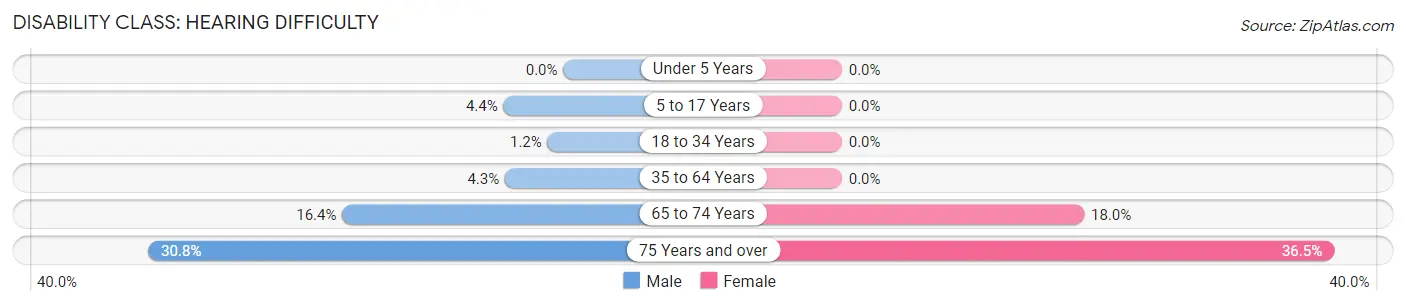
| Age Bracket | Male | Female |
| Under 5 Years | 0 (0.0%) | 0 (0.0%) |
| 5 to 17 Years | 62 (4.4%) | 0 (0.0%) |
| 18 to 34 Years | 17 (1.2%) | 0 (0.0%) |
| 35 to 64 Years | 86 (4.3%) | 0 (0.0%) |
| 65 to 74 Years | 54 (16.4%) | 86 (18.0%) |
| 75 Years and over | 74 (30.8%) | 95 (36.5%) |
Disability Class: Vision Difficulty
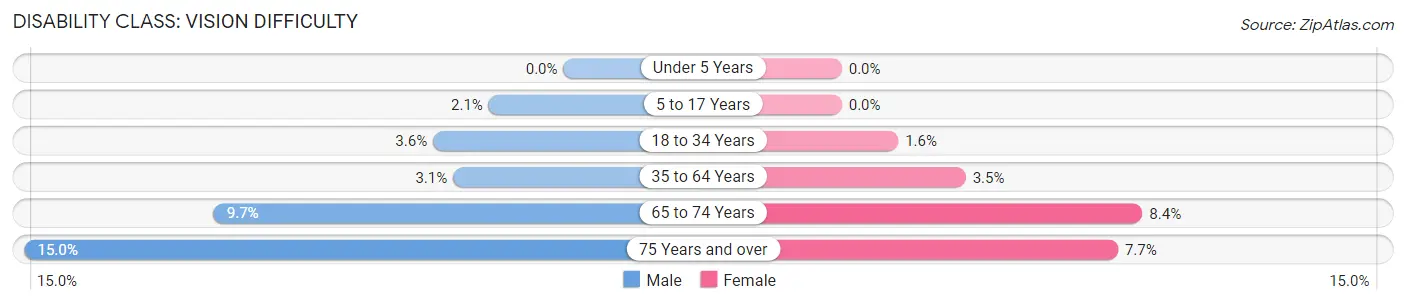
| Age Bracket | Male | Female |
| Under 5 Years | 0 (0.0%) | 0 (0.0%) |
| 5 to 17 Years | 29 (2.1%) | 0 (0.0%) |
| 18 to 34 Years | 53 (3.6%) | 19 (1.6%) |
| 35 to 64 Years | 61 (3.1%) | 59 (3.5%) |
| 65 to 74 Years | 32 (9.7%) | 40 (8.4%) |
| 75 Years and over | 36 (15.0%) | 20 (7.7%) |
Disability Class: Cognitive Difficulty
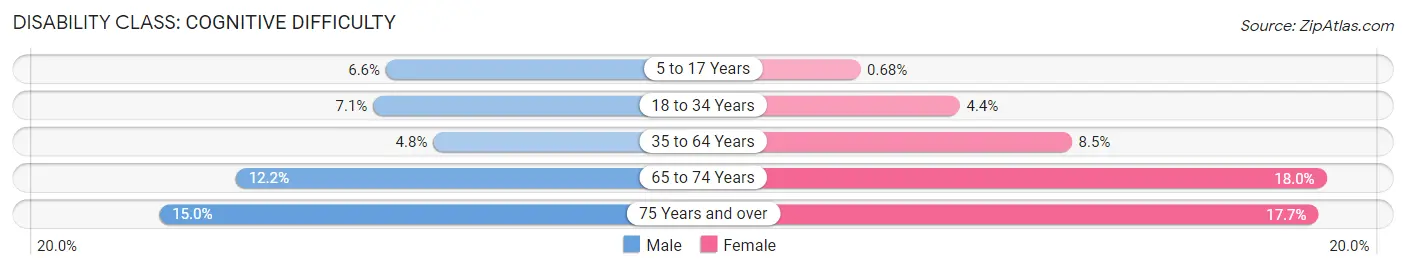
| Age Bracket | Male | Female |
| 5 to 17 Years | 92 (6.6%) | 8 (0.7%) |
| 18 to 34 Years | 103 (7.1%) | 53 (4.4%) |
| 35 to 64 Years | 96 (4.8%) | 146 (8.5%) |
| 65 to 74 Years | 40 (12.2%) | 86 (18.0%) |
| 75 Years and over | 36 (15.0%) | 46 (17.7%) |
Disability Class: Ambulatory Difficulty
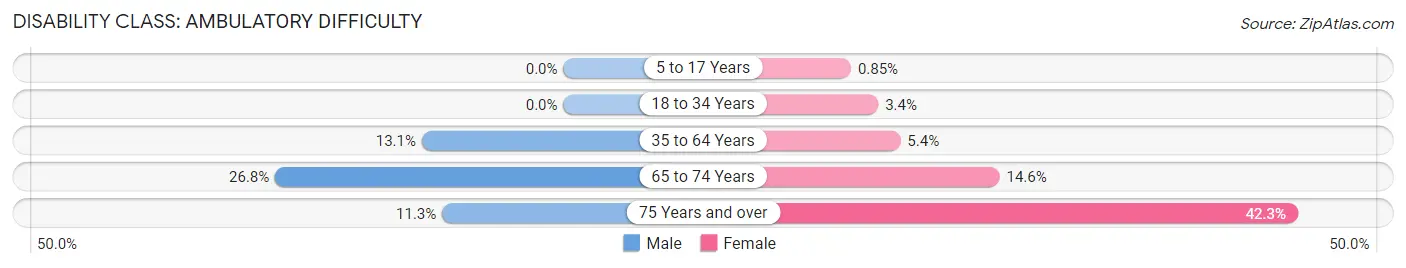
| Age Bracket | Male | Female |
| 5 to 17 Years | 0 (0.0%) | 10 (0.9%) |
| 18 to 34 Years | 0 (0.0%) | 41 (3.4%) |
| 35 to 64 Years | 261 (13.1%) | 93 (5.4%) |
| 65 to 74 Years | 88 (26.8%) | 70 (14.6%) |
| 75 Years and over | 27 (11.3%) | 110 (42.3%) |
Disability Class: Self-Care Difficulty
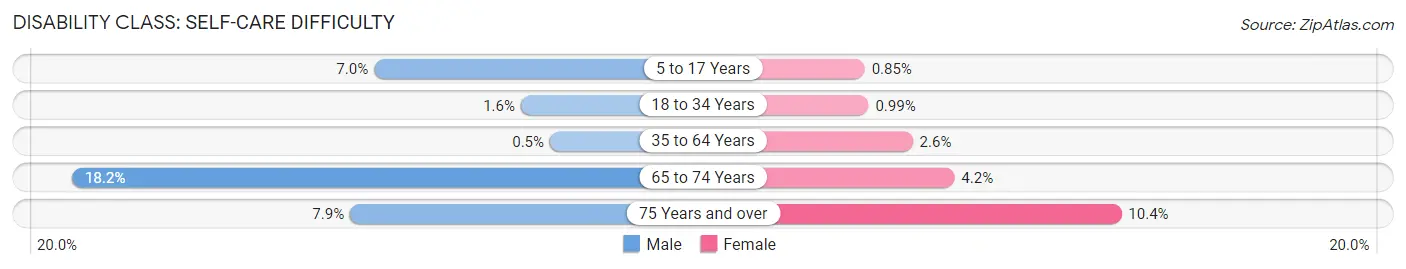
| Age Bracket | Male | Female |
| 5 to 17 Years | 98 (7.0%) | 10 (0.9%) |
| 18 to 34 Years | 23 (1.6%) | 12 (1.0%) |
| 35 to 64 Years | 10 (0.5%) | 45 (2.6%) |
| 65 to 74 Years | 60 (18.2%) | 20 (4.2%) |
| 75 Years and over | 19 (7.9%) | 27 (10.4%) |
Technology Access in Burley
Computing Device Access in Burley
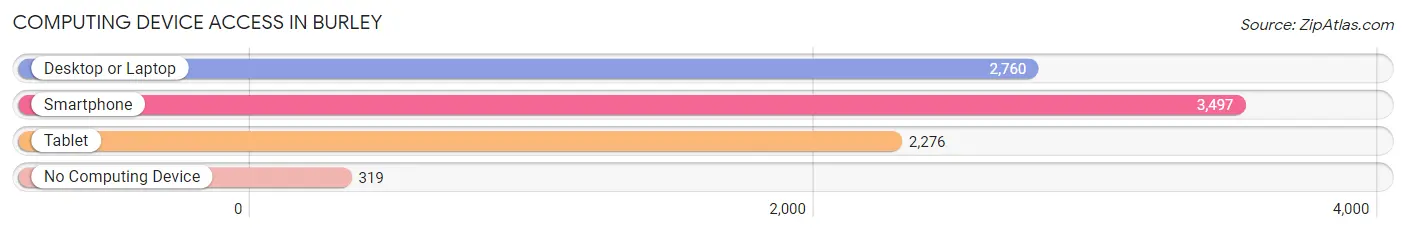
| Device Type | # Households | % Households |
| Desktop or Laptop | 2,760 | 70.8% |
| Smartphone | 3,497 | 89.7% |
| Tablet | 2,276 | 58.4% |
| No Computing Device | 319 | 8.2% |
| Total | 3,900 | 100.0% |
Internet Access in Burley
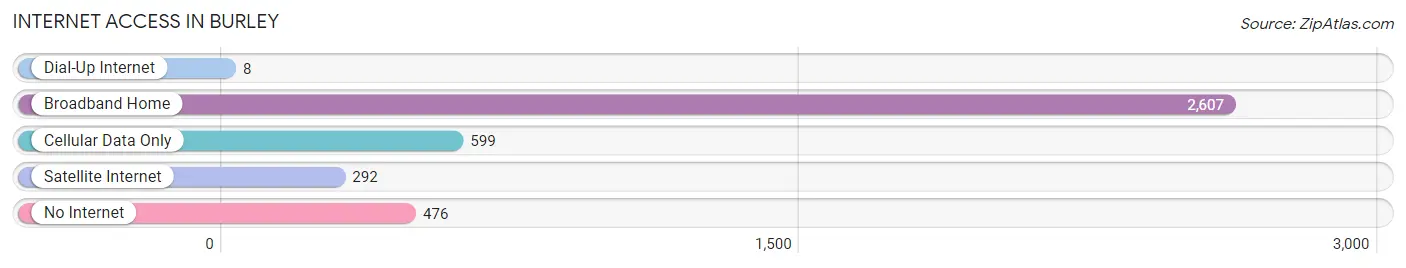
| Internet Type | # Households | % Households |
| Dial-Up Internet | 8 | 0.2% |
| Broadband Home | 2,607 | 66.8% |
| Cellular Data Only | 599 | 15.4% |
| Satellite Internet | 292 | 7.5% |
| No Internet | 476 | 12.2% |
| Total | 3,900 | 100.0% |
Burley Summary
Burley, Idaho is a small city located in the south-central part of the state, in Cassia County. It is situated along the Snake River, and is the county seat of Cassia County. The city has a population of approximately 11,000 people, and is part of the Twin Falls Metropolitan Statistical Area.
History
Burley was founded in 1906 by the Union Pacific Railroad, and was named after a railroad official, William Burley. The city was incorporated in 1908, and was initially a farming and ranching community. In the early 20th century, the city was a major stop on the Union Pacific Railroad, and was a hub for the agricultural industry.
In the 1950s, the city began to experience a population boom, as the agricultural industry in the area began to expand. This growth was further fueled by the construction of the Minidoka Dam in the 1960s, which provided irrigation for the area.
Geography
Burley is located in the south-central part of Idaho, in Cassia County. It is situated along the Snake River, and is the county seat of Cassia County. The city has a total area of 5.3 square miles, all of which is land.
The city is located in a semi-arid climate, with hot summers and cold winters. The average annual temperature is around 50 degrees Fahrenheit, and the average annual precipitation is around 11 inches.
Economy
The economy of Burley is largely based on agriculture and food processing. The city is home to several large food processing plants, including the J.R. Simplot Company, which produces potato products. The city is also home to several large agricultural companies, including the Idaho Sugar Company and the Idaho Potato Commission.
The city is also home to several manufacturing companies, including the Burley Manufacturing Company, which produces agricultural equipment. The city is also home to several retail stores, including Walmart and Target.
Demographics
As of the 2010 census, the population of Burley was 11,074. The racial makeup of the city was 90.3% White, 0.7% African American, 0.7% Native American, 0.7% Asian, 0.2% Pacific Islander, 5.3% from other races, and 2.2% from two or more races. Hispanic or Latino of any race were 11.3% of the population.
The median income for a household in the city was $35,938, and the median income for a family was $41,944. The per capita income for the city was $17,845. About 14.3% of families and 17.7% of the population were below the poverty line, including 25.2% of those under age 18 and 8.2% of those age 65 or over.
Common Questions
What is Per Capita Income in Burley?
Per Capita income in Burley is $26,596.
What is the Median Family Income in Burley?
Median Family Income in Burley is $64,788.
What is the Median Household income in Burley?
Median Household Income in Burley is $58,889.
What is Income or Wage Gap in Burley?
Income or Wage Gap in Burley is 33.5%.
Women in Burley earn 66.5 cents for every dollar earned by a man.
What is Family Income Deficit in Burley?
Family Income Deficit in Burley is $13,190.
Families that are below poverty line in Burley earn $13,190 less on average than the poverty threshold level.
What is Inequality or Gini Index in Burley?
Inequality or Gini Index in Burley is 0.45.
What is the Total Population of Burley?
Total Population of Burley is 11,506.
What is the Total Male Population of Burley?
Total Male Population of Burley is 6,118.
What is the Total Female Population of Burley?
Total Female Population of Burley is 5,388.
What is the Ratio of Males per 100 Females in Burley?
There are 113.55 Males per 100 Females in Burley.
What is the Ratio of Females per 100 Males in Burley?
There are 88.07 Females per 100 Males in Burley.
What is the Median Population Age in Burley?
Median Population Age in Burley is 30.2 Years.
What is the Average Family Size in Burley
Average Family Size in Burley is 3.4 People.
What is the Average Household Size in Burley
Average Household Size in Burley is 2.9 People.
How Large is the Labor Force in Burley?
There are 5,703 People in the Labor Forcein in Burley.
What is the Percentage of People in the Labor Force in Burley?
66.9% of People are in the Labor Force in Burley.
What is the Unemployment Rate in Burley?
Unemployment Rate in Burley is 3.7%.