Twin Falls, ID Map & Demographics
Twin Falls Map
Twin Falls Overview
$31,255
PER CAPITA INCOME
$71,330
AVG FAMILY INCOME
$58,024
AVG HOUSEHOLD INCOME
42.1%
WAGE / INCOME GAP [ % ]
57.9¢/ $1
WAGE / INCOME GAP [ $ ]
$9,329
FAMILY INCOME DEFICIT
0.45
INEQUALITY / GINI INDEX
52,315
TOTAL POPULATION
26,354
MALE POPULATION
25,961
FEMALE POPULATION
101.51
MALES / 100 FEMALES
98.51
FEMALES / 100 MALES
34.0
MEDIAN AGE
3.2
AVG FAMILY SIZE
2.6
AVG HOUSEHOLD SIZE
25,826
LABOR FORCE [ PEOPLE ]
63.9%
PERCENT IN LABOR FORCE
3.1%
UNEMPLOYMENT RATE
Twin Falls Zip Codes
Twin Falls Area Codes
Income in Twin Falls
Income Overview in Twin Falls
Per Capita Income in Twin Falls is $31,255, while median incomes of families and households are $71,330 and $58,024 respectively.
| Characteristic | Number | Measure |
| Per Capita Income | 52,315 | $31,255 |
| Median Family Income | 12,813 | $71,330 |
| Mean Family Income | 12,813 | $95,023 |
| Median Household Income | 19,897 | $58,024 |
| Mean Household Income | 19,897 | $79,248 |
| Income Deficit | 12,813 | $9,329 |
| Wage / Income Gap (%) | 52,315 | 42.11% |
| Wage / Income Gap ($) | 52,315 | 57.89¢ per $1 |
| Gini / Inequality Index | 52,315 | 0.45 |
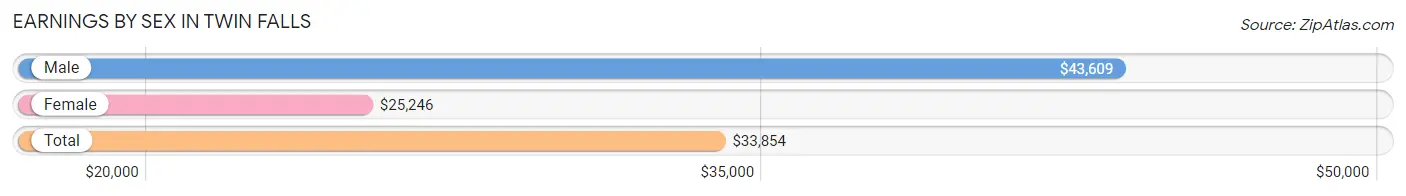
Earnings by Sex in Twin Falls
Average Earnings in Twin Falls are $33,854, $43,609 for men and $25,246 for women, a difference of 42.1%.
| Sex | Number | Average Earnings |
| Male | 15,390 (54.7%) | $43,609 |
| Female | 12,760 (45.3%) | $25,246 |
| Total | 28,150 (100.0%) | $33,854 |
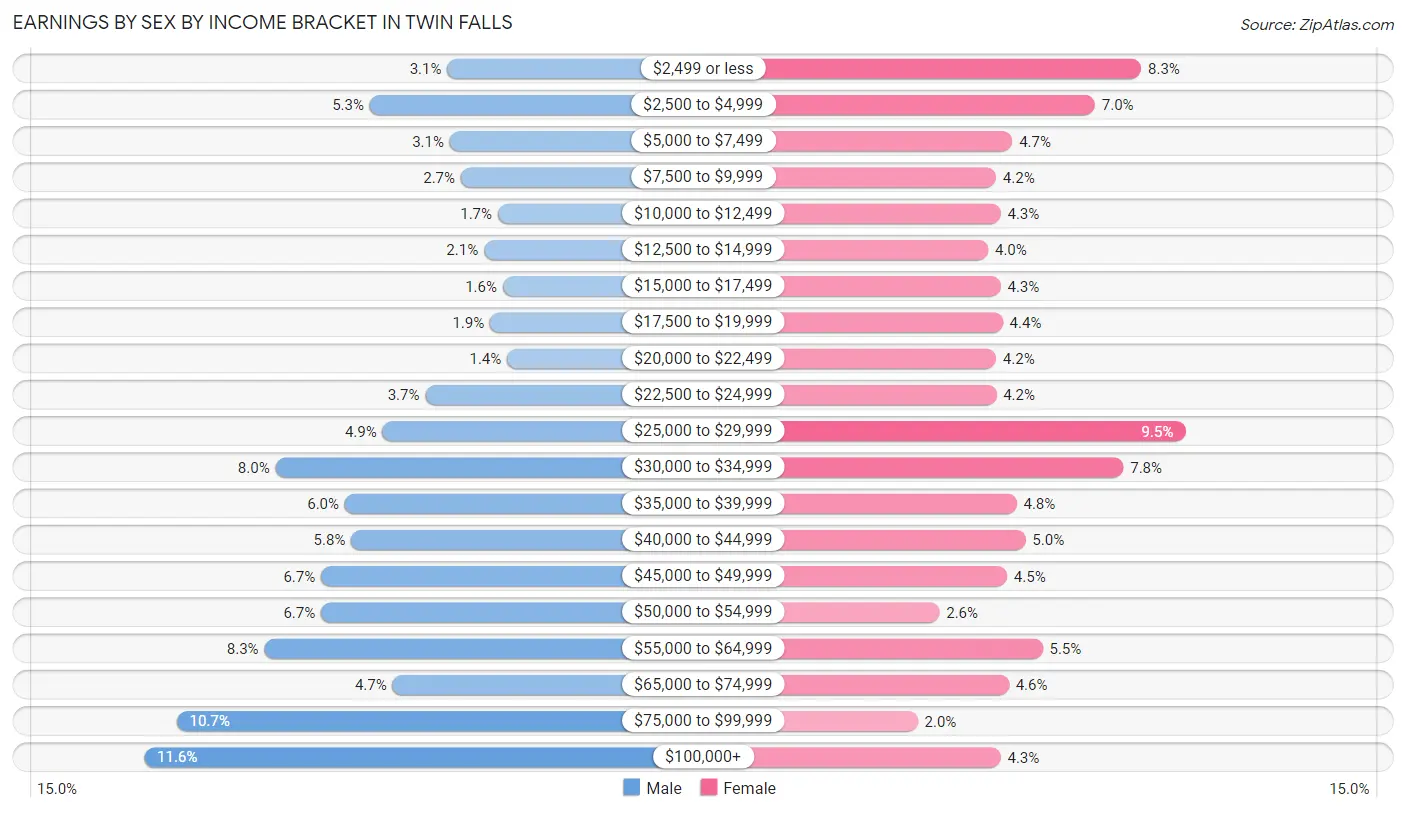
Earnings by Sex by Income Bracket in Twin Falls
The most common earnings brackets in Twin Falls are $100,000+ for men (1,791 | 11.6%) and $25,000 to $29,999 for women (1,213 | 9.5%).
| Income | Male | Female |
| $2,499 or less | 480 (3.1%) | 1,055 (8.3%) |
| $2,500 to $4,999 | 816 (5.3%) | 889 (7.0%) |
| $5,000 to $7,499 | 470 (3.0%) | 593 (4.6%) |
| $7,500 to $9,999 | 422 (2.7%) | 535 (4.2%) |
| $10,000 to $12,499 | 262 (1.7%) | 551 (4.3%) |
| $12,500 to $14,999 | 321 (2.1%) | 507 (4.0%) |
| $15,000 to $17,499 | 240 (1.6%) | 551 (4.3%) |
| $17,500 to $19,999 | 296 (1.9%) | 559 (4.4%) |
| $20,000 to $22,499 | 222 (1.4%) | 535 (4.2%) |
| $22,500 to $24,999 | 575 (3.7%) | 536 (4.2%) |
| $25,000 to $29,999 | 760 (4.9%) | 1,213 (9.5%) |
| $30,000 to $34,999 | 1,224 (8.0%) | 992 (7.8%) |
| $35,000 to $39,999 | 924 (6.0%) | 609 (4.8%) |
| $40,000 to $44,999 | 895 (5.8%) | 641 (5.0%) |
| $45,000 to $49,999 | 1,026 (6.7%) | 574 (4.5%) |
| $50,000 to $54,999 | 1,026 (6.7%) | 332 (2.6%) |
| $55,000 to $64,999 | 1,271 (8.3%) | 702 (5.5%) |
| $65,000 to $74,999 | 717 (4.7%) | 581 (4.5%) |
| $75,000 to $99,999 | 1,652 (10.7%) | 254 (2.0%) |
| $100,000+ | 1,791 (11.6%) | 551 (4.3%) |
| Total | 15,390 (100.0%) | 12,760 (100.0%) |
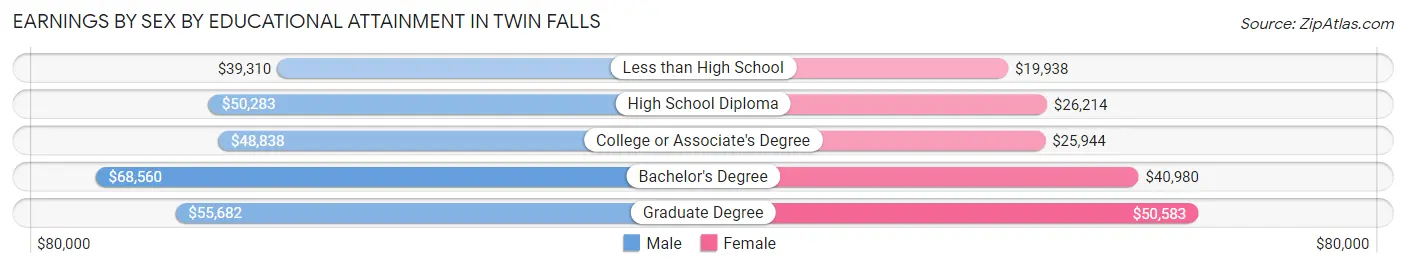
Earnings by Sex by Educational Attainment in Twin Falls
Average earnings in Twin Falls are $50,845 for men and $27,394 for women, a difference of 46.1%. Men with an educational attainment of bachelor's degree enjoy the highest average annual earnings of $68,560, while those with less than high school education earn the least with $39,310. Women with an educational attainment of graduate degree earn the most with the average annual earnings of $50,583, while those with less than high school education have the smallest earnings of $19,938.
| Educational Attainment | Male Income | Female Income |
| Less than High School | $39,310 | $19,938 |
| High School Diploma | $50,283 | $26,214 |
| College or Associate's Degree | $48,838 | $25,944 |
| Bachelor's Degree | $68,560 | $40,980 |
| Graduate Degree | $55,682 | $50,583 |
| Total | $50,845 | $27,394 |
Family Income in Twin Falls
Family Income Brackets in Twin Falls
According to the Twin Falls family income data, there are 2,755 families falling into the $50,000 to $74,999 income range, which is the most common income bracket and makes up 21.5% of all families. Conversely, the less than $10,000 income bracket is the least frequent group with only 154 families (1.2%) belonging to this category.
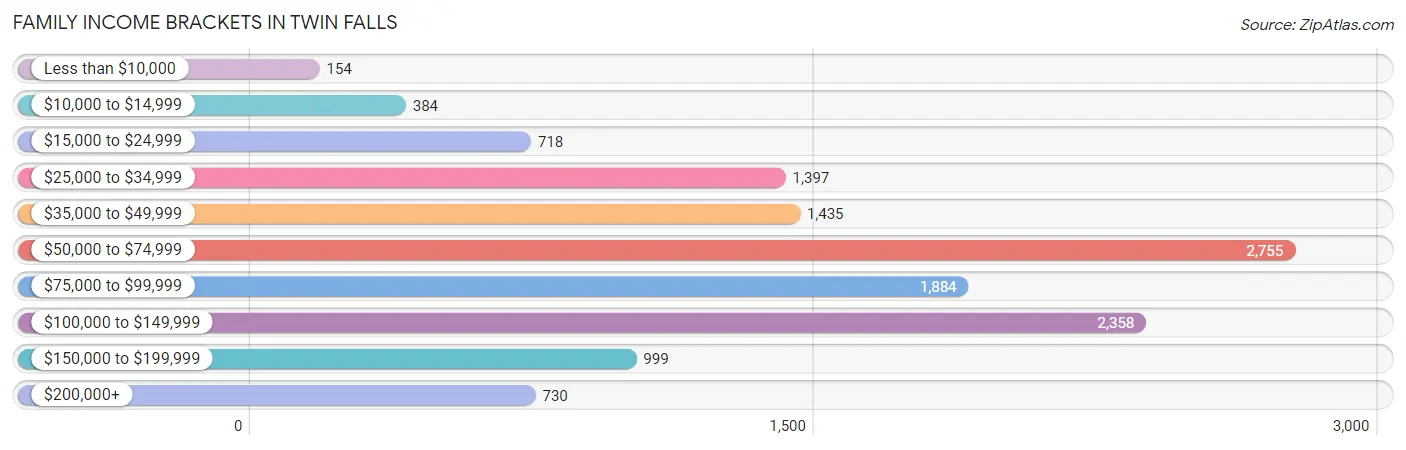
| Income Bracket | # Families | % Families |
| Less than $10,000 | 154 | 1.2% |
| $10,000 to $14,999 | 384 | 3.0% |
| $15,000 to $24,999 | 718 | 5.6% |
| $25,000 to $34,999 | 1,397 | 10.9% |
| $35,000 to $49,999 | 1,435 | 11.2% |
| $50,000 to $74,999 | 2,755 | 21.5% |
| $75,000 to $99,999 | 1,884 | 14.7% |
| $100,000 to $149,999 | 2,358 | 18.4% |
| $150,000 to $199,999 | 999 | 7.8% |
| $200,000+ | 730 | 5.7% |
Family Income by Famaliy Size in Twin Falls
6-person families (530 | 4.1%) account for the highest median family income in Twin Falls with $102,821 per family, while 2-person families (5,762 | 45.0%) have the highest median income of $29,629 per family member.
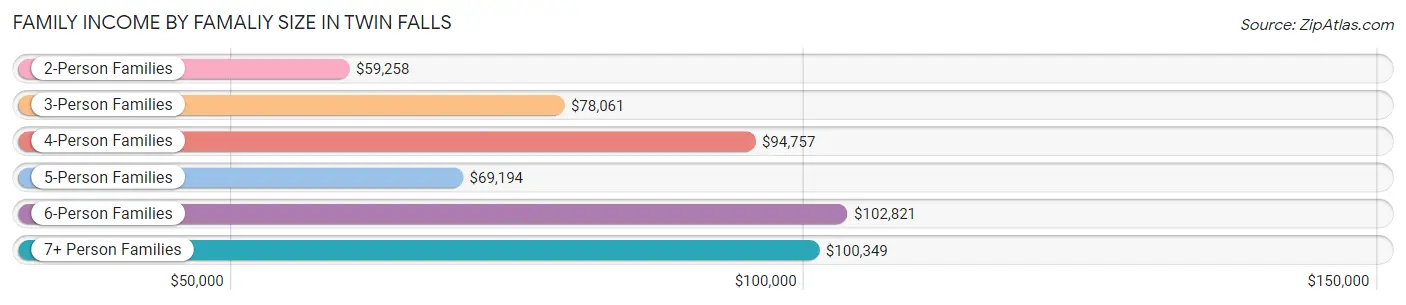
| Income Bracket | # Families | Median Income |
| 2-Person Families | 5,762 (45.0%) | $59,258 |
| 3-Person Families | 2,754 (21.5%) | $78,061 |
| 4-Person Families | 1,959 (15.3%) | $94,757 |
| 5-Person Families | 1,457 (11.4%) | $69,194 |
| 6-Person Families | 530 (4.1%) | $102,821 |
| 7+ Person Families | 351 (2.7%) | $100,349 |
| Total | 12,813 (100.0%) | $71,330 |
Family Income by Number of Earners in Twin Falls
The median family income in Twin Falls is $71,330, with families comprising 3+ earners (1,297) having the highest median family income of $111,051, while families with 1 earner (4,020) have the lowest median family income of $48,960, accounting for 10.1% and 31.4% of families, respectively.
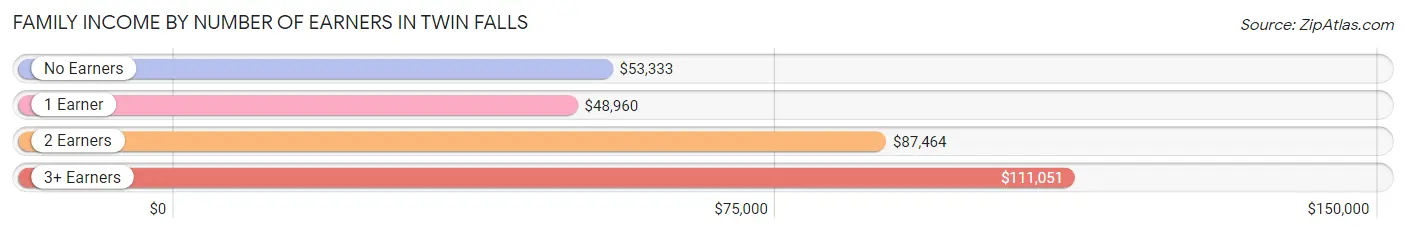
| Number of Earners | # Families | Median Income |
| No Earners | 1,458 (11.4%) | $53,333 |
| 1 Earner | 4,020 (31.4%) | $48,960 |
| 2 Earners | 6,038 (47.1%) | $87,464 |
| 3+ Earners | 1,297 (10.1%) | $111,051 |
| Total | 12,813 (100.0%) | $71,330 |
Household Income in Twin Falls
Household Income Brackets in Twin Falls
With 4,178 households falling in the category, the $50,000 to $74,999 income range is the most frequent in Twin Falls, accounting for 21.0% of all households. In contrast, only 458 households (2.3%) fall into the less than $10,000 income bracket, making it the least populous group.
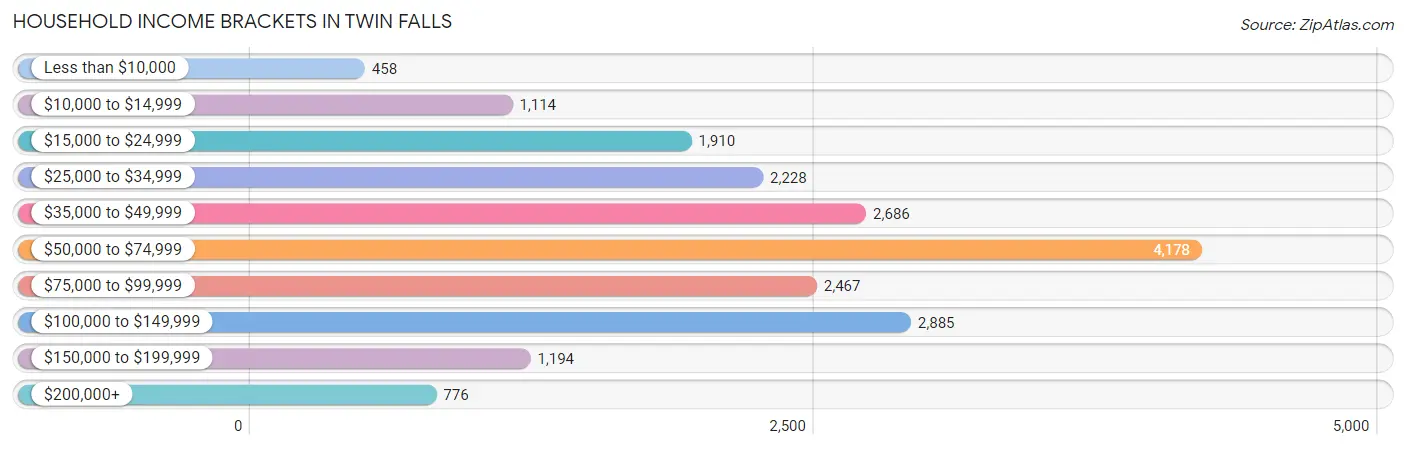
| Income Bracket | # Households | % Households |
| Less than $10,000 | 458 | 2.3% |
| $10,000 to $14,999 | 1,114 | 5.6% |
| $15,000 to $24,999 | 1,910 | 9.6% |
| $25,000 to $34,999 | 2,228 | 11.2% |
| $35,000 to $49,999 | 2,686 | 13.5% |
| $50,000 to $74,999 | 4,178 | 21.0% |
| $75,000 to $99,999 | 2,467 | 12.4% |
| $100,000 to $149,999 | 2,885 | 14.5% |
| $150,000 to $199,999 | 1,194 | 6.0% |
| $200,000+ | 776 | 3.9% |
Household Income by Householder Age in Twin Falls
The median household income in Twin Falls is $58,024, with the highest median household income of $68,849 found in the 25 to 44 years age bracket for the primary householder. A total of 7,666 households (38.5%) fall into this category. Meanwhile, the 65+ years age bracket for the primary householder has the lowest median household income of $40,421, with 4,915 households (24.7%) in this group.
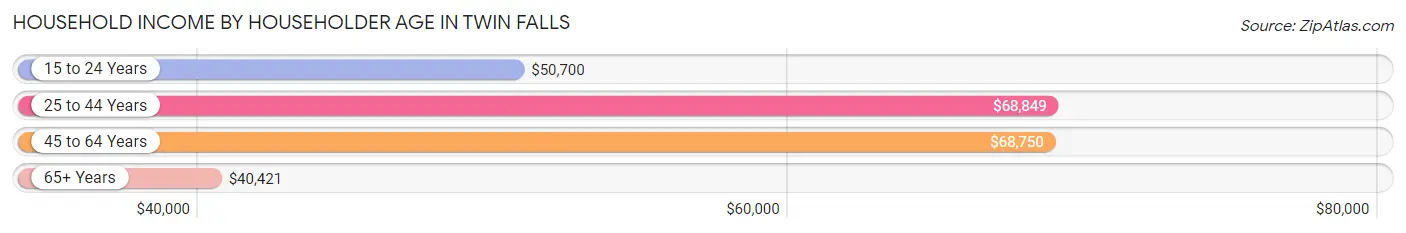
| Income Bracket | # Households | Median Income |
| 15 to 24 Years | 1,372 (6.9%) | $50,700 |
| 25 to 44 Years | 7,666 (38.5%) | $68,849 |
| 45 to 64 Years | 5,944 (29.9%) | $68,750 |
| 65+ Years | 4,915 (24.7%) | $40,421 |
| Total | 19,897 (100.0%) | $58,024 |
Poverty in Twin Falls
Income Below Poverty by Sex and Age in Twin Falls
With 11.9% poverty level for males and 12.3% for females among the residents of Twin Falls, 5 year old males and 55 to 64 year old females are the most vulnerable to poverty, with 180 males (38.4%) and 473 females (19.6%) in their respective age groups living below the poverty level.
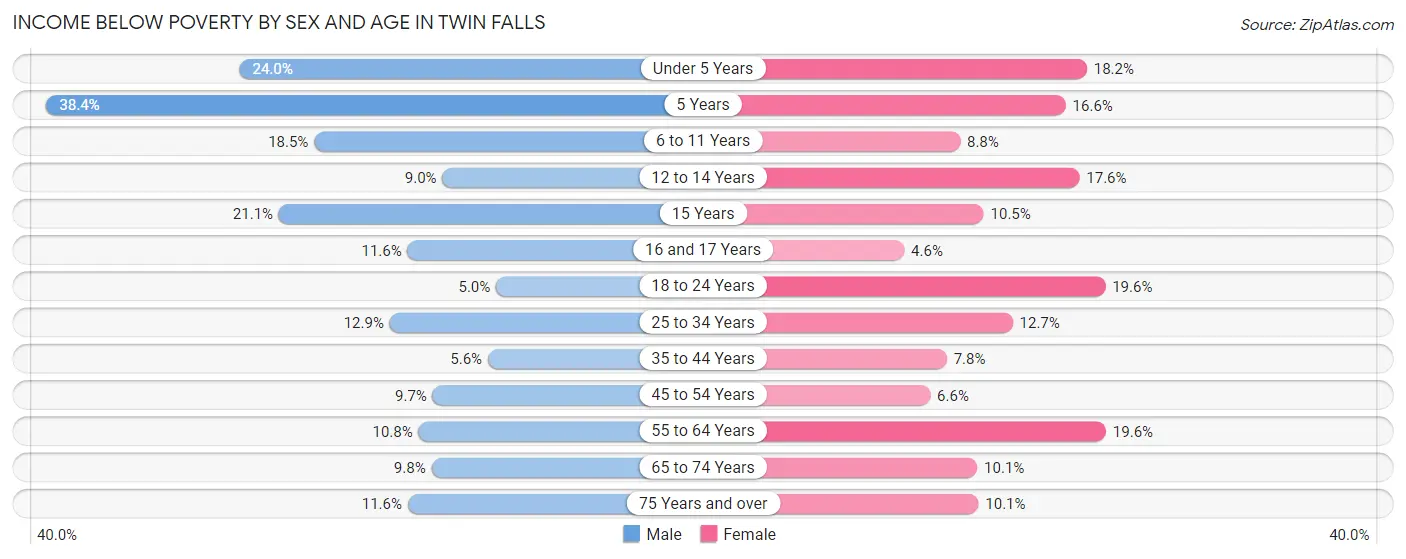
| Age Bracket | Male | Female |
| Under 5 Years | 492 (24.0%) | 281 (18.2%) |
| 5 Years | 180 (38.4%) | 66 (16.6%) |
| 6 to 11 Years | 425 (18.5%) | 208 (8.8%) |
| 12 to 14 Years | 92 (9.0%) | 181 (17.6%) |
| 15 Years | 49 (21.1%) | 46 (10.5%) |
| 16 and 17 Years | 82 (11.6%) | 25 (4.6%) |
| 18 to 24 Years | 134 (5.0%) | 447 (19.6%) |
| 25 to 34 Years | 492 (12.9%) | 542 (12.7%) |
| 35 to 44 Years | 215 (5.6%) | 257 (7.8%) |
| 45 to 54 Years | 260 (9.7%) | 152 (6.6%) |
| 55 to 64 Years | 261 (10.7%) | 473 (19.6%) |
| 65 to 74 Years | 193 (9.8%) | 244 (10.1%) |
| 75 Years and over | 179 (11.6%) | 199 (10.1%) |
| Total | 3,054 (11.9%) | 3,121 (12.3%) |
Income Above Poverty by Sex and Age in Twin Falls
According to the poverty statistics in Twin Falls, males aged 18 to 24 years and females aged 16 and 17 years are the age groups that are most secure financially, with 95.0% of males and 95.4% of females in these age groups living above the poverty line.
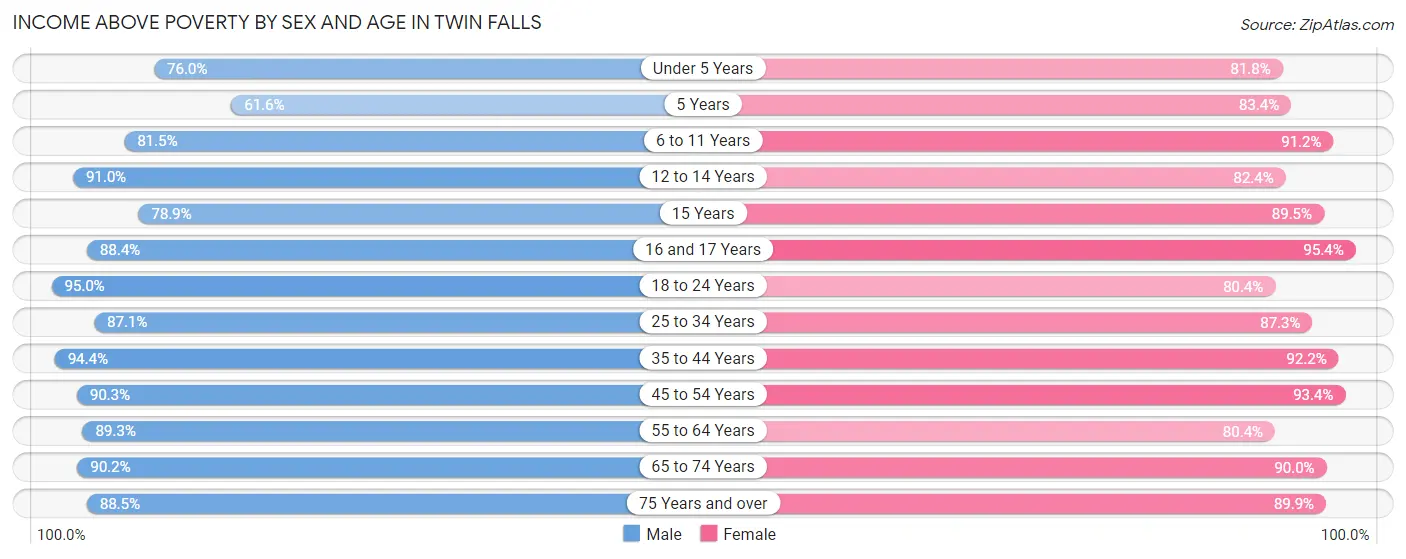
| Age Bracket | Male | Female |
| Under 5 Years | 1,555 (76.0%) | 1,264 (81.8%) |
| 5 Years | 289 (61.6%) | 331 (83.4%) |
| 6 to 11 Years | 1,872 (81.5%) | 2,162 (91.2%) |
| 12 to 14 Years | 933 (91.0%) | 845 (82.4%) |
| 15 Years | 183 (78.9%) | 391 (89.5%) |
| 16 and 17 Years | 627 (88.4%) | 515 (95.4%) |
| 18 to 24 Years | 2,553 (95.0%) | 1,838 (80.4%) |
| 25 to 34 Years | 3,325 (87.1%) | 3,734 (87.3%) |
| 35 to 44 Years | 3,626 (94.4%) | 3,042 (92.2%) |
| 45 to 54 Years | 2,421 (90.3%) | 2,165 (93.4%) |
| 55 to 64 Years | 2,166 (89.2%) | 1,939 (80.4%) |
| 65 to 74 Years | 1,778 (90.2%) | 2,185 (89.9%) |
| 75 Years and over | 1,371 (88.4%) | 1,764 (89.9%) |
| Total | 22,699 (88.1%) | 22,175 (87.7%) |
Income Below Poverty Among Married-Couple Families in Twin Falls
The poverty statistics for married-couple families in Twin Falls show that 6.6% or 647 of the total 9,870 families live below the poverty line. Families with 5 or more children have the highest poverty rate of 25.9%, comprising of 74 families. On the other hand, families with no children have the lowest poverty rate of 4.0%, which includes 213 families.
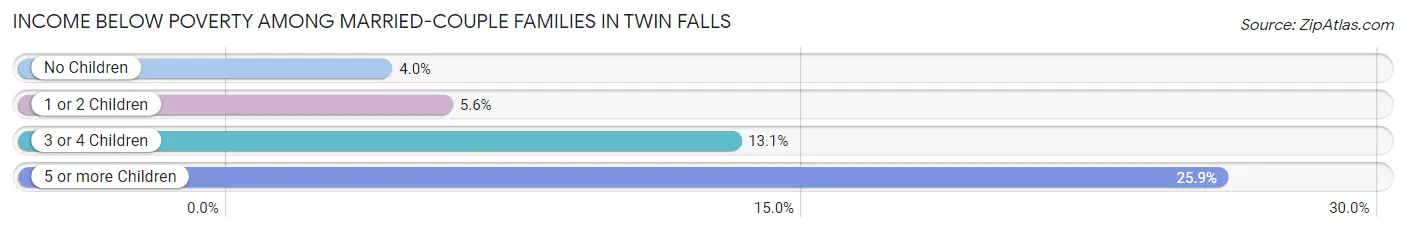
| Children | Above Poverty | Below Poverty |
| No Children | 5,077 (96.0%) | 213 (4.0%) |
| 1 or 2 Children | 2,559 (94.4%) | 152 (5.6%) |
| 3 or 4 Children | 1,375 (86.9%) | 208 (13.1%) |
| 5 or more Children | 212 (74.1%) | 74 (25.9%) |
| Total | 9,223 (93.4%) | 647 (6.6%) |
Income Below Poverty Among Single-Parent Households in Twin Falls
According to the poverty data in Twin Falls, 6.4% or 63 single-father households and 24.3% or 478 single-mother households are living below the poverty line. Among single-father households, those with 3 or 4 children have the highest poverty rate, with 22 households (51.2%) experiencing poverty. Likewise, among single-mother households, those with 3 or 4 children have the highest poverty rate, with 111 households (60.3%) falling below the poverty line.
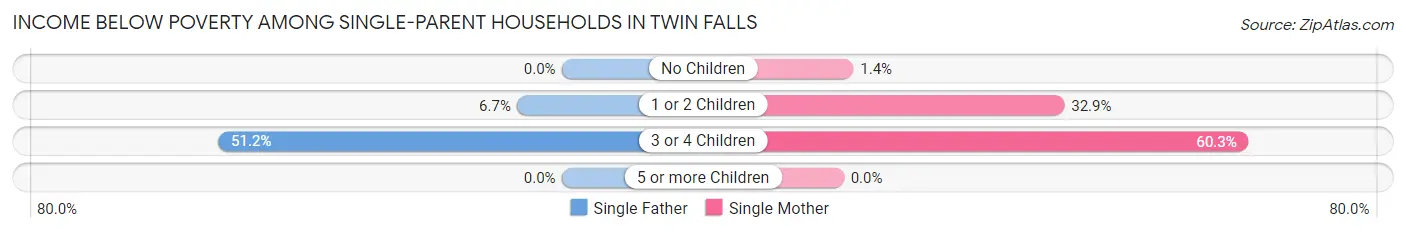
| Children | Single Father | Single Mother |
| No Children | 0 (0.0%) | 10 (1.4%) |
| 1 or 2 Children | 41 (6.7%) | 357 (32.9%) |
| 3 or 4 Children | 22 (51.2%) | 111 (60.3%) |
| 5 or more Children | 0 (0.0%) | 0 (0.0%) |
| Total | 63 (6.4%) | 478 (24.3%) |
Income Below Poverty Among Married-Couple vs Single-Parent Households in Twin Falls
The poverty data for Twin Falls shows that 647 of the married-couple family households (6.6%) and 541 of the single-parent households (18.4%) are living below the poverty level. Within the married-couple family households, those with 5 or more children have the highest poverty rate, with 74 households (25.9%) falling below the poverty line. Among the single-parent households, those with 3 or 4 children have the highest poverty rate, with 133 household (58.6%) living below poverty.
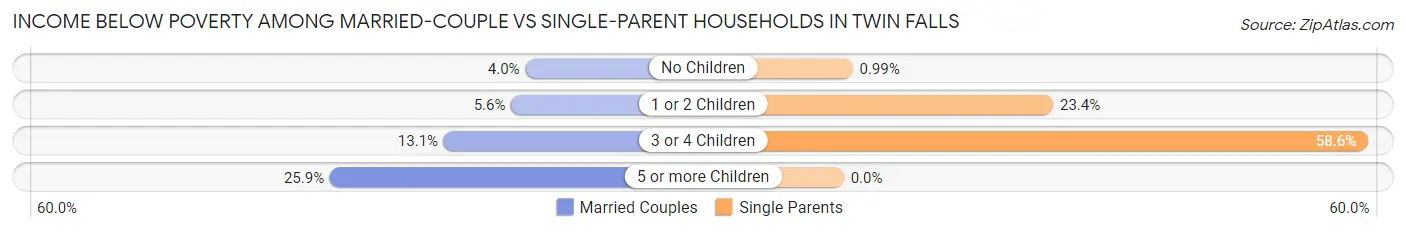
| Children | Married-Couple Families | Single-Parent Households |
| No Children | 213 (4.0%) | 10 (1.0%) |
| 1 or 2 Children | 152 (5.6%) | 398 (23.4%) |
| 3 or 4 Children | 208 (13.1%) | 133 (58.6%) |
| 5 or more Children | 74 (25.9%) | 0 (0.0%) |
| Total | 647 (6.6%) | 541 (18.4%) |
Race in Twin Falls
The most populous races in Twin Falls are White / Caucasian (43,834 | 83.8%), Hispanic or Latino (7,889 | 15.1%), and Two or more Races (4,217 | 8.1%).
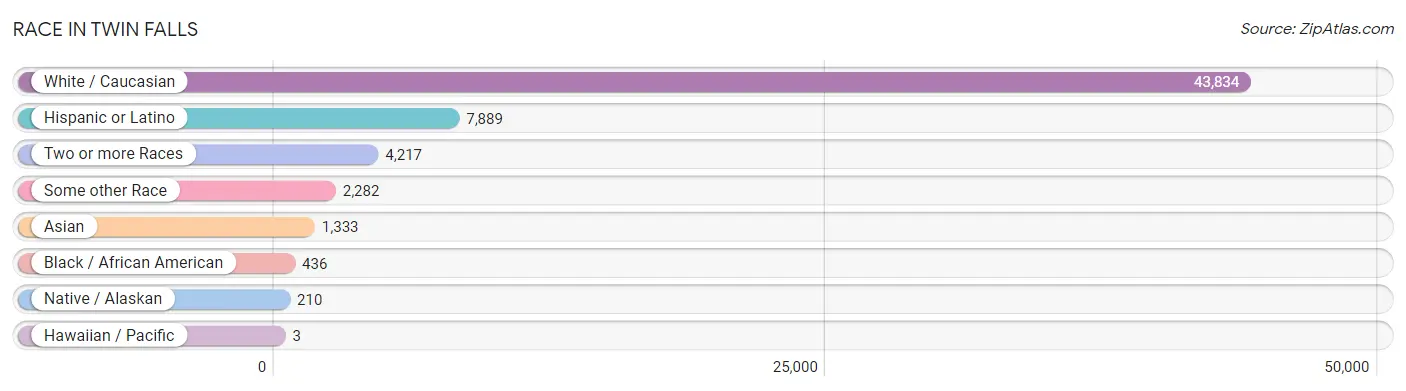
| Race | # Population | % Population |
| Asian | 1,333 | 2.5% |
| Black / African American | 436 | 0.8% |
| Hawaiian / Pacific | 3 | 0.0% |
| Hispanic or Latino | 7,889 | 15.1% |
| Native / Alaskan | 210 | 0.4% |
| White / Caucasian | 43,834 | 83.8% |
| Two or more Races | 4,217 | 8.1% |
| Some other Race | 2,282 | 4.4% |
| Total | 52,315 | 100.0% |
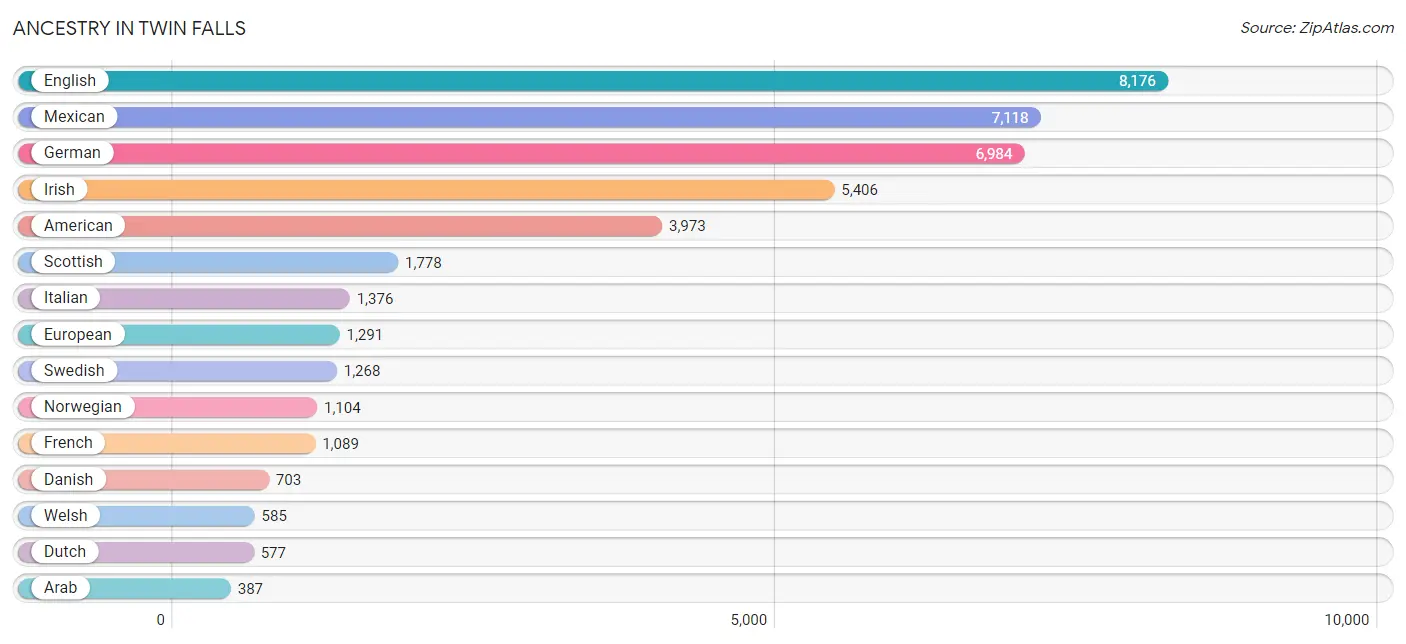
Ancestry in Twin Falls
The most populous ancestries reported in Twin Falls are English (8,176 | 15.6%), Mexican (7,118 | 13.6%), German (6,984 | 13.4%), Irish (5,406 | 10.3%), and American (3,973 | 7.6%), together accounting for 60.5% of all Twin Falls residents.
| Ancestry | # Population | % Population |
| Afghan | 66 | 0.1% |
| African | 157 | 0.3% |
| Albanian | 19 | 0.0% |
| American | 3,973 | 7.6% |
| Apache | 3 | 0.0% |
| Arab | 387 | 0.7% |
| Armenian | 10 | 0.0% |
| Austrian | 46 | 0.1% |
| Basque | 141 | 0.3% |
| Belgian | 45 | 0.1% |
| Belizean | 1 | 0.0% |
| Bhutanese | 376 | 0.7% |
| Blackfeet | 18 | 0.0% |
| British | 221 | 0.4% |
| Burmese | 134 | 0.3% |
| Cambodian | 30 | 0.1% |
| Canadian | 157 | 0.3% |
| Central American | 299 | 0.6% |
| Cherokee | 313 | 0.6% |
| Chippewa | 5 | 0.0% |
| Choctaw | 60 | 0.1% |
| Colombian | 57 | 0.1% |
| Costa Rican | 142 | 0.3% |
| Croatian | 67 | 0.1% |
| Czech | 213 | 0.4% |
| Czechoslovakian | 52 | 0.1% |
| Danish | 703 | 1.3% |
| Dutch | 577 | 1.1% |
| Eastern European | 11 | 0.0% |
| English | 8,176 | 15.6% |
| European | 1,291 | 2.5% |
| Finnish | 52 | 0.1% |
| French | 1,089 | 2.1% |
| French Canadian | 143 | 0.3% |
| German | 6,984 | 13.4% |
| German Russian | 31 | 0.1% |
| Greek | 144 | 0.3% |
| Guatemalan | 86 | 0.2% |
| Hungarian | 207 | 0.4% |
| Icelander | 12 | 0.0% |
| Indian (Asian) | 31 | 0.1% |
| Indonesian | 173 | 0.3% |
| Iranian | 196 | 0.4% |
| Iraqi | 108 | 0.2% |
| Irish | 5,406 | 10.3% |
| Italian | 1,376 | 2.6% |
| Kenyan | 8 | 0.0% |
| Korean | 71 | 0.1% |
| Laotian | 23 | 0.0% |
| Latvian | 38 | 0.1% |
| Lebanese | 138 | 0.3% |
| Luxembourger | 19 | 0.0% |
| Marshallese | 3 | 0.0% |
| Mexican | 7,118 | 13.6% |
| Mexican American Indian | 58 | 0.1% |
| Moroccan | 12 | 0.0% |
| Native Hawaiian | 64 | 0.1% |
| Navajo | 64 | 0.1% |
| Northern European | 309 | 0.6% |
| Norwegian | 1,104 | 2.1% |
| Paiute | 9 | 0.0% |
| Pakistani | 12 | 0.0% |
| Polish | 184 | 0.4% |
| Portuguese | 229 | 0.4% |
| Potawatomi | 7 | 0.0% |
| Pueblo | 1 | 0.0% |
| Puerto Rican | 65 | 0.1% |
| Russian | 216 | 0.4% |
| Salvadoran | 18 | 0.0% |
| Scandinavian | 304 | 0.6% |
| Scotch-Irish | 258 | 0.5% |
| Scottish | 1,778 | 3.4% |
| Sioux | 7 | 0.0% |
| Slavic | 10 | 0.0% |
| Slovak | 7 | 0.0% |
| South American | 57 | 0.1% |
| Spaniard | 31 | 0.1% |
| Spanish | 47 | 0.1% |
| Sri Lankan | 31 | 0.1% |
| Subsaharan African | 173 | 0.3% |
| Swedish | 1,268 | 2.4% |
| Swiss | 319 | 0.6% |
| Thai | 134 | 0.3% |
| Ukrainian | 75 | 0.1% |
| Welsh | 585 | 1.1% |
| West Indian | 17 | 0.0% |
| Yugoslavian | 230 | 0.4% | View All 87 Rows |
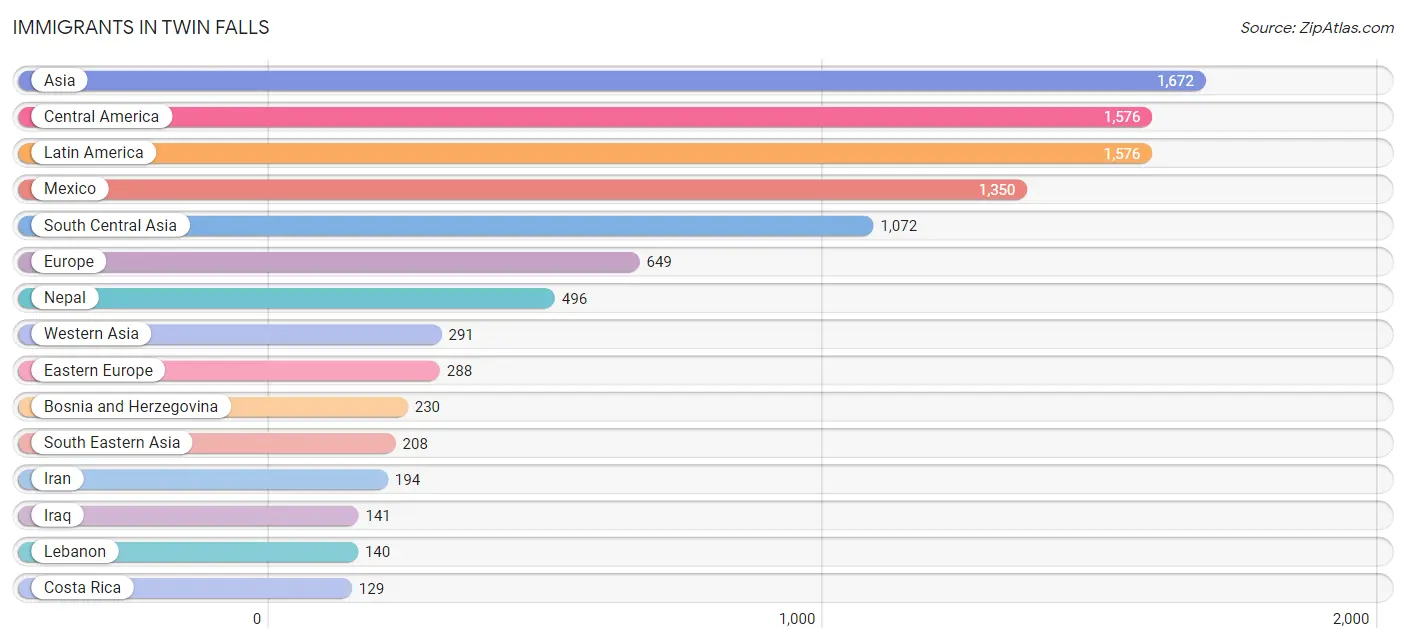
Immigrants in Twin Falls
The most numerous immigrant groups reported in Twin Falls came from Asia (1,672 | 3.2%), Central America (1,576 | 3.0%), Latin America (1,576 | 3.0%), Mexico (1,350 | 2.6%), and South Central Asia (1,072 | 2.1%), together accounting for 13.9% of all Twin Falls residents.
| Immigration Origin | # Population | % Population |
| Afghanistan | 19 | 0.0% |
| Africa | 16 | 0.0% |
| Asia | 1,672 | 3.2% |
| Australia | 55 | 0.1% |
| Bosnia and Herzegovina | 230 | 0.4% |
| Canada | 64 | 0.1% |
| Central America | 1,576 | 3.0% |
| China | 11 | 0.0% |
| Congo | 8 | 0.0% |
| Costa Rica | 129 | 0.3% |
| Czechoslovakia | 10 | 0.0% |
| Eastern Africa | 8 | 0.0% |
| Eastern Asia | 101 | 0.2% |
| Eastern Europe | 288 | 0.5% |
| El Salvador | 18 | 0.0% |
| England | 67 | 0.1% |
| Europe | 649 | 1.2% |
| France | 7 | 0.0% |
| Germany | 48 | 0.1% |
| Guatemala | 26 | 0.1% |
| Honduras | 53 | 0.1% |
| India | 127 | 0.2% |
| Iran | 194 | 0.4% |
| Iraq | 141 | 0.3% |
| Kenya | 8 | 0.0% |
| Korea | 60 | 0.1% |
| Latin America | 1,576 | 3.0% |
| Lebanon | 140 | 0.3% |
| Malaysia | 47 | 0.1% |
| Mexico | 1,350 | 2.6% |
| Micronesia | 3 | 0.0% |
| Middle Africa | 8 | 0.0% |
| Nepal | 496 | 0.9% |
| Netherlands | 10 | 0.0% |
| Northern Europe | 100 | 0.2% |
| Norway | 23 | 0.0% |
| Oceania | 58 | 0.1% |
| Philippines | 28 | 0.1% |
| Portugal | 64 | 0.1% |
| Romania | 27 | 0.1% |
| Russia | 21 | 0.0% |
| Scotland | 10 | 0.0% |
| South Central Asia | 1,072 | 2.1% |
| South Eastern Asia | 208 | 0.4% |
| Southern Europe | 64 | 0.1% |
| Thailand | 12 | 0.0% |
| Vietnam | 31 | 0.1% |
| Western Asia | 291 | 0.6% |
| Western Europe | 65 | 0.1% | View All 49 Rows |
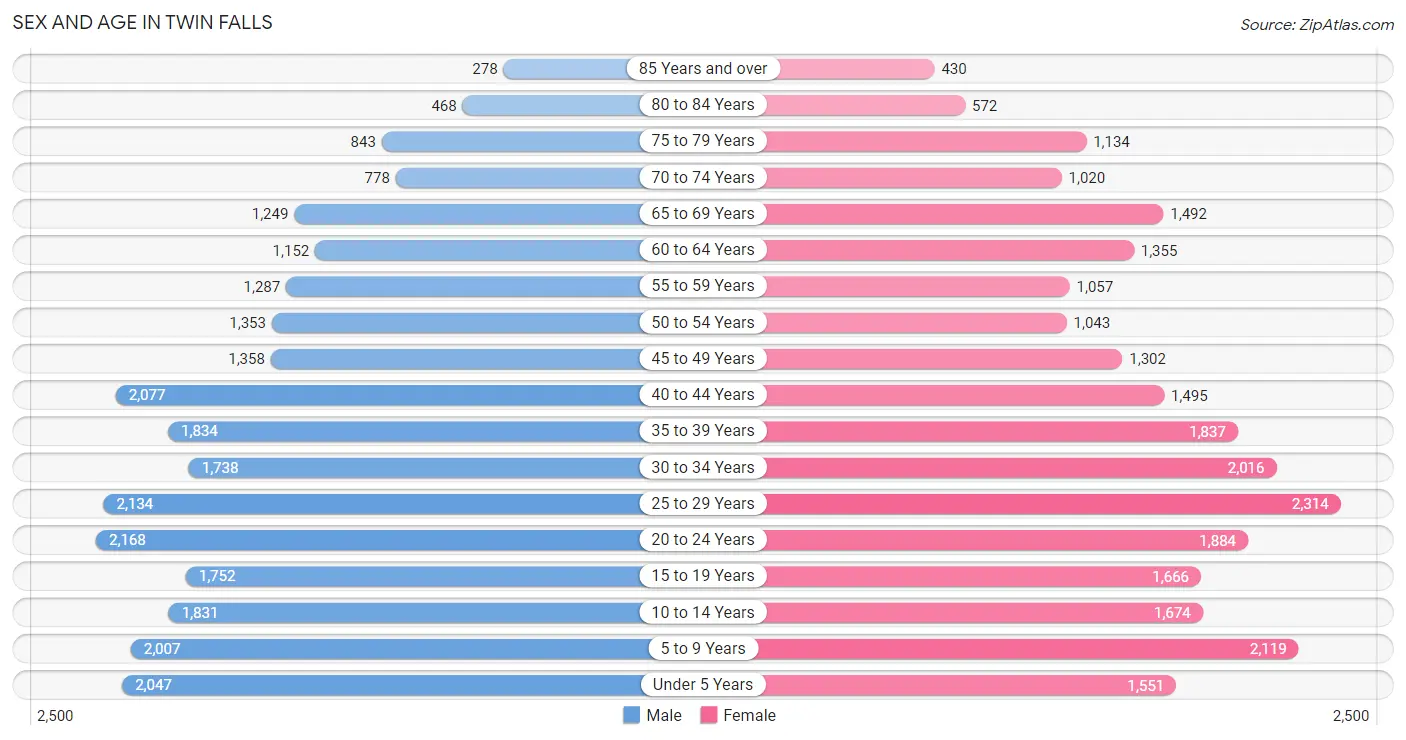
Sex and Age in Twin Falls
Sex and Age in Twin Falls
The most populous age groups in Twin Falls are 20 to 24 Years (2,168 | 8.2%) for men and 25 to 29 Years (2,314 | 8.9%) for women.
| Age Bracket | Male | Female |
| Under 5 Years | 2,047 (7.8%) | 1,551 (6.0%) |
| 5 to 9 Years | 2,007 (7.6%) | 2,119 (8.2%) |
| 10 to 14 Years | 1,831 (7.0%) | 1,674 (6.5%) |
| 15 to 19 Years | 1,752 (6.7%) | 1,666 (6.4%) |
| 20 to 24 Years | 2,168 (8.2%) | 1,884 (7.3%) |
| 25 to 29 Years | 2,134 (8.1%) | 2,314 (8.9%) |
| 30 to 34 Years | 1,738 (6.6%) | 2,016 (7.8%) |
| 35 to 39 Years | 1,834 (7.0%) | 1,837 (7.1%) |
| 40 to 44 Years | 2,077 (7.9%) | 1,495 (5.8%) |
| 45 to 49 Years | 1,358 (5.1%) | 1,302 (5.0%) |
| 50 to 54 Years | 1,353 (5.1%) | 1,043 (4.0%) |
| 55 to 59 Years | 1,287 (4.9%) | 1,057 (4.1%) |
| 60 to 64 Years | 1,152 (4.4%) | 1,355 (5.2%) |
| 65 to 69 Years | 1,249 (4.7%) | 1,492 (5.8%) |
| 70 to 74 Years | 778 (2.9%) | 1,020 (3.9%) |
| 75 to 79 Years | 843 (3.2%) | 1,134 (4.4%) |
| 80 to 84 Years | 468 (1.8%) | 572 (2.2%) |
| 85 Years and over | 278 (1.1%) | 430 (1.7%) |
| Total | 26,354 (100.0%) | 25,961 (100.0%) |
Families and Households in Twin Falls
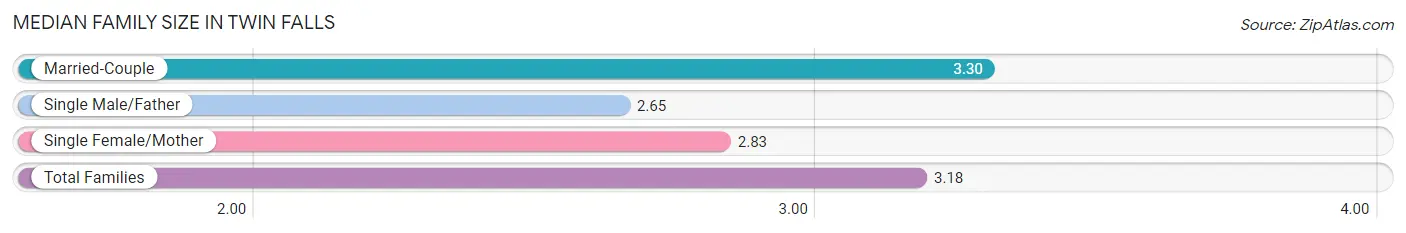
Median Family Size in Twin Falls
The median family size in Twin Falls is 3.18 persons per family, with married-couple families (9,870 | 77.0%) accounting for the largest median family size of 3.3 persons per family. On the other hand, single male/father families (979 | 7.6%) represent the smallest median family size with 2.65 persons per family.
| Family Type | # Families | Family Size |
| Married-Couple | 9,870 (77.0%) | 3.30 |
| Single Male/Father | 979 (7.6%) | 2.65 |
| Single Female/Mother | 1,964 (15.3%) | 2.83 |
| Total Families | 12,813 (100.0%) | 3.18 |
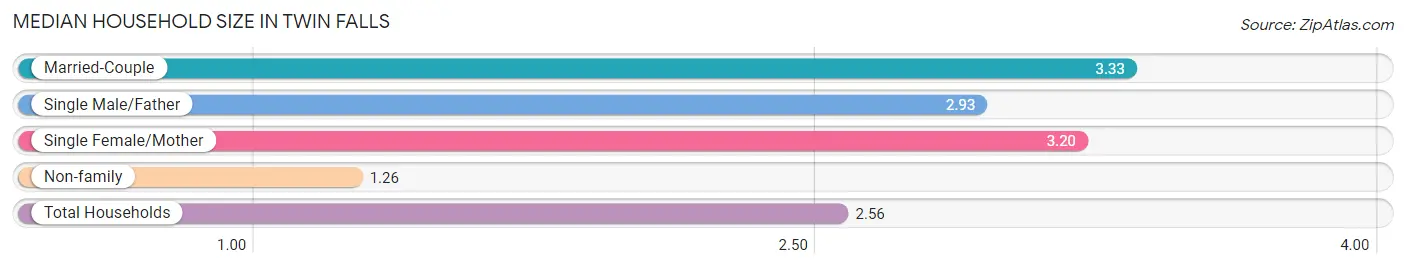
Median Household Size in Twin Falls
The median household size in Twin Falls is 2.56 persons per household, with married-couple households (9,870 | 49.6%) accounting for the largest median household size of 3.33 persons per household. non-family households (7,084 | 35.6%) represent the smallest median household size with 1.26 persons per household.
| Household Type | # Households | Household Size |
| Married-Couple | 9,870 (49.6%) | 3.33 |
| Single Male/Father | 979 (4.9%) | 2.93 |
| Single Female/Mother | 1,964 (9.9%) | 3.20 |
| Non-family | 7,084 (35.6%) | 1.26 |
| Total Households | 19,897 (100.0%) | 2.56 |
Household Size by Marriage Status in Twin Falls
Out of a total of 19,897 households in Twin Falls, 12,813 (64.4%) are family households, while 7,084 (35.6%) are nonfamily households. The most numerous type of family households are 2-person households, comprising 5,123, and the most common type of nonfamily households are 1-person households, comprising 5,919.
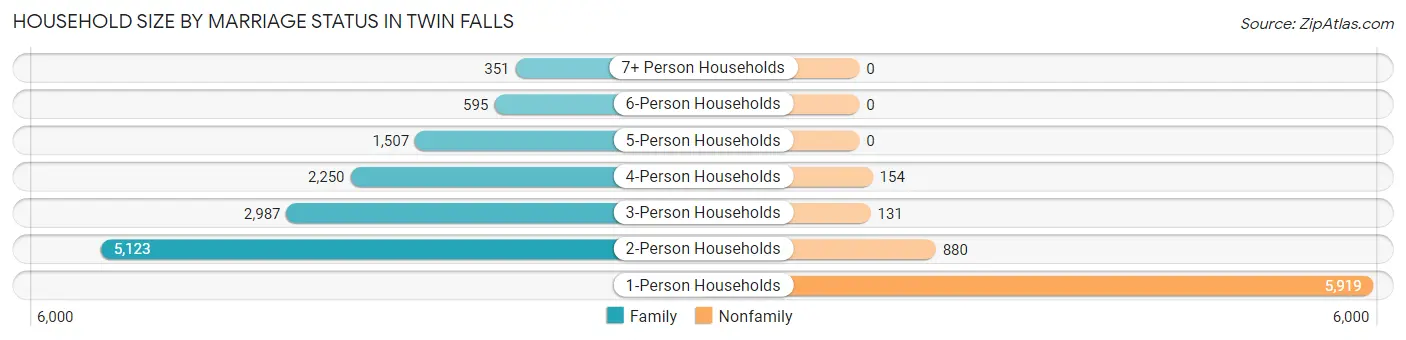
| Household Size | Family Households | Nonfamily Households |
| 1-Person Households | - | 5,919 (29.7%) |
| 2-Person Households | 5,123 (25.8%) | 880 (4.4%) |
| 3-Person Households | 2,987 (15.0%) | 131 (0.7%) |
| 4-Person Households | 2,250 (11.3%) | 154 (0.8%) |
| 5-Person Households | 1,507 (7.6%) | 0 (0.0%) |
| 6-Person Households | 595 (3.0%) | 0 (0.0%) |
| 7+ Person Households | 351 (1.8%) | 0 (0.0%) |
| Total | 12,813 (64.4%) | 7,084 (35.6%) |
Female Fertility in Twin Falls
Fertility by Age in Twin Falls
Average fertility rate in Twin Falls is 84.0 births per 1,000 women. Women in the age bracket of 20 to 34 years have the highest fertility rate with 151.0 births per 1,000 women. Women in the age bracket of 20 to 34 years acount for 87.7% of all women with births.
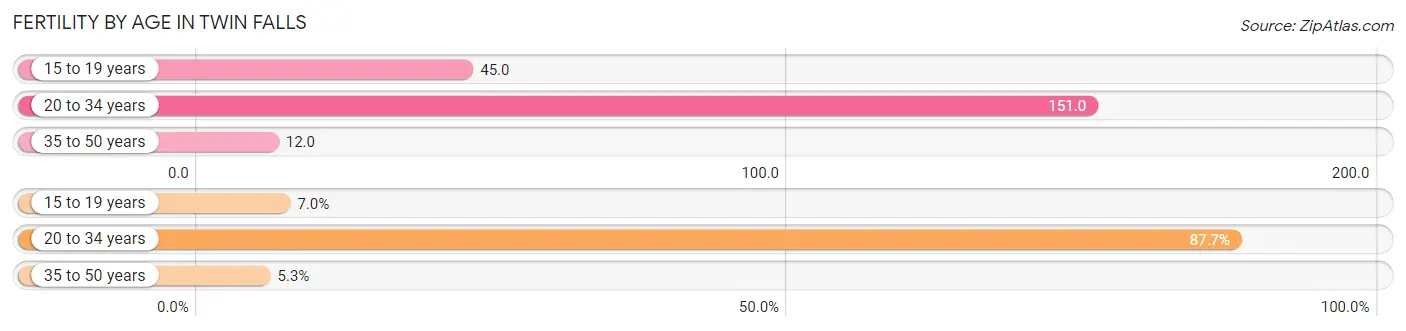
| Age Bracket | Women with Births | Births / 1,000 Women |
| 15 to 19 years | 75 (7.0%) | 45.0 |
| 20 to 34 years | 941 (87.7%) | 151.0 |
| 35 to 50 years | 57 (5.3%) | 12.0 |
| Total | 1,073 (100.0%) | 84.0 |
Fertility by Age by Marriage Status in Twin Falls
82.5% of women with births (1,073) in Twin Falls are married. The highest percentage of unmarried women with births falls into 15 to 19 years age bracket with 100.0% of them unmarried at the time of birth, while the lowest percentage of unmarried women with births belong to 35 to 50 years age bracket with 0.0% of them unmarried.
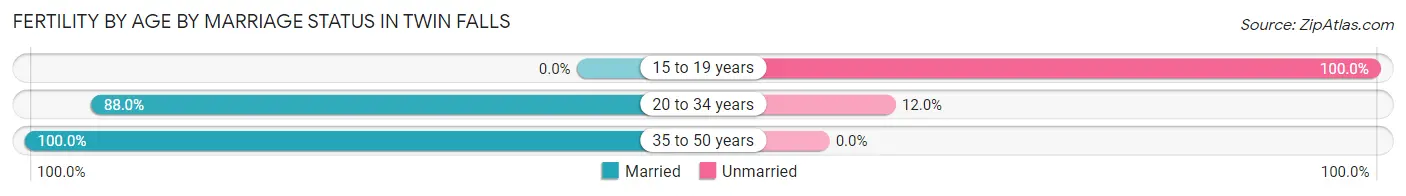
| Age Bracket | Married | Unmarried |
| 15 to 19 years | 0 (0.0%) | 75 (100.0%) |
| 20 to 34 years | 828 (88.0%) | 113 (12.0%) |
| 35 to 50 years | 57 (100.0%) | 0 (0.0%) |
| Total | 885 (82.5%) | 188 (17.5%) |
Fertility by Education in Twin Falls
Average fertility rate in Twin Falls is 84.0 births per 1,000 women. Women with the education attainment of bachelor's degree have the highest fertility rate of 151.0 births per 1,000 women, while women with the education attainment of less than high school have the lowest fertility at 50.0 births per 1,000 women. Women with the education attainment of high school diploma represent 30.1% of all women with births.
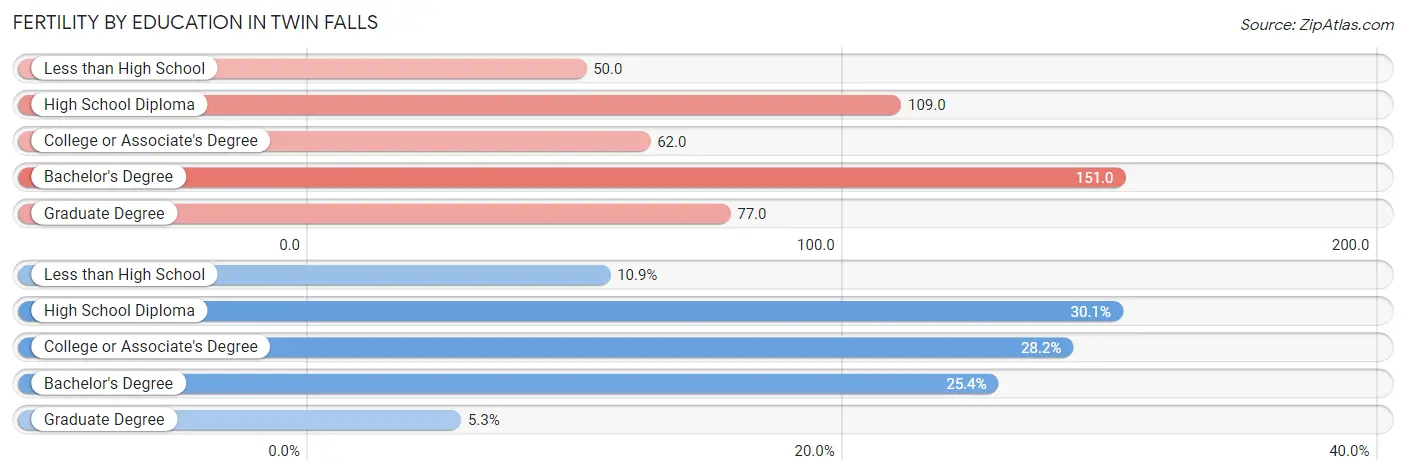
| Educational Attainment | Women with Births | Births / 1,000 Women |
| Less than High School | 117 (10.9%) | 50.0 |
| High School Diploma | 323 (30.1%) | 109.0 |
| College or Associate's Degree | 303 (28.2%) | 62.0 |
| Bachelor's Degree | 273 (25.4%) | 151.0 |
| Graduate Degree | 57 (5.3%) | 77.0 |
| Total | 1,073 (100.0%) | 84.0 |
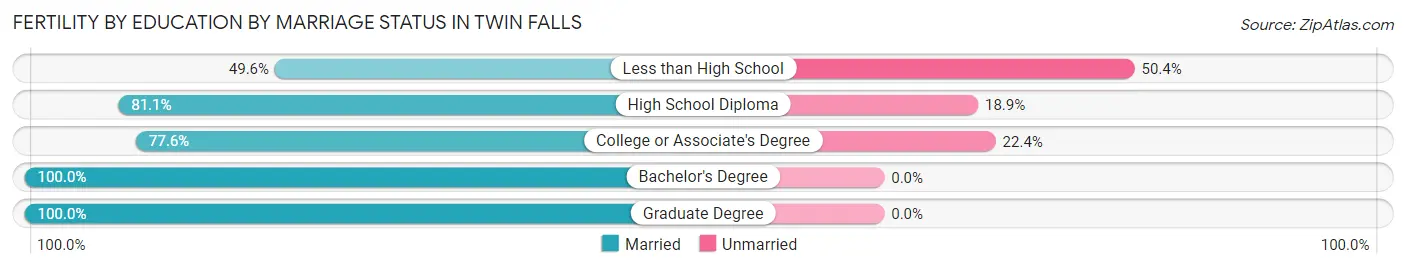
Fertility by Education by Marriage Status in Twin Falls
17.5% of women with births in Twin Falls are unmarried. Women with the educational attainment of bachelor's degree are most likely to be married with 100.0% of them married at childbirth, while women with the educational attainment of less than high school are least likely to be married with 50.4% of them unmarried at childbirth.
| Educational Attainment | Married | Unmarried |
| Less than High School | 58 (49.6%) | 59 (50.4%) |
| High School Diploma | 262 (81.1%) | 61 (18.9%) |
| College or Associate's Degree | 235 (77.6%) | 68 (22.4%) |
| Bachelor's Degree | 273 (100.0%) | 0 (0.0%) |
| Graduate Degree | 57 (100.0%) | 0 (0.0%) |
| Total | 885 (82.5%) | 188 (17.5%) |
Employment Characteristics in Twin Falls
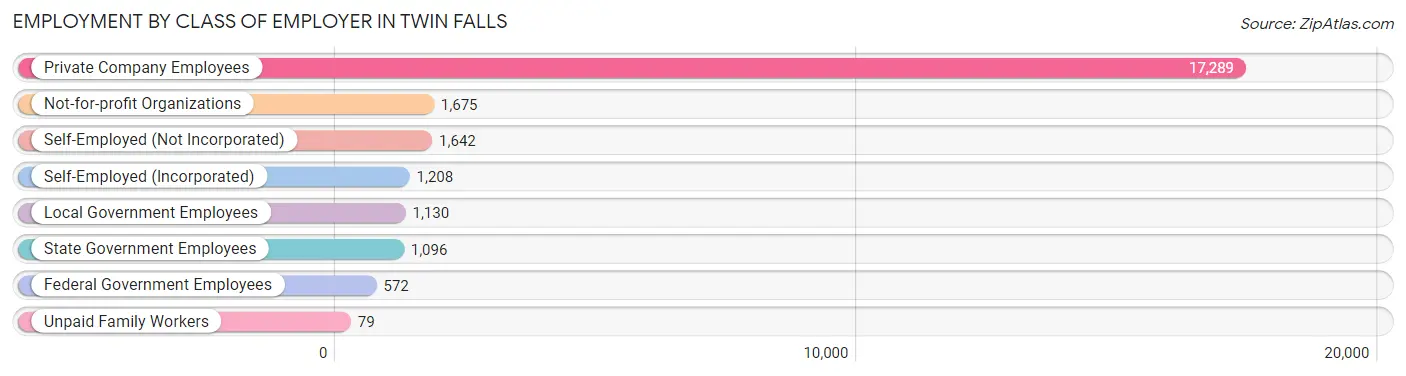
Employment by Class of Employer in Twin Falls
Among the 24,691 employed individuals in Twin Falls, private company employees (17,289 | 70.0%), not-for-profit organizations (1,675 | 6.8%), and self-employed (not incorporated) (1,642 | 6.7%) make up the most common classes of employment.
| Employer Class | # Employees | % Employees |
| Private Company Employees | 17,289 | 70.0% |
| Self-Employed (Incorporated) | 1,208 | 4.9% |
| Self-Employed (Not Incorporated) | 1,642 | 6.7% |
| Not-for-profit Organizations | 1,675 | 6.8% |
| Local Government Employees | 1,130 | 4.6% |
| State Government Employees | 1,096 | 4.4% |
| Federal Government Employees | 572 | 2.3% |
| Unpaid Family Workers | 79 | 0.3% |
| Total | 24,691 | 100.0% |
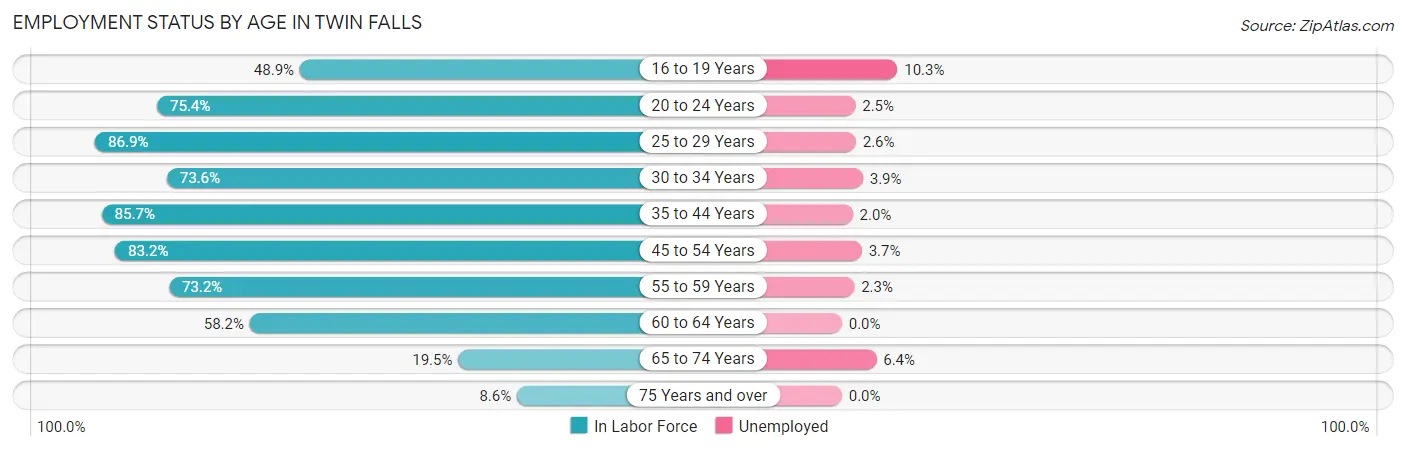
Employment Status by Age in Twin Falls
According to the labor force statistics for Twin Falls, out of the total population over 16 years of age (40,417), 63.9% or 25,826 individuals are in the labor force, with 3.1% or 801 of them unemployed. The age group with the highest labor force participation rate is 25 to 29 years, with 86.9% or 3,865 individuals in the labor force. Within the labor force, the 16 to 19 years age range has the highest percentage of unemployed individuals, with 10.3% or 138 of them being unemployed.
| Age Bracket | In Labor Force | Unemployed |
| 16 to 19 Years | 1,344 (48.9%) | 138 (10.3%) |
| 20 to 24 Years | 3,055 (75.4%) | 76 (2.5%) |
| 25 to 29 Years | 3,865 (86.9%) | 100 (2.6%) |
| 30 to 34 Years | 2,763 (73.6%) | 108 (3.9%) |
| 35 to 44 Years | 6,207 (85.7%) | 124 (2.0%) |
| 45 to 54 Years | 4,207 (83.2%) | 156 (3.7%) |
| 55 to 59 Years | 1,716 (73.2%) | 39 (2.3%) |
| 60 to 64 Years | 1,459 (58.2%) | 0 (0.0%) |
| 65 to 74 Years | 885 (19.5%) | 57 (6.4%) |
| 75 Years and over | 320 (8.6%) | 0 (0.0%) |
| Total | 25,826 (63.9%) | 801 (3.1%) |
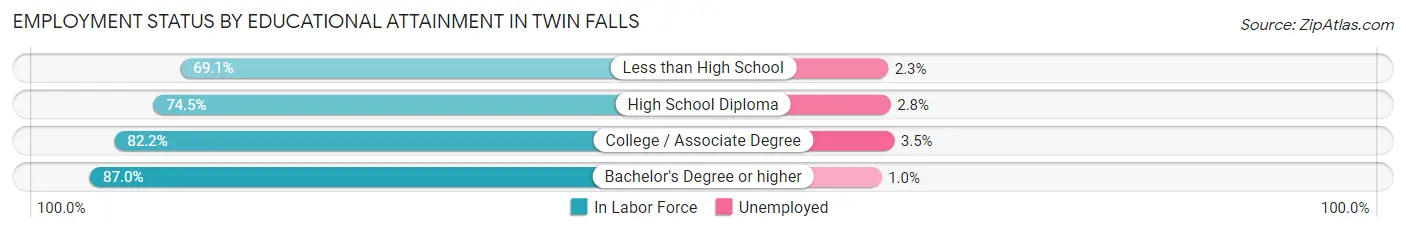
Employment Status by Educational Attainment in Twin Falls
According to labor force statistics for Twin Falls, 79.8% of individuals (20,231) out of the total population between 25 and 64 years of age (25,352) are in the labor force, with 2.6% or 526 of them being unemployed. The group with the highest labor force participation rate are those with the educational attainment of bachelor's degree or higher, with 87.0% or 4,956 individuals in the labor force. Within the labor force, individuals with college / associate degree education have the highest percentage of unemployment, with 3.5% or 289 of them being unemployed.
| Educational Attainment | In Labor Force | Unemployed |
| Less than High School | 1,835 (69.1%) | 61 (2.3%) |
| High School Diploma | 5,184 (74.5%) | 195 (2.8%) |
| College / Associate Degree | 8,254 (82.2%) | 351 (3.5%) |
| Bachelor's Degree or higher | 4,956 (87.0%) | 57 (1.0%) |
| Total | 20,231 (79.8%) | 659 (2.6%) |
Employment Occupations by Sex in Twin Falls
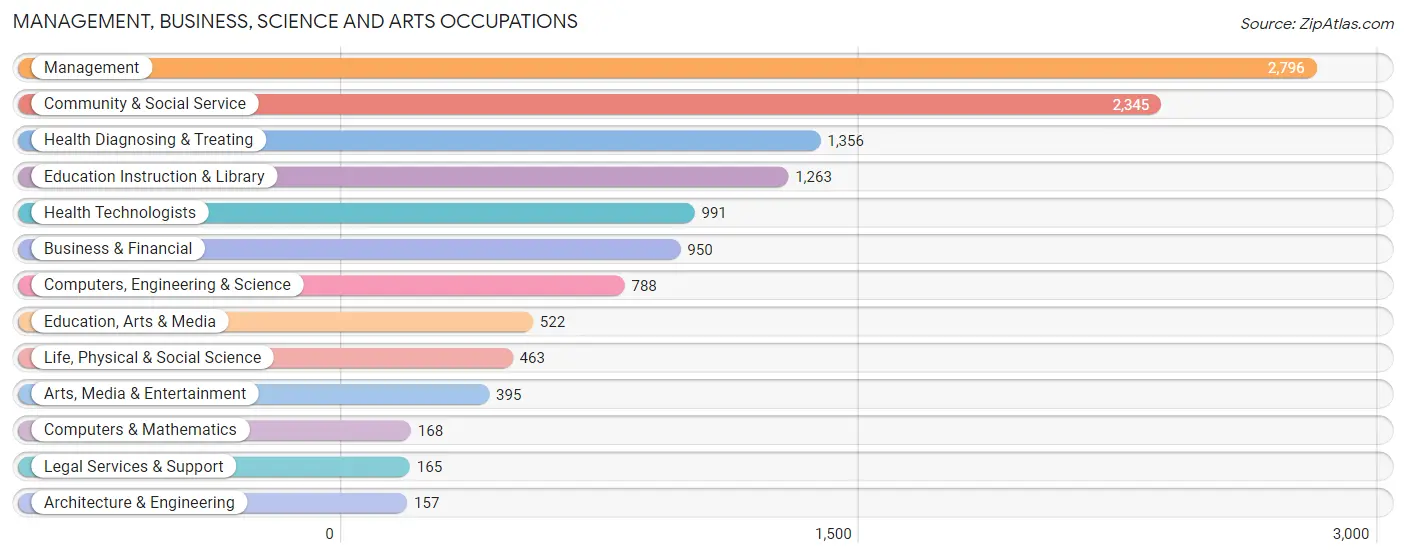
Management, Business, Science and Arts Occupations
The most common Management, Business, Science and Arts occupations in Twin Falls are Management (2,796 | 11.2%), Community & Social Service (2,345 | 9.4%), Health Diagnosing & Treating (1,356 | 5.4%), Education Instruction & Library (1,263 | 5.1%), and Health Technologists (991 | 4.0%).
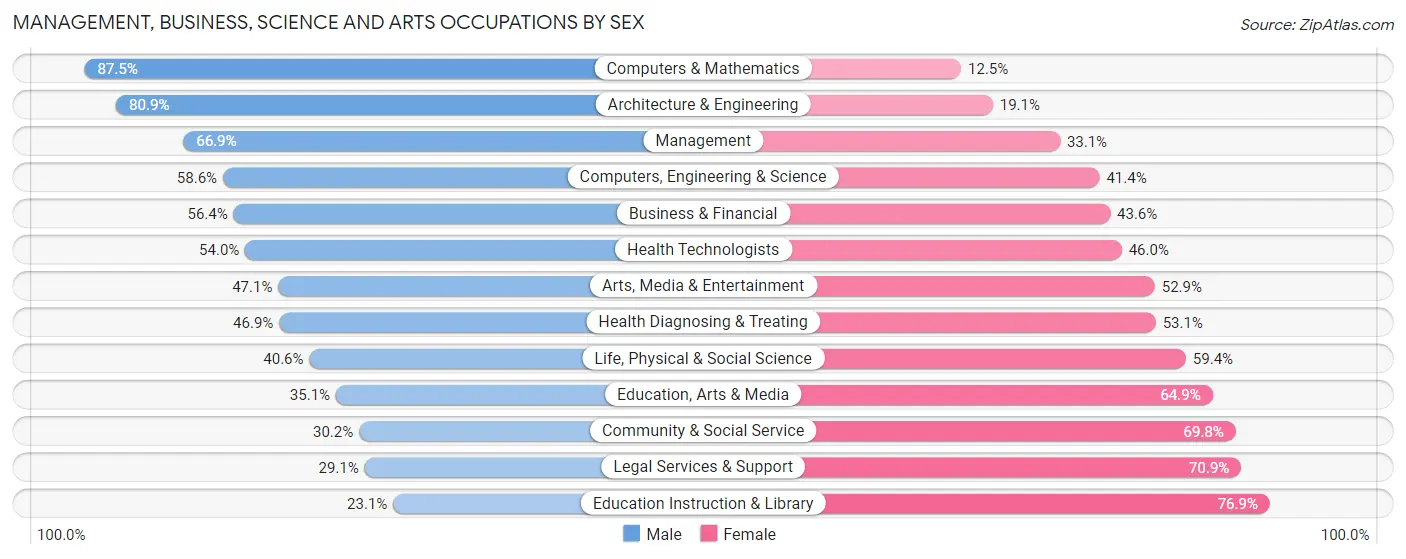
Management, Business, Science and Arts Occupations by Sex
Within the Management, Business, Science and Arts occupations in Twin Falls, the most male-oriented occupations are Computers & Mathematics (87.5%), Architecture & Engineering (80.9%), and Management (66.9%), while the most female-oriented occupations are Education Instruction & Library (76.9%), Legal Services & Support (70.9%), and Community & Social Service (69.8%).
| Occupation | Male | Female |
| Management | 1,870 (66.9%) | 926 (33.1%) |
| Business & Financial | 536 (56.4%) | 414 (43.6%) |
| Computers, Engineering & Science | 462 (58.6%) | 326 (41.4%) |
| Computers & Mathematics | 147 (87.5%) | 21 (12.5%) |
| Architecture & Engineering | 127 (80.9%) | 30 (19.1%) |
| Life, Physical & Social Science | 188 (40.6%) | 275 (59.4%) |
| Community & Social Service | 709 (30.2%) | 1,636 (69.8%) |
| Education, Arts & Media | 183 (35.1%) | 339 (64.9%) |
| Legal Services & Support | 48 (29.1%) | 117 (70.9%) |
| Education Instruction & Library | 292 (23.1%) | 971 (76.9%) |
| Arts, Media & Entertainment | 186 (47.1%) | 209 (52.9%) |
| Health Diagnosing & Treating | 636 (46.9%) | 720 (53.1%) |
| Health Technologists | 535 (54.0%) | 456 (46.0%) |
| Total (Category) | 4,213 (51.2%) | 4,022 (48.8%) |
| Total (Overall) | 14,097 (56.6%) | 10,829 (43.4%) |
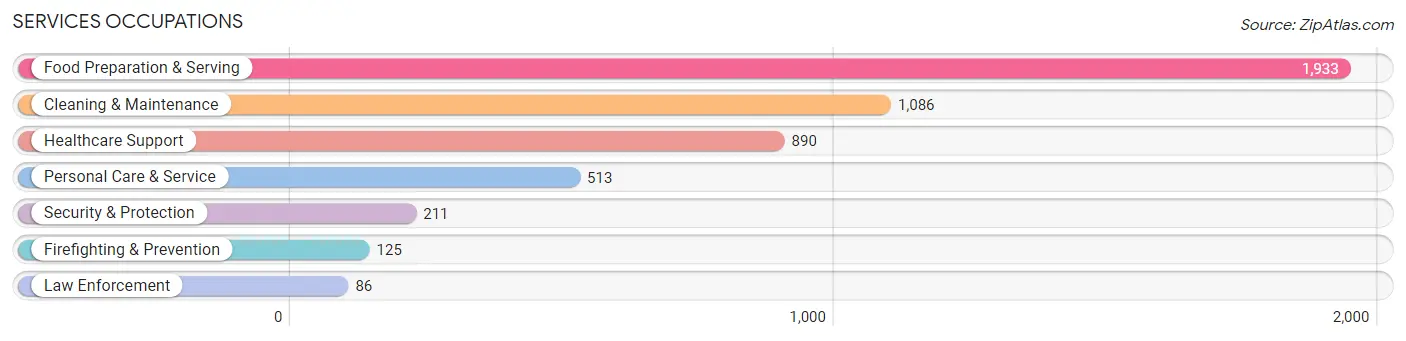
Services Occupations
The most common Services occupations in Twin Falls are Food Preparation & Serving (1,933 | 7.7%), Cleaning & Maintenance (1,086 | 4.4%), Healthcare Support (890 | 3.6%), Personal Care & Service (513 | 2.1%), and Security & Protection (211 | 0.9%).
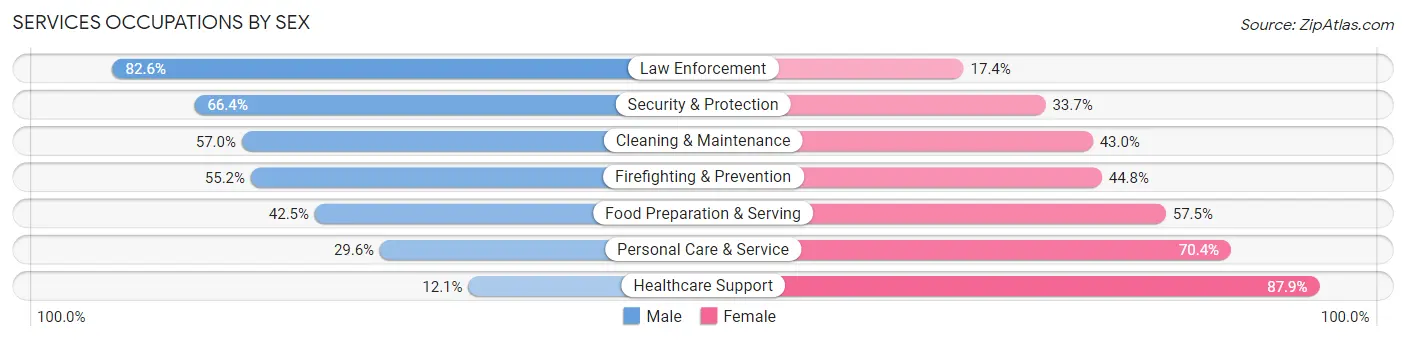
Services Occupations by Sex
Within the Services occupations in Twin Falls, the most male-oriented occupations are Law Enforcement (82.6%), Security & Protection (66.3%), and Cleaning & Maintenance (57.0%), while the most female-oriented occupations are Healthcare Support (87.9%), Personal Care & Service (70.4%), and Food Preparation & Serving (57.5%).
| Occupation | Male | Female |
| Healthcare Support | 108 (12.1%) | 782 (87.9%) |
| Security & Protection | 140 (66.3%) | 71 (33.7%) |
| Firefighting & Prevention | 69 (55.2%) | 56 (44.8%) |
| Law Enforcement | 71 (82.6%) | 15 (17.4%) |
| Food Preparation & Serving | 822 (42.5%) | 1,111 (57.5%) |
| Cleaning & Maintenance | 619 (57.0%) | 467 (43.0%) |
| Personal Care & Service | 152 (29.6%) | 361 (70.4%) |
| Total (Category) | 1,841 (39.7%) | 2,792 (60.3%) |
| Total (Overall) | 14,097 (56.6%) | 10,829 (43.4%) |
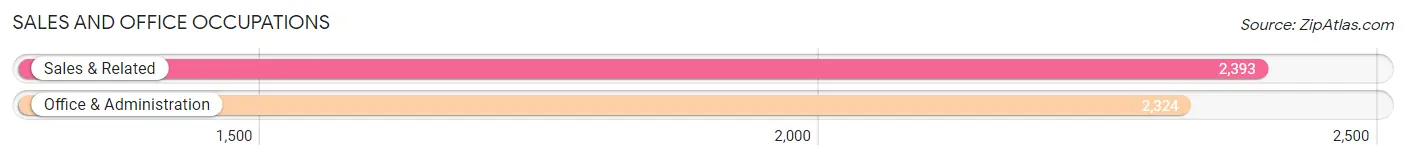
Sales and Office Occupations
The most common Sales and Office occupations in Twin Falls are Sales & Related (2,393 | 9.6%), and Office & Administration (2,324 | 9.3%).
Sales and Office Occupations by Sex
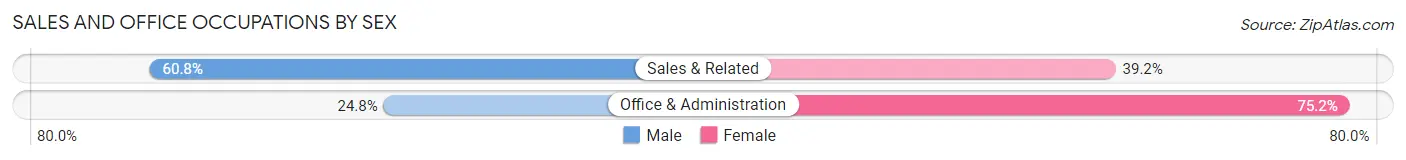
| Occupation | Male | Female |
| Sales & Related | 1,454 (60.8%) | 939 (39.2%) |
| Office & Administration | 576 (24.8%) | 1,748 (75.2%) |
| Total (Category) | 2,030 (43.0%) | 2,687 (57.0%) |
| Total (Overall) | 14,097 (56.6%) | 10,829 (43.4%) |
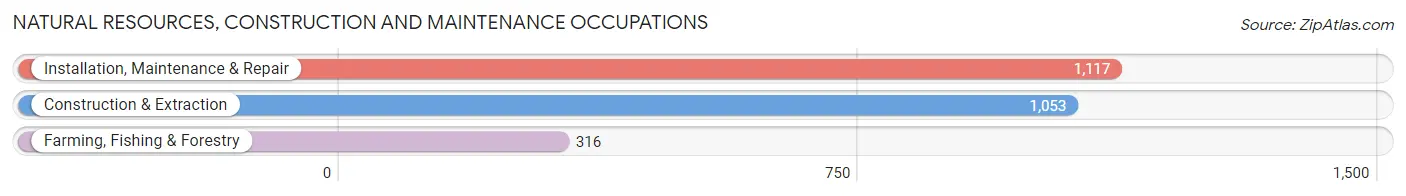
Natural Resources, Construction and Maintenance Occupations
The most common Natural Resources, Construction and Maintenance occupations in Twin Falls are Installation, Maintenance & Repair (1,117 | 4.5%), Construction & Extraction (1,053 | 4.2%), and Farming, Fishing & Forestry (316 | 1.3%).
Natural Resources, Construction and Maintenance Occupations by Sex
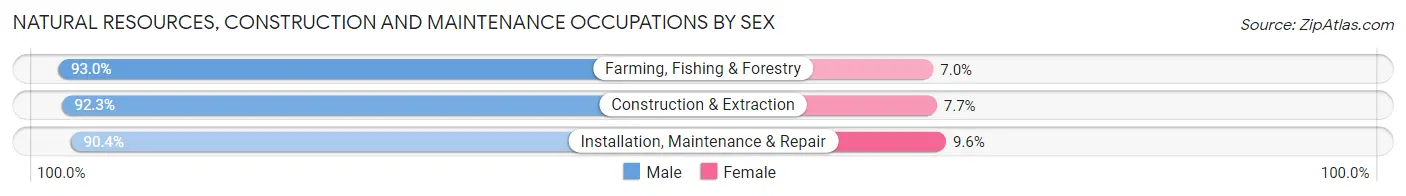
| Occupation | Male | Female |
| Farming, Fishing & Forestry | 294 (93.0%) | 22 (7.0%) |
| Construction & Extraction | 972 (92.3%) | 81 (7.7%) |
| Installation, Maintenance & Repair | 1,010 (90.4%) | 107 (9.6%) |
| Total (Category) | 2,276 (91.5%) | 210 (8.5%) |
| Total (Overall) | 14,097 (56.6%) | 10,829 (43.4%) |
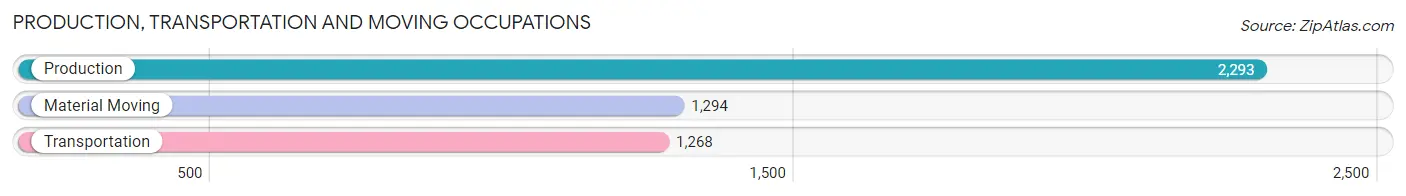
Production, Transportation and Moving Occupations
The most common Production, Transportation and Moving occupations in Twin Falls are Production (2,293 | 9.2%), Material Moving (1,294 | 5.2%), and Transportation (1,268 | 5.1%).
Production, Transportation and Moving Occupations by Sex
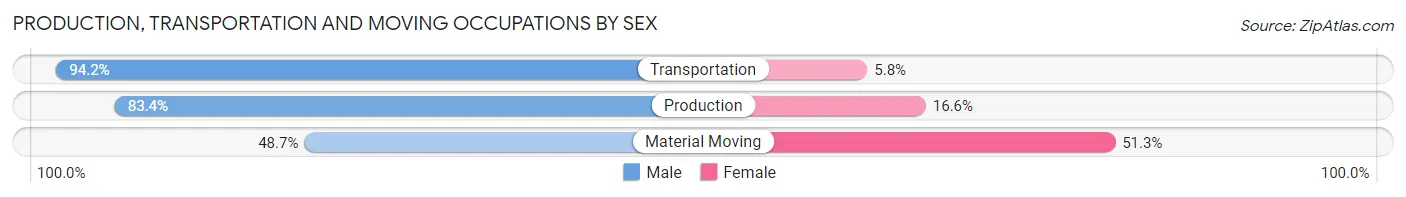
| Occupation | Male | Female |
| Production | 1,913 (83.4%) | 380 (16.6%) |
| Transportation | 1,194 (94.2%) | 74 (5.8%) |
| Material Moving | 630 (48.7%) | 664 (51.3%) |
| Total (Category) | 3,737 (77.0%) | 1,118 (23.0%) |
| Total (Overall) | 14,097 (56.6%) | 10,829 (43.4%) |
Employment Industries by Sex in Twin Falls
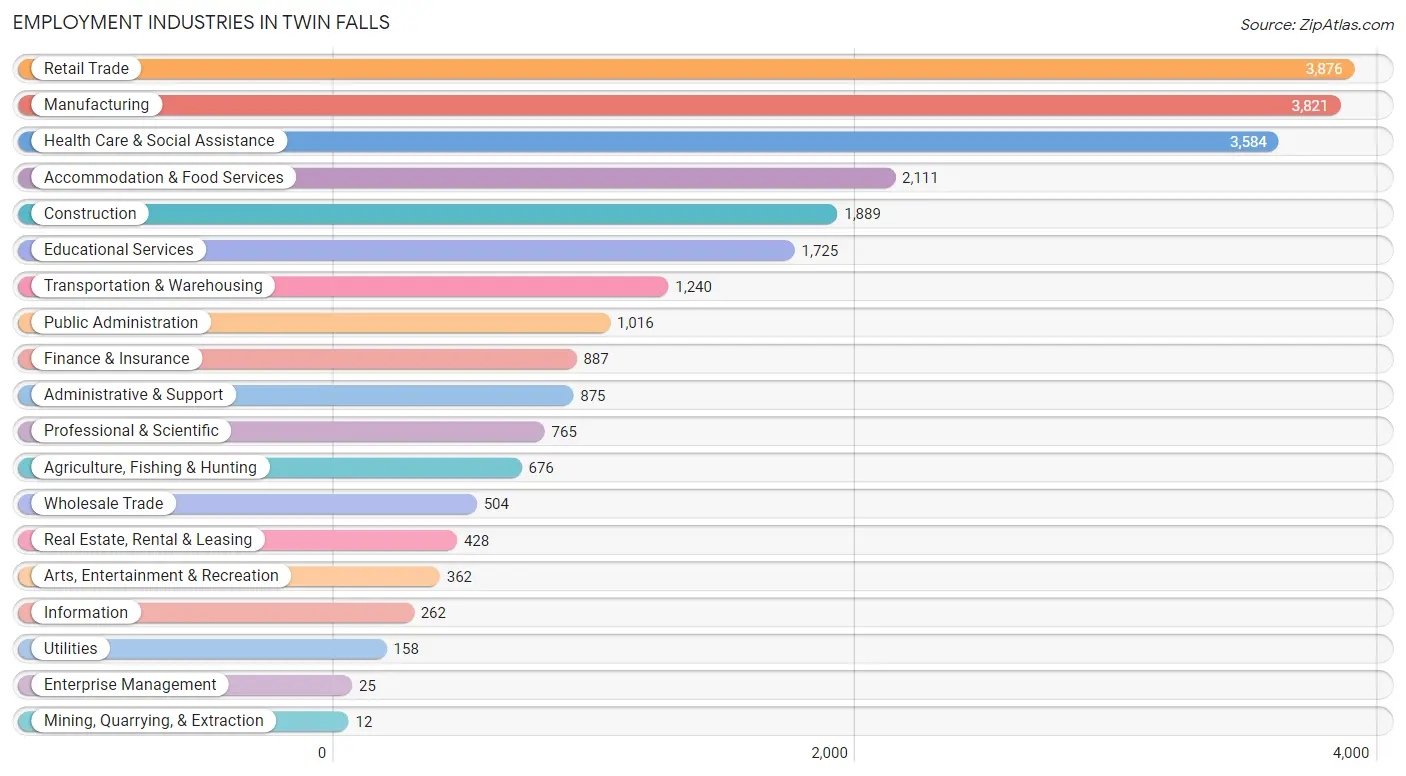
Employment Industries in Twin Falls
The major employment industries in Twin Falls include Retail Trade (3,876 | 15.5%), Manufacturing (3,821 | 15.3%), Health Care & Social Assistance (3,584 | 14.4%), Accommodation & Food Services (2,111 | 8.5%), and Construction (1,889 | 7.6%).
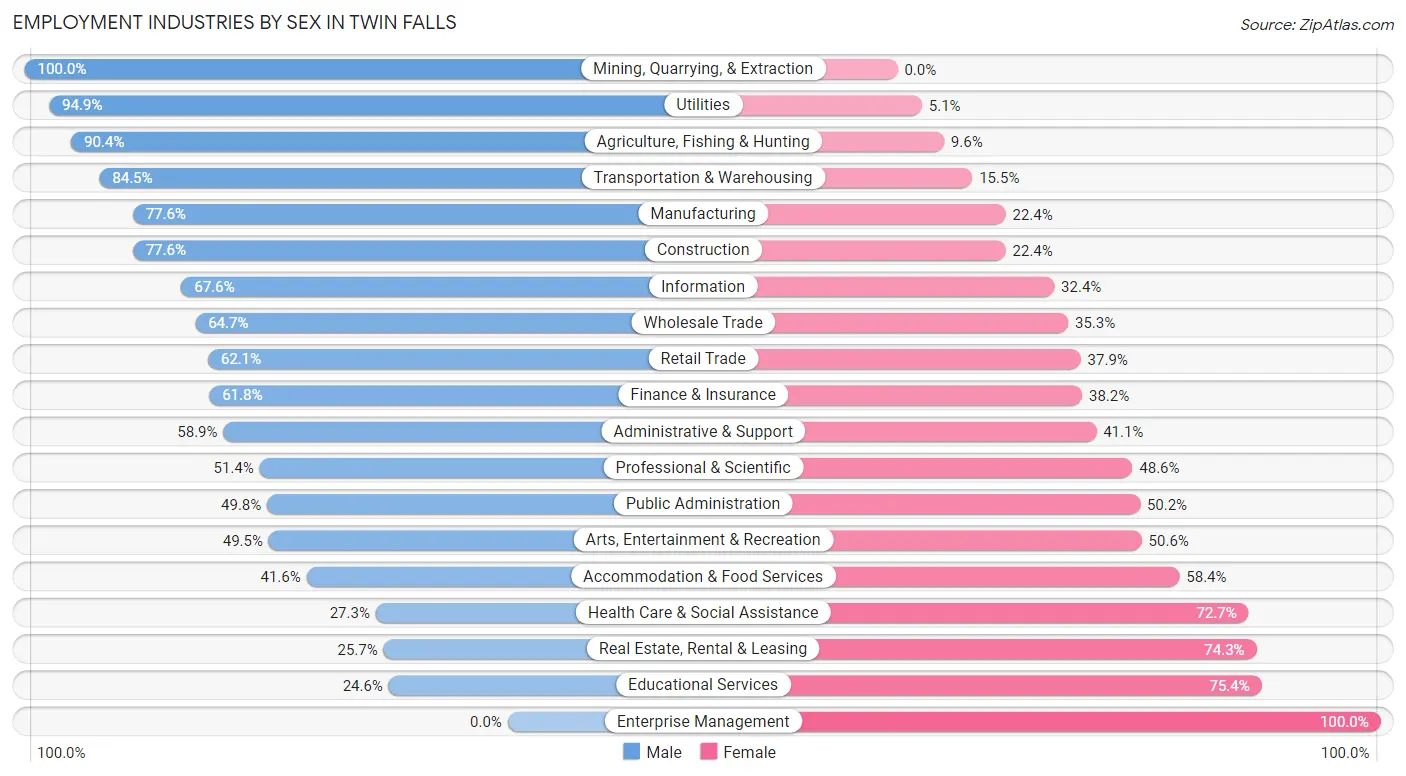
Employment Industries by Sex in Twin Falls
The Twin Falls industries that see more men than women are Mining, Quarrying, & Extraction (100.0%), Utilities (94.9%), and Agriculture, Fishing & Hunting (90.4%), whereas the industries that tend to have a higher number of women are Enterprise Management (100.0%), Educational Services (75.4%), and Real Estate, Rental & Leasing (74.3%).
| Industry | Male | Female |
| Agriculture, Fishing & Hunting | 611 (90.4%) | 65 (9.6%) |
| Mining, Quarrying, & Extraction | 12 (100.0%) | 0 (0.0%) |
| Construction | 1,466 (77.6%) | 423 (22.4%) |
| Manufacturing | 2,966 (77.6%) | 855 (22.4%) |
| Wholesale Trade | 326 (64.7%) | 178 (35.3%) |
| Retail Trade | 2,406 (62.1%) | 1,470 (37.9%) |
| Transportation & Warehousing | 1,048 (84.5%) | 192 (15.5%) |
| Utilities | 150 (94.9%) | 8 (5.1%) |
| Information | 177 (67.6%) | 85 (32.4%) |
| Finance & Insurance | 548 (61.8%) | 339 (38.2%) |
| Real Estate, Rental & Leasing | 110 (25.7%) | 318 (74.3%) |
| Professional & Scientific | 393 (51.4%) | 372 (48.6%) |
| Enterprise Management | 0 (0.0%) | 25 (100.0%) |
| Administrative & Support | 515 (58.9%) | 360 (41.1%) |
| Educational Services | 425 (24.6%) | 1,300 (75.4%) |
| Health Care & Social Assistance | 979 (27.3%) | 2,605 (72.7%) |
| Arts, Entertainment & Recreation | 179 (49.4%) | 183 (50.5%) |
| Accommodation & Food Services | 879 (41.6%) | 1,232 (58.4%) |
| Public Administration | 506 (49.8%) | 510 (50.2%) |
| Total | 14,097 (56.6%) | 10,829 (43.4%) |
Education in Twin Falls
School Enrollment in Twin Falls
The most common levels of schooling among the 12,753 students in Twin Falls are elementary school (3,199 | 25.1%), middle school (2,723 | 21.3%), and high school (2,592 | 20.3%).
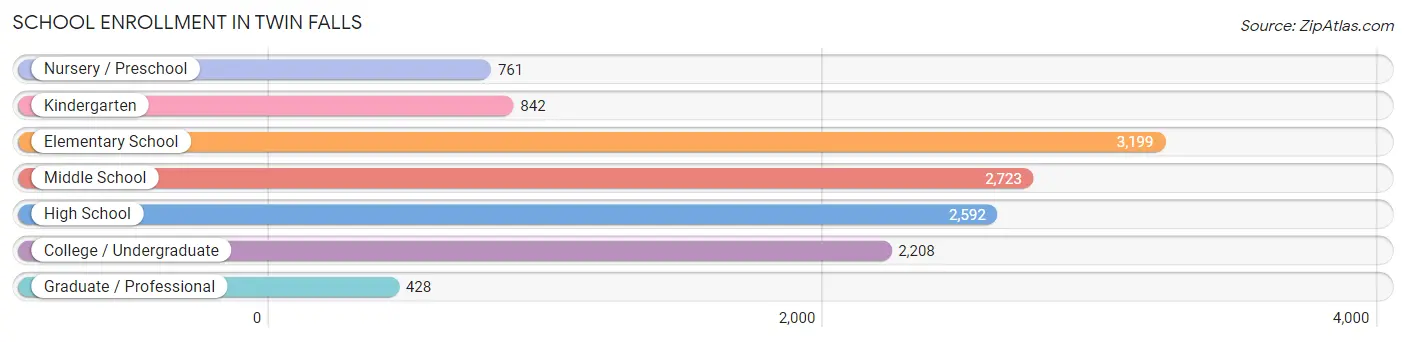
| School Level | # Students | % Students |
| Nursery / Preschool | 761 | 6.0% |
| Kindergarten | 842 | 6.6% |
| Elementary School | 3,199 | 25.1% |
| Middle School | 2,723 | 21.3% |
| High School | 2,592 | 20.3% |
| College / Undergraduate | 2,208 | 17.3% |
| Graduate / Professional | 428 | 3.4% |
| Total | 12,753 | 100.0% |
School Enrollment by Age by Funding Source in Twin Falls
Out of a total of 12,753 students who are enrolled in schools in Twin Falls, 1,683 (13.2%) attend a private institution, while the remaining 11,070 (86.8%) are enrolled in public schools. The age group of 3 to 4 year olds has the highest likelihood of being enrolled in private schools, with 179 (31.0% in the age bracket) enrolled. Conversely, the age group of 18 to 19 year olds has the lowest likelihood of being enrolled in a private school, with 864 (91.4% in the age bracket) attending a public institution.
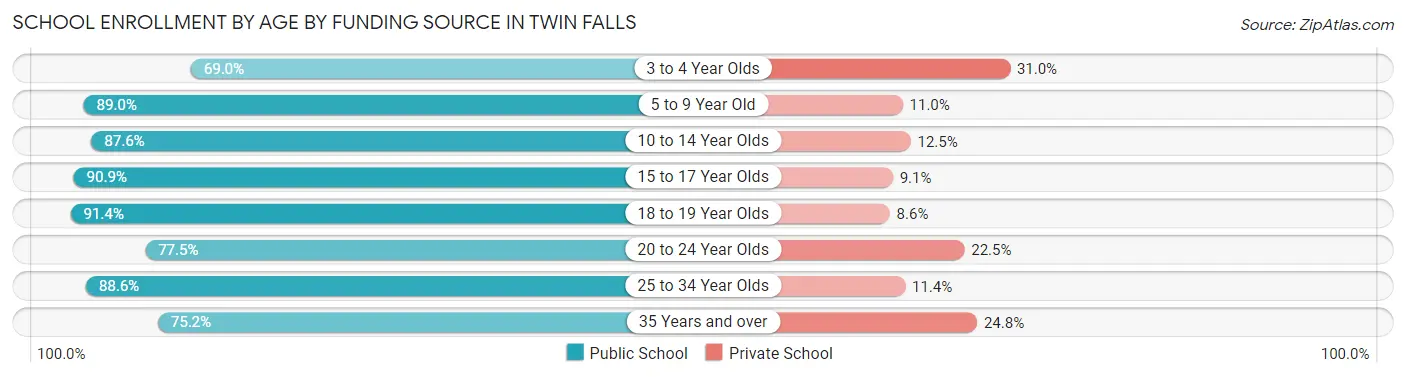
| Age Bracket | Public School | Private School |
| 3 to 4 Year Olds | 399 (69.0%) | 179 (31.0%) |
| 5 to 9 Year Old | 3,404 (89.0%) | 420 (11.0%) |
| 10 to 14 Year Olds | 3,003 (87.5%) | 427 (12.4%) |
| 15 to 17 Year Olds | 1,699 (90.9%) | 171 (9.1%) |
| 18 to 19 Year Olds | 864 (91.4%) | 81 (8.6%) |
| 20 to 24 Year Olds | 614 (77.5%) | 178 (22.5%) |
| 25 to 34 Year Olds | 643 (88.6%) | 83 (11.4%) |
| 35 Years and over | 442 (75.2%) | 146 (24.8%) |
| Total | 11,070 (86.8%) | 1,683 (13.2%) |
Educational Attainment by Field of Study in Twin Falls
Education (1,454 | 17.6%), business (1,363 | 16.5%), bio, nature & agricultural (1,199 | 14.5%), science & technology (777 | 9.4%), and arts & humanities (707 | 8.6%) are the most common fields of study among 8,240 individuals in Twin Falls who have obtained a bachelor's degree or higher.
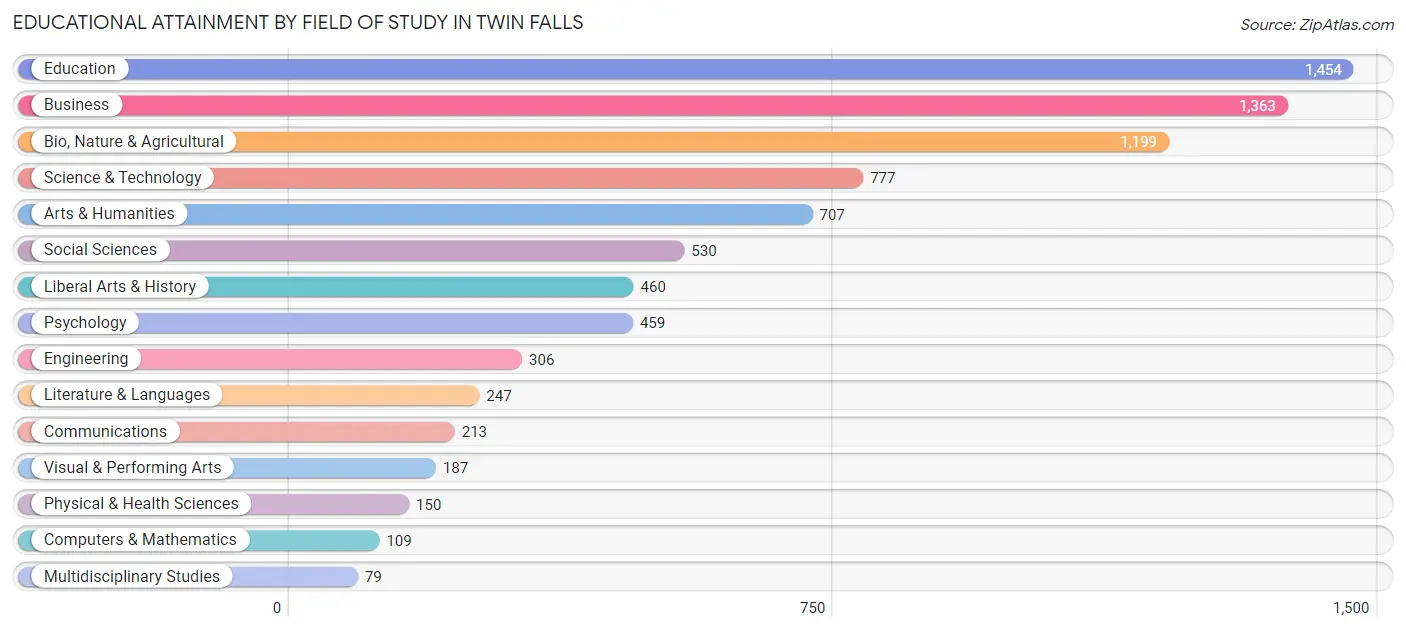
| Field of Study | # Graduates | % Graduates |
| Computers & Mathematics | 109 | 1.3% |
| Bio, Nature & Agricultural | 1,199 | 14.5% |
| Physical & Health Sciences | 150 | 1.8% |
| Psychology | 459 | 5.6% |
| Social Sciences | 530 | 6.4% |
| Engineering | 306 | 3.7% |
| Multidisciplinary Studies | 79 | 1.0% |
| Science & Technology | 777 | 9.4% |
| Business | 1,363 | 16.5% |
| Education | 1,454 | 17.6% |
| Literature & Languages | 247 | 3.0% |
| Liberal Arts & History | 460 | 5.6% |
| Visual & Performing Arts | 187 | 2.3% |
| Communications | 213 | 2.6% |
| Arts & Humanities | 707 | 8.6% |
| Total | 8,240 | 100.0% |
Transportation & Commute in Twin Falls
Vehicle Availability by Sex in Twin Falls
The most prevalent vehicle ownership categories in Twin Falls are males with 2 vehicles (5,435, accounting for 38.9%) and females with 2 vehicles (4,078, making up 52.0%).
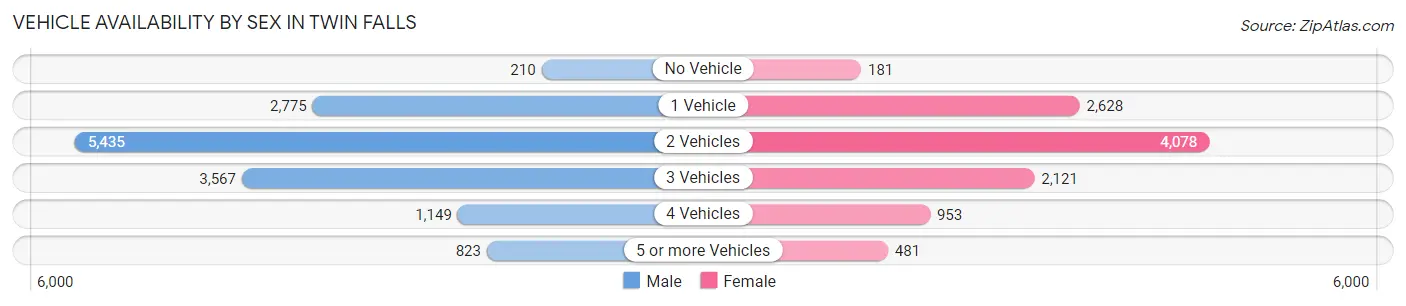
| Vehicles Available | Male | Female |
| No Vehicle | 210 (1.5%) | 181 (1.7%) |
| 1 Vehicle | 2,775 (19.9%) | 2,628 (25.2%) |
| 2 Vehicles | 5,435 (38.9%) | 4,078 (39.1%) |
| 3 Vehicles | 3,567 (25.6%) | 2,121 (20.3%) |
| 4 Vehicles | 1,149 (8.2%) | 953 (9.1%) |
| 5 or more Vehicles | 823 (5.9%) | 481 (4.6%) |
| Total | 13,959 (100.0%) | 10,442 (100.0%) |
Commute Time in Twin Falls
The most frequently occuring commute durations in Twin Falls are 10 to 14 minutes (5,749 commuters, 25.0%), 5 to 9 minutes (5,741 commuters, 24.9%), and 15 to 19 minutes (3,846 commuters, 16.7%).
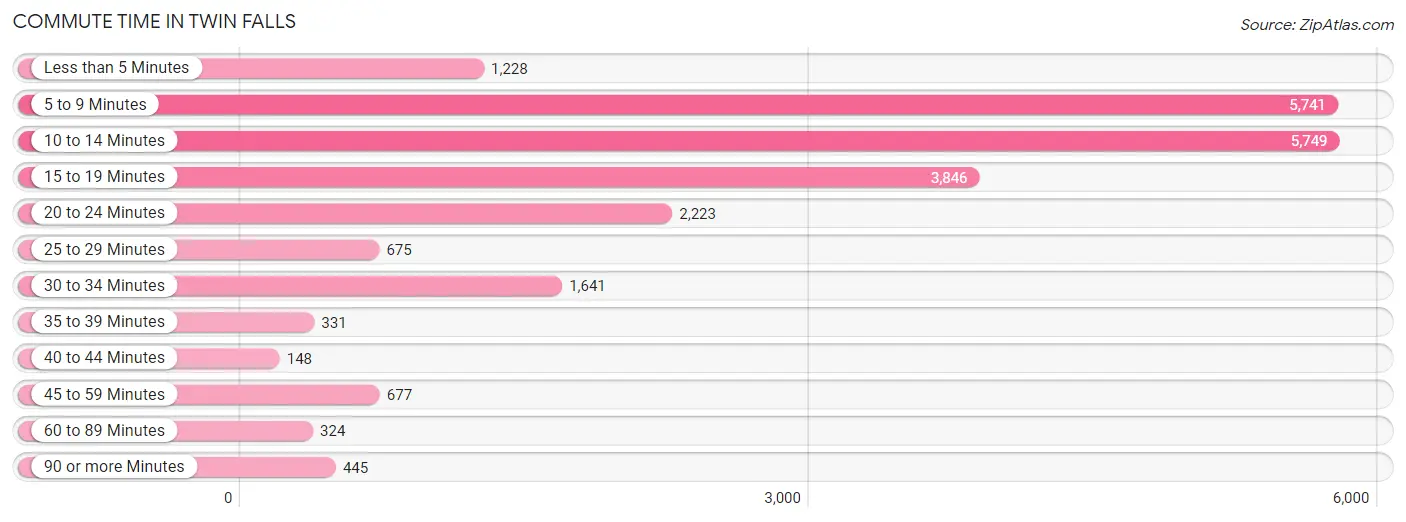
| Commute Time | # Commuters | % Commuters |
| Less than 5 Minutes | 1,228 | 5.3% |
| 5 to 9 Minutes | 5,741 | 24.9% |
| 10 to 14 Minutes | 5,749 | 25.0% |
| 15 to 19 Minutes | 3,846 | 16.7% |
| 20 to 24 Minutes | 2,223 | 9.7% |
| 25 to 29 Minutes | 675 | 2.9% |
| 30 to 34 Minutes | 1,641 | 7.1% |
| 35 to 39 Minutes | 331 | 1.4% |
| 40 to 44 Minutes | 148 | 0.6% |
| 45 to 59 Minutes | 677 | 2.9% |
| 60 to 89 Minutes | 324 | 1.4% |
| 90 or more Minutes | 445 | 1.9% |
Commute Time by Sex in Twin Falls
The most common commute times in Twin Falls are 10 to 14 minutes (3,449 commuters, 25.9%) for males and 5 to 9 minutes (3,022 commuters, 31.1%) for females.
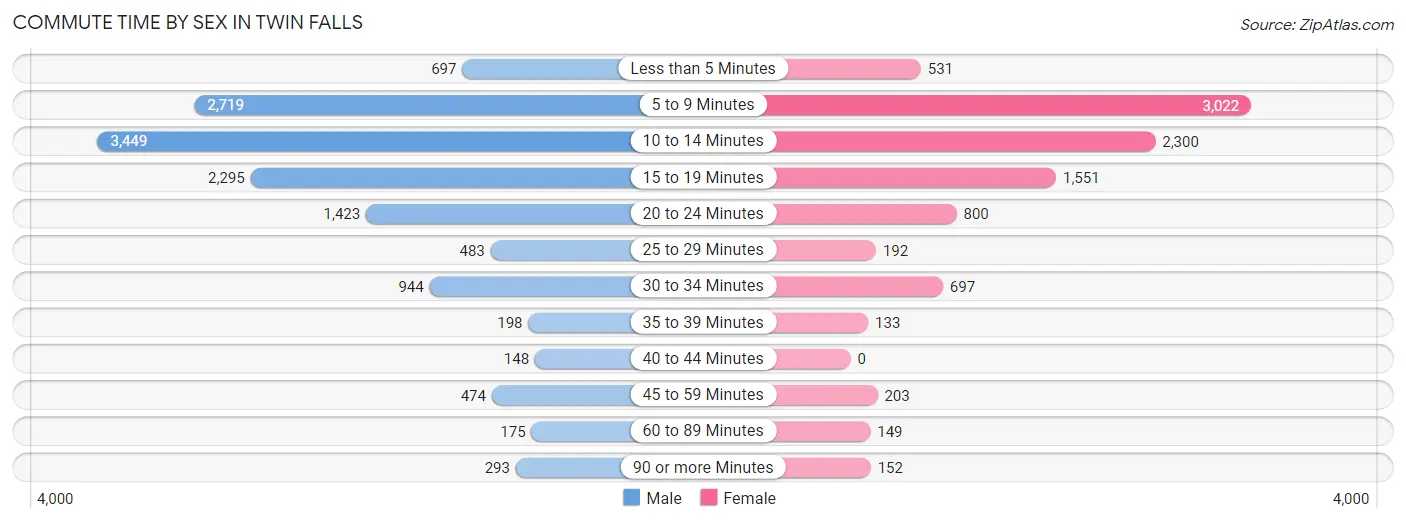
| Commute Time | Male | Female |
| Less than 5 Minutes | 697 (5.2%) | 531 (5.5%) |
| 5 to 9 Minutes | 2,719 (20.4%) | 3,022 (31.1%) |
| 10 to 14 Minutes | 3,449 (25.9%) | 2,300 (23.6%) |
| 15 to 19 Minutes | 2,295 (17.3%) | 1,551 (15.9%) |
| 20 to 24 Minutes | 1,423 (10.7%) | 800 (8.2%) |
| 25 to 29 Minutes | 483 (3.6%) | 192 (2.0%) |
| 30 to 34 Minutes | 944 (7.1%) | 697 (7.2%) |
| 35 to 39 Minutes | 198 (1.5%) | 133 (1.4%) |
| 40 to 44 Minutes | 148 (1.1%) | 0 (0.0%) |
| 45 to 59 Minutes | 474 (3.6%) | 203 (2.1%) |
| 60 to 89 Minutes | 175 (1.3%) | 149 (1.5%) |
| 90 or more Minutes | 293 (2.2%) | 152 (1.6%) |
Time of Departure to Work by Sex in Twin Falls
The most frequent times of departure to work in Twin Falls are 7:00 AM to 7:29 AM (2,225, 16.7%) for males and 7:30 AM to 7:59 AM (1,732, 17.8%) for females.
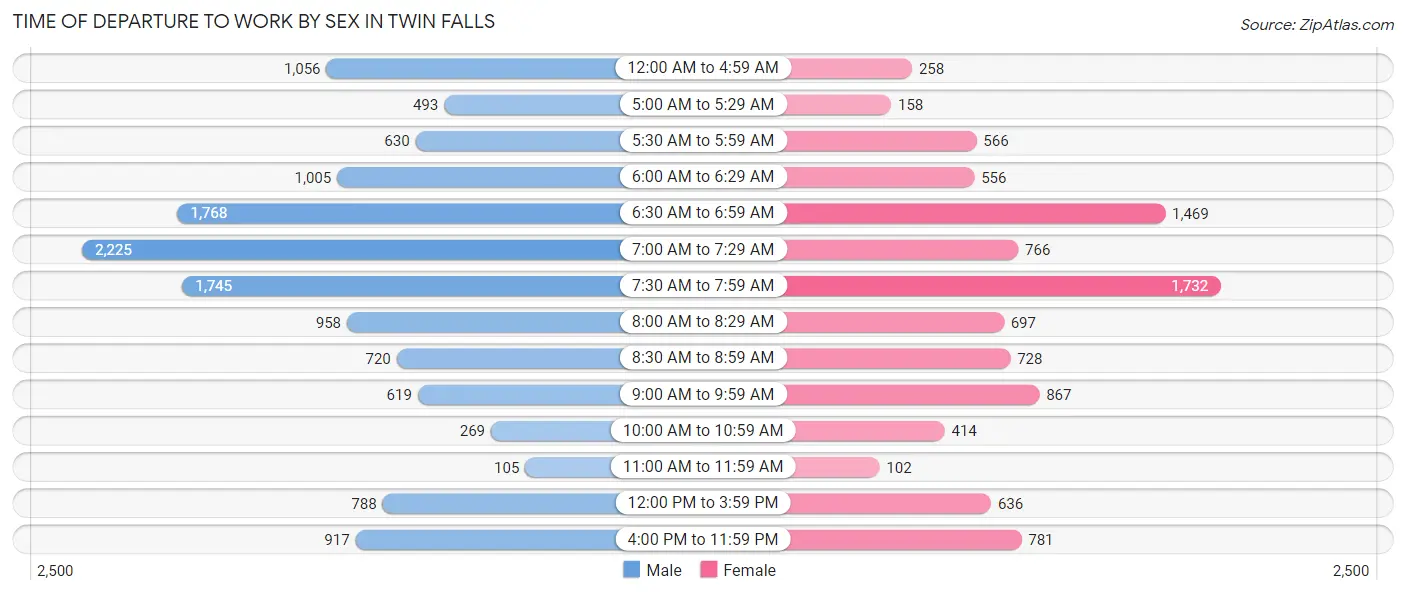
| Time of Departure | Male | Female |
| 12:00 AM to 4:59 AM | 1,056 (7.9%) | 258 (2.6%) |
| 5:00 AM to 5:29 AM | 493 (3.7%) | 158 (1.6%) |
| 5:30 AM to 5:59 AM | 630 (4.7%) | 566 (5.8%) |
| 6:00 AM to 6:29 AM | 1,005 (7.6%) | 556 (5.7%) |
| 6:30 AM to 6:59 AM | 1,768 (13.3%) | 1,469 (15.1%) |
| 7:00 AM to 7:29 AM | 2,225 (16.7%) | 766 (7.9%) |
| 7:30 AM to 7:59 AM | 1,745 (13.1%) | 1,732 (17.8%) |
| 8:00 AM to 8:29 AM | 958 (7.2%) | 697 (7.2%) |
| 8:30 AM to 8:59 AM | 720 (5.4%) | 728 (7.5%) |
| 9:00 AM to 9:59 AM | 619 (4.6%) | 867 (8.9%) |
| 10:00 AM to 10:59 AM | 269 (2.0%) | 414 (4.3%) |
| 11:00 AM to 11:59 AM | 105 (0.8%) | 102 (1.1%) |
| 12:00 PM to 3:59 PM | 788 (5.9%) | 636 (6.5%) |
| 4:00 PM to 11:59 PM | 917 (6.9%) | 781 (8.0%) |
| Total | 13,298 (100.0%) | 9,730 (100.0%) |
Housing Occupancy in Twin Falls
Occupancy by Ownership in Twin Falls
Of the total 19,897 dwellings in Twin Falls, owner-occupied units account for 12,529 (63.0%), while renter-occupied units make up 7,368 (37.0%).
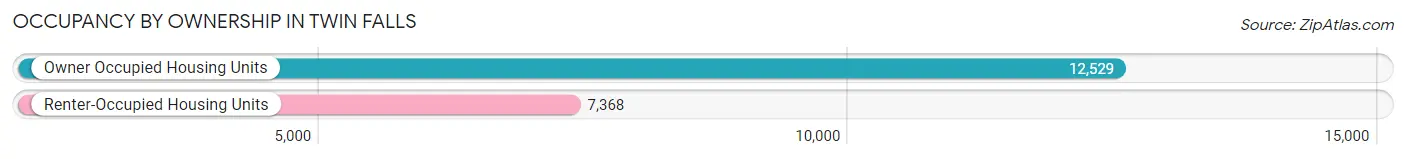
| Occupancy | # Housing Units | % Housing Units |
| Owner Occupied Housing Units | 12,529 | 63.0% |
| Renter-Occupied Housing Units | 7,368 | 37.0% |
| Total Occupied Housing Units | 19,897 | 100.0% |
Occupancy by Household Size in Twin Falls
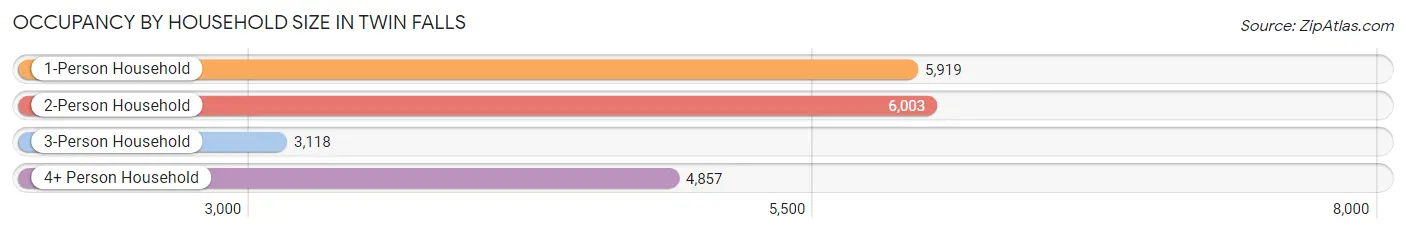
| Household Size | # Housing Units | % Housing Units |
| 1-Person Household | 5,919 | 29.7% |
| 2-Person Household | 6,003 | 30.2% |
| 3-Person Household | 3,118 | 15.7% |
| 4+ Person Household | 4,857 | 24.4% |
| Total Housing Units | 19,897 | 100.0% |
Occupancy by Ownership by Household Size in Twin Falls
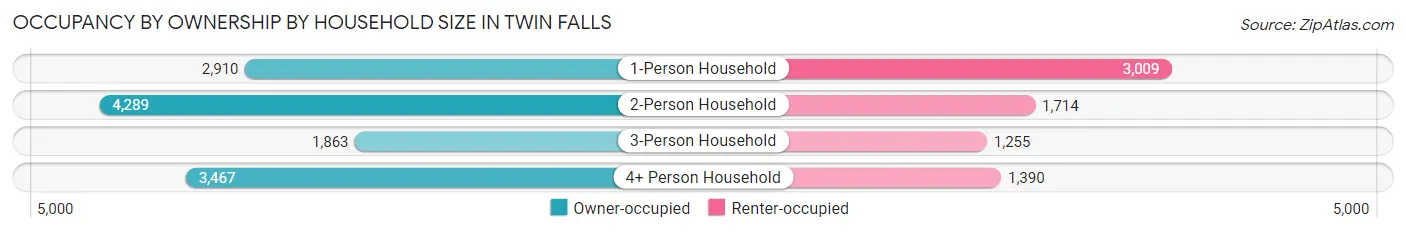
| Household Size | Owner-occupied | Renter-occupied |
| 1-Person Household | 2,910 (49.2%) | 3,009 (50.8%) |
| 2-Person Household | 4,289 (71.5%) | 1,714 (28.5%) |
| 3-Person Household | 1,863 (59.8%) | 1,255 (40.3%) |
| 4+ Person Household | 3,467 (71.4%) | 1,390 (28.6%) |
| Total Housing Units | 12,529 (63.0%) | 7,368 (37.0%) |
Occupancy by Educational Attainment in Twin Falls
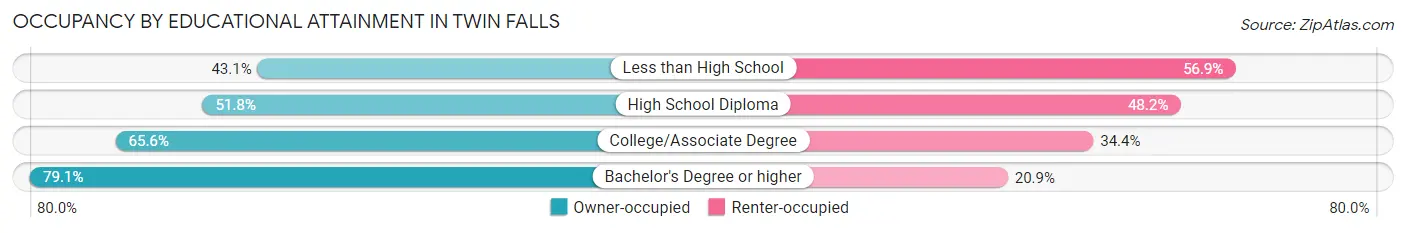
| Household Size | Owner-occupied | Renter-occupied |
| Less than High School | 915 (43.1%) | 1,210 (56.9%) |
| High School Diploma | 2,618 (51.8%) | 2,438 (48.2%) |
| College/Associate Degree | 5,150 (65.6%) | 2,705 (34.4%) |
| Bachelor's Degree or higher | 3,846 (79.1%) | 1,015 (20.9%) |
Occupancy by Age of Householder in Twin Falls
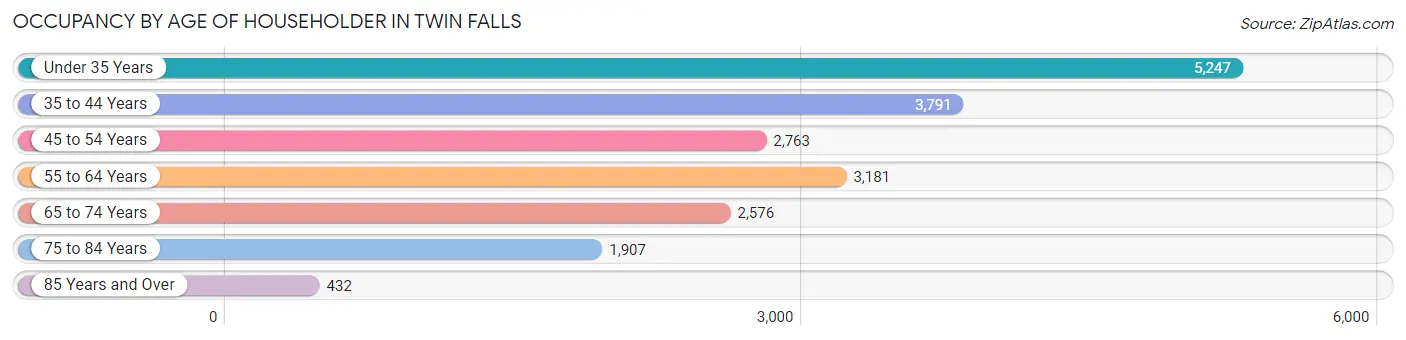
| Age Bracket | # Households | % Households |
| Under 35 Years | 5,247 | 26.4% |
| 35 to 44 Years | 3,791 | 19.1% |
| 45 to 54 Years | 2,763 | 13.9% |
| 55 to 64 Years | 3,181 | 16.0% |
| 65 to 74 Years | 2,576 | 13.0% |
| 75 to 84 Years | 1,907 | 9.6% |
| 85 Years and Over | 432 | 2.2% |
| Total | 19,897 | 100.0% |
Housing Finances in Twin Falls
Median Income by Occupancy in Twin Falls
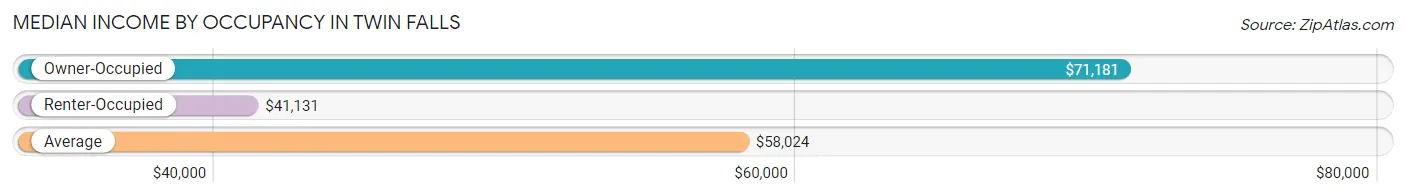
| Occupancy Type | # Households | Median Income |
| Owner-Occupied | 12,529 (63.0%) | $71,181 |
| Renter-Occupied | 7,368 (37.0%) | $41,131 |
| Average | 19,897 (100.0%) | $58,024 |
Occupancy by Householder Income Bracket in Twin Falls
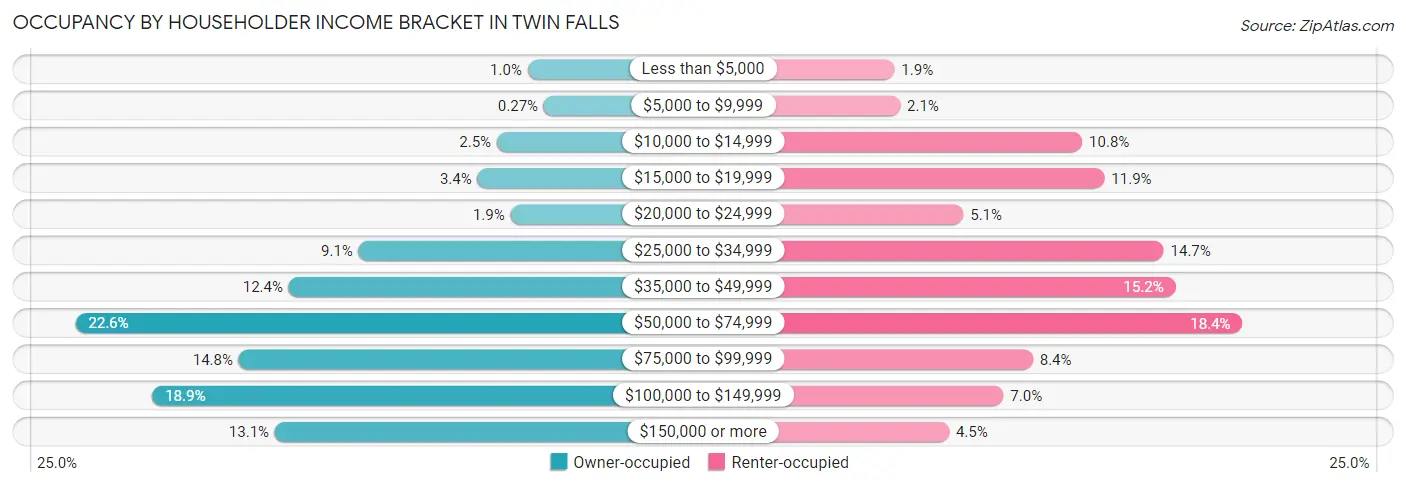
| Income Bracket | Owner-occupied | Renter-occupied |
| Less than $5,000 | 130 (1.0%) | 136 (1.8%) |
| $5,000 to $9,999 | 34 (0.3%) | 156 (2.1%) |
| $10,000 to $14,999 | 314 (2.5%) | 795 (10.8%) |
| $15,000 to $19,999 | 430 (3.4%) | 873 (11.8%) |
| $20,000 to $24,999 | 233 (1.9%) | 378 (5.1%) |
| $25,000 to $34,999 | 1,139 (9.1%) | 1,081 (14.7%) |
| $35,000 to $49,999 | 1,556 (12.4%) | 1,123 (15.2%) |
| $50,000 to $74,999 | 2,829 (22.6%) | 1,357 (18.4%) |
| $75,000 to $99,999 | 1,854 (14.8%) | 622 (8.4%) |
| $100,000 to $149,999 | 2,371 (18.9%) | 519 (7.0%) |
| $150,000 or more | 1,639 (13.1%) | 328 (4.4%) |
| Total | 12,529 (100.0%) | 7,368 (100.0%) |
Monthly Housing Cost Tiers in Twin Falls
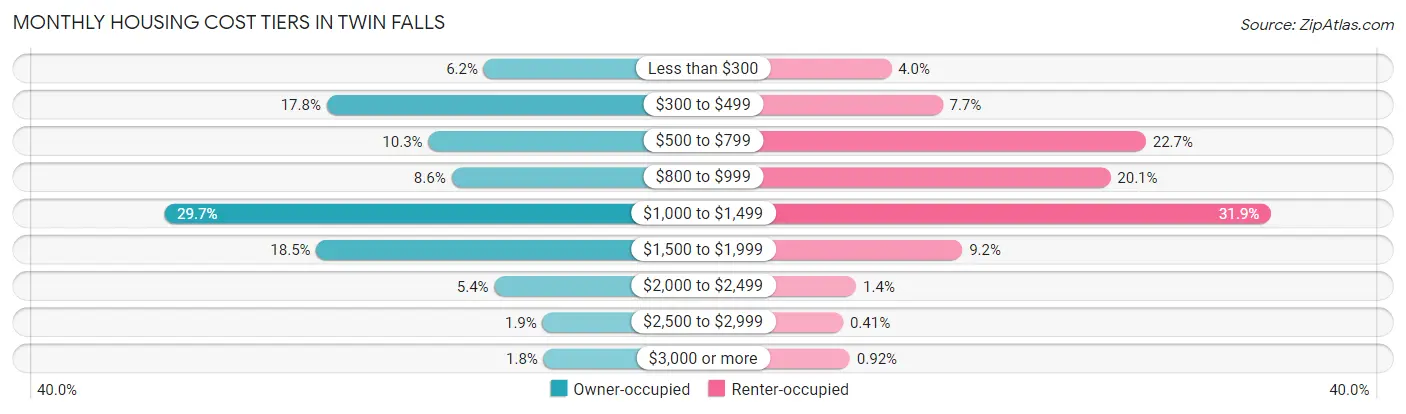
| Monthly Cost | Owner-occupied | Renter-occupied |
| Less than $300 | 774 (6.2%) | 292 (4.0%) |
| $300 to $499 | 2,224 (17.7%) | 570 (7.7%) |
| $500 to $799 | 1,286 (10.3%) | 1,673 (22.7%) |
| $800 to $999 | 1,073 (8.6%) | 1,481 (20.1%) |
| $1,000 to $1,499 | 3,723 (29.7%) | 2,353 (31.9%) |
| $1,500 to $1,999 | 2,319 (18.5%) | 677 (9.2%) |
| $2,000 to $2,499 | 676 (5.4%) | 102 (1.4%) |
| $2,500 to $2,999 | 232 (1.8%) | 30 (0.4%) |
| $3,000 or more | 222 (1.8%) | 68 (0.9%) |
| Total | 12,529 (100.0%) | 7,368 (100.0%) |
Physical Housing Characteristics in Twin Falls
Housing Structures in Twin Falls
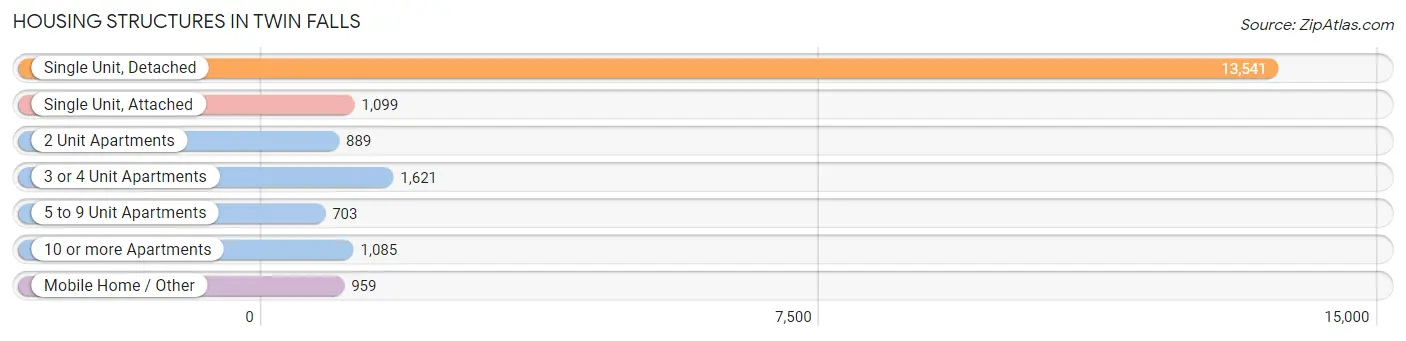
| Structure Type | # Housing Units | % Housing Units |
| Single Unit, Detached | 13,541 | 68.1% |
| Single Unit, Attached | 1,099 | 5.5% |
| 2 Unit Apartments | 889 | 4.5% |
| 3 or 4 Unit Apartments | 1,621 | 8.2% |
| 5 to 9 Unit Apartments | 703 | 3.5% |
| 10 or more Apartments | 1,085 | 5.4% |
| Mobile Home / Other | 959 | 4.8% |
| Total | 19,897 | 100.0% |
Housing Structures by Occupancy in Twin Falls
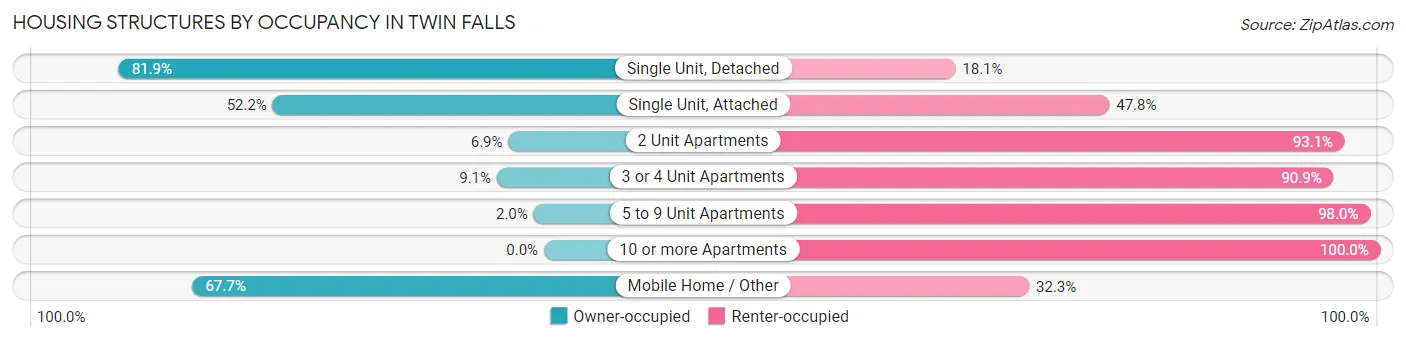
| Structure Type | Owner-occupied | Renter-occupied |
| Single Unit, Detached | 11,084 (81.9%) | 2,457 (18.1%) |
| Single Unit, Attached | 574 (52.2%) | 525 (47.8%) |
| 2 Unit Apartments | 61 (6.9%) | 828 (93.1%) |
| 3 or 4 Unit Apartments | 147 (9.1%) | 1,474 (90.9%) |
| 5 to 9 Unit Apartments | 14 (2.0%) | 689 (98.0%) |
| 10 or more Apartments | 0 (0.0%) | 1,085 (100.0%) |
| Mobile Home / Other | 649 (67.7%) | 310 (32.3%) |
| Total | 12,529 (63.0%) | 7,368 (37.0%) |
Housing Structures by Number of Rooms in Twin Falls
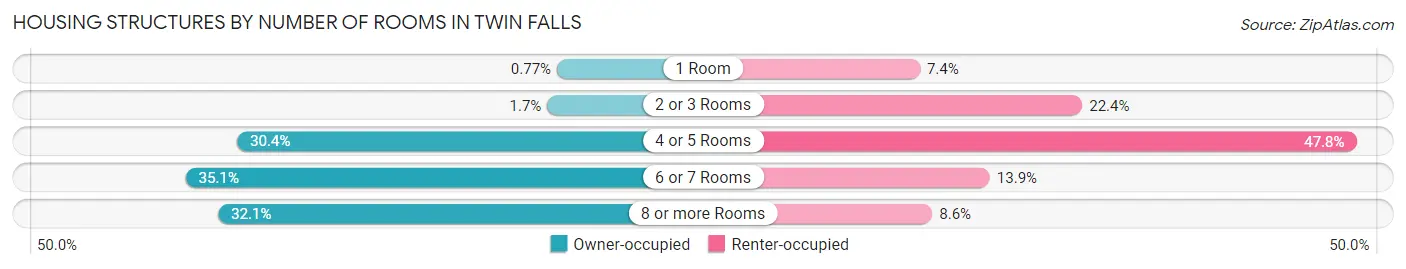
| Number of Rooms | Owner-occupied | Renter-occupied |
| 1 Room | 96 (0.8%) | 545 (7.4%) |
| 2 or 3 Rooms | 209 (1.7%) | 1,652 (22.4%) |
| 4 or 5 Rooms | 3,803 (30.3%) | 3,519 (47.8%) |
| 6 or 7 Rooms | 4,399 (35.1%) | 1,022 (13.9%) |
| 8 or more Rooms | 4,022 (32.1%) | 630 (8.6%) |
| Total | 12,529 (100.0%) | 7,368 (100.0%) |
Housing Structure by Heating Type in Twin Falls
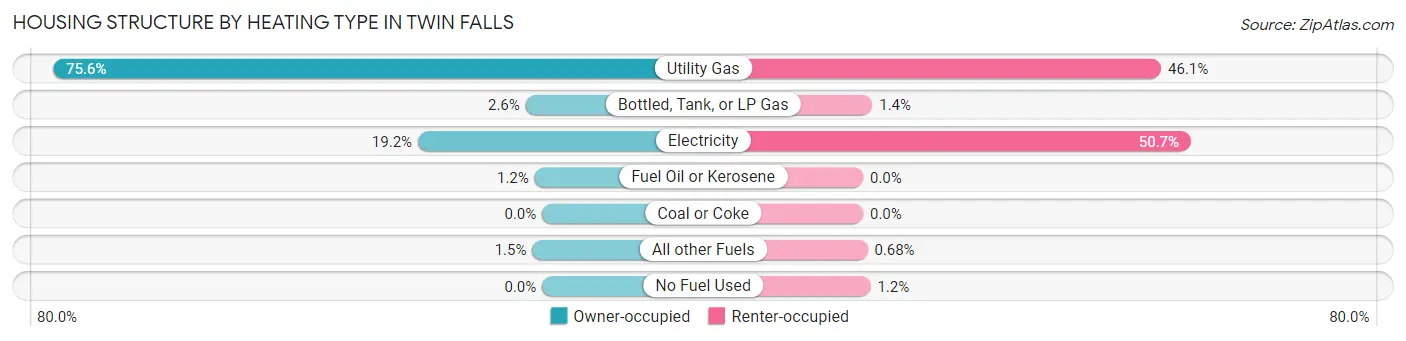
| Heating Type | Owner-occupied | Renter-occupied |
| Utility Gas | 9,471 (75.6%) | 3,395 (46.1%) |
| Bottled, Tank, or LP Gas | 319 (2.5%) | 105 (1.4%) |
| Electricity | 2,405 (19.2%) | 3,733 (50.7%) |
| Fuel Oil or Kerosene | 145 (1.2%) | 0 (0.0%) |
| Coal or Coke | 0 (0.0%) | 0 (0.0%) |
| All other Fuels | 189 (1.5%) | 50 (0.7%) |
| No Fuel Used | 0 (0.0%) | 85 (1.1%) |
| Total | 12,529 (100.0%) | 7,368 (100.0%) |
Household Vehicle Usage in Twin Falls
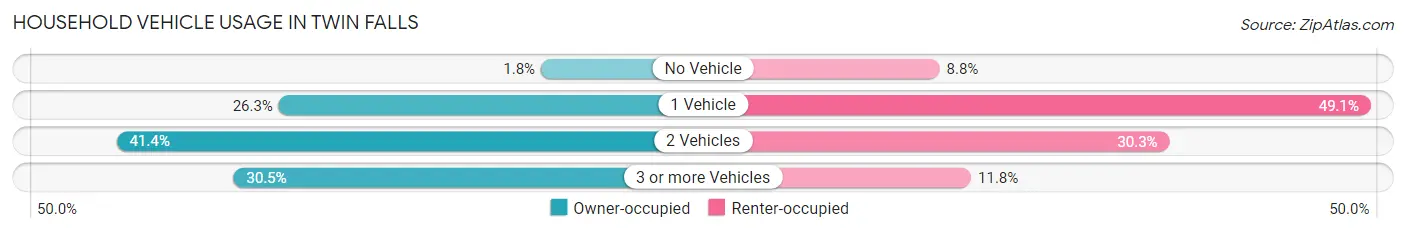
| Vehicles per Household | Owner-occupied | Renter-occupied |
| No Vehicle | 226 (1.8%) | 651 (8.8%) |
| 1 Vehicle | 3,292 (26.3%) | 3,617 (49.1%) |
| 2 Vehicles | 5,189 (41.4%) | 2,232 (30.3%) |
| 3 or more Vehicles | 3,822 (30.5%) | 868 (11.8%) |
| Total | 12,529 (100.0%) | 7,368 (100.0%) |
Real Estate & Mortgages in Twin Falls
Real Estate and Mortgage Overview in Twin Falls
| Characteristic | Without Mortgage | With Mortgage |
| Housing Units | 3,985 | 8,544 |
| Median Property Value | $223,000 | $248,400 |
| Median Household Income | $51,460 | $1,198 |
| Monthly Housing Costs | $431 | $209 |
| Real Estate Taxes | $1,698 | $410 |
Property Value by Mortgage Status in Twin Falls
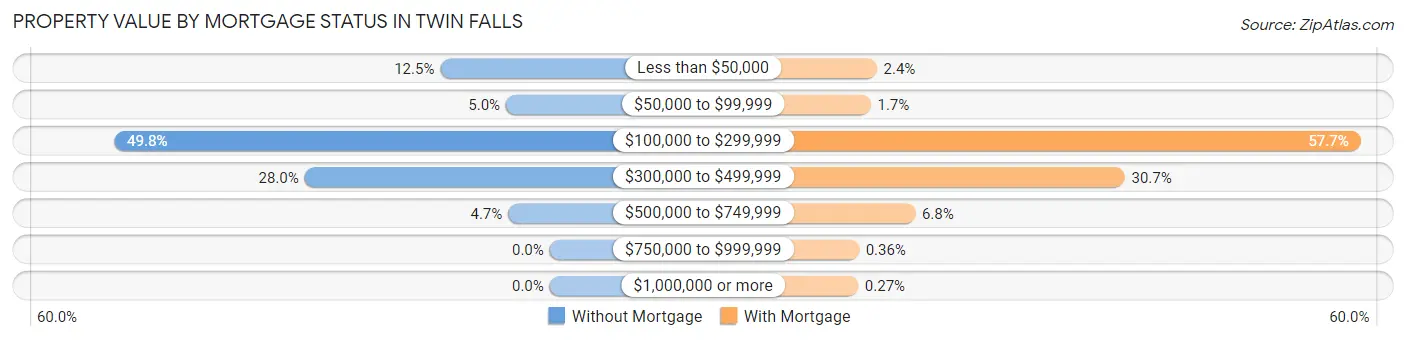
| Property Value | Without Mortgage | With Mortgage |
| Less than $50,000 | 498 (12.5%) | 206 (2.4%) |
| $50,000 to $99,999 | 199 (5.0%) | 146 (1.7%) |
| $100,000 to $299,999 | 1,983 (49.8%) | 4,932 (57.7%) |
| $300,000 to $499,999 | 1,116 (28.0%) | 2,626 (30.7%) |
| $500,000 to $749,999 | 189 (4.7%) | 580 (6.8%) |
| $750,000 to $999,999 | 0 (0.0%) | 31 (0.4%) |
| $1,000,000 or more | 0 (0.0%) | 23 (0.3%) |
| Total | 3,985 (100.0%) | 8,544 (100.0%) |
Household Income by Mortgage Status in Twin Falls
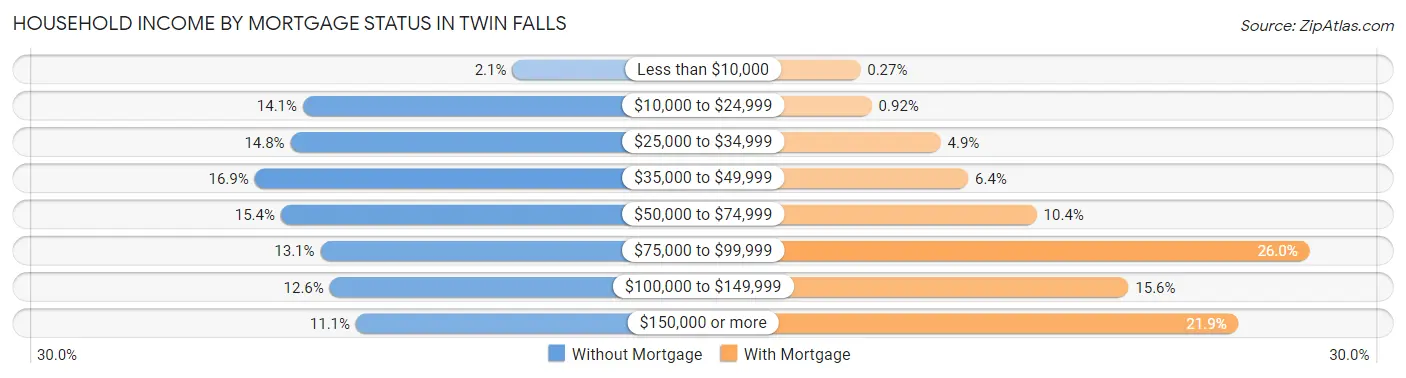
| Household Income | Without Mortgage | With Mortgage |
| Less than $10,000 | 85 (2.1%) | 23 (0.3%) |
| $10,000 to $24,999 | 562 (14.1%) | 79 (0.9%) |
| $25,000 to $34,999 | 590 (14.8%) | 415 (4.9%) |
| $35,000 to $49,999 | 672 (16.9%) | 549 (6.4%) |
| $50,000 to $74,999 | 612 (15.4%) | 884 (10.3%) |
| $75,000 to $99,999 | 522 (13.1%) | 2,217 (26.0%) |
| $100,000 to $149,999 | 501 (12.6%) | 1,332 (15.6%) |
| $150,000 or more | 441 (11.1%) | 1,870 (21.9%) |
| Total | 3,985 (100.0%) | 8,544 (100.0%) |
Property Value to Household Income Ratio in Twin Falls
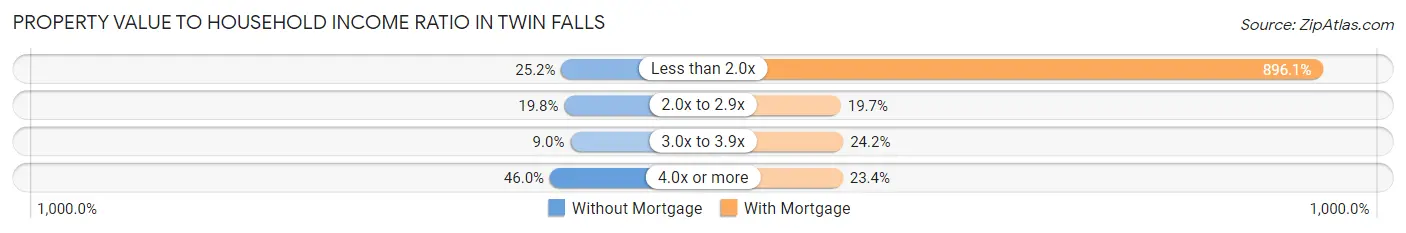
| Value-to-Income Ratio | Without Mortgage | With Mortgage |
| Less than 2.0x | 1,003 (25.2%) | 76,561 (896.1%) |
| 2.0x to 2.9x | 790 (19.8%) | 1,684 (19.7%) |
| 3.0x to 3.9x | 360 (9.0%) | 2,068 (24.2%) |
| 4.0x or more | 1,832 (46.0%) | 2,001 (23.4%) |
| Total | 3,985 (100.0%) | 8,544 (100.0%) |
Real Estate Taxes by Mortgage Status in Twin Falls
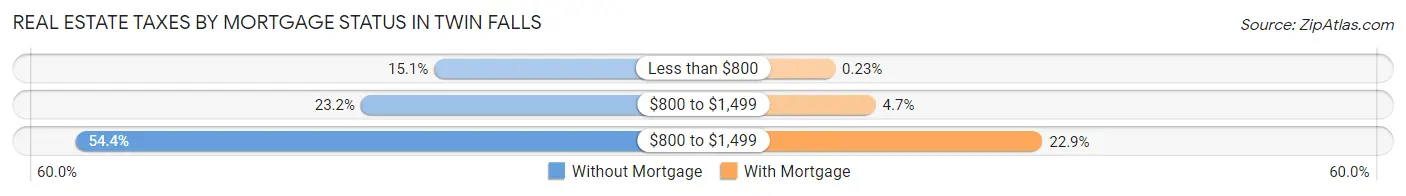
| Property Taxes | Without Mortgage | With Mortgage |
| Less than $800 | 603 (15.1%) | 20 (0.2%) |
| $800 to $1,499 | 923 (23.2%) | 399 (4.7%) |
| $800 to $1,499 | 2,168 (54.4%) | 1,960 (22.9%) |
| Total | 3,985 (100.0%) | 8,544 (100.0%) |
Health & Disability in Twin Falls
Health Insurance Coverage by Age in Twin Falls
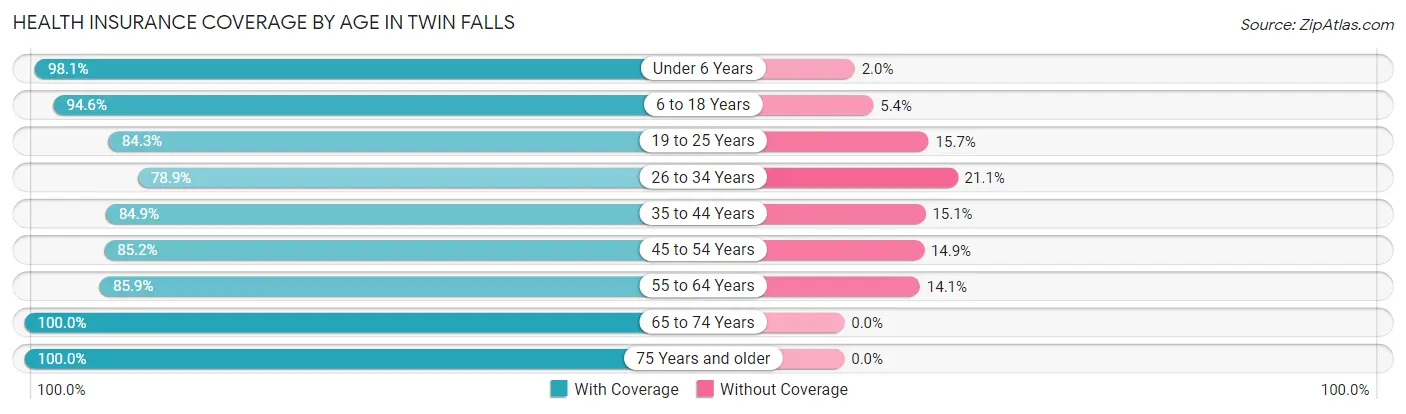
| Age Bracket | With Coverage | Without Coverage |
| Under 6 Years | 4,377 (98.1%) | 87 (1.9%) |
| 6 to 18 Years | 8,943 (94.6%) | 511 (5.4%) |
| 19 to 25 Years | 4,517 (84.3%) | 843 (15.7%) |
| 26 to 34 Years | 5,785 (78.9%) | 1,551 (21.1%) |
| 35 to 44 Years | 6,056 (84.9%) | 1,080 (15.1%) |
| 45 to 54 Years | 4,256 (85.2%) | 742 (14.8%) |
| 55 to 64 Years | 4,157 (85.9%) | 682 (14.1%) |
| 65 to 74 Years | 4,400 (100.0%) | 0 (0.0%) |
| 75 Years and older | 3,513 (100.0%) | 0 (0.0%) |
| Total | 46,004 (89.3%) | 5,496 (10.7%) |
Health Insurance Coverage by Citizenship Status in Twin Falls
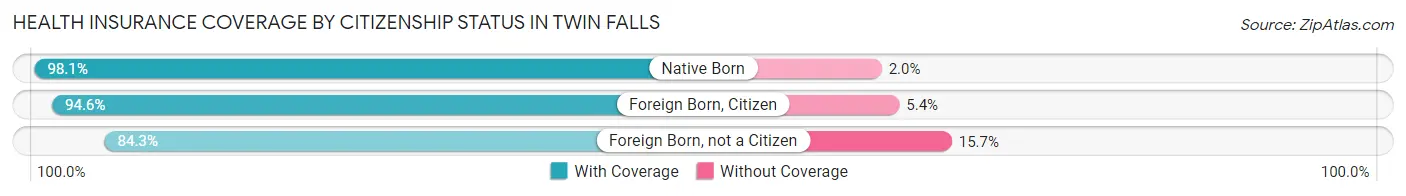
| Citizenship Status | With Coverage | Without Coverage |
| Native Born | 4,377 (98.1%) | 87 (1.9%) |
| Foreign Born, Citizen | 8,943 (94.6%) | 511 (5.4%) |
| Foreign Born, not a Citizen | 4,517 (84.3%) | 843 (15.7%) |
Health Insurance Coverage by Household Income in Twin Falls
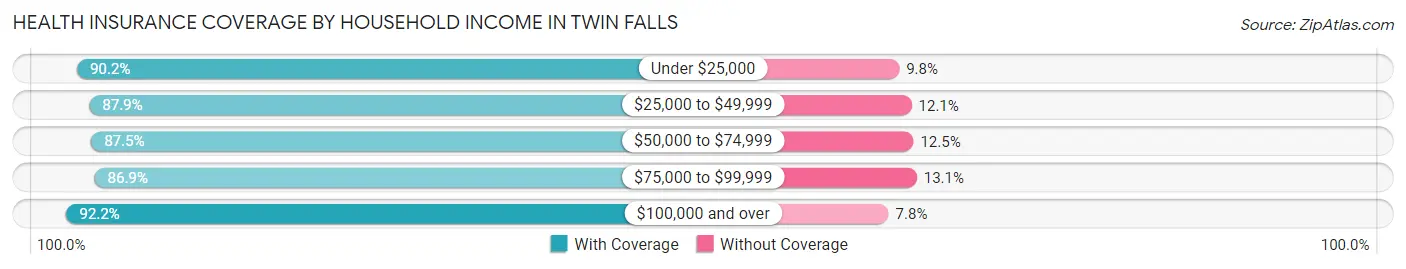
| Household Income | With Coverage | Without Coverage |
| Under $25,000 | 4,685 (90.2%) | 510 (9.8%) |
| $25,000 to $49,999 | 9,491 (87.9%) | 1,312 (12.1%) |
| $50,000 to $74,999 | 8,923 (87.5%) | 1,273 (12.5%) |
| $75,000 to $99,999 | 6,602 (86.9%) | 997 (13.1%) |
| $100,000 and over | 15,724 (92.2%) | 1,338 (7.8%) |
Public vs Private Health Insurance Coverage by Age in Twin Falls
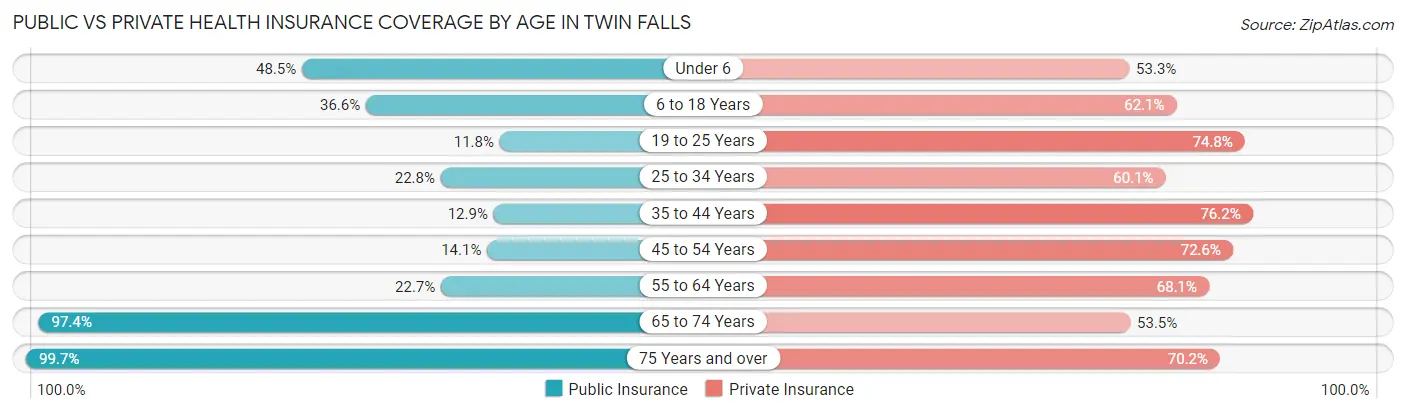
| Age Bracket | Public Insurance | Private Insurance |
| Under 6 | 2,165 (48.5%) | 2,381 (53.3%) |
| 6 to 18 Years | 3,462 (36.6%) | 5,870 (62.1%) |
| 19 to 25 Years | 632 (11.8%) | 4,008 (74.8%) |
| 25 to 34 Years | 1,669 (22.8%) | 4,406 (60.1%) |
| 35 to 44 Years | 922 (12.9%) | 5,439 (76.2%) |
| 45 to 54 Years | 706 (14.1%) | 3,627 (72.6%) |
| 55 to 64 Years | 1,098 (22.7%) | 3,297 (68.1%) |
| 65 to 74 Years | 4,286 (97.4%) | 2,355 (53.5%) |
| 75 Years and over | 3,503 (99.7%) | 2,465 (70.2%) |
| Total | 18,443 (35.8%) | 33,848 (65.7%) |
Disability Status by Sex by Age in Twin Falls
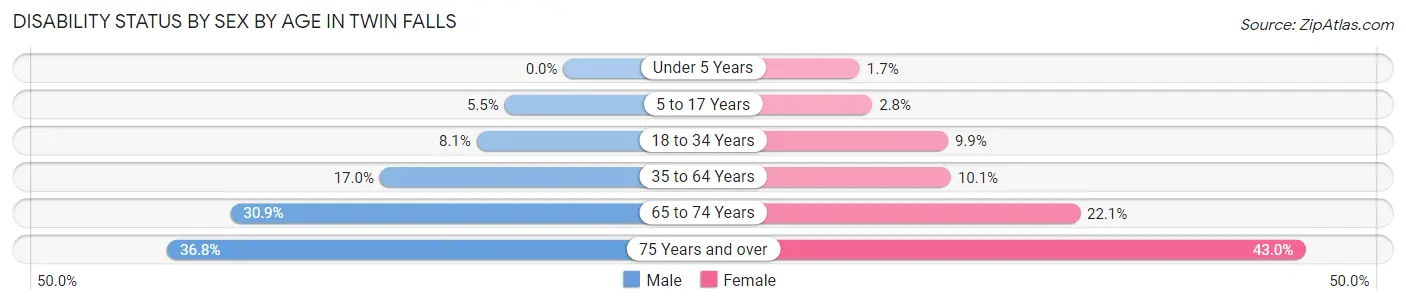
| Age Bracket | Male | Female |
| Under 5 Years | 0 (0.0%) | 26 (1.7%) |
| 5 to 17 Years | 261 (5.5%) | 135 (2.8%) |
| 18 to 34 Years | 534 (8.1%) | 673 (9.9%) |
| 35 to 64 Years | 1,524 (17.0%) | 813 (10.1%) |
| 65 to 74 Years | 609 (30.9%) | 537 (22.1%) |
| 75 Years and over | 570 (36.8%) | 844 (43.0%) |
Disability Class by Sex by Age in Twin Falls
Disability Class: Hearing Difficulty
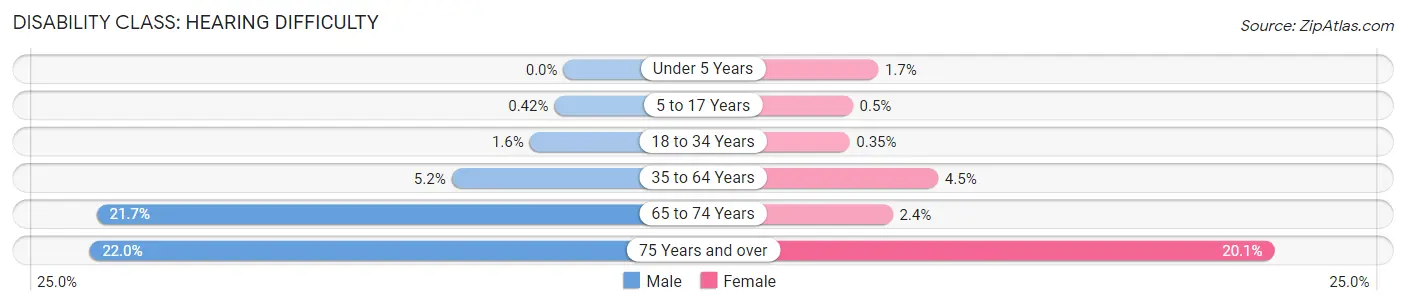
| Age Bracket | Male | Female |
| Under 5 Years | 0 (0.0%) | 26 (1.7%) |
| 5 to 17 Years | 20 (0.4%) | 24 (0.5%) |
| 18 to 34 Years | 104 (1.6%) | 24 (0.4%) |
| 35 to 64 Years | 464 (5.2%) | 358 (4.5%) |
| 65 to 74 Years | 427 (21.7%) | 57 (2.4%) |
| 75 Years and over | 341 (22.0%) | 394 (20.1%) |
Disability Class: Vision Difficulty
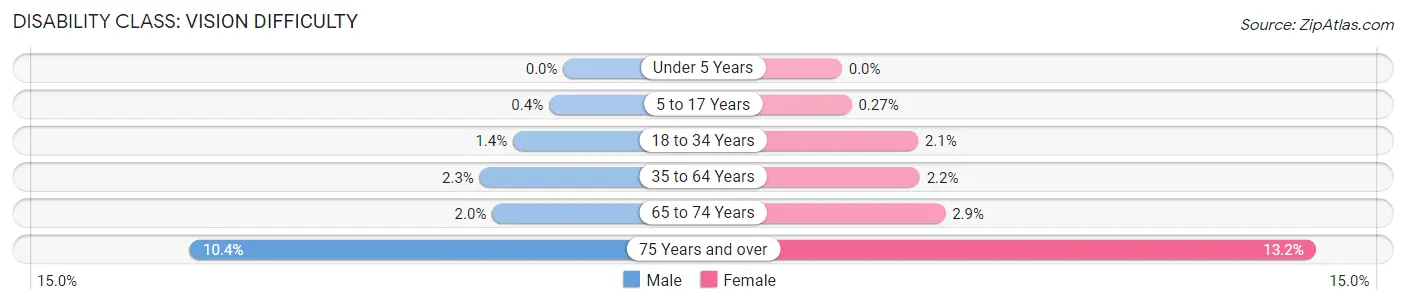
| Age Bracket | Male | Female |
| Under 5 Years | 0 (0.0%) | 0 (0.0%) |
| 5 to 17 Years | 19 (0.4%) | 13 (0.3%) |
| 18 to 34 Years | 93 (1.4%) | 145 (2.1%) |
| 35 to 64 Years | 208 (2.3%) | 174 (2.2%) |
| 65 to 74 Years | 39 (2.0%) | 70 (2.9%) |
| 75 Years and over | 161 (10.4%) | 259 (13.2%) |
Disability Class: Cognitive Difficulty
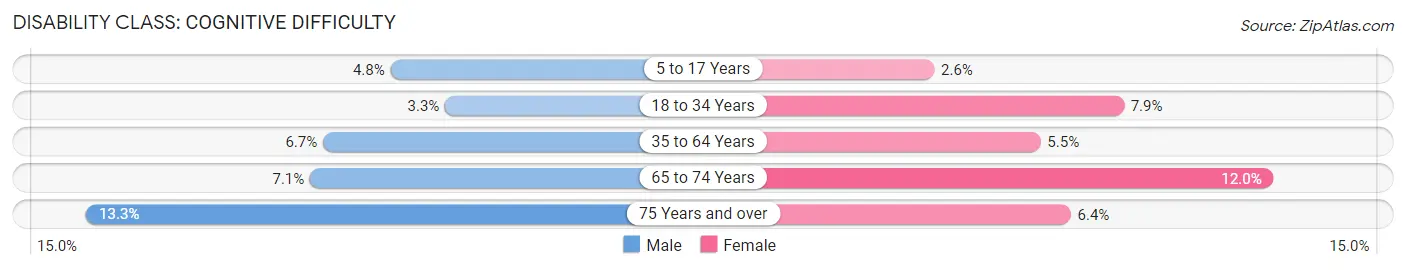
| Age Bracket | Male | Female |
| 5 to 17 Years | 230 (4.8%) | 123 (2.6%) |
| 18 to 34 Years | 218 (3.3%) | 536 (7.9%) |
| 35 to 64 Years | 598 (6.7%) | 444 (5.5%) |
| 65 to 74 Years | 139 (7.0%) | 292 (12.0%) |
| 75 Years and over | 206 (13.3%) | 125 (6.4%) |
Disability Class: Ambulatory Difficulty
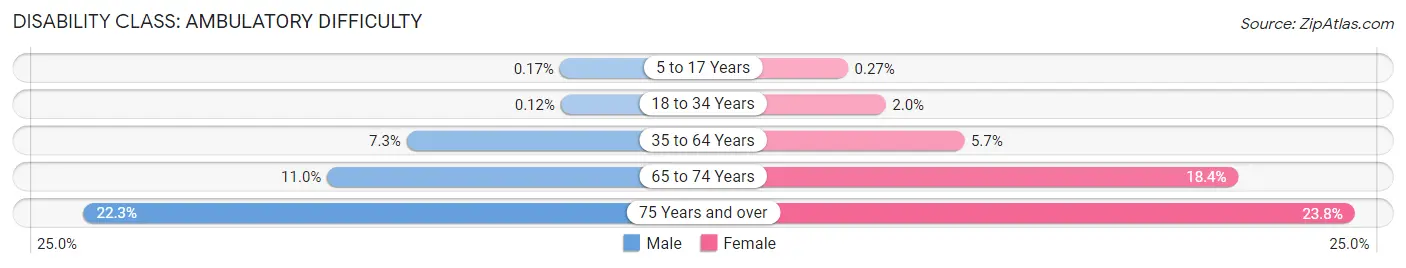
| Age Bracket | Male | Female |
| 5 to 17 Years | 8 (0.2%) | 13 (0.3%) |
| 18 to 34 Years | 8 (0.1%) | 138 (2.0%) |
| 35 to 64 Years | 650 (7.3%) | 455 (5.7%) |
| 65 to 74 Years | 216 (11.0%) | 447 (18.4%) |
| 75 Years and over | 345 (22.3%) | 467 (23.8%) |
Disability Class: Self-Care Difficulty
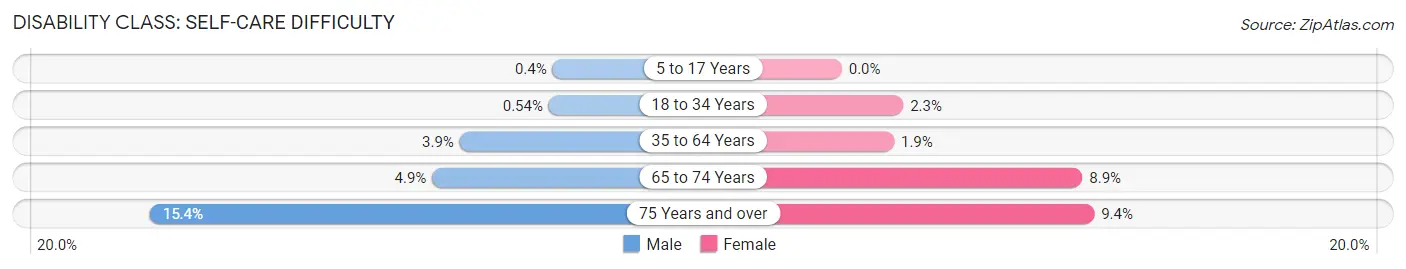
| Age Bracket | Male | Female |
| 5 to 17 Years | 19 (0.4%) | 0 (0.0%) |
| 18 to 34 Years | 36 (0.5%) | 156 (2.3%) |
| 35 to 64 Years | 344 (3.8%) | 156 (1.9%) |
| 65 to 74 Years | 96 (4.9%) | 217 (8.9%) |
| 75 Years and over | 238 (15.3%) | 184 (9.4%) |
Technology Access in Twin Falls
Computing Device Access in Twin Falls
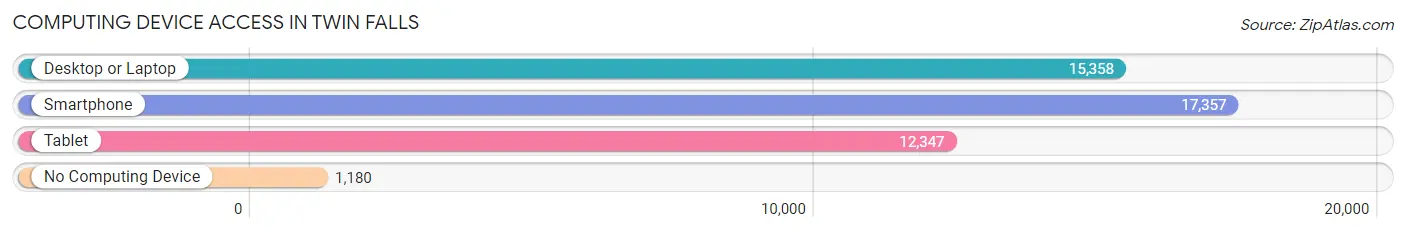
| Device Type | # Households | % Households |
| Desktop or Laptop | 15,358 | 77.2% |
| Smartphone | 17,357 | 87.2% |
| Tablet | 12,347 | 62.1% |
| No Computing Device | 1,180 | 5.9% |
| Total | 19,897 | 100.0% |
Internet Access in Twin Falls
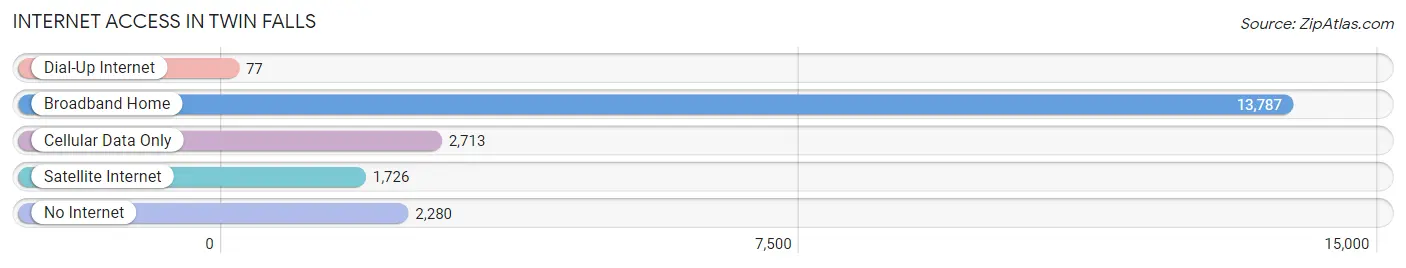
| Internet Type | # Households | % Households |
| Dial-Up Internet | 77 | 0.4% |
| Broadband Home | 13,787 | 69.3% |
| Cellular Data Only | 2,713 | 13.6% |
| Satellite Internet | 1,726 | 8.7% |
| No Internet | 2,280 | 11.5% |
| Total | 19,897 | 100.0% |
Twin Falls Summary
Twin Falls, Idaho is a city located in the south-central part of the state, in the Snake River Valley. It is the county seat of Twin Falls County and the largest city in the Magic Valley region. The city has a population of 44,125 as of the 2020 census, making it the ninth-largest city in Idaho.
History
Twin Falls was founded in 1904 by I.B. Perrine, a local rancher and businessman. He purchased the land from the federal government and began to develop the area for agricultural use. The city was named for the two waterfalls located on the Snake River, which runs through the city.
The city quickly grew, and by 1910, it had a population of 1,500. The city was incorporated in 1907 and became the county seat of Twin Falls County in 1911.
The city experienced rapid growth in the early 20th century, due to the construction of the Twin Falls Canal, which diverted water from the Snake River to irrigate the surrounding farmland. This allowed for the development of large-scale agriculture in the area, and the city became a major center for the production of sugar beets, potatoes, and other crops.
The city also became a major center for the production of hydroelectric power, with the construction of the Twin Falls Power Plant in the 1920s. This plant provided electricity to the city and surrounding area, and helped to fuel the city's growth.
The city continued to grow throughout the 20th century, and by the 2000 census, it had a population of 34,469.
Geography
Twin Falls is located in the Snake River Valley, in the south-central part of Idaho. The city is situated on the Snake River, which runs through the city and provides a source of hydroelectric power. The city is surrounded by the Snake River Canyon, which is a popular tourist destination.
The city has a total area of 24.3 square miles, of which 24.2 square miles is land and 0.1 square miles is water.
Economy
Twin Falls is a major center for agriculture, with the surrounding area producing a variety of crops, including sugar beets, potatoes, and other vegetables. The city is also home to several food processing plants, which process and package these crops for sale.
The city is also home to several manufacturing companies, including a large dairy processing plant, a plastics manufacturer, and a metal fabrication plant.
The city is also home to several retail stores, including a Walmart Supercenter, a Lowe's Home Improvement store, and a variety of other stores.
Demographics
As of the 2020 census, Twin Falls had a population of 44,125. The racial makeup of the city was 87.2% White, 0.7% African American, 0.7% Native American, 0.9% Asian, 0.1% Pacific Islander, 8.2% from other races, and 2.2% from two or more races. Hispanic or Latino of any race were 16.2% of the population.
The median household income in the city was $45,845, and the median family income was $54,845. The per capita income in the city was $22,845. About 13.2% of the population was below the poverty line.
Common Questions
What is Per Capita Income in Twin Falls?
Per Capita income in Twin Falls is $31,255.
What is the Median Family Income in Twin Falls?
Median Family Income in Twin Falls is $71,330.
What is the Median Household income in Twin Falls?
Median Household Income in Twin Falls is $58,024.
What is Income or Wage Gap in Twin Falls?
Income or Wage Gap in Twin Falls is 42.1%.
Women in Twin Falls earn 57.9 cents for every dollar earned by a man.
What is Family Income Deficit in Twin Falls?
Family Income Deficit in Twin Falls is $9,329.
Families that are below poverty line in Twin Falls earn $9,329 less on average than the poverty threshold level.
What is Inequality or Gini Index in Twin Falls?
Inequality or Gini Index in Twin Falls is 0.45.
What is the Total Population of Twin Falls?
Total Population of Twin Falls is 52,315.
What is the Total Male Population of Twin Falls?
Total Male Population of Twin Falls is 26,354.
What is the Total Female Population of Twin Falls?
Total Female Population of Twin Falls is 25,961.
What is the Ratio of Males per 100 Females in Twin Falls?
There are 101.51 Males per 100 Females in Twin Falls.
What is the Ratio of Females per 100 Males in Twin Falls?
There are 98.51 Females per 100 Males in Twin Falls.
What is the Median Population Age in Twin Falls?
Median Population Age in Twin Falls is 34.0 Years.
What is the Average Family Size in Twin Falls
Average Family Size in Twin Falls is 3.2 People.
What is the Average Household Size in Twin Falls
Average Household Size in Twin Falls is 2.6 People.
How Large is the Labor Force in Twin Falls?
There are 25,826 People in the Labor Forcein in Twin Falls.
What is the Percentage of People in the Labor Force in Twin Falls?
63.9% of People are in the Labor Force in Twin Falls.
What is the Unemployment Rate in Twin Falls?
Unemployment Rate in Twin Falls is 3.1%.