Payette, ID Map & Demographics
Payette Map
Payette Overview
$23,757
PER CAPITA INCOME
$59,637
AVG FAMILY INCOME
$51,477
AVG HOUSEHOLD INCOME
47.3%
WAGE / INCOME GAP [ % ]
52.7¢/ $1
WAGE / INCOME GAP [ $ ]
0.37
INEQUALITY / GINI INDEX
8,182
TOTAL POPULATION
3,843
MALE POPULATION
4,339
FEMALE POPULATION
88.57
MALES / 100 FEMALES
112.91
FEMALES / 100 MALES
34.8
MEDIAN AGE
3.1
AVG FAMILY SIZE
2.7
AVG HOUSEHOLD SIZE
3,502
LABOR FORCE [ PEOPLE ]
56.2%
PERCENT IN LABOR FORCE
7.2%
UNEMPLOYMENT RATE
Payette Zip Codes
Payette Area Codes
Income in Payette
Income Overview in Payette
Per Capita Income in Payette is $23,757, while median incomes of families and households are $59,637 and $51,477 respectively.
| Characteristic | Number | Measure |
| Per Capita Income | 8,182 | $23,757 |
| Median Family Income | 2,065 | $59,637 |
| Mean Family Income | 2,065 | $69,505 |
| Median Household Income | 2,977 | $51,477 |
| Mean Household Income | 2,977 | $61,909 |
| Income Deficit | 2,065 | $0 |
| Wage / Income Gap (%) | 8,182 | 47.31% |
| Wage / Income Gap ($) | 8,182 | 52.69¢ per $1 |
| Gini / Inequality Index | 8,182 | 0.37 |
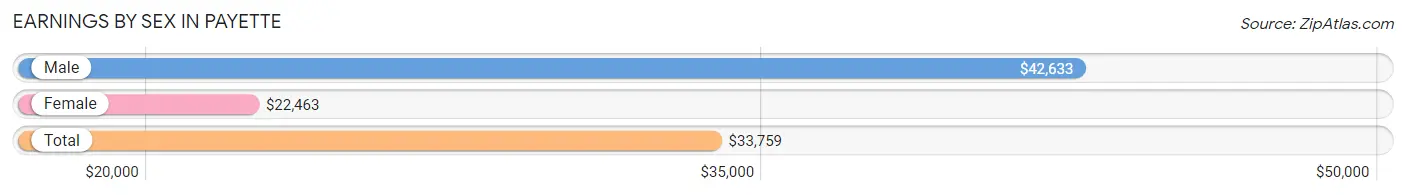
Earnings by Sex in Payette
Average Earnings in Payette are $33,759, $42,633 for men and $22,463 for women, a difference of 47.3%.
| Sex | Number | Average Earnings |
| Male | 2,067 (54.9%) | $42,633 |
| Female | 1,697 (45.1%) | $22,463 |
| Total | 3,764 (100.0%) | $33,759 |
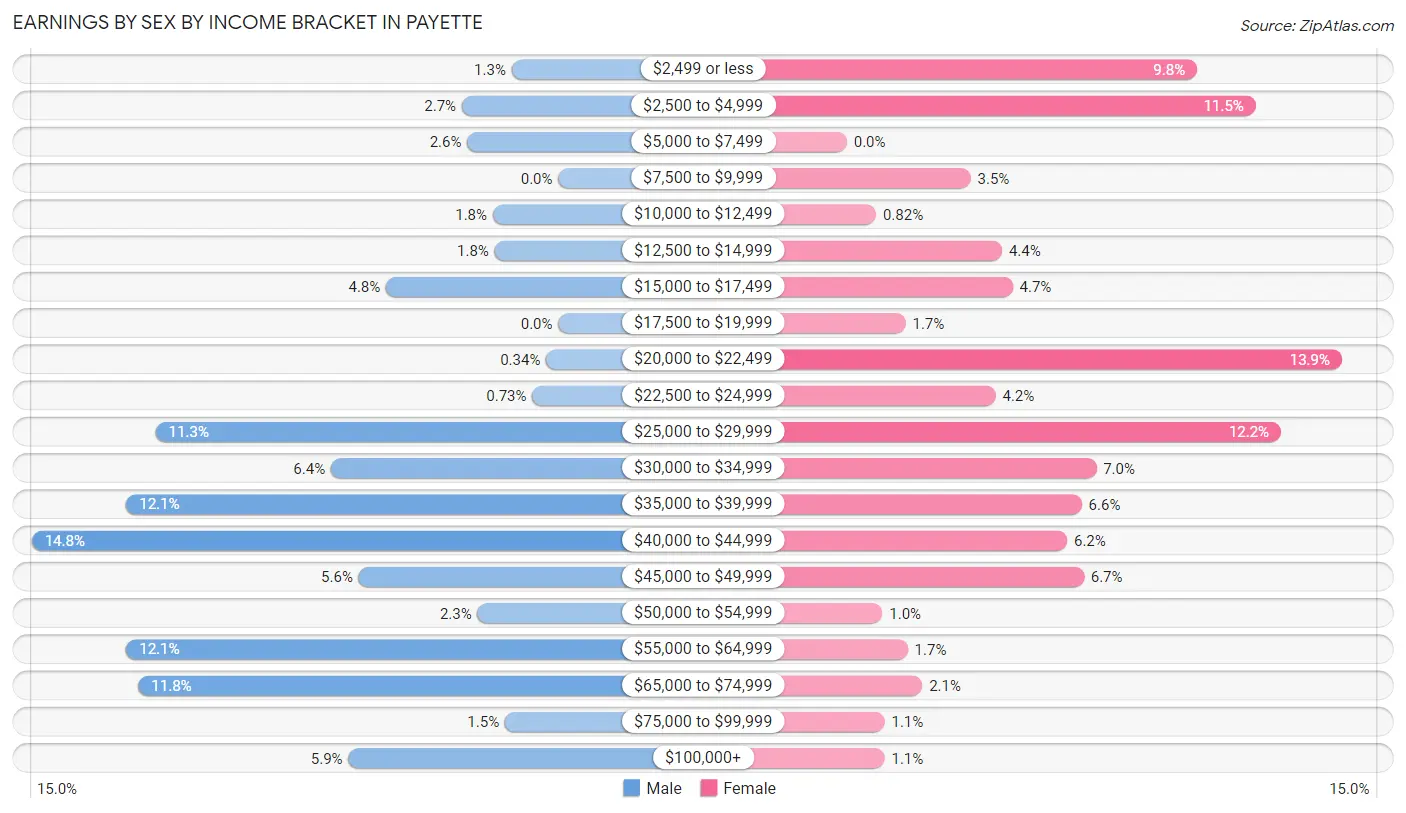
Earnings by Sex by Income Bracket in Payette
The most common earnings brackets in Payette are $40,000 to $44,999 for men (306 | 14.8%) and $20,000 to $22,499 for women (236 | 13.9%).
| Income | Male | Female |
| $2,499 or less | 27 (1.3%) | 167 (9.8%) |
| $2,500 to $4,999 | 56 (2.7%) | 195 (11.5%) |
| $5,000 to $7,499 | 53 (2.6%) | 0 (0.0%) |
| $7,500 to $9,999 | 0 (0.0%) | 59 (3.5%) |
| $10,000 to $12,499 | 38 (1.8%) | 14 (0.8%) |
| $12,500 to $14,999 | 37 (1.8%) | 74 (4.4%) |
| $15,000 to $17,499 | 100 (4.8%) | 79 (4.7%) |
| $17,500 to $19,999 | 0 (0.0%) | 28 (1.7%) |
| $20,000 to $22,499 | 7 (0.3%) | 236 (13.9%) |
| $22,500 to $24,999 | 15 (0.7%) | 71 (4.2%) |
| $25,000 to $29,999 | 234 (11.3%) | 207 (12.2%) |
| $30,000 to $34,999 | 132 (6.4%) | 119 (7.0%) |
| $35,000 to $39,999 | 251 (12.1%) | 112 (6.6%) |
| $40,000 to $44,999 | 306 (14.8%) | 105 (6.2%) |
| $45,000 to $49,999 | 116 (5.6%) | 113 (6.7%) |
| $50,000 to $54,999 | 47 (2.3%) | 17 (1.0%) |
| $55,000 to $64,999 | 251 (12.1%) | 29 (1.7%) |
| $65,000 to $74,999 | 244 (11.8%) | 36 (2.1%) |
| $75,000 to $99,999 | 31 (1.5%) | 18 (1.1%) |
| $100,000+ | 122 (5.9%) | 18 (1.1%) |
| Total | 2,067 (100.0%) | 1,697 (100.0%) |
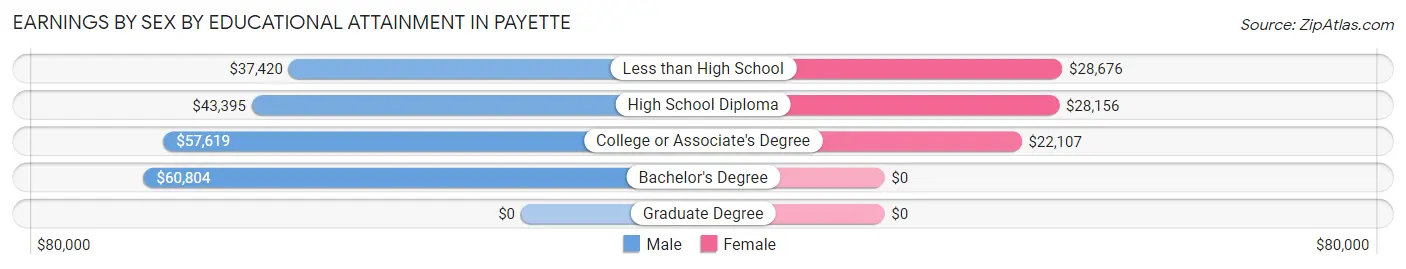
Earnings by Sex by Educational Attainment in Payette
Average earnings in Payette are $43,926 for men and $27,626 for women, a difference of 37.1%. Men with an educational attainment of bachelor's degree enjoy the highest average annual earnings of $60,804, while those with less than high school education earn the least with $37,420. Women with an educational attainment of less than high school earn the most with the average annual earnings of $28,676, while those with college or associate's degree education have the smallest earnings of $22,107.
| Educational Attainment | Male Income | Female Income |
| Less than High School | $37,420 | $28,676 |
| High School Diploma | $43,395 | $28,156 |
| College or Associate's Degree | $57,619 | $22,107 |
| Bachelor's Degree | $60,804 | $0 |
| Graduate Degree | - | - |
| Total | $43,926 | $27,626 |
Family Income in Payette
Family Income Brackets in Payette
According to the Payette family income data, there are 624 families falling into the $50,000 to $74,999 income range, which is the most common income bracket and makes up 30.2% of all families.
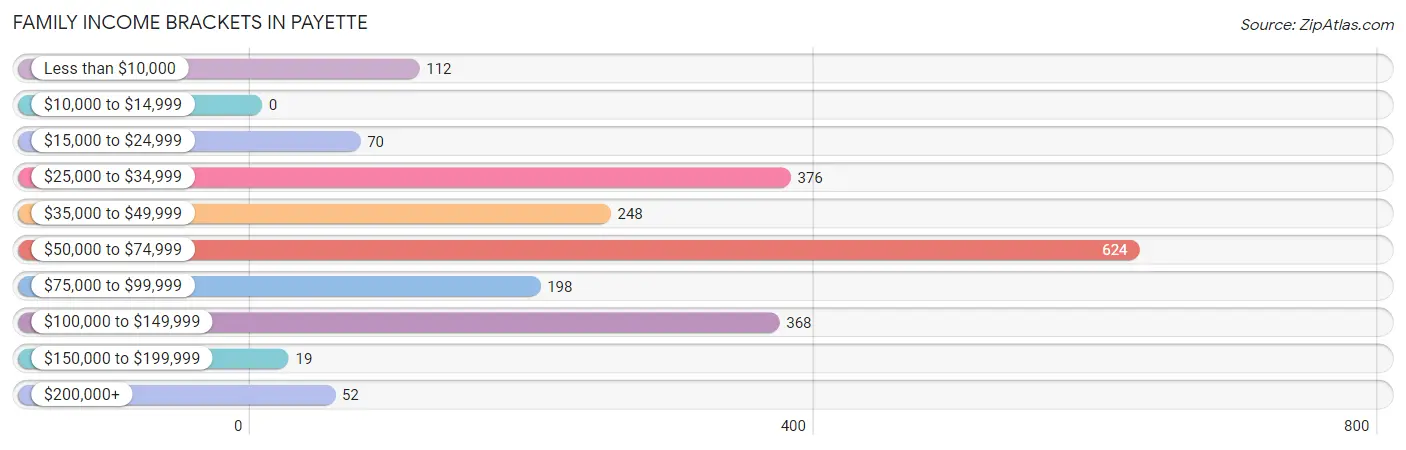
| Income Bracket | # Families | % Families |
| Less than $10,000 | 112 | 5.4% |
| $10,000 to $14,999 | 0 | 0.0% |
| $15,000 to $24,999 | 70 | 3.4% |
| $25,000 to $34,999 | 376 | 18.2% |
| $35,000 to $49,999 | 248 | 12.0% |
| $50,000 to $74,999 | 624 | 30.2% |
| $75,000 to $99,999 | 198 | 9.6% |
| $100,000 to $149,999 | 368 | 17.8% |
| $150,000 to $199,999 | 19 | 0.9% |
| $200,000+ | 52 | 2.5% |
Family Income by Famaliy Size in Payette
5-person families (154 | 7.5%) account for the highest median family income in Payette with $131,964 per family, while 2-person families (1,100 | 53.3%) have the highest median income of $30,842 per family member.
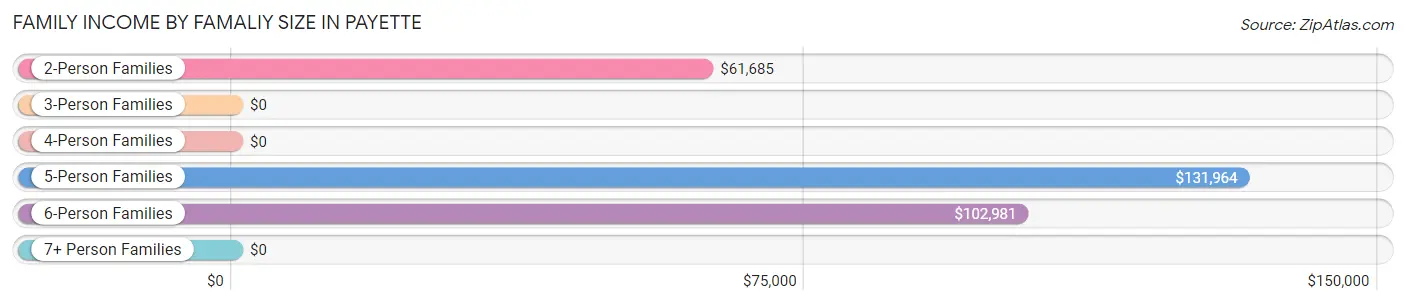
| Income Bracket | # Families | Median Income |
| 2-Person Families | 1,100 (53.3%) | $61,685 |
| 3-Person Families | 322 (15.6%) | $0 |
| 4-Person Families | 371 (18.0%) | $0 |
| 5-Person Families | 154 (7.5%) | $131,964 |
| 6-Person Families | 80 (3.9%) | $102,981 |
| 7+ Person Families | 38 (1.8%) | $0 |
| Total | 2,065 (100.0%) | $59,637 |
Family Income by Number of Earners in Payette
The median family income in Payette is $59,637, with families comprising 3+ earners (217) having the highest median family income of $136,567, while families with no earners (278) have the lowest median family income of $48,098, accounting for 10.5% and 13.5% of families, respectively.
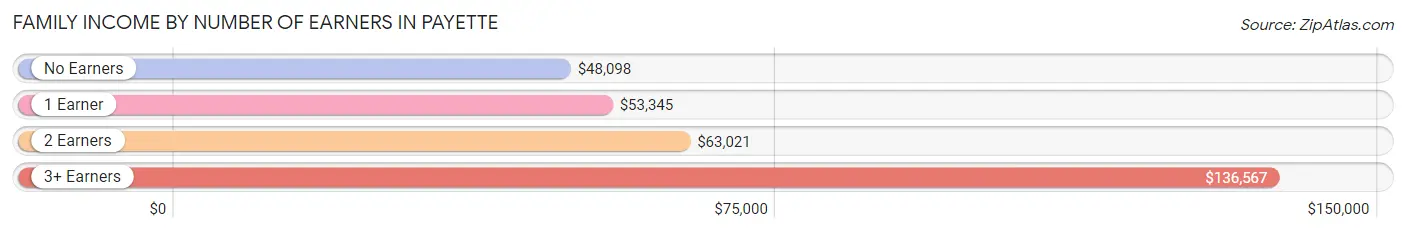
| Number of Earners | # Families | Median Income |
| No Earners | 278 (13.5%) | $48,098 |
| 1 Earner | 1,137 (55.1%) | $53,345 |
| 2 Earners | 433 (21.0%) | $63,021 |
| 3+ Earners | 217 (10.5%) | $136,567 |
| Total | 2,065 (100.0%) | $59,637 |
Household Income in Payette
Household Income Brackets in Payette
With 804 households falling in the category, the $50,000 to $74,999 income range is the most frequent in Payette, accounting for 27.0% of all households. In contrast, only 57 households (1.9%) fall into the $200,000+ income bracket, making it the least populous group.
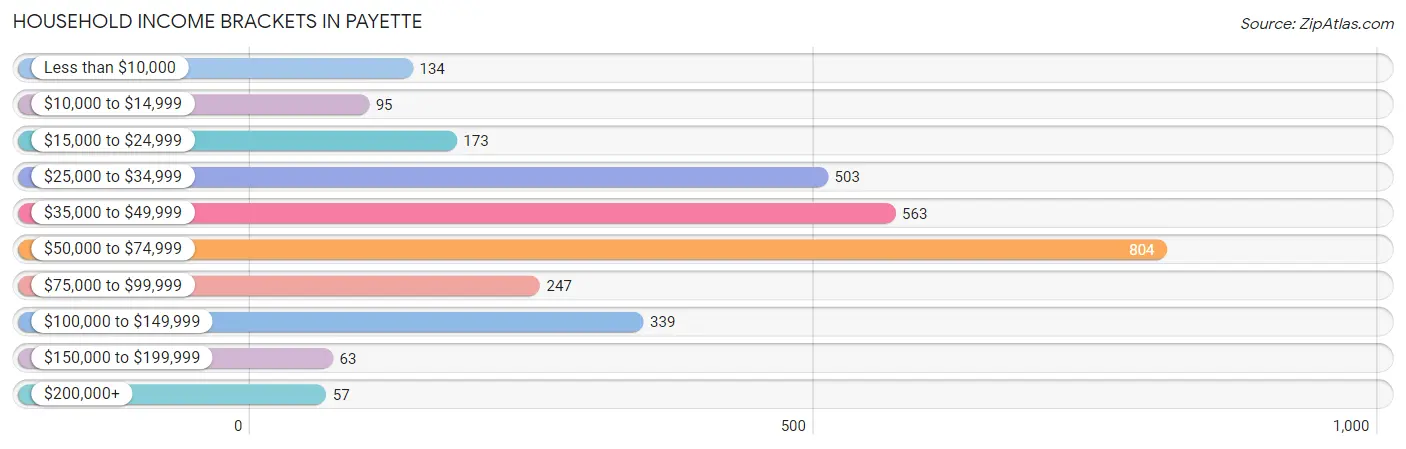
| Income Bracket | # Households | % Households |
| Less than $10,000 | 134 | 4.5% |
| $10,000 to $14,999 | 95 | 3.2% |
| $15,000 to $24,999 | 173 | 5.8% |
| $25,000 to $34,999 | 503 | 16.9% |
| $35,000 to $49,999 | 563 | 18.9% |
| $50,000 to $74,999 | 804 | 27.0% |
| $75,000 to $99,999 | 247 | 8.3% |
| $100,000 to $149,999 | 339 | 11.4% |
| $150,000 to $199,999 | 63 | 2.1% |
| $200,000+ | 57 | 1.9% |
Household Income by Householder Age in Payette
The median household income in Payette is $51,477, with the highest median household income of $61,458 found in the 45 to 64 years age bracket for the primary householder. A total of 803 households (27.0%) fall into this category. Meanwhile, the 15 to 24 years age bracket for the primary householder has the lowest median household income of $42,540, with 272 households (9.1%) in this group.
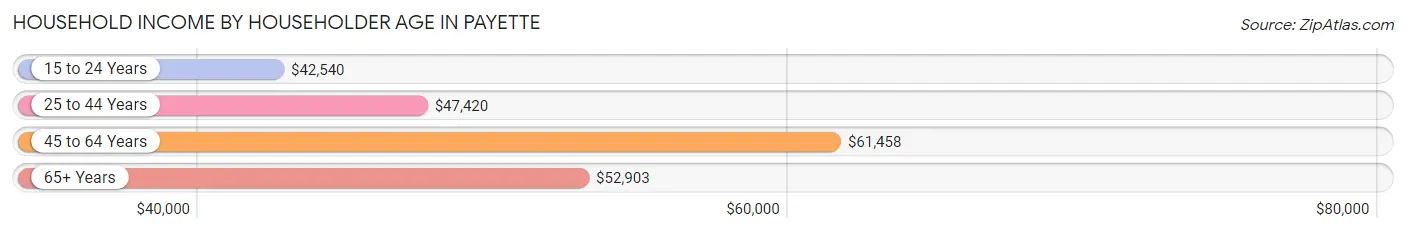
| Income Bracket | # Households | Median Income |
| 15 to 24 Years | 272 (9.1%) | $42,540 |
| 25 to 44 Years | 813 (27.3%) | $47,420 |
| 45 to 64 Years | 803 (27.0%) | $61,458 |
| 65+ Years | 1,089 (36.6%) | $52,903 |
| Total | 2,977 (100.0%) | $51,477 |
Poverty in Payette
Income Below Poverty by Sex and Age in Payette
With 11.5% poverty level for males and 16.4% for females among the residents of Payette, 55 to 64 year old males and 12 to 14 year old females are the most vulnerable to poverty, with 115 males (28.5%) and 52 females (92.9%) in their respective age groups living below the poverty level.
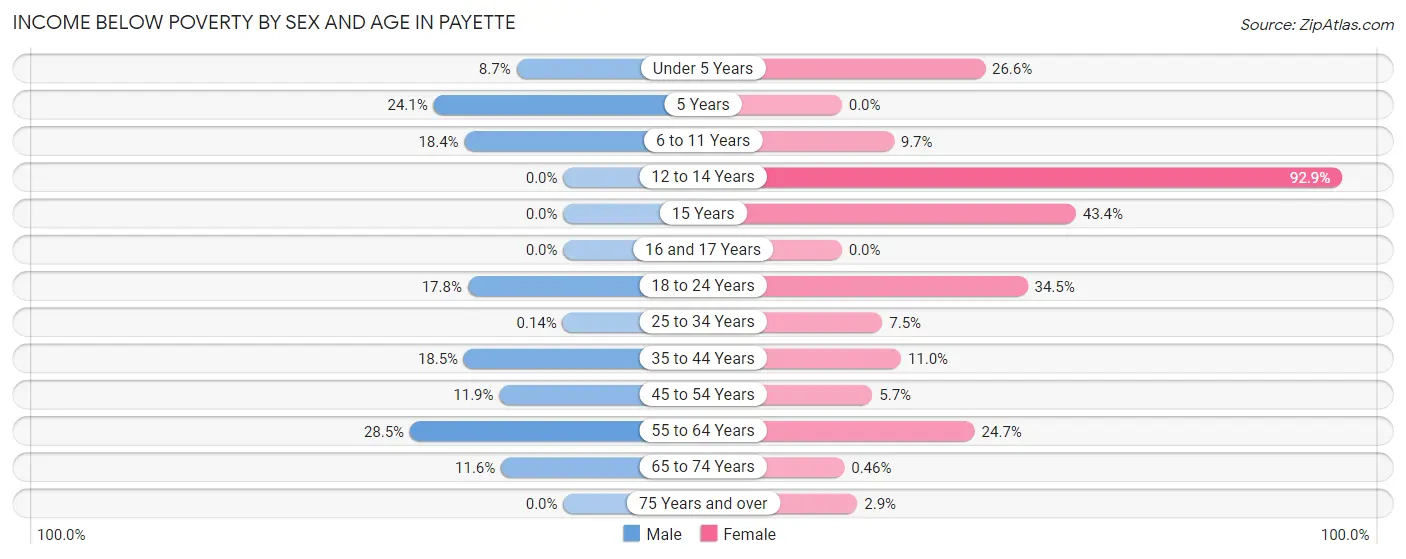
| Age Bracket | Male | Female |
| Under 5 Years | 14 (8.7%) | 171 (26.6%) |
| 5 Years | 20 (24.1%) | 0 (0.0%) |
| 6 to 11 Years | 65 (18.4%) | 36 (9.7%) |
| 12 to 14 Years | 0 (0.0%) | 52 (92.9%) |
| 15 Years | 0 (0.0%) | 43 (43.4%) |
| 16 and 17 Years | 0 (0.0%) | 0 (0.0%) |
| 18 to 24 Years | 41 (17.7%) | 151 (34.5%) |
| 25 to 34 Years | 1 (0.1%) | 54 (7.5%) |
| 35 to 44 Years | 57 (18.4%) | 28 (11.0%) |
| 45 to 54 Years | 65 (11.9%) | 20 (5.7%) |
| 55 to 64 Years | 115 (28.5%) | 128 (24.7%) |
| 65 to 74 Years | 58 (11.6%) | 2 (0.5%) |
| 75 Years and over | 0 (0.0%) | 10 (2.9%) |
| Total | 436 (11.5%) | 695 (16.4%) |
Income Above Poverty by Sex and Age in Payette
According to the poverty statistics in Payette, males aged 12 to 14 years and females aged 5 years are the age groups that are most secure financially, with 100.0% of males and 100.0% of females in these age groups living above the poverty line.
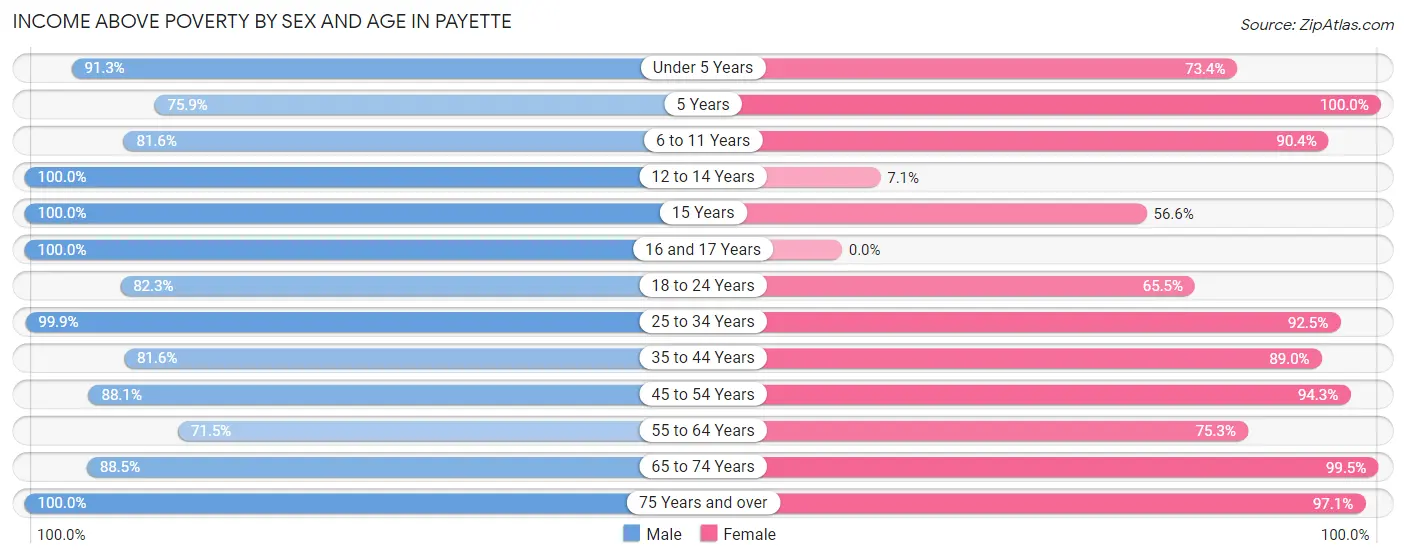
| Age Bracket | Male | Female |
| Under 5 Years | 147 (91.3%) | 472 (73.4%) |
| 5 Years | 63 (75.9%) | 9 (100.0%) |
| 6 to 11 Years | 289 (81.6%) | 337 (90.3%) |
| 12 to 14 Years | 87 (100.0%) | 4 (7.1%) |
| 15 Years | 74 (100.0%) | 56 (56.6%) |
| 16 and 17 Years | 49 (100.0%) | 0 (0.0%) |
| 18 to 24 Years | 190 (82.3%) | 287 (65.5%) |
| 25 to 34 Years | 700 (99.9%) | 664 (92.5%) |
| 35 to 44 Years | 252 (81.6%) | 227 (89.0%) |
| 45 to 54 Years | 482 (88.1%) | 333 (94.3%) |
| 55 to 64 Years | 289 (71.5%) | 391 (75.3%) |
| 65 to 74 Years | 444 (88.4%) | 433 (99.5%) |
| 75 Years and over | 282 (100.0%) | 336 (97.1%) |
| Total | 3,348 (88.5%) | 3,549 (83.6%) |
Income Below Poverty Among Married-Couple Families in Payette
The poverty statistics for married-couple families in Payette show that 1.8% or 28 of the total 1,568 families live below the poverty line. Families with 5 or more children have the highest poverty rate of 63.2%, comprising of 24 families. On the other hand, families with 1 or 2 children have the lowest poverty rate of 0.0%, which includes 0 families.
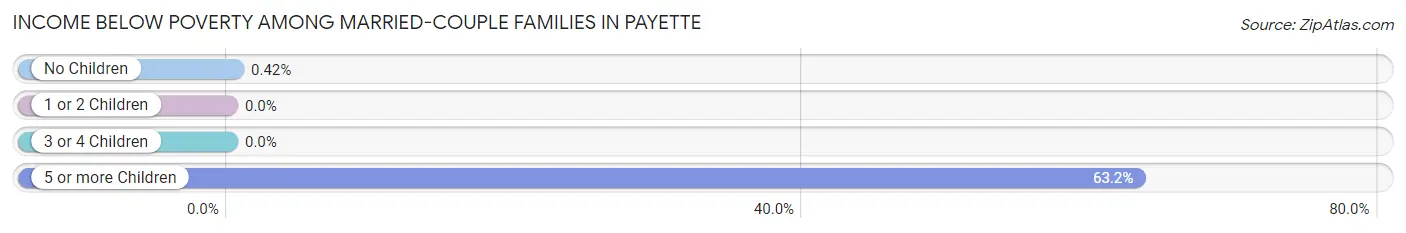
| Children | Above Poverty | Below Poverty |
| No Children | 950 (99.6%) | 4 (0.4%) |
| 1 or 2 Children | 458 (100.0%) | 0 (0.0%) |
| 3 or 4 Children | 118 (100.0%) | 0 (0.0%) |
| 5 or more Children | 14 (36.8%) | 24 (63.2%) |
| Total | 1,540 (98.2%) | 28 (1.8%) |
Income Below Poverty Among Single-Parent Households in Payette
According to the poverty data in Payette, 20.0% or 7 single-father households and 33.3% or 154 single-mother households are living below the poverty line. Among single-father households, those with no children have the highest poverty rate, with 7 households (77.8%) experiencing poverty. Likewise, among single-mother households, those with 1 or 2 children have the highest poverty rate, with 147 households (46.2%) falling below the poverty line.
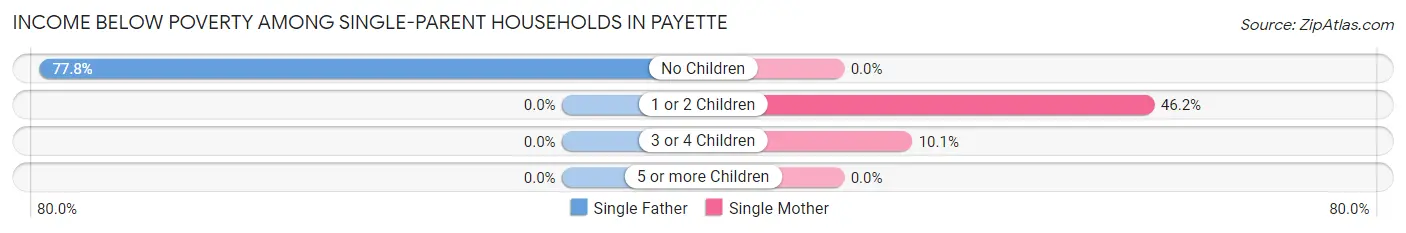
| Children | Single Father | Single Mother |
| No Children | 7 (77.8%) | 0 (0.0%) |
| 1 or 2 Children | 0 (0.0%) | 147 (46.2%) |
| 3 or 4 Children | 0 (0.0%) | 7 (10.1%) |
| 5 or more Children | 0 (0.0%) | 0 (0.0%) |
| Total | 7 (20.0%) | 154 (33.3%) |
Income Below Poverty Among Married-Couple vs Single-Parent Households in Payette
The poverty data for Payette shows that 28 of the married-couple family households (1.8%) and 161 of the single-parent households (32.4%) are living below the poverty level. Within the married-couple family households, those with 5 or more children have the highest poverty rate, with 24 households (63.2%) falling below the poverty line. Among the single-parent households, those with 1 or 2 children have the highest poverty rate, with 147 household (42.7%) living below poverty.
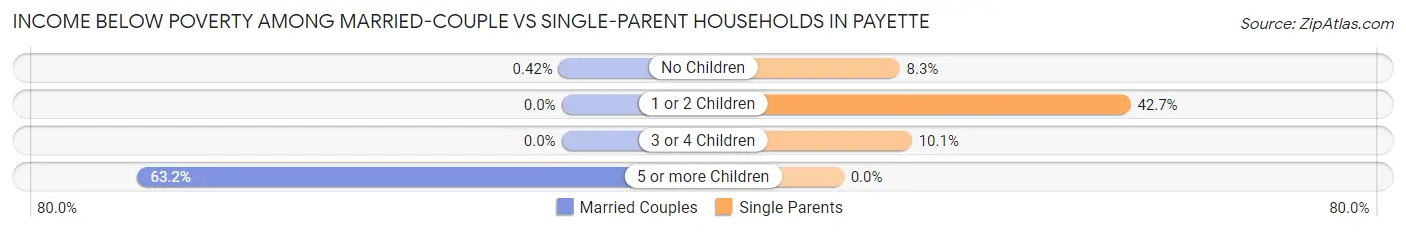
| Children | Married-Couple Families | Single-Parent Households |
| No Children | 4 (0.4%) | 7 (8.3%) |
| 1 or 2 Children | 0 (0.0%) | 147 (42.7%) |
| 3 or 4 Children | 0 (0.0%) | 7 (10.1%) |
| 5 or more Children | 24 (63.2%) | 0 (0.0%) |
| Total | 28 (1.8%) | 161 (32.4%) |
Race in Payette
The most populous races in Payette are White / Caucasian (6,416 | 78.4%), Hispanic or Latino (1,857 | 22.7%), and Two or more Races (1,089 | 13.3%).
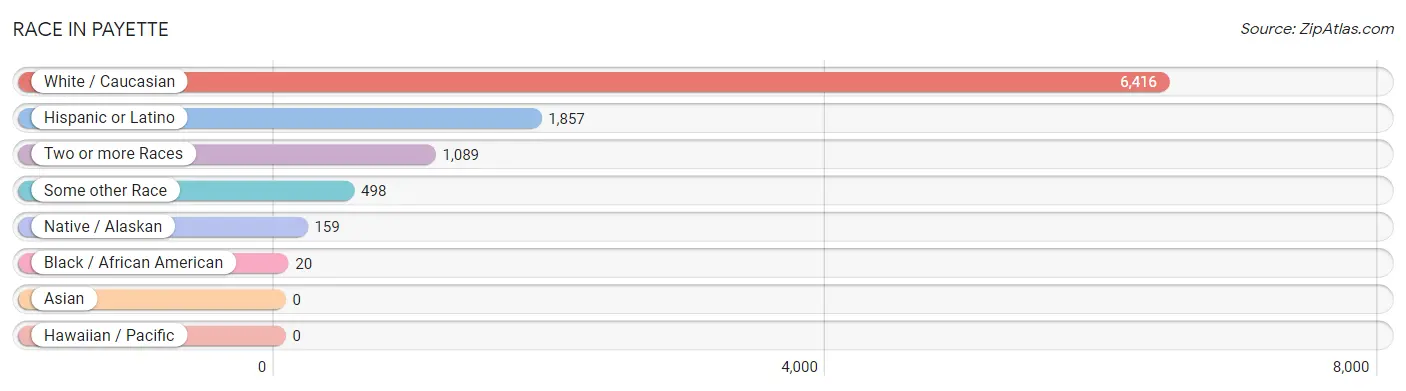
| Race | # Population | % Population |
| Asian | 0 | 0.0% |
| Black / African American | 20 | 0.2% |
| Hawaiian / Pacific | 0 | 0.0% |
| Hispanic or Latino | 1,857 | 22.7% |
| Native / Alaskan | 159 | 1.9% |
| White / Caucasian | 6,416 | 78.4% |
| Two or more Races | 1,089 | 13.3% |
| Some other Race | 498 | 6.1% |
| Total | 8,182 | 100.0% |
Ancestry in Payette
The most populous ancestries reported in Payette are Mexican (1,785 | 21.8%), German (1,034 | 12.6%), English (829 | 10.1%), American (726 | 8.9%), and Irish (464 | 5.7%), together accounting for 59.1% of all Payette residents.
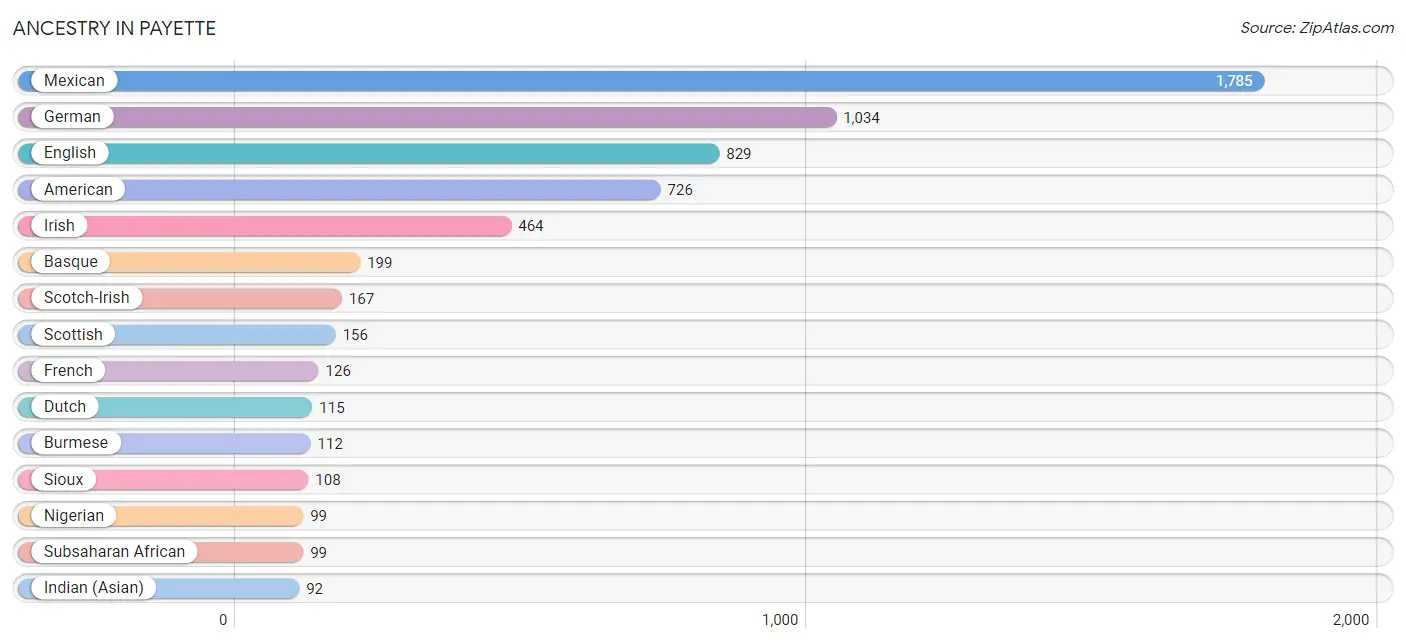
| Ancestry | # Population | % Population |
| American | 726 | 8.9% |
| Apache | 23 | 0.3% |
| Basque | 199 | 2.4% |
| Belgian | 13 | 0.2% |
| Bhutanese | 71 | 0.9% |
| British | 17 | 0.2% |
| Burmese | 112 | 1.4% |
| Celtic | 15 | 0.2% |
| Central American | 13 | 0.2% |
| Cherokee | 83 | 1.0% |
| Chickasaw | 4 | 0.1% |
| Chippewa | 22 | 0.3% |
| Costa Rican | 13 | 0.2% |
| Cree | 22 | 0.3% |
| Czech | 28 | 0.3% |
| Danish | 42 | 0.5% |
| Dutch | 115 | 1.4% |
| English | 829 | 10.1% |
| European | 58 | 0.7% |
| French | 126 | 1.5% |
| French Canadian | 15 | 0.2% |
| German | 1,034 | 12.6% |
| Hungarian | 1 | 0.0% |
| Icelander | 1 | 0.0% |
| Indian (Asian) | 92 | 1.1% |
| Irish | 464 | 5.7% |
| Italian | 12 | 0.2% |
| Lithuanian | 1 | 0.0% |
| Mexican | 1,785 | 21.8% |
| Mexican American Indian | 13 | 0.2% |
| Nigerian | 99 | 1.2% |
| Northern European | 9 | 0.1% |
| Norwegian | 70 | 0.9% |
| Polish | 40 | 0.5% |
| Portuguese | 3 | 0.0% |
| Pueblo | 5 | 0.1% |
| Scandinavian | 1 | 0.0% |
| Scotch-Irish | 167 | 2.0% |
| Scottish | 156 | 1.9% |
| Seminole | 27 | 0.3% |
| Sioux | 108 | 1.3% |
| Slavic | 23 | 0.3% |
| Spaniard | 52 | 0.6% |
| Spanish | 7 | 0.1% |
| Subsaharan African | 99 | 1.2% |
| Swedish | 89 | 1.1% |
| Swiss | 54 | 0.7% |
| Ukrainian | 1 | 0.0% |
| Welsh | 38 | 0.5% | View All 49 Rows |
Immigrants in Payette
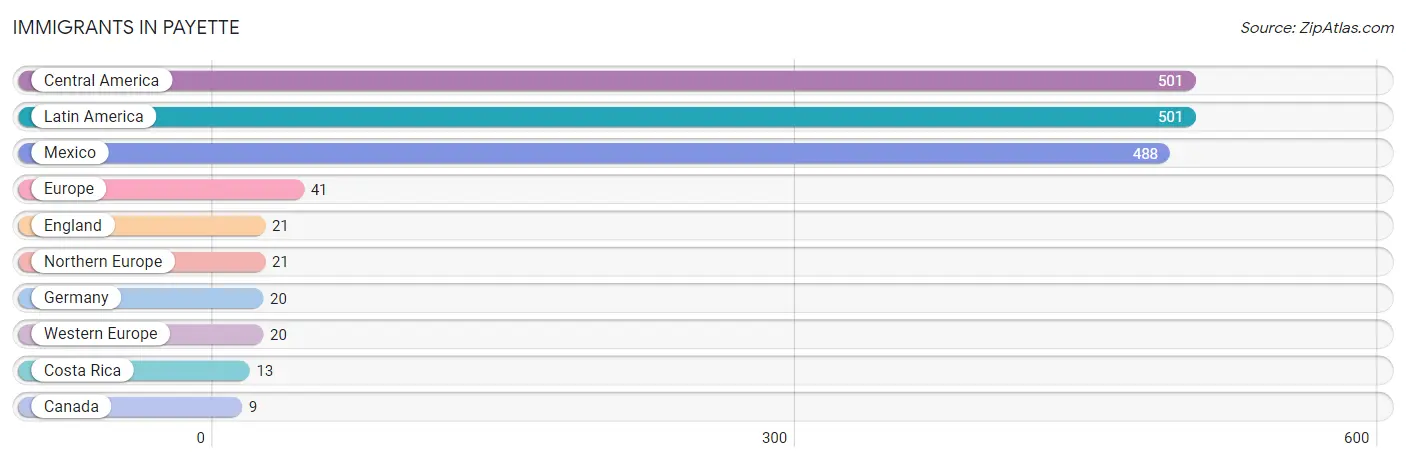
The most numerous immigrant groups reported in Payette came from Central America (501 | 6.1%), Latin America (501 | 6.1%), Mexico (488 | 6.0%), Europe (41 | 0.5%), and England (21 | 0.3%), together accounting for 19.0% of all Payette residents.
| Immigration Origin | # Population | % Population |
| Canada | 9 | 0.1% |
| Central America | 501 | 6.1% |
| Costa Rica | 13 | 0.2% |
| England | 21 | 0.3% |
| Europe | 41 | 0.5% |
| Germany | 20 | 0.2% |
| Latin America | 501 | 6.1% |
| Mexico | 488 | 6.0% |
| Northern Europe | 21 | 0.3% |
| Western Europe | 20 | 0.2% | View All 10 Rows |
Sex and Age in Payette
Sex and Age in Payette
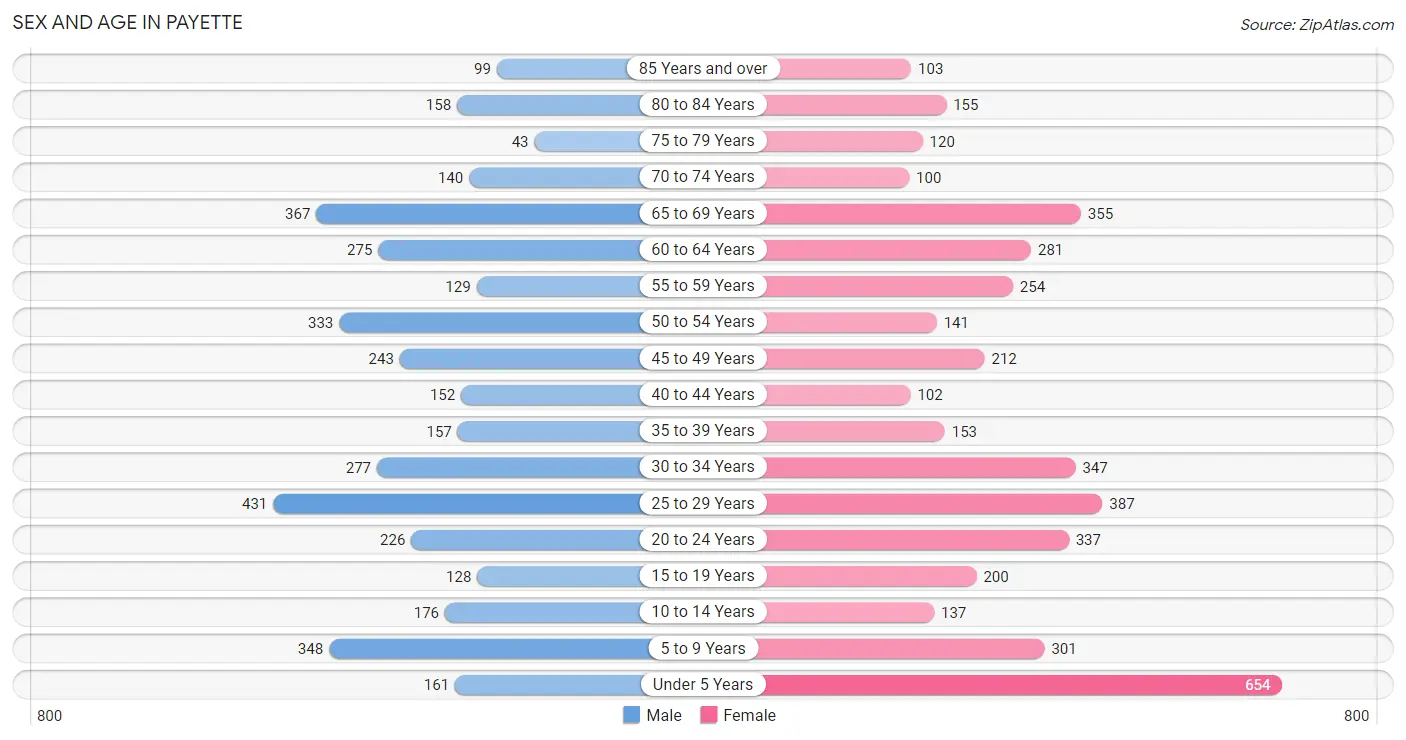
The most populous age groups in Payette are 25 to 29 Years (431 | 11.2%) for men and Under 5 Years (654 | 15.1%) for women.
| Age Bracket | Male | Female |
| Under 5 Years | 161 (4.2%) | 654 (15.1%) |
| 5 to 9 Years | 348 (9.1%) | 301 (6.9%) |
| 10 to 14 Years | 176 (4.6%) | 137 (3.2%) |
| 15 to 19 Years | 128 (3.3%) | 200 (4.6%) |
| 20 to 24 Years | 226 (5.9%) | 337 (7.8%) |
| 25 to 29 Years | 431 (11.2%) | 387 (8.9%) |
| 30 to 34 Years | 277 (7.2%) | 347 (8.0%) |
| 35 to 39 Years | 157 (4.1%) | 153 (3.5%) |
| 40 to 44 Years | 152 (4.0%) | 102 (2.4%) |
| 45 to 49 Years | 243 (6.3%) | 212 (4.9%) |
| 50 to 54 Years | 333 (8.7%) | 141 (3.3%) |
| 55 to 59 Years | 129 (3.4%) | 254 (5.9%) |
| 60 to 64 Years | 275 (7.2%) | 281 (6.5%) |
| 65 to 69 Years | 367 (9.6%) | 355 (8.2%) |
| 70 to 74 Years | 140 (3.6%) | 100 (2.3%) |
| 75 to 79 Years | 43 (1.1%) | 120 (2.8%) |
| 80 to 84 Years | 158 (4.1%) | 155 (3.6%) |
| 85 Years and over | 99 (2.6%) | 103 (2.4%) |
| Total | 3,843 (100.0%) | 4,339 (100.0%) |
Families and Households in Payette
Median Family Size in Payette
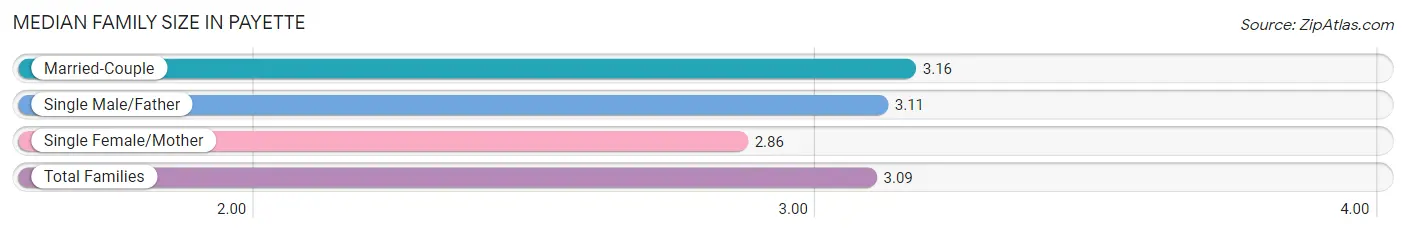
The median family size in Payette is 3.09 persons per family, with married-couple families (1,568 | 75.9%) accounting for the largest median family size of 3.16 persons per family. On the other hand, single female/mother families (462 | 22.4%) represent the smallest median family size with 2.86 persons per family.
| Family Type | # Families | Family Size |
| Married-Couple | 1,568 (75.9%) | 3.16 |
| Single Male/Father | 35 (1.7%) | 3.11 |
| Single Female/Mother | 462 (22.4%) | 2.86 |
| Total Families | 2,065 (100.0%) | 3.09 |
Median Household Size in Payette
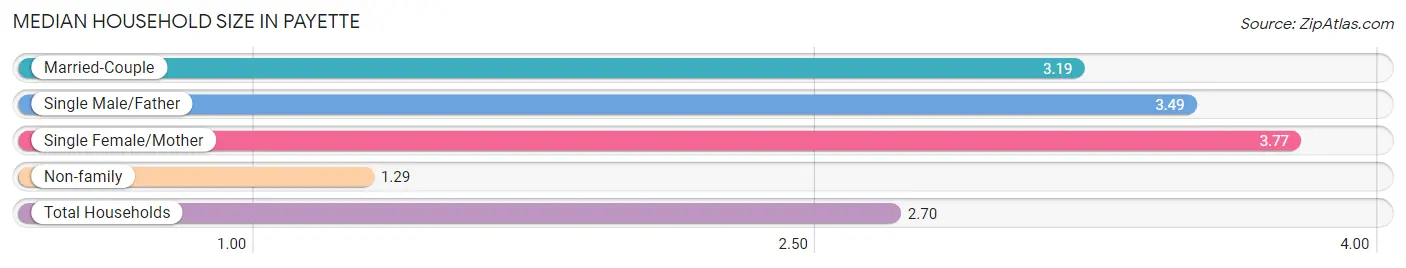
The median household size in Payette is 2.70 persons per household, with single female/mother households (462 | 15.5%) accounting for the largest median household size of 3.77 persons per household. non-family households (912 | 30.6%) represent the smallest median household size with 1.29 persons per household.
| Household Type | # Households | Household Size |
| Married-Couple | 1,568 (52.7%) | 3.19 |
| Single Male/Father | 35 (1.2%) | 3.49 |
| Single Female/Mother | 462 (15.5%) | 3.77 |
| Non-family | 912 (30.6%) | 1.29 |
| Total Households | 2,977 (100.0%) | 2.70 |
Household Size by Marriage Status in Payette
Out of a total of 2,977 households in Payette, 2,065 (69.4%) are family households, while 912 (30.6%) are nonfamily households. The most numerous type of family households are 2-person households, comprising 981, and the most common type of nonfamily households are 1-person households, comprising 757.
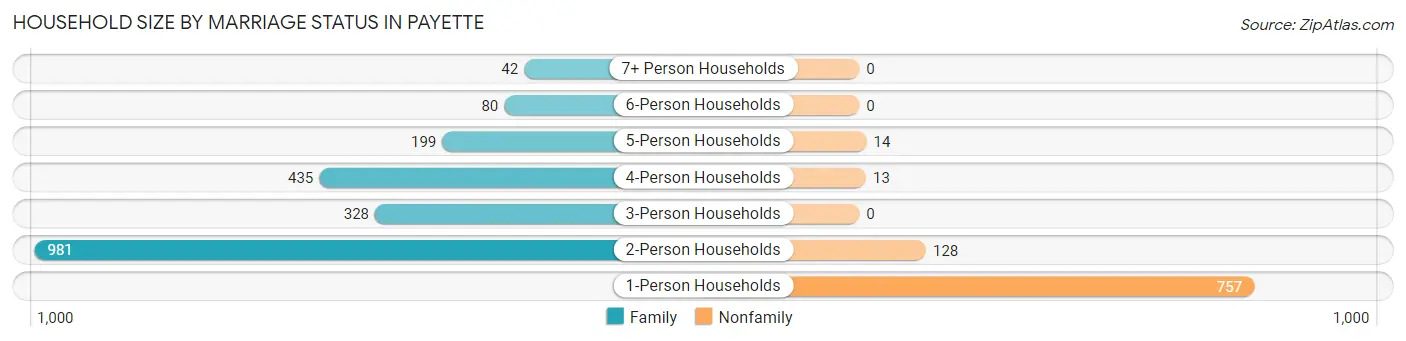
| Household Size | Family Households | Nonfamily Households |
| 1-Person Households | - | 757 (25.4%) |
| 2-Person Households | 981 (33.0%) | 128 (4.3%) |
| 3-Person Households | 328 (11.0%) | 0 (0.0%) |
| 4-Person Households | 435 (14.6%) | 13 (0.4%) |
| 5-Person Households | 199 (6.7%) | 14 (0.5%) |
| 6-Person Households | 80 (2.7%) | 0 (0.0%) |
| 7+ Person Households | 42 (1.4%) | 0 (0.0%) |
| Total | 2,065 (69.4%) | 912 (30.6%) |
Female Fertility in Payette
Fertility by Age in Payette
Average fertility rate in Payette is 79.0 births per 1,000 women. Women in the age bracket of 15 to 19 years have the highest fertility rate with 300.0 births per 1,000 women. Women in the age bracket of 20 to 34 years acount for 56.5% of all women with births.
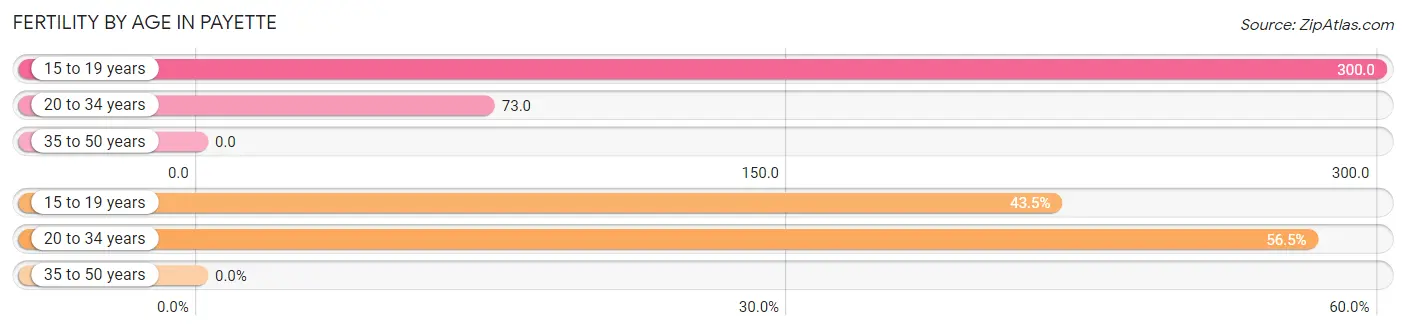
| Age Bracket | Women with Births | Births / 1,000 Women |
| 15 to 19 years | 60 (43.5%) | 300.0 |
| 20 to 34 years | 78 (56.5%) | 73.0 |
| 35 to 50 years | 0 (0.0%) | 0.0 |
| Total | 138 (100.0%) | 79.0 |
Fertility by Age by Marriage Status in Payette
33.3% of women with births (138) in Payette are married. The highest percentage of unmarried women with births falls into 15 to 19 years age bracket with 100.0% of them unmarried at the time of birth, while the lowest percentage of unmarried women with births belong to 20 to 34 years age bracket with 41.0% of them unmarried.
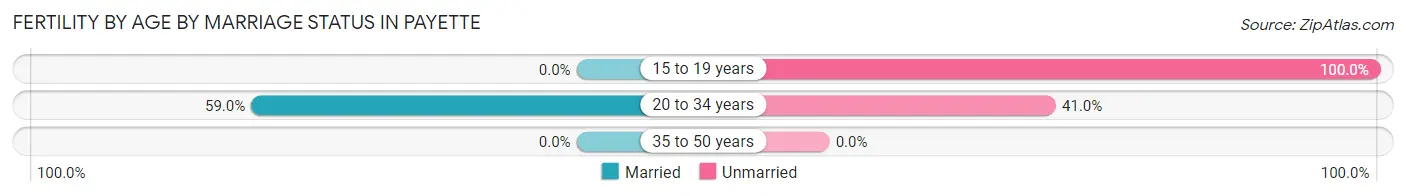
| Age Bracket | Married | Unmarried |
| 15 to 19 years | 0 (0.0%) | 60 (100.0%) |
| 20 to 34 years | 46 (59.0%) | 32 (41.0%) |
| 35 to 50 years | 0 (0.0%) | 0 (0.0%) |
| Total | 46 (33.3%) | 92 (66.7%) |
Fertility by Education in Payette
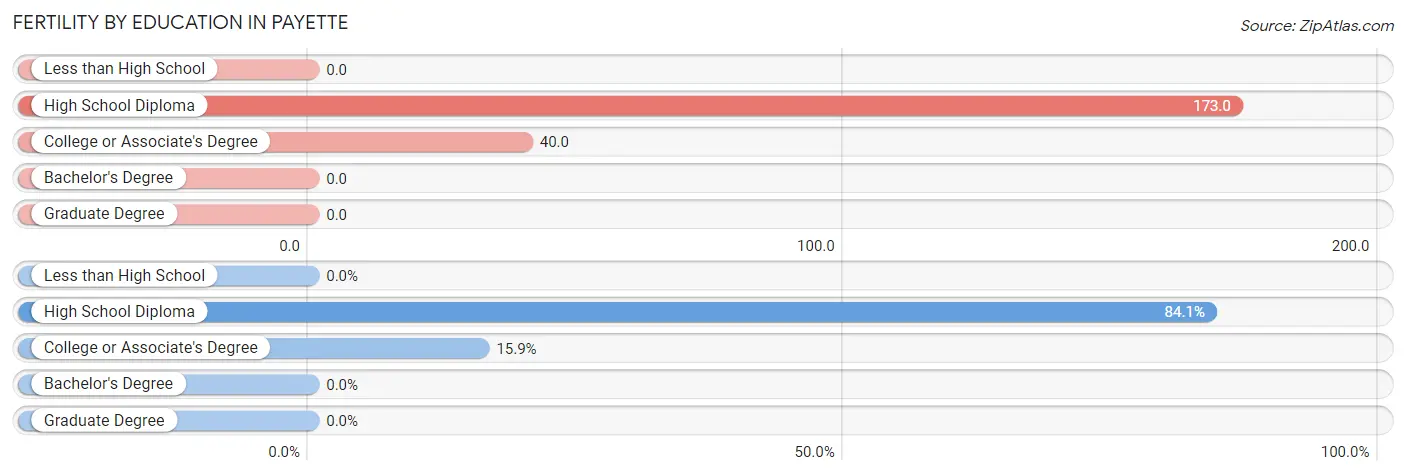
| Educational Attainment | Women with Births | Births / 1,000 Women |
| Less than High School | 0 (0.0%) | 0.0 |
| High School Diploma | 116 (84.1%) | 173.0 |
| College or Associate's Degree | 22 (15.9%) | 40.0 |
| Bachelor's Degree | 0 (0.0%) | 0.0 |
| Graduate Degree | 0 (0.0%) | 0.0 |
| Total | 138 (100.0%) | 79.0 |
Fertility by Education by Marriage Status in Payette
66.7% of women with births in Payette are unmarried. Women with the educational attainment of college or associate's degree are most likely to be married with 100.0% of them married at childbirth, while women with the educational attainment of high school diploma are least likely to be married with 79.3% of them unmarried at childbirth.
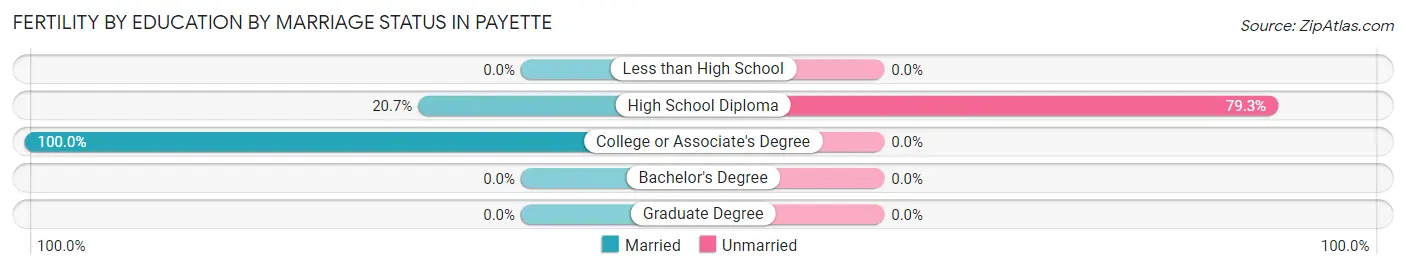
| Educational Attainment | Married | Unmarried |
| Less than High School | 0 (0.0%) | 0 (0.0%) |
| High School Diploma | 24 (20.7%) | 92 (79.3%) |
| College or Associate's Degree | 22 (100.0%) | 0 (0.0%) |
| Bachelor's Degree | 0 (0.0%) | 0 (0.0%) |
| Graduate Degree | 0 (0.0%) | 0 (0.0%) |
| Total | 46 (33.3%) | 92 (66.7%) |
Employment Characteristics in Payette
Employment by Class of Employer in Payette
Among the 3,211 employed individuals in Payette, private company employees (2,306 | 71.8%), local government employees (206 | 6.4%), and not-for-profit organizations (192 | 6.0%) make up the most common classes of employment.
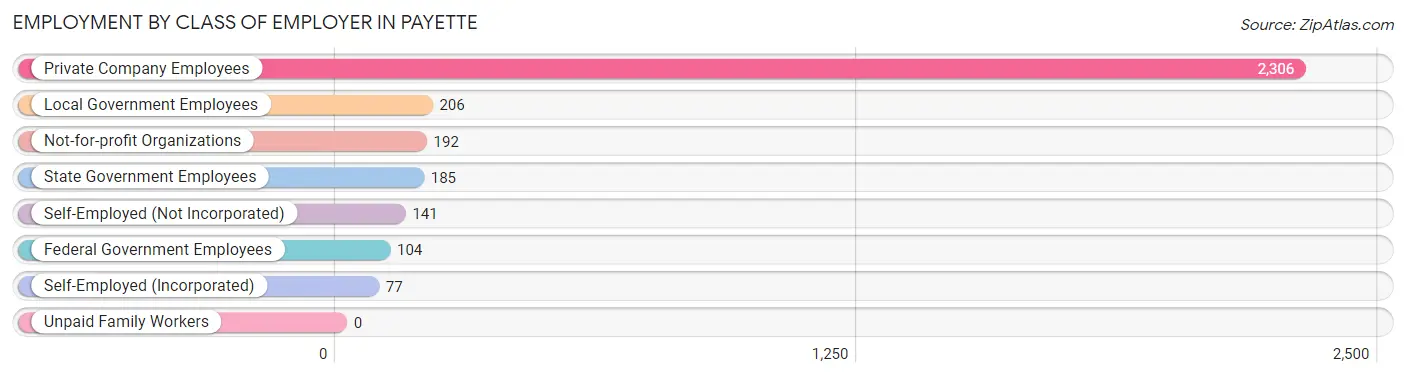
| Employer Class | # Employees | % Employees |
| Private Company Employees | 2,306 | 71.8% |
| Self-Employed (Incorporated) | 77 | 2.4% |
| Self-Employed (Not Incorporated) | 141 | 4.4% |
| Not-for-profit Organizations | 192 | 6.0% |
| Local Government Employees | 206 | 6.4% |
| State Government Employees | 185 | 5.8% |
| Federal Government Employees | 104 | 3.2% |
| Unpaid Family Workers | 0 | 0.0% |
| Total | 3,211 | 100.0% |
Employment Status by Age in Payette
According to the labor force statistics for Payette, out of the total population over 16 years of age (6,232), 56.2% or 3,502 individuals are in the labor force, with 7.2% or 252 of them unemployed. The age group with the highest labor force participation rate is 20 to 24 years, with 86.3% or 486 individuals in the labor force. Within the labor force, the 65 to 74 years age range has the highest percentage of unemployed individuals, with 33.3% or 102 of them being unemployed.
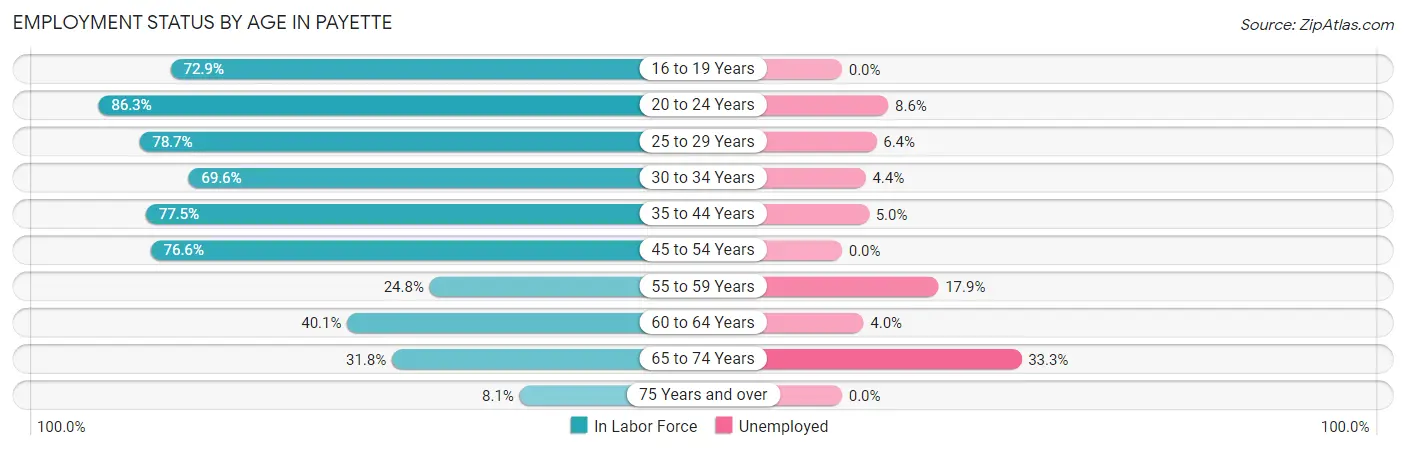
| Age Bracket | In Labor Force | Unemployed |
| 16 to 19 Years | 113 (72.9%) | 0 (0.0%) |
| 20 to 24 Years | 486 (86.3%) | 42 (8.6%) |
| 25 to 29 Years | 644 (78.7%) | 41 (6.4%) |
| 30 to 34 Years | 434 (69.6%) | 19 (4.4%) |
| 35 to 44 Years | 437 (77.5%) | 22 (5.0%) |
| 45 to 54 Years | 712 (76.6%) | 0 (0.0%) |
| 55 to 59 Years | 95 (24.8%) | 17 (17.9%) |
| 60 to 64 Years | 223 (40.1%) | 9 (4.0%) |
| 65 to 74 Years | 306 (31.8%) | 102 (33.3%) |
| 75 Years and over | 55 (8.1%) | 0 (0.0%) |
| Total | 3,502 (56.2%) | 252 (7.2%) |
Employment Status by Educational Attainment in Payette
According to labor force statistics for Payette, 65.7% of individuals (2,545) out of the total population between 25 and 64 years of age (3,874) are in the labor force, with 4.2% or 107 of them being unemployed. The group with the highest labor force participation rate are those with the educational attainment of college / associate degree, with 82.5% or 812 individuals in the labor force. Within the labor force, individuals with college / associate degree education have the highest percentage of unemployment, with 8.3% or 67 of them being unemployed.
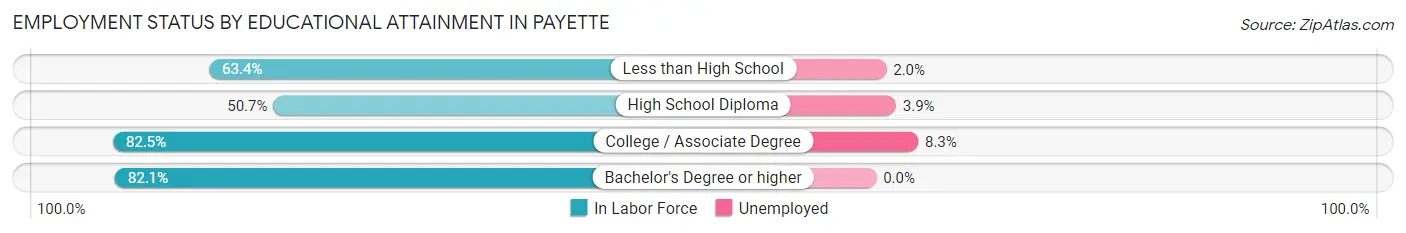
| Educational Attainment | In Labor Force | Unemployed |
| Less than High School | 451 (63.4%) | 14 (2.0%) |
| High School Diploma | 819 (50.7%) | 63 (3.9%) |
| College / Associate Degree | 812 (82.5%) | 82 (8.3%) |
| Bachelor's Degree or higher | 462 (82.1%) | 0 (0.0%) |
| Total | 2,545 (65.7%) | 163 (4.2%) |
Employment Occupations by Sex in Payette
Management, Business, Science and Arts Occupations
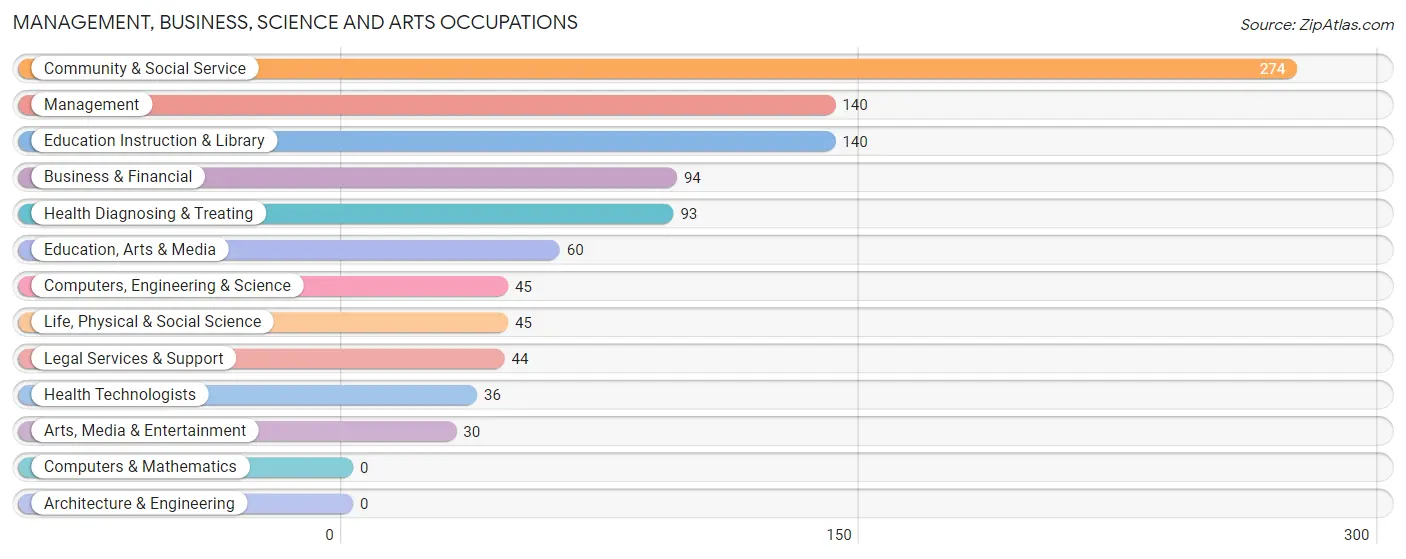
The most common Management, Business, Science and Arts occupations in Payette are Community & Social Service (274 | 8.4%), Management (140 | 4.3%), Education Instruction & Library (140 | 4.3%), Business & Financial (94 | 2.9%), and Health Diagnosing & Treating (93 | 2.9%).
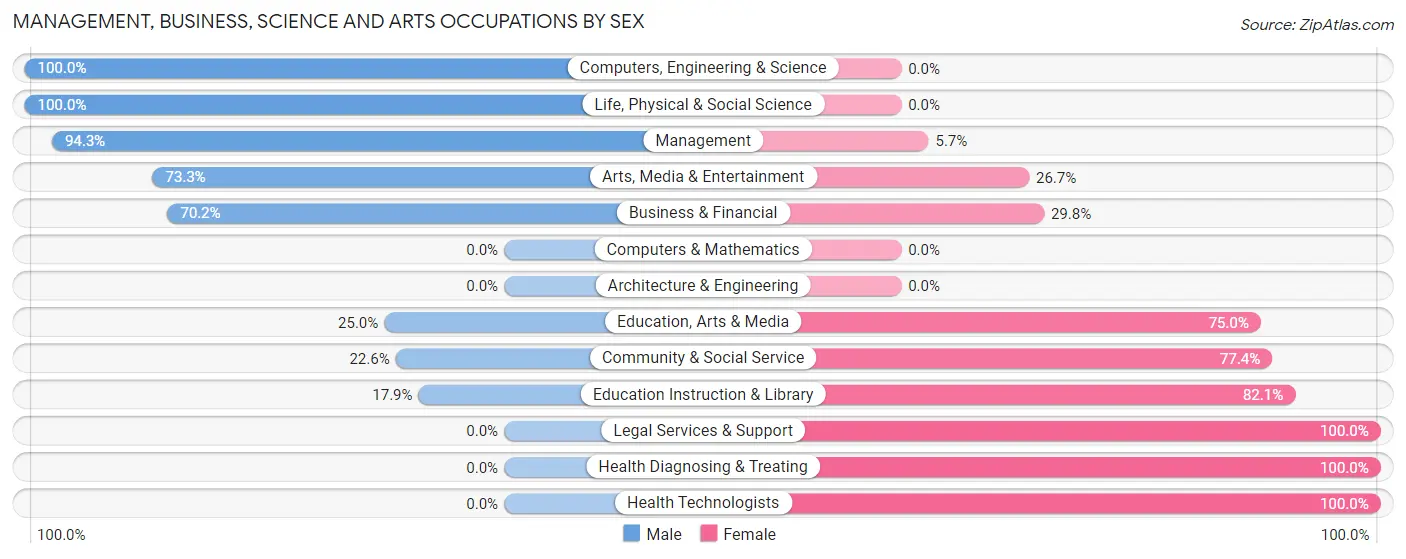
Management, Business, Science and Arts Occupations by Sex
Within the Management, Business, Science and Arts occupations in Payette, the most male-oriented occupations are Computers, Engineering & Science (100.0%), Life, Physical & Social Science (100.0%), and Management (94.3%), while the most female-oriented occupations are Legal Services & Support (100.0%), Health Diagnosing & Treating (100.0%), and Health Technologists (100.0%).
| Occupation | Male | Female |
| Management | 132 (94.3%) | 8 (5.7%) |
| Business & Financial | 66 (70.2%) | 28 (29.8%) |
| Computers, Engineering & Science | 45 (100.0%) | 0 (0.0%) |
| Computers & Mathematics | 0 (0.0%) | 0 (0.0%) |
| Architecture & Engineering | 0 (0.0%) | 0 (0.0%) |
| Life, Physical & Social Science | 45 (100.0%) | 0 (0.0%) |
| Community & Social Service | 62 (22.6%) | 212 (77.4%) |
| Education, Arts & Media | 15 (25.0%) | 45 (75.0%) |
| Legal Services & Support | 0 (0.0%) | 44 (100.0%) |
| Education Instruction & Library | 25 (17.9%) | 115 (82.1%) |
| Arts, Media & Entertainment | 22 (73.3%) | 8 (26.7%) |
| Health Diagnosing & Treating | 0 (0.0%) | 93 (100.0%) |
| Health Technologists | 0 (0.0%) | 36 (100.0%) |
| Total (Category) | 305 (47.2%) | 341 (52.8%) |
| Total (Overall) | 1,856 (57.1%) | 1,397 (42.9%) |
Services Occupations
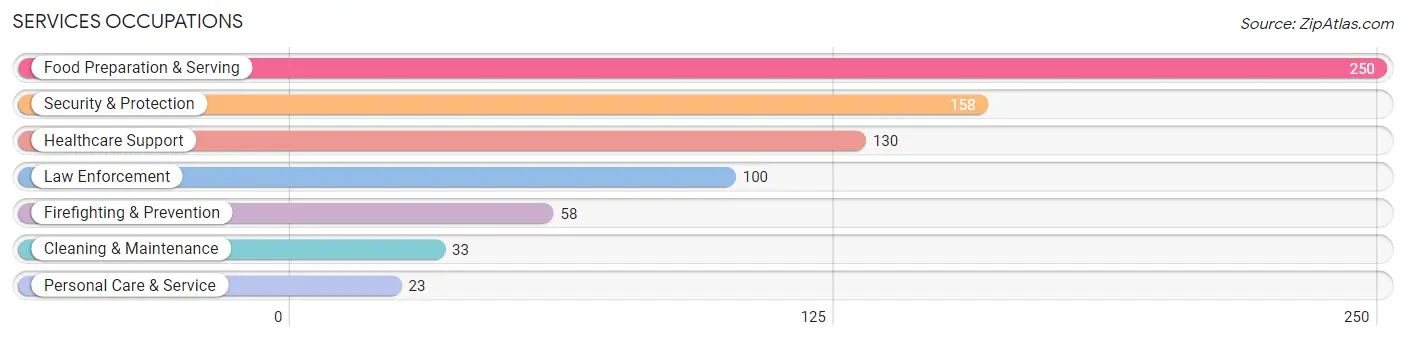
The most common Services occupations in Payette are Food Preparation & Serving (250 | 7.7%), Security & Protection (158 | 4.9%), Healthcare Support (130 | 4.0%), Law Enforcement (100 | 3.1%), and Firefighting & Prevention (58 | 1.8%).
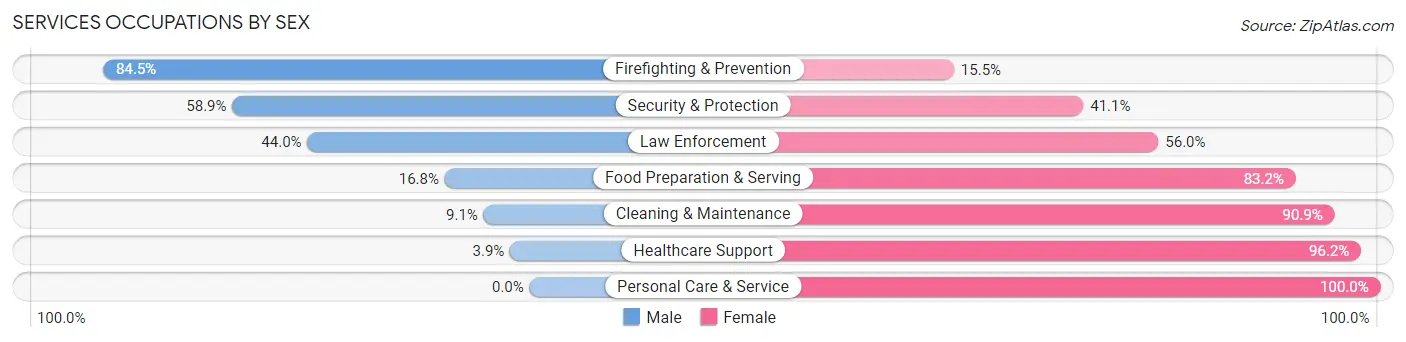
Services Occupations by Sex
Within the Services occupations in Payette, the most male-oriented occupations are Firefighting & Prevention (84.5%), Security & Protection (58.9%), and Law Enforcement (44.0%), while the most female-oriented occupations are Personal Care & Service (100.0%), Healthcare Support (96.2%), and Cleaning & Maintenance (90.9%).
| Occupation | Male | Female |
| Healthcare Support | 5 (3.8%) | 125 (96.2%) |
| Security & Protection | 93 (58.9%) | 65 (41.1%) |
| Firefighting & Prevention | 49 (84.5%) | 9 (15.5%) |
| Law Enforcement | 44 (44.0%) | 56 (56.0%) |
| Food Preparation & Serving | 42 (16.8%) | 208 (83.2%) |
| Cleaning & Maintenance | 3 (9.1%) | 30 (90.9%) |
| Personal Care & Service | 0 (0.0%) | 23 (100.0%) |
| Total (Category) | 143 (24.1%) | 451 (75.9%) |
| Total (Overall) | 1,856 (57.1%) | 1,397 (42.9%) |
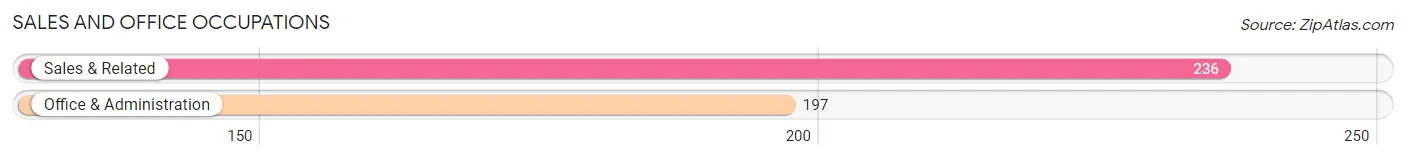
Sales and Office Occupations
The most common Sales and Office occupations in Payette are Sales & Related (236 | 7.2%), and Office & Administration (197 | 6.1%).
Sales and Office Occupations by Sex
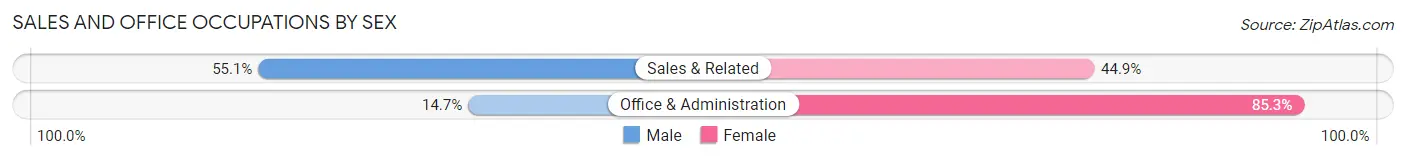
| Occupation | Male | Female |
| Sales & Related | 130 (55.1%) | 106 (44.9%) |
| Office & Administration | 29 (14.7%) | 168 (85.3%) |
| Total (Category) | 159 (36.7%) | 274 (63.3%) |
| Total (Overall) | 1,856 (57.1%) | 1,397 (42.9%) |
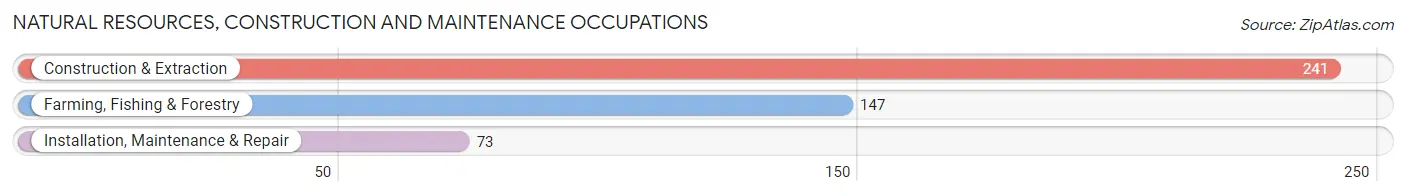
Natural Resources, Construction and Maintenance Occupations
The most common Natural Resources, Construction and Maintenance occupations in Payette are Construction & Extraction (241 | 7.4%), Farming, Fishing & Forestry (147 | 4.5%), and Installation, Maintenance & Repair (73 | 2.2%).
Natural Resources, Construction and Maintenance Occupations by Sex
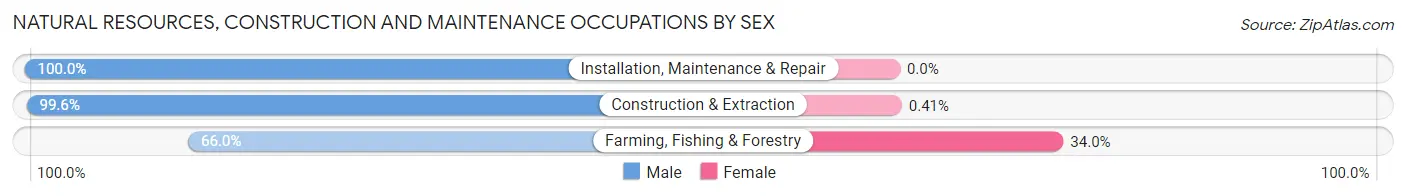
| Occupation | Male | Female |
| Farming, Fishing & Forestry | 97 (66.0%) | 50 (34.0%) |
| Construction & Extraction | 240 (99.6%) | 1 (0.4%) |
| Installation, Maintenance & Repair | 73 (100.0%) | 0 (0.0%) |
| Total (Category) | 410 (88.9%) | 51 (11.1%) |
| Total (Overall) | 1,856 (57.1%) | 1,397 (42.9%) |
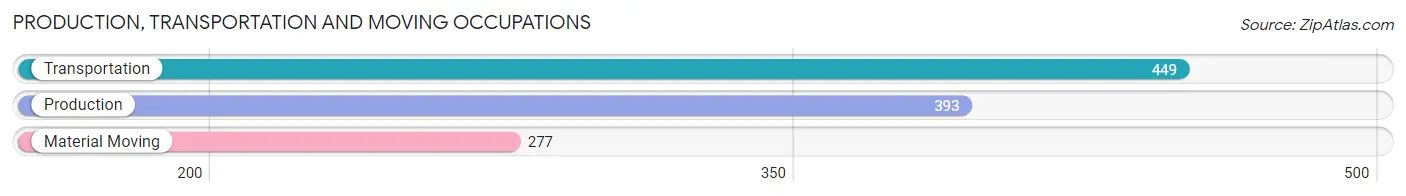
Production, Transportation and Moving Occupations
The most common Production, Transportation and Moving occupations in Payette are Transportation (449 | 13.8%), Production (393 | 12.1%), and Material Moving (277 | 8.5%).
Production, Transportation and Moving Occupations by Sex
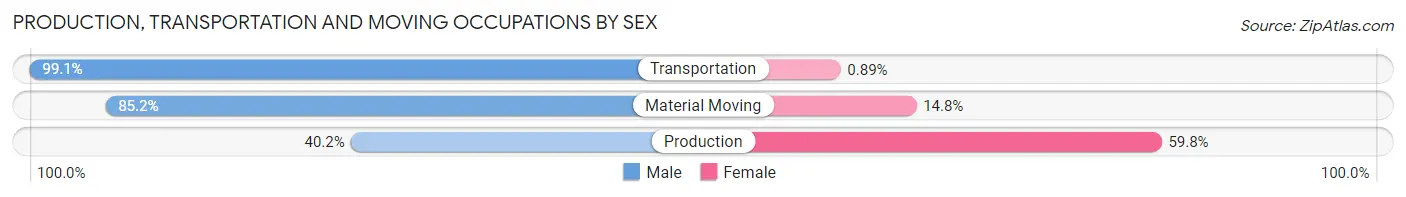
| Occupation | Male | Female |
| Production | 158 (40.2%) | 235 (59.8%) |
| Transportation | 445 (99.1%) | 4 (0.9%) |
| Material Moving | 236 (85.2%) | 41 (14.8%) |
| Total (Category) | 839 (75.0%) | 280 (25.0%) |
| Total (Overall) | 1,856 (57.1%) | 1,397 (42.9%) |
Employment Industries by Sex in Payette
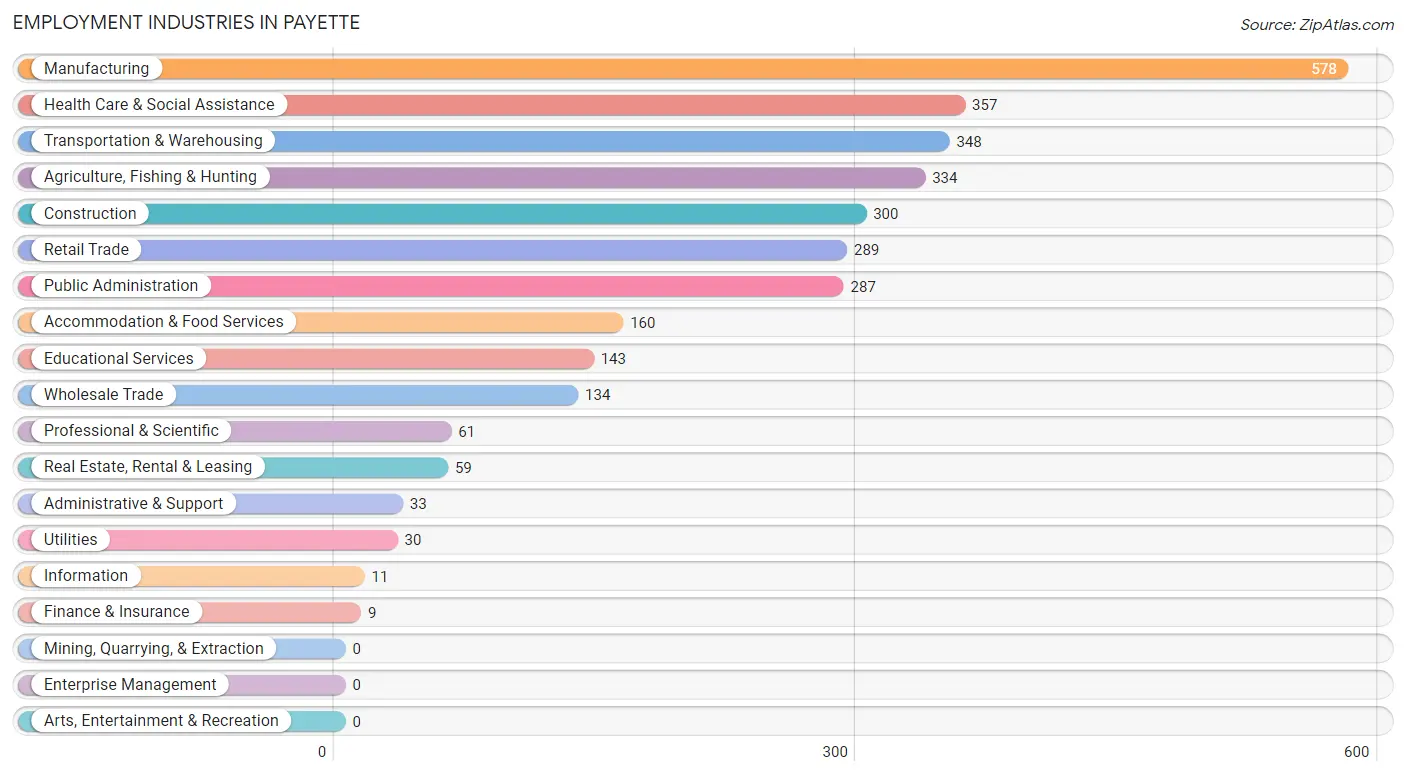
Employment Industries in Payette
The major employment industries in Payette include Manufacturing (578 | 17.8%), Health Care & Social Assistance (357 | 11.0%), Transportation & Warehousing (348 | 10.7%), Agriculture, Fishing & Hunting (334 | 10.3%), and Construction (300 | 9.2%).
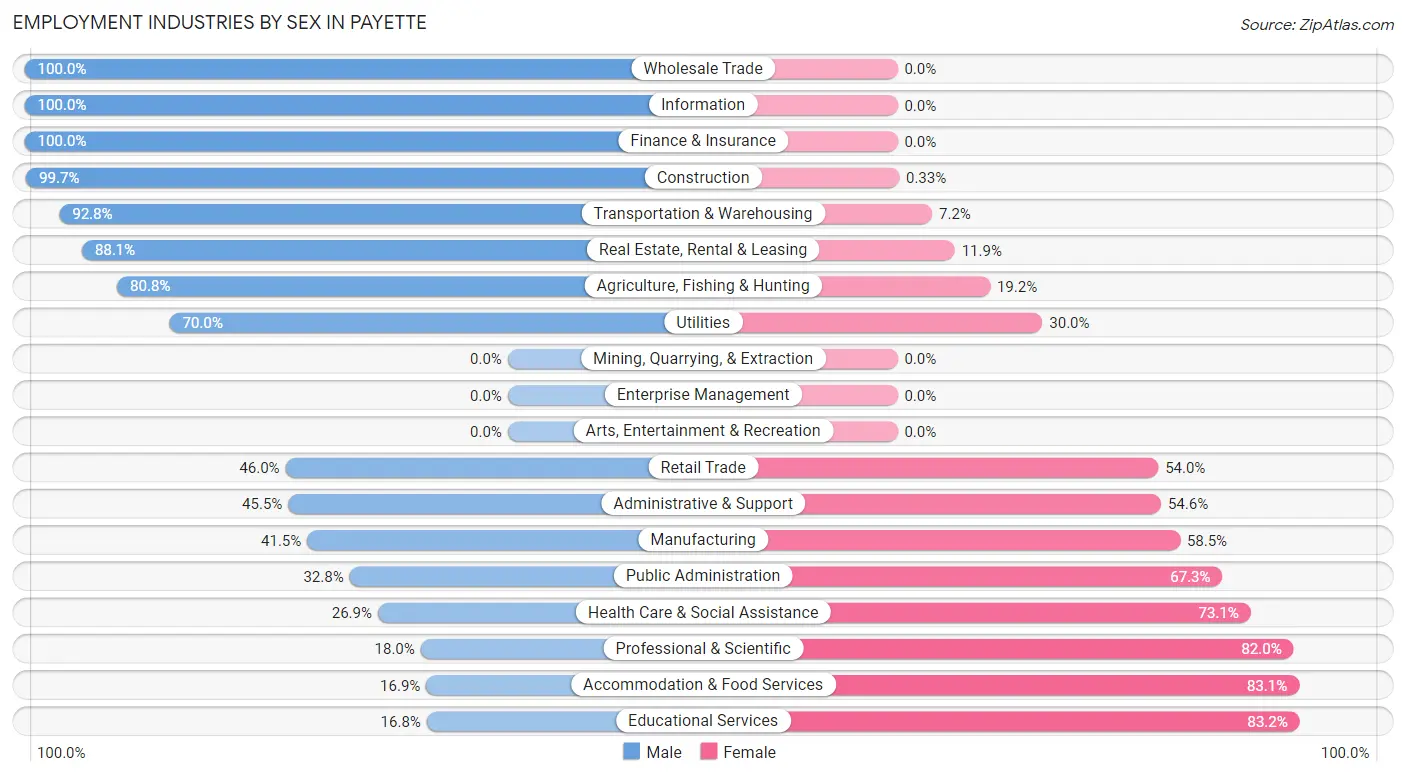
Employment Industries by Sex in Payette
The Payette industries that see more men than women are Wholesale Trade (100.0%), Information (100.0%), and Finance & Insurance (100.0%), whereas the industries that tend to have a higher number of women are Educational Services (83.2%), Accommodation & Food Services (83.1%), and Professional & Scientific (82.0%).
| Industry | Male | Female |
| Agriculture, Fishing & Hunting | 270 (80.8%) | 64 (19.2%) |
| Mining, Quarrying, & Extraction | 0 (0.0%) | 0 (0.0%) |
| Construction | 299 (99.7%) | 1 (0.3%) |
| Manufacturing | 240 (41.5%) | 338 (58.5%) |
| Wholesale Trade | 134 (100.0%) | 0 (0.0%) |
| Retail Trade | 133 (46.0%) | 156 (54.0%) |
| Transportation & Warehousing | 323 (92.8%) | 25 (7.2%) |
| Utilities | 21 (70.0%) | 9 (30.0%) |
| Information | 11 (100.0%) | 0 (0.0%) |
| Finance & Insurance | 9 (100.0%) | 0 (0.0%) |
| Real Estate, Rental & Leasing | 52 (88.1%) | 7 (11.9%) |
| Professional & Scientific | 11 (18.0%) | 50 (82.0%) |
| Enterprise Management | 0 (0.0%) | 0 (0.0%) |
| Administrative & Support | 15 (45.5%) | 18 (54.5%) |
| Educational Services | 24 (16.8%) | 119 (83.2%) |
| Health Care & Social Assistance | 96 (26.9%) | 261 (73.1%) |
| Arts, Entertainment & Recreation | 0 (0.0%) | 0 (0.0%) |
| Accommodation & Food Services | 27 (16.9%) | 133 (83.1%) |
| Public Administration | 94 (32.8%) | 193 (67.2%) |
| Total | 1,856 (57.1%) | 1,397 (42.9%) |
Education in Payette
School Enrollment in Payette
The most common levels of schooling among the 1,488 students in Payette are elementary school (368 | 24.7%), high school (298 | 20.0%), and middle school (257 | 17.3%).
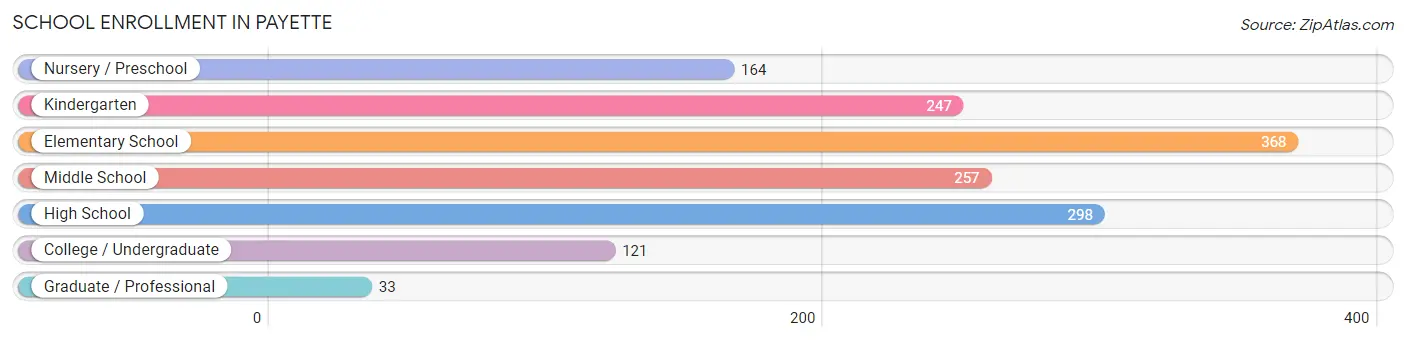
| School Level | # Students | % Students |
| Nursery / Preschool | 164 | 11.0% |
| Kindergarten | 247 | 16.6% |
| Elementary School | 368 | 24.7% |
| Middle School | 257 | 17.3% |
| High School | 298 | 20.0% |
| College / Undergraduate | 121 | 8.1% |
| Graduate / Professional | 33 | 2.2% |
| Total | 1,488 | 100.0% |
School Enrollment by Age by Funding Source in Payette
Out of a total of 1,488 students who are enrolled in schools in Payette, 243 (16.3%) attend a private institution, while the remaining 1,245 (83.7%) are enrolled in public schools. The age group of 3 to 4 year olds has the highest likelihood of being enrolled in private schools, with 74 (66.1% in the age bracket) enrolled. Conversely, the age group of 10 to 14 year olds has the lowest likelihood of being enrolled in a private school, with 296 (94.6% in the age bracket) attending a public institution.
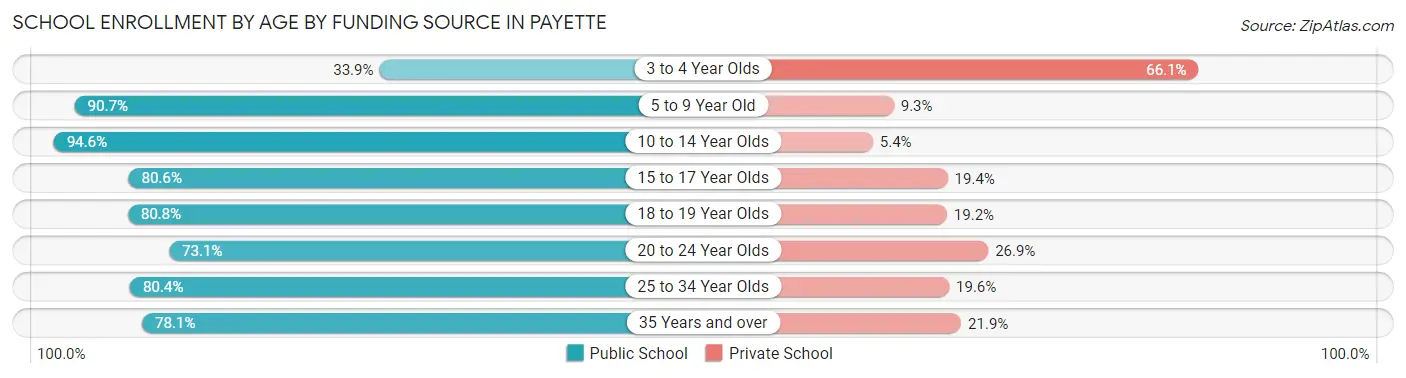
| Age Bracket | Public School | Private School |
| 3 to 4 Year Olds | 38 (33.9%) | 74 (66.1%) |
| 5 to 9 Year Old | 554 (90.7%) | 57 (9.3%) |
| 10 to 14 Year Olds | 296 (94.6%) | 17 (5.4%) |
| 15 to 17 Year Olds | 179 (80.6%) | 43 (19.4%) |
| 18 to 19 Year Olds | 21 (80.8%) | 5 (19.2%) |
| 20 to 24 Year Olds | 38 (73.1%) | 14 (26.9%) |
| 25 to 34 Year Olds | 45 (80.4%) | 11 (19.6%) |
| 35 Years and over | 75 (78.1%) | 21 (21.9%) |
| Total | 1,245 (83.7%) | 243 (16.3%) |
Educational Attainment by Field of Study in Payette
Education (168 | 20.2%), business (116 | 13.9%), bio, nature & agricultural (88 | 10.6%), science & technology (84 | 10.1%), and psychology (77 | 9.2%) are the most common fields of study among 832 individuals in Payette who have obtained a bachelor's degree or higher.
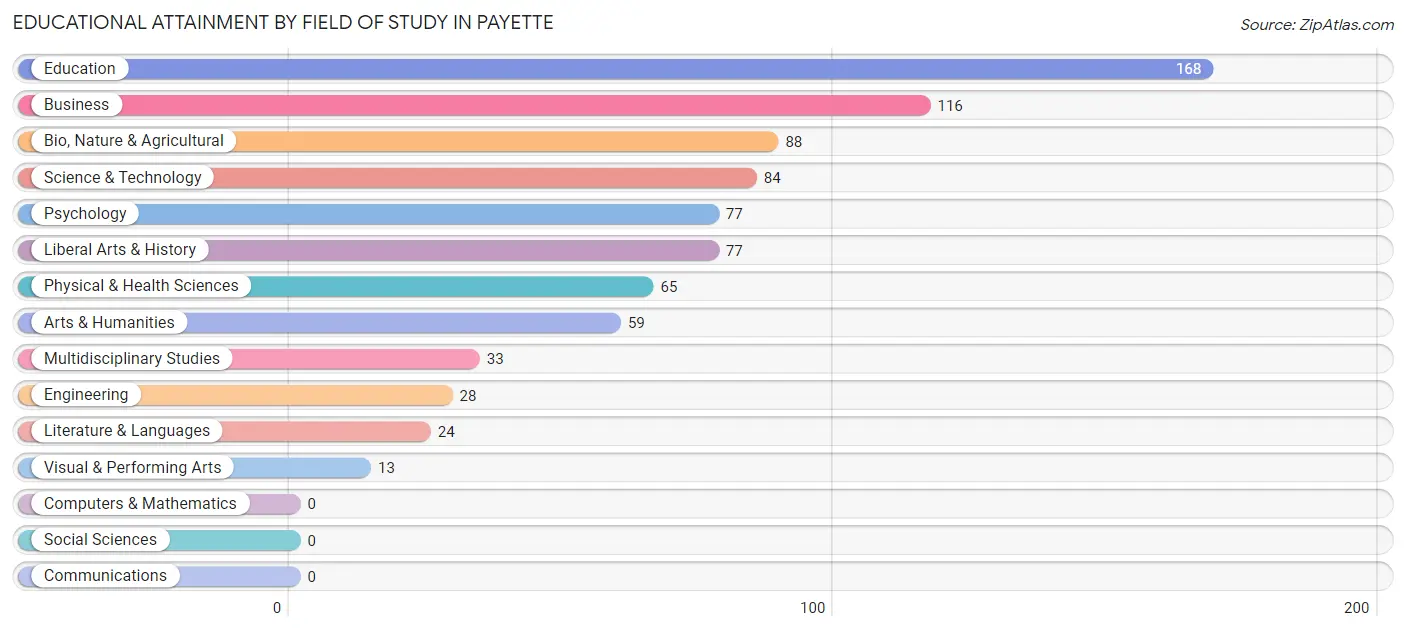
| Field of Study | # Graduates | % Graduates |
| Computers & Mathematics | 0 | 0.0% |
| Bio, Nature & Agricultural | 88 | 10.6% |
| Physical & Health Sciences | 65 | 7.8% |
| Psychology | 77 | 9.2% |
| Social Sciences | 0 | 0.0% |
| Engineering | 28 | 3.4% |
| Multidisciplinary Studies | 33 | 4.0% |
| Science & Technology | 84 | 10.1% |
| Business | 116 | 13.9% |
| Education | 168 | 20.2% |
| Literature & Languages | 24 | 2.9% |
| Liberal Arts & History | 77 | 9.2% |
| Visual & Performing Arts | 13 | 1.6% |
| Communications | 0 | 0.0% |
| Arts & Humanities | 59 | 7.1% |
| Total | 832 | 100.0% |
Transportation & Commute in Payette
Vehicle Availability by Sex in Payette
The most prevalent vehicle ownership categories in Payette are males with 2 vehicles (657, accounting for 35.9%) and females with 2 vehicles (377, making up 47.6%).
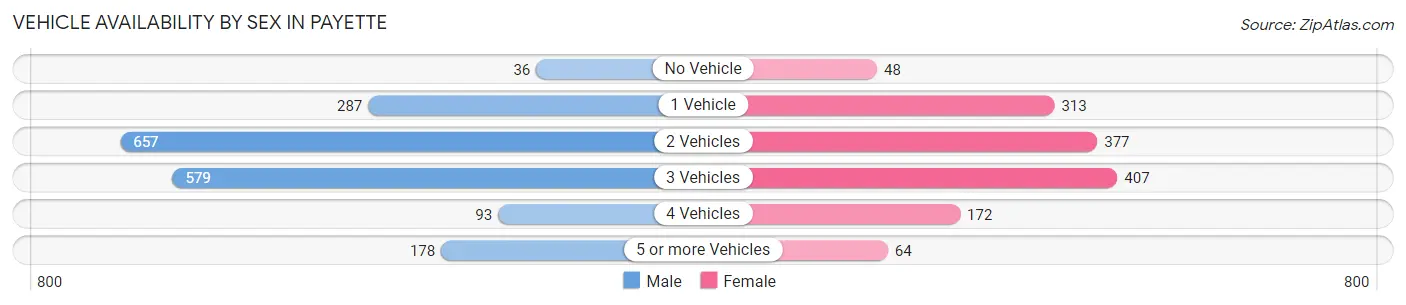
| Vehicles Available | Male | Female |
| No Vehicle | 36 (2.0%) | 48 (3.5%) |
| 1 Vehicle | 287 (15.7%) | 313 (22.7%) |
| 2 Vehicles | 657 (35.9%) | 377 (27.3%) |
| 3 Vehicles | 579 (31.6%) | 407 (29.5%) |
| 4 Vehicles | 93 (5.1%) | 172 (12.4%) |
| 5 or more Vehicles | 178 (9.7%) | 64 (4.6%) |
| Total | 1,830 (100.0%) | 1,381 (100.0%) |
Commute Time in Payette
The most frequently occuring commute durations in Payette are 15 to 19 minutes (793 commuters, 25.5%), 20 to 24 minutes (378 commuters, 12.1%), and 5 to 9 minutes (358 commuters, 11.5%).
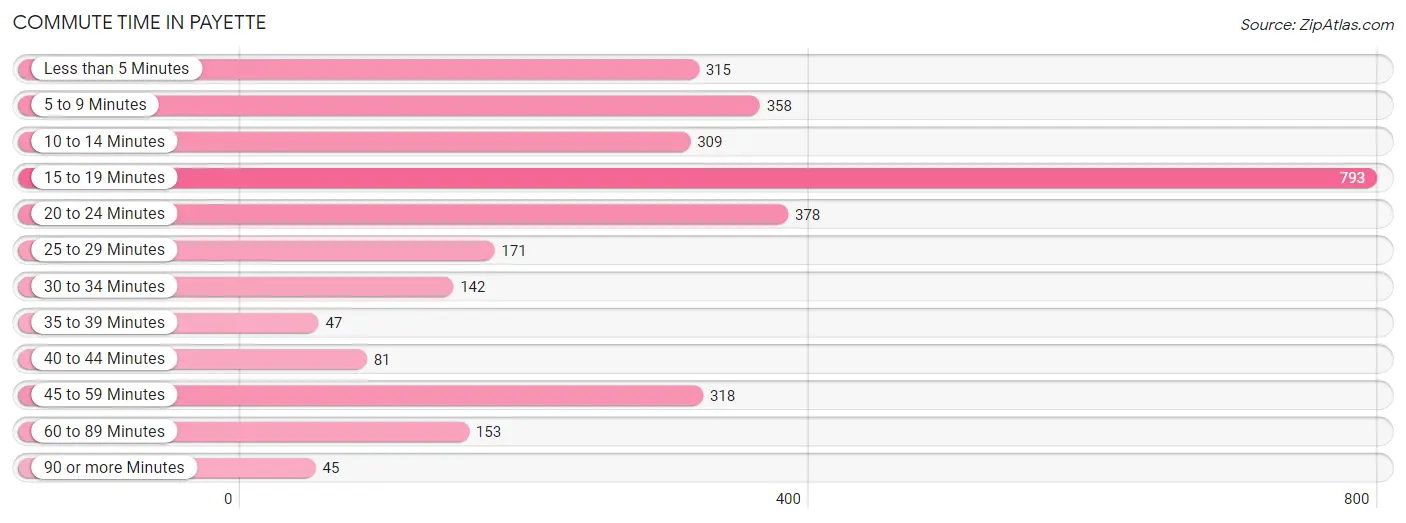
| Commute Time | # Commuters | % Commuters |
| Less than 5 Minutes | 315 | 10.1% |
| 5 to 9 Minutes | 358 | 11.5% |
| 10 to 14 Minutes | 309 | 9.9% |
| 15 to 19 Minutes | 793 | 25.5% |
| 20 to 24 Minutes | 378 | 12.1% |
| 25 to 29 Minutes | 171 | 5.5% |
| 30 to 34 Minutes | 142 | 4.6% |
| 35 to 39 Minutes | 47 | 1.5% |
| 40 to 44 Minutes | 81 | 2.6% |
| 45 to 59 Minutes | 318 | 10.2% |
| 60 to 89 Minutes | 153 | 4.9% |
| 90 or more Minutes | 45 | 1.5% |
Commute Time by Sex in Payette
The most common commute times in Payette are 15 to 19 minutes (310 commuters, 17.6%) for males and 15 to 19 minutes (483 commuters, 35.7%) for females.
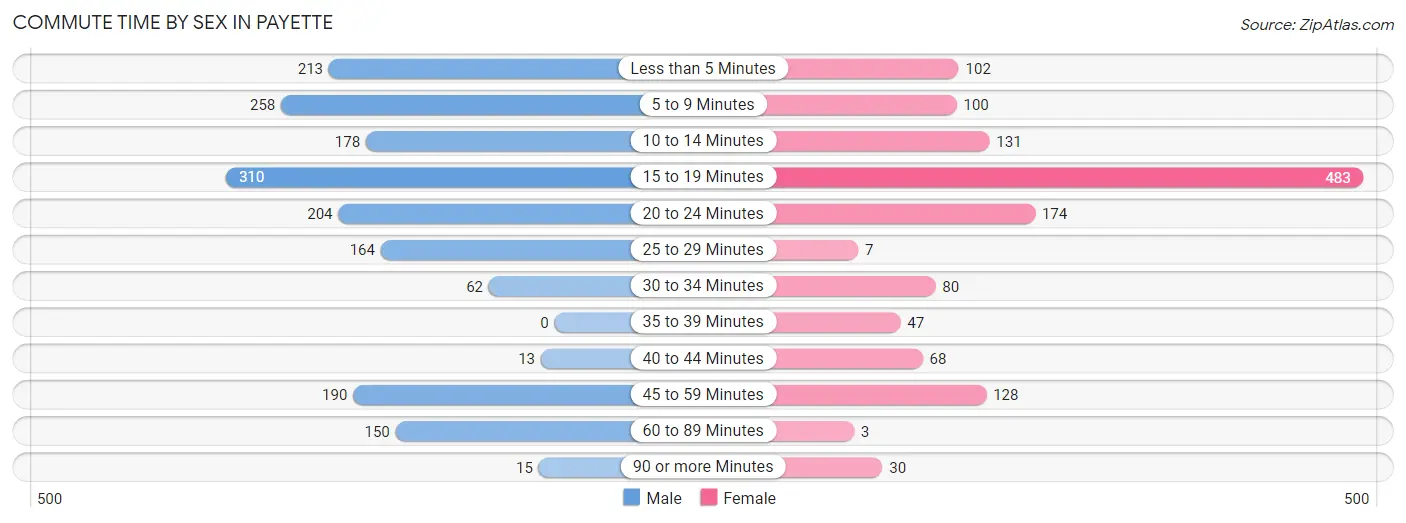
| Commute Time | Male | Female |
| Less than 5 Minutes | 213 (12.1%) | 102 (7.5%) |
| 5 to 9 Minutes | 258 (14.7%) | 100 (7.4%) |
| 10 to 14 Minutes | 178 (10.1%) | 131 (9.7%) |
| 15 to 19 Minutes | 310 (17.6%) | 483 (35.7%) |
| 20 to 24 Minutes | 204 (11.6%) | 174 (12.9%) |
| 25 to 29 Minutes | 164 (9.3%) | 7 (0.5%) |
| 30 to 34 Minutes | 62 (3.5%) | 80 (5.9%) |
| 35 to 39 Minutes | 0 (0.0%) | 47 (3.5%) |
| 40 to 44 Minutes | 13 (0.7%) | 68 (5.0%) |
| 45 to 59 Minutes | 190 (10.8%) | 128 (9.5%) |
| 60 to 89 Minutes | 150 (8.5%) | 3 (0.2%) |
| 90 or more Minutes | 15 (0.9%) | 30 (2.2%) |
Time of Departure to Work by Sex in Payette
The most frequent times of departure to work in Payette are 6:30 AM to 6:59 AM (335, 19.1%) for males and 7:30 AM to 7:59 AM (278, 20.5%) for females.
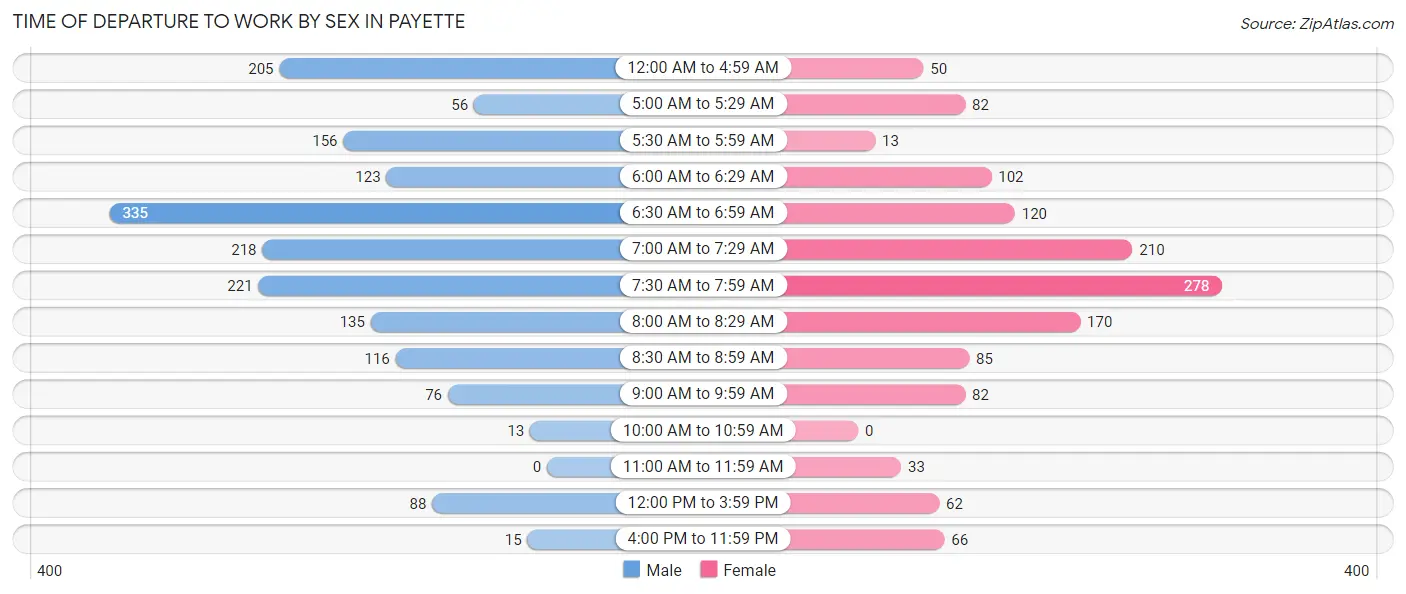
| Time of Departure | Male | Female |
| 12:00 AM to 4:59 AM | 205 (11.7%) | 50 (3.7%) |
| 5:00 AM to 5:29 AM | 56 (3.2%) | 82 (6.1%) |
| 5:30 AM to 5:59 AM | 156 (8.9%) | 13 (1.0%) |
| 6:00 AM to 6:29 AM | 123 (7.0%) | 102 (7.5%) |
| 6:30 AM to 6:59 AM | 335 (19.1%) | 120 (8.9%) |
| 7:00 AM to 7:29 AM | 218 (12.4%) | 210 (15.5%) |
| 7:30 AM to 7:59 AM | 221 (12.6%) | 278 (20.5%) |
| 8:00 AM to 8:29 AM | 135 (7.7%) | 170 (12.6%) |
| 8:30 AM to 8:59 AM | 116 (6.6%) | 85 (6.3%) |
| 9:00 AM to 9:59 AM | 76 (4.3%) | 82 (6.1%) |
| 10:00 AM to 10:59 AM | 13 (0.7%) | 0 (0.0%) |
| 11:00 AM to 11:59 AM | 0 (0.0%) | 33 (2.4%) |
| 12:00 PM to 3:59 PM | 88 (5.0%) | 62 (4.6%) |
| 4:00 PM to 11:59 PM | 15 (0.9%) | 66 (4.9%) |
| Total | 1,757 (100.0%) | 1,353 (100.0%) |
Housing Occupancy in Payette
Occupancy by Ownership in Payette
Of the total 2,977 dwellings in Payette, owner-occupied units account for 1,554 (52.2%), while renter-occupied units make up 1,423 (47.8%).
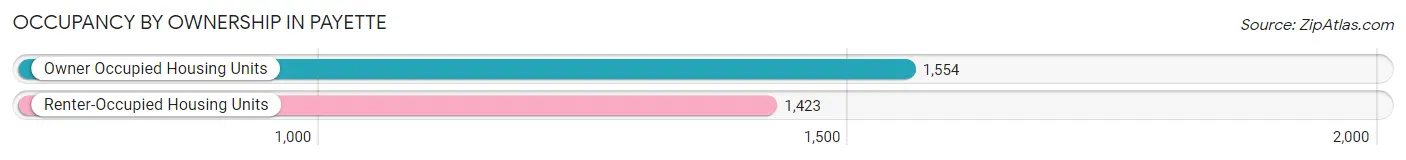
| Occupancy | # Housing Units | % Housing Units |
| Owner Occupied Housing Units | 1,554 | 52.2% |
| Renter-Occupied Housing Units | 1,423 | 47.8% |
| Total Occupied Housing Units | 2,977 | 100.0% |
Occupancy by Household Size in Payette
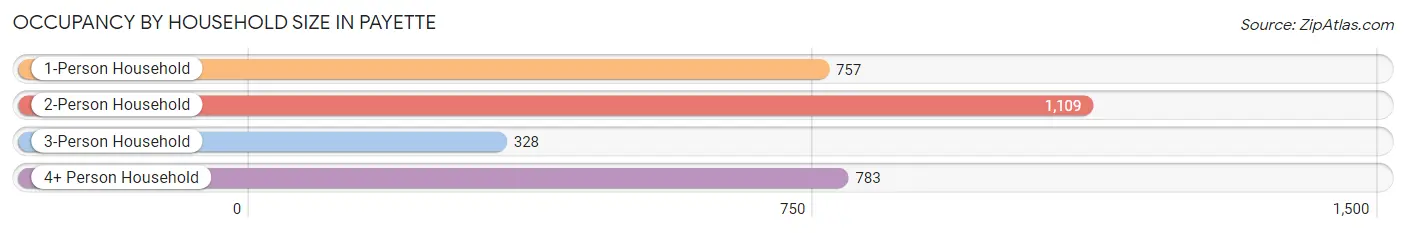
| Household Size | # Housing Units | % Housing Units |
| 1-Person Household | 757 | 25.4% |
| 2-Person Household | 1,109 | 37.2% |
| 3-Person Household | 328 | 11.0% |
| 4+ Person Household | 783 | 26.3% |
| Total Housing Units | 2,977 | 100.0% |
Occupancy by Ownership by Household Size in Payette
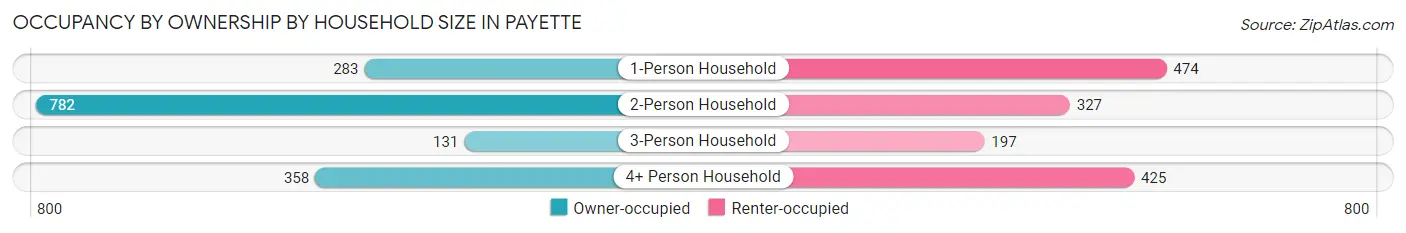
| Household Size | Owner-occupied | Renter-occupied |
| 1-Person Household | 283 (37.4%) | 474 (62.6%) |
| 2-Person Household | 782 (70.5%) | 327 (29.5%) |
| 3-Person Household | 131 (39.9%) | 197 (60.1%) |
| 4+ Person Household | 358 (45.7%) | 425 (54.3%) |
| Total Housing Units | 1,554 (52.2%) | 1,423 (47.8%) |
Occupancy by Educational Attainment in Payette
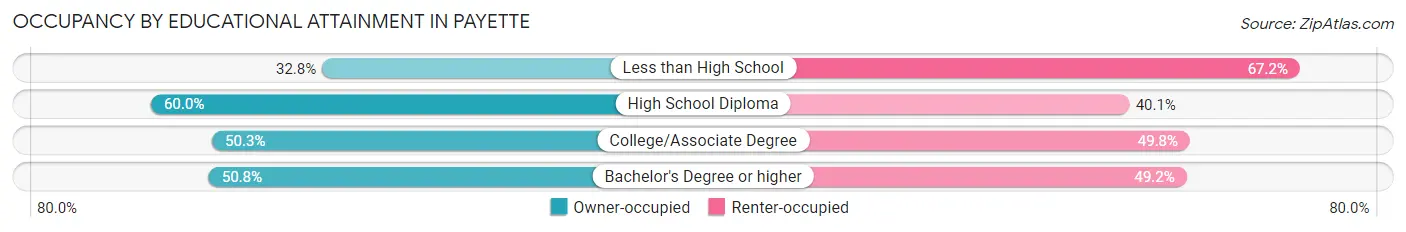
| Household Size | Owner-occupied | Renter-occupied |
| Less than High School | 106 (32.8%) | 217 (67.2%) |
| High School Diploma | 690 (60.0%) | 461 (40.1%) |
| College/Associate Degree | 499 (50.2%) | 494 (49.7%) |
| Bachelor's Degree or higher | 259 (50.8%) | 251 (49.2%) |
Occupancy by Age of Householder in Payette
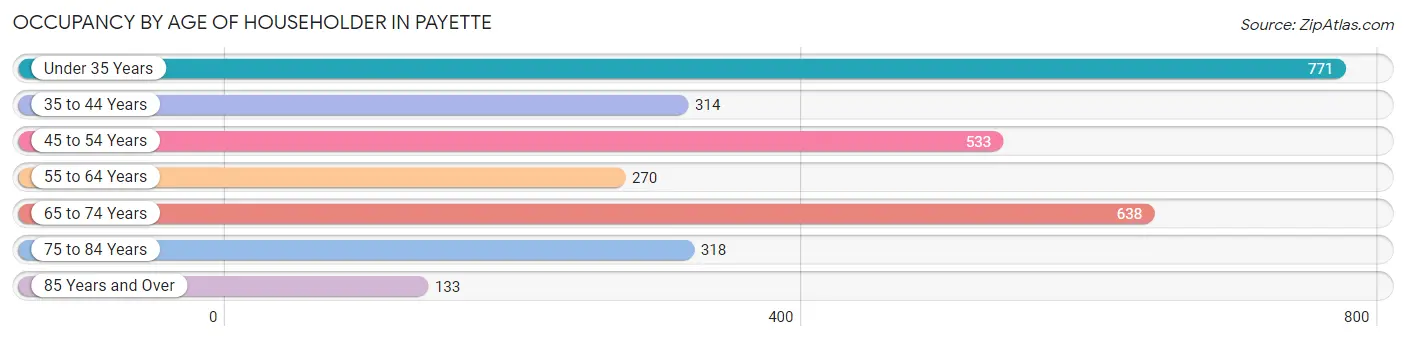
| Age Bracket | # Households | % Households |
| Under 35 Years | 771 | 25.9% |
| 35 to 44 Years | 314 | 10.5% |
| 45 to 54 Years | 533 | 17.9% |
| 55 to 64 Years | 270 | 9.1% |
| 65 to 74 Years | 638 | 21.4% |
| 75 to 84 Years | 318 | 10.7% |
| 85 Years and Over | 133 | 4.5% |
| Total | 2,977 | 100.0% |
Housing Finances in Payette
Median Income by Occupancy in Payette
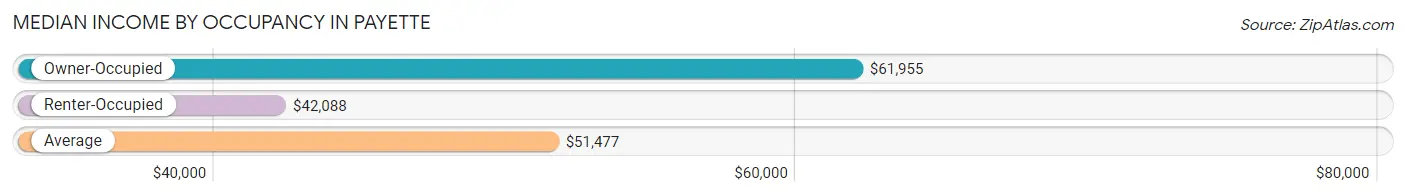
| Occupancy Type | # Households | Median Income |
| Owner-Occupied | 1,554 (52.2%) | $61,955 |
| Renter-Occupied | 1,423 (47.8%) | $42,088 |
| Average | 2,977 (100.0%) | $51,477 |
Occupancy by Householder Income Bracket in Payette
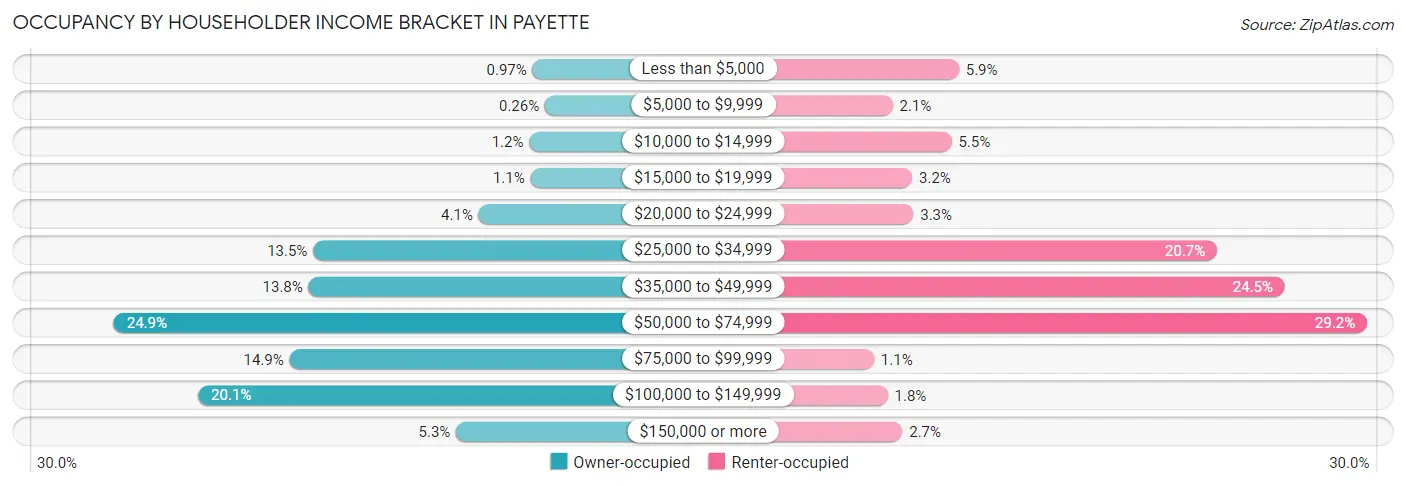
| Income Bracket | Owner-occupied | Renter-occupied |
| Less than $5,000 | 15 (1.0%) | 84 (5.9%) |
| $5,000 to $9,999 | 4 (0.3%) | 30 (2.1%) |
| $10,000 to $14,999 | 18 (1.2%) | 78 (5.5%) |
| $15,000 to $19,999 | 17 (1.1%) | 46 (3.2%) |
| $20,000 to $24,999 | 63 (4.1%) | 47 (3.3%) |
| $25,000 to $34,999 | 210 (13.5%) | 294 (20.7%) |
| $35,000 to $49,999 | 214 (13.8%) | 349 (24.5%) |
| $50,000 to $74,999 | 387 (24.9%) | 416 (29.2%) |
| $75,000 to $99,999 | 231 (14.9%) | 15 (1.1%) |
| $100,000 to $149,999 | 312 (20.1%) | 26 (1.8%) |
| $150,000 or more | 83 (5.3%) | 38 (2.7%) |
| Total | 1,554 (100.0%) | 1,423 (100.0%) |
Monthly Housing Cost Tiers in Payette
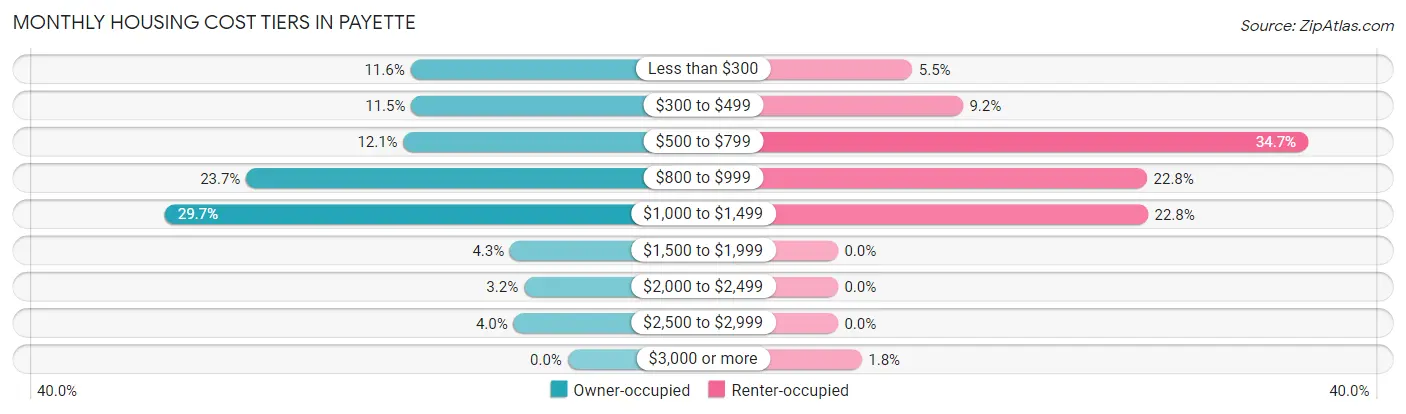
| Monthly Cost | Owner-occupied | Renter-occupied |
| Less than $300 | 180 (11.6%) | 78 (5.5%) |
| $300 to $499 | 179 (11.5%) | 131 (9.2%) |
| $500 to $799 | 188 (12.1%) | 493 (34.6%) |
| $800 to $999 | 368 (23.7%) | 324 (22.8%) |
| $1,000 to $1,499 | 461 (29.7%) | 325 (22.8%) |
| $1,500 to $1,999 | 66 (4.3%) | 0 (0.0%) |
| $2,000 to $2,499 | 50 (3.2%) | 0 (0.0%) |
| $2,500 to $2,999 | 62 (4.0%) | 0 (0.0%) |
| $3,000 or more | 0 (0.0%) | 25 (1.8%) |
| Total | 1,554 (100.0%) | 1,423 (100.0%) |
Physical Housing Characteristics in Payette
Housing Structures in Payette
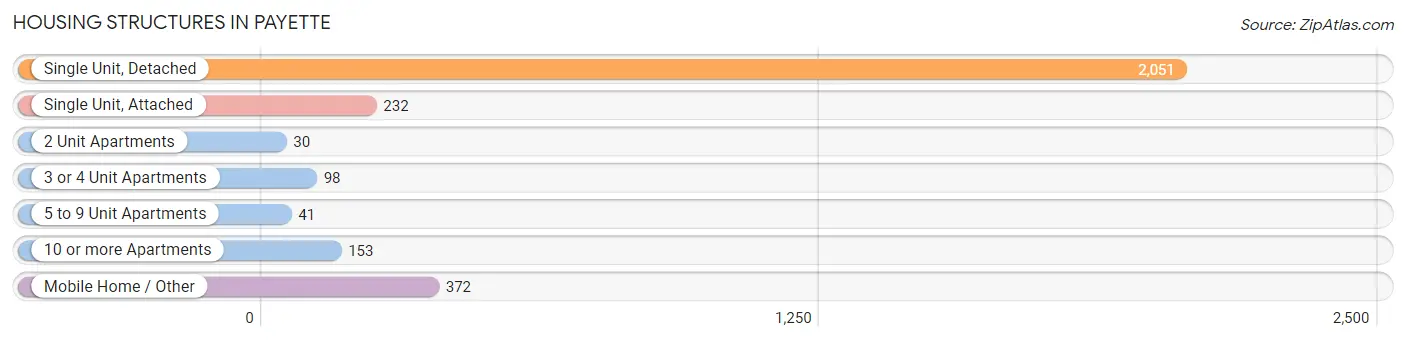
| Structure Type | # Housing Units | % Housing Units |
| Single Unit, Detached | 2,051 | 68.9% |
| Single Unit, Attached | 232 | 7.8% |
| 2 Unit Apartments | 30 | 1.0% |
| 3 or 4 Unit Apartments | 98 | 3.3% |
| 5 to 9 Unit Apartments | 41 | 1.4% |
| 10 or more Apartments | 153 | 5.1% |
| Mobile Home / Other | 372 | 12.5% |
| Total | 2,977 | 100.0% |
Housing Structures by Occupancy in Payette
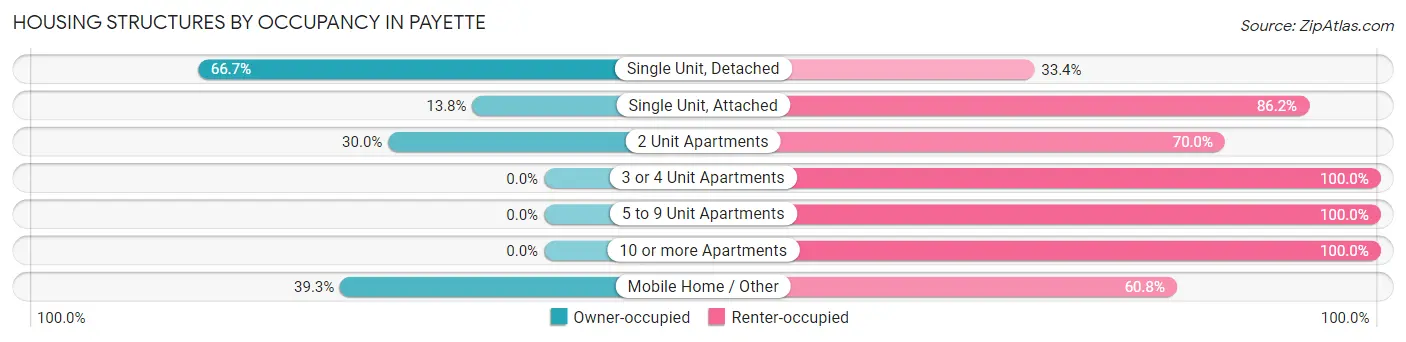
| Structure Type | Owner-occupied | Renter-occupied |
| Single Unit, Detached | 1,367 (66.6%) | 684 (33.4%) |
| Single Unit, Attached | 32 (13.8%) | 200 (86.2%) |
| 2 Unit Apartments | 9 (30.0%) | 21 (70.0%) |
| 3 or 4 Unit Apartments | 0 (0.0%) | 98 (100.0%) |
| 5 to 9 Unit Apartments | 0 (0.0%) | 41 (100.0%) |
| 10 or more Apartments | 0 (0.0%) | 153 (100.0%) |
| Mobile Home / Other | 146 (39.3%) | 226 (60.8%) |
| Total | 1,554 (52.2%) | 1,423 (47.8%) |
Housing Structures by Number of Rooms in Payette
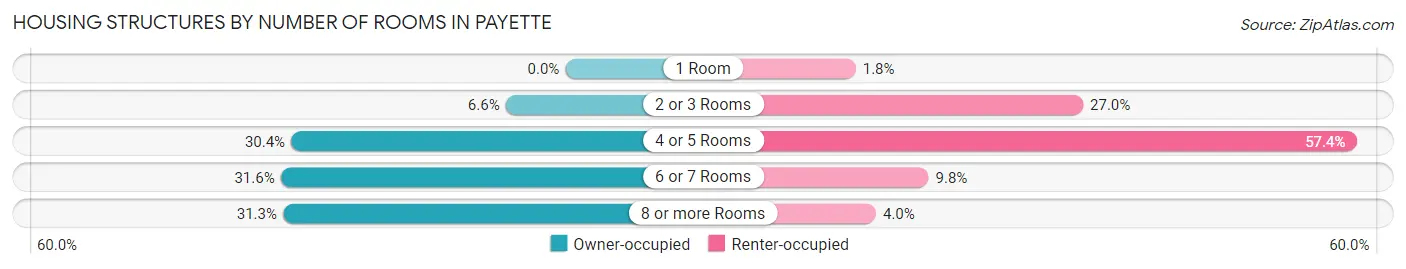
| Number of Rooms | Owner-occupied | Renter-occupied |
| 1 Room | 0 (0.0%) | 25 (1.8%) |
| 2 or 3 Rooms | 103 (6.6%) | 384 (27.0%) |
| 4 or 5 Rooms | 473 (30.4%) | 817 (57.4%) |
| 6 or 7 Rooms | 491 (31.6%) | 140 (9.8%) |
| 8 or more Rooms | 487 (31.3%) | 57 (4.0%) |
| Total | 1,554 (100.0%) | 1,423 (100.0%) |
Housing Structure by Heating Type in Payette
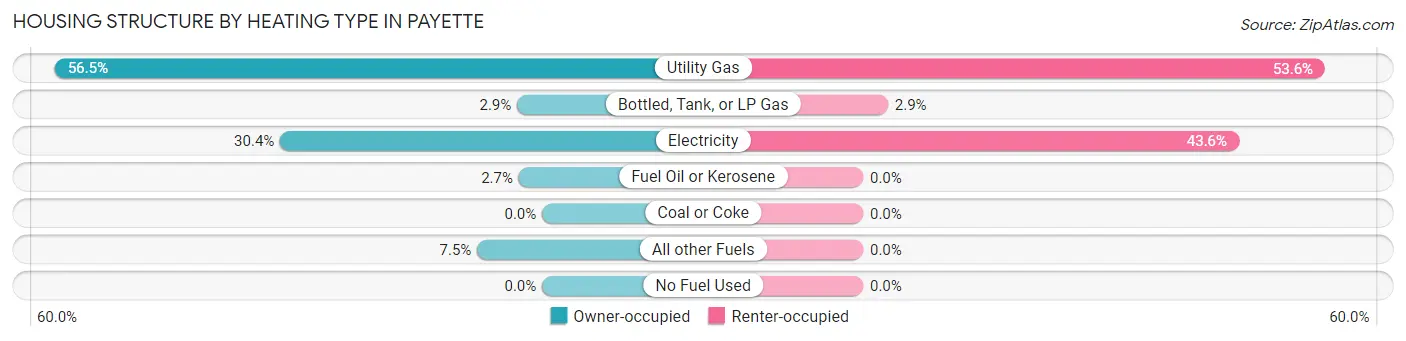
| Heating Type | Owner-occupied | Renter-occupied |
| Utility Gas | 878 (56.5%) | 762 (53.5%) |
| Bottled, Tank, or LP Gas | 45 (2.9%) | 41 (2.9%) |
| Electricity | 472 (30.4%) | 620 (43.6%) |
| Fuel Oil or Kerosene | 42 (2.7%) | 0 (0.0%) |
| Coal or Coke | 0 (0.0%) | 0 (0.0%) |
| All other Fuels | 117 (7.5%) | 0 (0.0%) |
| No Fuel Used | 0 (0.0%) | 0 (0.0%) |
| Total | 1,554 (100.0%) | 1,423 (100.0%) |
Household Vehicle Usage in Payette
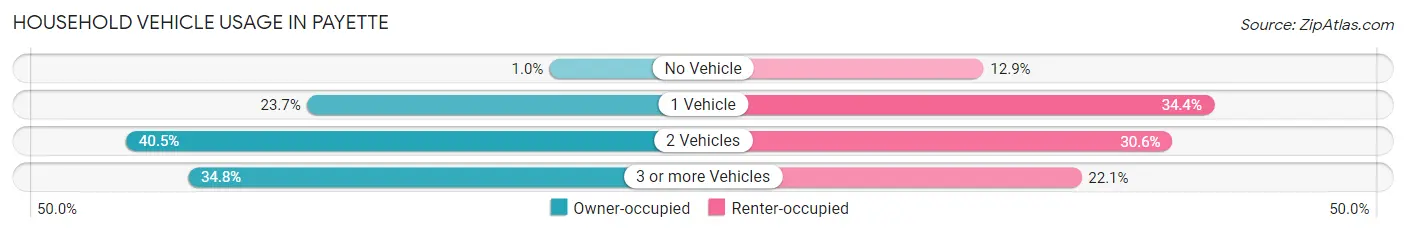
| Vehicles per Household | Owner-occupied | Renter-occupied |
| No Vehicle | 16 (1.0%) | 184 (12.9%) |
| 1 Vehicle | 368 (23.7%) | 490 (34.4%) |
| 2 Vehicles | 630 (40.5%) | 435 (30.6%) |
| 3 or more Vehicles | 540 (34.7%) | 314 (22.1%) |
| Total | 1,554 (100.0%) | 1,423 (100.0%) |
Real Estate & Mortgages in Payette
Real Estate and Mortgage Overview in Payette
| Characteristic | Without Mortgage | With Mortgage |
| Housing Units | 460 | 1,094 |
| Median Property Value | $214,500 | $170,600 |
| Median Household Income | $60,313 | $40 |
| Monthly Housing Costs | $394 | $0 |
| Real Estate Taxes | $1,332 | $30 |
Property Value by Mortgage Status in Payette
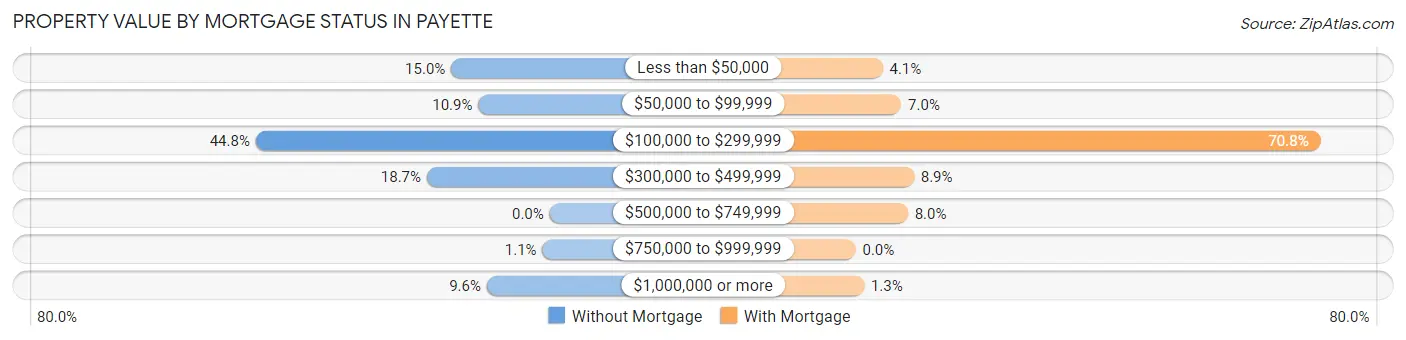
| Property Value | Without Mortgage | With Mortgage |
| Less than $50,000 | 69 (15.0%) | 45 (4.1%) |
| $50,000 to $99,999 | 50 (10.9%) | 76 (7.0%) |
| $100,000 to $299,999 | 206 (44.8%) | 775 (70.8%) |
| $300,000 to $499,999 | 86 (18.7%) | 97 (8.9%) |
| $500,000 to $749,999 | 0 (0.0%) | 87 (8.0%) |
| $750,000 to $999,999 | 5 (1.1%) | 0 (0.0%) |
| $1,000,000 or more | 44 (9.6%) | 14 (1.3%) |
| Total | 460 (100.0%) | 1,094 (100.0%) |
Household Income by Mortgage Status in Payette
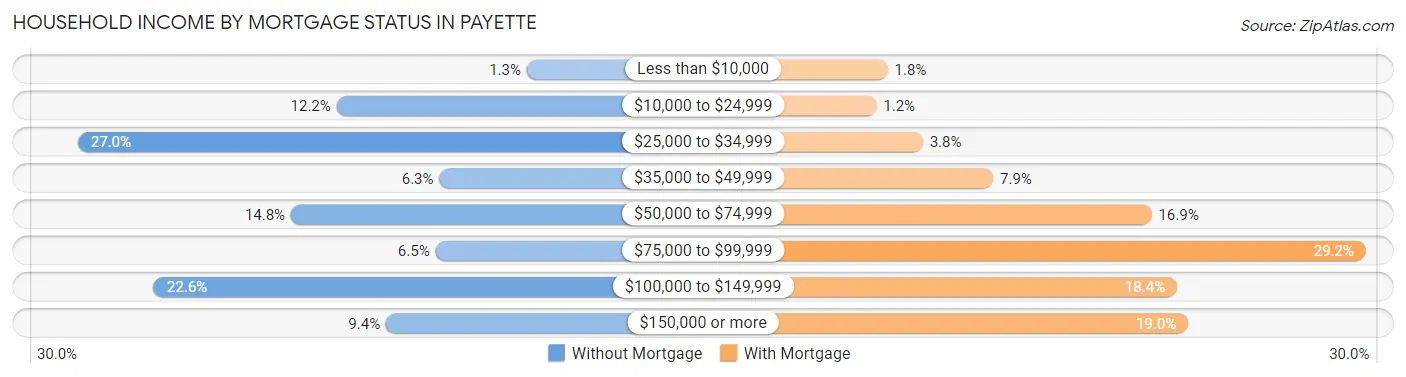
| Household Income | Without Mortgage | With Mortgage |
| Less than $10,000 | 6 (1.3%) | 20 (1.8%) |
| $10,000 to $24,999 | 56 (12.2%) | 13 (1.2%) |
| $25,000 to $34,999 | 124 (27.0%) | 42 (3.8%) |
| $35,000 to $49,999 | 29 (6.3%) | 86 (7.9%) |
| $50,000 to $74,999 | 68 (14.8%) | 185 (16.9%) |
| $75,000 to $99,999 | 30 (6.5%) | 319 (29.2%) |
| $100,000 to $149,999 | 104 (22.6%) | 201 (18.4%) |
| $150,000 or more | 43 (9.3%) | 208 (19.0%) |
| Total | 460 (100.0%) | 1,094 (100.0%) |
Property Value to Household Income Ratio in Payette
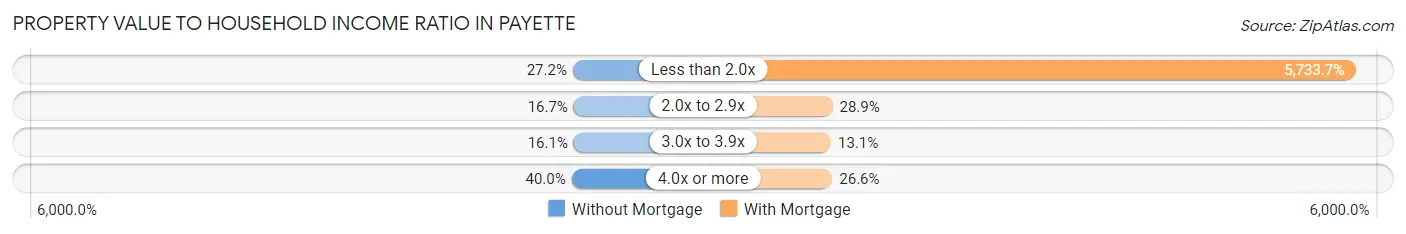
| Value-to-Income Ratio | Without Mortgage | With Mortgage |
| Less than 2.0x | 125 (27.2%) | 62,727 (5,733.7%) |
| 2.0x to 2.9x | 77 (16.7%) | 316 (28.9%) |
| 3.0x to 3.9x | 74 (16.1%) | 143 (13.1%) |
| 4.0x or more | 184 (40.0%) | 291 (26.6%) |
| Total | 460 (100.0%) | 1,094 (100.0%) |
Real Estate Taxes by Mortgage Status in Payette
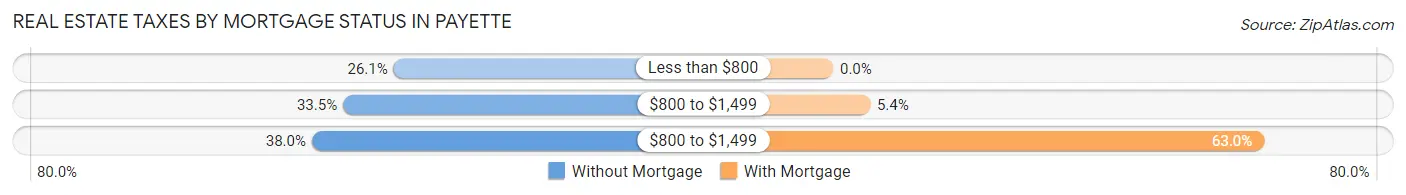
| Property Taxes | Without Mortgage | With Mortgage |
| Less than $800 | 120 (26.1%) | 0 (0.0%) |
| $800 to $1,499 | 154 (33.5%) | 59 (5.4%) |
| $800 to $1,499 | 175 (38.0%) | 689 (63.0%) |
| Total | 460 (100.0%) | 1,094 (100.0%) |
Health & Disability in Payette
Health Insurance Coverage by Age in Payette
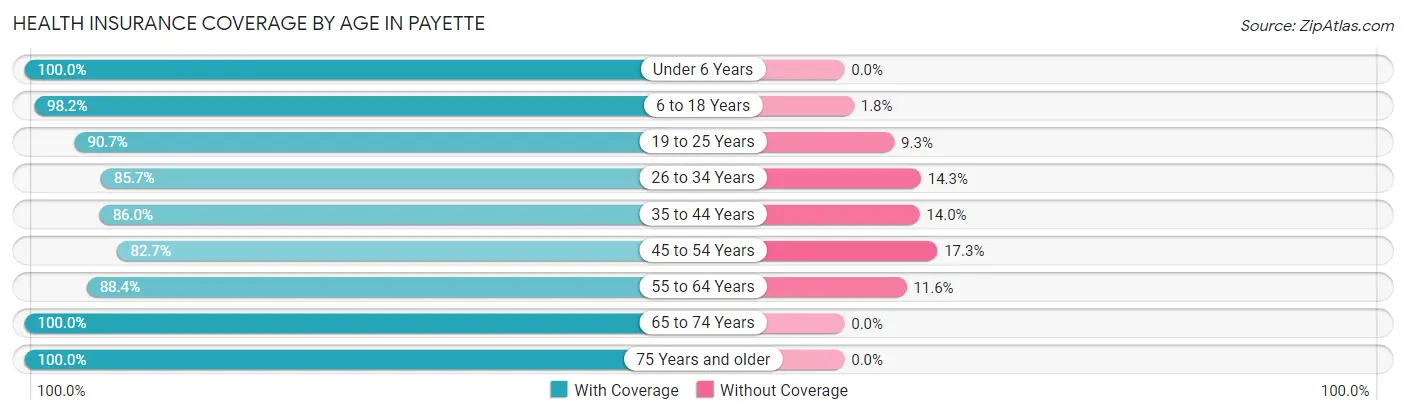
| Age Bracket | With Coverage | Without Coverage |
| Under 6 Years | 907 (100.0%) | 0 (0.0%) |
| 6 to 18 Years | 1,113 (98.2%) | 20 (1.8%) |
| 19 to 25 Years | 751 (90.7%) | 77 (9.3%) |
| 26 to 34 Years | 1,045 (85.7%) | 174 (14.3%) |
| 35 to 44 Years | 485 (86.0%) | 79 (14.0%) |
| 45 to 54 Years | 744 (82.7%) | 156 (17.3%) |
| 55 to 64 Years | 816 (88.4%) | 107 (11.6%) |
| 65 to 74 Years | 937 (100.0%) | 0 (0.0%) |
| 75 Years and older | 628 (100.0%) | 0 (0.0%) |
| Total | 7,426 (92.4%) | 613 (7.6%) |
Health Insurance Coverage by Citizenship Status in Payette
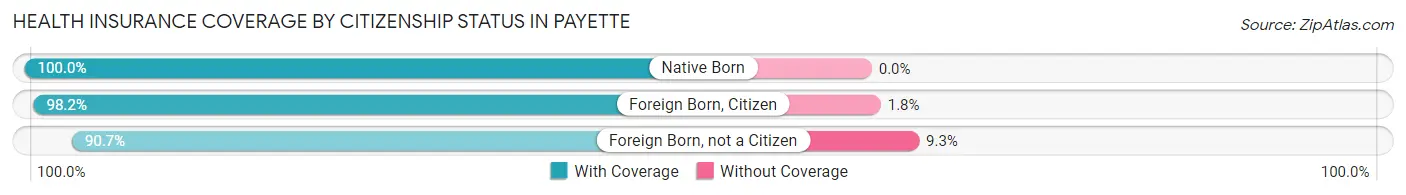
| Citizenship Status | With Coverage | Without Coverage |
| Native Born | 907 (100.0%) | 0 (0.0%) |
| Foreign Born, Citizen | 1,113 (98.2%) | 20 (1.8%) |
| Foreign Born, not a Citizen | 751 (90.7%) | 77 (9.3%) |
Health Insurance Coverage by Household Income in Payette
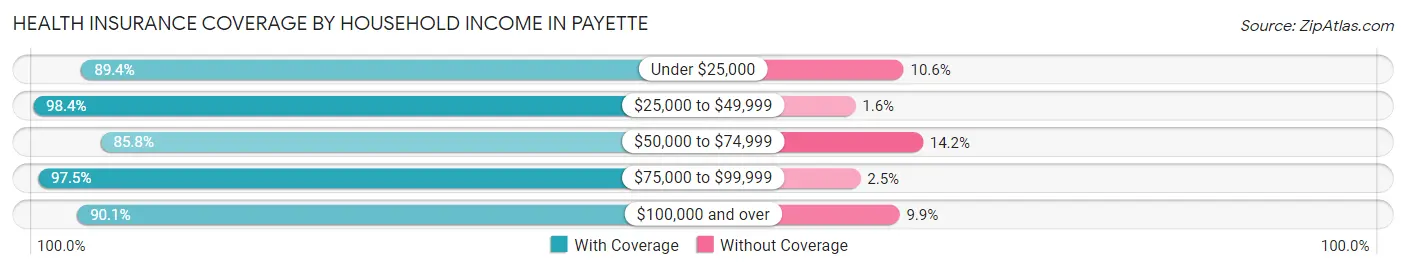
| Household Income | With Coverage | Without Coverage |
| Under $25,000 | 462 (89.4%) | 55 (10.6%) |
| $25,000 to $49,999 | 2,633 (98.4%) | 43 (1.6%) |
| $50,000 to $74,999 | 1,855 (85.8%) | 308 (14.2%) |
| $75,000 to $99,999 | 767 (97.5%) | 20 (2.5%) |
| $100,000 and over | 1,708 (90.1%) | 187 (9.9%) |
Public vs Private Health Insurance Coverage by Age in Payette
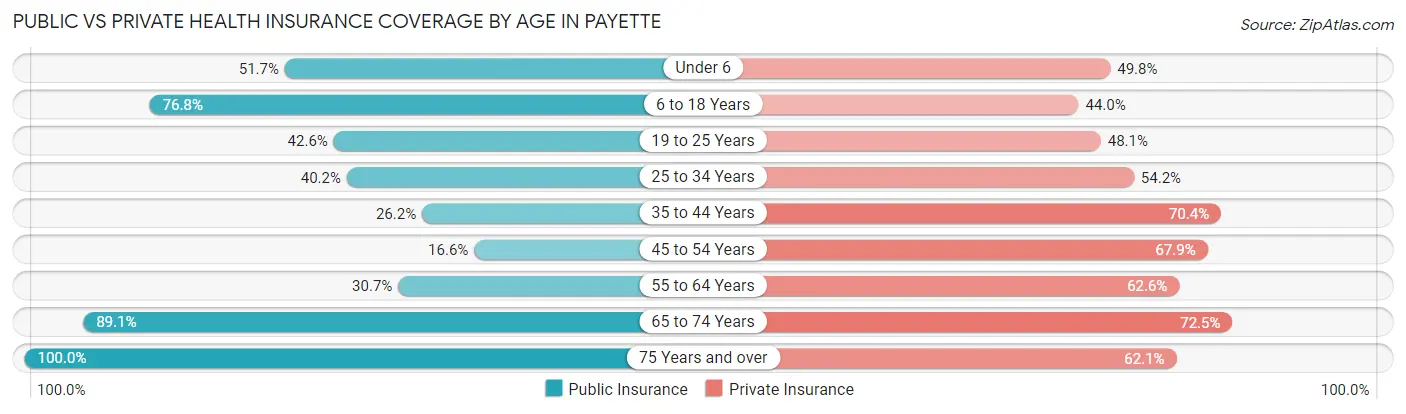
| Age Bracket | Public Insurance | Private Insurance |
| Under 6 | 469 (51.7%) | 452 (49.8%) |
| 6 to 18 Years | 870 (76.8%) | 498 (44.0%) |
| 19 to 25 Years | 353 (42.6%) | 398 (48.1%) |
| 25 to 34 Years | 490 (40.2%) | 661 (54.2%) |
| 35 to 44 Years | 148 (26.2%) | 397 (70.4%) |
| 45 to 54 Years | 149 (16.6%) | 611 (67.9%) |
| 55 to 64 Years | 283 (30.7%) | 578 (62.6%) |
| 65 to 74 Years | 835 (89.1%) | 679 (72.5%) |
| 75 Years and over | 628 (100.0%) | 390 (62.1%) |
| Total | 4,225 (52.6%) | 4,664 (58.0%) |
Disability Status by Sex by Age in Payette
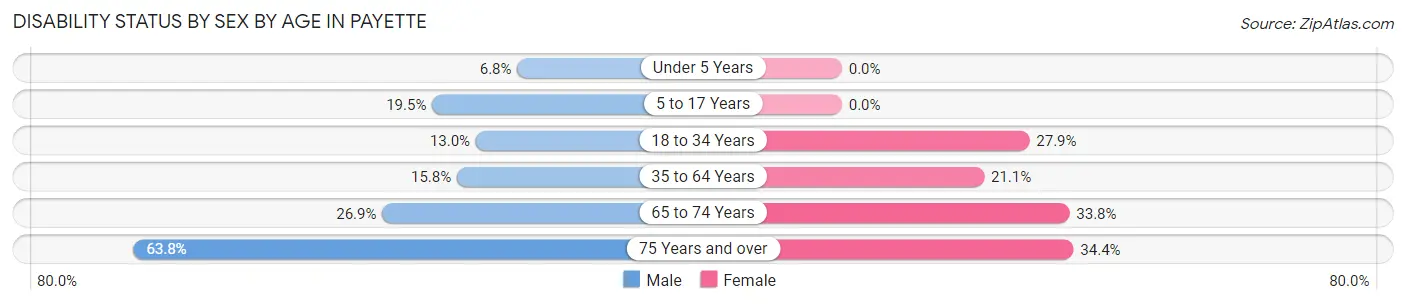
| Age Bracket | Male | Female |
| Under 5 Years | 11 (6.8%) | 0 (0.0%) |
| 5 to 17 Years | 126 (19.5%) | 0 (0.0%) |
| 18 to 34 Years | 121 (13.0%) | 322 (27.9%) |
| 35 to 64 Years | 199 (15.8%) | 238 (21.1%) |
| 65 to 74 Years | 135 (26.9%) | 147 (33.8%) |
| 75 Years and over | 180 (63.8%) | 119 (34.4%) |
Disability Class by Sex by Age in Payette
Disability Class: Hearing Difficulty
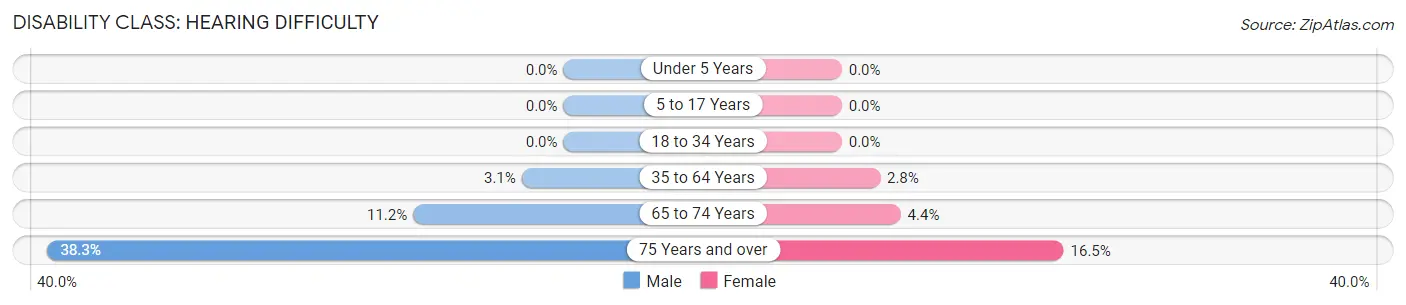
| Age Bracket | Male | Female |
| Under 5 Years | 0 (0.0%) | 0 (0.0%) |
| 5 to 17 Years | 0 (0.0%) | 0 (0.0%) |
| 18 to 34 Years | 0 (0.0%) | 0 (0.0%) |
| 35 to 64 Years | 39 (3.1%) | 32 (2.8%) |
| 65 to 74 Years | 56 (11.2%) | 19 (4.4%) |
| 75 Years and over | 108 (38.3%) | 57 (16.5%) |
Disability Class: Vision Difficulty
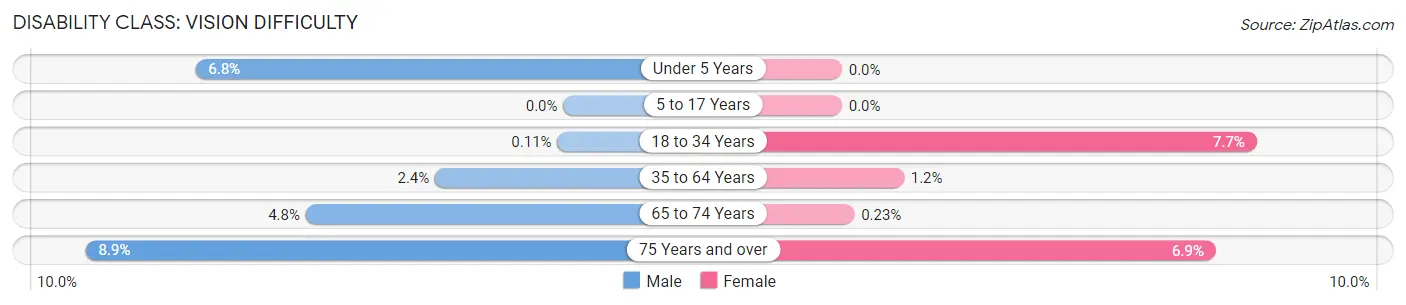
| Age Bracket | Male | Female |
| Under 5 Years | 11 (6.8%) | 0 (0.0%) |
| 5 to 17 Years | 0 (0.0%) | 0 (0.0%) |
| 18 to 34 Years | 1 (0.1%) | 89 (7.7%) |
| 35 to 64 Years | 30 (2.4%) | 13 (1.1%) |
| 65 to 74 Years | 24 (4.8%) | 1 (0.2%) |
| 75 Years and over | 25 (8.9%) | 24 (6.9%) |
Disability Class: Cognitive Difficulty
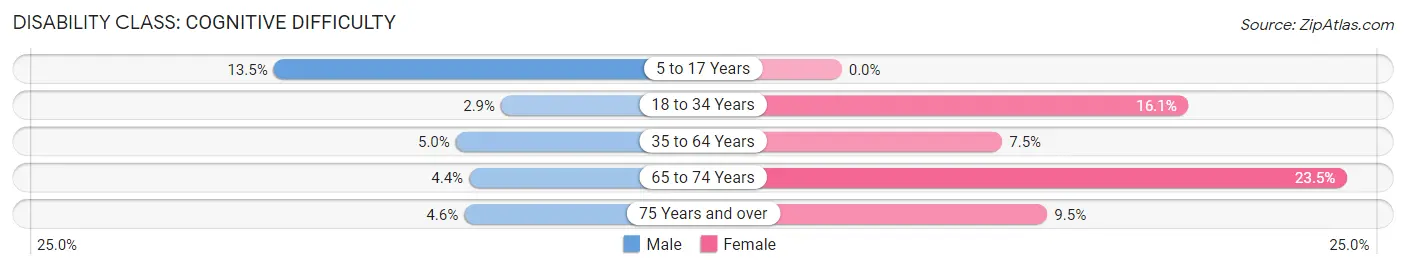
| Age Bracket | Male | Female |
| 5 to 17 Years | 87 (13.5%) | 0 (0.0%) |
| 18 to 34 Years | 27 (2.9%) | 186 (16.1%) |
| 35 to 64 Years | 63 (5.0%) | 84 (7.4%) |
| 65 to 74 Years | 22 (4.4%) | 102 (23.4%) |
| 75 Years and over | 13 (4.6%) | 33 (9.5%) |
Disability Class: Ambulatory Difficulty
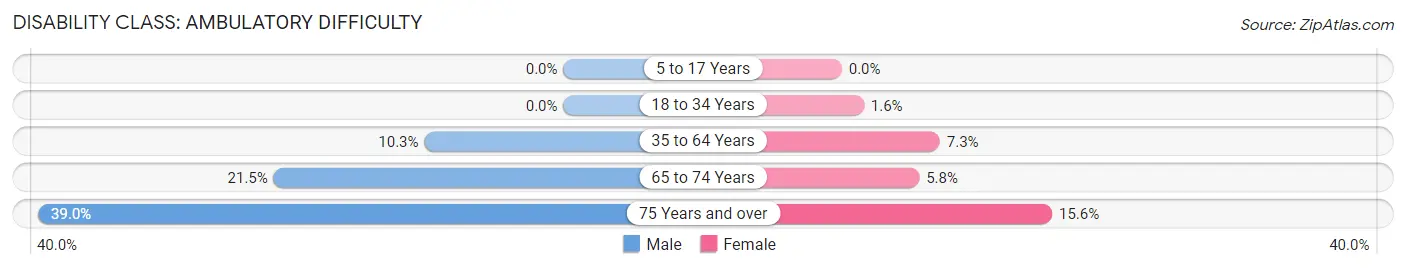
| Age Bracket | Male | Female |
| 5 to 17 Years | 0 (0.0%) | 0 (0.0%) |
| 18 to 34 Years | 0 (0.0%) | 19 (1.6%) |
| 35 to 64 Years | 130 (10.3%) | 82 (7.3%) |
| 65 to 74 Years | 108 (21.5%) | 25 (5.8%) |
| 75 Years and over | 110 (39.0%) | 54 (15.6%) |
Disability Class: Self-Care Difficulty
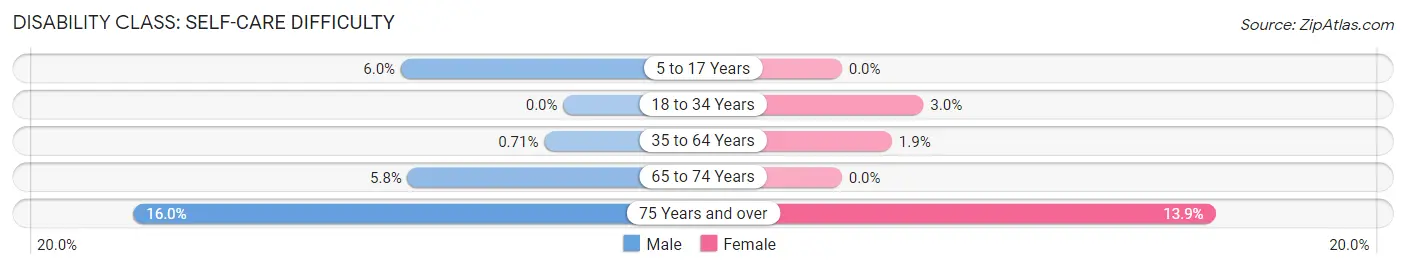
| Age Bracket | Male | Female |
| 5 to 17 Years | 39 (6.0%) | 0 (0.0%) |
| 18 to 34 Years | 0 (0.0%) | 35 (3.0%) |
| 35 to 64 Years | 9 (0.7%) | 21 (1.9%) |
| 65 to 74 Years | 29 (5.8%) | 0 (0.0%) |
| 75 Years and over | 45 (16.0%) | 48 (13.9%) |
Technology Access in Payette
Computing Device Access in Payette
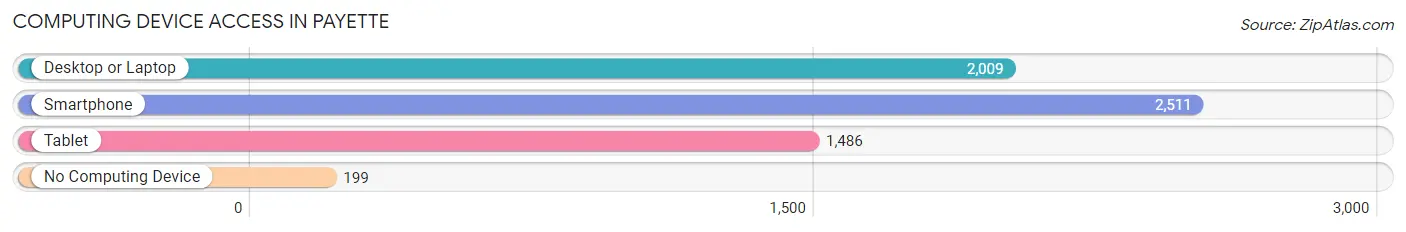
| Device Type | # Households | % Households |
| Desktop or Laptop | 2,009 | 67.5% |
| Smartphone | 2,511 | 84.4% |
| Tablet | 1,486 | 49.9% |
| No Computing Device | 199 | 6.7% |
| Total | 2,977 | 100.0% |
Internet Access in Payette
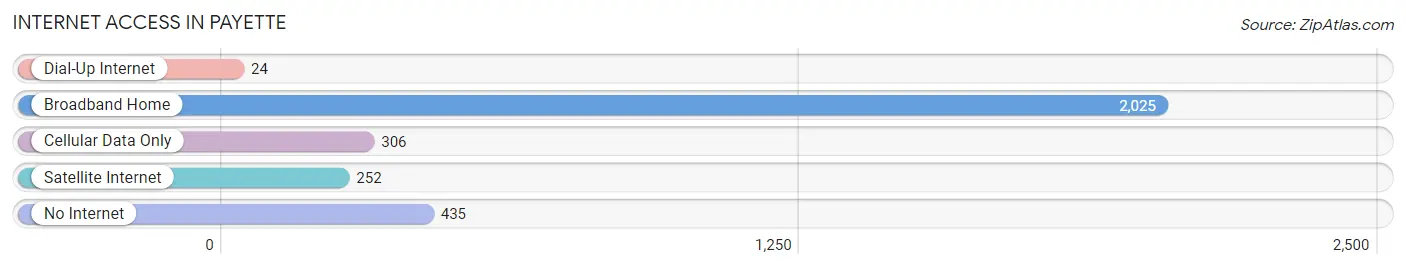
| Internet Type | # Households | % Households |
| Dial-Up Internet | 24 | 0.8% |
| Broadband Home | 2,025 | 68.0% |
| Cellular Data Only | 306 | 10.3% |
| Satellite Internet | 252 | 8.5% |
| No Internet | 435 | 14.6% |
| Total | 2,977 | 100.0% |
Payette Summary
Payette, Idaho is a small city located in the western part of the state, near the Oregon border. It is the county seat of Payette County and has a population of approximately 7,000 people. The city is situated in a valley surrounded by the Payette River and the Snake River.
History
Payette was founded in 1883 by a group of settlers from Oregon. The city was named after Francois Payette, a French-Canadian fur trapper who had explored the area in the early 1800s. The city was incorporated in 1891 and quickly became a center of commerce and industry. The city was home to several sawmills, a flour mill, and a brickyard.
Geography
Payette is located in the western part of Idaho, near the Oregon border. The city is situated in a valley surrounded by the Payette River and the Snake River. The city is located at an elevation of 2,845 feet above sea level. The climate is semi-arid, with hot summers and cold winters.
Economy
Payette’s economy is largely based on agriculture and manufacturing. The city is home to several food processing plants, as well as a number of agricultural businesses. The city is also home to several retail stores, restaurants, and other businesses.
Demographics
As of the 2010 census, Payette had a population of 7,000 people. The racial makeup of the city was 90.3% White, 0.7% African American, 0.4% Native American, 0.3% Asian, 0.1% Pacific Islander, and 8.2% from other races. The median household income was $35,000, and the median family income was $41,000.
Conclusion
Payette, Idaho is a small city located in the western part of the state, near the Oregon border. It is the county seat of Payette County and has a population of approximately 7,000 people. The city is situated in a valley surrounded by the Payette River and the Snake River. The economy of Payette is largely based on agriculture and manufacturing, and the city is home to several food processing plants, as well as a number of agricultural businesses. The racial makeup of the city is 90.3% White, 0.7% African American, 0.4% Native American, 0.3% Asian, 0.1% Pacific Islander, and 8.2% from other races. The median household income was $35,000, and the median family income was $41,000.
Common Questions
What is Per Capita Income in Payette?
Per Capita income in Payette is $23,757.
What is the Median Family Income in Payette?
Median Family Income in Payette is $59,637.
What is the Median Household income in Payette?
Median Household Income in Payette is $51,477.
What is Income or Wage Gap in Payette?
Income or Wage Gap in Payette is 47.3%.
Women in Payette earn 52.7 cents for every dollar earned by a man.
What is Inequality or Gini Index in Payette?
Inequality or Gini Index in Payette is 0.37.
What is the Total Population of Payette?
Total Population of Payette is 8,182.
What is the Total Male Population of Payette?
Total Male Population of Payette is 3,843.
What is the Total Female Population of Payette?
Total Female Population of Payette is 4,339.
What is the Ratio of Males per 100 Females in Payette?
There are 88.57 Males per 100 Females in Payette.
What is the Ratio of Females per 100 Males in Payette?
There are 112.91 Females per 100 Males in Payette.
What is the Median Population Age in Payette?
Median Population Age in Payette is 34.8 Years.
What is the Average Family Size in Payette
Average Family Size in Payette is 3.1 People.
What is the Average Household Size in Payette
Average Household Size in Payette is 2.7 People.
How Large is the Labor Force in Payette?
There are 3,502 People in the Labor Forcein in Payette.
What is the Percentage of People in the Labor Force in Payette?
56.2% of People are in the Labor Force in Payette.
What is the Unemployment Rate in Payette?
Unemployment Rate in Payette is 7.2%.