Mountain Home, ID Map & Demographics
Mountain Home Map
Mountain Home Overview
$26,904
PER CAPITA INCOME
$65,846
AVG FAMILY INCOME
$53,108
AVG HOUSEHOLD INCOME
28.8%
WAGE / INCOME GAP [ % ]
71.2¢/ $1
WAGE / INCOME GAP [ $ ]
0.39
INEQUALITY / GINI INDEX
16,026
TOTAL POPULATION
8,197
MALE POPULATION
7,829
FEMALE POPULATION
104.70
MALES / 100 FEMALES
95.51
FEMALES / 100 MALES
31.3
MEDIAN AGE
3.2
AVG FAMILY SIZE
2.5
AVG HOUSEHOLD SIZE
7,441
LABOR FORCE [ PEOPLE ]
60.9%
PERCENT IN LABOR FORCE
6.0%
UNEMPLOYMENT RATE
Mountain Home Zip Codes
Mountain Home Area Codes
Income in Mountain Home
Income Overview in Mountain Home
Per Capita Income in Mountain Home is $26,904, while median incomes of families and households are $65,846 and $53,108 respectively.
| Characteristic | Number | Measure |
| Per Capita Income | 16,026 | $26,904 |
| Median Family Income | 3,552 | $65,846 |
| Mean Family Income | 3,552 | $74,438 |
| Median Household Income | 6,184 | $53,108 |
| Mean Household Income | 6,184 | $65,454 |
| Income Deficit | 3,552 | $0 |
| Wage / Income Gap (%) | 16,026 | 28.82% |
| Wage / Income Gap ($) | 16,026 | 71.18¢ per $1 |
| Gini / Inequality Index | 16,026 | 0.39 |
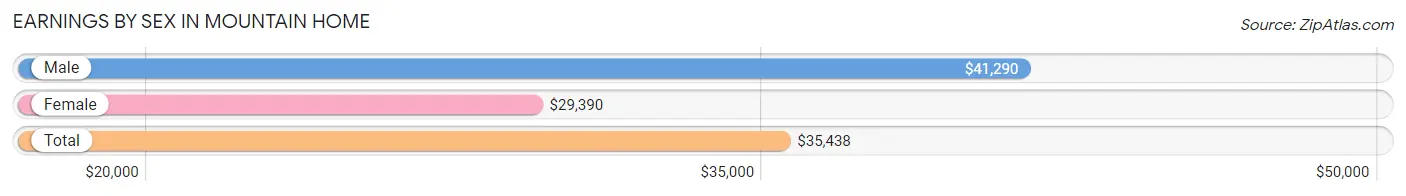
Earnings by Sex in Mountain Home
Average Earnings in Mountain Home are $35,438, $41,290 for men and $29,390 for women, a difference of 28.8%.
| Sex | Number | Average Earnings |
| Male | 4,488 (57.3%) | $41,290 |
| Female | 3,340 (42.7%) | $29,390 |
| Total | 7,828 (100.0%) | $35,438 |
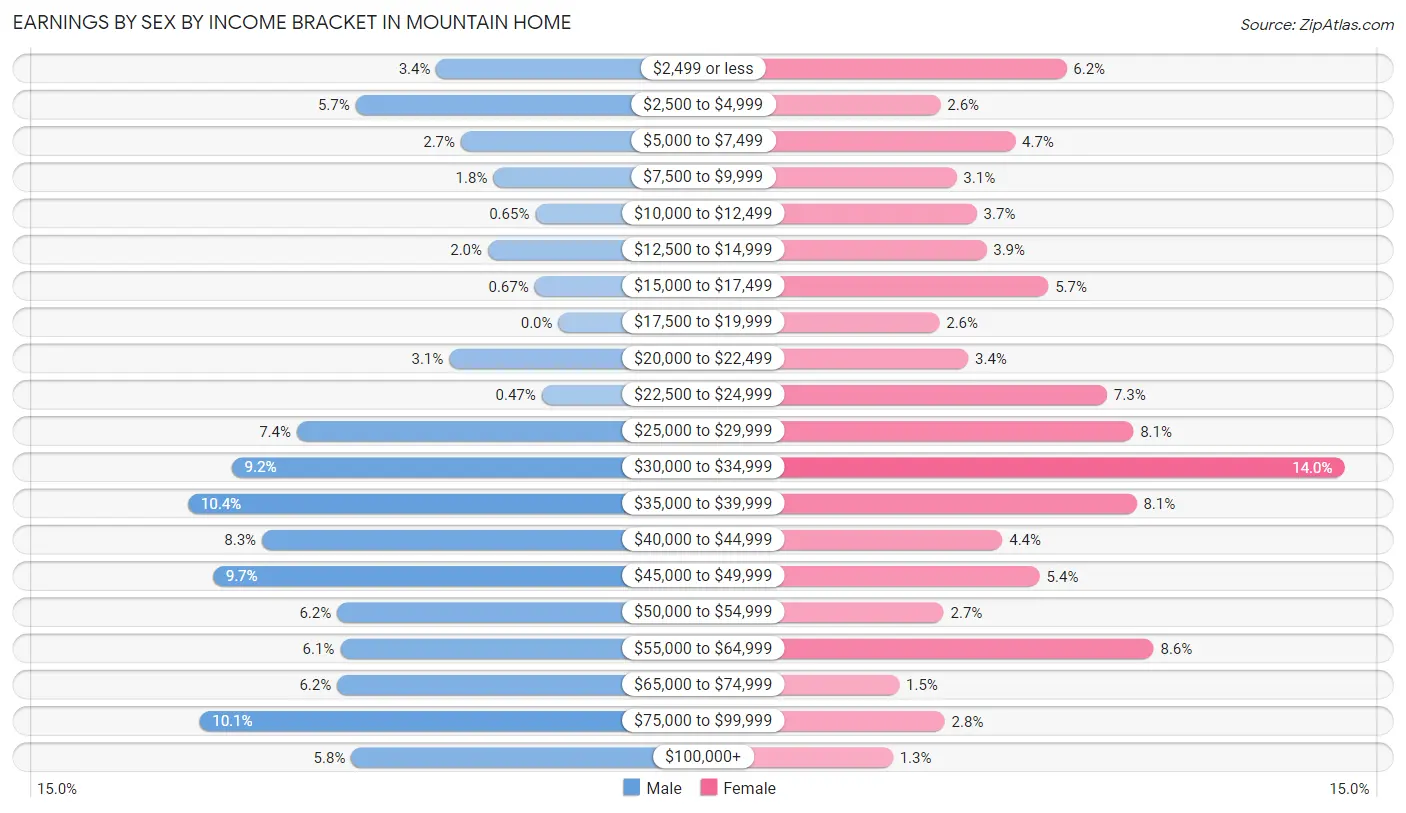
Earnings by Sex by Income Bracket in Mountain Home
The most common earnings brackets in Mountain Home are $35,000 to $39,999 for men (467 | 10.4%) and $30,000 to $34,999 for women (467 | 14.0%).
| Income | Male | Female |
| $2,499 or less | 154 (3.4%) | 206 (6.2%) |
| $2,500 to $4,999 | 256 (5.7%) | 88 (2.6%) |
| $5,000 to $7,499 | 123 (2.7%) | 158 (4.7%) |
| $7,500 to $9,999 | 82 (1.8%) | 103 (3.1%) |
| $10,000 to $12,499 | 29 (0.6%) | 122 (3.6%) |
| $12,500 to $14,999 | 89 (2.0%) | 131 (3.9%) |
| $15,000 to $17,499 | 30 (0.7%) | 189 (5.7%) |
| $17,500 to $19,999 | 0 (0.0%) | 87 (2.6%) |
| $20,000 to $22,499 | 138 (3.1%) | 114 (3.4%) |
| $22,500 to $24,999 | 21 (0.5%) | 244 (7.3%) |
| $25,000 to $29,999 | 330 (7.3%) | 269 (8.1%) |
| $30,000 to $34,999 | 412 (9.2%) | 467 (14.0%) |
| $35,000 to $39,999 | 467 (10.4%) | 272 (8.1%) |
| $40,000 to $44,999 | 374 (8.3%) | 146 (4.4%) |
| $45,000 to $49,999 | 436 (9.7%) | 181 (5.4%) |
| $50,000 to $54,999 | 279 (6.2%) | 91 (2.7%) |
| $55,000 to $64,999 | 275 (6.1%) | 288 (8.6%) |
| $65,000 to $74,999 | 279 (6.2%) | 49 (1.5%) |
| $75,000 to $99,999 | 453 (10.1%) | 92 (2.8%) |
| $100,000+ | 261 (5.8%) | 43 (1.3%) |
| Total | 4,488 (100.0%) | 3,340 (100.0%) |
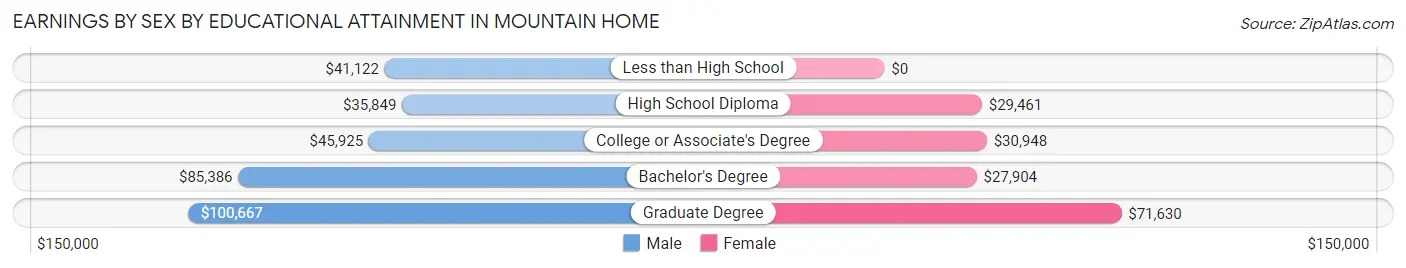
Earnings by Sex by Educational Attainment in Mountain Home
Average earnings in Mountain Home are $44,097 for men and $30,972 for women, a difference of 29.8%. Men with an educational attainment of graduate degree enjoy the highest average annual earnings of $100,667, while those with high school diploma education earn the least with $35,849. Women with an educational attainment of graduate degree earn the most with the average annual earnings of $71,630, while those with bachelor's degree education have the smallest earnings of $27,904.
| Educational Attainment | Male Income | Female Income |
| Less than High School | $41,122 | $0 |
| High School Diploma | $35,849 | $29,461 |
| College or Associate's Degree | $45,925 | $30,948 |
| Bachelor's Degree | $85,386 | $27,904 |
| Graduate Degree | $100,667 | $71,630 |
| Total | $44,097 | $30,972 |
Family Income in Mountain Home
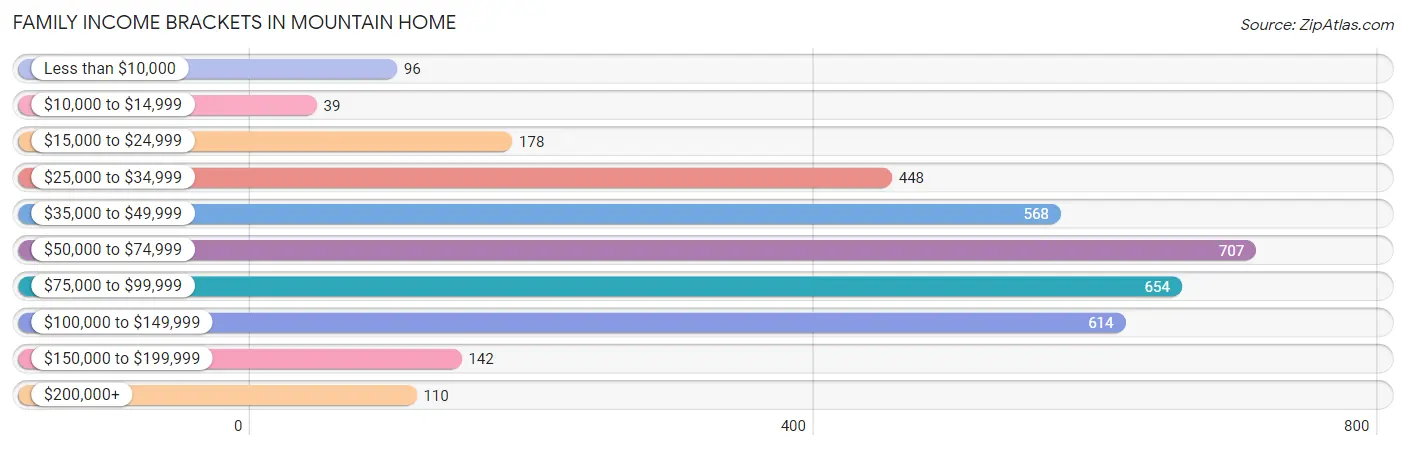
Family Income Brackets in Mountain Home
According to the Mountain Home family income data, there are 707 families falling into the $50,000 to $74,999 income range, which is the most common income bracket and makes up 19.9% of all families. Conversely, the $10,000 to $14,999 income bracket is the least frequent group with only 39 families (1.1%) belonging to this category.
| Income Bracket | # Families | % Families |
| Less than $10,000 | 96 | 2.7% |
| $10,000 to $14,999 | 39 | 1.1% |
| $15,000 to $24,999 | 178 | 5.0% |
| $25,000 to $34,999 | 448 | 12.6% |
| $35,000 to $49,999 | 568 | 16.0% |
| $50,000 to $74,999 | 707 | 19.9% |
| $75,000 to $99,999 | 654 | 18.4% |
| $100,000 to $149,999 | 614 | 17.3% |
| $150,000 to $199,999 | 142 | 4.0% |
| $200,000+ | 110 | 3.1% |
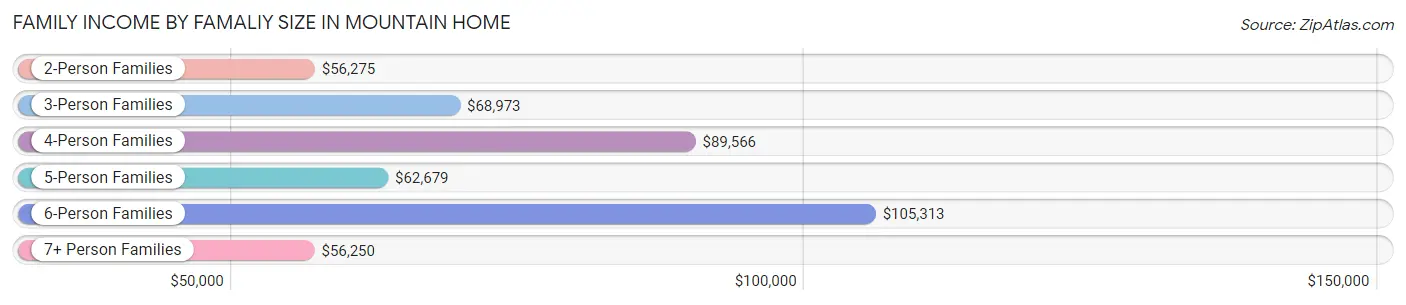
Family Income by Famaliy Size in Mountain Home
6-person families (83 | 2.3%) account for the highest median family income in Mountain Home with $105,313 per family, while 2-person families (1,678 | 47.2%) have the highest median income of $28,138 per family member.
| Income Bracket | # Families | Median Income |
| 2-Person Families | 1,678 (47.2%) | $56,275 |
| 3-Person Families | 809 (22.8%) | $68,973 |
| 4-Person Families | 563 (15.9%) | $89,566 |
| 5-Person Families | 301 (8.5%) | $62,679 |
| 6-Person Families | 83 (2.3%) | $105,313 |
| 7+ Person Families | 118 (3.3%) | $56,250 |
| Total | 3,552 (100.0%) | $65,846 |
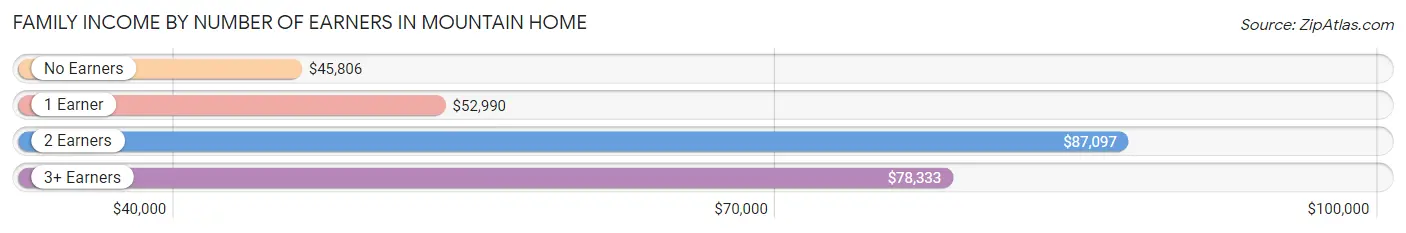
Family Income by Number of Earners in Mountain Home
The median family income in Mountain Home is $65,846, with families comprising 2 earners (1,332) having the highest median family income of $87,097, while families with no earners (672) have the lowest median family income of $45,806, accounting for 37.5% and 18.9% of families, respectively.
| Number of Earners | # Families | Median Income |
| No Earners | 672 (18.9%) | $45,806 |
| 1 Earner | 1,286 (36.2%) | $52,990 |
| 2 Earners | 1,332 (37.5%) | $87,097 |
| 3+ Earners | 262 (7.4%) | $78,333 |
| Total | 3,552 (100.0%) | $65,846 |
Household Income in Mountain Home
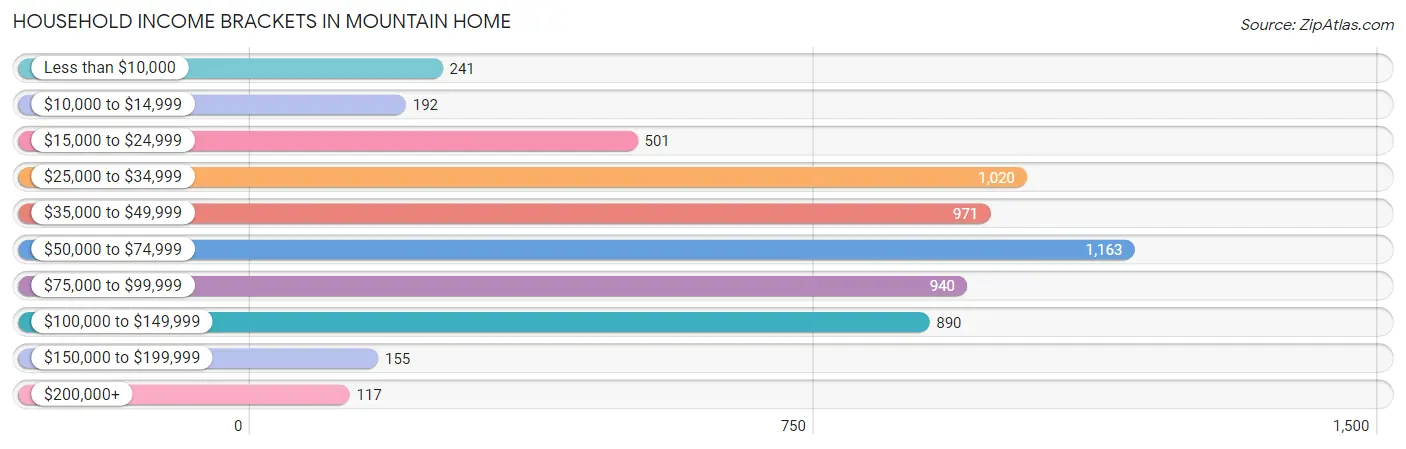
Household Income Brackets in Mountain Home
With 1,163 households falling in the category, the $50,000 to $74,999 income range is the most frequent in Mountain Home, accounting for 18.8% of all households. In contrast, only 117 households (1.9%) fall into the $200,000+ income bracket, making it the least populous group.
| Income Bracket | # Households | % Households |
| Less than $10,000 | 241 | 3.9% |
| $10,000 to $14,999 | 192 | 3.1% |
| $15,000 to $24,999 | 501 | 8.1% |
| $25,000 to $34,999 | 1,020 | 16.5% |
| $35,000 to $49,999 | 971 | 15.7% |
| $50,000 to $74,999 | 1,163 | 18.8% |
| $75,000 to $99,999 | 940 | 15.2% |
| $100,000 to $149,999 | 890 | 14.4% |
| $150,000 to $199,999 | 155 | 2.5% |
| $200,000+ | 117 | 1.9% |
Household Income by Householder Age in Mountain Home
The median household income in Mountain Home is $53,108, with the highest median household income of $60,851 found in the 25 to 44 years age bracket for the primary householder. A total of 2,520 households (40.7%) fall into this category. Meanwhile, the 15 to 24 years age bracket for the primary householder has the lowest median household income of $34,231, with 635 households (10.3%) in this group.
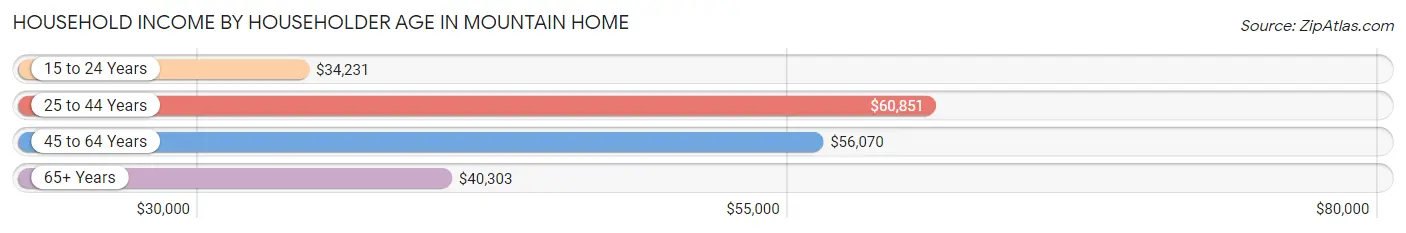
| Income Bracket | # Households | Median Income |
| 15 to 24 Years | 635 (10.3%) | $34,231 |
| 25 to 44 Years | 2,520 (40.7%) | $60,851 |
| 45 to 64 Years | 1,727 (27.9%) | $56,070 |
| 65+ Years | 1,302 (21.0%) | $40,303 |
| Total | 6,184 (100.0%) | $53,108 |
Poverty in Mountain Home
Income Below Poverty by Sex and Age in Mountain Home
With 10.0% poverty level for males and 13.9% for females among the residents of Mountain Home, 55 to 64 year old males and under 5 year old females are the most vulnerable to poverty, with 200 males (23.3%) and 132 females (24.3%) in their respective age groups living below the poverty level.
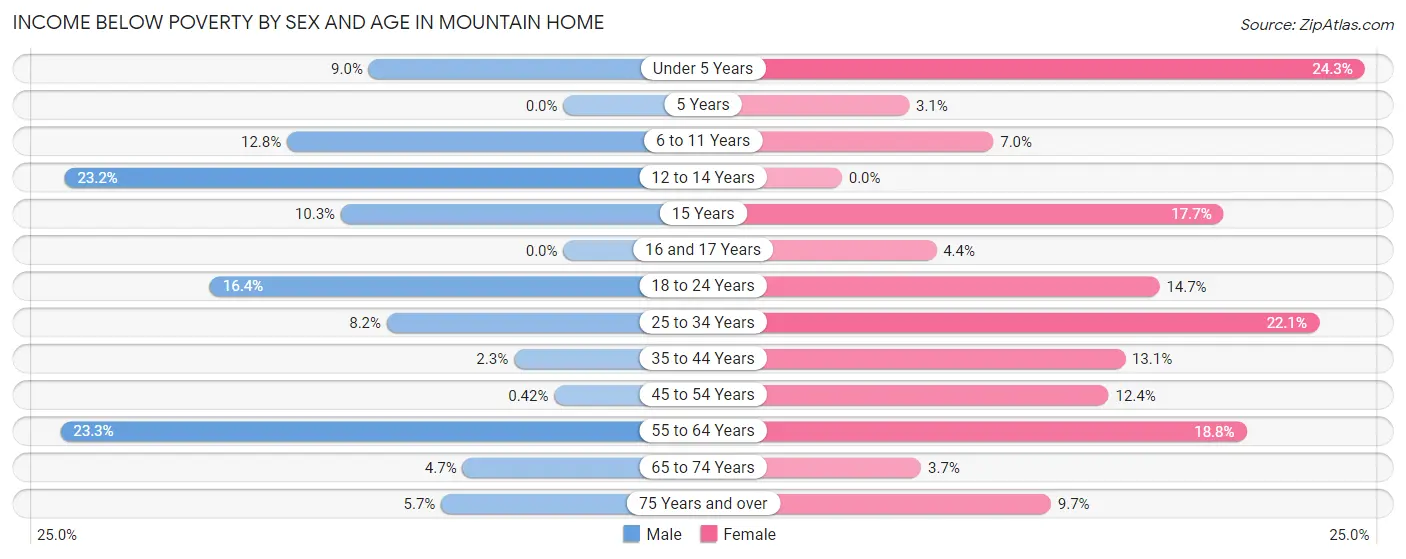
| Age Bracket | Male | Female |
| Under 5 Years | 63 (9.0%) | 132 (24.3%) |
| 5 Years | 0 (0.0%) | 3 (3.1%) |
| 6 to 11 Years | 86 (12.8%) | 36 (7.0%) |
| 12 to 14 Years | 78 (23.2%) | 0 (0.0%) |
| 15 Years | 16 (10.3%) | 17 (17.7%) |
| 16 and 17 Years | 0 (0.0%) | 6 (4.4%) |
| 18 to 24 Years | 133 (16.4%) | 131 (14.7%) |
| 25 to 34 Years | 139 (8.2%) | 307 (22.1%) |
| 35 to 44 Years | 20 (2.3%) | 102 (13.1%) |
| 45 to 54 Years | 3 (0.4%) | 90 (12.4%) |
| 55 to 64 Years | 200 (23.3%) | 168 (18.8%) |
| 65 to 74 Years | 18 (4.7%) | 23 (3.7%) |
| 75 Years and over | 24 (5.7%) | 51 (9.7%) |
| Total | 780 (10.0%) | 1,066 (13.9%) |
Income Above Poverty by Sex and Age in Mountain Home
According to the poverty statistics in Mountain Home, males aged 5 years and females aged 12 to 14 years are the age groups that are most secure financially, with 100.0% of males and 100.0% of females in these age groups living above the poverty line.
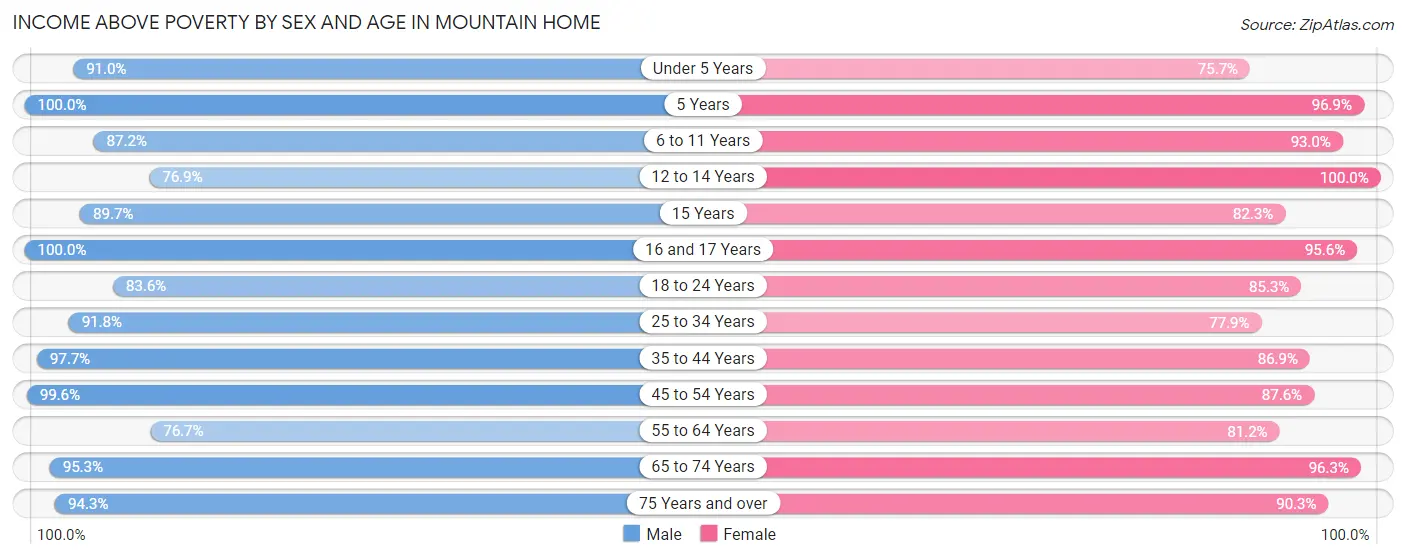
| Age Bracket | Male | Female |
| Under 5 Years | 635 (91.0%) | 412 (75.7%) |
| 5 Years | 15 (100.0%) | 93 (96.9%) |
| 6 to 11 Years | 585 (87.2%) | 476 (93.0%) |
| 12 to 14 Years | 259 (76.8%) | 479 (100.0%) |
| 15 Years | 139 (89.7%) | 79 (82.3%) |
| 16 and 17 Years | 165 (100.0%) | 131 (95.6%) |
| 18 to 24 Years | 678 (83.6%) | 758 (85.3%) |
| 25 to 34 Years | 1,558 (91.8%) | 1,080 (77.9%) |
| 35 to 44 Years | 853 (97.7%) | 674 (86.9%) |
| 45 to 54 Years | 707 (99.6%) | 637 (87.6%) |
| 55 to 64 Years | 657 (76.7%) | 727 (81.2%) |
| 65 to 74 Years | 367 (95.3%) | 602 (96.3%) |
| 75 Years and over | 399 (94.3%) | 475 (90.3%) |
| Total | 7,017 (90.0%) | 6,623 (86.1%) |
Income Below Poverty Among Married-Couple Families in Mountain Home
The poverty statistics for married-couple families in Mountain Home show that 6.0% or 144 of the total 2,395 families live below the poverty line. Families with 3 or 4 children have the highest poverty rate of 16.8%, comprising of 35 families. On the other hand, families with 5 or more children have the lowest poverty rate of 0.0%, which includes 0 families.
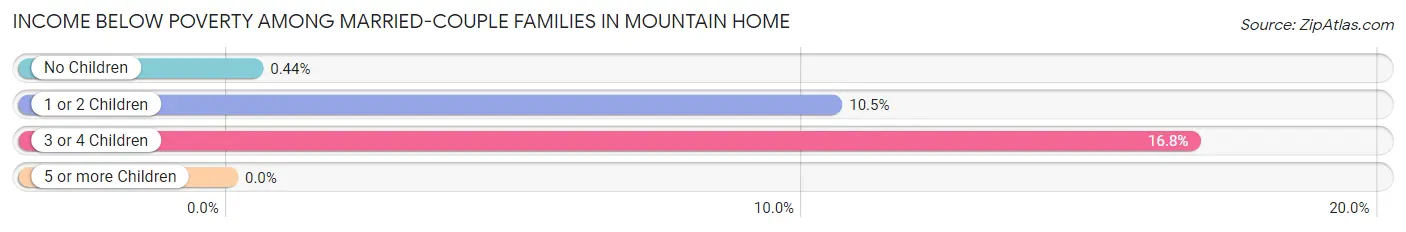
| Children | Above Poverty | Below Poverty |
| No Children | 1,137 (99.6%) | 5 (0.4%) |
| 1 or 2 Children | 885 (89.5%) | 104 (10.5%) |
| 3 or 4 Children | 174 (83.3%) | 35 (16.8%) |
| 5 or more Children | 55 (100.0%) | 0 (0.0%) |
| Total | 2,251 (94.0%) | 144 (6.0%) |
Income Below Poverty Among Single-Parent Households in Mountain Home
According to the poverty data in Mountain Home, 12.4% or 36 single-father households and 15.1% or 131 single-mother households are living below the poverty line. Among single-father households, those with no children have the highest poverty rate, with 19 households (19.2%) experiencing poverty. Likewise, among single-mother households, those with 1 or 2 children have the highest poverty rate, with 111 households (21.4%) falling below the poverty line.
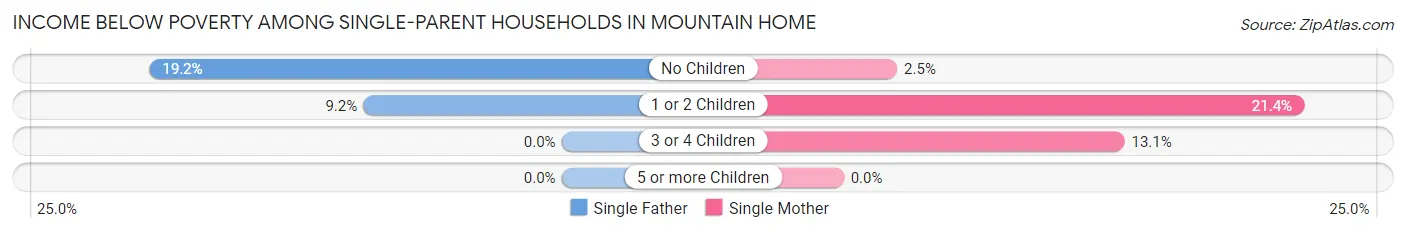
| Children | Single Father | Single Mother |
| No Children | 19 (19.2%) | 6 (2.5%) |
| 1 or 2 Children | 17 (9.2%) | 111 (21.4%) |
| 3 or 4 Children | 0 (0.0%) | 14 (13.1%) |
| 5 or more Children | 0 (0.0%) | 0 (0.0%) |
| Total | 36 (12.4%) | 131 (15.1%) |
Income Below Poverty Among Married-Couple vs Single-Parent Households in Mountain Home
The poverty data for Mountain Home shows that 144 of the married-couple family households (6.0%) and 167 of the single-parent households (14.4%) are living below the poverty level. Within the married-couple family households, those with 3 or 4 children have the highest poverty rate, with 35 households (16.8%) falling below the poverty line. Among the single-parent households, those with 1 or 2 children have the highest poverty rate, with 128 household (18.2%) living below poverty.
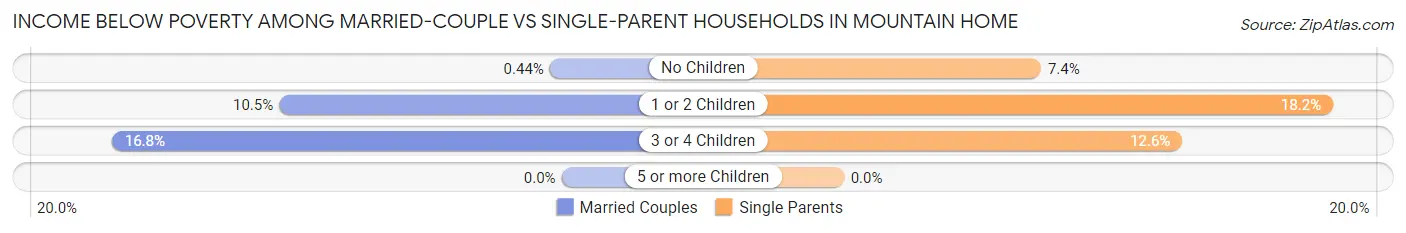
| Children | Married-Couple Families | Single-Parent Households |
| No Children | 5 (0.4%) | 25 (7.3%) |
| 1 or 2 Children | 104 (10.5%) | 128 (18.2%) |
| 3 or 4 Children | 35 (16.8%) | 14 (12.6%) |
| 5 or more Children | 0 (0.0%) | 0 (0.0%) |
| Total | 144 (6.0%) | 167 (14.4%) |
Race in Mountain Home
The most populous races in Mountain Home are White / Caucasian (12,224 | 76.3%), Hispanic or Latino (2,284 | 14.2%), and Two or more Races (1,546 | 9.7%).
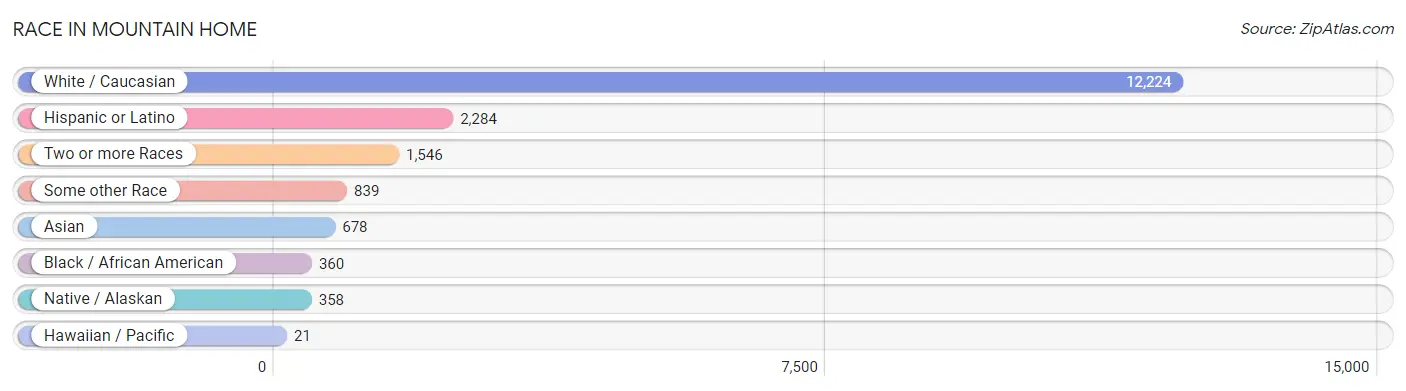
| Race | # Population | % Population |
| Asian | 678 | 4.2% |
| Black / African American | 360 | 2.2% |
| Hawaiian / Pacific | 21 | 0.1% |
| Hispanic or Latino | 2,284 | 14.2% |
| Native / Alaskan | 358 | 2.2% |
| White / Caucasian | 12,224 | 76.3% |
| Two or more Races | 1,546 | 9.7% |
| Some other Race | 839 | 5.2% |
| Total | 16,026 | 100.0% |
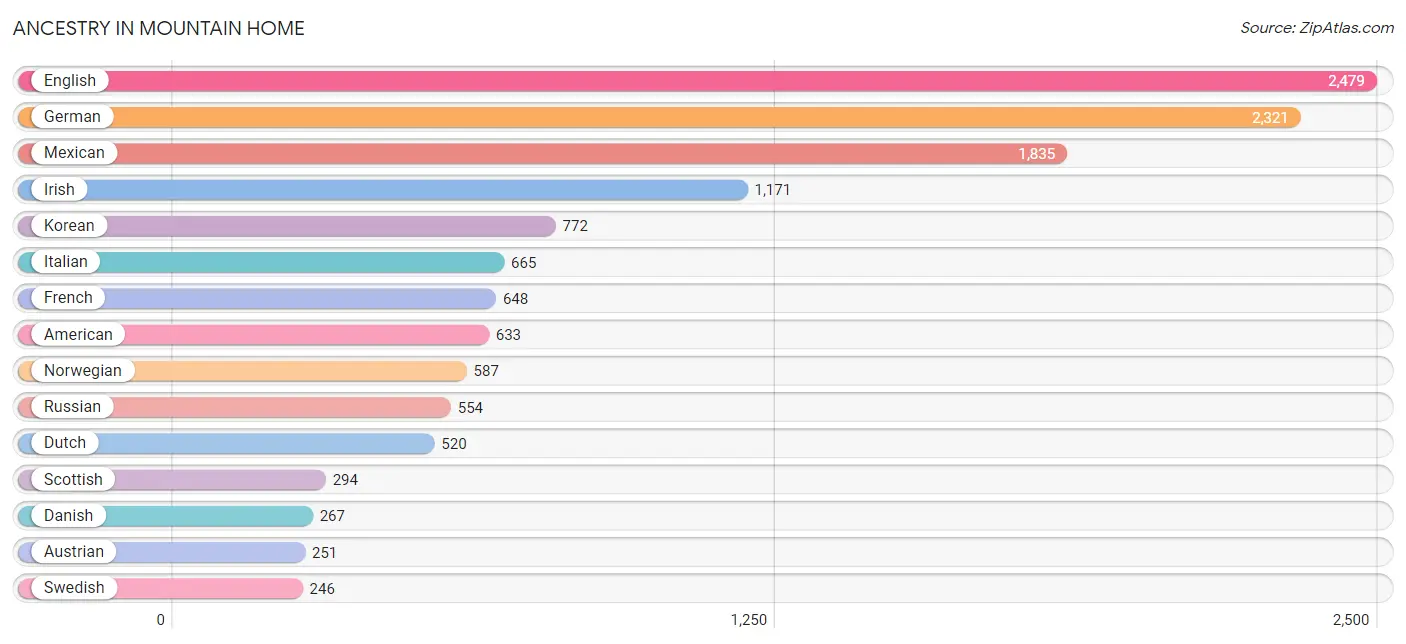
Ancestry in Mountain Home
The most populous ancestries reported in Mountain Home are English (2,479 | 15.5%), German (2,321 | 14.5%), Mexican (1,835 | 11.5%), Irish (1,171 | 7.3%), and Korean (772 | 4.8%), together accounting for 53.5% of all Mountain Home residents.
| Ancestry | # Population | % Population |
| African | 5 | 0.0% |
| Alaska Native | 6 | 0.0% |
| American | 633 | 4.0% |
| Apache | 8 | 0.1% |
| Austrian | 251 | 1.6% |
| Basque | 151 | 0.9% |
| Belgian | 3 | 0.0% |
| Bhutanese | 151 | 0.9% |
| Blackfeet | 18 | 0.1% |
| British | 31 | 0.2% |
| Burmese | 19 | 0.1% |
| Cajun | 15 | 0.1% |
| Canadian | 10 | 0.1% |
| Central American | 106 | 0.7% |
| Central American Indian | 86 | 0.5% |
| Cherokee | 106 | 0.7% |
| Chippewa | 11 | 0.1% |
| Comanche | 21 | 0.1% |
| Czech | 7 | 0.0% |
| Czechoslovakian | 18 | 0.1% |
| Danish | 267 | 1.7% |
| Dominican | 22 | 0.1% |
| Dutch | 520 | 3.2% |
| Eastern European | 6 | 0.0% |
| English | 2,479 | 15.5% |
| European | 120 | 0.7% |
| Finnish | 46 | 0.3% |
| French | 648 | 4.0% |
| French Canadian | 53 | 0.3% |
| German | 2,321 | 14.5% |
| Greek | 24 | 0.2% |
| Guatemalan | 94 | 0.6% |
| Hungarian | 72 | 0.4% |
| Indian (Asian) | 212 | 1.3% |
| Irish | 1,171 | 7.3% |
| Italian | 665 | 4.2% |
| Korean | 772 | 4.8% |
| Malaysian | 6 | 0.0% |
| Mexican | 1,835 | 11.5% |
| Mexican American Indian | 86 | 0.5% |
| Native Hawaiian | 48 | 0.3% |
| Navajo | 24 | 0.2% |
| Nigerian | 43 | 0.3% |
| Norwegian | 587 | 3.7% |
| Okinawan | 38 | 0.2% |
| Paiute | 17 | 0.1% |
| Pakistani | 8 | 0.1% |
| Peruvian | 32 | 0.2% |
| Polish | 143 | 0.9% |
| Portuguese | 7 | 0.0% |
| Puerto Rican | 174 | 1.1% |
| Russian | 554 | 3.5% |
| Salvadoran | 12 | 0.1% |
| Scandinavian | 153 | 0.9% |
| Scotch-Irish | 120 | 0.7% |
| Scottish | 294 | 1.8% |
| Seminole | 12 | 0.1% |
| Shoshone | 30 | 0.2% |
| Sioux | 92 | 0.6% |
| South American | 32 | 0.2% |
| Spaniard | 21 | 0.1% |
| Spanish | 29 | 0.2% |
| Subsaharan African | 48 | 0.3% |
| Swedish | 246 | 1.5% |
| Swiss | 130 | 0.8% |
| Thai | 31 | 0.2% |
| Tlingit-Haida | 40 | 0.3% |
| Trinidadian and Tobagonian | 9 | 0.1% |
| Ukrainian | 6 | 0.0% |
| Welsh | 195 | 1.2% |
| Yugoslavian | 45 | 0.3% | View All 71 Rows |
Immigrants in Mountain Home
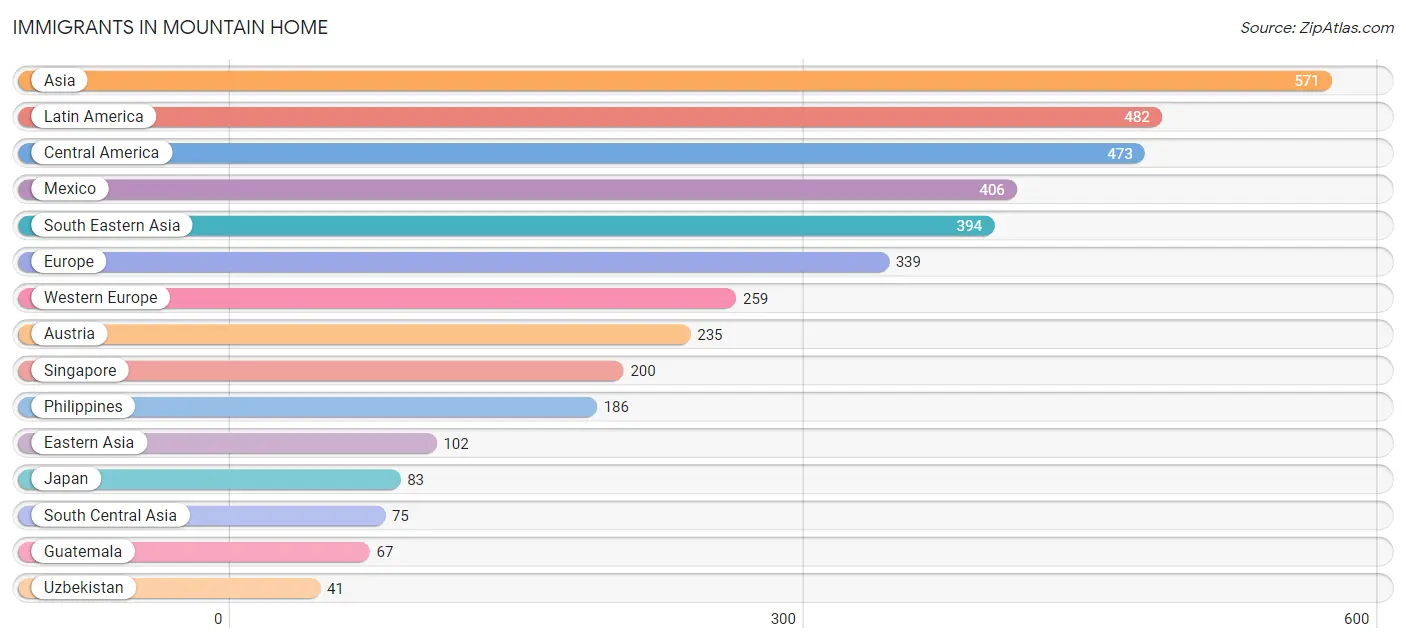
The most numerous immigrant groups reported in Mountain Home came from Asia (571 | 3.6%), Latin America (482 | 3.0%), Central America (473 | 2.9%), Mexico (406 | 2.5%), and South Eastern Asia (394 | 2.5%), together accounting for 14.5% of all Mountain Home residents.
| Immigration Origin | # Population | % Population |
| Africa | 16 | 0.1% |
| Asia | 571 | 3.6% |
| Austria | 235 | 1.5% |
| Canada | 29 | 0.2% |
| Caribbean | 9 | 0.1% |
| Central America | 473 | 2.9% |
| China | 19 | 0.1% |
| Eastern Asia | 102 | 0.6% |
| England | 35 | 0.2% |
| Europe | 339 | 2.1% |
| Germany | 24 | 0.2% |
| Guatemala | 67 | 0.4% |
| Japan | 83 | 0.5% |
| Latin America | 482 | 3.0% |
| Liberia | 5 | 0.0% |
| Mexico | 406 | 2.5% |
| Nigeria | 11 | 0.1% |
| Northern Europe | 40 | 0.3% |
| Philippines | 186 | 1.2% |
| Singapore | 200 | 1.3% |
| South Central Asia | 75 | 0.5% |
| South Eastern Asia | 394 | 2.5% |
| Southern Europe | 40 | 0.3% |
| Spain | 40 | 0.3% |
| Thailand | 8 | 0.1% |
| Trinidad and Tobago | 9 | 0.1% |
| Uzbekistan | 41 | 0.3% |
| Western Africa | 16 | 0.1% |
| Western Europe | 259 | 1.6% | View All 29 Rows |
Sex and Age in Mountain Home
Sex and Age in Mountain Home
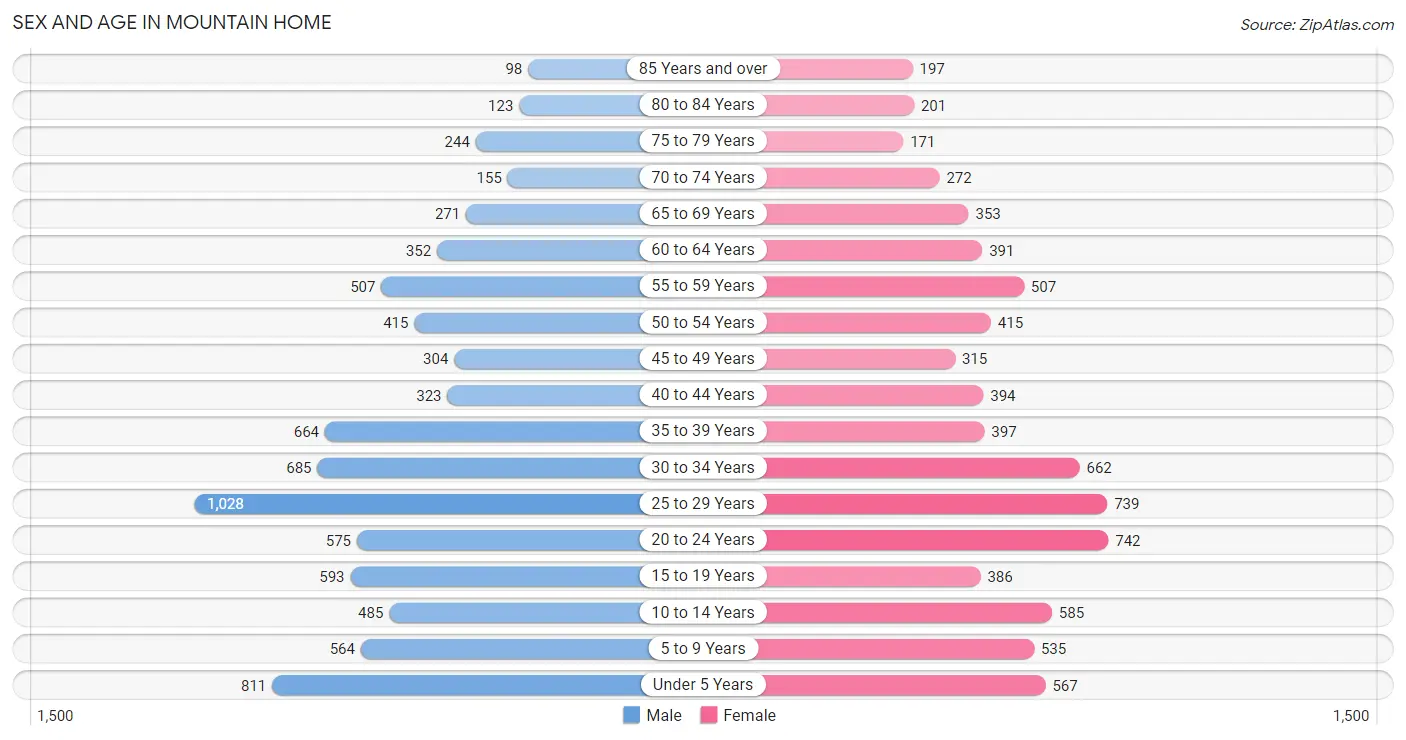
The most populous age groups in Mountain Home are 25 to 29 Years (1,028 | 12.5%) for men and 20 to 24 Years (742 | 9.5%) for women.
| Age Bracket | Male | Female |
| Under 5 Years | 811 (9.9%) | 567 (7.2%) |
| 5 to 9 Years | 564 (6.9%) | 535 (6.8%) |
| 10 to 14 Years | 485 (5.9%) | 585 (7.5%) |
| 15 to 19 Years | 593 (7.2%) | 386 (4.9%) |
| 20 to 24 Years | 575 (7.0%) | 742 (9.5%) |
| 25 to 29 Years | 1,028 (12.5%) | 739 (9.4%) |
| 30 to 34 Years | 685 (8.4%) | 662 (8.5%) |
| 35 to 39 Years | 664 (8.1%) | 397 (5.1%) |
| 40 to 44 Years | 323 (3.9%) | 394 (5.0%) |
| 45 to 49 Years | 304 (3.7%) | 315 (4.0%) |
| 50 to 54 Years | 415 (5.1%) | 415 (5.3%) |
| 55 to 59 Years | 507 (6.2%) | 507 (6.5%) |
| 60 to 64 Years | 352 (4.3%) | 391 (5.0%) |
| 65 to 69 Years | 271 (3.3%) | 353 (4.5%) |
| 70 to 74 Years | 155 (1.9%) | 272 (3.5%) |
| 75 to 79 Years | 244 (3.0%) | 171 (2.2%) |
| 80 to 84 Years | 123 (1.5%) | 201 (2.6%) |
| 85 Years and over | 98 (1.2%) | 197 (2.5%) |
| Total | 8,197 (100.0%) | 7,829 (100.0%) |
Families and Households in Mountain Home
Median Family Size in Mountain Home
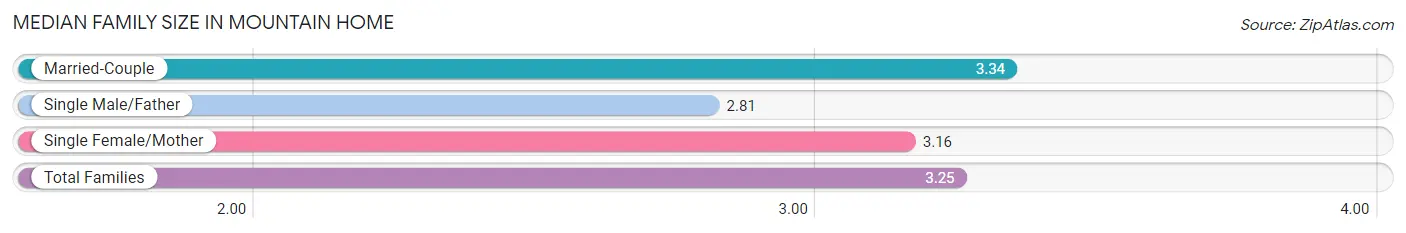
The median family size in Mountain Home is 3.25 persons per family, with married-couple families (2,395 | 67.4%) accounting for the largest median family size of 3.34 persons per family. On the other hand, single male/father families (291 | 8.2%) represent the smallest median family size with 2.81 persons per family.
| Family Type | # Families | Family Size |
| Married-Couple | 2,395 (67.4%) | 3.34 |
| Single Male/Father | 291 (8.2%) | 2.81 |
| Single Female/Mother | 866 (24.4%) | 3.16 |
| Total Families | 3,552 (100.0%) | 3.25 |
Median Household Size in Mountain Home
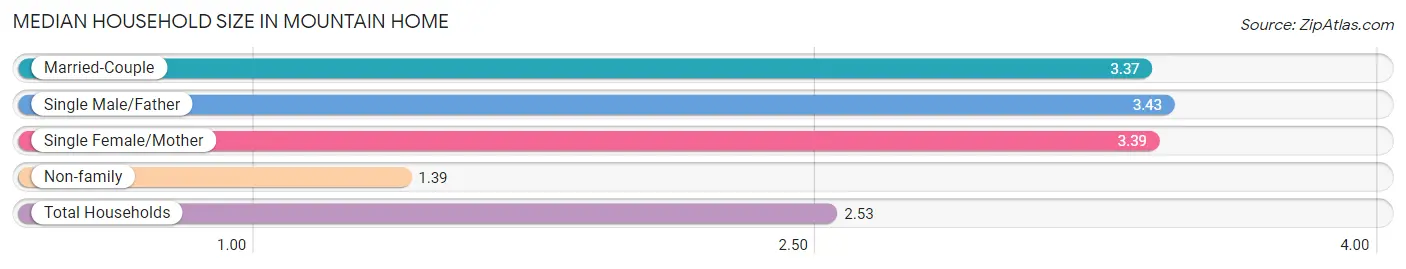
The median household size in Mountain Home is 2.53 persons per household, with single male/father households (291 | 4.7%) accounting for the largest median household size of 3.43 persons per household. non-family households (2,632 | 42.6%) represent the smallest median household size with 1.39 persons per household.
| Household Type | # Households | Household Size |
| Married-Couple | 2,395 (38.7%) | 3.37 |
| Single Male/Father | 291 (4.7%) | 3.43 |
| Single Female/Mother | 866 (14.0%) | 3.39 |
| Non-family | 2,632 (42.6%) | 1.39 |
| Total Households | 6,184 (100.0%) | 2.53 |
Household Size by Marriage Status in Mountain Home
Out of a total of 6,184 households in Mountain Home, 3,552 (57.4%) are family households, while 2,632 (42.6%) are nonfamily households. The most numerous type of family households are 2-person households, comprising 1,517, and the most common type of nonfamily households are 1-person households, comprising 2,090.
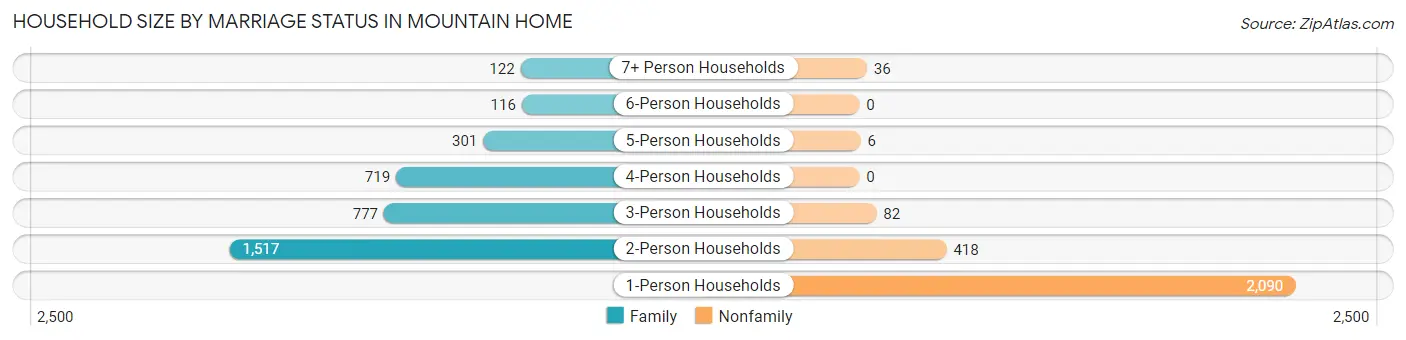
| Household Size | Family Households | Nonfamily Households |
| 1-Person Households | - | 2,090 (33.8%) |
| 2-Person Households | 1,517 (24.5%) | 418 (6.8%) |
| 3-Person Households | 777 (12.6%) | 82 (1.3%) |
| 4-Person Households | 719 (11.6%) | 0 (0.0%) |
| 5-Person Households | 301 (4.9%) | 6 (0.1%) |
| 6-Person Households | 116 (1.9%) | 0 (0.0%) |
| 7+ Person Households | 122 (2.0%) | 36 (0.6%) |
| Total | 3,552 (57.4%) | 2,632 (42.6%) |
Female Fertility in Mountain Home
Fertility by Age in Mountain Home
Average fertility rate in Mountain Home is 63.0 births per 1,000 women. Women in the age bracket of 20 to 34 years have the highest fertility rate with 87.0 births per 1,000 women. Women in the age bracket of 20 to 34 years acount for 80.3% of all women with births.
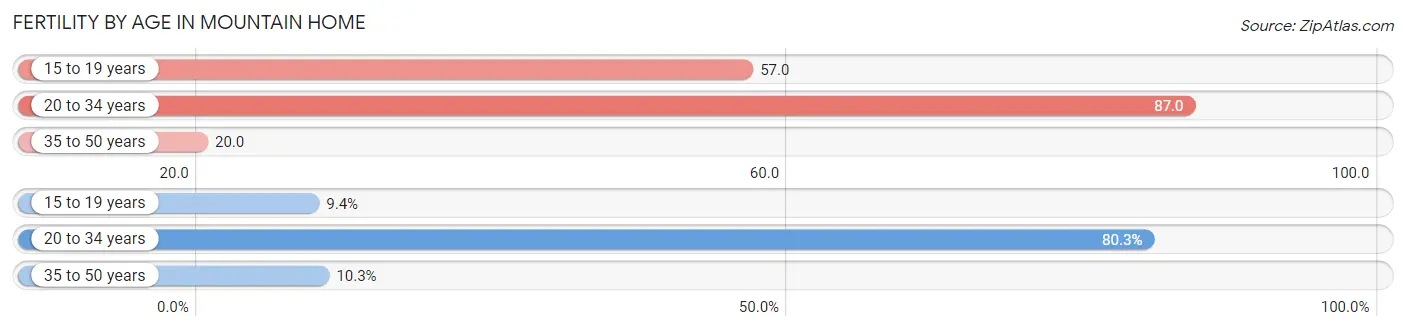
| Age Bracket | Women with Births | Births / 1,000 Women |
| 15 to 19 years | 22 (9.4%) | 57.0 |
| 20 to 34 years | 187 (80.3%) | 87.0 |
| 35 to 50 years | 24 (10.3%) | 20.0 |
| Total | 233 (100.0%) | 63.0 |
Fertility by Age by Marriage Status in Mountain Home
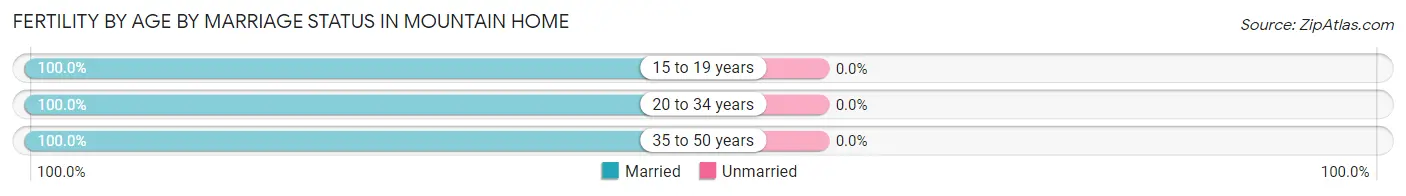
| Age Bracket | Married | Unmarried |
| 15 to 19 years | 22 (100.0%) | 0 (0.0%) |
| 20 to 34 years | 187 (100.0%) | 0 (0.0%) |
| 35 to 50 years | 24 (100.0%) | 0 (0.0%) |
| Total | 233 (100.0%) | 0 (0.0%) |
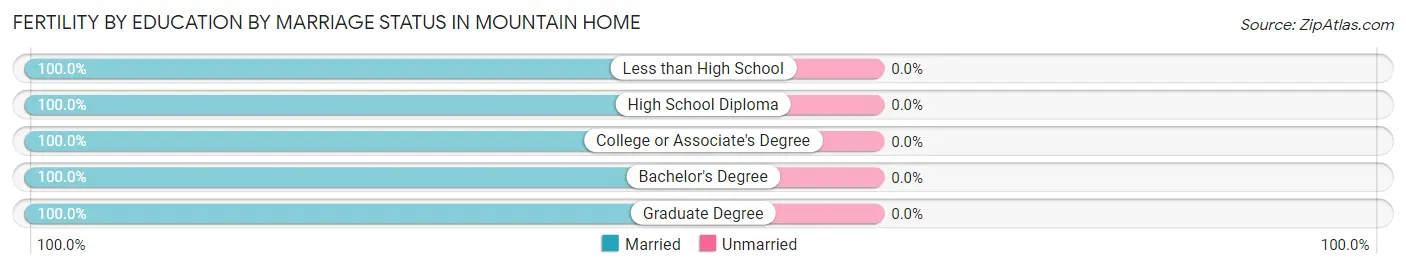
Fertility by Education in Mountain Home
Average fertility rate in Mountain Home is 63.0 births per 1,000 women. Women with the education attainment of high school diploma have the highest fertility rate of 106.0 births per 1,000 women, while women with the education attainment of college or associate's degree have the lowest fertility at 31.0 births per 1,000 women. Women with the education attainment of high school diploma represent 41.2% of all women with births.
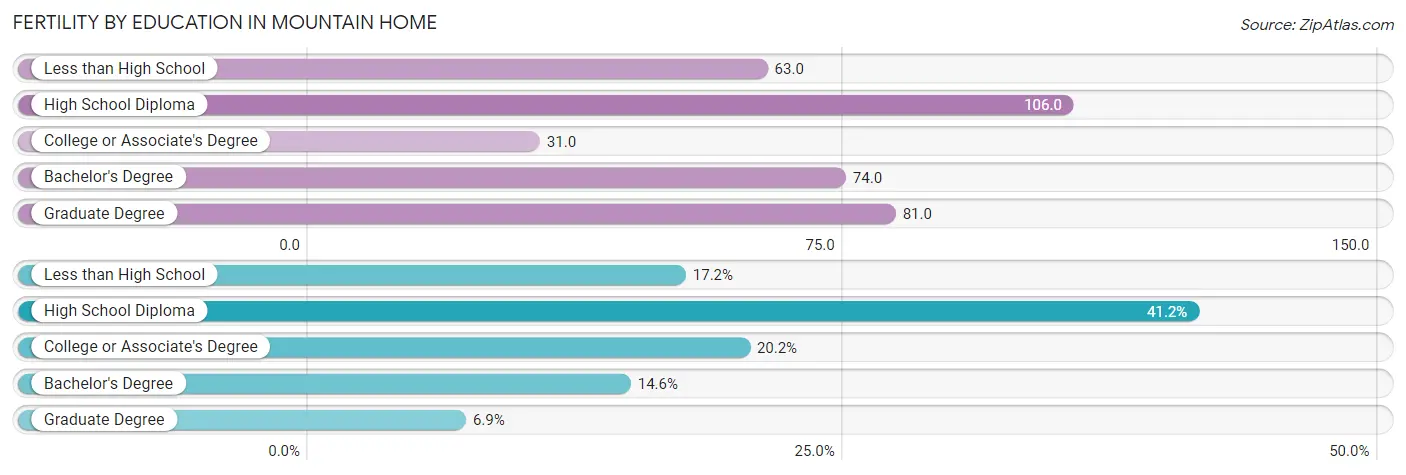
| Educational Attainment | Women with Births | Births / 1,000 Women |
| Less than High School | 40 (17.2%) | 63.0 |
| High School Diploma | 96 (41.2%) | 106.0 |
| College or Associate's Degree | 47 (20.2%) | 31.0 |
| Bachelor's Degree | 34 (14.6%) | 74.0 |
| Graduate Degree | 16 (6.9%) | 81.0 |
| Total | 233 (100.0%) | 63.0 |
Fertility by Education by Marriage Status in Mountain Home
| Educational Attainment | Married | Unmarried |
| Less than High School | 40 (100.0%) | 0 (0.0%) |
| High School Diploma | 96 (100.0%) | 0 (0.0%) |
| College or Associate's Degree | 47 (100.0%) | 0 (0.0%) |
| Bachelor's Degree | 34 (100.0%) | 0 (0.0%) |
| Graduate Degree | 16 (100.0%) | 0 (0.0%) |
| Total | 233 (100.0%) | 0 (0.0%) |
Employment Characteristics in Mountain Home
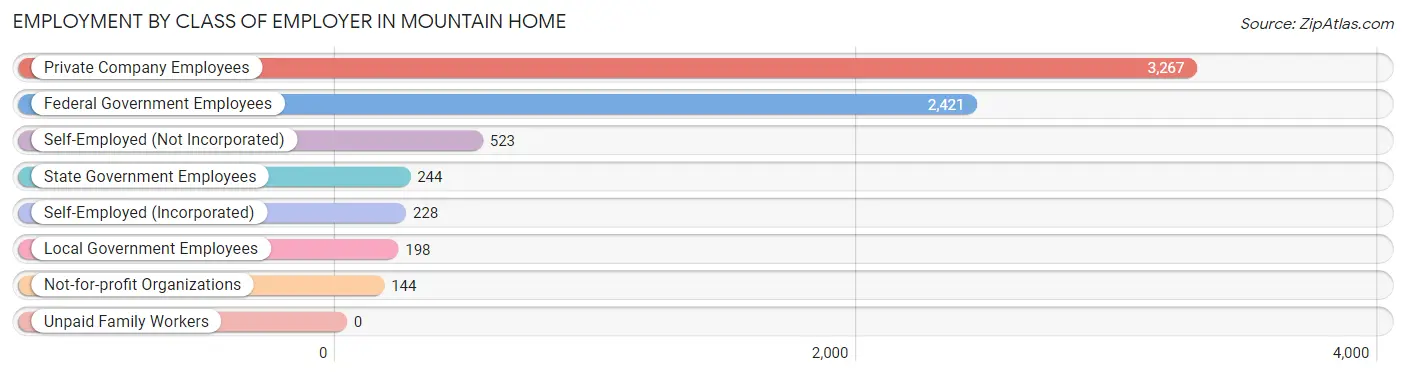
Employment by Class of Employer in Mountain Home
Among the 7,025 employed individuals in Mountain Home, private company employees (3,267 | 46.5%), federal government employees (2,421 | 34.5%), and self-employed (not incorporated) (523 | 7.4%) make up the most common classes of employment.
| Employer Class | # Employees | % Employees |
| Private Company Employees | 3,267 | 46.5% |
| Self-Employed (Incorporated) | 228 | 3.3% |
| Self-Employed (Not Incorporated) | 523 | 7.4% |
| Not-for-profit Organizations | 144 | 2.1% |
| Local Government Employees | 198 | 2.8% |
| State Government Employees | 244 | 3.5% |
| Federal Government Employees | 2,421 | 34.5% |
| Unpaid Family Workers | 0 | 0.0% |
| Total | 7,025 | 100.0% |
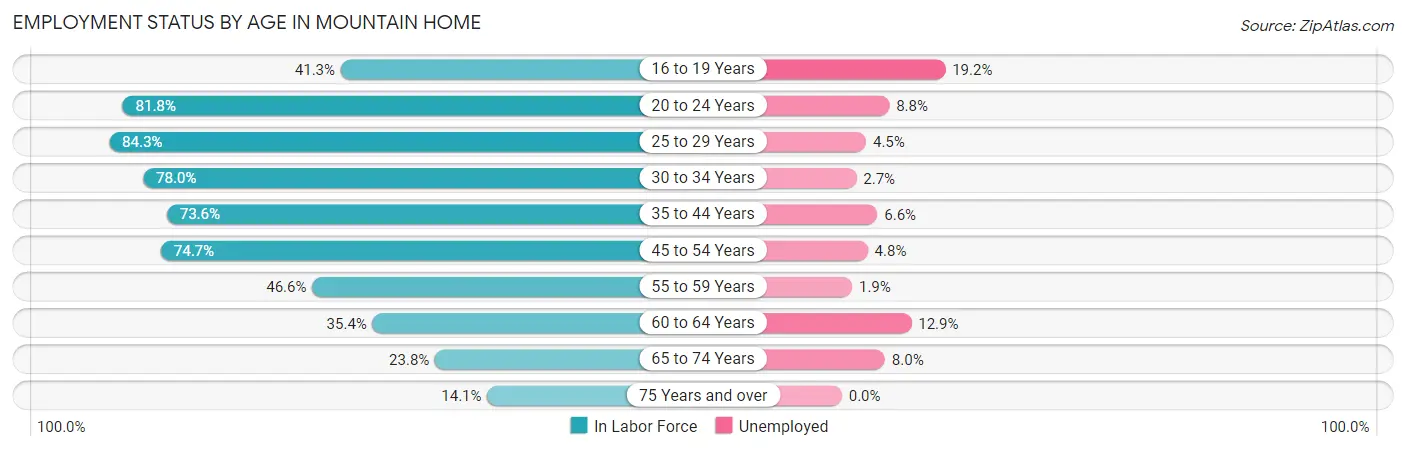
Employment Status by Age in Mountain Home
According to the labor force statistics for Mountain Home, out of the total population over 16 years of age (12,219), 60.9% or 7,441 individuals are in the labor force, with 6.0% or 446 of them unemployed. The age group with the highest labor force participation rate is 25 to 29 years, with 84.3% or 1,490 individuals in the labor force. Within the labor force, the 16 to 19 years age range has the highest percentage of unemployed individuals, with 19.2% or 57 of them being unemployed.
| Age Bracket | In Labor Force | Unemployed |
| 16 to 19 Years | 297 (41.3%) | 57 (19.2%) |
| 20 to 24 Years | 1,077 (81.8%) | 95 (8.8%) |
| 25 to 29 Years | 1,490 (84.3%) | 67 (4.5%) |
| 30 to 34 Years | 1,051 (78.0%) | 28 (2.7%) |
| 35 to 44 Years | 1,309 (73.6%) | 86 (6.6%) |
| 45 to 54 Years | 1,082 (74.7%) | 52 (4.8%) |
| 55 to 59 Years | 473 (46.6%) | 9 (1.9%) |
| 60 to 64 Years | 263 (35.4%) | 34 (12.9%) |
| 65 to 74 Years | 250 (23.8%) | 20 (8.0%) |
| 75 Years and over | 146 (14.1%) | 0 (0.0%) |
| Total | 7,441 (60.9%) | 446 (6.0%) |
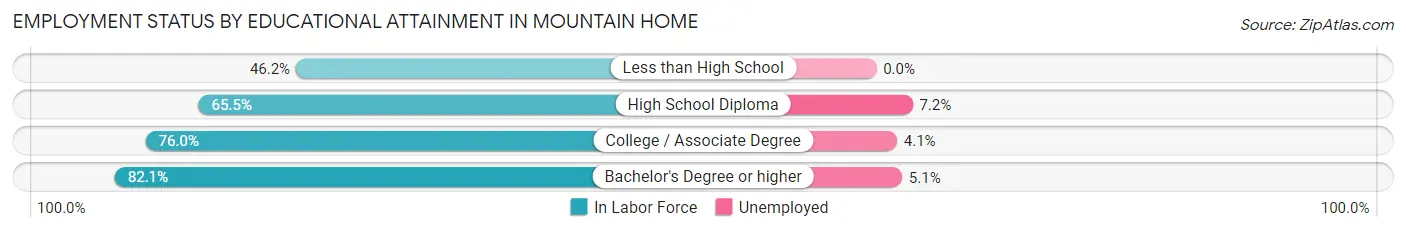
Employment Status by Educational Attainment in Mountain Home
According to labor force statistics for Mountain Home, 70.0% of individuals (5,669) out of the total population between 25 and 64 years of age (8,098) are in the labor force, with 4.9% or 278 of them being unemployed. The group with the highest labor force participation rate are those with the educational attainment of bachelor's degree or higher, with 82.1% or 980 individuals in the labor force. Within the labor force, individuals with high school diploma education have the highest percentage of unemployment, with 7.2% or 124 of them being unemployed.
| Educational Attainment | In Labor Force | Unemployed |
| Less than High School | 438 (46.2%) | 0 (0.0%) |
| High School Diploma | 1,723 (65.5%) | 189 (7.2%) |
| College / Associate Degree | 2,527 (76.0%) | 136 (4.1%) |
| Bachelor's Degree or higher | 980 (82.1%) | 61 (5.1%) |
| Total | 5,669 (70.0%) | 397 (4.9%) |
Employment Occupations by Sex in Mountain Home
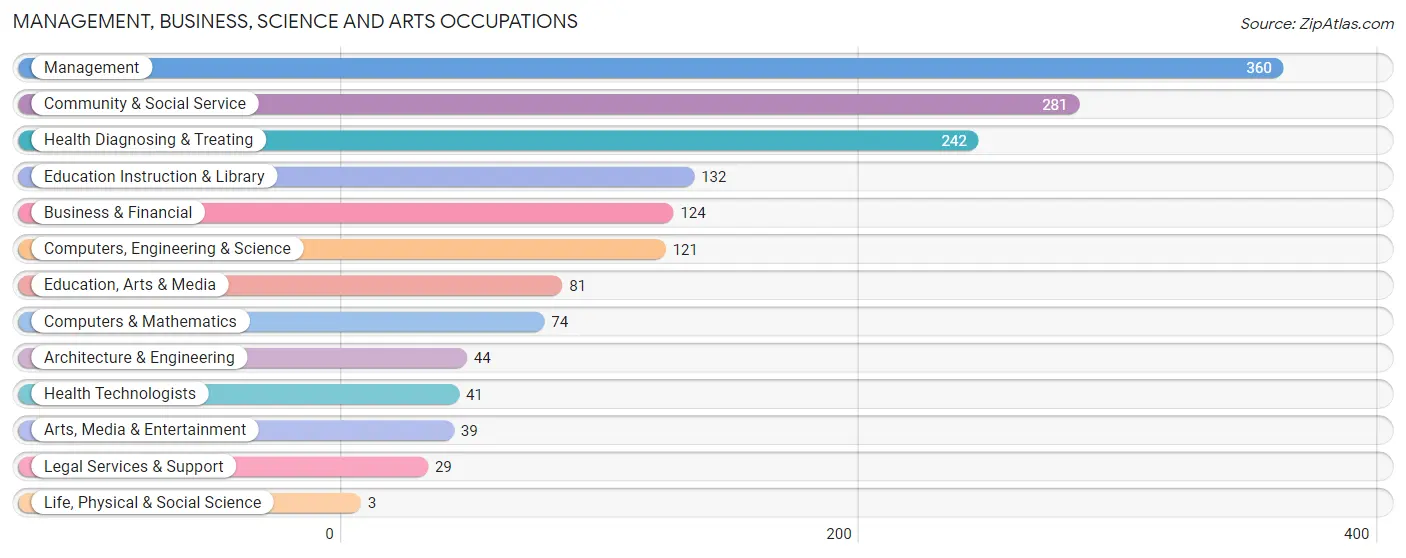
Management, Business, Science and Arts Occupations
The most common Management, Business, Science and Arts occupations in Mountain Home are Management (360 | 6.6%), Community & Social Service (281 | 5.2%), Health Diagnosing & Treating (242 | 4.5%), Education Instruction & Library (132 | 2.4%), and Business & Financial (124 | 2.3%).
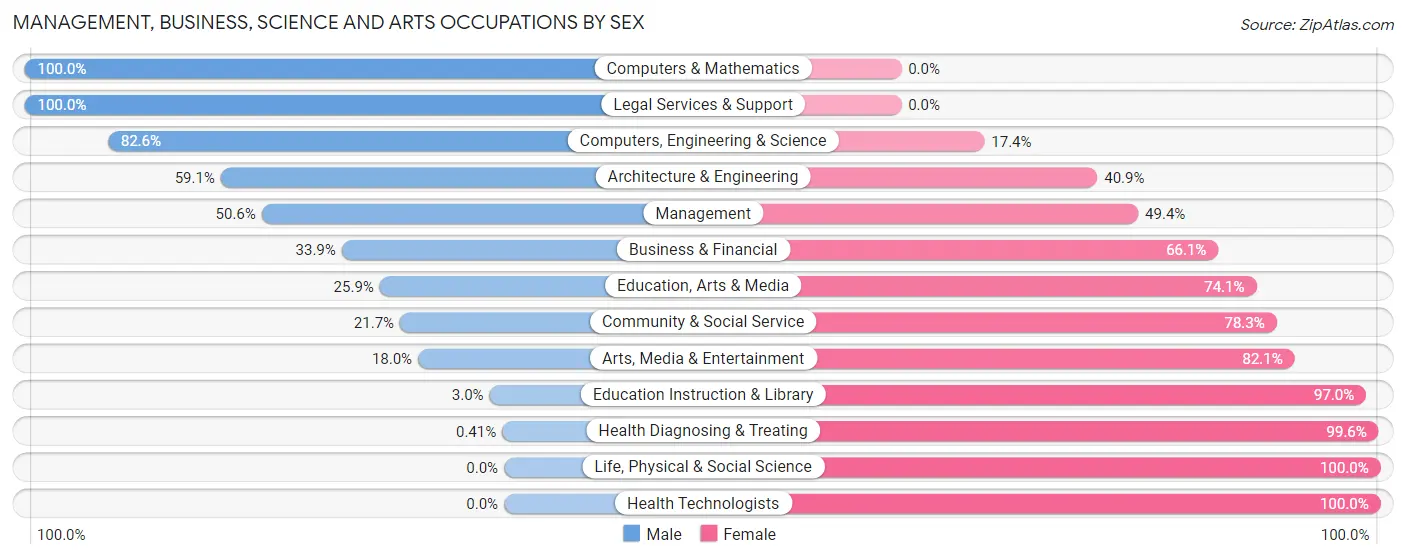
Management, Business, Science and Arts Occupations by Sex
Within the Management, Business, Science and Arts occupations in Mountain Home, the most male-oriented occupations are Computers & Mathematics (100.0%), Legal Services & Support (100.0%), and Computers, Engineering & Science (82.6%), while the most female-oriented occupations are Life, Physical & Social Science (100.0%), Health Technologists (100.0%), and Health Diagnosing & Treating (99.6%).
| Occupation | Male | Female |
| Management | 182 (50.6%) | 178 (49.4%) |
| Business & Financial | 42 (33.9%) | 82 (66.1%) |
| Computers, Engineering & Science | 100 (82.6%) | 21 (17.4%) |
| Computers & Mathematics | 74 (100.0%) | 0 (0.0%) |
| Architecture & Engineering | 26 (59.1%) | 18 (40.9%) |
| Life, Physical & Social Science | 0 (0.0%) | 3 (100.0%) |
| Community & Social Service | 61 (21.7%) | 220 (78.3%) |
| Education, Arts & Media | 21 (25.9%) | 60 (74.1%) |
| Legal Services & Support | 29 (100.0%) | 0 (0.0%) |
| Education Instruction & Library | 4 (3.0%) | 128 (97.0%) |
| Arts, Media & Entertainment | 7 (17.9%) | 32 (82.1%) |
| Health Diagnosing & Treating | 1 (0.4%) | 241 (99.6%) |
| Health Technologists | 0 (0.0%) | 41 (100.0%) |
| Total (Category) | 386 (34.2%) | 742 (65.8%) |
| Total (Overall) | 2,864 (52.7%) | 2,565 (47.2%) |
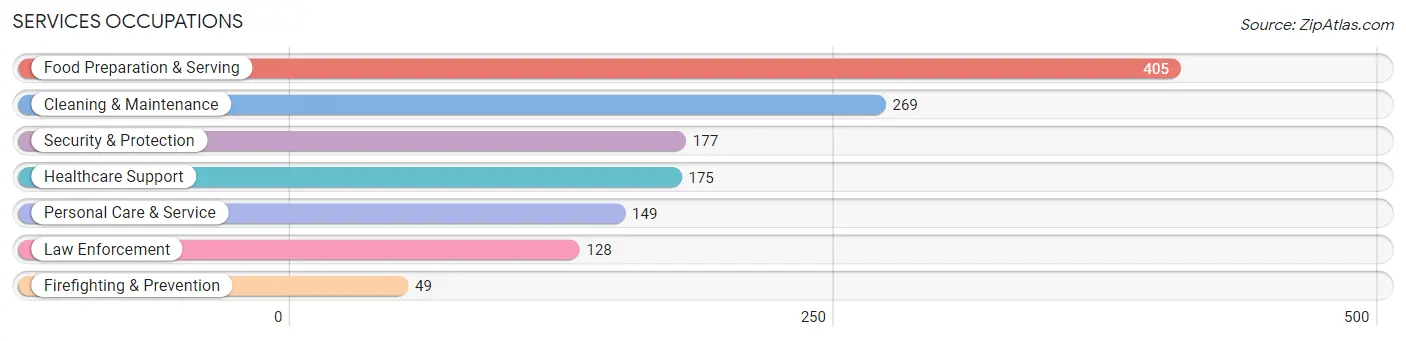
Services Occupations
The most common Services occupations in Mountain Home are Food Preparation & Serving (405 | 7.5%), Cleaning & Maintenance (269 | 5.0%), Security & Protection (177 | 3.3%), Healthcare Support (175 | 3.2%), and Personal Care & Service (149 | 2.7%).
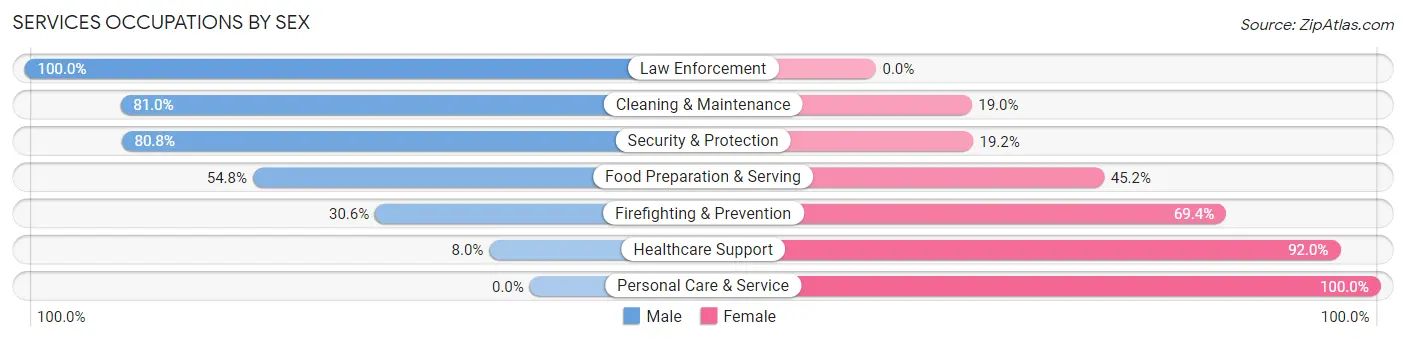
Services Occupations by Sex
Within the Services occupations in Mountain Home, the most male-oriented occupations are Law Enforcement (100.0%), Cleaning & Maintenance (81.0%), and Security & Protection (80.8%), while the most female-oriented occupations are Personal Care & Service (100.0%), Healthcare Support (92.0%), and Firefighting & Prevention (69.4%).
| Occupation | Male | Female |
| Healthcare Support | 14 (8.0%) | 161 (92.0%) |
| Security & Protection | 143 (80.8%) | 34 (19.2%) |
| Firefighting & Prevention | 15 (30.6%) | 34 (69.4%) |
| Law Enforcement | 128 (100.0%) | 0 (0.0%) |
| Food Preparation & Serving | 222 (54.8%) | 183 (45.2%) |
| Cleaning & Maintenance | 218 (81.0%) | 51 (19.0%) |
| Personal Care & Service | 0 (0.0%) | 149 (100.0%) |
| Total (Category) | 597 (50.8%) | 578 (49.2%) |
| Total (Overall) | 2,864 (52.7%) | 2,565 (47.2%) |
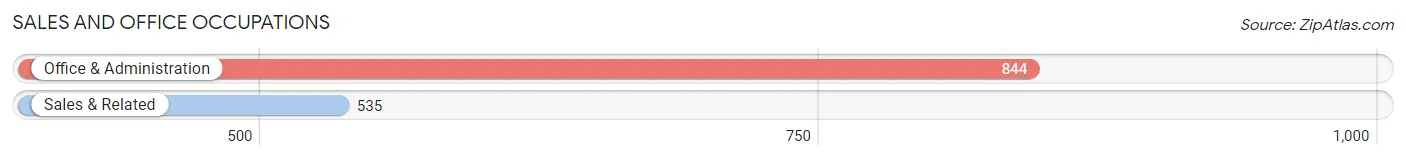
Sales and Office Occupations
The most common Sales and Office occupations in Mountain Home are Office & Administration (844 | 15.5%), and Sales & Related (535 | 9.9%).
Sales and Office Occupations by Sex
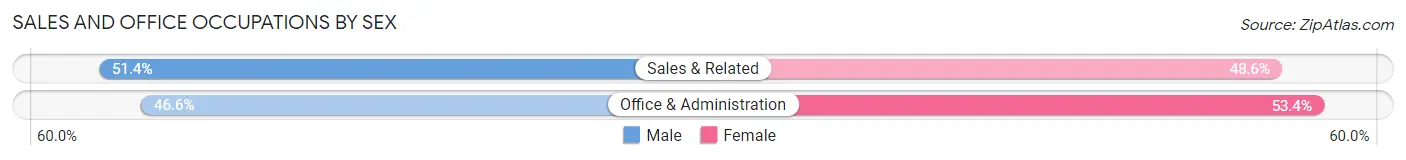
| Occupation | Male | Female |
| Sales & Related | 275 (51.4%) | 260 (48.6%) |
| Office & Administration | 393 (46.6%) | 451 (53.4%) |
| Total (Category) | 668 (48.4%) | 711 (51.6%) |
| Total (Overall) | 2,864 (52.7%) | 2,565 (47.2%) |
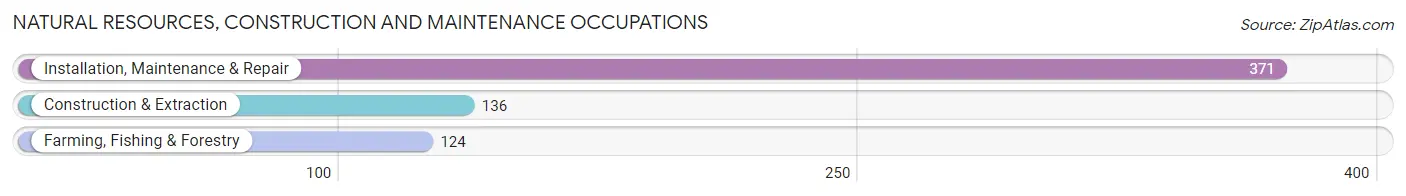
Natural Resources, Construction and Maintenance Occupations
The most common Natural Resources, Construction and Maintenance occupations in Mountain Home are Installation, Maintenance & Repair (371 | 6.8%), Construction & Extraction (136 | 2.5%), and Farming, Fishing & Forestry (124 | 2.3%).
Natural Resources, Construction and Maintenance Occupations by Sex
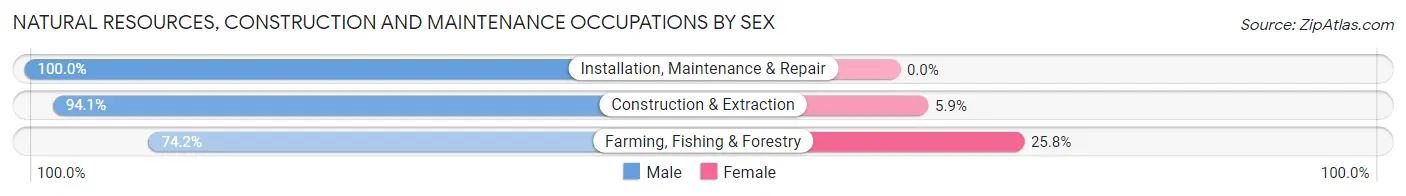
| Occupation | Male | Female |
| Farming, Fishing & Forestry | 92 (74.2%) | 32 (25.8%) |
| Construction & Extraction | 128 (94.1%) | 8 (5.9%) |
| Installation, Maintenance & Repair | 371 (100.0%) | 0 (0.0%) |
| Total (Category) | 591 (93.7%) | 40 (6.3%) |
| Total (Overall) | 2,864 (52.7%) | 2,565 (47.2%) |
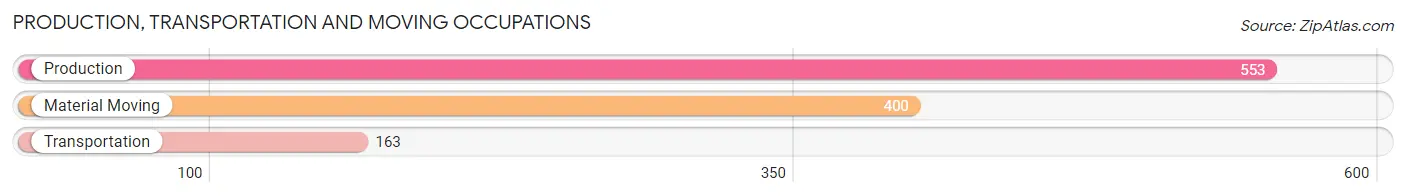
Production, Transportation and Moving Occupations
The most common Production, Transportation and Moving occupations in Mountain Home are Production (553 | 10.2%), Material Moving (400 | 7.4%), and Transportation (163 | 3.0%).
Production, Transportation and Moving Occupations by Sex
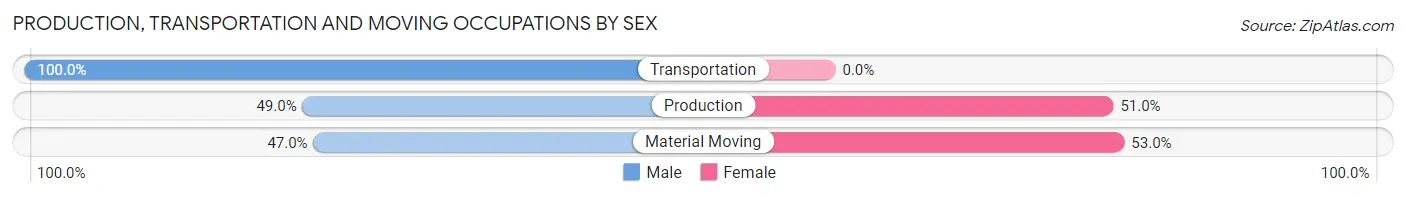
| Occupation | Male | Female |
| Production | 271 (49.0%) | 282 (51.0%) |
| Transportation | 163 (100.0%) | 0 (0.0%) |
| Material Moving | 188 (47.0%) | 212 (53.0%) |
| Total (Category) | 622 (55.7%) | 494 (44.3%) |
| Total (Overall) | 2,864 (52.7%) | 2,565 (47.2%) |
Employment Industries by Sex in Mountain Home
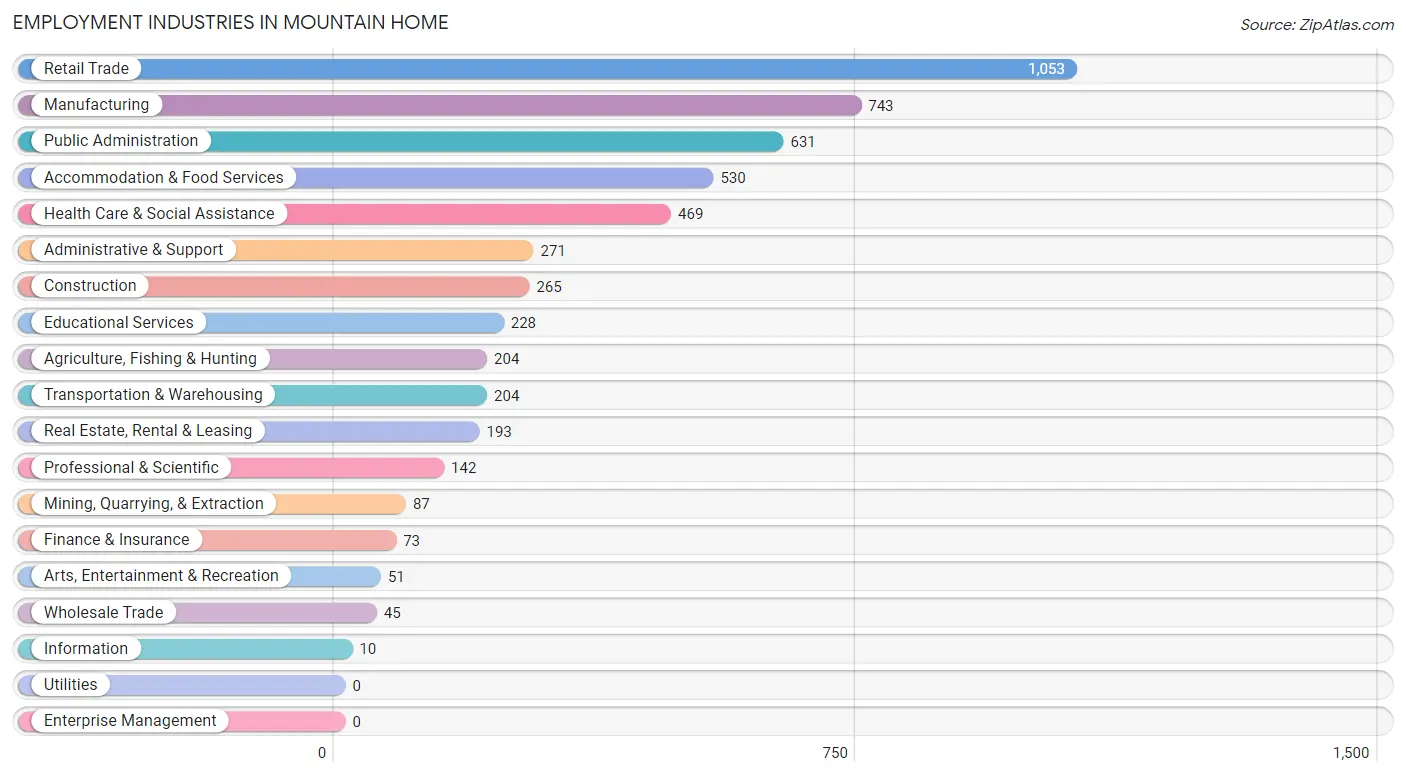
Employment Industries in Mountain Home
The major employment industries in Mountain Home include Retail Trade (1,053 | 19.4%), Manufacturing (743 | 13.7%), Public Administration (631 | 11.6%), Accommodation & Food Services (530 | 9.8%), and Health Care & Social Assistance (469 | 8.6%).
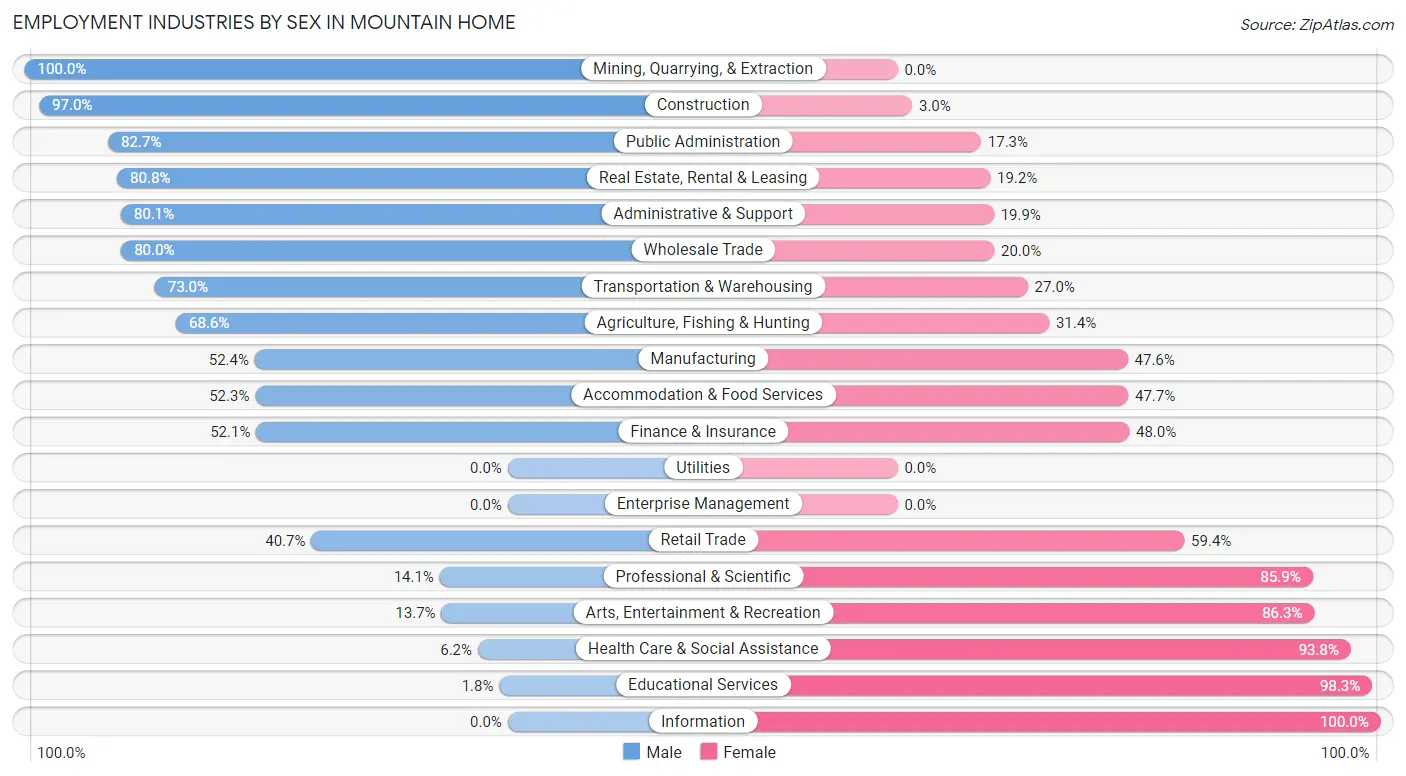
Employment Industries by Sex in Mountain Home
The Mountain Home industries that see more men than women are Mining, Quarrying, & Extraction (100.0%), Construction (97.0%), and Public Administration (82.7%), whereas the industries that tend to have a higher number of women are Information (100.0%), Educational Services (98.3%), and Health Care & Social Assistance (93.8%).
| Industry | Male | Female |
| Agriculture, Fishing & Hunting | 140 (68.6%) | 64 (31.4%) |
| Mining, Quarrying, & Extraction | 87 (100.0%) | 0 (0.0%) |
| Construction | 257 (97.0%) | 8 (3.0%) |
| Manufacturing | 389 (52.4%) | 354 (47.6%) |
| Wholesale Trade | 36 (80.0%) | 9 (20.0%) |
| Retail Trade | 428 (40.6%) | 625 (59.4%) |
| Transportation & Warehousing | 149 (73.0%) | 55 (27.0%) |
| Utilities | 0 (0.0%) | 0 (0.0%) |
| Information | 0 (0.0%) | 10 (100.0%) |
| Finance & Insurance | 38 (52.0%) | 35 (47.9%) |
| Real Estate, Rental & Leasing | 156 (80.8%) | 37 (19.2%) |
| Professional & Scientific | 20 (14.1%) | 122 (85.9%) |
| Enterprise Management | 0 (0.0%) | 0 (0.0%) |
| Administrative & Support | 217 (80.1%) | 54 (19.9%) |
| Educational Services | 4 (1.8%) | 224 (98.3%) |
| Health Care & Social Assistance | 29 (6.2%) | 440 (93.8%) |
| Arts, Entertainment & Recreation | 7 (13.7%) | 44 (86.3%) |
| Accommodation & Food Services | 277 (52.3%) | 253 (47.7%) |
| Public Administration | 522 (82.7%) | 109 (17.3%) |
| Total | 2,864 (52.7%) | 2,565 (47.2%) |
Education in Mountain Home
School Enrollment in Mountain Home
The most common levels of schooling among the 3,619 students in Mountain Home are middle school (968 | 26.8%), college / undergraduate (876 | 24.2%), and elementary school (828 | 22.9%).
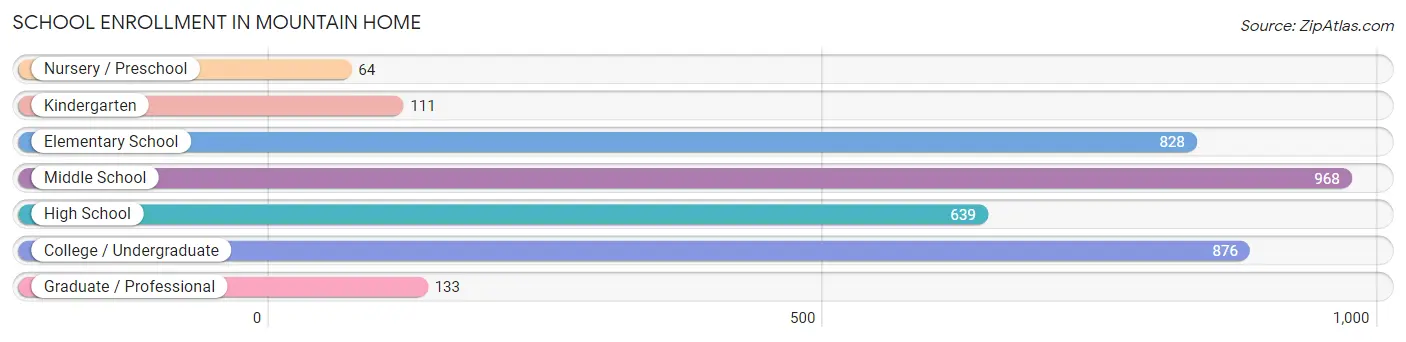
| School Level | # Students | % Students |
| Nursery / Preschool | 64 | 1.8% |
| Kindergarten | 111 | 3.1% |
| Elementary School | 828 | 22.9% |
| Middle School | 968 | 26.8% |
| High School | 639 | 17.7% |
| College / Undergraduate | 876 | 24.2% |
| Graduate / Professional | 133 | 3.7% |
| Total | 3,619 | 100.0% |
School Enrollment by Age by Funding Source in Mountain Home
Out of a total of 3,619 students who are enrolled in schools in Mountain Home, 756 (20.9%) attend a private institution, while the remaining 2,863 (79.1%) are enrolled in public schools. The age group of 35 years and over has the highest likelihood of being enrolled in private schools, with 172 (62.1% in the age bracket) enrolled. Conversely, the age group of 3 to 4 year olds has the lowest likelihood of being enrolled in a private school, with 57 (100.0% in the age bracket) attending a public institution.
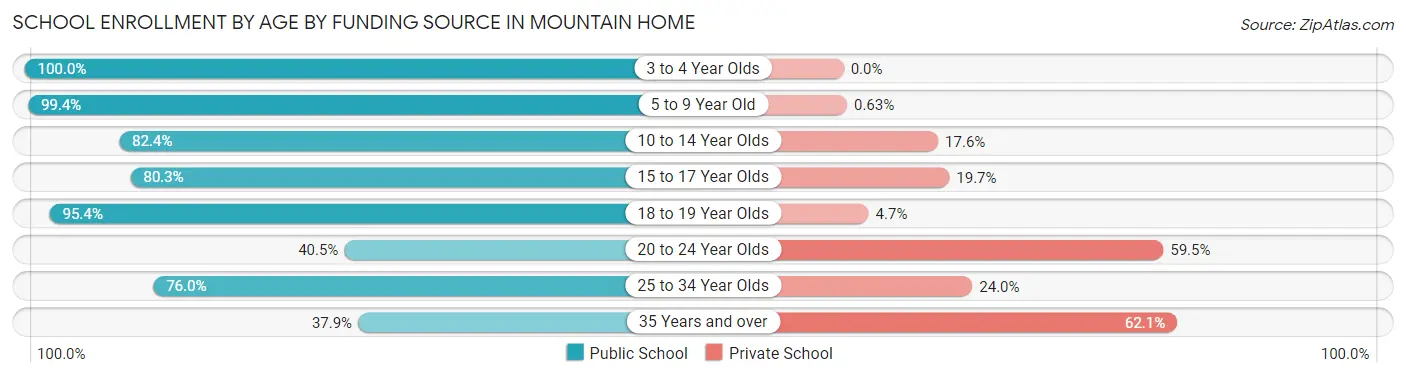
| Age Bracket | Public School | Private School |
| 3 to 4 Year Olds | 57 (100.0%) | 0 (0.0%) |
| 5 to 9 Year Old | 943 (99.4%) | 6 (0.6%) |
| 10 to 14 Year Olds | 838 (82.4%) | 179 (17.6%) |
| 15 to 17 Year Olds | 359 (80.3%) | 88 (19.7%) |
| 18 to 19 Year Olds | 164 (95.4%) | 8 (4.6%) |
| 20 to 24 Year Olds | 155 (40.5%) | 228 (59.5%) |
| 25 to 34 Year Olds | 241 (76.0%) | 76 (24.0%) |
| 35 Years and over | 105 (37.9%) | 172 (62.1%) |
| Total | 2,863 (79.1%) | 756 (20.9%) |
Educational Attainment by Field of Study in Mountain Home
Science & technology (413 | 23.1%), business (346 | 19.4%), education (198 | 11.1%), arts & humanities (173 | 9.7%), and liberal arts & history (113 | 6.3%) are the most common fields of study among 1,788 individuals in Mountain Home who have obtained a bachelor's degree or higher.
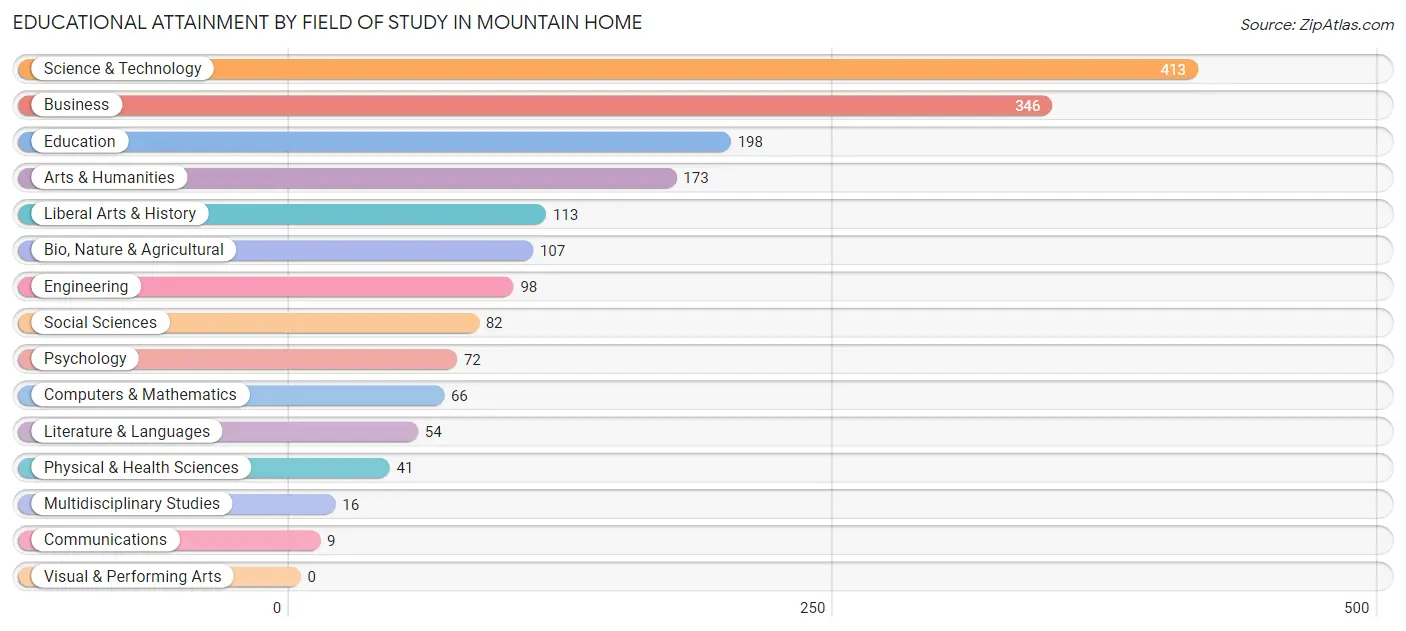
| Field of Study | # Graduates | % Graduates |
| Computers & Mathematics | 66 | 3.7% |
| Bio, Nature & Agricultural | 107 | 6.0% |
| Physical & Health Sciences | 41 | 2.3% |
| Psychology | 72 | 4.0% |
| Social Sciences | 82 | 4.6% |
| Engineering | 98 | 5.5% |
| Multidisciplinary Studies | 16 | 0.9% |
| Science & Technology | 413 | 23.1% |
| Business | 346 | 19.4% |
| Education | 198 | 11.1% |
| Literature & Languages | 54 | 3.0% |
| Liberal Arts & History | 113 | 6.3% |
| Visual & Performing Arts | 0 | 0.0% |
| Communications | 9 | 0.5% |
| Arts & Humanities | 173 | 9.7% |
| Total | 1,788 | 100.0% |
Transportation & Commute in Mountain Home
Vehicle Availability by Sex in Mountain Home
The most prevalent vehicle ownership categories in Mountain Home are males with 2 vehicles (1,916, accounting for 47.4%) and females with 2 vehicles (956, making up 64.2%).
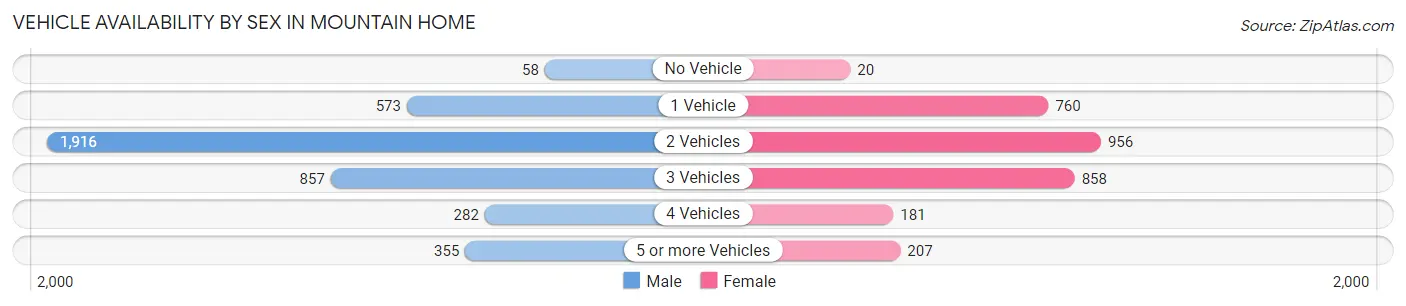
| Vehicles Available | Male | Female |
| No Vehicle | 58 (1.4%) | 20 (0.7%) |
| 1 Vehicle | 573 (14.2%) | 760 (25.5%) |
| 2 Vehicles | 1,916 (47.4%) | 956 (32.1%) |
| 3 Vehicles | 857 (21.2%) | 858 (28.8%) |
| 4 Vehicles | 282 (7.0%) | 181 (6.1%) |
| 5 or more Vehicles | 355 (8.8%) | 207 (6.9%) |
| Total | 4,041 (100.0%) | 2,982 (100.0%) |
Commute Time in Mountain Home
The most frequently occuring commute durations in Mountain Home are 5 to 9 minutes (1,289 commuters, 18.7%), 15 to 19 minutes (1,174 commuters, 17.1%), and 20 to 24 minutes (1,071 commuters, 15.6%).
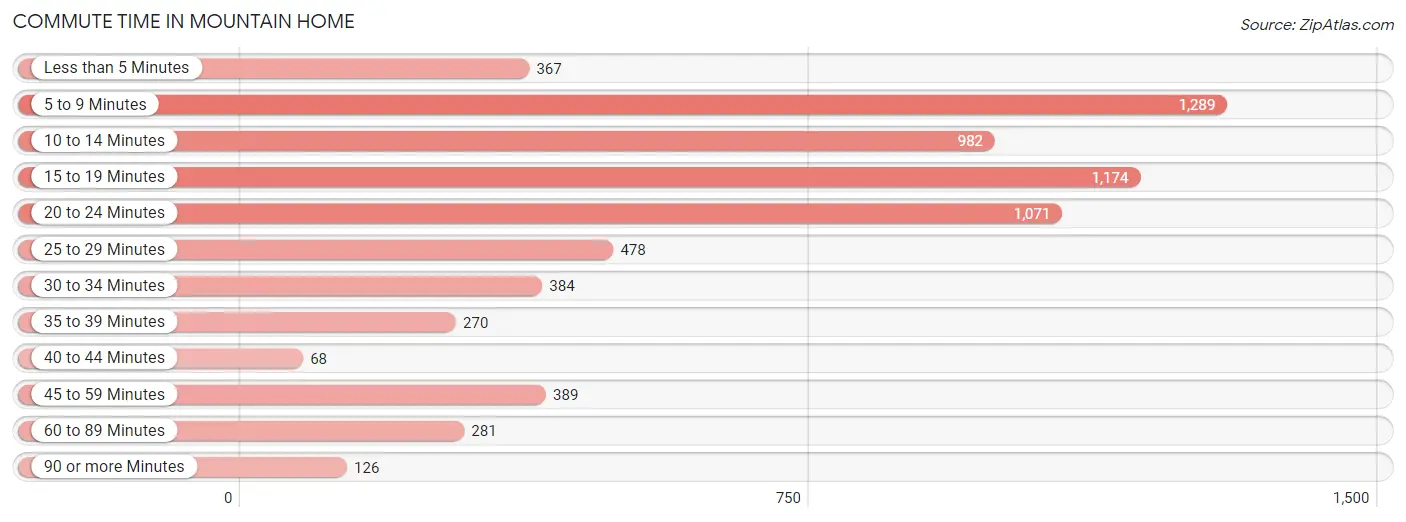
| Commute Time | # Commuters | % Commuters |
| Less than 5 Minutes | 367 | 5.3% |
| 5 to 9 Minutes | 1,289 | 18.7% |
| 10 to 14 Minutes | 982 | 14.3% |
| 15 to 19 Minutes | 1,174 | 17.1% |
| 20 to 24 Minutes | 1,071 | 15.6% |
| 25 to 29 Minutes | 478 | 7.0% |
| 30 to 34 Minutes | 384 | 5.6% |
| 35 to 39 Minutes | 270 | 3.9% |
| 40 to 44 Minutes | 68 | 1.0% |
| 45 to 59 Minutes | 389 | 5.7% |
| 60 to 89 Minutes | 281 | 4.1% |
| 90 or more Minutes | 126 | 1.8% |
Commute Time by Sex in Mountain Home
The most common commute times in Mountain Home are 15 to 19 minutes (826 commuters, 20.7%) for males and 10 to 14 minutes (638 commuters, 22.0%) for females.
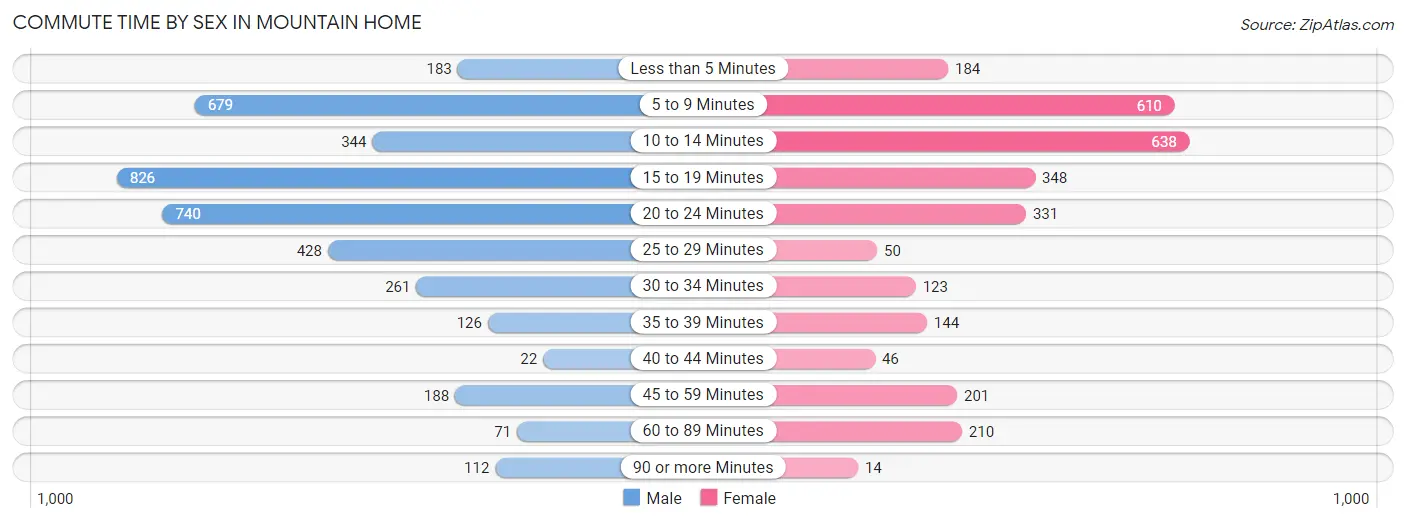
| Commute Time | Male | Female |
| Less than 5 Minutes | 183 (4.6%) | 184 (6.4%) |
| 5 to 9 Minutes | 679 (17.1%) | 610 (21.0%) |
| 10 to 14 Minutes | 344 (8.6%) | 638 (22.0%) |
| 15 to 19 Minutes | 826 (20.7%) | 348 (12.0%) |
| 20 to 24 Minutes | 740 (18.6%) | 331 (11.4%) |
| 25 to 29 Minutes | 428 (10.7%) | 50 (1.7%) |
| 30 to 34 Minutes | 261 (6.6%) | 123 (4.2%) |
| 35 to 39 Minutes | 126 (3.2%) | 144 (5.0%) |
| 40 to 44 Minutes | 22 (0.5%) | 46 (1.6%) |
| 45 to 59 Minutes | 188 (4.7%) | 201 (6.9%) |
| 60 to 89 Minutes | 71 (1.8%) | 210 (7.2%) |
| 90 or more Minutes | 112 (2.8%) | 14 (0.5%) |
Time of Departure to Work by Sex in Mountain Home
The most frequent times of departure to work in Mountain Home are 6:00 AM to 6:29 AM (653, 16.4%) for males and 7:00 AM to 7:29 AM (444, 15.3%) for females.
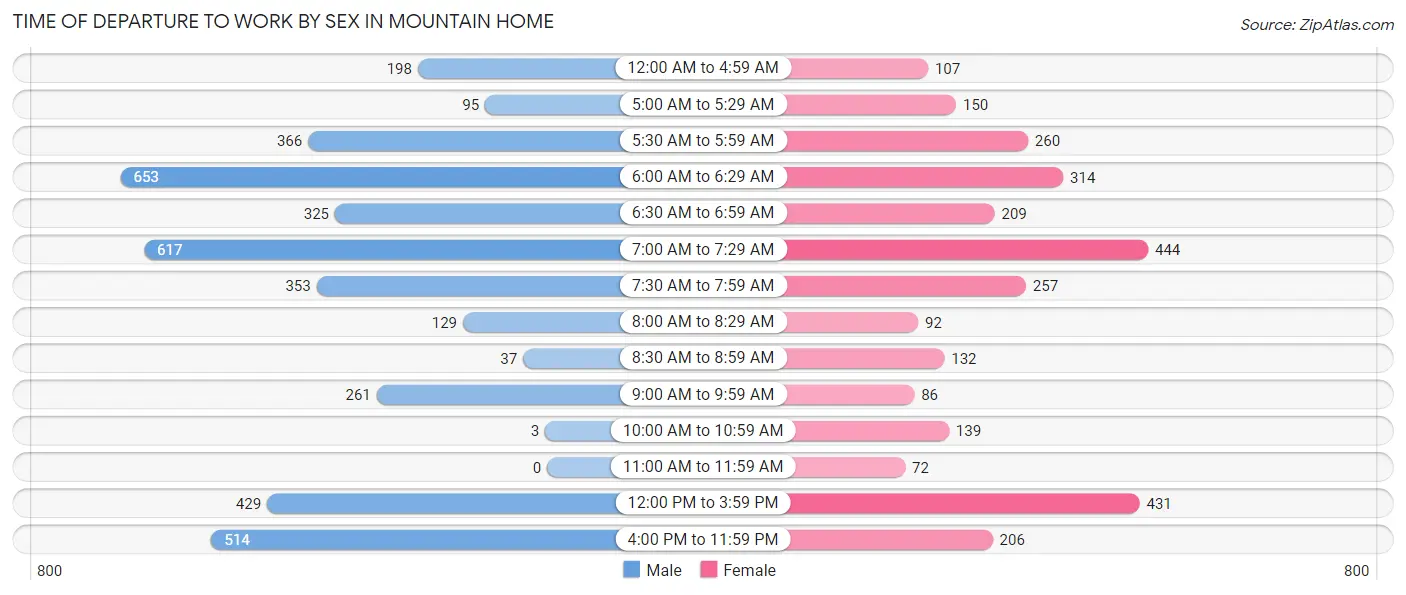
| Time of Departure | Male | Female |
| 12:00 AM to 4:59 AM | 198 (5.0%) | 107 (3.7%) |
| 5:00 AM to 5:29 AM | 95 (2.4%) | 150 (5.2%) |
| 5:30 AM to 5:59 AM | 366 (9.2%) | 260 (9.0%) |
| 6:00 AM to 6:29 AM | 653 (16.4%) | 314 (10.8%) |
| 6:30 AM to 6:59 AM | 325 (8.2%) | 209 (7.2%) |
| 7:00 AM to 7:29 AM | 617 (15.5%) | 444 (15.3%) |
| 7:30 AM to 7:59 AM | 353 (8.9%) | 257 (8.9%) |
| 8:00 AM to 8:29 AM | 129 (3.2%) | 92 (3.2%) |
| 8:30 AM to 8:59 AM | 37 (0.9%) | 132 (4.5%) |
| 9:00 AM to 9:59 AM | 261 (6.6%) | 86 (3.0%) |
| 10:00 AM to 10:59 AM | 3 (0.1%) | 139 (4.8%) |
| 11:00 AM to 11:59 AM | 0 (0.0%) | 72 (2.5%) |
| 12:00 PM to 3:59 PM | 429 (10.8%) | 431 (14.9%) |
| 4:00 PM to 11:59 PM | 514 (12.9%) | 206 (7.1%) |
| Total | 3,980 (100.0%) | 2,899 (100.0%) |
Housing Occupancy in Mountain Home
Occupancy by Ownership in Mountain Home
Of the total 6,184 dwellings in Mountain Home, owner-occupied units account for 3,819 (61.8%), while renter-occupied units make up 2,365 (38.2%).
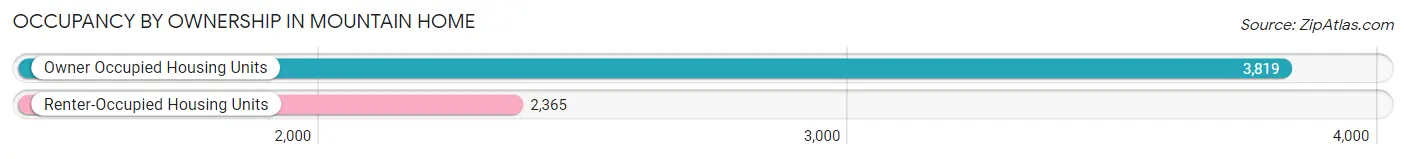
| Occupancy | # Housing Units | % Housing Units |
| Owner Occupied Housing Units | 3,819 | 61.8% |
| Renter-Occupied Housing Units | 2,365 | 38.2% |
| Total Occupied Housing Units | 6,184 | 100.0% |
Occupancy by Household Size in Mountain Home
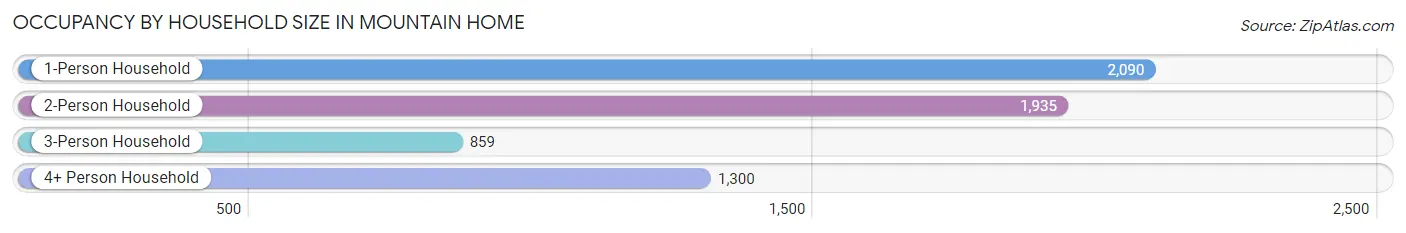
| Household Size | # Housing Units | % Housing Units |
| 1-Person Household | 2,090 | 33.8% |
| 2-Person Household | 1,935 | 31.3% |
| 3-Person Household | 859 | 13.9% |
| 4+ Person Household | 1,300 | 21.0% |
| Total Housing Units | 6,184 | 100.0% |
Occupancy by Ownership by Household Size in Mountain Home
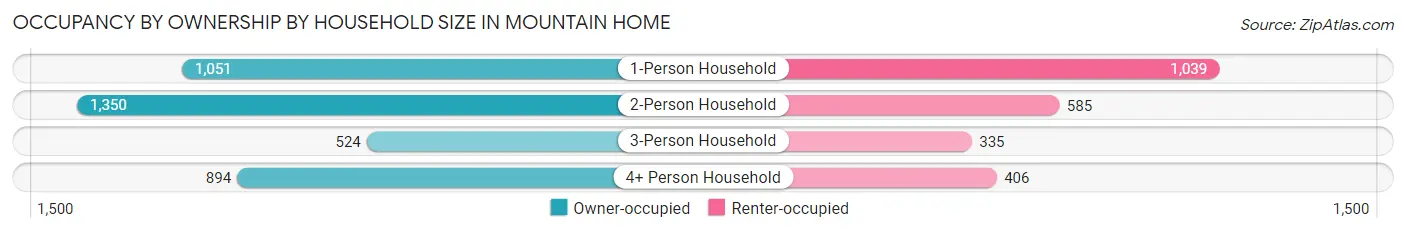
| Household Size | Owner-occupied | Renter-occupied |
| 1-Person Household | 1,051 (50.3%) | 1,039 (49.7%) |
| 2-Person Household | 1,350 (69.8%) | 585 (30.2%) |
| 3-Person Household | 524 (61.0%) | 335 (39.0%) |
| 4+ Person Household | 894 (68.8%) | 406 (31.2%) |
| Total Housing Units | 3,819 (61.8%) | 2,365 (38.2%) |
Occupancy by Educational Attainment in Mountain Home
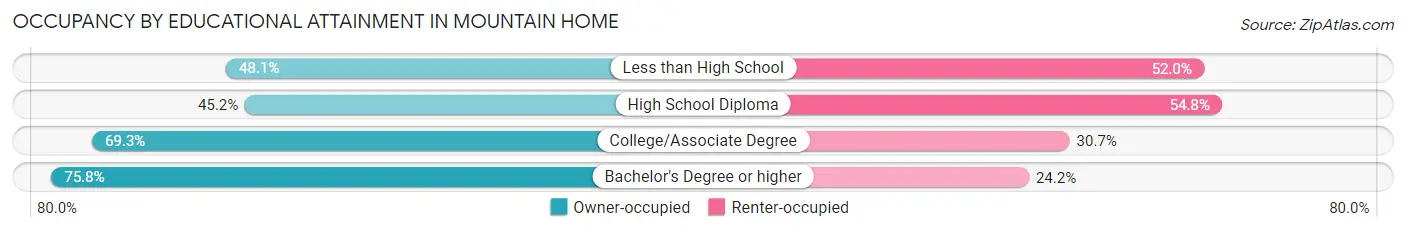
| Household Size | Owner-occupied | Renter-occupied |
| Less than High School | 197 (48.0%) | 213 (51.9%) |
| High School Diploma | 834 (45.2%) | 1,012 (54.8%) |
| College/Associate Degree | 2,019 (69.3%) | 894 (30.7%) |
| Bachelor's Degree or higher | 769 (75.8%) | 246 (24.2%) |
Occupancy by Age of Householder in Mountain Home
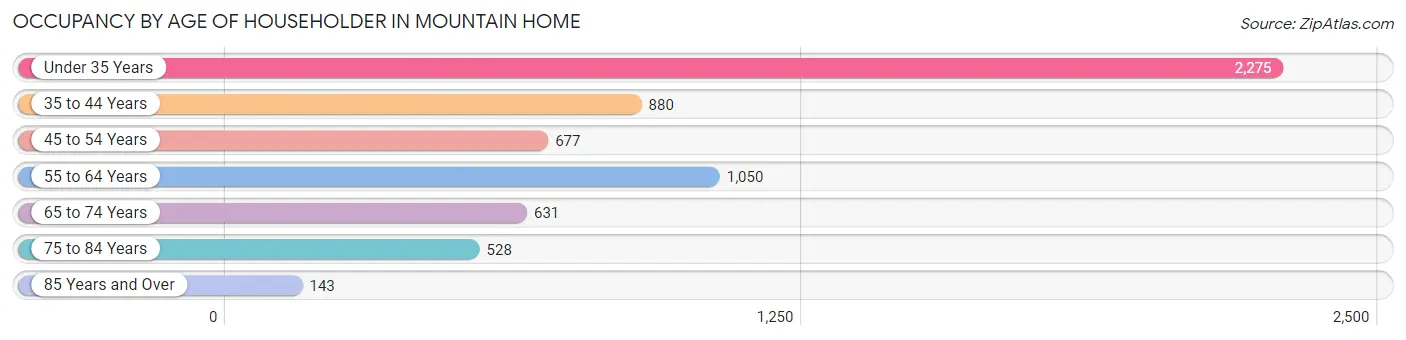
| Age Bracket | # Households | % Households |
| Under 35 Years | 2,275 | 36.8% |
| 35 to 44 Years | 880 | 14.2% |
| 45 to 54 Years | 677 | 11.0% |
| 55 to 64 Years | 1,050 | 17.0% |
| 65 to 74 Years | 631 | 10.2% |
| 75 to 84 Years | 528 | 8.5% |
| 85 Years and Over | 143 | 2.3% |
| Total | 6,184 | 100.0% |
Housing Finances in Mountain Home
Median Income by Occupancy in Mountain Home
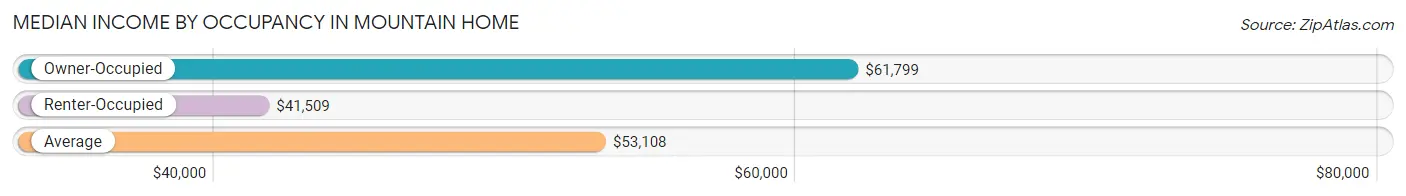
| Occupancy Type | # Households | Median Income |
| Owner-Occupied | 3,819 (61.8%) | $61,799 |
| Renter-Occupied | 2,365 (38.2%) | $41,509 |
| Average | 6,184 (100.0%) | $53,108 |
Occupancy by Householder Income Bracket in Mountain Home
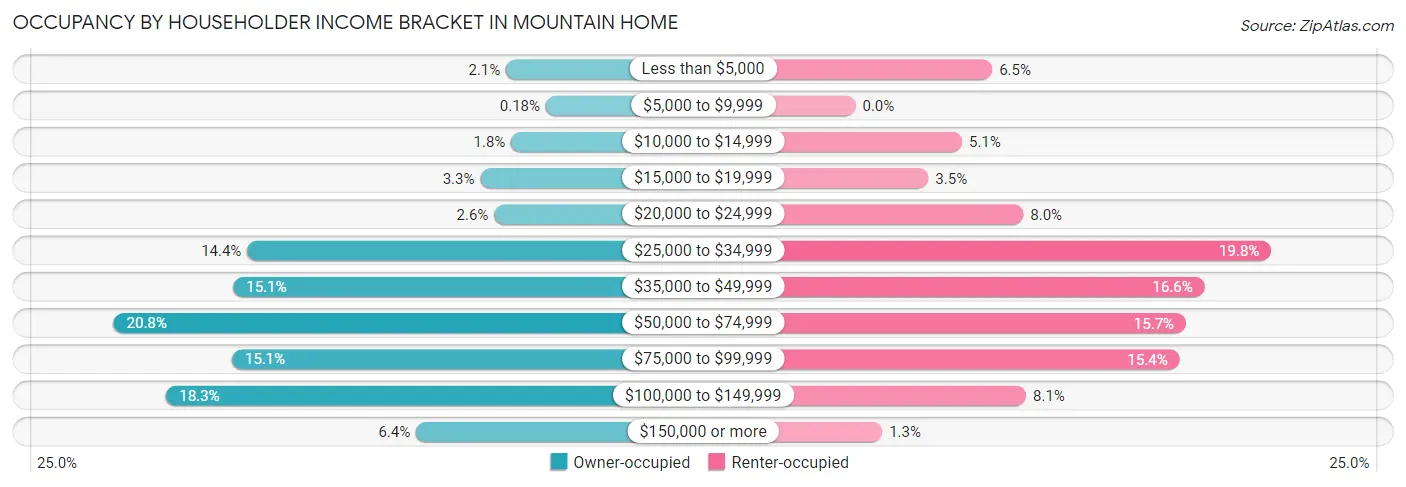
| Income Bracket | Owner-occupied | Renter-occupied |
| Less than $5,000 | 79 (2.1%) | 154 (6.5%) |
| $5,000 to $9,999 | 7 (0.2%) | 0 (0.0%) |
| $10,000 to $14,999 | 70 (1.8%) | 120 (5.1%) |
| $15,000 to $19,999 | 126 (3.3%) | 82 (3.5%) |
| $20,000 to $24,999 | 101 (2.6%) | 189 (8.0%) |
| $25,000 to $34,999 | 550 (14.4%) | 468 (19.8%) |
| $35,000 to $49,999 | 575 (15.1%) | 393 (16.6%) |
| $50,000 to $74,999 | 793 (20.8%) | 372 (15.7%) |
| $75,000 to $99,999 | 578 (15.1%) | 365 (15.4%) |
| $100,000 to $149,999 | 697 (18.2%) | 192 (8.1%) |
| $150,000 or more | 243 (6.4%) | 30 (1.3%) |
| Total | 3,819 (100.0%) | 2,365 (100.0%) |
Monthly Housing Cost Tiers in Mountain Home
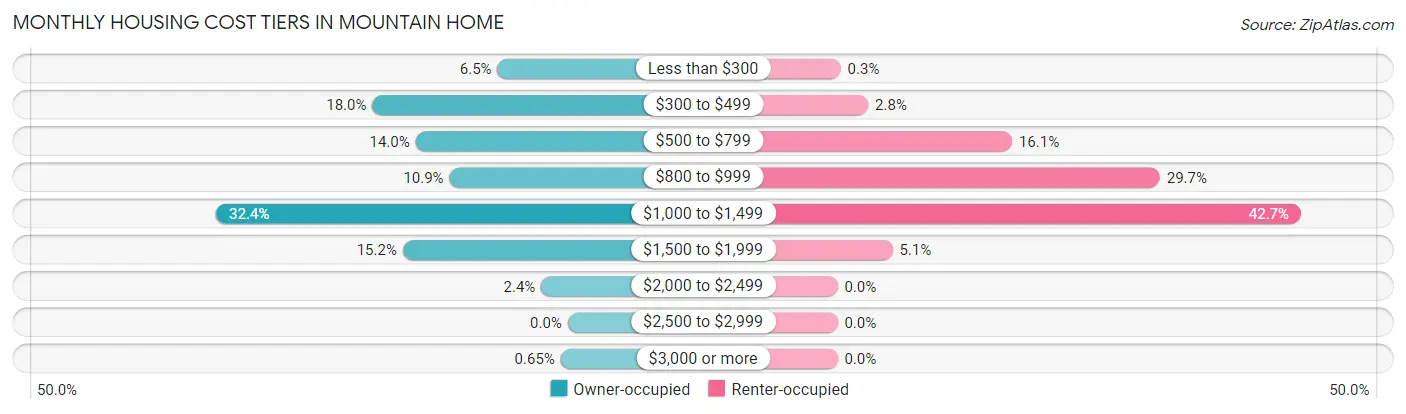
| Monthly Cost | Owner-occupied | Renter-occupied |
| Less than $300 | 247 (6.5%) | 7 (0.3%) |
| $300 to $499 | 687 (18.0%) | 67 (2.8%) |
| $500 to $799 | 535 (14.0%) | 380 (16.1%) |
| $800 to $999 | 416 (10.9%) | 702 (29.7%) |
| $1,000 to $1,499 | 1,236 (32.4%) | 1,009 (42.7%) |
| $1,500 to $1,999 | 580 (15.2%) | 120 (5.1%) |
| $2,000 to $2,499 | 93 (2.4%) | 0 (0.0%) |
| $2,500 to $2,999 | 0 (0.0%) | 0 (0.0%) |
| $3,000 or more | 25 (0.6%) | 0 (0.0%) |
| Total | 3,819 (100.0%) | 2,365 (100.0%) |
Physical Housing Characteristics in Mountain Home
Housing Structures in Mountain Home
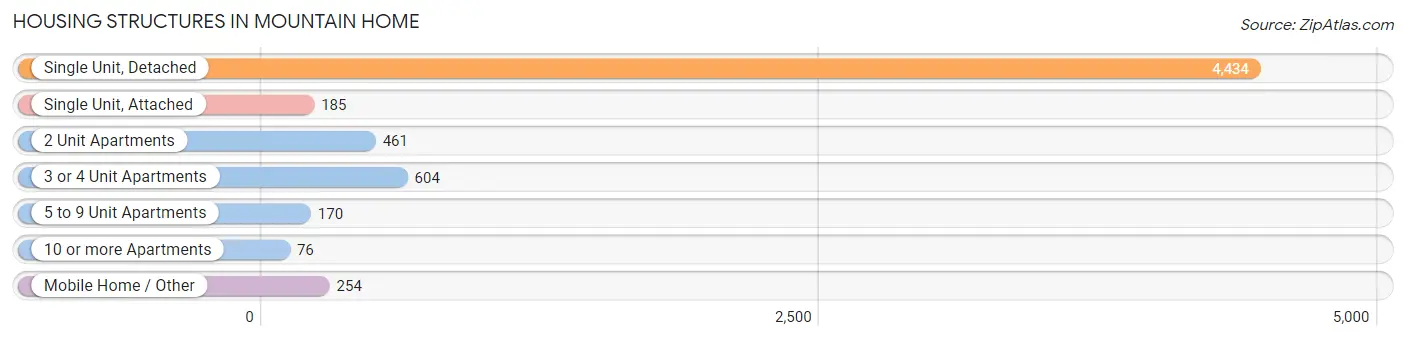
| Structure Type | # Housing Units | % Housing Units |
| Single Unit, Detached | 4,434 | 71.7% |
| Single Unit, Attached | 185 | 3.0% |
| 2 Unit Apartments | 461 | 7.4% |
| 3 or 4 Unit Apartments | 604 | 9.8% |
| 5 to 9 Unit Apartments | 170 | 2.8% |
| 10 or more Apartments | 76 | 1.2% |
| Mobile Home / Other | 254 | 4.1% |
| Total | 6,184 | 100.0% |
Housing Structures by Occupancy in Mountain Home
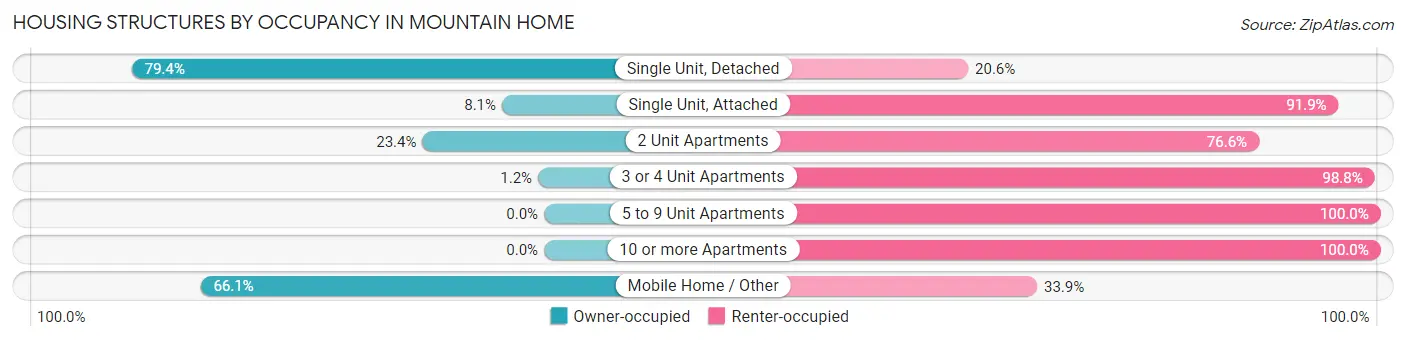
| Structure Type | Owner-occupied | Renter-occupied |
| Single Unit, Detached | 3,521 (79.4%) | 913 (20.6%) |
| Single Unit, Attached | 15 (8.1%) | 170 (91.9%) |
| 2 Unit Apartments | 108 (23.4%) | 353 (76.6%) |
| 3 or 4 Unit Apartments | 7 (1.2%) | 597 (98.8%) |
| 5 to 9 Unit Apartments | 0 (0.0%) | 170 (100.0%) |
| 10 or more Apartments | 0 (0.0%) | 76 (100.0%) |
| Mobile Home / Other | 168 (66.1%) | 86 (33.9%) |
| Total | 3,819 (61.8%) | 2,365 (38.2%) |
Housing Structures by Number of Rooms in Mountain Home
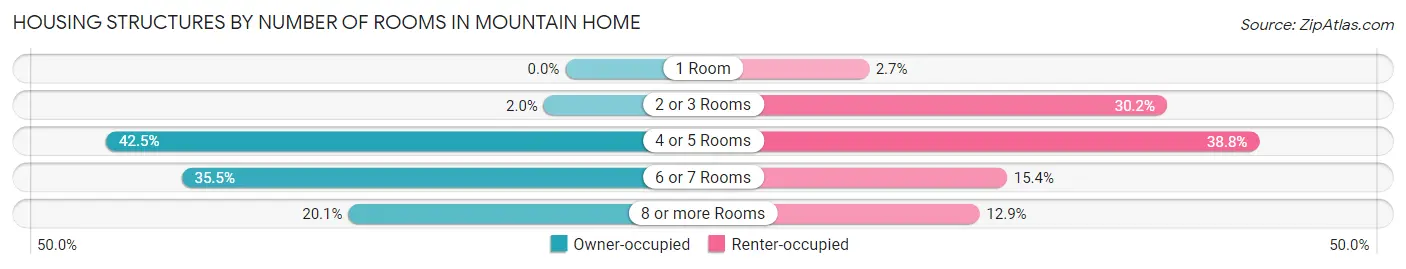
| Number of Rooms | Owner-occupied | Renter-occupied |
| 1 Room | 0 (0.0%) | 63 (2.7%) |
| 2 or 3 Rooms | 76 (2.0%) | 715 (30.2%) |
| 4 or 5 Rooms | 1,622 (42.5%) | 917 (38.8%) |
| 6 or 7 Rooms | 1,355 (35.5%) | 365 (15.4%) |
| 8 or more Rooms | 766 (20.1%) | 305 (12.9%) |
| Total | 3,819 (100.0%) | 2,365 (100.0%) |
Housing Structure by Heating Type in Mountain Home
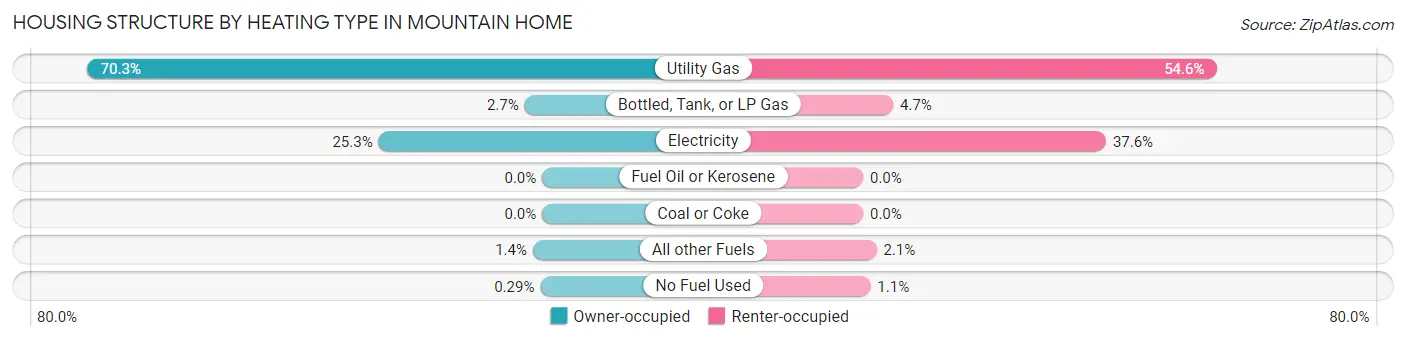
| Heating Type | Owner-occupied | Renter-occupied |
| Utility Gas | 2,683 (70.3%) | 1,291 (54.6%) |
| Bottled, Tank, or LP Gas | 104 (2.7%) | 110 (4.6%) |
| Electricity | 966 (25.3%) | 888 (37.6%) |
| Fuel Oil or Kerosene | 0 (0.0%) | 0 (0.0%) |
| Coal or Coke | 0 (0.0%) | 0 (0.0%) |
| All other Fuels | 55 (1.4%) | 49 (2.1%) |
| No Fuel Used | 11 (0.3%) | 27 (1.1%) |
| Total | 3,819 (100.0%) | 2,365 (100.0%) |
Household Vehicle Usage in Mountain Home
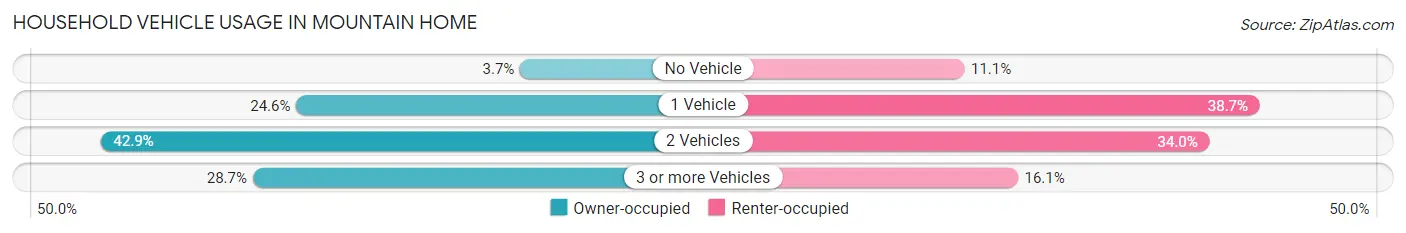
| Vehicles per Household | Owner-occupied | Renter-occupied |
| No Vehicle | 143 (3.7%) | 263 (11.1%) |
| 1 Vehicle | 941 (24.6%) | 916 (38.7%) |
| 2 Vehicles | 1,639 (42.9%) | 805 (34.0%) |
| 3 or more Vehicles | 1,096 (28.7%) | 381 (16.1%) |
| Total | 3,819 (100.0%) | 2,365 (100.0%) |
Real Estate & Mortgages in Mountain Home
Real Estate and Mortgage Overview in Mountain Home
| Characteristic | Without Mortgage | With Mortgage |
| Housing Units | 1,127 | 2,692 |
| Median Property Value | $192,400 | $241,500 |
| Median Household Income | $58,350 | $222 |
| Monthly Housing Costs | $366 | $25 |
| Real Estate Taxes | $1,590 | $64 |
Property Value by Mortgage Status in Mountain Home
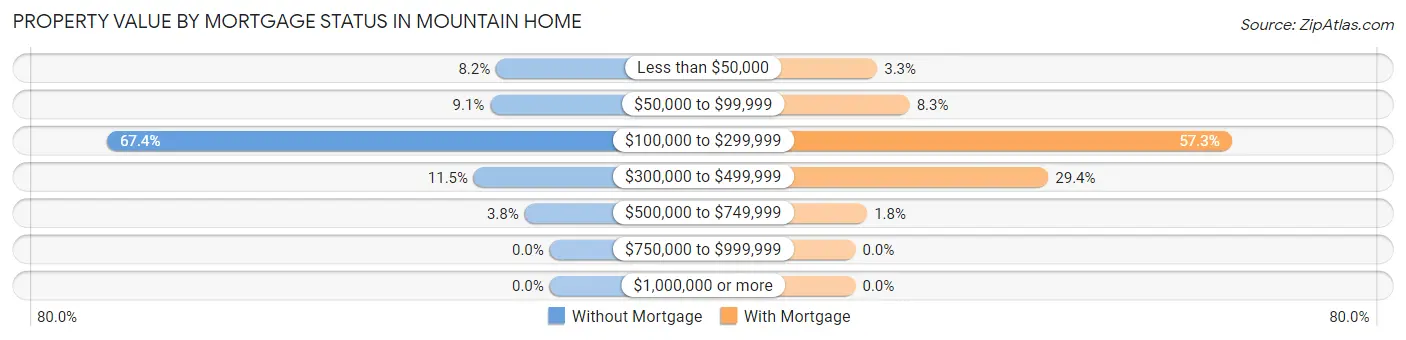
| Property Value | Without Mortgage | With Mortgage |
| Less than $50,000 | 92 (8.2%) | 89 (3.3%) |
| $50,000 to $99,999 | 102 (9.0%) | 222 (8.3%) |
| $100,000 to $299,999 | 760 (67.4%) | 1,542 (57.3%) |
| $300,000 to $499,999 | 130 (11.5%) | 791 (29.4%) |
| $500,000 to $749,999 | 43 (3.8%) | 48 (1.8%) |
| $750,000 to $999,999 | 0 (0.0%) | 0 (0.0%) |
| $1,000,000 or more | 0 (0.0%) | 0 (0.0%) |
| Total | 1,127 (100.0%) | 2,692 (100.0%) |
Household Income by Mortgage Status in Mountain Home
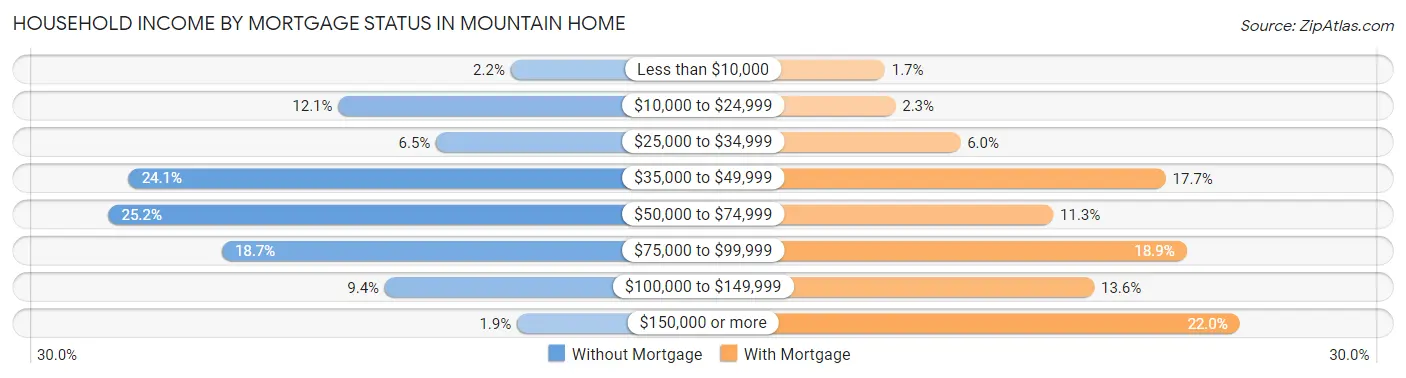
| Household Income | Without Mortgage | With Mortgage |
| Less than $10,000 | 25 (2.2%) | 45 (1.7%) |
| $10,000 to $24,999 | 136 (12.1%) | 61 (2.3%) |
| $25,000 to $34,999 | 73 (6.5%) | 161 (6.0%) |
| $35,000 to $49,999 | 271 (24.0%) | 477 (17.7%) |
| $50,000 to $74,999 | 284 (25.2%) | 304 (11.3%) |
| $75,000 to $99,999 | 211 (18.7%) | 509 (18.9%) |
| $100,000 to $149,999 | 106 (9.4%) | 367 (13.6%) |
| $150,000 or more | 21 (1.9%) | 591 (22.0%) |
| Total | 1,127 (100.0%) | 2,692 (100.0%) |
Property Value to Household Income Ratio in Mountain Home
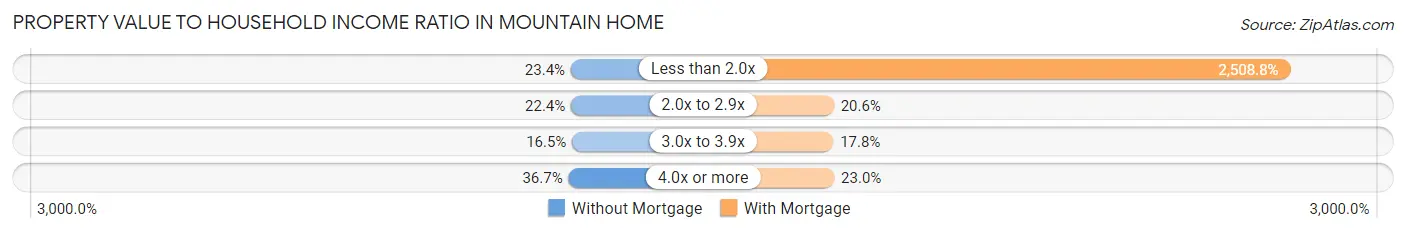
| Value-to-Income Ratio | Without Mortgage | With Mortgage |
| Less than 2.0x | 264 (23.4%) | 67,537 (2,508.8%) |
| 2.0x to 2.9x | 252 (22.4%) | 554 (20.6%) |
| 3.0x to 3.9x | 186 (16.5%) | 479 (17.8%) |
| 4.0x or more | 413 (36.6%) | 620 (23.0%) |
| Total | 1,127 (100.0%) | 2,692 (100.0%) |
Real Estate Taxes by Mortgage Status in Mountain Home
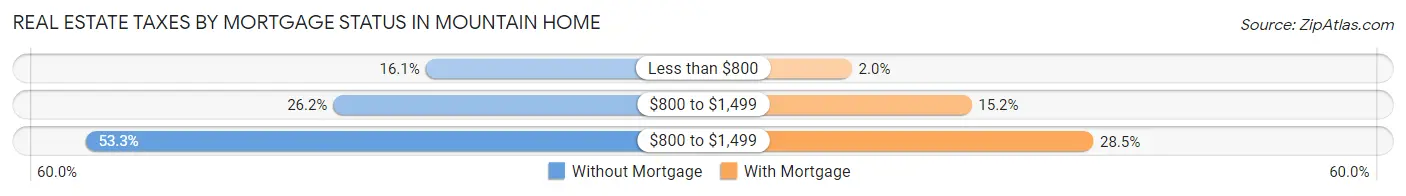
| Property Taxes | Without Mortgage | With Mortgage |
| Less than $800 | 181 (16.1%) | 55 (2.0%) |
| $800 to $1,499 | 295 (26.2%) | 408 (15.2%) |
| $800 to $1,499 | 601 (53.3%) | 767 (28.5%) |
| Total | 1,127 (100.0%) | 2,692 (100.0%) |
Health & Disability in Mountain Home
Health Insurance Coverage by Age in Mountain Home
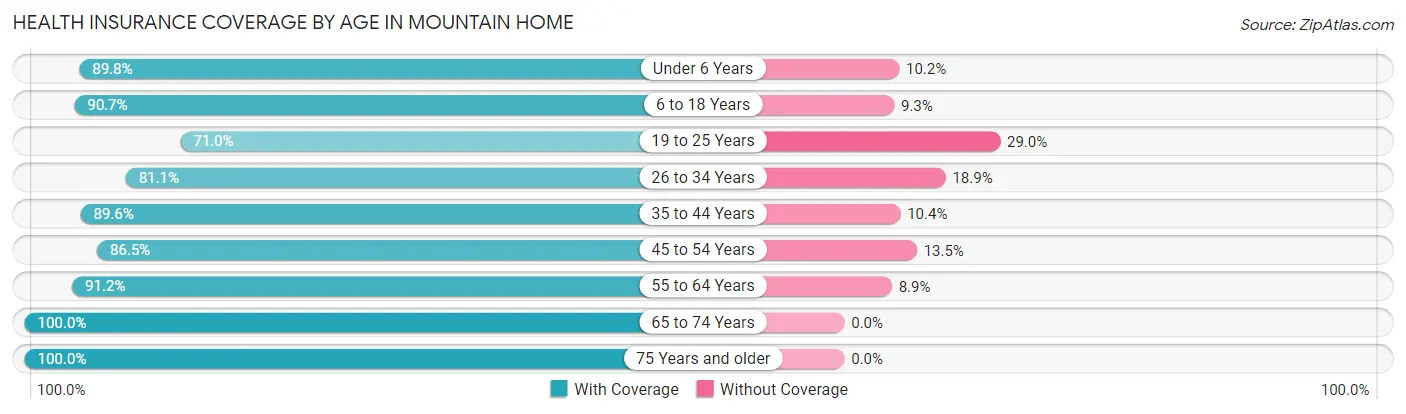
| Age Bracket | With Coverage | Without Coverage |
| Under 6 Years | 1,337 (89.8%) | 152 (10.2%) |
| 6 to 18 Years | 2,592 (90.7%) | 265 (9.3%) |
| 19 to 25 Years | 743 (71.0%) | 304 (29.0%) |
| 26 to 34 Years | 1,694 (81.1%) | 394 (18.9%) |
| 35 to 44 Years | 1,236 (89.6%) | 144 (10.4%) |
| 45 to 54 Years | 1,243 (86.5%) | 194 (13.5%) |
| 55 to 64 Years | 1,597 (91.1%) | 155 (8.8%) |
| 65 to 74 Years | 1,010 (100.0%) | 0 (0.0%) |
| 75 Years and older | 949 (100.0%) | 0 (0.0%) |
| Total | 12,401 (88.5%) | 1,608 (11.5%) |
Health Insurance Coverage by Citizenship Status in Mountain Home
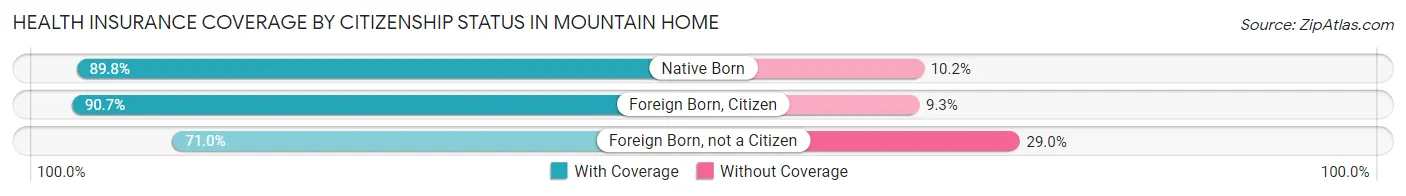
| Citizenship Status | With Coverage | Without Coverage |
| Native Born | 1,337 (89.8%) | 152 (10.2%) |
| Foreign Born, Citizen | 2,592 (90.7%) | 265 (9.3%) |
| Foreign Born, not a Citizen | 743 (71.0%) | 304 (29.0%) |
Health Insurance Coverage by Household Income in Mountain Home
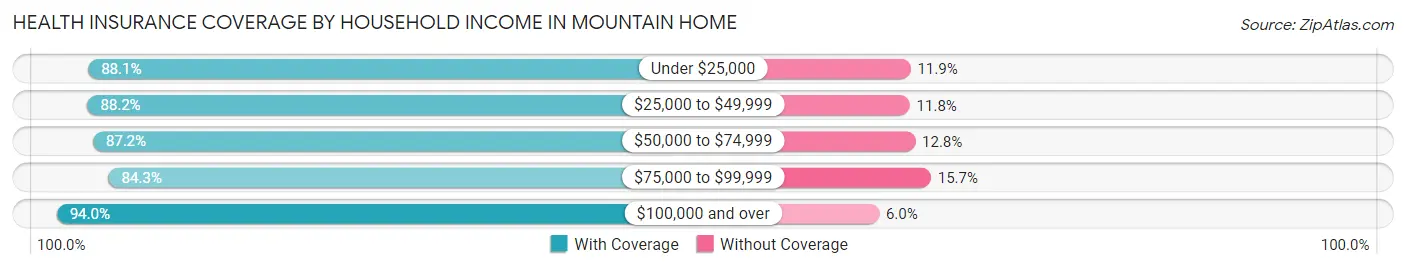
| Household Income | With Coverage | Without Coverage |
| Under $25,000 | 1,557 (88.1%) | 211 (11.9%) |
| $25,000 to $49,999 | 2,740 (88.2%) | 366 (11.8%) |
| $50,000 to $74,999 | 2,698 (87.2%) | 396 (12.8%) |
| $75,000 to $99,999 | 2,334 (84.3%) | 436 (15.7%) |
| $100,000 and over | 3,069 (94.0%) | 197 (6.0%) |
Public vs Private Health Insurance Coverage by Age in Mountain Home
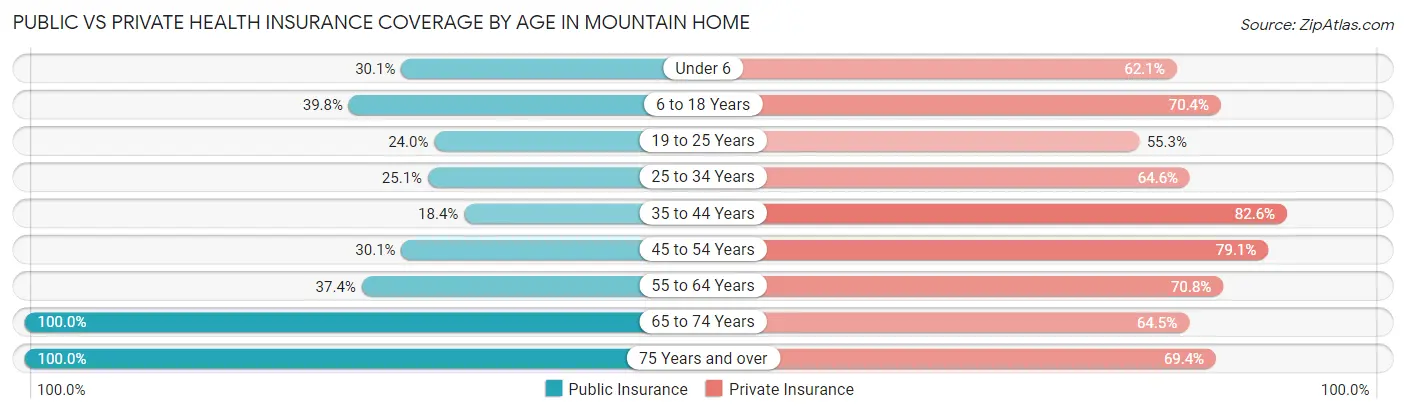
| Age Bracket | Public Insurance | Private Insurance |
| Under 6 | 448 (30.1%) | 925 (62.1%) |
| 6 to 18 Years | 1,138 (39.8%) | 2,010 (70.4%) |
| 19 to 25 Years | 251 (24.0%) | 579 (55.3%) |
| 25 to 34 Years | 525 (25.1%) | 1,349 (64.6%) |
| 35 to 44 Years | 254 (18.4%) | 1,140 (82.6%) |
| 45 to 54 Years | 432 (30.1%) | 1,137 (79.1%) |
| 55 to 64 Years | 656 (37.4%) | 1,240 (70.8%) |
| 65 to 74 Years | 1,010 (100.0%) | 651 (64.5%) |
| 75 Years and over | 949 (100.0%) | 659 (69.4%) |
| Total | 5,663 (40.4%) | 9,690 (69.2%) |
Disability Status by Sex by Age in Mountain Home
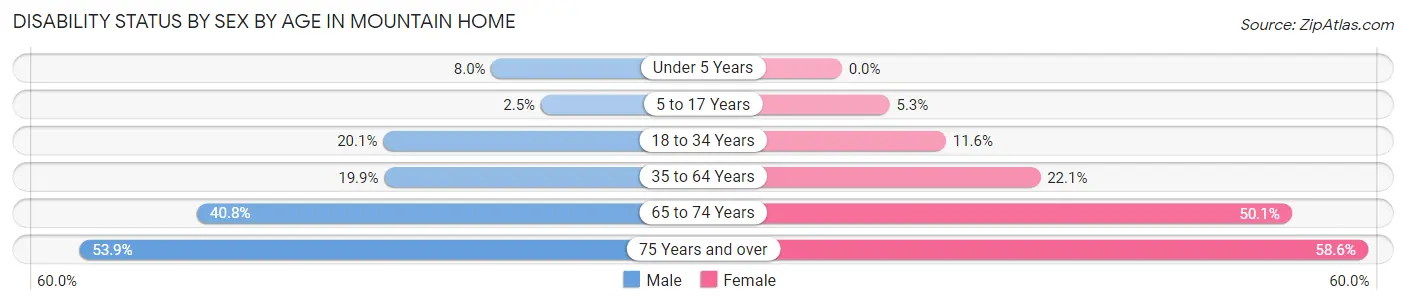
| Age Bracket | Male | Female |
| Under 5 Years | 65 (8.0%) | 0 (0.0%) |
| 5 to 17 Years | 34 (2.5%) | 72 (5.3%) |
| 18 to 34 Years | 318 (20.1%) | 209 (11.6%) |
| 35 to 64 Years | 433 (19.9%) | 530 (22.1%) |
| 65 to 74 Years | 157 (40.8%) | 313 (50.1%) |
| 75 Years and over | 228 (53.9%) | 308 (58.6%) |
Disability Class by Sex by Age in Mountain Home
Disability Class: Hearing Difficulty
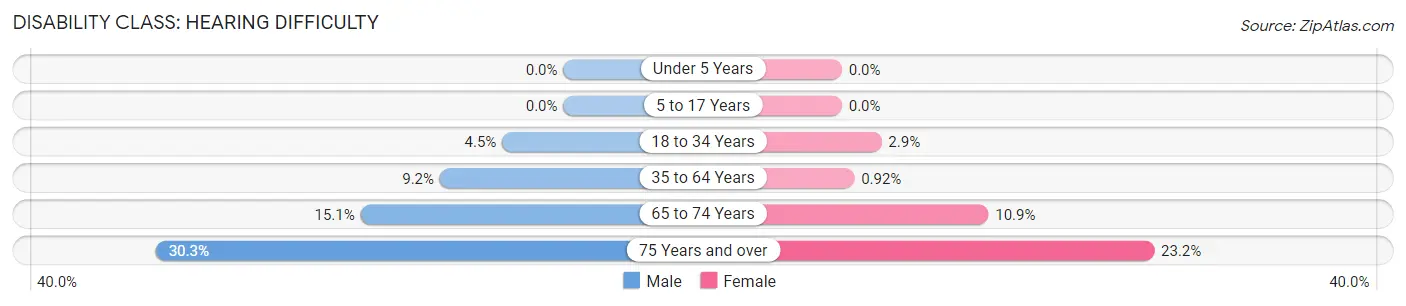
| Age Bracket | Male | Female |
| Under 5 Years | 0 (0.0%) | 0 (0.0%) |
| 5 to 17 Years | 0 (0.0%) | 0 (0.0%) |
| 18 to 34 Years | 72 (4.5%) | 53 (2.9%) |
| 35 to 64 Years | 199 (9.2%) | 22 (0.9%) |
| 65 to 74 Years | 58 (15.1%) | 68 (10.9%) |
| 75 Years and over | 128 (30.3%) | 122 (23.2%) |
Disability Class: Vision Difficulty
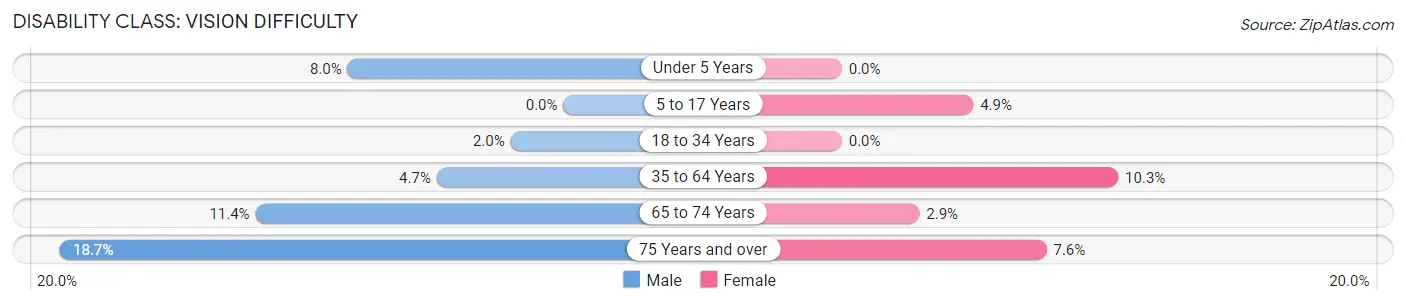
| Age Bracket | Male | Female |
| Under 5 Years | 65 (8.0%) | 0 (0.0%) |
| 5 to 17 Years | 0 (0.0%) | 66 (4.9%) |
| 18 to 34 Years | 31 (2.0%) | 0 (0.0%) |
| 35 to 64 Years | 102 (4.7%) | 246 (10.3%) |
| 65 to 74 Years | 44 (11.4%) | 18 (2.9%) |
| 75 Years and over | 79 (18.7%) | 40 (7.6%) |
Disability Class: Cognitive Difficulty
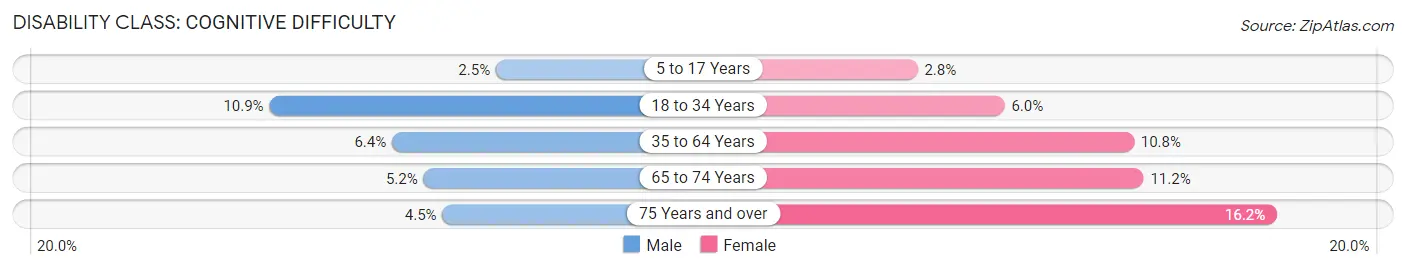
| Age Bracket | Male | Female |
| 5 to 17 Years | 34 (2.5%) | 38 (2.8%) |
| 18 to 34 Years | 173 (10.9%) | 109 (6.0%) |
| 35 to 64 Years | 138 (6.4%) | 260 (10.8%) |
| 65 to 74 Years | 20 (5.2%) | 70 (11.2%) |
| 75 Years and over | 19 (4.5%) | 85 (16.2%) |
Disability Class: Ambulatory Difficulty
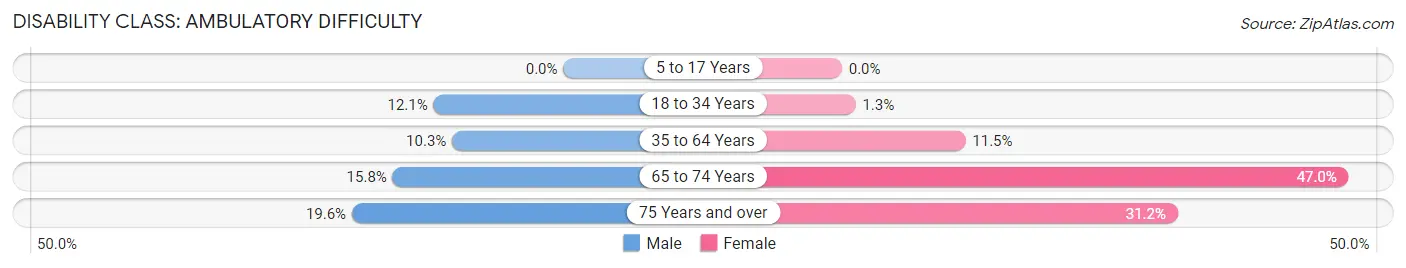
| Age Bracket | Male | Female |
| 5 to 17 Years | 0 (0.0%) | 0 (0.0%) |
| 18 to 34 Years | 191 (12.0%) | 23 (1.3%) |
| 35 to 64 Years | 224 (10.3%) | 275 (11.5%) |
| 65 to 74 Years | 61 (15.8%) | 294 (47.0%) |
| 75 Years and over | 83 (19.6%) | 164 (31.2%) |
Disability Class: Self-Care Difficulty
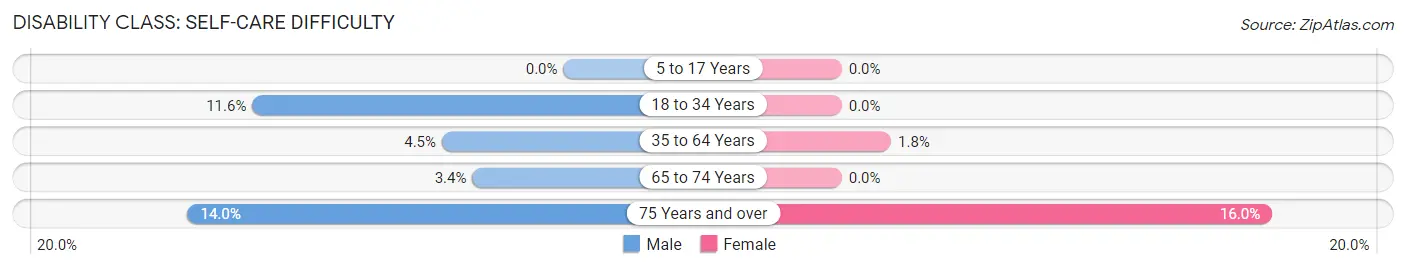
| Age Bracket | Male | Female |
| 5 to 17 Years | 0 (0.0%) | 0 (0.0%) |
| 18 to 34 Years | 183 (11.6%) | 0 (0.0%) |
| 35 to 64 Years | 98 (4.5%) | 44 (1.8%) |
| 65 to 74 Years | 13 (3.4%) | 0 (0.0%) |
| 75 Years and over | 59 (14.0%) | 84 (16.0%) |
Technology Access in Mountain Home
Computing Device Access in Mountain Home
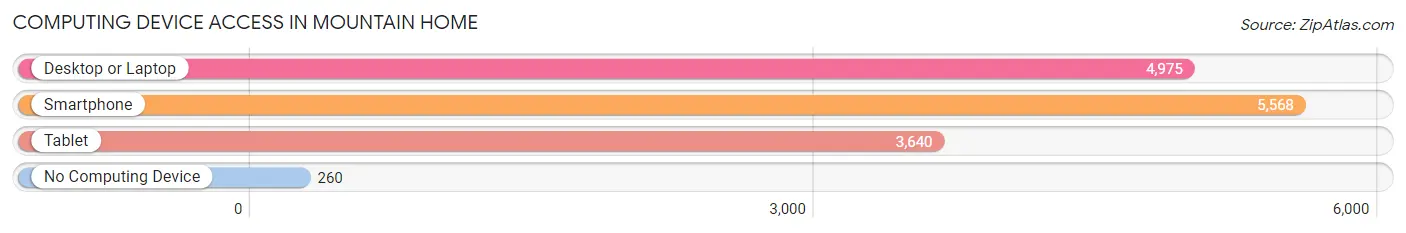
| Device Type | # Households | % Households |
| Desktop or Laptop | 4,975 | 80.4% |
| Smartphone | 5,568 | 90.0% |
| Tablet | 3,640 | 58.9% |
| No Computing Device | 260 | 4.2% |
| Total | 6,184 | 100.0% |
Internet Access in Mountain Home
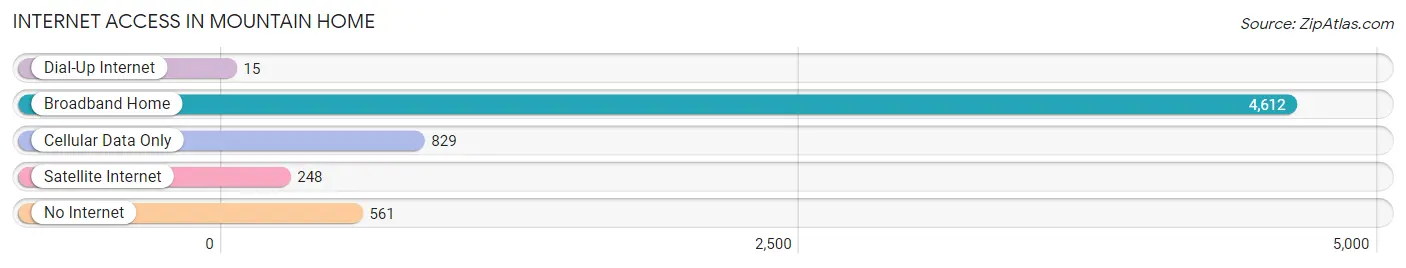
| Internet Type | # Households | % Households |
| Dial-Up Internet | 15 | 0.2% |
| Broadband Home | 4,612 | 74.6% |
| Cellular Data Only | 829 | 13.4% |
| Satellite Internet | 248 | 4.0% |
| No Internet | 561 | 9.1% |
| Total | 6,184 | 100.0% |
Mountain Home Summary
Mountain Home, Idaho is a small city located in Elmore County, in the southwestern part of the state. It is situated at the base of the Owyhee Mountains, and is the county seat of Elmore County. The city has a population of approximately 13,000 people, and is the largest city in Elmore County.
History
Mountain Home was founded in 1864 by a group of settlers from the Oregon Trail. The city was originally named "Mountain Home Station" due to its location at the base of the Owyhee Mountains. The city was incorporated in 1891, and the name was changed to Mountain Home.
The city was an important stop on the Oregon Trail, and was a major supply center for miners and ranchers in the area. The city was also a major stop on the Union Pacific Railroad, which connected the city to the rest of the country.
Geography
Mountain Home is located in the southwestern part of Idaho, in Elmore County. The city is situated at the base of the Owyhee Mountains, and is surrounded by rolling hills and farmland. The city is located at an elevation of 4,000 feet, and has a total area of 8.3 square miles.
The city is located near several major highways, including Interstate 84, US Highway 20, and US Highway 26. The city is also located near several major cities, including Boise, Idaho Falls, and Twin Falls.
Economy
Mountain Home has a diverse economy, with a variety of industries and businesses. The city is home to several major employers, including Mountain Home Air Force Base, the Elmore County School District, and the Elmore County Hospital.
The city is also home to several manufacturing companies, including Boise Cascade, Boise Paper, and Boise Steel. The city is also home to several retail stores, including Walmart, Target, and Lowe's.
Demographics
Mountain Home has a population of approximately 13,000 people, and is the largest city in Elmore County. The city has a median household income of $45,000, and a median home value of $150,000. The city has a population that is predominantly white, with a small percentage of African Americans, Hispanics, and Asians.
The city has a low crime rate, and is considered to be a safe place to live. The city has a low unemployment rate, and is considered to be a good place to find employment.
Conclusion
Mountain Home, Idaho is a small city located in Elmore County, in the southwestern part of the state. The city has a population of approximately 13,000 people, and is the largest city in Elmore County. The city has a diverse economy, with a variety of industries and businesses. The city has a median household income of $45,000, and a median home value of $150,000. The city has a low crime rate, and is considered to be a safe place to live. Mountain Home is an ideal place to live, work, and raise a family.
Common Questions
What is Per Capita Income in Mountain Home?
Per Capita income in Mountain Home is $26,904.
What is the Median Family Income in Mountain Home?
Median Family Income in Mountain Home is $65,846.
What is the Median Household income in Mountain Home?
Median Household Income in Mountain Home is $53,108.
What is Income or Wage Gap in Mountain Home?
Income or Wage Gap in Mountain Home is 28.8%.
Women in Mountain Home earn 71.2 cents for every dollar earned by a man.
What is Inequality or Gini Index in Mountain Home?
Inequality or Gini Index in Mountain Home is 0.39.
What is the Total Population of Mountain Home?
Total Population of Mountain Home is 16,026.
What is the Total Male Population of Mountain Home?
Total Male Population of Mountain Home is 8,197.
What is the Total Female Population of Mountain Home?
Total Female Population of Mountain Home is 7,829.
What is the Ratio of Males per 100 Females in Mountain Home?
There are 104.70 Males per 100 Females in Mountain Home.
What is the Ratio of Females per 100 Males in Mountain Home?
There are 95.51 Females per 100 Males in Mountain Home.
What is the Median Population Age in Mountain Home?
Median Population Age in Mountain Home is 31.3 Years.
What is the Average Family Size in Mountain Home
Average Family Size in Mountain Home is 3.2 People.
What is the Average Household Size in Mountain Home
Average Household Size in Mountain Home is 2.5 People.
How Large is the Labor Force in Mountain Home?
There are 7,441 People in the Labor Forcein in Mountain Home.
What is the Percentage of People in the Labor Force in Mountain Home?
60.9% of People are in the Labor Force in Mountain Home.
What is the Unemployment Rate in Mountain Home?
Unemployment Rate in Mountain Home is 6.0%.