Smyrna, DE Map & Demographics
Smyrna Map
Smyrna Overview
$31,340
PER CAPITA INCOME
$72,464
AVG FAMILY INCOME
$68,260
AVG HOUSEHOLD INCOME
8.1%
WAGE / INCOME GAP [ % ]
91.9¢/ $1
WAGE / INCOME GAP [ $ ]
$2,865
FAMILY INCOME DEFICIT
0.33
INEQUALITY / GINI INDEX
12,870
TOTAL POPULATION
6,289
MALE POPULATION
6,581
FEMALE POPULATION
95.56
MALES / 100 FEMALES
104.64
FEMALES / 100 MALES
34.2
MEDIAN AGE
3.2
AVG FAMILY SIZE
2.7
AVG HOUSEHOLD SIZE
6,914
LABOR FORCE [ PEOPLE ]
69.4%
PERCENT IN LABOR FORCE
6.1%
UNEMPLOYMENT RATE
Smyrna Zip Codes
Smyrna Area Codes
Income in Smyrna
Income Overview in Smyrna
Per Capita Income in Smyrna is $31,340, while median incomes of families and households are $72,464 and $68,260 respectively.
| Characteristic | Number | Measure |
| Per Capita Income | 12,870 | $31,340 |
| Median Family Income | 3,227 | $72,464 |
| Mean Family Income | 3,227 | $87,447 |
| Median Household Income | 4,759 | $68,260 |
| Mean Household Income | 4,759 | $80,221 |
| Income Deficit | 3,227 | $2,865 |
| Wage / Income Gap (%) | 12,870 | 8.05% |
| Wage / Income Gap ($) | 12,870 | 91.95¢ per $1 |
| Gini / Inequality Index | 12,870 | 0.33 |
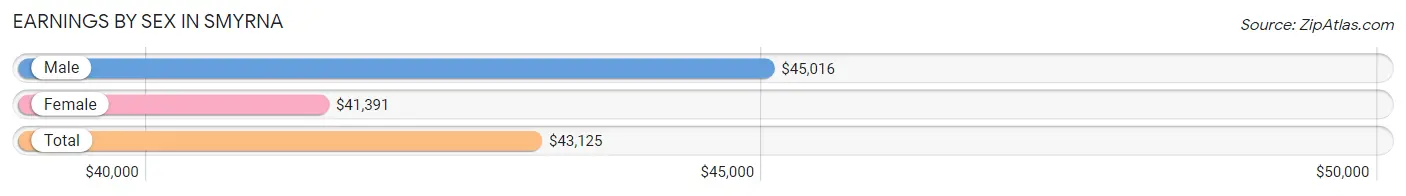
Earnings by Sex in Smyrna
Average Earnings in Smyrna are $43,125, $45,016 for men and $41,391 for women, a difference of 8.1%.
| Sex | Number | Average Earnings |
| Male | 3,365 (47.5%) | $45,016 |
| Female | 3,716 (52.5%) | $41,391 |
| Total | 7,081 (100.0%) | $43,125 |
Earnings by Sex by Income Bracket in Smyrna
The most common earnings brackets in Smyrna are $45,000 to $49,999 for men (466 | 13.9%) and $45,000 to $49,999 for women (480 | 12.9%).
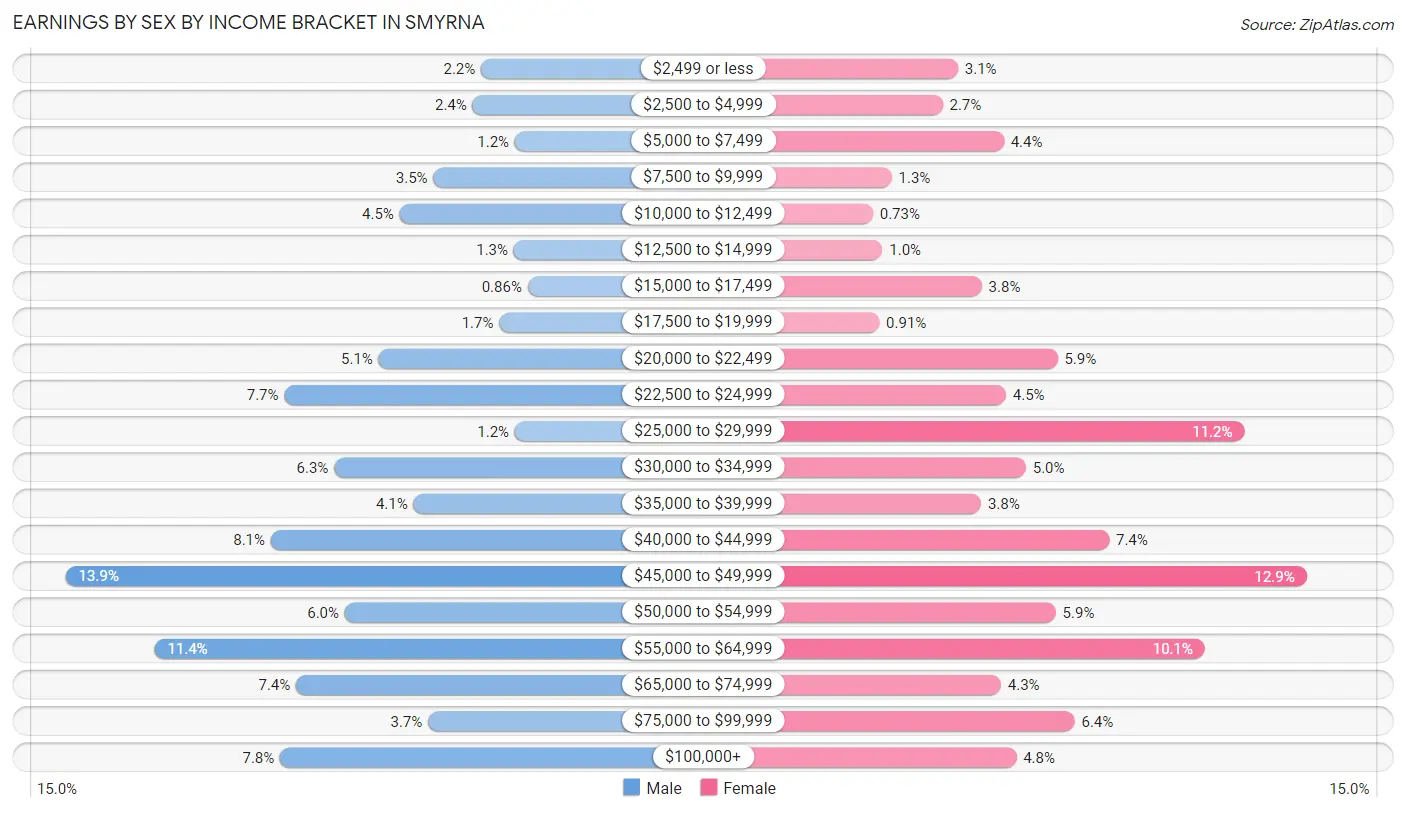
| Income | Male | Female |
| $2,499 or less | 73 (2.2%) | 116 (3.1%) |
| $2,500 to $4,999 | 81 (2.4%) | 100 (2.7%) |
| $5,000 to $7,499 | 41 (1.2%) | 164 (4.4%) |
| $7,500 to $9,999 | 118 (3.5%) | 47 (1.3%) |
| $10,000 to $12,499 | 150 (4.5%) | 27 (0.7%) |
| $12,500 to $14,999 | 42 (1.3%) | 37 (1.0%) |
| $15,000 to $17,499 | 29 (0.9%) | 141 (3.8%) |
| $17,500 to $19,999 | 56 (1.7%) | 34 (0.9%) |
| $20,000 to $22,499 | 170 (5.1%) | 220 (5.9%) |
| $22,500 to $24,999 | 259 (7.7%) | 166 (4.5%) |
| $25,000 to $29,999 | 41 (1.2%) | 415 (11.2%) |
| $30,000 to $34,999 | 212 (6.3%) | 187 (5.0%) |
| $35,000 to $39,999 | 137 (4.1%) | 140 (3.8%) |
| $40,000 to $44,999 | 272 (8.1%) | 274 (7.4%) |
| $45,000 to $49,999 | 466 (13.9%) | 480 (12.9%) |
| $50,000 to $54,999 | 202 (6.0%) | 218 (5.9%) |
| $55,000 to $64,999 | 382 (11.4%) | 374 (10.1%) |
| $65,000 to $74,999 | 248 (7.4%) | 161 (4.3%) |
| $75,000 to $99,999 | 123 (3.7%) | 238 (6.4%) |
| $100,000+ | 263 (7.8%) | 177 (4.8%) |
| Total | 3,365 (100.0%) | 3,716 (100.0%) |
Earnings by Sex by Educational Attainment in Smyrna
Average earnings in Smyrna are $46,076 for men and $44,104 for women, a difference of 4.3%. Men with an educational attainment of less than high school enjoy the highest average annual earnings of $46,181, while those with bachelor's degree education earn the least with $39,643. Women with an educational attainment of graduate degree earn the most with the average annual earnings of $84,832, while those with high school diploma education have the smallest earnings of $25,581.
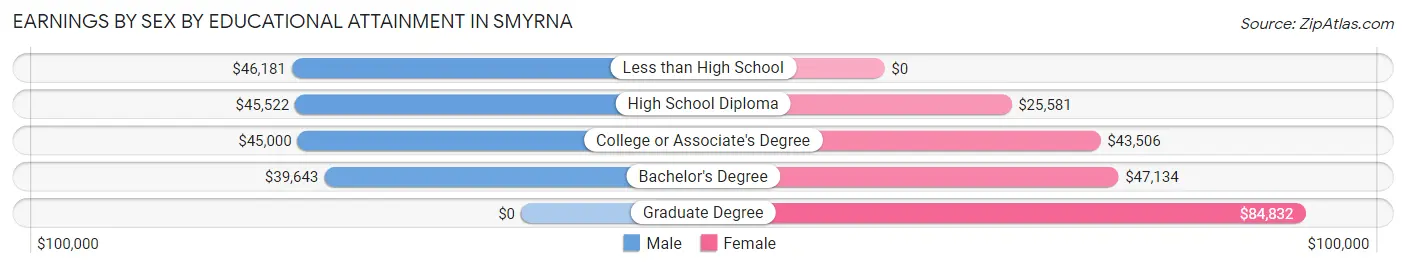
| Educational Attainment | Male Income | Female Income |
| Less than High School | $46,181 | $0 |
| High School Diploma | $45,522 | $25,581 |
| College or Associate's Degree | $45,000 | $43,506 |
| Bachelor's Degree | $39,643 | $47,134 |
| Graduate Degree | - | - |
| Total | $46,076 | $44,104 |
Family Income in Smyrna
Family Income Brackets in Smyrna
According to the Smyrna family income data, there are 791 families falling into the $50,000 to $74,999 income range, which is the most common income bracket and makes up 24.5% of all families.
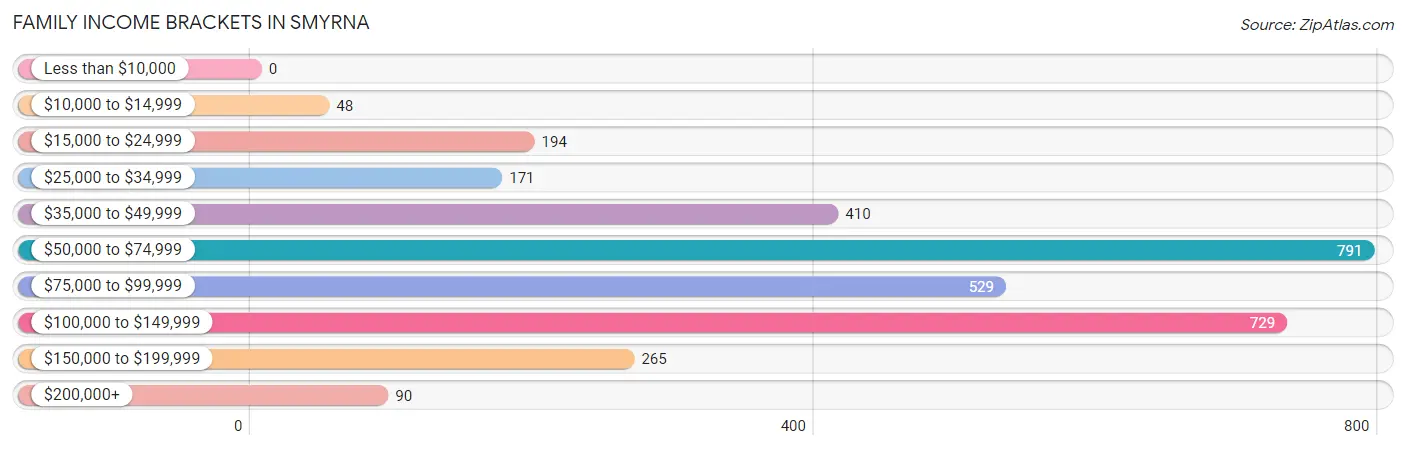
| Income Bracket | # Families | % Families |
| Less than $10,000 | 0 | 0.0% |
| $10,000 to $14,999 | 48 | 1.5% |
| $15,000 to $24,999 | 194 | 6.0% |
| $25,000 to $34,999 | 171 | 5.3% |
| $35,000 to $49,999 | 410 | 12.7% |
| $50,000 to $74,999 | 791 | 24.5% |
| $75,000 to $99,999 | 529 | 16.4% |
| $100,000 to $149,999 | 729 | 22.6% |
| $150,000 to $199,999 | 265 | 8.2% |
| $200,000+ | 90 | 2.8% |
Family Income by Famaliy Size in Smyrna
6-person families (27 | 0.8%) account for the highest median family income in Smyrna with $243,250 per family, while 6-person families (27 | 0.8%) have the highest median income of $40,542 per family member.
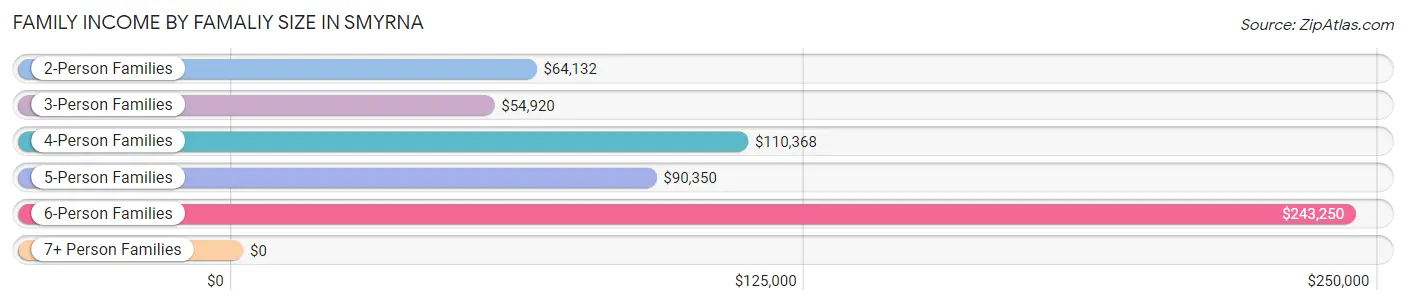
| Income Bracket | # Families | Median Income |
| 2-Person Families | 1,385 (42.9%) | $64,132 |
| 3-Person Families | 852 (26.4%) | $54,920 |
| 4-Person Families | 643 (19.9%) | $110,368 |
| 5-Person Families | 306 (9.5%) | $90,350 |
| 6-Person Families | 27 (0.8%) | $243,250 |
| 7+ Person Families | 14 (0.4%) | $0 |
| Total | 3,227 (100.0%) | $72,464 |
Family Income by Number of Earners in Smyrna
The median family income in Smyrna is $72,464, with families comprising 3+ earners (364) having the highest median family income of $116,741, while families with 1 earner (856) have the lowest median family income of $44,118, accounting for 11.3% and 26.5% of families, respectively.
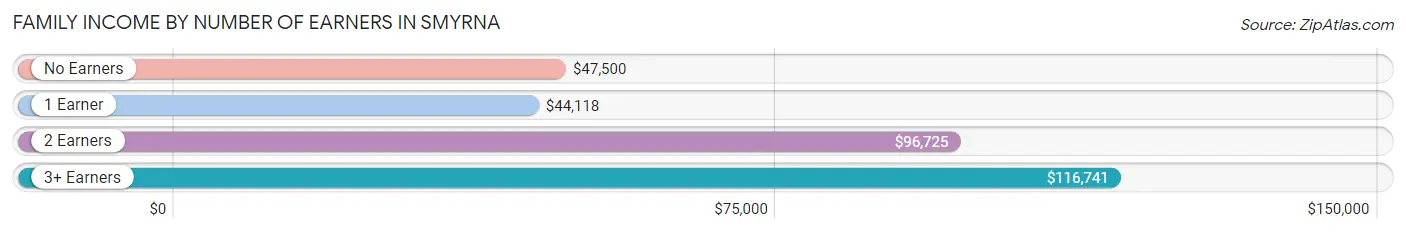
| Number of Earners | # Families | Median Income |
| No Earners | 300 (9.3%) | $47,500 |
| 1 Earner | 856 (26.5%) | $44,118 |
| 2 Earners | 1,707 (52.9%) | $96,725 |
| 3+ Earners | 364 (11.3%) | $116,741 |
| Total | 3,227 (100.0%) | $72,464 |
Household Income in Smyrna
Household Income Brackets in Smyrna
With 1,423 households falling in the category, the $50,000 to $74,999 income range is the most frequent in Smyrna, accounting for 29.9% of all households. In contrast, only 19 households (0.4%) fall into the less than $10,000 income bracket, making it the least populous group.
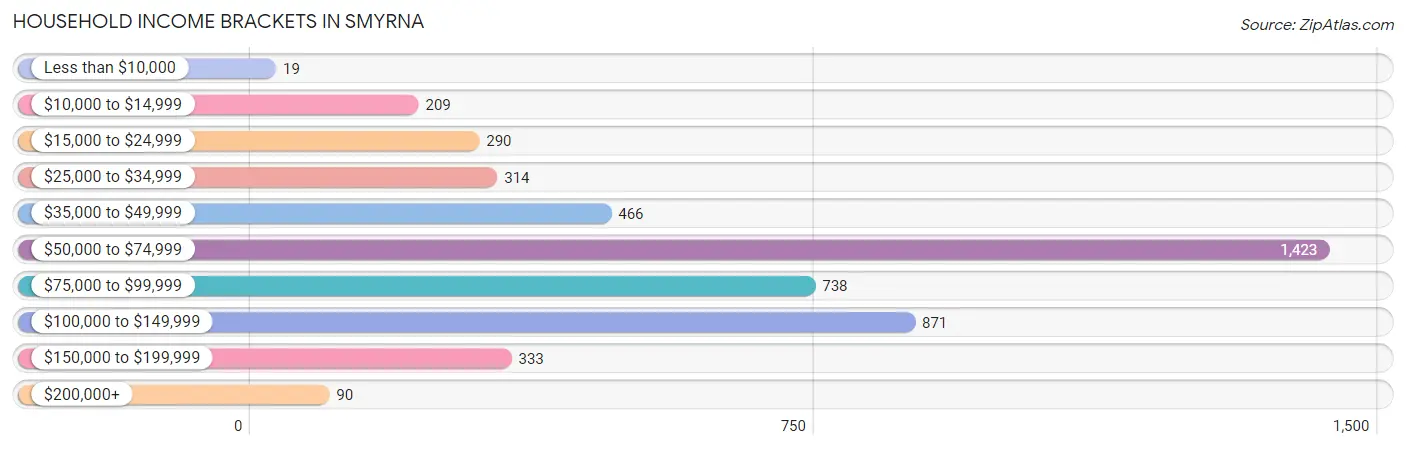
| Income Bracket | # Households | % Households |
| Less than $10,000 | 19 | 0.4% |
| $10,000 to $14,999 | 209 | 4.4% |
| $15,000 to $24,999 | 290 | 6.1% |
| $25,000 to $34,999 | 314 | 6.6% |
| $35,000 to $49,999 | 466 | 9.8% |
| $50,000 to $74,999 | 1,423 | 29.9% |
| $75,000 to $99,999 | 738 | 15.5% |
| $100,000 to $149,999 | 871 | 18.3% |
| $150,000 to $199,999 | 333 | 7.0% |
| $200,000+ | 90 | 1.9% |
Household Income by Householder Age in Smyrna
The median household income in Smyrna is $68,260, with the highest median household income of $74,893 found in the 45 to 64 years age bracket for the primary householder. A total of 1,495 households (31.4%) fall into this category. Meanwhile, the 15 to 24 years age bracket for the primary householder has the lowest median household income of $46,546, with 105 households (2.2%) in this group.
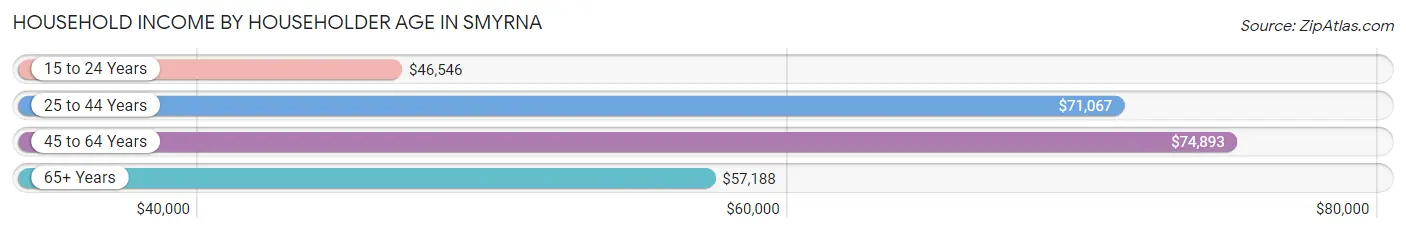
| Income Bracket | # Households | Median Income |
| 15 to 24 Years | 105 (2.2%) | $46,546 |
| 25 to 44 Years | 2,055 (43.2%) | $71,067 |
| 45 to 64 Years | 1,495 (31.4%) | $74,893 |
| 65+ Years | 1,104 (23.2%) | $57,188 |
| Total | 4,759 (100.0%) | $68,260 |
Poverty in Smyrna
Income Below Poverty by Sex and Age in Smyrna
With 8.2% poverty level for males and 11.7% for females among the residents of Smyrna, 12 to 14 year old males and 75 year old and over females are the most vulnerable to poverty, with 48 males (29.3%) and 82 females (27.1%) in their respective age groups living below the poverty level.
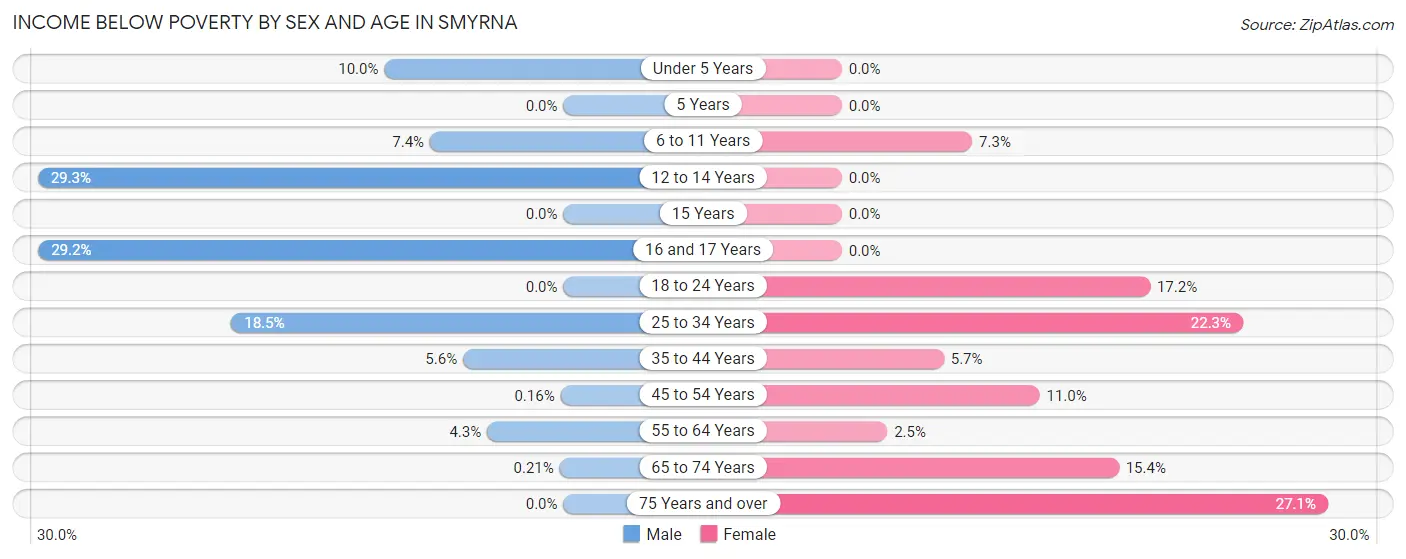
| Age Bracket | Male | Female |
| Under 5 Years | 68 (10.0%) | 0 (0.0%) |
| 5 Years | 0 (0.0%) | 0 (0.0%) |
| 6 to 11 Years | 39 (7.4%) | 46 (7.3%) |
| 12 to 14 Years | 48 (29.3%) | 0 (0.0%) |
| 15 Years | 0 (0.0%) | 0 (0.0%) |
| 16 and 17 Years | 50 (29.2%) | 0 (0.0%) |
| 18 to 24 Years | 0 (0.0%) | 64 (17.2%) |
| 25 to 34 Years | 232 (18.5%) | 303 (22.3%) |
| 35 to 44 Years | 47 (5.6%) | 52 (5.7%) |
| 45 to 54 Years | 1 (0.2%) | 100 (11.0%) |
| 55 to 64 Years | 24 (4.3%) | 15 (2.5%) |
| 65 to 74 Years | 1 (0.2%) | 89 (15.4%) |
| 75 Years and over | 0 (0.0%) | 82 (27.1%) |
| Total | 510 (8.2%) | 751 (11.7%) |
Income Above Poverty by Sex and Age in Smyrna
According to the poverty statistics in Smyrna, males aged 15 years and females aged under 5 years are the age groups that are most secure financially, with 100.0% of males and 100.0% of females in these age groups living above the poverty line.
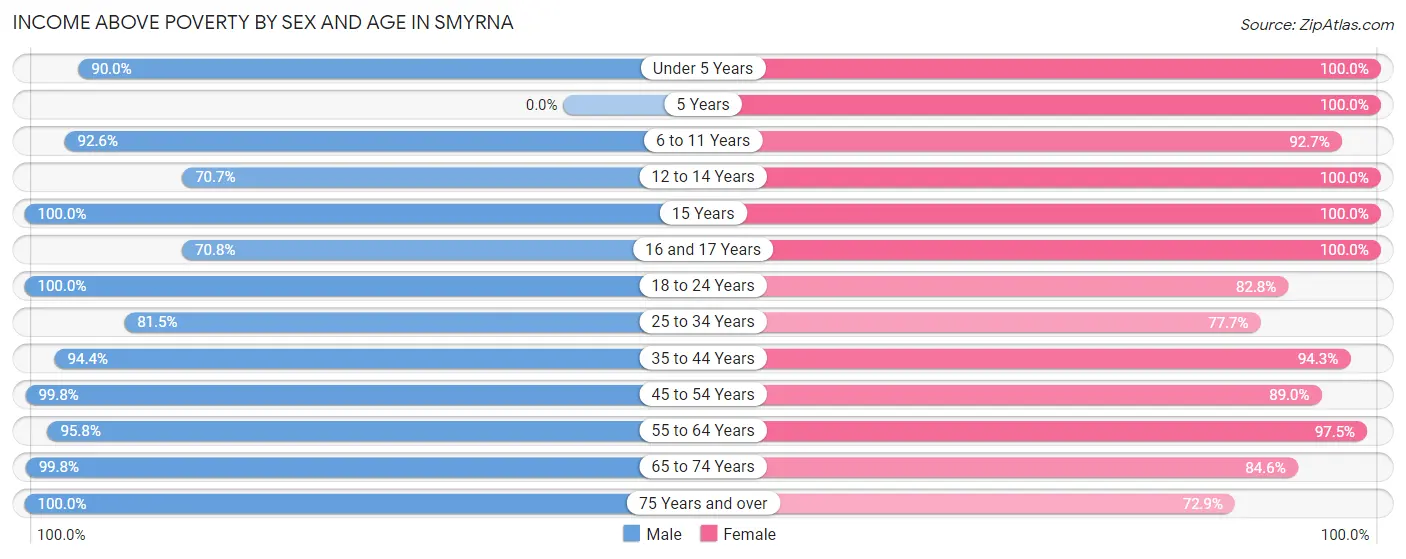
| Age Bracket | Male | Female |
| Under 5 Years | 614 (90.0%) | 450 (100.0%) |
| 5 Years | 0 (0.0%) | 10 (100.0%) |
| 6 to 11 Years | 486 (92.6%) | 588 (92.7%) |
| 12 to 14 Years | 116 (70.7%) | 133 (100.0%) |
| 15 Years | 188 (100.0%) | 42 (100.0%) |
| 16 and 17 Years | 121 (70.8%) | 123 (100.0%) |
| 18 to 24 Years | 524 (100.0%) | 309 (82.8%) |
| 25 to 34 Years | 1,023 (81.5%) | 1,054 (77.7%) |
| 35 to 44 Years | 794 (94.4%) | 863 (94.3%) |
| 45 to 54 Years | 618 (99.8%) | 808 (89.0%) |
| 55 to 64 Years | 541 (95.8%) | 578 (97.5%) |
| 65 to 74 Years | 474 (99.8%) | 488 (84.6%) |
| 75 Years and over | 197 (100.0%) | 221 (72.9%) |
| Total | 5,696 (91.8%) | 5,667 (88.3%) |
Income Below Poverty Among Married-Couple Families in Smyrna
The poverty statistics for married-couple families in Smyrna show that 6.1% or 131 of the total 2,135 families live below the poverty line. Families with 1 or 2 children have the highest poverty rate of 13.6%, comprising of 128 families. On the other hand, families with 3 or 4 children have the lowest poverty rate of 0.0%, which includes 0 families.
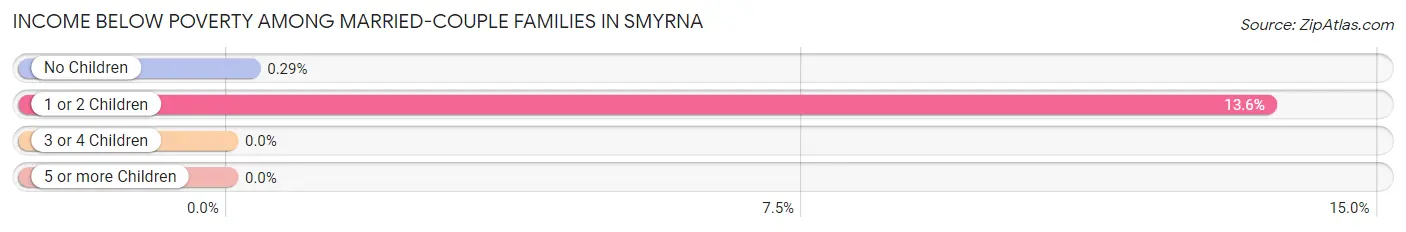
| Children | Above Poverty | Below Poverty |
| No Children | 1,046 (99.7%) | 3 (0.3%) |
| 1 or 2 Children | 816 (86.4%) | 128 (13.6%) |
| 3 or 4 Children | 142 (100.0%) | 0 (0.0%) |
| 5 or more Children | 0 (0.0%) | 0 (0.0%) |
| Total | 2,004 (93.9%) | 131 (6.1%) |
Income Below Poverty Among Single-Parent Households in Smyrna
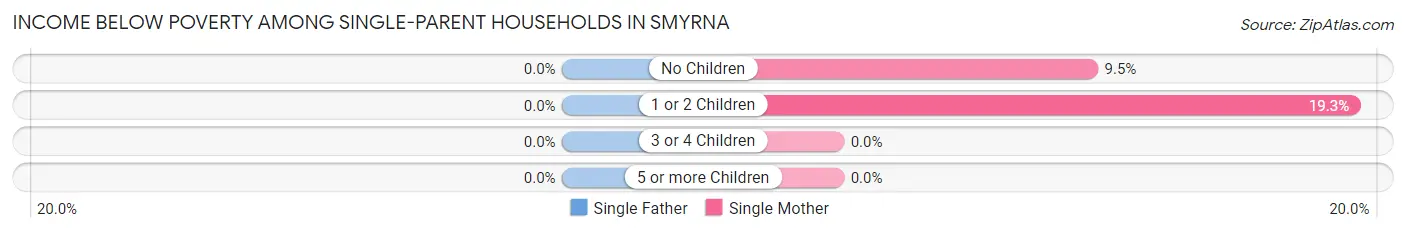
| Children | Single Father | Single Mother |
| No Children | 0 (0.0%) | 28 (9.5%) |
| 1 or 2 Children | 0 (0.0%) | 106 (19.3%) |
| 3 or 4 Children | 0 (0.0%) | 0 (0.0%) |
| 5 or more Children | 0 (0.0%) | 0 (0.0%) |
| Total | 0 (0.0%) | 134 (15.1%) |
Income Below Poverty Among Married-Couple vs Single-Parent Households in Smyrna
The poverty data for Smyrna shows that 131 of the married-couple family households (6.1%) and 134 of the single-parent households (12.3%) are living below the poverty level. Within the married-couple family households, those with 1 or 2 children have the highest poverty rate, with 128 households (13.6%) falling below the poverty line. Among the single-parent households, those with 1 or 2 children have the highest poverty rate, with 106 household (15.4%) living below poverty.
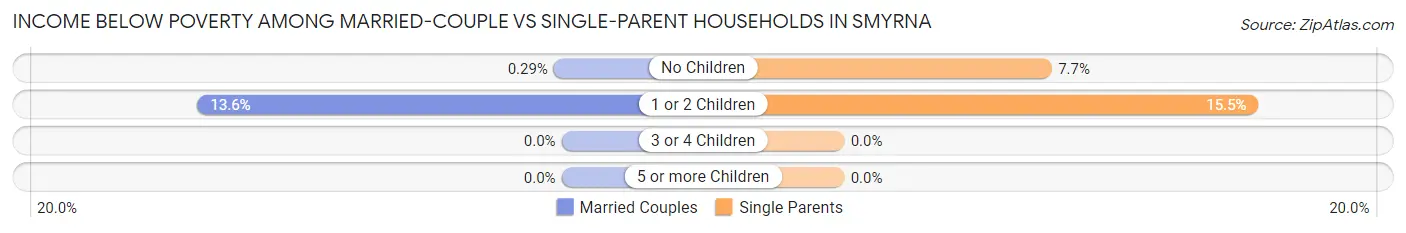
| Children | Married-Couple Families | Single-Parent Households |
| No Children | 3 (0.3%) | 28 (7.7%) |
| 1 or 2 Children | 128 (13.6%) | 106 (15.4%) |
| 3 or 4 Children | 0 (0.0%) | 0 (0.0%) |
| 5 or more Children | 0 (0.0%) | 0 (0.0%) |
| Total | 131 (6.1%) | 134 (12.3%) |
Race in Smyrna
The most populous races in Smyrna are White / Caucasian (6,748 | 52.4%), Black / African American (4,476 | 34.8%), and Two or more Races (1,218 | 9.5%).
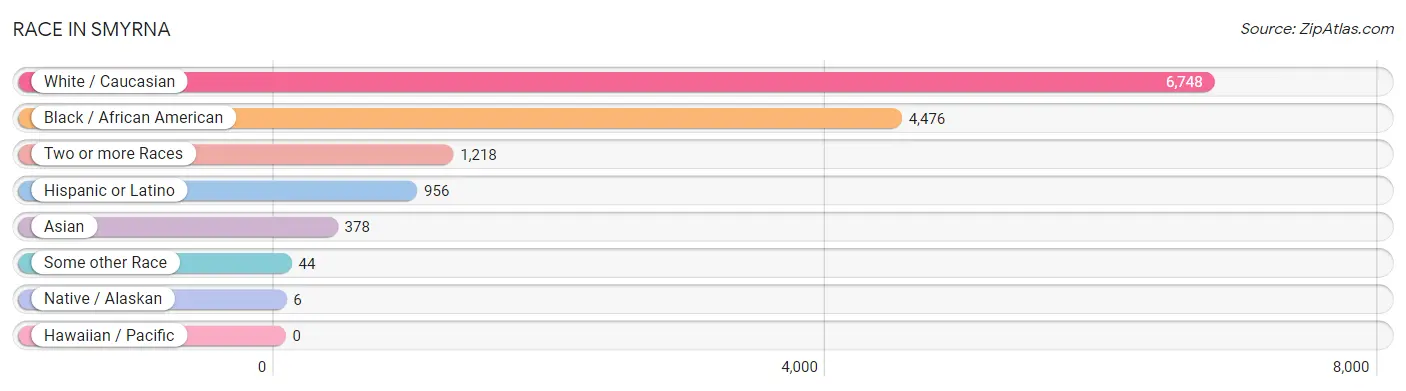
| Race | # Population | % Population |
| Asian | 378 | 2.9% |
| Black / African American | 4,476 | 34.8% |
| Hawaiian / Pacific | 0 | 0.0% |
| Hispanic or Latino | 956 | 7.4% |
| Native / Alaskan | 6 | 0.1% |
| White / Caucasian | 6,748 | 52.4% |
| Two or more Races | 1,218 | 9.5% |
| Some other Race | 44 | 0.3% |
| Total | 12,870 | 100.0% |
Ancestry in Smyrna
The most populous ancestries reported in Smyrna are Irish (2,084 | 16.2%), German (1,610 | 12.5%), Polish (900 | 7.0%), English (817 | 6.4%), and Italian (617 | 4.8%), together accounting for 46.8% of all Smyrna residents.
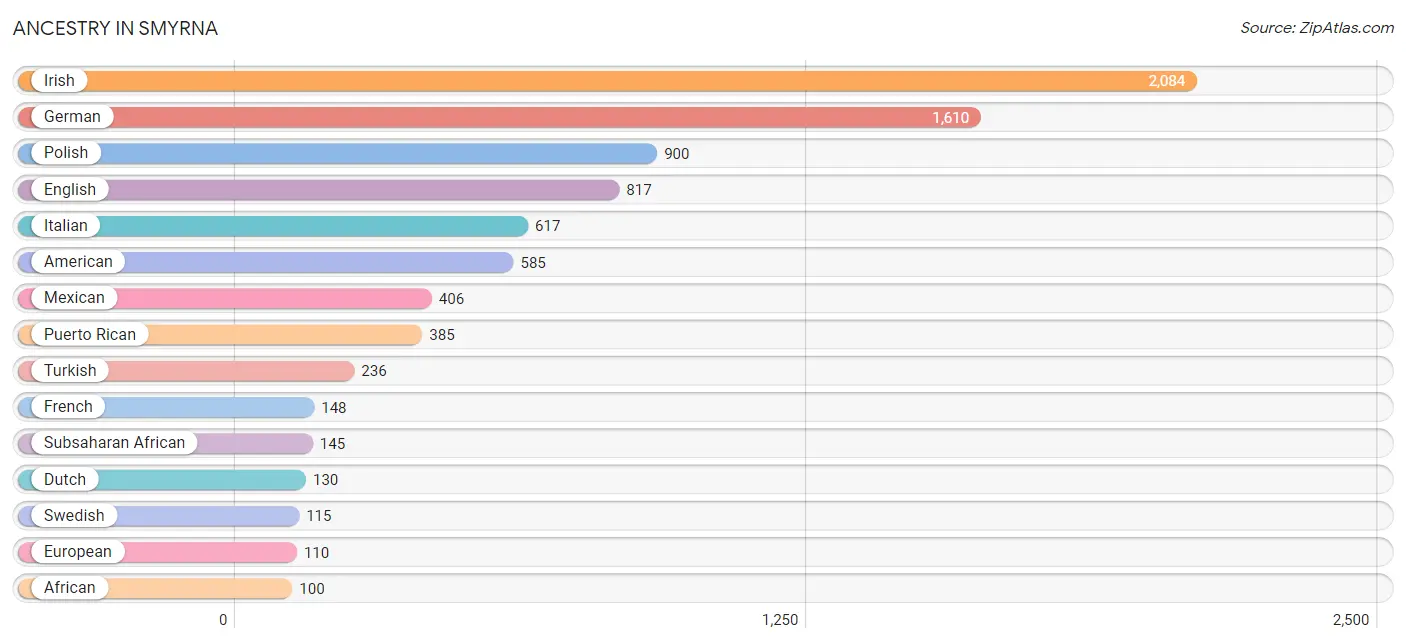
| Ancestry | # Population | % Population |
| Afghan | 74 | 0.6% |
| African | 100 | 0.8% |
| American | 585 | 4.5% |
| Bhutanese | 3 | 0.0% |
| British | 27 | 0.2% |
| Burmese | 10 | 0.1% |
| Central American | 73 | 0.6% |
| Cherokee | 16 | 0.1% |
| Colombian | 19 | 0.2% |
| Cuban | 73 | 0.6% |
| Czechoslovakian | 13 | 0.1% |
| Dutch | 130 | 1.0% |
| English | 817 | 6.4% |
| European | 110 | 0.9% |
| French | 148 | 1.1% |
| French Canadian | 43 | 0.3% |
| German | 1,610 | 12.5% |
| Guyanese | 31 | 0.2% |
| Haitian | 3 | 0.0% |
| Indian (Asian) | 92 | 0.7% |
| Iranian | 42 | 0.3% |
| Irish | 2,084 | 16.2% |
| Italian | 617 | 4.8% |
| Jamaican | 9 | 0.1% |
| Korean | 73 | 0.6% |
| Liberian | 40 | 0.3% |
| Lithuanian | 44 | 0.3% |
| Mexican | 406 | 3.2% |
| Nigerian | 5 | 0.0% |
| Norwegian | 29 | 0.2% |
| Pennsylvania German | 68 | 0.5% |
| Polish | 900 | 7.0% |
| Puerto Rican | 385 | 3.0% |
| Russian | 49 | 0.4% |
| Salvadoran | 73 | 0.6% |
| Scotch-Irish | 72 | 0.6% |
| Scottish | 47 | 0.4% |
| South American | 19 | 0.2% |
| Subsaharan African | 145 | 1.1% |
| Swedish | 115 | 0.9% |
| Thai | 31 | 0.2% |
| Trinidadian and Tobagonian | 14 | 0.1% |
| Turkish | 236 | 1.8% |
| Welsh | 23 | 0.2% | View All 44 Rows |
Immigrants in Smyrna
The most numerous immigrant groups reported in Smyrna came from Asia (475 | 3.7%), South Central Asia (262 | 2.0%), Pakistan (146 | 1.1%), Turkey (119 | 0.9%), and Western Asia (119 | 0.9%), together accounting for 8.7% of all Smyrna residents.
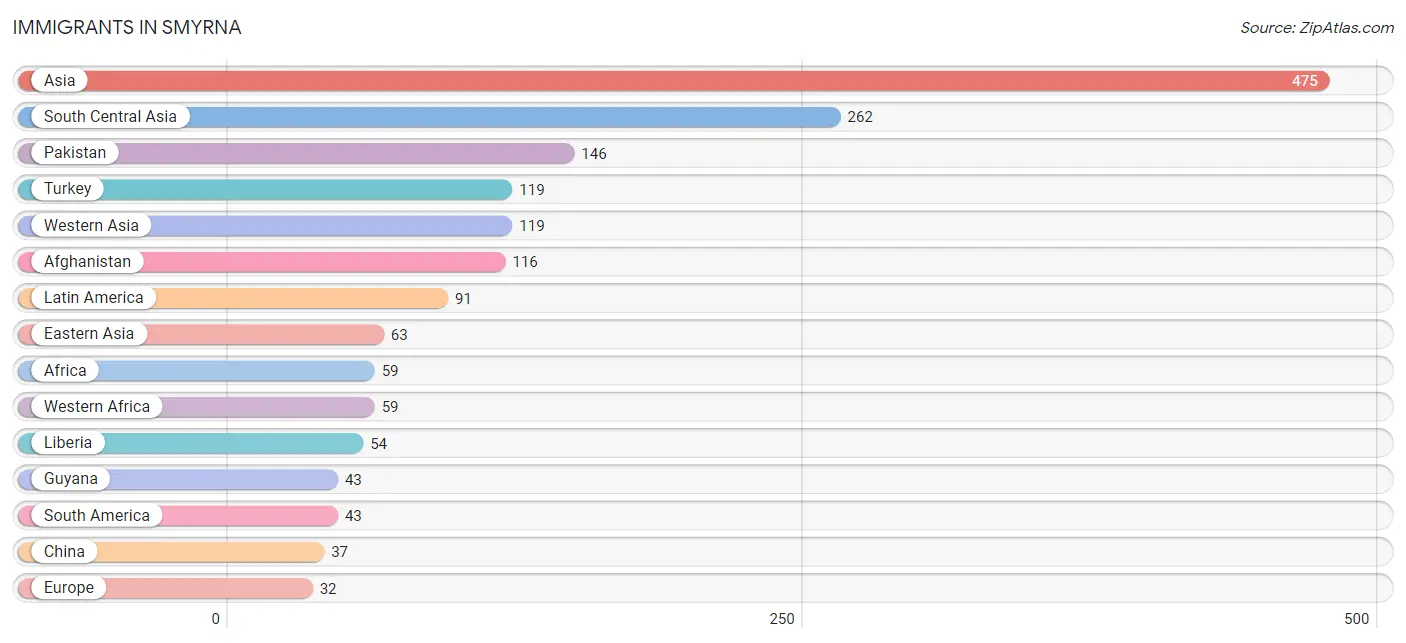
| Immigration Origin | # Population | % Population |
| Afghanistan | 116 | 0.9% |
| Africa | 59 | 0.5% |
| Asia | 475 | 3.7% |
| Caribbean | 17 | 0.1% |
| Central America | 31 | 0.2% |
| China | 37 | 0.3% |
| Eastern Asia | 63 | 0.5% |
| Eastern Europe | 23 | 0.2% |
| Europe | 32 | 0.3% |
| Guyana | 43 | 0.3% |
| Haiti | 3 | 0.0% |
| Japan | 26 | 0.2% |
| Latin America | 91 | 0.7% |
| Liberia | 54 | 0.4% |
| Mexico | 31 | 0.2% |
| Nigeria | 5 | 0.0% |
| Northern Europe | 9 | 0.1% |
| Pakistan | 146 | 1.1% |
| Philippines | 31 | 0.2% |
| Russia | 23 | 0.2% |
| South America | 43 | 0.3% |
| South Central Asia | 262 | 2.0% |
| South Eastern Asia | 31 | 0.2% |
| Trinidad and Tobago | 14 | 0.1% |
| Turkey | 119 | 0.9% |
| Western Africa | 59 | 0.5% |
| Western Asia | 119 | 0.9% | View All 27 Rows |
Sex and Age in Smyrna
Sex and Age in Smyrna
The most populous age groups in Smyrna are Under 5 Years (682 | 10.8%) for men and 30 to 34 Years (832 | 12.6%) for women.
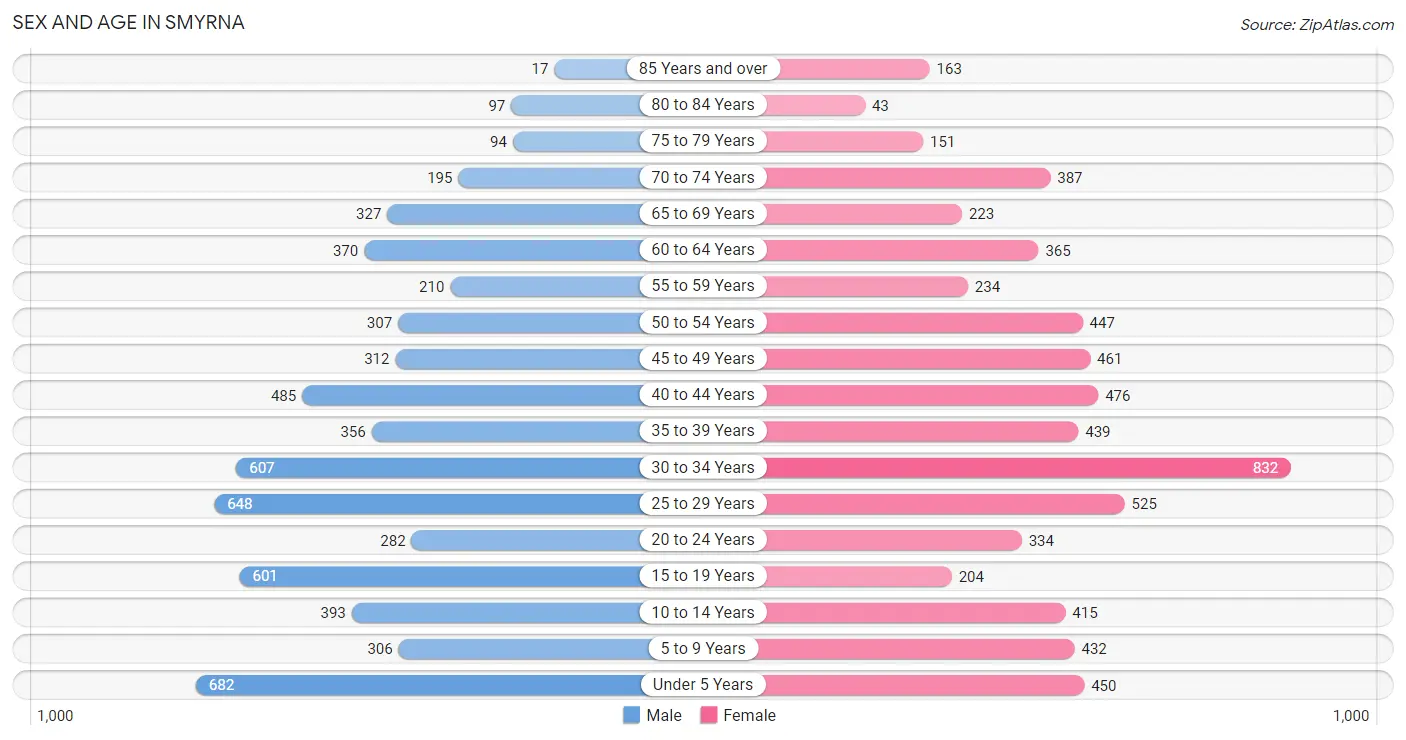
| Age Bracket | Male | Female |
| Under 5 Years | 682 (10.8%) | 450 (6.8%) |
| 5 to 9 Years | 306 (4.9%) | 432 (6.6%) |
| 10 to 14 Years | 393 (6.2%) | 415 (6.3%) |
| 15 to 19 Years | 601 (9.6%) | 204 (3.1%) |
| 20 to 24 Years | 282 (4.5%) | 334 (5.1%) |
| 25 to 29 Years | 648 (10.3%) | 525 (8.0%) |
| 30 to 34 Years | 607 (9.7%) | 832 (12.6%) |
| 35 to 39 Years | 356 (5.7%) | 439 (6.7%) |
| 40 to 44 Years | 485 (7.7%) | 476 (7.2%) |
| 45 to 49 Years | 312 (5.0%) | 461 (7.0%) |
| 50 to 54 Years | 307 (4.9%) | 447 (6.8%) |
| 55 to 59 Years | 210 (3.3%) | 234 (3.6%) |
| 60 to 64 Years | 370 (5.9%) | 365 (5.6%) |
| 65 to 69 Years | 327 (5.2%) | 223 (3.4%) |
| 70 to 74 Years | 195 (3.1%) | 387 (5.9%) |
| 75 to 79 Years | 94 (1.5%) | 151 (2.3%) |
| 80 to 84 Years | 97 (1.5%) | 43 (0.6%) |
| 85 Years and over | 17 (0.3%) | 163 (2.5%) |
| Total | 6,289 (100.0%) | 6,581 (100.0%) |
Families and Households in Smyrna
Median Family Size in Smyrna
The median family size in Smyrna is 3.21 persons per family, with married-couple families (2,135 | 66.2%) accounting for the largest median family size of 3.38 persons per family. On the other hand, single male/father families (202 | 6.3%) represent the smallest median family size with 2.87 persons per family.
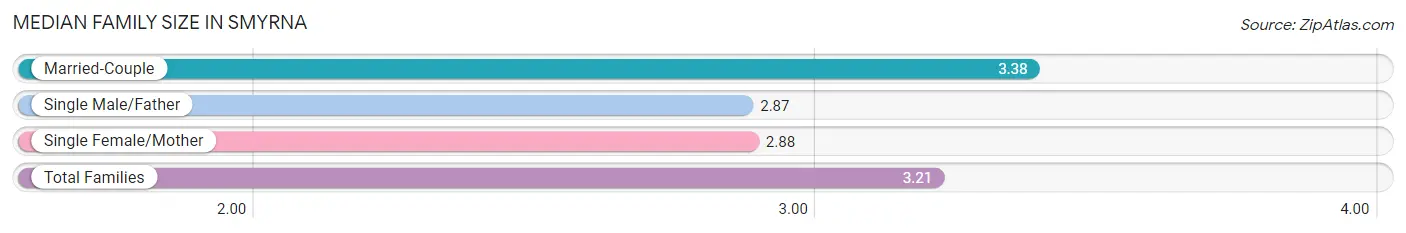
| Family Type | # Families | Family Size |
| Married-Couple | 2,135 (66.2%) | 3.38 |
| Single Male/Father | 202 (6.3%) | 2.87 |
| Single Female/Mother | 890 (27.6%) | 2.88 |
| Total Families | 3,227 (100.0%) | 3.21 |
Median Household Size in Smyrna
The median household size in Smyrna is 2.67 persons per household, with single male/father households (202 | 4.2%) accounting for the largest median household size of 3.54 persons per household. non-family households (1,532 | 32.2%) represent the smallest median household size with 1.36 persons per household.
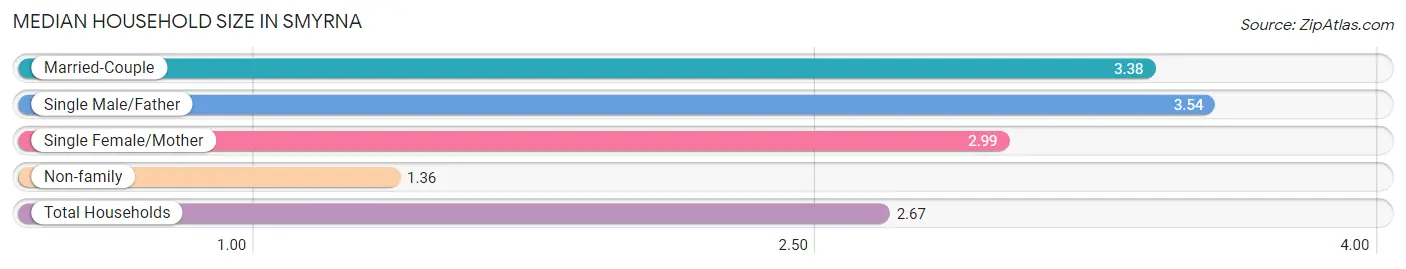
| Household Type | # Households | Household Size |
| Married-Couple | 2,135 (44.9%) | 3.38 |
| Single Male/Father | 202 (4.2%) | 3.54 |
| Single Female/Mother | 890 (18.7%) | 2.99 |
| Non-family | 1,532 (32.2%) | 1.36 |
| Total Households | 4,759 (100.0%) | 2.67 |
Household Size by Marriage Status in Smyrna
Out of a total of 4,759 households in Smyrna, 3,227 (67.8%) are family households, while 1,532 (32.2%) are nonfamily households. The most numerous type of family households are 2-person households, comprising 1,341, and the most common type of nonfamily households are 1-person households, comprising 1,244.
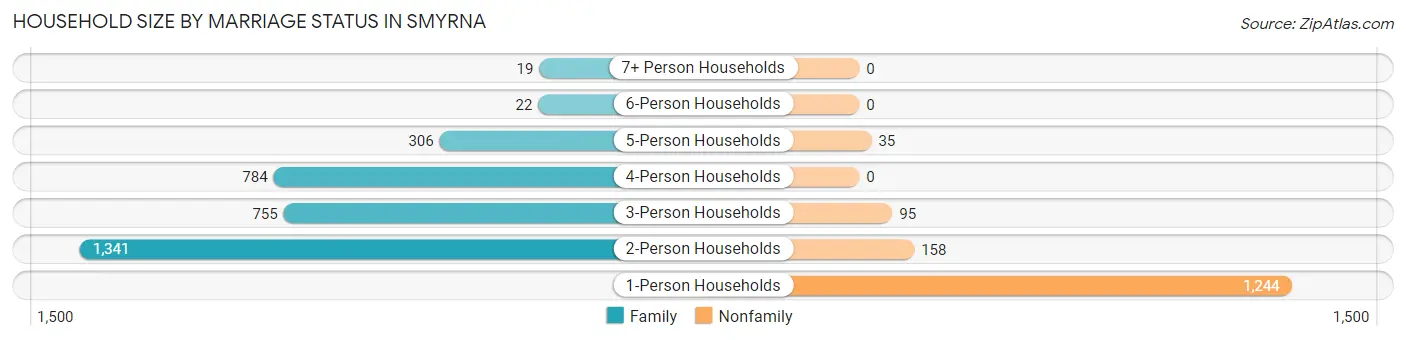
| Household Size | Family Households | Nonfamily Households |
| 1-Person Households | - | 1,244 (26.1%) |
| 2-Person Households | 1,341 (28.2%) | 158 (3.3%) |
| 3-Person Households | 755 (15.9%) | 95 (2.0%) |
| 4-Person Households | 784 (16.5%) | 0 (0.0%) |
| 5-Person Households | 306 (6.4%) | 35 (0.7%) |
| 6-Person Households | 22 (0.5%) | 0 (0.0%) |
| 7+ Person Households | 19 (0.4%) | 0 (0.0%) |
| Total | 3,227 (67.8%) | 1,532 (32.2%) |
Female Fertility in Smyrna
Fertility by Age in Smyrna
Average fertility rate in Smyrna is 62.0 births per 1,000 women. Women in the age bracket of 20 to 34 years have the highest fertility rate with 77.0 births per 1,000 women. Women in the age bracket of 20 to 34 years acount for 62.4% of all women with births.
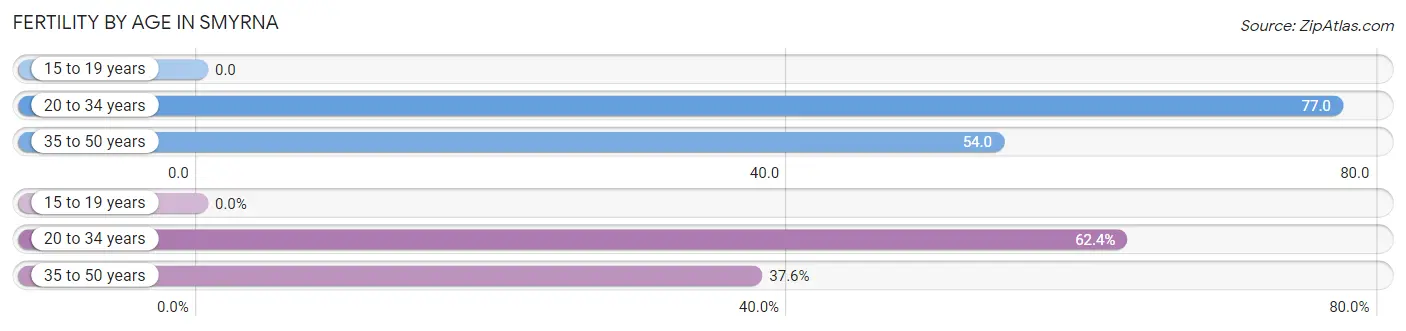
| Age Bracket | Women with Births | Births / 1,000 Women |
| 15 to 19 years | 0 (0.0%) | 0.0 |
| 20 to 34 years | 131 (62.4%) | 77.0 |
| 35 to 50 years | 79 (37.6%) | 54.0 |
| Total | 210 (100.0%) | 62.0 |
Fertility by Age by Marriage Status in Smyrna
48.6% of women with births (210) in Smyrna are married. The highest percentage of unmarried women with births falls into 35 to 50 years age bracket with 100.0% of them unmarried at the time of birth, while the lowest percentage of unmarried women with births belong to 20 to 34 years age bracket with 22.1% of them unmarried.
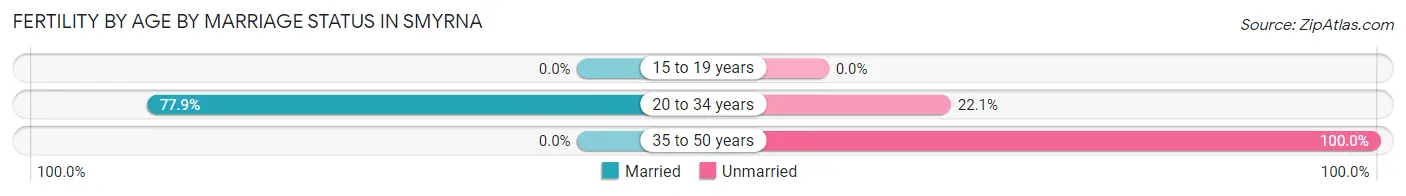
| Age Bracket | Married | Unmarried |
| 15 to 19 years | 0 (0.0%) | 0 (0.0%) |
| 20 to 34 years | 102 (77.9%) | 29 (22.1%) |
| 35 to 50 years | 0 (0.0%) | 79 (100.0%) |
| Total | 102 (48.6%) | 108 (51.4%) |
Fertility by Education in Smyrna
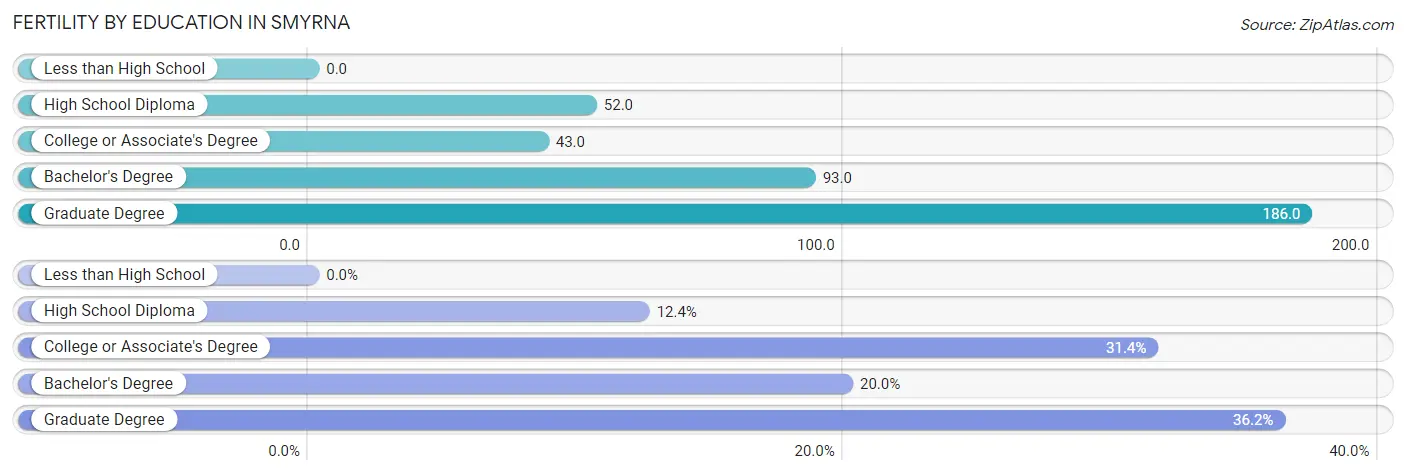
| Educational Attainment | Women with Births | Births / 1,000 Women |
| Less than High School | 0 (0.0%) | 0.0 |
| High School Diploma | 26 (12.4%) | 52.0 |
| College or Associate's Degree | 66 (31.4%) | 43.0 |
| Bachelor's Degree | 42 (20.0%) | 93.0 |
| Graduate Degree | 76 (36.2%) | 186.0 |
| Total | 210 (100.0%) | 62.0 |
Fertility by Education by Marriage Status in Smyrna
51.4% of women with births in Smyrna are unmarried. Women with the educational attainment of high school diploma are most likely to be married with 100.0% of them married at childbirth, while women with the educational attainment of graduate degree are least likely to be married with 100.0% of them unmarried at childbirth.
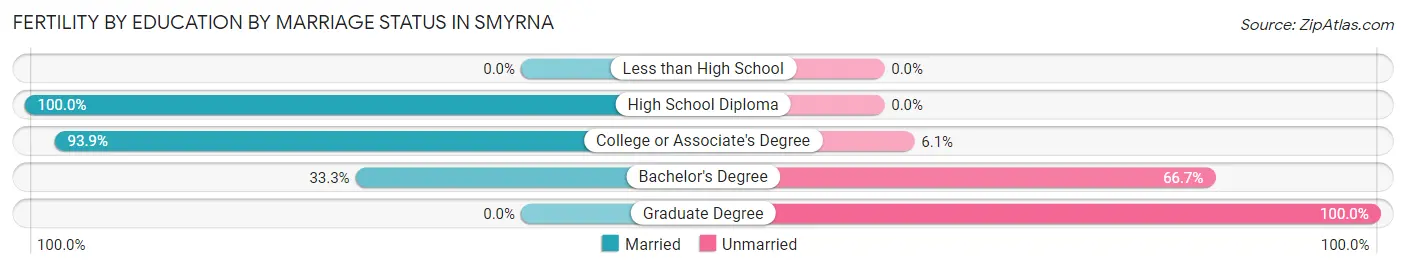
| Educational Attainment | Married | Unmarried |
| Less than High School | 0 (0.0%) | 0 (0.0%) |
| High School Diploma | 26 (100.0%) | 0 (0.0%) |
| College or Associate's Degree | 62 (93.9%) | 4 (6.1%) |
| Bachelor's Degree | 14 (33.3%) | 28 (66.7%) |
| Graduate Degree | 0 (0.0%) | 76 (100.0%) |
| Total | 102 (48.6%) | 108 (51.4%) |
Employment Characteristics in Smyrna
Employment by Class of Employer in Smyrna
Among the 6,378 employed individuals in Smyrna, private company employees (4,161 | 65.2%), state government employees (881 | 13.8%), and self-employed (incorporated) (452 | 7.1%) make up the most common classes of employment.
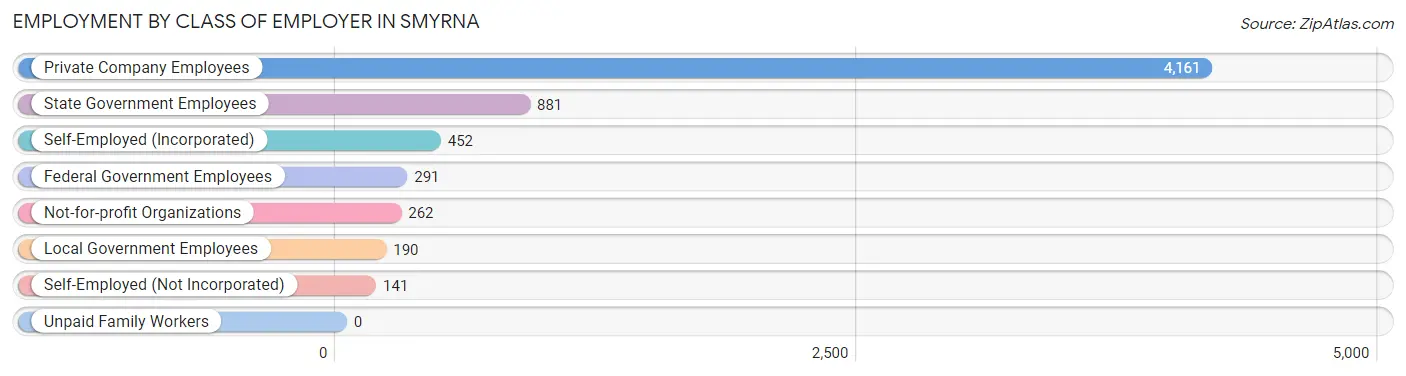
| Employer Class | # Employees | % Employees |
| Private Company Employees | 4,161 | 65.2% |
| Self-Employed (Incorporated) | 452 | 7.1% |
| Self-Employed (Not Incorporated) | 141 | 2.2% |
| Not-for-profit Organizations | 262 | 4.1% |
| Local Government Employees | 190 | 3.0% |
| State Government Employees | 881 | 13.8% |
| Federal Government Employees | 291 | 4.6% |
| Unpaid Family Workers | 0 | 0.0% |
| Total | 6,378 | 100.0% |
Employment Status by Age in Smyrna
According to the labor force statistics for Smyrna, out of the total population over 16 years of age (9,962), 69.4% or 6,914 individuals are in the labor force, with 6.1% or 422 of them unemployed. The age group with the highest labor force participation rate is 35 to 44 years, with 96.8% or 1,700 individuals in the labor force. Within the labor force, the 65 to 74 years age range has the highest percentage of unemployed individuals, with 23.8% or 75 of them being unemployed.
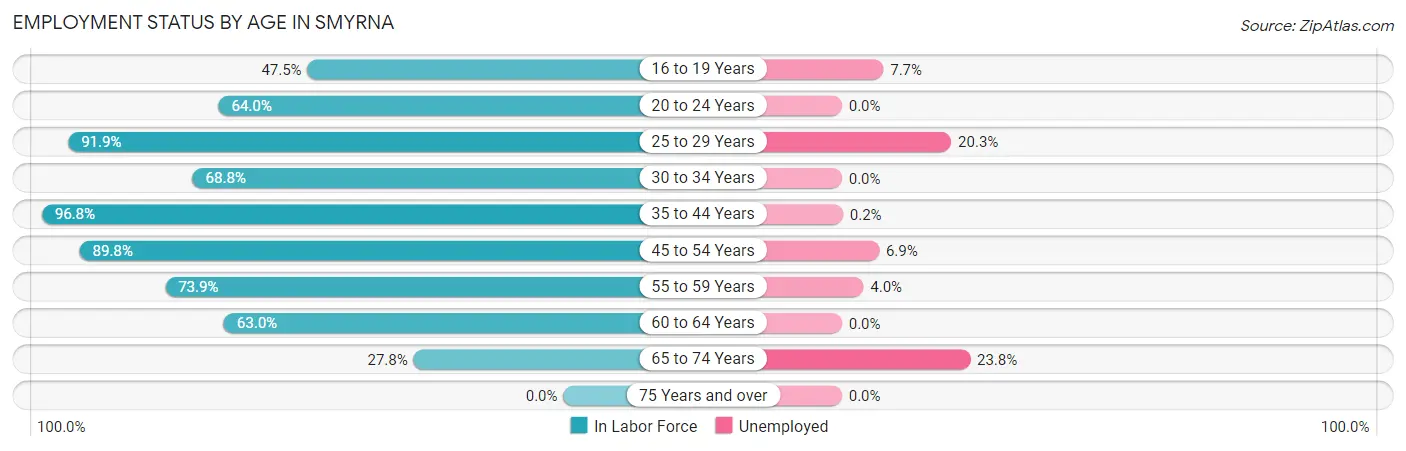
| Age Bracket | In Labor Force | Unemployed |
| 16 to 19 Years | 273 (47.5%) | 21 (7.7%) |
| 20 to 24 Years | 394 (64.0%) | 0 (0.0%) |
| 25 to 29 Years | 1,078 (91.9%) | 219 (20.3%) |
| 30 to 34 Years | 990 (68.8%) | 0 (0.0%) |
| 35 to 44 Years | 1,700 (96.8%) | 3 (0.2%) |
| 45 to 54 Years | 1,371 (89.8%) | 95 (6.9%) |
| 55 to 59 Years | 328 (73.9%) | 13 (4.0%) |
| 60 to 64 Years | 463 (63.0%) | 0 (0.0%) |
| 65 to 74 Years | 315 (27.8%) | 75 (23.8%) |
| 75 Years and over | 0 (0.0%) | 0 (0.0%) |
| Total | 6,914 (69.4%) | 422 (6.1%) |
Employment Status by Educational Attainment in Smyrna
According to labor force statistics for Smyrna, 83.8% of individuals (5,928) out of the total population between 25 and 64 years of age (7,074) are in the labor force, with 5.5% or 326 of them being unemployed. The group with the highest labor force participation rate are those with the educational attainment of bachelor's degree or higher, with 94.9% or 1,475 individuals in the labor force. Within the labor force, individuals with college / associate degree education have the highest percentage of unemployment, with 11.2% or 286 of them being unemployed.
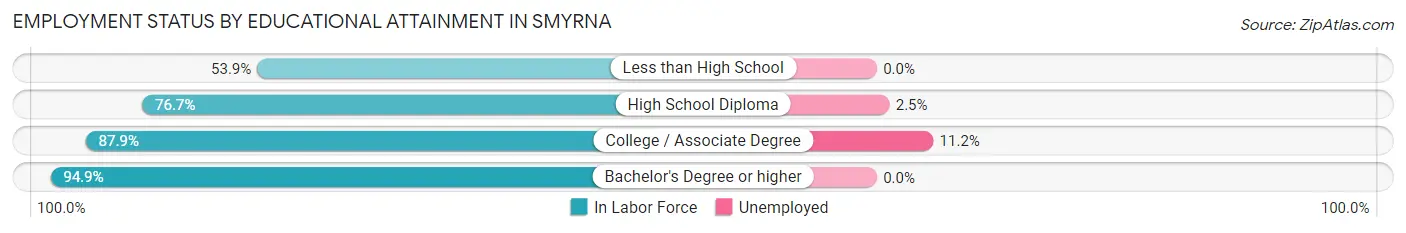
| Educational Attainment | In Labor Force | Unemployed |
| Less than High School | 249 (53.9%) | 0 (0.0%) |
| High School Diploma | 1,648 (76.7%) | 54 (2.5%) |
| College / Associate Degree | 2,557 (87.9%) | 326 (11.2%) |
| Bachelor's Degree or higher | 1,475 (94.9%) | 0 (0.0%) |
| Total | 5,928 (83.8%) | 389 (5.5%) |
Employment Occupations by Sex in Smyrna
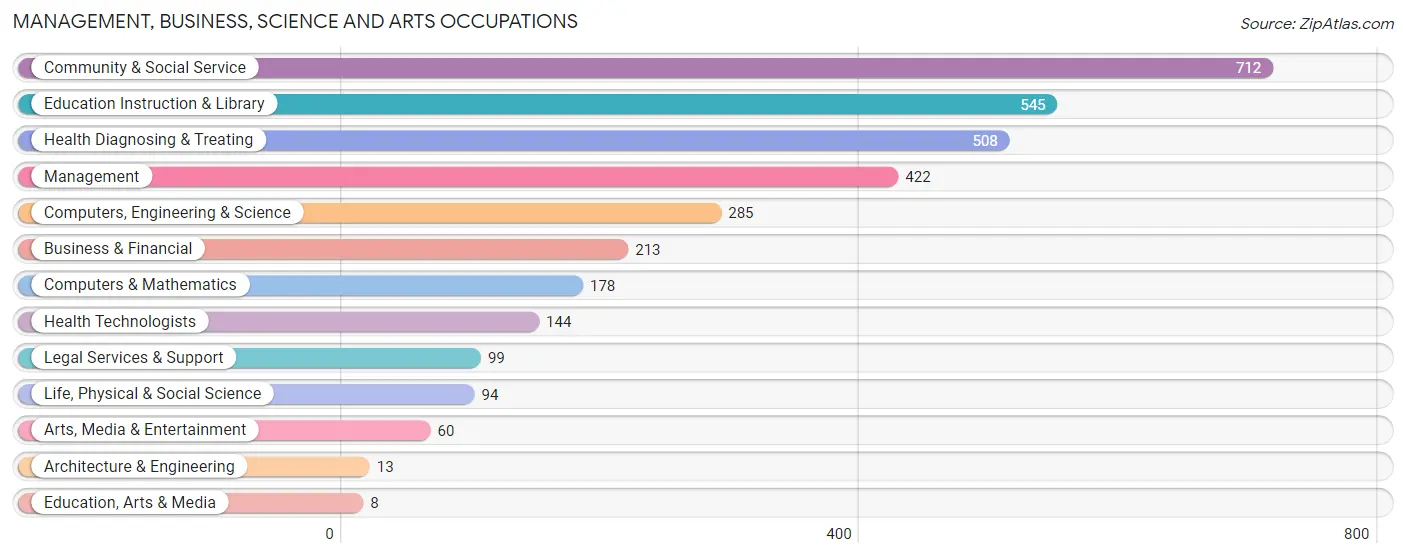
Management, Business, Science and Arts Occupations
The most common Management, Business, Science and Arts occupations in Smyrna are Community & Social Service (712 | 11.1%), Education Instruction & Library (545 | 8.5%), Health Diagnosing & Treating (508 | 7.9%), Management (422 | 6.6%), and Computers, Engineering & Science (285 | 4.4%).
Management, Business, Science and Arts Occupations by Sex
Within the Management, Business, Science and Arts occupations in Smyrna, the most male-oriented occupations are Architecture & Engineering (100.0%), Education, Arts & Media (100.0%), and Computers & Mathematics (85.4%), while the most female-oriented occupations are Legal Services & Support (100.0%), Arts, Media & Entertainment (100.0%), and Health Diagnosing & Treating (98.0%).
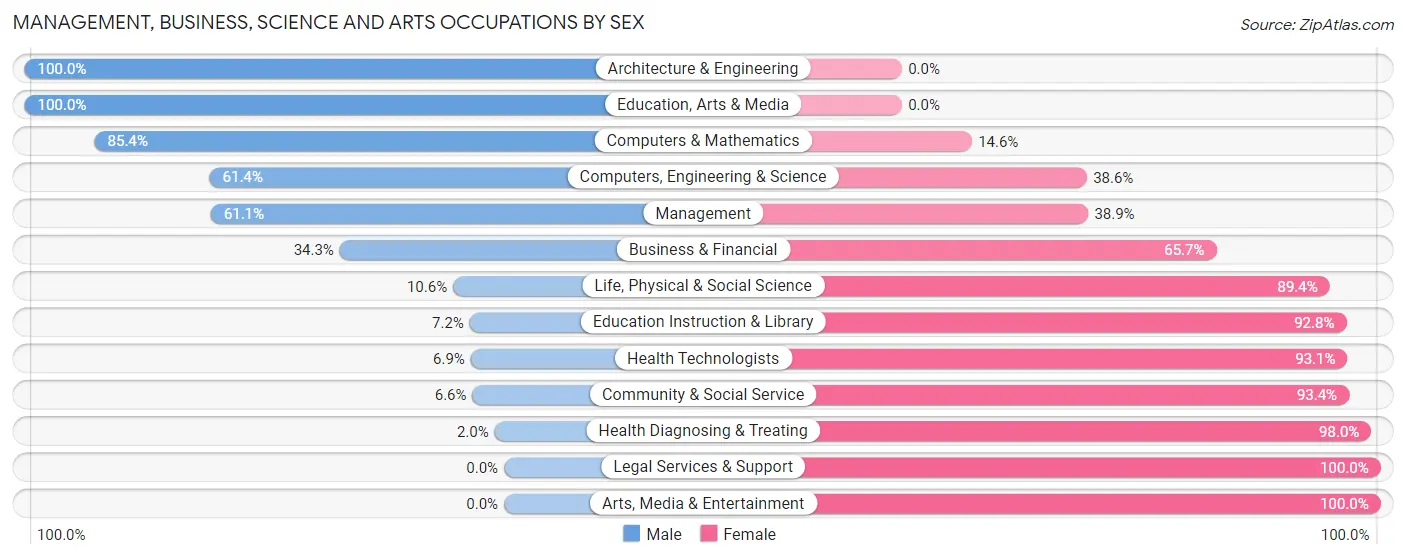
| Occupation | Male | Female |
| Management | 258 (61.1%) | 164 (38.9%) |
| Business & Financial | 73 (34.3%) | 140 (65.7%) |
| Computers, Engineering & Science | 175 (61.4%) | 110 (38.6%) |
| Computers & Mathematics | 152 (85.4%) | 26 (14.6%) |
| Architecture & Engineering | 13 (100.0%) | 0 (0.0%) |
| Life, Physical & Social Science | 10 (10.6%) | 84 (89.4%) |
| Community & Social Service | 47 (6.6%) | 665 (93.4%) |
| Education, Arts & Media | 8 (100.0%) | 0 (0.0%) |
| Legal Services & Support | 0 (0.0%) | 99 (100.0%) |
| Education Instruction & Library | 39 (7.2%) | 506 (92.8%) |
| Arts, Media & Entertainment | 0 (0.0%) | 60 (100.0%) |
| Health Diagnosing & Treating | 10 (2.0%) | 498 (98.0%) |
| Health Technologists | 10 (6.9%) | 134 (93.1%) |
| Total (Category) | 563 (26.3%) | 1,577 (73.7%) |
| Total (Overall) | 3,079 (47.8%) | 3,356 (52.1%) |
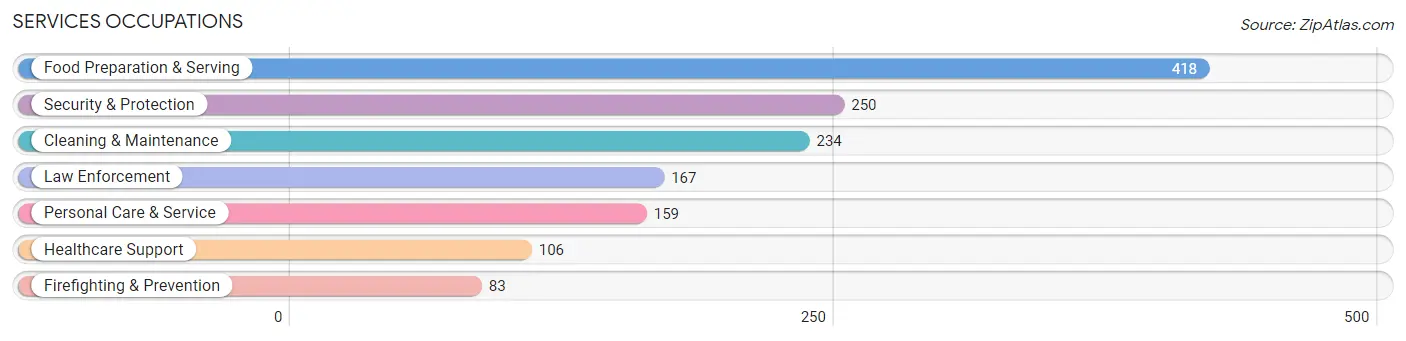
Services Occupations
The most common Services occupations in Smyrna are Food Preparation & Serving (418 | 6.5%), Security & Protection (250 | 3.9%), Cleaning & Maintenance (234 | 3.6%), Law Enforcement (167 | 2.6%), and Personal Care & Service (159 | 2.5%).
Services Occupations by Sex
Within the Services occupations in Smyrna, the most male-oriented occupations are Firefighting & Prevention (100.0%), Security & Protection (78.8%), and Cleaning & Maintenance (68.4%), while the most female-oriented occupations are Healthcare Support (99.1%), Personal Care & Service (68.5%), and Food Preparation & Serving (60.3%).
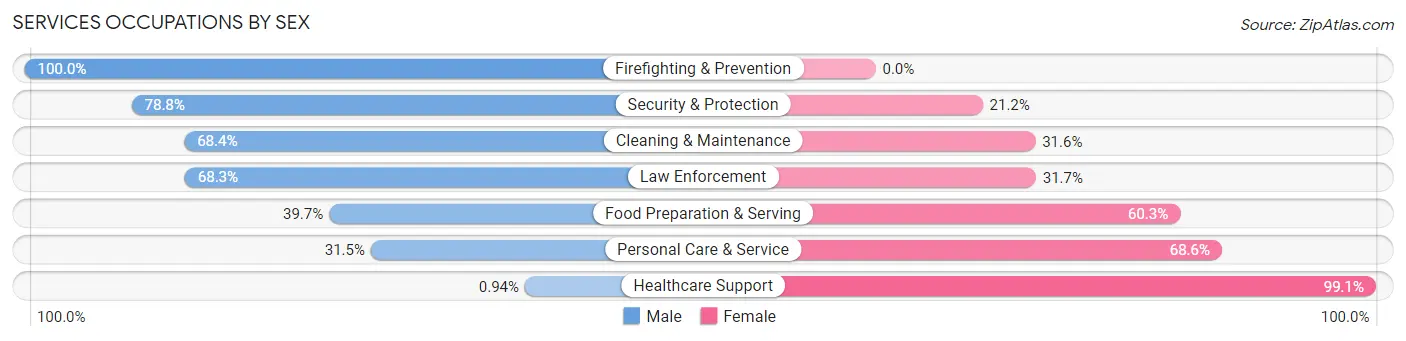
| Occupation | Male | Female |
| Healthcare Support | 1 (0.9%) | 105 (99.1%) |
| Security & Protection | 197 (78.8%) | 53 (21.2%) |
| Firefighting & Prevention | 83 (100.0%) | 0 (0.0%) |
| Law Enforcement | 114 (68.3%) | 53 (31.7%) |
| Food Preparation & Serving | 166 (39.7%) | 252 (60.3%) |
| Cleaning & Maintenance | 160 (68.4%) | 74 (31.6%) |
| Personal Care & Service | 50 (31.5%) | 109 (68.5%) |
| Total (Category) | 574 (49.2%) | 593 (50.8%) |
| Total (Overall) | 3,079 (47.8%) | 3,356 (52.1%) |
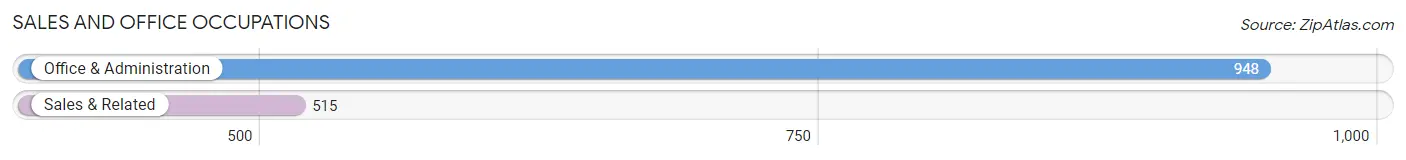
Sales and Office Occupations
The most common Sales and Office occupations in Smyrna are Office & Administration (948 | 14.7%), and Sales & Related (515 | 8.0%).
Sales and Office Occupations by Sex
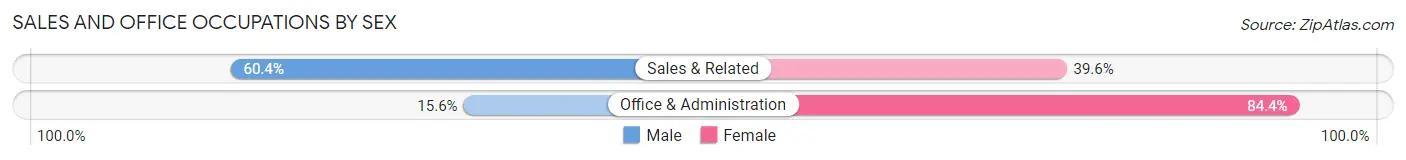
| Occupation | Male | Female |
| Sales & Related | 311 (60.4%) | 204 (39.6%) |
| Office & Administration | 148 (15.6%) | 800 (84.4%) |
| Total (Category) | 459 (31.4%) | 1,004 (68.6%) |
| Total (Overall) | 3,079 (47.8%) | 3,356 (52.1%) |
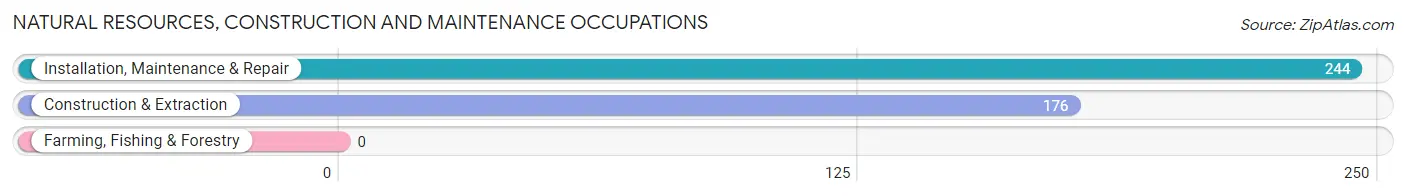
Natural Resources, Construction and Maintenance Occupations
The most common Natural Resources, Construction and Maintenance occupations in Smyrna are Installation, Maintenance & Repair (244 | 3.8%), and Construction & Extraction (176 | 2.7%).
Natural Resources, Construction and Maintenance Occupations by Sex
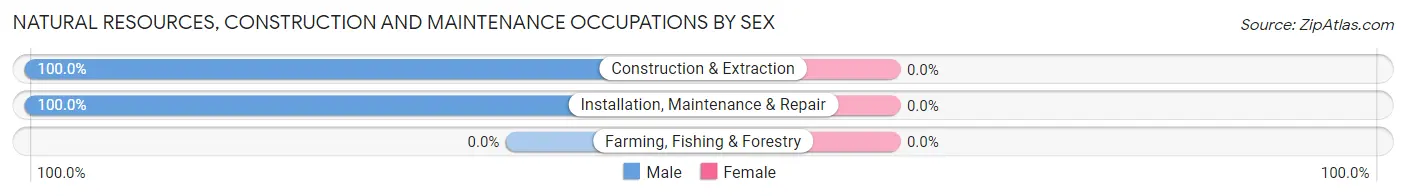
| Occupation | Male | Female |
| Farming, Fishing & Forestry | 0 (0.0%) | 0 (0.0%) |
| Construction & Extraction | 176 (100.0%) | 0 (0.0%) |
| Installation, Maintenance & Repair | 244 (100.0%) | 0 (0.0%) |
| Total (Category) | 420 (100.0%) | 0 (0.0%) |
| Total (Overall) | 3,079 (47.8%) | 3,356 (52.1%) |
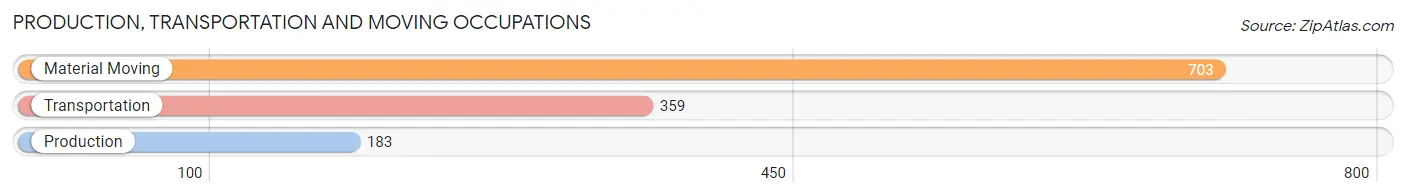
Production, Transportation and Moving Occupations
The most common Production, Transportation and Moving occupations in Smyrna are Material Moving (703 | 10.9%), Transportation (359 | 5.6%), and Production (183 | 2.8%).
Production, Transportation and Moving Occupations by Sex
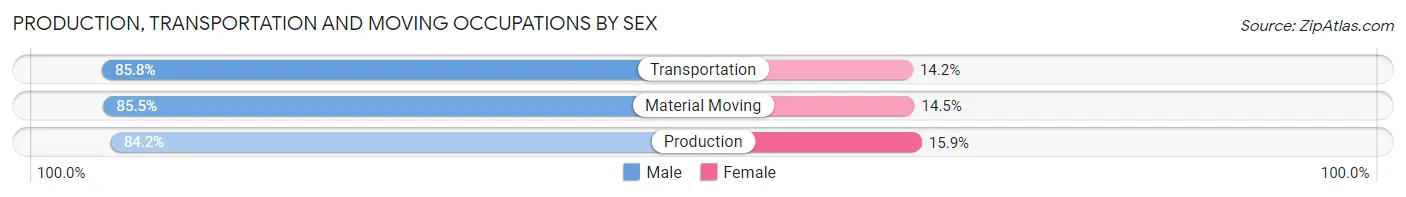
| Occupation | Male | Female |
| Production | 154 (84.2%) | 29 (15.9%) |
| Transportation | 308 (85.8%) | 51 (14.2%) |
| Material Moving | 601 (85.5%) | 102 (14.5%) |
| Total (Category) | 1,063 (85.4%) | 182 (14.6%) |
| Total (Overall) | 3,079 (47.8%) | 3,356 (52.1%) |
Employment Industries by Sex in Smyrna
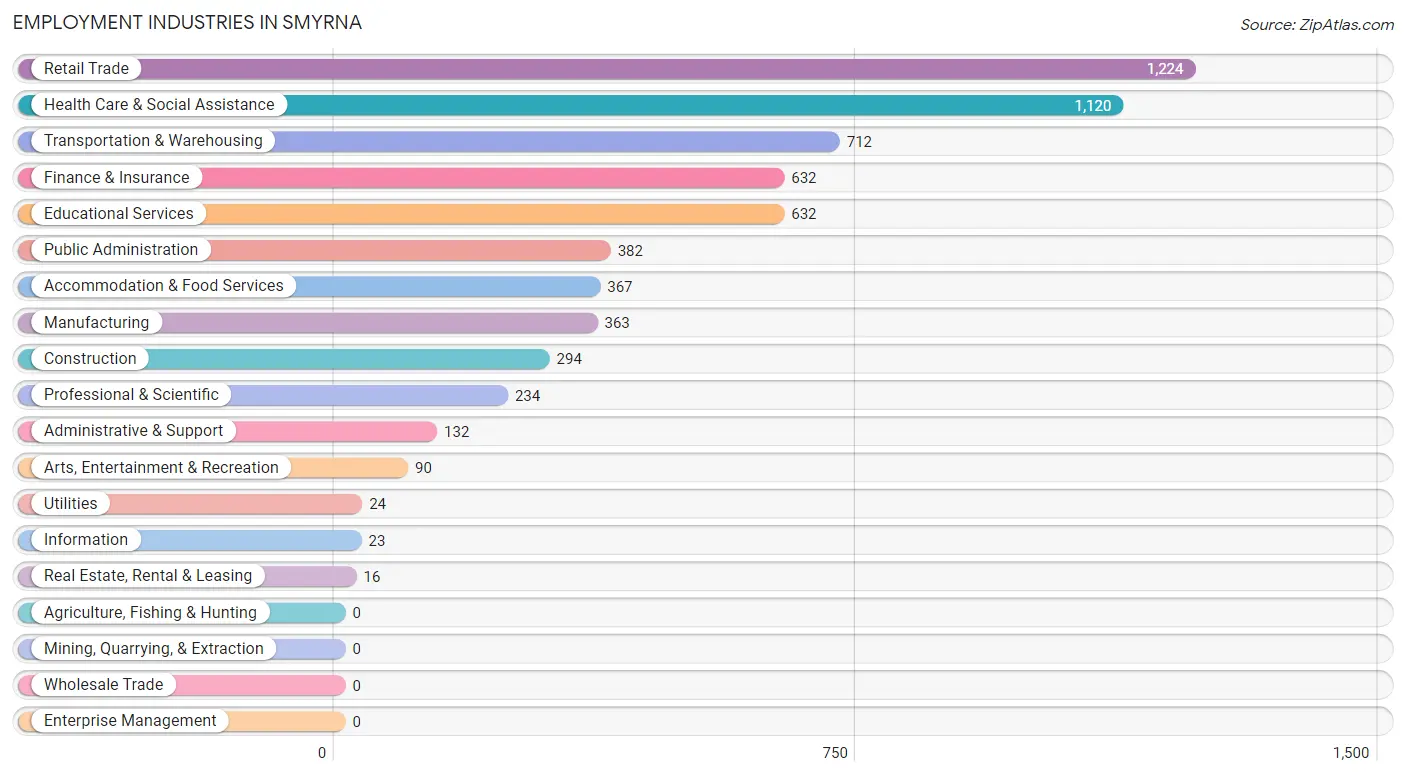
Employment Industries in Smyrna
The major employment industries in Smyrna include Retail Trade (1,224 | 19.0%), Health Care & Social Assistance (1,120 | 17.4%), Transportation & Warehousing (712 | 11.1%), Finance & Insurance (632 | 9.8%), and Educational Services (632 | 9.8%).
Employment Industries by Sex in Smyrna
The Smyrna industries that see more men than women are Arts, Entertainment & Recreation (87.8%), Transportation & Warehousing (81.7%), and Real Estate, Rental & Leasing (81.2%), whereas the industries that tend to have a higher number of women are Utilities (100.0%), Health Care & Social Assistance (87.1%), and Finance & Insurance (76.9%).
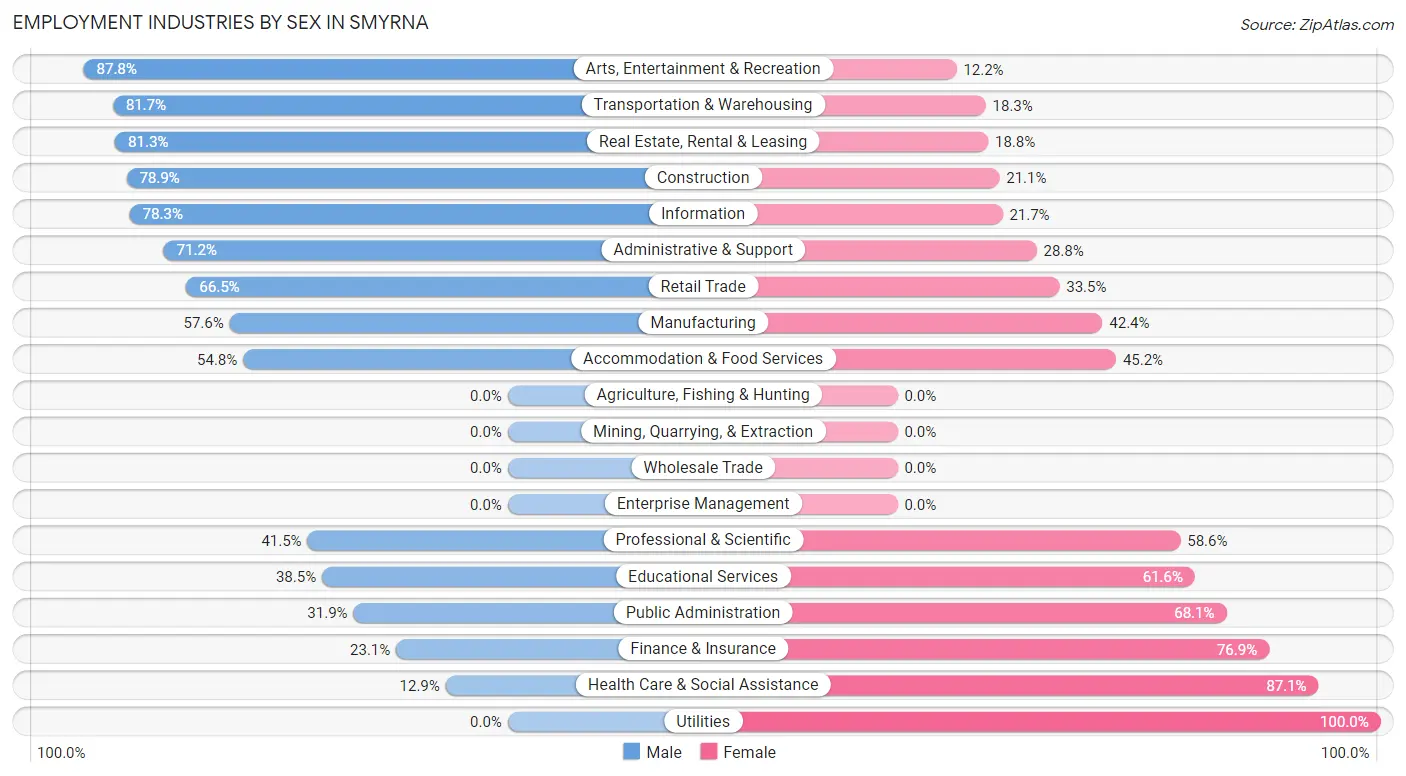
| Industry | Male | Female |
| Agriculture, Fishing & Hunting | 0 (0.0%) | 0 (0.0%) |
| Mining, Quarrying, & Extraction | 0 (0.0%) | 0 (0.0%) |
| Construction | 232 (78.9%) | 62 (21.1%) |
| Manufacturing | 209 (57.6%) | 154 (42.4%) |
| Wholesale Trade | 0 (0.0%) | 0 (0.0%) |
| Retail Trade | 814 (66.5%) | 410 (33.5%) |
| Transportation & Warehousing | 582 (81.7%) | 130 (18.3%) |
| Utilities | 0 (0.0%) | 24 (100.0%) |
| Information | 18 (78.3%) | 5 (21.7%) |
| Finance & Insurance | 146 (23.1%) | 486 (76.9%) |
| Real Estate, Rental & Leasing | 13 (81.2%) | 3 (18.8%) |
| Professional & Scientific | 97 (41.4%) | 137 (58.6%) |
| Enterprise Management | 0 (0.0%) | 0 (0.0%) |
| Administrative & Support | 94 (71.2%) | 38 (28.8%) |
| Educational Services | 243 (38.5%) | 389 (61.6%) |
| Health Care & Social Assistance | 144 (12.9%) | 976 (87.1%) |
| Arts, Entertainment & Recreation | 79 (87.8%) | 11 (12.2%) |
| Accommodation & Food Services | 201 (54.8%) | 166 (45.2%) |
| Public Administration | 122 (31.9%) | 260 (68.1%) |
| Total | 3,079 (47.8%) | 3,356 (52.1%) |
Education in Smyrna
School Enrollment in Smyrna
The most common levels of schooling among the 2,799 students in Smyrna are middle school (752 | 26.9%), elementary school (602 | 21.5%), and high school (568 | 20.3%).
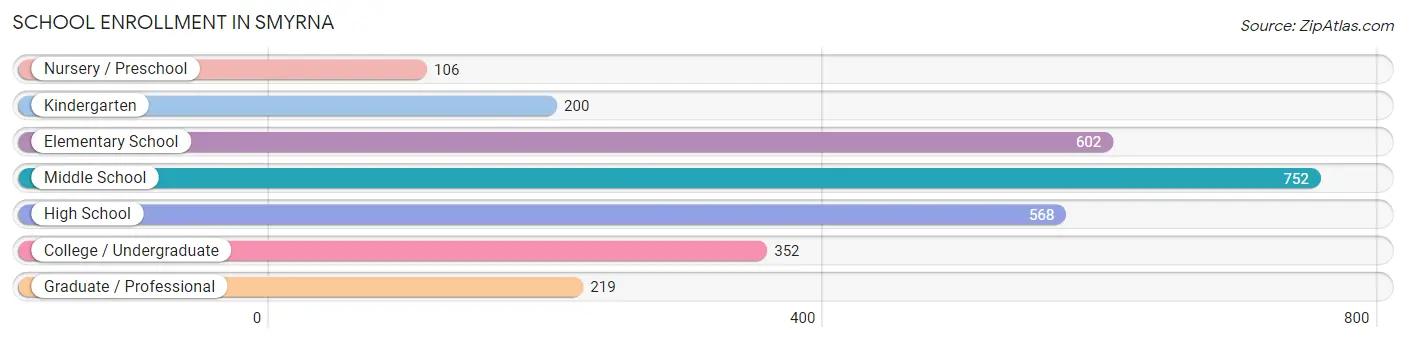
| School Level | # Students | % Students |
| Nursery / Preschool | 106 | 3.8% |
| Kindergarten | 200 | 7.1% |
| Elementary School | 602 | 21.5% |
| Middle School | 752 | 26.9% |
| High School | 568 | 20.3% |
| College / Undergraduate | 352 | 12.6% |
| Graduate / Professional | 219 | 7.8% |
| Total | 2,799 | 100.0% |
School Enrollment by Age by Funding Source in Smyrna
Out of a total of 2,799 students who are enrolled in schools in Smyrna, 537 (19.2%) attend a private institution, while the remaining 2,262 (80.8%) are enrolled in public schools. The age group of 35 years and over has the highest likelihood of being enrolled in private schools, with 188 (68.6% in the age bracket) enrolled. Conversely, the age group of 15 to 17 year olds has the lowest likelihood of being enrolled in a private school, with 451 (95.2% in the age bracket) attending a public institution.
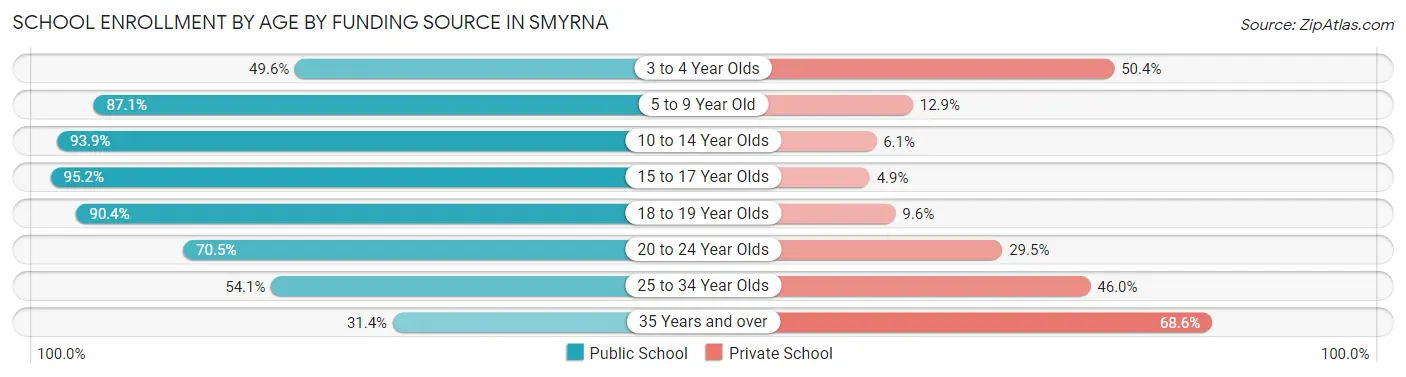
| Age Bracket | Public School | Private School |
| 3 to 4 Year Olds | 62 (49.6%) | 63 (50.4%) |
| 5 to 9 Year Old | 643 (87.1%) | 95 (12.9%) |
| 10 to 14 Year Olds | 759 (93.9%) | 49 (6.1%) |
| 15 to 17 Year Olds | 451 (95.2%) | 23 (4.9%) |
| 18 to 19 Year Olds | 75 (90.4%) | 8 (9.6%) |
| 20 to 24 Year Olds | 105 (70.5%) | 44 (29.5%) |
| 25 to 34 Year Olds | 80 (54.0%) | 68 (46.0%) |
| 35 Years and over | 86 (31.4%) | 188 (68.6%) |
| Total | 2,262 (80.8%) | 537 (19.2%) |
Educational Attainment by Field of Study in Smyrna
Education (428 | 20.7%), business (333 | 16.1%), arts & humanities (322 | 15.6%), social sciences (212 | 10.3%), and communications (140 | 6.8%) are the most common fields of study among 2,065 individuals in Smyrna who have obtained a bachelor's degree or higher.

| Field of Study | # Graduates | % Graduates |
| Computers & Mathematics | 81 | 3.9% |
| Bio, Nature & Agricultural | 63 | 3.0% |
| Physical & Health Sciences | 50 | 2.4% |
| Psychology | 115 | 5.6% |
| Social Sciences | 212 | 10.3% |
| Engineering | 85 | 4.1% |
| Multidisciplinary Studies | 57 | 2.8% |
| Science & Technology | 84 | 4.1% |
| Business | 333 | 16.1% |
| Education | 428 | 20.7% |
| Literature & Languages | 27 | 1.3% |
| Liberal Arts & History | 68 | 3.3% |
| Visual & Performing Arts | 0 | 0.0% |
| Communications | 140 | 6.8% |
| Arts & Humanities | 322 | 15.6% |
| Total | 2,065 | 100.0% |
Transportation & Commute in Smyrna
Vehicle Availability by Sex in Smyrna
The most prevalent vehicle ownership categories in Smyrna are males with 2 vehicles (1,697, accounting for 54.6%) and females with 2 vehicles (1,534, making up 52.0%).
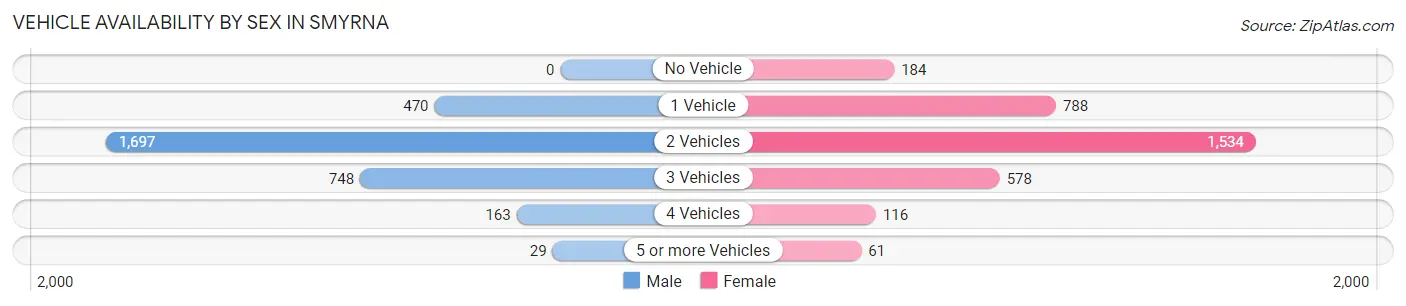
| Vehicles Available | Male | Female |
| No Vehicle | 0 (0.0%) | 184 (5.6%) |
| 1 Vehicle | 470 (15.1%) | 788 (24.2%) |
| 2 Vehicles | 1,697 (54.6%) | 1,534 (47.0%) |
| 3 Vehicles | 748 (24.1%) | 578 (17.7%) |
| 4 Vehicles | 163 (5.2%) | 116 (3.6%) |
| 5 or more Vehicles | 29 (0.9%) | 61 (1.9%) |
| Total | 3,107 (100.0%) | 3,261 (100.0%) |
Commute Time in Smyrna
The most frequently occuring commute durations in Smyrna are 20 to 24 minutes (967 commuters, 16.4%), 30 to 34 minutes (866 commuters, 14.7%), and 15 to 19 minutes (772 commuters, 13.1%).
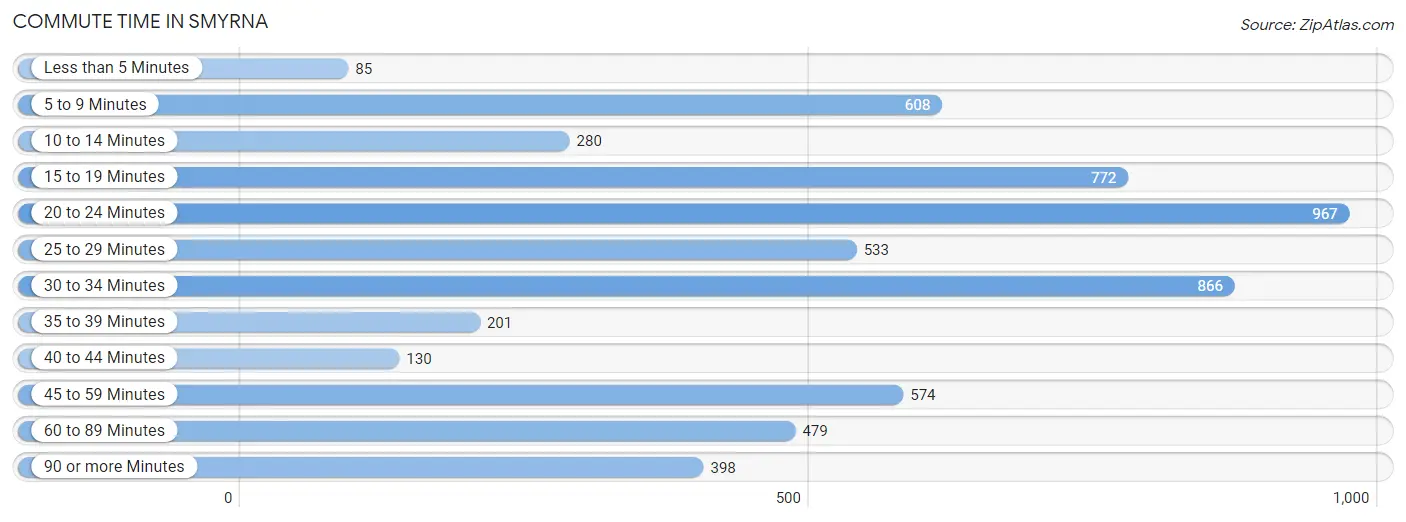
| Commute Time | # Commuters | % Commuters |
| Less than 5 Minutes | 85 | 1.4% |
| 5 to 9 Minutes | 608 | 10.3% |
| 10 to 14 Minutes | 280 | 4.8% |
| 15 to 19 Minutes | 772 | 13.1% |
| 20 to 24 Minutes | 967 | 16.4% |
| 25 to 29 Minutes | 533 | 9.0% |
| 30 to 34 Minutes | 866 | 14.7% |
| 35 to 39 Minutes | 201 | 3.4% |
| 40 to 44 Minutes | 130 | 2.2% |
| 45 to 59 Minutes | 574 | 9.7% |
| 60 to 89 Minutes | 479 | 8.1% |
| 90 or more Minutes | 398 | 6.8% |
Commute Time by Sex in Smyrna
The most common commute times in Smyrna are 20 to 24 minutes (651 commuters, 21.8%) for males and 30 to 34 minutes (518 commuters, 17.8%) for females.
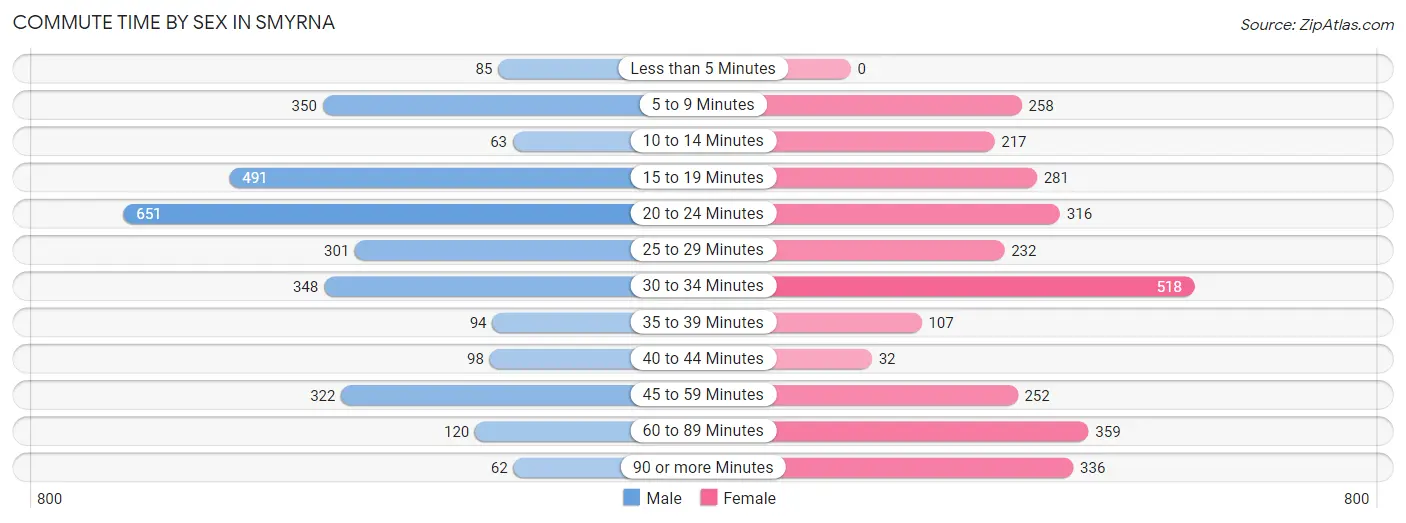
| Commute Time | Male | Female |
| Less than 5 Minutes | 85 (2.9%) | 0 (0.0%) |
| 5 to 9 Minutes | 350 (11.7%) | 258 (8.9%) |
| 10 to 14 Minutes | 63 (2.1%) | 217 (7.5%) |
| 15 to 19 Minutes | 491 (16.5%) | 281 (9.7%) |
| 20 to 24 Minutes | 651 (21.8%) | 316 (10.9%) |
| 25 to 29 Minutes | 301 (10.1%) | 232 (8.0%) |
| 30 to 34 Minutes | 348 (11.7%) | 518 (17.8%) |
| 35 to 39 Minutes | 94 (3.2%) | 107 (3.7%) |
| 40 to 44 Minutes | 98 (3.3%) | 32 (1.1%) |
| 45 to 59 Minutes | 322 (10.8%) | 252 (8.7%) |
| 60 to 89 Minutes | 120 (4.0%) | 359 (12.3%) |
| 90 or more Minutes | 62 (2.1%) | 336 (11.6%) |
Time of Departure to Work by Sex in Smyrna
The most frequent times of departure to work in Smyrna are 7:00 AM to 7:29 AM (719, 24.1%) for males and 6:30 AM to 6:59 AM (836, 28.7%) for females.
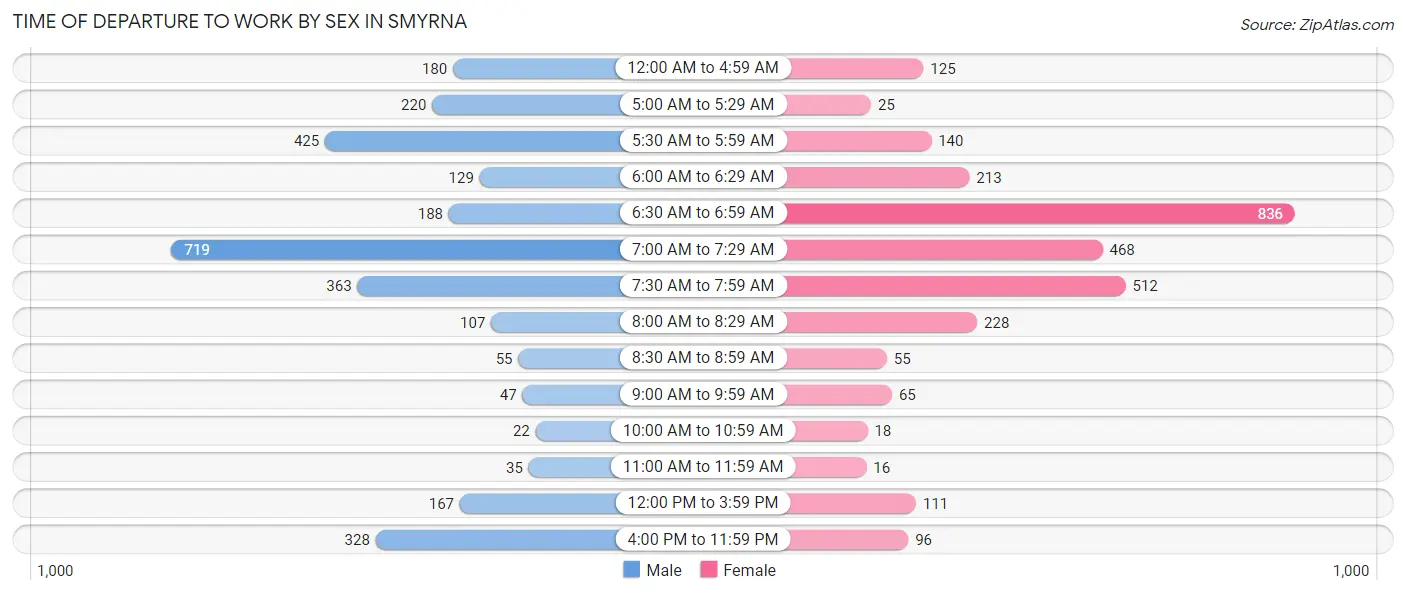
| Time of Departure | Male | Female |
| 12:00 AM to 4:59 AM | 180 (6.0%) | 125 (4.3%) |
| 5:00 AM to 5:29 AM | 220 (7.4%) | 25 (0.9%) |
| 5:30 AM to 5:59 AM | 425 (14.2%) | 140 (4.8%) |
| 6:00 AM to 6:29 AM | 129 (4.3%) | 213 (7.3%) |
| 6:30 AM to 6:59 AM | 188 (6.3%) | 836 (28.7%) |
| 7:00 AM to 7:29 AM | 719 (24.1%) | 468 (16.1%) |
| 7:30 AM to 7:59 AM | 363 (12.2%) | 512 (17.6%) |
| 8:00 AM to 8:29 AM | 107 (3.6%) | 228 (7.8%) |
| 8:30 AM to 8:59 AM | 55 (1.8%) | 55 (1.9%) |
| 9:00 AM to 9:59 AM | 47 (1.6%) | 65 (2.2%) |
| 10:00 AM to 10:59 AM | 22 (0.7%) | 18 (0.6%) |
| 11:00 AM to 11:59 AM | 35 (1.2%) | 16 (0.5%) |
| 12:00 PM to 3:59 PM | 167 (5.6%) | 111 (3.8%) |
| 4:00 PM to 11:59 PM | 328 (11.0%) | 96 (3.3%) |
| Total | 2,985 (100.0%) | 2,908 (100.0%) |
Housing Occupancy in Smyrna
Occupancy by Ownership in Smyrna
Of the total 4,759 dwellings in Smyrna, owner-occupied units account for 3,240 (68.1%), while renter-occupied units make up 1,519 (31.9%).
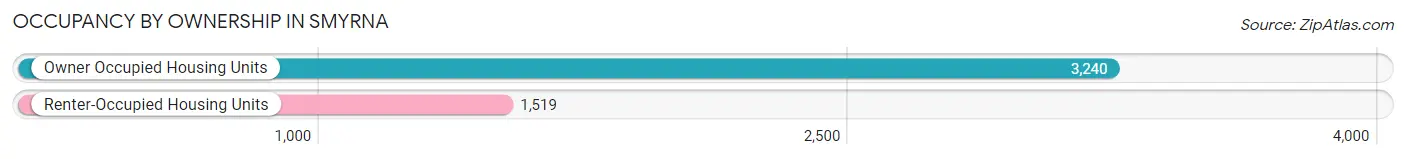
| Occupancy | # Housing Units | % Housing Units |
| Owner Occupied Housing Units | 3,240 | 68.1% |
| Renter-Occupied Housing Units | 1,519 | 31.9% |
| Total Occupied Housing Units | 4,759 | 100.0% |
Occupancy by Household Size in Smyrna
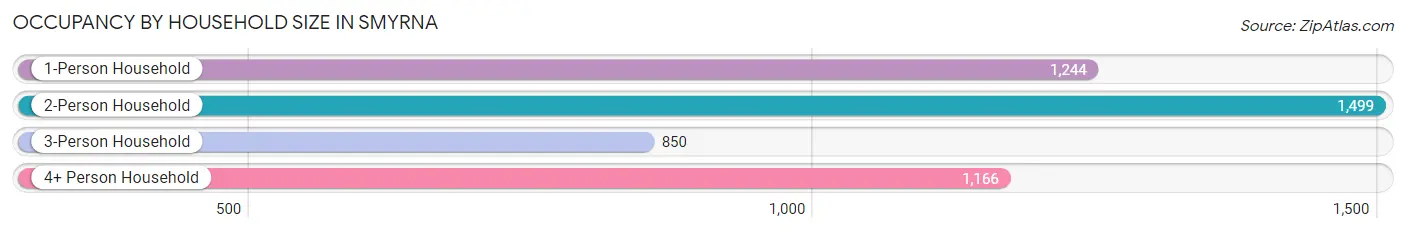
| Household Size | # Housing Units | % Housing Units |
| 1-Person Household | 1,244 | 26.1% |
| 2-Person Household | 1,499 | 31.5% |
| 3-Person Household | 850 | 17.9% |
| 4+ Person Household | 1,166 | 24.5% |
| Total Housing Units | 4,759 | 100.0% |
Occupancy by Ownership by Household Size in Smyrna
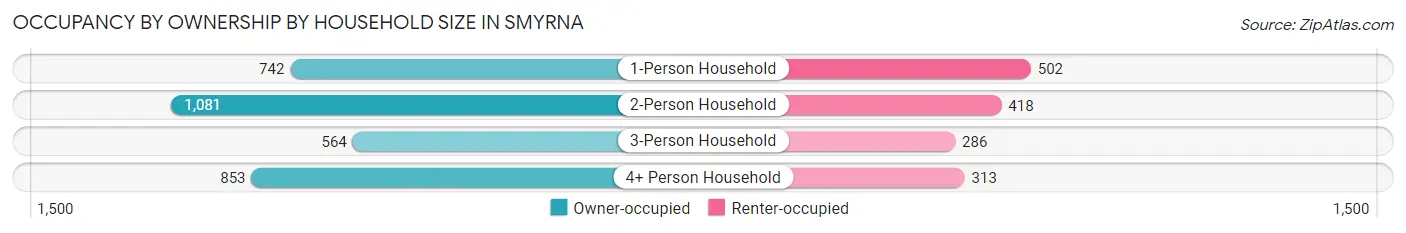
| Household Size | Owner-occupied | Renter-occupied |
| 1-Person Household | 742 (59.7%) | 502 (40.4%) |
| 2-Person Household | 1,081 (72.1%) | 418 (27.9%) |
| 3-Person Household | 564 (66.3%) | 286 (33.7%) |
| 4+ Person Household | 853 (73.2%) | 313 (26.8%) |
| Total Housing Units | 3,240 (68.1%) | 1,519 (31.9%) |
Occupancy by Educational Attainment in Smyrna
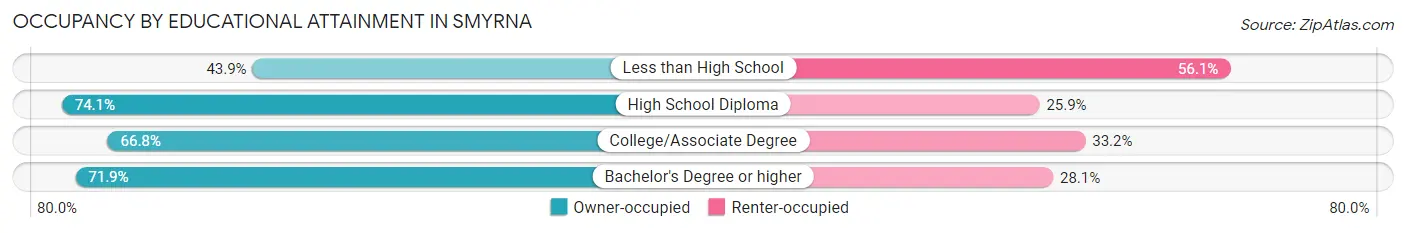
| Household Size | Owner-occupied | Renter-occupied |
| Less than High School | 193 (43.9%) | 247 (56.1%) |
| High School Diploma | 867 (74.1%) | 303 (25.9%) |
| College/Associate Degree | 1,116 (66.8%) | 554 (33.2%) |
| Bachelor's Degree or higher | 1,064 (71.9%) | 415 (28.1%) |
Occupancy by Age of Householder in Smyrna
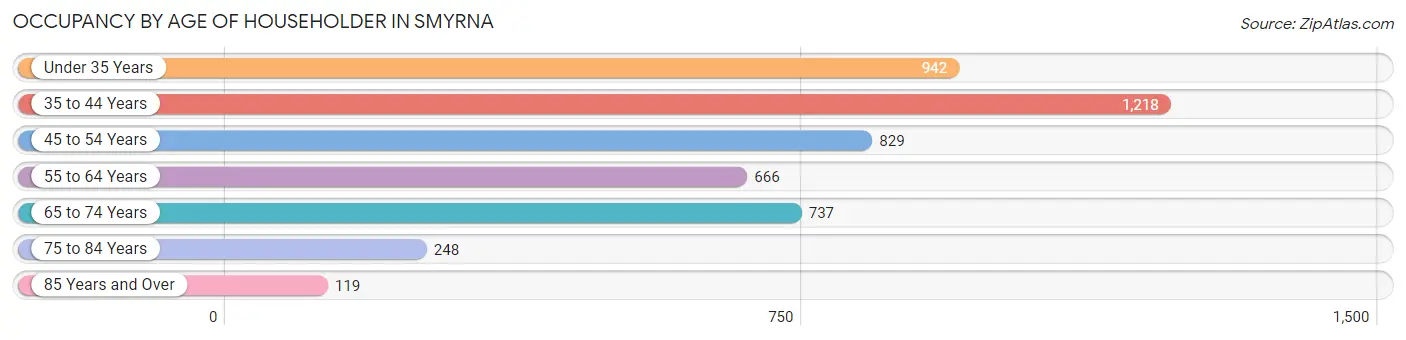
| Age Bracket | # Households | % Households |
| Under 35 Years | 942 | 19.8% |
| 35 to 44 Years | 1,218 | 25.6% |
| 45 to 54 Years | 829 | 17.4% |
| 55 to 64 Years | 666 | 14.0% |
| 65 to 74 Years | 737 | 15.5% |
| 75 to 84 Years | 248 | 5.2% |
| 85 Years and Over | 119 | 2.5% |
| Total | 4,759 | 100.0% |
Housing Finances in Smyrna
Median Income by Occupancy in Smyrna
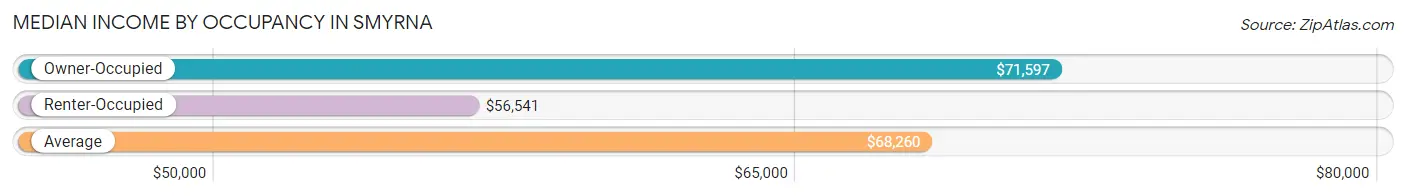
| Occupancy Type | # Households | Median Income |
| Owner-Occupied | 3,240 (68.1%) | $71,597 |
| Renter-Occupied | 1,519 (31.9%) | $56,541 |
| Average | 4,759 (100.0%) | $68,260 |
Occupancy by Householder Income Bracket in Smyrna
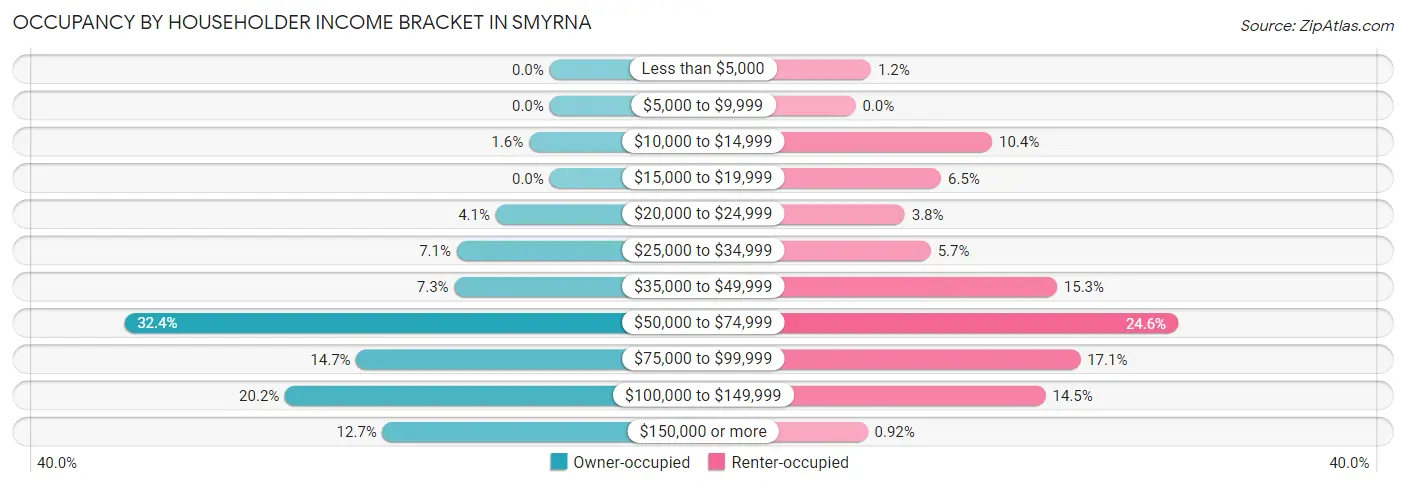
| Income Bracket | Owner-occupied | Renter-occupied |
| Less than $5,000 | 0 (0.0%) | 18 (1.2%) |
| $5,000 to $9,999 | 0 (0.0%) | 0 (0.0%) |
| $10,000 to $14,999 | 51 (1.6%) | 158 (10.4%) |
| $15,000 to $19,999 | 0 (0.0%) | 99 (6.5%) |
| $20,000 to $24,999 | 133 (4.1%) | 57 (3.7%) |
| $25,000 to $34,999 | 229 (7.1%) | 87 (5.7%) |
| $35,000 to $49,999 | 235 (7.2%) | 233 (15.3%) |
| $50,000 to $74,999 | 1,050 (32.4%) | 373 (24.6%) |
| $75,000 to $99,999 | 477 (14.7%) | 260 (17.1%) |
| $100,000 to $149,999 | 653 (20.2%) | 220 (14.5%) |
| $150,000 or more | 412 (12.7%) | 14 (0.9%) |
| Total | 3,240 (100.0%) | 1,519 (100.0%) |
Monthly Housing Cost Tiers in Smyrna
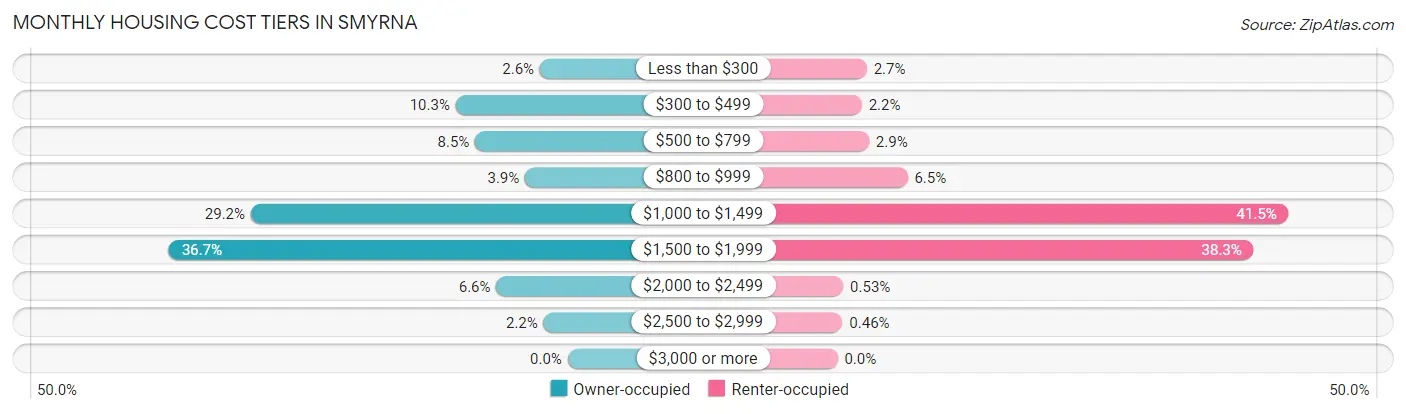
| Monthly Cost | Owner-occupied | Renter-occupied |
| Less than $300 | 83 (2.6%) | 41 (2.7%) |
| $300 to $499 | 334 (10.3%) | 34 (2.2%) |
| $500 to $799 | 276 (8.5%) | 44 (2.9%) |
| $800 to $999 | 127 (3.9%) | 98 (6.5%) |
| $1,000 to $1,499 | 945 (29.2%) | 631 (41.5%) |
| $1,500 to $1,999 | 1,190 (36.7%) | 582 (38.3%) |
| $2,000 to $2,499 | 213 (6.6%) | 8 (0.5%) |
| $2,500 to $2,999 | 72 (2.2%) | 7 (0.5%) |
| $3,000 or more | 0 (0.0%) | 0 (0.0%) |
| Total | 3,240 (100.0%) | 1,519 (100.0%) |
Physical Housing Characteristics in Smyrna
Housing Structures in Smyrna
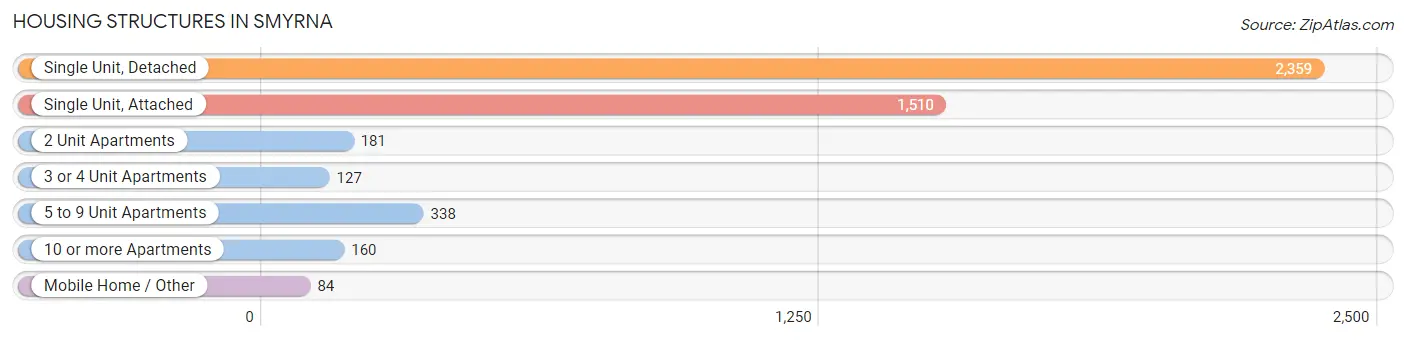
| Structure Type | # Housing Units | % Housing Units |
| Single Unit, Detached | 2,359 | 49.6% |
| Single Unit, Attached | 1,510 | 31.7% |
| 2 Unit Apartments | 181 | 3.8% |
| 3 or 4 Unit Apartments | 127 | 2.7% |
| 5 to 9 Unit Apartments | 338 | 7.1% |
| 10 or more Apartments | 160 | 3.4% |
| Mobile Home / Other | 84 | 1.8% |
| Total | 4,759 | 100.0% |
Housing Structures by Occupancy in Smyrna

| Structure Type | Owner-occupied | Renter-occupied |
| Single Unit, Detached | 2,119 (89.8%) | 240 (10.2%) |
| Single Unit, Attached | 1,060 (70.2%) | 450 (29.8%) |
| 2 Unit Apartments | 0 (0.0%) | 181 (100.0%) |
| 3 or 4 Unit Apartments | 0 (0.0%) | 127 (100.0%) |
| 5 to 9 Unit Apartments | 15 (4.4%) | 323 (95.6%) |
| 10 or more Apartments | 12 (7.5%) | 148 (92.5%) |
| Mobile Home / Other | 34 (40.5%) | 50 (59.5%) |
| Total | 3,240 (68.1%) | 1,519 (31.9%) |
Housing Structures by Number of Rooms in Smyrna
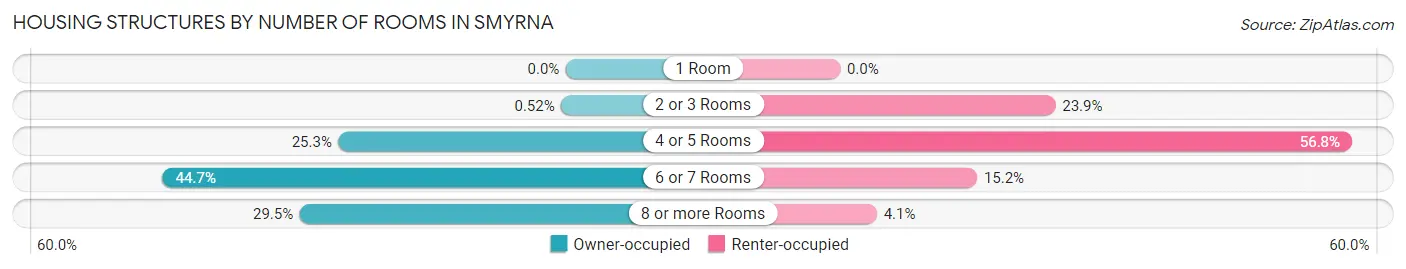
| Number of Rooms | Owner-occupied | Renter-occupied |
| 1 Room | 0 (0.0%) | 0 (0.0%) |
| 2 or 3 Rooms | 17 (0.5%) | 363 (23.9%) |
| 4 or 5 Rooms | 818 (25.3%) | 863 (56.8%) |
| 6 or 7 Rooms | 1,448 (44.7%) | 231 (15.2%) |
| 8 or more Rooms | 957 (29.5%) | 62 (4.1%) |
| Total | 3,240 (100.0%) | 1,519 (100.0%) |
Housing Structure by Heating Type in Smyrna
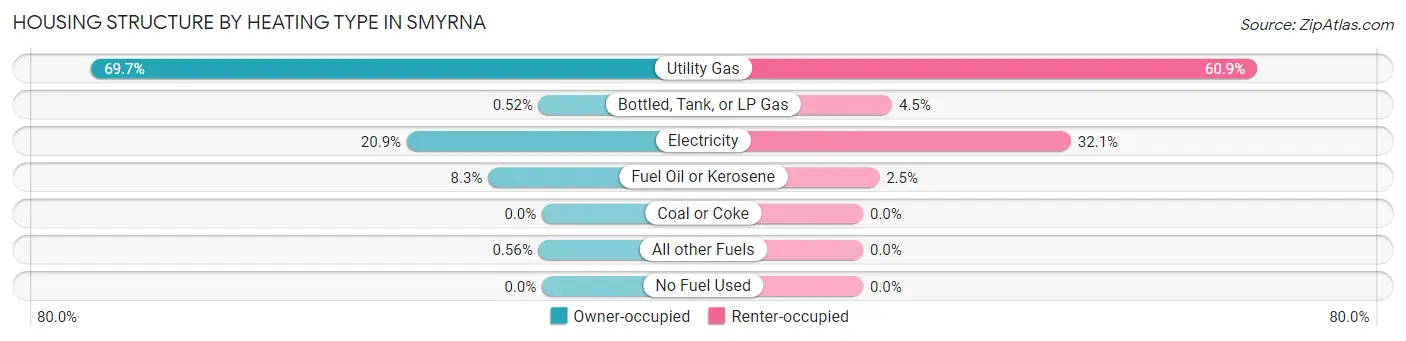
| Heating Type | Owner-occupied | Renter-occupied |
| Utility Gas | 2,258 (69.7%) | 925 (60.9%) |
| Bottled, Tank, or LP Gas | 17 (0.5%) | 68 (4.5%) |
| Electricity | 677 (20.9%) | 488 (32.1%) |
| Fuel Oil or Kerosene | 270 (8.3%) | 38 (2.5%) |
| Coal or Coke | 0 (0.0%) | 0 (0.0%) |
| All other Fuels | 18 (0.6%) | 0 (0.0%) |
| No Fuel Used | 0 (0.0%) | 0 (0.0%) |
| Total | 3,240 (100.0%) | 1,519 (100.0%) |
Household Vehicle Usage in Smyrna
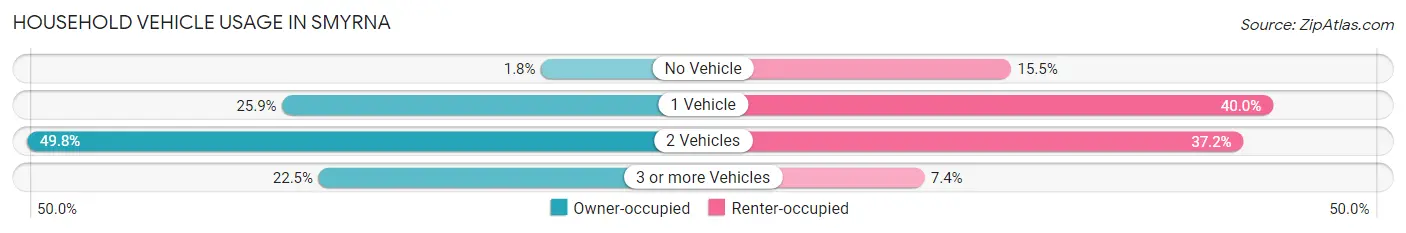
| Vehicles per Household | Owner-occupied | Renter-occupied |
| No Vehicle | 57 (1.8%) | 235 (15.5%) |
| 1 Vehicle | 840 (25.9%) | 607 (40.0%) |
| 2 Vehicles | 1,613 (49.8%) | 565 (37.2%) |
| 3 or more Vehicles | 730 (22.5%) | 112 (7.4%) |
| Total | 3,240 (100.0%) | 1,519 (100.0%) |
Real Estate & Mortgages in Smyrna
Real Estate and Mortgage Overview in Smyrna
| Characteristic | Without Mortgage | With Mortgage |
| Housing Units | 710 | 2,530 |
| Median Property Value | $194,800 | $254,800 |
| Median Household Income | $58,656 | $365 |
| Monthly Housing Costs | $467 | $0 |
| Real Estate Taxes | $1,151 | $151 |
Property Value by Mortgage Status in Smyrna
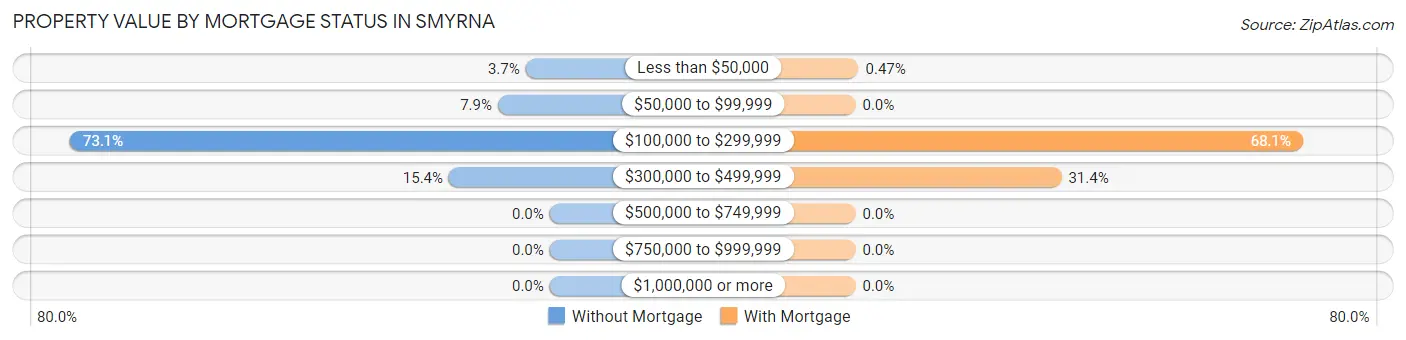
| Property Value | Without Mortgage | With Mortgage |
| Less than $50,000 | 26 (3.7%) | 12 (0.5%) |
| $50,000 to $99,999 | 56 (7.9%) | 0 (0.0%) |
| $100,000 to $299,999 | 519 (73.1%) | 1,724 (68.1%) |
| $300,000 to $499,999 | 109 (15.3%) | 794 (31.4%) |
| $500,000 to $749,999 | 0 (0.0%) | 0 (0.0%) |
| $750,000 to $999,999 | 0 (0.0%) | 0 (0.0%) |
| $1,000,000 or more | 0 (0.0%) | 0 (0.0%) |
| Total | 710 (100.0%) | 2,530 (100.0%) |
Household Income by Mortgage Status in Smyrna
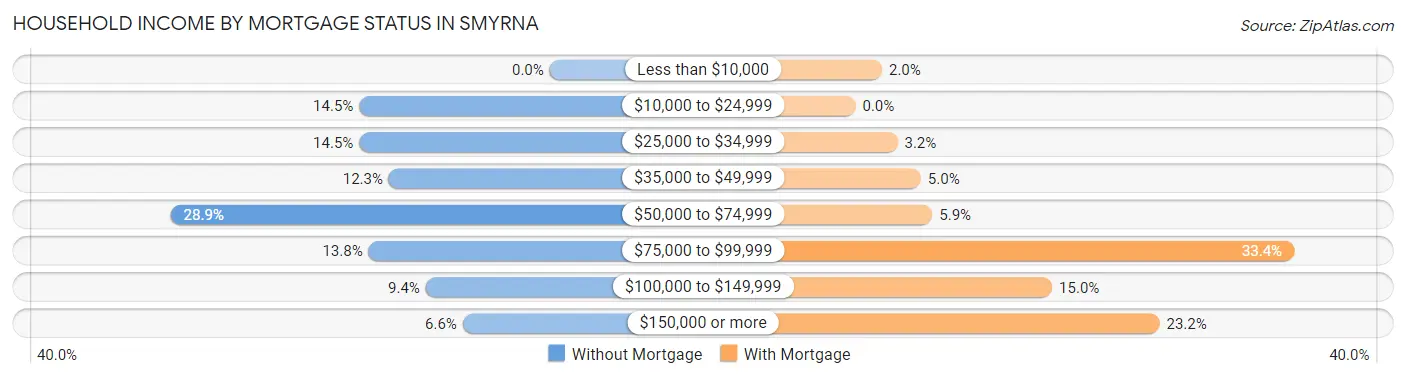
| Household Income | Without Mortgage | With Mortgage |
| Less than $10,000 | 0 (0.0%) | 51 (2.0%) |
| $10,000 to $24,999 | 103 (14.5%) | 0 (0.0%) |
| $25,000 to $34,999 | 103 (14.5%) | 81 (3.2%) |
| $35,000 to $49,999 | 87 (12.2%) | 126 (5.0%) |
| $50,000 to $74,999 | 205 (28.9%) | 148 (5.9%) |
| $75,000 to $99,999 | 98 (13.8%) | 845 (33.4%) |
| $100,000 to $149,999 | 67 (9.4%) | 379 (15.0%) |
| $150,000 or more | 47 (6.6%) | 586 (23.2%) |
| Total | 710 (100.0%) | 2,530 (100.0%) |
Property Value to Household Income Ratio in Smyrna
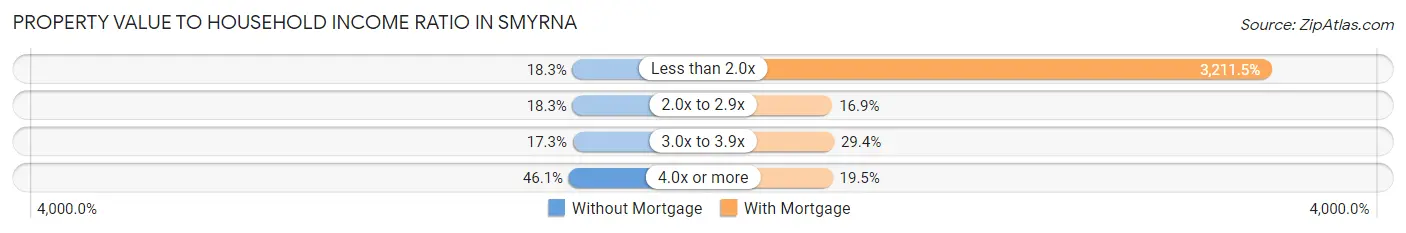
| Value-to-Income Ratio | Without Mortgage | With Mortgage |
| Less than 2.0x | 130 (18.3%) | 81,250 (3,211.5%) |
| 2.0x to 2.9x | 130 (18.3%) | 428 (16.9%) |
| 3.0x to 3.9x | 123 (17.3%) | 744 (29.4%) |
| 4.0x or more | 327 (46.1%) | 492 (19.5%) |
| Total | 710 (100.0%) | 2,530 (100.0%) |
Real Estate Taxes by Mortgage Status in Smyrna
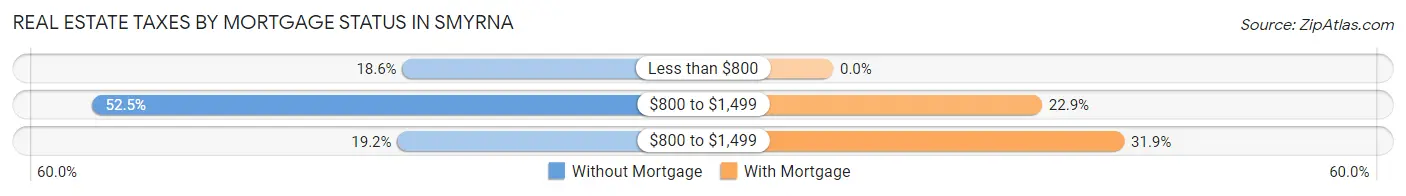
| Property Taxes | Without Mortgage | With Mortgage |
| Less than $800 | 132 (18.6%) | 0 (0.0%) |
| $800 to $1,499 | 373 (52.5%) | 579 (22.9%) |
| $800 to $1,499 | 136 (19.2%) | 807 (31.9%) |
| Total | 710 (100.0%) | 2,530 (100.0%) |
Health & Disability in Smyrna
Health Insurance Coverage by Age in Smyrna
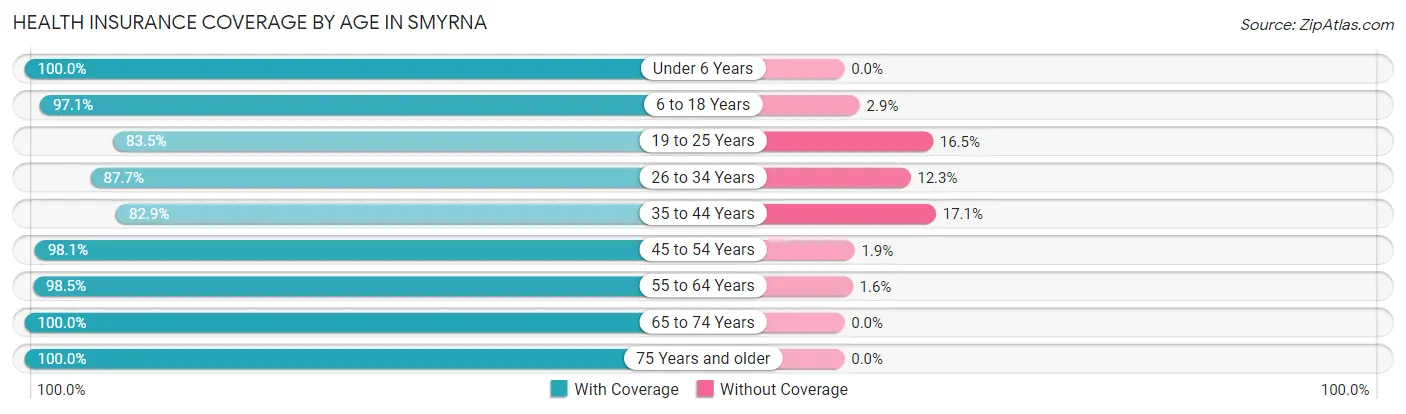
| Age Bracket | With Coverage | Without Coverage |
| Under 6 Years | 1,177 (100.0%) | 0 (0.0%) |
| 6 to 18 Years | 2,164 (97.1%) | 64 (2.9%) |
| 19 to 25 Years | 794 (83.5%) | 157 (16.5%) |
| 26 to 34 Years | 2,032 (87.7%) | 285 (12.3%) |
| 35 to 44 Years | 1,438 (82.9%) | 296 (17.1%) |
| 45 to 54 Years | 1,498 (98.1%) | 29 (1.9%) |
| 55 to 64 Years | 1,140 (98.5%) | 18 (1.5%) |
| 65 to 74 Years | 1,052 (100.0%) | 0 (0.0%) |
| 75 Years and older | 500 (100.0%) | 0 (0.0%) |
| Total | 11,795 (93.3%) | 849 (6.7%) |
Health Insurance Coverage by Citizenship Status in Smyrna
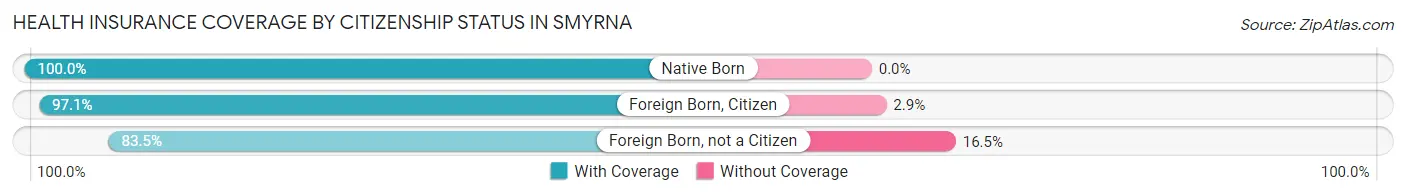
| Citizenship Status | With Coverage | Without Coverage |
| Native Born | 1,177 (100.0%) | 0 (0.0%) |
| Foreign Born, Citizen | 2,164 (97.1%) | 64 (2.9%) |
| Foreign Born, not a Citizen | 794 (83.5%) | 157 (16.5%) |
Health Insurance Coverage by Household Income in Smyrna
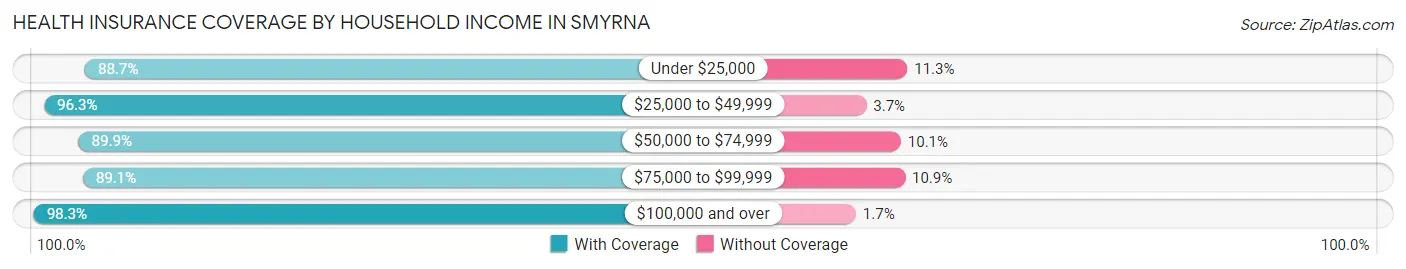
| Household Income | With Coverage | Without Coverage |
| Under $25,000 | 767 (88.7%) | 98 (11.3%) |
| $25,000 to $49,999 | 1,710 (96.3%) | 65 (3.7%) |
| $50,000 to $74,999 | 3,193 (89.9%) | 360 (10.1%) |
| $75,000 to $99,999 | 2,090 (89.1%) | 256 (10.9%) |
| $100,000 and over | 4,017 (98.3%) | 70 (1.7%) |
Public vs Private Health Insurance Coverage by Age in Smyrna
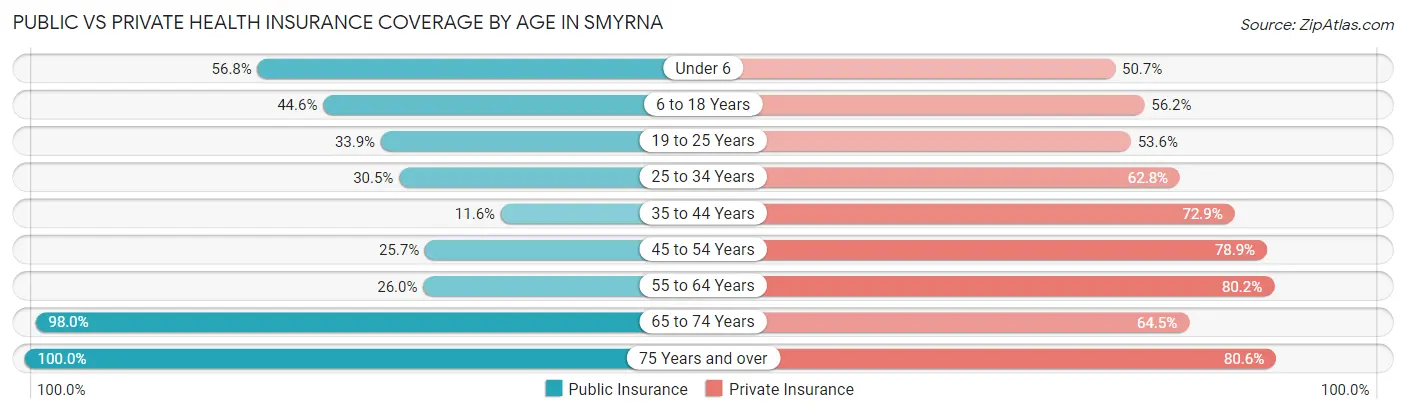
| Age Bracket | Public Insurance | Private Insurance |
| Under 6 | 668 (56.8%) | 597 (50.7%) |
| 6 to 18 Years | 993 (44.6%) | 1,251 (56.1%) |
| 19 to 25 Years | 322 (33.9%) | 510 (53.6%) |
| 25 to 34 Years | 706 (30.5%) | 1,454 (62.7%) |
| 35 to 44 Years | 201 (11.6%) | 1,264 (72.9%) |
| 45 to 54 Years | 392 (25.7%) | 1,205 (78.9%) |
| 55 to 64 Years | 301 (26.0%) | 929 (80.2%) |
| 65 to 74 Years | 1,031 (98.0%) | 678 (64.4%) |
| 75 Years and over | 500 (100.0%) | 403 (80.6%) |
| Total | 5,114 (40.5%) | 8,291 (65.6%) |
Disability Status by Sex by Age in Smyrna

| Age Bracket | Male | Female |
| Under 5 Years | 0 (0.0%) | 0 (0.0%) |
| 5 to 17 Years | 132 (12.5%) | 46 (4.5%) |
| 18 to 34 Years | 324 (18.6%) | 44 (2.5%) |
| 35 to 64 Years | 227 (11.3%) | 349 (14.4%) |
| 65 to 74 Years | 72 (15.2%) | 214 (37.1%) |
| 75 Years and over | 50 (25.4%) | 155 (51.2%) |
Disability Class by Sex by Age in Smyrna
Disability Class: Hearing Difficulty
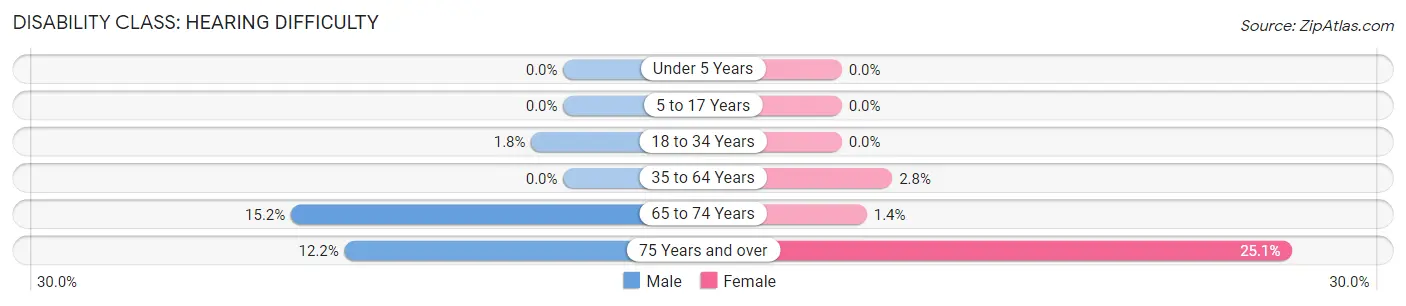
| Age Bracket | Male | Female |
| Under 5 Years | 0 (0.0%) | 0 (0.0%) |
| 5 to 17 Years | 0 (0.0%) | 0 (0.0%) |
| 18 to 34 Years | 31 (1.8%) | 0 (0.0%) |
| 35 to 64 Years | 0 (0.0%) | 68 (2.8%) |
| 65 to 74 Years | 72 (15.2%) | 8 (1.4%) |
| 75 Years and over | 24 (12.2%) | 76 (25.1%) |
Disability Class: Vision Difficulty
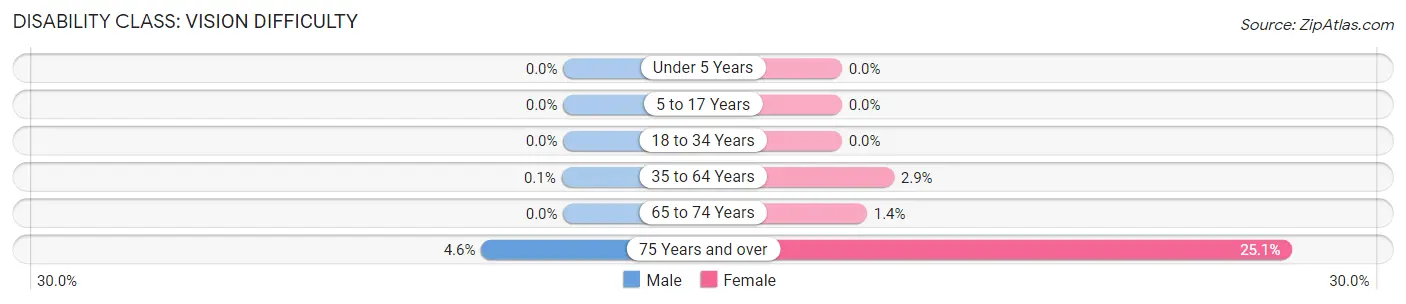
| Age Bracket | Male | Female |
| Under 5 Years | 0 (0.0%) | 0 (0.0%) |
| 5 to 17 Years | 0 (0.0%) | 0 (0.0%) |
| 18 to 34 Years | 0 (0.0%) | 0 (0.0%) |
| 35 to 64 Years | 2 (0.1%) | 70 (2.9%) |
| 65 to 74 Years | 0 (0.0%) | 8 (1.4%) |
| 75 Years and over | 9 (4.6%) | 76 (25.1%) |
Disability Class: Cognitive Difficulty
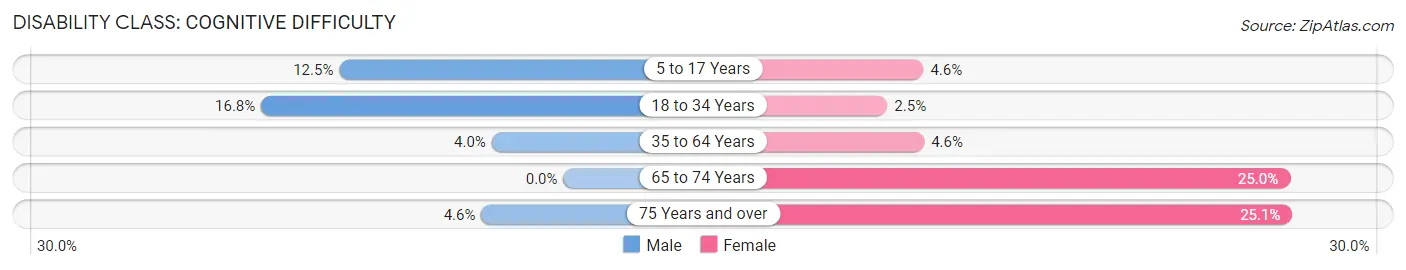
| Age Bracket | Male | Female |
| 5 to 17 Years | 132 (12.5%) | 46 (4.5%) |
| 18 to 34 Years | 293 (16.8%) | 44 (2.5%) |
| 35 to 64 Years | 80 (4.0%) | 111 (4.6%) |
| 65 to 74 Years | 0 (0.0%) | 144 (25.0%) |
| 75 Years and over | 9 (4.6%) | 76 (25.1%) |
Disability Class: Ambulatory Difficulty
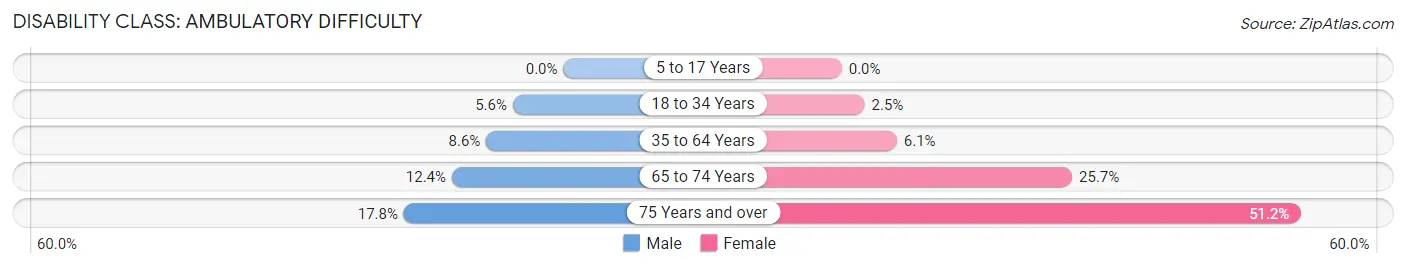
| Age Bracket | Male | Female |
| 5 to 17 Years | 0 (0.0%) | 0 (0.0%) |
| 18 to 34 Years | 98 (5.6%) | 44 (2.5%) |
| 35 to 64 Years | 172 (8.6%) | 148 (6.1%) |
| 65 to 74 Years | 59 (12.4%) | 148 (25.7%) |
| 75 Years and over | 35 (17.8%) | 155 (51.2%) |
Disability Class: Self-Care Difficulty
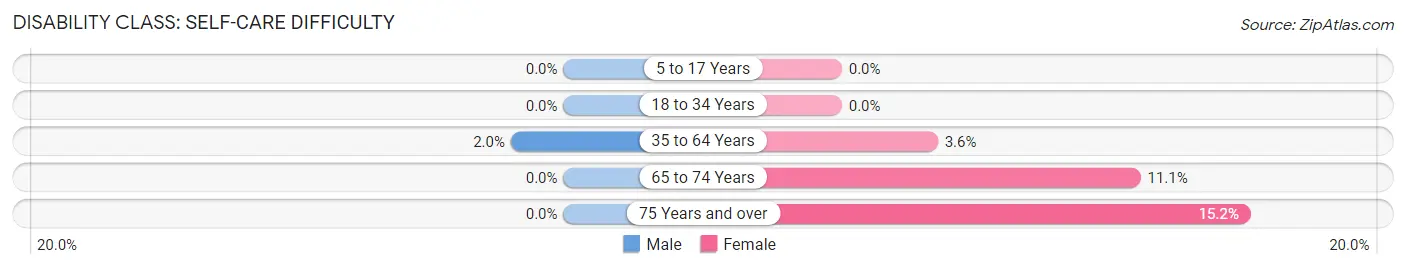
| Age Bracket | Male | Female |
| 5 to 17 Years | 0 (0.0%) | 0 (0.0%) |
| 18 to 34 Years | 0 (0.0%) | 0 (0.0%) |
| 35 to 64 Years | 39 (1.9%) | 86 (3.6%) |
| 65 to 74 Years | 0 (0.0%) | 64 (11.1%) |
| 75 Years and over | 0 (0.0%) | 46 (15.2%) |
Technology Access in Smyrna
Computing Device Access in Smyrna
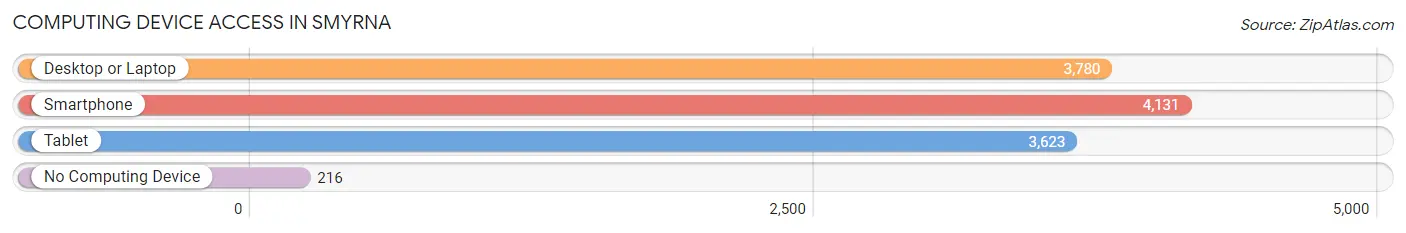
| Device Type | # Households | % Households |
| Desktop or Laptop | 3,780 | 79.4% |
| Smartphone | 4,131 | 86.8% |
| Tablet | 3,623 | 76.1% |
| No Computing Device | 216 | 4.5% |
| Total | 4,759 | 100.0% |
Internet Access in Smyrna
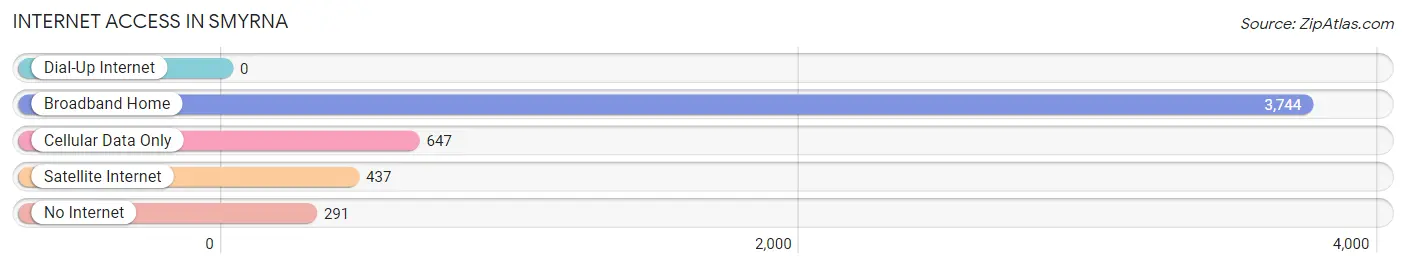
| Internet Type | # Households | % Households |
| Dial-Up Internet | 0 | 0.0% |
| Broadband Home | 3,744 | 78.7% |
| Cellular Data Only | 647 | 13.6% |
| Satellite Internet | 437 | 9.2% |
| No Internet | 291 | 6.1% |
| Total | 4,759 | 100.0% |
Smyrna Summary
Smyrna, Delaware is a small town located in Kent County, Delaware. It is situated on the banks of the Duck Creek, and is part of the Dover Metropolitan Statistical Area. The town has a population of approximately 11,000 people, and is the second largest town in Kent County.
History
Smyrna was founded in 1713 by a group of Swedish settlers. The town was originally known as Duck Creek Crossroads, and was renamed Smyrna in 1806. The name was chosen in honor of the ancient city of Smyrna in Asia Minor. The town was incorporated in 1855, and has since grown to become the second largest town in Kent County.
Geography
Smyrna is located in the central part of Kent County, Delaware. It is situated on the banks of the Duck Creek, and is bordered by the towns of Clayton, Dover, and Felton. The town has a total area of 8.3 square miles, of which 8.2 square miles is land and 0.1 square miles is water.
Economy
Smyrna’s economy is largely based on agriculture and manufacturing. The town is home to several large agricultural operations, including poultry farms, dairy farms, and vegetable farms. The town is also home to several manufacturing companies, including a plastics manufacturer, a paper mill, and a furniture manufacturer.
Demographics
As of the 2010 census, the population of Smyrna was 11,000. The racial makeup of the town was 79.3% White, 14.2% African American, 0.7% Native American, 1.2% Asian, 0.1% Pacific Islander, and 4.5% from other races. The median household income was $45,000, and the median family income was $53,000. The per capita income was $20,000.
Conclusion
Smyrna, Delaware is a small town located in Kent County, Delaware. It was founded in 1713 by a group of Swedish settlers, and was incorporated in 1855. The town has a population of approximately 11,000 people, and is the second largest town in Kent County. The economy of Smyrna is largely based on agriculture and manufacturing, and the town is home to several large agricultural operations and manufacturing companies. The racial makeup of the town is 79.3% White, 14.2% African American, 0.7% Native American, 1.2% Asian, 0.1% Pacific Islander, and 4.5% from other races. The median household income was $45,000, and the median family income was $53,000.
Common Questions
What is Per Capita Income in Smyrna?
Per Capita income in Smyrna is $31,340.
What is the Median Family Income in Smyrna?
Median Family Income in Smyrna is $72,464.
What is the Median Household income in Smyrna?
Median Household Income in Smyrna is $68,260.
What is Income or Wage Gap in Smyrna?
Income or Wage Gap in Smyrna is 8.1%.
Women in Smyrna earn 91.9 cents for every dollar earned by a man.
What is Family Income Deficit in Smyrna?
Family Income Deficit in Smyrna is $2,865.
Families that are below poverty line in Smyrna earn $2,865 less on average than the poverty threshold level.
What is Inequality or Gini Index in Smyrna?
Inequality or Gini Index in Smyrna is 0.33.
What is the Total Population of Smyrna?
Total Population of Smyrna is 12,870.
What is the Total Male Population of Smyrna?
Total Male Population of Smyrna is 6,289.
What is the Total Female Population of Smyrna?
Total Female Population of Smyrna is 6,581.
What is the Ratio of Males per 100 Females in Smyrna?
There are 95.56 Males per 100 Females in Smyrna.
What is the Ratio of Females per 100 Males in Smyrna?
There are 104.64 Females per 100 Males in Smyrna.
What is the Median Population Age in Smyrna?
Median Population Age in Smyrna is 34.2 Years.
What is the Average Family Size in Smyrna
Average Family Size in Smyrna is 3.2 People.
What is the Average Household Size in Smyrna
Average Household Size in Smyrna is 2.7 People.
How Large is the Labor Force in Smyrna?
There are 6,914 People in the Labor Forcein in Smyrna.
What is the Percentage of People in the Labor Force in Smyrna?
69.4% of People are in the Labor Force in Smyrna.
What is the Unemployment Rate in Smyrna?
Unemployment Rate in Smyrna is 6.1%.