Milford, DE Map & Demographics
Milford Map
Milford Overview
$33,823
PER CAPITA INCOME
$70,186
AVG FAMILY INCOME
$53,472
AVG HOUSEHOLD INCOME
8.0%
WAGE / INCOME GAP [ % ]
92.0¢/ $1
WAGE / INCOME GAP [ $ ]
0.45
INEQUALITY / GINI INDEX
11,714
TOTAL POPULATION
5,279
MALE POPULATION
6,435
FEMALE POPULATION
82.04
MALES / 100 FEMALES
121.90
FEMALES / 100 MALES
43.6
MEDIAN AGE
3.1
AVG FAMILY SIZE
2.3
AVG HOUSEHOLD SIZE
5,500
LABOR FORCE [ PEOPLE ]
57.9%
PERCENT IN LABOR FORCE
6.1%
UNEMPLOYMENT RATE
Milford Zip Codes
Milford Area Codes
Income in Milford
Income Overview in Milford
Per Capita Income in Milford is $33,823, while median incomes of families and households are $70,186 and $53,472 respectively.
| Characteristic | Number | Measure |
| Per Capita Income | 11,714 | $33,823 |
| Median Family Income | 2,569 | $70,186 |
| Mean Family Income | 2,569 | $86,476 |
| Median Household Income | 5,034 | $53,472 |
| Mean Household Income | 5,034 | $73,238 |
| Income Deficit | 2,569 | $0 |
| Wage / Income Gap (%) | 11,714 | 7.96% |
| Wage / Income Gap ($) | 11,714 | 92.04¢ per $1 |
| Gini / Inequality Index | 11,714 | 0.45 |
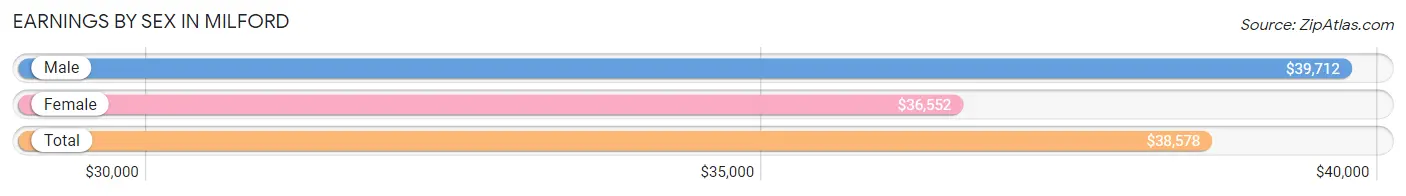
Earnings by Sex in Milford
Average Earnings in Milford are $38,578, $39,712 for men and $36,552 for women, a difference of 8.0%.
| Sex | Number | Average Earnings |
| Male | 3,013 (53.4%) | $39,712 |
| Female | 2,625 (46.6%) | $36,552 |
| Total | 5,638 (100.0%) | $38,578 |
Earnings by Sex by Income Bracket in Milford
The most common earnings brackets in Milford are $55,000 to $64,999 for men (331 | 11.0%) and $75,000 to $99,999 for women (297 | 11.3%).
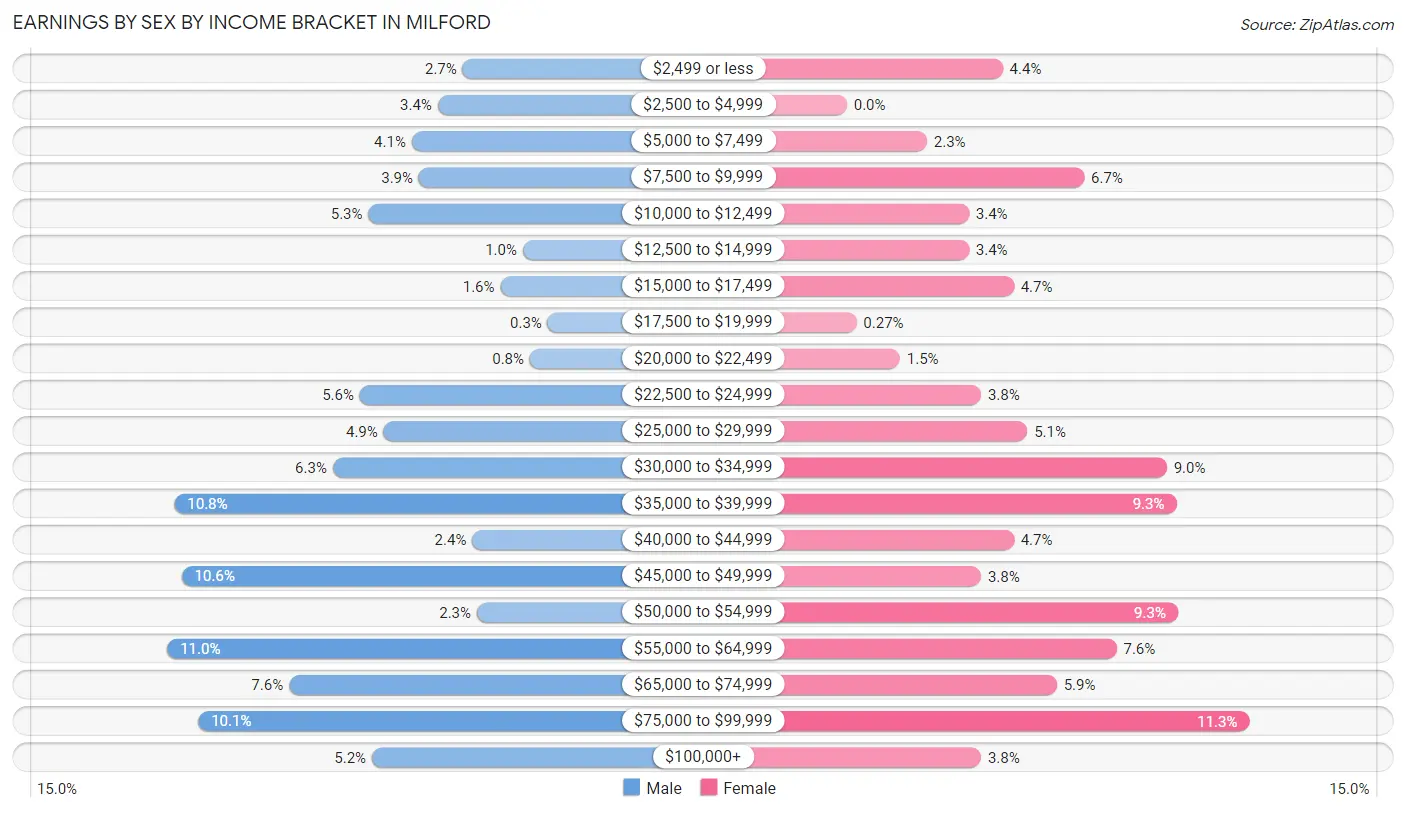
| Income | Male | Female |
| $2,499 or less | 81 (2.7%) | 115 (4.4%) |
| $2,500 to $4,999 | 102 (3.4%) | 0 (0.0%) |
| $5,000 to $7,499 | 124 (4.1%) | 59 (2.2%) |
| $7,500 to $9,999 | 118 (3.9%) | 175 (6.7%) |
| $10,000 to $12,499 | 161 (5.3%) | 90 (3.4%) |
| $12,500 to $14,999 | 30 (1.0%) | 90 (3.4%) |
| $15,000 to $17,499 | 49 (1.6%) | 123 (4.7%) |
| $17,500 to $19,999 | 9 (0.3%) | 7 (0.3%) |
| $20,000 to $22,499 | 24 (0.8%) | 39 (1.5%) |
| $22,500 to $24,999 | 168 (5.6%) | 99 (3.8%) |
| $25,000 to $29,999 | 148 (4.9%) | 133 (5.1%) |
| $30,000 to $34,999 | 191 (6.3%) | 236 (9.0%) |
| $35,000 to $39,999 | 325 (10.8%) | 243 (9.3%) |
| $40,000 to $44,999 | 73 (2.4%) | 123 (4.7%) |
| $45,000 to $49,999 | 319 (10.6%) | 99 (3.8%) |
| $50,000 to $54,999 | 69 (2.3%) | 244 (9.3%) |
| $55,000 to $64,999 | 331 (11.0%) | 199 (7.6%) |
| $65,000 to $74,999 | 228 (7.6%) | 155 (5.9%) |
| $75,000 to $99,999 | 305 (10.1%) | 297 (11.3%) |
| $100,000+ | 158 (5.2%) | 99 (3.8%) |
| Total | 3,013 (100.0%) | 2,625 (100.0%) |
Earnings by Sex by Educational Attainment in Milford
Average earnings in Milford are $42,396 for men and $40,412 for women, a difference of 4.7%. Men with an educational attainment of graduate degree enjoy the highest average annual earnings of $78,750, while those with less than high school education earn the least with $33,882. Women with an educational attainment of graduate degree earn the most with the average annual earnings of $54,091, while those with less than high school education have the smallest earnings of $30,994.
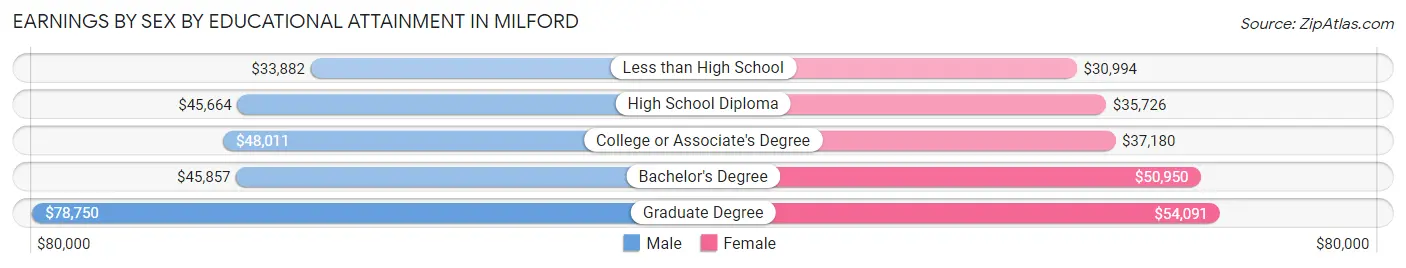
| Educational Attainment | Male Income | Female Income |
| Less than High School | $33,882 | $30,994 |
| High School Diploma | $45,664 | $35,726 |
| College or Associate's Degree | $48,011 | $37,180 |
| Bachelor's Degree | $45,857 | $50,950 |
| Graduate Degree | $78,750 | $54,091 |
| Total | $42,396 | $40,412 |
Family Income in Milford
Family Income Brackets in Milford
According to the Milford family income data, there are 617 families falling into the $50,000 to $74,999 income range, which is the most common income bracket and makes up 24.0% of all families. Conversely, the $10,000 to $14,999 income bracket is the least frequent group with only 28 families (1.1%) belonging to this category.
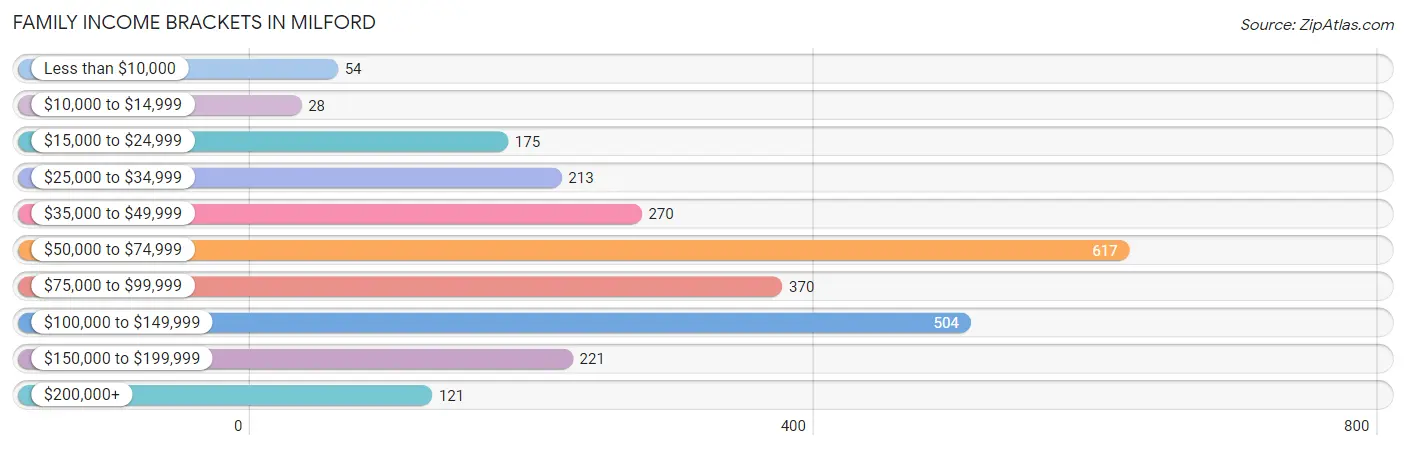
| Income Bracket | # Families | % Families |
| Less than $10,000 | 54 | 2.1% |
| $10,000 to $14,999 | 28 | 1.1% |
| $15,000 to $24,999 | 175 | 6.8% |
| $25,000 to $34,999 | 213 | 8.3% |
| $35,000 to $49,999 | 270 | 10.5% |
| $50,000 to $74,999 | 617 | 24.0% |
| $75,000 to $99,999 | 370 | 14.4% |
| $100,000 to $149,999 | 504 | 19.6% |
| $150,000 to $199,999 | 221 | 8.6% |
| $200,000+ | 121 | 4.7% |
Family Income by Famaliy Size in Milford
5-person families (151 | 5.9%) account for the highest median family income in Milford with $179,450 per family, while 2-person families (1,366 | 53.2%) have the highest median income of $39,562 per family member.
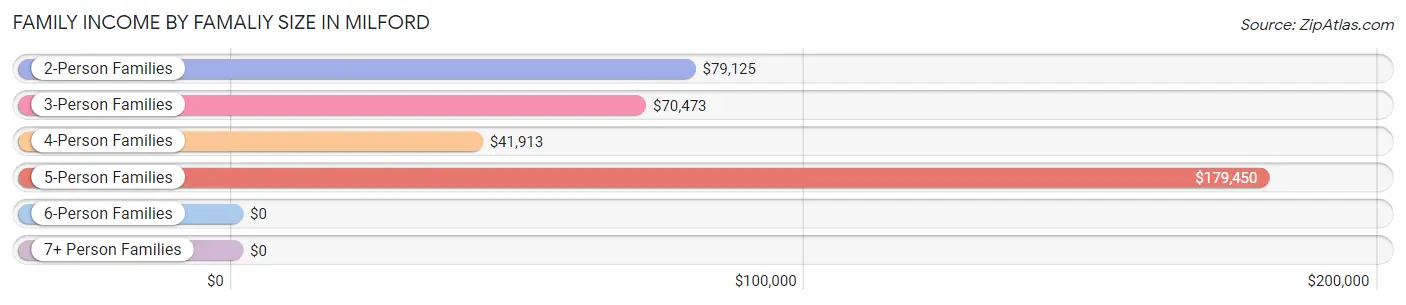
| Income Bracket | # Families | Median Income |
| 2-Person Families | 1,366 (53.2%) | $79,125 |
| 3-Person Families | 516 (20.1%) | $70,473 |
| 4-Person Families | 475 (18.5%) | $41,913 |
| 5-Person Families | 151 (5.9%) | $179,450 |
| 6-Person Families | 51 (2.0%) | $0 |
| 7+ Person Families | 10 (0.4%) | $0 |
| Total | 2,569 (100.0%) | $70,186 |
Family Income by Number of Earners in Milford
The median family income in Milford is $70,186, with families comprising 3+ earners (266) having the highest median family income of $165,786, while families with 1 earner (940) have the lowest median family income of $54,949, accounting for 10.3% and 36.6% of families, respectively.
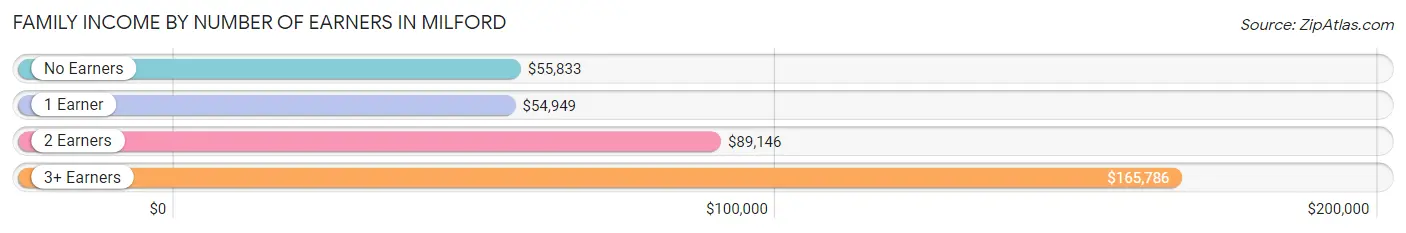
| Number of Earners | # Families | Median Income |
| No Earners | 466 (18.1%) | $55,833 |
| 1 Earner | 940 (36.6%) | $54,949 |
| 2 Earners | 897 (34.9%) | $89,146 |
| 3+ Earners | 266 (10.3%) | $165,786 |
| Total | 2,569 (100.0%) | $70,186 |
Household Income in Milford
Household Income Brackets in Milford
With 1,168 households falling in the category, the $50,000 to $74,999 income range is the most frequent in Milford, accounting for 23.2% of all households. In contrast, only 146 households (2.9%) fall into the less than $10,000 income bracket, making it the least populous group.
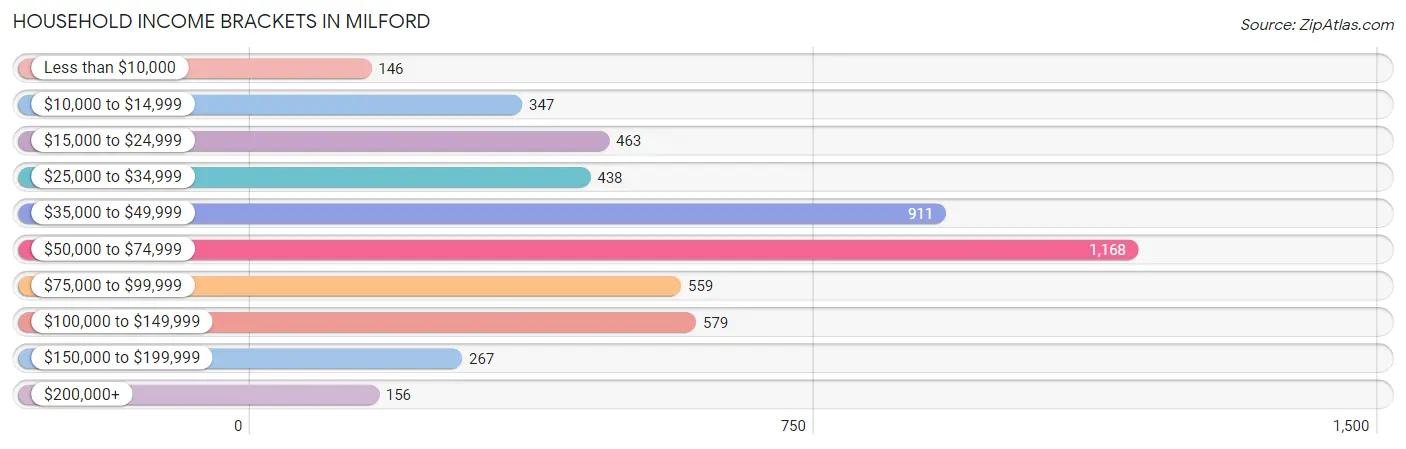
| Income Bracket | # Households | % Households |
| Less than $10,000 | 146 | 2.9% |
| $10,000 to $14,999 | 347 | 6.9% |
| $15,000 to $24,999 | 463 | 9.2% |
| $25,000 to $34,999 | 438 | 8.7% |
| $35,000 to $49,999 | 911 | 18.1% |
| $50,000 to $74,999 | 1,168 | 23.2% |
| $75,000 to $99,999 | 559 | 11.1% |
| $100,000 to $149,999 | 579 | 11.5% |
| $150,000 to $199,999 | 267 | 5.3% |
| $200,000+ | 156 | 3.1% |
Household Income by Householder Age in Milford
The median household income in Milford is $53,472, with the highest median household income of $72,304 found in the 45 to 64 years age bracket for the primary householder. A total of 1,762 households (35.0%) fall into this category. Meanwhile, the 65+ years age bracket for the primary householder has the lowest median household income of $39,530, with 1,779 households (35.3%) in this group.
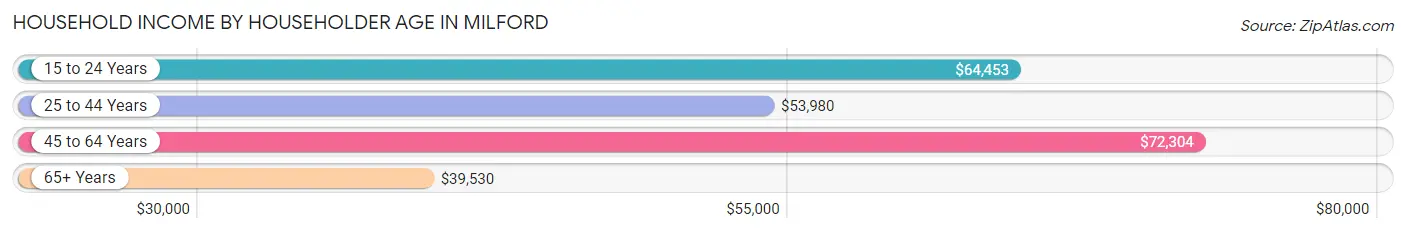
| Income Bracket | # Households | Median Income |
| 15 to 24 Years | 72 (1.4%) | $64,453 |
| 25 to 44 Years | 1,421 (28.2%) | $53,980 |
| 45 to 64 Years | 1,762 (35.0%) | $72,304 |
| 65+ Years | 1,779 (35.3%) | $39,530 |
| Total | 5,034 (100.0%) | $53,472 |
Poverty in Milford
Income Below Poverty by Sex and Age in Milford
With 14.3% poverty level for males and 17.3% for females among the residents of Milford, 5 year old males and 15 year old females are the most vulnerable to poverty, with 53 males (63.9%) and 37 females (61.7%) in their respective age groups living below the poverty level.
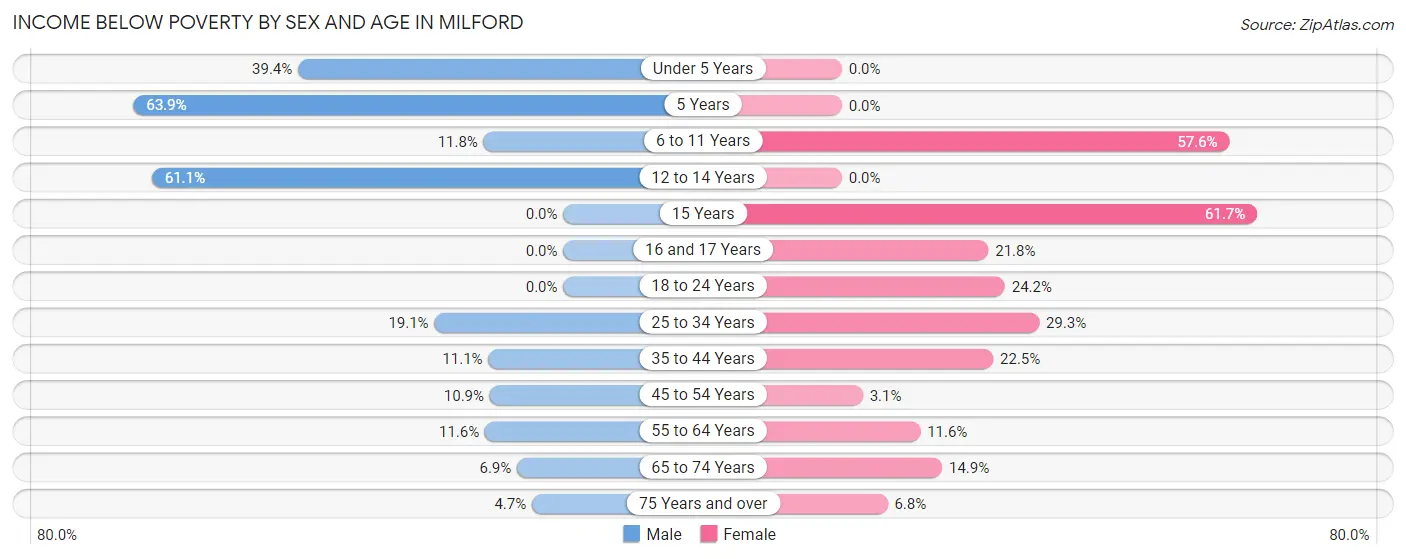
| Age Bracket | Male | Female |
| Under 5 Years | 130 (39.4%) | 0 (0.0%) |
| 5 Years | 53 (63.9%) | 0 (0.0%) |
| 6 to 11 Years | 40 (11.8%) | 259 (57.6%) |
| 12 to 14 Years | 55 (61.1%) | 0 (0.0%) |
| 15 Years | 0 (0.0%) | 37 (61.7%) |
| 16 and 17 Years | 0 (0.0%) | 37 (21.8%) |
| 18 to 24 Years | 0 (0.0%) | 61 (24.2%) |
| 25 to 34 Years | 178 (19.1%) | 241 (29.3%) |
| 35 to 44 Years | 68 (11.1%) | 109 (22.5%) |
| 45 to 54 Years | 55 (10.9%) | 21 (3.1%) |
| 55 to 64 Years | 94 (11.6%) | 107 (11.6%) |
| 65 to 74 Years | 40 (6.9%) | 183 (14.9%) |
| 75 Years and over | 14 (4.6%) | 32 (6.8%) |
| Total | 727 (14.3%) | 1,087 (17.3%) |
Income Above Poverty by Sex and Age in Milford
According to the poverty statistics in Milford, males aged 15 years and females aged under 5 years are the age groups that are most secure financially, with 100.0% of males and 100.0% of females in these age groups living above the poverty line.
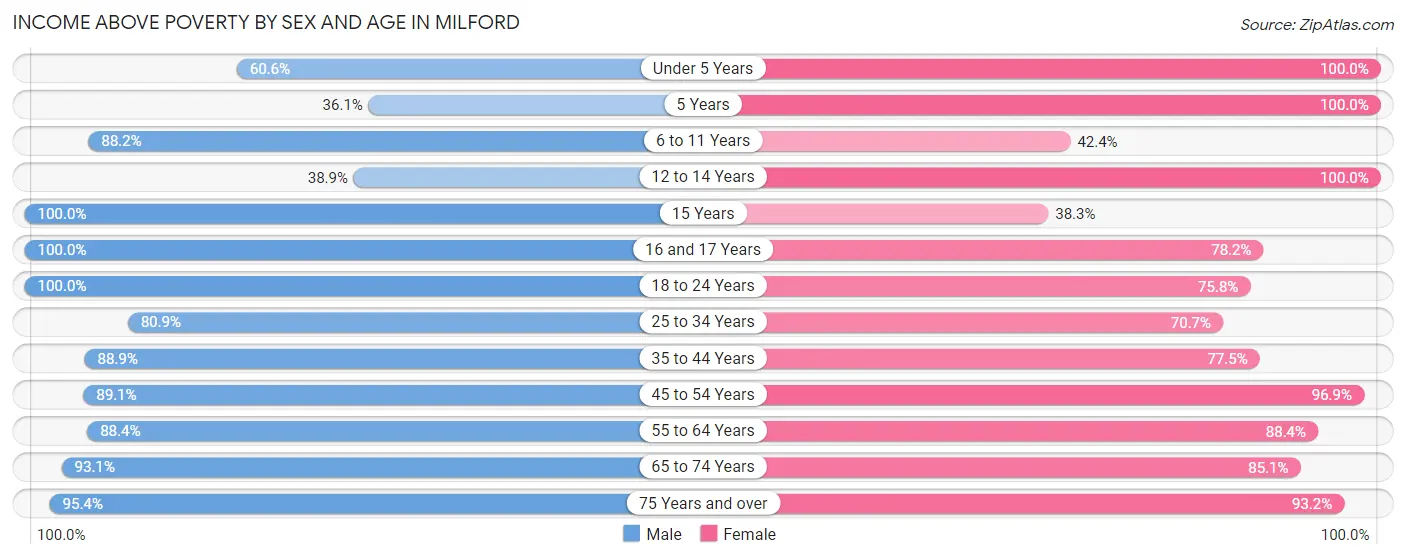
| Age Bracket | Male | Female |
| Under 5 Years | 200 (60.6%) | 585 (100.0%) |
| 5 Years | 30 (36.1%) | 5 (100.0%) |
| 6 to 11 Years | 298 (88.2%) | 191 (42.4%) |
| 12 to 14 Years | 35 (38.9%) | 170 (100.0%) |
| 15 Years | 48 (100.0%) | 23 (38.3%) |
| 16 and 17 Years | 125 (100.0%) | 133 (78.2%) |
| 18 to 24 Years | 326 (100.0%) | 191 (75.8%) |
| 25 to 34 Years | 752 (80.9%) | 582 (70.7%) |
| 35 to 44 Years | 543 (88.9%) | 376 (77.5%) |
| 45 to 54 Years | 449 (89.1%) | 654 (96.9%) |
| 55 to 64 Years | 714 (88.4%) | 812 (88.4%) |
| 65 to 74 Years | 542 (93.1%) | 1,046 (85.1%) |
| 75 Years and over | 287 (95.4%) | 440 (93.2%) |
| Total | 4,349 (85.7%) | 5,208 (82.7%) |
Income Below Poverty Among Married-Couple Families in Milford
The poverty statistics for married-couple families in Milford show that 7.0% or 110 of the total 1,578 families live below the poverty line. Families with 3 or 4 children have the highest poverty rate of 30.0%, comprising of 21 families. On the other hand, families with 1 or 2 children have the lowest poverty rate of 5.3%, which includes 24 families.
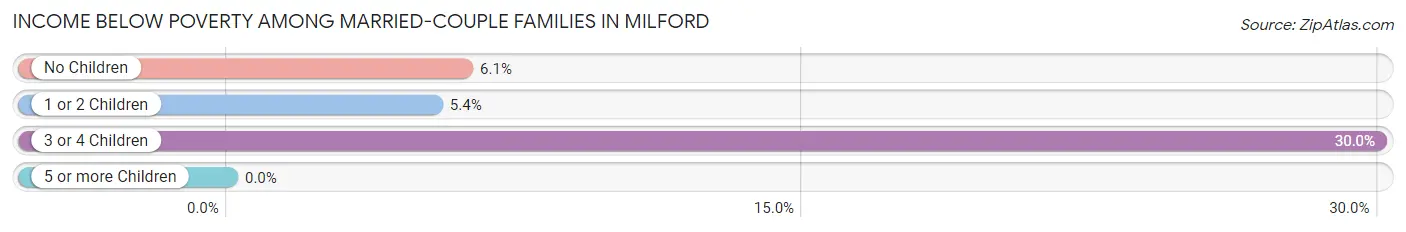
| Children | Above Poverty | Below Poverty |
| No Children | 994 (93.9%) | 65 (6.1%) |
| 1 or 2 Children | 425 (94.7%) | 24 (5.3%) |
| 3 or 4 Children | 49 (70.0%) | 21 (30.0%) |
| 5 or more Children | 0 (0.0%) | 0 (0.0%) |
| Total | 1,468 (93.0%) | 110 (7.0%) |
Income Below Poverty Among Single-Parent Households in Milford
According to the poverty data in Milford, 4.1% or 16 single-father households and 27.8% or 166 single-mother households are living below the poverty line. Among single-father households, those with no children have the highest poverty rate, with 16 households (16.5%) experiencing poverty. Likewise, among single-mother households, those with 3 or 4 children have the highest poverty rate, with 83 households (78.3%) falling below the poverty line.
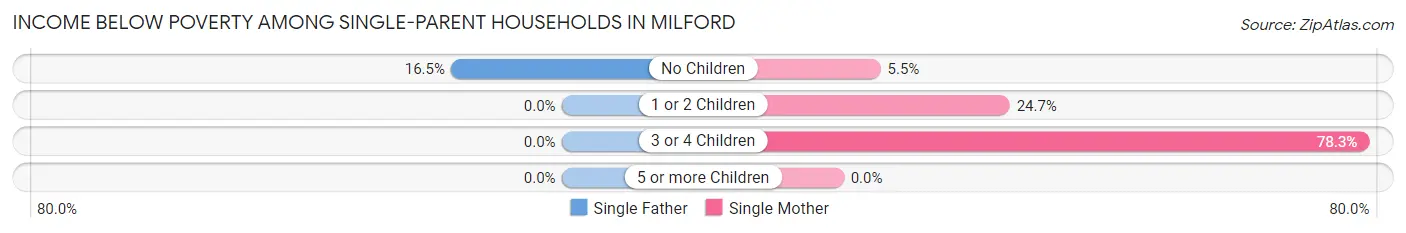
| Children | Single Father | Single Mother |
| No Children | 16 (16.5%) | 11 (5.5%) |
| 1 or 2 Children | 0 (0.0%) | 72 (24.7%) |
| 3 or 4 Children | 0 (0.0%) | 83 (78.3%) |
| 5 or more Children | 0 (0.0%) | 0 (0.0%) |
| Total | 16 (4.1%) | 166 (27.8%) |
Income Below Poverty Among Married-Couple vs Single-Parent Households in Milford
The poverty data for Milford shows that 110 of the married-couple family households (7.0%) and 182 of the single-parent households (18.4%) are living below the poverty level. Within the married-couple family households, those with 3 or 4 children have the highest poverty rate, with 21 households (30.0%) falling below the poverty line. Among the single-parent households, those with 3 or 4 children have the highest poverty rate, with 83 household (53.9%) living below poverty.
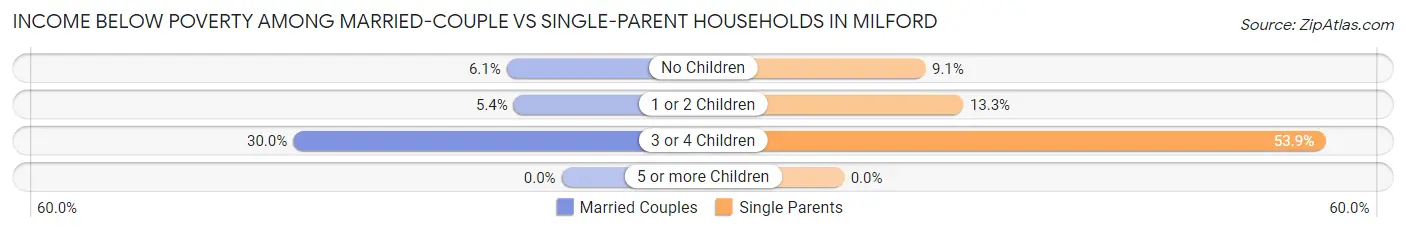
| Children | Married-Couple Families | Single-Parent Households |
| No Children | 65 (6.1%) | 27 (9.1%) |
| 1 or 2 Children | 24 (5.3%) | 72 (13.3%) |
| 3 or 4 Children | 21 (30.0%) | 83 (53.9%) |
| 5 or more Children | 0 (0.0%) | 0 (0.0%) |
| Total | 110 (7.0%) | 182 (18.4%) |
Race in Milford
The most populous races in Milford are White / Caucasian (7,018 | 59.9%), Black / African American (2,668 | 22.8%), and Hispanic or Latino (1,562 | 13.3%).
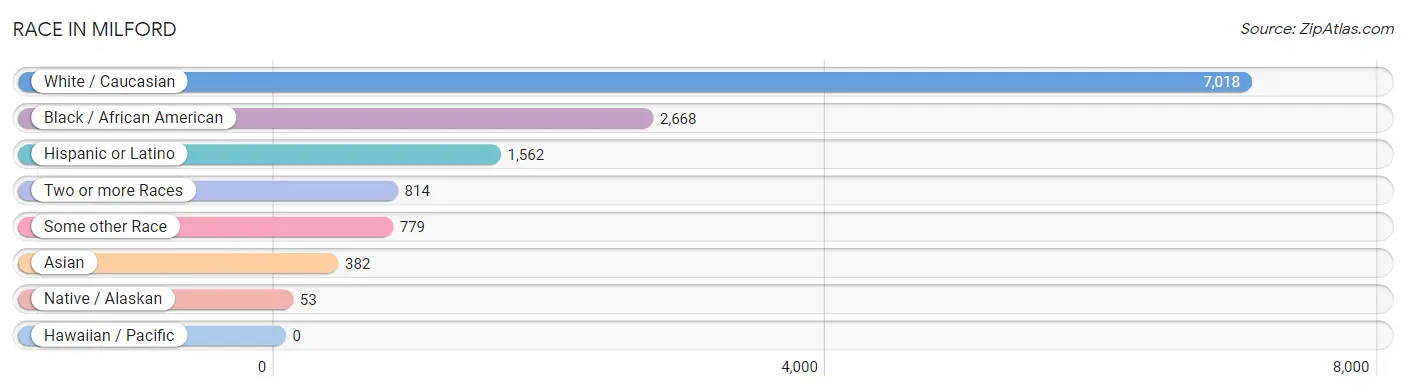
| Race | # Population | % Population |
| Asian | 382 | 3.3% |
| Black / African American | 2,668 | 22.8% |
| Hawaiian / Pacific | 0 | 0.0% |
| Hispanic or Latino | 1,562 | 13.3% |
| Native / Alaskan | 53 | 0.4% |
| White / Caucasian | 7,018 | 59.9% |
| Two or more Races | 814 | 7.0% |
| Some other Race | 779 | 6.7% |
| Total | 11,714 | 100.0% |
Ancestry in Milford
The most populous ancestries reported in Milford are Irish (1,393 | 11.9%), American (1,240 | 10.6%), German (1,084 | 9.2%), Italian (831 | 7.1%), and English (766 | 6.5%), together accounting for 45.4% of all Milford residents.
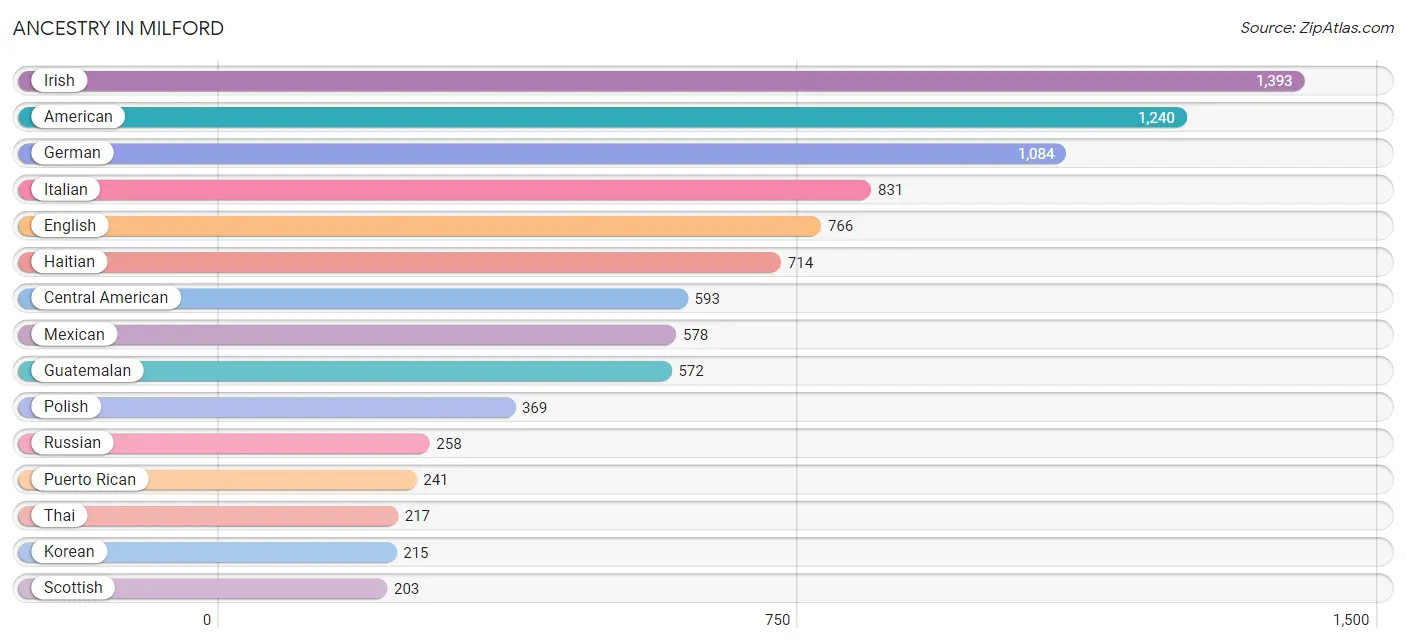
| Ancestry | # Population | % Population |
| African | 23 | 0.2% |
| American | 1,240 | 10.6% |
| Arab | 36 | 0.3% |
| Austrian | 74 | 0.6% |
| British | 76 | 0.6% |
| Burmese | 15 | 0.1% |
| Canadian | 9 | 0.1% |
| Central American | 593 | 5.1% |
| Cherokee | 14 | 0.1% |
| Colombian | 78 | 0.7% |
| Delaware | 12 | 0.1% |
| Dutch | 98 | 0.8% |
| English | 766 | 6.5% |
| European | 59 | 0.5% |
| French | 72 | 0.6% |
| French Canadian | 29 | 0.3% |
| German | 1,084 | 9.2% |
| Greek | 36 | 0.3% |
| Guamanian / Chamorro | 78 | 0.7% |
| Guatemalan | 572 | 4.9% |
| Haitian | 714 | 6.1% |
| Hungarian | 192 | 1.6% |
| Indian (Asian) | 34 | 0.3% |
| Irish | 1,393 | 11.9% |
| Iroquois | 9 | 0.1% |
| Italian | 831 | 7.1% |
| Jamaican | 33 | 0.3% |
| Korean | 215 | 1.8% |
| Lebanese | 36 | 0.3% |
| Mexican | 578 | 4.9% |
| Norwegian | 77 | 0.7% |
| Polish | 369 | 3.2% |
| Portuguese | 55 | 0.5% |
| Puerto Rican | 241 | 2.1% |
| Romanian | 24 | 0.2% |
| Russian | 258 | 2.2% |
| Salvadoran | 21 | 0.2% |
| Scandinavian | 38 | 0.3% |
| Scotch-Irish | 54 | 0.5% |
| Scottish | 203 | 1.7% |
| South African | 121 | 1.0% |
| South American | 78 | 0.7% |
| Spanish | 67 | 0.6% |
| Sri Lankan | 48 | 0.4% |
| Subsaharan African | 144 | 1.2% |
| Swedish | 18 | 0.2% |
| Swiss | 23 | 0.2% |
| Thai | 217 | 1.8% |
| Turkish | 19 | 0.2% |
| Ukrainian | 40 | 0.3% |
| Welsh | 107 | 0.9% |
| West Indian | 16 | 0.1% | View All 52 Rows |
Immigrants in Milford
The most numerous immigrant groups reported in Milford came from Latin America (1,350 | 11.5%), Caribbean (641 | 5.5%), Central America (632 | 5.4%), Haiti (624 | 5.3%), and Asia (429 | 3.7%), together accounting for 31.4% of all Milford residents.
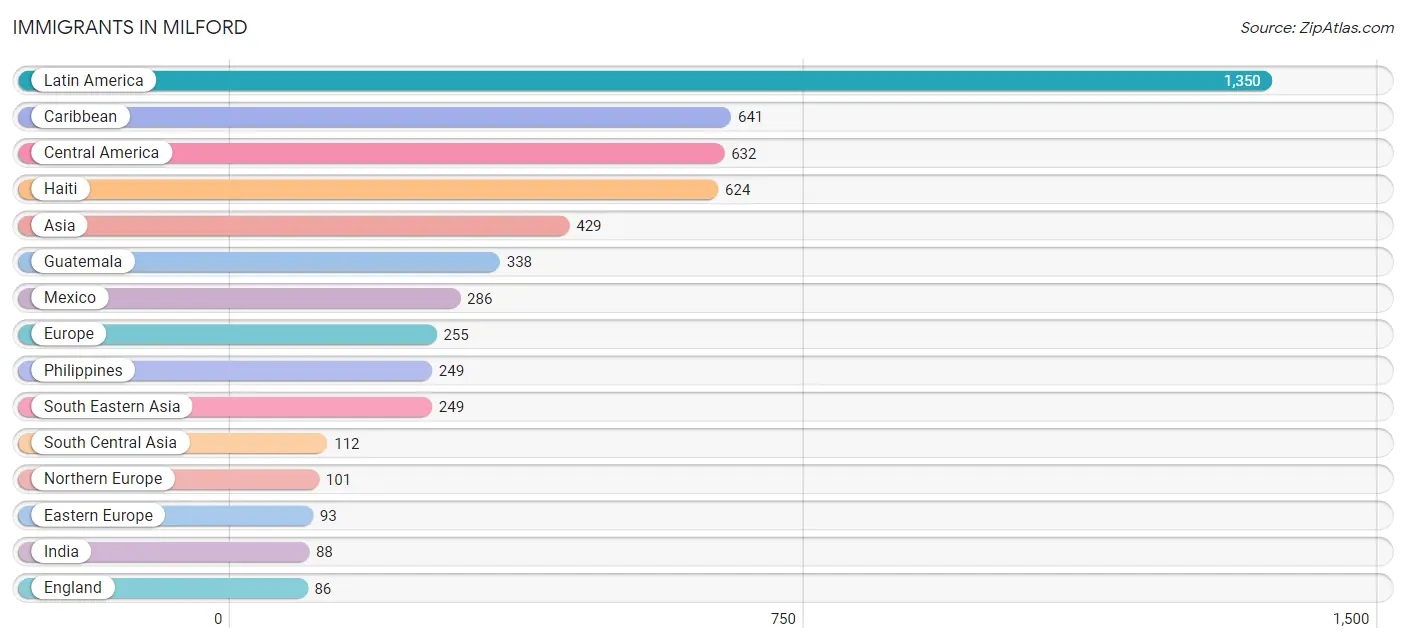
| Immigration Origin | # Population | % Population |
| Africa | 63 | 0.5% |
| Asia | 429 | 3.7% |
| Canada | 11 | 0.1% |
| Caribbean | 641 | 5.5% |
| Central America | 632 | 5.4% |
| China | 34 | 0.3% |
| Colombia | 77 | 0.7% |
| Eastern Asia | 49 | 0.4% |
| Eastern Europe | 93 | 0.8% |
| El Salvador | 8 | 0.1% |
| England | 86 | 0.7% |
| Europe | 255 | 2.2% |
| France | 24 | 0.2% |
| Germany | 10 | 0.1% |
| Greece | 9 | 0.1% |
| Guatemala | 338 | 2.9% |
| Haiti | 624 | 5.3% |
| India | 88 | 0.7% |
| Ireland | 15 | 0.1% |
| Italy | 8 | 0.1% |
| Jamaica | 17 | 0.2% |
| Korea | 15 | 0.1% |
| Latin America | 1,350 | 11.5% |
| Mexico | 286 | 2.4% |
| Moldova | 25 | 0.2% |
| Northern Europe | 101 | 0.9% |
| Pakistan | 24 | 0.2% |
| Philippines | 249 | 2.1% |
| Portugal | 10 | 0.1% |
| Russia | 68 | 0.6% |
| South Africa | 60 | 0.5% |
| South America | 77 | 0.7% |
| South Central Asia | 112 | 1.0% |
| South Eastern Asia | 249 | 2.1% |
| Southern Europe | 27 | 0.2% |
| Turkey | 19 | 0.2% |
| Western Asia | 19 | 0.2% |
| Western Europe | 34 | 0.3% | View All 38 Rows |
Sex and Age in Milford
Sex and Age in Milford
The most populous age groups in Milford are 60 to 64 Years (525 | 10.0%) for men and 65 to 69 Years (637 | 9.9%) for women.
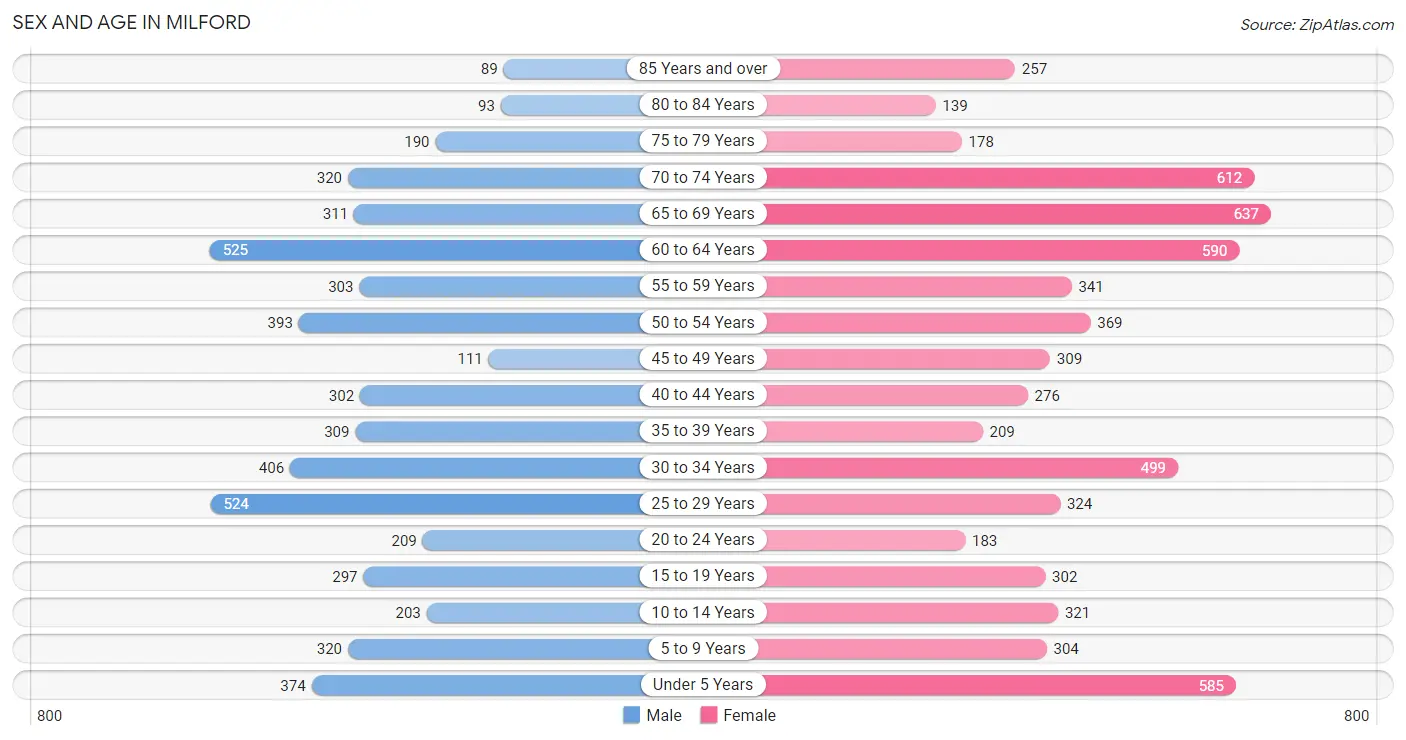
| Age Bracket | Male | Female |
| Under 5 Years | 374 (7.1%) | 585 (9.1%) |
| 5 to 9 Years | 320 (6.1%) | 304 (4.7%) |
| 10 to 14 Years | 203 (3.8%) | 321 (5.0%) |
| 15 to 19 Years | 297 (5.6%) | 302 (4.7%) |
| 20 to 24 Years | 209 (4.0%) | 183 (2.8%) |
| 25 to 29 Years | 524 (9.9%) | 324 (5.0%) |
| 30 to 34 Years | 406 (7.7%) | 499 (7.7%) |
| 35 to 39 Years | 309 (5.9%) | 209 (3.3%) |
| 40 to 44 Years | 302 (5.7%) | 276 (4.3%) |
| 45 to 49 Years | 111 (2.1%) | 309 (4.8%) |
| 50 to 54 Years | 393 (7.4%) | 369 (5.7%) |
| 55 to 59 Years | 303 (5.7%) | 341 (5.3%) |
| 60 to 64 Years | 525 (10.0%) | 590 (9.2%) |
| 65 to 69 Years | 311 (5.9%) | 637 (9.9%) |
| 70 to 74 Years | 320 (6.1%) | 612 (9.5%) |
| 75 to 79 Years | 190 (3.6%) | 178 (2.8%) |
| 80 to 84 Years | 93 (1.8%) | 139 (2.2%) |
| 85 Years and over | 89 (1.7%) | 257 (4.0%) |
| Total | 5,279 (100.0%) | 6,435 (100.0%) |
Families and Households in Milford
Median Family Size in Milford
The median family size in Milford is 3.15 persons per family, with single female/mother families (597 | 23.2%) accounting for the largest median family size of 3.2 persons per family. On the other hand, married-couple families (1,578 | 61.4%) represent the smallest median family size with 3.14 persons per family.
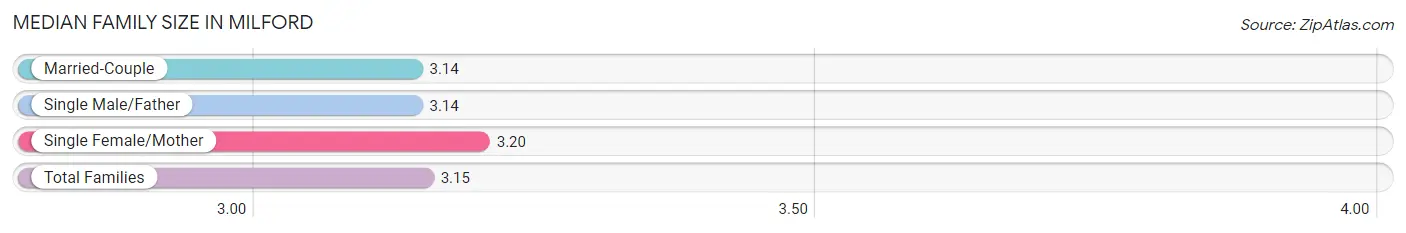
| Family Type | # Families | Family Size |
| Married-Couple | 1,578 (61.4%) | 3.14 |
| Single Male/Father | 394 (15.3%) | 3.14 |
| Single Female/Mother | 597 (23.2%) | 3.20 |
| Total Families | 2,569 (100.0%) | 3.15 |
Median Household Size in Milford
The median household size in Milford is 2.27 persons per household, with single male/father households (394 | 7.8%) accounting for the largest median household size of 3.86 persons per household. non-family households (2,465 | 49.0%) represent the smallest median household size with 1.13 persons per household.
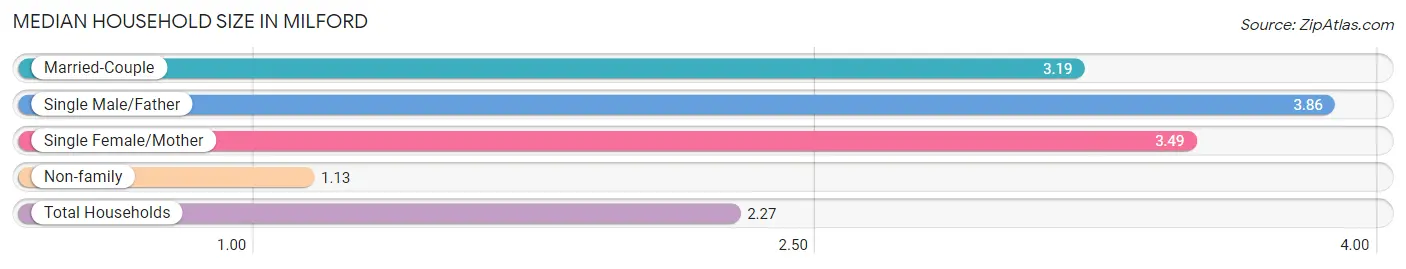
| Household Type | # Households | Household Size |
| Married-Couple | 1,578 (31.4%) | 3.19 |
| Single Male/Father | 394 (7.8%) | 3.86 |
| Single Female/Mother | 597 (11.9%) | 3.49 |
| Non-family | 2,465 (49.0%) | 1.13 |
| Total Households | 5,034 (100.0%) | 2.27 |
Household Size by Marriage Status in Milford
Out of a total of 5,034 households in Milford, 2,569 (51.0%) are family households, while 2,465 (49.0%) are nonfamily households. The most numerous type of family households are 2-person households, comprising 1,187, and the most common type of nonfamily households are 1-person households, comprising 2,136.
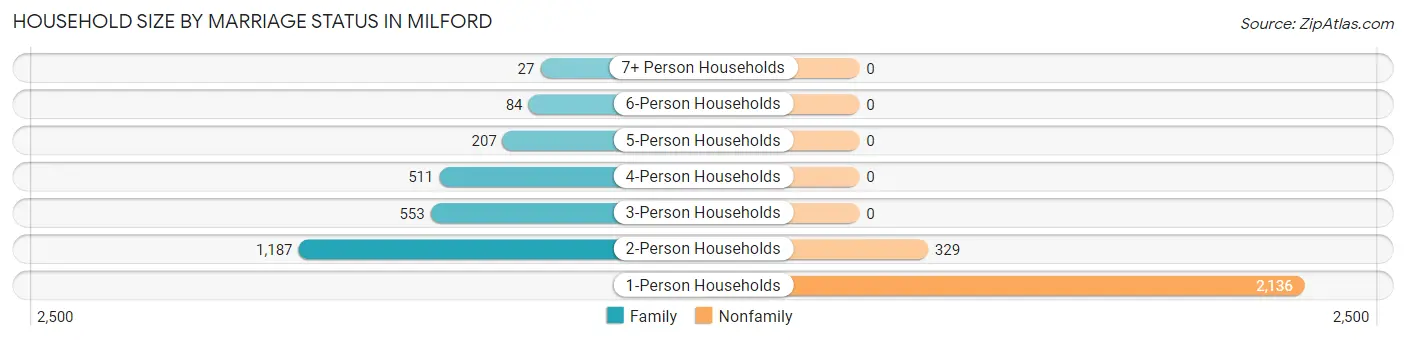
| Household Size | Family Households | Nonfamily Households |
| 1-Person Households | - | 2,136 (42.4%) |
| 2-Person Households | 1,187 (23.6%) | 329 (6.5%) |
| 3-Person Households | 553 (11.0%) | 0 (0.0%) |
| 4-Person Households | 511 (10.2%) | 0 (0.0%) |
| 5-Person Households | 207 (4.1%) | 0 (0.0%) |
| 6-Person Households | 84 (1.7%) | 0 (0.0%) |
| 7+ Person Households | 27 (0.5%) | 0 (0.0%) |
| Total | 2,569 (51.0%) | 2,465 (49.0%) |
Female Fertility in Milford
Fertility by Age in Milford
Average fertility rate in Milford is 19.0 births per 1,000 women. Women in the age bracket of 15 to 19 years have the highest fertility rate with 26.0 births per 1,000 women. Women in the age bracket of 20 to 34 years acount for 61.0% of all women with births.
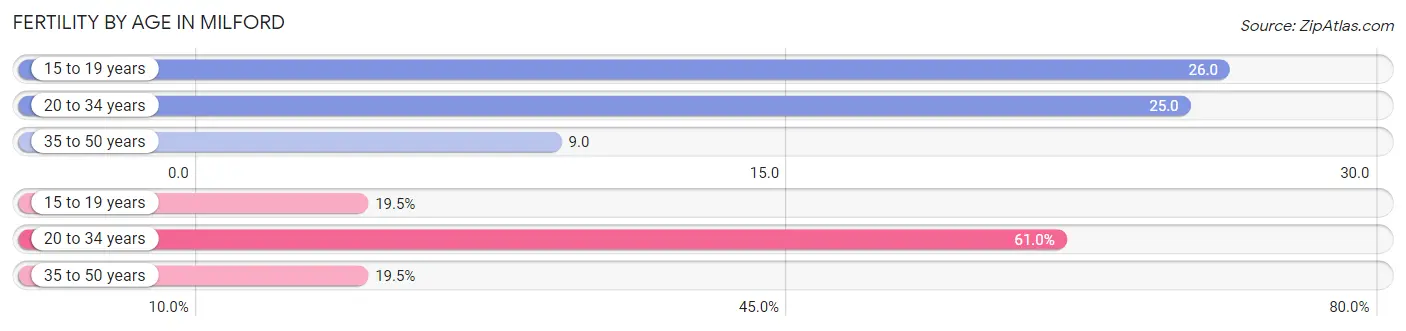
| Age Bracket | Women with Births | Births / 1,000 Women |
| 15 to 19 years | 8 (19.5%) | 26.0 |
| 20 to 34 years | 25 (61.0%) | 25.0 |
| 35 to 50 years | 8 (19.5%) | 9.0 |
| Total | 41 (100.0%) | 19.0 |
Fertility by Age by Marriage Status in Milford
39.0% of women with births (41) in Milford are married. The highest percentage of unmarried women with births falls into 15 to 19 years age bracket with 100.0% of them unmarried at the time of birth, while the lowest percentage of unmarried women with births belong to 20 to 34 years age bracket with 36.0% of them unmarried.
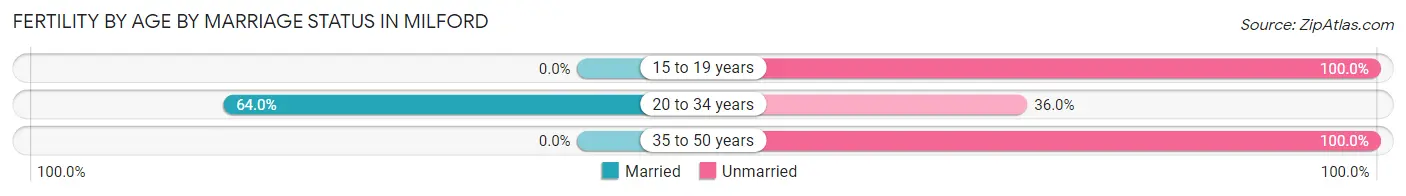
| Age Bracket | Married | Unmarried |
| 15 to 19 years | 0 (0.0%) | 8 (100.0%) |
| 20 to 34 years | 16 (64.0%) | 9 (36.0%) |
| 35 to 50 years | 0 (0.0%) | 8 (100.0%) |
| Total | 16 (39.0%) | 25 (61.0%) |
Fertility by Education in Milford
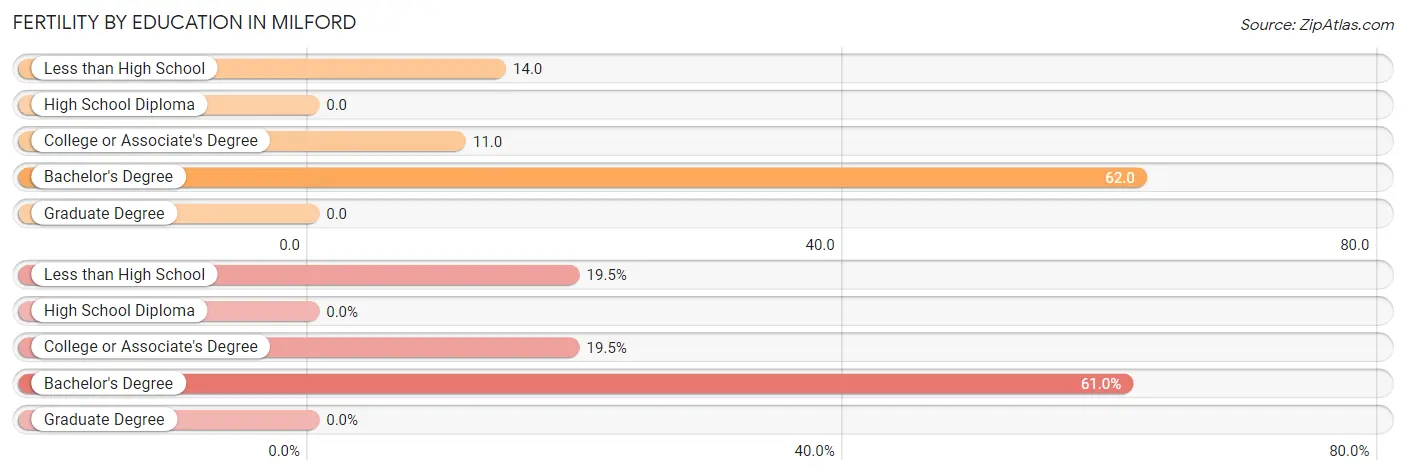
| Educational Attainment | Women with Births | Births / 1,000 Women |
| Less than High School | 8 (19.5%) | 14.0 |
| High School Diploma | 0 (0.0%) | 0.0 |
| College or Associate's Degree | 8 (19.5%) | 11.0 |
| Bachelor's Degree | 25 (61.0%) | 62.0 |
| Graduate Degree | 0 (0.0%) | 0.0 |
| Total | 41 (100.0%) | 19.0 |
Fertility by Education by Marriage Status in Milford
61.0% of women with births in Milford are unmarried. Women with the educational attainment of bachelor's degree are most likely to be married with 64.0% of them married at childbirth, while women with the educational attainment of less than high school are least likely to be married with 100.0% of them unmarried at childbirth.
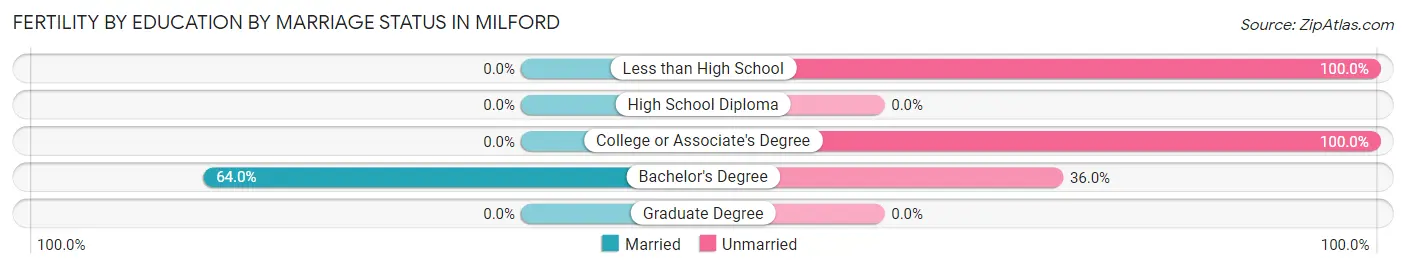
| Educational Attainment | Married | Unmarried |
| Less than High School | 0 (0.0%) | 8 (100.0%) |
| High School Diploma | 0 (0.0%) | 0 (0.0%) |
| College or Associate's Degree | 0 (0.0%) | 8 (100.0%) |
| Bachelor's Degree | 16 (64.0%) | 9 (36.0%) |
| Graduate Degree | 0 (0.0%) | 0 (0.0%) |
| Total | 16 (39.0%) | 25 (61.0%) |
Employment Characteristics in Milford
Employment by Class of Employer in Milford
Among the 5,118 employed individuals in Milford, private company employees (3,541 | 69.2%), state government employees (477 | 9.3%), and not-for-profit organizations (386 | 7.5%) make up the most common classes of employment.
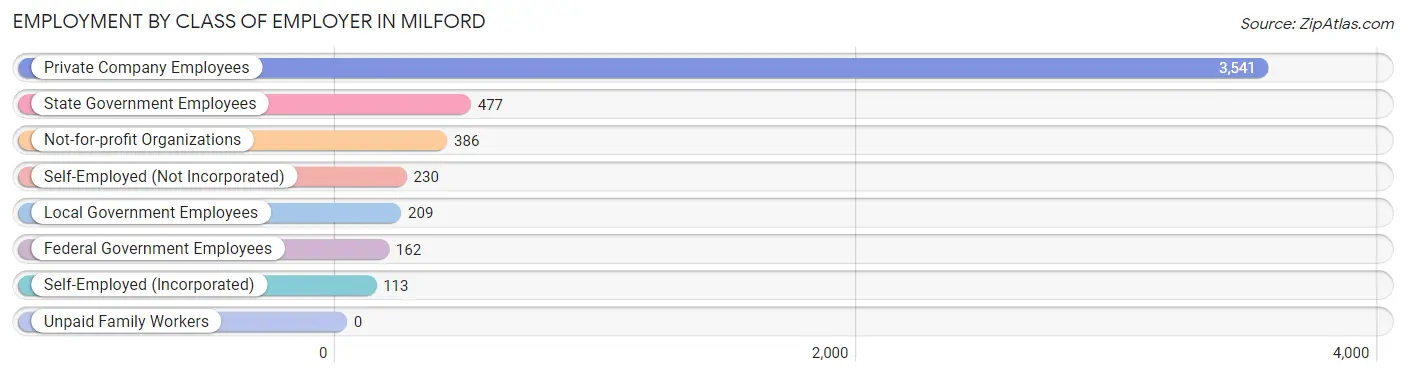
| Employer Class | # Employees | % Employees |
| Private Company Employees | 3,541 | 69.2% |
| Self-Employed (Incorporated) | 113 | 2.2% |
| Self-Employed (Not Incorporated) | 230 | 4.5% |
| Not-for-profit Organizations | 386 | 7.5% |
| Local Government Employees | 209 | 4.1% |
| State Government Employees | 477 | 9.3% |
| Federal Government Employees | 162 | 3.2% |
| Unpaid Family Workers | 0 | 0.0% |
| Total | 5,118 | 100.0% |
Employment Status by Age in Milford
According to the labor force statistics for Milford, out of the total population over 16 years of age (9,499), 57.9% or 5,500 individuals are in the labor force, with 6.1% or 336 of them unemployed. The age group with the highest labor force participation rate is 20 to 24 years, with 100.0% or 392 individuals in the labor force. Within the labor force, the 75 years and over age range has the highest percentage of unemployed individuals, with 69.4% or 59 of them being unemployed.
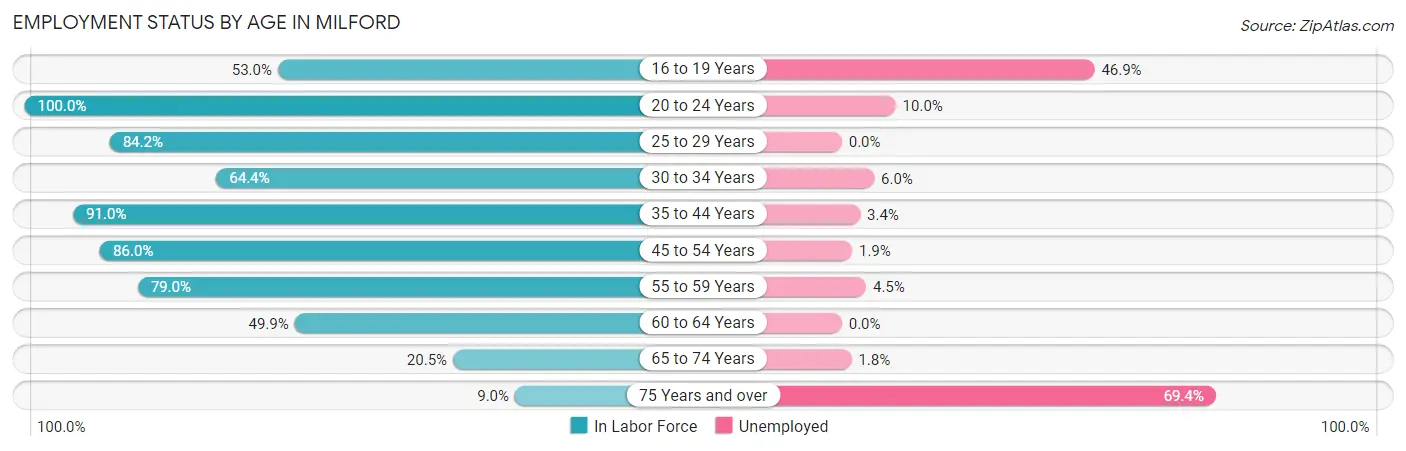
| Age Bracket | In Labor Force | Unemployed |
| 16 to 19 Years | 260 (53.0%) | 122 (46.9%) |
| 20 to 24 Years | 392 (100.0%) | 39 (10.0%) |
| 25 to 29 Years | 714 (84.2%) | 0 (0.0%) |
| 30 to 34 Years | 583 (64.4%) | 35 (6.0%) |
| 35 to 44 Years | 997 (91.0%) | 34 (3.4%) |
| 45 to 54 Years | 1,017 (86.0%) | 19 (1.9%) |
| 55 to 59 Years | 509 (79.0%) | 23 (4.5%) |
| 60 to 64 Years | 556 (49.9%) | 0 (0.0%) |
| 65 to 74 Years | 385 (20.5%) | 7 (1.8%) |
| 75 Years and over | 85 (9.0%) | 59 (69.4%) |
| Total | 5,500 (57.9%) | 336 (6.1%) |
Employment Status by Educational Attainment in Milford
According to labor force statistics for Milford, 75.6% of individuals (4,377) out of the total population between 25 and 64 years of age (5,790) are in the labor force, with 2.5% or 109 of them being unemployed. The group with the highest labor force participation rate are those with the educational attainment of bachelor's degree or higher, with 83.9% or 1,468 individuals in the labor force. Within the labor force, individuals with less than high school education have the highest percentage of unemployment, with 4.1% or 19 of them being unemployed.
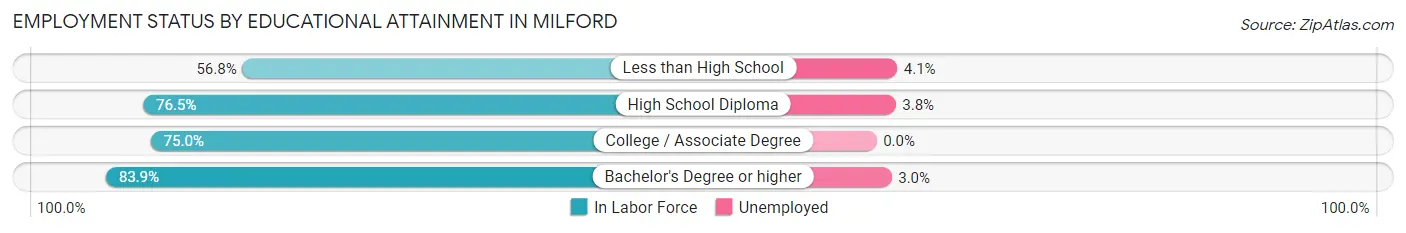
| Educational Attainment | In Labor Force | Unemployed |
| Less than High School | 461 (56.8%) | 33 (4.1%) |
| High School Diploma | 1,253 (76.5%) | 62 (3.8%) |
| College / Associate Degree | 1,192 (75.0%) | 0 (0.0%) |
| Bachelor's Degree or higher | 1,468 (83.9%) | 52 (3.0%) |
| Total | 4,377 (75.6%) | 145 (2.5%) |
Employment Occupations by Sex in Milford
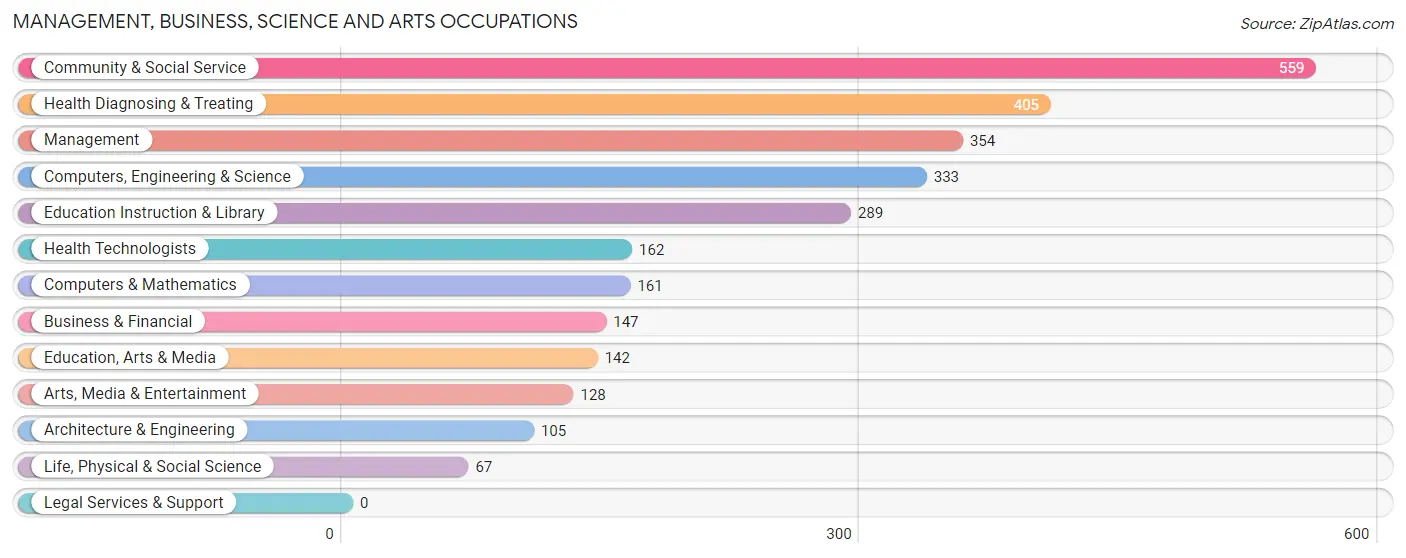
Management, Business, Science and Arts Occupations
The most common Management, Business, Science and Arts occupations in Milford are Community & Social Service (559 | 10.9%), Health Diagnosing & Treating (405 | 7.9%), Management (354 | 6.9%), Computers, Engineering & Science (333 | 6.5%), and Education Instruction & Library (289 | 5.7%).
Management, Business, Science and Arts Occupations by Sex
Within the Management, Business, Science and Arts occupations in Milford, the most male-oriented occupations are Architecture & Engineering (100.0%), Business & Financial (80.9%), and Arts, Media & Entertainment (74.2%), while the most female-oriented occupations are Health Technologists (93.2%), Life, Physical & Social Science (83.6%), and Education, Arts & Media (83.1%).
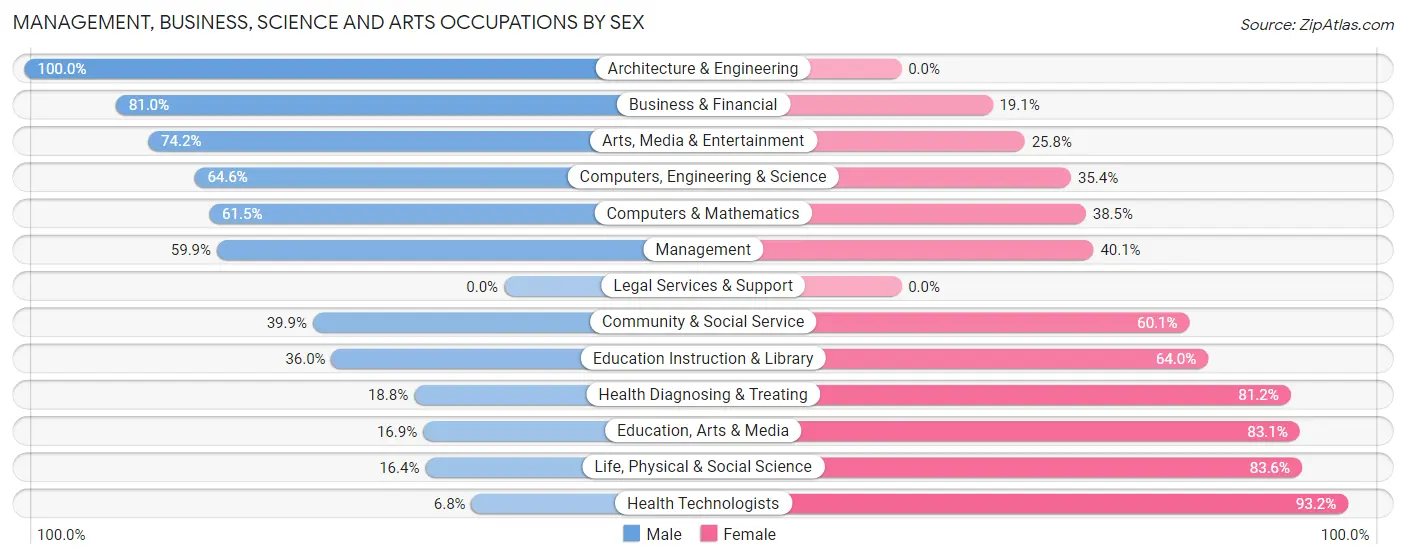
| Occupation | Male | Female |
| Management | 212 (59.9%) | 142 (40.1%) |
| Business & Financial | 119 (80.9%) | 28 (19.1%) |
| Computers, Engineering & Science | 215 (64.6%) | 118 (35.4%) |
| Computers & Mathematics | 99 (61.5%) | 62 (38.5%) |
| Architecture & Engineering | 105 (100.0%) | 0 (0.0%) |
| Life, Physical & Social Science | 11 (16.4%) | 56 (83.6%) |
| Community & Social Service | 223 (39.9%) | 336 (60.1%) |
| Education, Arts & Media | 24 (16.9%) | 118 (83.1%) |
| Legal Services & Support | 0 (0.0%) | 0 (0.0%) |
| Education Instruction & Library | 104 (36.0%) | 185 (64.0%) |
| Arts, Media & Entertainment | 95 (74.2%) | 33 (25.8%) |
| Health Diagnosing & Treating | 76 (18.8%) | 329 (81.2%) |
| Health Technologists | 11 (6.8%) | 151 (93.2%) |
| Total (Category) | 845 (47.0%) | 953 (53.0%) |
| Total (Overall) | 2,702 (52.9%) | 2,409 (47.1%) |
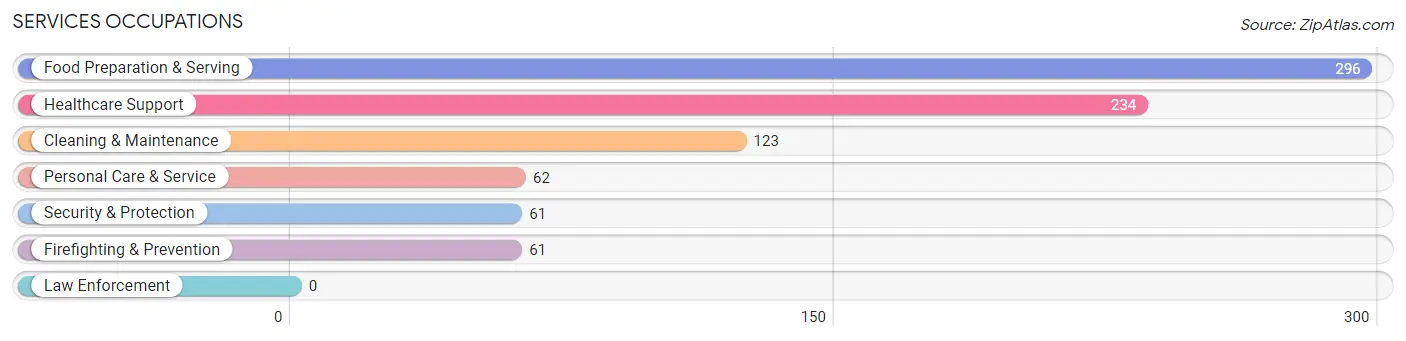
Services Occupations
The most common Services occupations in Milford are Food Preparation & Serving (296 | 5.8%), Healthcare Support (234 | 4.6%), Cleaning & Maintenance (123 | 2.4%), Personal Care & Service (62 | 1.2%), and Security & Protection (61 | 1.2%).
Services Occupations by Sex
Within the Services occupations in Milford, the most male-oriented occupations are Personal Care & Service (54.8%), Cleaning & Maintenance (52.8%), and Food Preparation & Serving (43.2%), while the most female-oriented occupations are Healthcare Support (94.9%), Security & Protection (57.4%), and Firefighting & Prevention (57.4%).
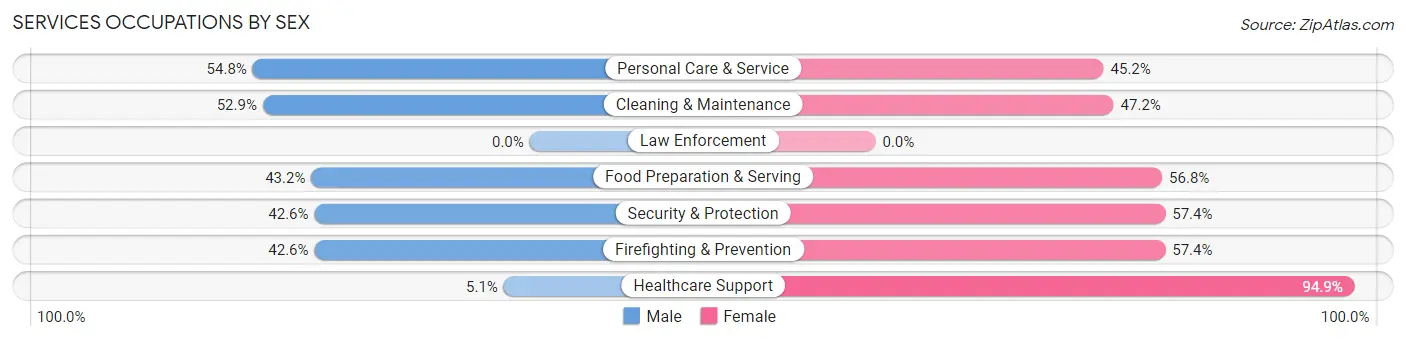
| Occupation | Male | Female |
| Healthcare Support | 12 (5.1%) | 222 (94.9%) |
| Security & Protection | 26 (42.6%) | 35 (57.4%) |
| Firefighting & Prevention | 26 (42.6%) | 35 (57.4%) |
| Law Enforcement | 0 (0.0%) | 0 (0.0%) |
| Food Preparation & Serving | 128 (43.2%) | 168 (56.8%) |
| Cleaning & Maintenance | 65 (52.8%) | 58 (47.1%) |
| Personal Care & Service | 34 (54.8%) | 28 (45.2%) |
| Total (Category) | 265 (34.2%) | 511 (65.8%) |
| Total (Overall) | 2,702 (52.9%) | 2,409 (47.1%) |
Sales and Office Occupations
The most common Sales and Office occupations in Milford are Office & Administration (557 | 10.9%), and Sales & Related (467 | 9.1%).
Sales and Office Occupations by Sex
| Occupation | Male | Female |
| Sales & Related | 264 (56.5%) | 203 (43.5%) |
| Office & Administration | 177 (31.8%) | 380 (68.2%) |
| Total (Category) | 441 (43.1%) | 583 (56.9%) |
| Total (Overall) | 2,702 (52.9%) | 2,409 (47.1%) |
Natural Resources, Construction and Maintenance Occupations
The most common Natural Resources, Construction and Maintenance occupations in Milford are Construction & Extraction (326 | 6.4%), Installation, Maintenance & Repair (227 | 4.4%), and Farming, Fishing & Forestry (19 | 0.4%).
Natural Resources, Construction and Maintenance Occupations by Sex
| Occupation | Male | Female |
| Farming, Fishing & Forestry | 19 (100.0%) | 0 (0.0%) |
| Construction & Extraction | 326 (100.0%) | 0 (0.0%) |
| Installation, Maintenance & Repair | 227 (100.0%) | 0 (0.0%) |
| Total (Category) | 572 (100.0%) | 0 (0.0%) |
| Total (Overall) | 2,702 (52.9%) | 2,409 (47.1%) |
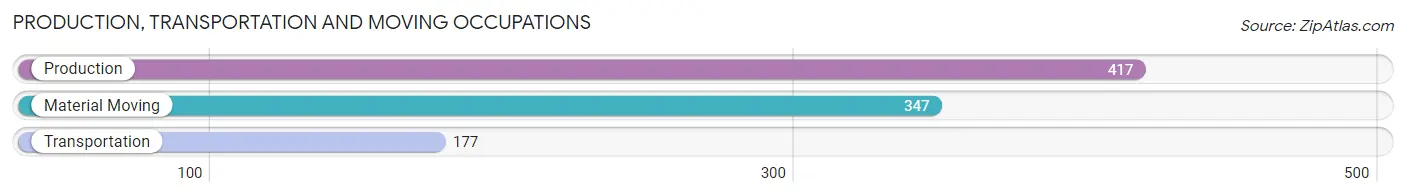
Production, Transportation and Moving Occupations
The most common Production, Transportation and Moving occupations in Milford are Production (417 | 8.2%), Material Moving (347 | 6.8%), and Transportation (177 | 3.5%).
Production, Transportation and Moving Occupations by Sex
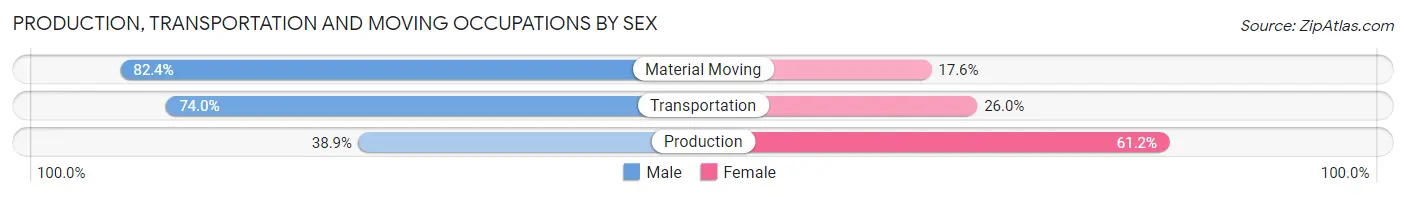
| Occupation | Male | Female |
| Production | 162 (38.9%) | 255 (61.2%) |
| Transportation | 131 (74.0%) | 46 (26.0%) |
| Material Moving | 286 (82.4%) | 61 (17.6%) |
| Total (Category) | 579 (61.5%) | 362 (38.5%) |
| Total (Overall) | 2,702 (52.9%) | 2,409 (47.1%) |
Employment Industries by Sex in Milford
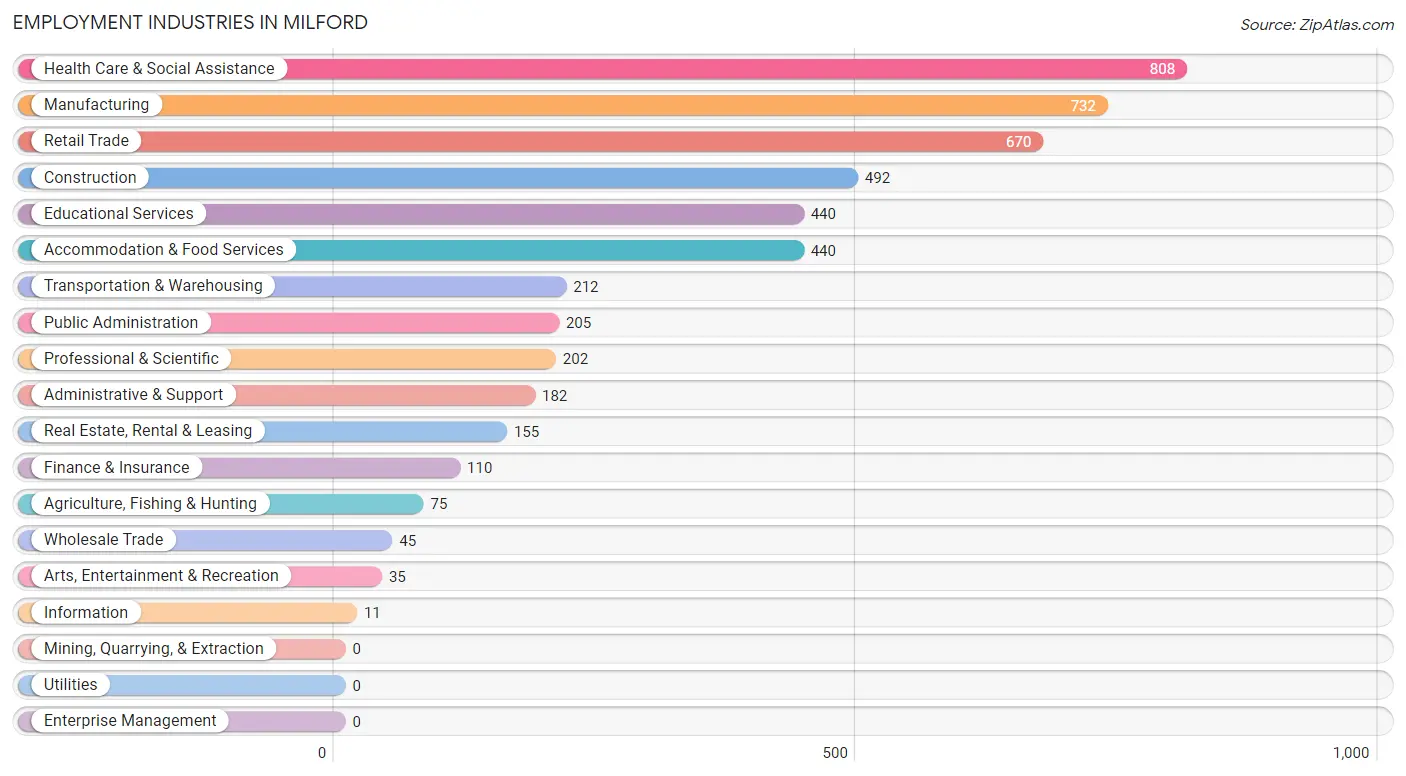
Employment Industries in Milford
The major employment industries in Milford include Health Care & Social Assistance (808 | 15.8%), Manufacturing (732 | 14.3%), Retail Trade (670 | 13.1%), Construction (492 | 9.6%), and Educational Services (440 | 8.6%).
Employment Industries by Sex in Milford
The Milford industries that see more men than women are Agriculture, Fishing & Hunting (100.0%), Wholesale Trade (100.0%), and Arts, Entertainment & Recreation (100.0%), whereas the industries that tend to have a higher number of women are Information (100.0%), Health Care & Social Assistance (86.3%), and Administrative & Support (74.7%).
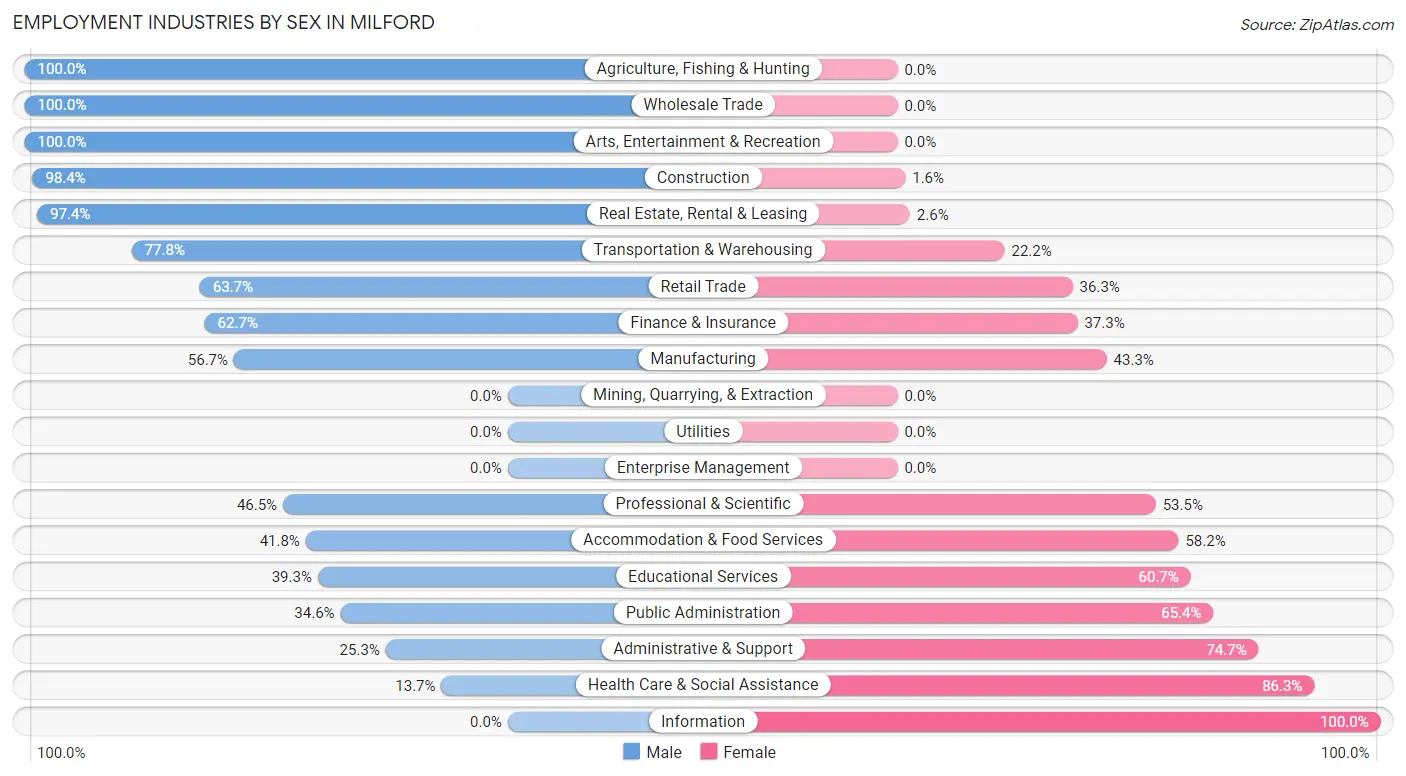
| Industry | Male | Female |
| Agriculture, Fishing & Hunting | 75 (100.0%) | 0 (0.0%) |
| Mining, Quarrying, & Extraction | 0 (0.0%) | 0 (0.0%) |
| Construction | 484 (98.4%) | 8 (1.6%) |
| Manufacturing | 415 (56.7%) | 317 (43.3%) |
| Wholesale Trade | 45 (100.0%) | 0 (0.0%) |
| Retail Trade | 427 (63.7%) | 243 (36.3%) |
| Transportation & Warehousing | 165 (77.8%) | 47 (22.2%) |
| Utilities | 0 (0.0%) | 0 (0.0%) |
| Information | 0 (0.0%) | 11 (100.0%) |
| Finance & Insurance | 69 (62.7%) | 41 (37.3%) |
| Real Estate, Rental & Leasing | 151 (97.4%) | 4 (2.6%) |
| Professional & Scientific | 94 (46.5%) | 108 (53.5%) |
| Enterprise Management | 0 (0.0%) | 0 (0.0%) |
| Administrative & Support | 46 (25.3%) | 136 (74.7%) |
| Educational Services | 173 (39.3%) | 267 (60.7%) |
| Health Care & Social Assistance | 111 (13.7%) | 697 (86.3%) |
| Arts, Entertainment & Recreation | 35 (100.0%) | 0 (0.0%) |
| Accommodation & Food Services | 184 (41.8%) | 256 (58.2%) |
| Public Administration | 71 (34.6%) | 134 (65.4%) |
| Total | 2,702 (52.9%) | 2,409 (47.1%) |
Education in Milford
School Enrollment in Milford
The most common levels of schooling among the 1,977 students in Milford are high school (591 | 29.9%), middle school (368 | 18.6%), and elementary school (359 | 18.2%).
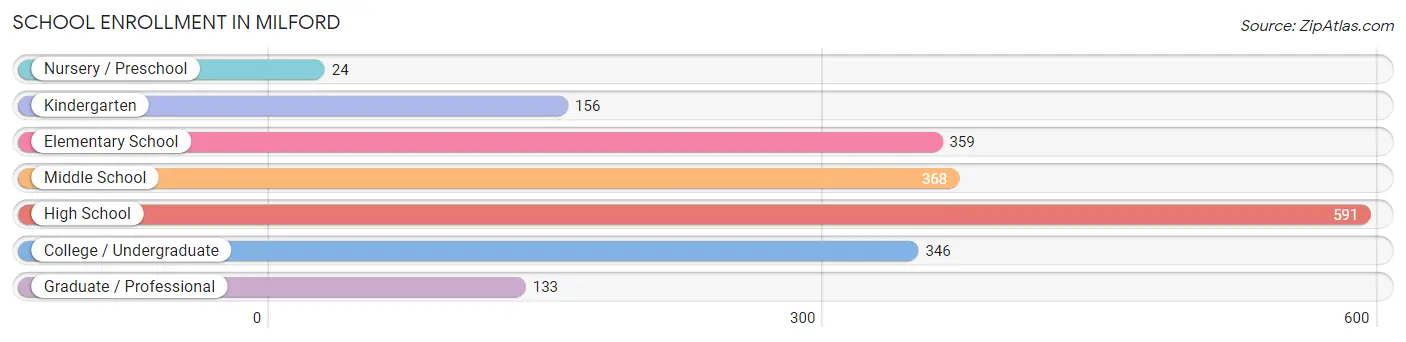
| School Level | # Students | % Students |
| Nursery / Preschool | 24 | 1.2% |
| Kindergarten | 156 | 7.9% |
| Elementary School | 359 | 18.2% |
| Middle School | 368 | 18.6% |
| High School | 591 | 29.9% |
| College / Undergraduate | 346 | 17.5% |
| Graduate / Professional | 133 | 6.7% |
| Total | 1,977 | 100.0% |
School Enrollment by Age by Funding Source in Milford
Out of a total of 1,977 students who are enrolled in schools in Milford, 119 (6.0%) attend a private institution, while the remaining 1,858 (94.0%) are enrolled in public schools. The age group of 20 to 24 year olds has the highest likelihood of being enrolled in private schools, with 22 (22.0% in the age bracket) enrolled. Conversely, the age group of 3 to 4 year olds has the lowest likelihood of being enrolled in a private school, with 24 (100.0% in the age bracket) attending a public institution.
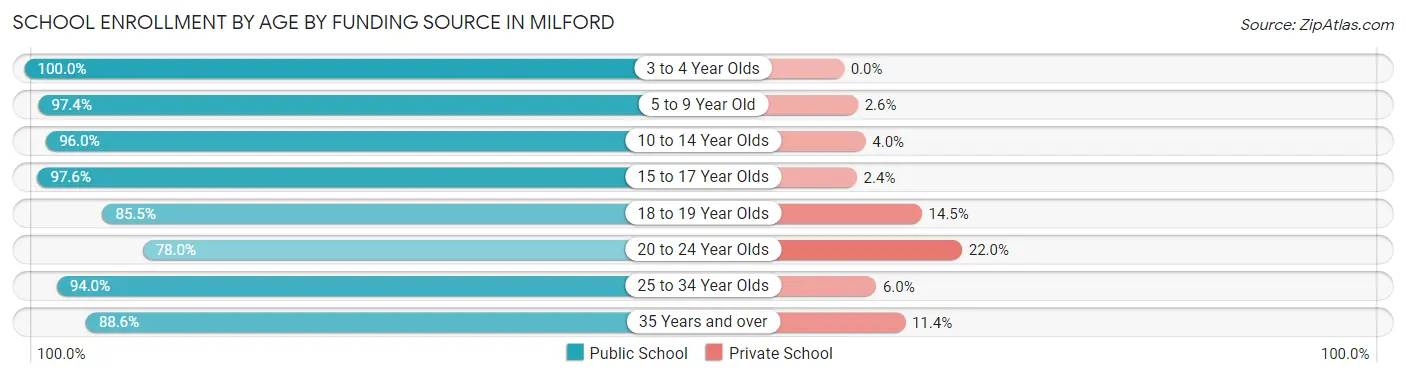
| Age Bracket | Public School | Private School |
| 3 to 4 Year Olds | 24 (100.0%) | 0 (0.0%) |
| 5 to 9 Year Old | 485 (97.4%) | 13 (2.6%) |
| 10 to 14 Year Olds | 428 (96.0%) | 18 (4.0%) |
| 15 to 17 Year Olds | 403 (97.6%) | 10 (2.4%) |
| 18 to 19 Year Olds | 106 (85.5%) | 18 (14.5%) |
| 20 to 24 Year Olds | 78 (78.0%) | 22 (22.0%) |
| 25 to 34 Year Olds | 78 (94.0%) | 5 (6.0%) |
| 35 Years and over | 256 (88.6%) | 33 (11.4%) |
| Total | 1,858 (94.0%) | 119 (6.0%) |
Educational Attainment by Field of Study in Milford
Business (763 | 29.3%), education (366 | 14.1%), science & technology (327 | 12.6%), liberal arts & history (221 | 8.5%), and arts & humanities (180 | 6.9%) are the most common fields of study among 2,602 individuals in Milford who have obtained a bachelor's degree or higher.
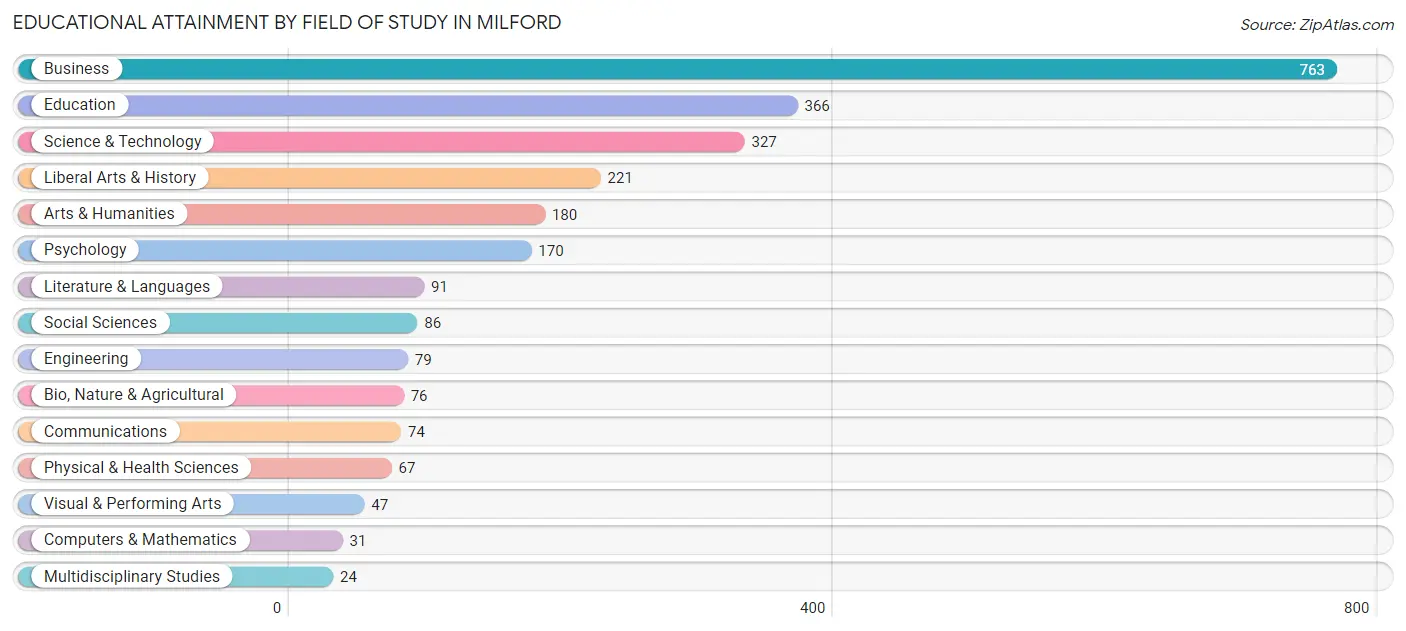
| Field of Study | # Graduates | % Graduates |
| Computers & Mathematics | 31 | 1.2% |
| Bio, Nature & Agricultural | 76 | 2.9% |
| Physical & Health Sciences | 67 | 2.6% |
| Psychology | 170 | 6.5% |
| Social Sciences | 86 | 3.3% |
| Engineering | 79 | 3.0% |
| Multidisciplinary Studies | 24 | 0.9% |
| Science & Technology | 327 | 12.6% |
| Business | 763 | 29.3% |
| Education | 366 | 14.1% |
| Literature & Languages | 91 | 3.5% |
| Liberal Arts & History | 221 | 8.5% |
| Visual & Performing Arts | 47 | 1.8% |
| Communications | 74 | 2.8% |
| Arts & Humanities | 180 | 6.9% |
| Total | 2,602 | 100.0% |
Transportation & Commute in Milford
Vehicle Availability by Sex in Milford
The most prevalent vehicle ownership categories in Milford are males with 2 vehicles (883, accounting for 32.5%) and females with 2 vehicles (999, making up 36.7%).
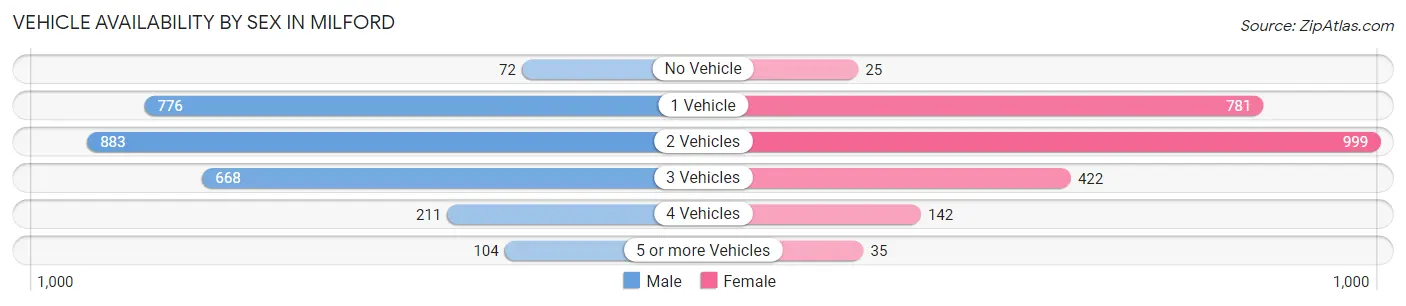
| Vehicles Available | Male | Female |
| No Vehicle | 72 (2.6%) | 25 (1.0%) |
| 1 Vehicle | 776 (28.6%) | 781 (32.5%) |
| 2 Vehicles | 883 (32.5%) | 999 (41.6%) |
| 3 Vehicles | 668 (24.6%) | 422 (17.5%) |
| 4 Vehicles | 211 (7.8%) | 142 (5.9%) |
| 5 or more Vehicles | 104 (3.8%) | 35 (1.5%) |
| Total | 2,714 (100.0%) | 2,404 (100.0%) |
Commute Time in Milford
The most frequently occuring commute durations in Milford are 30 to 34 minutes (924 commuters, 20.3%), 10 to 14 minutes (899 commuters, 19.7%), and 5 to 9 minutes (574 commuters, 12.6%).
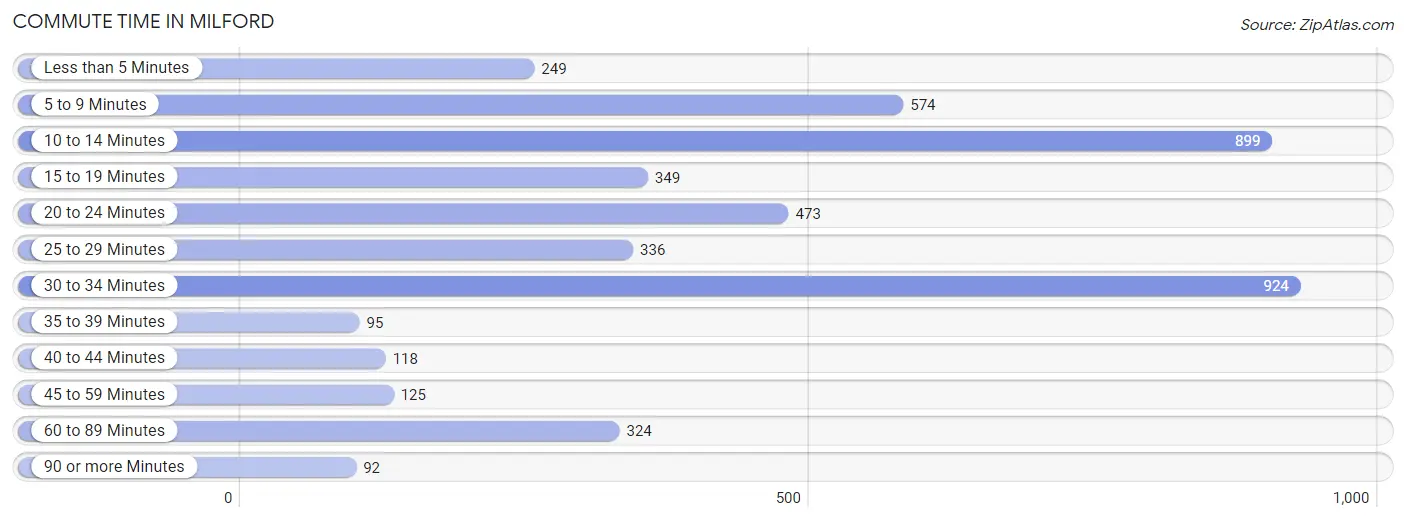
| Commute Time | # Commuters | % Commuters |
| Less than 5 Minutes | 249 | 5.5% |
| 5 to 9 Minutes | 574 | 12.6% |
| 10 to 14 Minutes | 899 | 19.7% |
| 15 to 19 Minutes | 349 | 7.7% |
| 20 to 24 Minutes | 473 | 10.4% |
| 25 to 29 Minutes | 336 | 7.4% |
| 30 to 34 Minutes | 924 | 20.3% |
| 35 to 39 Minutes | 95 | 2.1% |
| 40 to 44 Minutes | 118 | 2.6% |
| 45 to 59 Minutes | 125 | 2.7% |
| 60 to 89 Minutes | 324 | 7.1% |
| 90 or more Minutes | 92 | 2.0% |
Commute Time by Sex in Milford
The most common commute times in Milford are 10 to 14 minutes (636 commuters, 26.5%) for males and 30 to 34 minutes (545 commuters, 25.3%) for females.
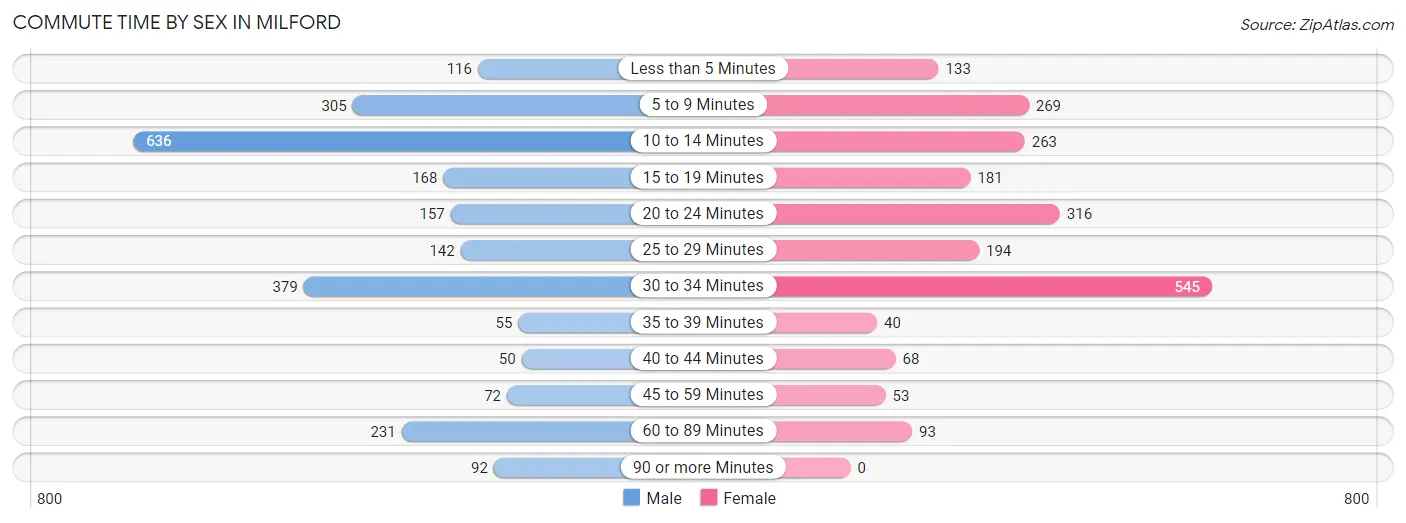
| Commute Time | Male | Female |
| Less than 5 Minutes | 116 (4.8%) | 133 (6.2%) |
| 5 to 9 Minutes | 305 (12.7%) | 269 (12.5%) |
| 10 to 14 Minutes | 636 (26.5%) | 263 (12.2%) |
| 15 to 19 Minutes | 168 (7.0%) | 181 (8.4%) |
| 20 to 24 Minutes | 157 (6.5%) | 316 (14.7%) |
| 25 to 29 Minutes | 142 (5.9%) | 194 (9.0%) |
| 30 to 34 Minutes | 379 (15.8%) | 545 (25.3%) |
| 35 to 39 Minutes | 55 (2.3%) | 40 (1.9%) |
| 40 to 44 Minutes | 50 (2.1%) | 68 (3.2%) |
| 45 to 59 Minutes | 72 (3.0%) | 53 (2.5%) |
| 60 to 89 Minutes | 231 (9.6%) | 93 (4.3%) |
| 90 or more Minutes | 92 (3.8%) | 0 (0.0%) |
Time of Departure to Work by Sex in Milford
The most frequent times of departure to work in Milford are 12:00 AM to 4:59 AM (347, 14.4%) for males and 7:00 AM to 7:29 AM (721, 33.5%) for females.
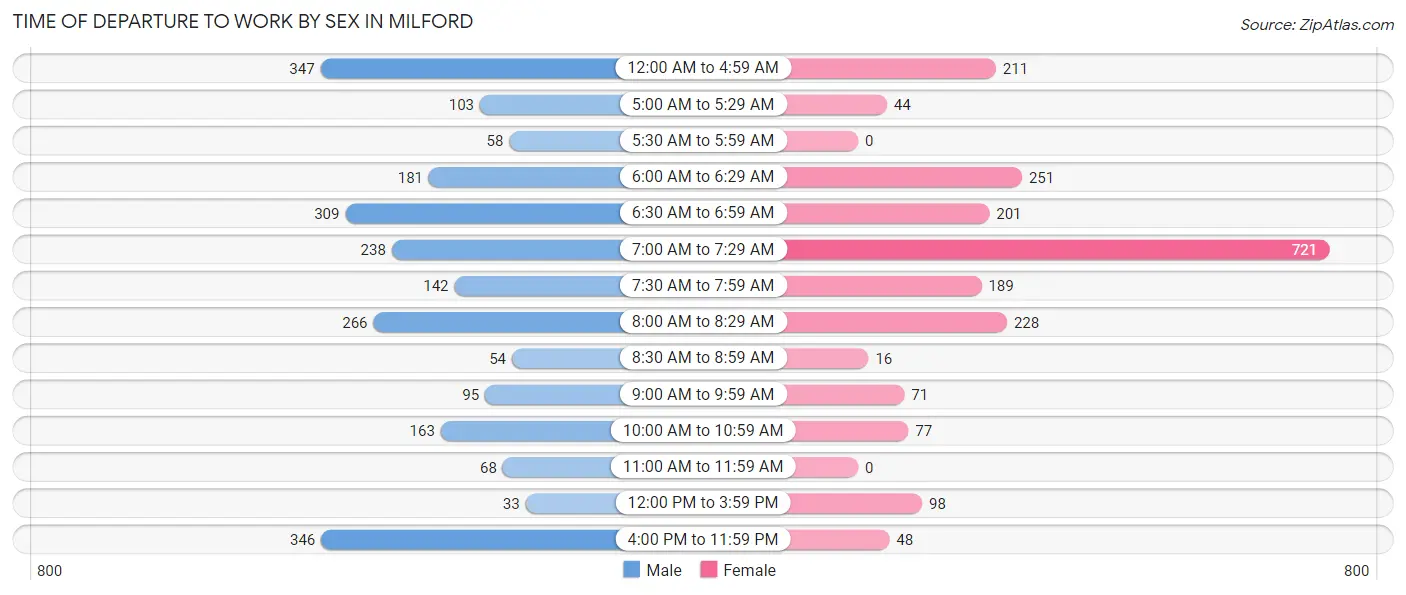
| Time of Departure | Male | Female |
| 12:00 AM to 4:59 AM | 347 (14.4%) | 211 (9.8%) |
| 5:00 AM to 5:29 AM | 103 (4.3%) | 44 (2.0%) |
| 5:30 AM to 5:59 AM | 58 (2.4%) | 0 (0.0%) |
| 6:00 AM to 6:29 AM | 181 (7.5%) | 251 (11.7%) |
| 6:30 AM to 6:59 AM | 309 (12.9%) | 201 (9.3%) |
| 7:00 AM to 7:29 AM | 238 (9.9%) | 721 (33.5%) |
| 7:30 AM to 7:59 AM | 142 (5.9%) | 189 (8.8%) |
| 8:00 AM to 8:29 AM | 266 (11.1%) | 228 (10.6%) |
| 8:30 AM to 8:59 AM | 54 (2.2%) | 16 (0.7%) |
| 9:00 AM to 9:59 AM | 95 (4.0%) | 71 (3.3%) |
| 10:00 AM to 10:59 AM | 163 (6.8%) | 77 (3.6%) |
| 11:00 AM to 11:59 AM | 68 (2.8%) | 0 (0.0%) |
| 12:00 PM to 3:59 PM | 33 (1.4%) | 98 (4.5%) |
| 4:00 PM to 11:59 PM | 346 (14.4%) | 48 (2.2%) |
| Total | 2,403 (100.0%) | 2,155 (100.0%) |
Housing Occupancy in Milford
Occupancy by Ownership in Milford
Of the total 5,034 dwellings in Milford, owner-occupied units account for 2,515 (50.0%), while renter-occupied units make up 2,519 (50.0%).
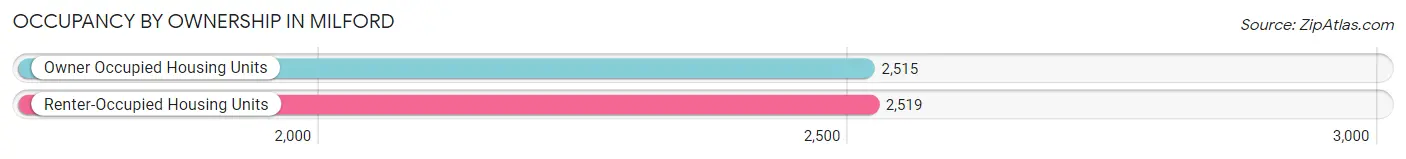
| Occupancy | # Housing Units | % Housing Units |
| Owner Occupied Housing Units | 2,515 | 50.0% |
| Renter-Occupied Housing Units | 2,519 | 50.0% |
| Total Occupied Housing Units | 5,034 | 100.0% |
Occupancy by Household Size in Milford
| Household Size | # Housing Units | % Housing Units |
| 1-Person Household | 2,136 | 42.4% |
| 2-Person Household | 1,516 | 30.1% |
| 3-Person Household | 553 | 11.0% |
| 4+ Person Household | 829 | 16.5% |
| Total Housing Units | 5,034 | 100.0% |
Occupancy by Ownership by Household Size in Milford
| Household Size | Owner-occupied | Renter-occupied |
| 1-Person Household | 859 (40.2%) | 1,277 (59.8%) |
| 2-Person Household | 954 (62.9%) | 562 (37.1%) |
| 3-Person Household | 385 (69.6%) | 168 (30.4%) |
| 4+ Person Household | 317 (38.2%) | 512 (61.8%) |
| Total Housing Units | 2,515 (50.0%) | 2,519 (50.0%) |
Occupancy by Educational Attainment in Milford
| Household Size | Owner-occupied | Renter-occupied |
| Less than High School | 87 (17.5%) | 411 (82.5%) |
| High School Diploma | 728 (51.1%) | 696 (48.9%) |
| College/Associate Degree | 625 (42.7%) | 839 (57.3%) |
| Bachelor's Degree or higher | 1,075 (65.2%) | 573 (34.8%) |
Occupancy by Age of Householder in Milford
| Age Bracket | # Households | % Households |
| Under 35 Years | 849 | 16.9% |
| 35 to 44 Years | 644 | 12.8% |
| 45 to 54 Years | 825 | 16.4% |
| 55 to 64 Years | 937 | 18.6% |
| 65 to 74 Years | 1,295 | 25.7% |
| 75 to 84 Years | 310 | 6.2% |
| 85 Years and Over | 174 | 3.5% |
| Total | 5,034 | 100.0% |
Housing Finances in Milford
Median Income by Occupancy in Milford
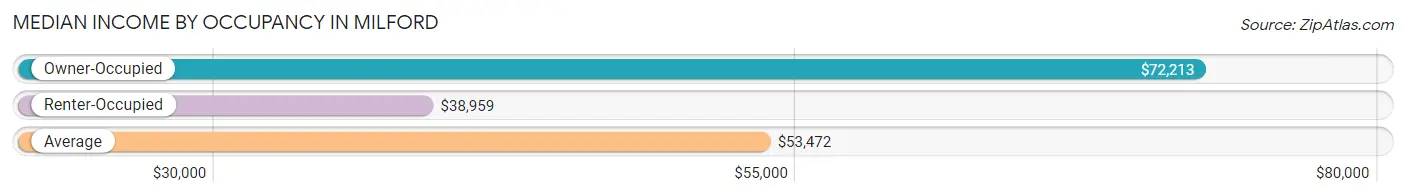
| Occupancy Type | # Households | Median Income |
| Owner-Occupied | 2,515 (50.0%) | $72,213 |
| Renter-Occupied | 2,519 (50.0%) | $38,959 |
| Average | 5,034 (100.0%) | $53,472 |
Occupancy by Householder Income Bracket in Milford
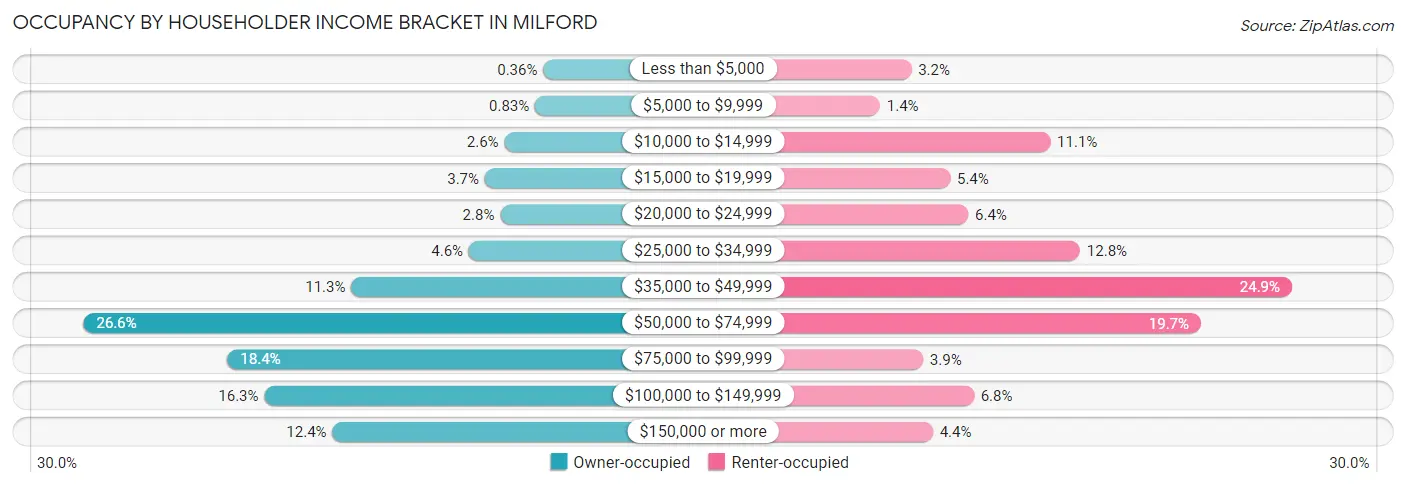
| Income Bracket | Owner-occupied | Renter-occupied |
| Less than $5,000 | 9 (0.4%) | 80 (3.2%) |
| $5,000 to $9,999 | 21 (0.8%) | 35 (1.4%) |
| $10,000 to $14,999 | 65 (2.6%) | 280 (11.1%) |
| $15,000 to $19,999 | 93 (3.7%) | 136 (5.4%) |
| $20,000 to $24,999 | 71 (2.8%) | 162 (6.4%) |
| $25,000 to $34,999 | 116 (4.6%) | 323 (12.8%) |
| $35,000 to $49,999 | 285 (11.3%) | 628 (24.9%) |
| $50,000 to $74,999 | 670 (26.6%) | 497 (19.7%) |
| $75,000 to $99,999 | 463 (18.4%) | 97 (3.8%) |
| $100,000 to $149,999 | 410 (16.3%) | 170 (6.8%) |
| $150,000 or more | 312 (12.4%) | 111 (4.4%) |
| Total | 2,515 (100.0%) | 2,519 (100.0%) |
Monthly Housing Cost Tiers in Milford
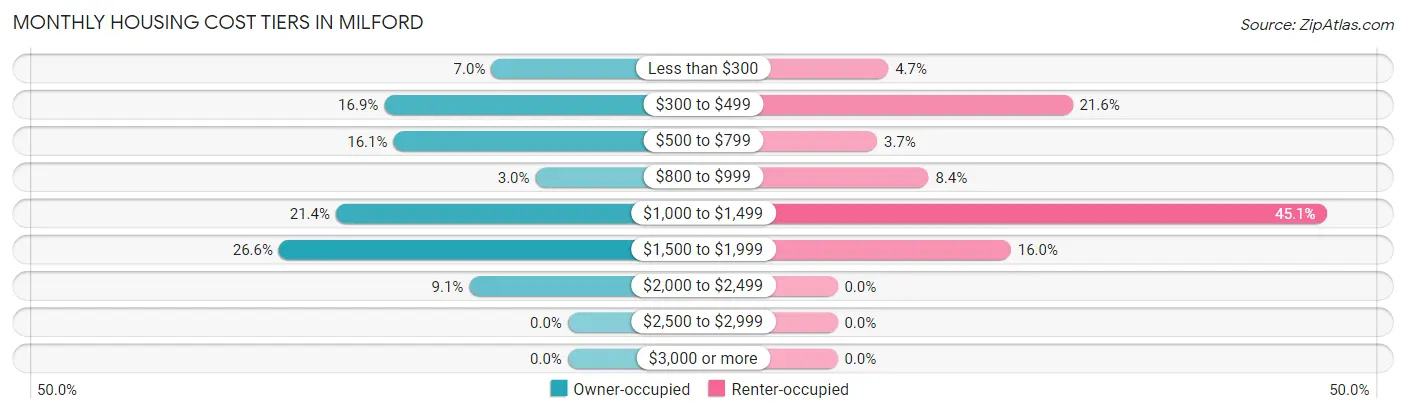
| Monthly Cost | Owner-occupied | Renter-occupied |
| Less than $300 | 177 (7.0%) | 118 (4.7%) |
| $300 to $499 | 425 (16.9%) | 545 (21.6%) |
| $500 to $799 | 404 (16.1%) | 92 (3.6%) |
| $800 to $999 | 75 (3.0%) | 211 (8.4%) |
| $1,000 to $1,499 | 537 (21.3%) | 1,136 (45.1%) |
| $1,500 to $1,999 | 669 (26.6%) | 402 (16.0%) |
| $2,000 to $2,499 | 228 (9.1%) | 0 (0.0%) |
| $2,500 to $2,999 | 0 (0.0%) | 0 (0.0%) |
| $3,000 or more | 0 (0.0%) | 0 (0.0%) |
| Total | 2,515 (100.0%) | 2,519 (100.0%) |
Physical Housing Characteristics in Milford
Housing Structures in Milford
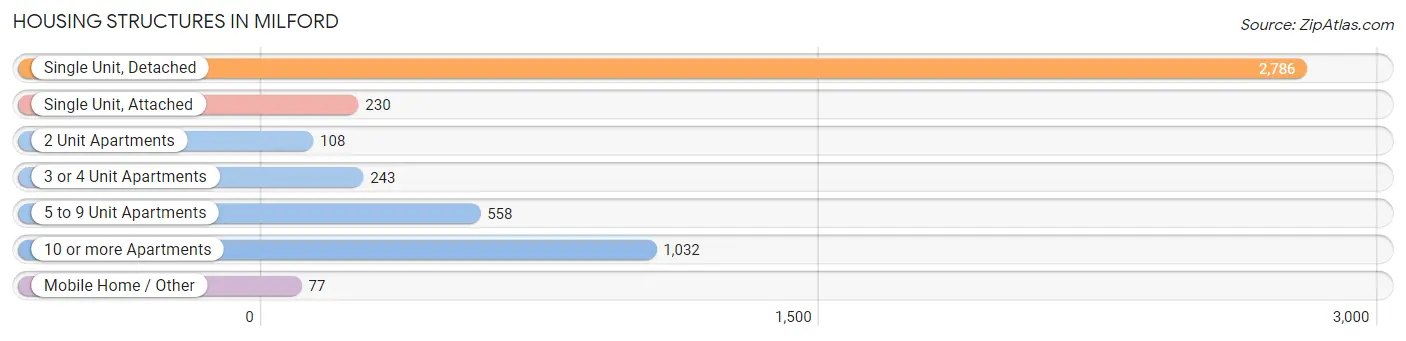
| Structure Type | # Housing Units | % Housing Units |
| Single Unit, Detached | 2,786 | 55.3% |
| Single Unit, Attached | 230 | 4.6% |
| 2 Unit Apartments | 108 | 2.1% |
| 3 or 4 Unit Apartments | 243 | 4.8% |
| 5 to 9 Unit Apartments | 558 | 11.1% |
| 10 or more Apartments | 1,032 | 20.5% |
| Mobile Home / Other | 77 | 1.5% |
| Total | 5,034 | 100.0% |
Housing Structures by Occupancy in Milford
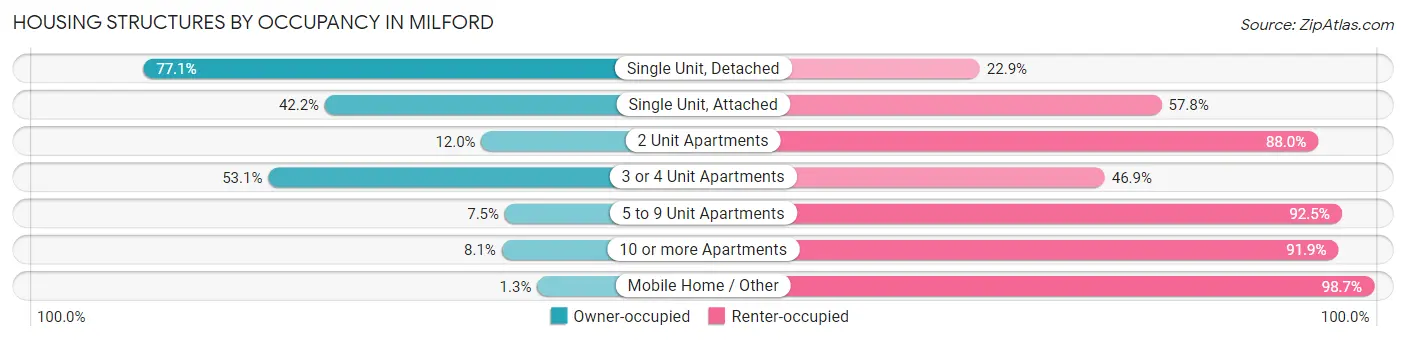
| Structure Type | Owner-occupied | Renter-occupied |
| Single Unit, Detached | 2,149 (77.1%) | 637 (22.9%) |
| Single Unit, Attached | 97 (42.2%) | 133 (57.8%) |
| 2 Unit Apartments | 13 (12.0%) | 95 (88.0%) |
| 3 or 4 Unit Apartments | 129 (53.1%) | 114 (46.9%) |
| 5 to 9 Unit Apartments | 42 (7.5%) | 516 (92.5%) |
| 10 or more Apartments | 84 (8.1%) | 948 (91.9%) |
| Mobile Home / Other | 1 (1.3%) | 76 (98.7%) |
| Total | 2,515 (50.0%) | 2,519 (50.0%) |
Housing Structures by Number of Rooms in Milford
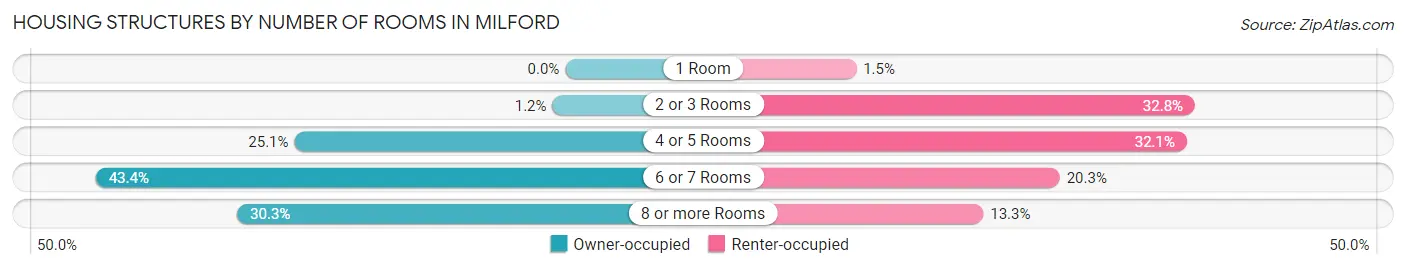
| Number of Rooms | Owner-occupied | Renter-occupied |
| 1 Room | 0 (0.0%) | 38 (1.5%) |
| 2 or 3 Rooms | 30 (1.2%) | 827 (32.8%) |
| 4 or 5 Rooms | 630 (25.1%) | 808 (32.1%) |
| 6 or 7 Rooms | 1,092 (43.4%) | 512 (20.3%) |
| 8 or more Rooms | 763 (30.3%) | 334 (13.3%) |
| Total | 2,515 (100.0%) | 2,519 (100.0%) |
Housing Structure by Heating Type in Milford
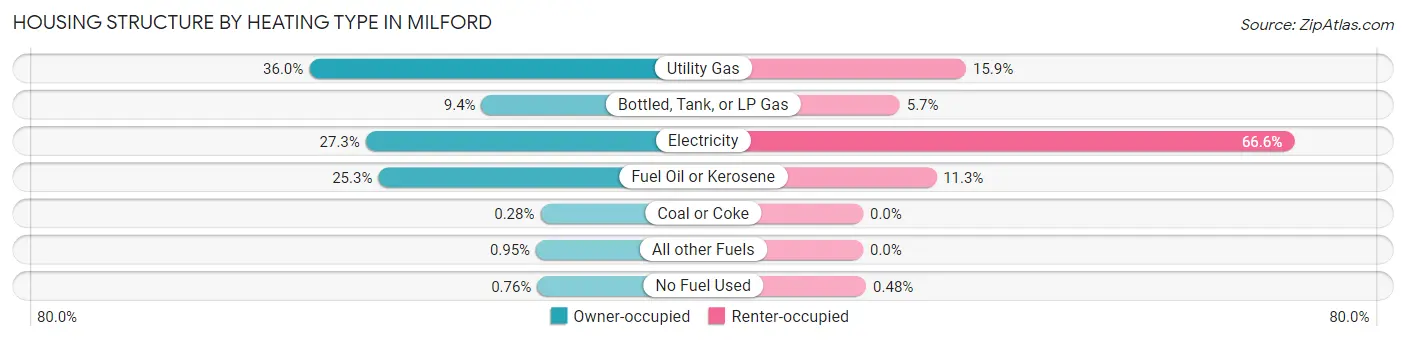
| Heating Type | Owner-occupied | Renter-occupied |
| Utility Gas | 906 (36.0%) | 401 (15.9%) |
| Bottled, Tank, or LP Gas | 236 (9.4%) | 143 (5.7%) |
| Electricity | 686 (27.3%) | 1,678 (66.6%) |
| Fuel Oil or Kerosene | 637 (25.3%) | 285 (11.3%) |
| Coal or Coke | 7 (0.3%) | 0 (0.0%) |
| All other Fuels | 24 (0.9%) | 0 (0.0%) |
| No Fuel Used | 19 (0.8%) | 12 (0.5%) |
| Total | 2,515 (100.0%) | 2,519 (100.0%) |
Household Vehicle Usage in Milford
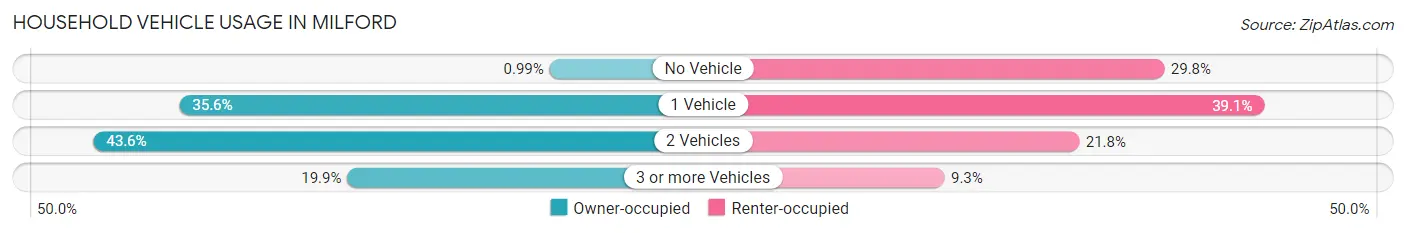
| Vehicles per Household | Owner-occupied | Renter-occupied |
| No Vehicle | 25 (1.0%) | 750 (29.8%) |
| 1 Vehicle | 894 (35.5%) | 986 (39.1%) |
| 2 Vehicles | 1,096 (43.6%) | 550 (21.8%) |
| 3 or more Vehicles | 500 (19.9%) | 233 (9.2%) |
| Total | 2,515 (100.0%) | 2,519 (100.0%) |
Real Estate & Mortgages in Milford
Real Estate and Mortgage Overview in Milford
| Characteristic | Without Mortgage | With Mortgage |
| Housing Units | 1,068 | 1,447 |
| Median Property Value | $219,200 | $275,500 |
| Median Household Income | $58,198 | $211 |
| Monthly Housing Costs | $473 | $0 |
| Real Estate Taxes | $1,502 | $38 |
Property Value by Mortgage Status in Milford
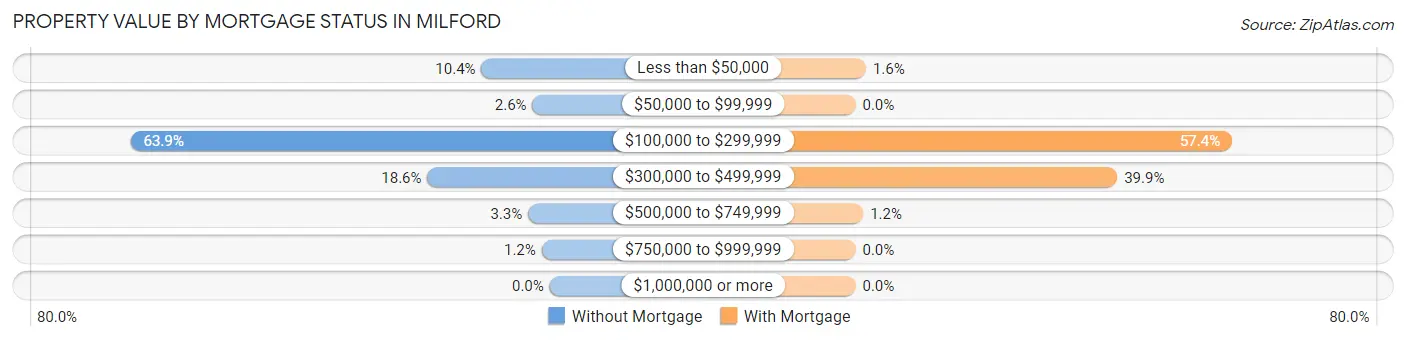
| Property Value | Without Mortgage | With Mortgage |
| Less than $50,000 | 111 (10.4%) | 23 (1.6%) |
| $50,000 to $99,999 | 28 (2.6%) | 0 (0.0%) |
| $100,000 to $299,999 | 682 (63.9%) | 830 (57.4%) |
| $300,000 to $499,999 | 199 (18.6%) | 577 (39.9%) |
| $500,000 to $749,999 | 35 (3.3%) | 17 (1.2%) |
| $750,000 to $999,999 | 13 (1.2%) | 0 (0.0%) |
| $1,000,000 or more | 0 (0.0%) | 0 (0.0%) |
| Total | 1,068 (100.0%) | 1,447 (100.0%) |
Household Income by Mortgage Status in Milford
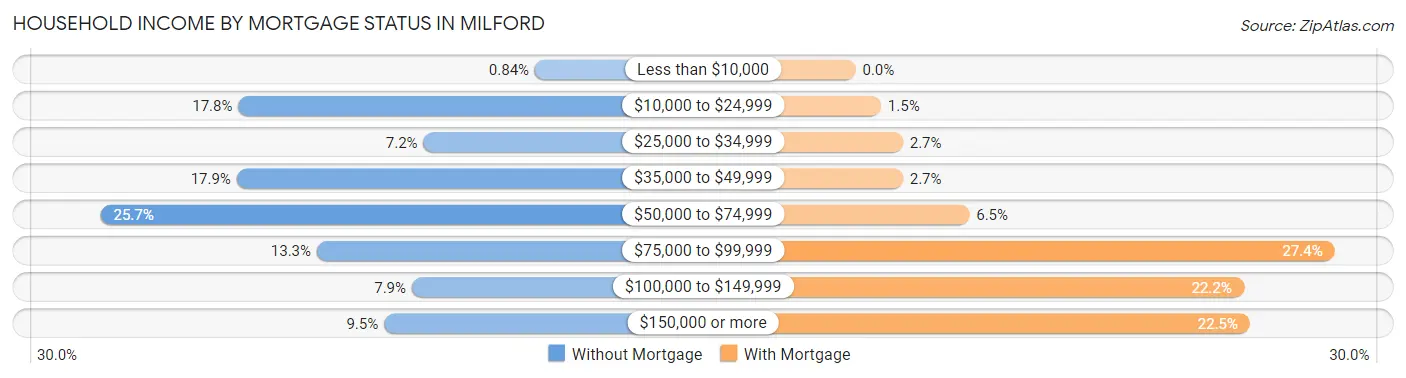
| Household Income | Without Mortgage | With Mortgage |
| Less than $10,000 | 9 (0.8%) | 0 (0.0%) |
| $10,000 to $24,999 | 190 (17.8%) | 21 (1.5%) |
| $25,000 to $34,999 | 77 (7.2%) | 39 (2.7%) |
| $35,000 to $49,999 | 191 (17.9%) | 39 (2.7%) |
| $50,000 to $74,999 | 274 (25.7%) | 94 (6.5%) |
| $75,000 to $99,999 | 142 (13.3%) | 396 (27.4%) |
| $100,000 to $149,999 | 84 (7.9%) | 321 (22.2%) |
| $150,000 or more | 101 (9.5%) | 326 (22.5%) |
| Total | 1,068 (100.0%) | 1,447 (100.0%) |
Property Value to Household Income Ratio in Milford
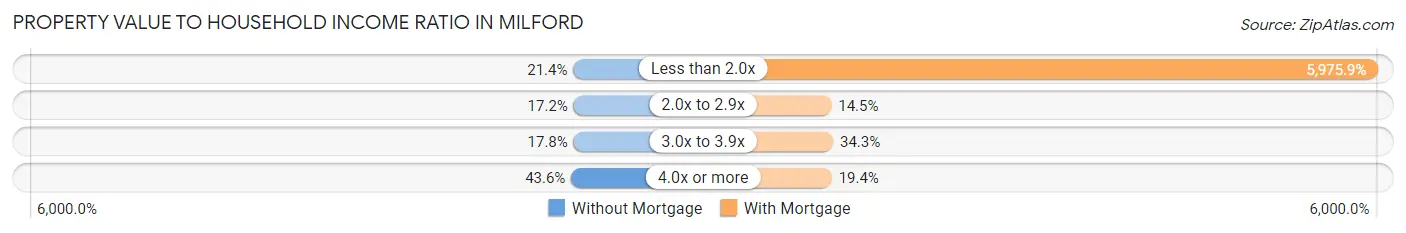
| Value-to-Income Ratio | Without Mortgage | With Mortgage |
| Less than 2.0x | 228 (21.3%) | 86,471 (5,975.9%) |
| 2.0x to 2.9x | 184 (17.2%) | 210 (14.5%) |
| 3.0x to 3.9x | 190 (17.8%) | 496 (34.3%) |
| 4.0x or more | 466 (43.6%) | 281 (19.4%) |
| Total | 1,068 (100.0%) | 1,447 (100.0%) |
Real Estate Taxes by Mortgage Status in Milford
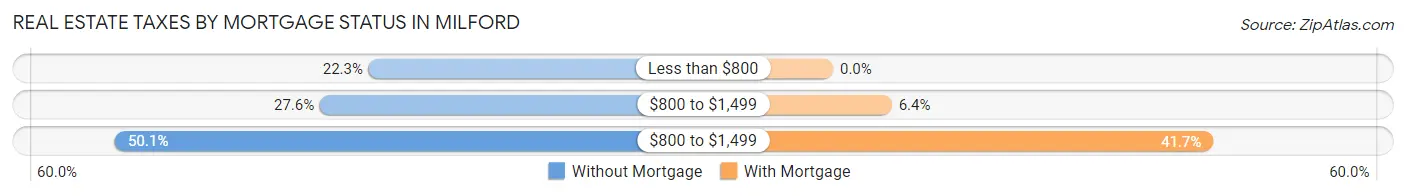
| Property Taxes | Without Mortgage | With Mortgage |
| Less than $800 | 238 (22.3%) | 0 (0.0%) |
| $800 to $1,499 | 295 (27.6%) | 93 (6.4%) |
| $800 to $1,499 | 535 (50.1%) | 603 (41.7%) |
| Total | 1,068 (100.0%) | 1,447 (100.0%) |
Health & Disability in Milford
Health Insurance Coverage by Age in Milford
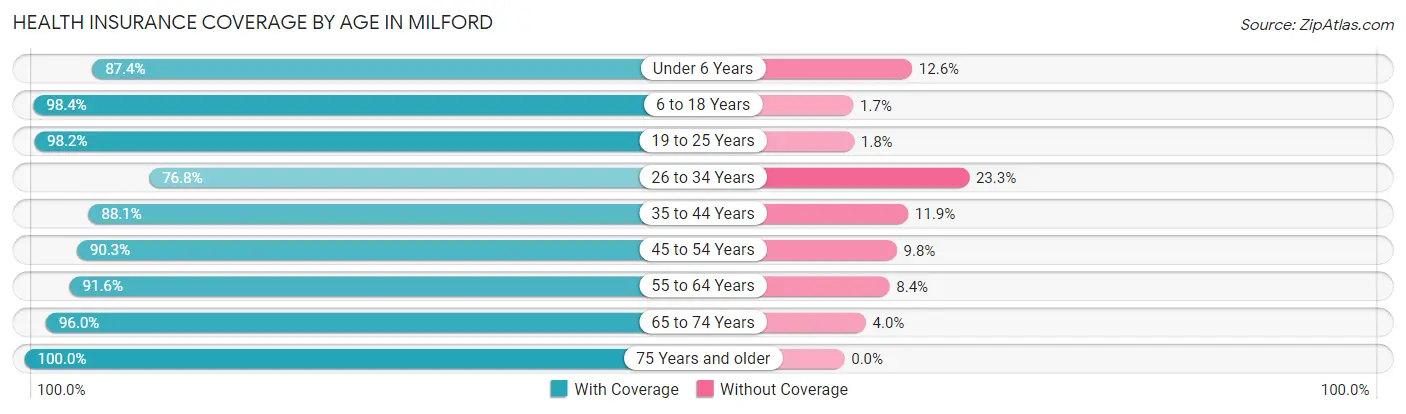
| Age Bracket | With Coverage | Without Coverage |
| Under 6 Years | 915 (87.4%) | 132 (12.6%) |
| 6 to 18 Years | 1,611 (98.4%) | 27 (1.7%) |
| 19 to 25 Years | 498 (98.2%) | 9 (1.8%) |
| 26 to 34 Years | 1,238 (76.7%) | 375 (23.3%) |
| 35 to 44 Years | 948 (88.1%) | 128 (11.9%) |
| 45 to 54 Years | 1,064 (90.2%) | 115 (9.8%) |
| 55 to 64 Years | 1,582 (91.6%) | 145 (8.4%) |
| 65 to 74 Years | 1,739 (96.0%) | 72 (4.0%) |
| 75 Years and older | 773 (100.0%) | 0 (0.0%) |
| Total | 10,368 (91.2%) | 1,003 (8.8%) |
Health Insurance Coverage by Citizenship Status in Milford
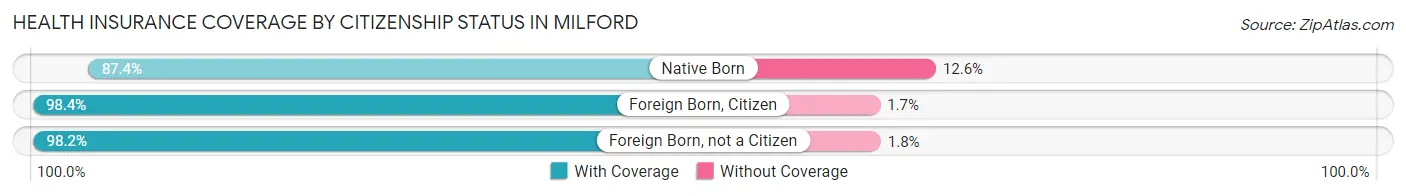
| Citizenship Status | With Coverage | Without Coverage |
| Native Born | 915 (87.4%) | 132 (12.6%) |
| Foreign Born, Citizen | 1,611 (98.4%) | 27 (1.7%) |
| Foreign Born, not a Citizen | 498 (98.2%) | 9 (1.8%) |
Health Insurance Coverage by Household Income in Milford
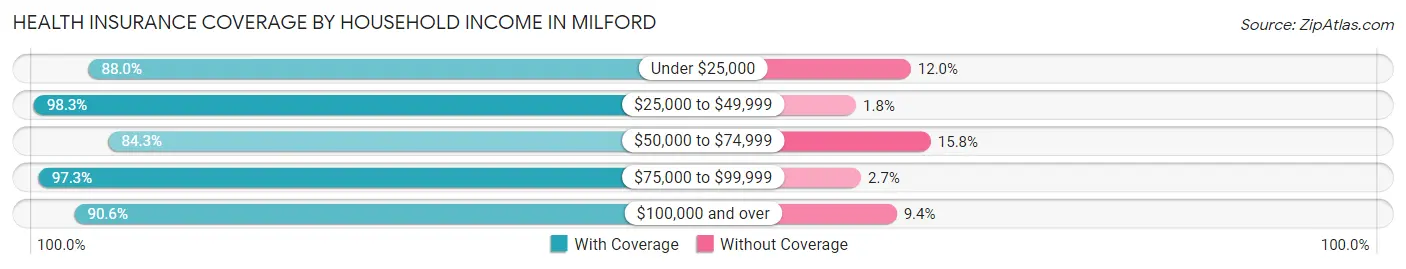
| Household Income | With Coverage | Without Coverage |
| Under $25,000 | 1,225 (88.0%) | 167 (12.0%) |
| $25,000 to $49,999 | 2,470 (98.3%) | 44 (1.8%) |
| $50,000 to $74,999 | 2,278 (84.3%) | 426 (15.8%) |
| $75,000 to $99,999 | 1,164 (97.3%) | 32 (2.7%) |
| $100,000 and over | 3,224 (90.6%) | 333 (9.4%) |
Public vs Private Health Insurance Coverage by Age in Milford
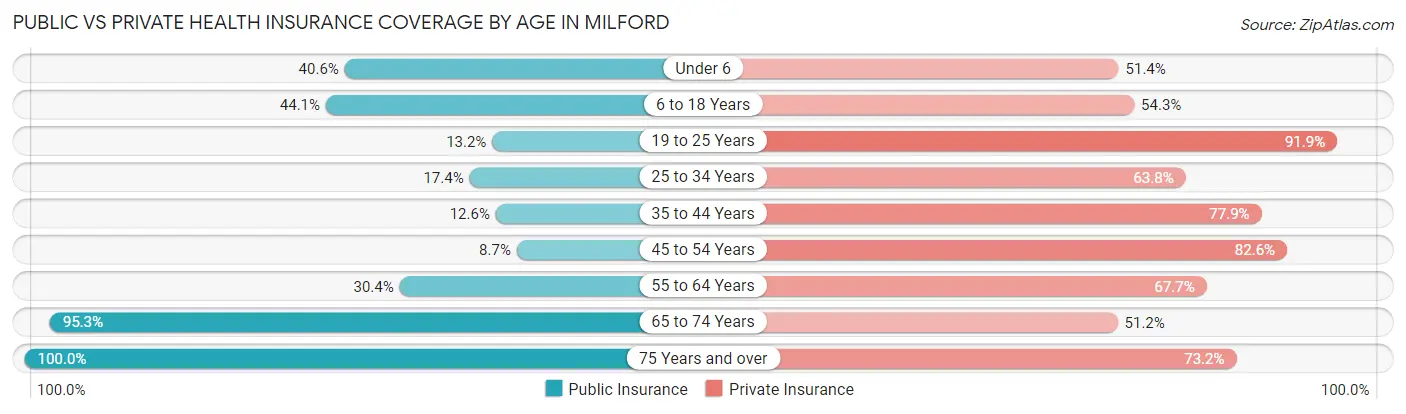
| Age Bracket | Public Insurance | Private Insurance |
| Under 6 | 425 (40.6%) | 538 (51.4%) |
| 6 to 18 Years | 722 (44.1%) | 889 (54.3%) |
| 19 to 25 Years | 67 (13.2%) | 466 (91.9%) |
| 25 to 34 Years | 281 (17.4%) | 1,029 (63.8%) |
| 35 to 44 Years | 135 (12.6%) | 838 (77.9%) |
| 45 to 54 Years | 102 (8.6%) | 974 (82.6%) |
| 55 to 64 Years | 525 (30.4%) | 1,169 (67.7%) |
| 65 to 74 Years | 1,726 (95.3%) | 927 (51.2%) |
| 75 Years and over | 773 (100.0%) | 566 (73.2%) |
| Total | 4,756 (41.8%) | 7,396 (65.0%) |
Disability Status by Sex by Age in Milford
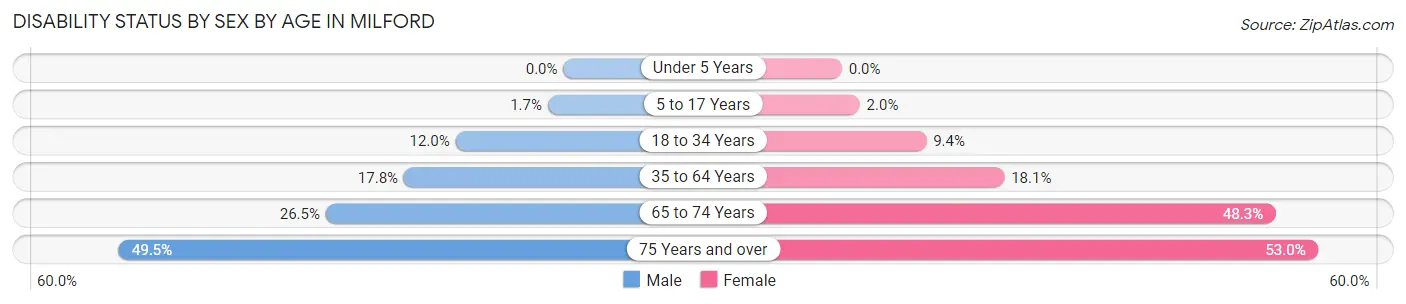
| Age Bracket | Male | Female |
| Under 5 Years | 0 (0.0%) | 0 (0.0%) |
| 5 to 17 Years | 12 (1.7%) | 17 (2.0%) |
| 18 to 34 Years | 147 (12.0%) | 101 (9.4%) |
| 35 to 64 Years | 338 (17.8%) | 376 (18.1%) |
| 65 to 74 Years | 154 (26.5%) | 593 (48.2%) |
| 75 Years and over | 149 (49.5%) | 250 (53.0%) |
Disability Class by Sex by Age in Milford
Disability Class: Hearing Difficulty
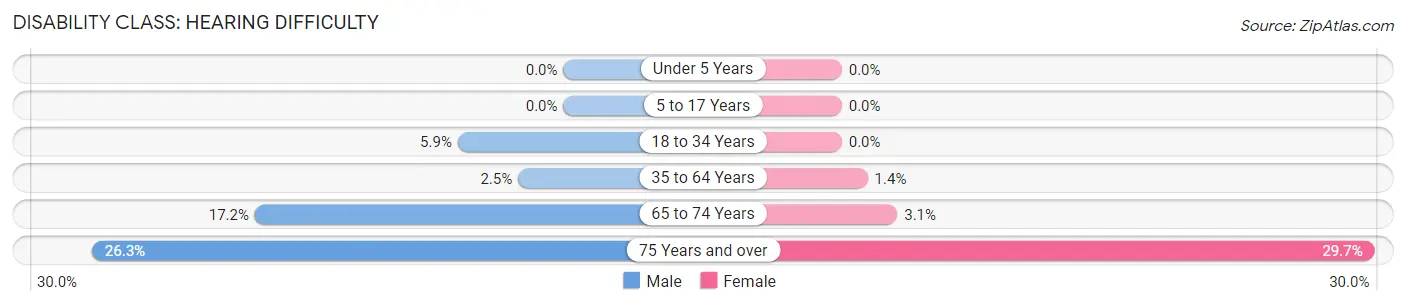
| Age Bracket | Male | Female |
| Under 5 Years | 0 (0.0%) | 0 (0.0%) |
| 5 to 17 Years | 0 (0.0%) | 0 (0.0%) |
| 18 to 34 Years | 72 (5.9%) | 0 (0.0%) |
| 35 to 64 Years | 48 (2.5%) | 30 (1.4%) |
| 65 to 74 Years | 100 (17.2%) | 38 (3.1%) |
| 75 Years and over | 79 (26.3%) | 140 (29.7%) |
Disability Class: Vision Difficulty
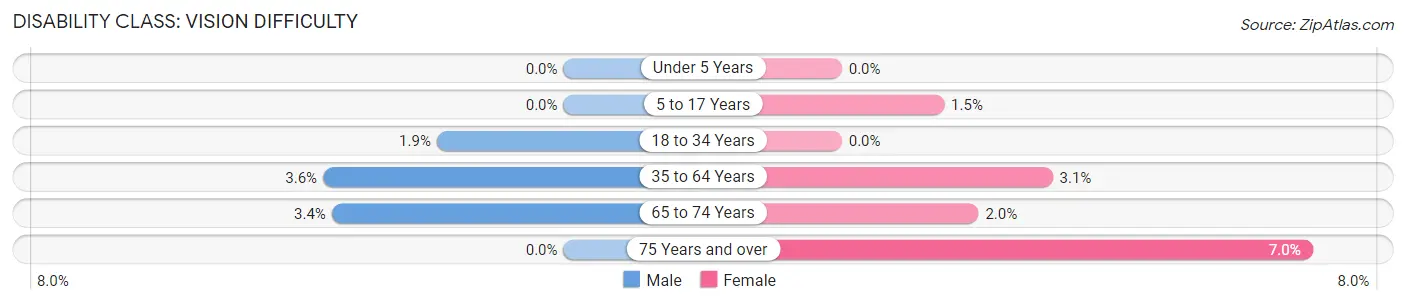
| Age Bracket | Male | Female |
| Under 5 Years | 0 (0.0%) | 0 (0.0%) |
| 5 to 17 Years | 0 (0.0%) | 13 (1.5%) |
| 18 to 34 Years | 23 (1.9%) | 0 (0.0%) |
| 35 to 64 Years | 68 (3.6%) | 65 (3.1%) |
| 65 to 74 Years | 20 (3.4%) | 25 (2.0%) |
| 75 Years and over | 0 (0.0%) | 33 (7.0%) |
Disability Class: Cognitive Difficulty
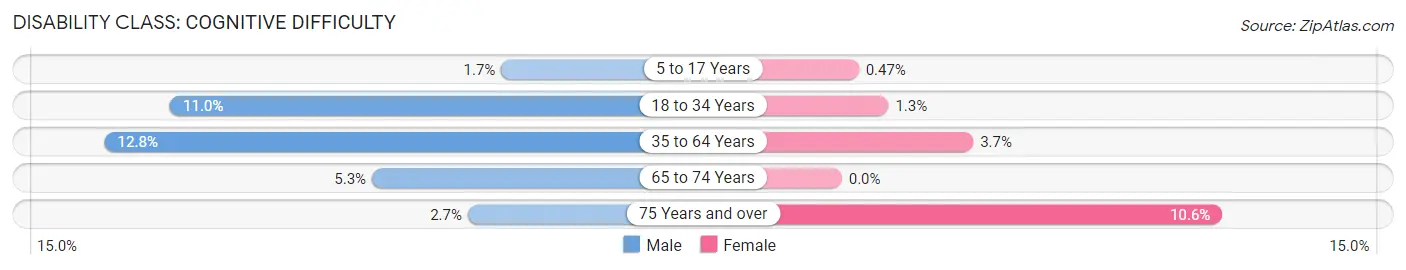
| Age Bracket | Male | Female |
| 5 to 17 Years | 12 (1.7%) | 4 (0.5%) |
| 18 to 34 Years | 134 (11.0%) | 14 (1.3%) |
| 35 to 64 Years | 243 (12.8%) | 76 (3.7%) |
| 65 to 74 Years | 31 (5.3%) | 0 (0.0%) |
| 75 Years and over | 8 (2.7%) | 50 (10.6%) |
Disability Class: Ambulatory Difficulty
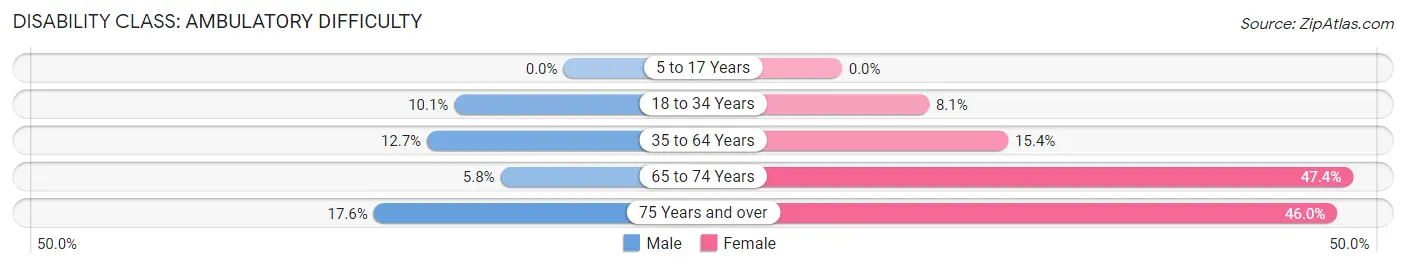
| Age Bracket | Male | Female |
| 5 to 17 Years | 0 (0.0%) | 0 (0.0%) |
| 18 to 34 Years | 124 (10.1%) | 87 (8.1%) |
| 35 to 64 Years | 241 (12.7%) | 321 (15.4%) |
| 65 to 74 Years | 34 (5.8%) | 583 (47.4%) |
| 75 Years and over | 53 (17.6%) | 217 (46.0%) |
Disability Class: Self-Care Difficulty
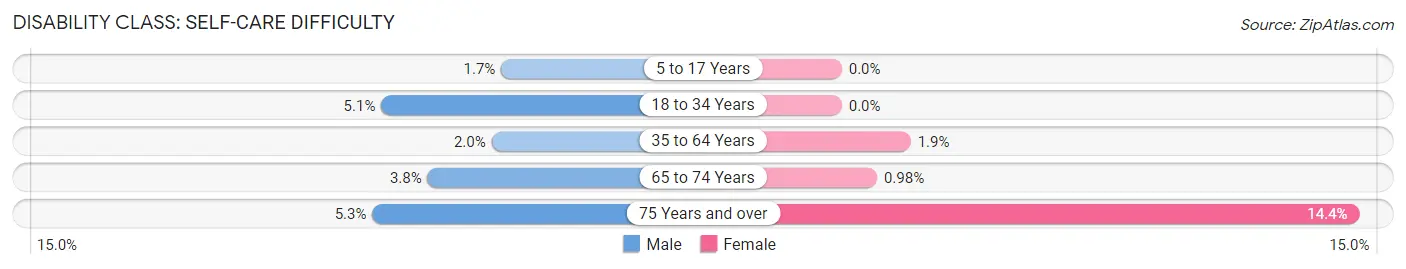
| Age Bracket | Male | Female |
| 5 to 17 Years | 12 (1.7%) | 0 (0.0%) |
| 18 to 34 Years | 62 (5.1%) | 0 (0.0%) |
| 35 to 64 Years | 38 (2.0%) | 40 (1.9%) |
| 65 to 74 Years | 22 (3.8%) | 12 (1.0%) |
| 75 Years and over | 16 (5.3%) | 68 (14.4%) |
Technology Access in Milford
Computing Device Access in Milford
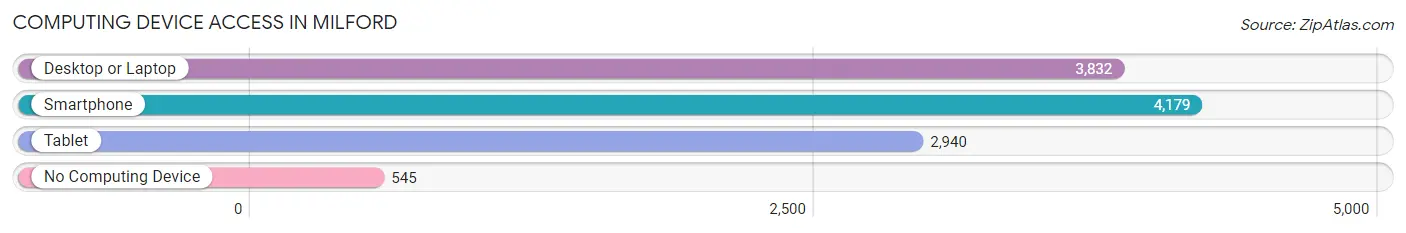
| Device Type | # Households | % Households |
| Desktop or Laptop | 3,832 | 76.1% |
| Smartphone | 4,179 | 83.0% |
| Tablet | 2,940 | 58.4% |
| No Computing Device | 545 | 10.8% |
| Total | 5,034 | 100.0% |
Internet Access in Milford
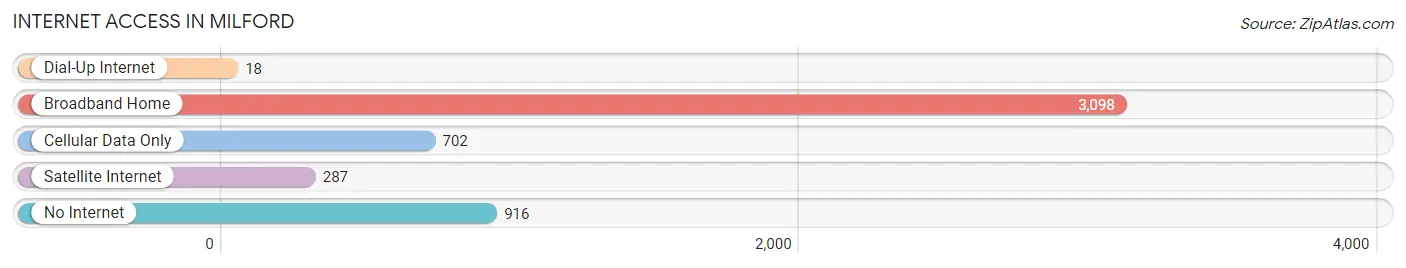
| Internet Type | # Households | % Households |
| Dial-Up Internet | 18 | 0.4% |
| Broadband Home | 3,098 | 61.5% |
| Cellular Data Only | 702 | 14.0% |
| Satellite Internet | 287 | 5.7% |
| No Internet | 916 | 18.2% |
| Total | 5,034 | 100.0% |
Milford Summary
Milford, Delaware is a small city located in Kent County, Delaware. It is situated on the Mispillion River, about 25 miles south of Dover, the state capital. The city has a population of 9,559 as of the 2010 census, making it the ninth largest city in the state.
History
The area that is now Milford was first settled in the early 1700s by English colonists. The town was originally known as "Head of the River" and was part of Kent County. In 1790, the town was officially incorporated as Milford, named after the nearby Mispillion River.
In the early 1800s, Milford was a thriving port town, with ships carrying goods from the Mispillion River to the Delaware Bay. The town was also a major stop on the Underground Railroad, with many escaped slaves passing through on their way to freedom.
In the late 1800s, Milford began to experience a period of growth and prosperity. The town was home to several large businesses, including a cannery, a brickyard, and a paper mill. The town also had a thriving shipbuilding industry, with several large ships being built in the area.
In the early 1900s, Milford experienced a period of decline. The shipbuilding industry had moved elsewhere, and the town's economy was in decline. However, in the late 1900s, Milford began to experience a period of revitalization. The town was home to several new businesses, including a brewery, a winery, and a distillery.
Geography
Milford is located in Kent County, Delaware, about 25 miles south of Dover, the state capital. The city is situated on the Mispillion River, which flows into the Delaware Bay. The city has a total area of 4.2 square miles, all of which is land.
The city is located in the Atlantic Coastal Plain region of Delaware, and is characterized by flat terrain and sandy soils. The climate is humid subtropical, with hot, humid summers and mild winters.
Economy
Milford's economy is largely based on tourism and manufacturing. The city is home to several large manufacturing companies, including a paper mill, a cannery, and a brickyard. The city is also home to several small businesses, including restaurants, shops, and galleries.
The city is also home to several tourist attractions, including the Mispillion Riverwalk, a boardwalk along the Mispillion River, and the Milford Museum, which houses artifacts from the city's history.
Demographics
As of the 2010 census, Milford had a population of 9,559. The racial makeup of the city was 79.2% White, 14.3% African American, 0.5% Native American, 1.3% Asian, 0.1% Pacific Islander, and 4.6% from other races. Hispanic or Latino of any race were 5.3% of the population.
The median household income in Milford was $45,945, and the median family income was $54,945. The per capita income was $22,945. About 11.2% of families and 14.2% of the population were below the poverty line.
Common Questions
What is Per Capita Income in Milford?
Per Capita income in Milford is $33,823.
What is the Median Family Income in Milford?
Median Family Income in Milford is $70,186.
What is the Median Household income in Milford?
Median Household Income in Milford is $53,472.
What is Income or Wage Gap in Milford?
Income or Wage Gap in Milford is 8.0%.
Women in Milford earn 92.0 cents for every dollar earned by a man.
What is Inequality or Gini Index in Milford?
Inequality or Gini Index in Milford is 0.45.
What is the Total Population of Milford?
Total Population of Milford is 11,714.
What is the Total Male Population of Milford?
Total Male Population of Milford is 5,279.
What is the Total Female Population of Milford?
Total Female Population of Milford is 6,435.
What is the Ratio of Males per 100 Females in Milford?
There are 82.04 Males per 100 Females in Milford.
What is the Ratio of Females per 100 Males in Milford?
There are 121.90 Females per 100 Males in Milford.
What is the Median Population Age in Milford?
Median Population Age in Milford is 43.6 Years.
What is the Average Family Size in Milford
Average Family Size in Milford is 3.1 People.
What is the Average Household Size in Milford
Average Household Size in Milford is 2.3 People.
How Large is the Labor Force in Milford?
There are 5,500 People in the Labor Forcein in Milford.
What is the Percentage of People in the Labor Force in Milford?
57.9% of People are in the Labor Force in Milford.
What is the Unemployment Rate in Milford?
Unemployment Rate in Milford is 6.1%.