Wilmington, DE Map & Demographics
Wilmington Map
Wilmington Overview
$36,446
PER CAPITA INCOME
$75,457
AVG FAMILY INCOME
$54,731
AVG HOUSEHOLD INCOME
19.3%
WAGE / INCOME GAP [ % ]
80.7¢/ $1
WAGE / INCOME GAP [ $ ]
$13,090
FAMILY INCOME DEFICIT
0.51
INEQUALITY / GINI INDEX
71,034
TOTAL POPULATION
33,062
MALE POPULATION
37,972
FEMALE POPULATION
87.07
MALES / 100 FEMALES
114.85
FEMALES / 100 MALES
36.9
MEDIAN AGE
3.3
AVG FAMILY SIZE
2.2
AVG HOUSEHOLD SIZE
37,394
LABOR FORCE [ PEOPLE ]
65.3%
PERCENT IN LABOR FORCE
8.6%
UNEMPLOYMENT RATE
Wilmington Area Codes
Income in Wilmington
Income Overview in Wilmington
Per Capita Income in Wilmington is $36,446, while median incomes of families and households are $75,457 and $54,731 respectively.
| Characteristic | Number | Measure |
| Per Capita Income | 71,034 | $36,446 |
| Median Family Income | 14,505 | $75,457 |
| Mean Family Income | 14,505 | $101,620 |
| Median Household Income | 31,650 | $54,731 |
| Mean Household Income | 31,650 | $78,311 |
| Income Deficit | 14,505 | $13,090 |
| Wage / Income Gap (%) | 71,034 | 19.34% |
| Wage / Income Gap ($) | 71,034 | 80.66¢ per $1 |
| Gini / Inequality Index | 71,034 | 0.51 |
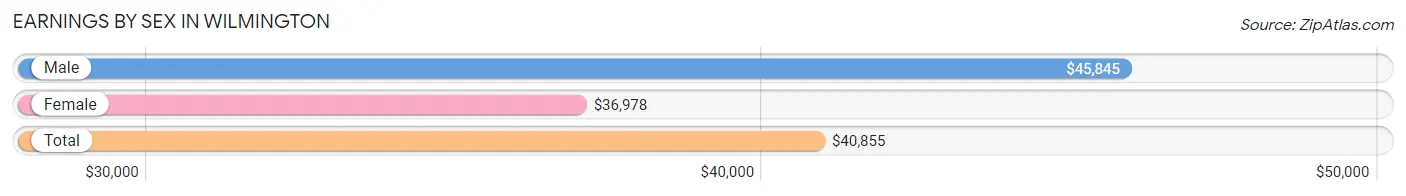
Earnings by Sex in Wilmington
Average Earnings in Wilmington are $40,855, $45,845 for men and $36,978 for women, a difference of 19.3%.
| Sex | Number | Average Earnings |
| Male | 18,193 (47.5%) | $45,845 |
| Female | 20,118 (52.5%) | $36,978 |
| Total | 38,311 (100.0%) | $40,855 |
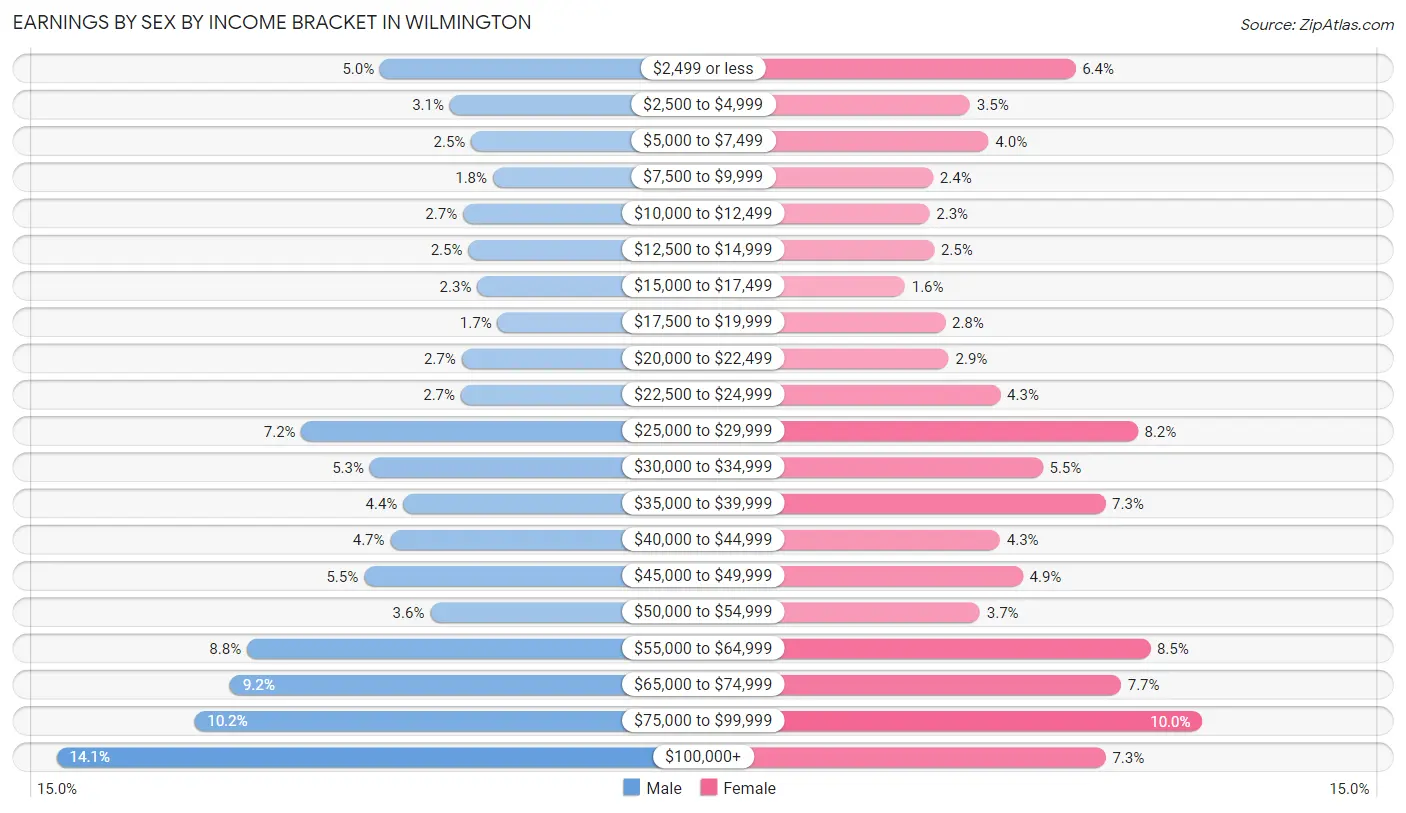
Earnings by Sex by Income Bracket in Wilmington
The most common earnings brackets in Wilmington are $100,000+ for men (2,566 | 14.1%) and $75,000 to $99,999 for women (2,010 | 10.0%).
| Income | Male | Female |
| $2,499 or less | 912 (5.0%) | 1,291 (6.4%) |
| $2,500 to $4,999 | 555 (3.0%) | 697 (3.5%) |
| $5,000 to $7,499 | 446 (2.5%) | 801 (4.0%) |
| $7,500 to $9,999 | 335 (1.8%) | 486 (2.4%) |
| $10,000 to $12,499 | 488 (2.7%) | 467 (2.3%) |
| $12,500 to $14,999 | 461 (2.5%) | 492 (2.5%) |
| $15,000 to $17,499 | 415 (2.3%) | 327 (1.6%) |
| $17,500 to $19,999 | 311 (1.7%) | 555 (2.8%) |
| $20,000 to $22,499 | 495 (2.7%) | 576 (2.9%) |
| $22,500 to $24,999 | 498 (2.7%) | 867 (4.3%) |
| $25,000 to $29,999 | 1,314 (7.2%) | 1,644 (8.2%) |
| $30,000 to $34,999 | 965 (5.3%) | 1,106 (5.5%) |
| $35,000 to $39,999 | 794 (4.4%) | 1,460 (7.3%) |
| $40,000 to $44,999 | 858 (4.7%) | 866 (4.3%) |
| $45,000 to $49,999 | 993 (5.5%) | 994 (4.9%) |
| $50,000 to $54,999 | 655 (3.6%) | 753 (3.7%) |
| $55,000 to $64,999 | 1,591 (8.7%) | 1,714 (8.5%) |
| $65,000 to $74,999 | 1,679 (9.2%) | 1,549 (7.7%) |
| $75,000 to $99,999 | 1,862 (10.2%) | 2,010 (10.0%) |
| $100,000+ | 2,566 (14.1%) | 1,463 (7.3%) |
| Total | 18,193 (100.0%) | 20,118 (100.0%) |
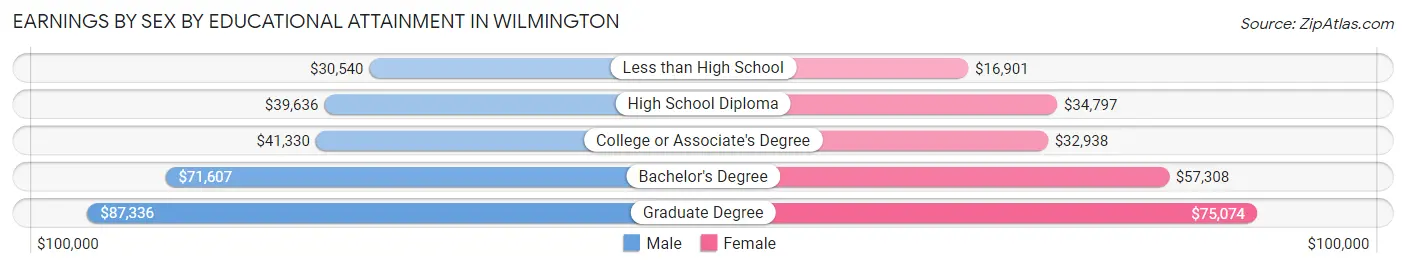
Earnings by Sex by Educational Attainment in Wilmington
Average earnings in Wilmington are $48,842 for men and $41,755 for women, a difference of 14.5%. Men with an educational attainment of graduate degree enjoy the highest average annual earnings of $87,336, while those with less than high school education earn the least with $30,540. Women with an educational attainment of graduate degree earn the most with the average annual earnings of $75,074, while those with less than high school education have the smallest earnings of $16,901.
| Educational Attainment | Male Income | Female Income |
| Less than High School | $30,540 | $16,901 |
| High School Diploma | $39,636 | $34,797 |
| College or Associate's Degree | $41,330 | $32,938 |
| Bachelor's Degree | $71,607 | $57,308 |
| Graduate Degree | $87,336 | $75,074 |
| Total | $48,842 | $41,755 |
Family Income in Wilmington
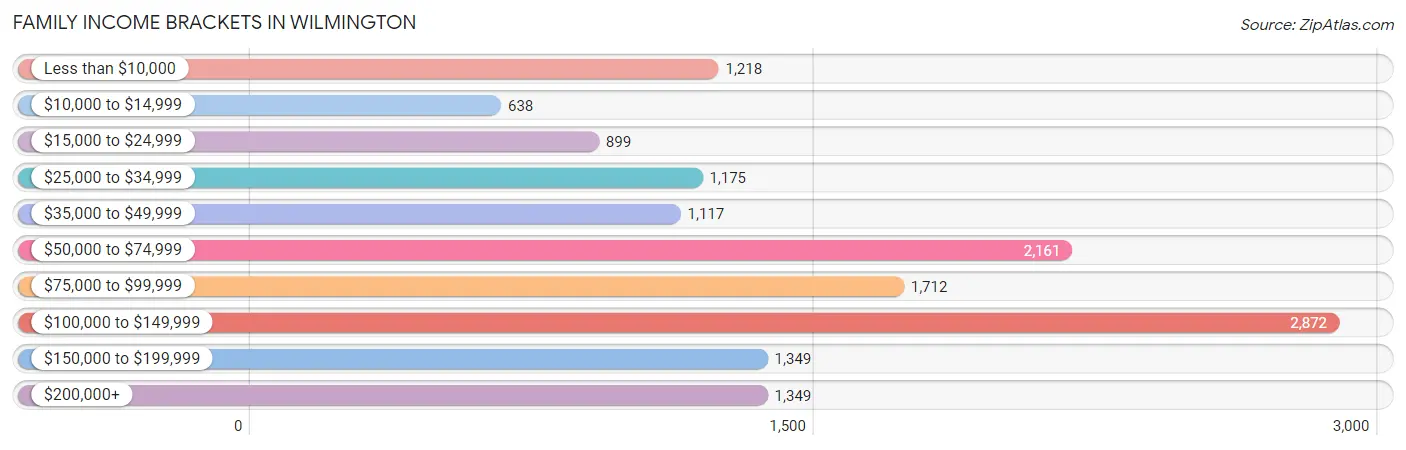
Family Income Brackets in Wilmington
According to the Wilmington family income data, there are 2,872 families falling into the $100,000 to $149,999 income range, which is the most common income bracket and makes up 19.8% of all families. Conversely, the $10,000 to $14,999 income bracket is the least frequent group with only 638 families (4.4%) belonging to this category.
| Income Bracket | # Families | % Families |
| Less than $10,000 | 1,218 | 8.4% |
| $10,000 to $14,999 | 638 | 4.4% |
| $15,000 to $24,999 | 899 | 6.2% |
| $25,000 to $34,999 | 1,175 | 8.1% |
| $35,000 to $49,999 | 1,117 | 7.7% |
| $50,000 to $74,999 | 2,161 | 14.9% |
| $75,000 to $99,999 | 1,712 | 11.8% |
| $100,000 to $149,999 | 2,872 | 19.8% |
| $150,000 to $199,999 | 1,349 | 9.3% |
| $200,000+ | 1,349 | 9.3% |
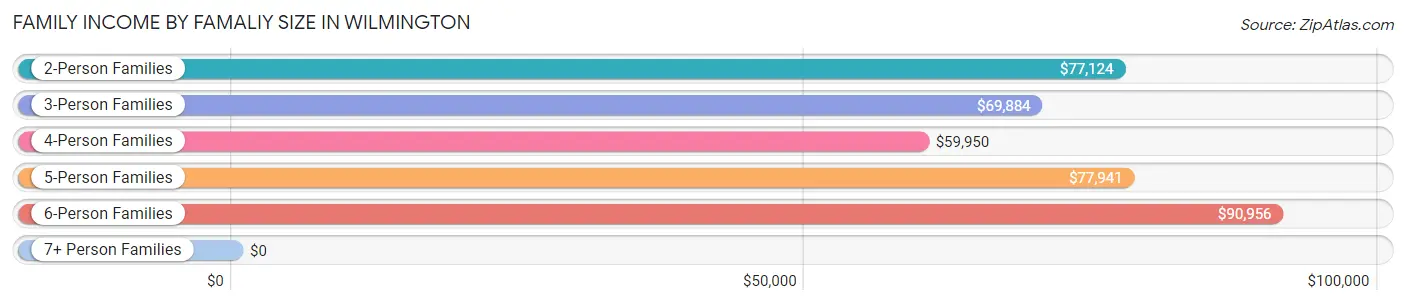
Family Income by Famaliy Size in Wilmington
6-person families (335 | 2.3%) account for the highest median family income in Wilmington with $90,956 per family, while 2-person families (6,859 | 47.3%) have the highest median income of $38,562 per family member.
| Income Bracket | # Families | Median Income |
| 2-Person Families | 6,859 (47.3%) | $77,124 |
| 3-Person Families | 4,037 (27.8%) | $69,884 |
| 4-Person Families | 2,445 (16.9%) | $59,950 |
| 5-Person Families | 656 (4.5%) | $77,941 |
| 6-Person Families | 335 (2.3%) | $90,956 |
| 7+ Person Families | 173 (1.2%) | $0 |
| Total | 14,505 (100.0%) | $75,457 |
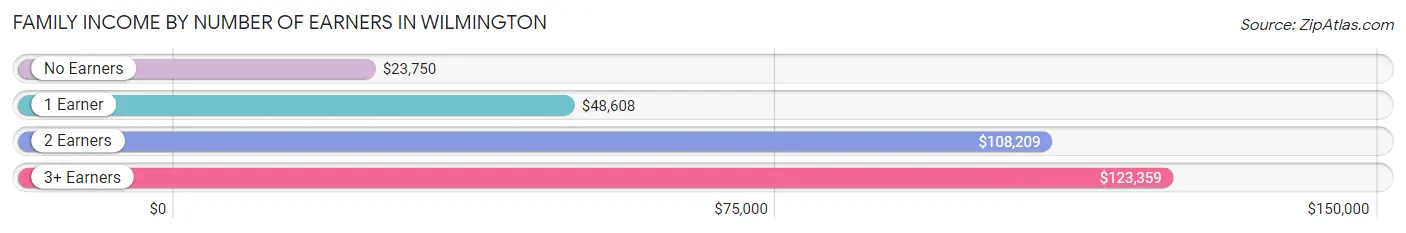
Family Income by Number of Earners in Wilmington
The median family income in Wilmington is $75,457, with families comprising 3+ earners (1,377) having the highest median family income of $123,359, while families with no earners (2,278) have the lowest median family income of $23,750, accounting for 9.5% and 15.7% of families, respectively.
| Number of Earners | # Families | Median Income |
| No Earners | 2,278 (15.7%) | $23,750 |
| 1 Earner | 4,898 (33.8%) | $48,608 |
| 2 Earners | 5,952 (41.0%) | $108,209 |
| 3+ Earners | 1,377 (9.5%) | $123,359 |
| Total | 14,505 (100.0%) | $75,457 |
Household Income in Wilmington
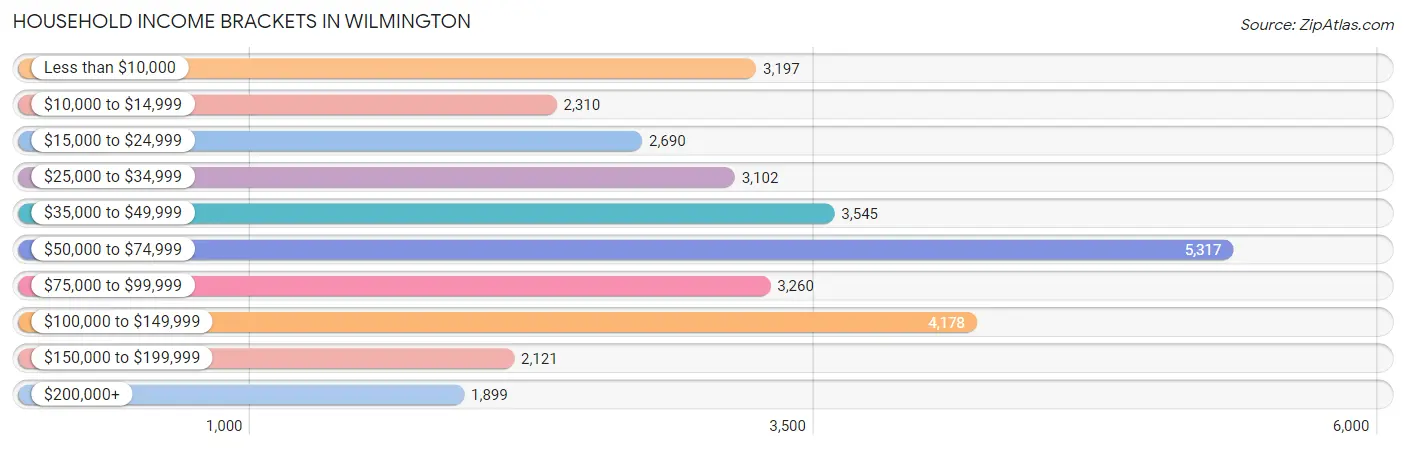
Household Income Brackets in Wilmington
With 5,317 households falling in the category, the $50,000 to $74,999 income range is the most frequent in Wilmington, accounting for 16.8% of all households. In contrast, only 1,899 households (6.0%) fall into the $200,000+ income bracket, making it the least populous group.
| Income Bracket | # Households | % Households |
| Less than $10,000 | 3,197 | 10.1% |
| $10,000 to $14,999 | 2,310 | 7.3% |
| $15,000 to $24,999 | 2,690 | 8.5% |
| $25,000 to $34,999 | 3,102 | 9.8% |
| $35,000 to $49,999 | 3,545 | 11.2% |
| $50,000 to $74,999 | 5,317 | 16.8% |
| $75,000 to $99,999 | 3,260 | 10.3% |
| $100,000 to $149,999 | 4,178 | 13.2% |
| $150,000 to $199,999 | 2,121 | 6.7% |
| $200,000+ | 1,899 | 6.0% |
Household Income by Householder Age in Wilmington
The median household income in Wilmington is $54,731, with the highest median household income of $62,184 found in the 25 to 44 years age bracket for the primary householder. A total of 11,858 households (37.5%) fall into this category. Meanwhile, the 15 to 24 years age bracket for the primary householder has the lowest median household income of $21,838, with 889 households (2.8%) in this group.
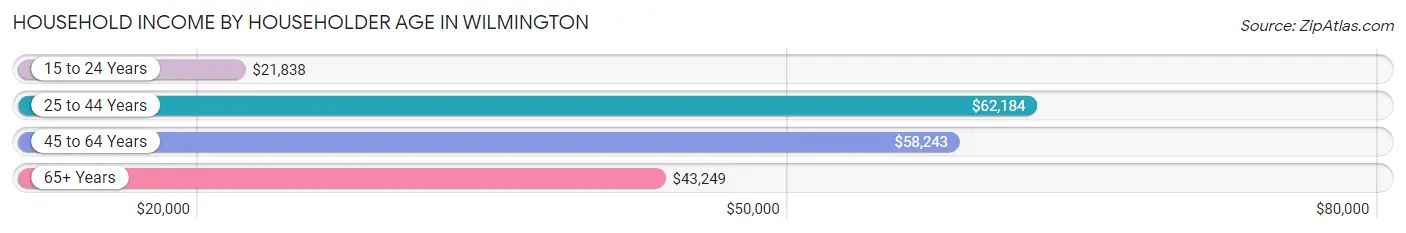
| Income Bracket | # Households | Median Income |
| 15 to 24 Years | 889 (2.8%) | $21,838 |
| 25 to 44 Years | 11,858 (37.5%) | $62,184 |
| 45 to 64 Years | 12,096 (38.2%) | $58,243 |
| 65+ Years | 6,807 (21.5%) | $43,249 |
| Total | 31,650 (100.0%) | $54,731 |
Poverty in Wilmington
Income Below Poverty by Sex and Age in Wilmington
With 23.3% poverty level for males and 25.1% for females among the residents of Wilmington, 15 year old males and under 5 year old females are the most vulnerable to poverty, with 150 males (57.7%) and 1,059 females (52.1%) in their respective age groups living below the poverty level.
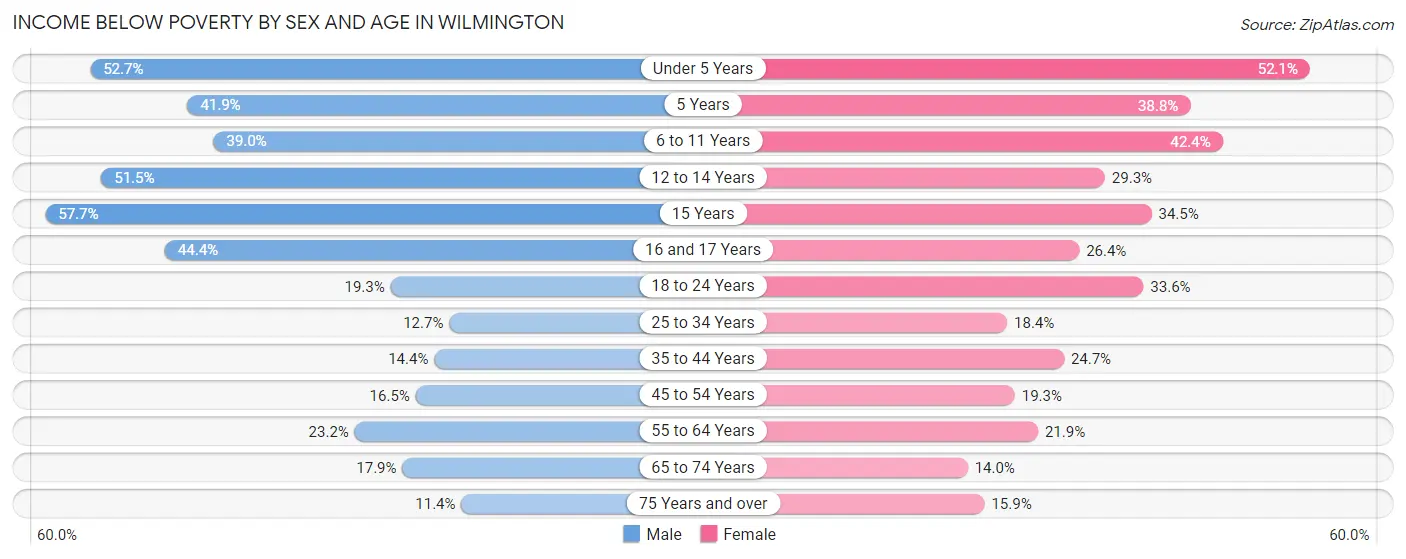
| Age Bracket | Male | Female |
| Under 5 Years | 1,079 (52.7%) | 1,059 (52.1%) |
| 5 Years | 144 (41.9%) | 135 (38.8%) |
| 6 to 11 Years | 906 (39.0%) | 1,213 (42.4%) |
| 12 to 14 Years | 676 (51.4%) | 428 (29.3%) |
| 15 Years | 150 (57.7%) | 158 (34.5%) |
| 16 and 17 Years | 351 (44.4%) | 239 (26.4%) |
| 18 to 24 Years | 411 (19.3%) | 924 (33.6%) |
| 25 to 34 Years | 736 (12.7%) | 1,171 (18.4%) |
| 35 to 44 Years | 597 (14.4%) | 1,235 (24.7%) |
| 45 to 54 Years | 614 (16.5%) | 841 (19.3%) |
| 55 to 64 Years | 969 (23.2%) | 1,155 (21.8%) |
| 65 to 74 Years | 484 (17.9%) | 490 (14.0%) |
| 75 Years and over | 173 (11.4%) | 335 (15.9%) |
| Total | 7,290 (23.3%) | 9,383 (25.1%) |
Income Above Poverty by Sex and Age in Wilmington
According to the poverty statistics in Wilmington, males aged 75 years and over and females aged 65 to 74 years are the age groups that are most secure financially, with 88.6% of males and 86.0% of females in these age groups living above the poverty line.
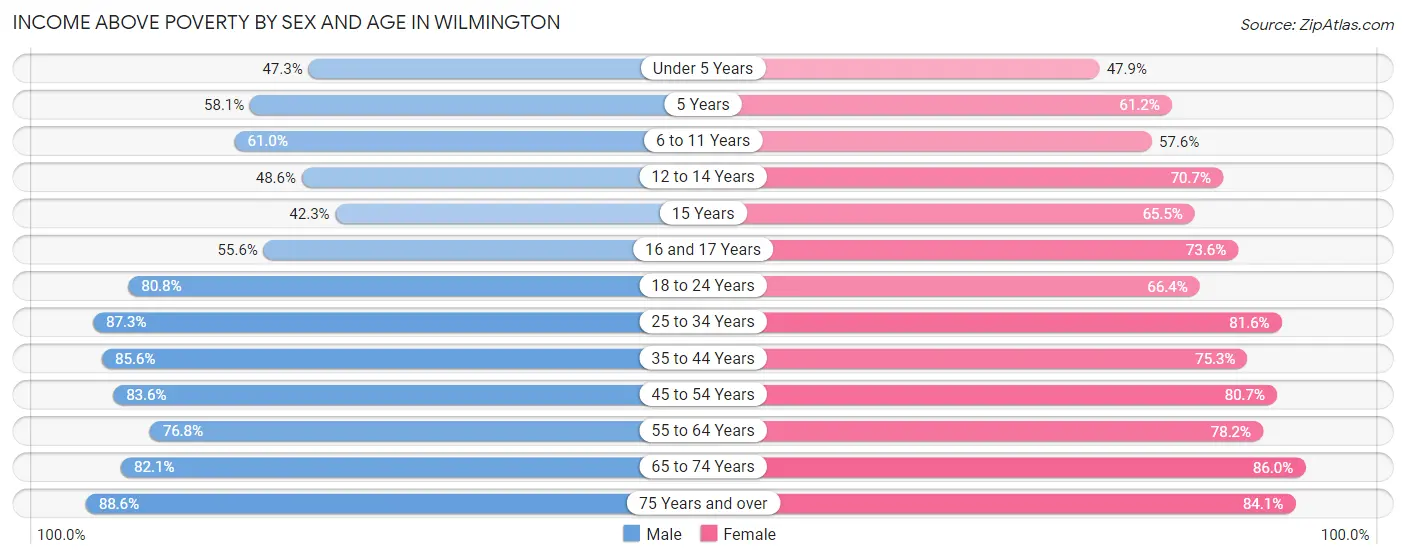
| Age Bracket | Male | Female |
| Under 5 Years | 969 (47.3%) | 973 (47.9%) |
| 5 Years | 200 (58.1%) | 213 (61.2%) |
| 6 to 11 Years | 1,419 (61.0%) | 1,648 (57.6%) |
| 12 to 14 Years | 638 (48.5%) | 1,033 (70.7%) |
| 15 Years | 110 (42.3%) | 300 (65.5%) |
| 16 and 17 Years | 440 (55.6%) | 665 (73.6%) |
| 18 to 24 Years | 1,724 (80.7%) | 1,827 (66.4%) |
| 25 to 34 Years | 5,055 (87.3%) | 5,191 (81.6%) |
| 35 to 44 Years | 3,555 (85.6%) | 3,756 (75.3%) |
| 45 to 54 Years | 3,118 (83.6%) | 3,523 (80.7%) |
| 55 to 64 Years | 3,201 (76.8%) | 4,131 (78.1%) |
| 65 to 74 Years | 2,216 (82.1%) | 3,004 (86.0%) |
| 75 Years and over | 1,350 (88.6%) | 1,773 (84.1%) |
| Total | 23,995 (76.7%) | 28,037 (74.9%) |
Income Below Poverty Among Married-Couple Families in Wilmington
The poverty statistics for married-couple families in Wilmington show that 6.1% or 426 of the total 6,925 families live below the poverty line. Families with 3 or 4 children have the highest poverty rate of 17.1%, comprising of 67 families. On the other hand, families with 5 or more children have the lowest poverty rate of 0.0%, which includes 0 families.
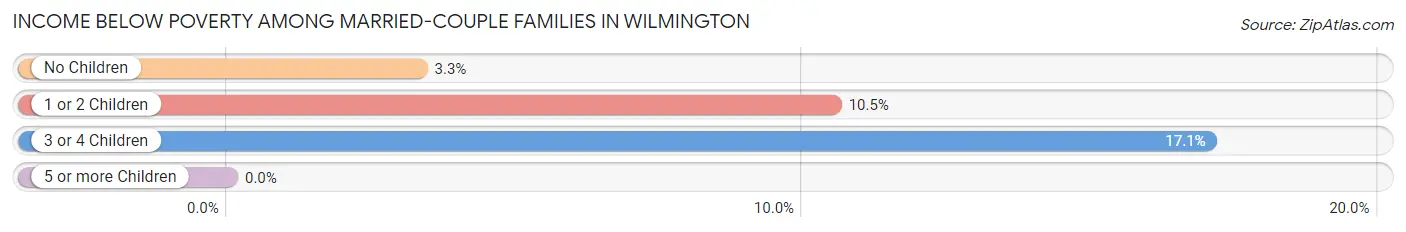
| Children | Above Poverty | Below Poverty |
| No Children | 4,341 (96.7%) | 148 (3.3%) |
| 1 or 2 Children | 1,797 (89.5%) | 211 (10.5%) |
| 3 or 4 Children | 326 (83.0%) | 67 (17.1%) |
| 5 or more Children | 35 (100.0%) | 0 (0.0%) |
| Total | 6,499 (93.9%) | 426 (6.1%) |
Income Below Poverty Among Single-Parent Households in Wilmington
According to the poverty data in Wilmington, 22.7% or 346 single-father households and 34.4% or 2,081 single-mother households are living below the poverty line. Among single-father households, those with 5 or more children have the highest poverty rate, with 38 households (100.0%) experiencing poverty. Likewise, among single-mother households, those with 5 or more children have the highest poverty rate, with 80 households (93.0%) falling below the poverty line.
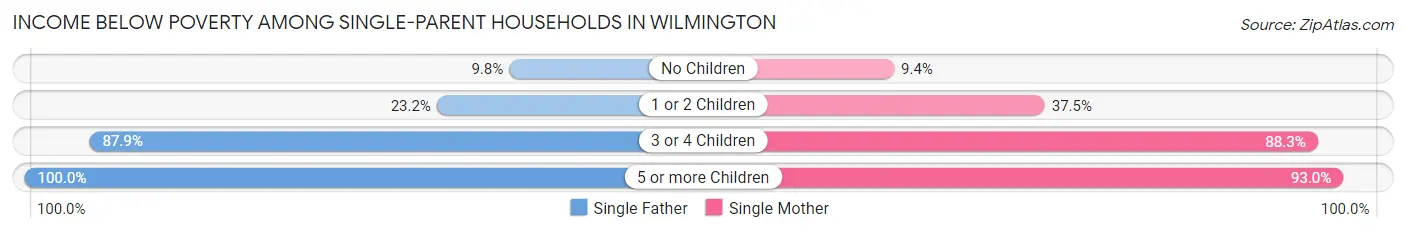
| Children | Single Father | Single Mother |
| No Children | 70 (9.8%) | 200 (9.4%) |
| 1 or 2 Children | 158 (23.2%) | 1,170 (37.5%) |
| 3 or 4 Children | 80 (87.9%) | 631 (88.2%) |
| 5 or more Children | 38 (100.0%) | 80 (93.0%) |
| Total | 346 (22.7%) | 2,081 (34.4%) |
Income Below Poverty Among Married-Couple vs Single-Parent Households in Wilmington
The poverty data for Wilmington shows that 426 of the married-couple family households (6.1%) and 2,427 of the single-parent households (32.0%) are living below the poverty level. Within the married-couple family households, those with 3 or 4 children have the highest poverty rate, with 67 households (17.1%) falling below the poverty line. Among the single-parent households, those with 5 or more children have the highest poverty rate, with 118 household (95.2%) living below poverty.
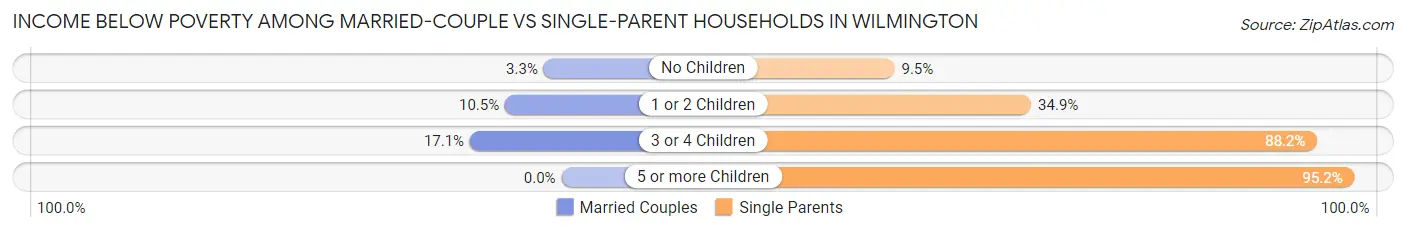
| Children | Married-Couple Families | Single-Parent Households |
| No Children | 148 (3.3%) | 270 (9.5%) |
| 1 or 2 Children | 211 (10.5%) | 1,328 (34.9%) |
| 3 or 4 Children | 67 (17.1%) | 711 (88.2%) |
| 5 or more Children | 0 (0.0%) | 118 (95.2%) |
| Total | 426 (6.1%) | 2,427 (32.0%) |
Race in Wilmington
The most populous races in Wilmington are Black / African American (38,114 | 53.7%), White / Caucasian (24,392 | 34.3%), and Hispanic or Latino (8,013 | 11.3%).
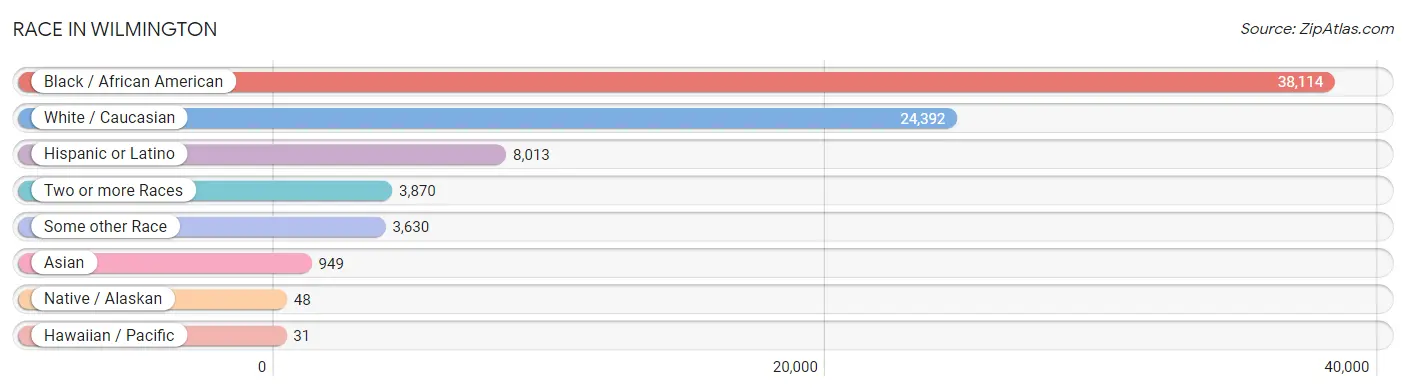
| Race | # Population | % Population |
| Asian | 949 | 1.3% |
| Black / African American | 38,114 | 53.7% |
| Hawaiian / Pacific | 31 | 0.0% |
| Hispanic or Latino | 8,013 | 11.3% |
| Native / Alaskan | 48 | 0.1% |
| White / Caucasian | 24,392 | 34.3% |
| Two or more Races | 3,870 | 5.4% |
| Some other Race | 3,630 | 5.1% |
| Total | 71,034 | 100.0% |
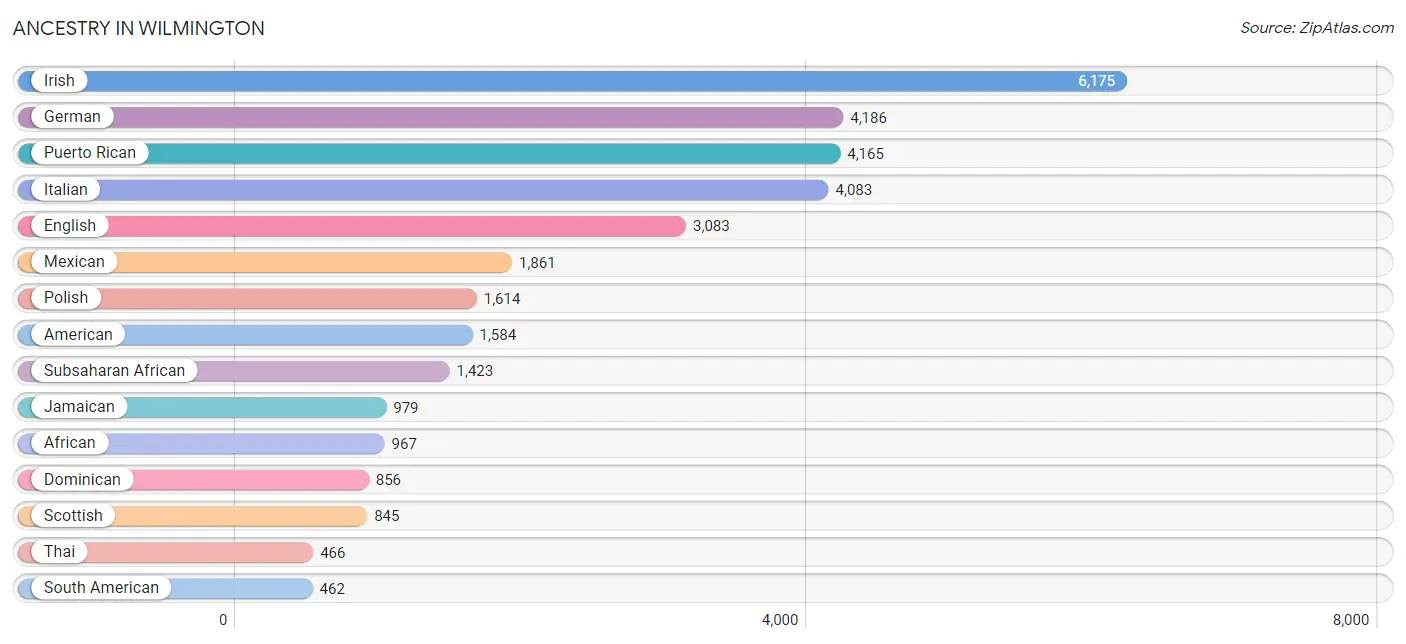
Ancestry in Wilmington
The most populous ancestries reported in Wilmington are Irish (6,175 | 8.7%), German (4,186 | 5.9%), Puerto Rican (4,165 | 5.9%), Italian (4,083 | 5.8%), and English (3,083 | 4.3%), together accounting for 30.5% of all Wilmington residents.
| Ancestry | # Population | % Population |
| African | 967 | 1.4% |
| Albanian | 8 | 0.0% |
| Alsatian | 8 | 0.0% |
| American | 1,584 | 2.2% |
| Arab | 365 | 0.5% |
| Argentinean | 16 | 0.0% |
| Armenian | 39 | 0.1% |
| Australian | 9 | 0.0% |
| Austrian | 166 | 0.2% |
| Bermudan | 79 | 0.1% |
| Bhutanese | 13 | 0.0% |
| Blackfeet | 32 | 0.1% |
| Brazilian | 8 | 0.0% |
| British | 177 | 0.3% |
| British West Indian | 25 | 0.0% |
| Burmese | 104 | 0.2% |
| Canadian | 80 | 0.1% |
| Central American | 255 | 0.4% |
| Central American Indian | 165 | 0.2% |
| Cherokee | 288 | 0.4% |
| Chilean | 16 | 0.0% |
| Chippewa | 16 | 0.0% |
| Colombian | 146 | 0.2% |
| Costa Rican | 12 | 0.0% |
| Croatian | 13 | 0.0% |
| Cuban | 77 | 0.1% |
| Czech | 112 | 0.2% |
| Czechoslovakian | 49 | 0.1% |
| Danish | 72 | 0.1% |
| Delaware | 117 | 0.2% |
| Dominican | 856 | 1.2% |
| Dutch | 178 | 0.3% |
| Eastern European | 152 | 0.2% |
| Ecuadorian | 182 | 0.3% |
| Egyptian | 7 | 0.0% |
| English | 3,083 | 4.3% |
| Estonian | 10 | 0.0% |
| Ethiopian | 52 | 0.1% |
| European | 437 | 0.6% |
| Filipino | 33 | 0.1% |
| Finnish | 45 | 0.1% |
| French | 443 | 0.6% |
| French Canadian | 94 | 0.1% |
| German | 4,186 | 5.9% |
| German Russian | 28 | 0.0% |
| Ghanaian | 18 | 0.0% |
| Greek | 165 | 0.2% |
| Guamanian / Chamorro | 8 | 0.0% |
| Guatemalan | 92 | 0.1% |
| Guyanese | 64 | 0.1% |
| Haitian | 61 | 0.1% |
| Honduran | 16 | 0.0% |
| Hungarian | 110 | 0.2% |
| Indian (Asian) | 288 | 0.4% |
| Iranian | 6 | 0.0% |
| Irish | 6,175 | 8.7% |
| Iroquois | 29 | 0.0% |
| Israeli | 26 | 0.0% |
| Italian | 4,083 | 5.8% |
| Jamaican | 979 | 1.4% |
| Jordanian | 16 | 0.0% |
| Kenyan | 7 | 0.0% |
| Korean | 78 | 0.1% |
| Laotian | 5 | 0.0% |
| Latvian | 21 | 0.0% |
| Lebanese | 12 | 0.0% |
| Liberian | 76 | 0.1% |
| Lithuanian | 97 | 0.1% |
| Mexican | 1,861 | 2.6% |
| Mongolian | 10 | 0.0% |
| Native Hawaiian | 10 | 0.0% |
| Navajo | 3 | 0.0% |
| Nigerian | 158 | 0.2% |
| Northern European | 132 | 0.2% |
| Norwegian | 250 | 0.4% |
| Panamanian | 79 | 0.1% |
| Pennsylvania German | 6 | 0.0% |
| Peruvian | 88 | 0.1% |
| Polish | 1,614 | 2.3% |
| Portuguese | 62 | 0.1% |
| Puerto Rican | 4,165 | 5.9% |
| Romanian | 4 | 0.0% |
| Russian | 344 | 0.5% |
| Salvadoran | 56 | 0.1% |
| Samoan | 21 | 0.0% |
| Scandinavian | 35 | 0.1% |
| Scotch-Irish | 164 | 0.2% |
| Scottish | 845 | 1.2% |
| Seminole | 8 | 0.0% |
| Serbian | 5 | 0.0% |
| Slavic | 24 | 0.0% |
| Slovak | 65 | 0.1% |
| Slovene | 10 | 0.0% |
| South African | 93 | 0.1% |
| South American | 462 | 0.6% |
| Spaniard | 212 | 0.3% |
| Spanish | 25 | 0.0% |
| Sri Lankan | 19 | 0.0% |
| Subsaharan African | 1,423 | 2.0% |
| Sudanese | 10 | 0.0% |
| Swedish | 272 | 0.4% |
| Swiss | 33 | 0.1% |
| Thai | 466 | 0.7% |
| Trinidadian and Tobagonian | 143 | 0.2% |
| Turkish | 32 | 0.1% |
| Ukrainian | 368 | 0.5% |
| Uruguayan | 7 | 0.0% |
| Venezuelan | 7 | 0.0% |
| Welsh | 249 | 0.4% |
| West Indian | 173 | 0.2% | View All 110 Rows |
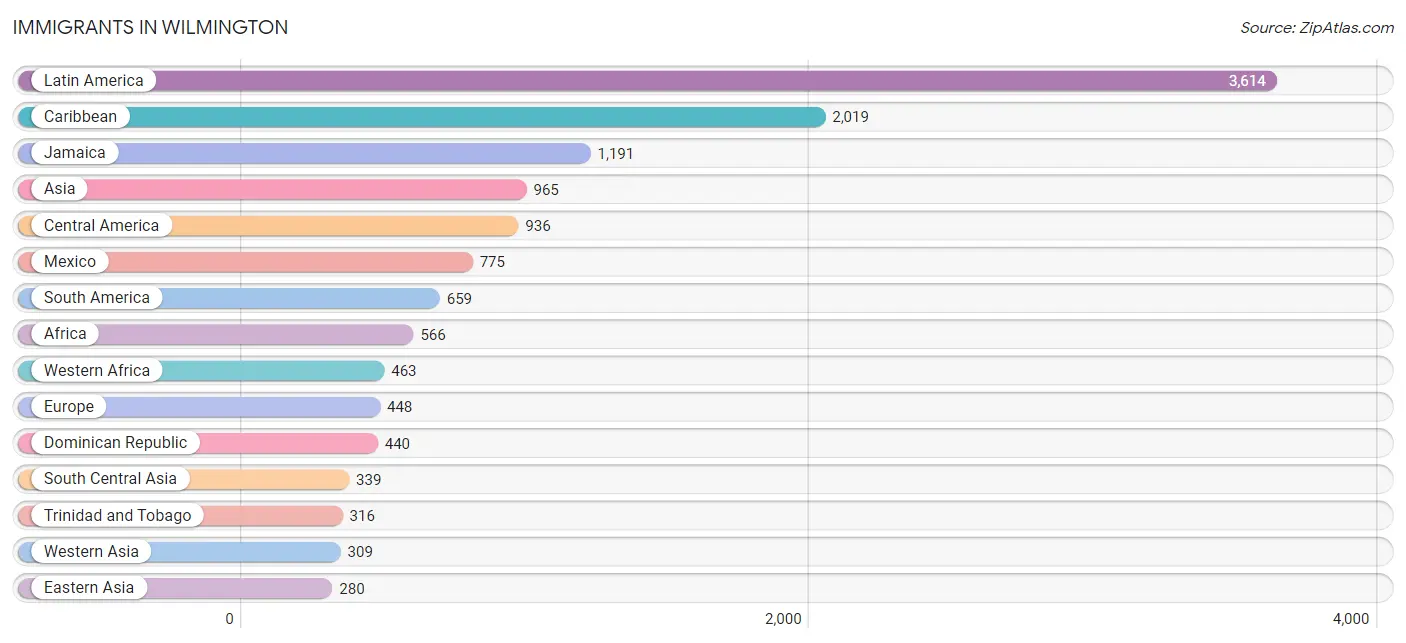
Immigrants in Wilmington
The most numerous immigrant groups reported in Wilmington came from Latin America (3,614 | 5.1%), Caribbean (2,019 | 2.8%), Jamaica (1,191 | 1.7%), Asia (965 | 1.4%), and Central America (936 | 1.3%), together accounting for 12.3% of all Wilmington residents.
| Immigration Origin | # Population | % Population |
| Africa | 566 | 0.8% |
| Argentina | 16 | 0.0% |
| Asia | 965 | 1.4% |
| Australia | 9 | 0.0% |
| Barbados | 14 | 0.0% |
| Belarus | 18 | 0.0% |
| Brazil | 26 | 0.0% |
| Canada | 7 | 0.0% |
| Caribbean | 2,019 | 2.8% |
| Central America | 936 | 1.3% |
| Chile | 16 | 0.0% |
| China | 227 | 0.3% |
| Colombia | 158 | 0.2% |
| Croatia | 16 | 0.0% |
| Dominican Republic | 440 | 0.6% |
| Eastern Africa | 86 | 0.1% |
| Eastern Asia | 280 | 0.4% |
| Eastern Europe | 100 | 0.1% |
| Ecuador | 101 | 0.1% |
| El Salvador | 40 | 0.1% |
| England | 24 | 0.0% |
| Ethiopia | 27 | 0.0% |
| Europe | 448 | 0.6% |
| France | 8 | 0.0% |
| Germany | 142 | 0.2% |
| Ghana | 18 | 0.0% |
| Guatemala | 57 | 0.1% |
| Guyana | 176 | 0.3% |
| Haiti | 31 | 0.0% |
| India | 256 | 0.4% |
| Indonesia | 2 | 0.0% |
| Ireland | 47 | 0.1% |
| Israel | 14 | 0.0% |
| Italy | 31 | 0.0% |
| Jamaica | 1,191 | 1.7% |
| Japan | 11 | 0.0% |
| Jordan | 24 | 0.0% |
| Kazakhstan | 11 | 0.0% |
| Korea | 42 | 0.1% |
| Latin America | 3,614 | 5.1% |
| Liberia | 47 | 0.1% |
| Malaysia | 10 | 0.0% |
| Mexico | 775 | 1.1% |
| Nepal | 23 | 0.0% |
| Nigeria | 133 | 0.2% |
| Northern Africa | 10 | 0.0% |
| Northern Europe | 108 | 0.2% |
| Oceania | 9 | 0.0% |
| Pakistan | 49 | 0.1% |
| Panama | 64 | 0.1% |
| Peru | 114 | 0.2% |
| Philippines | 21 | 0.0% |
| Poland | 57 | 0.1% |
| Russia | 9 | 0.0% |
| Sierra Leone | 185 | 0.3% |
| South America | 659 | 0.9% |
| South Central Asia | 339 | 0.5% |
| South Eastern Asia | 37 | 0.1% |
| Southern Europe | 90 | 0.1% |
| Spain | 59 | 0.1% |
| Sudan | 10 | 0.0% |
| Taiwan | 13 | 0.0% |
| Trinidad and Tobago | 316 | 0.4% |
| Turkey | 48 | 0.1% |
| Venezuela | 7 | 0.0% |
| Vietnam | 4 | 0.0% |
| Western Africa | 463 | 0.6% |
| Western Asia | 309 | 0.4% |
| Western Europe | 150 | 0.2% |
| Yemen | 212 | 0.3% |
| Zimbabwe | 32 | 0.1% | View All 71 Rows |
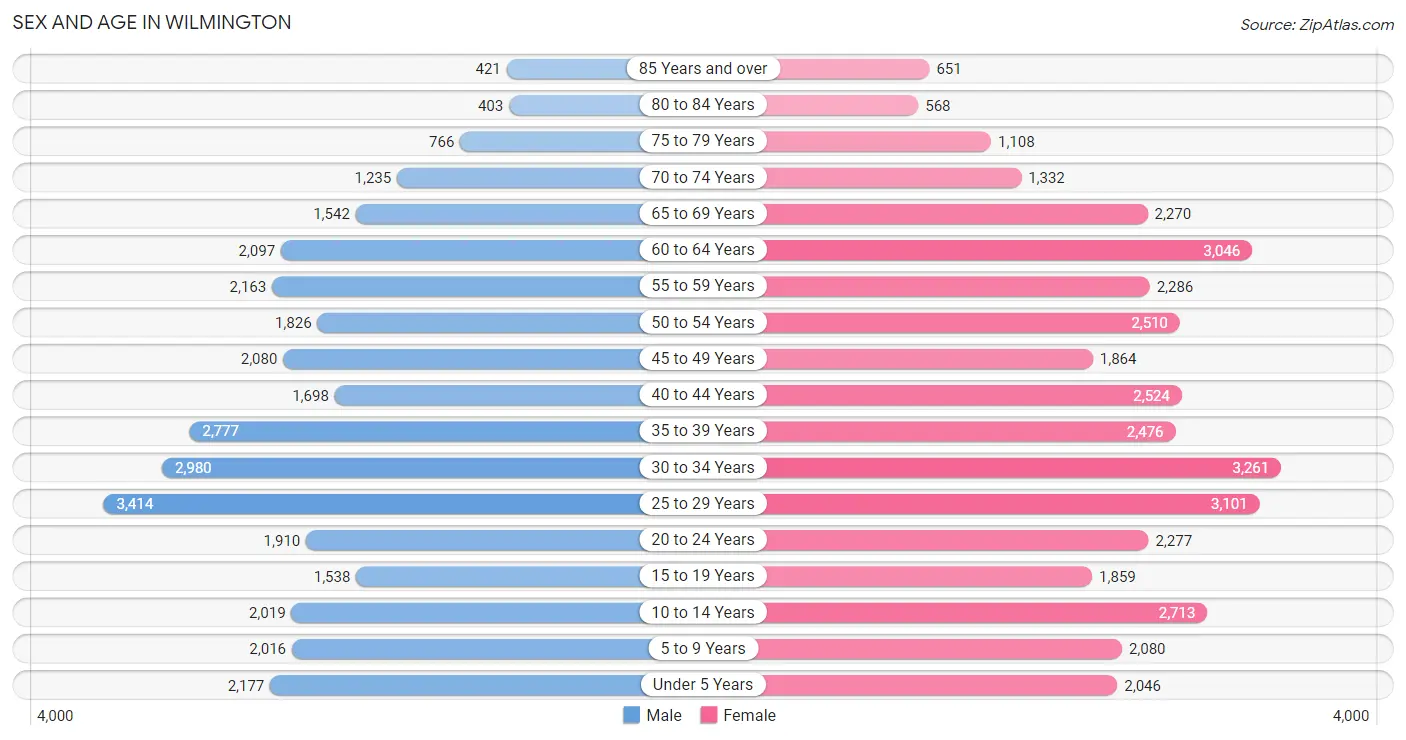
Sex and Age in Wilmington
Sex and Age in Wilmington
The most populous age groups in Wilmington are 25 to 29 Years (3,414 | 10.3%) for men and 30 to 34 Years (3,261 | 8.6%) for women.
| Age Bracket | Male | Female |
| Under 5 Years | 2,177 (6.6%) | 2,046 (5.4%) |
| 5 to 9 Years | 2,016 (6.1%) | 2,080 (5.5%) |
| 10 to 14 Years | 2,019 (6.1%) | 2,713 (7.1%) |
| 15 to 19 Years | 1,538 (4.6%) | 1,859 (4.9%) |
| 20 to 24 Years | 1,910 (5.8%) | 2,277 (6.0%) |
| 25 to 29 Years | 3,414 (10.3%) | 3,101 (8.2%) |
| 30 to 34 Years | 2,980 (9.0%) | 3,261 (8.6%) |
| 35 to 39 Years | 2,777 (8.4%) | 2,476 (6.5%) |
| 40 to 44 Years | 1,698 (5.1%) | 2,524 (6.7%) |
| 45 to 49 Years | 2,080 (6.3%) | 1,864 (4.9%) |
| 50 to 54 Years | 1,826 (5.5%) | 2,510 (6.6%) |
| 55 to 59 Years | 2,163 (6.5%) | 2,286 (6.0%) |
| 60 to 64 Years | 2,097 (6.3%) | 3,046 (8.0%) |
| 65 to 69 Years | 1,542 (4.7%) | 2,270 (6.0%) |
| 70 to 74 Years | 1,235 (3.7%) | 1,332 (3.5%) |
| 75 to 79 Years | 766 (2.3%) | 1,108 (2.9%) |
| 80 to 84 Years | 403 (1.2%) | 568 (1.5%) |
| 85 Years and over | 421 (1.3%) | 651 (1.7%) |
| Total | 33,062 (100.0%) | 37,972 (100.0%) |
Families and Households in Wilmington
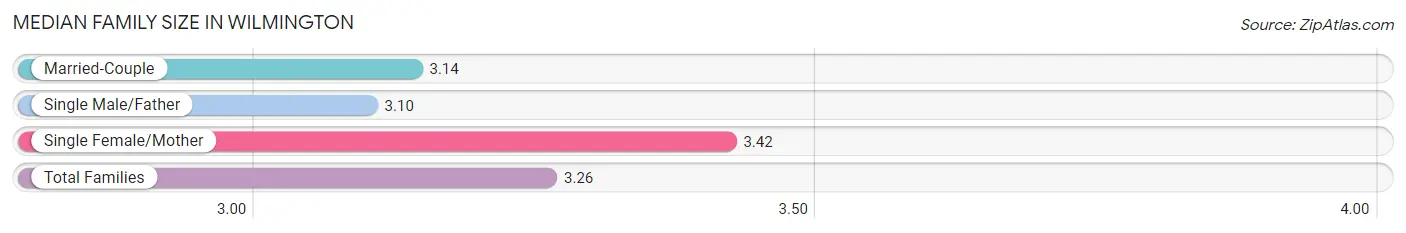
Median Family Size in Wilmington
The median family size in Wilmington is 3.26 persons per family, with single female/mother families (6,054 | 41.7%) accounting for the largest median family size of 3.42 persons per family. On the other hand, single male/father families (1,526 | 10.5%) represent the smallest median family size with 3.10 persons per family.
| Family Type | # Families | Family Size |
| Married-Couple | 6,925 (47.7%) | 3.14 |
| Single Male/Father | 1,526 (10.5%) | 3.10 |
| Single Female/Mother | 6,054 (41.7%) | 3.42 |
| Total Families | 14,505 (100.0%) | 3.26 |
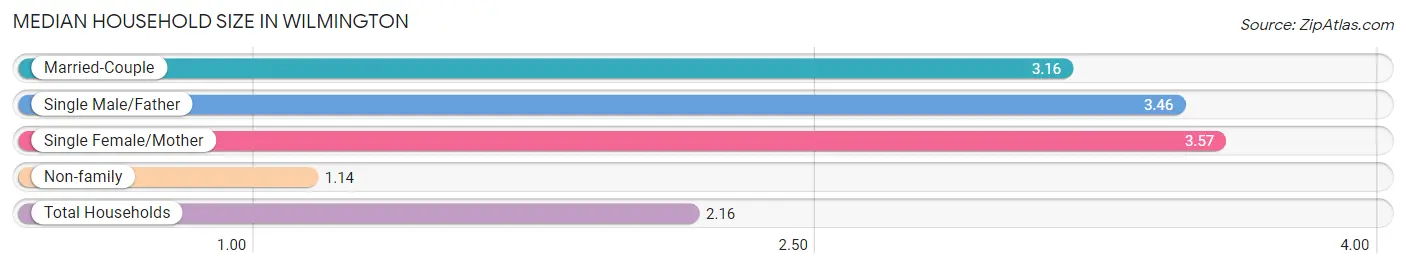
Median Household Size in Wilmington
The median household size in Wilmington is 2.16 persons per household, with single female/mother households (6,054 | 19.1%) accounting for the largest median household size of 3.57 persons per household. non-family households (17,145 | 54.2%) represent the smallest median household size with 1.14 persons per household.
| Household Type | # Households | Household Size |
| Married-Couple | 6,925 (21.9%) | 3.16 |
| Single Male/Father | 1,526 (4.8%) | 3.46 |
| Single Female/Mother | 6,054 (19.1%) | 3.57 |
| Non-family | 17,145 (54.2%) | 1.14 |
| Total Households | 31,650 (100.0%) | 2.16 |
Household Size by Marriage Status in Wilmington
Out of a total of 31,650 households in Wilmington, 14,505 (45.8%) are family households, while 17,145 (54.2%) are nonfamily households. The most numerous type of family households are 2-person households, comprising 6,381, and the most common type of nonfamily households are 1-person households, comprising 15,091.
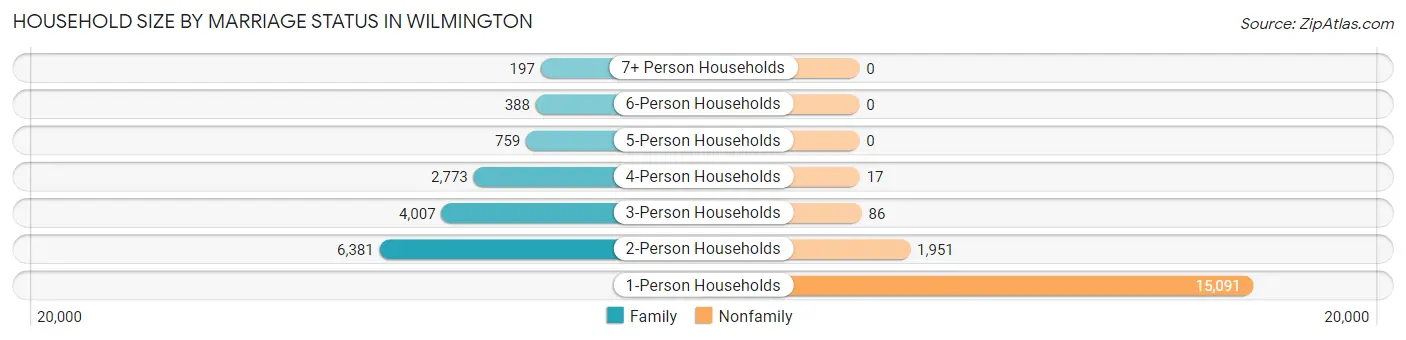
| Household Size | Family Households | Nonfamily Households |
| 1-Person Households | - | 15,091 (47.7%) |
| 2-Person Households | 6,381 (20.2%) | 1,951 (6.2%) |
| 3-Person Households | 4,007 (12.7%) | 86 (0.3%) |
| 4-Person Households | 2,773 (8.8%) | 17 (0.1%) |
| 5-Person Households | 759 (2.4%) | 0 (0.0%) |
| 6-Person Households | 388 (1.2%) | 0 (0.0%) |
| 7+ Person Households | 197 (0.6%) | 0 (0.0%) |
| Total | 14,505 (45.8%) | 17,145 (54.2%) |
Female Fertility in Wilmington
Fertility by Age in Wilmington
Average fertility rate in Wilmington is 42.0 births per 1,000 women. Women in the age bracket of 20 to 34 years have the highest fertility rate with 63.0 births per 1,000 women. Women in the age bracket of 20 to 34 years acount for 72.3% of all women with births.
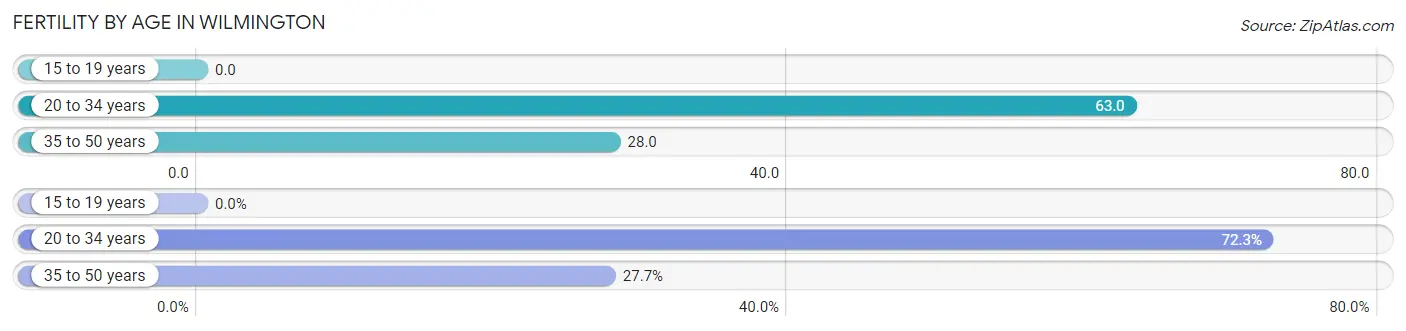
| Age Bracket | Women with Births | Births / 1,000 Women |
| 15 to 19 years | 0 (0.0%) | 0.0 |
| 20 to 34 years | 546 (72.3%) | 63.0 |
| 35 to 50 years | 209 (27.7%) | 28.0 |
| Total | 755 (100.0%) | 42.0 |
Fertility by Age by Marriage Status in Wilmington
32.7% of women with births (755) in Wilmington are married. The highest percentage of unmarried women with births falls into 20 to 34 years age bracket with 74.9% of them unmarried at the time of birth, while the lowest percentage of unmarried women with births belong to 35 to 50 years age bracket with 47.4% of them unmarried.
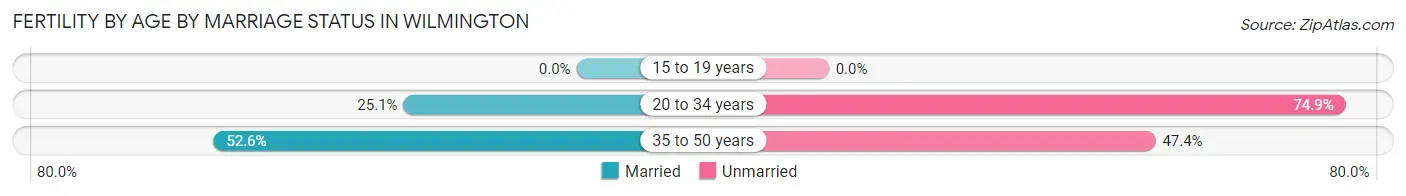
| Age Bracket | Married | Unmarried |
| 15 to 19 years | 0 (0.0%) | 0 (0.0%) |
| 20 to 34 years | 137 (25.1%) | 409 (74.9%) |
| 35 to 50 years | 110 (52.6%) | 99 (47.4%) |
| Total | 247 (32.7%) | 508 (67.3%) |
Fertility by Education in Wilmington
Average fertility rate in Wilmington is 42.0 births per 1,000 women. Women with the education attainment of college or associate's degree have the highest fertility rate of 74.0 births per 1,000 women, while women with the education attainment of bachelor's degree have the lowest fertility at 25.0 births per 1,000 women. Women with the education attainment of college or associate's degree represent 40.4% of all women with births.
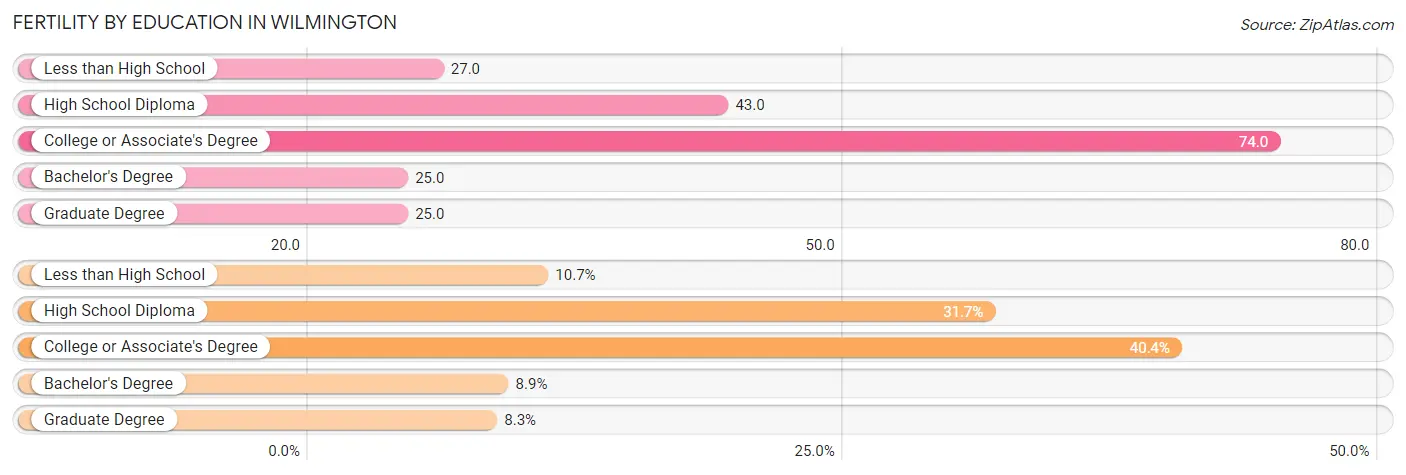
| Educational Attainment | Women with Births | Births / 1,000 Women |
| Less than High School | 81 (10.7%) | 27.0 |
| High School Diploma | 239 (31.7%) | 43.0 |
| College or Associate's Degree | 305 (40.4%) | 74.0 |
| Bachelor's Degree | 67 (8.9%) | 25.0 |
| Graduate Degree | 63 (8.3%) | 25.0 |
| Total | 755 (100.0%) | 42.0 |
Fertility by Education by Marriage Status in Wilmington
67.3% of women with births in Wilmington are unmarried. Women with the educational attainment of graduate degree are most likely to be married with 100.0% of them married at childbirth, while women with the educational attainment of less than high school are least likely to be married with 85.2% of them unmarried at childbirth.
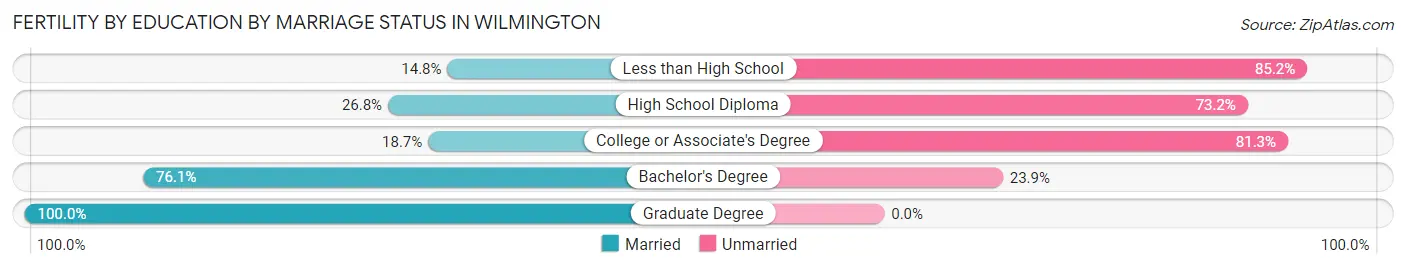
| Educational Attainment | Married | Unmarried |
| Less than High School | 12 (14.8%) | 69 (85.2%) |
| High School Diploma | 64 (26.8%) | 175 (73.2%) |
| College or Associate's Degree | 57 (18.7%) | 248 (81.3%) |
| Bachelor's Degree | 51 (76.1%) | 16 (23.9%) |
| Graduate Degree | 63 (100.0%) | 0 (0.0%) |
| Total | 247 (32.7%) | 508 (67.3%) |
Employment Characteristics in Wilmington
Employment by Class of Employer in Wilmington
Among the 33,483 employed individuals in Wilmington, private company employees (21,107 | 63.0%), not-for-profit organizations (4,363 | 13.0%), and state government employees (3,484 | 10.4%) make up the most common classes of employment.
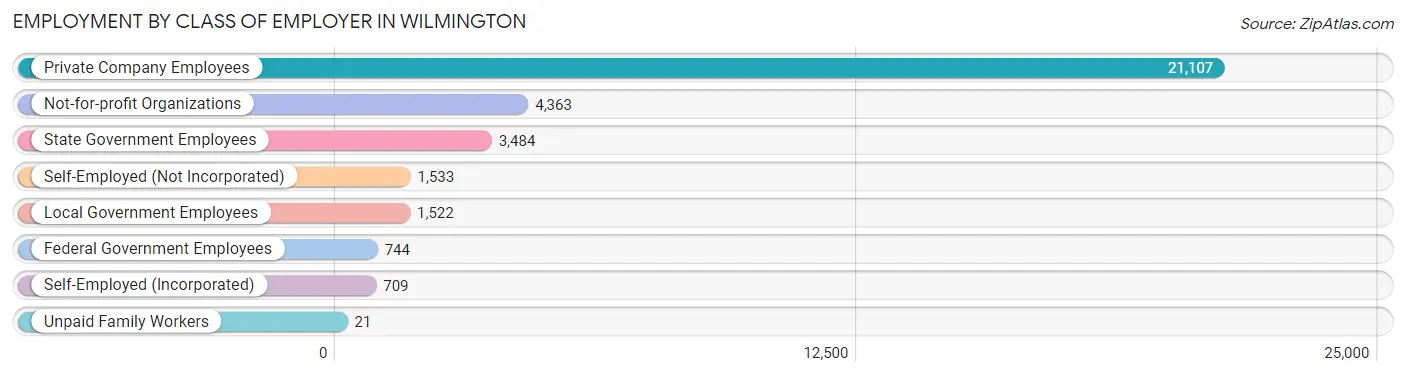
| Employer Class | # Employees | % Employees |
| Private Company Employees | 21,107 | 63.0% |
| Self-Employed (Incorporated) | 709 | 2.1% |
| Self-Employed (Not Incorporated) | 1,533 | 4.6% |
| Not-for-profit Organizations | 4,363 | 13.0% |
| Local Government Employees | 1,522 | 4.5% |
| State Government Employees | 3,484 | 10.4% |
| Federal Government Employees | 744 | 2.2% |
| Unpaid Family Workers | 21 | 0.1% |
| Total | 33,483 | 100.0% |
Employment Status by Age in Wilmington
According to the labor force statistics for Wilmington, out of the total population over 16 years of age (57,265), 65.3% or 37,394 individuals are in the labor force, with 8.6% or 3,216 of them unemployed. The age group with the highest labor force participation rate is 30 to 34 years, with 84.8% or 5,292 individuals in the labor force. Within the labor force, the 20 to 24 years age range has the highest percentage of unemployed individuals, with 22.1% or 727 of them being unemployed.
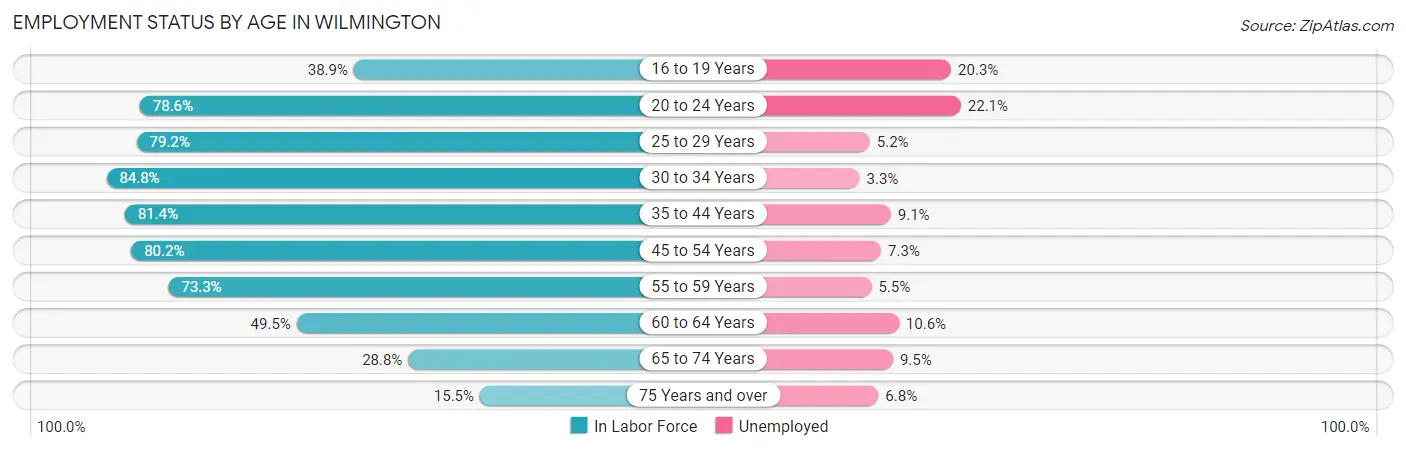
| Age Bracket | In Labor Force | Unemployed |
| 16 to 19 Years | 1,042 (38.9%) | 212 (20.3%) |
| 20 to 24 Years | 3,291 (78.6%) | 727 (22.1%) |
| 25 to 29 Years | 5,160 (79.2%) | 268 (5.2%) |
| 30 to 34 Years | 5,292 (84.8%) | 175 (3.3%) |
| 35 to 44 Years | 7,713 (81.4%) | 702 (9.1%) |
| 45 to 54 Years | 6,641 (80.2%) | 485 (7.3%) |
| 55 to 59 Years | 3,261 (73.3%) | 179 (5.5%) |
| 60 to 64 Years | 2,546 (49.5%) | 270 (10.6%) |
| 65 to 74 Years | 1,837 (28.8%) | 175 (9.5%) |
| 75 Years and over | 607 (15.5%) | 41 (6.8%) |
| Total | 37,394 (65.3%) | 3,216 (8.6%) |
Employment Status by Educational Attainment in Wilmington
According to labor force statistics for Wilmington, 76.3% of individuals (30,599) out of the total population between 25 and 64 years of age (40,103) are in the labor force, with 6.8% or 2,081 of them being unemployed. The group with the highest labor force participation rate are those with the educational attainment of bachelor's degree or higher, with 90.9% or 11,591 individuals in the labor force. Within the labor force, individuals with less than high school education have the highest percentage of unemployment, with 16.0% or 280 of them being unemployed.
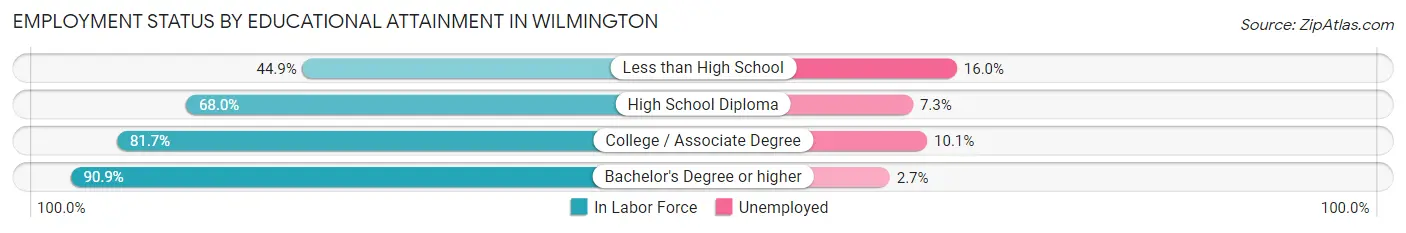
| Educational Attainment | In Labor Force | Unemployed |
| Less than High School | 1,752 (44.9%) | 624 (16.0%) |
| High School Diploma | 9,381 (68.0%) | 1,007 (7.3%) |
| College / Associate Degree | 7,887 (81.7%) | 975 (10.1%) |
| Bachelor's Degree or higher | 11,591 (90.9%) | 344 (2.7%) |
| Total | 30,599 (76.3%) | 2,727 (6.8%) |
Employment Occupations by Sex in Wilmington
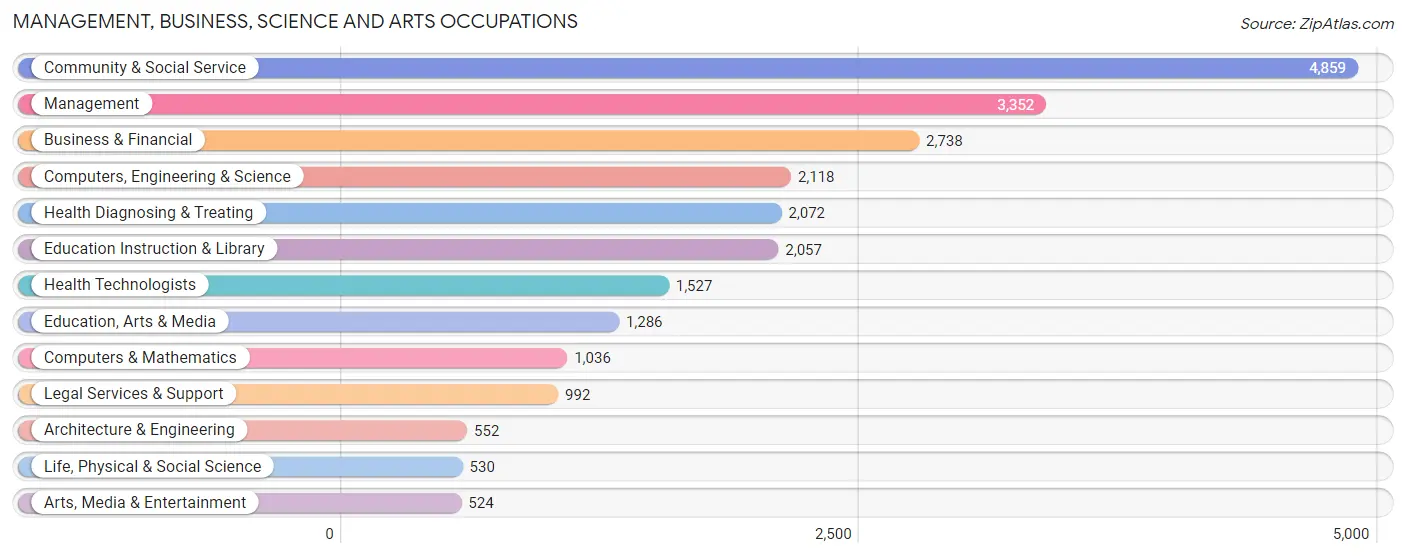
Management, Business, Science and Arts Occupations
The most common Management, Business, Science and Arts occupations in Wilmington are Community & Social Service (4,859 | 14.3%), Management (3,352 | 9.9%), Business & Financial (2,738 | 8.1%), Computers, Engineering & Science (2,118 | 6.2%), and Health Diagnosing & Treating (2,072 | 6.1%).
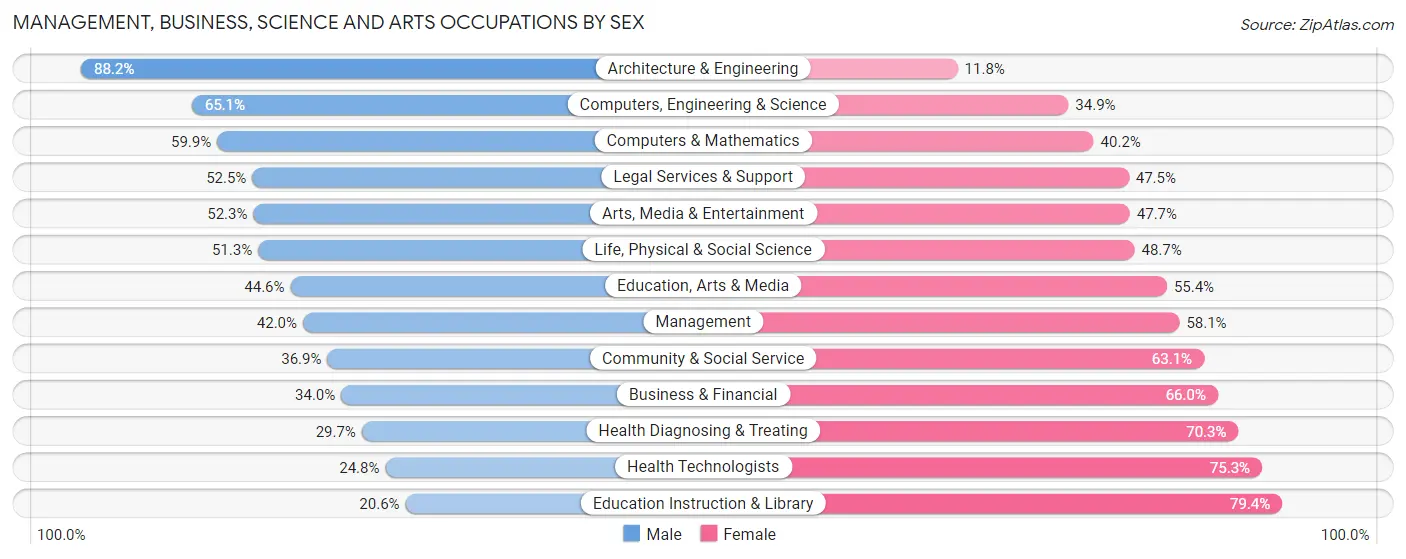
Management, Business, Science and Arts Occupations by Sex
Within the Management, Business, Science and Arts occupations in Wilmington, the most male-oriented occupations are Architecture & Engineering (88.2%), Computers, Engineering & Science (65.1%), and Computers & Mathematics (59.9%), while the most female-oriented occupations are Education Instruction & Library (79.4%), Health Technologists (75.2%), and Health Diagnosing & Treating (70.3%).
| Occupation | Male | Female |
| Management | 1,406 (41.9%) | 1,946 (58.1%) |
| Business & Financial | 930 (34.0%) | 1,808 (66.0%) |
| Computers, Engineering & Science | 1,379 (65.1%) | 739 (34.9%) |
| Computers & Mathematics | 620 (59.9%) | 416 (40.2%) |
| Architecture & Engineering | 487 (88.2%) | 65 (11.8%) |
| Life, Physical & Social Science | 272 (51.3%) | 258 (48.7%) |
| Community & Social Service | 1,791 (36.9%) | 3,068 (63.1%) |
| Education, Arts & Media | 573 (44.6%) | 713 (55.4%) |
| Legal Services & Support | 521 (52.5%) | 471 (47.5%) |
| Education Instruction & Library | 423 (20.6%) | 1,634 (79.4%) |
| Arts, Media & Entertainment | 274 (52.3%) | 250 (47.7%) |
| Health Diagnosing & Treating | 615 (29.7%) | 1,457 (70.3%) |
| Health Technologists | 378 (24.7%) | 1,149 (75.2%) |
| Total (Category) | 6,121 (40.4%) | 9,018 (59.6%) |
| Total (Overall) | 16,004 (47.1%) | 17,999 (52.9%) |
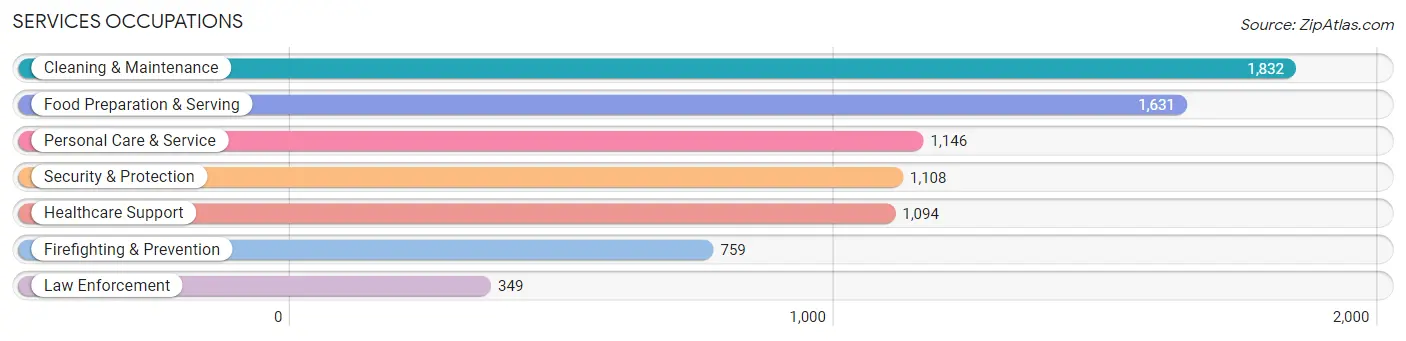
Services Occupations
The most common Services occupations in Wilmington are Cleaning & Maintenance (1,832 | 5.4%), Food Preparation & Serving (1,631 | 4.8%), Personal Care & Service (1,146 | 3.4%), Security & Protection (1,108 | 3.3%), and Healthcare Support (1,094 | 3.2%).
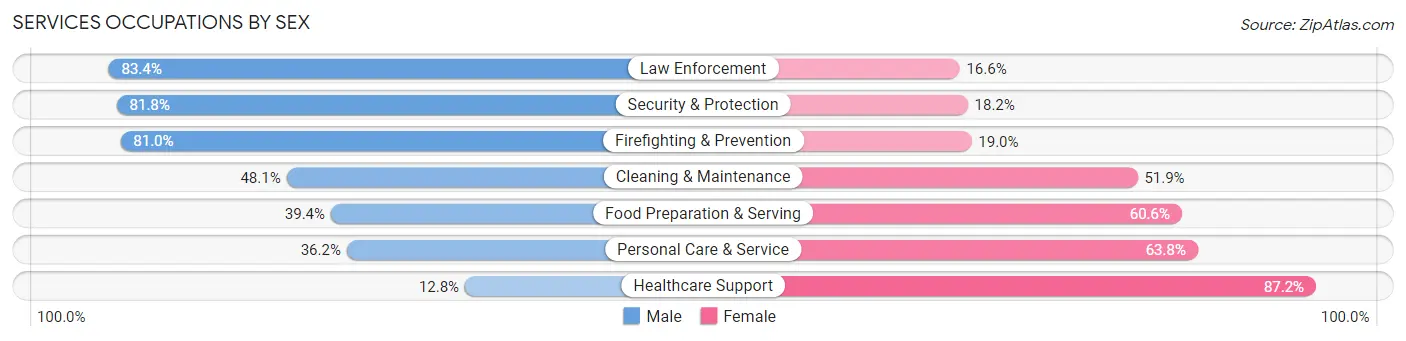
Services Occupations by Sex
Within the Services occupations in Wilmington, the most male-oriented occupations are Law Enforcement (83.4%), Security & Protection (81.8%), and Firefighting & Prevention (81.0%), while the most female-oriented occupations are Healthcare Support (87.2%), Personal Care & Service (63.8%), and Food Preparation & Serving (60.6%).
| Occupation | Male | Female |
| Healthcare Support | 140 (12.8%) | 954 (87.2%) |
| Security & Protection | 906 (81.8%) | 202 (18.2%) |
| Firefighting & Prevention | 615 (81.0%) | 144 (19.0%) |
| Law Enforcement | 291 (83.4%) | 58 (16.6%) |
| Food Preparation & Serving | 642 (39.4%) | 989 (60.6%) |
| Cleaning & Maintenance | 882 (48.1%) | 950 (51.9%) |
| Personal Care & Service | 415 (36.2%) | 731 (63.8%) |
| Total (Category) | 2,985 (43.8%) | 3,826 (56.2%) |
| Total (Overall) | 16,004 (47.1%) | 17,999 (52.9%) |
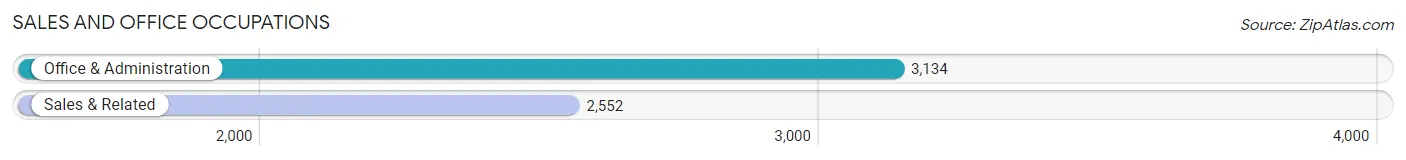
Sales and Office Occupations
The most common Sales and Office occupations in Wilmington are Office & Administration (3,134 | 9.2%), and Sales & Related (2,552 | 7.5%).
Sales and Office Occupations by Sex
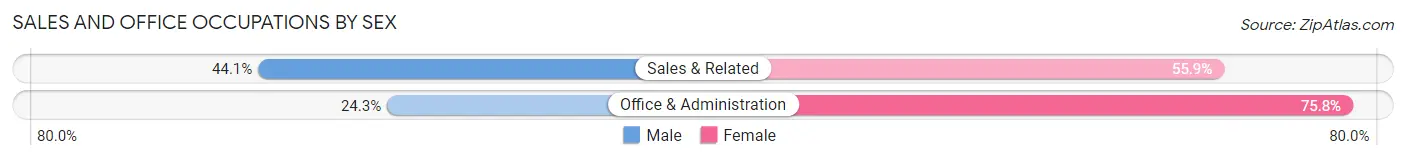
| Occupation | Male | Female |
| Sales & Related | 1,125 (44.1%) | 1,427 (55.9%) |
| Office & Administration | 760 (24.2%) | 2,374 (75.7%) |
| Total (Category) | 1,885 (33.2%) | 3,801 (66.8%) |
| Total (Overall) | 16,004 (47.1%) | 17,999 (52.9%) |
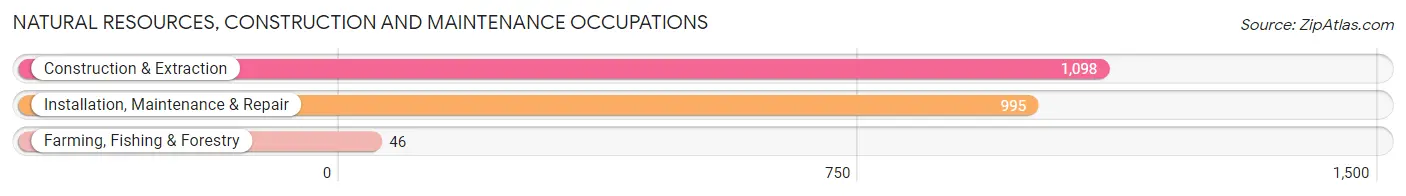
Natural Resources, Construction and Maintenance Occupations
The most common Natural Resources, Construction and Maintenance occupations in Wilmington are Construction & Extraction (1,098 | 3.2%), Installation, Maintenance & Repair (995 | 2.9%), and Farming, Fishing & Forestry (46 | 0.1%).
Natural Resources, Construction and Maintenance Occupations by Sex
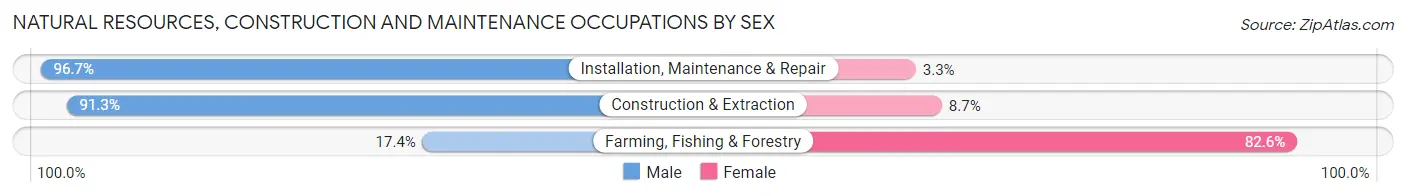
| Occupation | Male | Female |
| Farming, Fishing & Forestry | 8 (17.4%) | 38 (82.6%) |
| Construction & Extraction | 1,002 (91.3%) | 96 (8.7%) |
| Installation, Maintenance & Repair | 962 (96.7%) | 33 (3.3%) |
| Total (Category) | 1,972 (92.2%) | 167 (7.8%) |
| Total (Overall) | 16,004 (47.1%) | 17,999 (52.9%) |
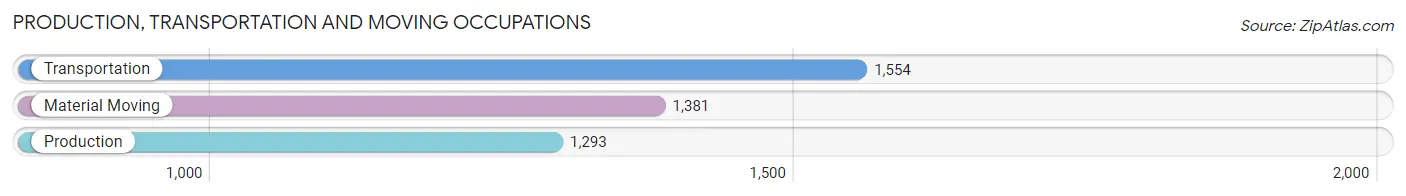
Production, Transportation and Moving Occupations
The most common Production, Transportation and Moving occupations in Wilmington are Transportation (1,554 | 4.6%), Material Moving (1,381 | 4.1%), and Production (1,293 | 3.8%).
Production, Transportation and Moving Occupations by Sex
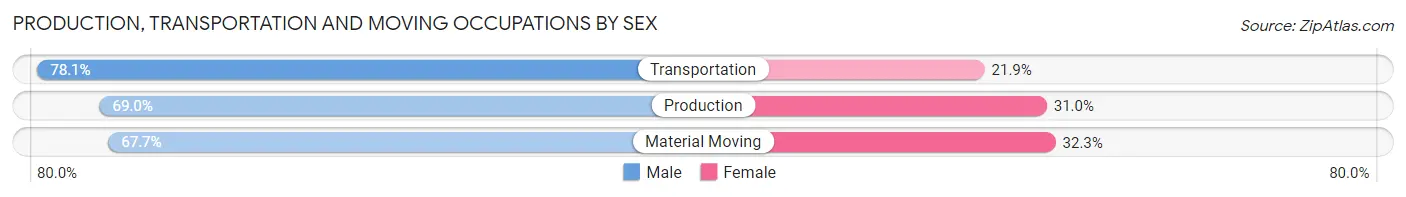
| Occupation | Male | Female |
| Production | 892 (69.0%) | 401 (31.0%) |
| Transportation | 1,214 (78.1%) | 340 (21.9%) |
| Material Moving | 935 (67.7%) | 446 (32.3%) |
| Total (Category) | 3,041 (71.9%) | 1,187 (28.1%) |
| Total (Overall) | 16,004 (47.1%) | 17,999 (52.9%) |
Employment Industries by Sex in Wilmington
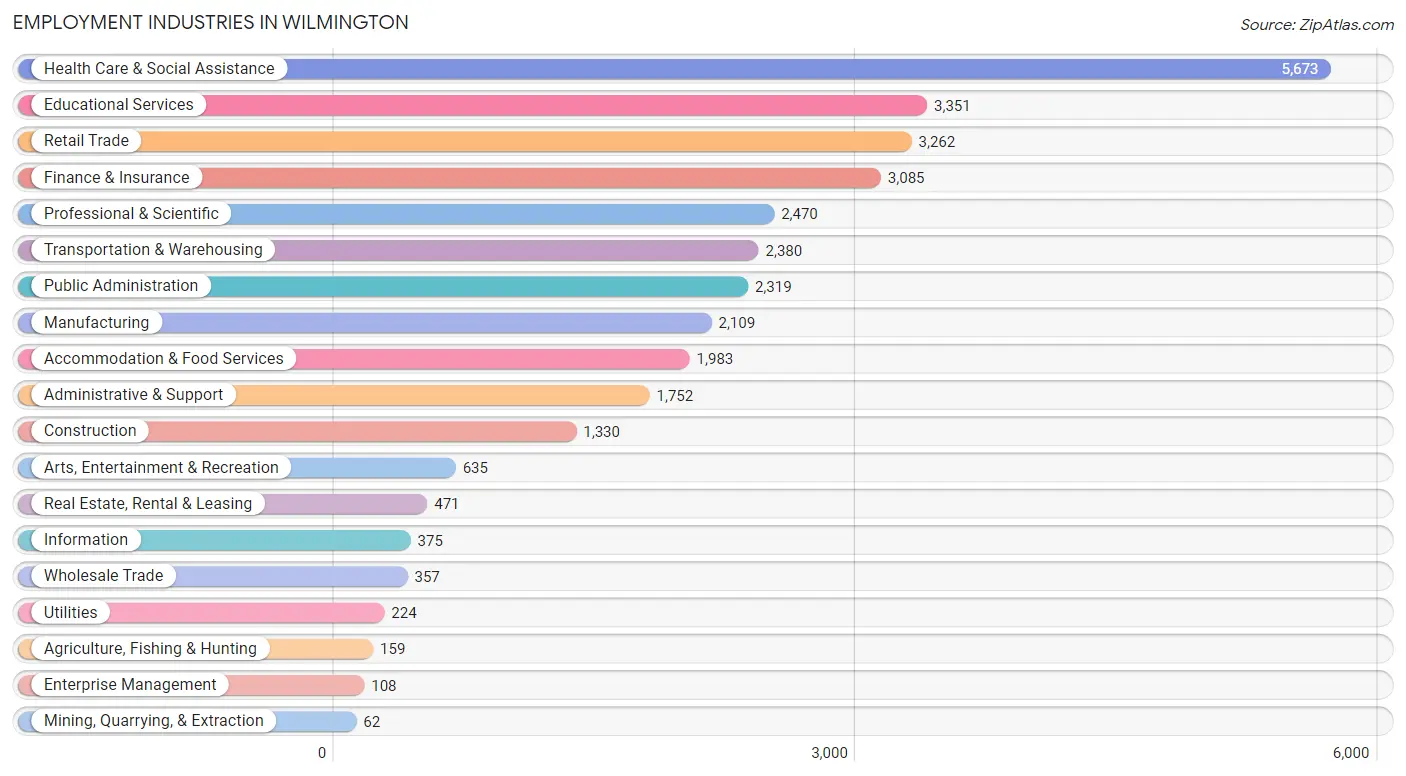
Employment Industries in Wilmington
The major employment industries in Wilmington include Health Care & Social Assistance (5,673 | 16.7%), Educational Services (3,351 | 9.9%), Retail Trade (3,262 | 9.6%), Finance & Insurance (3,085 | 9.1%), and Professional & Scientific (2,470 | 7.3%).
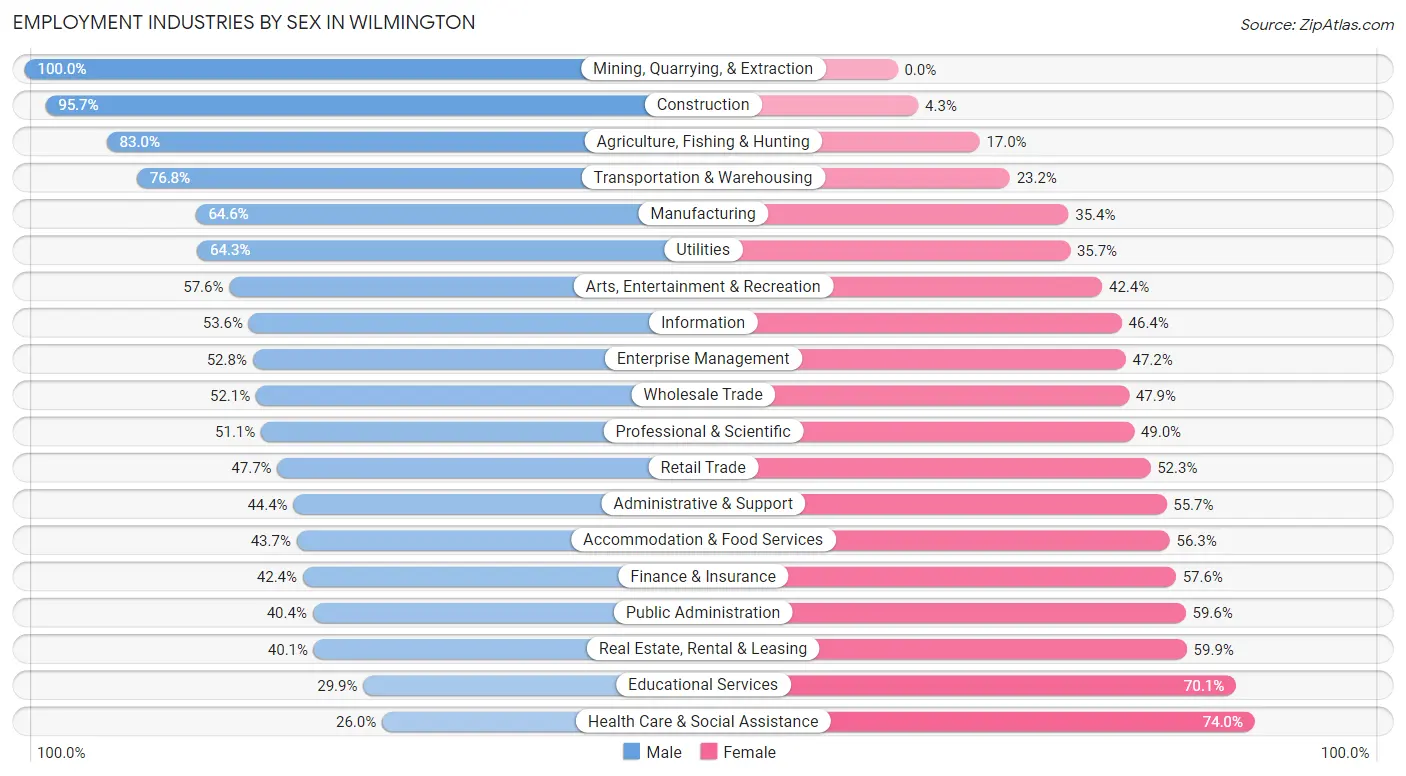
Employment Industries by Sex in Wilmington
The Wilmington industries that see more men than women are Mining, Quarrying, & Extraction (100.0%), Construction (95.7%), and Agriculture, Fishing & Hunting (83.0%), whereas the industries that tend to have a higher number of women are Health Care & Social Assistance (74.0%), Educational Services (70.1%), and Real Estate, Rental & Leasing (59.9%).
| Industry | Male | Female |
| Agriculture, Fishing & Hunting | 132 (83.0%) | 27 (17.0%) |
| Mining, Quarrying, & Extraction | 62 (100.0%) | 0 (0.0%) |
| Construction | 1,273 (95.7%) | 57 (4.3%) |
| Manufacturing | 1,363 (64.6%) | 746 (35.4%) |
| Wholesale Trade | 186 (52.1%) | 171 (47.9%) |
| Retail Trade | 1,555 (47.7%) | 1,707 (52.3%) |
| Transportation & Warehousing | 1,827 (76.8%) | 553 (23.2%) |
| Utilities | 144 (64.3%) | 80 (35.7%) |
| Information | 201 (53.6%) | 174 (46.4%) |
| Finance & Insurance | 1,308 (42.4%) | 1,777 (57.6%) |
| Real Estate, Rental & Leasing | 189 (40.1%) | 282 (59.9%) |
| Professional & Scientific | 1,261 (51.0%) | 1,209 (48.9%) |
| Enterprise Management | 57 (52.8%) | 51 (47.2%) |
| Administrative & Support | 777 (44.4%) | 975 (55.6%) |
| Educational Services | 1,002 (29.9%) | 2,349 (70.1%) |
| Health Care & Social Assistance | 1,476 (26.0%) | 4,197 (74.0%) |
| Arts, Entertainment & Recreation | 366 (57.6%) | 269 (42.4%) |
| Accommodation & Food Services | 866 (43.7%) | 1,117 (56.3%) |
| Public Administration | 936 (40.4%) | 1,383 (59.6%) |
| Total | 16,004 (47.1%) | 17,999 (52.9%) |
Education in Wilmington
School Enrollment in Wilmington
The most common levels of schooling among the 15,675 students in Wilmington are middle school (3,896 | 24.8%), elementary school (3,498 | 22.3%), and high school (3,227 | 20.6%).
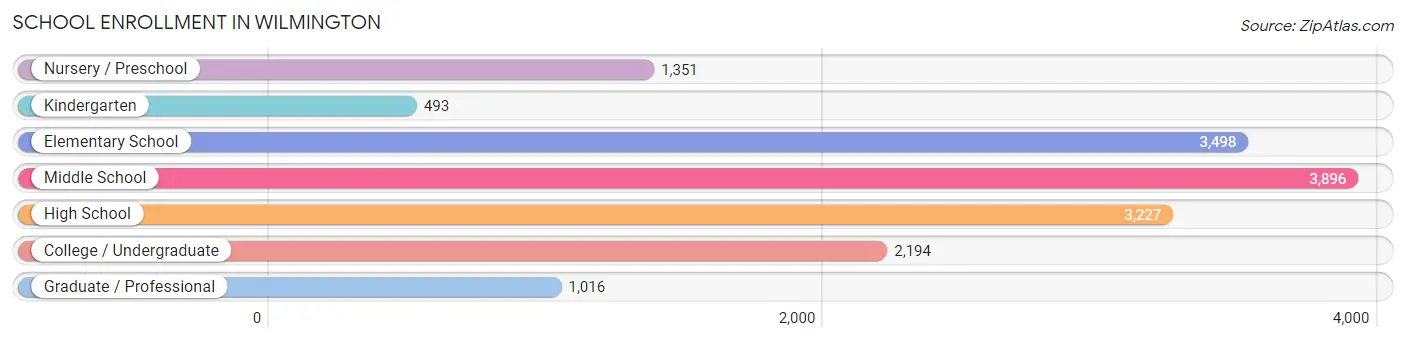
| School Level | # Students | % Students |
| Nursery / Preschool | 1,351 | 8.6% |
| Kindergarten | 493 | 3.2% |
| Elementary School | 3,498 | 22.3% |
| Middle School | 3,896 | 24.8% |
| High School | 3,227 | 20.6% |
| College / Undergraduate | 2,194 | 14.0% |
| Graduate / Professional | 1,016 | 6.5% |
| Total | 15,675 | 100.0% |
School Enrollment by Age by Funding Source in Wilmington
Out of a total of 15,675 students who are enrolled in schools in Wilmington, 2,398 (15.3%) attend a private institution, while the remaining 13,277 (84.7%) are enrolled in public schools. The age group of 20 to 24 year olds has the highest likelihood of being enrolled in private schools, with 312 (37.8% in the age bracket) enrolled. Conversely, the age group of 10 to 14 year olds has the lowest likelihood of being enrolled in a private school, with 4,320 (93.2% in the age bracket) attending a public institution.
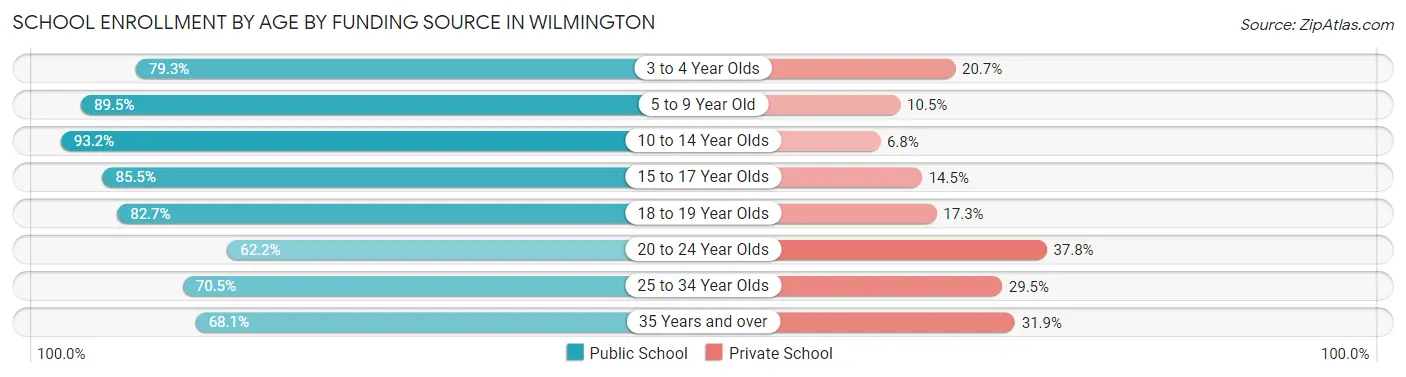
| Age Bracket | Public School | Private School |
| 3 to 4 Year Olds | 768 (79.3%) | 201 (20.7%) |
| 5 to 9 Year Old | 3,531 (89.5%) | 415 (10.5%) |
| 10 to 14 Year Olds | 4,320 (93.2%) | 313 (6.8%) |
| 15 to 17 Year Olds | 1,975 (85.5%) | 336 (14.5%) |
| 18 to 19 Year Olds | 575 (82.7%) | 120 (17.3%) |
| 20 to 24 Year Olds | 514 (62.2%) | 312 (37.8%) |
| 25 to 34 Year Olds | 778 (70.5%) | 325 (29.5%) |
| 35 Years and over | 812 (68.1%) | 380 (31.9%) |
| Total | 13,277 (84.7%) | 2,398 (15.3%) |
Educational Attainment by Field of Study in Wilmington
Business (3,243 | 18.5%), education (2,212 | 12.6%), social sciences (1,736 | 9.9%), arts & humanities (1,384 | 7.9%), and liberal arts & history (1,372 | 7.8%) are the most common fields of study among 17,523 individuals in Wilmington who have obtained a bachelor's degree or higher.
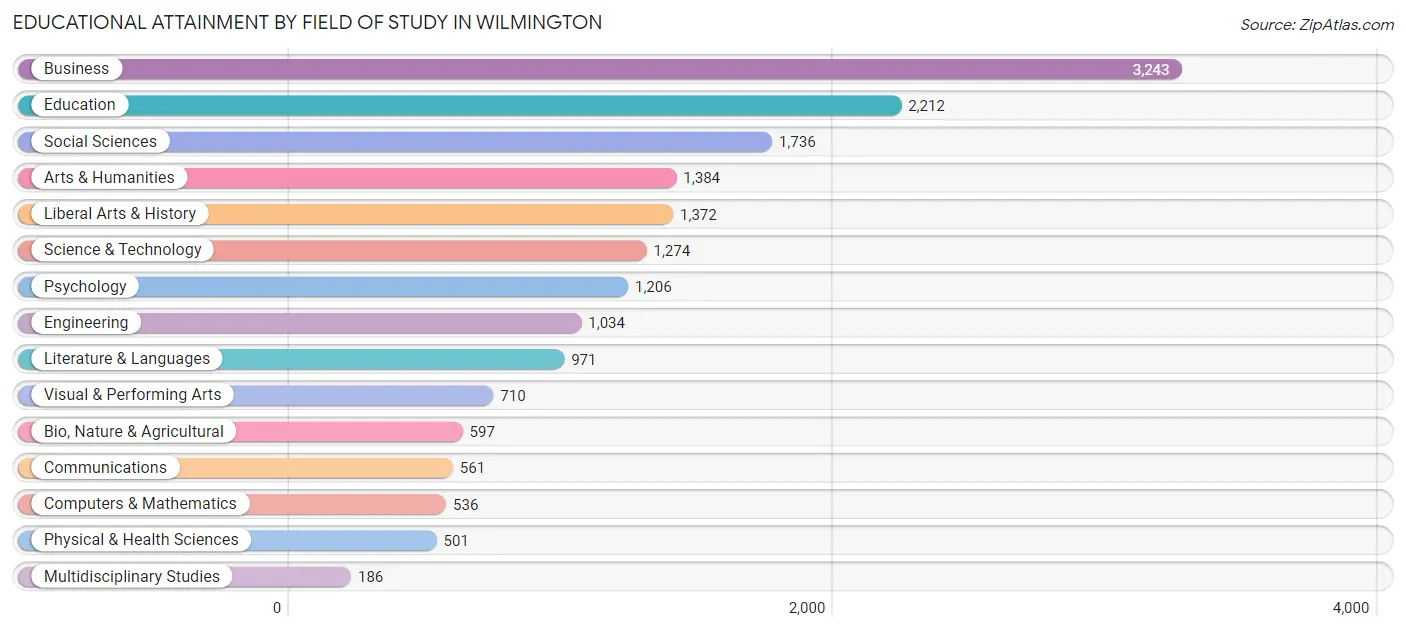
| Field of Study | # Graduates | % Graduates |
| Computers & Mathematics | 536 | 3.1% |
| Bio, Nature & Agricultural | 597 | 3.4% |
| Physical & Health Sciences | 501 | 2.9% |
| Psychology | 1,206 | 6.9% |
| Social Sciences | 1,736 | 9.9% |
| Engineering | 1,034 | 5.9% |
| Multidisciplinary Studies | 186 | 1.1% |
| Science & Technology | 1,274 | 7.3% |
| Business | 3,243 | 18.5% |
| Education | 2,212 | 12.6% |
| Literature & Languages | 971 | 5.5% |
| Liberal Arts & History | 1,372 | 7.8% |
| Visual & Performing Arts | 710 | 4.1% |
| Communications | 561 | 3.2% |
| Arts & Humanities | 1,384 | 7.9% |
| Total | 17,523 | 100.0% |
Transportation & Commute in Wilmington
Vehicle Availability by Sex in Wilmington
The most prevalent vehicle ownership categories in Wilmington are males with 2 vehicles (6,667, accounting for 42.3%) and females with 2 vehicles (6,105, making up 38.2%).
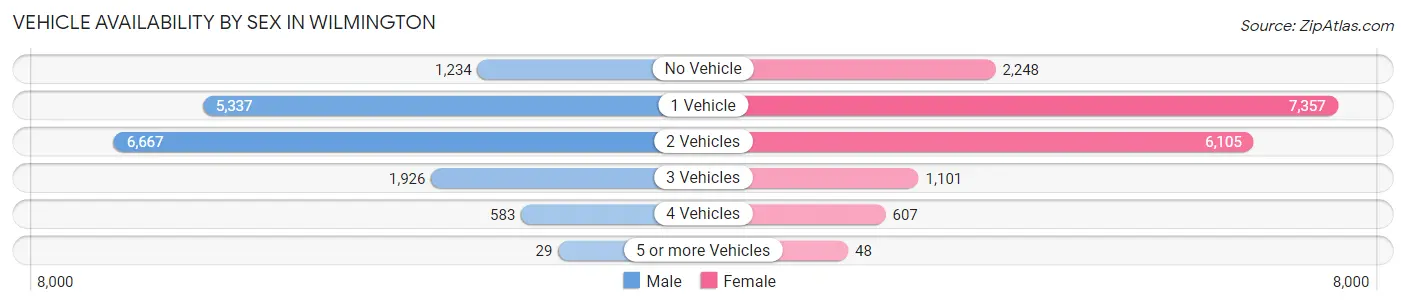
| Vehicles Available | Male | Female |
| No Vehicle | 1,234 (7.8%) | 2,248 (12.9%) |
| 1 Vehicle | 5,337 (33.8%) | 7,357 (42.1%) |
| 2 Vehicles | 6,667 (42.3%) | 6,105 (34.9%) |
| 3 Vehicles | 1,926 (12.2%) | 1,101 (6.3%) |
| 4 Vehicles | 583 (3.7%) | 607 (3.5%) |
| 5 or more Vehicles | 29 (0.2%) | 48 (0.3%) |
| Total | 15,776 (100.0%) | 17,466 (100.0%) |
Commute Time in Wilmington
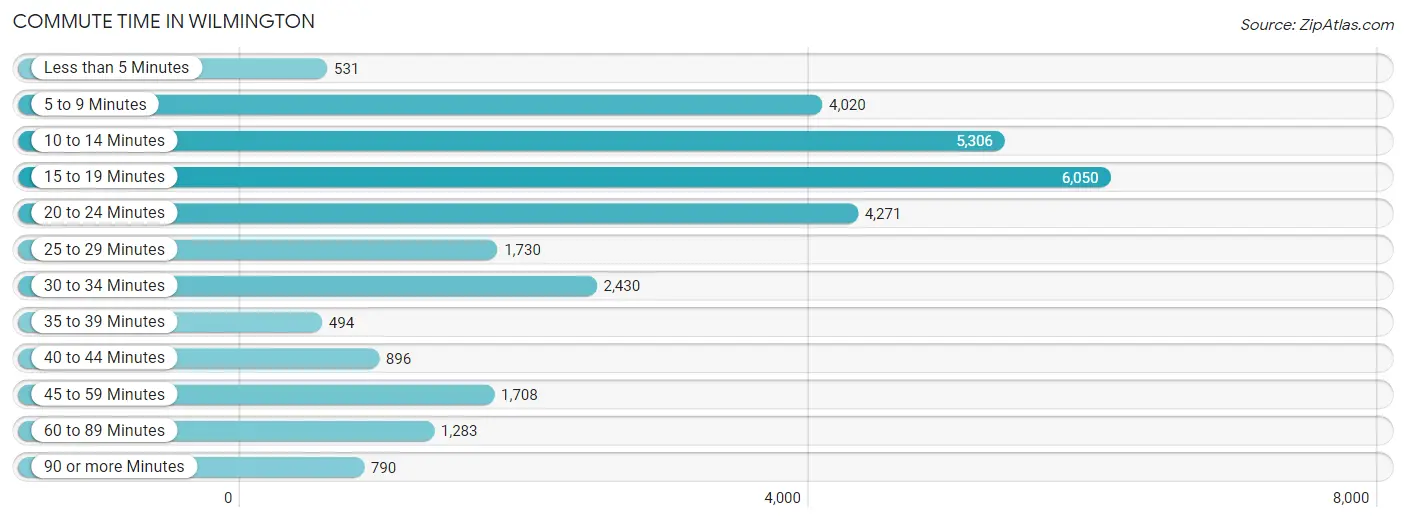
The most frequently occuring commute durations in Wilmington are 15 to 19 minutes (6,050 commuters, 20.5%), 10 to 14 minutes (5,306 commuters, 18.0%), and 20 to 24 minutes (4,271 commuters, 14.5%).
| Commute Time | # Commuters | % Commuters |
| Less than 5 Minutes | 531 | 1.8% |
| 5 to 9 Minutes | 4,020 | 13.6% |
| 10 to 14 Minutes | 5,306 | 18.0% |
| 15 to 19 Minutes | 6,050 | 20.5% |
| 20 to 24 Minutes | 4,271 | 14.5% |
| 25 to 29 Minutes | 1,730 | 5.9% |
| 30 to 34 Minutes | 2,430 | 8.2% |
| 35 to 39 Minutes | 494 | 1.7% |
| 40 to 44 Minutes | 896 | 3.0% |
| 45 to 59 Minutes | 1,708 | 5.8% |
| 60 to 89 Minutes | 1,283 | 4.3% |
| 90 or more Minutes | 790 | 2.7% |
Commute Time by Sex in Wilmington
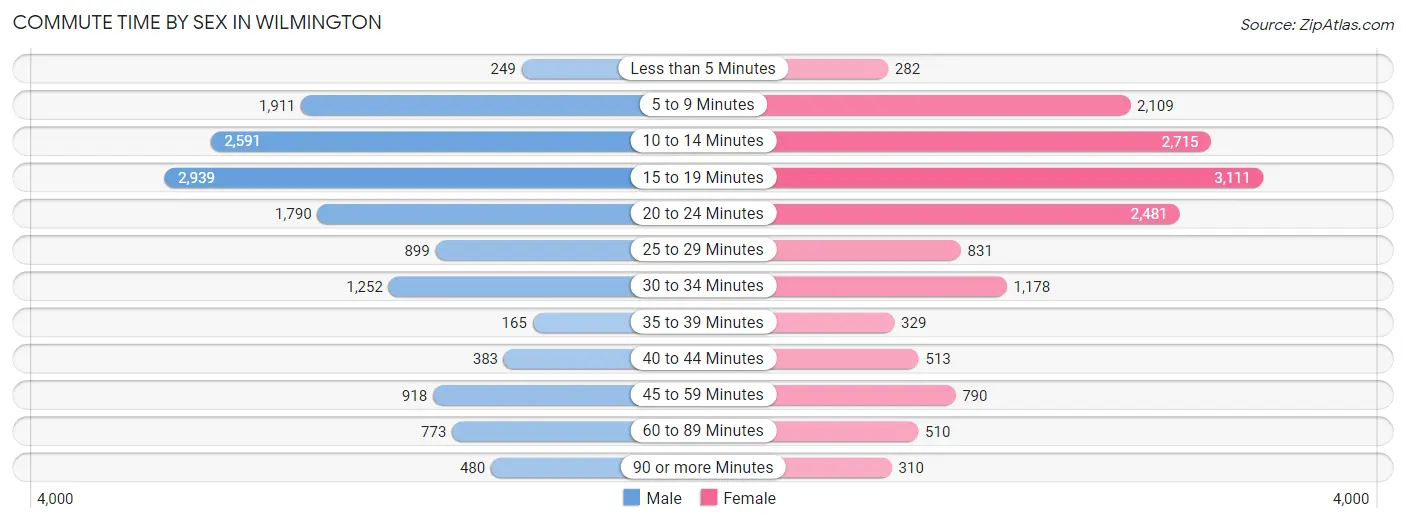
The most common commute times in Wilmington are 15 to 19 minutes (2,939 commuters, 20.5%) for males and 15 to 19 minutes (3,111 commuters, 20.5%) for females.
| Commute Time | Male | Female |
| Less than 5 Minutes | 249 (1.7%) | 282 (1.9%) |
| 5 to 9 Minutes | 1,911 (13.3%) | 2,109 (13.9%) |
| 10 to 14 Minutes | 2,591 (18.1%) | 2,715 (17.9%) |
| 15 to 19 Minutes | 2,939 (20.5%) | 3,111 (20.5%) |
| 20 to 24 Minutes | 1,790 (12.5%) | 2,481 (16.4%) |
| 25 to 29 Minutes | 899 (6.3%) | 831 (5.5%) |
| 30 to 34 Minutes | 1,252 (8.7%) | 1,178 (7.8%) |
| 35 to 39 Minutes | 165 (1.1%) | 329 (2.2%) |
| 40 to 44 Minutes | 383 (2.7%) | 513 (3.4%) |
| 45 to 59 Minutes | 918 (6.4%) | 790 (5.2%) |
| 60 to 89 Minutes | 773 (5.4%) | 510 (3.4%) |
| 90 or more Minutes | 480 (3.3%) | 310 (2.0%) |
Time of Departure to Work by Sex in Wilmington
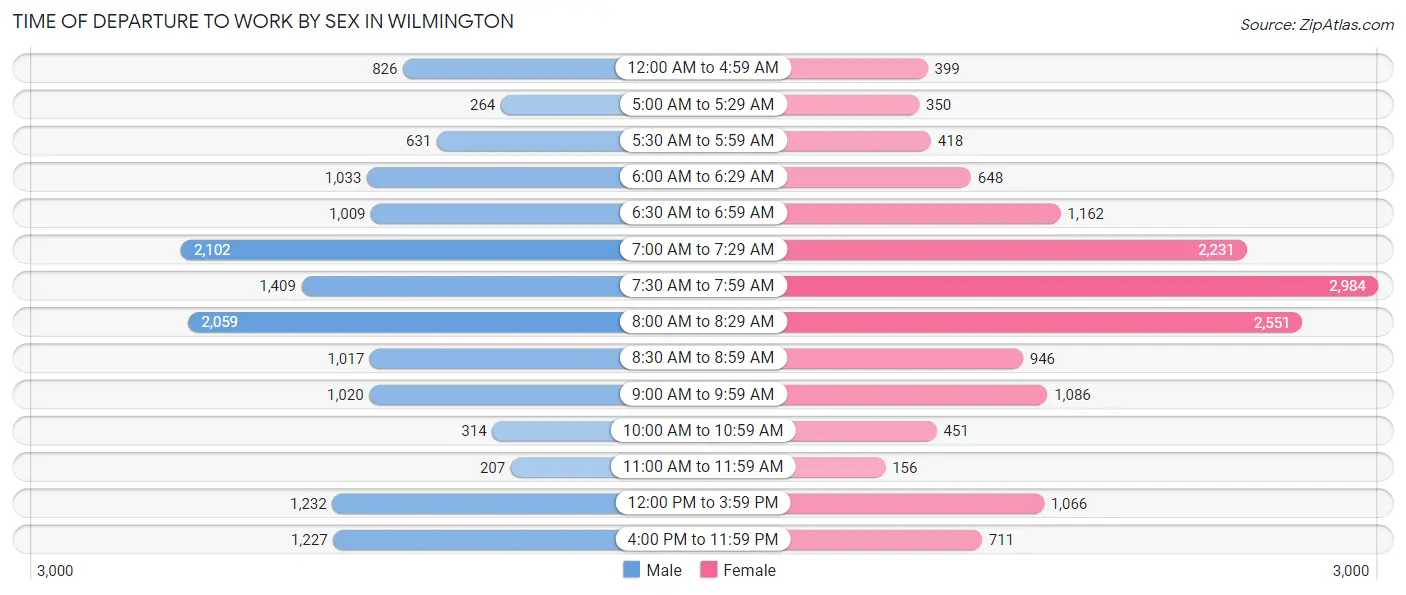
The most frequent times of departure to work in Wilmington are 7:00 AM to 7:29 AM (2,102, 14.6%) for males and 7:30 AM to 7:59 AM (2,984, 19.7%) for females.
| Time of Departure | Male | Female |
| 12:00 AM to 4:59 AM | 826 (5.8%) | 399 (2.6%) |
| 5:00 AM to 5:29 AM | 264 (1.8%) | 350 (2.3%) |
| 5:30 AM to 5:59 AM | 631 (4.4%) | 418 (2.8%) |
| 6:00 AM to 6:29 AM | 1,033 (7.2%) | 648 (4.3%) |
| 6:30 AM to 6:59 AM | 1,009 (7.0%) | 1,162 (7.7%) |
| 7:00 AM to 7:29 AM | 2,102 (14.6%) | 2,231 (14.7%) |
| 7:30 AM to 7:59 AM | 1,409 (9.8%) | 2,984 (19.7%) |
| 8:00 AM to 8:29 AM | 2,059 (14.3%) | 2,551 (16.8%) |
| 8:30 AM to 8:59 AM | 1,017 (7.1%) | 946 (6.2%) |
| 9:00 AM to 9:59 AM | 1,020 (7.1%) | 1,086 (7.2%) |
| 10:00 AM to 10:59 AM | 314 (2.2%) | 451 (3.0%) |
| 11:00 AM to 11:59 AM | 207 (1.4%) | 156 (1.0%) |
| 12:00 PM to 3:59 PM | 1,232 (8.6%) | 1,066 (7.0%) |
| 4:00 PM to 11:59 PM | 1,227 (8.6%) | 711 (4.7%) |
| Total | 14,350 (100.0%) | 15,159 (100.0%) |
Housing Occupancy in Wilmington
Occupancy by Ownership in Wilmington
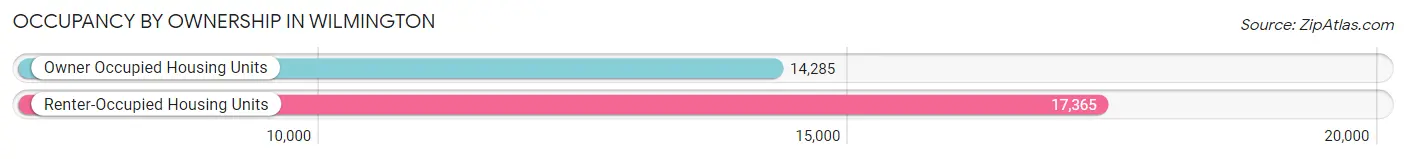
Of the total 31,650 dwellings in Wilmington, owner-occupied units account for 14,285 (45.1%), while renter-occupied units make up 17,365 (54.9%).
| Occupancy | # Housing Units | % Housing Units |
| Owner Occupied Housing Units | 14,285 | 45.1% |
| Renter-Occupied Housing Units | 17,365 | 54.9% |
| Total Occupied Housing Units | 31,650 | 100.0% |
Occupancy by Household Size in Wilmington
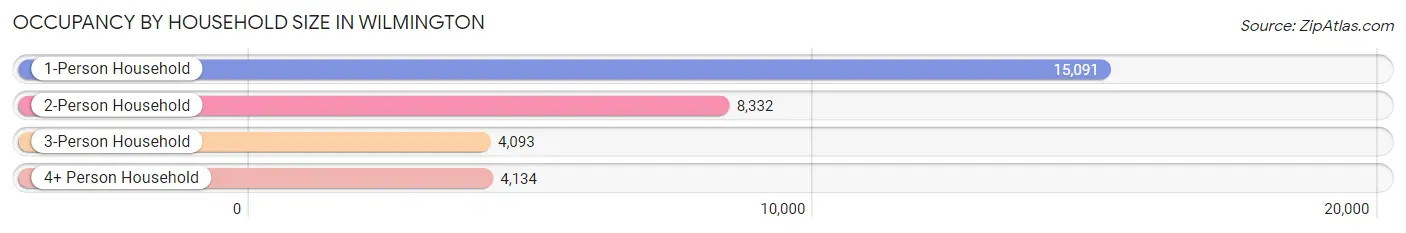
| Household Size | # Housing Units | % Housing Units |
| 1-Person Household | 15,091 | 47.7% |
| 2-Person Household | 8,332 | 26.3% |
| 3-Person Household | 4,093 | 12.9% |
| 4+ Person Household | 4,134 | 13.1% |
| Total Housing Units | 31,650 | 100.0% |
Occupancy by Ownership by Household Size in Wilmington
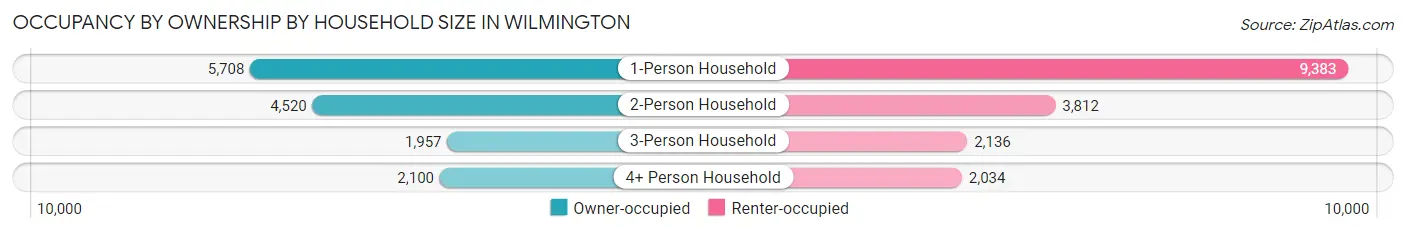
| Household Size | Owner-occupied | Renter-occupied |
| 1-Person Household | 5,708 (37.8%) | 9,383 (62.2%) |
| 2-Person Household | 4,520 (54.2%) | 3,812 (45.8%) |
| 3-Person Household | 1,957 (47.8%) | 2,136 (52.2%) |
| 4+ Person Household | 2,100 (50.8%) | 2,034 (49.2%) |
| Total Housing Units | 14,285 (45.1%) | 17,365 (54.9%) |
Occupancy by Educational Attainment in Wilmington
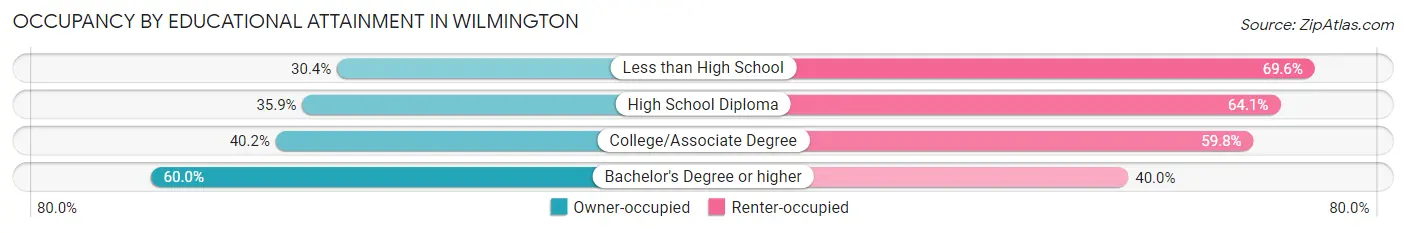
| Household Size | Owner-occupied | Renter-occupied |
| Less than High School | 887 (30.4%) | 2,028 (69.6%) |
| High School Diploma | 3,557 (35.9%) | 6,343 (64.1%) |
| College/Associate Degree | 2,960 (40.2%) | 4,409 (59.8%) |
| Bachelor's Degree or higher | 6,881 (60.0%) | 4,585 (40.0%) |
Occupancy by Age of Householder in Wilmington
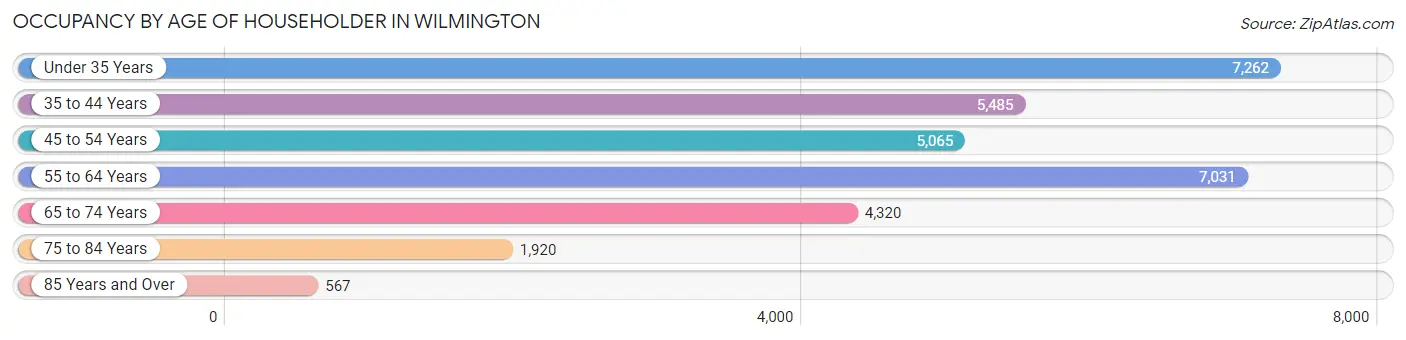
| Age Bracket | # Households | % Households |
| Under 35 Years | 7,262 | 22.9% |
| 35 to 44 Years | 5,485 | 17.3% |
| 45 to 54 Years | 5,065 | 16.0% |
| 55 to 64 Years | 7,031 | 22.2% |
| 65 to 74 Years | 4,320 | 13.7% |
| 75 to 84 Years | 1,920 | 6.1% |
| 85 Years and Over | 567 | 1.8% |
| Total | 31,650 | 100.0% |
Housing Finances in Wilmington
Median Income by Occupancy in Wilmington
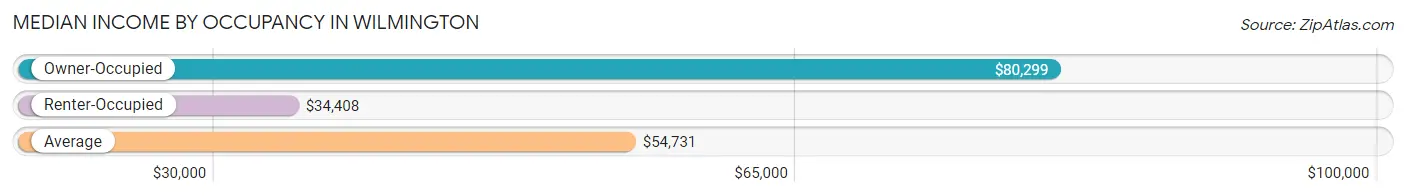
| Occupancy Type | # Households | Median Income |
| Owner-Occupied | 14,285 (45.1%) | $80,299 |
| Renter-Occupied | 17,365 (54.9%) | $34,408 |
| Average | 31,650 (100.0%) | $54,731 |
Occupancy by Householder Income Bracket in Wilmington
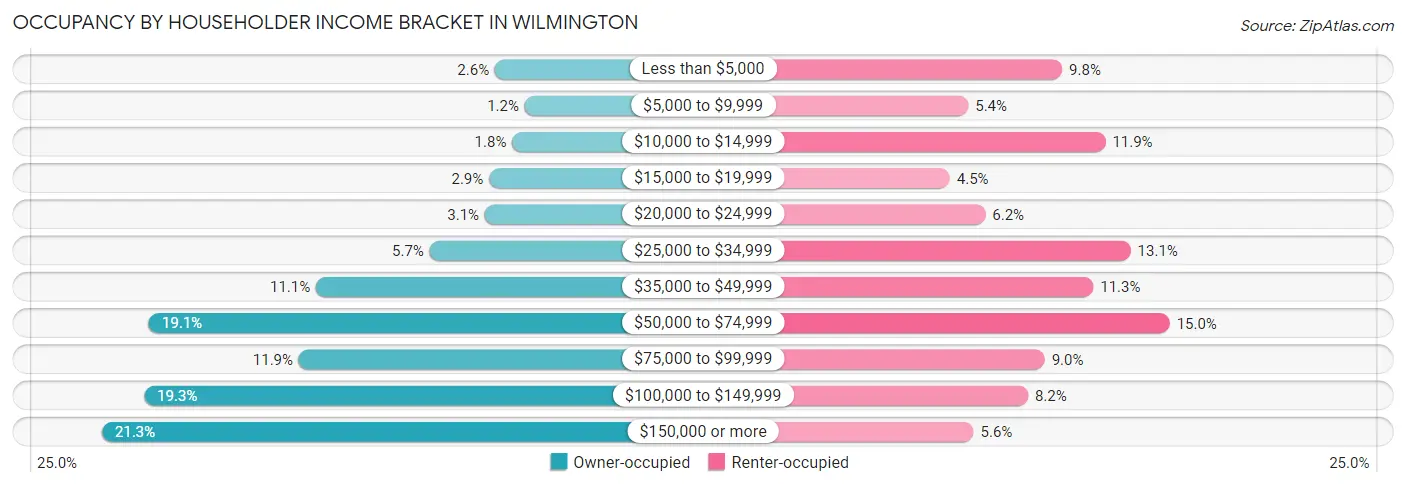
| Income Bracket | Owner-occupied | Renter-occupied |
| Less than $5,000 | 371 (2.6%) | 1,709 (9.8%) |
| $5,000 to $9,999 | 168 (1.2%) | 933 (5.4%) |
| $10,000 to $14,999 | 254 (1.8%) | 2,066 (11.9%) |
| $15,000 to $19,999 | 412 (2.9%) | 779 (4.5%) |
| $20,000 to $24,999 | 440 (3.1%) | 1,074 (6.2%) |
| $25,000 to $34,999 | 816 (5.7%) | 2,275 (13.1%) |
| $35,000 to $49,999 | 1,589 (11.1%) | 1,965 (11.3%) |
| $50,000 to $74,999 | 2,726 (19.1%) | 2,597 (15.0%) |
| $75,000 to $99,999 | 1,706 (11.9%) | 1,565 (9.0%) |
| $100,000 to $149,999 | 2,758 (19.3%) | 1,426 (8.2%) |
| $150,000 or more | 3,045 (21.3%) | 976 (5.6%) |
| Total | 14,285 (100.0%) | 17,365 (100.0%) |
Monthly Housing Cost Tiers in Wilmington
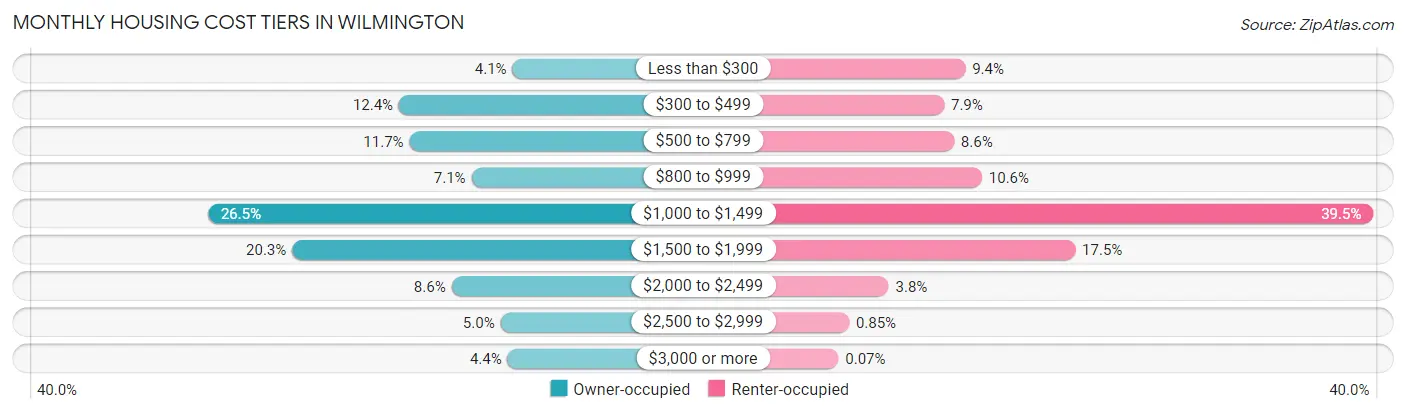
| Monthly Cost | Owner-occupied | Renter-occupied |
| Less than $300 | 582 (4.1%) | 1,634 (9.4%) |
| $300 to $499 | 1,775 (12.4%) | 1,364 (7.9%) |
| $500 to $799 | 1,665 (11.7%) | 1,490 (8.6%) |
| $800 to $999 | 1,013 (7.1%) | 1,848 (10.6%) |
| $1,000 to $1,499 | 3,787 (26.5%) | 6,852 (39.5%) |
| $1,500 to $1,999 | 2,900 (20.3%) | 3,041 (17.5%) |
| $2,000 to $2,499 | 1,223 (8.6%) | 654 (3.8%) |
| $2,500 to $2,999 | 707 (5.0%) | 147 (0.9%) |
| $3,000 or more | 633 (4.4%) | 13 (0.1%) |
| Total | 14,285 (100.0%) | 17,365 (100.0%) |
Physical Housing Characteristics in Wilmington
Housing Structures in Wilmington
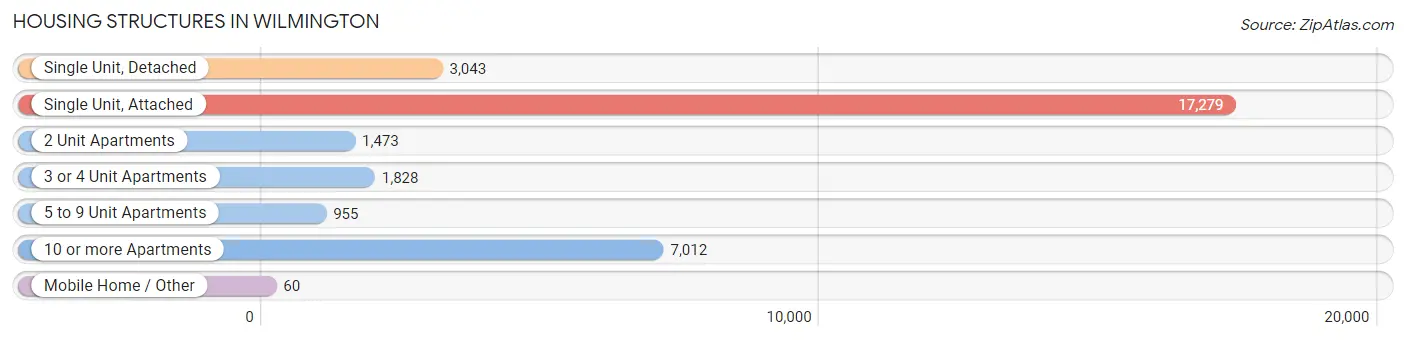
| Structure Type | # Housing Units | % Housing Units |
| Single Unit, Detached | 3,043 | 9.6% |
| Single Unit, Attached | 17,279 | 54.6% |
| 2 Unit Apartments | 1,473 | 4.6% |
| 3 or 4 Unit Apartments | 1,828 | 5.8% |
| 5 to 9 Unit Apartments | 955 | 3.0% |
| 10 or more Apartments | 7,012 | 22.2% |
| Mobile Home / Other | 60 | 0.2% |
| Total | 31,650 | 100.0% |
Housing Structures by Occupancy in Wilmington
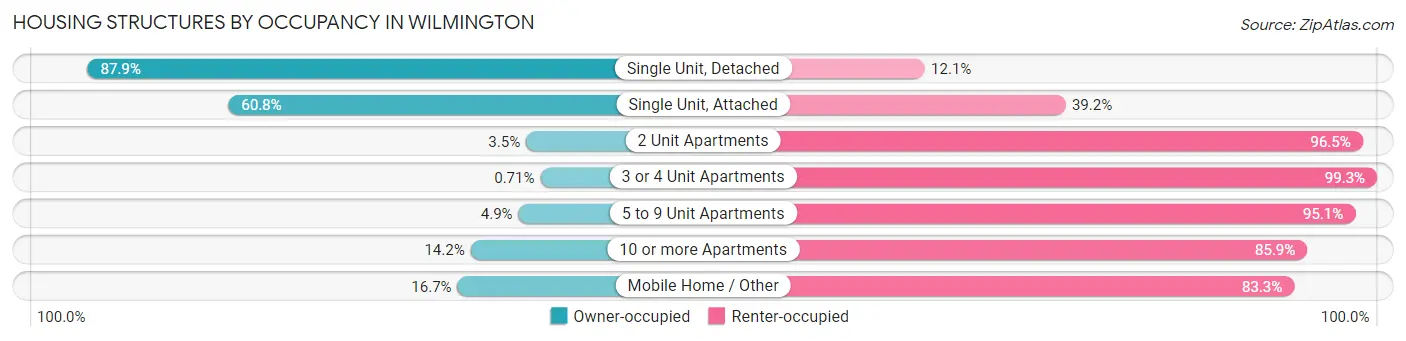
| Structure Type | Owner-occupied | Renter-occupied |
| Single Unit, Detached | 2,674 (87.9%) | 369 (12.1%) |
| Single Unit, Attached | 10,498 (60.8%) | 6,781 (39.2%) |
| 2 Unit Apartments | 51 (3.5%) | 1,422 (96.5%) |
| 3 or 4 Unit Apartments | 13 (0.7%) | 1,815 (99.3%) |
| 5 to 9 Unit Apartments | 47 (4.9%) | 908 (95.1%) |
| 10 or more Apartments | 992 (14.1%) | 6,020 (85.9%) |
| Mobile Home / Other | 10 (16.7%) | 50 (83.3%) |
| Total | 14,285 (45.1%) | 17,365 (54.9%) |
Housing Structures by Number of Rooms in Wilmington
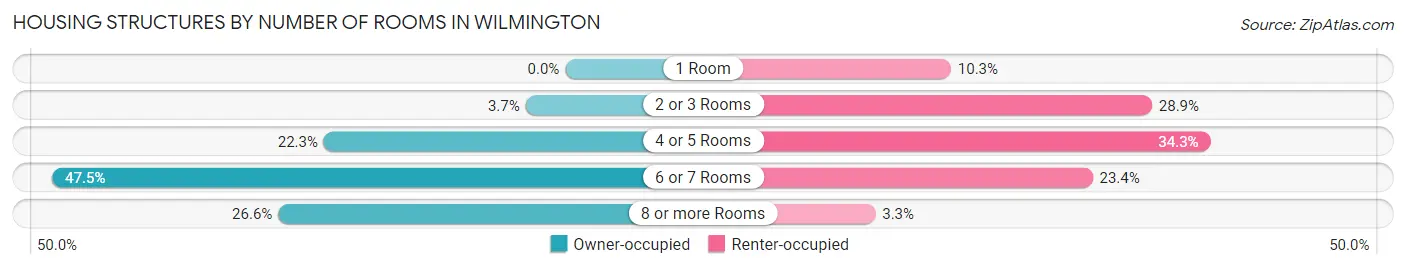
| Number of Rooms | Owner-occupied | Renter-occupied |
| 1 Room | 0 (0.0%) | 1,782 (10.3%) |
| 2 or 3 Rooms | 524 (3.7%) | 5,010 (28.8%) |
| 4 or 5 Rooms | 3,190 (22.3%) | 5,949 (34.3%) |
| 6 or 7 Rooms | 6,779 (47.5%) | 4,057 (23.4%) |
| 8 or more Rooms | 3,792 (26.6%) | 567 (3.3%) |
| Total | 14,285 (100.0%) | 17,365 (100.0%) |
Housing Structure by Heating Type in Wilmington
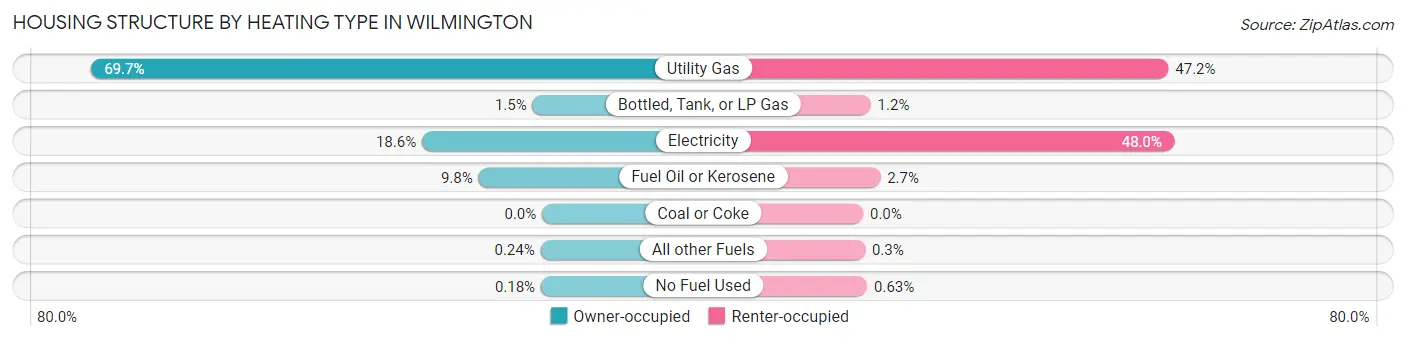
| Heating Type | Owner-occupied | Renter-occupied |
| Utility Gas | 9,957 (69.7%) | 8,197 (47.2%) |
| Bottled, Tank, or LP Gas | 211 (1.5%) | 205 (1.2%) |
| Electricity | 2,653 (18.6%) | 8,340 (48.0%) |
| Fuel Oil or Kerosene | 1,404 (9.8%) | 462 (2.7%) |
| Coal or Coke | 0 (0.0%) | 0 (0.0%) |
| All other Fuels | 34 (0.2%) | 52 (0.3%) |
| No Fuel Used | 26 (0.2%) | 109 (0.6%) |
| Total | 14,285 (100.0%) | 17,365 (100.0%) |
Household Vehicle Usage in Wilmington
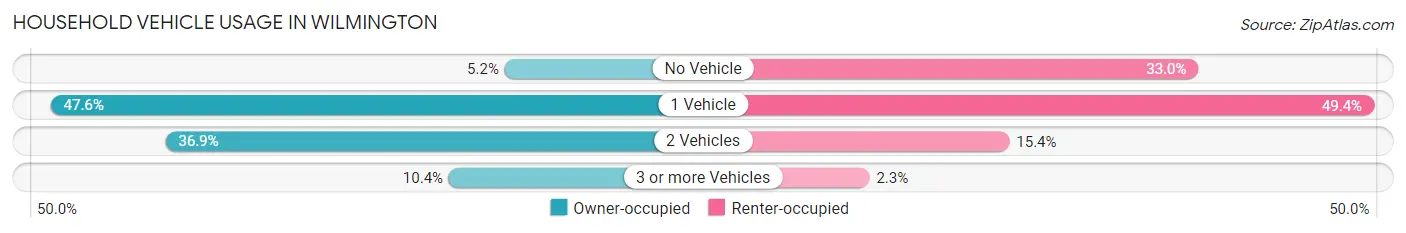
| Vehicles per Household | Owner-occupied | Renter-occupied |
| No Vehicle | 740 (5.2%) | 5,728 (33.0%) |
| 1 Vehicle | 6,796 (47.6%) | 8,574 (49.4%) |
| 2 Vehicles | 5,265 (36.9%) | 2,666 (15.3%) |
| 3 or more Vehicles | 1,484 (10.4%) | 397 (2.3%) |
| Total | 14,285 (100.0%) | 17,365 (100.0%) |
Real Estate & Mortgages in Wilmington
Real Estate and Mortgage Overview in Wilmington
| Characteristic | Without Mortgage | With Mortgage |
| Housing Units | 4,281 | 10,004 |
| Median Property Value | $164,900 | $220,700 |
| Median Household Income | $63,216 | $2,471 |
| Monthly Housing Costs | $489 | $607 |
| Real Estate Taxes | $1,604 | $444 |
Property Value by Mortgage Status in Wilmington
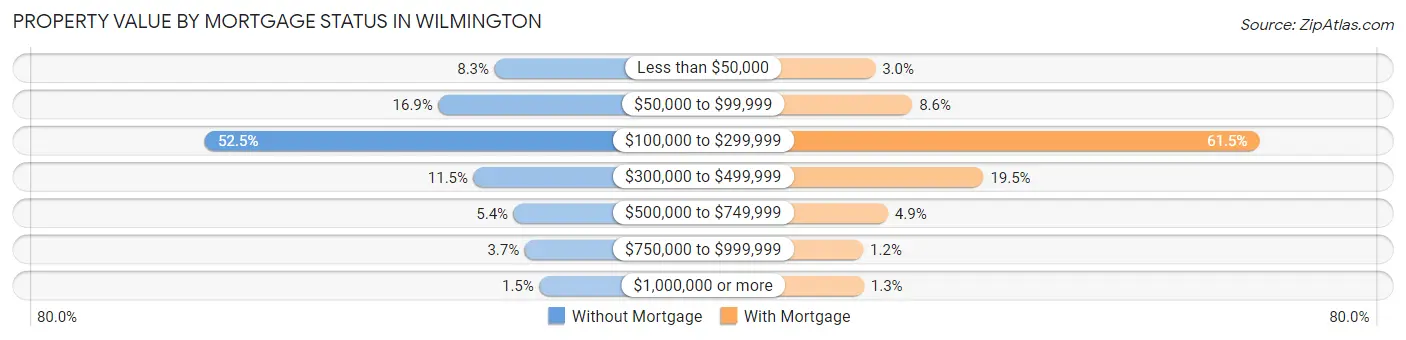
| Property Value | Without Mortgage | With Mortgage |
| Less than $50,000 | 357 (8.3%) | 300 (3.0%) |
| $50,000 to $99,999 | 724 (16.9%) | 864 (8.6%) |
| $100,000 to $299,999 | 2,248 (52.5%) | 6,154 (61.5%) |
| $300,000 to $499,999 | 494 (11.5%) | 1,950 (19.5%) |
| $500,000 to $749,999 | 233 (5.4%) | 493 (4.9%) |
| $750,000 to $999,999 | 160 (3.7%) | 116 (1.2%) |
| $1,000,000 or more | 65 (1.5%) | 127 (1.3%) |
| Total | 4,281 (100.0%) | 10,004 (100.0%) |
Household Income by Mortgage Status in Wilmington
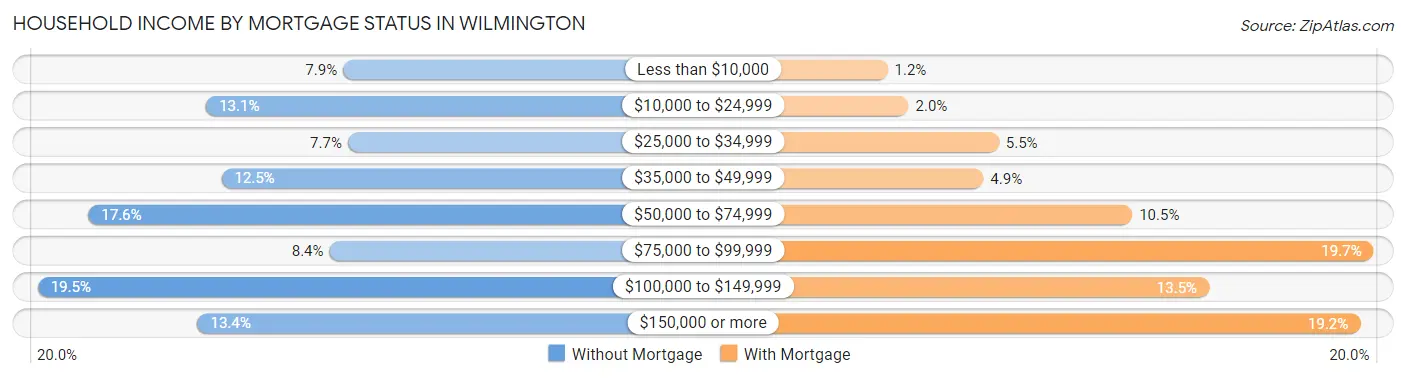
| Household Income | Without Mortgage | With Mortgage |
| Less than $10,000 | 337 (7.9%) | 122 (1.2%) |
| $10,000 to $24,999 | 560 (13.1%) | 202 (2.0%) |
| $25,000 to $34,999 | 329 (7.7%) | 546 (5.5%) |
| $35,000 to $49,999 | 535 (12.5%) | 487 (4.9%) |
| $50,000 to $74,999 | 752 (17.6%) | 1,054 (10.5%) |
| $75,000 to $99,999 | 359 (8.4%) | 1,974 (19.7%) |
| $100,000 to $149,999 | 835 (19.5%) | 1,347 (13.5%) |
| $150,000 or more | 574 (13.4%) | 1,923 (19.2%) |
| Total | 4,281 (100.0%) | 10,004 (100.0%) |
Property Value to Household Income Ratio in Wilmington
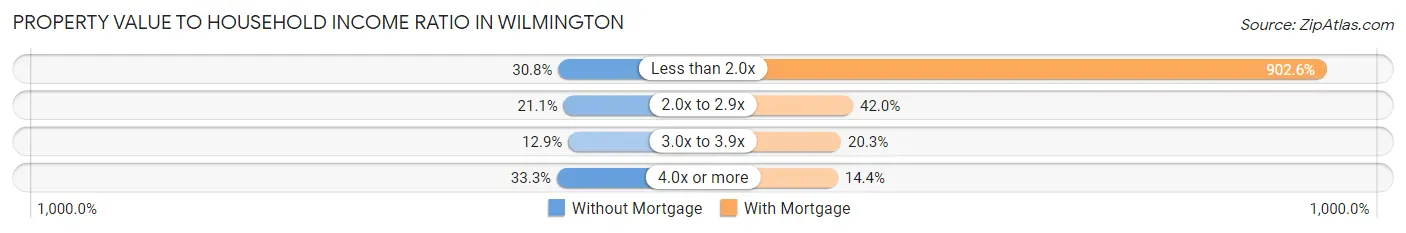
| Value-to-Income Ratio | Without Mortgage | With Mortgage |
| Less than 2.0x | 1,319 (30.8%) | 90,291 (902.5%) |
| 2.0x to 2.9x | 905 (21.1%) | 4,204 (42.0%) |
| 3.0x to 3.9x | 550 (12.9%) | 2,030 (20.3%) |
| 4.0x or more | 1,425 (33.3%) | 1,436 (14.3%) |
| Total | 4,281 (100.0%) | 10,004 (100.0%) |
Real Estate Taxes by Mortgage Status in Wilmington
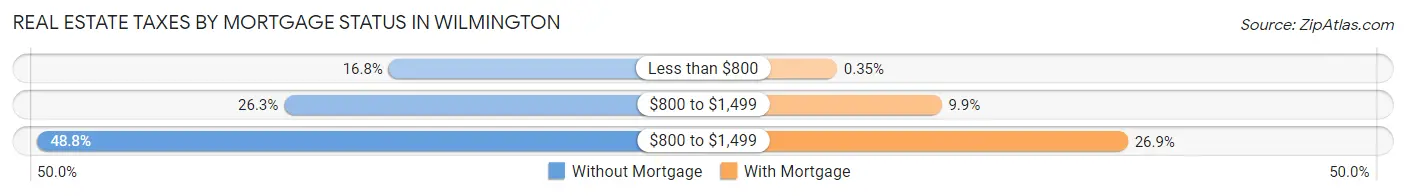
| Property Taxes | Without Mortgage | With Mortgage |
| Less than $800 | 717 (16.8%) | 35 (0.4%) |
| $800 to $1,499 | 1,126 (26.3%) | 990 (9.9%) |
| $800 to $1,499 | 2,090 (48.8%) | 2,692 (26.9%) |
| Total | 4,281 (100.0%) | 10,004 (100.0%) |
Health & Disability in Wilmington
Health Insurance Coverage by Age in Wilmington
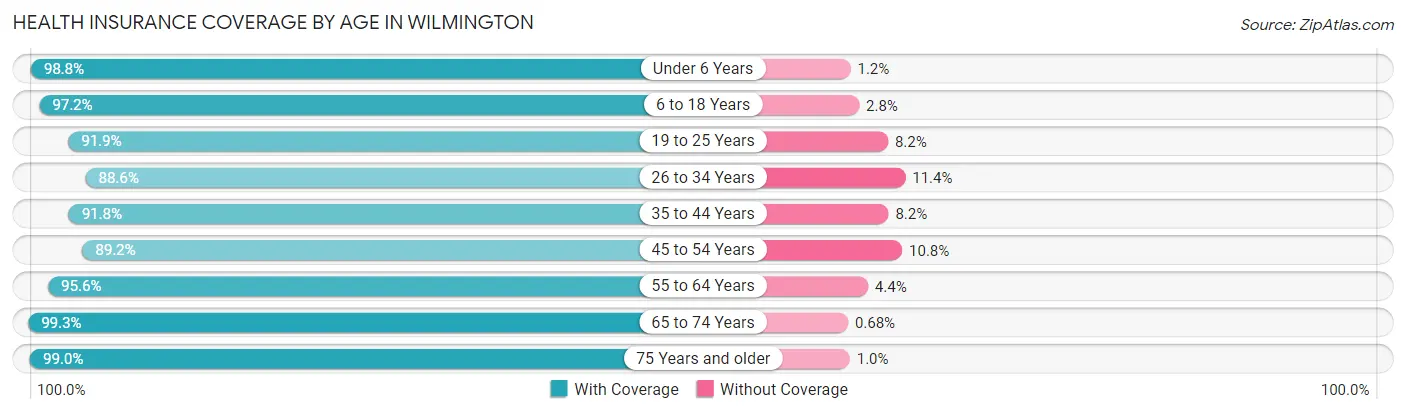
| Age Bracket | With Coverage | Without Coverage |
| Under 6 Years | 4,858 (98.8%) | 57 (1.2%) |
| 6 to 18 Years | 10,818 (97.2%) | 307 (2.8%) |
| 19 to 25 Years | 4,757 (91.8%) | 422 (8.2%) |
| 26 to 34 Years | 9,896 (88.6%) | 1,269 (11.4%) |
| 35 to 44 Years | 8,390 (91.8%) | 753 (8.2%) |
| 45 to 54 Years | 7,215 (89.2%) | 872 (10.8%) |
| 55 to 64 Years | 9,040 (95.6%) | 416 (4.4%) |
| 65 to 74 Years | 6,152 (99.3%) | 42 (0.7%) |
| 75 Years and older | 3,594 (99.0%) | 37 (1.0%) |
| Total | 64,720 (93.9%) | 4,175 (6.1%) |
Health Insurance Coverage by Citizenship Status in Wilmington
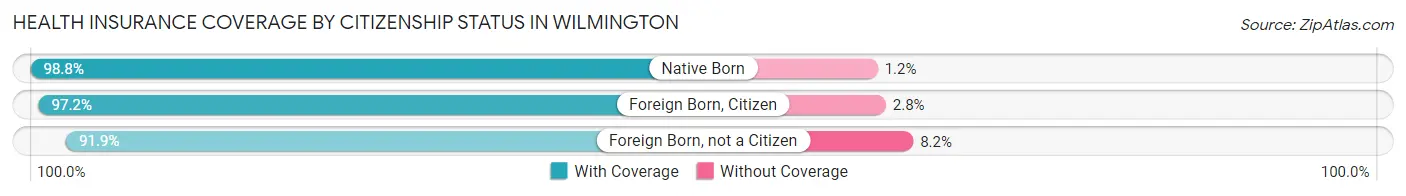
| Citizenship Status | With Coverage | Without Coverage |
| Native Born | 4,858 (98.8%) | 57 (1.2%) |
| Foreign Born, Citizen | 10,818 (97.2%) | 307 (2.8%) |
| Foreign Born, not a Citizen | 4,757 (91.8%) | 422 (8.2%) |
Health Insurance Coverage by Household Income in Wilmington
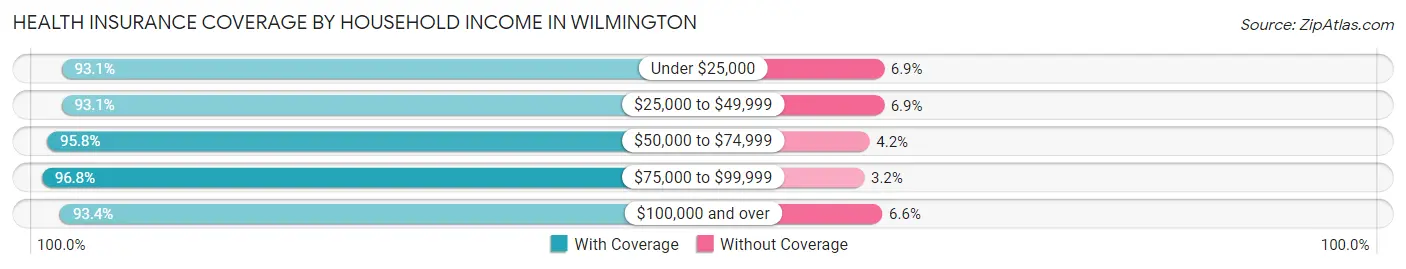
| Household Income | With Coverage | Without Coverage |
| Under $25,000 | 14,220 (93.1%) | 1,059 (6.9%) |
| $25,000 to $49,999 | 11,448 (93.1%) | 850 (6.9%) |
| $50,000 to $74,999 | 9,861 (95.8%) | 436 (4.2%) |
| $75,000 to $99,999 | 7,762 (96.8%) | 259 (3.2%) |
| $100,000 and over | 20,845 (93.4%) | 1,481 (6.6%) |
Public vs Private Health Insurance Coverage by Age in Wilmington
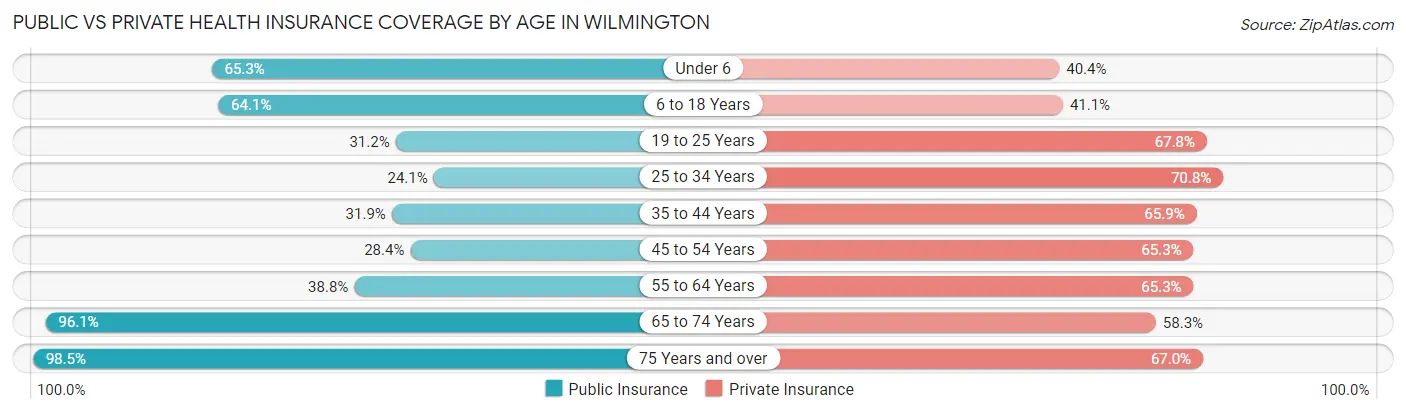
| Age Bracket | Public Insurance | Private Insurance |
| Under 6 | 3,210 (65.3%) | 1,984 (40.4%) |
| 6 to 18 Years | 7,128 (64.1%) | 4,567 (41.0%) |
| 19 to 25 Years | 1,614 (31.2%) | 3,509 (67.7%) |
| 25 to 34 Years | 2,690 (24.1%) | 7,904 (70.8%) |
| 35 to 44 Years | 2,914 (31.9%) | 6,021 (65.8%) |
| 45 to 54 Years | 2,298 (28.4%) | 5,278 (65.3%) |
| 55 to 64 Years | 3,672 (38.8%) | 6,171 (65.3%) |
| 65 to 74 Years | 5,954 (96.1%) | 3,611 (58.3%) |
| 75 Years and over | 3,576 (98.5%) | 2,434 (67.0%) |
| Total | 33,056 (48.0%) | 41,479 (60.2%) |
Disability Status by Sex by Age in Wilmington
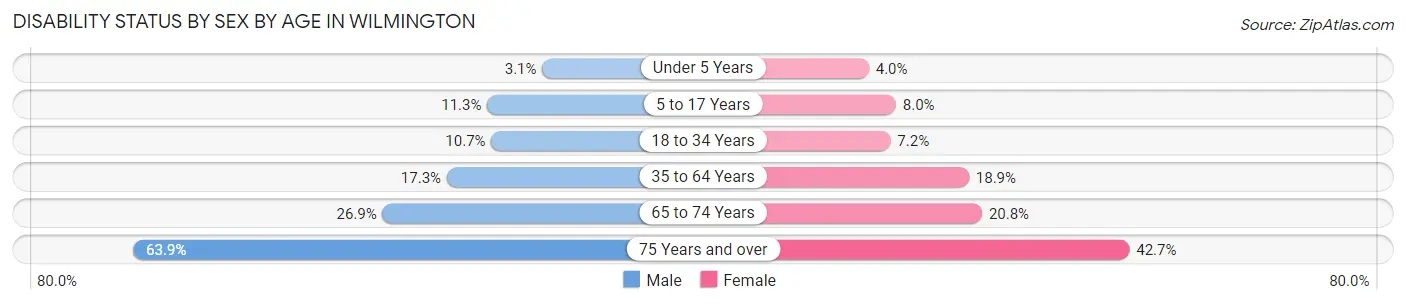
| Age Bracket | Male | Female |
| Under 5 Years | 68 (3.1%) | 82 (4.0%) |
| 5 to 17 Years | 574 (11.3%) | 494 (8.0%) |
| 18 to 34 Years | 836 (10.7%) | 656 (7.2%) |
| 35 to 64 Years | 2,083 (17.3%) | 2,763 (18.9%) |
| 65 to 74 Years | 725 (26.9%) | 727 (20.8%) |
| 75 Years and over | 973 (63.9%) | 900 (42.7%) |
Disability Class by Sex by Age in Wilmington
Disability Class: Hearing Difficulty
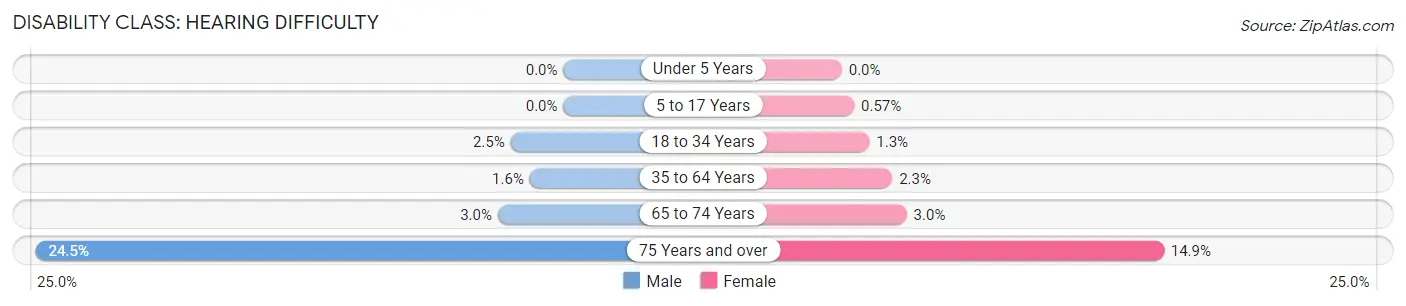
| Age Bracket | Male | Female |
| Under 5 Years | 0 (0.0%) | 0 (0.0%) |
| 5 to 17 Years | 0 (0.0%) | 35 (0.6%) |
| 18 to 34 Years | 192 (2.5%) | 116 (1.3%) |
| 35 to 64 Years | 188 (1.6%) | 343 (2.3%) |
| 65 to 74 Years | 82 (3.0%) | 105 (3.0%) |
| 75 Years and over | 373 (24.5%) | 315 (14.9%) |
Disability Class: Vision Difficulty
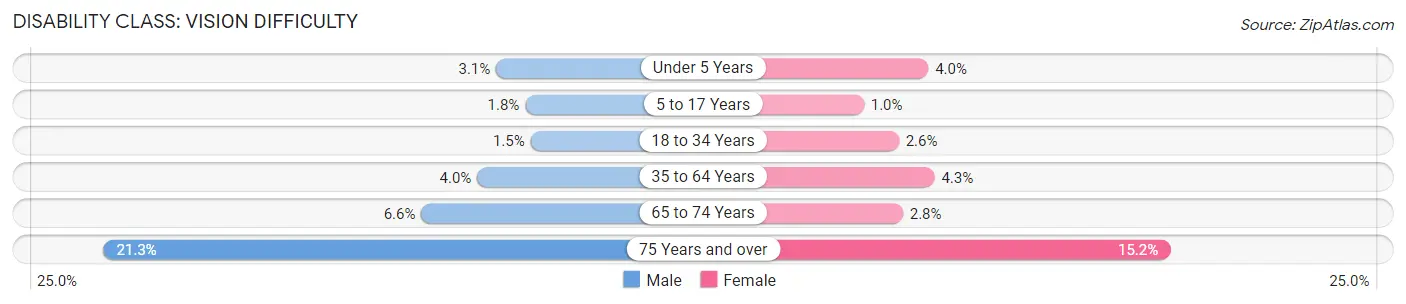
| Age Bracket | Male | Female |
| Under 5 Years | 68 (3.1%) | 82 (4.0%) |
| 5 to 17 Years | 90 (1.8%) | 63 (1.0%) |
| 18 to 34 Years | 119 (1.5%) | 240 (2.6%) |
| 35 to 64 Years | 482 (4.0%) | 629 (4.3%) |
| 65 to 74 Years | 178 (6.6%) | 99 (2.8%) |
| 75 Years and over | 325 (21.3%) | 321 (15.2%) |
Disability Class: Cognitive Difficulty
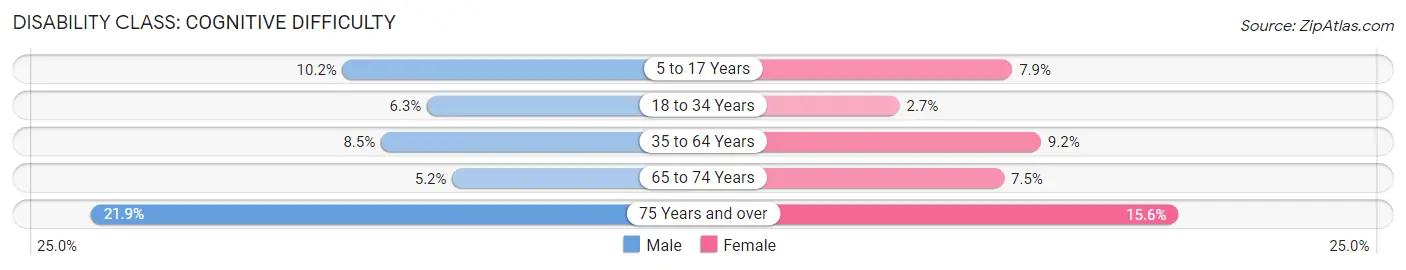
| Age Bracket | Male | Female |
| 5 to 17 Years | 521 (10.2%) | 487 (7.9%) |
| 18 to 34 Years | 495 (6.3%) | 244 (2.7%) |
| 35 to 64 Years | 1,019 (8.5%) | 1,353 (9.2%) |
| 65 to 74 Years | 139 (5.1%) | 263 (7.5%) |
| 75 Years and over | 334 (21.9%) | 329 (15.6%) |
Disability Class: Ambulatory Difficulty
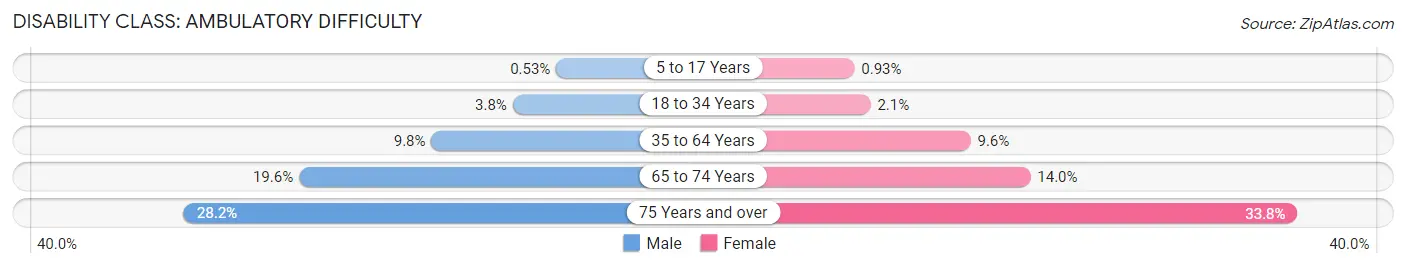
| Age Bracket | Male | Female |
| 5 to 17 Years | 27 (0.5%) | 57 (0.9%) |
| 18 to 34 Years | 294 (3.8%) | 194 (2.1%) |
| 35 to 64 Years | 1,181 (9.8%) | 1,400 (9.6%) |
| 65 to 74 Years | 530 (19.6%) | 489 (14.0%) |
| 75 Years and over | 429 (28.2%) | 713 (33.8%) |
Disability Class: Self-Care Difficulty
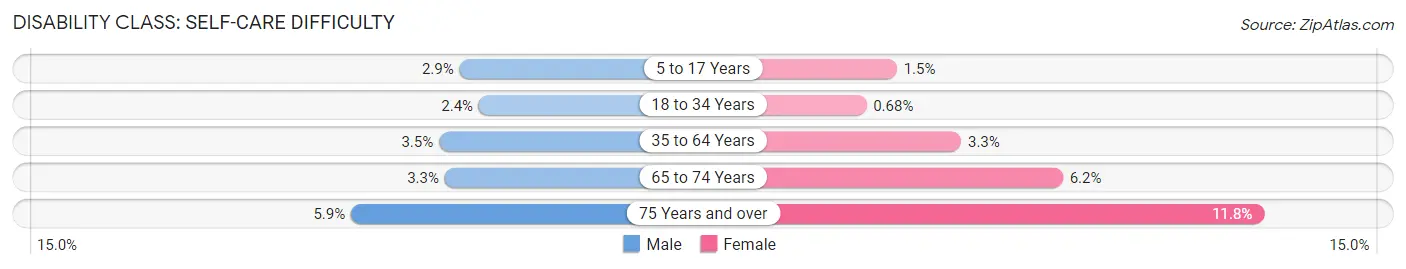
| Age Bracket | Male | Female |
| 5 to 17 Years | 147 (2.9%) | 94 (1.5%) |
| 18 to 34 Years | 184 (2.4%) | 62 (0.7%) |
| 35 to 64 Years | 417 (3.5%) | 486 (3.3%) |
| 65 to 74 Years | 89 (3.3%) | 215 (6.1%) |
| 75 Years and over | 90 (5.9%) | 248 (11.8%) |
Technology Access in Wilmington
Computing Device Access in Wilmington
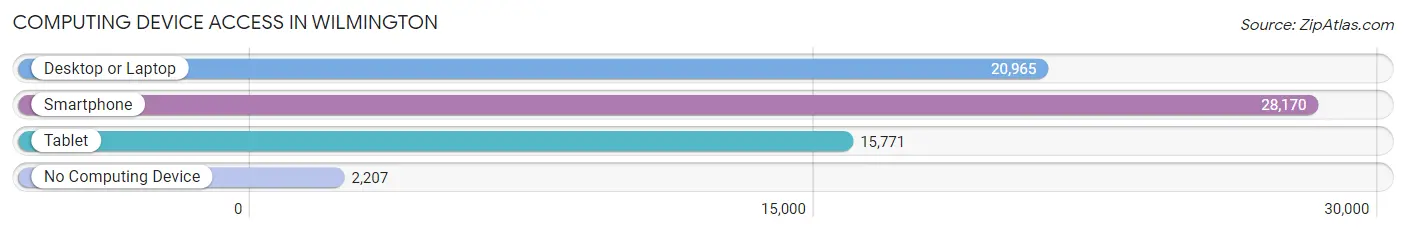
| Device Type | # Households | % Households |
| Desktop or Laptop | 20,965 | 66.2% |
| Smartphone | 28,170 | 89.0% |
| Tablet | 15,771 | 49.8% |
| No Computing Device | 2,207 | 7.0% |
| Total | 31,650 | 100.0% |
Internet Access in Wilmington
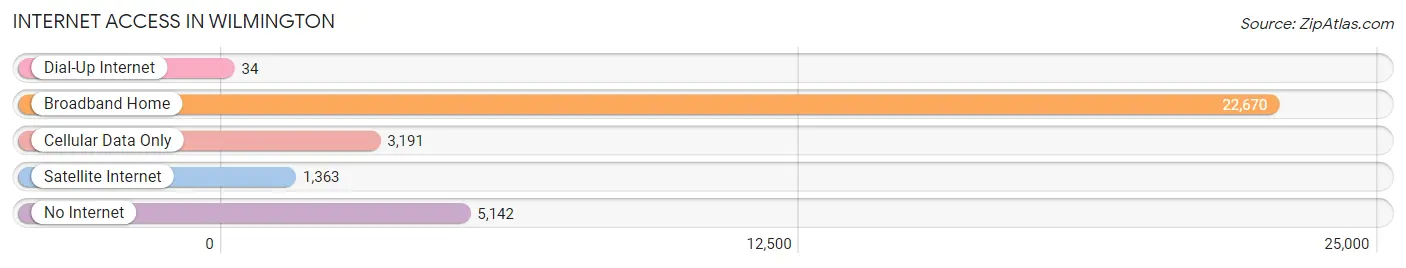
| Internet Type | # Households | % Households |
| Dial-Up Internet | 34 | 0.1% |
| Broadband Home | 22,670 | 71.6% |
| Cellular Data Only | 3,191 | 10.1% |
| Satellite Internet | 1,363 | 4.3% |
| No Internet | 5,142 | 16.3% |
| Total | 31,650 | 100.0% |
Wilmington Summary
Wilmington, Delaware is a city located in New Castle County, Delaware, United States. It is the county seat of New Castle County and the largest city in the state of Delaware. The city is situated at the confluence of the Christina River and Brandywine Creek, near the Delaware River. It is the corporate home of many large companies, including DuPont, Bank of America, and AstraZeneca.
History
The area that is now Wilmington was first settled by the Lenape Native Americans in the 1600s. The first European settlers arrived in the area in 1638, when Swedish settlers established Fort Christina, the first permanent European settlement in the Delaware Valley. The settlement was later taken over by the Dutch, who renamed it Fort Casimir. In 1655, the Dutch were defeated by the English, who renamed the settlement New Amstel. The settlement was incorporated as a city in 1739 and was renamed Wilmington in 1739, after Spencer Compton, the Earl of Wilmington.
In the late 1700s, Wilmington became an important port city, with a thriving shipbuilding industry. The city was also a major center of the abolitionist movement, and was home to several prominent abolitionists, including Thomas Garrett and Harriet Tubman.
In the 1800s, Wilmington became an important industrial center, with several large factories and mills. The city was also a major center of the DuPont Company, which was founded in Wilmington in 1802. The city was also home to several prominent banks, including the Wilmington Trust Company, which was founded in 1903.
Geography
Wilmington is located in the northern part of New Castle County, Delaware, at the confluence of the Christina River and Brandywine Creek. The city is situated on the Delaware River, about 25 miles (40 km) south of Philadelphia, Pennsylvania. The city covers an area of 22.6 square miles (58.5 km2), with a population of 72,664 as of the 2010 census.
The city is divided into several neighborhoods, including the Downtown area, the East Side, the West Side, and the South Side. The city is also home to several parks, including Brandywine Park, Rockford Park, and Wilmington State Park.
Economy
Wilmington is the corporate home of several large companies, including DuPont, Bank of America, and AstraZeneca. The city is also home to several large financial institutions, including the Wilmington Trust Company, which was founded in 1903.
The city is also home to several large universities, including the University of Delaware, Wilmington University, and Delaware State University. The city is also home to several large hospitals, including Christiana Care Health System and St. Francis Hospital.
Demographics
As of the 2010 census, the population of Wilmington was 72,664. The racial makeup of the city was 57.2% White, 33.3% African American, 0.4% Native American, 2.2% Asian, 0.1% Pacific Islander, 4.2% from other races, and 2.6% from two or more races. Hispanic or Latino of any race were 8.7% of the population.
The median income for a household in the city was $37,945, and the median income for a family was $45,845. The per capita income for the city was $21,845. About 17.2% of families and 20.7% of the population were below the poverty line, including 28.3% of those under age 18 and 11.2% of those age 65 or over.
Common Questions
What is Per Capita Income in Wilmington?
Per Capita income in Wilmington is $36,446.
What is the Median Family Income in Wilmington?
Median Family Income in Wilmington is $75,457.
What is the Median Household income in Wilmington?
Median Household Income in Wilmington is $54,731.
What is Income or Wage Gap in Wilmington?
Income or Wage Gap in Wilmington is 19.3%.
Women in Wilmington earn 80.7 cents for every dollar earned by a man.
What is Family Income Deficit in Wilmington?
Family Income Deficit in Wilmington is $13,090.
Families that are below poverty line in Wilmington earn $13,090 less on average than the poverty threshold level.
What is Inequality or Gini Index in Wilmington?
Inequality or Gini Index in Wilmington is 0.51.
What is the Total Population of Wilmington?
Total Population of Wilmington is 71,034.
What is the Total Male Population of Wilmington?
Total Male Population of Wilmington is 33,062.
What is the Total Female Population of Wilmington?
Total Female Population of Wilmington is 37,972.
What is the Ratio of Males per 100 Females in Wilmington?
There are 87.07 Males per 100 Females in Wilmington.
What is the Ratio of Females per 100 Males in Wilmington?
There are 114.85 Females per 100 Males in Wilmington.
What is the Median Population Age in Wilmington?
Median Population Age in Wilmington is 36.9 Years.
What is the Average Family Size in Wilmington
Average Family Size in Wilmington is 3.3 People.
What is the Average Household Size in Wilmington
Average Household Size in Wilmington is 2.2 People.
How Large is the Labor Force in Wilmington?
There are 37,394 People in the Labor Forcein in Wilmington.
What is the Percentage of People in the Labor Force in Wilmington?
65.3% of People are in the Labor Force in Wilmington.
What is the Unemployment Rate in Wilmington?
Unemployment Rate in Wilmington is 8.6%.