Camden, DE Map & Demographics
Camden Map
Camden Overview
$30,893
PER CAPITA INCOME
$72,695
AVG FAMILY INCOME
$60,549
AVG HOUSEHOLD INCOME
25.1%
WAGE / INCOME GAP [ % ]
74.9¢/ $1
WAGE / INCOME GAP [ $ ]
0.40
INEQUALITY / GINI INDEX
3,914
TOTAL POPULATION
2,030
MALE POPULATION
1,884
FEMALE POPULATION
107.75
MALES / 100 FEMALES
92.81
FEMALES / 100 MALES
36.9
MEDIAN AGE
2.7
AVG FAMILY SIZE
2.5
AVG HOUSEHOLD SIZE
1,867
LABOR FORCE [ PEOPLE ]
58.1%
PERCENT IN LABOR FORCE
3.5%
UNEMPLOYMENT RATE
Camden Area Codes
Income in Camden
Income Overview in Camden
Per Capita Income in Camden is $30,893, while median incomes of families and households are $72,695 and $60,549 respectively.
| Characteristic | Number | Measure |
| Per Capita Income | 3,914 | $30,893 |
| Median Family Income | 1,283 | $72,695 |
| Mean Family Income | 1,283 | $88,433 |
| Median Household Income | 1,566 | $60,549 |
| Mean Household Income | 1,566 | $79,531 |
| Income Deficit | 1,283 | $0 |
| Wage / Income Gap (%) | 3,914 | 25.06% |
| Wage / Income Gap ($) | 3,914 | 74.94¢ per $1 |
| Gini / Inequality Index | 3,914 | 0.40 |
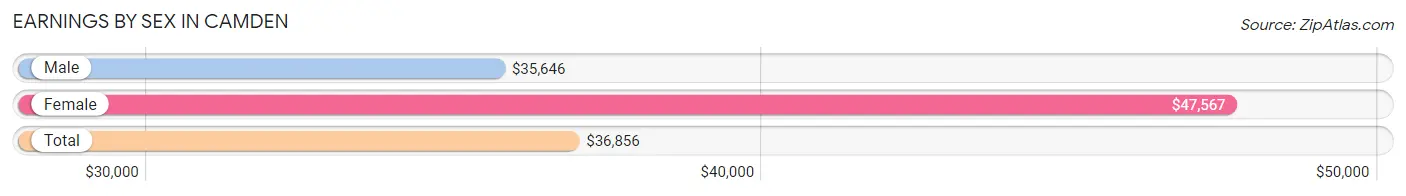
Earnings by Sex in Camden
Average Earnings in Camden are $36,856, $35,646 for men and $47,567 for women, a difference of 25.1%.
| Sex | Number | Average Earnings |
| Male | 1,178 (60.2%) | $35,646 |
| Female | 780 (39.8%) | $47,567 |
| Total | 1,958 (100.0%) | $36,856 |
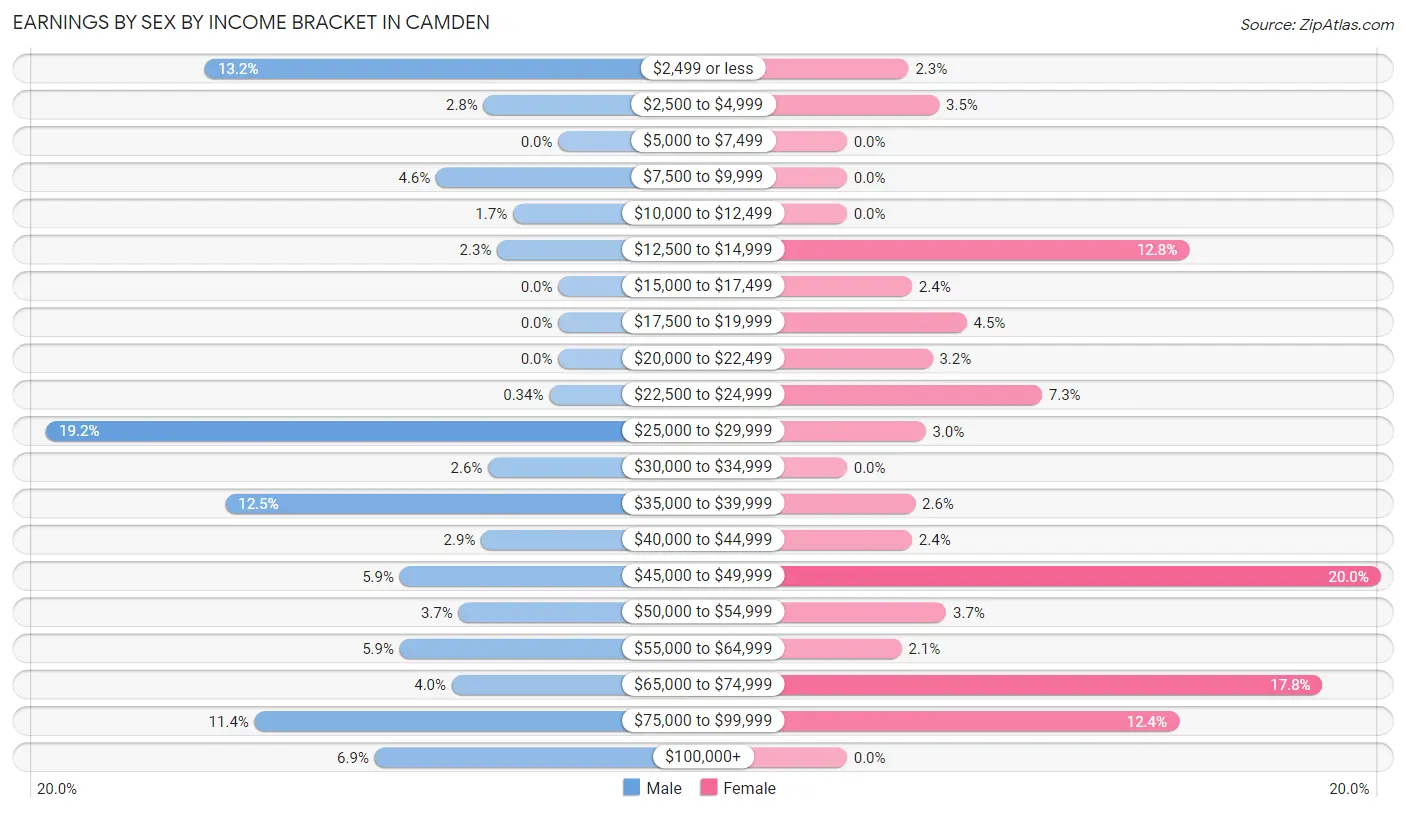
Earnings by Sex by Income Bracket in Camden
The most common earnings brackets in Camden are $25,000 to $29,999 for men (226 | 19.2%) and $45,000 to $49,999 for women (156 | 20.0%).
| Income | Male | Female |
| $2,499 or less | 156 (13.2%) | 18 (2.3%) |
| $2,500 to $4,999 | 33 (2.8%) | 27 (3.5%) |
| $5,000 to $7,499 | 0 (0.0%) | 0 (0.0%) |
| $7,500 to $9,999 | 54 (4.6%) | 0 (0.0%) |
| $10,000 to $12,499 | 20 (1.7%) | 0 (0.0%) |
| $12,500 to $14,999 | 27 (2.3%) | 100 (12.8%) |
| $15,000 to $17,499 | 0 (0.0%) | 19 (2.4%) |
| $17,500 to $19,999 | 0 (0.0%) | 35 (4.5%) |
| $20,000 to $22,499 | 0 (0.0%) | 25 (3.2%) |
| $22,500 to $24,999 | 4 (0.3%) | 57 (7.3%) |
| $25,000 to $29,999 | 226 (19.2%) | 23 (2.9%) |
| $30,000 to $34,999 | 31 (2.6%) | 0 (0.0%) |
| $35,000 to $39,999 | 147 (12.5%) | 20 (2.6%) |
| $40,000 to $44,999 | 34 (2.9%) | 19 (2.4%) |
| $45,000 to $49,999 | 70 (5.9%) | 156 (20.0%) |
| $50,000 to $54,999 | 44 (3.7%) | 29 (3.7%) |
| $55,000 to $64,999 | 70 (5.9%) | 16 (2.1%) |
| $65,000 to $74,999 | 47 (4.0%) | 139 (17.8%) |
| $75,000 to $99,999 | 134 (11.4%) | 97 (12.4%) |
| $100,000+ | 81 (6.9%) | 0 (0.0%) |
| Total | 1,178 (100.0%) | 780 (100.0%) |
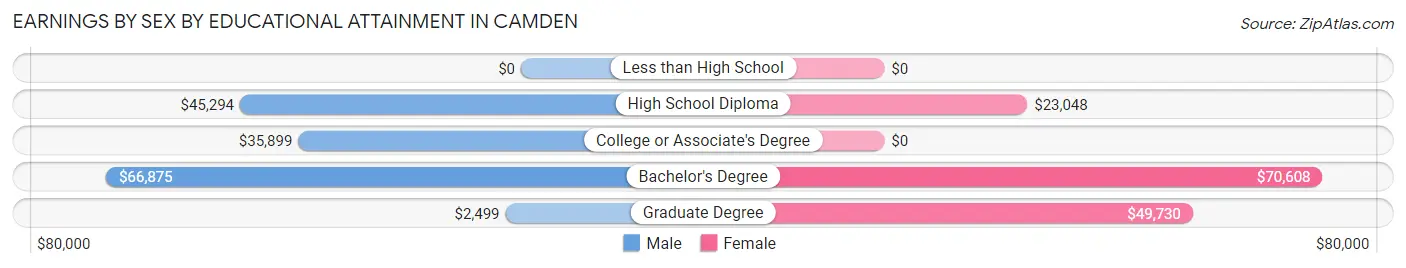
Earnings by Sex by Educational Attainment in Camden
Average earnings in Camden are $45,066 for men and $47,772 for women, a difference of 5.7%. Men with an educational attainment of bachelor's degree enjoy the highest average annual earnings of $66,875, while those with graduate degree education earn the least with $2,499. Women with an educational attainment of bachelor's degree earn the most with the average annual earnings of $70,608, while those with high school diploma education have the smallest earnings of $23,048.
| Educational Attainment | Male Income | Female Income |
| Less than High School | - | - |
| High School Diploma | $45,294 | $23,048 |
| College or Associate's Degree | $35,899 | $0 |
| Bachelor's Degree | $66,875 | $70,608 |
| Graduate Degree | $2,499 | $49,730 |
| Total | $45,066 | $47,772 |
Family Income in Camden
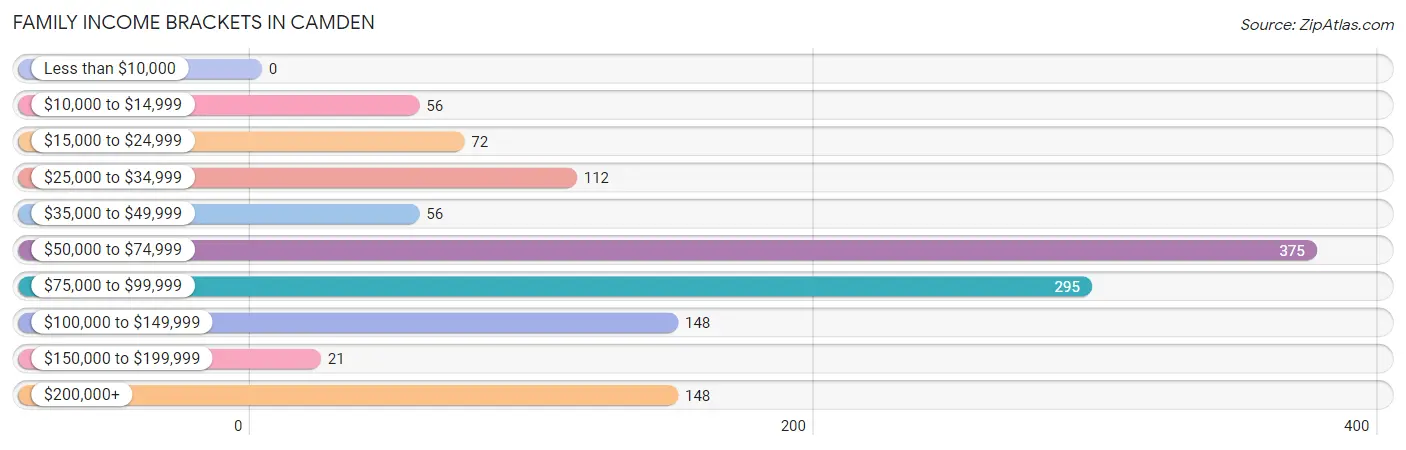
Family Income Brackets in Camden
According to the Camden family income data, there are 375 families falling into the $50,000 to $74,999 income range, which is the most common income bracket and makes up 29.2% of all families.
| Income Bracket | # Families | % Families |
| Less than $10,000 | 0 | 0.0% |
| $10,000 to $14,999 | 56 | 4.4% |
| $15,000 to $24,999 | 72 | 5.6% |
| $25,000 to $34,999 | 112 | 8.7% |
| $35,000 to $49,999 | 56 | 4.4% |
| $50,000 to $74,999 | 375 | 29.2% |
| $75,000 to $99,999 | 295 | 23.0% |
| $100,000 to $149,999 | 148 | 11.5% |
| $150,000 to $199,999 | 21 | 1.6% |
| $200,000+ | 148 | 11.5% |
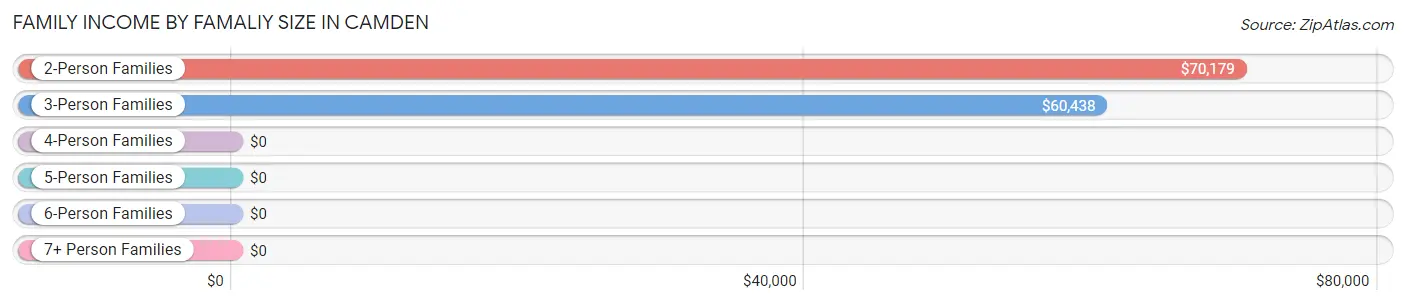
Family Income by Famaliy Size in Camden
2-person families (858 | 66.9%) account for the highest median family income in Camden with $70,179 per family, while 2-person families (858 | 66.9%) have the highest median income of $35,090 per family member.
| Income Bracket | # Families | Median Income |
| 2-Person Families | 858 (66.9%) | $70,179 |
| 3-Person Families | 123 (9.6%) | $60,438 |
| 4-Person Families | 128 (10.0%) | $0 |
| 5-Person Families | 45 (3.5%) | $0 |
| 6-Person Families | 129 (10.1%) | $0 |
| 7+ Person Families | 0 (0.0%) | $0 |
| Total | 1,283 (100.0%) | $72,695 |
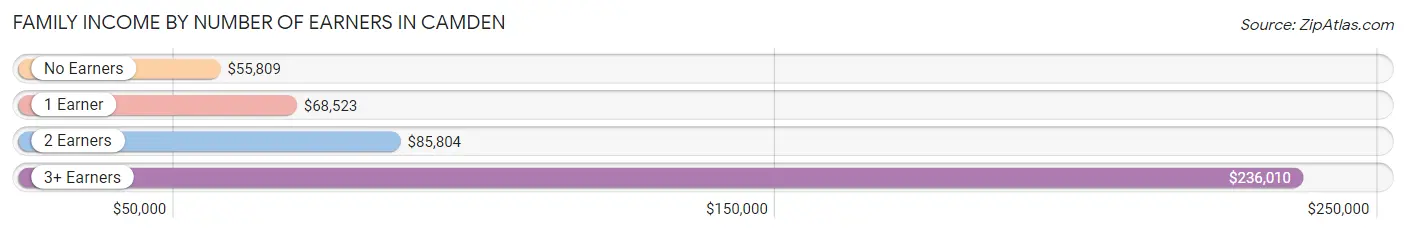
Family Income by Number of Earners in Camden
The median family income in Camden is $72,695, with families comprising 3+ earners (143) having the highest median family income of $236,010, while families with no earners (409) have the lowest median family income of $55,809, accounting for 11.2% and 31.9% of families, respectively.
| Number of Earners | # Families | Median Income |
| No Earners | 409 (31.9%) | $55,809 |
| 1 Earner | 335 (26.1%) | $68,523 |
| 2 Earners | 396 (30.9%) | $85,804 |
| 3+ Earners | 143 (11.2%) | $236,010 |
| Total | 1,283 (100.0%) | $72,695 |
Household Income in Camden
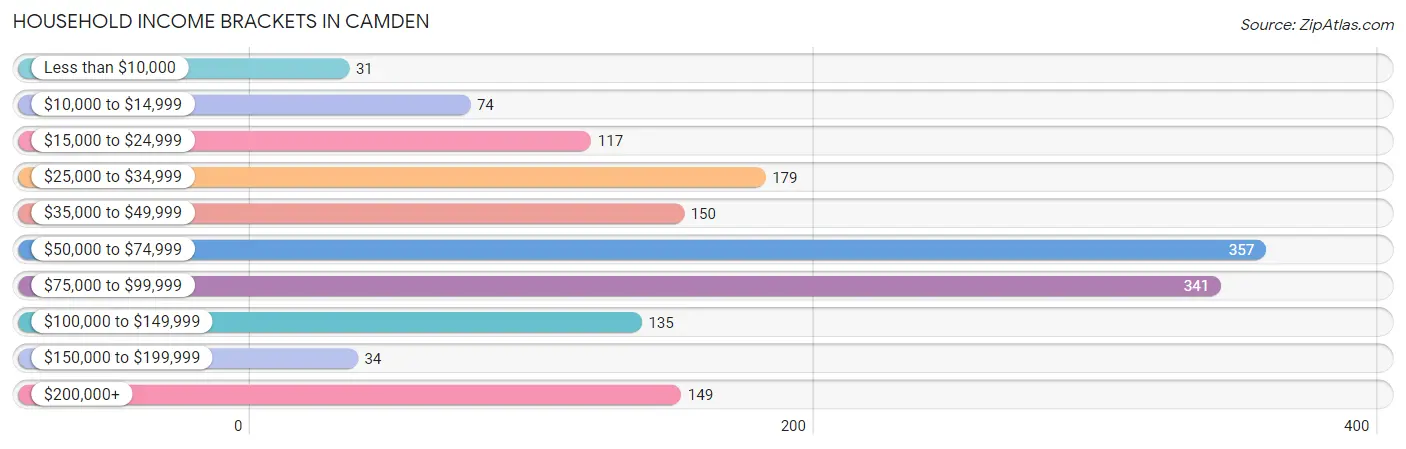
Household Income Brackets in Camden
With 357 households falling in the category, the $50,000 to $74,999 income range is the most frequent in Camden, accounting for 22.8% of all households. In contrast, only 31 households (2.0%) fall into the less than $10,000 income bracket, making it the least populous group.
| Income Bracket | # Households | % Households |
| Less than $10,000 | 31 | 2.0% |
| $10,000 to $14,999 | 74 | 4.7% |
| $15,000 to $24,999 | 117 | 7.5% |
| $25,000 to $34,999 | 179 | 11.4% |
| $35,000 to $49,999 | 150 | 9.6% |
| $50,000 to $74,999 | 357 | 22.8% |
| $75,000 to $99,999 | 341 | 21.8% |
| $100,000 to $149,999 | 135 | 8.6% |
| $150,000 to $199,999 | 34 | 2.2% |
| $200,000+ | 149 | 9.5% |
Household Income by Householder Age in Camden
The median household income in Camden is $60,549, with the highest median household income of $93,966 found in the 25 to 44 years age bracket for the primary householder. A total of 596 households (38.1%) fall into this category. Meanwhile, the 15 to 24 years age bracket for the primary householder has the lowest median household income of $0, with 16 households (1.0%) in this group.
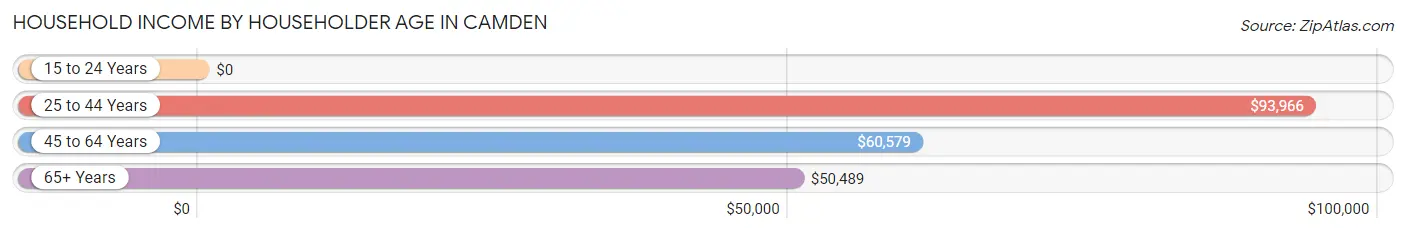
| Income Bracket | # Households | Median Income |
| 15 to 24 Years | 16 (1.0%) | $0 |
| 25 to 44 Years | 596 (38.1%) | $93,966 |
| 45 to 64 Years | 399 (25.5%) | $60,579 |
| 65+ Years | 555 (35.4%) | $50,489 |
| Total | 1,566 (100.0%) | $60,549 |
Poverty in Camden
Income Below Poverty by Sex and Age in Camden
With 7.7% poverty level for males and 6.6% for females among the residents of Camden, 65 to 74 year old males and 65 to 74 year old females are the most vulnerable to poverty, with 77 males (43.0%) and 56 females (21.4%) in their respective age groups living below the poverty level.
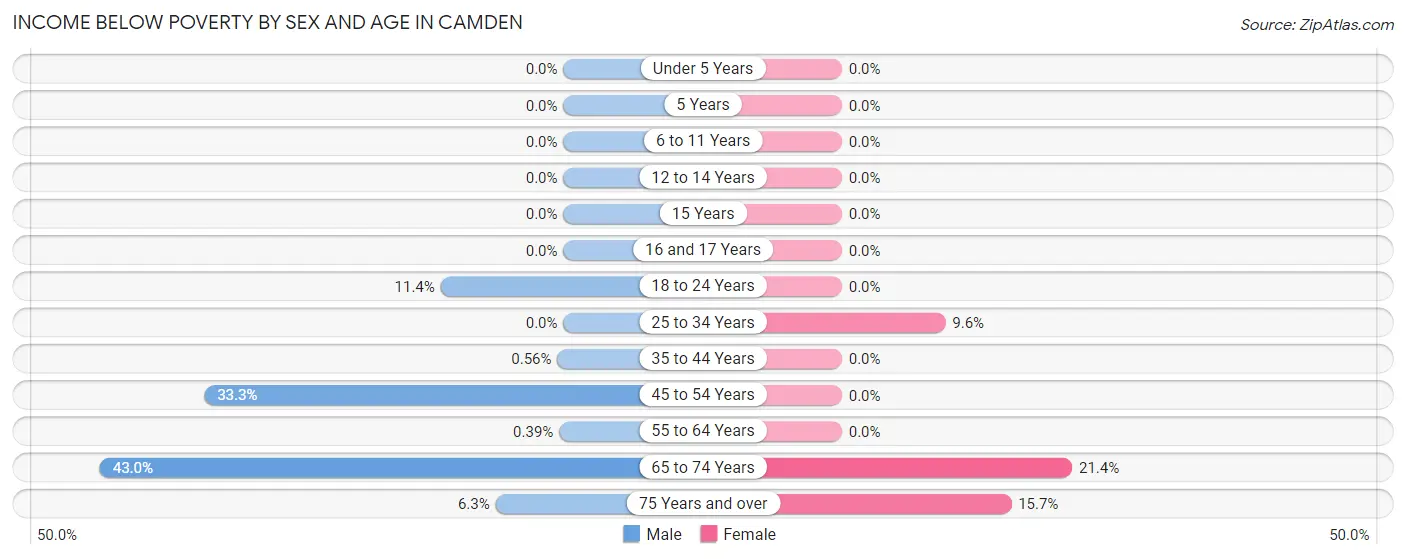
| Age Bracket | Male | Female |
| Under 5 Years | 0 (0.0%) | 0 (0.0%) |
| 5 Years | 0 (0.0%) | 0 (0.0%) |
| 6 to 11 Years | 0 (0.0%) | 0 (0.0%) |
| 12 to 14 Years | 0 (0.0%) | 0 (0.0%) |
| 15 Years | 0 (0.0%) | 0 (0.0%) |
| 16 and 17 Years | 0 (0.0%) | 0 (0.0%) |
| 18 to 24 Years | 27 (11.4%) | 0 (0.0%) |
| 25 to 34 Years | 0 (0.0%) | 32 (9.6%) |
| 35 to 44 Years | 1 (0.6%) | 0 (0.0%) |
| 45 to 54 Years | 31 (33.3%) | 0 (0.0%) |
| 55 to 64 Years | 1 (0.4%) | 0 (0.0%) |
| 65 to 74 Years | 77 (43.0%) | 56 (21.4%) |
| 75 Years and over | 20 (6.3%) | 36 (15.7%) |
| Total | 157 (7.7%) | 124 (6.6%) |
Income Above Poverty by Sex and Age in Camden
According to the poverty statistics in Camden, males aged under 5 years and females aged under 5 years are the age groups that are most secure financially, with 100.0% of males and 100.0% of females in these age groups living above the poverty line.
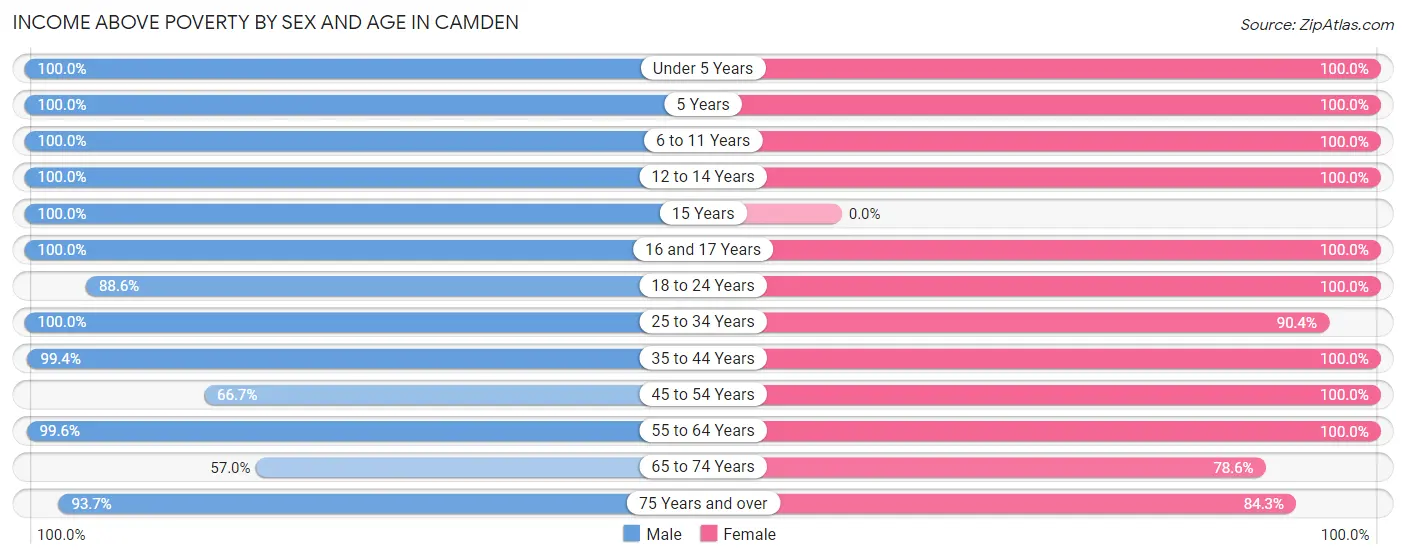
| Age Bracket | Male | Female |
| Under 5 Years | 45 (100.0%) | 154 (100.0%) |
| 5 Years | 40 (100.0%) | 16 (100.0%) |
| 6 to 11 Years | 28 (100.0%) | 264 (100.0%) |
| 12 to 14 Years | 126 (100.0%) | 5 (100.0%) |
| 15 Years | 7 (100.0%) | 0 (0.0%) |
| 16 and 17 Years | 103 (100.0%) | 18 (100.0%) |
| 18 to 24 Years | 210 (88.6%) | 36 (100.0%) |
| 25 to 34 Years | 417 (100.0%) | 301 (90.4%) |
| 35 to 44 Years | 177 (99.4%) | 251 (100.0%) |
| 45 to 54 Years | 62 (66.7%) | 116 (100.0%) |
| 55 to 64 Years | 258 (99.6%) | 184 (100.0%) |
| 65 to 74 Years | 102 (57.0%) | 206 (78.6%) |
| 75 Years and over | 298 (93.7%) | 193 (84.3%) |
| Total | 1,873 (92.3%) | 1,744 (93.4%) |
Income Below Poverty Among Married-Couple Families in Camden
The poverty statistics for married-couple families in Camden show that 7.8% or 76 of the total 969 families live below the poverty line. Families with no children have the highest poverty rate of 10.1%, comprising of 76 families. On the other hand, families with 1 or 2 children have the lowest poverty rate of 0.0%, which includes 0 families.
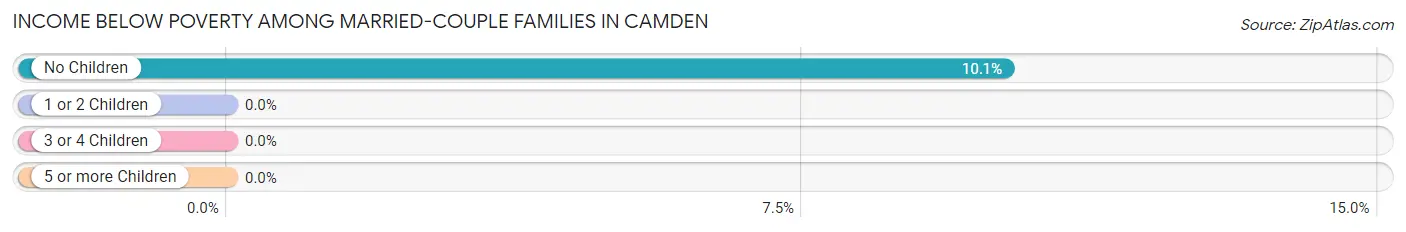
| Children | Above Poverty | Below Poverty |
| No Children | 674 (89.9%) | 76 (10.1%) |
| 1 or 2 Children | 165 (100.0%) | 0 (0.0%) |
| 3 or 4 Children | 54 (100.0%) | 0 (0.0%) |
| 5 or more Children | 0 (0.0%) | 0 (0.0%) |
| Total | 893 (92.2%) | 76 (7.8%) |
Income Below Poverty Among Single-Parent Households in Camden
| Children | Single Father | Single Mother |
| No Children | 0 (0.0%) | 0 (0.0%) |
| 1 or 2 Children | 0 (0.0%) | 0 (0.0%) |
| 3 or 4 Children | 0 (0.0%) | 0 (0.0%) |
| 5 or more Children | 0 (0.0%) | 0 (0.0%) |
| Total | 0 (0.0%) | 0 (0.0%) |
Income Below Poverty Among Married-Couple vs Single-Parent Households in Camden
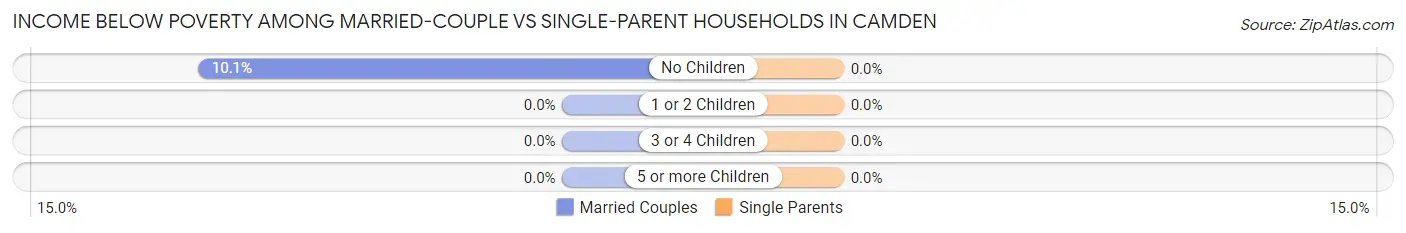
| Children | Married-Couple Families | Single-Parent Households |
| No Children | 76 (10.1%) | 0 (0.0%) |
| 1 or 2 Children | 0 (0.0%) | 0 (0.0%) |
| 3 or 4 Children | 0 (0.0%) | 0 (0.0%) |
| 5 or more Children | 0 (0.0%) | 0 (0.0%) |
| Total | 76 (7.8%) | 0 (0.0%) |
Race in Camden
The most populous races in Camden are White / Caucasian (2,122 | 54.2%), Black / African American (1,482 | 37.9%), and Hispanic or Latino (235 | 6.0%).
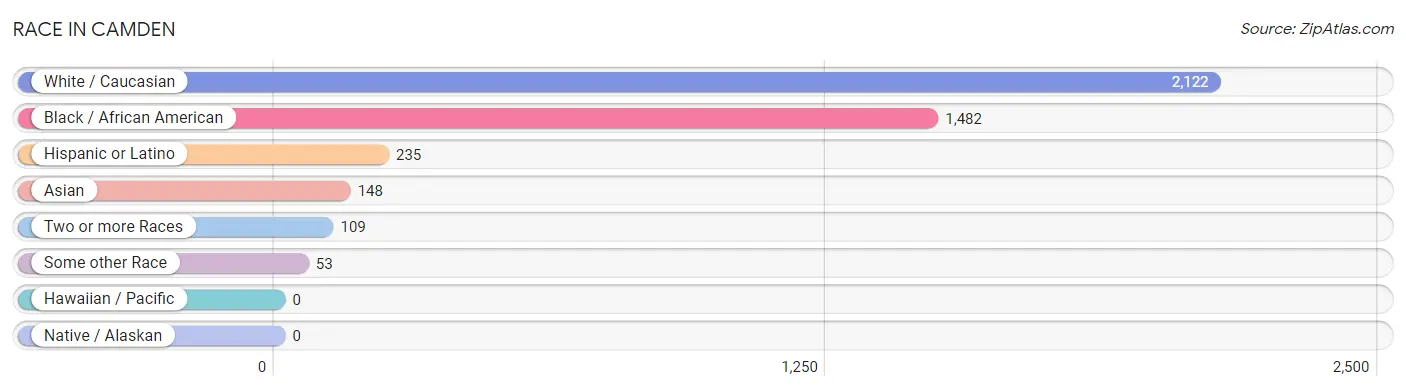
| Race | # Population | % Population |
| Asian | 148 | 3.8% |
| Black / African American | 1,482 | 37.9% |
| Hawaiian / Pacific | 0 | 0.0% |
| Hispanic or Latino | 235 | 6.0% |
| Native / Alaskan | 0 | 0.0% |
| White / Caucasian | 2,122 | 54.2% |
| Two or more Races | 109 | 2.8% |
| Some other Race | 53 | 1.3% |
| Total | 3,914 | 100.0% |
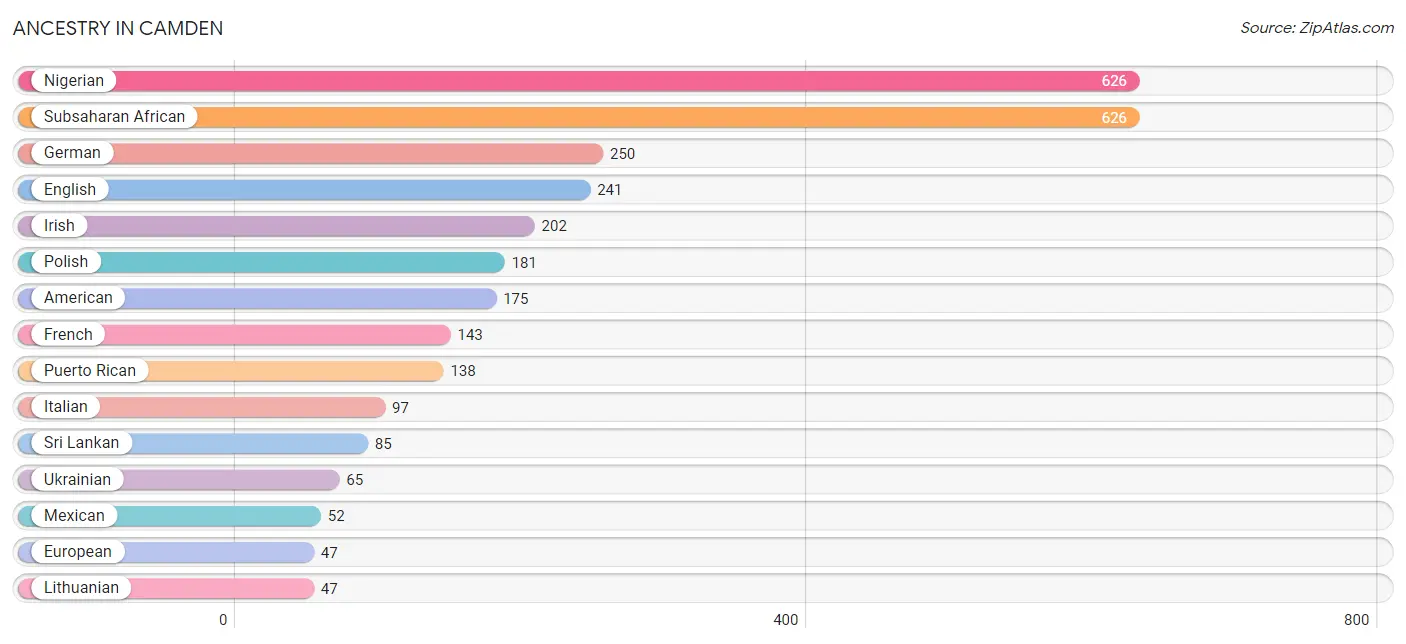
Ancestry in Camden
The most populous ancestries reported in Camden are Nigerian (626 | 16.0%), Subsaharan African (626 | 16.0%), German (250 | 6.4%), English (241 | 6.2%), and Irish (202 | 5.2%), together accounting for 49.7% of all Camden residents.
| Ancestry | # Population | % Population |
| American | 175 | 4.5% |
| Burmese | 33 | 0.8% |
| Central American | 45 | 1.1% |
| Dutch | 17 | 0.4% |
| English | 241 | 6.2% |
| Estonian | 25 | 0.6% |
| European | 47 | 1.2% |
| French | 143 | 3.6% |
| German | 250 | 6.4% |
| Guatemalan | 16 | 0.4% |
| Haitian | 23 | 0.6% |
| Hungarian | 16 | 0.4% |
| Indian (Asian) | 32 | 0.8% |
| Irish | 202 | 5.2% |
| Italian | 97 | 2.5% |
| Lithuanian | 47 | 1.2% |
| Mexican | 52 | 1.3% |
| Nicaraguan | 29 | 0.7% |
| Nigerian | 626 | 16.0% |
| Pennsylvania German | 20 | 0.5% |
| Polish | 181 | 4.6% |
| Puerto Rican | 138 | 3.5% |
| Russian | 25 | 0.6% |
| Scottish | 23 | 0.6% |
| Seminole | 2 | 0.1% |
| Sri Lankan | 85 | 2.2% |
| Subsaharan African | 626 | 16.0% |
| Swedish | 29 | 0.7% |
| Swiss | 46 | 1.2% |
| Thai | 31 | 0.8% |
| Ukrainian | 65 | 1.7% |
| Welsh | 46 | 1.2% | View All 32 Rows |
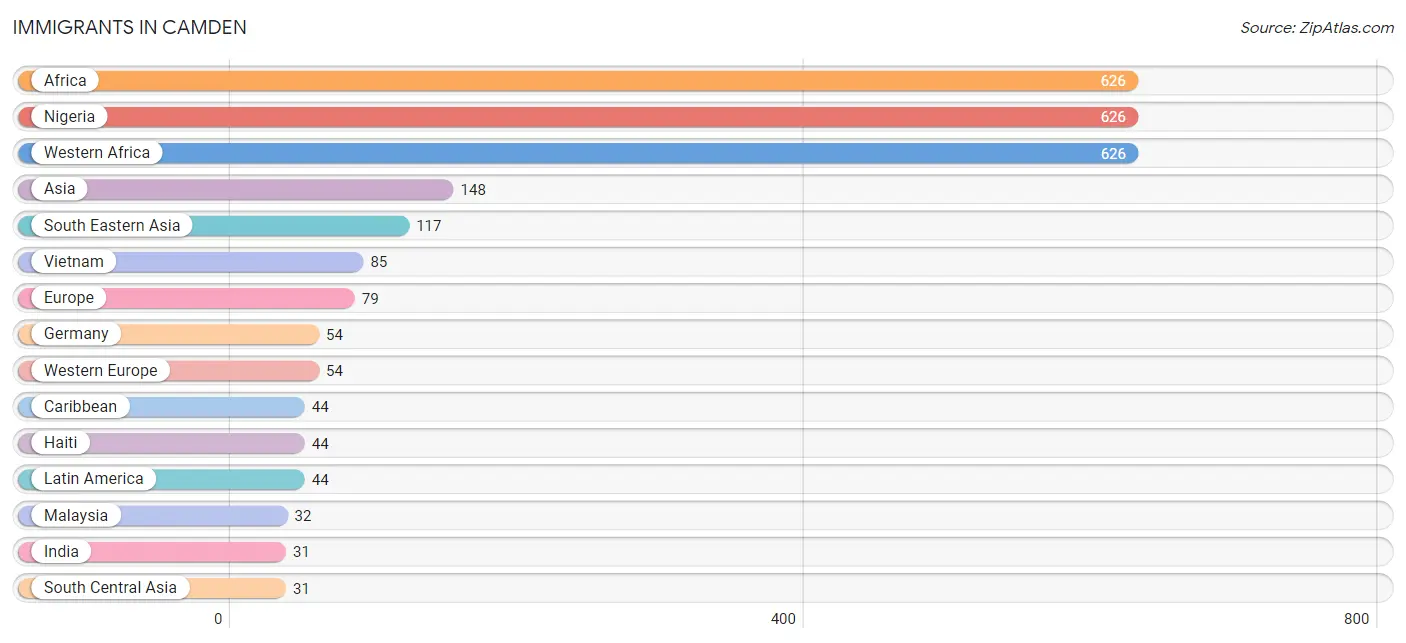
Immigrants in Camden
The most numerous immigrant groups reported in Camden came from Africa (626 | 16.0%), Nigeria (626 | 16.0%), Western Africa (626 | 16.0%), Asia (148 | 3.8%), and South Eastern Asia (117 | 3.0%), together accounting for 54.7% of all Camden residents.
| Immigration Origin | # Population | % Population |
| Africa | 626 | 16.0% |
| Asia | 148 | 3.8% |
| Caribbean | 44 | 1.1% |
| Eastern Europe | 25 | 0.6% |
| Europe | 79 | 2.0% |
| Germany | 54 | 1.4% |
| Haiti | 44 | 1.1% |
| India | 31 | 0.8% |
| Latin America | 44 | 1.1% |
| Malaysia | 32 | 0.8% |
| Nigeria | 626 | 16.0% |
| South Central Asia | 31 | 0.8% |
| South Eastern Asia | 117 | 3.0% |
| Vietnam | 85 | 2.2% |
| Western Africa | 626 | 16.0% |
| Western Europe | 54 | 1.4% | View All 16 Rows |
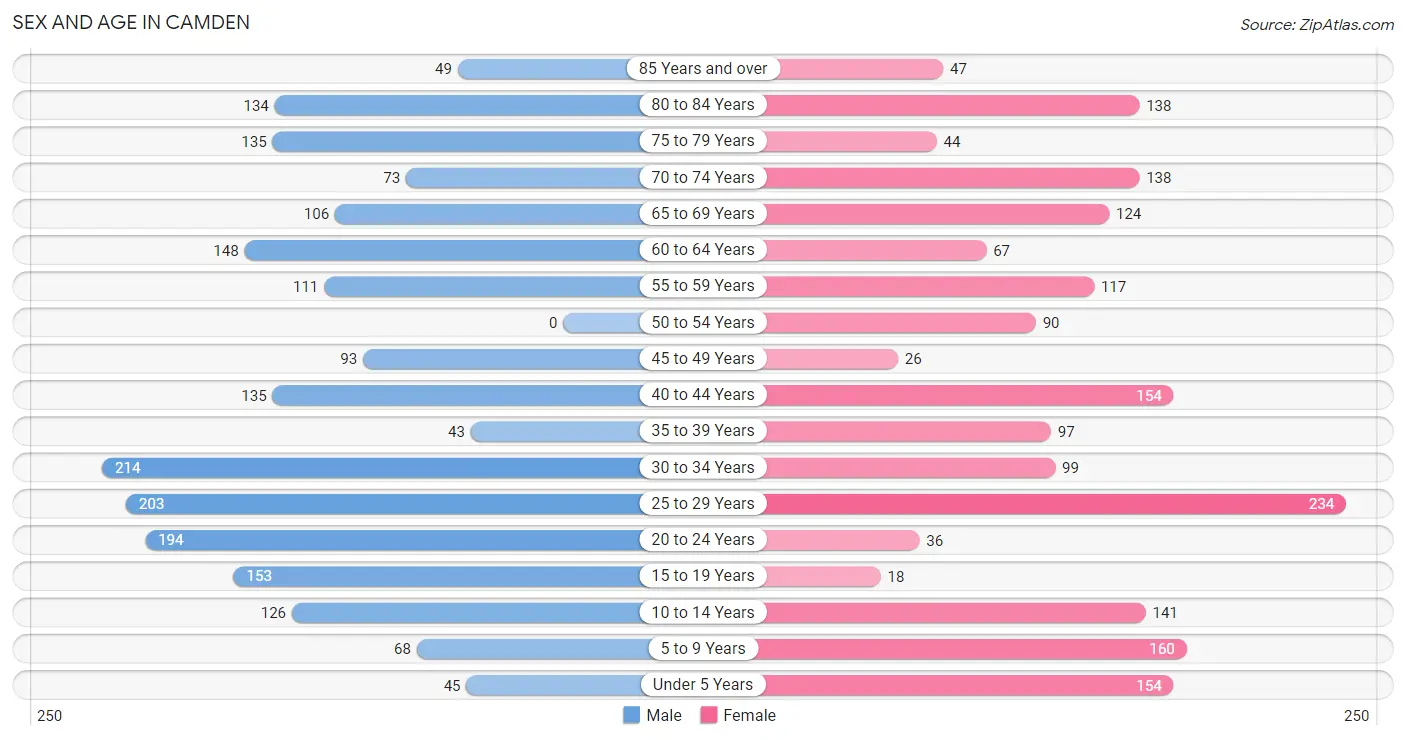
Sex and Age in Camden
Sex and Age in Camden
The most populous age groups in Camden are 30 to 34 Years (214 | 10.5%) for men and 25 to 29 Years (234 | 12.4%) for women.
| Age Bracket | Male | Female |
| Under 5 Years | 45 (2.2%) | 154 (8.2%) |
| 5 to 9 Years | 68 (3.4%) | 160 (8.5%) |
| 10 to 14 Years | 126 (6.2%) | 141 (7.5%) |
| 15 to 19 Years | 153 (7.5%) | 18 (1.0%) |
| 20 to 24 Years | 194 (9.6%) | 36 (1.9%) |
| 25 to 29 Years | 203 (10.0%) | 234 (12.4%) |
| 30 to 34 Years | 214 (10.5%) | 99 (5.2%) |
| 35 to 39 Years | 43 (2.1%) | 97 (5.1%) |
| 40 to 44 Years | 135 (6.7%) | 154 (8.2%) |
| 45 to 49 Years | 93 (4.6%) | 26 (1.4%) |
| 50 to 54 Years | 0 (0.0%) | 90 (4.8%) |
| 55 to 59 Years | 111 (5.5%) | 117 (6.2%) |
| 60 to 64 Years | 148 (7.3%) | 67 (3.6%) |
| 65 to 69 Years | 106 (5.2%) | 124 (6.6%) |
| 70 to 74 Years | 73 (3.6%) | 138 (7.3%) |
| 75 to 79 Years | 135 (6.7%) | 44 (2.3%) |
| 80 to 84 Years | 134 (6.6%) | 138 (7.3%) |
| 85 Years and over | 49 (2.4%) | 47 (2.5%) |
| Total | 2,030 (100.0%) | 1,884 (100.0%) |
Families and Households in Camden
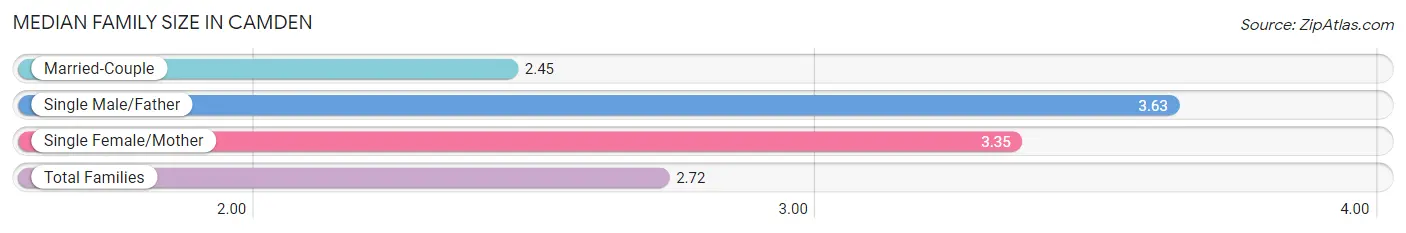
Median Family Size in Camden
The median family size in Camden is 2.72 persons per family, with single male/father families (228 | 17.8%) accounting for the largest median family size of 3.63 persons per family. On the other hand, married-couple families (969 | 75.5%) represent the smallest median family size with 2.45 persons per family.
| Family Type | # Families | Family Size |
| Married-Couple | 969 (75.5%) | 2.45 |
| Single Male/Father | 228 (17.8%) | 3.63 |
| Single Female/Mother | 86 (6.7%) | 3.35 |
| Total Families | 1,283 (100.0%) | 2.72 |
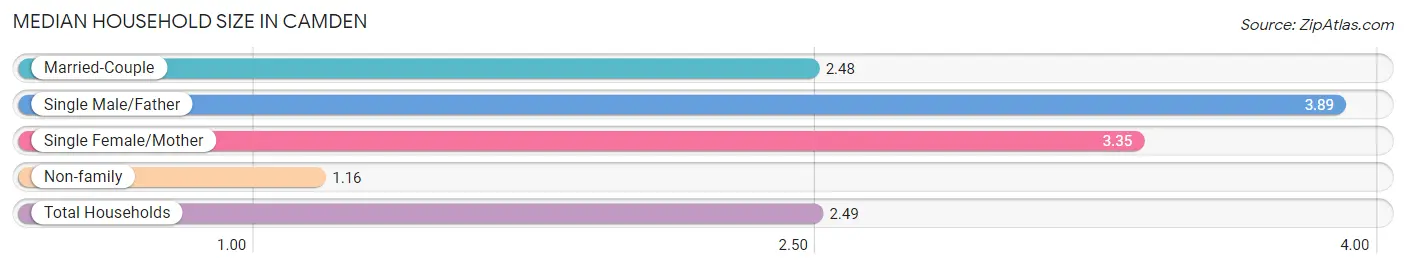
Median Household Size in Camden
The median household size in Camden is 2.49 persons per household, with single male/father households (228 | 14.6%) accounting for the largest median household size of 3.89 persons per household. non-family households (283 | 18.1%) represent the smallest median household size with 1.16 persons per household.
| Household Type | # Households | Household Size |
| Married-Couple | 969 (61.9%) | 2.48 |
| Single Male/Father | 228 (14.6%) | 3.89 |
| Single Female/Mother | 86 (5.5%) | 3.35 |
| Non-family | 283 (18.1%) | 1.16 |
| Total Households | 1,566 (100.0%) | 2.49 |
Household Size by Marriage Status in Camden
Out of a total of 1,566 households in Camden, 1,283 (81.9%) are family households, while 283 (18.1%) are nonfamily households. The most numerous type of family households are 2-person households, comprising 825, and the most common type of nonfamily households are 1-person households, comprising 258.
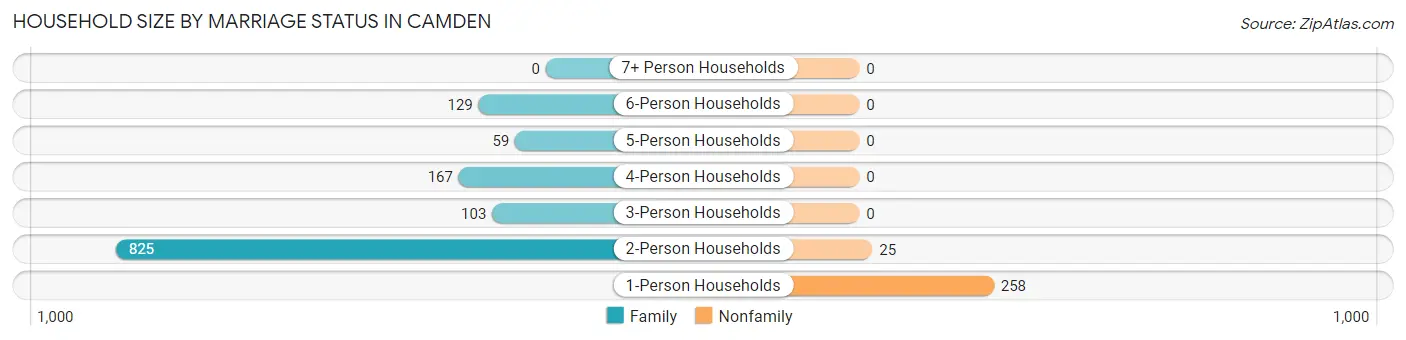
| Household Size | Family Households | Nonfamily Households |
| 1-Person Households | - | 258 (16.5%) |
| 2-Person Households | 825 (52.7%) | 25 (1.6%) |
| 3-Person Households | 103 (6.6%) | 0 (0.0%) |
| 4-Person Households | 167 (10.7%) | 0 (0.0%) |
| 5-Person Households | 59 (3.8%) | 0 (0.0%) |
| 6-Person Households | 129 (8.2%) | 0 (0.0%) |
| 7+ Person Households | 0 (0.0%) | 0 (0.0%) |
| Total | 1,283 (81.9%) | 283 (18.1%) |
Female Fertility in Camden
Fertility by Age in Camden
| Age Bracket | Women with Births | Births / 1,000 Women |
| 15 to 19 years | 0 (0.0%) | 0.0 |
| 20 to 34 years | 0 (0.0%) | 0.0 |
| 35 to 50 years | 0 (0.0%) | 0.0 |
| Total | 0 (0.0%) | 0.0 |
Fertility by Age by Marriage Status in Camden
| Age Bracket | Married | Unmarried |
| 15 to 19 years | 0 (0.0%) | 0 (0.0%) |
| 20 to 34 years | 0 (0.0%) | 0 (0.0%) |
| 35 to 50 years | 0 (0.0%) | 0 (0.0%) |
| Total | 0 (0.0%) | 0 (0.0%) |
Fertility by Education in Camden
| Educational Attainment | Women with Births | Births / 1,000 Women |
| Less than High School | 0 (0.0%) | 0.0 |
| High School Diploma | 0 (0.0%) | 0.0 |
| College or Associate's Degree | 0 (0.0%) | 0.0 |
| Bachelor's Degree | 0 (0.0%) | 0.0 |
| Graduate Degree | 0 (0.0%) | 0.0 |
| Total | 0 (0.0%) | 0.0 |
Fertility by Education by Marriage Status in Camden
| Educational Attainment | Married | Unmarried |
| Less than High School | 0 (0.0%) | 0 (0.0%) |
| High School Diploma | 0 (0.0%) | 0 (0.0%) |
| College or Associate's Degree | 0 (0.0%) | 0 (0.0%) |
| Bachelor's Degree | 0 (0.0%) | 0 (0.0%) |
| Graduate Degree | 0 (0.0%) | 0 (0.0%) |
| Total | 0 (0.0%) | 0 (0.0%) |
Employment Characteristics in Camden
Employment by Class of Employer in Camden
Among the 1,806 employed individuals in Camden, private company employees (1,173 | 64.9%), federal government employees (212 | 11.7%), and state government employees (166 | 9.2%) make up the most common classes of employment.
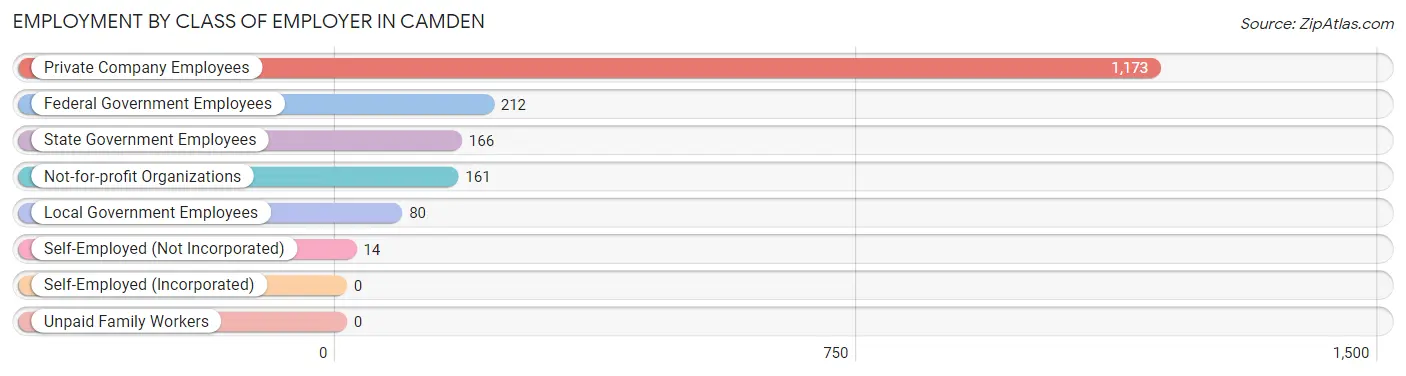
| Employer Class | # Employees | % Employees |
| Private Company Employees | 1,173 | 64.9% |
| Self-Employed (Incorporated) | 0 | 0.0% |
| Self-Employed (Not Incorporated) | 14 | 0.8% |
| Not-for-profit Organizations | 161 | 8.9% |
| Local Government Employees | 80 | 4.4% |
| State Government Employees | 166 | 9.2% |
| Federal Government Employees | 212 | 11.7% |
| Unpaid Family Workers | 0 | 0.0% |
| Total | 1,806 | 100.0% |
Employment Status by Age in Camden
According to the labor force statistics for Camden, out of the total population over 16 years of age (3,213), 58.1% or 1,867 individuals are in the labor force, with 3.5% or 65 of them unemployed. The age group with the highest labor force participation rate is 20 to 24 years, with 100.0% or 230 individuals in the labor force. Within the labor force, the 30 to 34 years age range has the highest percentage of unemployed individuals, with 13.7% or 43 of them being unemployed.
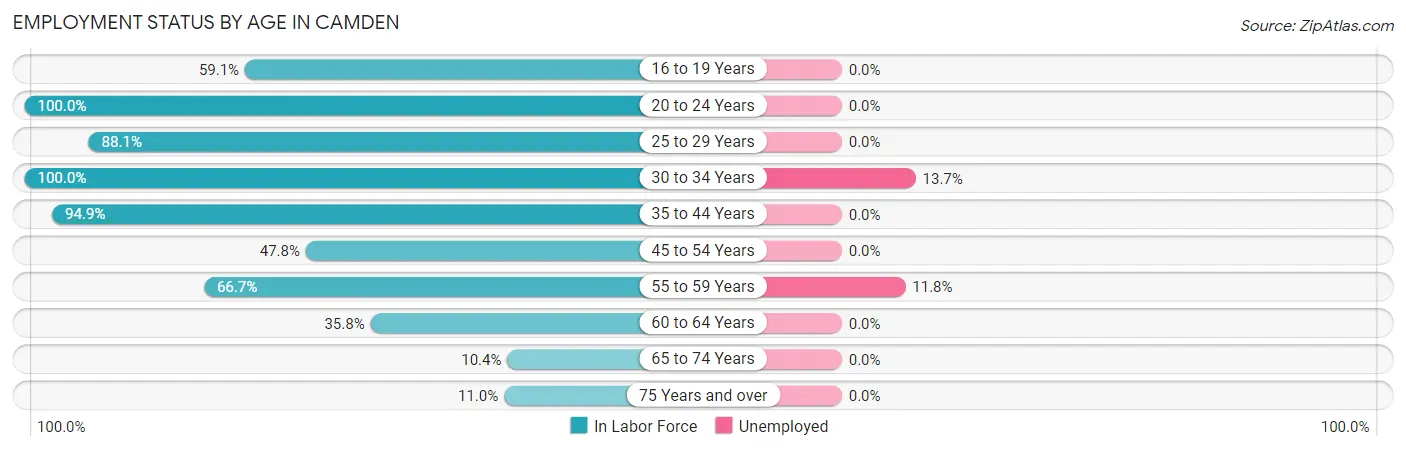
| Age Bracket | In Labor Force | Unemployed |
| 16 to 19 Years | 97 (59.1%) | 0 (0.0%) |
| 20 to 24 Years | 230 (100.0%) | 0 (0.0%) |
| 25 to 29 Years | 385 (88.1%) | 0 (0.0%) |
| 30 to 34 Years | 313 (100.0%) | 43 (13.7%) |
| 35 to 44 Years | 407 (94.9%) | 0 (0.0%) |
| 45 to 54 Years | 100 (47.8%) | 0 (0.0%) |
| 55 to 59 Years | 152 (66.7%) | 18 (11.8%) |
| 60 to 64 Years | 77 (35.8%) | 0 (0.0%) |
| 65 to 74 Years | 46 (10.4%) | 0 (0.0%) |
| 75 Years and over | 60 (11.0%) | 0 (0.0%) |
| Total | 1,867 (58.1%) | 65 (3.5%) |
Employment Status by Educational Attainment in Camden
According to labor force statistics for Camden, 78.3% of individuals (1,434) out of the total population between 25 and 64 years of age (1,831) are in the labor force, with 4.6% or 66 of them being unemployed. The group with the highest labor force participation rate are those with the educational attainment of college / associate degree, with 90.1% or 485 individuals in the labor force. Within the labor force, individuals with college / associate degree education have the highest percentage of unemployment, with 14.1% or 68 of them being unemployed.
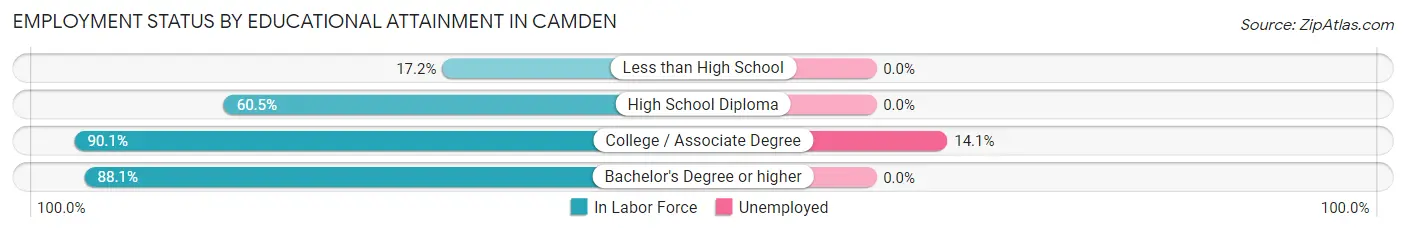
| Educational Attainment | In Labor Force | Unemployed |
| Less than High School | 27 (17.2%) | 0 (0.0%) |
| High School Diploma | 173 (60.5%) | 0 (0.0%) |
| College / Associate Degree | 485 (90.1%) | 76 (14.1%) |
| Bachelor's Degree or higher | 749 (88.1%) | 0 (0.0%) |
| Total | 1,434 (78.3%) | 84 (4.6%) |
Employment Occupations by Sex in Camden
Management, Business, Science and Arts Occupations
The most common Management, Business, Science and Arts occupations in Camden are Management (225 | 13.4%), Health Diagnosing & Treating (193 | 11.5%), Health Technologists (145 | 8.6%), Community & Social Service (125 | 7.5%), and Education, Arts & Media (108 | 6.4%).

Management, Business, Science and Arts Occupations by Sex
Within the Management, Business, Science and Arts occupations in Camden, the most male-oriented occupations are Architecture & Engineering (100.0%), Life, Physical & Social Science (100.0%), and Education Instruction & Library (94.1%), while the most female-oriented occupations are Computers & Mathematics (100.0%), Health Diagnosing & Treating (100.0%), and Health Technologists (100.0%).
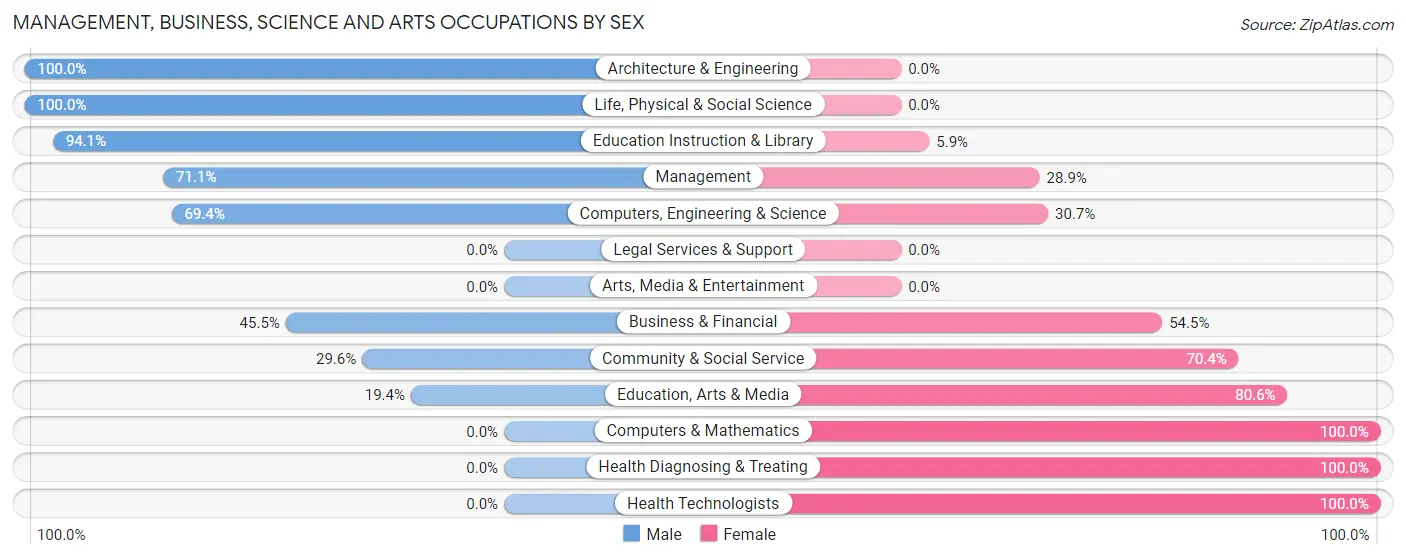
| Occupation | Male | Female |
| Management | 160 (71.1%) | 65 (28.9%) |
| Business & Financial | 46 (45.5%) | 55 (54.5%) |
| Computers, Engineering & Science | 43 (69.4%) | 19 (30.6%) |
| Computers & Mathematics | 0 (0.0%) | 19 (100.0%) |
| Architecture & Engineering | 23 (100.0%) | 0 (0.0%) |
| Life, Physical & Social Science | 20 (100.0%) | 0 (0.0%) |
| Community & Social Service | 37 (29.6%) | 88 (70.4%) |
| Education, Arts & Media | 21 (19.4%) | 87 (80.6%) |
| Legal Services & Support | 0 (0.0%) | 0 (0.0%) |
| Education Instruction & Library | 16 (94.1%) | 1 (5.9%) |
| Arts, Media & Entertainment | 0 (0.0%) | 0 (0.0%) |
| Health Diagnosing & Treating | 0 (0.0%) | 193 (100.0%) |
| Health Technologists | 0 (0.0%) | 145 (100.0%) |
| Total (Category) | 286 (40.5%) | 420 (59.5%) |
| Total (Overall) | 981 (58.5%) | 695 (41.5%) |
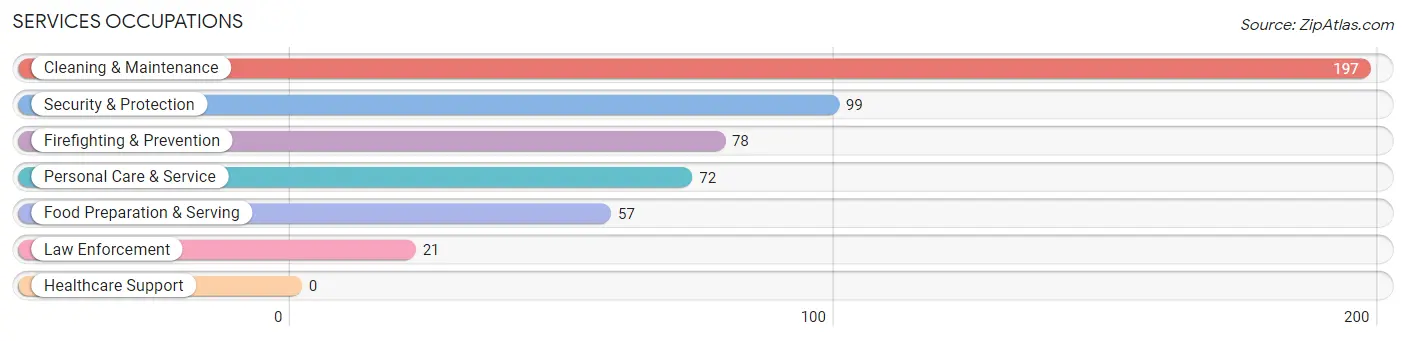
Services Occupations
The most common Services occupations in Camden are Cleaning & Maintenance (197 | 11.7%), Security & Protection (99 | 5.9%), Firefighting & Prevention (78 | 4.6%), Personal Care & Service (72 | 4.3%), and Food Preparation & Serving (57 | 3.4%).
Services Occupations by Sex
Within the Services occupations in Camden, the most male-oriented occupations are Security & Protection (100.0%), Firefighting & Prevention (100.0%), and Law Enforcement (100.0%), while the most female-oriented occupations are Food Preparation & Serving (61.4%), Personal Care & Service (25.0%), and Cleaning & Maintenance (8.6%).
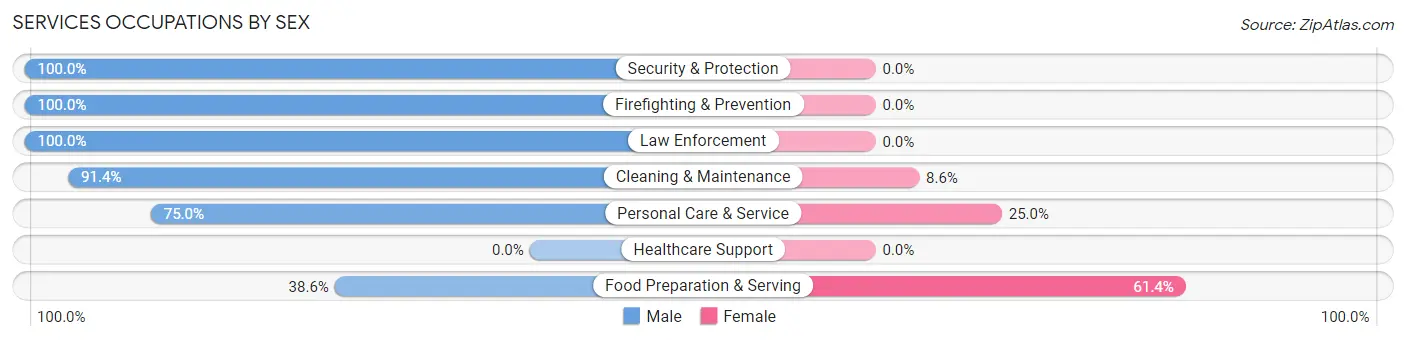
| Occupation | Male | Female |
| Healthcare Support | 0 (0.0%) | 0 (0.0%) |
| Security & Protection | 99 (100.0%) | 0 (0.0%) |
| Firefighting & Prevention | 78 (100.0%) | 0 (0.0%) |
| Law Enforcement | 21 (100.0%) | 0 (0.0%) |
| Food Preparation & Serving | 22 (38.6%) | 35 (61.4%) |
| Cleaning & Maintenance | 180 (91.4%) | 17 (8.6%) |
| Personal Care & Service | 54 (75.0%) | 18 (25.0%) |
| Total (Category) | 355 (83.5%) | 70 (16.5%) |
| Total (Overall) | 981 (58.5%) | 695 (41.5%) |
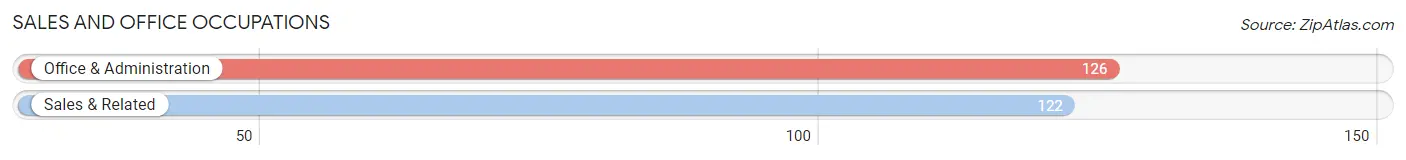
Sales and Office Occupations
The most common Sales and Office occupations in Camden are Office & Administration (126 | 7.5%), and Sales & Related (122 | 7.3%).
Sales and Office Occupations by Sex
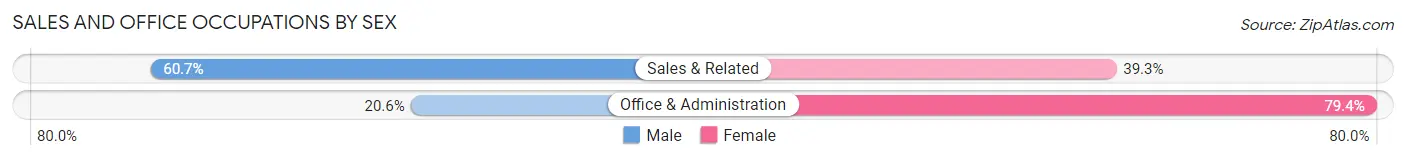
| Occupation | Male | Female |
| Sales & Related | 74 (60.7%) | 48 (39.3%) |
| Office & Administration | 26 (20.6%) | 100 (79.4%) |
| Total (Category) | 100 (40.3%) | 148 (59.7%) |
| Total (Overall) | 981 (58.5%) | 695 (41.5%) |
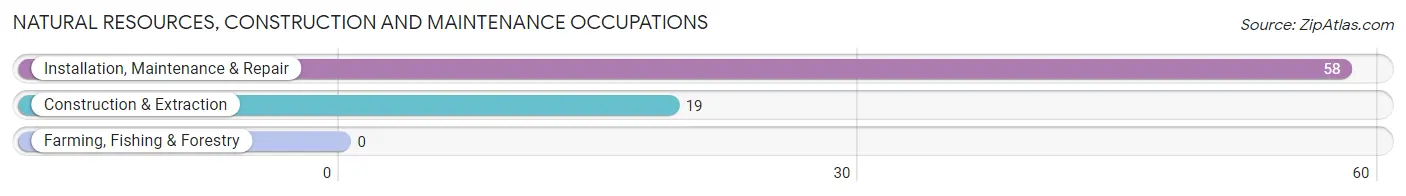
Natural Resources, Construction and Maintenance Occupations
The most common Natural Resources, Construction and Maintenance occupations in Camden are Installation, Maintenance & Repair (58 | 3.5%), and Construction & Extraction (19 | 1.1%).
Natural Resources, Construction and Maintenance Occupations by Sex
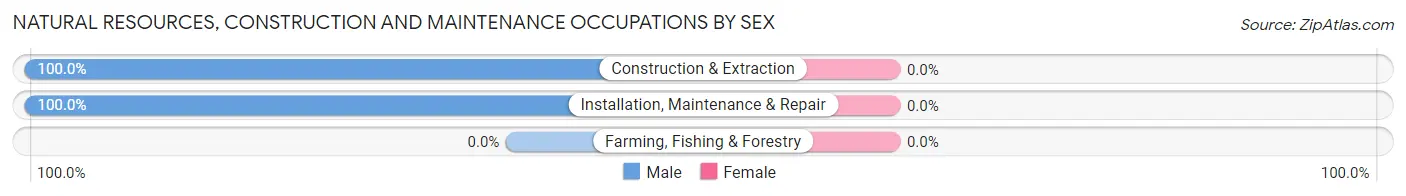
| Occupation | Male | Female |
| Farming, Fishing & Forestry | 0 (0.0%) | 0 (0.0%) |
| Construction & Extraction | 19 (100.0%) | 0 (0.0%) |
| Installation, Maintenance & Repair | 58 (100.0%) | 0 (0.0%) |
| Total (Category) | 77 (100.0%) | 0 (0.0%) |
| Total (Overall) | 981 (58.5%) | 695 (41.5%) |
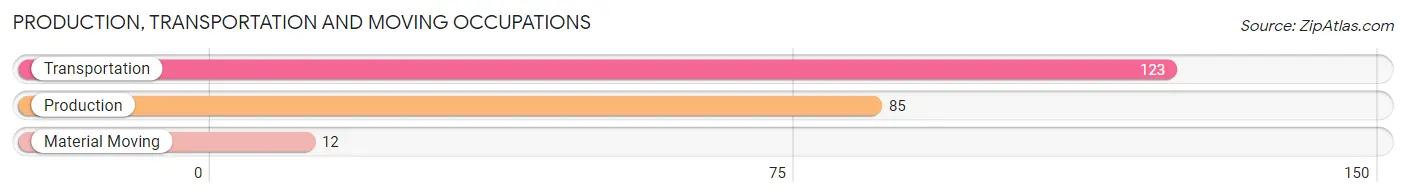
Production, Transportation and Moving Occupations
The most common Production, Transportation and Moving occupations in Camden are Transportation (123 | 7.3%), Production (85 | 5.1%), and Material Moving (12 | 0.7%).
Production, Transportation and Moving Occupations by Sex
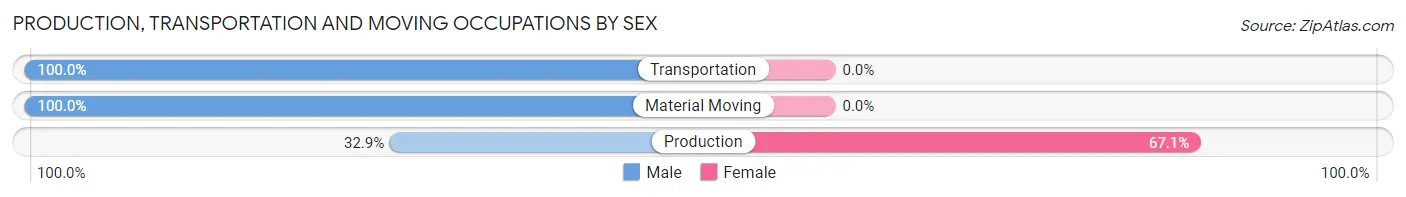
| Occupation | Male | Female |
| Production | 28 (32.9%) | 57 (67.1%) |
| Transportation | 123 (100.0%) | 0 (0.0%) |
| Material Moving | 12 (100.0%) | 0 (0.0%) |
| Total (Category) | 163 (74.1%) | 57 (25.9%) |
| Total (Overall) | 981 (58.5%) | 695 (41.5%) |
Employment Industries by Sex in Camden
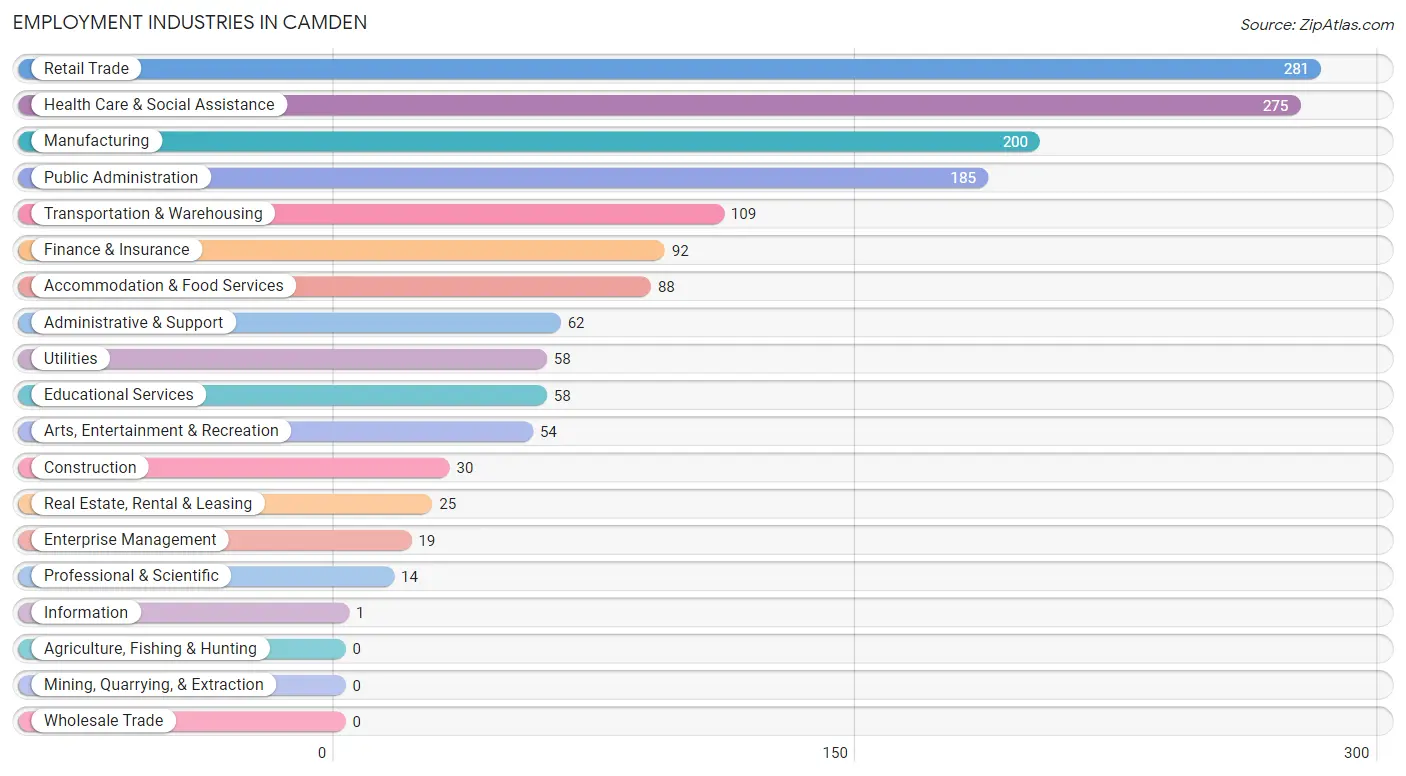
Employment Industries in Camden
The major employment industries in Camden include Retail Trade (281 | 16.8%), Health Care & Social Assistance (275 | 16.4%), Manufacturing (200 | 11.9%), Public Administration (185 | 11.0%), and Transportation & Warehousing (109 | 6.5%).
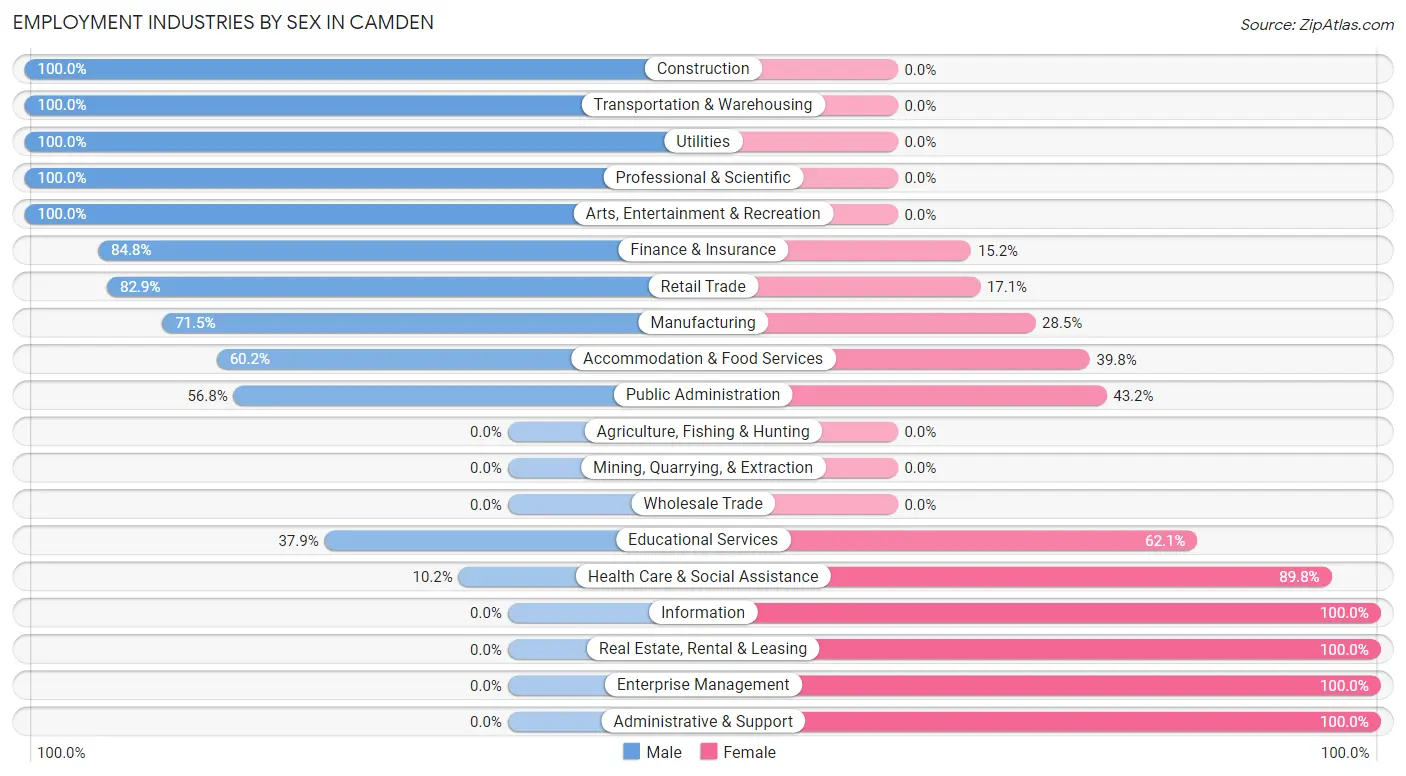
Employment Industries by Sex in Camden
The Camden industries that see more men than women are Construction (100.0%), Transportation & Warehousing (100.0%), and Utilities (100.0%), whereas the industries that tend to have a higher number of women are Information (100.0%), Real Estate, Rental & Leasing (100.0%), and Enterprise Management (100.0%).
| Industry | Male | Female |
| Agriculture, Fishing & Hunting | 0 (0.0%) | 0 (0.0%) |
| Mining, Quarrying, & Extraction | 0 (0.0%) | 0 (0.0%) |
| Construction | 30 (100.0%) | 0 (0.0%) |
| Manufacturing | 143 (71.5%) | 57 (28.5%) |
| Wholesale Trade | 0 (0.0%) | 0 (0.0%) |
| Retail Trade | 233 (82.9%) | 48 (17.1%) |
| Transportation & Warehousing | 109 (100.0%) | 0 (0.0%) |
| Utilities | 58 (100.0%) | 0 (0.0%) |
| Information | 0 (0.0%) | 1 (100.0%) |
| Finance & Insurance | 78 (84.8%) | 14 (15.2%) |
| Real Estate, Rental & Leasing | 0 (0.0%) | 25 (100.0%) |
| Professional & Scientific | 14 (100.0%) | 0 (0.0%) |
| Enterprise Management | 0 (0.0%) | 19 (100.0%) |
| Administrative & Support | 0 (0.0%) | 62 (100.0%) |
| Educational Services | 22 (37.9%) | 36 (62.1%) |
| Health Care & Social Assistance | 28 (10.2%) | 247 (89.8%) |
| Arts, Entertainment & Recreation | 54 (100.0%) | 0 (0.0%) |
| Accommodation & Food Services | 53 (60.2%) | 35 (39.8%) |
| Public Administration | 105 (56.8%) | 80 (43.2%) |
| Total | 981 (58.5%) | 695 (41.5%) |
Education in Camden
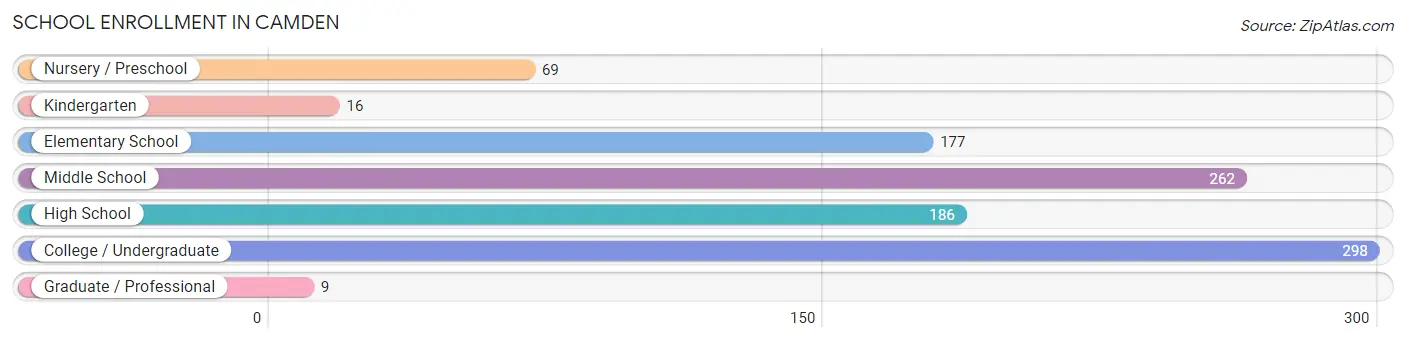
School Enrollment in Camden
The most common levels of schooling among the 1,017 students in Camden are college / undergraduate (298 | 29.3%), middle school (262 | 25.8%), and high school (186 | 18.3%).
| School Level | # Students | % Students |
| Nursery / Preschool | 69 | 6.8% |
| Kindergarten | 16 | 1.6% |
| Elementary School | 177 | 17.4% |
| Middle School | 262 | 25.8% |
| High School | 186 | 18.3% |
| College / Undergraduate | 298 | 29.3% |
| Graduate / Professional | 9 | 0.9% |
| Total | 1,017 | 100.0% |
School Enrollment by Age by Funding Source in Camden
Out of a total of 1,017 students who are enrolled in schools in Camden, 170 (16.7%) attend a private institution, while the remaining 847 (83.3%) are enrolled in public schools. The age group of 20 to 24 year olds has the highest likelihood of being enrolled in private schools, with 153 (100.0% in the age bracket) enrolled. Conversely, the age group of 3 to 4 year olds has the lowest likelihood of being enrolled in a private school, with 69 (100.0% in the age bracket) attending a public institution.
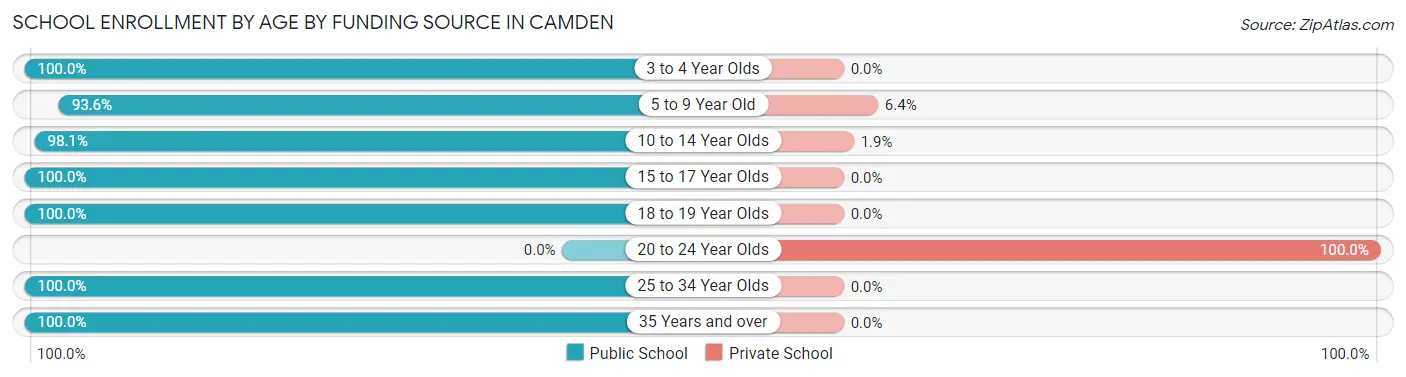
| Age Bracket | Public School | Private School |
| 3 to 4 Year Olds | 69 (100.0%) | 0 (0.0%) |
| 5 to 9 Year Old | 176 (93.6%) | 12 (6.4%) |
| 10 to 14 Year Olds | 262 (98.1%) | 5 (1.9%) |
| 15 to 17 Year Olds | 128 (100.0%) | 0 (0.0%) |
| 18 to 19 Year Olds | 43 (100.0%) | 0 (0.0%) |
| 20 to 24 Year Olds | 0 (0.0%) | 153 (100.0%) |
| 25 to 34 Year Olds | 83 (100.0%) | 0 (0.0%) |
| 35 Years and over | 86 (100.0%) | 0 (0.0%) |
| Total | 847 (83.3%) | 170 (16.7%) |
Educational Attainment by Field of Study in Camden
Business (255 | 19.8%), education (177 | 13.7%), science & technology (134 | 10.4%), liberal arts & history (132 | 10.2%), and arts & humanities (131 | 10.2%) are the most common fields of study among 1,288 individuals in Camden who have obtained a bachelor's degree or higher.
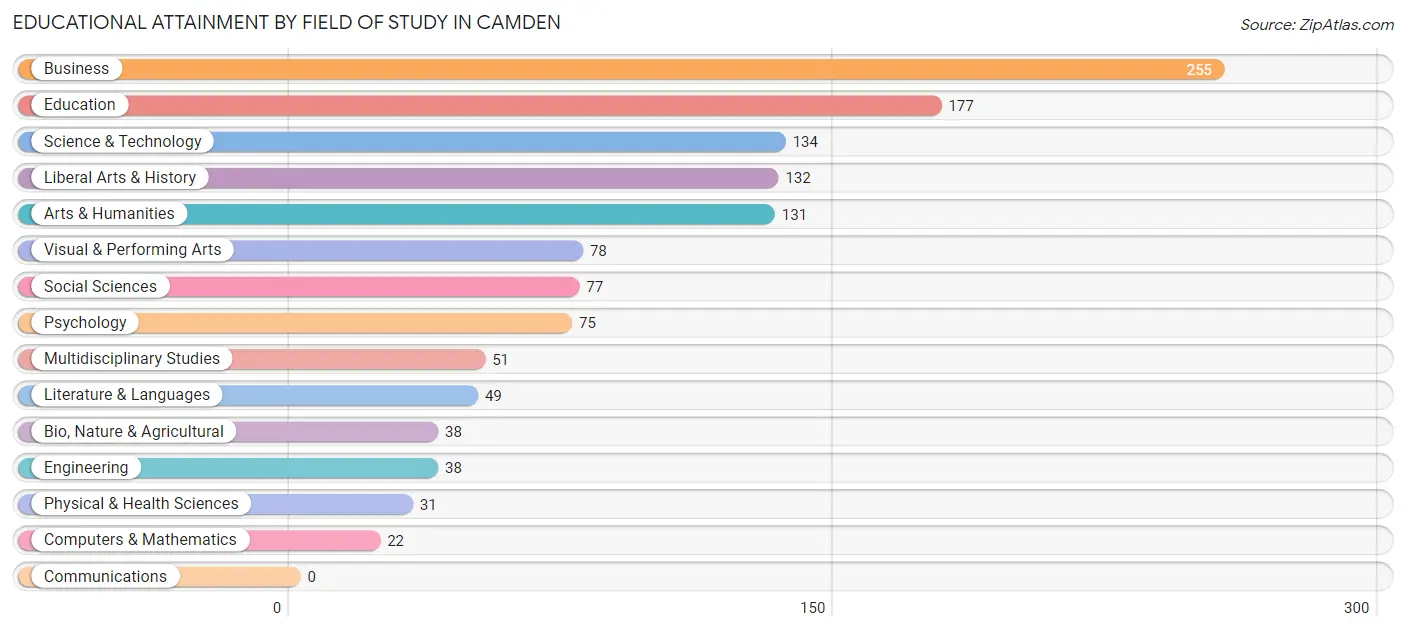
| Field of Study | # Graduates | % Graduates |
| Computers & Mathematics | 22 | 1.7% |
| Bio, Nature & Agricultural | 38 | 2.9% |
| Physical & Health Sciences | 31 | 2.4% |
| Psychology | 75 | 5.8% |
| Social Sciences | 77 | 6.0% |
| Engineering | 38 | 2.9% |
| Multidisciplinary Studies | 51 | 4.0% |
| Science & Technology | 134 | 10.4% |
| Business | 255 | 19.8% |
| Education | 177 | 13.7% |
| Literature & Languages | 49 | 3.8% |
| Liberal Arts & History | 132 | 10.2% |
| Visual & Performing Arts | 78 | 6.1% |
| Communications | 0 | 0.0% |
| Arts & Humanities | 131 | 10.2% |
| Total | 1,288 | 100.0% |
Transportation & Commute in Camden
Vehicle Availability by Sex in Camden
The most prevalent vehicle ownership categories in Camden are males with 4 vehicles (473, accounting for 44.3%) and females with 4 vehicles (132, making up 64.4%).
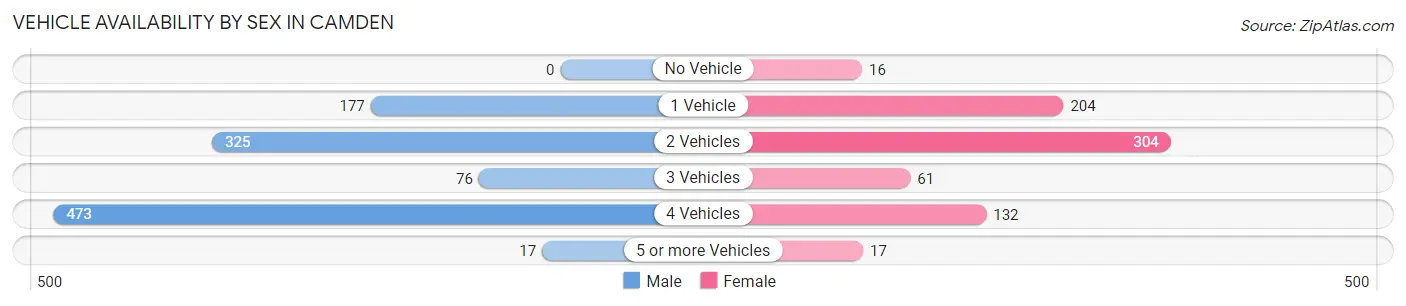
| Vehicles Available | Male | Female |
| No Vehicle | 0 (0.0%) | 16 (2.2%) |
| 1 Vehicle | 177 (16.6%) | 204 (27.8%) |
| 2 Vehicles | 325 (30.4%) | 304 (41.4%) |
| 3 Vehicles | 76 (7.1%) | 61 (8.3%) |
| 4 Vehicles | 473 (44.3%) | 132 (18.0%) |
| 5 or more Vehicles | 17 (1.6%) | 17 (2.3%) |
| Total | 1,068 (100.0%) | 734 (100.0%) |
Commute Time in Camden
The most frequently occuring commute durations in Camden are 15 to 19 minutes (319 commuters, 19.8%), 10 to 14 minutes (318 commuters, 19.8%), and 5 to 9 minutes (271 commuters, 16.8%).
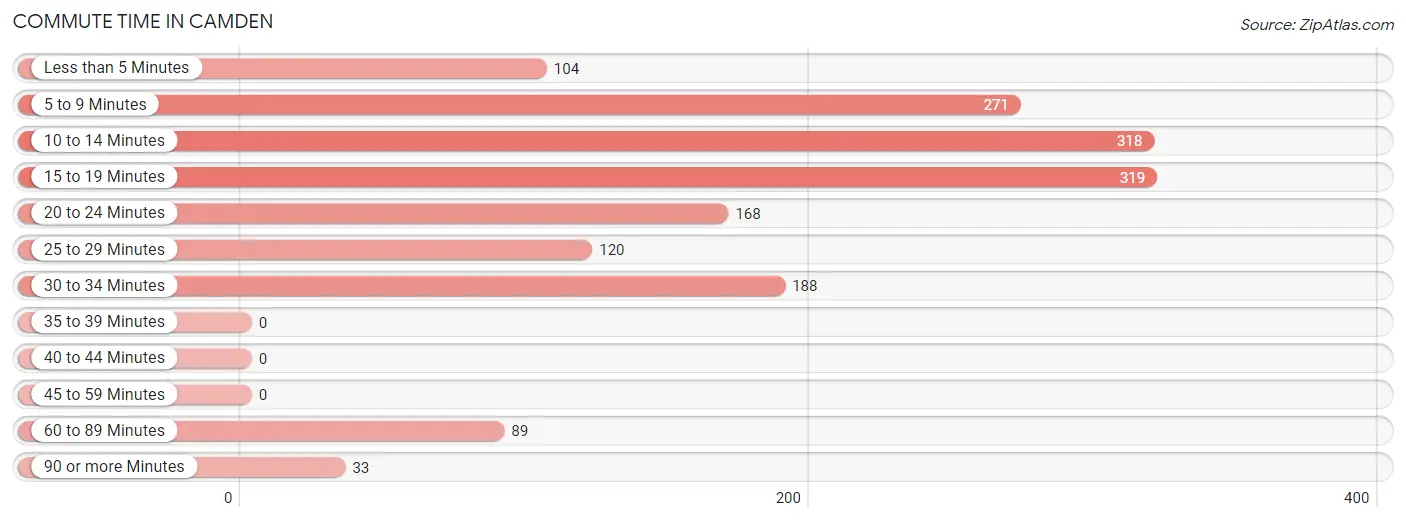
| Commute Time | # Commuters | % Commuters |
| Less than 5 Minutes | 104 | 6.5% |
| 5 to 9 Minutes | 271 | 16.8% |
| 10 to 14 Minutes | 318 | 19.8% |
| 15 to 19 Minutes | 319 | 19.8% |
| 20 to 24 Minutes | 168 | 10.4% |
| 25 to 29 Minutes | 120 | 7.4% |
| 30 to 34 Minutes | 188 | 11.7% |
| 35 to 39 Minutes | 0 | 0.0% |
| 40 to 44 Minutes | 0 | 0.0% |
| 45 to 59 Minutes | 0 | 0.0% |
| 60 to 89 Minutes | 89 | 5.5% |
| 90 or more Minutes | 33 | 2.1% |
Commute Time by Sex in Camden
The most common commute times in Camden are 10 to 14 minutes (249 commuters, 25.7%) for males and 20 to 24 minutes (168 commuters, 26.2%) for females.
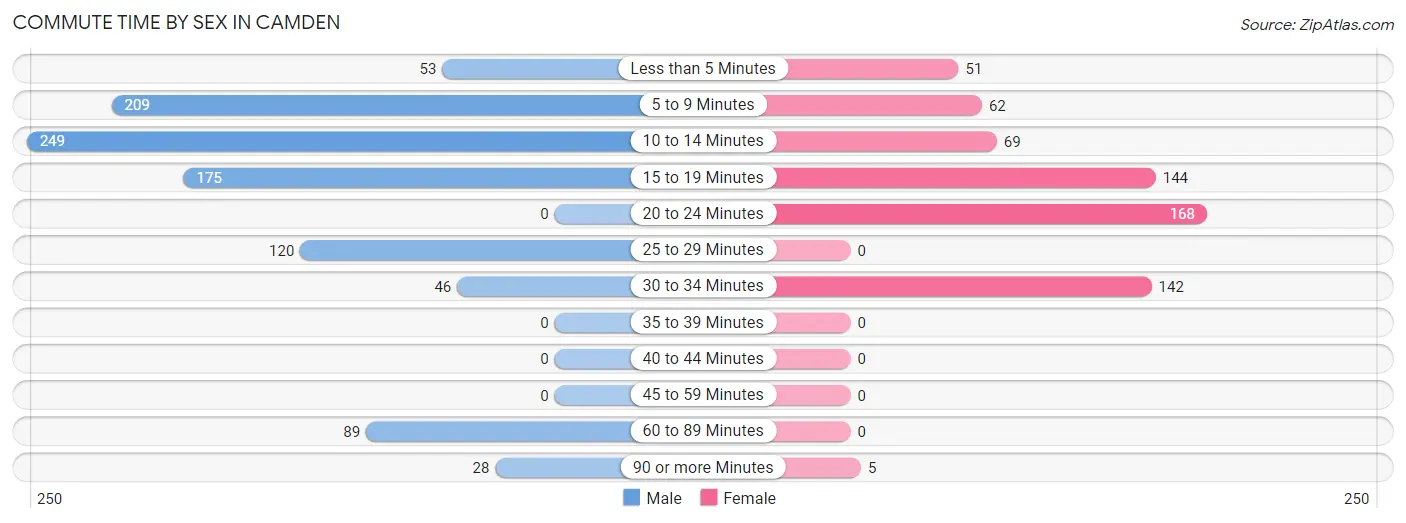
| Commute Time | Male | Female |
| Less than 5 Minutes | 53 (5.5%) | 51 (8.0%) |
| 5 to 9 Minutes | 209 (21.6%) | 62 (9.7%) |
| 10 to 14 Minutes | 249 (25.7%) | 69 (10.8%) |
| 15 to 19 Minutes | 175 (18.1%) | 144 (22.5%) |
| 20 to 24 Minutes | 0 (0.0%) | 168 (26.2%) |
| 25 to 29 Minutes | 120 (12.4%) | 0 (0.0%) |
| 30 to 34 Minutes | 46 (4.8%) | 142 (22.2%) |
| 35 to 39 Minutes | 0 (0.0%) | 0 (0.0%) |
| 40 to 44 Minutes | 0 (0.0%) | 0 (0.0%) |
| 45 to 59 Minutes | 0 (0.0%) | 0 (0.0%) |
| 60 to 89 Minutes | 89 (9.2%) | 0 (0.0%) |
| 90 or more Minutes | 28 (2.9%) | 5 (0.8%) |
Time of Departure to Work by Sex in Camden
The most frequent times of departure to work in Camden are 4:00 PM to 11:59 PM (273, 28.2%) for males and 7:00 AM to 7:29 AM (148, 23.1%) for females.
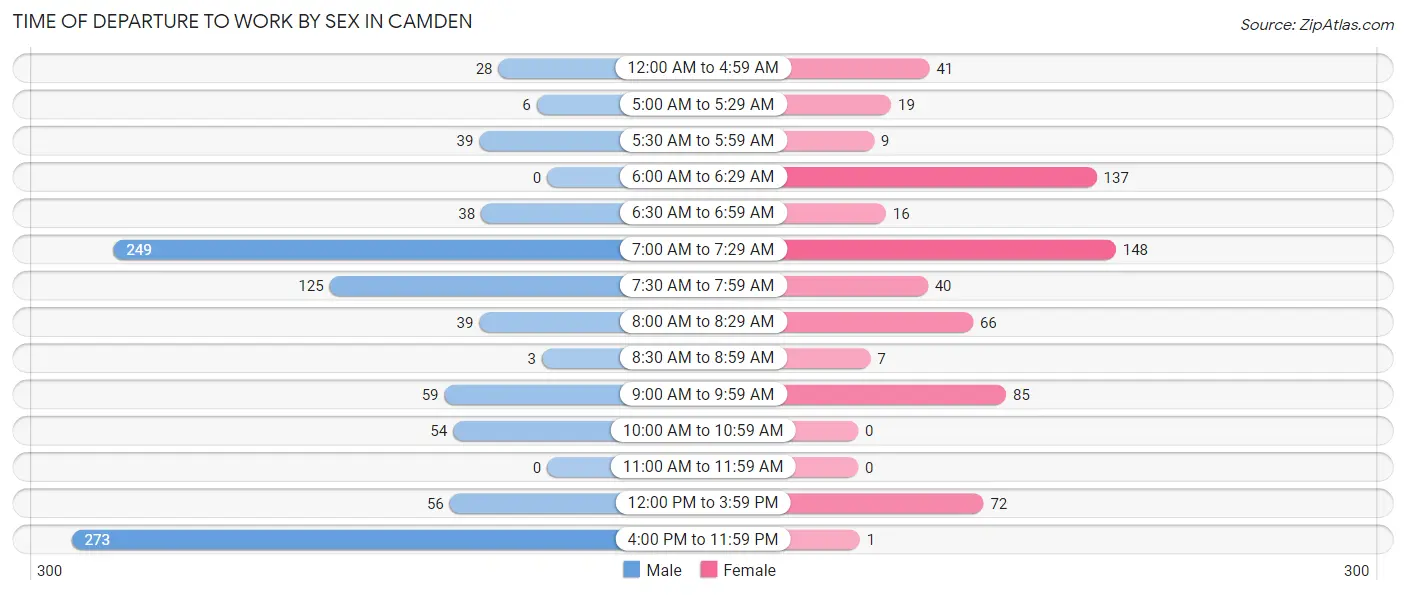
| Time of Departure | Male | Female |
| 12:00 AM to 4:59 AM | 28 (2.9%) | 41 (6.4%) |
| 5:00 AM to 5:29 AM | 6 (0.6%) | 19 (3.0%) |
| 5:30 AM to 5:59 AM | 39 (4.0%) | 9 (1.4%) |
| 6:00 AM to 6:29 AM | 0 (0.0%) | 137 (21.4%) |
| 6:30 AM to 6:59 AM | 38 (3.9%) | 16 (2.5%) |
| 7:00 AM to 7:29 AM | 249 (25.7%) | 148 (23.1%) |
| 7:30 AM to 7:59 AM | 125 (12.9%) | 40 (6.2%) |
| 8:00 AM to 8:29 AM | 39 (4.0%) | 66 (10.3%) |
| 8:30 AM to 8:59 AM | 3 (0.3%) | 7 (1.1%) |
| 9:00 AM to 9:59 AM | 59 (6.1%) | 85 (13.3%) |
| 10:00 AM to 10:59 AM | 54 (5.6%) | 0 (0.0%) |
| 11:00 AM to 11:59 AM | 0 (0.0%) | 0 (0.0%) |
| 12:00 PM to 3:59 PM | 56 (5.8%) | 72 (11.2%) |
| 4:00 PM to 11:59 PM | 273 (28.2%) | 1 (0.2%) |
| Total | 969 (100.0%) | 641 (100.0%) |
Housing Occupancy in Camden
Occupancy by Ownership in Camden
Of the total 1,566 dwellings in Camden, owner-occupied units account for 1,314 (83.9%), while renter-occupied units make up 252 (16.1%).
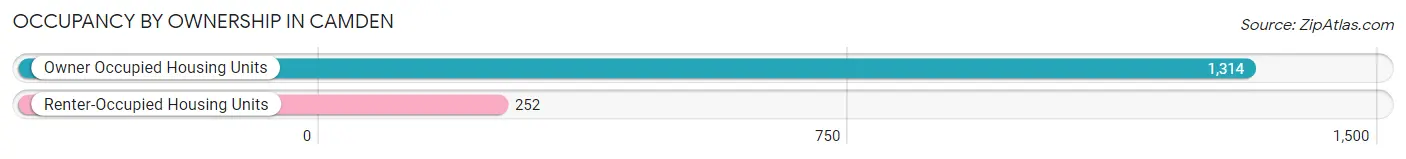
| Occupancy | # Housing Units | % Housing Units |
| Owner Occupied Housing Units | 1,314 | 83.9% |
| Renter-Occupied Housing Units | 252 | 16.1% |
| Total Occupied Housing Units | 1,566 | 100.0% |
Occupancy by Household Size in Camden
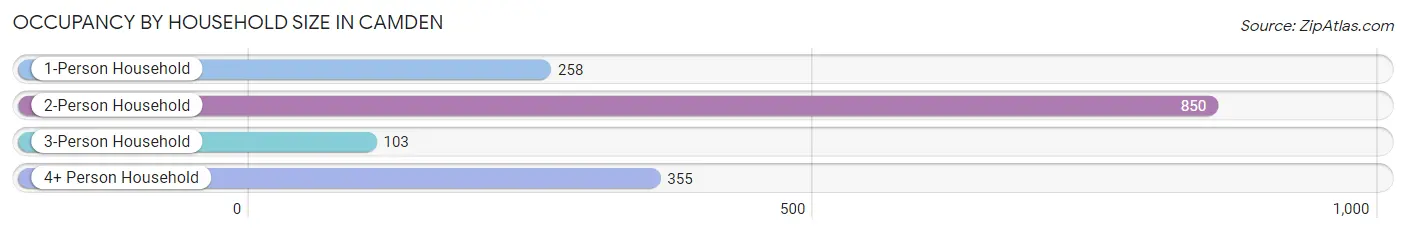
| Household Size | # Housing Units | % Housing Units |
| 1-Person Household | 258 | 16.5% |
| 2-Person Household | 850 | 54.3% |
| 3-Person Household | 103 | 6.6% |
| 4+ Person Household | 355 | 22.7% |
| Total Housing Units | 1,566 | 100.0% |
Occupancy by Ownership by Household Size in Camden
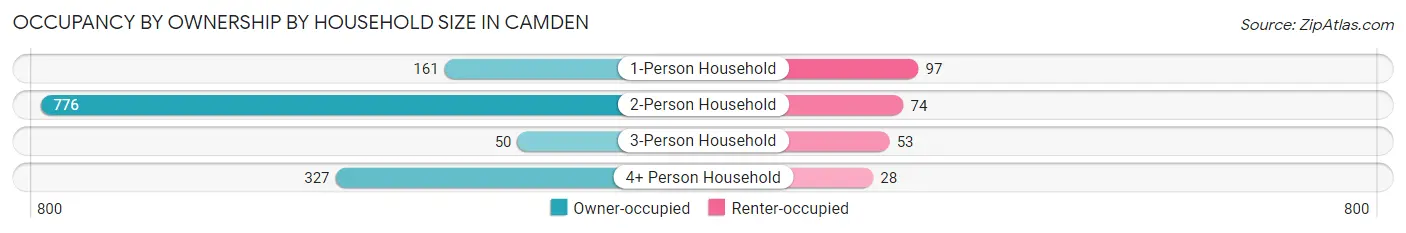
| Household Size | Owner-occupied | Renter-occupied |
| 1-Person Household | 161 (62.4%) | 97 (37.6%) |
| 2-Person Household | 776 (91.3%) | 74 (8.7%) |
| 3-Person Household | 50 (48.5%) | 53 (51.5%) |
| 4+ Person Household | 327 (92.1%) | 28 (7.9%) |
| Total Housing Units | 1,314 (83.9%) | 252 (16.1%) |
Occupancy by Educational Attainment in Camden
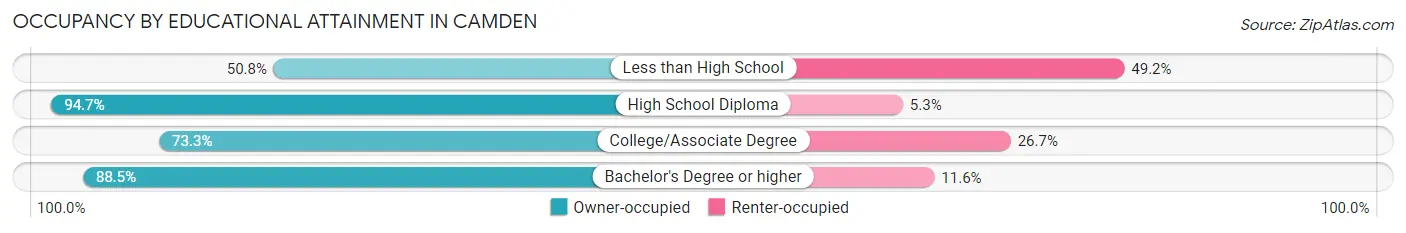
| Household Size | Owner-occupied | Renter-occupied |
| Less than High School | 32 (50.8%) | 31 (49.2%) |
| High School Diploma | 304 (94.7%) | 17 (5.3%) |
| College/Associate Degree | 327 (73.3%) | 119 (26.7%) |
| Bachelor's Degree or higher | 651 (88.4%) | 85 (11.6%) |
Occupancy by Age of Householder in Camden
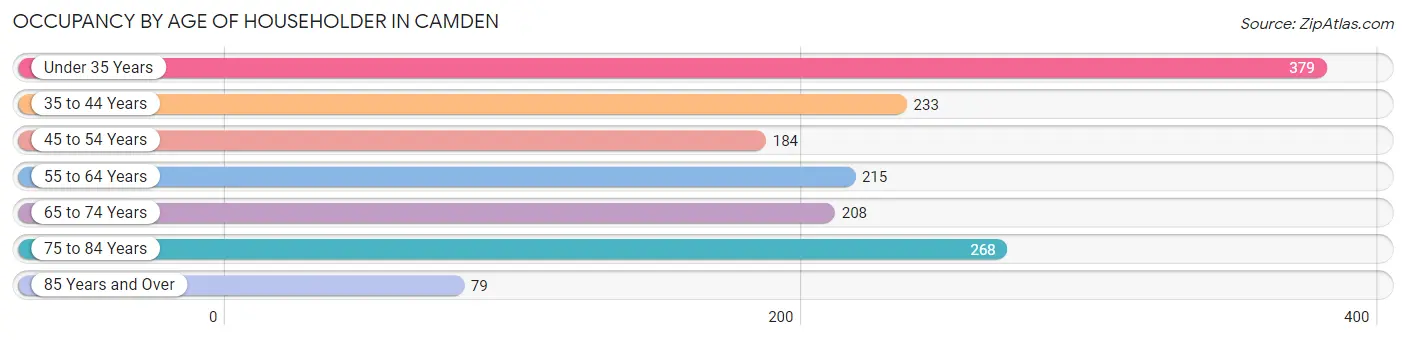
| Age Bracket | # Households | % Households |
| Under 35 Years | 379 | 24.2% |
| 35 to 44 Years | 233 | 14.9% |
| 45 to 54 Years | 184 | 11.7% |
| 55 to 64 Years | 215 | 13.7% |
| 65 to 74 Years | 208 | 13.3% |
| 75 to 84 Years | 268 | 17.1% |
| 85 Years and Over | 79 | 5.0% |
| Total | 1,566 | 100.0% |
Housing Finances in Camden
Median Income by Occupancy in Camden
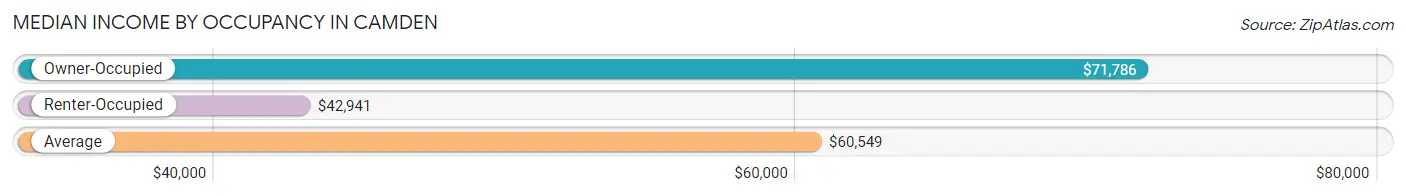
| Occupancy Type | # Households | Median Income |
| Owner-Occupied | 1,314 (83.9%) | $71,786 |
| Renter-Occupied | 252 (16.1%) | $42,941 |
| Average | 1,566 (100.0%) | $60,549 |
Occupancy by Householder Income Bracket in Camden
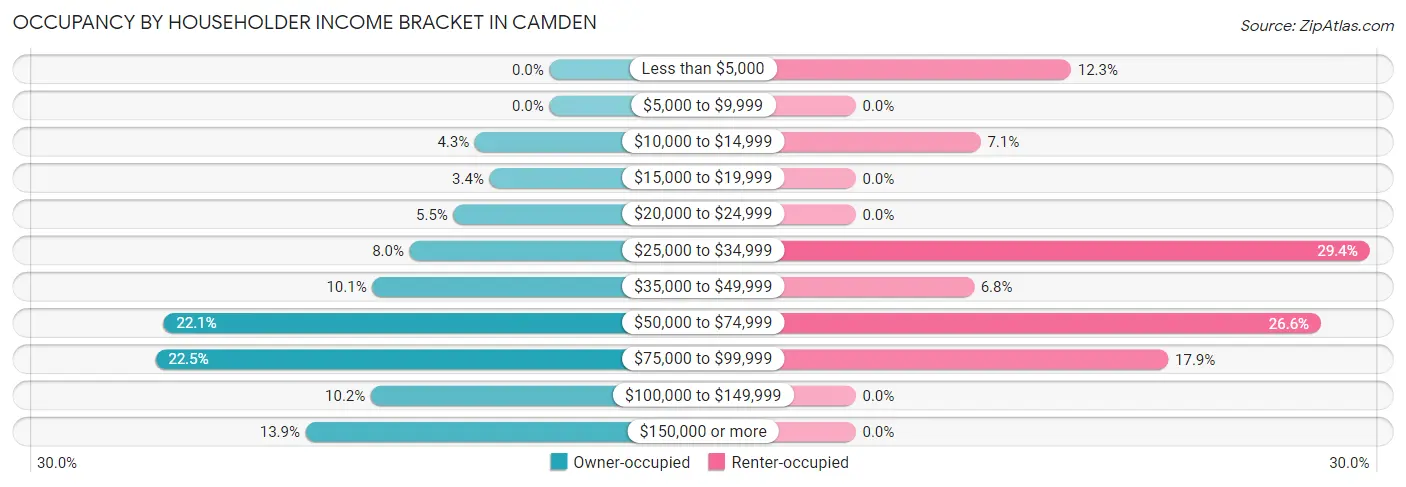
| Income Bracket | Owner-occupied | Renter-occupied |
| Less than $5,000 | 0 (0.0%) | 31 (12.3%) |
| $5,000 to $9,999 | 0 (0.0%) | 0 (0.0%) |
| $10,000 to $14,999 | 56 (4.3%) | 18 (7.1%) |
| $15,000 to $19,999 | 45 (3.4%) | 0 (0.0%) |
| $20,000 to $24,999 | 72 (5.5%) | 0 (0.0%) |
| $25,000 to $34,999 | 105 (8.0%) | 74 (29.4%) |
| $35,000 to $49,999 | 133 (10.1%) | 17 (6.8%) |
| $50,000 to $74,999 | 290 (22.1%) | 67 (26.6%) |
| $75,000 to $99,999 | 296 (22.5%) | 45 (17.9%) |
| $100,000 to $149,999 | 134 (10.2%) | 0 (0.0%) |
| $150,000 or more | 183 (13.9%) | 0 (0.0%) |
| Total | 1,314 (100.0%) | 252 (100.0%) |
Monthly Housing Cost Tiers in Camden
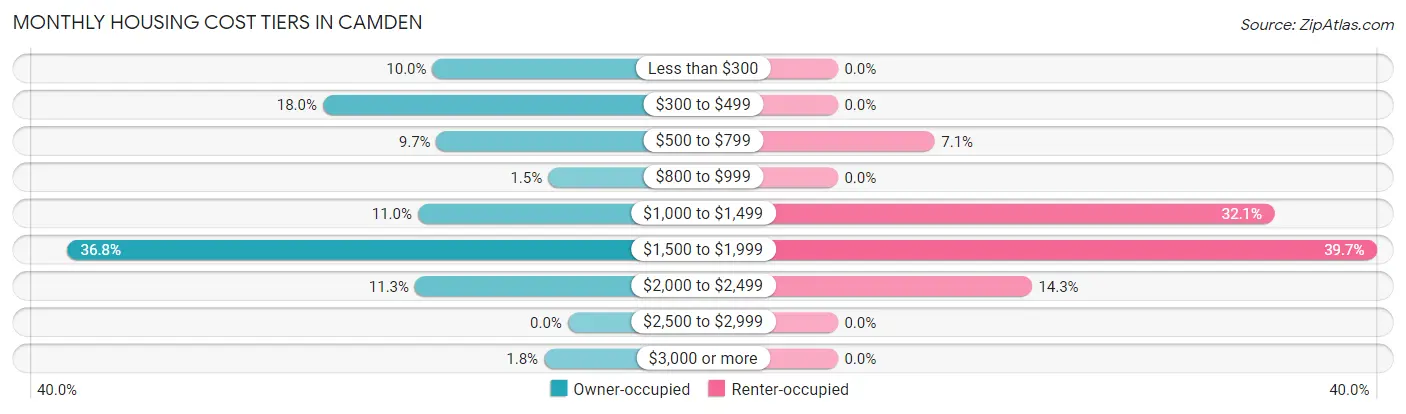
| Monthly Cost | Owner-occupied | Renter-occupied |
| Less than $300 | 131 (10.0%) | 0 (0.0%) |
| $300 to $499 | 237 (18.0%) | 0 (0.0%) |
| $500 to $799 | 127 (9.7%) | 18 (7.1%) |
| $800 to $999 | 19 (1.5%) | 0 (0.0%) |
| $1,000 to $1,499 | 145 (11.0%) | 81 (32.1%) |
| $1,500 to $1,999 | 484 (36.8%) | 100 (39.7%) |
| $2,000 to $2,499 | 148 (11.3%) | 36 (14.3%) |
| $2,500 to $2,999 | 0 (0.0%) | 0 (0.0%) |
| $3,000 or more | 23 (1.8%) | 0 (0.0%) |
| Total | 1,314 (100.0%) | 252 (100.0%) |
Physical Housing Characteristics in Camden
Housing Structures in Camden
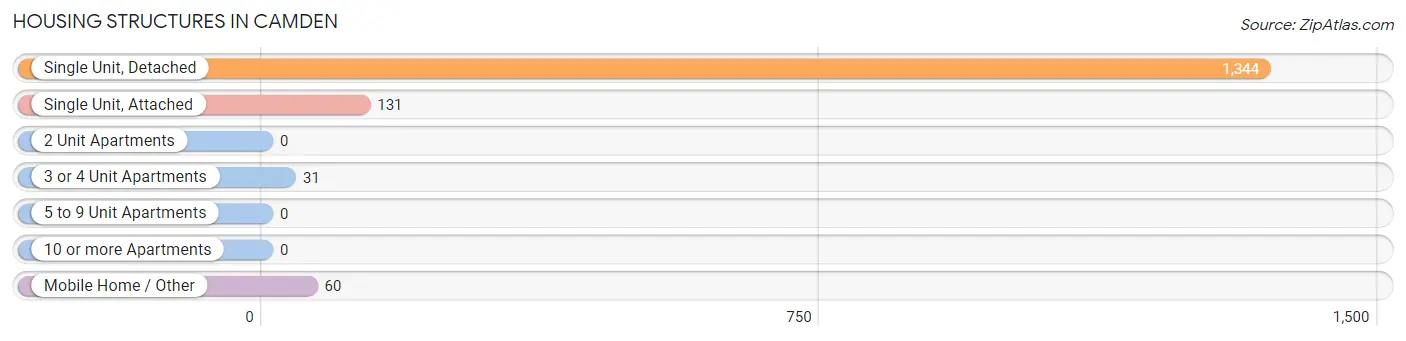
| Structure Type | # Housing Units | % Housing Units |
| Single Unit, Detached | 1,344 | 85.8% |
| Single Unit, Attached | 131 | 8.4% |
| 2 Unit Apartments | 0 | 0.0% |
| 3 or 4 Unit Apartments | 31 | 2.0% |
| 5 to 9 Unit Apartments | 0 | 0.0% |
| 10 or more Apartments | 0 | 0.0% |
| Mobile Home / Other | 60 | 3.8% |
| Total | 1,566 | 100.0% |
Housing Structures by Occupancy in Camden
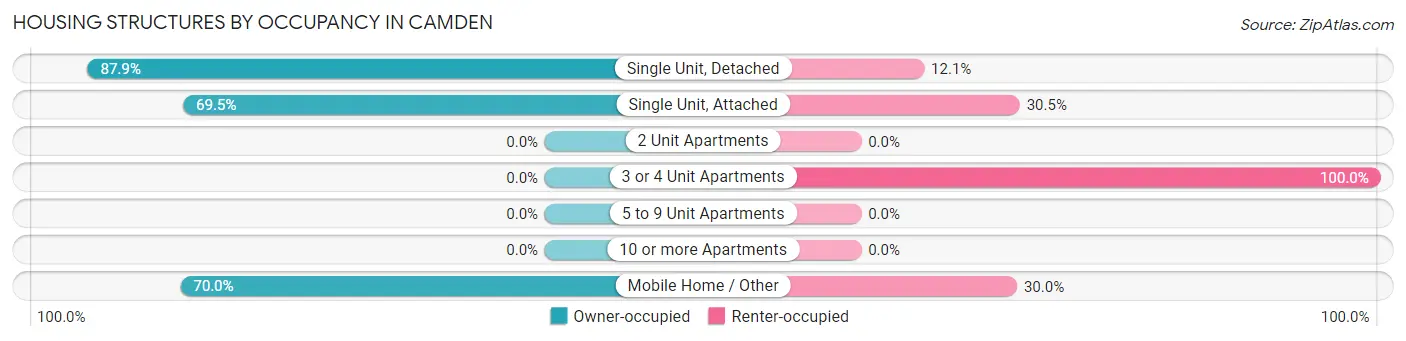
| Structure Type | Owner-occupied | Renter-occupied |
| Single Unit, Detached | 1,181 (87.9%) | 163 (12.1%) |
| Single Unit, Attached | 91 (69.5%) | 40 (30.5%) |
| 2 Unit Apartments | 0 (0.0%) | 0 (0.0%) |
| 3 or 4 Unit Apartments | 0 (0.0%) | 31 (100.0%) |
| 5 to 9 Unit Apartments | 0 (0.0%) | 0 (0.0%) |
| 10 or more Apartments | 0 (0.0%) | 0 (0.0%) |
| Mobile Home / Other | 42 (70.0%) | 18 (30.0%) |
| Total | 1,314 (83.9%) | 252 (16.1%) |
Housing Structures by Number of Rooms in Camden
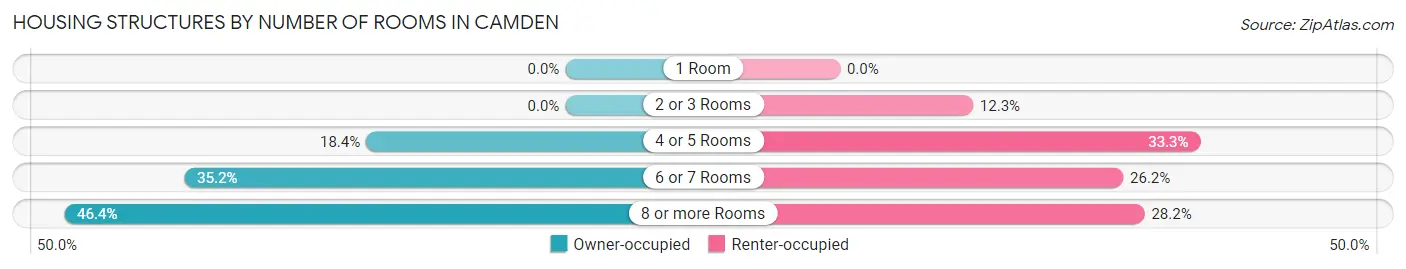
| Number of Rooms | Owner-occupied | Renter-occupied |
| 1 Room | 0 (0.0%) | 0 (0.0%) |
| 2 or 3 Rooms | 0 (0.0%) | 31 (12.3%) |
| 4 or 5 Rooms | 242 (18.4%) | 84 (33.3%) |
| 6 or 7 Rooms | 463 (35.2%) | 66 (26.2%) |
| 8 or more Rooms | 609 (46.4%) | 71 (28.2%) |
| Total | 1,314 (100.0%) | 252 (100.0%) |
Housing Structure by Heating Type in Camden
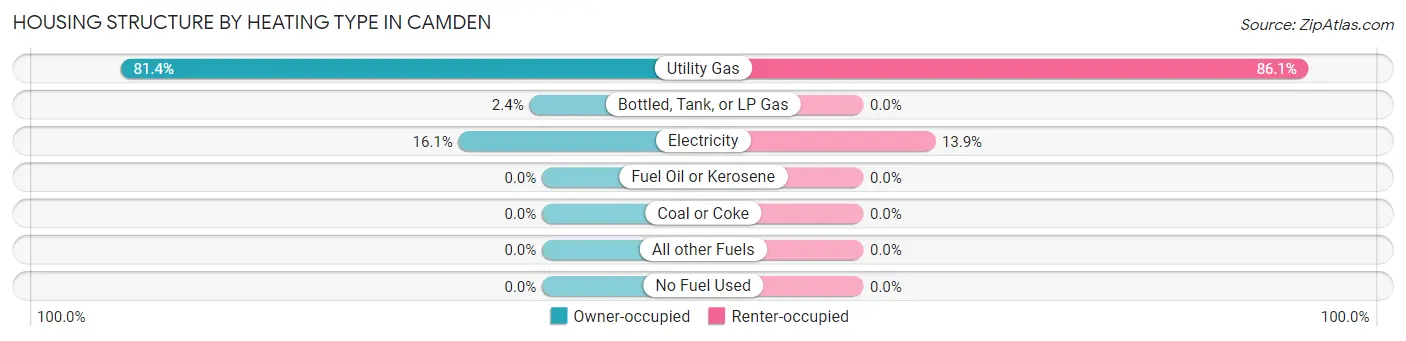
| Heating Type | Owner-occupied | Renter-occupied |
| Utility Gas | 1,070 (81.4%) | 217 (86.1%) |
| Bottled, Tank, or LP Gas | 32 (2.4%) | 0 (0.0%) |
| Electricity | 212 (16.1%) | 35 (13.9%) |
| Fuel Oil or Kerosene | 0 (0.0%) | 0 (0.0%) |
| Coal or Coke | 0 (0.0%) | 0 (0.0%) |
| All other Fuels | 0 (0.0%) | 0 (0.0%) |
| No Fuel Used | 0 (0.0%) | 0 (0.0%) |
| Total | 1,314 (100.0%) | 252 (100.0%) |
Household Vehicle Usage in Camden
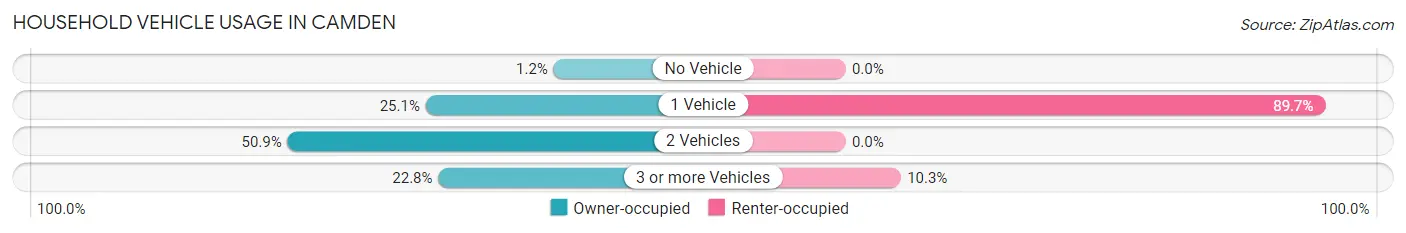
| Vehicles per Household | Owner-occupied | Renter-occupied |
| No Vehicle | 16 (1.2%) | 0 (0.0%) |
| 1 Vehicle | 330 (25.1%) | 226 (89.7%) |
| 2 Vehicles | 669 (50.9%) | 0 (0.0%) |
| 3 or more Vehicles | 299 (22.8%) | 26 (10.3%) |
| Total | 1,314 (100.0%) | 252 (100.0%) |
Real Estate & Mortgages in Camden
Real Estate and Mortgage Overview in Camden
| Characteristic | Without Mortgage | With Mortgage |
| Housing Units | 523 | 791 |
| Median Property Value | $209,900 | $288,200 |
| Median Household Income | $50,380 | $183 |
| Monthly Housing Costs | $407 | $23 |
| Real Estate Taxes | $974 | $0 |
Property Value by Mortgage Status in Camden
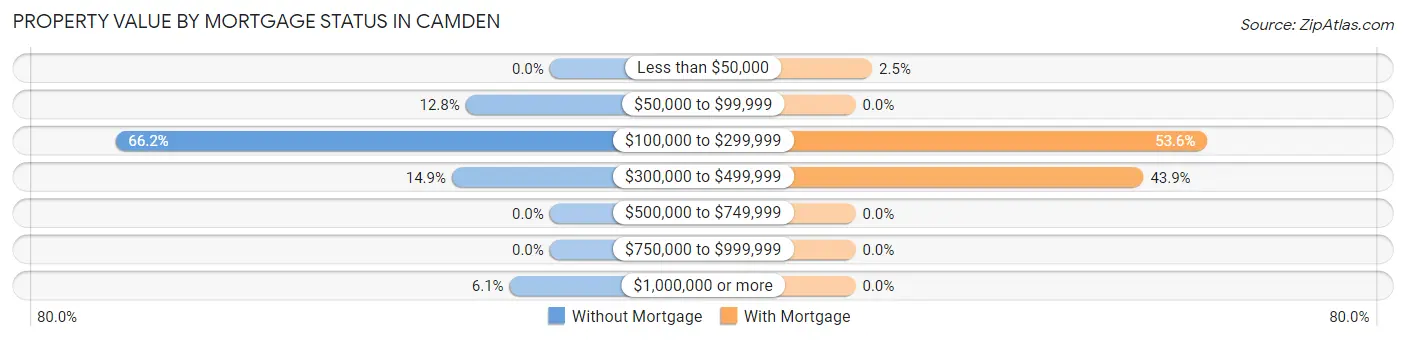
| Property Value | Without Mortgage | With Mortgage |
| Less than $50,000 | 0 (0.0%) | 20 (2.5%) |
| $50,000 to $99,999 | 67 (12.8%) | 0 (0.0%) |
| $100,000 to $299,999 | 346 (66.2%) | 424 (53.6%) |
| $300,000 to $499,999 | 78 (14.9%) | 347 (43.9%) |
| $500,000 to $749,999 | 0 (0.0%) | 0 (0.0%) |
| $750,000 to $999,999 | 0 (0.0%) | 0 (0.0%) |
| $1,000,000 or more | 32 (6.1%) | 0 (0.0%) |
| Total | 523 (100.0%) | 791 (100.0%) |
Household Income by Mortgage Status in Camden
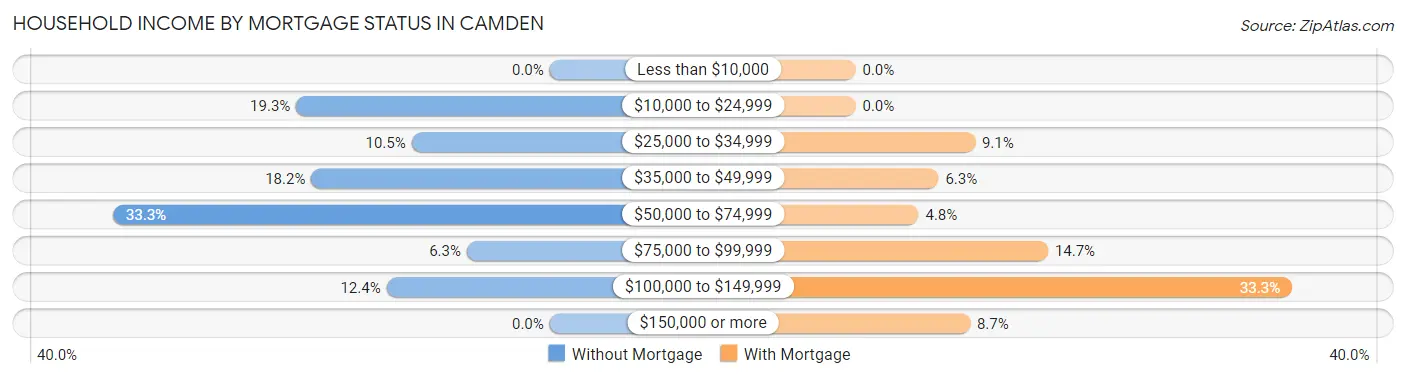
| Household Income | Without Mortgage | With Mortgage |
| Less than $10,000 | 0 (0.0%) | 0 (0.0%) |
| $10,000 to $24,999 | 101 (19.3%) | 0 (0.0%) |
| $25,000 to $34,999 | 55 (10.5%) | 72 (9.1%) |
| $35,000 to $49,999 | 95 (18.2%) | 50 (6.3%) |
| $50,000 to $74,999 | 174 (33.3%) | 38 (4.8%) |
| $75,000 to $99,999 | 33 (6.3%) | 116 (14.7%) |
| $100,000 to $149,999 | 65 (12.4%) | 263 (33.3%) |
| $150,000 or more | 0 (0.0%) | 69 (8.7%) |
| Total | 523 (100.0%) | 791 (100.0%) |
Property Value to Household Income Ratio in Camden
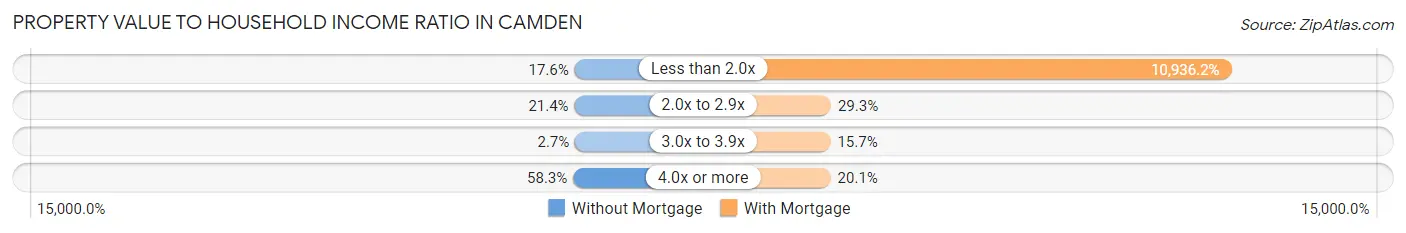
| Value-to-Income Ratio | Without Mortgage | With Mortgage |
| Less than 2.0x | 92 (17.6%) | 86,505 (10,936.2%) |
| 2.0x to 2.9x | 112 (21.4%) | 232 (29.3%) |
| 3.0x to 3.9x | 14 (2.7%) | 124 (15.7%) |
| 4.0x or more | 305 (58.3%) | 159 (20.1%) |
| Total | 523 (100.0%) | 791 (100.0%) |
Real Estate Taxes by Mortgage Status in Camden
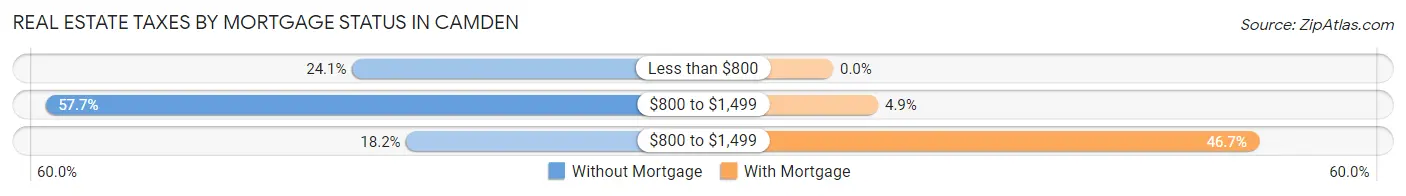
| Property Taxes | Without Mortgage | With Mortgage |
| Less than $800 | 126 (24.1%) | 0 (0.0%) |
| $800 to $1,499 | 302 (57.7%) | 39 (4.9%) |
| $800 to $1,499 | 95 (18.2%) | 369 (46.7%) |
| Total | 523 (100.0%) | 791 (100.0%) |
Health & Disability in Camden
Health Insurance Coverage by Age in Camden
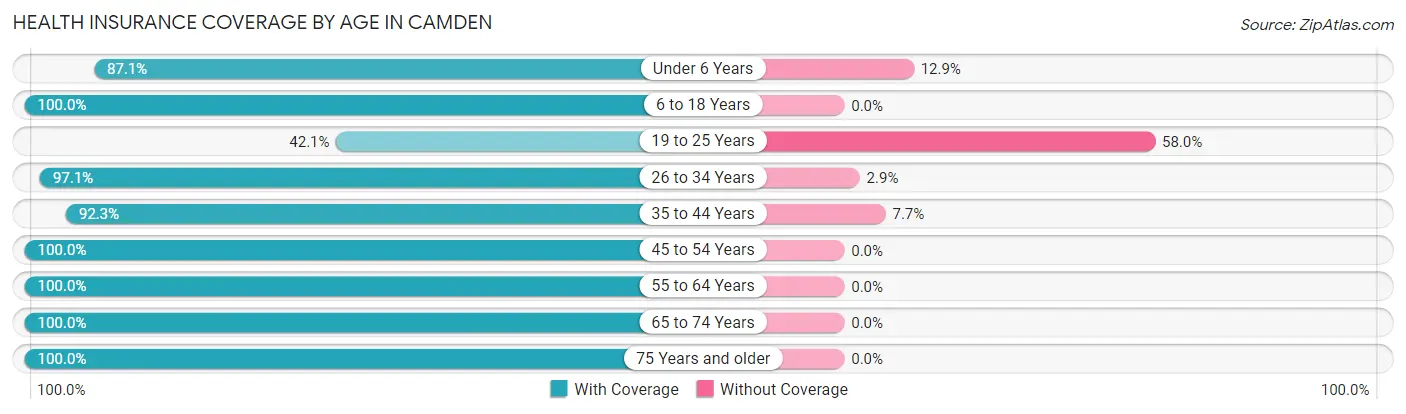
| Age Bracket | With Coverage | Without Coverage |
| Under 6 Years | 222 (87.1%) | 33 (12.9%) |
| 6 to 18 Years | 567 (100.0%) | 0 (0.0%) |
| 19 to 25 Years | 111 (42.0%) | 153 (58.0%) |
| 26 to 34 Years | 611 (97.1%) | 18 (2.9%) |
| 35 to 44 Years | 396 (92.3%) | 33 (7.7%) |
| 45 to 54 Years | 209 (100.0%) | 0 (0.0%) |
| 55 to 64 Years | 443 (100.0%) | 0 (0.0%) |
| 65 to 74 Years | 441 (100.0%) | 0 (0.0%) |
| 75 Years and older | 547 (100.0%) | 0 (0.0%) |
| Total | 3,547 (93.7%) | 237 (6.3%) |
Health Insurance Coverage by Citizenship Status in Camden
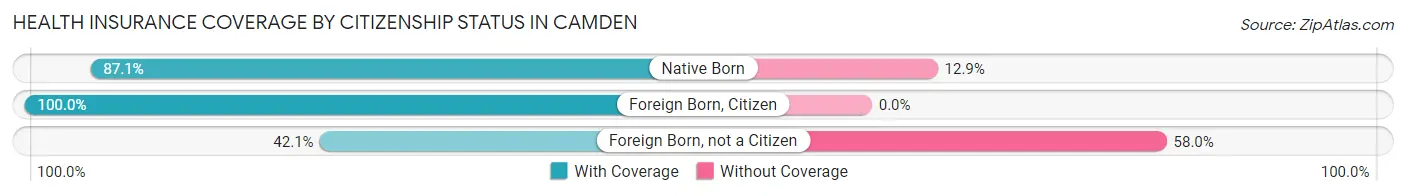
| Citizenship Status | With Coverage | Without Coverage |
| Native Born | 222 (87.1%) | 33 (12.9%) |
| Foreign Born, Citizen | 567 (100.0%) | 0 (0.0%) |
| Foreign Born, not a Citizen | 111 (42.0%) | 153 (58.0%) |
Health Insurance Coverage by Household Income in Camden
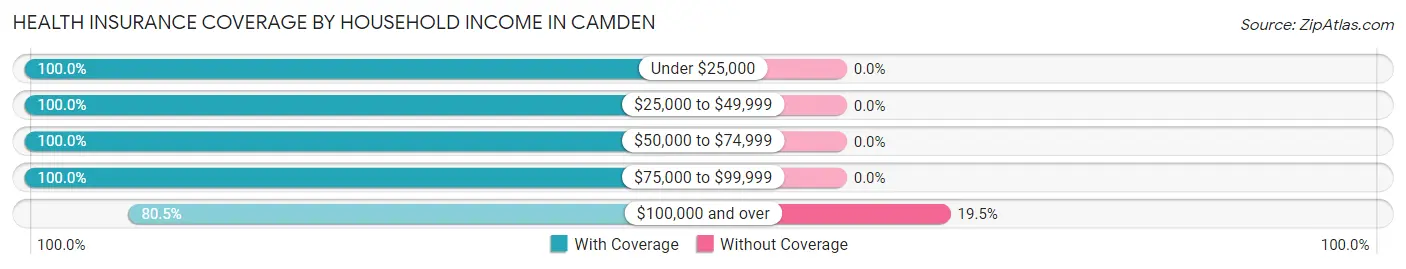
| Household Income | With Coverage | Without Coverage |
| Under $25,000 | 424 (100.0%) | 0 (0.0%) |
| $25,000 to $49,999 | 479 (100.0%) | 0 (0.0%) |
| $50,000 to $74,999 | 899 (100.0%) | 0 (0.0%) |
| $75,000 to $99,999 | 757 (100.0%) | 0 (0.0%) |
| $100,000 and over | 981 (80.5%) | 237 (19.5%) |
Public vs Private Health Insurance Coverage by Age in Camden
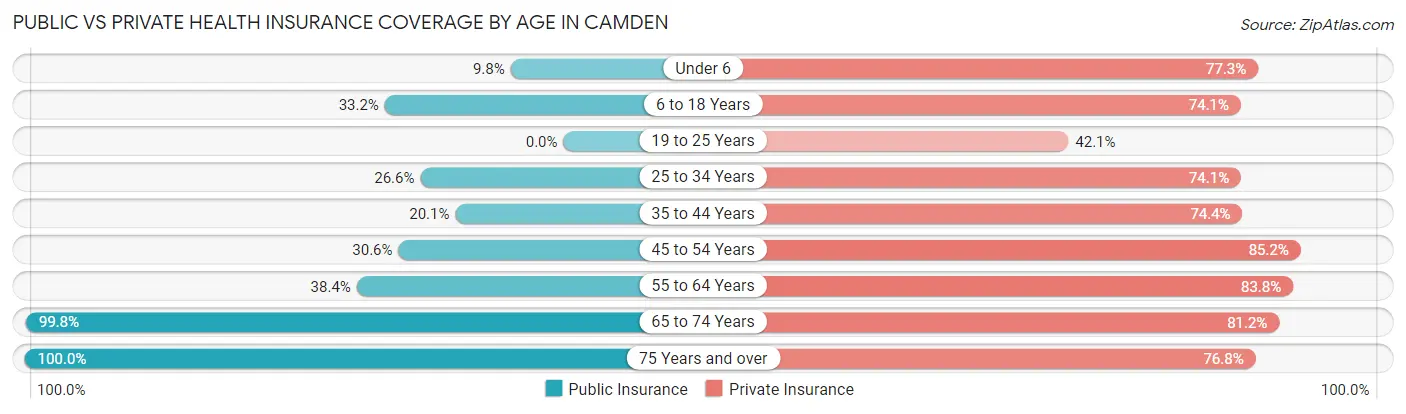
| Age Bracket | Public Insurance | Private Insurance |
| Under 6 | 25 (9.8%) | 197 (77.2%) |
| 6 to 18 Years | 188 (33.2%) | 420 (74.1%) |
| 19 to 25 Years | 0 (0.0%) | 111 (42.0%) |
| 25 to 34 Years | 167 (26.6%) | 466 (74.1%) |
| 35 to 44 Years | 86 (20.1%) | 319 (74.4%) |
| 45 to 54 Years | 64 (30.6%) | 178 (85.2%) |
| 55 to 64 Years | 170 (38.4%) | 371 (83.8%) |
| 65 to 74 Years | 440 (99.8%) | 358 (81.2%) |
| 75 Years and over | 547 (100.0%) | 420 (76.8%) |
| Total | 1,687 (44.6%) | 2,840 (75.0%) |
Disability Status by Sex by Age in Camden
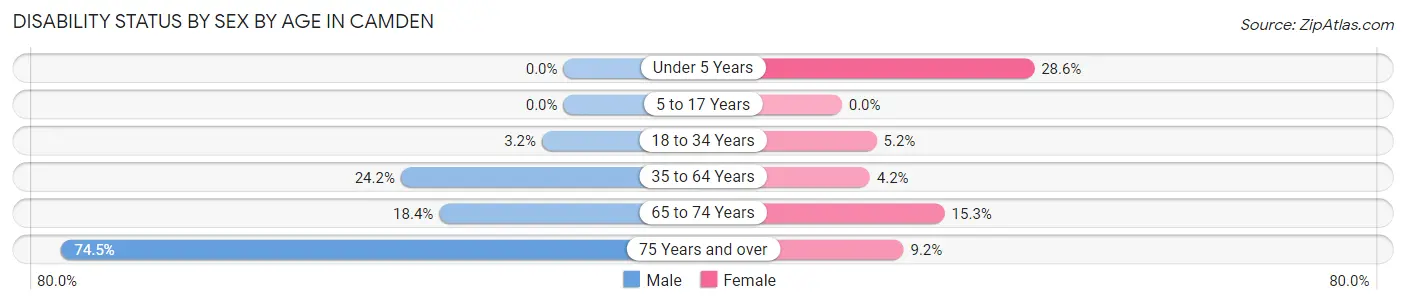
| Age Bracket | Male | Female |
| Under 5 Years | 0 (0.0%) | 44 (28.6%) |
| 5 to 17 Years | 0 (0.0%) | 0 (0.0%) |
| 18 to 34 Years | 18 (3.2%) | 17 (5.2%) |
| 35 to 64 Years | 128 (24.1%) | 23 (4.2%) |
| 65 to 74 Years | 33 (18.4%) | 40 (15.3%) |
| 75 Years and over | 237 (74.5%) | 21 (9.2%) |
Disability Class by Sex by Age in Camden
Disability Class: Hearing Difficulty
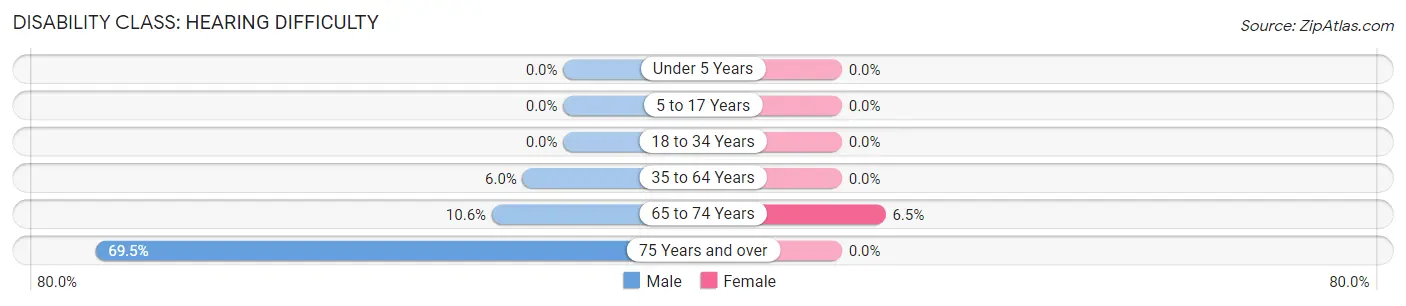
| Age Bracket | Male | Female |
| Under 5 Years | 0 (0.0%) | 0 (0.0%) |
| 5 to 17 Years | 0 (0.0%) | 0 (0.0%) |
| 18 to 34 Years | 0 (0.0%) | 0 (0.0%) |
| 35 to 64 Years | 32 (6.0%) | 0 (0.0%) |
| 65 to 74 Years | 19 (10.6%) | 17 (6.5%) |
| 75 Years and over | 221 (69.5%) | 0 (0.0%) |
Disability Class: Vision Difficulty
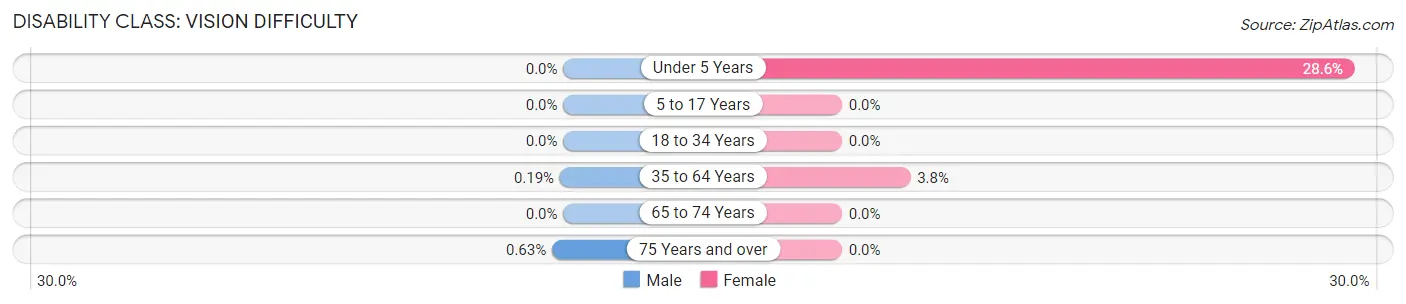
| Age Bracket | Male | Female |
| Under 5 Years | 0 (0.0%) | 44 (28.6%) |
| 5 to 17 Years | 0 (0.0%) | 0 (0.0%) |
| 18 to 34 Years | 0 (0.0%) | 0 (0.0%) |
| 35 to 64 Years | 1 (0.2%) | 21 (3.8%) |
| 65 to 74 Years | 0 (0.0%) | 0 (0.0%) |
| 75 Years and over | 2 (0.6%) | 0 (0.0%) |
Disability Class: Cognitive Difficulty
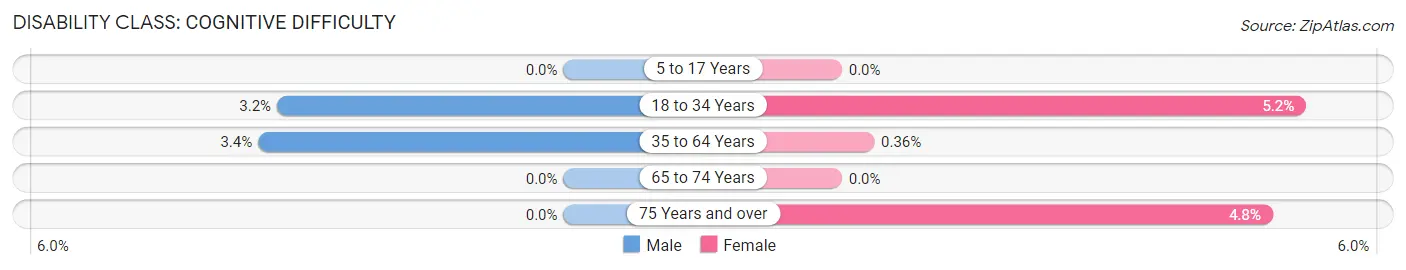
| Age Bracket | Male | Female |
| 5 to 17 Years | 0 (0.0%) | 0 (0.0%) |
| 18 to 34 Years | 18 (3.2%) | 17 (5.2%) |
| 35 to 64 Years | 18 (3.4%) | 2 (0.4%) |
| 65 to 74 Years | 0 (0.0%) | 0 (0.0%) |
| 75 Years and over | 0 (0.0%) | 11 (4.8%) |
Disability Class: Ambulatory Difficulty
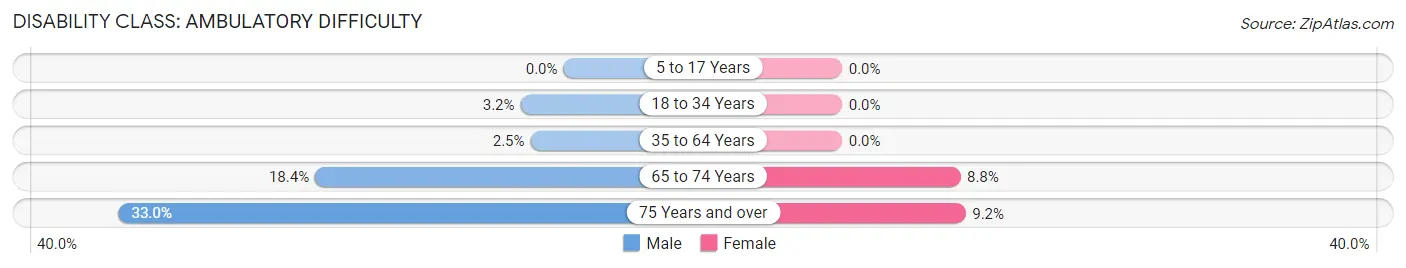
| Age Bracket | Male | Female |
| 5 to 17 Years | 0 (0.0%) | 0 (0.0%) |
| 18 to 34 Years | 18 (3.2%) | 0 (0.0%) |
| 35 to 64 Years | 13 (2.5%) | 0 (0.0%) |
| 65 to 74 Years | 33 (18.4%) | 23 (8.8%) |
| 75 Years and over | 105 (33.0%) | 21 (9.2%) |
Disability Class: Self-Care Difficulty
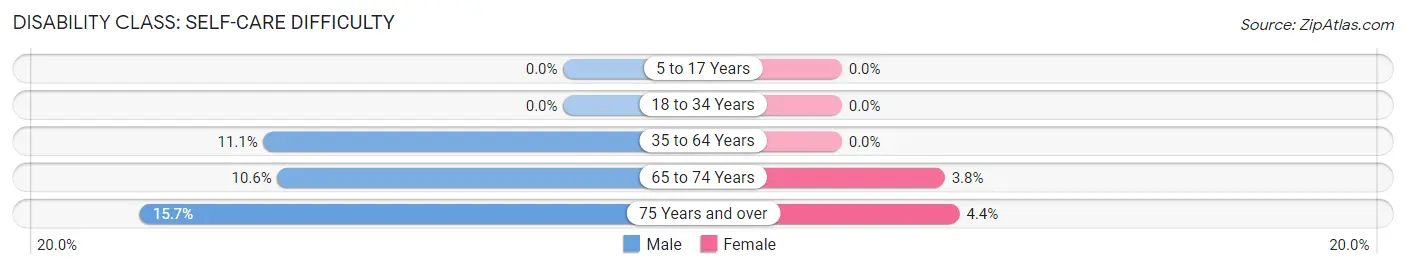
| Age Bracket | Male | Female |
| 5 to 17 Years | 0 (0.0%) | 0 (0.0%) |
| 18 to 34 Years | 0 (0.0%) | 0 (0.0%) |
| 35 to 64 Years | 59 (11.1%) | 0 (0.0%) |
| 65 to 74 Years | 19 (10.6%) | 10 (3.8%) |
| 75 Years and over | 50 (15.7%) | 10 (4.4%) |
Technology Access in Camden
Computing Device Access in Camden
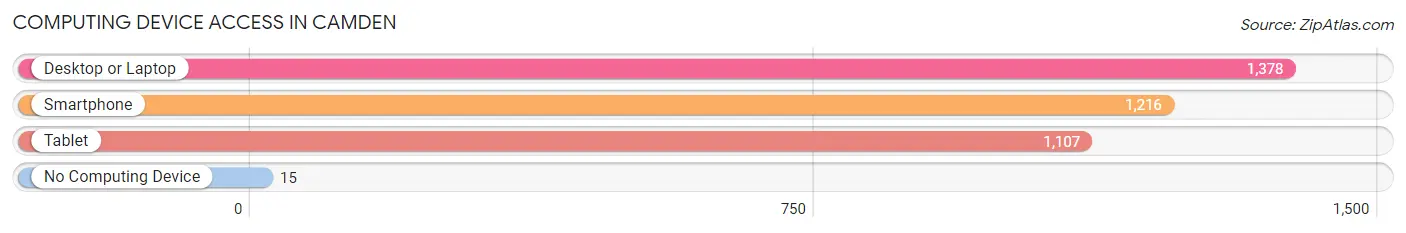
| Device Type | # Households | % Households |
| Desktop or Laptop | 1,378 | 88.0% |
| Smartphone | 1,216 | 77.6% |
| Tablet | 1,107 | 70.7% |
| No Computing Device | 15 | 1.0% |
| Total | 1,566 | 100.0% |
Internet Access in Camden
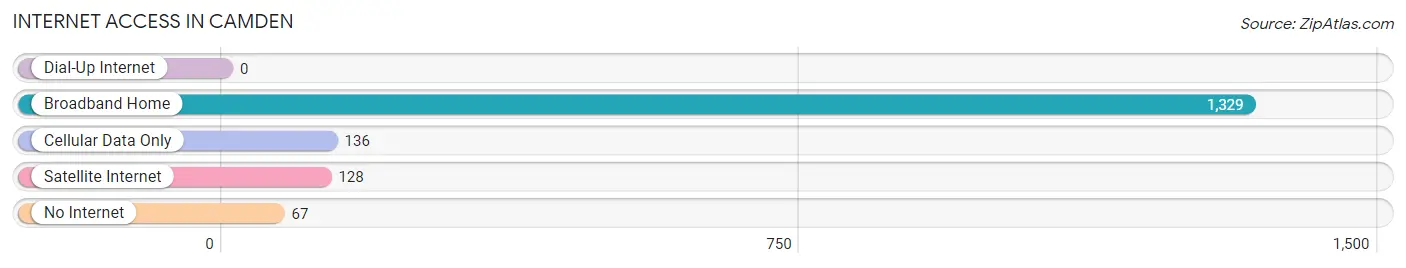
| Internet Type | # Households | % Households |
| Dial-Up Internet | 0 | 0.0% |
| Broadband Home | 1,329 | 84.9% |
| Cellular Data Only | 136 | 8.7% |
| Satellite Internet | 128 | 8.2% |
| No Internet | 67 | 4.3% |
| Total | 1,566 | 100.0% |
Camden Summary
Camden, Delaware is a small town located in Kent County, Delaware. It is situated on the banks of the St. Jones River, and is part of the Dover Metropolitan Statistical Area. The town has a population of approximately 2,000 people, and is known for its historic buildings, quaint downtown area, and its proximity to the Delaware Bay.
History
The area that is now Camden was first settled in the late 1600s by English settlers. The town was originally known as “The Rocks”, and was part of the St. Jones Hundred. In 1717, the town was officially incorporated as Camden, and was named after Charles Pratt, the 1st Earl of Camden. During the Revolutionary War, Camden was a major port for the Continental Army, and was the site of several battles.
In the 19th century, Camden became an important center for the lumber and shipbuilding industries. The town was also home to several mills, and was a major stop on the Delaware Railroad. In the late 19th century, Camden began to decline as the lumber and shipbuilding industries moved elsewhere.
Geography
Camden is located in Kent County, Delaware, and is situated on the banks of the St. Jones River. The town is located approximately 10 miles south of Dover, and is part of the Dover Metropolitan Statistical Area. The town has a total area of 1.2 square miles, and is bordered by the towns of Dover, Magnolia, and Hartly.
The terrain of Camden is mostly flat, with some rolling hills. The town is located in a temperate climate zone, and experiences hot, humid summers and mild winters. The average annual temperature is around 60 degrees Fahrenheit, and the average annual precipitation is around 40 inches.
Economy
The economy of Camden is largely based on tourism and retail. The town is home to several historic buildings, and is a popular destination for visitors. The downtown area is home to several shops and restaurants, and is a popular destination for locals and visitors alike.
The town is also home to several manufacturing and industrial businesses. The town is home to several food processing plants, and is a major center for the poultry industry. The town is also home to several trucking companies, and is a major hub for the transportation industry.
Demographics
As of the 2010 census, the population of Camden was 2,000 people. The racial makeup of the town was 94.2% White, 2.2% African American, 0.7% Native American, 0.7% Asian, 0.2% Pacific Islander, and 1.9% from other races. The median household income was $41,250, and the median family income was $50,000.
The town is home to several churches, and is served by the Caesar Rodney School District. The town is also home to several parks, and is a popular destination for outdoor activities. The town is served by several major highways, and is a major transportation hub for the region.
Common Questions
What is Per Capita Income in Camden?
Per Capita income in Camden is $30,893.
What is the Median Family Income in Camden?
Median Family Income in Camden is $72,695.
What is the Median Household income in Camden?
Median Household Income in Camden is $60,549.
What is Income or Wage Gap in Camden?
Income or Wage Gap in Camden is 25.1%.
Women in Camden earn 74.9 cents for every dollar earned by a man.
What is Inequality or Gini Index in Camden?
Inequality or Gini Index in Camden is 0.40.
What is the Total Population of Camden?
Total Population of Camden is 3,914.
What is the Total Male Population of Camden?
Total Male Population of Camden is 2,030.
What is the Total Female Population of Camden?
Total Female Population of Camden is 1,884.
What is the Ratio of Males per 100 Females in Camden?
There are 107.75 Males per 100 Females in Camden.
What is the Ratio of Females per 100 Males in Camden?
There are 92.81 Females per 100 Males in Camden.
What is the Median Population Age in Camden?
Median Population Age in Camden is 36.9 Years.
What is the Average Family Size in Camden
Average Family Size in Camden is 2.7 People.
What is the Average Household Size in Camden
Average Household Size in Camden is 2.5 People.
How Large is the Labor Force in Camden?
There are 1,867 People in the Labor Forcein in Camden.
What is the Percentage of People in the Labor Force in Camden?
58.1% of People are in the Labor Force in Camden.
What is the Unemployment Rate in Camden?
Unemployment Rate in Camden is 3.5%.