Edgemoor, DE Map & Demographics
Edgemoor Map
Edgemoor Overview
$40,072
PER CAPITA INCOME
$80,944
AVG FAMILY INCOME
$70,672
AVG HOUSEHOLD INCOME
14.8%
WAGE / INCOME GAP [ % ]
85.2¢/ $1
WAGE / INCOME GAP [ $ ]
0.40
INEQUALITY / GINI INDEX
6,485
TOTAL POPULATION
3,463
MALE POPULATION
3,022
FEMALE POPULATION
114.59
MALES / 100 FEMALES
87.27
FEMALES / 100 MALES
40.8
MEDIAN AGE
2.8
AVG FAMILY SIZE
2.1
AVG HOUSEHOLD SIZE
3,641
LABOR FORCE [ PEOPLE ]
69.3%
PERCENT IN LABOR FORCE
5.6%
UNEMPLOYMENT RATE
Edgemoor Area Codes
Income in Edgemoor
Income Overview in Edgemoor
Per Capita Income in Edgemoor is $40,072, while median incomes of families and households are $80,944 and $70,672 respectively.
| Characteristic | Number | Measure |
| Per Capita Income | 6,485 | $40,072 |
| Median Family Income | 1,712 | $80,944 |
| Mean Family Income | 1,712 | $97,738 |
| Median Household Income | 3,031 | $70,672 |
| Mean Household Income | 3,031 | $84,273 |
| Income Deficit | 1,712 | $0 |
| Wage / Income Gap (%) | 6,485 | 14.84% |
| Wage / Income Gap ($) | 6,485 | 85.16¢ per $1 |
| Gini / Inequality Index | 6,485 | 0.40 |
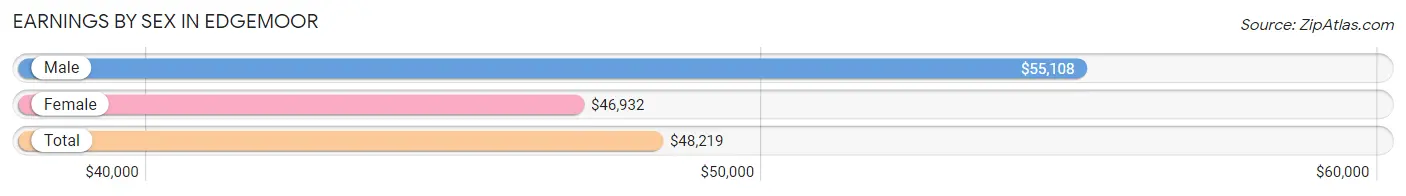
Earnings by Sex in Edgemoor
Average Earnings in Edgemoor are $48,219, $55,108 for men and $46,932 for women, a difference of 14.8%.
| Sex | Number | Average Earnings |
| Male | 1,963 (51.4%) | $55,108 |
| Female | 1,855 (48.6%) | $46,932 |
| Total | 3,818 (100.0%) | $48,219 |
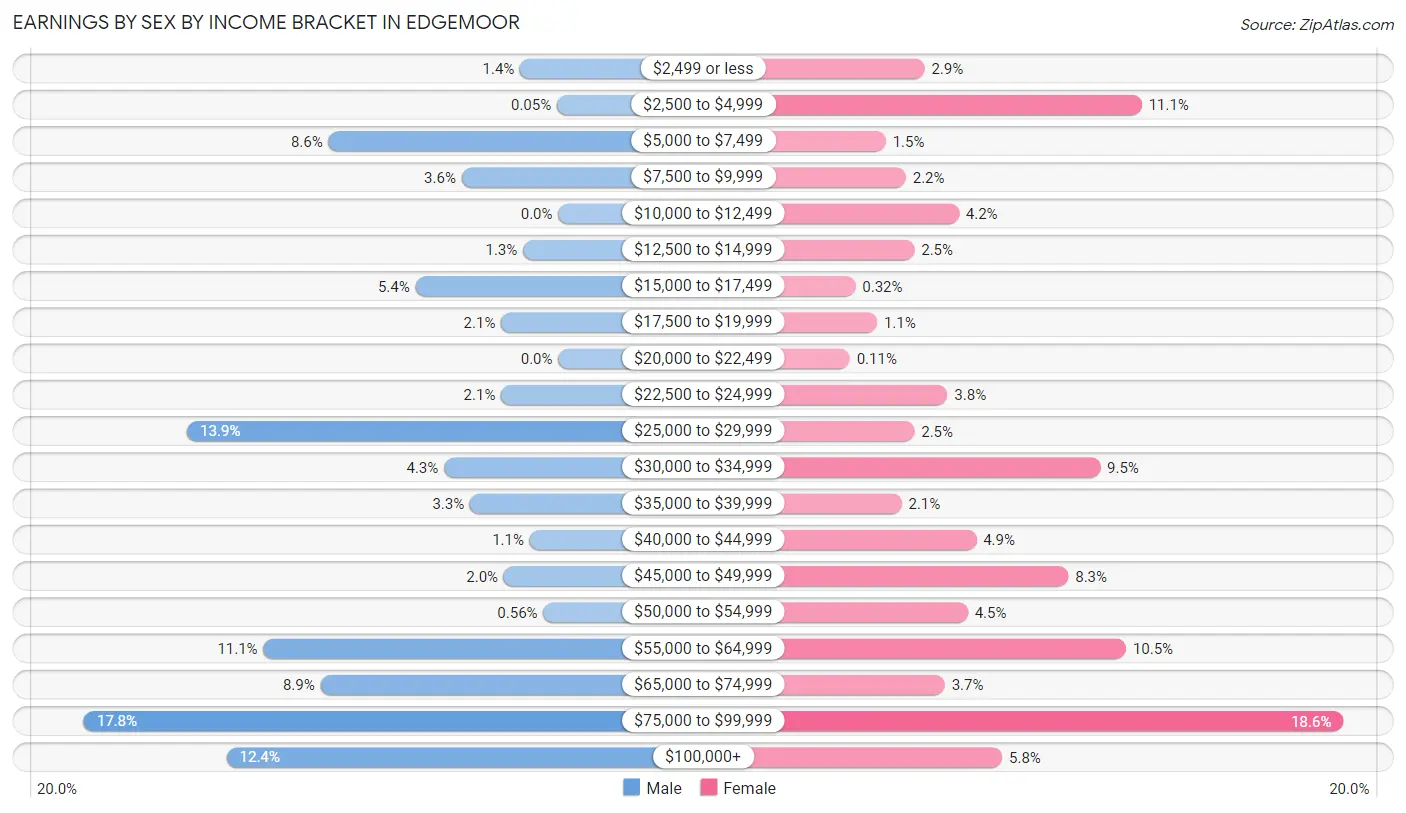
Earnings by Sex by Income Bracket in Edgemoor
The most common earnings brackets in Edgemoor are $75,000 to $99,999 for men (349 | 17.8%) and $75,000 to $99,999 for women (345 | 18.6%).
| Income | Male | Female |
| $2,499 or less | 28 (1.4%) | 54 (2.9%) |
| $2,500 to $4,999 | 1 (0.1%) | 205 (11.1%) |
| $5,000 to $7,499 | 169 (8.6%) | 27 (1.5%) |
| $7,500 to $9,999 | 71 (3.6%) | 41 (2.2%) |
| $10,000 to $12,499 | 0 (0.0%) | 78 (4.2%) |
| $12,500 to $14,999 | 26 (1.3%) | 47 (2.5%) |
| $15,000 to $17,499 | 105 (5.3%) | 6 (0.3%) |
| $17,500 to $19,999 | 42 (2.1%) | 21 (1.1%) |
| $20,000 to $22,499 | 0 (0.0%) | 2 (0.1%) |
| $22,500 to $24,999 | 42 (2.1%) | 70 (3.8%) |
| $25,000 to $29,999 | 273 (13.9%) | 47 (2.5%) |
| $30,000 to $34,999 | 84 (4.3%) | 176 (9.5%) |
| $35,000 to $39,999 | 65 (3.3%) | 38 (2.1%) |
| $40,000 to $44,999 | 21 (1.1%) | 90 (4.9%) |
| $45,000 to $49,999 | 40 (2.0%) | 154 (8.3%) |
| $50,000 to $54,999 | 11 (0.6%) | 84 (4.5%) |
| $55,000 to $64,999 | 217 (11.1%) | 194 (10.5%) |
| $65,000 to $74,999 | 175 (8.9%) | 68 (3.7%) |
| $75,000 to $99,999 | 349 (17.8%) | 345 (18.6%) |
| $100,000+ | 244 (12.4%) | 108 (5.8%) |
| Total | 1,963 (100.0%) | 1,855 (100.0%) |
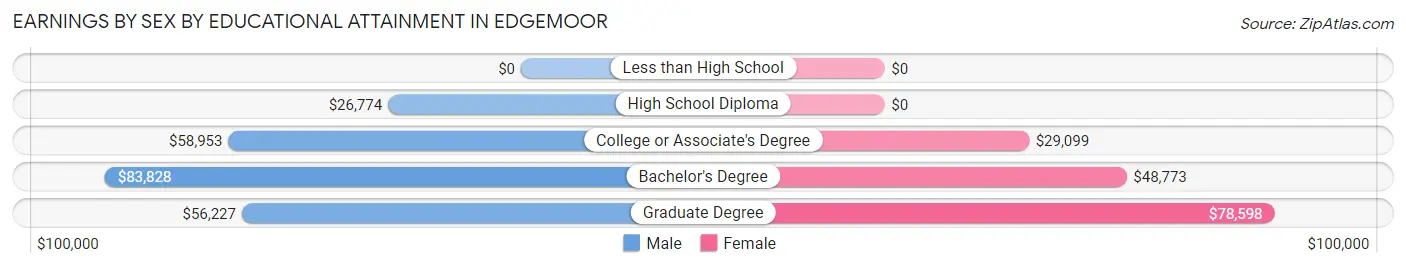
Earnings by Sex by Educational Attainment in Edgemoor
Average earnings in Edgemoor are $55,247 for men and $48,306 for women, a difference of 12.6%. Men with an educational attainment of bachelor's degree enjoy the highest average annual earnings of $83,828, while those with high school diploma education earn the least with $26,774. Women with an educational attainment of graduate degree earn the most with the average annual earnings of $78,598, while those with college or associate's degree education have the smallest earnings of $29,099.
| Educational Attainment | Male Income | Female Income |
| Less than High School | - | - |
| High School Diploma | $26,774 | $0 |
| College or Associate's Degree | $58,953 | $29,099 |
| Bachelor's Degree | $83,828 | $48,773 |
| Graduate Degree | $56,227 | $78,598 |
| Total | $55,247 | $48,306 |
Family Income in Edgemoor
Family Income Brackets in Edgemoor
According to the Edgemoor family income data, there are 294 families falling into the $100,000 to $149,999 income range, which is the most common income bracket and makes up 17.2% of all families. Conversely, the $10,000 to $14,999 income bracket is the least frequent group with only 50 families (2.9%) belonging to this category.
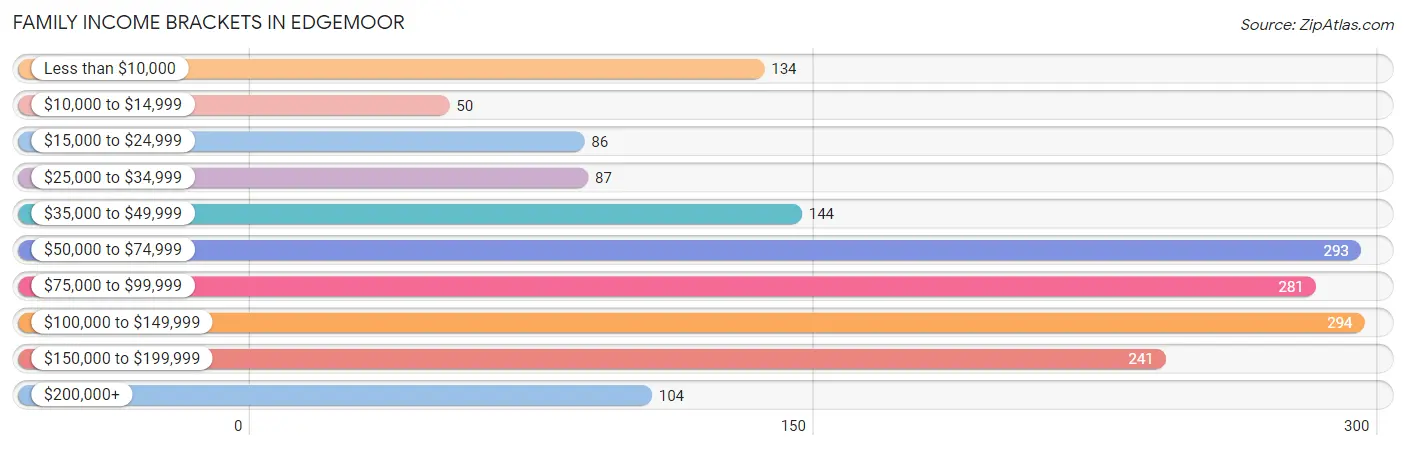
| Income Bracket | # Families | % Families |
| Less than $10,000 | 134 | 7.8% |
| $10,000 to $14,999 | 50 | 2.9% |
| $15,000 to $24,999 | 86 | 5.0% |
| $25,000 to $34,999 | 87 | 5.1% |
| $35,000 to $49,999 | 144 | 8.4% |
| $50,000 to $74,999 | 293 | 17.1% |
| $75,000 to $99,999 | 281 | 16.4% |
| $100,000 to $149,999 | 294 | 17.2% |
| $150,000 to $199,999 | 241 | 14.1% |
| $200,000+ | 104 | 6.1% |
Family Income by Famaliy Size in Edgemoor
4-person families (224 | 13.1%) account for the highest median family income in Edgemoor with $149,200 per family, while 2-person families (1,099 | 64.2%) have the highest median income of $40,144 per family member.
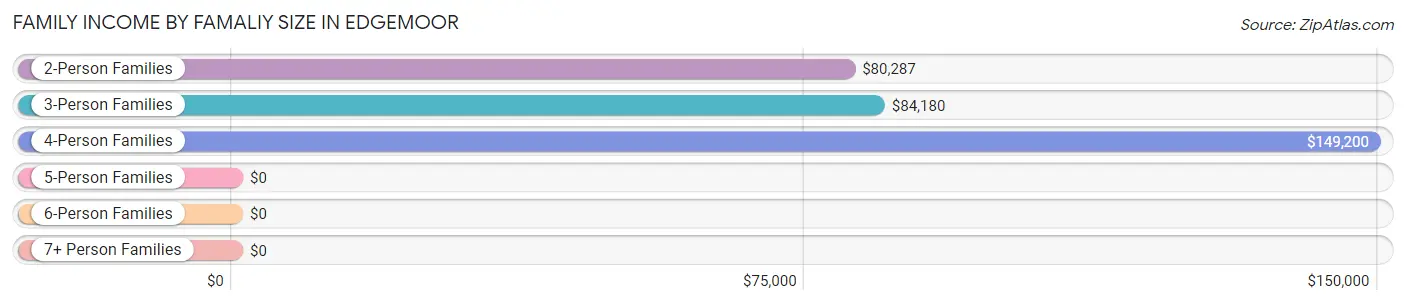
| Income Bracket | # Families | Median Income |
| 2-Person Families | 1,099 (64.2%) | $80,287 |
| 3-Person Families | 275 (16.1%) | $84,180 |
| 4-Person Families | 224 (13.1%) | $149,200 |
| 5-Person Families | 47 (2.8%) | $0 |
| 6-Person Families | 67 (3.9%) | $0 |
| 7+ Person Families | 0 (0.0%) | $0 |
| Total | 1,712 (100.0%) | $80,944 |
Family Income by Number of Earners in Edgemoor
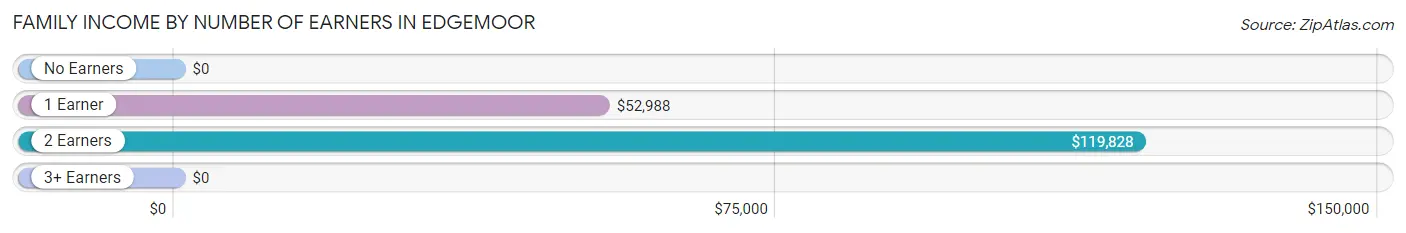
| Number of Earners | # Families | Median Income |
| No Earners | 195 (11.4%) | $0 |
| 1 Earner | 634 (37.0%) | $52,988 |
| 2 Earners | 809 (47.2%) | $119,828 |
| 3+ Earners | 74 (4.3%) | $0 |
| Total | 1,712 (100.0%) | $80,944 |
Household Income in Edgemoor
Household Income Brackets in Edgemoor
With 609 households falling in the category, the $100,000 to $149,999 income range is the most frequent in Edgemoor, accounting for 20.1% of all households. In contrast, only 94 households (3.1%) fall into the $10,000 to $14,999 income bracket, making it the least populous group.
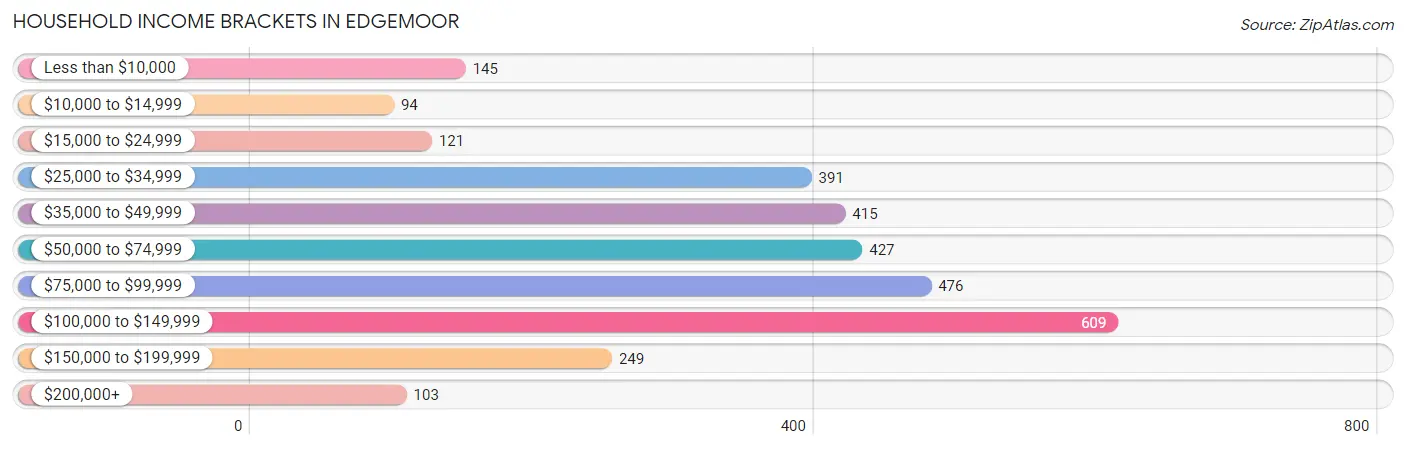
| Income Bracket | # Households | % Households |
| Less than $10,000 | 145 | 4.8% |
| $10,000 to $14,999 | 94 | 3.1% |
| $15,000 to $24,999 | 121 | 4.0% |
| $25,000 to $34,999 | 391 | 12.9% |
| $35,000 to $49,999 | 415 | 13.7% |
| $50,000 to $74,999 | 427 | 14.1% |
| $75,000 to $99,999 | 476 | 15.7% |
| $100,000 to $149,999 | 609 | 20.1% |
| $150,000 to $199,999 | 249 | 8.2% |
| $200,000+ | 103 | 3.4% |
Household Income by Householder Age in Edgemoor
The median household income in Edgemoor is $70,672, with the highest median household income of $84,741 found in the 25 to 44 years age bracket for the primary householder. A total of 1,103 households (36.4%) fall into this category. Meanwhile, the 15 to 24 years age bracket for the primary householder has the lowest median household income of $0, with 16 households (0.5%) in this group.
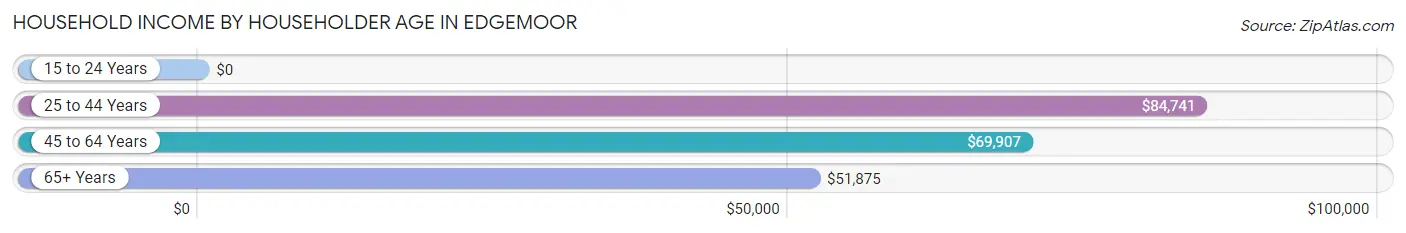
| Income Bracket | # Households | Median Income |
| 15 to 24 Years | 16 (0.5%) | $0 |
| 25 to 44 Years | 1,103 (36.4%) | $84,741 |
| 45 to 64 Years | 1,288 (42.5%) | $69,907 |
| 65+ Years | 624 (20.6%) | $51,875 |
| Total | 3,031 (100.0%) | $70,672 |
Poverty in Edgemoor
Income Below Poverty by Sex and Age in Edgemoor
With 22.9% poverty level for males and 24.2% for females among the residents of Edgemoor, 15 year old males and 6 to 11 year old females are the most vulnerable to poverty, with 205 males (100.0%) and 11 females (100.0%) in their respective age groups living below the poverty level.
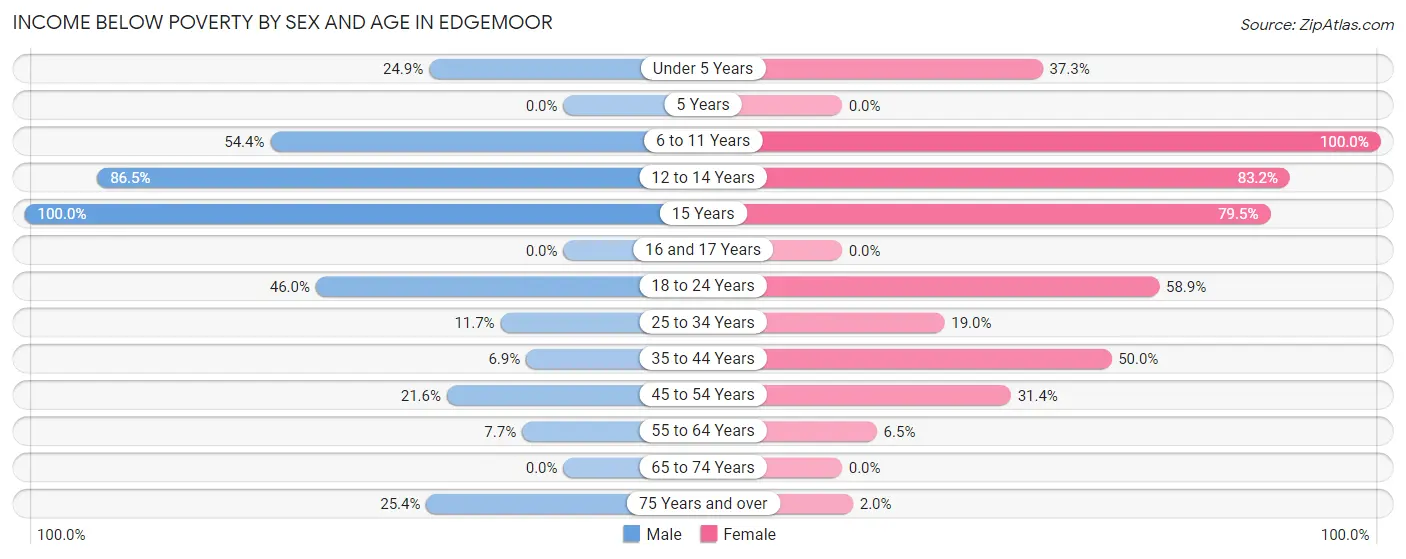
| Age Bracket | Male | Female |
| Under 5 Years | 90 (24.9%) | 38 (37.2%) |
| 5 Years | 0 (0.0%) | 0 (0.0%) |
| 6 to 11 Years | 155 (54.4%) | 11 (100.0%) |
| 12 to 14 Years | 77 (86.5%) | 74 (83.2%) |
| 15 Years | 205 (100.0%) | 66 (79.5%) |
| 16 and 17 Years | 0 (0.0%) | 0 (0.0%) |
| 18 to 24 Years | 17 (46.0%) | 63 (58.9%) |
| 25 to 34 Years | 62 (11.7%) | 134 (19.0%) |
| 35 to 44 Years | 33 (6.9%) | 219 (50.0%) |
| 45 to 54 Years | 58 (21.6%) | 79 (31.4%) |
| 55 to 64 Years | 67 (7.7%) | 41 (6.5%) |
| 65 to 74 Years | 0 (0.0%) | 0 (0.0%) |
| 75 Years and over | 29 (25.4%) | 6 (2.0%) |
| Total | 793 (22.9%) | 731 (24.2%) |
Income Above Poverty by Sex and Age in Edgemoor
According to the poverty statistics in Edgemoor, males aged 16 and 17 years and females aged 16 and 17 years are the age groups that are most secure financially, with 100.0% of males and 100.0% of females in these age groups living above the poverty line.
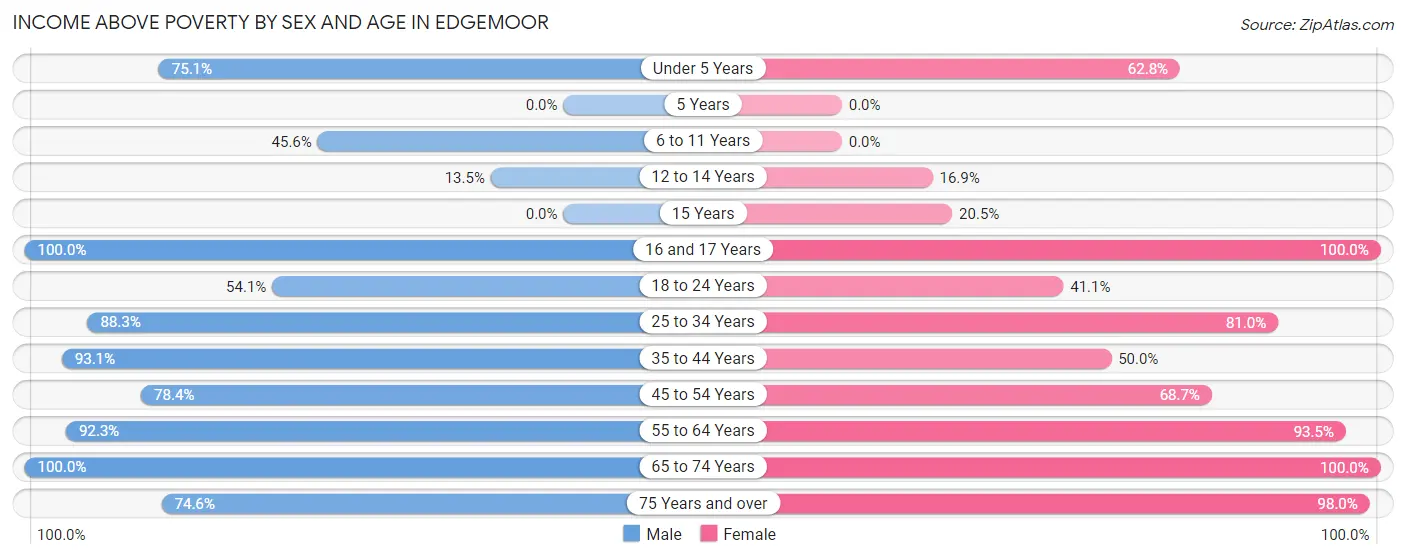
| Age Bracket | Male | Female |
| Under 5 Years | 271 (75.1%) | 64 (62.7%) |
| 5 Years | 0 (0.0%) | 0 (0.0%) |
| 6 to 11 Years | 130 (45.6%) | 0 (0.0%) |
| 12 to 14 Years | 12 (13.5%) | 15 (16.9%) |
| 15 Years | 0 (0.0%) | 17 (20.5%) |
| 16 and 17 Years | 35 (100.0%) | 68 (100.0%) |
| 18 to 24 Years | 20 (54.0%) | 44 (41.1%) |
| 25 to 34 Years | 469 (88.3%) | 570 (81.0%) |
| 35 to 44 Years | 444 (93.1%) | 219 (50.0%) |
| 45 to 54 Years | 210 (78.4%) | 173 (68.6%) |
| 55 to 64 Years | 805 (92.3%) | 593 (93.5%) |
| 65 to 74 Years | 189 (100.0%) | 234 (100.0%) |
| 75 Years and over | 85 (74.6%) | 288 (98.0%) |
| Total | 2,670 (77.1%) | 2,285 (75.8%) |
Income Below Poverty Among Married-Couple Families in Edgemoor
The poverty statistics for married-couple families in Edgemoor show that 11.2% or 100 of the total 890 families live below the poverty line. Families with 3 or 4 children have the highest poverty rate of 70.2%, comprising of 33 families. On the other hand, families with no children have the lowest poverty rate of 0.0%, which includes 0 families.
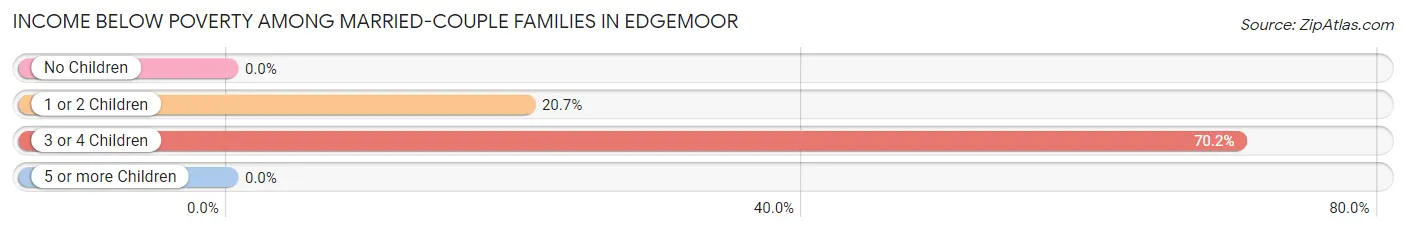
| Children | Above Poverty | Below Poverty |
| No Children | 519 (100.0%) | 0 (0.0%) |
| 1 or 2 Children | 257 (79.3%) | 67 (20.7%) |
| 3 or 4 Children | 14 (29.8%) | 33 (70.2%) |
| 5 or more Children | 0 (0.0%) | 0 (0.0%) |
| Total | 790 (88.8%) | 100 (11.2%) |
Income Below Poverty Among Single-Parent Households in Edgemoor
According to the poverty data in Edgemoor, 16.6% or 58 single-father households and 39.6% or 187 single-mother households are living below the poverty line. Among single-father households, those with 1 or 2 children have the highest poverty rate, with 58 households (32.0%) experiencing poverty. Likewise, among single-mother households, those with 1 or 2 children have the highest poverty rate, with 187 households (92.1%) falling below the poverty line.
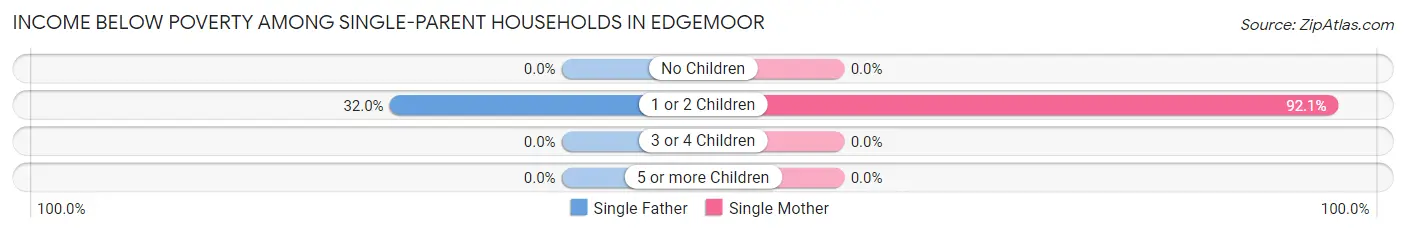
| Children | Single Father | Single Mother |
| No Children | 0 (0.0%) | 0 (0.0%) |
| 1 or 2 Children | 58 (32.0%) | 187 (92.1%) |
| 3 or 4 Children | 0 (0.0%) | 0 (0.0%) |
| 5 or more Children | 0 (0.0%) | 0 (0.0%) |
| Total | 58 (16.6%) | 187 (39.6%) |
Income Below Poverty Among Married-Couple vs Single-Parent Households in Edgemoor
The poverty data for Edgemoor shows that 100 of the married-couple family households (11.2%) and 245 of the single-parent households (29.8%) are living below the poverty level. Within the married-couple family households, those with 3 or 4 children have the highest poverty rate, with 33 households (70.2%) falling below the poverty line. Among the single-parent households, those with 1 or 2 children have the highest poverty rate, with 245 household (63.8%) living below poverty.
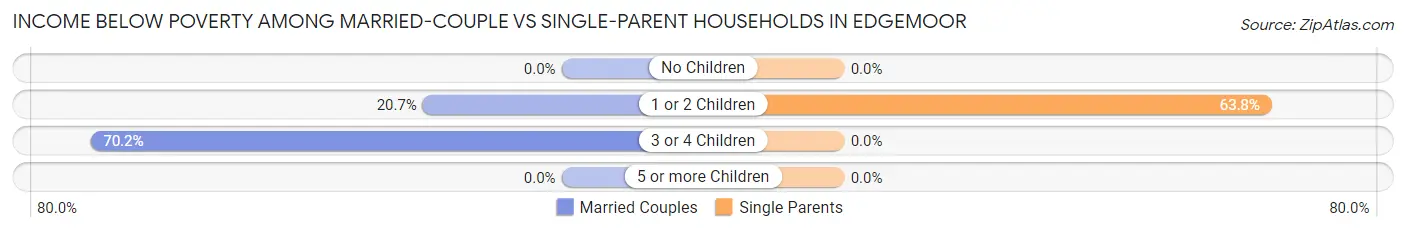
| Children | Married-Couple Families | Single-Parent Households |
| No Children | 0 (0.0%) | 0 (0.0%) |
| 1 or 2 Children | 67 (20.7%) | 245 (63.8%) |
| 3 or 4 Children | 33 (70.2%) | 0 (0.0%) |
| 5 or more Children | 0 (0.0%) | 0 (0.0%) |
| Total | 100 (11.2%) | 245 (29.8%) |
Race in Edgemoor
The most populous races in Edgemoor are Black / African American (2,904 | 44.8%), White / Caucasian (2,792 | 43.0%), and Asian (537 | 8.3%).
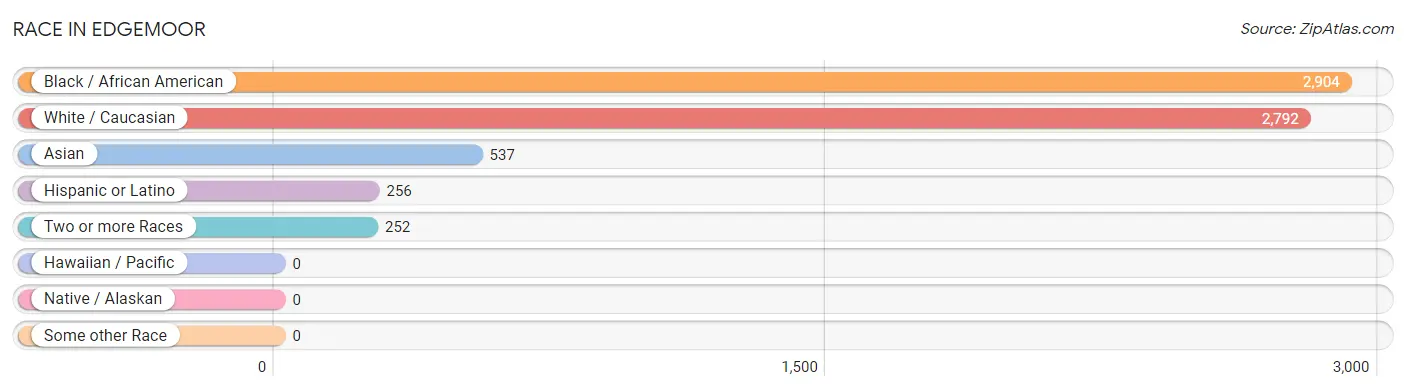
| Race | # Population | % Population |
| Asian | 537 | 8.3% |
| Black / African American | 2,904 | 44.8% |
| Hawaiian / Pacific | 0 | 0.0% |
| Hispanic or Latino | 256 | 4.0% |
| Native / Alaskan | 0 | 0.0% |
| White / Caucasian | 2,792 | 43.0% |
| Two or more Races | 252 | 3.9% |
| Some other Race | 0 | 0.0% |
| Total | 6,485 | 100.0% |
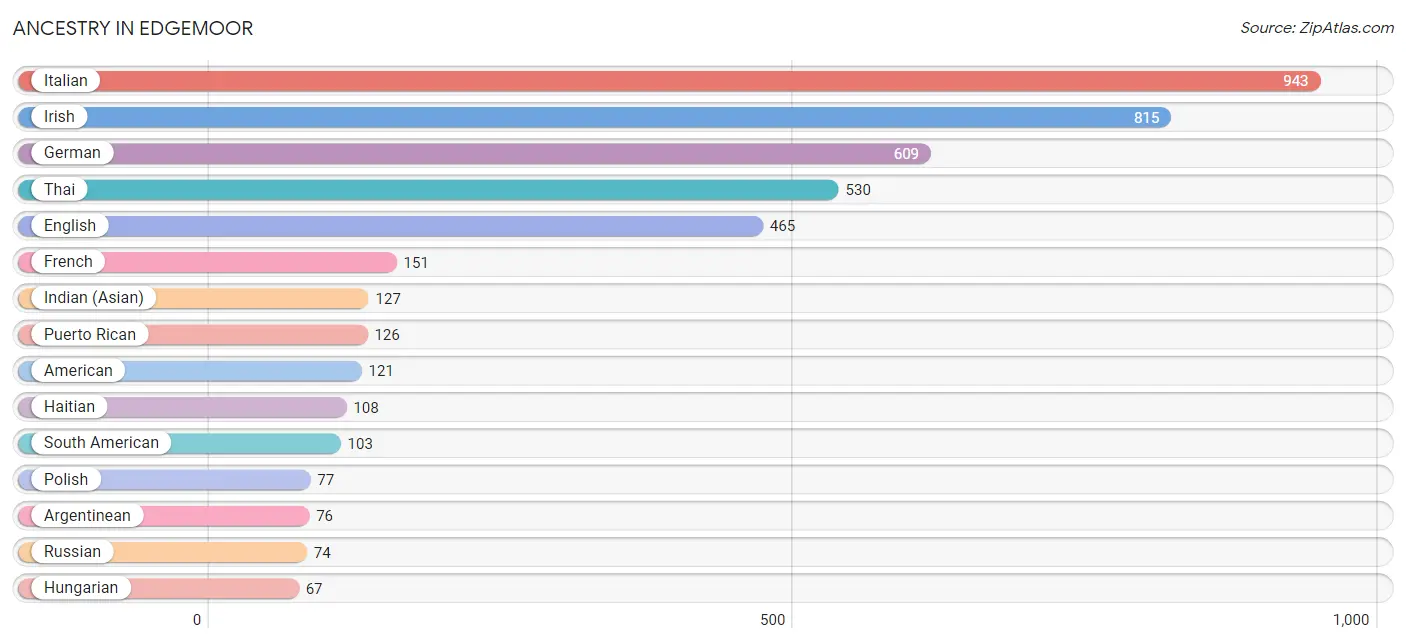
Ancestry in Edgemoor
The most populous ancestries reported in Edgemoor are Italian (943 | 14.5%), Irish (815 | 12.6%), German (609 | 9.4%), Thai (530 | 8.2%), and English (465 | 7.2%), together accounting for 51.8% of all Edgemoor residents.
| Ancestry | # Population | % Population |
| American | 121 | 1.9% |
| Argentinean | 76 | 1.2% |
| Austrian | 30 | 0.5% |
| Belgian | 20 | 0.3% |
| Blackfeet | 16 | 0.3% |
| British | 61 | 0.9% |
| Canadian | 1 | 0.0% |
| Choctaw | 6 | 0.1% |
| Colombian | 27 | 0.4% |
| Cuban | 16 | 0.3% |
| Czech | 25 | 0.4% |
| Danish | 4 | 0.1% |
| Dutch | 38 | 0.6% |
| Eastern European | 41 | 0.6% |
| English | 465 | 7.2% |
| European | 12 | 0.2% |
| French | 151 | 2.3% |
| German | 609 | 9.4% |
| Guyanese | 4 | 0.1% |
| Haitian | 108 | 1.7% |
| Hungarian | 67 | 1.0% |
| Indian (Asian) | 127 | 2.0% |
| Iranian | 49 | 0.8% |
| Irish | 815 | 12.6% |
| Italian | 943 | 14.5% |
| Lithuanian | 37 | 0.6% |
| Pennsylvania German | 26 | 0.4% |
| Polish | 77 | 1.2% |
| Portuguese | 26 | 0.4% |
| Puerto Rican | 126 | 1.9% |
| Russian | 74 | 1.1% |
| Scottish | 53 | 0.8% |
| Slovak | 58 | 0.9% |
| South American | 103 | 1.6% |
| Spanish | 11 | 0.2% |
| Swedish | 44 | 0.7% |
| Thai | 530 | 8.2% |
| Ukrainian | 36 | 0.6% |
| Welsh | 16 | 0.3% | View All 39 Rows |
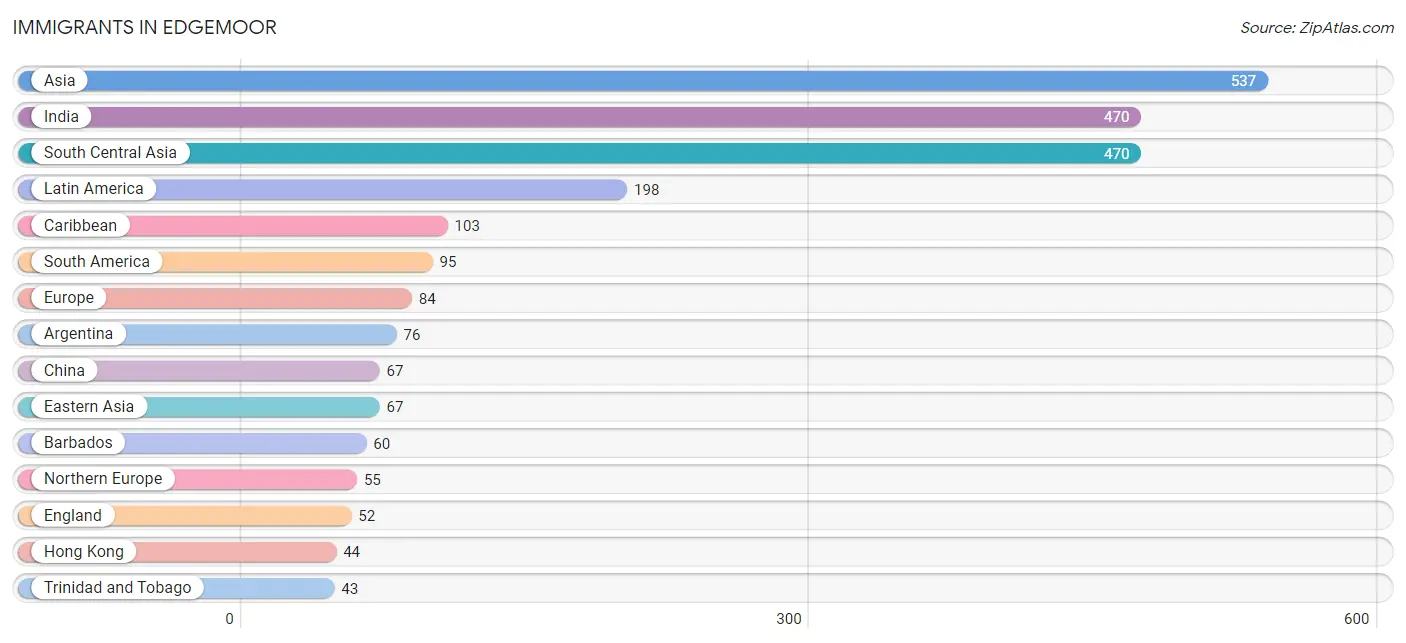
Immigrants in Edgemoor
The most numerous immigrant groups reported in Edgemoor came from Asia (537 | 8.3%), India (470 | 7.2%), South Central Asia (470 | 7.2%), Latin America (198 | 3.0%), and Caribbean (103 | 1.6%), together accounting for 27.4% of all Edgemoor residents.
| Immigration Origin | # Population | % Population |
| Argentina | 76 | 1.2% |
| Asia | 537 | 8.3% |
| Barbados | 60 | 0.9% |
| Caribbean | 103 | 1.6% |
| China | 67 | 1.0% |
| Colombia | 15 | 0.2% |
| Eastern Asia | 67 | 1.0% |
| Eastern Europe | 10 | 0.2% |
| England | 52 | 0.8% |
| Europe | 84 | 1.3% |
| Germany | 19 | 0.3% |
| Guyana | 4 | 0.1% |
| Hong Kong | 44 | 0.7% |
| India | 470 | 7.2% |
| Latin America | 198 | 3.0% |
| Northern Europe | 55 | 0.9% |
| Russia | 10 | 0.2% |
| South America | 95 | 1.5% |
| South Central Asia | 470 | 7.2% |
| Trinidad and Tobago | 43 | 0.7% |
| Western Europe | 19 | 0.3% | View All 21 Rows |
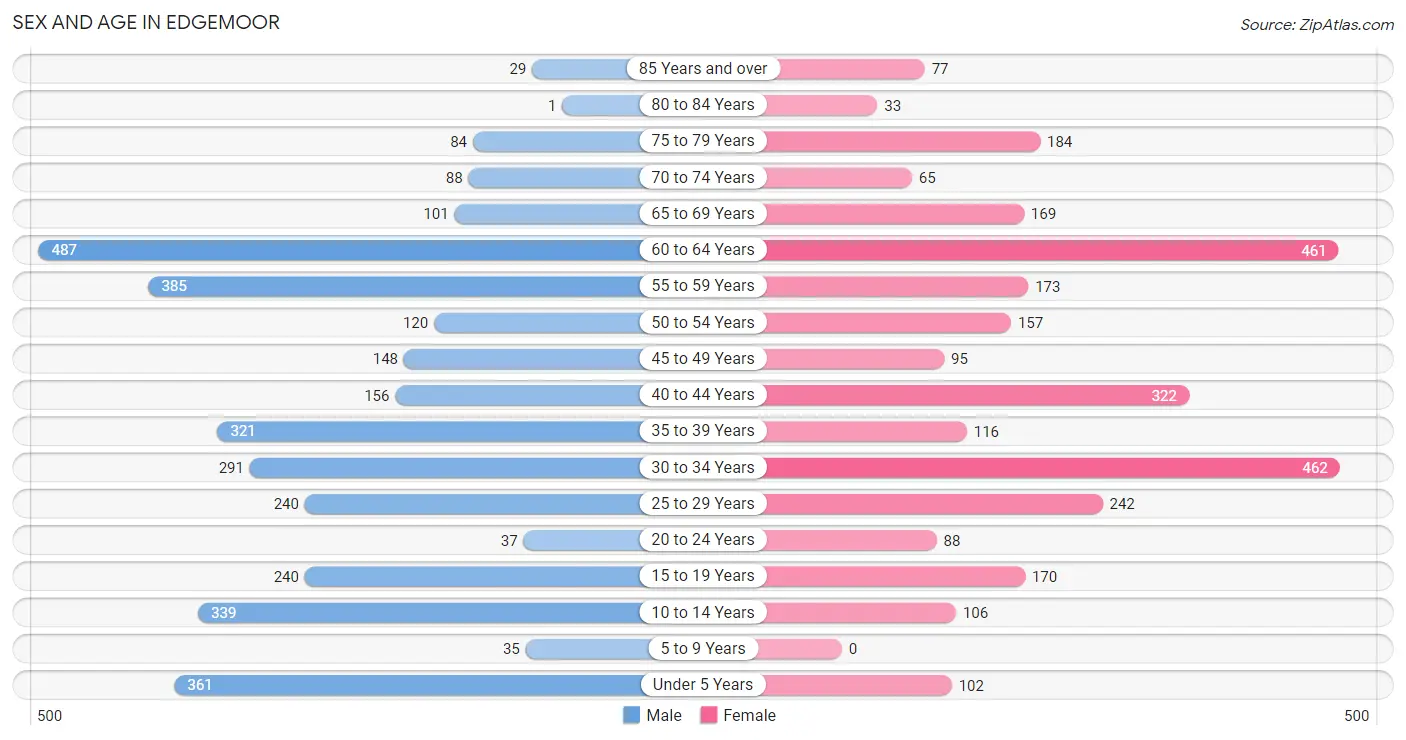
Sex and Age in Edgemoor
Sex and Age in Edgemoor
The most populous age groups in Edgemoor are 60 to 64 Years (487 | 14.1%) for men and 30 to 34 Years (462 | 15.3%) for women.
| Age Bracket | Male | Female |
| Under 5 Years | 361 (10.4%) | 102 (3.4%) |
| 5 to 9 Years | 35 (1.0%) | 0 (0.0%) |
| 10 to 14 Years | 339 (9.8%) | 106 (3.5%) |
| 15 to 19 Years | 240 (6.9%) | 170 (5.6%) |
| 20 to 24 Years | 37 (1.1%) | 88 (2.9%) |
| 25 to 29 Years | 240 (6.9%) | 242 (8.0%) |
| 30 to 34 Years | 291 (8.4%) | 462 (15.3%) |
| 35 to 39 Years | 321 (9.3%) | 116 (3.8%) |
| 40 to 44 Years | 156 (4.5%) | 322 (10.7%) |
| 45 to 49 Years | 148 (4.3%) | 95 (3.1%) |
| 50 to 54 Years | 120 (3.5%) | 157 (5.2%) |
| 55 to 59 Years | 385 (11.1%) | 173 (5.7%) |
| 60 to 64 Years | 487 (14.1%) | 461 (15.2%) |
| 65 to 69 Years | 101 (2.9%) | 169 (5.6%) |
| 70 to 74 Years | 88 (2.5%) | 65 (2.1%) |
| 75 to 79 Years | 84 (2.4%) | 184 (6.1%) |
| 80 to 84 Years | 1 (0.0%) | 33 (1.1%) |
| 85 Years and over | 29 (0.8%) | 77 (2.5%) |
| Total | 3,463 (100.0%) | 3,022 (100.0%) |
Families and Households in Edgemoor
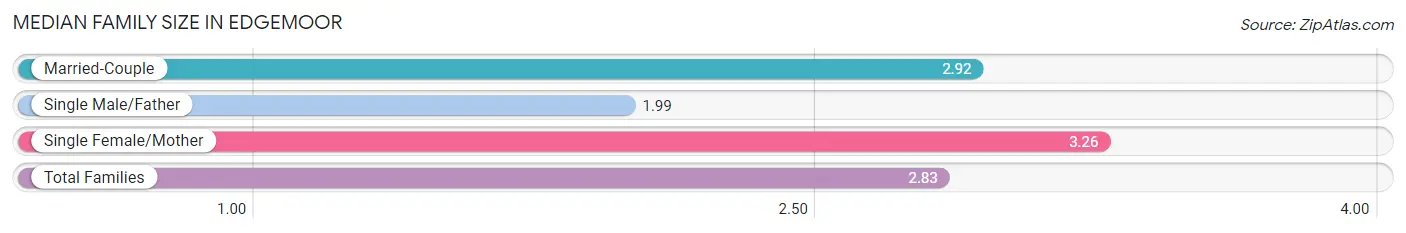
Median Family Size in Edgemoor
The median family size in Edgemoor is 2.83 persons per family, with single female/mother families (472 | 27.6%) accounting for the largest median family size of 3.26 persons per family. On the other hand, single male/father families (350 | 20.4%) represent the smallest median family size with 1.99 persons per family.
| Family Type | # Families | Family Size |
| Married-Couple | 890 (52.0%) | 2.92 |
| Single Male/Father | 350 (20.4%) | 1.99 |
| Single Female/Mother | 472 (27.6%) | 3.26 |
| Total Families | 1,712 (100.0%) | 2.83 |
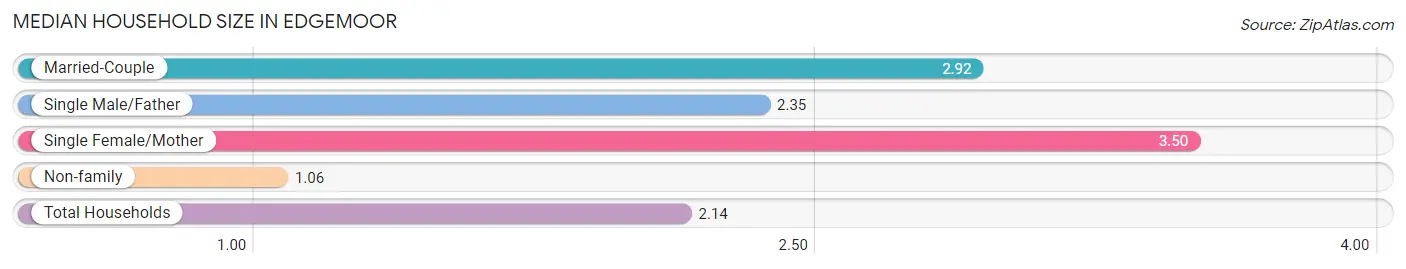
Median Household Size in Edgemoor
The median household size in Edgemoor is 2.14 persons per household, with single female/mother households (472 | 15.6%) accounting for the largest median household size of 3.5 persons per household. non-family households (1,319 | 43.5%) represent the smallest median household size with 1.06 persons per household.
| Household Type | # Households | Household Size |
| Married-Couple | 890 (29.4%) | 2.92 |
| Single Male/Father | 350 (11.6%) | 2.35 |
| Single Female/Mother | 472 (15.6%) | 3.50 |
| Non-family | 1,319 (43.5%) | 1.06 |
| Total Households | 3,031 (100.0%) | 2.14 |
Household Size by Marriage Status in Edgemoor
Out of a total of 3,031 households in Edgemoor, 1,712 (56.5%) are family households, while 1,319 (43.5%) are nonfamily households. The most numerous type of family households are 2-person households, comprising 874, and the most common type of nonfamily households are 1-person households, comprising 1,268.
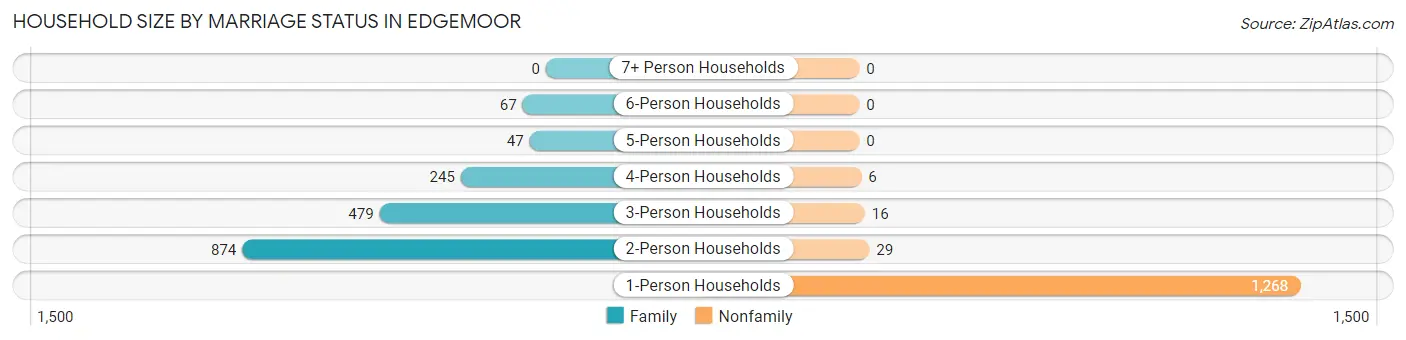
| Household Size | Family Households | Nonfamily Households |
| 1-Person Households | - | 1,268 (41.8%) |
| 2-Person Households | 874 (28.8%) | 29 (1.0%) |
| 3-Person Households | 479 (15.8%) | 16 (0.5%) |
| 4-Person Households | 245 (8.1%) | 6 (0.2%) |
| 5-Person Households | 47 (1.5%) | 0 (0.0%) |
| 6-Person Households | 67 (2.2%) | 0 (0.0%) |
| 7+ Person Households | 0 (0.0%) | 0 (0.0%) |
| Total | 1,712 (56.5%) | 1,319 (43.5%) |
Female Fertility in Edgemoor
Fertility by Age in Edgemoor
Average fertility rate in Edgemoor is 64.0 births per 1,000 women. Women in the age bracket of 20 to 34 years have the highest fertility rate with 122.0 births per 1,000 women. Women in the age bracket of 20 to 34 years acount for 100.0% of all women with births.
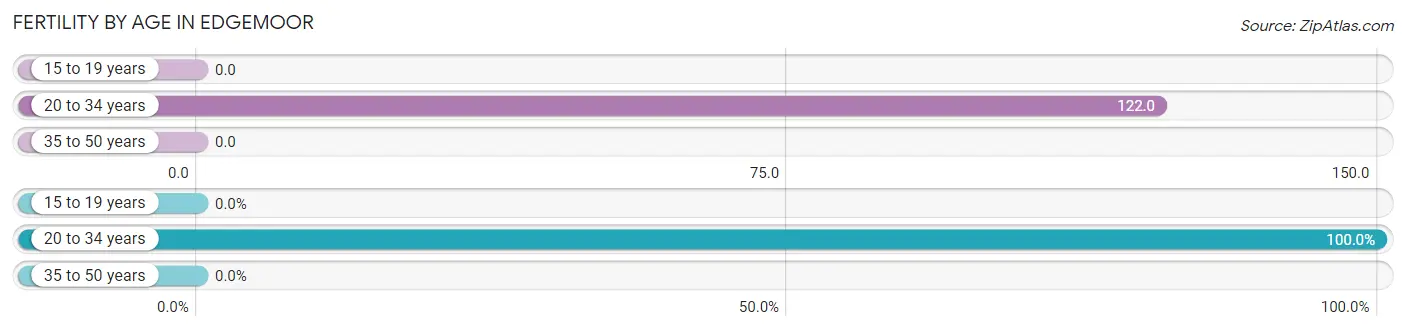
| Age Bracket | Women with Births | Births / 1,000 Women |
| 15 to 19 years | 0 (0.0%) | 0.0 |
| 20 to 34 years | 97 (100.0%) | 122.0 |
| 35 to 50 years | 0 (0.0%) | 0.0 |
| Total | 97 (100.0%) | 64.0 |
Fertility by Age by Marriage Status in Edgemoor
59.8% of women with births (97) in Edgemoor are married. The highest percentage of unmarried women with births falls into 20 to 34 years age bracket with 40.2% of them unmarried at the time of birth, while the lowest percentage of unmarried women with births belong to 20 to 34 years age bracket with 40.2% of them unmarried.
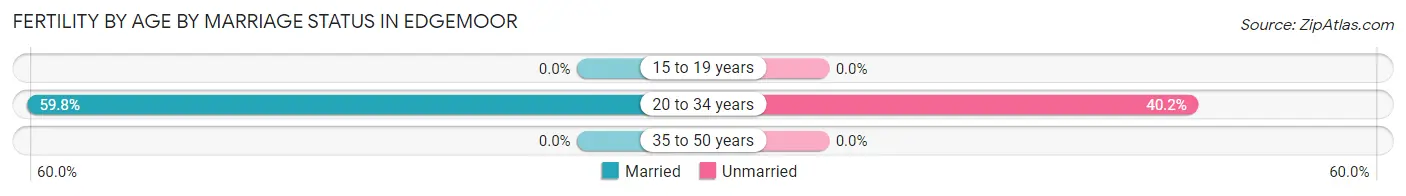
| Age Bracket | Married | Unmarried |
| 15 to 19 years | 0 (0.0%) | 0 (0.0%) |
| 20 to 34 years | 58 (59.8%) | 39 (40.2%) |
| 35 to 50 years | 0 (0.0%) | 0 (0.0%) |
| Total | 58 (59.8%) | 39 (40.2%) |
Fertility by Education in Edgemoor
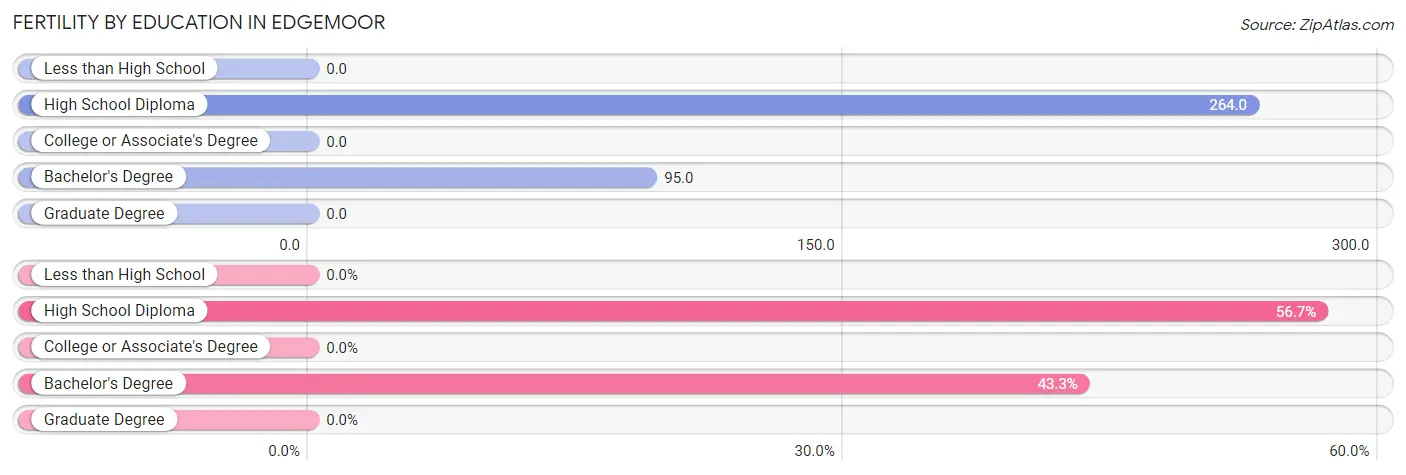
| Educational Attainment | Women with Births | Births / 1,000 Women |
| Less than High School | 0 (0.0%) | 0.0 |
| High School Diploma | 55 (56.7%) | 264.0 |
| College or Associate's Degree | 0 (0.0%) | 0.0 |
| Bachelor's Degree | 42 (43.3%) | 95.0 |
| Graduate Degree | 0 (0.0%) | 0.0 |
| Total | 97 (100.0%) | 64.0 |
Fertility by Education by Marriage Status in Edgemoor
40.2% of women with births in Edgemoor are unmarried. Women with the educational attainment of bachelor's degree are most likely to be married with 100.0% of them married at childbirth, while women with the educational attainment of high school diploma are least likely to be married with 70.9% of them unmarried at childbirth.
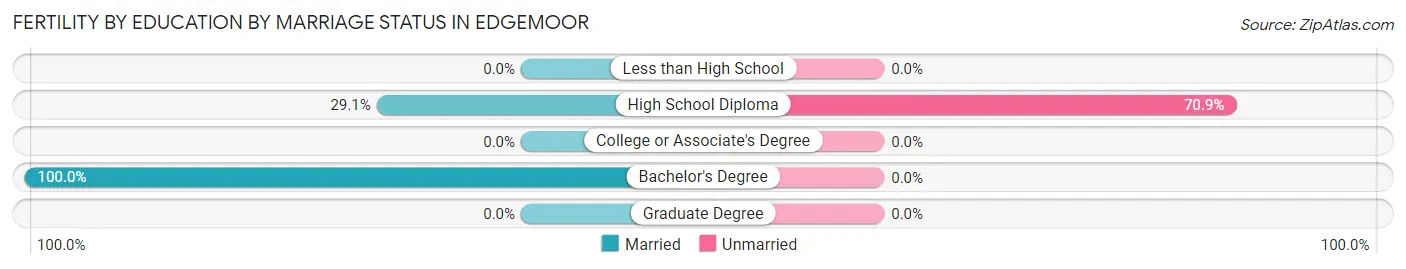
| Educational Attainment | Married | Unmarried |
| Less than High School | 0 (0.0%) | 0 (0.0%) |
| High School Diploma | 16 (29.1%) | 39 (70.9%) |
| College or Associate's Degree | 0 (0.0%) | 0 (0.0%) |
| Bachelor's Degree | 42 (100.0%) | 0 (0.0%) |
| Graduate Degree | 0 (0.0%) | 0 (0.0%) |
| Total | 58 (59.8%) | 39 (40.2%) |
Employment Characteristics in Edgemoor
Employment by Class of Employer in Edgemoor
Among the 3,276 employed individuals in Edgemoor, private company employees (2,112 | 64.5%), state government employees (348 | 10.6%), and self-employed (not incorporated) (303 | 9.2%) make up the most common classes of employment.
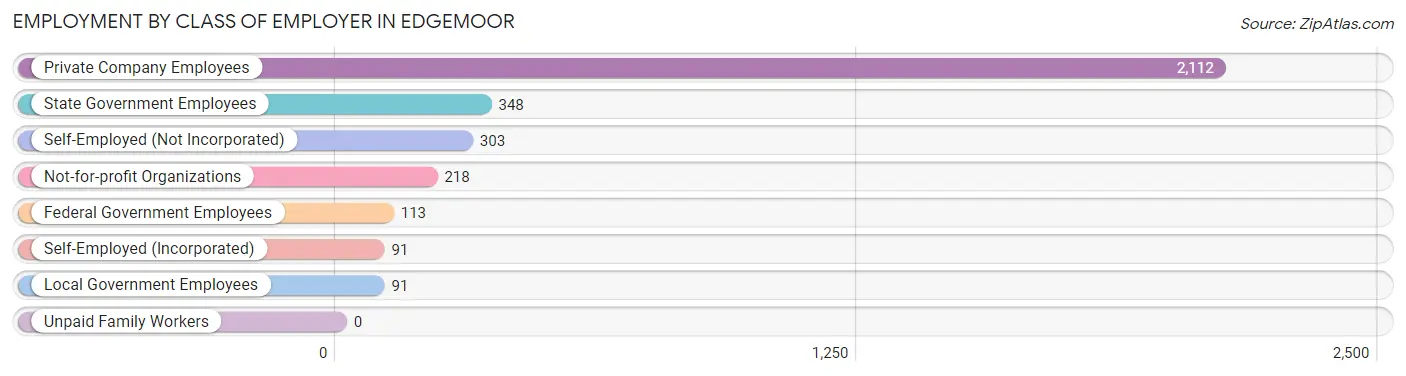
| Employer Class | # Employees | % Employees |
| Private Company Employees | 2,112 | 64.5% |
| Self-Employed (Incorporated) | 91 | 2.8% |
| Self-Employed (Not Incorporated) | 303 | 9.2% |
| Not-for-profit Organizations | 218 | 6.7% |
| Local Government Employees | 91 | 2.8% |
| State Government Employees | 348 | 10.6% |
| Federal Government Employees | 113 | 3.5% |
| Unpaid Family Workers | 0 | 0.0% |
| Total | 3,276 | 100.0% |
Employment Status by Age in Edgemoor
According to the labor force statistics for Edgemoor, out of the total population over 16 years of age (5,254), 69.3% or 3,641 individuals are in the labor force, with 5.6% or 204 of them unemployed. The age group with the highest labor force participation rate is 30 to 34 years, with 99.2% or 747 individuals in the labor force. Within the labor force, the 65 to 74 years age range has the highest percentage of unemployed individuals, with 16.4% or 19 of them being unemployed.
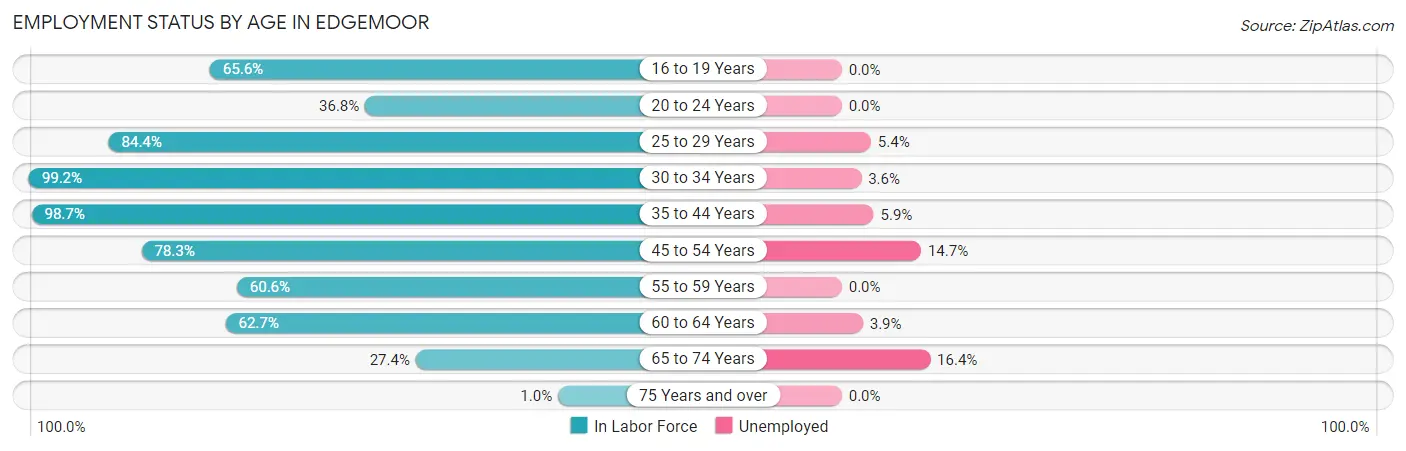
| Age Bracket | In Labor Force | Unemployed |
| 16 to 19 Years | 80 (65.6%) | 0 (0.0%) |
| 20 to 24 Years | 46 (36.8%) | 0 (0.0%) |
| 25 to 29 Years | 407 (84.4%) | 22 (5.4%) |
| 30 to 34 Years | 747 (99.2%) | 27 (3.6%) |
| 35 to 44 Years | 903 (98.7%) | 53 (5.9%) |
| 45 to 54 Years | 407 (78.3%) | 60 (14.7%) |
| 55 to 59 Years | 338 (60.6%) | 0 (0.0%) |
| 60 to 64 Years | 594 (62.7%) | 23 (3.9%) |
| 65 to 74 Years | 116 (27.4%) | 19 (16.4%) |
| 75 Years and over | 4 (1.0%) | 0 (0.0%) |
| Total | 3,641 (69.3%) | 204 (5.6%) |
Employment Status by Educational Attainment in Edgemoor
According to labor force statistics for Edgemoor, 81.3% of individuals (3,395) out of the total population between 25 and 64 years of age (4,176) are in the labor force, with 5.4% or 183 of them being unemployed. The group with the highest labor force participation rate are those with the educational attainment of bachelor's degree or higher, with 96.8% or 1,391 individuals in the labor force. Within the labor force, individuals with high school diploma education have the highest percentage of unemployment, with 9.9% or 87 of them being unemployed.
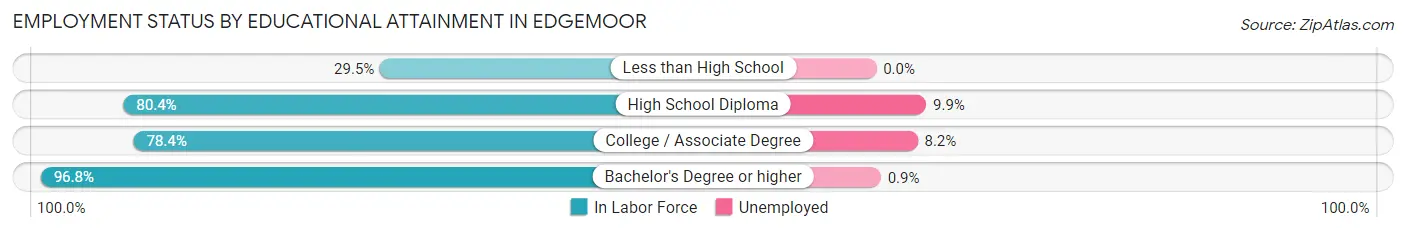
| Educational Attainment | In Labor Force | Unemployed |
| Less than High School | 99 (29.5%) | 0 (0.0%) |
| High School Diploma | 875 (80.4%) | 108 (9.9%) |
| College / Associate Degree | 1,031 (78.4%) | 108 (8.2%) |
| Bachelor's Degree or higher | 1,391 (96.8%) | 13 (0.9%) |
| Total | 3,395 (81.3%) | 226 (5.4%) |
Employment Occupations by Sex in Edgemoor
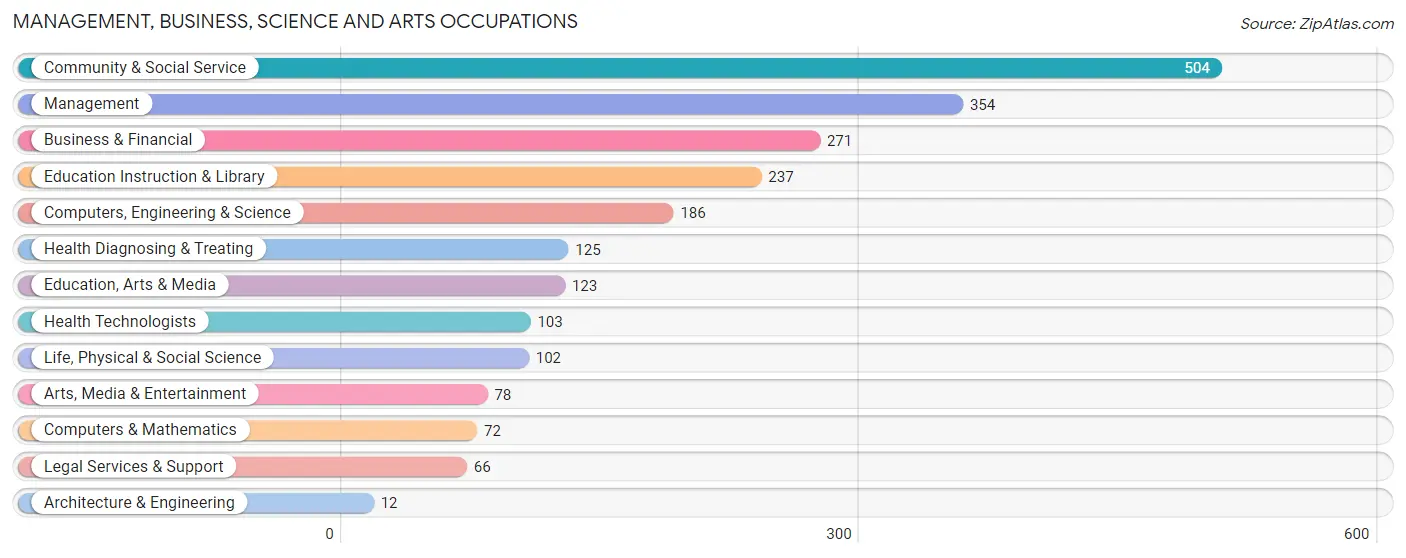
Management, Business, Science and Arts Occupations
The most common Management, Business, Science and Arts occupations in Edgemoor are Community & Social Service (504 | 14.7%), Management (354 | 10.3%), Business & Financial (271 | 7.9%), Education Instruction & Library (237 | 6.9%), and Computers, Engineering & Science (186 | 5.4%).
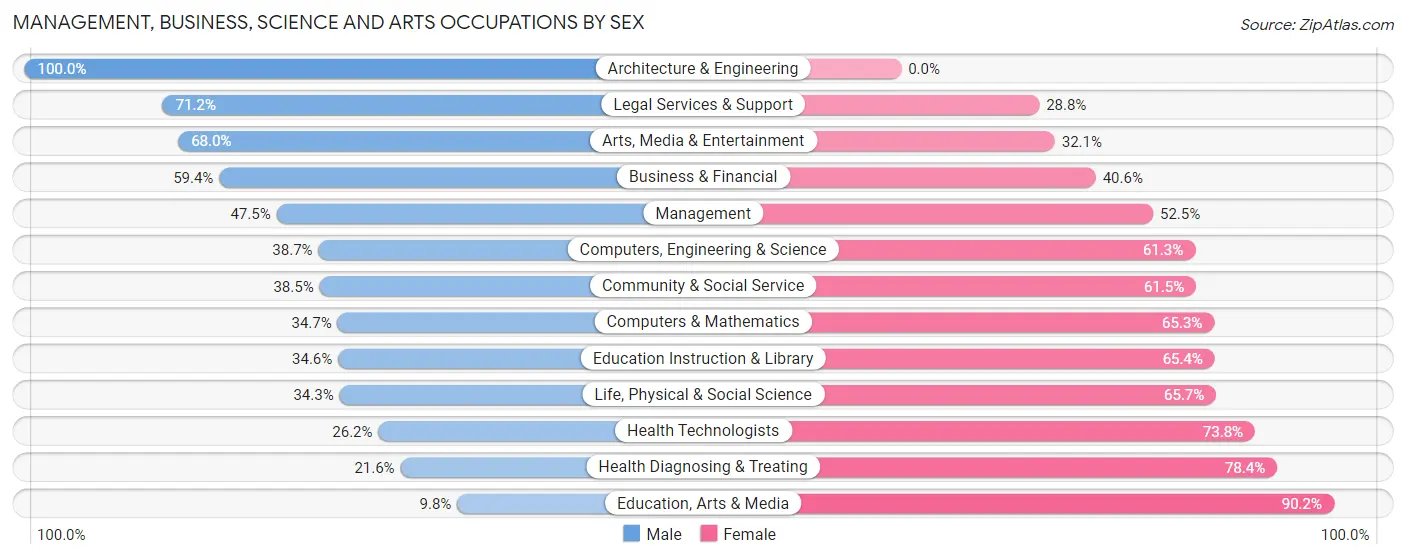
Management, Business, Science and Arts Occupations by Sex
Within the Management, Business, Science and Arts occupations in Edgemoor, the most male-oriented occupations are Architecture & Engineering (100.0%), Legal Services & Support (71.2%), and Arts, Media & Entertainment (67.9%), while the most female-oriented occupations are Education, Arts & Media (90.2%), Health Diagnosing & Treating (78.4%), and Health Technologists (73.8%).
| Occupation | Male | Female |
| Management | 168 (47.5%) | 186 (52.5%) |
| Business & Financial | 161 (59.4%) | 110 (40.6%) |
| Computers, Engineering & Science | 72 (38.7%) | 114 (61.3%) |
| Computers & Mathematics | 25 (34.7%) | 47 (65.3%) |
| Architecture & Engineering | 12 (100.0%) | 0 (0.0%) |
| Life, Physical & Social Science | 35 (34.3%) | 67 (65.7%) |
| Community & Social Service | 194 (38.5%) | 310 (61.5%) |
| Education, Arts & Media | 12 (9.8%) | 111 (90.2%) |
| Legal Services & Support | 47 (71.2%) | 19 (28.8%) |
| Education Instruction & Library | 82 (34.6%) | 155 (65.4%) |
| Arts, Media & Entertainment | 53 (67.9%) | 25 (32.1%) |
| Health Diagnosing & Treating | 27 (21.6%) | 98 (78.4%) |
| Health Technologists | 27 (26.2%) | 76 (73.8%) |
| Total (Category) | 622 (43.2%) | 818 (56.8%) |
| Total (Overall) | 1,711 (49.8%) | 1,727 (50.2%) |
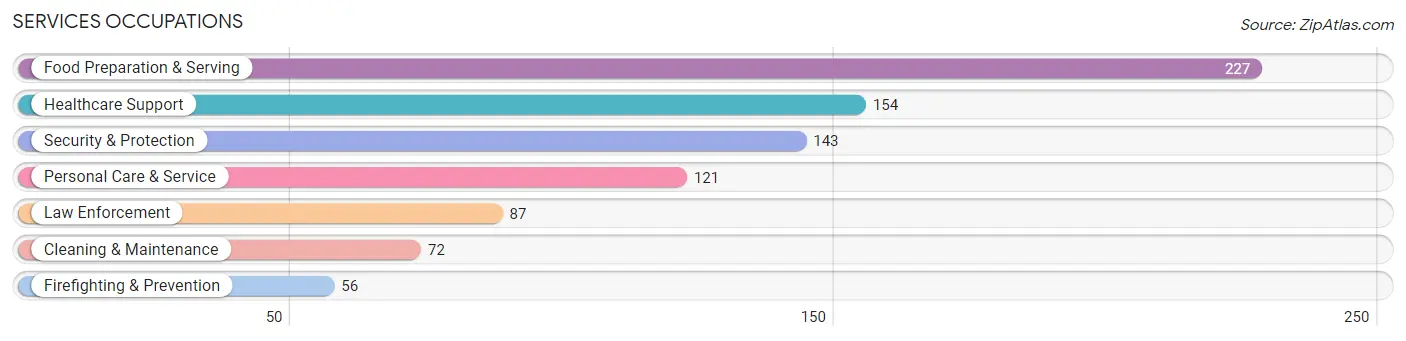
Services Occupations
The most common Services occupations in Edgemoor are Food Preparation & Serving (227 | 6.6%), Healthcare Support (154 | 4.5%), Security & Protection (143 | 4.2%), Personal Care & Service (121 | 3.5%), and Law Enforcement (87 | 2.5%).
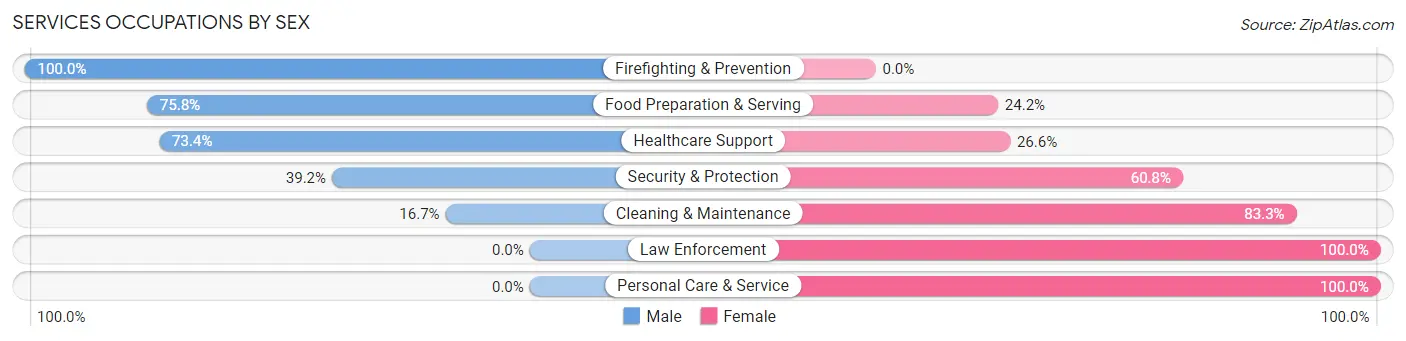
Services Occupations by Sex
Within the Services occupations in Edgemoor, the most male-oriented occupations are Firefighting & Prevention (100.0%), Food Preparation & Serving (75.8%), and Healthcare Support (73.4%), while the most female-oriented occupations are Law Enforcement (100.0%), Personal Care & Service (100.0%), and Cleaning & Maintenance (83.3%).
| Occupation | Male | Female |
| Healthcare Support | 113 (73.4%) | 41 (26.6%) |
| Security & Protection | 56 (39.2%) | 87 (60.8%) |
| Firefighting & Prevention | 56 (100.0%) | 0 (0.0%) |
| Law Enforcement | 0 (0.0%) | 87 (100.0%) |
| Food Preparation & Serving | 172 (75.8%) | 55 (24.2%) |
| Cleaning & Maintenance | 12 (16.7%) | 60 (83.3%) |
| Personal Care & Service | 0 (0.0%) | 121 (100.0%) |
| Total (Category) | 353 (49.2%) | 364 (50.8%) |
| Total (Overall) | 1,711 (49.8%) | 1,727 (50.2%) |
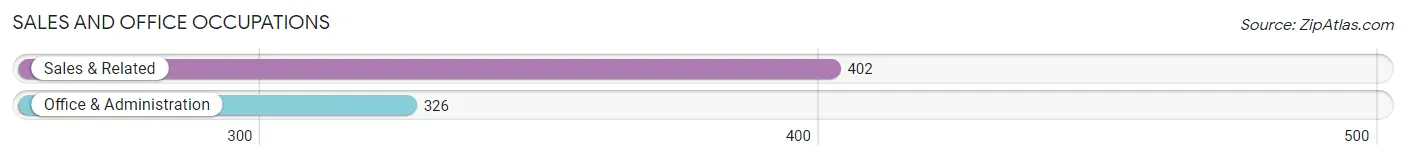
Sales and Office Occupations
The most common Sales and Office occupations in Edgemoor are Sales & Related (402 | 11.7%), and Office & Administration (326 | 9.5%).
Sales and Office Occupations by Sex
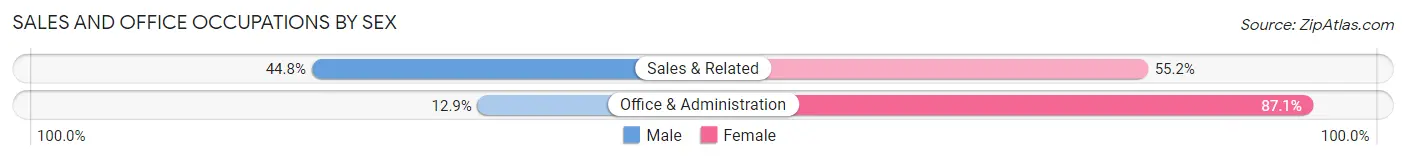
| Occupation | Male | Female |
| Sales & Related | 180 (44.8%) | 222 (55.2%) |
| Office & Administration | 42 (12.9%) | 284 (87.1%) |
| Total (Category) | 222 (30.5%) | 506 (69.5%) |
| Total (Overall) | 1,711 (49.8%) | 1,727 (50.2%) |
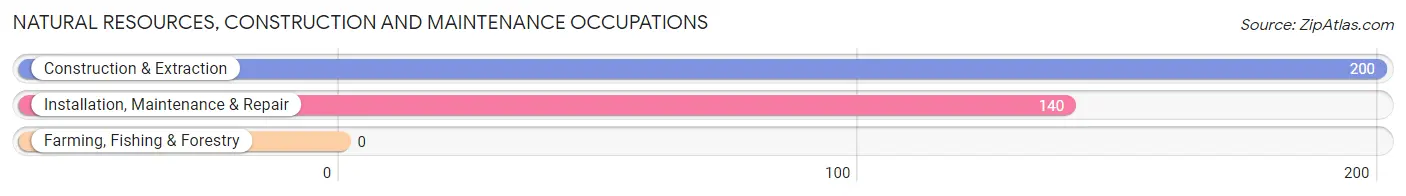
Natural Resources, Construction and Maintenance Occupations
The most common Natural Resources, Construction and Maintenance occupations in Edgemoor are Construction & Extraction (200 | 5.8%), and Installation, Maintenance & Repair (140 | 4.1%).
Natural Resources, Construction and Maintenance Occupations by Sex
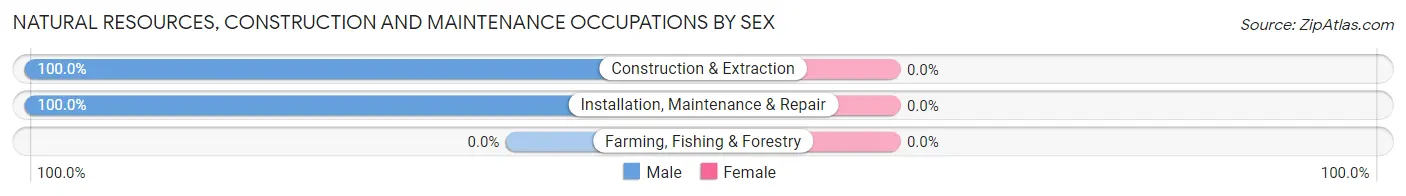
| Occupation | Male | Female |
| Farming, Fishing & Forestry | 0 (0.0%) | 0 (0.0%) |
| Construction & Extraction | 200 (100.0%) | 0 (0.0%) |
| Installation, Maintenance & Repair | 140 (100.0%) | 0 (0.0%) |
| Total (Category) | 340 (100.0%) | 0 (0.0%) |
| Total (Overall) | 1,711 (49.8%) | 1,727 (50.2%) |
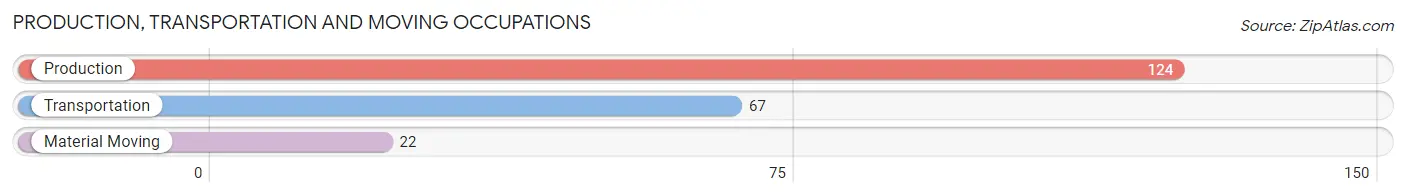
Production, Transportation and Moving Occupations
The most common Production, Transportation and Moving occupations in Edgemoor are Production (124 | 3.6%), Transportation (67 | 1.9%), and Material Moving (22 | 0.6%).
Production, Transportation and Moving Occupations by Sex
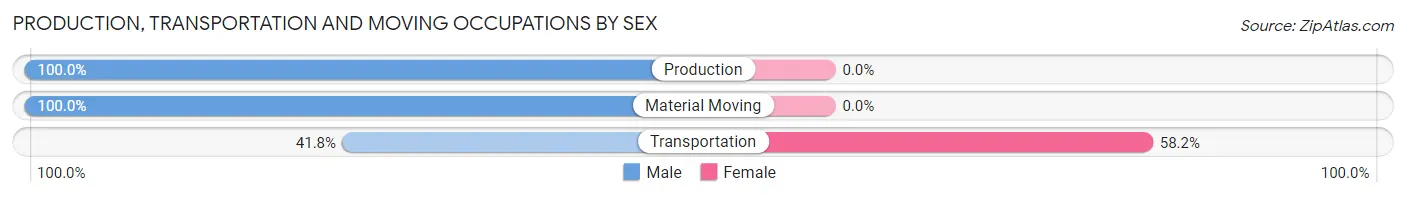
| Occupation | Male | Female |
| Production | 124 (100.0%) | 0 (0.0%) |
| Transportation | 28 (41.8%) | 39 (58.2%) |
| Material Moving | 22 (100.0%) | 0 (0.0%) |
| Total (Category) | 174 (81.7%) | 39 (18.3%) |
| Total (Overall) | 1,711 (49.8%) | 1,727 (50.2%) |
Employment Industries by Sex in Edgemoor
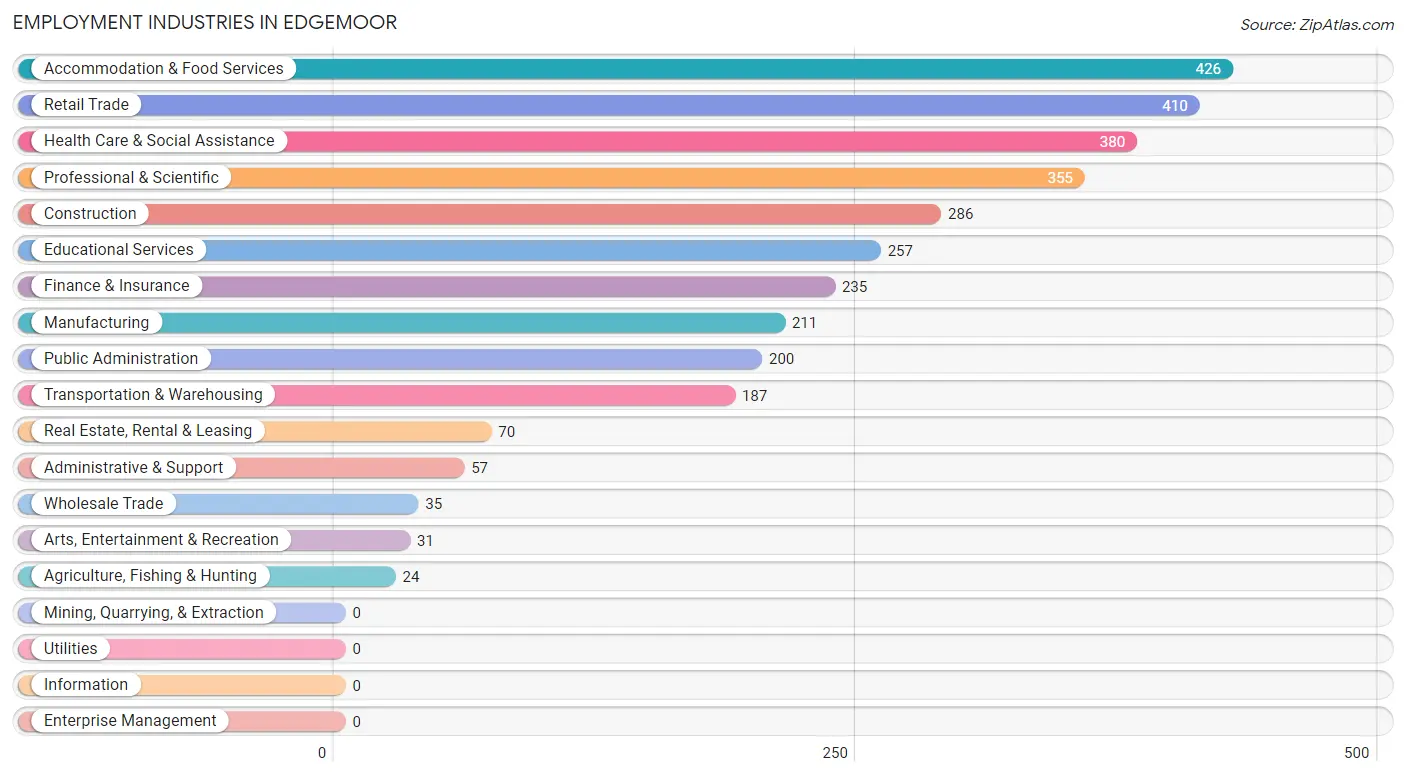
Employment Industries in Edgemoor
The major employment industries in Edgemoor include Accommodation & Food Services (426 | 12.4%), Retail Trade (410 | 11.9%), Health Care & Social Assistance (380 | 11.1%), Professional & Scientific (355 | 10.3%), and Construction (286 | 8.3%).
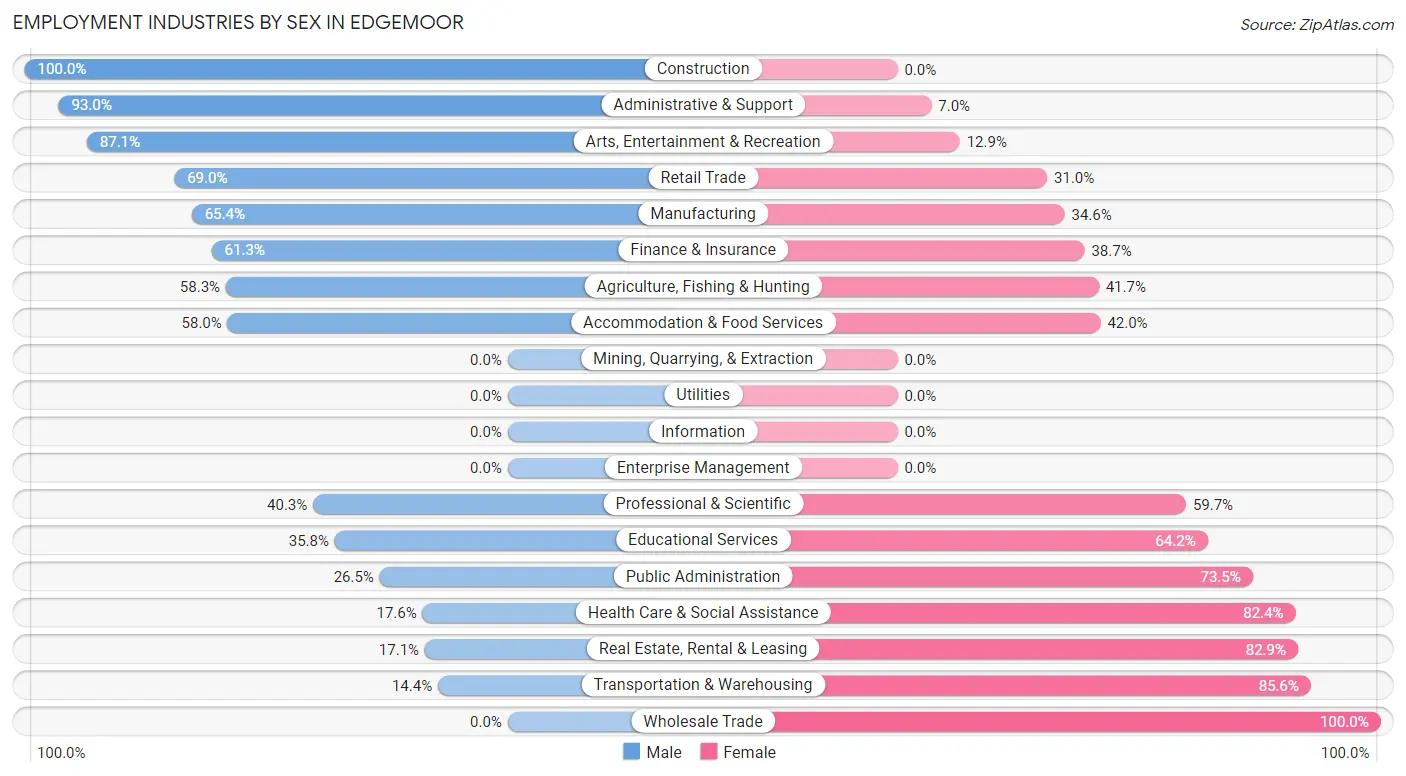
Employment Industries by Sex in Edgemoor
The Edgemoor industries that see more men than women are Construction (100.0%), Administrative & Support (93.0%), and Arts, Entertainment & Recreation (87.1%), whereas the industries that tend to have a higher number of women are Wholesale Trade (100.0%), Transportation & Warehousing (85.6%), and Real Estate, Rental & Leasing (82.9%).
| Industry | Male | Female |
| Agriculture, Fishing & Hunting | 14 (58.3%) | 10 (41.7%) |
| Mining, Quarrying, & Extraction | 0 (0.0%) | 0 (0.0%) |
| Construction | 286 (100.0%) | 0 (0.0%) |
| Manufacturing | 138 (65.4%) | 73 (34.6%) |
| Wholesale Trade | 0 (0.0%) | 35 (100.0%) |
| Retail Trade | 283 (69.0%) | 127 (31.0%) |
| Transportation & Warehousing | 27 (14.4%) | 160 (85.6%) |
| Utilities | 0 (0.0%) | 0 (0.0%) |
| Information | 0 (0.0%) | 0 (0.0%) |
| Finance & Insurance | 144 (61.3%) | 91 (38.7%) |
| Real Estate, Rental & Leasing | 12 (17.1%) | 58 (82.9%) |
| Professional & Scientific | 143 (40.3%) | 212 (59.7%) |
| Enterprise Management | 0 (0.0%) | 0 (0.0%) |
| Administrative & Support | 53 (93.0%) | 4 (7.0%) |
| Educational Services | 92 (35.8%) | 165 (64.2%) |
| Health Care & Social Assistance | 67 (17.6%) | 313 (82.4%) |
| Arts, Entertainment & Recreation | 27 (87.1%) | 4 (12.9%) |
| Accommodation & Food Services | 247 (58.0%) | 179 (42.0%) |
| Public Administration | 53 (26.5%) | 147 (73.5%) |
| Total | 1,711 (49.8%) | 1,727 (50.2%) |
Education in Edgemoor
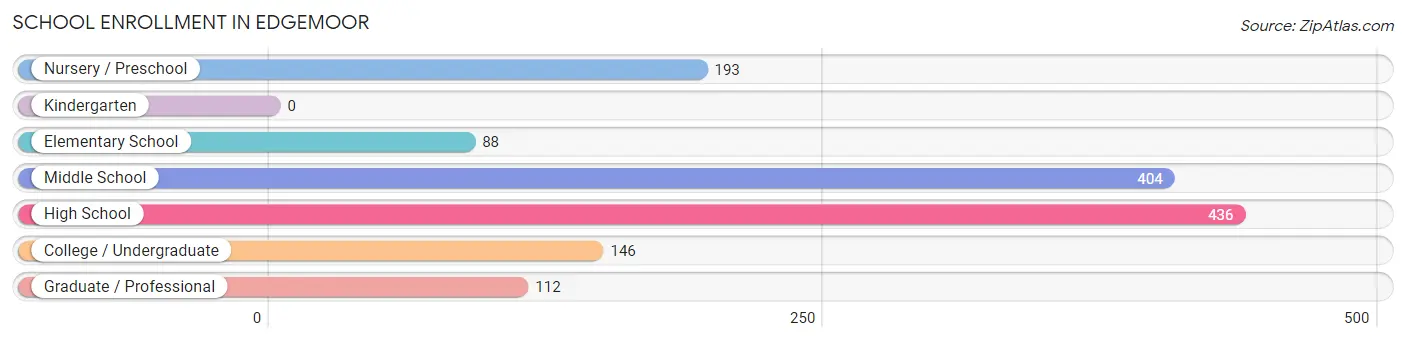
School Enrollment in Edgemoor
The most common levels of schooling among the 1,379 students in Edgemoor are high school (436 | 31.6%), middle school (404 | 29.3%), and nursery / preschool (193 | 14.0%).
| School Level | # Students | % Students |
| Nursery / Preschool | 193 | 14.0% |
| Kindergarten | 0 | 0.0% |
| Elementary School | 88 | 6.4% |
| Middle School | 404 | 29.3% |
| High School | 436 | 31.6% |
| College / Undergraduate | 146 | 10.6% |
| Graduate / Professional | 112 | 8.1% |
| Total | 1,379 | 100.0% |
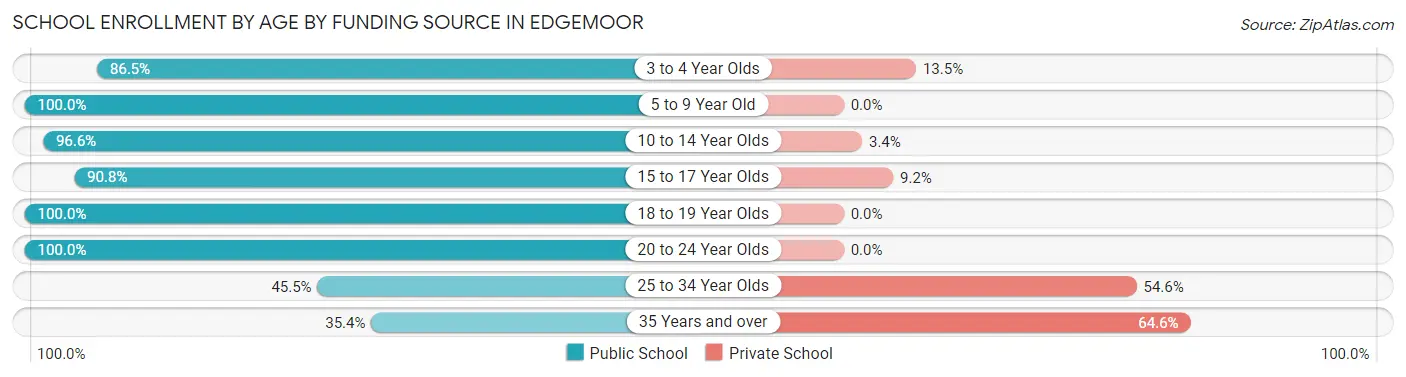
School Enrollment by Age by Funding Source in Edgemoor
Out of a total of 1,379 students who are enrolled in schools in Edgemoor, 217 (15.7%) attend a private institution, while the remaining 1,162 (84.3%) are enrolled in public schools. The age group of 35 years and over has the highest likelihood of being enrolled in private schools, with 62 (64.6% in the age bracket) enrolled. Conversely, the age group of 5 to 9 year old has the lowest likelihood of being enrolled in a private school, with 35 (100.0% in the age bracket) attending a public institution.
| Age Bracket | Public School | Private School |
| 3 to 4 Year Olds | 167 (86.5%) | 26 (13.5%) |
| 5 to 9 Year Old | 35 (100.0%) | 0 (0.0%) |
| 10 to 14 Year Olds | 424 (96.6%) | 15 (3.4%) |
| 15 to 17 Year Olds | 355 (90.8%) | 36 (9.2%) |
| 18 to 19 Year Olds | 19 (100.0%) | 0 (0.0%) |
| 20 to 24 Year Olds | 63 (100.0%) | 0 (0.0%) |
| 25 to 34 Year Olds | 65 (45.5%) | 78 (54.5%) |
| 35 Years and over | 34 (35.4%) | 62 (64.6%) |
| Total | 1,162 (84.3%) | 217 (15.7%) |
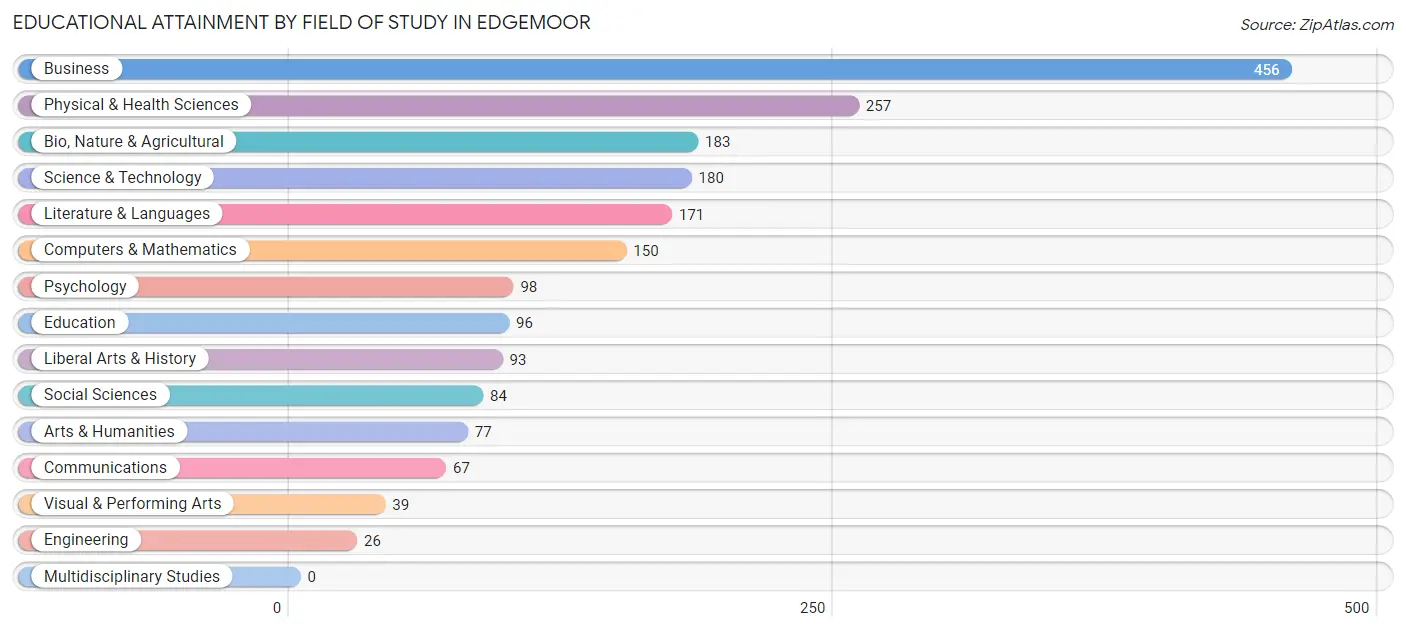
Educational Attainment by Field of Study in Edgemoor
Business (456 | 23.1%), physical & health sciences (257 | 13.0%), bio, nature & agricultural (183 | 9.3%), science & technology (180 | 9.1%), and literature & languages (171 | 8.6%) are the most common fields of study among 1,977 individuals in Edgemoor who have obtained a bachelor's degree or higher.
| Field of Study | # Graduates | % Graduates |
| Computers & Mathematics | 150 | 7.6% |
| Bio, Nature & Agricultural | 183 | 9.3% |
| Physical & Health Sciences | 257 | 13.0% |
| Psychology | 98 | 5.0% |
| Social Sciences | 84 | 4.3% |
| Engineering | 26 | 1.3% |
| Multidisciplinary Studies | 0 | 0.0% |
| Science & Technology | 180 | 9.1% |
| Business | 456 | 23.1% |
| Education | 96 | 4.9% |
| Literature & Languages | 171 | 8.6% |
| Liberal Arts & History | 93 | 4.7% |
| Visual & Performing Arts | 39 | 2.0% |
| Communications | 67 | 3.4% |
| Arts & Humanities | 77 | 3.9% |
| Total | 1,977 | 100.0% |
Transportation & Commute in Edgemoor
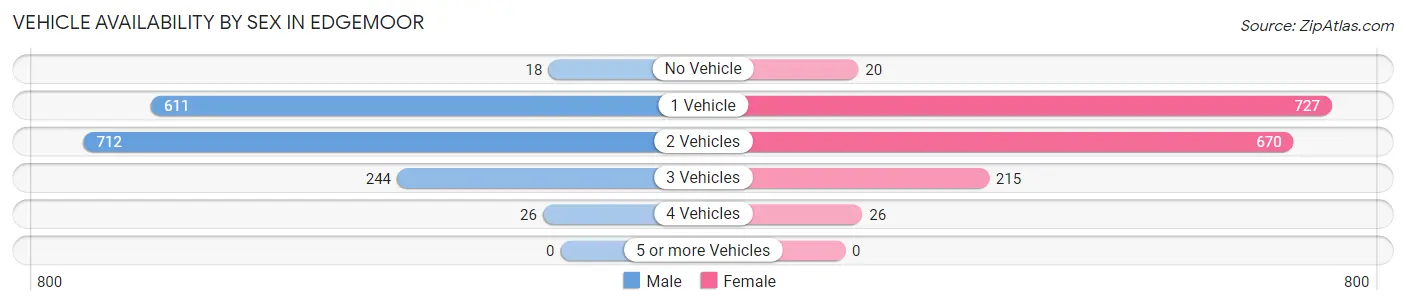
Vehicle Availability by Sex in Edgemoor
The most prevalent vehicle ownership categories in Edgemoor are males with 2 vehicles (712, accounting for 44.2%) and females with 2 vehicles (670, making up 42.9%).
| Vehicles Available | Male | Female |
| No Vehicle | 18 (1.1%) | 20 (1.2%) |
| 1 Vehicle | 611 (37.9%) | 727 (43.9%) |
| 2 Vehicles | 712 (44.2%) | 670 (40.4%) |
| 3 Vehicles | 244 (15.1%) | 215 (13.0%) |
| 4 Vehicles | 26 (1.6%) | 26 (1.6%) |
| 5 or more Vehicles | 0 (0.0%) | 0 (0.0%) |
| Total | 1,611 (100.0%) | 1,658 (100.0%) |
Commute Time in Edgemoor
The most frequently occuring commute durations in Edgemoor are 20 to 24 minutes (834 commuters, 29.0%), 10 to 14 minutes (508 commuters, 17.7%), and 15 to 19 minutes (457 commuters, 15.9%).
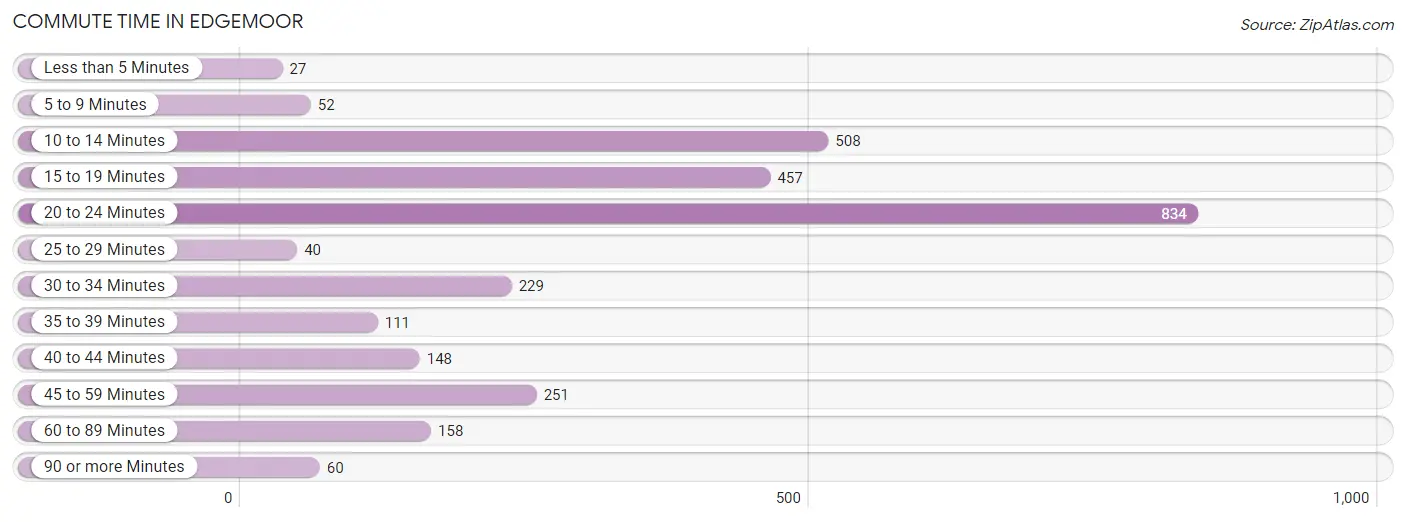
| Commute Time | # Commuters | % Commuters |
| Less than 5 Minutes | 27 | 0.9% |
| 5 to 9 Minutes | 52 | 1.8% |
| 10 to 14 Minutes | 508 | 17.7% |
| 15 to 19 Minutes | 457 | 15.9% |
| 20 to 24 Minutes | 834 | 29.0% |
| 25 to 29 Minutes | 40 | 1.4% |
| 30 to 34 Minutes | 229 | 8.0% |
| 35 to 39 Minutes | 111 | 3.9% |
| 40 to 44 Minutes | 148 | 5.1% |
| 45 to 59 Minutes | 251 | 8.7% |
| 60 to 89 Minutes | 158 | 5.5% |
| 90 or more Minutes | 60 | 2.1% |
Commute Time by Sex in Edgemoor
The most common commute times in Edgemoor are 20 to 24 minutes (565 commuters, 36.8%) for males and 10 to 14 minutes (368 commuters, 27.5%) for females.
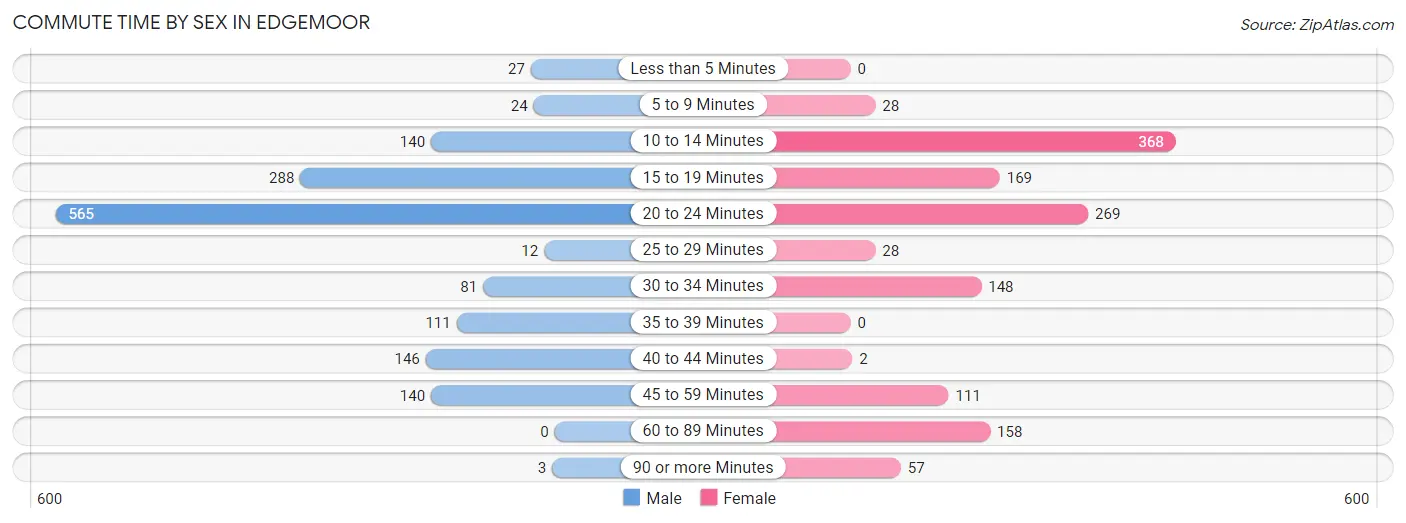
| Commute Time | Male | Female |
| Less than 5 Minutes | 27 (1.8%) | 0 (0.0%) |
| 5 to 9 Minutes | 24 (1.6%) | 28 (2.1%) |
| 10 to 14 Minutes | 140 (9.1%) | 368 (27.5%) |
| 15 to 19 Minutes | 288 (18.7%) | 169 (12.6%) |
| 20 to 24 Minutes | 565 (36.8%) | 269 (20.1%) |
| 25 to 29 Minutes | 12 (0.8%) | 28 (2.1%) |
| 30 to 34 Minutes | 81 (5.3%) | 148 (11.1%) |
| 35 to 39 Minutes | 111 (7.2%) | 0 (0.0%) |
| 40 to 44 Minutes | 146 (9.5%) | 2 (0.2%) |
| 45 to 59 Minutes | 140 (9.1%) | 111 (8.3%) |
| 60 to 89 Minutes | 0 (0.0%) | 158 (11.8%) |
| 90 or more Minutes | 3 (0.2%) | 57 (4.3%) |
Time of Departure to Work by Sex in Edgemoor
The most frequent times of departure to work in Edgemoor are 4:00 PM to 11:59 PM (232, 15.1%) for males and 7:30 AM to 7:59 AM (401, 30.0%) for females.
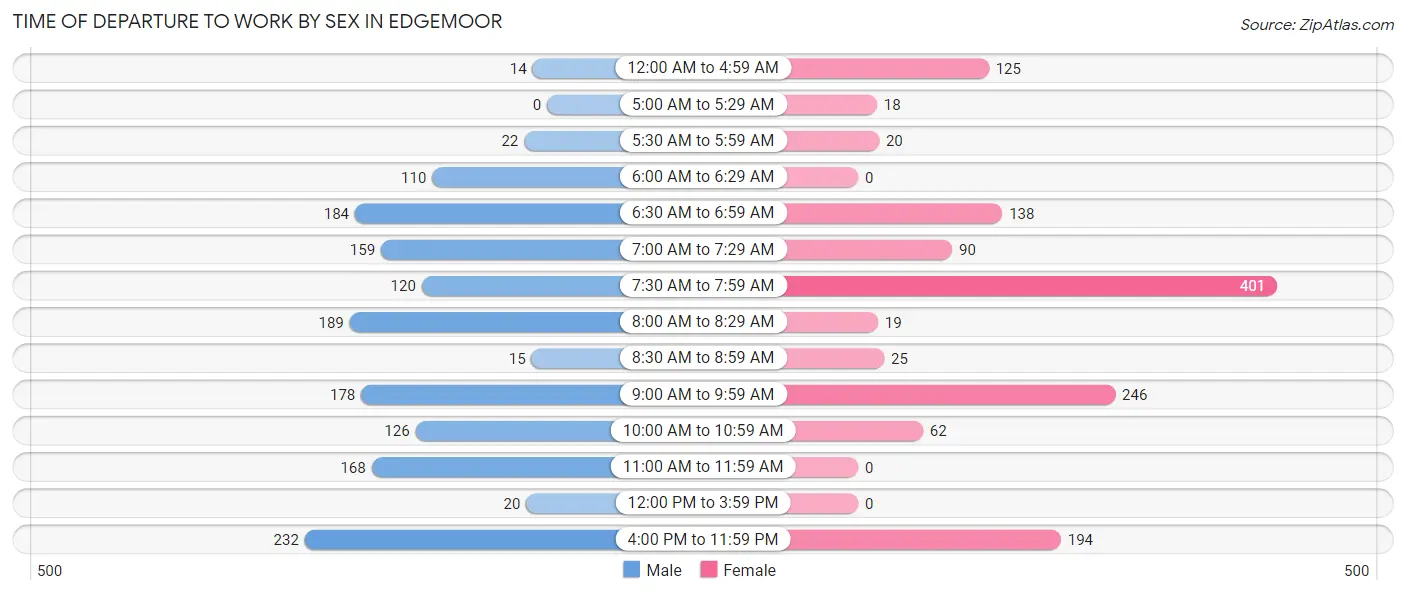
| Time of Departure | Male | Female |
| 12:00 AM to 4:59 AM | 14 (0.9%) | 125 (9.3%) |
| 5:00 AM to 5:29 AM | 0 (0.0%) | 18 (1.3%) |
| 5:30 AM to 5:59 AM | 22 (1.4%) | 20 (1.5%) |
| 6:00 AM to 6:29 AM | 110 (7.2%) | 0 (0.0%) |
| 6:30 AM to 6:59 AM | 184 (12.0%) | 138 (10.3%) |
| 7:00 AM to 7:29 AM | 159 (10.3%) | 90 (6.7%) |
| 7:30 AM to 7:59 AM | 120 (7.8%) | 401 (30.0%) |
| 8:00 AM to 8:29 AM | 189 (12.3%) | 19 (1.4%) |
| 8:30 AM to 8:59 AM | 15 (1.0%) | 25 (1.9%) |
| 9:00 AM to 9:59 AM | 178 (11.6%) | 246 (18.4%) |
| 10:00 AM to 10:59 AM | 126 (8.2%) | 62 (4.6%) |
| 11:00 AM to 11:59 AM | 168 (10.9%) | 0 (0.0%) |
| 12:00 PM to 3:59 PM | 20 (1.3%) | 0 (0.0%) |
| 4:00 PM to 11:59 PM | 232 (15.1%) | 194 (14.5%) |
| Total | 1,537 (100.0%) | 1,338 (100.0%) |
Housing Occupancy in Edgemoor
Occupancy by Ownership in Edgemoor
Of the total 3,031 dwellings in Edgemoor, owner-occupied units account for 1,758 (58.0%), while renter-occupied units make up 1,273 (42.0%).
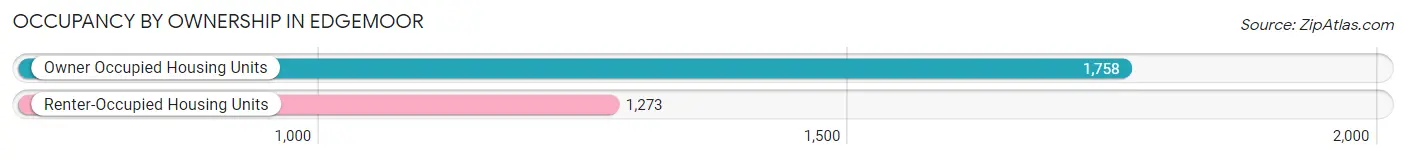
| Occupancy | # Housing Units | % Housing Units |
| Owner Occupied Housing Units | 1,758 | 58.0% |
| Renter-Occupied Housing Units | 1,273 | 42.0% |
| Total Occupied Housing Units | 3,031 | 100.0% |
Occupancy by Household Size in Edgemoor
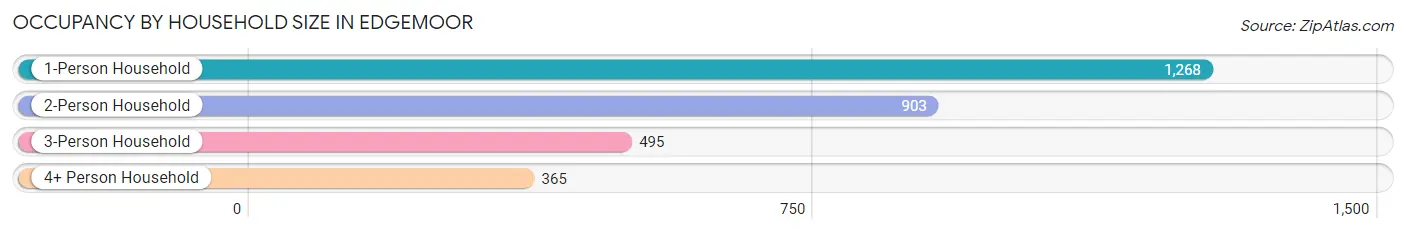
| Household Size | # Housing Units | % Housing Units |
| 1-Person Household | 1,268 | 41.8% |
| 2-Person Household | 903 | 29.8% |
| 3-Person Household | 495 | 16.3% |
| 4+ Person Household | 365 | 12.0% |
| Total Housing Units | 3,031 | 100.0% |
Occupancy by Ownership by Household Size in Edgemoor
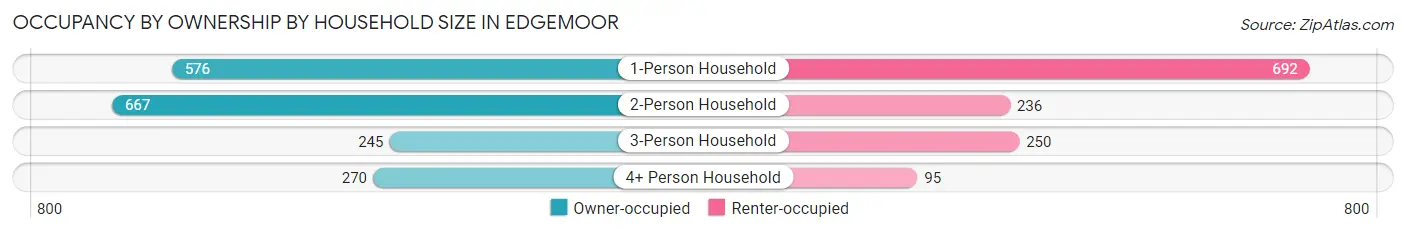
| Household Size | Owner-occupied | Renter-occupied |
| 1-Person Household | 576 (45.4%) | 692 (54.6%) |
| 2-Person Household | 667 (73.9%) | 236 (26.1%) |
| 3-Person Household | 245 (49.5%) | 250 (50.5%) |
| 4+ Person Household | 270 (74.0%) | 95 (26.0%) |
| Total Housing Units | 1,758 (58.0%) | 1,273 (42.0%) |
Occupancy by Educational Attainment in Edgemoor
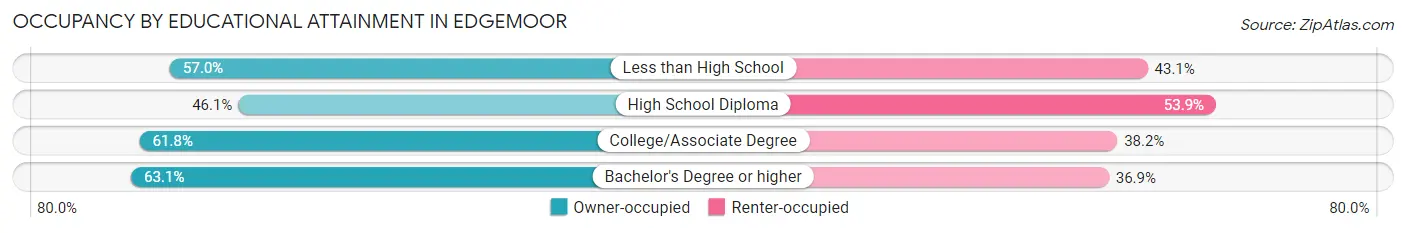
| Household Size | Owner-occupied | Renter-occupied |
| Less than High School | 86 (57.0%) | 65 (43.0%) |
| High School Diploma | 363 (46.1%) | 424 (53.9%) |
| College/Associate Degree | 551 (61.8%) | 341 (38.2%) |
| Bachelor's Degree or higher | 758 (63.1%) | 443 (36.9%) |
Occupancy by Age of Householder in Edgemoor
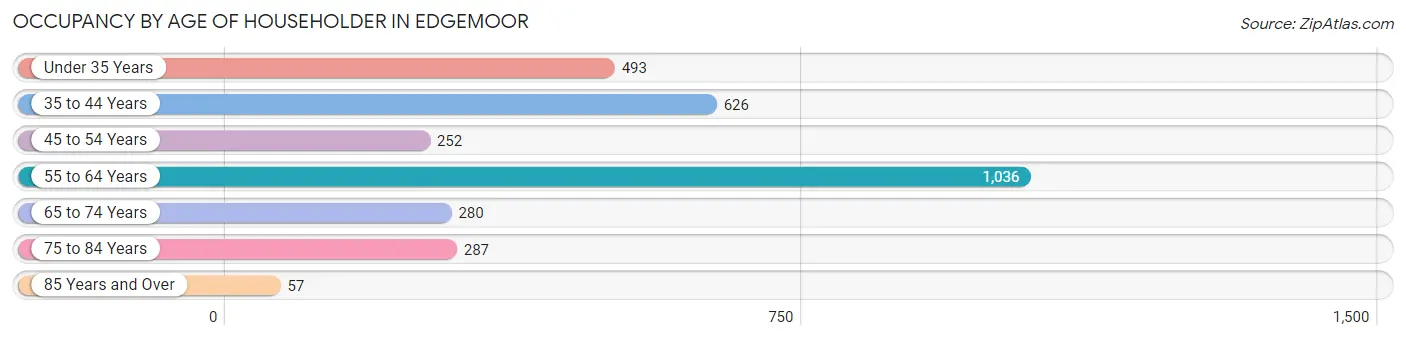
| Age Bracket | # Households | % Households |
| Under 35 Years | 493 | 16.3% |
| 35 to 44 Years | 626 | 20.6% |
| 45 to 54 Years | 252 | 8.3% |
| 55 to 64 Years | 1,036 | 34.2% |
| 65 to 74 Years | 280 | 9.2% |
| 75 to 84 Years | 287 | 9.5% |
| 85 Years and Over | 57 | 1.9% |
| Total | 3,031 | 100.0% |
Housing Finances in Edgemoor
Median Income by Occupancy in Edgemoor
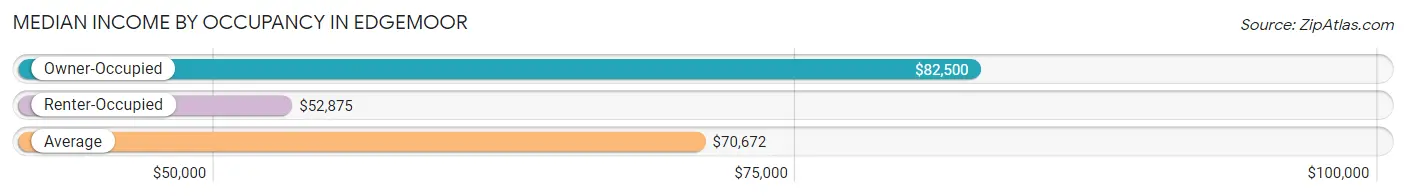
| Occupancy Type | # Households | Median Income |
| Owner-Occupied | 1,758 (58.0%) | $82,500 |
| Renter-Occupied | 1,273 (42.0%) | $52,875 |
| Average | 3,031 (100.0%) | $70,672 |
Occupancy by Householder Income Bracket in Edgemoor
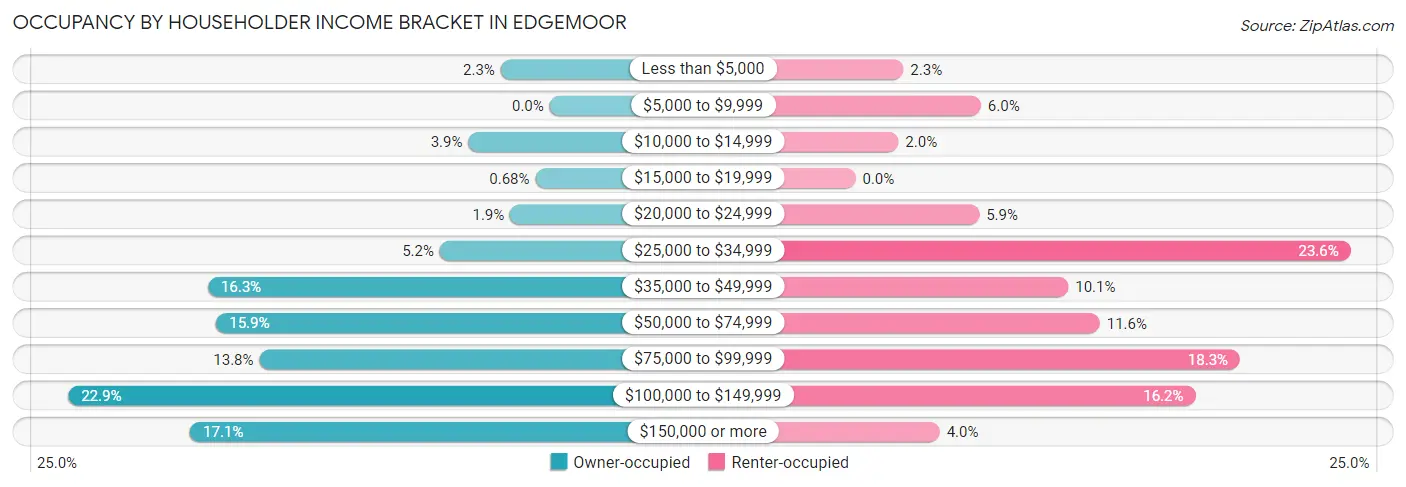
| Income Bracket | Owner-occupied | Renter-occupied |
| Less than $5,000 | 41 (2.3%) | 29 (2.3%) |
| $5,000 to $9,999 | 0 (0.0%) | 76 (6.0%) |
| $10,000 to $14,999 | 68 (3.9%) | 26 (2.0%) |
| $15,000 to $19,999 | 12 (0.7%) | 0 (0.0%) |
| $20,000 to $24,999 | 33 (1.9%) | 75 (5.9%) |
| $25,000 to $34,999 | 92 (5.2%) | 300 (23.6%) |
| $35,000 to $49,999 | 286 (16.3%) | 129 (10.1%) |
| $50,000 to $74,999 | 279 (15.9%) | 148 (11.6%) |
| $75,000 to $99,999 | 243 (13.8%) | 233 (18.3%) |
| $100,000 to $149,999 | 403 (22.9%) | 206 (16.2%) |
| $150,000 or more | 301 (17.1%) | 51 (4.0%) |
| Total | 1,758 (100.0%) | 1,273 (100.0%) |
Monthly Housing Cost Tiers in Edgemoor
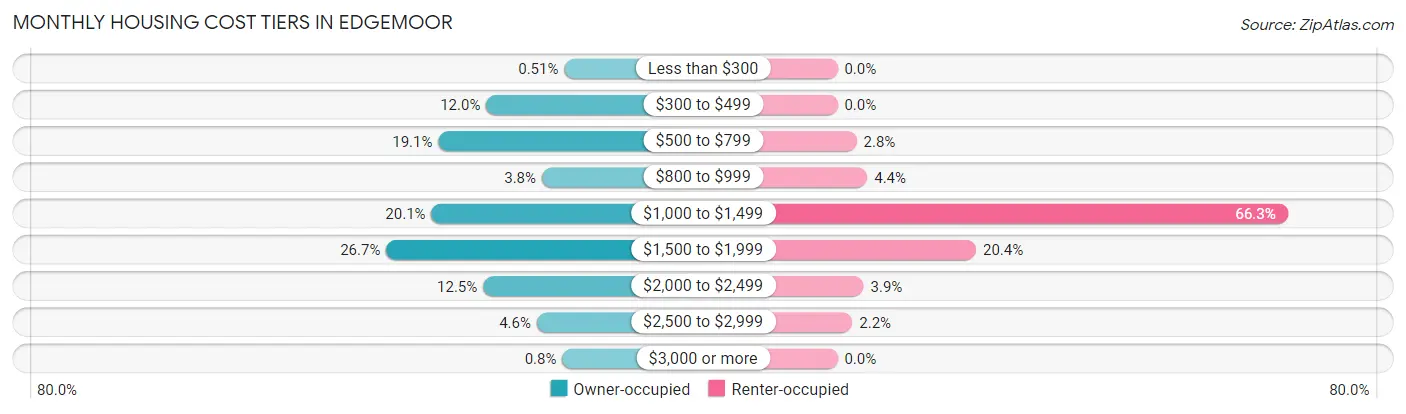
| Monthly Cost | Owner-occupied | Renter-occupied |
| Less than $300 | 9 (0.5%) | 0 (0.0%) |
| $300 to $499 | 211 (12.0%) | 0 (0.0%) |
| $500 to $799 | 335 (19.1%) | 36 (2.8%) |
| $800 to $999 | 67 (3.8%) | 56 (4.4%) |
| $1,000 to $1,499 | 353 (20.1%) | 844 (66.3%) |
| $1,500 to $1,999 | 470 (26.7%) | 260 (20.4%) |
| $2,000 to $2,499 | 219 (12.5%) | 49 (3.8%) |
| $2,500 to $2,999 | 80 (4.5%) | 28 (2.2%) |
| $3,000 or more | 14 (0.8%) | 0 (0.0%) |
| Total | 1,758 (100.0%) | 1,273 (100.0%) |
Physical Housing Characteristics in Edgemoor
Housing Structures in Edgemoor
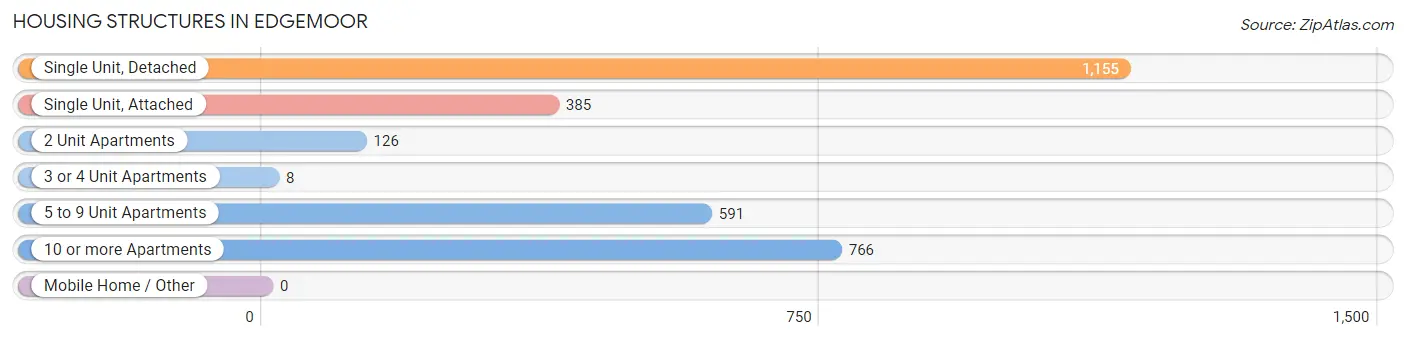
| Structure Type | # Housing Units | % Housing Units |
| Single Unit, Detached | 1,155 | 38.1% |
| Single Unit, Attached | 385 | 12.7% |
| 2 Unit Apartments | 126 | 4.2% |
| 3 or 4 Unit Apartments | 8 | 0.3% |
| 5 to 9 Unit Apartments | 591 | 19.5% |
| 10 or more Apartments | 766 | 25.3% |
| Mobile Home / Other | 0 | 0.0% |
| Total | 3,031 | 100.0% |
Housing Structures by Occupancy in Edgemoor
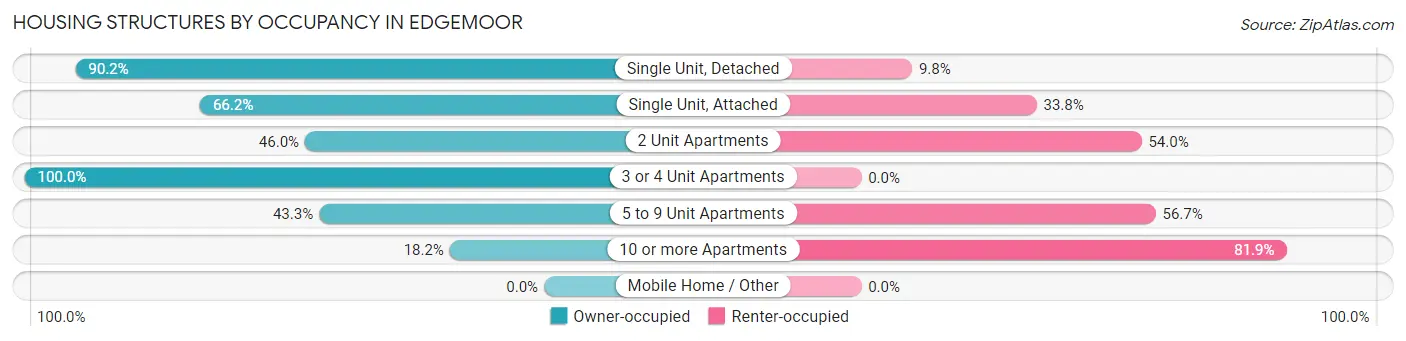
| Structure Type | Owner-occupied | Renter-occupied |
| Single Unit, Detached | 1,042 (90.2%) | 113 (9.8%) |
| Single Unit, Attached | 255 (66.2%) | 130 (33.8%) |
| 2 Unit Apartments | 58 (46.0%) | 68 (54.0%) |
| 3 or 4 Unit Apartments | 8 (100.0%) | 0 (0.0%) |
| 5 to 9 Unit Apartments | 256 (43.3%) | 335 (56.7%) |
| 10 or more Apartments | 139 (18.1%) | 627 (81.9%) |
| Mobile Home / Other | 0 (0.0%) | 0 (0.0%) |
| Total | 1,758 (58.0%) | 1,273 (42.0%) |
Housing Structures by Number of Rooms in Edgemoor
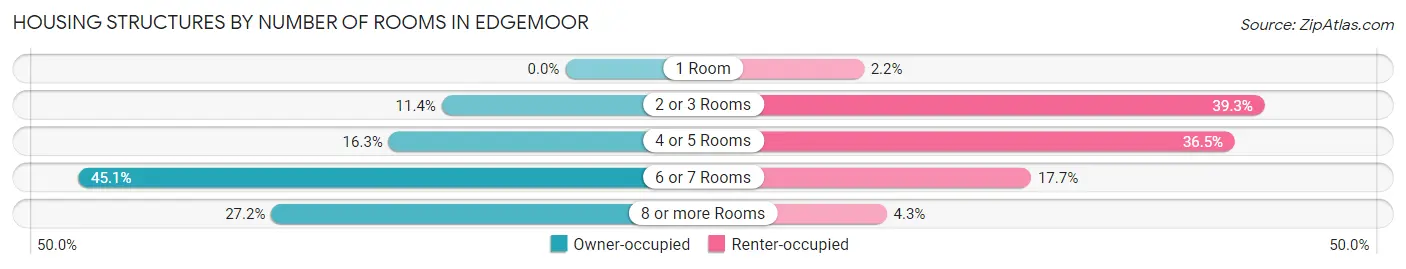
| Number of Rooms | Owner-occupied | Renter-occupied |
| 1 Room | 0 (0.0%) | 28 (2.2%) |
| 2 or 3 Rooms | 201 (11.4%) | 500 (39.3%) |
| 4 or 5 Rooms | 287 (16.3%) | 465 (36.5%) |
| 6 or 7 Rooms | 792 (45.1%) | 225 (17.7%) |
| 8 or more Rooms | 478 (27.2%) | 55 (4.3%) |
| Total | 1,758 (100.0%) | 1,273 (100.0%) |
Housing Structure by Heating Type in Edgemoor
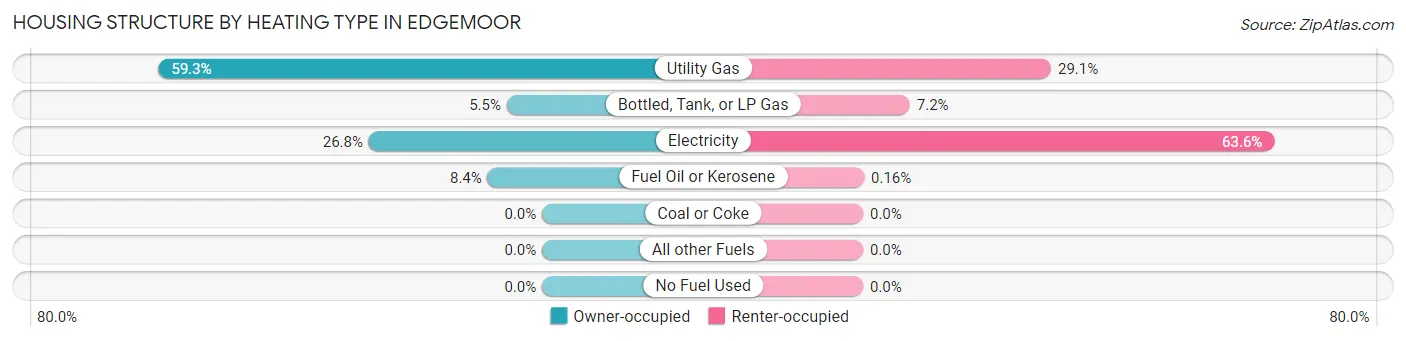
| Heating Type | Owner-occupied | Renter-occupied |
| Utility Gas | 1,043 (59.3%) | 370 (29.1%) |
| Bottled, Tank, or LP Gas | 96 (5.5%) | 92 (7.2%) |
| Electricity | 471 (26.8%) | 809 (63.5%) |
| Fuel Oil or Kerosene | 148 (8.4%) | 2 (0.2%) |
| Coal or Coke | 0 (0.0%) | 0 (0.0%) |
| All other Fuels | 0 (0.0%) | 0 (0.0%) |
| No Fuel Used | 0 (0.0%) | 0 (0.0%) |
| Total | 1,758 (100.0%) | 1,273 (100.0%) |
Household Vehicle Usage in Edgemoor
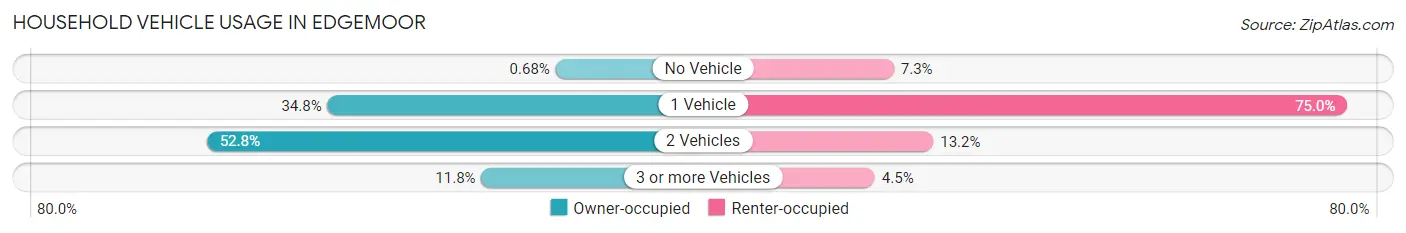
| Vehicles per Household | Owner-occupied | Renter-occupied |
| No Vehicle | 12 (0.7%) | 93 (7.3%) |
| 1 Vehicle | 611 (34.8%) | 955 (75.0%) |
| 2 Vehicles | 928 (52.8%) | 168 (13.2%) |
| 3 or more Vehicles | 207 (11.8%) | 57 (4.5%) |
| Total | 1,758 (100.0%) | 1,273 (100.0%) |
Real Estate & Mortgages in Edgemoor
Real Estate and Mortgage Overview in Edgemoor
| Characteristic | Without Mortgage | With Mortgage |
| Housing Units | 610 | 1,148 |
| Median Property Value | $259,700 | $310,800 |
| Median Household Income | $95,724 | $175 |
| Monthly Housing Costs | $620 | $14 |
| Real Estate Taxes | $2,155 | $12 |
Property Value by Mortgage Status in Edgemoor
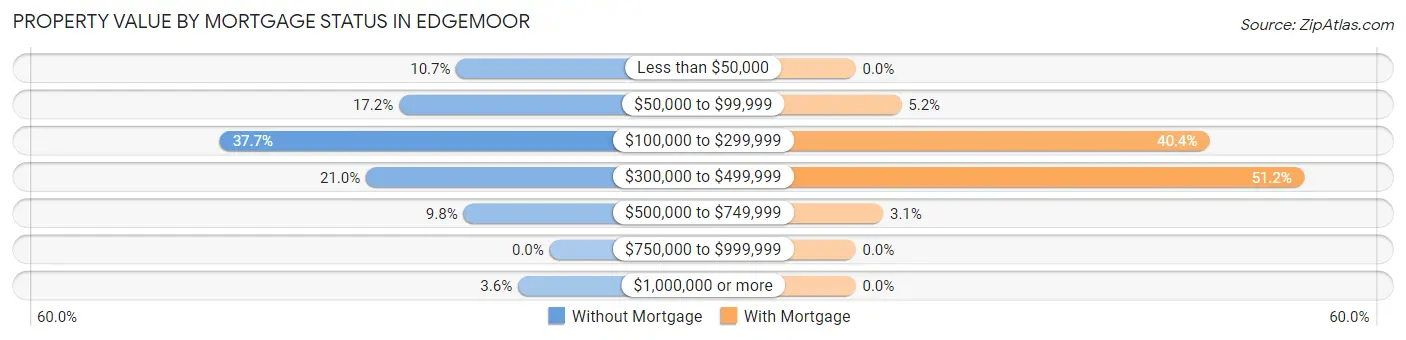
| Property Value | Without Mortgage | With Mortgage |
| Less than $50,000 | 65 (10.7%) | 0 (0.0%) |
| $50,000 to $99,999 | 105 (17.2%) | 60 (5.2%) |
| $100,000 to $299,999 | 230 (37.7%) | 464 (40.4%) |
| $300,000 to $499,999 | 128 (21.0%) | 588 (51.2%) |
| $500,000 to $749,999 | 60 (9.8%) | 36 (3.1%) |
| $750,000 to $999,999 | 0 (0.0%) | 0 (0.0%) |
| $1,000,000 or more | 22 (3.6%) | 0 (0.0%) |
| Total | 610 (100.0%) | 1,148 (100.0%) |
Household Income by Mortgage Status in Edgemoor
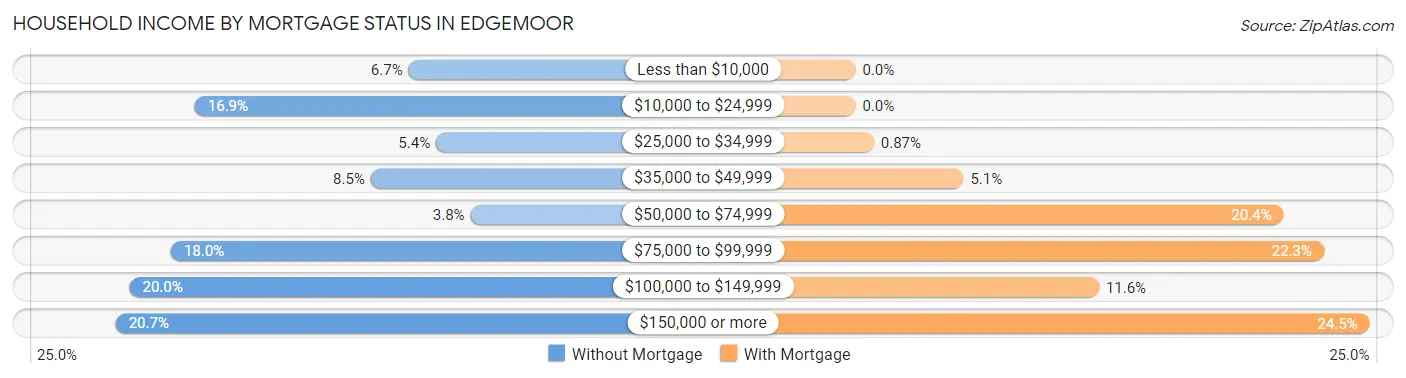
| Household Income | Without Mortgage | With Mortgage |
| Less than $10,000 | 41 (6.7%) | 0 (0.0%) |
| $10,000 to $24,999 | 103 (16.9%) | 0 (0.0%) |
| $25,000 to $34,999 | 33 (5.4%) | 10 (0.9%) |
| $35,000 to $49,999 | 52 (8.5%) | 59 (5.1%) |
| $50,000 to $74,999 | 23 (3.8%) | 234 (20.4%) |
| $75,000 to $99,999 | 110 (18.0%) | 256 (22.3%) |
| $100,000 to $149,999 | 122 (20.0%) | 133 (11.6%) |
| $150,000 or more | 126 (20.7%) | 281 (24.5%) |
| Total | 610 (100.0%) | 1,148 (100.0%) |
Property Value to Household Income Ratio in Edgemoor
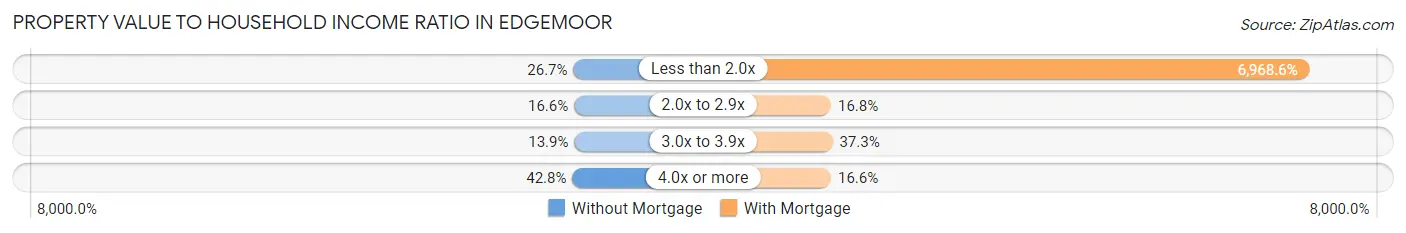
| Value-to-Income Ratio | Without Mortgage | With Mortgage |
| Less than 2.0x | 163 (26.7%) | 80,000 (6,968.6%) |
| 2.0x to 2.9x | 101 (16.6%) | 193 (16.8%) |
| 3.0x to 3.9x | 85 (13.9%) | 428 (37.3%) |
| 4.0x or more | 261 (42.8%) | 190 (16.6%) |
| Total | 610 (100.0%) | 1,148 (100.0%) |
Real Estate Taxes by Mortgage Status in Edgemoor
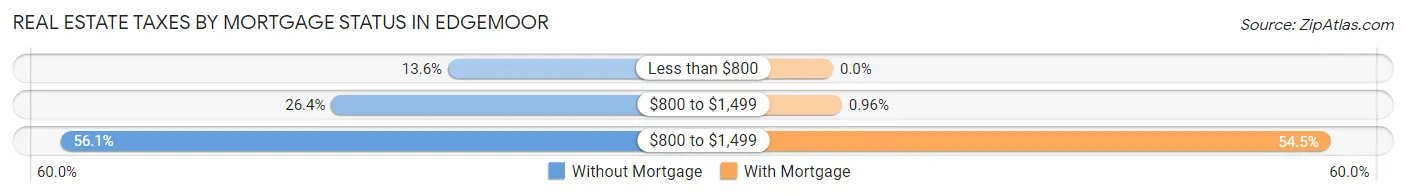
| Property Taxes | Without Mortgage | With Mortgage |
| Less than $800 | 83 (13.6%) | 0 (0.0%) |
| $800 to $1,499 | 161 (26.4%) | 11 (1.0%) |
| $800 to $1,499 | 342 (56.1%) | 626 (54.5%) |
| Total | 610 (100.0%) | 1,148 (100.0%) |
Health & Disability in Edgemoor
Health Insurance Coverage by Age in Edgemoor
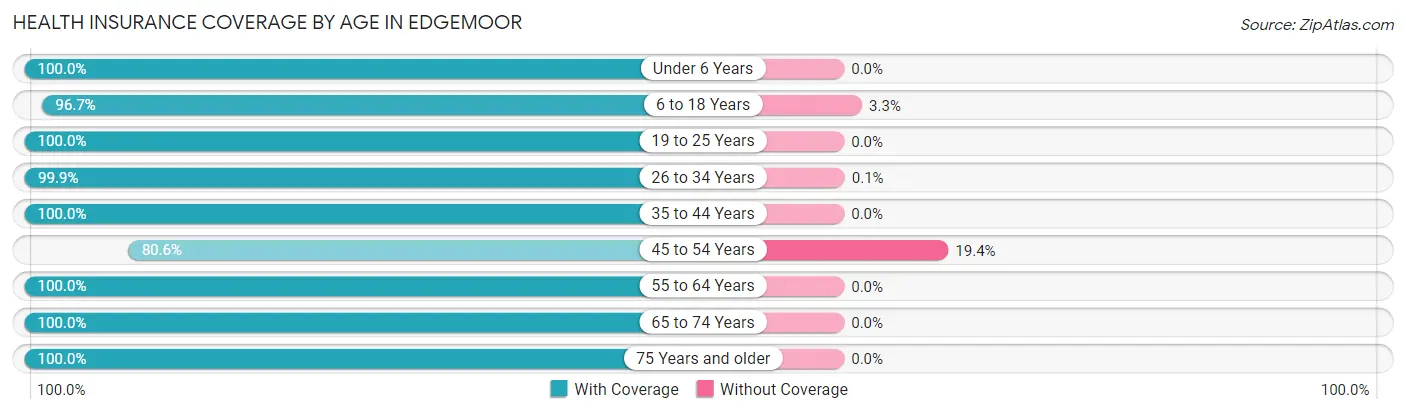
| Age Bracket | With Coverage | Without Coverage |
| Under 6 Years | 463 (100.0%) | 0 (0.0%) |
| 6 to 18 Years | 842 (96.7%) | 29 (3.3%) |
| 19 to 25 Years | 343 (100.0%) | 0 (0.0%) |
| 26 to 34 Years | 1,035 (99.9%) | 1 (0.1%) |
| 35 to 44 Years | 915 (100.0%) | 0 (0.0%) |
| 45 to 54 Years | 419 (80.6%) | 101 (19.4%) |
| 55 to 64 Years | 1,506 (100.0%) | 0 (0.0%) |
| 65 to 74 Years | 423 (100.0%) | 0 (0.0%) |
| 75 Years and older | 408 (100.0%) | 0 (0.0%) |
| Total | 6,354 (98.0%) | 131 (2.0%) |
Health Insurance Coverage by Citizenship Status in Edgemoor
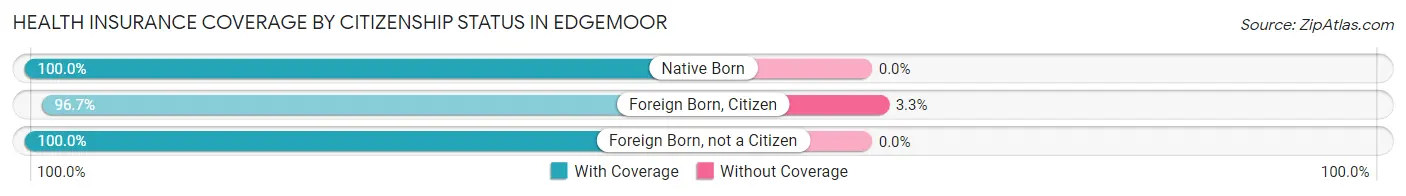
| Citizenship Status | With Coverage | Without Coverage |
| Native Born | 463 (100.0%) | 0 (0.0%) |
| Foreign Born, Citizen | 842 (96.7%) | 29 (3.3%) |
| Foreign Born, not a Citizen | 343 (100.0%) | 0 (0.0%) |
Health Insurance Coverage by Household Income in Edgemoor
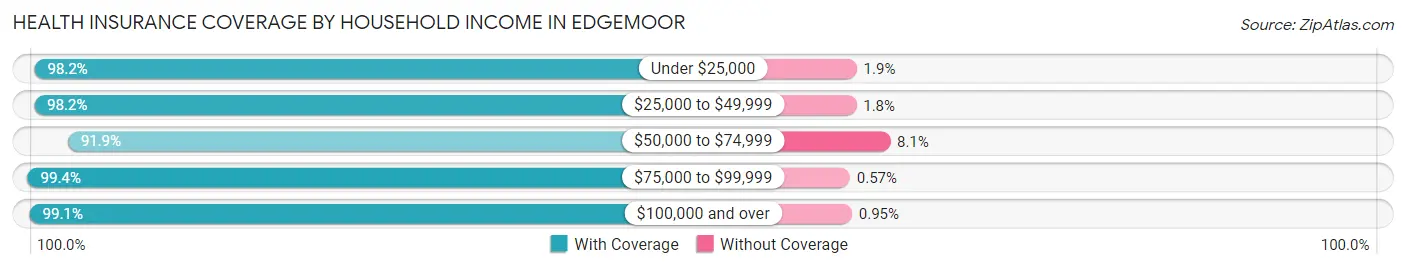
| Household Income | With Coverage | Without Coverage |
| Under $25,000 | 850 (98.2%) | 16 (1.8%) |
| $25,000 to $49,999 | 1,376 (98.2%) | 25 (1.8%) |
| $50,000 to $74,999 | 681 (91.9%) | 60 (8.1%) |
| $75,000 to $99,999 | 1,047 (99.4%) | 6 (0.6%) |
| $100,000 and over | 2,394 (99.1%) | 23 (0.9%) |
Public vs Private Health Insurance Coverage by Age in Edgemoor
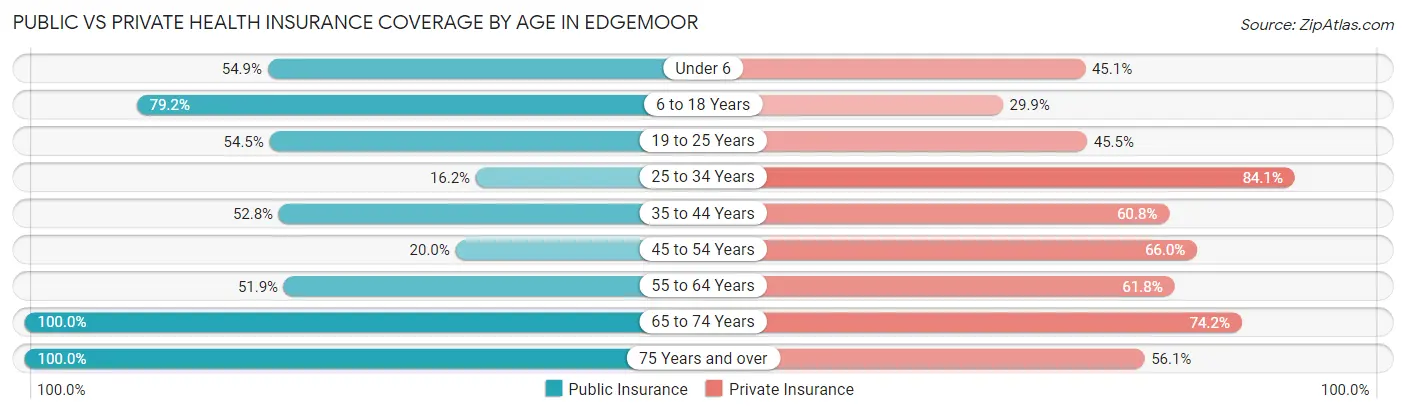
| Age Bracket | Public Insurance | Private Insurance |
| Under 6 | 254 (54.9%) | 209 (45.1%) |
| 6 to 18 Years | 690 (79.2%) | 260 (29.8%) |
| 19 to 25 Years | 187 (54.5%) | 156 (45.5%) |
| 25 to 34 Years | 168 (16.2%) | 871 (84.1%) |
| 35 to 44 Years | 483 (52.8%) | 556 (60.8%) |
| 45 to 54 Years | 104 (20.0%) | 343 (66.0%) |
| 55 to 64 Years | 781 (51.9%) | 930 (61.8%) |
| 65 to 74 Years | 423 (100.0%) | 314 (74.2%) |
| 75 Years and over | 408 (100.0%) | 229 (56.1%) |
| Total | 3,498 (53.9%) | 3,868 (59.7%) |
Disability Status by Sex by Age in Edgemoor
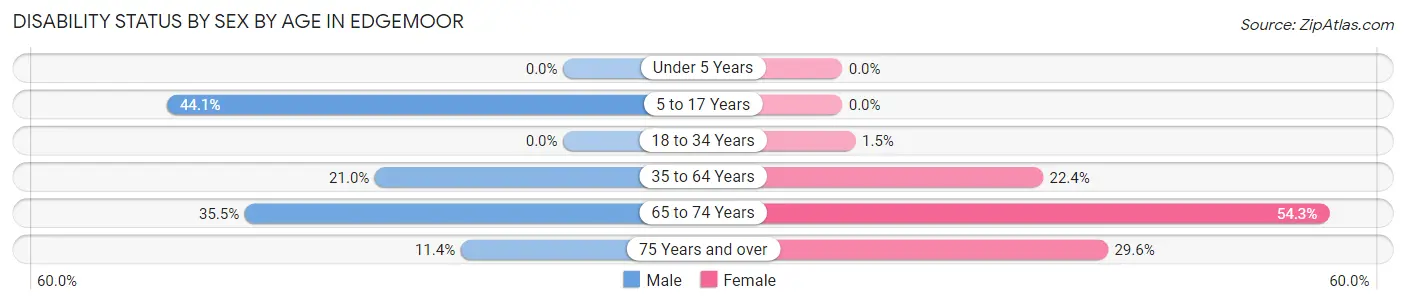
| Age Bracket | Male | Female |
| Under 5 Years | 0 (0.0%) | 0 (0.0%) |
| 5 to 17 Years | 271 (44.1%) | 0 (0.0%) |
| 18 to 34 Years | 0 (0.0%) | 12 (1.5%) |
| 35 to 64 Years | 339 (21.0%) | 296 (22.4%) |
| 65 to 74 Years | 67 (35.4%) | 127 (54.3%) |
| 75 Years and over | 13 (11.4%) | 87 (29.6%) |
Disability Class by Sex by Age in Edgemoor
Disability Class: Hearing Difficulty
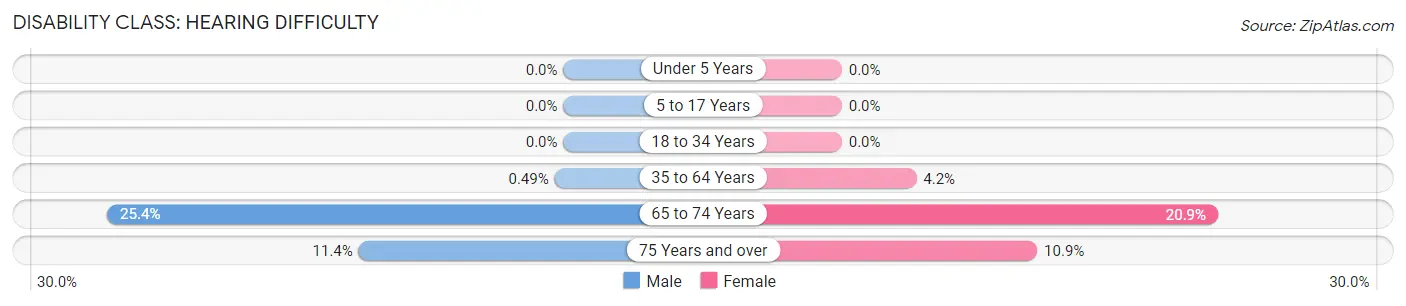
| Age Bracket | Male | Female |
| Under 5 Years | 0 (0.0%) | 0 (0.0%) |
| 5 to 17 Years | 0 (0.0%) | 0 (0.0%) |
| 18 to 34 Years | 0 (0.0%) | 0 (0.0%) |
| 35 to 64 Years | 8 (0.5%) | 55 (4.2%) |
| 65 to 74 Years | 48 (25.4%) | 49 (20.9%) |
| 75 Years and over | 13 (11.4%) | 32 (10.9%) |
Disability Class: Vision Difficulty
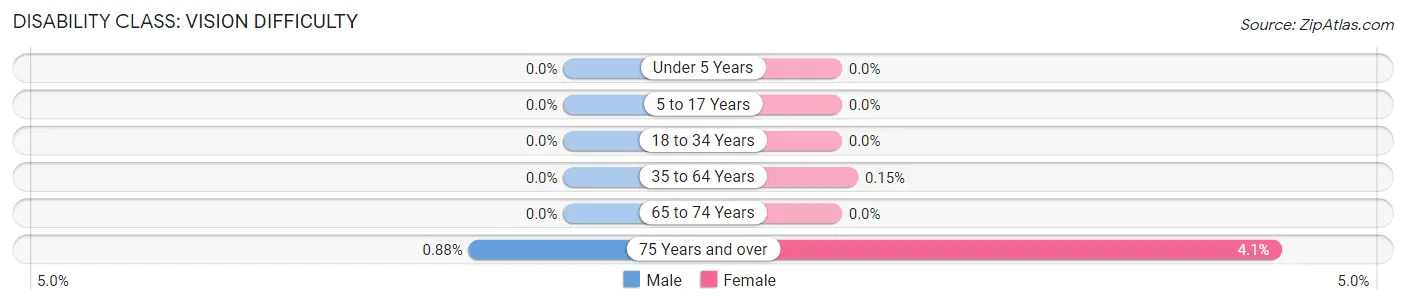
| Age Bracket | Male | Female |
| Under 5 Years | 0 (0.0%) | 0 (0.0%) |
| 5 to 17 Years | 0 (0.0%) | 0 (0.0%) |
| 18 to 34 Years | 0 (0.0%) | 0 (0.0%) |
| 35 to 64 Years | 0 (0.0%) | 2 (0.2%) |
| 65 to 74 Years | 0 (0.0%) | 0 (0.0%) |
| 75 Years and over | 1 (0.9%) | 12 (4.1%) |
Disability Class: Cognitive Difficulty
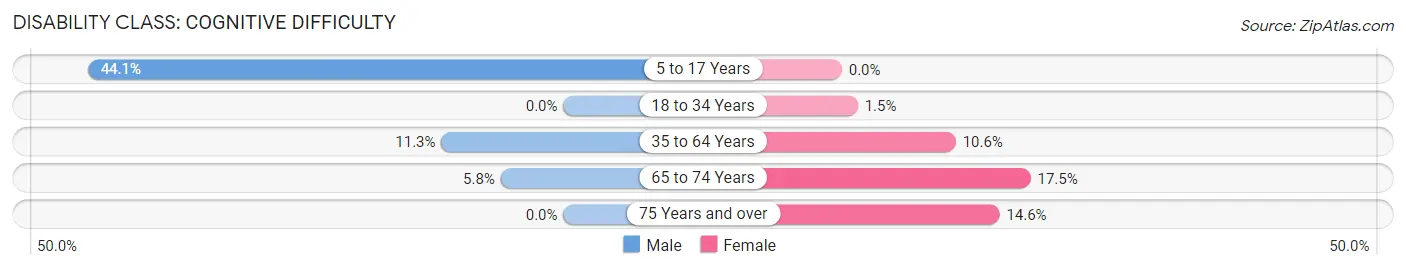
| Age Bracket | Male | Female |
| 5 to 17 Years | 271 (44.1%) | 0 (0.0%) |
| 18 to 34 Years | 0 (0.0%) | 12 (1.5%) |
| 35 to 64 Years | 183 (11.3%) | 140 (10.6%) |
| 65 to 74 Years | 11 (5.8%) | 41 (17.5%) |
| 75 Years and over | 0 (0.0%) | 43 (14.6%) |
Disability Class: Ambulatory Difficulty
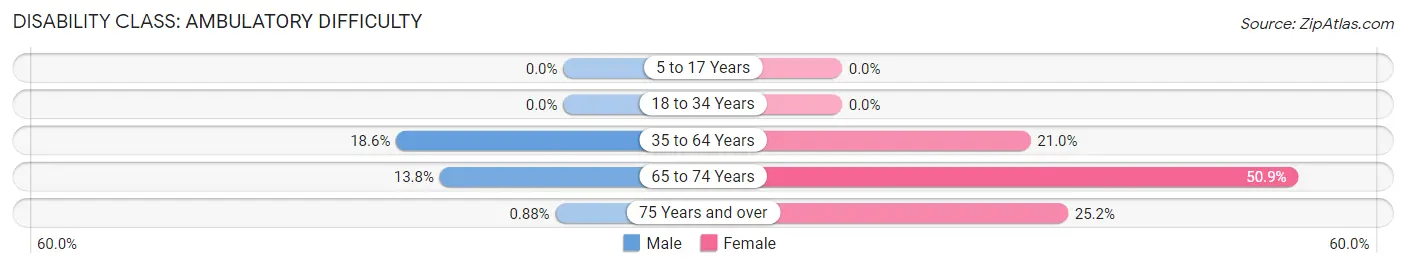
| Age Bracket | Male | Female |
| 5 to 17 Years | 0 (0.0%) | 0 (0.0%) |
| 18 to 34 Years | 0 (0.0%) | 0 (0.0%) |
| 35 to 64 Years | 301 (18.6%) | 278 (21.0%) |
| 65 to 74 Years | 26 (13.8%) | 119 (50.8%) |
| 75 Years and over | 1 (0.9%) | 74 (25.2%) |
Disability Class: Self-Care Difficulty
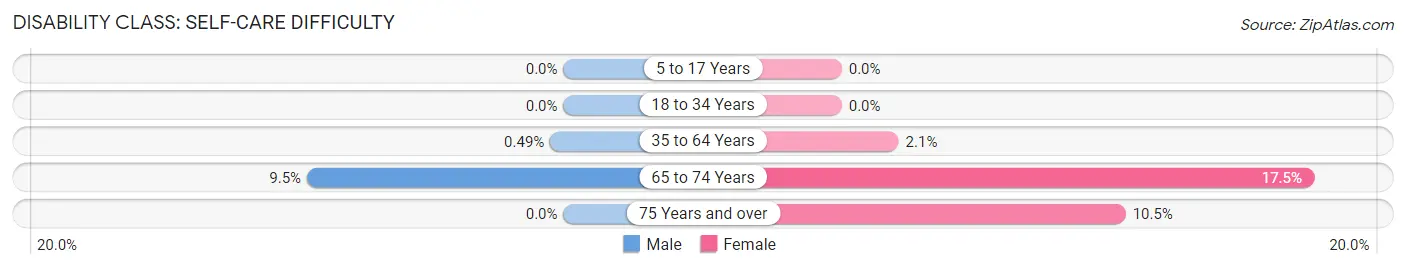
| Age Bracket | Male | Female |
| 5 to 17 Years | 0 (0.0%) | 0 (0.0%) |
| 18 to 34 Years | 0 (0.0%) | 0 (0.0%) |
| 35 to 64 Years | 8 (0.5%) | 28 (2.1%) |
| 65 to 74 Years | 18 (9.5%) | 41 (17.5%) |
| 75 Years and over | 0 (0.0%) | 31 (10.5%) |
Technology Access in Edgemoor
Computing Device Access in Edgemoor
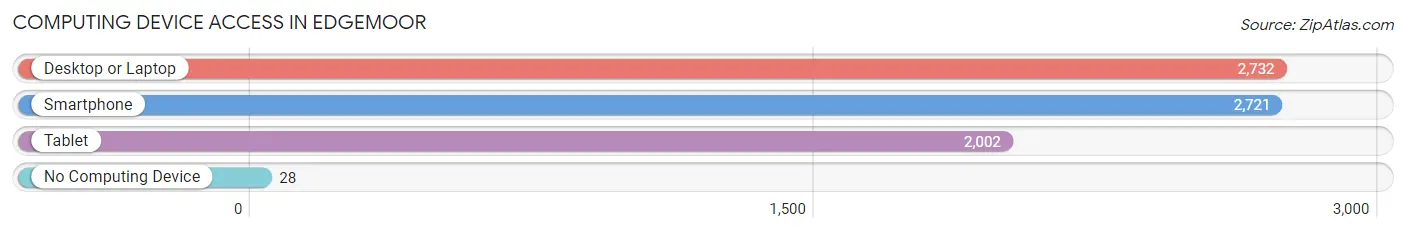
| Device Type | # Households | % Households |
| Desktop or Laptop | 2,732 | 90.1% |
| Smartphone | 2,721 | 89.8% |
| Tablet | 2,002 | 66.0% |
| No Computing Device | 28 | 0.9% |
| Total | 3,031 | 100.0% |
Internet Access in Edgemoor
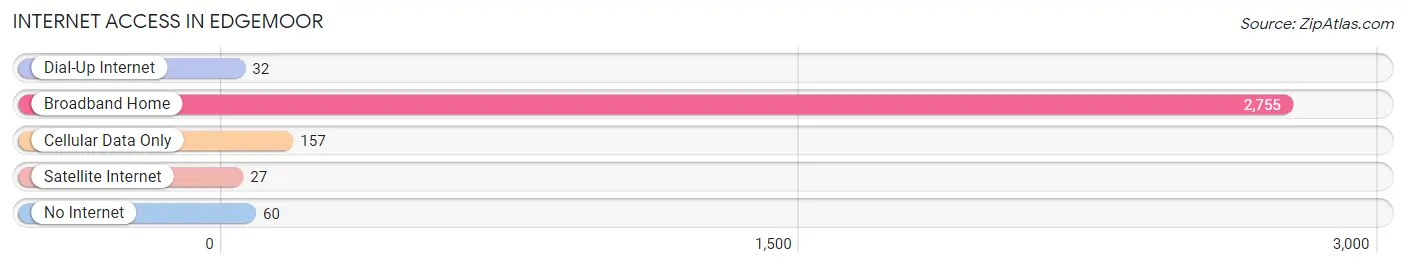
| Internet Type | # Households | % Households |
| Dial-Up Internet | 32 | 1.1% |
| Broadband Home | 2,755 | 90.9% |
| Cellular Data Only | 157 | 5.2% |
| Satellite Internet | 27 | 0.9% |
| No Internet | 60 | 2.0% |
| Total | 3,031 | 100.0% |
Edgemoor Summary
Edgemoor is a small unincorporated community located in New Castle County, Delaware. It is situated on the Delaware River, just south of Wilmington. The community is part of the Wilmington Metropolitan Statistical Area.
History
Edgemoor was first settled in the late 17th century by Dutch and Swedish settlers. The area was originally known as "Edge Moor" and was part of the original land grant given to William Penn in 1682. The area was primarily used for farming and fishing until the early 19th century when the Delaware and Chesapeake Canal was built. The canal brought increased economic activity to the area and the community began to grow.
In 1868, the Edgemoor Iron Works was established and the community began to develop into an industrial center. The iron works produced a variety of products, including railroad cars, bridges, and ships. The iron works closed in the early 20th century, but the community continued to grow.
In the 1950s, Edgemoor was annexed by the City of Wilmington. The annexation allowed the community to benefit from the city's infrastructure and services.
Geography
Edgemoor is located in New Castle County, Delaware. It is situated on the Delaware River, just south of Wilmington. The community is part of the Wilmington Metropolitan Statistical Area.
The community is bordered by the Delaware River to the east, the City of Wilmington to the north, and the unincorporated community of Bellefonte to the south. The community is located approximately 8 miles south of downtown Wilmington and is accessible via Interstate 95 and Delaware Route 9.
Economy
Edgemoor is primarily a residential community, but it does have some commercial and industrial businesses. The community is home to several small businesses, including a grocery store, a gas station, and a few restaurants.
The community is also home to the Edgemoor Industrial Park, which is home to several large companies, including DuPont, AstraZeneca, and Bank of America. The industrial park is a major employer in the area and provides jobs for many of the residents of Edgemoor.
Demographics
As of the 2010 census, the population of Edgemoor was 2,845. The racial makeup of the community was 79.3% White, 15.2% African American, 0.7% Native American, 1.2% Asian, and 3.6% from other races. The median household income was $50,945 and the median family income was $60,945.
The majority of the population is employed in the service industry, with the largest employers being the Edgemoor Industrial Park and the City of Wilmington. The community also has a large number of retirees, as well as a growing number of young professionals.
Conclusion
Edgemoor is a small unincorporated community located in New Castle County, Delaware. It is situated on the Delaware River, just south of Wilmington. The community is part of the Wilmington Metropolitan Statistical Area. Edgemoor was first settled in the late 17th century and has since grown into a residential community with some commercial and industrial businesses. The community is home to the Edgemoor Industrial Park, which is a major employer in the area. As of the 2010 census, the population of Edgemoor was 2,845. The majority of the population is employed in the service industry, with the largest employers being the Edgemoor Industrial Park and the City of Wilmington.
Common Questions
What is Per Capita Income in Edgemoor?
Per Capita income in Edgemoor is $40,072.
What is the Median Family Income in Edgemoor?
Median Family Income in Edgemoor is $80,944.
What is the Median Household income in Edgemoor?
Median Household Income in Edgemoor is $70,672.
What is Income or Wage Gap in Edgemoor?
Income or Wage Gap in Edgemoor is 14.8%.
Women in Edgemoor earn 85.2 cents for every dollar earned by a man.
What is Inequality or Gini Index in Edgemoor?
Inequality or Gini Index in Edgemoor is 0.40.
What is the Total Population of Edgemoor?
Total Population of Edgemoor is 6,485.
What is the Total Male Population of Edgemoor?
Total Male Population of Edgemoor is 3,463.
What is the Total Female Population of Edgemoor?
Total Female Population of Edgemoor is 3,022.
What is the Ratio of Males per 100 Females in Edgemoor?
There are 114.59 Males per 100 Females in Edgemoor.
What is the Ratio of Females per 100 Males in Edgemoor?
There are 87.27 Females per 100 Males in Edgemoor.
What is the Median Population Age in Edgemoor?
Median Population Age in Edgemoor is 40.8 Years.
What is the Average Family Size in Edgemoor
Average Family Size in Edgemoor is 2.8 People.
What is the Average Household Size in Edgemoor
Average Household Size in Edgemoor is 2.1 People.
How Large is the Labor Force in Edgemoor?
There are 3,641 People in the Labor Forcein in Edgemoor.
What is the Percentage of People in the Labor Force in Edgemoor?
69.3% of People are in the Labor Force in Edgemoor.
What is the Unemployment Rate in Edgemoor?
Unemployment Rate in Edgemoor is 5.6%.