Harrington, DE Map & Demographics
Harrington Map
Harrington Overview
$27,550
PER CAPITA INCOME
$85,267
AVG FAMILY INCOME
$63,814
AVG HOUSEHOLD INCOME
18.6%
WAGE / INCOME GAP [ % ]
81.4¢/ $1
WAGE / INCOME GAP [ $ ]
0.37
INEQUALITY / GINI INDEX
3,770
TOTAL POPULATION
1,668
MALE POPULATION
2,102
FEMALE POPULATION
79.35
MALES / 100 FEMALES
126.02
FEMALES / 100 MALES
28.7
MEDIAN AGE
3.6
AVG FAMILY SIZE
2.6
AVG HOUSEHOLD SIZE
1,931
LABOR FORCE [ PEOPLE ]
76.8%
PERCENT IN LABOR FORCE
5.0%
UNEMPLOYMENT RATE
Harrington Zip Codes
Harrington Area Codes
Income in Harrington
Income Overview in Harrington
Per Capita Income in Harrington is $27,550, while median incomes of families and households are $85,267 and $63,814 respectively.
| Characteristic | Number | Measure |
| Per Capita Income | 3,770 | $27,550 |
| Median Family Income | 864 | $85,267 |
| Mean Family Income | 864 | $85,354 |
| Median Household Income | 1,458 | $63,814 |
| Mean Household Income | 1,458 | $71,136 |
| Income Deficit | 864 | $0 |
| Wage / Income Gap (%) | 3,770 | 18.56% |
| Wage / Income Gap ($) | 3,770 | 81.44¢ per $1 |
| Gini / Inequality Index | 3,770 | 0.37 |
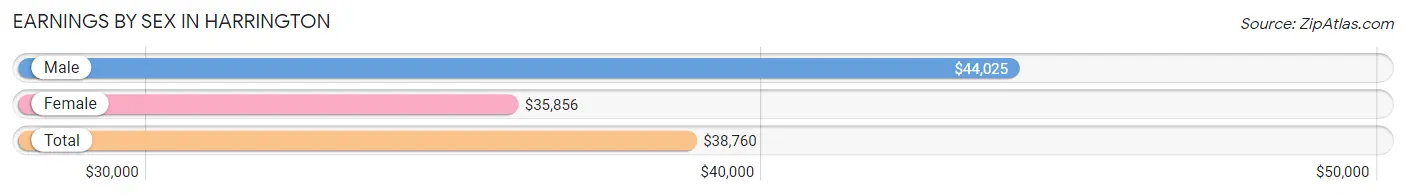
Earnings by Sex in Harrington
Average Earnings in Harrington are $38,760, $44,025 for men and $35,856 for women, a difference of 18.6%.
| Sex | Number | Average Earnings |
| Male | 1,012 (51.3%) | $44,025 |
| Female | 962 (48.7%) | $35,856 |
| Total | 1,974 (100.0%) | $38,760 |
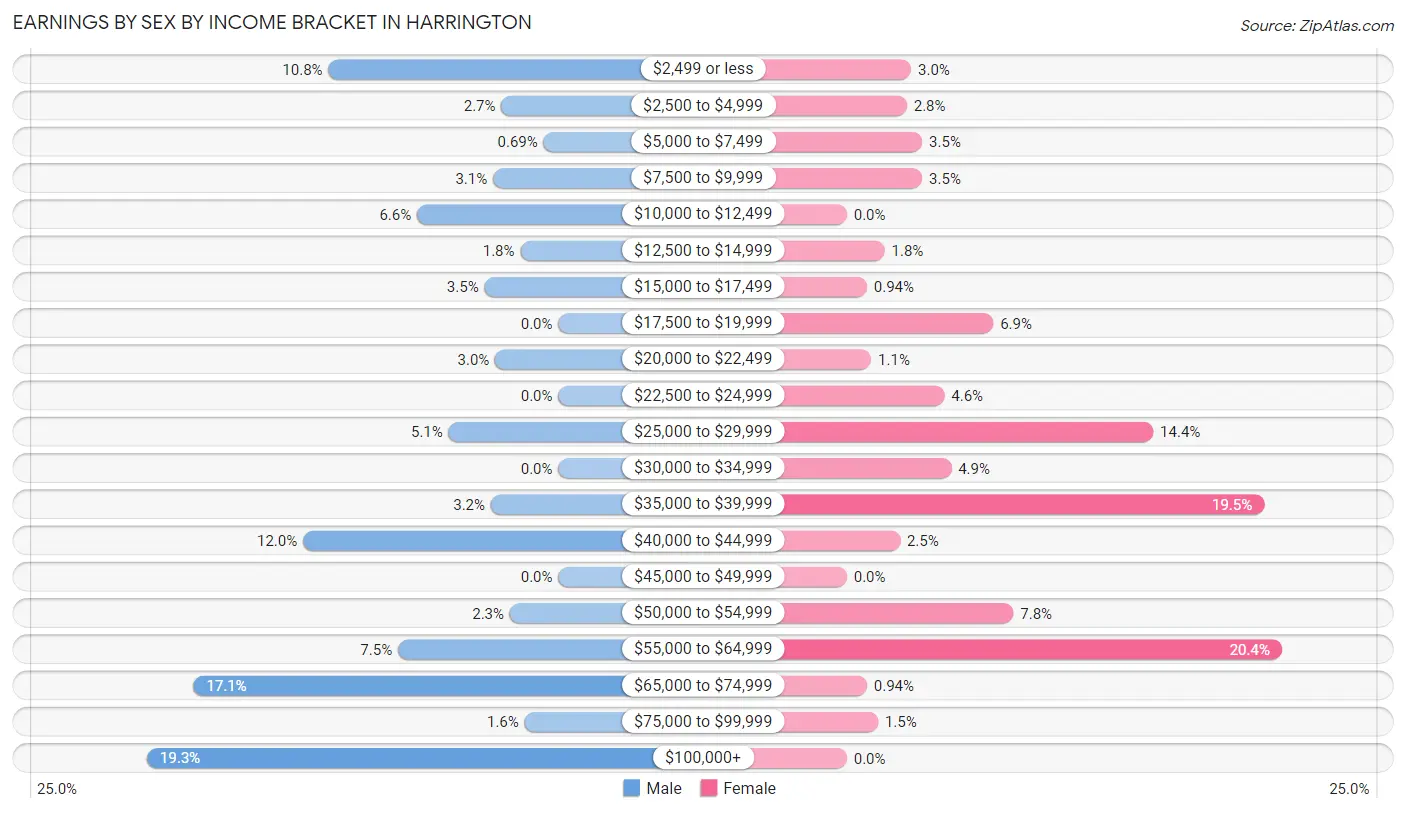
Earnings by Sex by Income Bracket in Harrington
The most common earnings brackets in Harrington are $100,000+ for men (195 | 19.3%) and $55,000 to $64,999 for women (196 | 20.4%).
| Income | Male | Female |
| $2,499 or less | 109 (10.8%) | 29 (3.0%) |
| $2,500 to $4,999 | 27 (2.7%) | 27 (2.8%) |
| $5,000 to $7,499 | 7 (0.7%) | 34 (3.5%) |
| $7,500 to $9,999 | 31 (3.1%) | 34 (3.5%) |
| $10,000 to $12,499 | 67 (6.6%) | 0 (0.0%) |
| $12,500 to $14,999 | 18 (1.8%) | 17 (1.8%) |
| $15,000 to $17,499 | 35 (3.5%) | 9 (0.9%) |
| $17,500 to $19,999 | 0 (0.0%) | 66 (6.9%) |
| $20,000 to $22,499 | 30 (3.0%) | 11 (1.1%) |
| $22,500 to $24,999 | 0 (0.0%) | 44 (4.6%) |
| $25,000 to $29,999 | 52 (5.1%) | 138 (14.3%) |
| $30,000 to $34,999 | 0 (0.0%) | 47 (4.9%) |
| $35,000 to $39,999 | 32 (3.2%) | 188 (19.5%) |
| $40,000 to $44,999 | 121 (12.0%) | 24 (2.5%) |
| $45,000 to $49,999 | 0 (0.0%) | 0 (0.0%) |
| $50,000 to $54,999 | 23 (2.3%) | 75 (7.8%) |
| $55,000 to $64,999 | 76 (7.5%) | 196 (20.4%) |
| $65,000 to $74,999 | 173 (17.1%) | 9 (0.9%) |
| $75,000 to $99,999 | 16 (1.6%) | 14 (1.5%) |
| $100,000+ | 195 (19.3%) | 0 (0.0%) |
| Total | 1,012 (100.0%) | 962 (100.0%) |
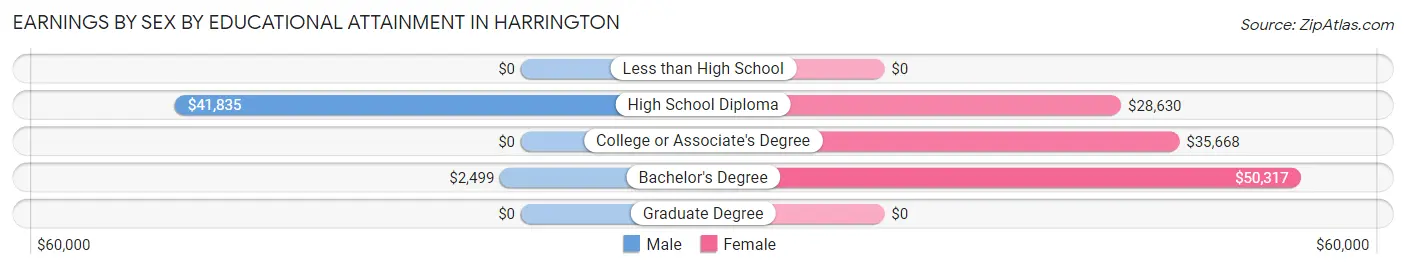
Earnings by Sex by Educational Attainment in Harrington
Average earnings in Harrington are $60,444 for men and $37,140 for women, a difference of 38.6%. Men with an educational attainment of high school diploma enjoy the highest average annual earnings of $41,835, while those with bachelor's degree education earn the least with $2,499. Women with an educational attainment of bachelor's degree earn the most with the average annual earnings of $50,317, while those with high school diploma education have the smallest earnings of $28,630.
| Educational Attainment | Male Income | Female Income |
| Less than High School | - | - |
| High School Diploma | $41,835 | $28,630 |
| College or Associate's Degree | - | - |
| Bachelor's Degree | $2,499 | $50,317 |
| Graduate Degree | - | - |
| Total | $60,444 | $37,140 |
Family Income in Harrington
Family Income Brackets in Harrington
According to the Harrington family income data, there are 224 families falling into the $75,000 to $99,999 income range, which is the most common income bracket and makes up 25.9% of all families. Conversely, the $200,000+ income bracket is the least frequent group with only 5 families (0.6%) belonging to this category.
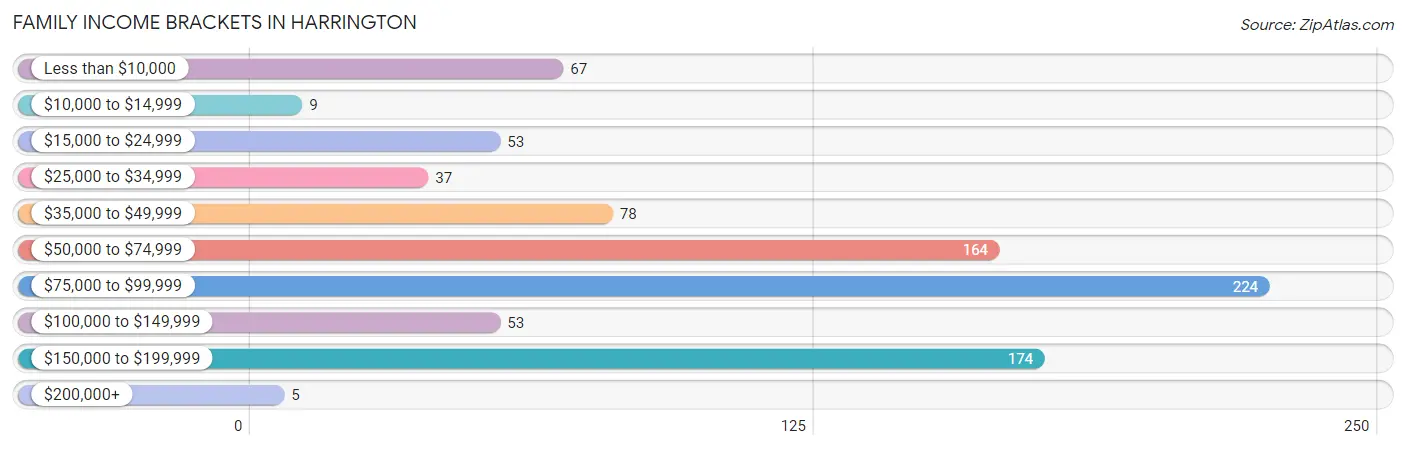
| Income Bracket | # Families | % Families |
| Less than $10,000 | 67 | 7.8% |
| $10,000 to $14,999 | 9 | 1.0% |
| $15,000 to $24,999 | 53 | 6.1% |
| $25,000 to $34,999 | 37 | 4.3% |
| $35,000 to $49,999 | 78 | 9.0% |
| $50,000 to $74,999 | 164 | 19.0% |
| $75,000 to $99,999 | 224 | 25.9% |
| $100,000 to $149,999 | 53 | 6.1% |
| $150,000 to $199,999 | 174 | 20.1% |
| $200,000+ | 5 | 0.6% |
Family Income by Famaliy Size in Harrington
4-person families (239 | 27.7%) account for the highest median family income in Harrington with $86,723 per family, while 2-person families (324 | 37.5%) have the highest median income of $36,406 per family member.
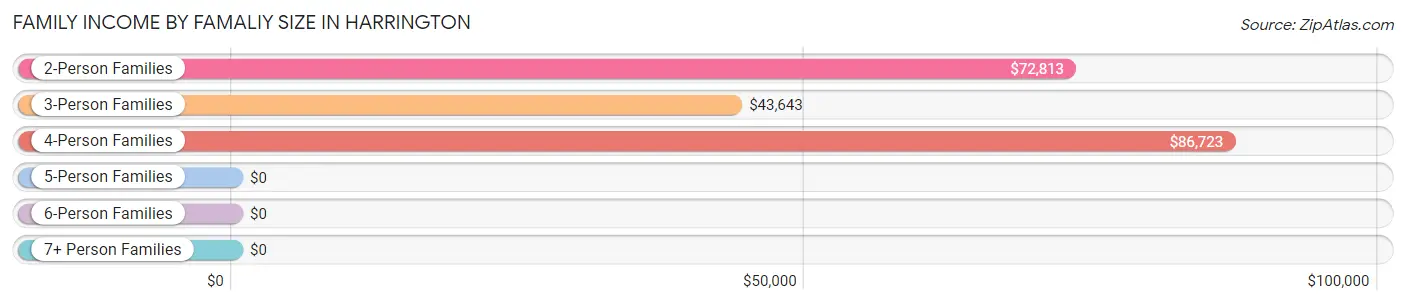
| Income Bracket | # Families | Median Income |
| 2-Person Families | 324 (37.5%) | $72,813 |
| 3-Person Families | 120 (13.9%) | $43,643 |
| 4-Person Families | 239 (27.7%) | $86,723 |
| 5-Person Families | 0 (0.0%) | $0 |
| 6-Person Families | 176 (20.4%) | $0 |
| 7+ Person Families | 5 (0.6%) | $0 |
| Total | 864 (100.0%) | $85,267 |
Family Income by Number of Earners in Harrington
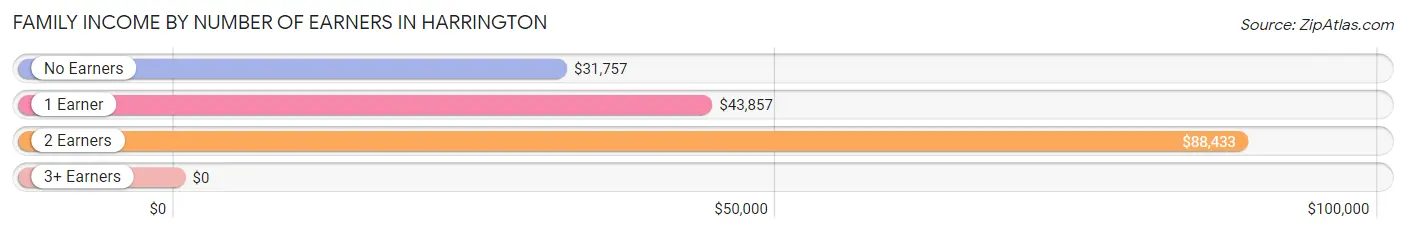
| Number of Earners | # Families | Median Income |
| No Earners | 74 (8.6%) | $31,757 |
| 1 Earner | 246 (28.5%) | $43,857 |
| 2 Earners | 496 (57.4%) | $88,433 |
| 3+ Earners | 48 (5.6%) | $0 |
| Total | 864 (100.0%) | $85,267 |
Household Income in Harrington
Household Income Brackets in Harrington
With 478 households falling in the category, the $50,000 to $74,999 income range is the most frequent in Harrington, accounting for 32.8% of all households. In contrast, only 4 households (0.3%) fall into the $200,000+ income bracket, making it the least populous group.
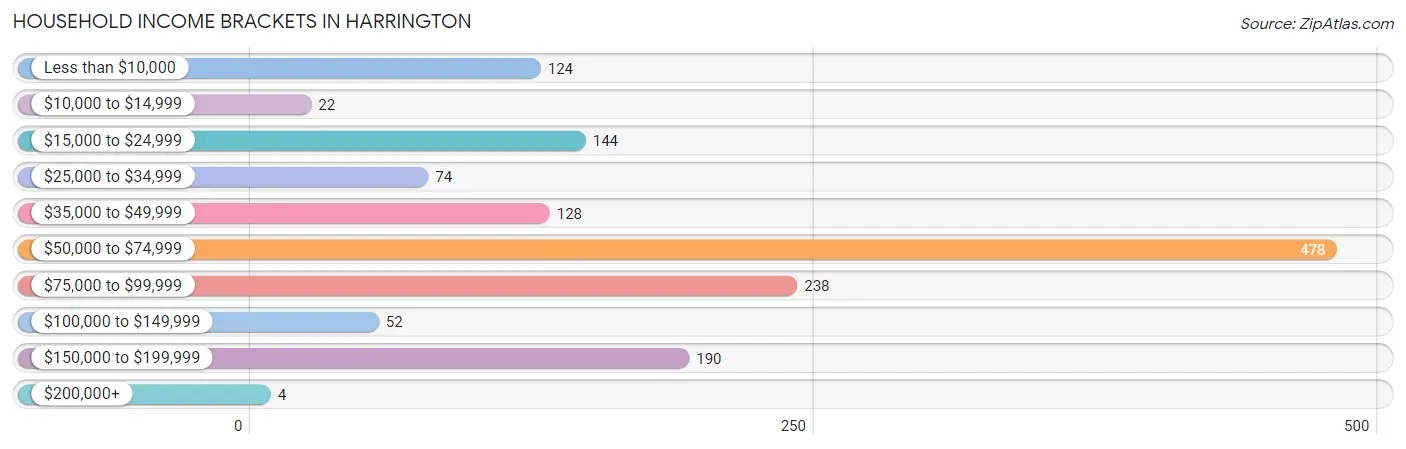
| Income Bracket | # Households | % Households |
| Less than $10,000 | 124 | 8.5% |
| $10,000 to $14,999 | 22 | 1.5% |
| $15,000 to $24,999 | 144 | 9.9% |
| $25,000 to $34,999 | 74 | 5.1% |
| $35,000 to $49,999 | 128 | 8.8% |
| $50,000 to $74,999 | 478 | 32.8% |
| $75,000 to $99,999 | 238 | 16.3% |
| $100,000 to $149,999 | 52 | 3.6% |
| $150,000 to $199,999 | 190 | 13.0% |
| $200,000+ | 4 | 0.3% |
Household Income by Householder Age in Harrington
The median household income in Harrington is $63,814, with the highest median household income of $71,121 found in the 25 to 44 years age bracket for the primary householder. A total of 670 households (46.0%) fall into this category. Meanwhile, the 45 to 64 years age bracket for the primary householder has the lowest median household income of $0, with 383 households (26.3%) in this group.
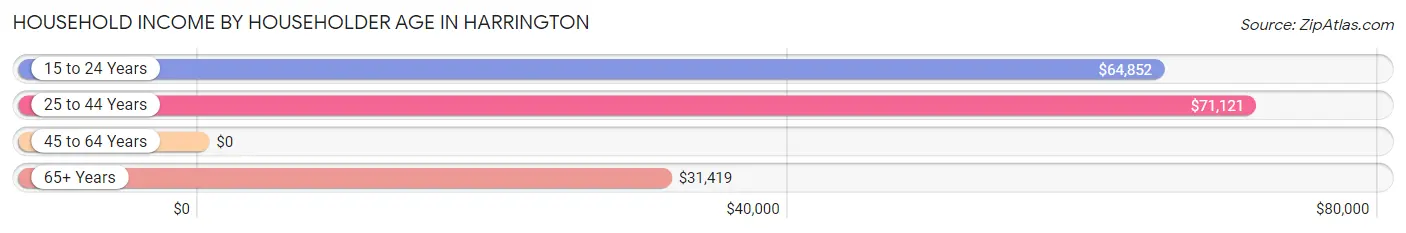
| Income Bracket | # Households | Median Income |
| 15 to 24 Years | 143 (9.8%) | $64,852 |
| 25 to 44 Years | 670 (46.0%) | $71,121 |
| 45 to 64 Years | 383 (26.3%) | $0 |
| 65+ Years | 262 (18.0%) | $31,419 |
| Total | 1,458 (100.0%) | $63,814 |
Poverty in Harrington
Income Below Poverty by Sex and Age in Harrington
With 12.8% poverty level for males and 13.8% for females among the residents of Harrington, 16 and 17 year old males and 6 to 11 year old females are the most vulnerable to poverty, with 33 males (100.0%) and 86 females (31.3%) in their respective age groups living below the poverty level.
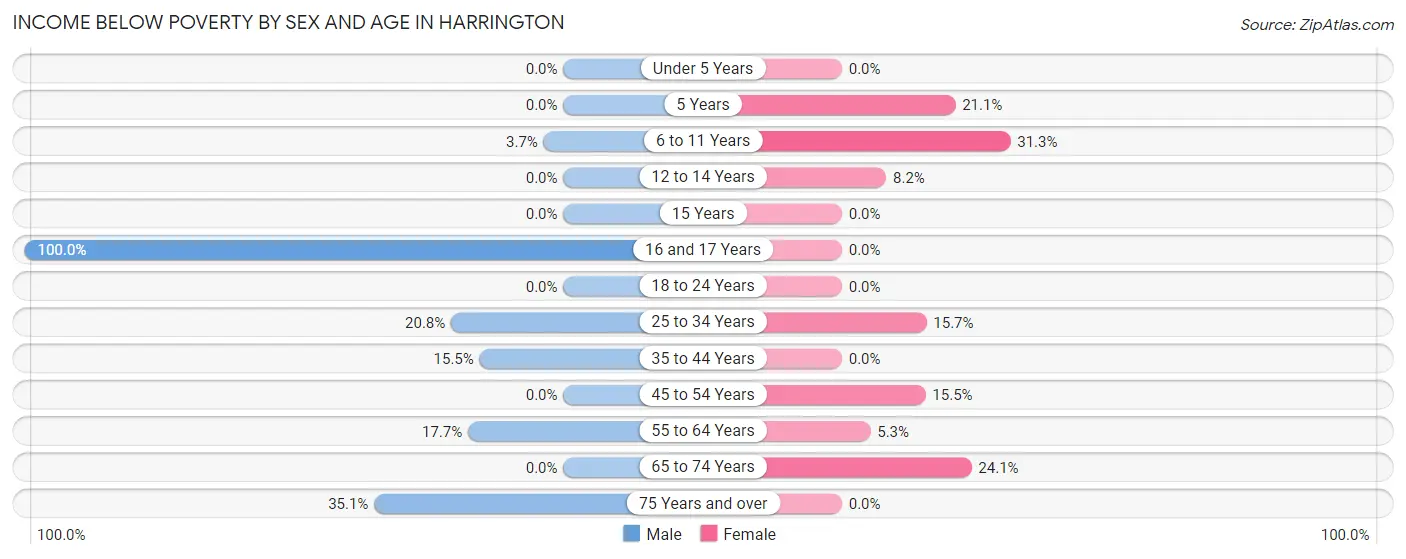
| Age Bracket | Male | Female |
| Under 5 Years | 0 (0.0%) | 0 (0.0%) |
| 5 Years | 0 (0.0%) | 40 (21.0%) |
| 6 to 11 Years | 5 (3.6%) | 86 (31.3%) |
| 12 to 14 Years | 0 (0.0%) | 6 (8.2%) |
| 15 Years | 0 (0.0%) | 0 (0.0%) |
| 16 and 17 Years | 33 (100.0%) | 0 (0.0%) |
| 18 to 24 Years | 0 (0.0%) | 0 (0.0%) |
| 25 to 34 Years | 80 (20.8%) | 87 (15.7%) |
| 35 to 44 Years | 39 (15.5%) | 0 (0.0%) |
| 45 to 54 Years | 0 (0.0%) | 27 (15.5%) |
| 55 to 64 Years | 23 (17.7%) | 11 (5.3%) |
| 65 to 74 Years | 0 (0.0%) | 32 (24.1%) |
| 75 Years and over | 33 (35.1%) | 0 (0.0%) |
| Total | 213 (12.8%) | 289 (13.8%) |
Income Above Poverty by Sex and Age in Harrington
According to the poverty statistics in Harrington, males aged under 5 years and females aged under 5 years are the age groups that are most secure financially, with 100.0% of males and 100.0% of females in these age groups living above the poverty line.

| Age Bracket | Male | Female |
| Under 5 Years | 181 (100.0%) | 290 (100.0%) |
| 5 Years | 0 (0.0%) | 150 (78.9%) |
| 6 to 11 Years | 132 (96.4%) | 189 (68.7%) |
| 12 to 14 Years | 70 (100.0%) | 67 (91.8%) |
| 15 Years | 23 (100.0%) | 17 (100.0%) |
| 16 and 17 Years | 0 (0.0%) | 10 (100.0%) |
| 18 to 24 Years | 184 (100.0%) | 65 (100.0%) |
| 25 to 34 Years | 304 (79.2%) | 467 (84.3%) |
| 35 to 44 Years | 212 (84.5%) | 51 (100.0%) |
| 45 to 54 Years | 103 (100.0%) | 147 (84.5%) |
| 55 to 64 Years | 107 (82.3%) | 197 (94.7%) |
| 65 to 74 Years | 78 (100.0%) | 101 (75.9%) |
| 75 Years and over | 61 (64.9%) | 62 (100.0%) |
| Total | 1,455 (87.2%) | 1,813 (86.3%) |
Income Below Poverty Among Married-Couple Families in Harrington
The poverty statistics for married-couple families in Harrington show that 17.1% or 109 of the total 636 families live below the poverty line. Families with 1 or 2 children have the highest poverty rate of 40.2%, comprising of 109 families. On the other hand, families with no children have the lowest poverty rate of 0.0%, which includes 0 families.
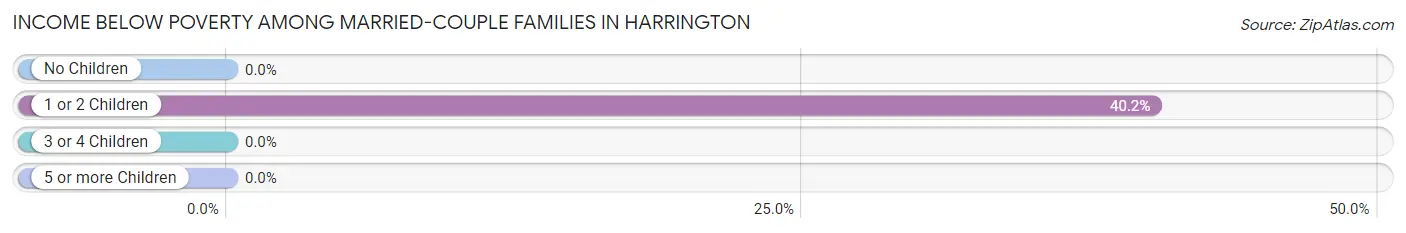
| Children | Above Poverty | Below Poverty |
| No Children | 189 (100.0%) | 0 (0.0%) |
| 1 or 2 Children | 162 (59.8%) | 109 (40.2%) |
| 3 or 4 Children | 176 (100.0%) | 0 (0.0%) |
| 5 or more Children | 0 (0.0%) | 0 (0.0%) |
| Total | 527 (82.9%) | 109 (17.1%) |
Income Below Poverty Among Single-Parent Households in Harrington
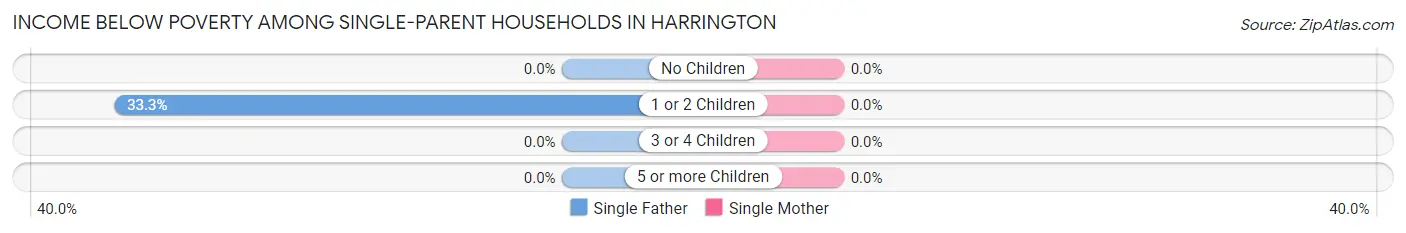
| Children | Single Father | Single Mother |
| No Children | 0 (0.0%) | 0 (0.0%) |
| 1 or 2 Children | 9 (33.3%) | 0 (0.0%) |
| 3 or 4 Children | 0 (0.0%) | 0 (0.0%) |
| 5 or more Children | 0 (0.0%) | 0 (0.0%) |
| Total | 9 (7.4%) | 0 (0.0%) |
Income Below Poverty Among Married-Couple vs Single-Parent Households in Harrington
The poverty data for Harrington shows that 109 of the married-couple family households (17.1%) and 9 of the single-parent households (4.0%) are living below the poverty level. Within the married-couple family households, those with 1 or 2 children have the highest poverty rate, with 109 households (40.2%) falling below the poverty line. Among the single-parent households, those with 1 or 2 children have the highest poverty rate, with 9 household (11.4%) living below poverty.
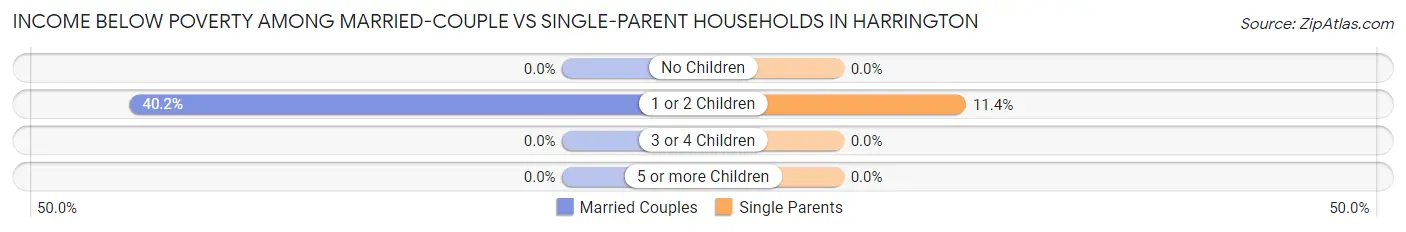
| Children | Married-Couple Families | Single-Parent Households |
| No Children | 0 (0.0%) | 0 (0.0%) |
| 1 or 2 Children | 109 (40.2%) | 9 (11.4%) |
| 3 or 4 Children | 0 (0.0%) | 0 (0.0%) |
| 5 or more Children | 0 (0.0%) | 0 (0.0%) |
| Total | 109 (17.1%) | 9 (4.0%) |
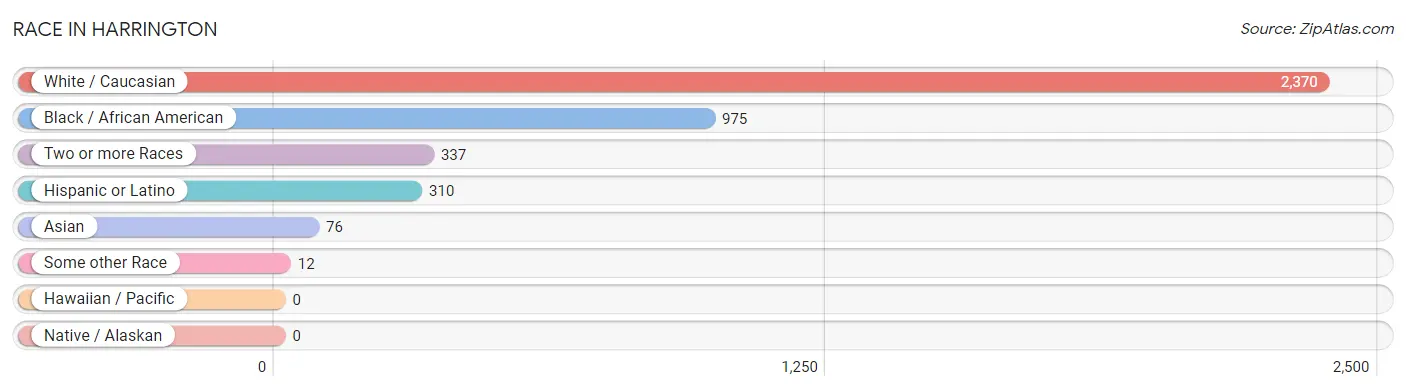
Race in Harrington
The most populous races in Harrington are White / Caucasian (2,370 | 62.9%), Black / African American (975 | 25.9%), and Two or more Races (337 | 8.9%).
| Race | # Population | % Population |
| Asian | 76 | 2.0% |
| Black / African American | 975 | 25.9% |
| Hawaiian / Pacific | 0 | 0.0% |
| Hispanic or Latino | 310 | 8.2% |
| Native / Alaskan | 0 | 0.0% |
| White / Caucasian | 2,370 | 62.9% |
| Two or more Races | 337 | 8.9% |
| Some other Race | 12 | 0.3% |
| Total | 3,770 | 100.0% |
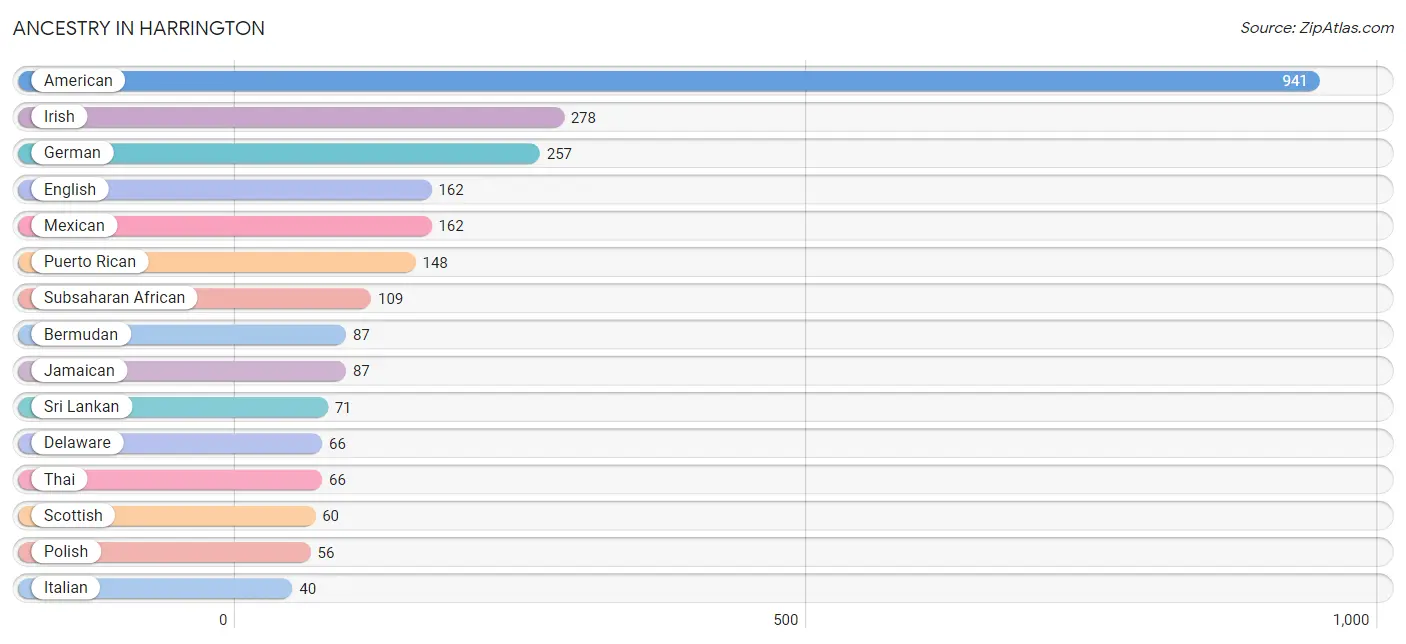
Ancestry in Harrington
The most populous ancestries reported in Harrington are American (941 | 25.0%), Irish (278 | 7.4%), German (257 | 6.8%), English (162 | 4.3%), and Mexican (162 | 4.3%), together accounting for 47.7% of all Harrington residents.
| Ancestry | # Population | % Population |
| American | 941 | 25.0% |
| Bermudan | 87 | 2.3% |
| Brazilian | 17 | 0.4% |
| Czechoslovakian | 14 | 0.4% |
| Delaware | 66 | 1.8% |
| Dutch | 14 | 0.4% |
| English | 162 | 4.3% |
| European | 19 | 0.5% |
| French Canadian | 5 | 0.1% |
| German | 257 | 6.8% |
| Greek | 23 | 0.6% |
| Indian (Asian) | 25 | 0.7% |
| Irish | 278 | 7.4% |
| Italian | 40 | 1.1% |
| Jamaican | 87 | 2.3% |
| Korean | 38 | 1.0% |
| Liberian | 15 | 0.4% |
| Mexican | 162 | 4.3% |
| Pennsylvania German | 27 | 0.7% |
| Polish | 56 | 1.5% |
| Portuguese | 17 | 0.4% |
| Puerto Rican | 148 | 3.9% |
| Scotch-Irish | 26 | 0.7% |
| Scottish | 60 | 1.6% |
| Sri Lankan | 71 | 1.9% |
| Subsaharan African | 109 | 2.9% |
| Thai | 66 | 1.8% | View All 27 Rows |
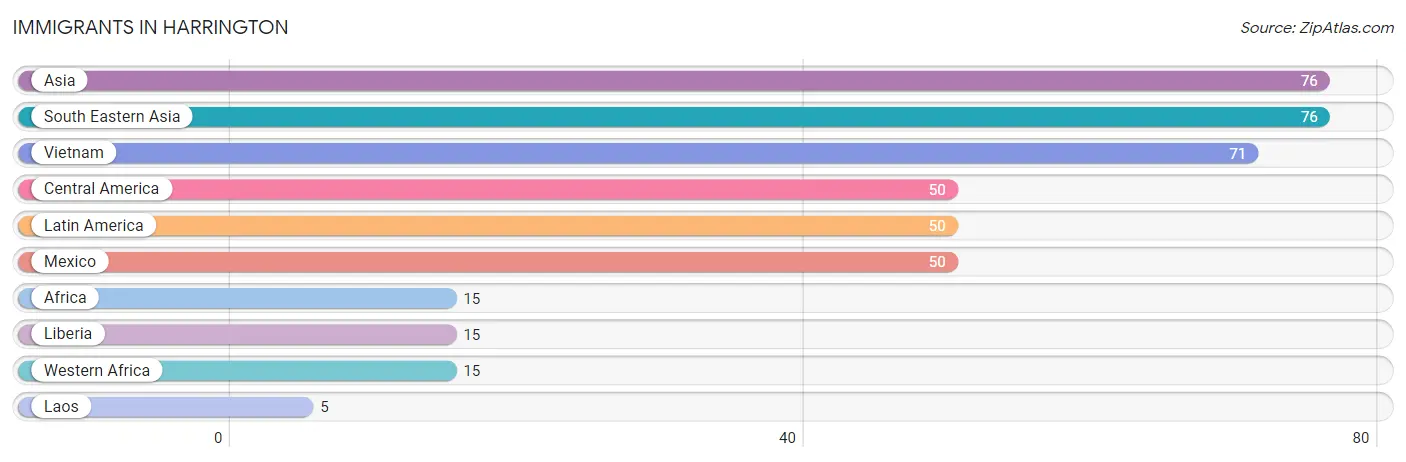
Immigrants in Harrington
The most numerous immigrant groups reported in Harrington came from Asia (76 | 2.0%), South Eastern Asia (76 | 2.0%), Vietnam (71 | 1.9%), Central America (50 | 1.3%), and Latin America (50 | 1.3%), together accounting for 8.6% of all Harrington residents.
| Immigration Origin | # Population | % Population |
| Africa | 15 | 0.4% |
| Asia | 76 | 2.0% |
| Central America | 50 | 1.3% |
| Laos | 5 | 0.1% |
| Latin America | 50 | 1.3% |
| Liberia | 15 | 0.4% |
| Mexico | 50 | 1.3% |
| South Eastern Asia | 76 | 2.0% |
| Vietnam | 71 | 1.9% |
| Western Africa | 15 | 0.4% | View All 10 Rows |
Sex and Age in Harrington
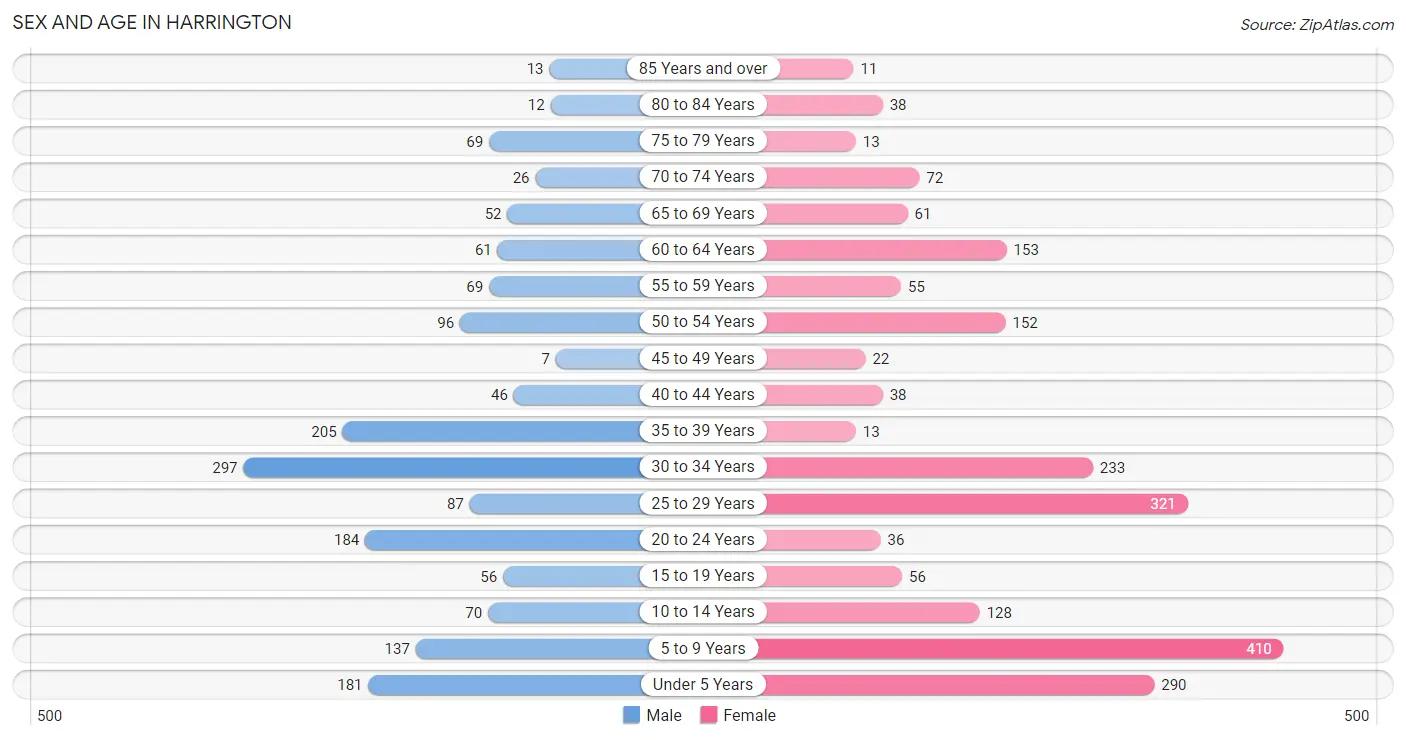
Sex and Age in Harrington
The most populous age groups in Harrington are 30 to 34 Years (297 | 17.8%) for men and 5 to 9 Years (410 | 19.5%) for women.
| Age Bracket | Male | Female |
| Under 5 Years | 181 (10.8%) | 290 (13.8%) |
| 5 to 9 Years | 137 (8.2%) | 410 (19.5%) |
| 10 to 14 Years | 70 (4.2%) | 128 (6.1%) |
| 15 to 19 Years | 56 (3.4%) | 56 (2.7%) |
| 20 to 24 Years | 184 (11.0%) | 36 (1.7%) |
| 25 to 29 Years | 87 (5.2%) | 321 (15.3%) |
| 30 to 34 Years | 297 (17.8%) | 233 (11.1%) |
| 35 to 39 Years | 205 (12.3%) | 13 (0.6%) |
| 40 to 44 Years | 46 (2.8%) | 38 (1.8%) |
| 45 to 49 Years | 7 (0.4%) | 22 (1.1%) |
| 50 to 54 Years | 96 (5.8%) | 152 (7.2%) |
| 55 to 59 Years | 69 (4.1%) | 55 (2.6%) |
| 60 to 64 Years | 61 (3.7%) | 153 (7.3%) |
| 65 to 69 Years | 52 (3.1%) | 61 (2.9%) |
| 70 to 74 Years | 26 (1.6%) | 72 (3.4%) |
| 75 to 79 Years | 69 (4.1%) | 13 (0.6%) |
| 80 to 84 Years | 12 (0.7%) | 38 (1.8%) |
| 85 Years and over | 13 (0.8%) | 11 (0.5%) |
| Total | 1,668 (100.0%) | 2,102 (100.0%) |
Families and Households in Harrington
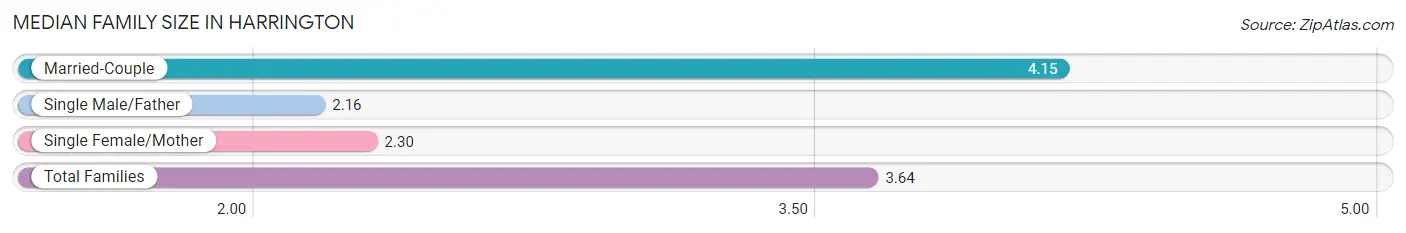
Median Family Size in Harrington
The median family size in Harrington is 3.64 persons per family, with married-couple families (636 | 73.6%) accounting for the largest median family size of 4.15 persons per family. On the other hand, single male/father families (122 | 14.1%) represent the smallest median family size with 2.16 persons per family.
| Family Type | # Families | Family Size |
| Married-Couple | 636 (73.6%) | 4.15 |
| Single Male/Father | 122 (14.1%) | 2.16 |
| Single Female/Mother | 106 (12.3%) | 2.30 |
| Total Families | 864 (100.0%) | 3.64 |
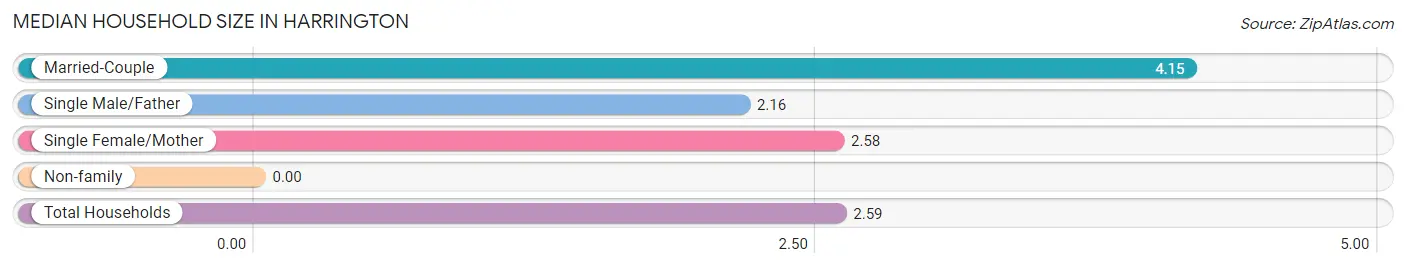
Median Household Size in Harrington
| Household Type | # Households | Household Size |
| Married-Couple | 636 (43.6%) | 4.15 |
| Single Male/Father | 122 (8.4%) | 2.16 |
| Single Female/Mother | 106 (7.3%) | 2.58 |
| Non-family | 594 (40.7%) | - |
| Total Households | 1,458 (100.0%) | 2.59 |
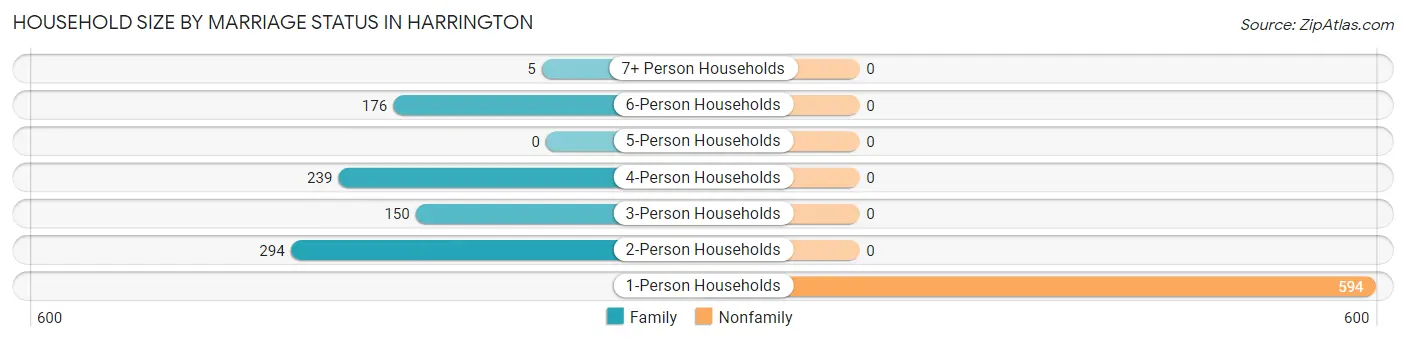
Household Size by Marriage Status in Harrington
Out of a total of 1,458 households in Harrington, 864 (59.3%) are family households, while 594 (40.7%) are nonfamily households. The most numerous type of family households are 2-person households, comprising 294, and the most common type of nonfamily households are 1-person households, comprising 594.
| Household Size | Family Households | Nonfamily Households |
| 1-Person Households | - | 594 (40.7%) |
| 2-Person Households | 294 (20.2%) | 0 (0.0%) |
| 3-Person Households | 150 (10.3%) | 0 (0.0%) |
| 4-Person Households | 239 (16.4%) | 0 (0.0%) |
| 5-Person Households | 0 (0.0%) | 0 (0.0%) |
| 6-Person Households | 176 (12.1%) | 0 (0.0%) |
| 7+ Person Households | 5 (0.3%) | 0 (0.0%) |
| Total | 864 (59.3%) | 594 (40.7%) |
Female Fertility in Harrington
Fertility by Age in Harrington
Average fertility rate in Harrington is 222.0 births per 1,000 women. Women in the age bracket of 20 to 34 years have the highest fertility rate with 271.0 births per 1,000 women. Women in the age bracket of 20 to 34 years acount for 100.0% of all women with births.
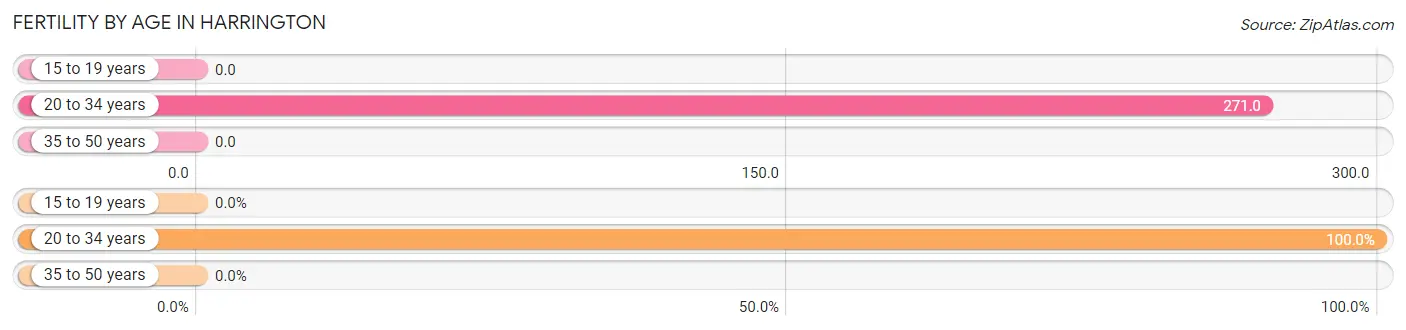
| Age Bracket | Women with Births | Births / 1,000 Women |
| 15 to 19 years | 0 (0.0%) | 0.0 |
| 20 to 34 years | 160 (100.0%) | 271.0 |
| 35 to 50 years | 0 (0.0%) | 0.0 |
| Total | 160 (100.0%) | 222.0 |
Fertility by Age by Marriage Status in Harrington
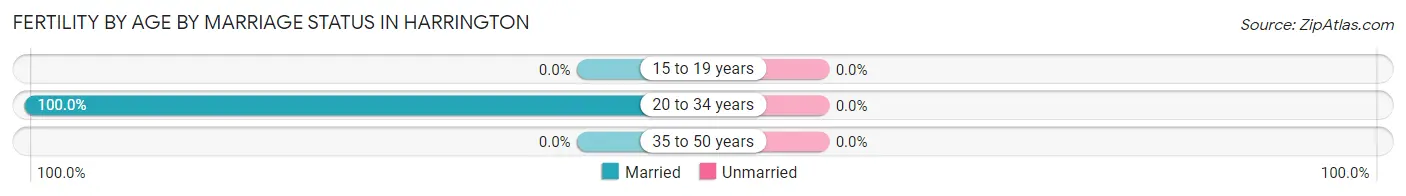
| Age Bracket | Married | Unmarried |
| 15 to 19 years | 0 (0.0%) | 0 (0.0%) |
| 20 to 34 years | 160 (100.0%) | 0 (0.0%) |
| 35 to 50 years | 0 (0.0%) | 0 (0.0%) |
| Total | 160 (100.0%) | 0 (0.0%) |
Fertility by Education in Harrington
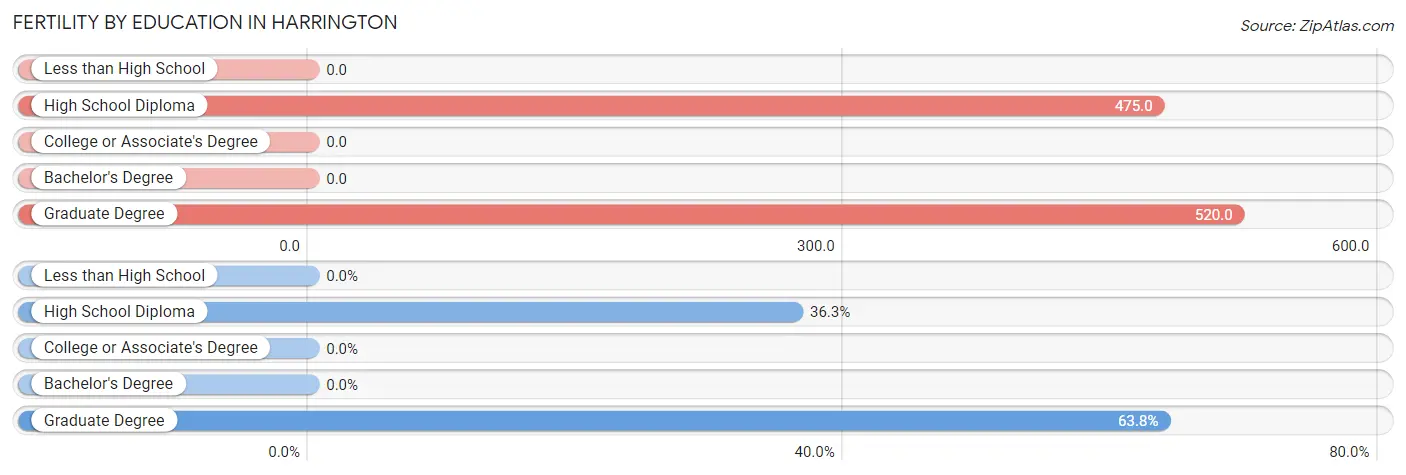
| Educational Attainment | Women with Births | Births / 1,000 Women |
| Less than High School | 0 (0.0%) | 0.0 |
| High School Diploma | 58 (36.2%) | 475.0 |
| College or Associate's Degree | 0 (0.0%) | 0.0 |
| Bachelor's Degree | 0 (0.0%) | 0.0 |
| Graduate Degree | 102 (63.7%) | 520.0 |
| Total | 160 (100.0%) | 222.0 |
Fertility by Education by Marriage Status in Harrington

| Educational Attainment | Married | Unmarried |
| Less than High School | 0 (0.0%) | 0 (0.0%) |
| High School Diploma | 58 (100.0%) | 0 (0.0%) |
| College or Associate's Degree | 0 (0.0%) | 0 (0.0%) |
| Bachelor's Degree | 0 (0.0%) | 0 (0.0%) |
| Graduate Degree | 102 (100.0%) | 0 (0.0%) |
| Total | 160 (100.0%) | 0 (0.0%) |
Employment Characteristics in Harrington
Employment by Class of Employer in Harrington
Among the 1,732 employed individuals in Harrington, private company employees (979 | 56.5%), state government employees (389 | 22.5%), and local government employees (199 | 11.5%) make up the most common classes of employment.
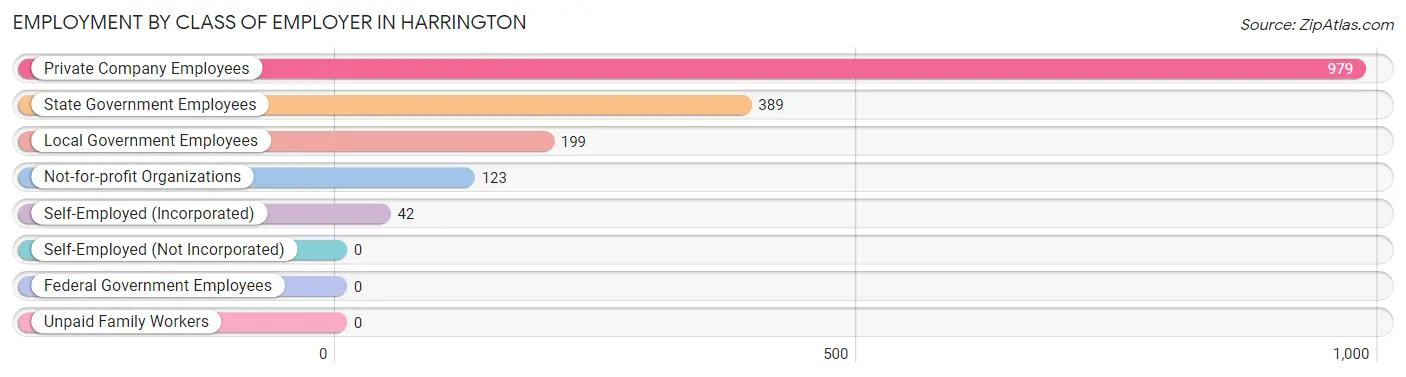
| Employer Class | # Employees | % Employees |
| Private Company Employees | 979 | 56.5% |
| Self-Employed (Incorporated) | 42 | 2.4% |
| Self-Employed (Not Incorporated) | 0 | 0.0% |
| Not-for-profit Organizations | 123 | 7.1% |
| Local Government Employees | 199 | 11.5% |
| State Government Employees | 389 | 22.5% |
| Federal Government Employees | 0 | 0.0% |
| Unpaid Family Workers | 0 | 0.0% |
| Total | 1,732 | 100.0% |
Employment Status by Age in Harrington
According to the labor force statistics for Harrington, out of the total population over 16 years of age (2,514), 76.8% or 1,931 individuals are in the labor force, with 5.0% or 97 of them unemployed. The age group with the highest labor force participation rate is 20 to 24 years, with 100.0% or 220 individuals in the labor force. Within the labor force, the 20 to 24 years age range has the highest percentage of unemployed individuals, with 15.9% or 35 of them being unemployed.
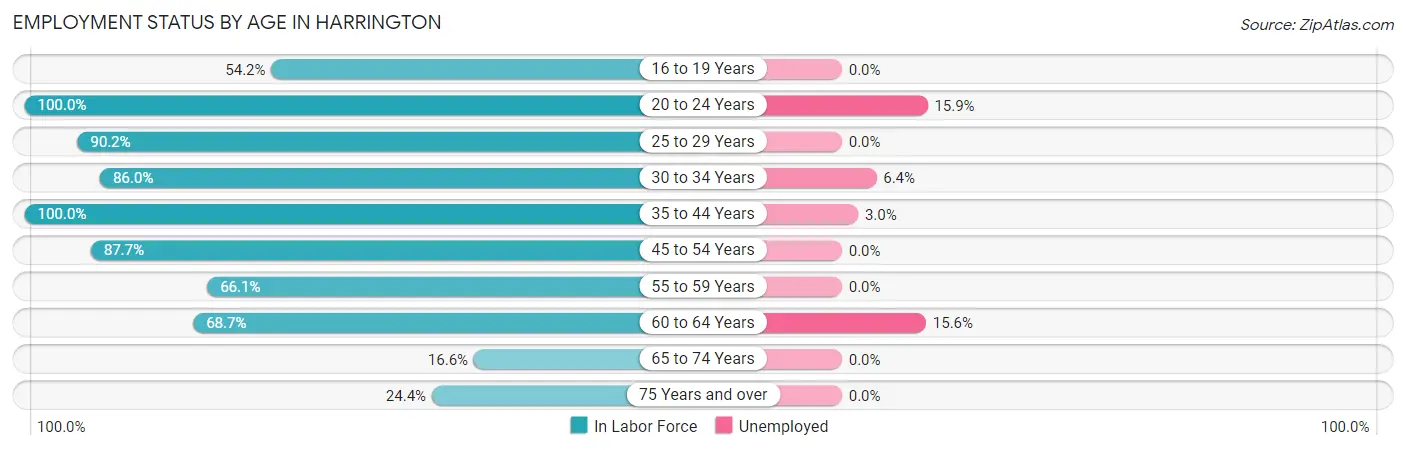
| Age Bracket | In Labor Force | Unemployed |
| 16 to 19 Years | 39 (54.2%) | 0 (0.0%) |
| 20 to 24 Years | 220 (100.0%) | 35 (15.9%) |
| 25 to 29 Years | 368 (90.2%) | 0 (0.0%) |
| 30 to 34 Years | 456 (86.0%) | 29 (6.4%) |
| 35 to 44 Years | 302 (100.0%) | 9 (3.0%) |
| 45 to 54 Years | 243 (87.7%) | 0 (0.0%) |
| 55 to 59 Years | 82 (66.1%) | 0 (0.0%) |
| 60 to 64 Years | 147 (68.7%) | 23 (15.6%) |
| 65 to 74 Years | 35 (16.6%) | 0 (0.0%) |
| 75 Years and over | 38 (24.4%) | 0 (0.0%) |
| Total | 1,931 (76.8%) | 97 (5.0%) |
Employment Status by Educational Attainment in Harrington
According to labor force statistics for Harrington, 86.1% of individuals (1,597) out of the total population between 25 and 64 years of age (1,855) are in the labor force, with 3.8% or 61 of them being unemployed. The group with the highest labor force participation rate are those with the educational attainment of bachelor's degree or higher, with 100.0% or 503 individuals in the labor force. Within the labor force, individuals with less than high school education have the highest percentage of unemployment, with 25.2% or 29 of them being unemployed.
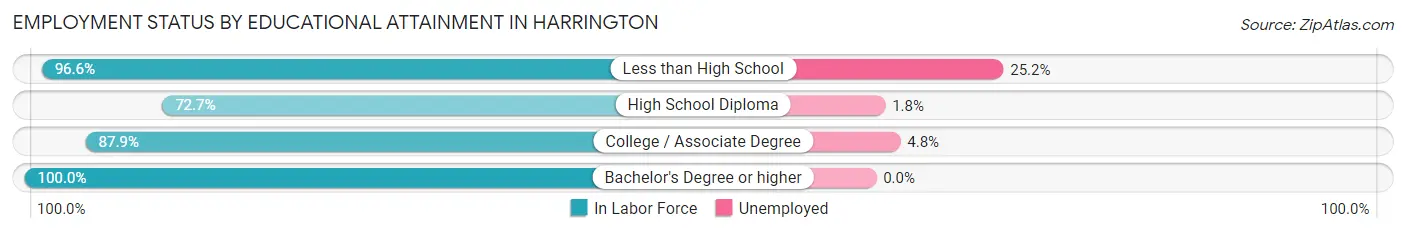
| Educational Attainment | In Labor Force | Unemployed |
| Less than High School | 115 (96.6%) | 30 (25.2%) |
| High School Diploma | 499 (72.7%) | 12 (1.8%) |
| College / Associate Degree | 481 (87.9%) | 26 (4.8%) |
| Bachelor's Degree or higher | 503 (100.0%) | 0 (0.0%) |
| Total | 1,597 (86.1%) | 70 (3.8%) |
Employment Occupations by Sex in Harrington
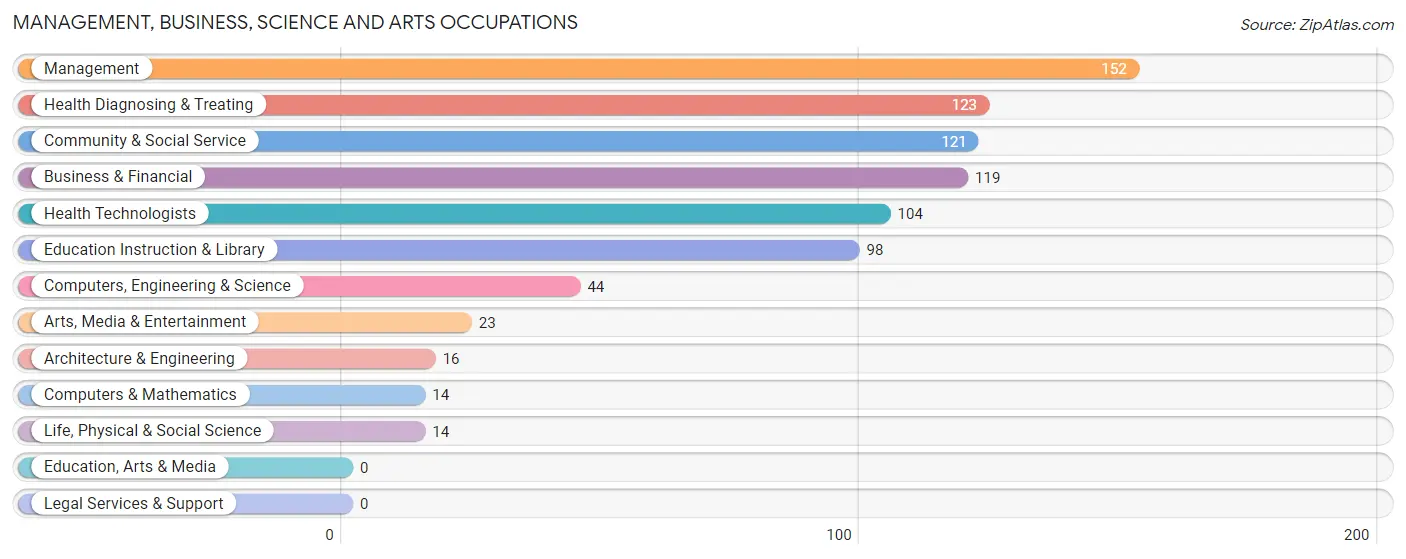
Management, Business, Science and Arts Occupations
The most common Management, Business, Science and Arts occupations in Harrington are Management (152 | 8.3%), Health Diagnosing & Treating (123 | 6.7%), Community & Social Service (121 | 6.6%), Business & Financial (119 | 6.5%), and Health Technologists (104 | 5.7%).
Management, Business, Science and Arts Occupations by Sex
Within the Management, Business, Science and Arts occupations in Harrington, the most male-oriented occupations are Computers & Mathematics (100.0%), Architecture & Engineering (100.0%), and Computers, Engineering & Science (68.2%), while the most female-oriented occupations are Business & Financial (100.0%), Life, Physical & Social Science (100.0%), and Arts, Media & Entertainment (100.0%).
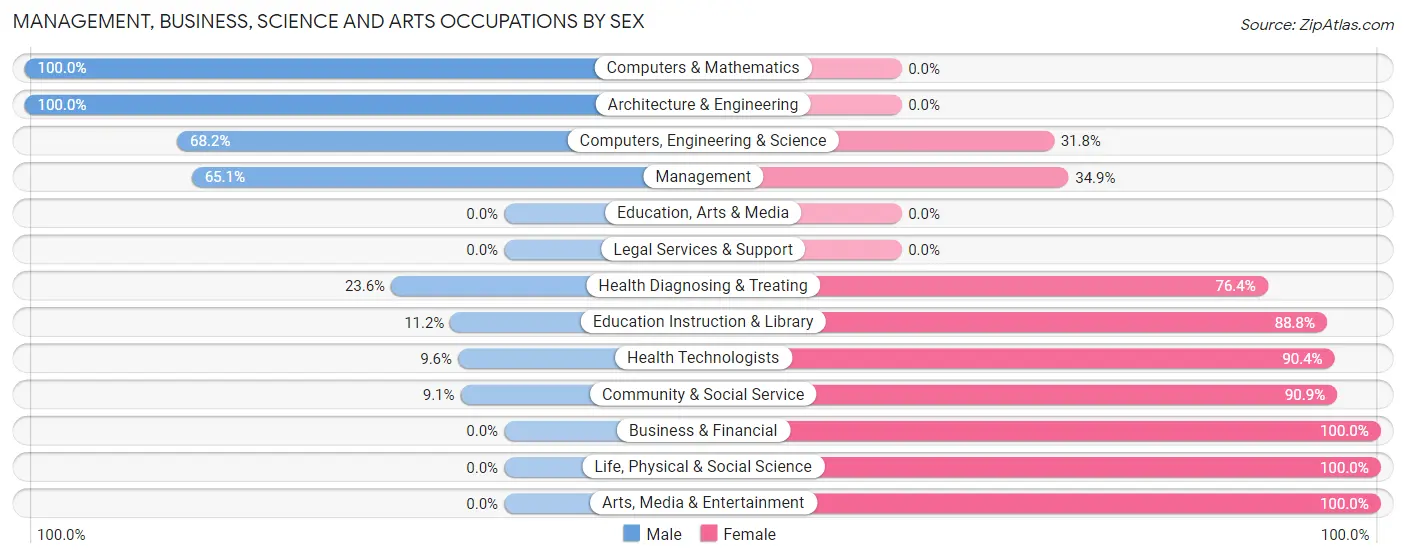
| Occupation | Male | Female |
| Management | 99 (65.1%) | 53 (34.9%) |
| Business & Financial | 0 (0.0%) | 119 (100.0%) |
| Computers, Engineering & Science | 30 (68.2%) | 14 (31.8%) |
| Computers & Mathematics | 14 (100.0%) | 0 (0.0%) |
| Architecture & Engineering | 16 (100.0%) | 0 (0.0%) |
| Life, Physical & Social Science | 0 (0.0%) | 14 (100.0%) |
| Community & Social Service | 11 (9.1%) | 110 (90.9%) |
| Education, Arts & Media | 0 (0.0%) | 0 (0.0%) |
| Legal Services & Support | 0 (0.0%) | 0 (0.0%) |
| Education Instruction & Library | 11 (11.2%) | 87 (88.8%) |
| Arts, Media & Entertainment | 0 (0.0%) | 23 (100.0%) |
| Health Diagnosing & Treating | 29 (23.6%) | 94 (76.4%) |
| Health Technologists | 10 (9.6%) | 94 (90.4%) |
| Total (Category) | 169 (30.2%) | 390 (69.8%) |
| Total (Overall) | 902 (49.2%) | 932 (50.8%) |
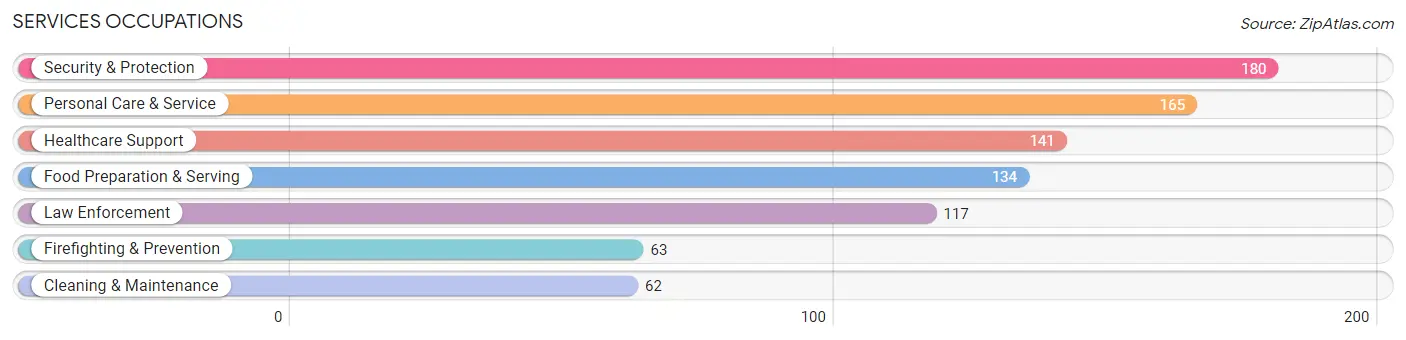
Services Occupations
The most common Services occupations in Harrington are Security & Protection (180 | 9.8%), Personal Care & Service (165 | 9.0%), Healthcare Support (141 | 7.7%), Food Preparation & Serving (134 | 7.3%), and Law Enforcement (117 | 6.4%).
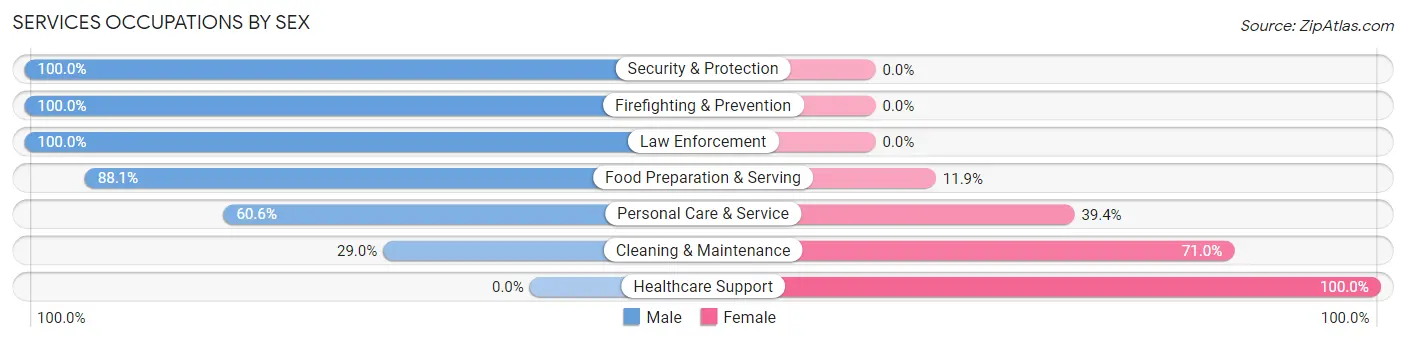
Services Occupations by Sex
Within the Services occupations in Harrington, the most male-oriented occupations are Security & Protection (100.0%), Firefighting & Prevention (100.0%), and Law Enforcement (100.0%), while the most female-oriented occupations are Healthcare Support (100.0%), Cleaning & Maintenance (71.0%), and Personal Care & Service (39.4%).
| Occupation | Male | Female |
| Healthcare Support | 0 (0.0%) | 141 (100.0%) |
| Security & Protection | 180 (100.0%) | 0 (0.0%) |
| Firefighting & Prevention | 63 (100.0%) | 0 (0.0%) |
| Law Enforcement | 117 (100.0%) | 0 (0.0%) |
| Food Preparation & Serving | 118 (88.1%) | 16 (11.9%) |
| Cleaning & Maintenance | 18 (29.0%) | 44 (71.0%) |
| Personal Care & Service | 100 (60.6%) | 65 (39.4%) |
| Total (Category) | 416 (61.0%) | 266 (39.0%) |
| Total (Overall) | 902 (49.2%) | 932 (50.8%) |
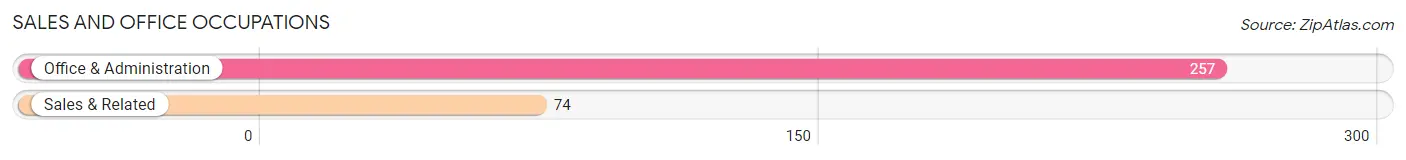
Sales and Office Occupations
The most common Sales and Office occupations in Harrington are Office & Administration (257 | 14.0%), and Sales & Related (74 | 4.0%).
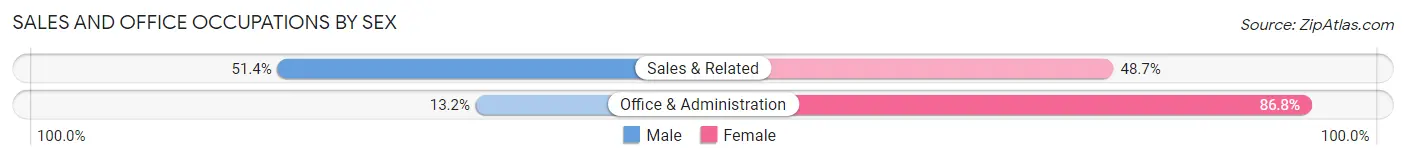
Sales and Office Occupations by Sex
| Occupation | Male | Female |
| Sales & Related | 38 (51.3%) | 36 (48.6%) |
| Office & Administration | 34 (13.2%) | 223 (86.8%) |
| Total (Category) | 72 (21.7%) | 259 (78.2%) |
| Total (Overall) | 902 (49.2%) | 932 (50.8%) |
Natural Resources, Construction and Maintenance Occupations
The most common Natural Resources, Construction and Maintenance occupations in Harrington are Installation, Maintenance & Repair (96 | 5.2%), and Construction & Extraction (65 | 3.5%).
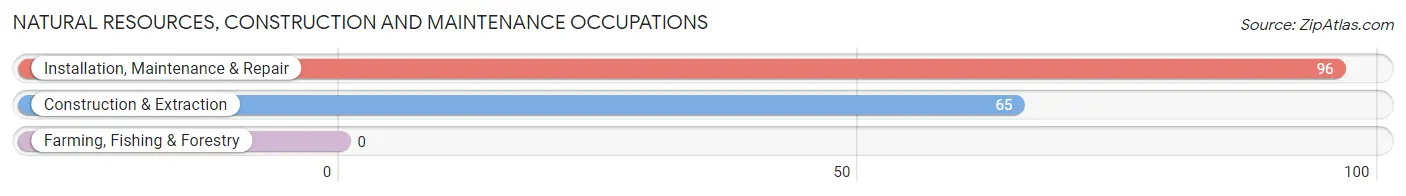
Natural Resources, Construction and Maintenance Occupations by Sex
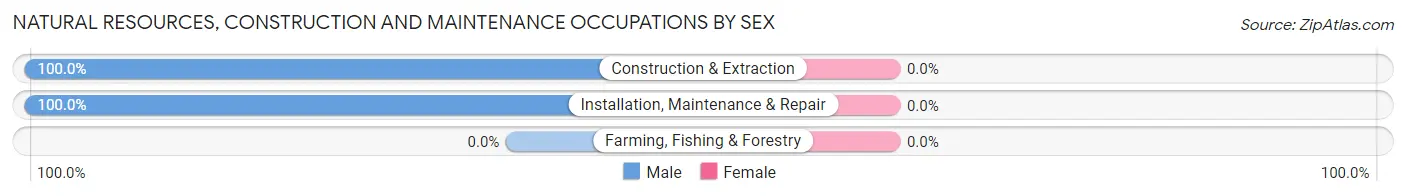
| Occupation | Male | Female |
| Farming, Fishing & Forestry | 0 (0.0%) | 0 (0.0%) |
| Construction & Extraction | 65 (100.0%) | 0 (0.0%) |
| Installation, Maintenance & Repair | 96 (100.0%) | 0 (0.0%) |
| Total (Category) | 161 (100.0%) | 0 (0.0%) |
| Total (Overall) | 902 (49.2%) | 932 (50.8%) |
Production, Transportation and Moving Occupations
The most common Production, Transportation and Moving occupations in Harrington are Material Moving (56 | 3.0%), and Transportation (45 | 2.5%).
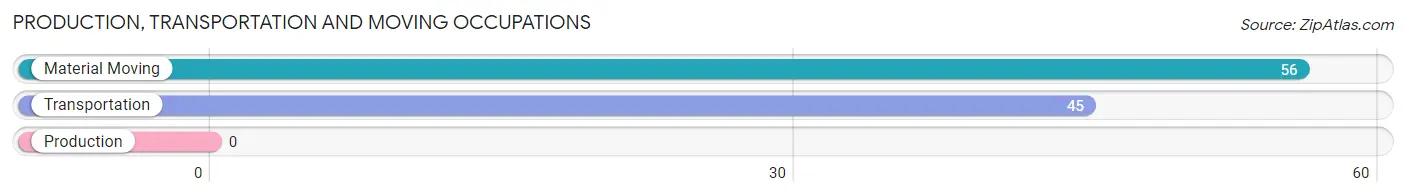
Production, Transportation and Moving Occupations by Sex
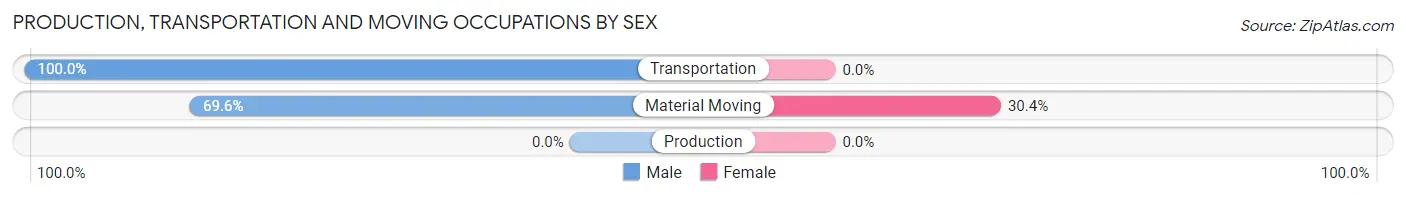
| Occupation | Male | Female |
| Production | 0 (0.0%) | 0 (0.0%) |
| Transportation | 45 (100.0%) | 0 (0.0%) |
| Material Moving | 39 (69.6%) | 17 (30.4%) |
| Total (Category) | 84 (83.2%) | 17 (16.8%) |
| Total (Overall) | 902 (49.2%) | 932 (50.8%) |
Employment Industries by Sex in Harrington
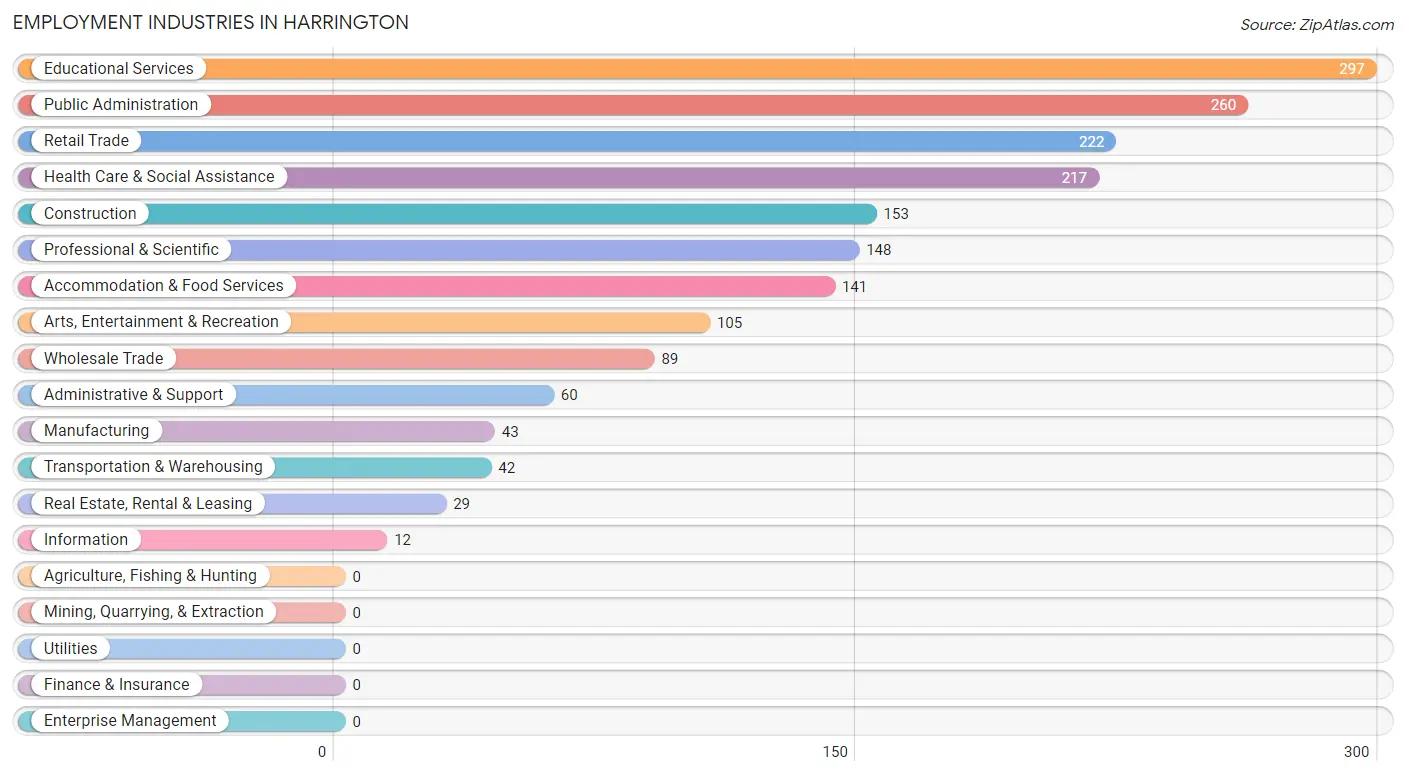
Employment Industries in Harrington
The major employment industries in Harrington include Educational Services (297 | 16.2%), Public Administration (260 | 14.2%), Retail Trade (222 | 12.1%), Health Care & Social Assistance (217 | 11.8%), and Construction (153 | 8.3%).
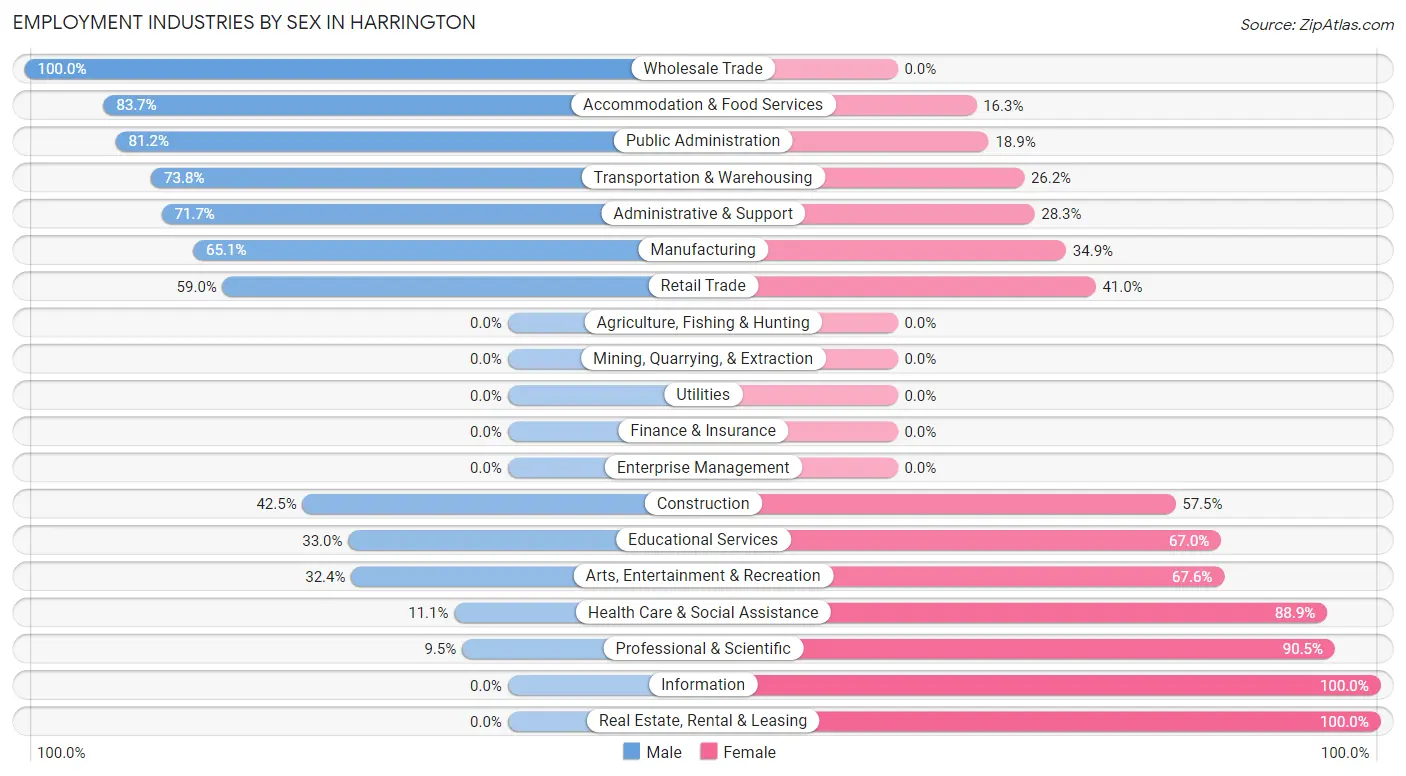
Employment Industries by Sex in Harrington
The Harrington industries that see more men than women are Wholesale Trade (100.0%), Accommodation & Food Services (83.7%), and Public Administration (81.1%), whereas the industries that tend to have a higher number of women are Information (100.0%), Real Estate, Rental & Leasing (100.0%), and Professional & Scientific (90.5%).
| Industry | Male | Female |
| Agriculture, Fishing & Hunting | 0 (0.0%) | 0 (0.0%) |
| Mining, Quarrying, & Extraction | 0 (0.0%) | 0 (0.0%) |
| Construction | 65 (42.5%) | 88 (57.5%) |
| Manufacturing | 28 (65.1%) | 15 (34.9%) |
| Wholesale Trade | 89 (100.0%) | 0 (0.0%) |
| Retail Trade | 131 (59.0%) | 91 (41.0%) |
| Transportation & Warehousing | 31 (73.8%) | 11 (26.2%) |
| Utilities | 0 (0.0%) | 0 (0.0%) |
| Information | 0 (0.0%) | 12 (100.0%) |
| Finance & Insurance | 0 (0.0%) | 0 (0.0%) |
| Real Estate, Rental & Leasing | 0 (0.0%) | 29 (100.0%) |
| Professional & Scientific | 14 (9.5%) | 134 (90.5%) |
| Enterprise Management | 0 (0.0%) | 0 (0.0%) |
| Administrative & Support | 43 (71.7%) | 17 (28.3%) |
| Educational Services | 98 (33.0%) | 199 (67.0%) |
| Health Care & Social Assistance | 24 (11.1%) | 193 (88.9%) |
| Arts, Entertainment & Recreation | 34 (32.4%) | 71 (67.6%) |
| Accommodation & Food Services | 118 (83.7%) | 23 (16.3%) |
| Public Administration | 211 (81.1%) | 49 (18.9%) |
| Total | 902 (49.2%) | 932 (50.8%) |
Education in Harrington
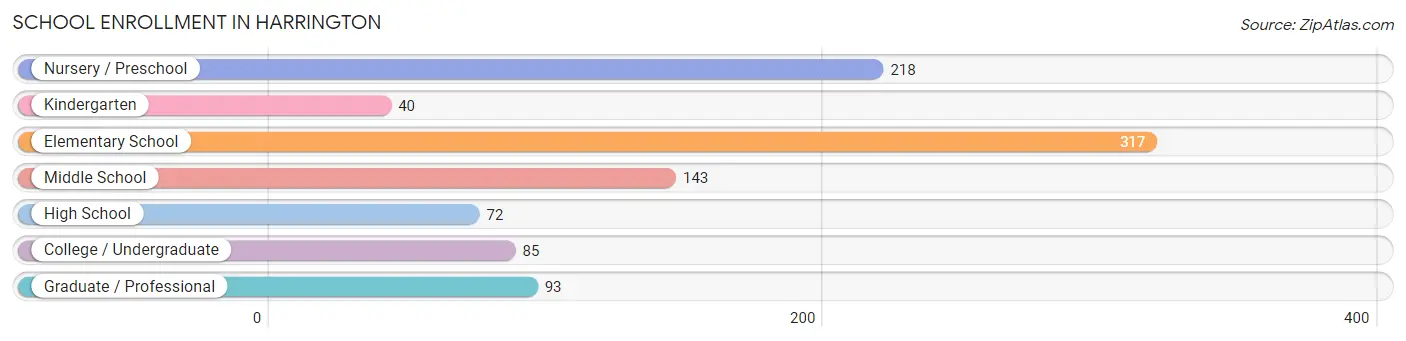
School Enrollment in Harrington
The most common levels of schooling among the 968 students in Harrington are elementary school (317 | 32.8%), nursery / preschool (218 | 22.5%), and middle school (143 | 14.8%).
| School Level | # Students | % Students |
| Nursery / Preschool | 218 | 22.5% |
| Kindergarten | 40 | 4.1% |
| Elementary School | 317 | 32.8% |
| Middle School | 143 | 14.8% |
| High School | 72 | 7.4% |
| College / Undergraduate | 85 | 8.8% |
| Graduate / Professional | 93 | 9.6% |
| Total | 968 | 100.0% |
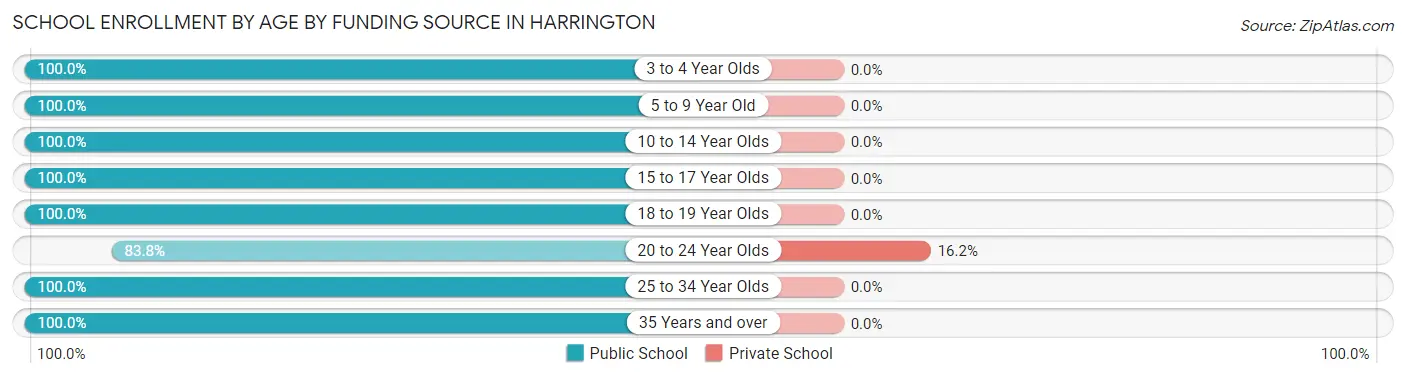
School Enrollment by Age by Funding Source in Harrington
Out of a total of 968 students who are enrolled in schools in Harrington, 6 (0.6%) attend a private institution, while the remaining 962 (99.4%) are enrolled in public schools. The age group of 20 to 24 year olds has the highest likelihood of being enrolled in private schools, with 6 (16.2% in the age bracket) enrolled. Conversely, the age group of 3 to 4 year olds has the lowest likelihood of being enrolled in a private school, with 68 (100.0% in the age bracket) attending a public institution.
| Age Bracket | Public School | Private School |
| 3 to 4 Year Olds | 68 (100.0%) | 0 (0.0%) |
| 5 to 9 Year Old | 507 (100.0%) | 0 (0.0%) |
| 10 to 14 Year Olds | 132 (100.0%) | 0 (0.0%) |
| 15 to 17 Year Olds | 83 (100.0%) | 0 (0.0%) |
| 18 to 19 Year Olds | 29 (100.0%) | 0 (0.0%) |
| 20 to 24 Year Olds | 31 (83.8%) | 6 (16.2%) |
| 25 to 34 Year Olds | 25 (100.0%) | 0 (0.0%) |
| 35 Years and over | 87 (100.0%) | 0 (0.0%) |
| Total | 962 (99.4%) | 6 (0.6%) |
Educational Attainment by Field of Study in Harrington
Education (186 | 33.0%), business (139 | 24.7%), arts & humanities (101 | 17.9%), social sciences (53 | 9.4%), and computers & mathematics (47 | 8.4%) are the most common fields of study among 563 individuals in Harrington who have obtained a bachelor's degree or higher.
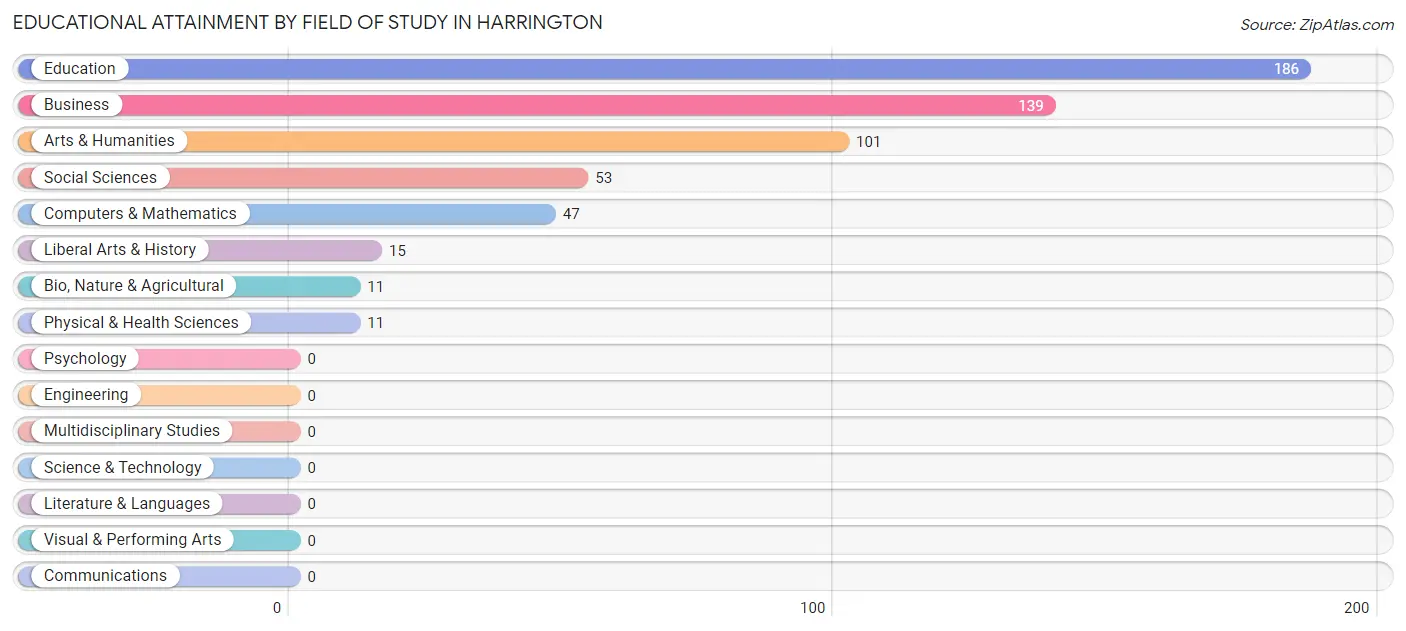
| Field of Study | # Graduates | % Graduates |
| Computers & Mathematics | 47 | 8.4% |
| Bio, Nature & Agricultural | 11 | 1.9% |
| Physical & Health Sciences | 11 | 1.9% |
| Psychology | 0 | 0.0% |
| Social Sciences | 53 | 9.4% |
| Engineering | 0 | 0.0% |
| Multidisciplinary Studies | 0 | 0.0% |
| Science & Technology | 0 | 0.0% |
| Business | 139 | 24.7% |
| Education | 186 | 33.0% |
| Literature & Languages | 0 | 0.0% |
| Liberal Arts & History | 15 | 2.7% |
| Visual & Performing Arts | 0 | 0.0% |
| Communications | 0 | 0.0% |
| Arts & Humanities | 101 | 17.9% |
| Total | 563 | 100.0% |
Transportation & Commute in Harrington
Vehicle Availability by Sex in Harrington
The most prevalent vehicle ownership categories in Harrington are males with 2 vehicles (467, accounting for 51.8%) and females with 2 vehicles (466, making up 56.3%).
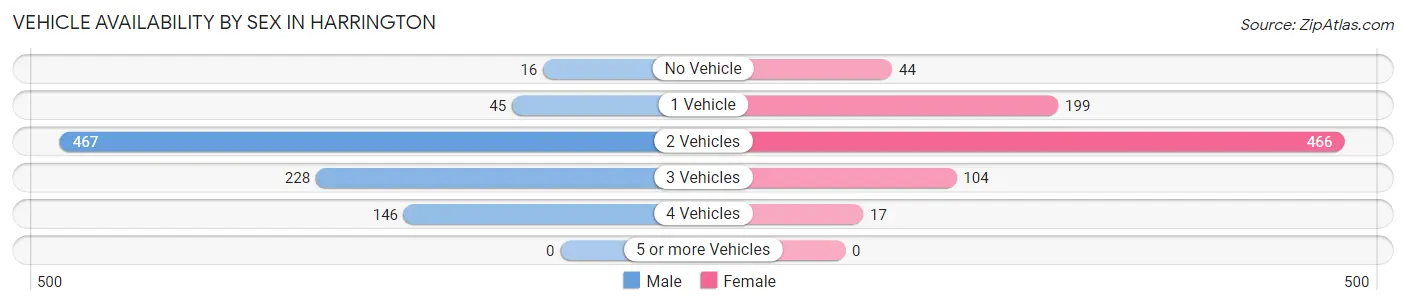
| Vehicles Available | Male | Female |
| No Vehicle | 16 (1.8%) | 44 (5.3%) |
| 1 Vehicle | 45 (5.0%) | 199 (24.0%) |
| 2 Vehicles | 467 (51.8%) | 466 (56.1%) |
| 3 Vehicles | 228 (25.3%) | 104 (12.5%) |
| 4 Vehicles | 146 (16.2%) | 17 (2.1%) |
| 5 or more Vehicles | 0 (0.0%) | 0 (0.0%) |
| Total | 902 (100.0%) | 830 (100.0%) |
Commute Time in Harrington
The most frequently occuring commute durations in Harrington are 30 to 34 minutes (468 commuters, 29.4%), 5 to 9 minutes (217 commuters, 13.7%), and 15 to 19 minutes (171 commuters, 10.8%).
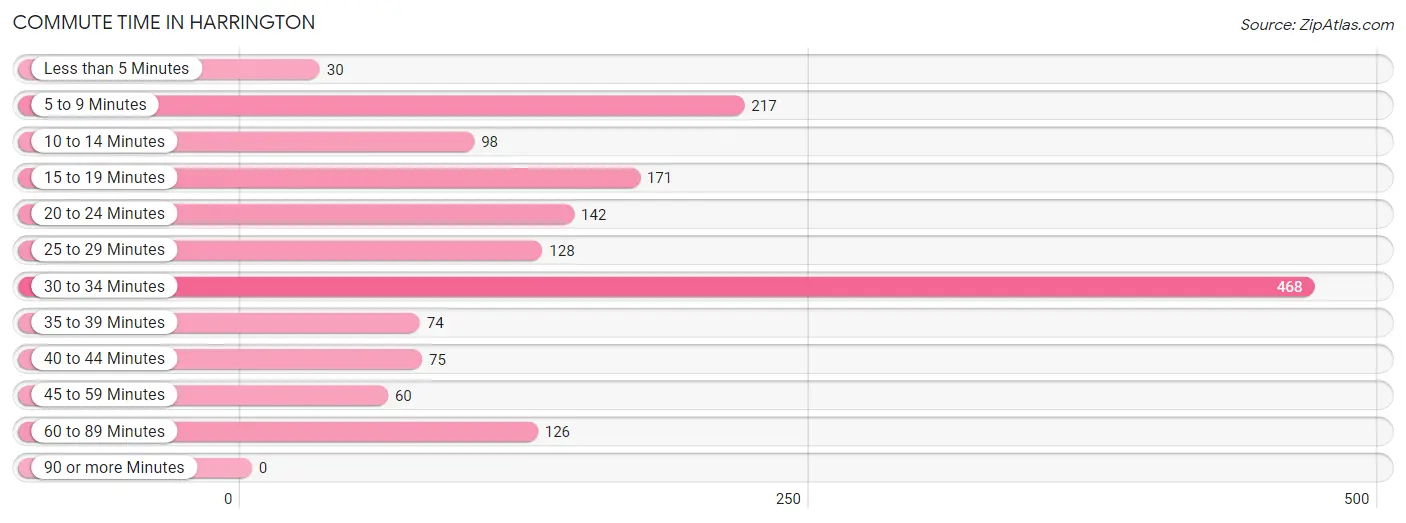
| Commute Time | # Commuters | % Commuters |
| Less than 5 Minutes | 30 | 1.9% |
| 5 to 9 Minutes | 217 | 13.7% |
| 10 to 14 Minutes | 98 | 6.2% |
| 15 to 19 Minutes | 171 | 10.8% |
| 20 to 24 Minutes | 142 | 8.9% |
| 25 to 29 Minutes | 128 | 8.1% |
| 30 to 34 Minutes | 468 | 29.4% |
| 35 to 39 Minutes | 74 | 4.7% |
| 40 to 44 Minutes | 75 | 4.7% |
| 45 to 59 Minutes | 60 | 3.8% |
| 60 to 89 Minutes | 126 | 7.9% |
| 90 or more Minutes | 0 | 0.0% |
Commute Time by Sex in Harrington
The most common commute times in Harrington are 30 to 34 minutes (225 commuters, 28.7%) for males and 30 to 34 minutes (243 commuters, 30.2%) for females.
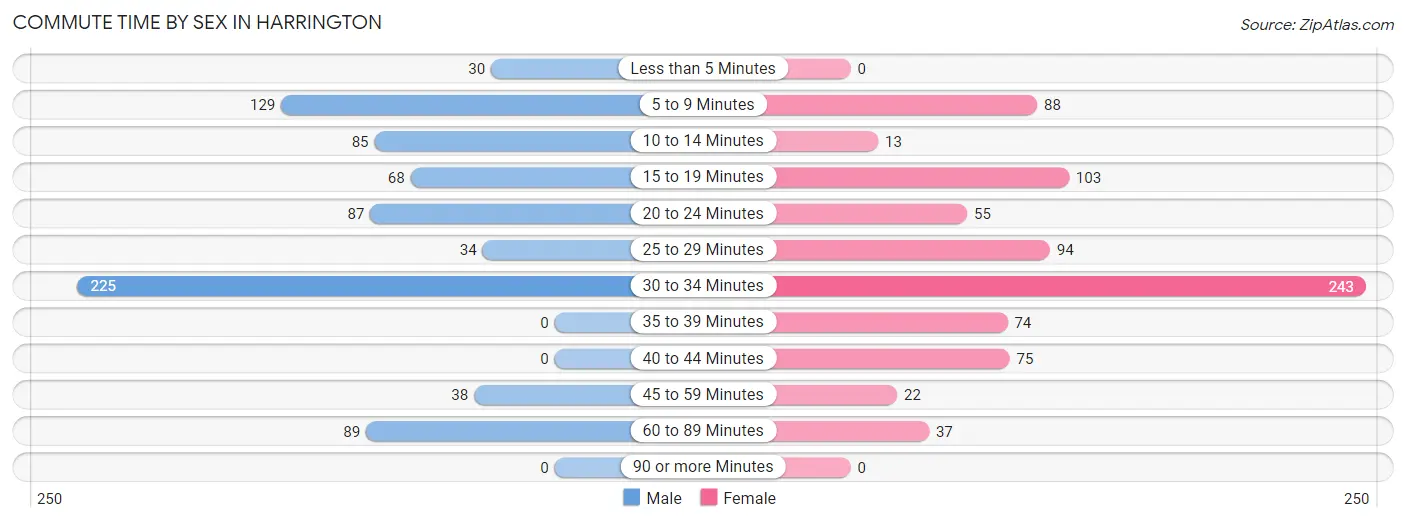
| Commute Time | Male | Female |
| Less than 5 Minutes | 30 (3.8%) | 0 (0.0%) |
| 5 to 9 Minutes | 129 (16.4%) | 88 (11.0%) |
| 10 to 14 Minutes | 85 (10.8%) | 13 (1.6%) |
| 15 to 19 Minutes | 68 (8.7%) | 103 (12.8%) |
| 20 to 24 Minutes | 87 (11.1%) | 55 (6.8%) |
| 25 to 29 Minutes | 34 (4.3%) | 94 (11.7%) |
| 30 to 34 Minutes | 225 (28.7%) | 243 (30.2%) |
| 35 to 39 Minutes | 0 (0.0%) | 74 (9.2%) |
| 40 to 44 Minutes | 0 (0.0%) | 75 (9.3%) |
| 45 to 59 Minutes | 38 (4.8%) | 22 (2.7%) |
| 60 to 89 Minutes | 89 (11.3%) | 37 (4.6%) |
| 90 or more Minutes | 0 (0.0%) | 0 (0.0%) |
Time of Departure to Work by Sex in Harrington
The most frequent times of departure to work in Harrington are 12:00 AM to 4:59 AM (187, 23.8%) for males and 7:00 AM to 7:29 AM (269, 33.5%) for females.
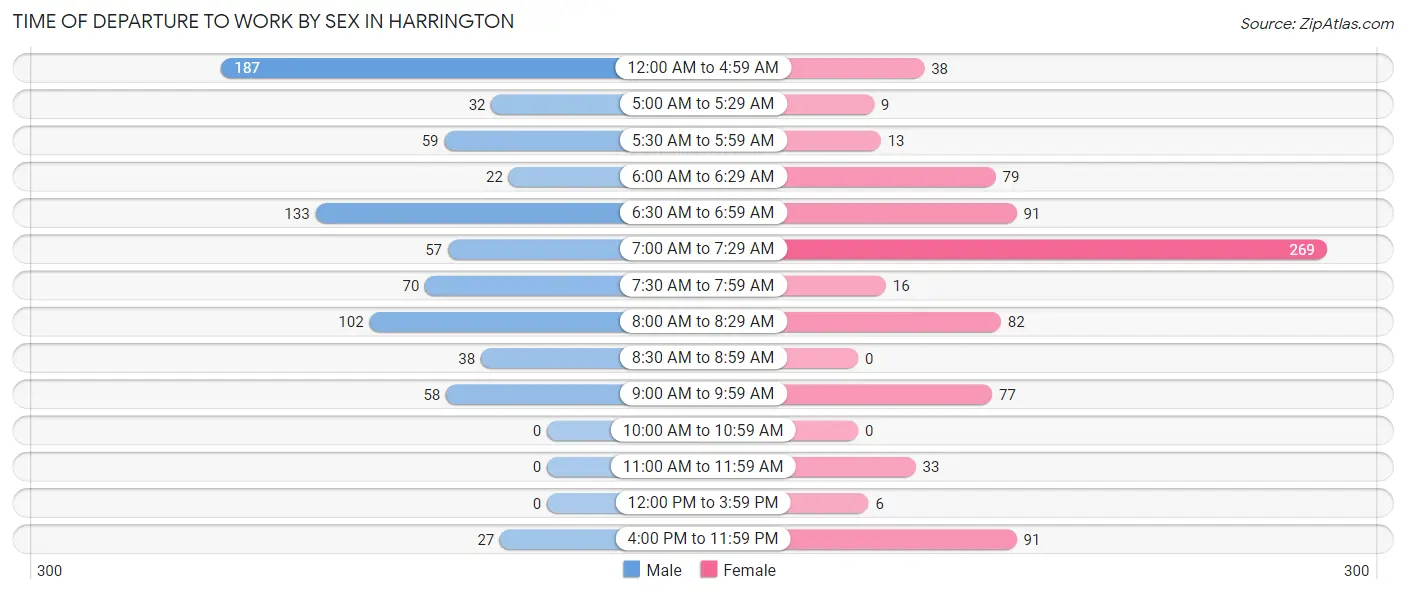
| Time of Departure | Male | Female |
| 12:00 AM to 4:59 AM | 187 (23.8%) | 38 (4.7%) |
| 5:00 AM to 5:29 AM | 32 (4.1%) | 9 (1.1%) |
| 5:30 AM to 5:59 AM | 59 (7.5%) | 13 (1.6%) |
| 6:00 AM to 6:29 AM | 22 (2.8%) | 79 (9.8%) |
| 6:30 AM to 6:59 AM | 133 (16.9%) | 91 (11.3%) |
| 7:00 AM to 7:29 AM | 57 (7.3%) | 269 (33.5%) |
| 7:30 AM to 7:59 AM | 70 (8.9%) | 16 (2.0%) |
| 8:00 AM to 8:29 AM | 102 (13.0%) | 82 (10.2%) |
| 8:30 AM to 8:59 AM | 38 (4.8%) | 0 (0.0%) |
| 9:00 AM to 9:59 AM | 58 (7.4%) | 77 (9.6%) |
| 10:00 AM to 10:59 AM | 0 (0.0%) | 0 (0.0%) |
| 11:00 AM to 11:59 AM | 0 (0.0%) | 33 (4.1%) |
| 12:00 PM to 3:59 PM | 0 (0.0%) | 6 (0.7%) |
| 4:00 PM to 11:59 PM | 27 (3.4%) | 91 (11.3%) |
| Total | 785 (100.0%) | 804 (100.0%) |
Housing Occupancy in Harrington
Occupancy by Ownership in Harrington
Of the total 1,458 dwellings in Harrington, owner-occupied units account for 831 (57.0%), while renter-occupied units make up 627 (43.0%).
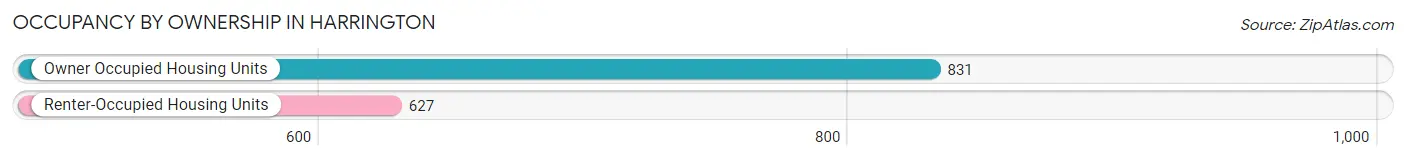
| Occupancy | # Housing Units | % Housing Units |
| Owner Occupied Housing Units | 831 | 57.0% |
| Renter-Occupied Housing Units | 627 | 43.0% |
| Total Occupied Housing Units | 1,458 | 100.0% |
Occupancy by Household Size in Harrington
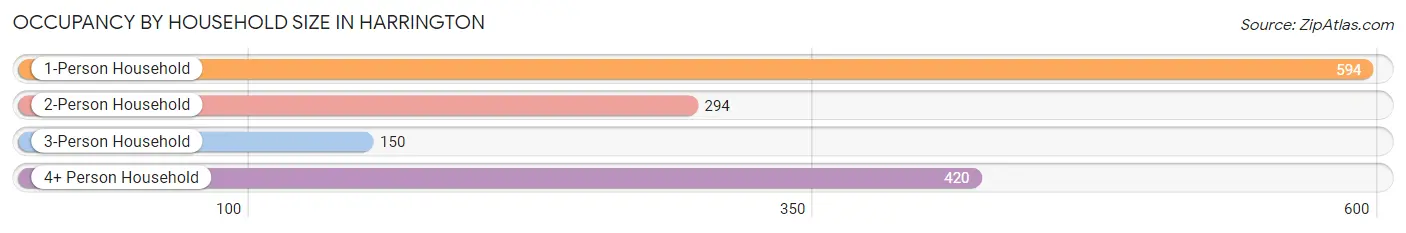
| Household Size | # Housing Units | % Housing Units |
| 1-Person Household | 594 | 40.7% |
| 2-Person Household | 294 | 20.2% |
| 3-Person Household | 150 | 10.3% |
| 4+ Person Household | 420 | 28.8% |
| Total Housing Units | 1,458 | 100.0% |
Occupancy by Ownership by Household Size in Harrington
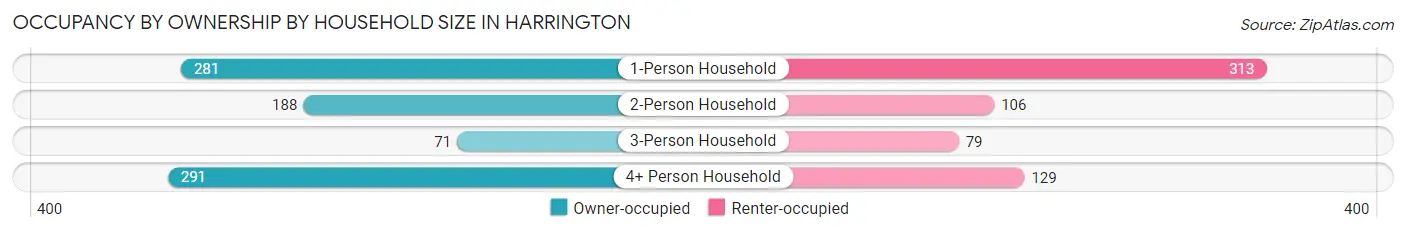
| Household Size | Owner-occupied | Renter-occupied |
| 1-Person Household | 281 (47.3%) | 313 (52.7%) |
| 2-Person Household | 188 (63.9%) | 106 (36.0%) |
| 3-Person Household | 71 (47.3%) | 79 (52.7%) |
| 4+ Person Household | 291 (69.3%) | 129 (30.7%) |
| Total Housing Units | 831 (57.0%) | 627 (43.0%) |
Occupancy by Educational Attainment in Harrington
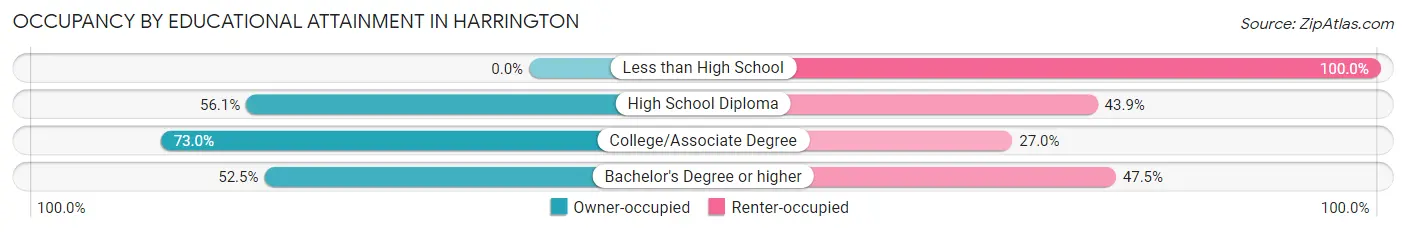
| Household Size | Owner-occupied | Renter-occupied |
| Less than High School | 0 (0.0%) | 109 (100.0%) |
| High School Diploma | 235 (56.1%) | 184 (43.9%) |
| College/Associate Degree | 384 (73.0%) | 142 (27.0%) |
| Bachelor's Degree or higher | 212 (52.5%) | 192 (47.5%) |
Occupancy by Age of Householder in Harrington
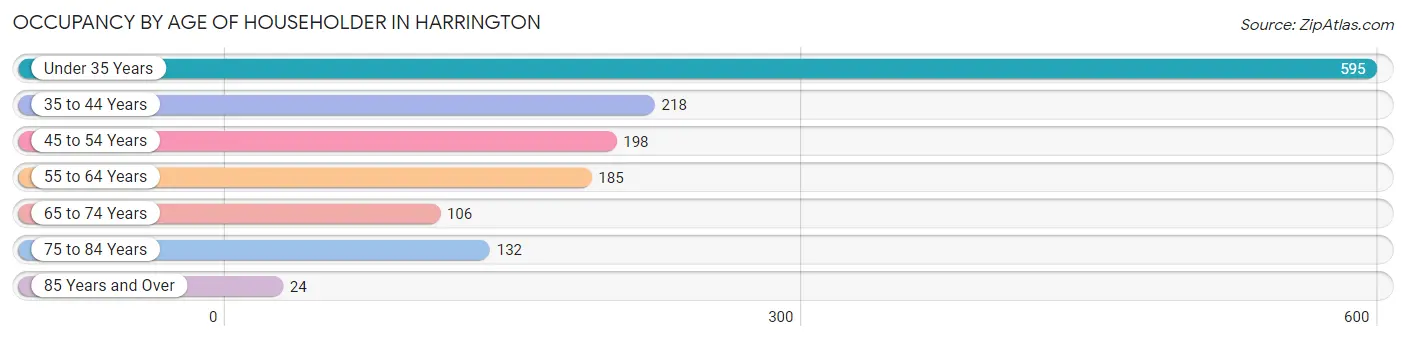
| Age Bracket | # Households | % Households |
| Under 35 Years | 595 | 40.8% |
| 35 to 44 Years | 218 | 14.9% |
| 45 to 54 Years | 198 | 13.6% |
| 55 to 64 Years | 185 | 12.7% |
| 65 to 74 Years | 106 | 7.3% |
| 75 to 84 Years | 132 | 9.0% |
| 85 Years and Over | 24 | 1.7% |
| Total | 1,458 | 100.0% |
Housing Finances in Harrington
Median Income by Occupancy in Harrington
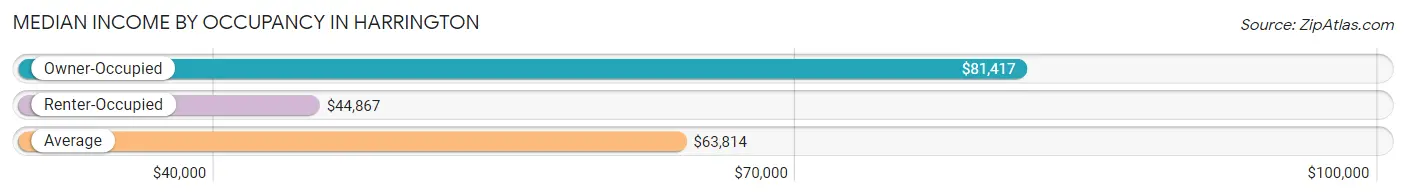
| Occupancy Type | # Households | Median Income |
| Owner-Occupied | 831 (57.0%) | $81,417 |
| Renter-Occupied | 627 (43.0%) | $44,867 |
| Average | 1,458 (100.0%) | $63,814 |
Occupancy by Householder Income Bracket in Harrington
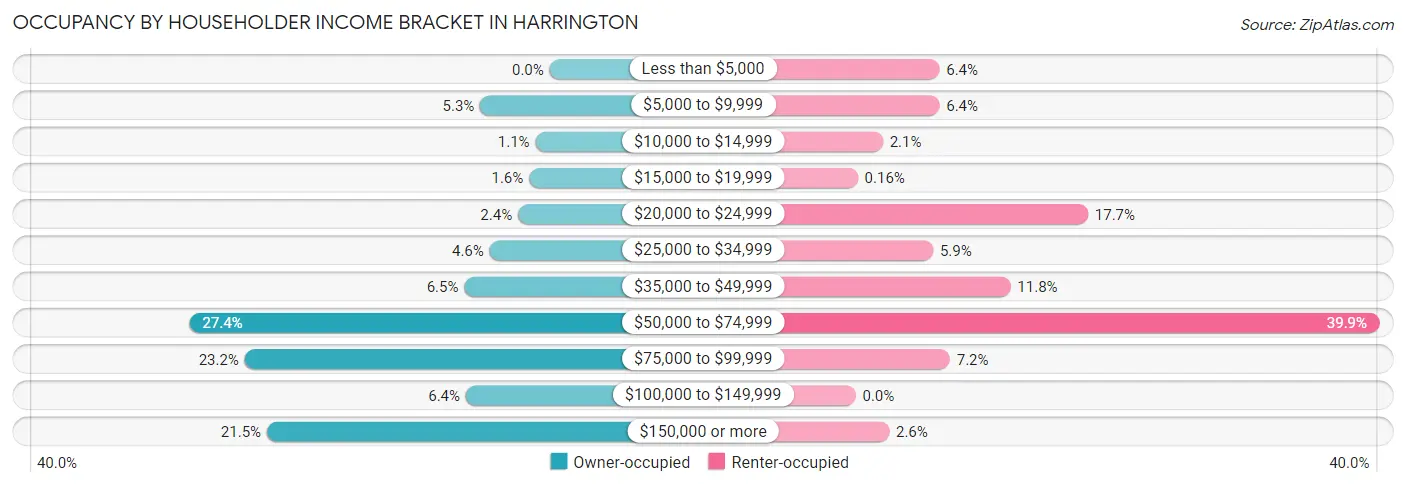
| Income Bracket | Owner-occupied | Renter-occupied |
| Less than $5,000 | 0 (0.0%) | 40 (6.4%) |
| $5,000 to $9,999 | 44 (5.3%) | 40 (6.4%) |
| $10,000 to $14,999 | 9 (1.1%) | 13 (2.1%) |
| $15,000 to $19,999 | 13 (1.6%) | 1 (0.2%) |
| $20,000 to $24,999 | 20 (2.4%) | 111 (17.7%) |
| $25,000 to $34,999 | 38 (4.6%) | 37 (5.9%) |
| $35,000 to $49,999 | 54 (6.5%) | 74 (11.8%) |
| $50,000 to $74,999 | 228 (27.4%) | 250 (39.9%) |
| $75,000 to $99,999 | 193 (23.2%) | 45 (7.2%) |
| $100,000 to $149,999 | 53 (6.4%) | 0 (0.0%) |
| $150,000 or more | 179 (21.5%) | 16 (2.5%) |
| Total | 831 (100.0%) | 627 (100.0%) |
Monthly Housing Cost Tiers in Harrington

| Monthly Cost | Owner-occupied | Renter-occupied |
| Less than $300 | 80 (9.6%) | 13 (2.1%) |
| $300 to $499 | 63 (7.6%) | 34 (5.4%) |
| $500 to $799 | 40 (4.8%) | 121 (19.3%) |
| $800 to $999 | 145 (17.4%) | 16 (2.5%) |
| $1,000 to $1,499 | 343 (41.3%) | 330 (52.6%) |
| $1,500 to $1,999 | 160 (19.3%) | 113 (18.0%) |
| $2,000 to $2,499 | 0 (0.0%) | 0 (0.0%) |
| $2,500 to $2,999 | 0 (0.0%) | 0 (0.0%) |
| $3,000 or more | 0 (0.0%) | 0 (0.0%) |
| Total | 831 (100.0%) | 627 (100.0%) |
Physical Housing Characteristics in Harrington
Housing Structures in Harrington
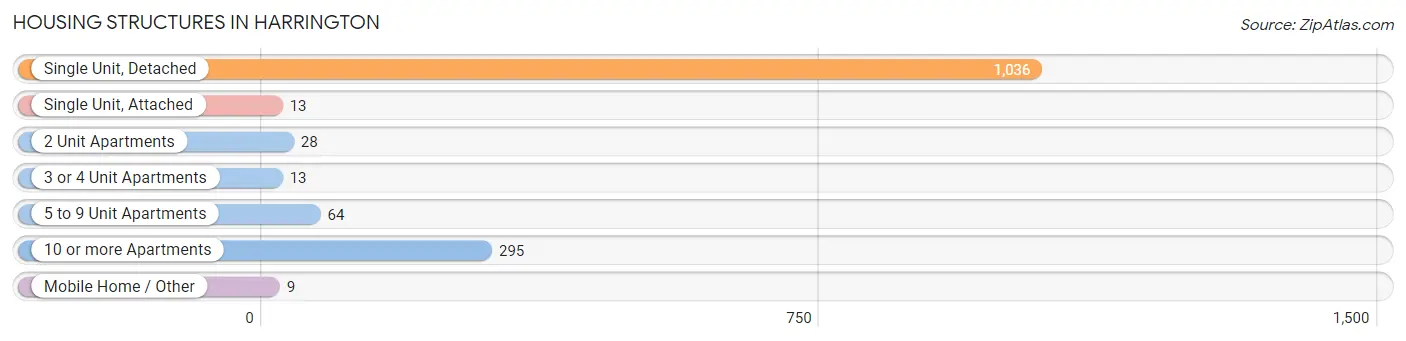
| Structure Type | # Housing Units | % Housing Units |
| Single Unit, Detached | 1,036 | 71.1% |
| Single Unit, Attached | 13 | 0.9% |
| 2 Unit Apartments | 28 | 1.9% |
| 3 or 4 Unit Apartments | 13 | 0.9% |
| 5 to 9 Unit Apartments | 64 | 4.4% |
| 10 or more Apartments | 295 | 20.2% |
| Mobile Home / Other | 9 | 0.6% |
| Total | 1,458 | 100.0% |
Housing Structures by Occupancy in Harrington
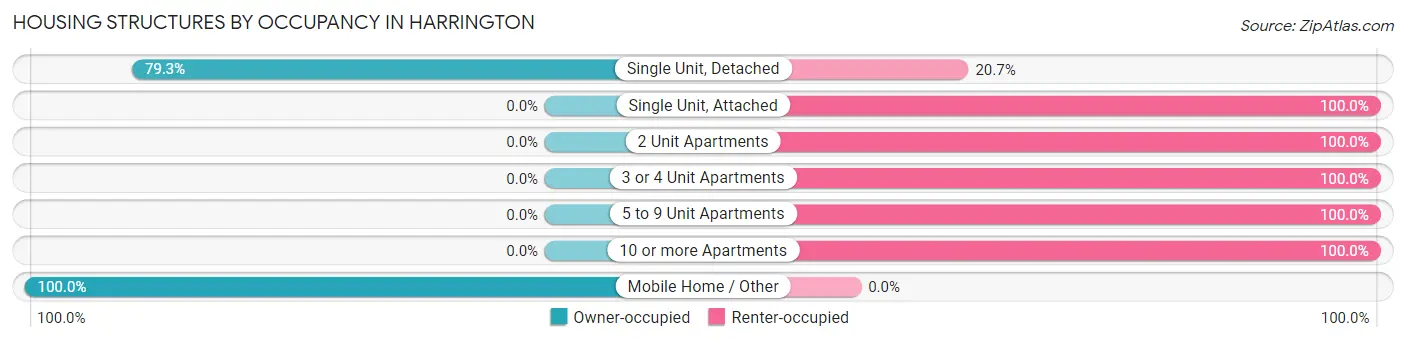
| Structure Type | Owner-occupied | Renter-occupied |
| Single Unit, Detached | 822 (79.3%) | 214 (20.7%) |
| Single Unit, Attached | 0 (0.0%) | 13 (100.0%) |
| 2 Unit Apartments | 0 (0.0%) | 28 (100.0%) |
| 3 or 4 Unit Apartments | 0 (0.0%) | 13 (100.0%) |
| 5 to 9 Unit Apartments | 0 (0.0%) | 64 (100.0%) |
| 10 or more Apartments | 0 (0.0%) | 295 (100.0%) |
| Mobile Home / Other | 9 (100.0%) | 0 (0.0%) |
| Total | 831 (57.0%) | 627 (43.0%) |
Housing Structures by Number of Rooms in Harrington
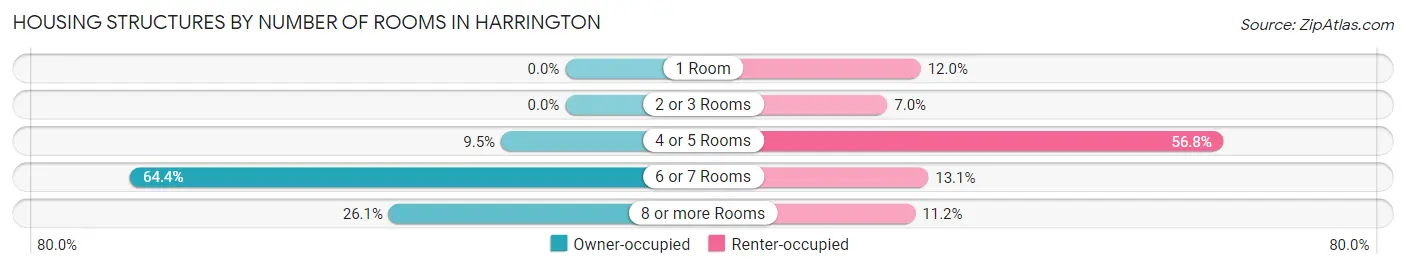
| Number of Rooms | Owner-occupied | Renter-occupied |
| 1 Room | 0 (0.0%) | 75 (12.0%) |
| 2 or 3 Rooms | 0 (0.0%) | 44 (7.0%) |
| 4 or 5 Rooms | 79 (9.5%) | 356 (56.8%) |
| 6 or 7 Rooms | 535 (64.4%) | 82 (13.1%) |
| 8 or more Rooms | 217 (26.1%) | 70 (11.2%) |
| Total | 831 (100.0%) | 627 (100.0%) |
Housing Structure by Heating Type in Harrington
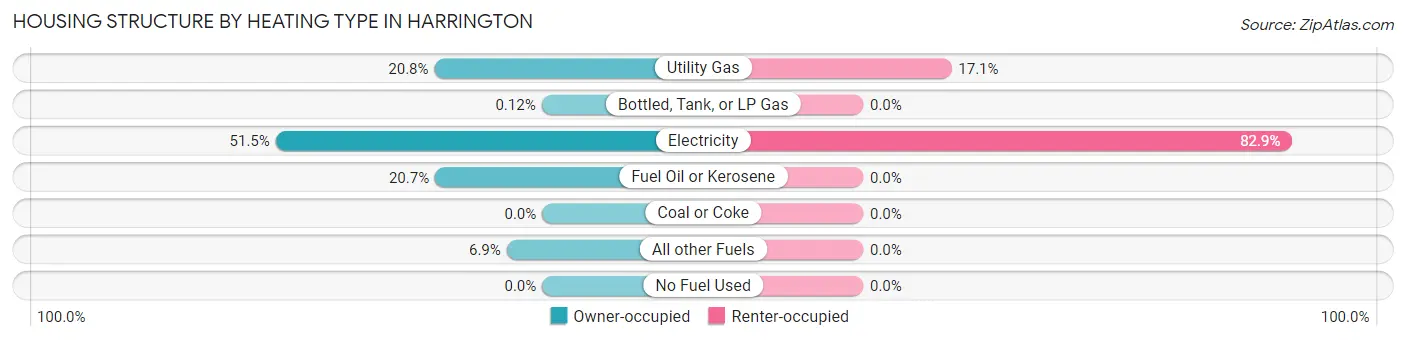
| Heating Type | Owner-occupied | Renter-occupied |
| Utility Gas | 173 (20.8%) | 107 (17.1%) |
| Bottled, Tank, or LP Gas | 1 (0.1%) | 0 (0.0%) |
| Electricity | 428 (51.5%) | 520 (82.9%) |
| Fuel Oil or Kerosene | 172 (20.7%) | 0 (0.0%) |
| Coal or Coke | 0 (0.0%) | 0 (0.0%) |
| All other Fuels | 57 (6.9%) | 0 (0.0%) |
| No Fuel Used | 0 (0.0%) | 0 (0.0%) |
| Total | 831 (100.0%) | 627 (100.0%) |
Household Vehicle Usage in Harrington
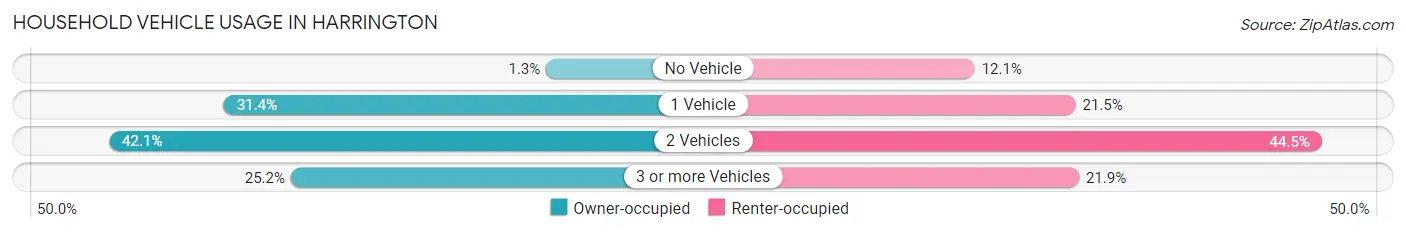
| Vehicles per Household | Owner-occupied | Renter-occupied |
| No Vehicle | 11 (1.3%) | 76 (12.1%) |
| 1 Vehicle | 261 (31.4%) | 135 (21.5%) |
| 2 Vehicles | 350 (42.1%) | 279 (44.5%) |
| 3 or more Vehicles | 209 (25.2%) | 137 (21.8%) |
| Total | 831 (100.0%) | 627 (100.0%) |
Real Estate & Mortgages in Harrington
Real Estate and Mortgage Overview in Harrington
| Characteristic | Without Mortgage | With Mortgage |
| Housing Units | 174 | 657 |
| Median Property Value | $130,400 | $205,100 |
| Median Household Income | $38,354 | $174 |
| Monthly Housing Costs | $329 | $0 |
| Real Estate Taxes | $554 | $39 |
Property Value by Mortgage Status in Harrington

| Property Value | Without Mortgage | With Mortgage |
| Less than $50,000 | 29 (16.7%) | 0 (0.0%) |
| $50,000 to $99,999 | 41 (23.6%) | 0 (0.0%) |
| $100,000 to $299,999 | 92 (52.9%) | 618 (94.1%) |
| $300,000 to $499,999 | 12 (6.9%) | 30 (4.6%) |
| $500,000 to $749,999 | 0 (0.0%) | 9 (1.4%) |
| $750,000 to $999,999 | 0 (0.0%) | 0 (0.0%) |
| $1,000,000 or more | 0 (0.0%) | 0 (0.0%) |
| Total | 174 (100.0%) | 657 (100.0%) |
Household Income by Mortgage Status in Harrington
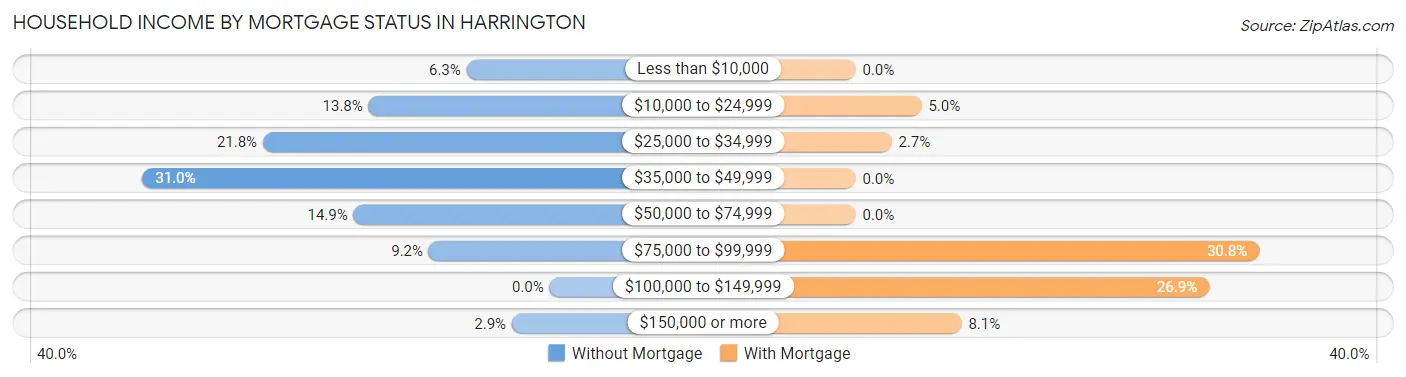
| Household Income | Without Mortgage | With Mortgage |
| Less than $10,000 | 11 (6.3%) | 0 (0.0%) |
| $10,000 to $24,999 | 24 (13.8%) | 33 (5.0%) |
| $25,000 to $34,999 | 38 (21.8%) | 18 (2.7%) |
| $35,000 to $49,999 | 54 (31.0%) | 0 (0.0%) |
| $50,000 to $74,999 | 26 (14.9%) | 0 (0.0%) |
| $75,000 to $99,999 | 16 (9.2%) | 202 (30.7%) |
| $100,000 to $149,999 | 0 (0.0%) | 177 (26.9%) |
| $150,000 or more | 5 (2.9%) | 53 (8.1%) |
| Total | 174 (100.0%) | 657 (100.0%) |
Property Value to Household Income Ratio in Harrington
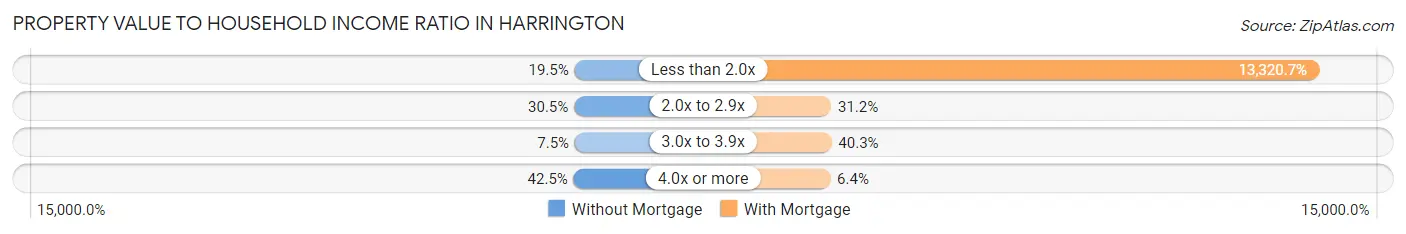
| Value-to-Income Ratio | Without Mortgage | With Mortgage |
| Less than 2.0x | 34 (19.5%) | 87,517 (13,320.7%) |
| 2.0x to 2.9x | 53 (30.5%) | 205 (31.2%) |
| 3.0x to 3.9x | 13 (7.5%) | 265 (40.3%) |
| 4.0x or more | 74 (42.5%) | 42 (6.4%) |
| Total | 174 (100.0%) | 657 (100.0%) |
Real Estate Taxes by Mortgage Status in Harrington
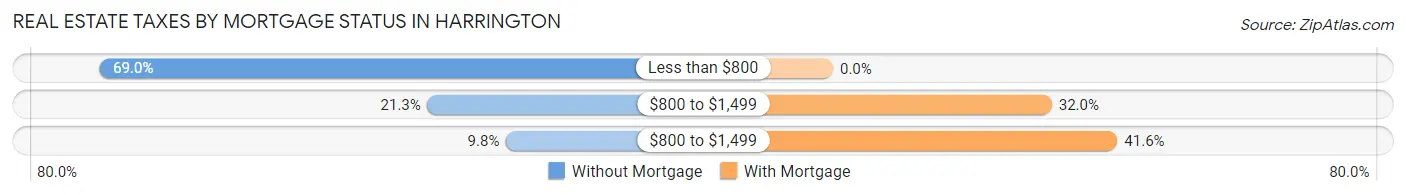
| Property Taxes | Without Mortgage | With Mortgage |
| Less than $800 | 120 (69.0%) | 0 (0.0%) |
| $800 to $1,499 | 37 (21.3%) | 210 (32.0%) |
| $800 to $1,499 | 17 (9.8%) | 273 (41.5%) |
| Total | 174 (100.0%) | 657 (100.0%) |
Health & Disability in Harrington
Health Insurance Coverage by Age in Harrington
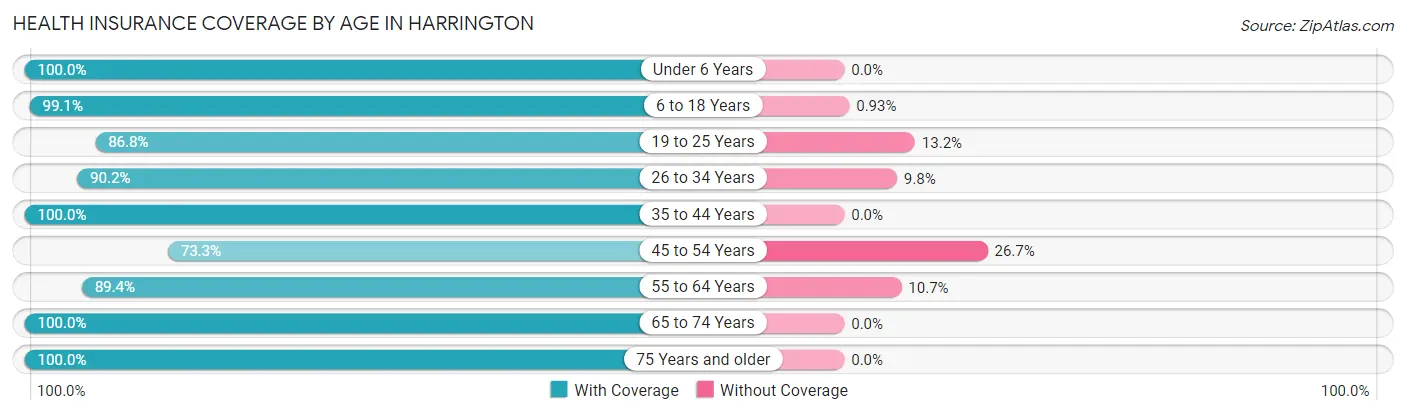
| Age Bracket | With Coverage | Without Coverage |
| Under 6 Years | 661 (100.0%) | 0 (0.0%) |
| 6 to 18 Years | 638 (99.1%) | 6 (0.9%) |
| 19 to 25 Years | 211 (86.8%) | 32 (13.2%) |
| 26 to 34 Years | 846 (90.2%) | 92 (9.8%) |
| 35 to 44 Years | 302 (100.0%) | 0 (0.0%) |
| 45 to 54 Years | 203 (73.3%) | 74 (26.7%) |
| 55 to 64 Years | 302 (89.3%) | 36 (10.6%) |
| 65 to 74 Years | 211 (100.0%) | 0 (0.0%) |
| 75 Years and older | 156 (100.0%) | 0 (0.0%) |
| Total | 3,530 (93.6%) | 240 (6.4%) |
Health Insurance Coverage by Citizenship Status in Harrington
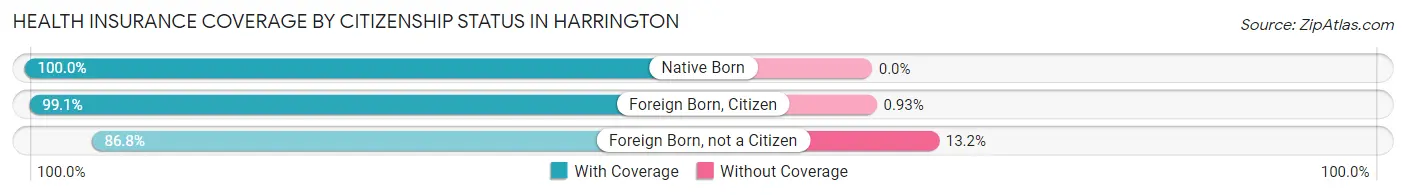
| Citizenship Status | With Coverage | Without Coverage |
| Native Born | 661 (100.0%) | 0 (0.0%) |
| Foreign Born, Citizen | 638 (99.1%) | 6 (0.9%) |
| Foreign Born, not a Citizen | 211 (86.8%) | 32 (13.2%) |
Health Insurance Coverage by Household Income in Harrington
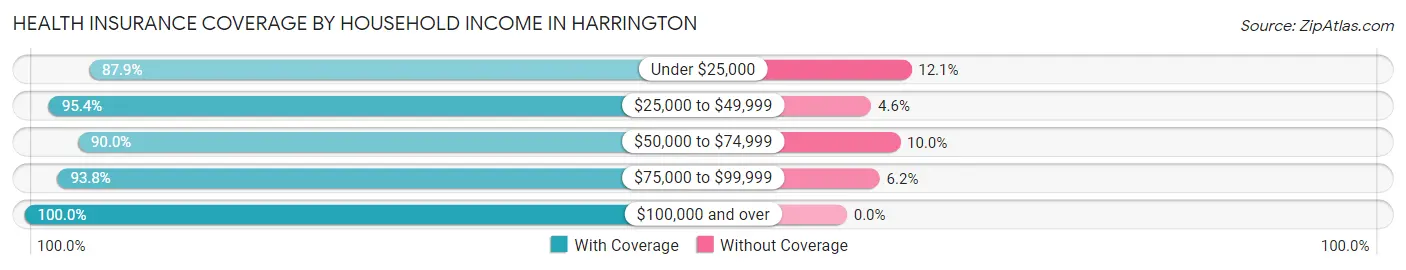
| Household Income | With Coverage | Without Coverage |
| Under $25,000 | 553 (87.9%) | 76 (12.1%) |
| $25,000 to $49,999 | 335 (95.4%) | 16 (4.6%) |
| $50,000 to $74,999 | 928 (90.0%) | 103 (10.0%) |
| $75,000 to $99,999 | 685 (93.8%) | 45 (6.2%) |
| $100,000 and over | 1,029 (100.0%) | 0 (0.0%) |
Public vs Private Health Insurance Coverage by Age in Harrington
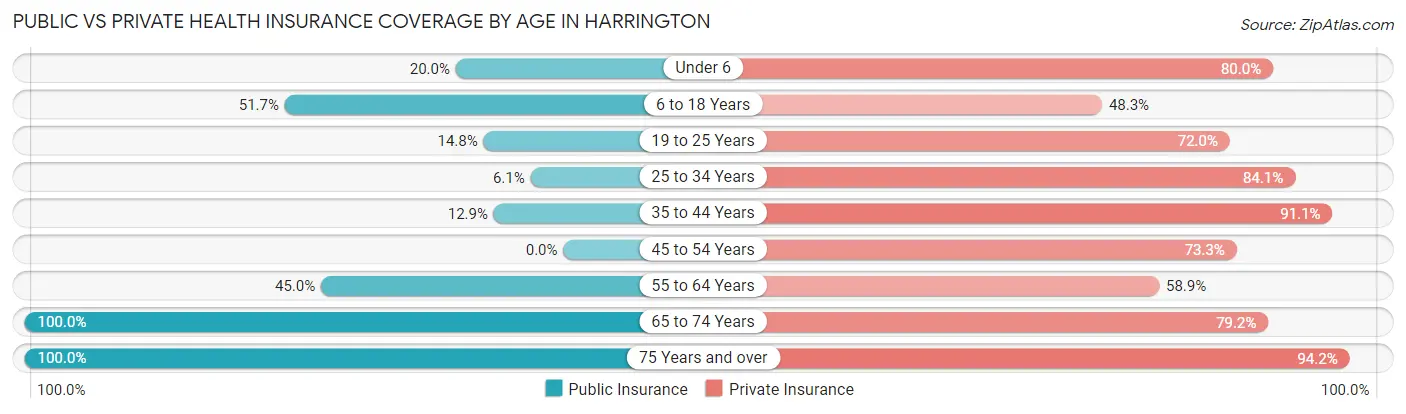
| Age Bracket | Public Insurance | Private Insurance |
| Under 6 | 132 (20.0%) | 529 (80.0%) |
| 6 to 18 Years | 333 (51.7%) | 311 (48.3%) |
| 19 to 25 Years | 36 (14.8%) | 175 (72.0%) |
| 25 to 34 Years | 57 (6.1%) | 789 (84.1%) |
| 35 to 44 Years | 39 (12.9%) | 275 (91.1%) |
| 45 to 54 Years | 0 (0.0%) | 203 (73.3%) |
| 55 to 64 Years | 152 (45.0%) | 199 (58.9%) |
| 65 to 74 Years | 211 (100.0%) | 167 (79.1%) |
| 75 Years and over | 156 (100.0%) | 147 (94.2%) |
| Total | 1,116 (29.6%) | 2,795 (74.1%) |
Disability Status by Sex by Age in Harrington
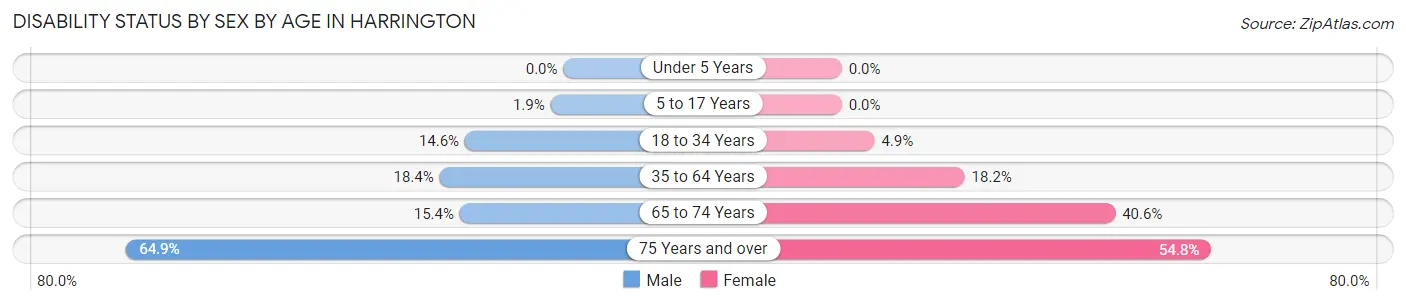
| Age Bracket | Male | Female |
| Under 5 Years | 0 (0.0%) | 0 (0.0%) |
| 5 to 17 Years | 5 (1.9%) | 0 (0.0%) |
| 18 to 34 Years | 83 (14.6%) | 30 (4.9%) |
| 35 to 64 Years | 89 (18.4%) | 79 (18.2%) |
| 65 to 74 Years | 12 (15.4%) | 54 (40.6%) |
| 75 Years and over | 61 (64.9%) | 34 (54.8%) |
Disability Class by Sex by Age in Harrington
Disability Class: Hearing Difficulty
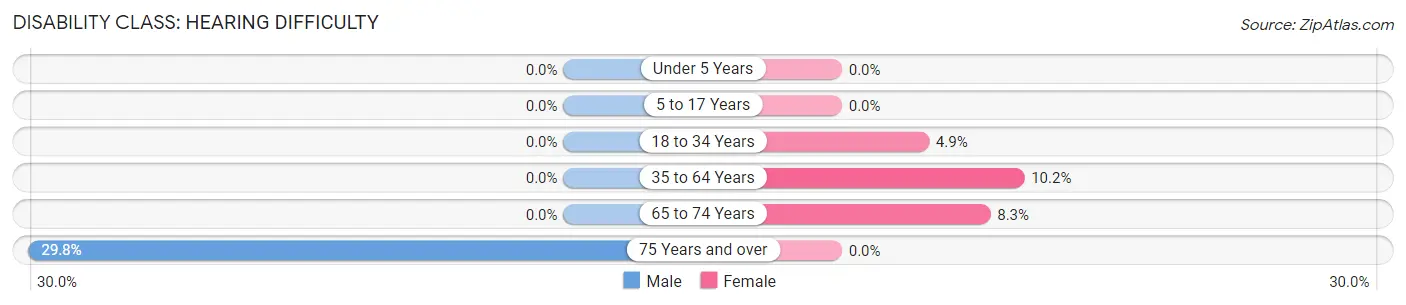
| Age Bracket | Male | Female |
| Under 5 Years | 0 (0.0%) | 0 (0.0%) |
| 5 to 17 Years | 0 (0.0%) | 0 (0.0%) |
| 18 to 34 Years | 0 (0.0%) | 30 (4.9%) |
| 35 to 64 Years | 0 (0.0%) | 44 (10.2%) |
| 65 to 74 Years | 0 (0.0%) | 11 (8.3%) |
| 75 Years and over | 28 (29.8%) | 0 (0.0%) |
Disability Class: Vision Difficulty
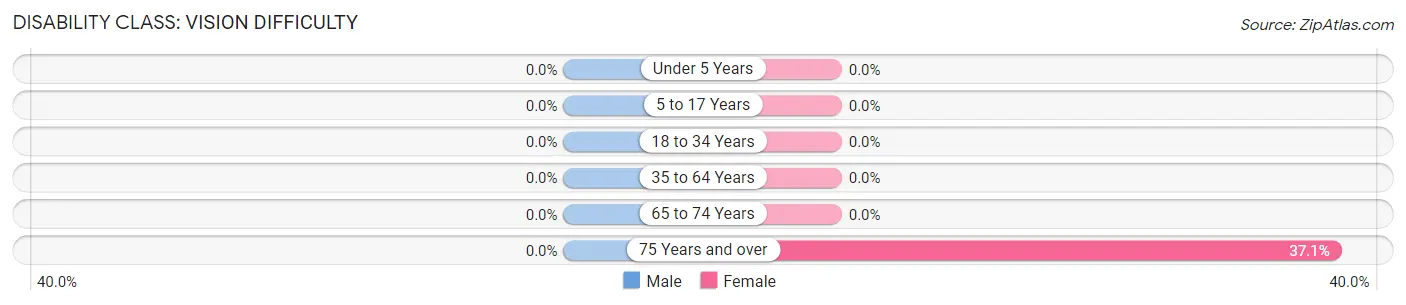
| Age Bracket | Male | Female |
| Under 5 Years | 0 (0.0%) | 0 (0.0%) |
| 5 to 17 Years | 0 (0.0%) | 0 (0.0%) |
| 18 to 34 Years | 0 (0.0%) | 0 (0.0%) |
| 35 to 64 Years | 0 (0.0%) | 0 (0.0%) |
| 65 to 74 Years | 0 (0.0%) | 0 (0.0%) |
| 75 Years and over | 0 (0.0%) | 23 (37.1%) |
Disability Class: Cognitive Difficulty
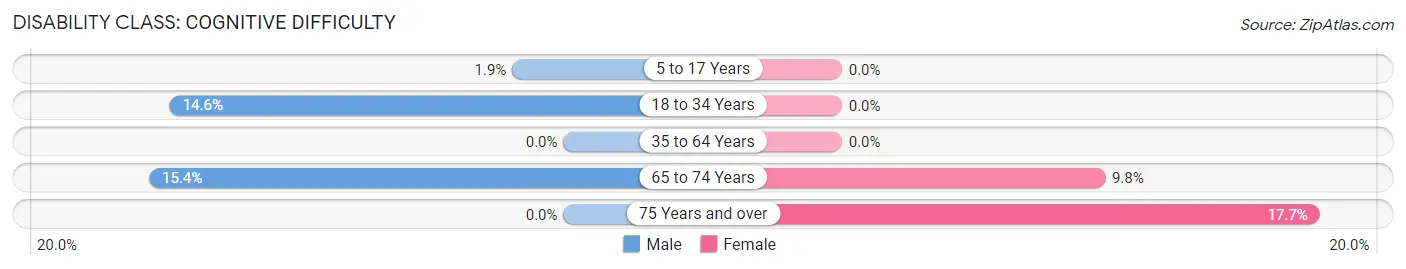
| Age Bracket | Male | Female |
| 5 to 17 Years | 5 (1.9%) | 0 (0.0%) |
| 18 to 34 Years | 83 (14.6%) | 0 (0.0%) |
| 35 to 64 Years | 0 (0.0%) | 0 (0.0%) |
| 65 to 74 Years | 12 (15.4%) | 13 (9.8%) |
| 75 Years and over | 0 (0.0%) | 11 (17.7%) |
Disability Class: Ambulatory Difficulty
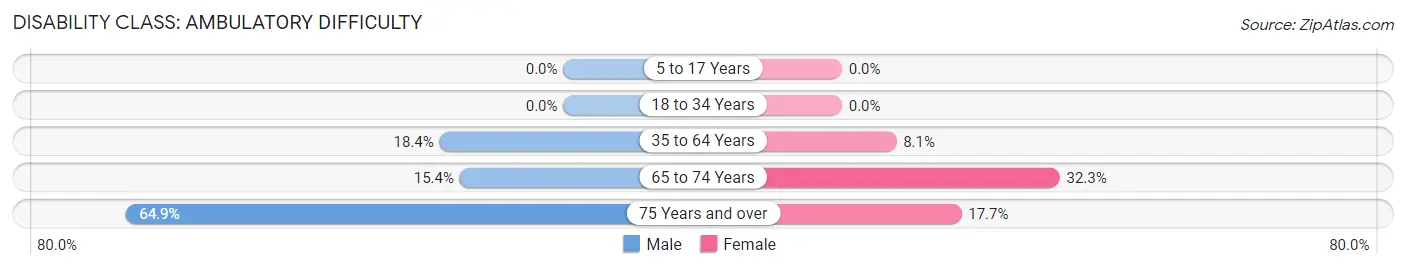
| Age Bracket | Male | Female |
| 5 to 17 Years | 0 (0.0%) | 0 (0.0%) |
| 18 to 34 Years | 0 (0.0%) | 0 (0.0%) |
| 35 to 64 Years | 89 (18.4%) | 35 (8.1%) |
| 65 to 74 Years | 12 (15.4%) | 43 (32.3%) |
| 75 Years and over | 61 (64.9%) | 11 (17.7%) |
Disability Class: Self-Care Difficulty
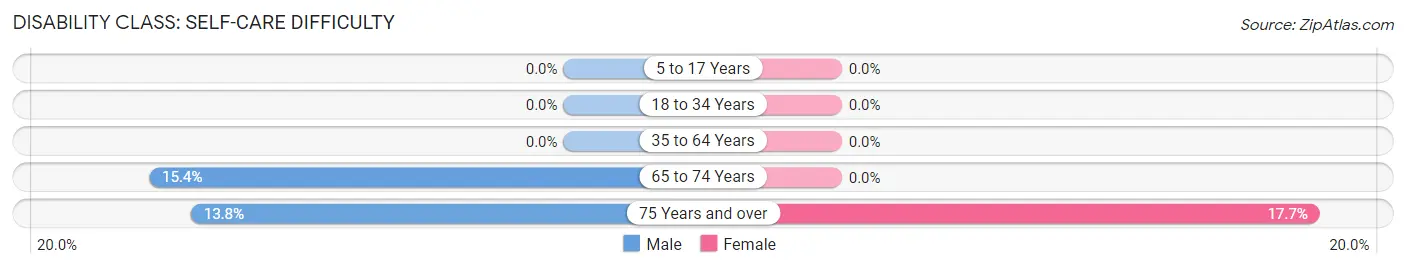
| Age Bracket | Male | Female |
| 5 to 17 Years | 0 (0.0%) | 0 (0.0%) |
| 18 to 34 Years | 0 (0.0%) | 0 (0.0%) |
| 35 to 64 Years | 0 (0.0%) | 0 (0.0%) |
| 65 to 74 Years | 12 (15.4%) | 0 (0.0%) |
| 75 Years and over | 13 (13.8%) | 11 (17.7%) |
Technology Access in Harrington
Computing Device Access in Harrington
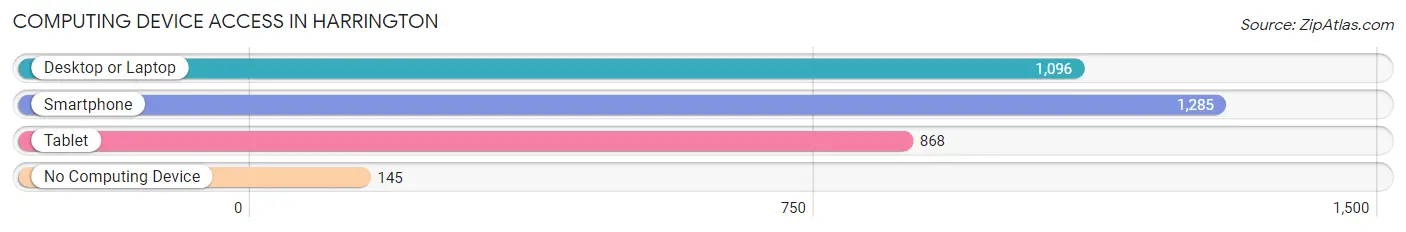
| Device Type | # Households | % Households |
| Desktop or Laptop | 1,096 | 75.2% |
| Smartphone | 1,285 | 88.1% |
| Tablet | 868 | 59.5% |
| No Computing Device | 145 | 10.0% |
| Total | 1,458 | 100.0% |
Internet Access in Harrington
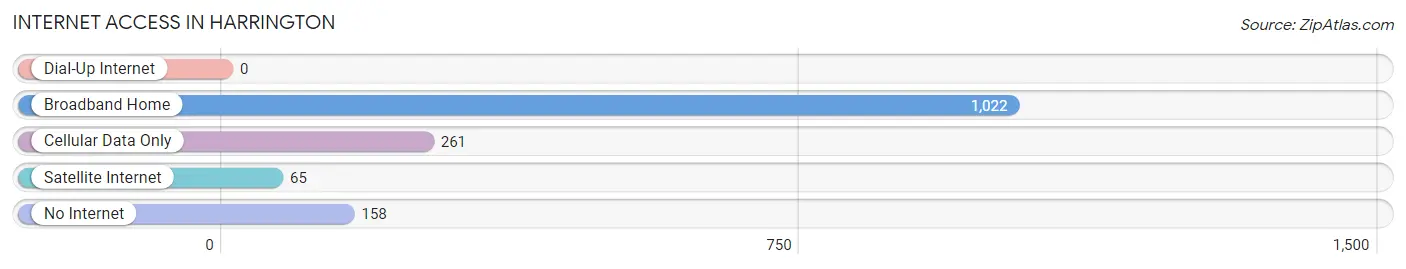
| Internet Type | # Households | % Households |
| Dial-Up Internet | 0 | 0.0% |
| Broadband Home | 1,022 | 70.1% |
| Cellular Data Only | 261 | 17.9% |
| Satellite Internet | 65 | 4.5% |
| No Internet | 158 | 10.8% |
| Total | 1,458 | 100.0% |
Harrington Summary
Harrington, Delaware is a small town located in Kent County, Delaware. It is situated in the heart of the Delmarva Peninsula, and is bordered by the towns of Felton, Greenwood, and Milford. The town has a population of approximately 3,000 people, and is known for its rural charm and small-town atmosphere.
Geography
Harrington is located in the heart of the Delmarva Peninsula, and is bordered by the towns of Felton, Greenwood, and Milford. The town is situated on the banks of the Murderkill River, and is surrounded by rolling hills and farmland. The town is located approximately 30 miles south of Dover, the state capital, and is within easy driving distance of the beaches of the Atlantic Ocean.
The town is divided into two distinct sections, the “Old Town” and the “New Town”. The Old Town is the original settlement of Harrington, and is home to many of the town’s historic buildings and landmarks. The New Town is the more modern section of the town, and is home to many of the town’s businesses and services.
Economy
Harrington’s economy is largely based on agriculture and tourism. The town is home to several large farms, which produce a variety of crops, including corn, soybeans, and wheat. The town is also home to several small businesses, including restaurants, retail stores, and service providers.
The town is also a popular tourist destination, and is home to several attractions, including the Harrington Raceway and Casino, the Harrington Historical Society, and the Harrington Museum of Natural History. The town is also home to several festivals and events throughout the year, including the Harrington Apple Festival and the Harrington Watermelon Festival.
Demographics
As of the 2010 census, the population of Harrington was 3,039. The racial makeup of the town was 87.3% White, 8.2% African American, 0.7% Native American, 0.7% Asian, 0.1% Pacific Islander, and 2.1% from two or more races. Hispanic or Latino of any race were 1.7% of the population.
The median income for a household in the town was $41,944, and the median income for a family was $50,917. The per capita income for the town was $20,845. About 11.2% of families and 14.2% of the population were below the poverty line, including 18.2% of those under age 18 and 8.2% of those age 65 or over.
Conclusion
Harrington, Delaware is a small town located in Kent County, Delaware. It is situated in the heart of the Delmarva Peninsula, and is bordered by the towns of Felton, Greenwood, and Milford. The town has a population of approximately 3,000 people, and is known for its rural charm and small-town atmosphere. The town’s economy is largely based on agriculture and tourism, and the town is home to several attractions, including the Harrington Raceway and Casino, the Harrington Historical Society, and the Harrington Museum of Natural History. As of the 2010 census, the population of Harrington was 3,039, and the median income for a household in the town was $41,944.
Common Questions
What is Per Capita Income in Harrington?
Per Capita income in Harrington is $27,550.
What is the Median Family Income in Harrington?
Median Family Income in Harrington is $85,267.
What is the Median Household income in Harrington?
Median Household Income in Harrington is $63,814.
What is Income or Wage Gap in Harrington?
Income or Wage Gap in Harrington is 18.6%.
Women in Harrington earn 81.4 cents for every dollar earned by a man.
What is Inequality or Gini Index in Harrington?
Inequality or Gini Index in Harrington is 0.37.
What is the Total Population of Harrington?
Total Population of Harrington is 3,770.
What is the Total Male Population of Harrington?
Total Male Population of Harrington is 1,668.
What is the Total Female Population of Harrington?
Total Female Population of Harrington is 2,102.
What is the Ratio of Males per 100 Females in Harrington?
There are 79.35 Males per 100 Females in Harrington.
What is the Ratio of Females per 100 Males in Harrington?
There are 126.02 Females per 100 Males in Harrington.
What is the Median Population Age in Harrington?
Median Population Age in Harrington is 28.7 Years.
What is the Average Family Size in Harrington
Average Family Size in Harrington is 3.6 People.
What is the Average Household Size in Harrington
Average Household Size in Harrington is 2.6 People.
How Large is the Labor Force in Harrington?
There are 1,931 People in the Labor Forcein in Harrington.
What is the Percentage of People in the Labor Force in Harrington?
76.8% of People are in the Labor Force in Harrington.
What is the Unemployment Rate in Harrington?
Unemployment Rate in Harrington is 5.0%.