New Castle, DE Map & Demographics
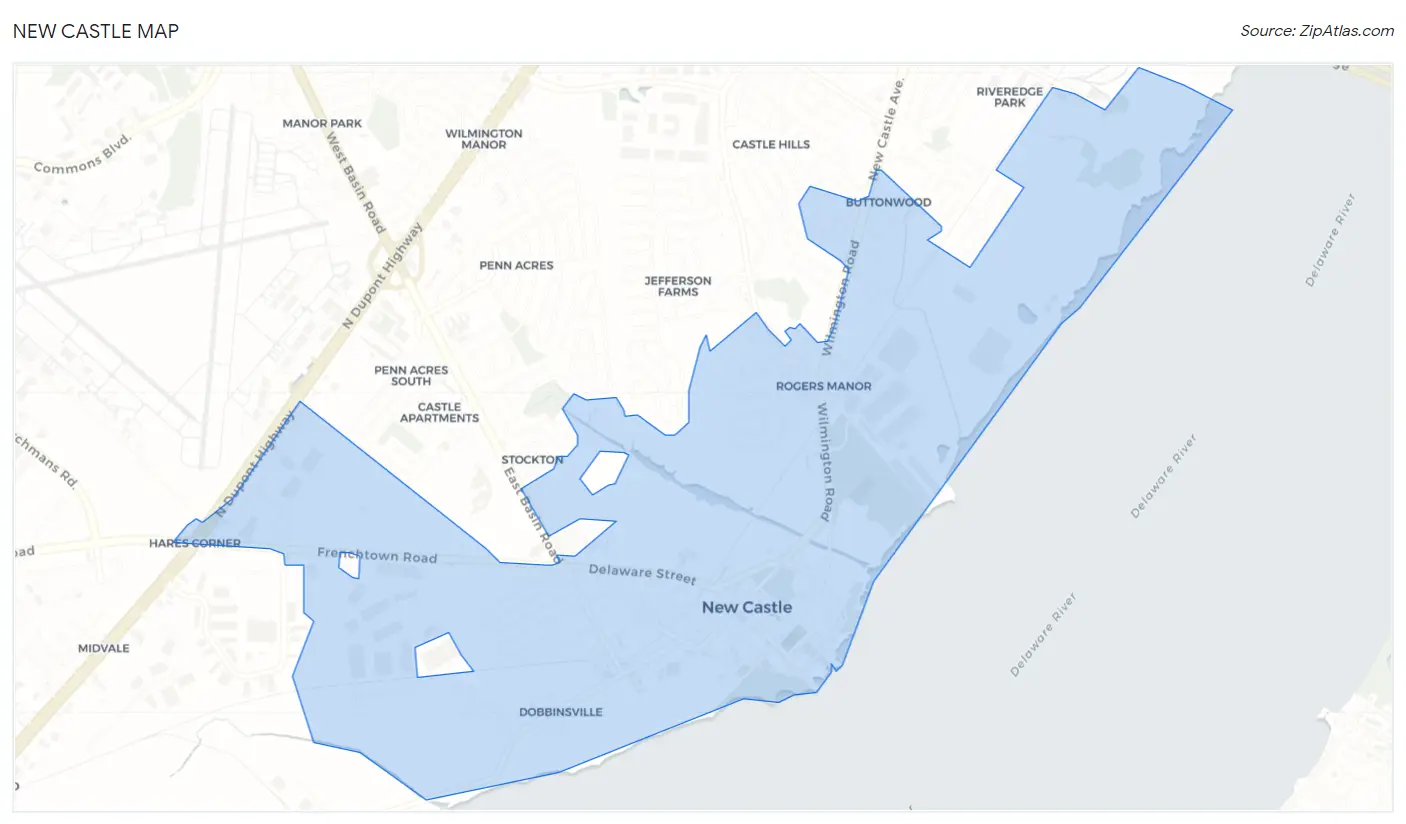
New Castle Map
New Castle Overview
$53,997
PER CAPITA INCOME
$112,500
AVG FAMILY INCOME
$95,884
AVG HOUSEHOLD INCOME
9.4%
WAGE / INCOME GAP [ % ]
90.6¢/ $1
WAGE / INCOME GAP [ $ ]
0.39
INEQUALITY / GINI INDEX
5,523
TOTAL POPULATION
2,712
MALE POPULATION
2,811
FEMALE POPULATION
96.48
MALES / 100 FEMALES
103.65
FEMALES / 100 MALES
49.2
MEDIAN AGE
2.6
AVG FAMILY SIZE
2.0
AVG HOUSEHOLD SIZE
3,319
LABOR FORCE [ PEOPLE ]
68.2%
PERCENT IN LABOR FORCE
1.3%
UNEMPLOYMENT RATE
New Castle Zip Codes
New Castle Area Codes
Income in New Castle
Income Overview in New Castle
Per Capita Income in New Castle is $53,997, while median incomes of families and households are $112,500 and $95,884 respectively.
| Characteristic | Number | Measure |
| Per Capita Income | 5,523 | $53,997 |
| Median Family Income | 1,562 | $112,500 |
| Mean Family Income | 1,562 | $127,064 |
| Median Household Income | 2,711 | $95,884 |
| Mean Household Income | 2,711 | $107,132 |
| Income Deficit | 1,562 | $0 |
| Wage / Income Gap (%) | 5,523 | 9.38% |
| Wage / Income Gap ($) | 5,523 | 90.62¢ per $1 |
| Gini / Inequality Index | 5,523 | 0.39 |
Earnings by Sex in New Castle
Average Earnings in New Castle are $56,314, $58,623 for men and $53,125 for women, a difference of 9.4%.
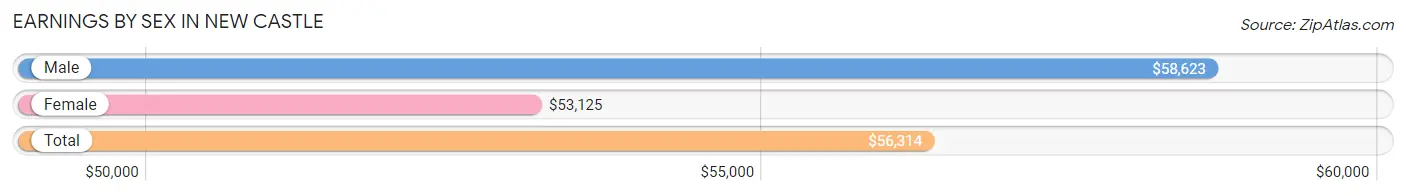
| Sex | Number | Average Earnings |
| Male | 1,759 (49.5%) | $58,623 |
| Female | 1,797 (50.5%) | $53,125 |
| Total | 3,556 (100.0%) | $56,314 |
Earnings by Sex by Income Bracket in New Castle
The most common earnings brackets in New Castle are $100,000+ for men (321 | 18.2%) and $100,000+ for women (252 | 14.0%).
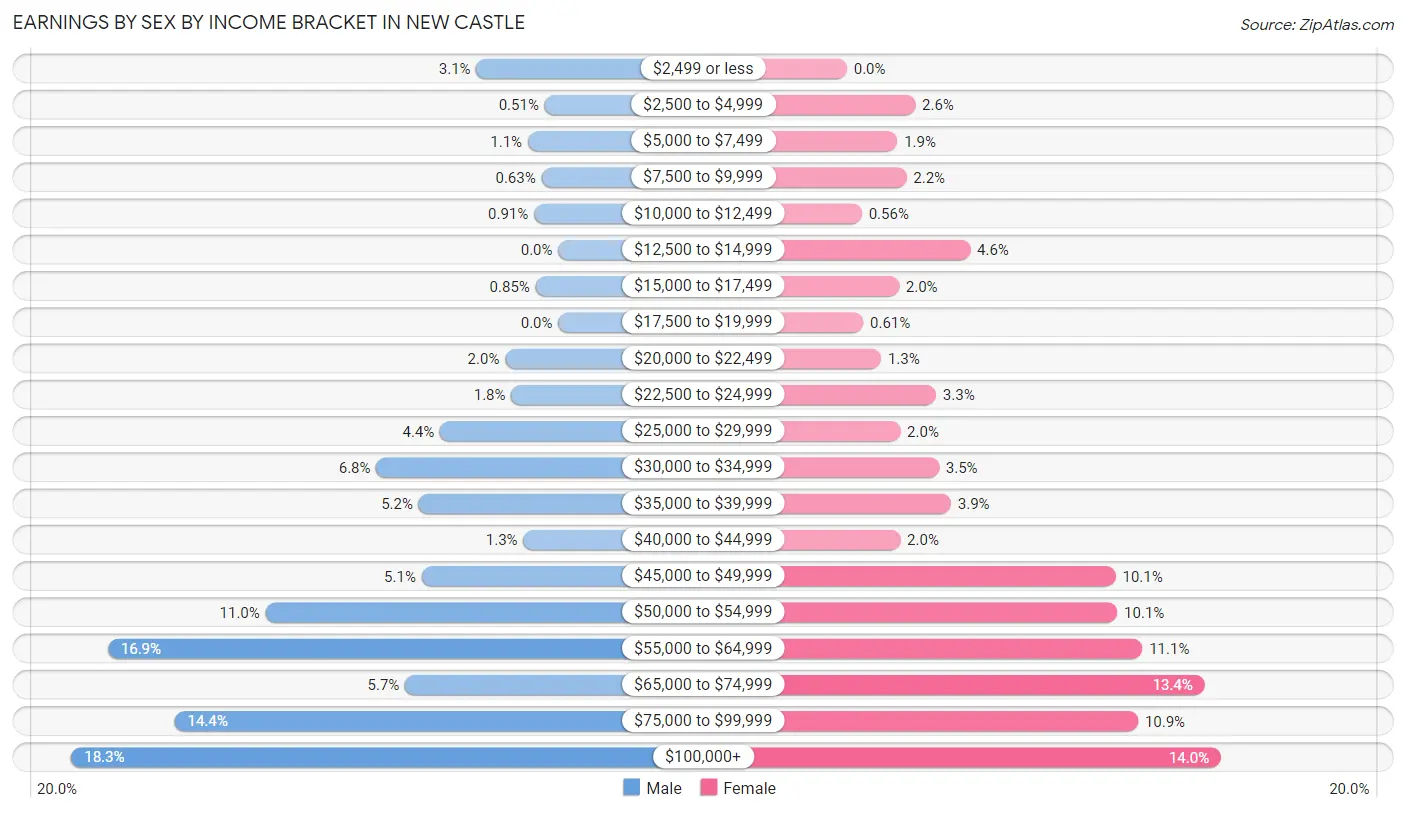
| Income | Male | Female |
| $2,499 or less | 54 (3.1%) | 0 (0.0%) |
| $2,500 to $4,999 | 9 (0.5%) | 46 (2.6%) |
| $5,000 to $7,499 | 20 (1.1%) | 34 (1.9%) |
| $7,500 to $9,999 | 11 (0.6%) | 40 (2.2%) |
| $10,000 to $12,499 | 16 (0.9%) | 10 (0.6%) |
| $12,500 to $14,999 | 0 (0.0%) | 83 (4.6%) |
| $15,000 to $17,499 | 15 (0.9%) | 35 (1.9%) |
| $17,500 to $19,999 | 0 (0.0%) | 11 (0.6%) |
| $20,000 to $22,499 | 35 (2.0%) | 23 (1.3%) |
| $22,500 to $24,999 | 31 (1.8%) | 60 (3.3%) |
| $25,000 to $29,999 | 78 (4.4%) | 36 (2.0%) |
| $30,000 to $34,999 | 120 (6.8%) | 62 (3.5%) |
| $35,000 to $39,999 | 92 (5.2%) | 70 (3.9%) |
| $40,000 to $44,999 | 23 (1.3%) | 36 (2.0%) |
| $45,000 to $49,999 | 90 (5.1%) | 181 (10.1%) |
| $50,000 to $54,999 | 193 (11.0%) | 182 (10.1%) |
| $55,000 to $64,999 | 297 (16.9%) | 199 (11.1%) |
| $65,000 to $74,999 | 101 (5.7%) | 241 (13.4%) |
| $75,000 to $99,999 | 253 (14.4%) | 196 (10.9%) |
| $100,000+ | 321 (18.2%) | 252 (14.0%) |
| Total | 1,759 (100.0%) | 1,797 (100.0%) |
Earnings by Sex by Educational Attainment in New Castle
Average earnings in New Castle are $60,239 for men and $54,911 for women, a difference of 8.8%. Men with an educational attainment of graduate degree enjoy the highest average annual earnings of $96,210, while those with less than high school education earn the least with $33,250. Women with an educational attainment of bachelor's degree earn the most with the average annual earnings of $88,413, while those with high school diploma education have the smallest earnings of $35,714.
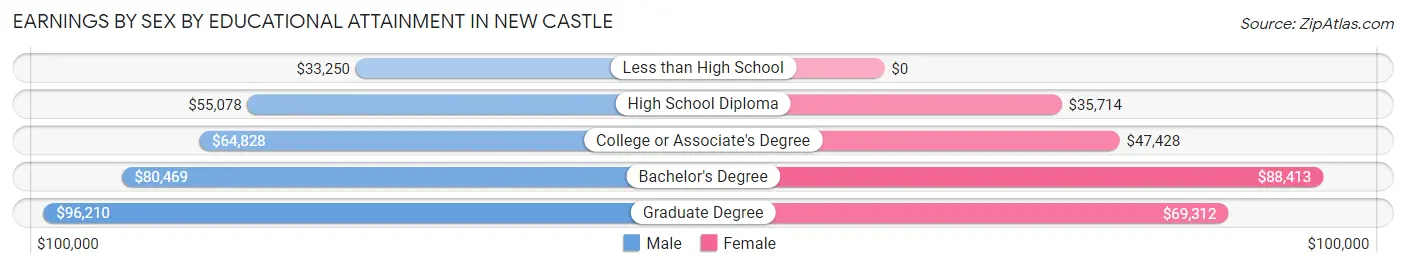
| Educational Attainment | Male Income | Female Income |
| Less than High School | $33,250 | $0 |
| High School Diploma | $55,078 | $35,714 |
| College or Associate's Degree | $64,828 | $47,428 |
| Bachelor's Degree | $80,469 | $88,413 |
| Graduate Degree | $96,210 | $69,312 |
| Total | $60,239 | $54,911 |
Family Income in New Castle
Family Income Brackets in New Castle
According to the New Castle family income data, there are 597 families falling into the $100,000 to $149,999 income range, which is the most common income bracket and makes up 38.2% of all families.
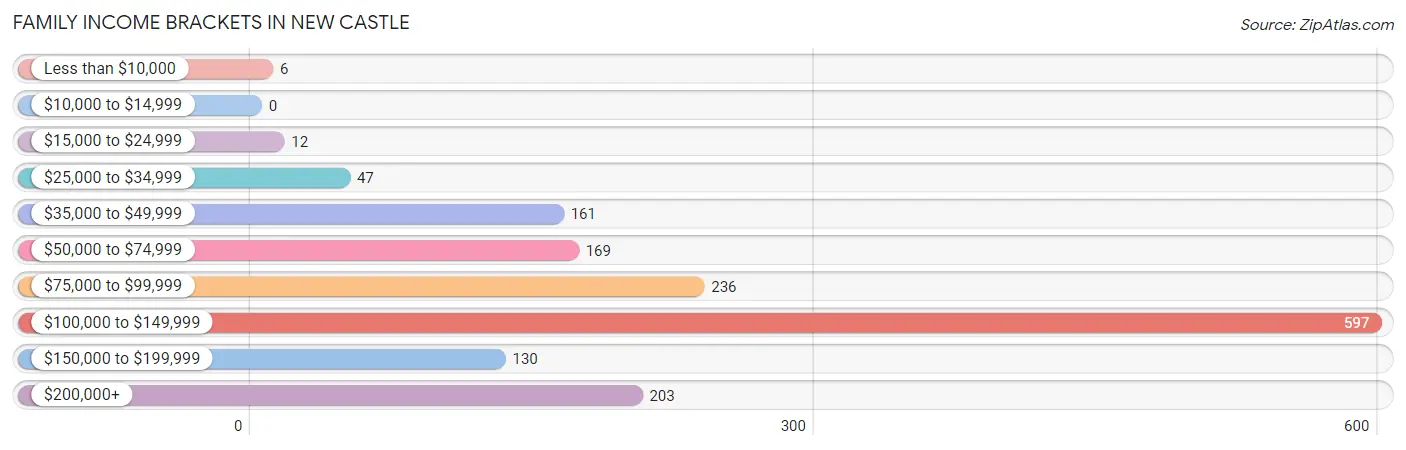
| Income Bracket | # Families | % Families |
| Less than $10,000 | 6 | 0.4% |
| $10,000 to $14,999 | 0 | 0.0% |
| $15,000 to $24,999 | 12 | 0.8% |
| $25,000 to $34,999 | 47 | 3.0% |
| $35,000 to $49,999 | 161 | 10.3% |
| $50,000 to $74,999 | 169 | 10.8% |
| $75,000 to $99,999 | 236 | 15.1% |
| $100,000 to $149,999 | 597 | 38.2% |
| $150,000 to $199,999 | 130 | 8.3% |
| $200,000+ | 203 | 13.0% |
Family Income by Famaliy Size in New Castle
3-person families (284 | 18.2%) account for the highest median family income in New Castle with $115,682 per family, while 2-person families (946 | 60.6%) have the highest median income of $53,306 per family member.
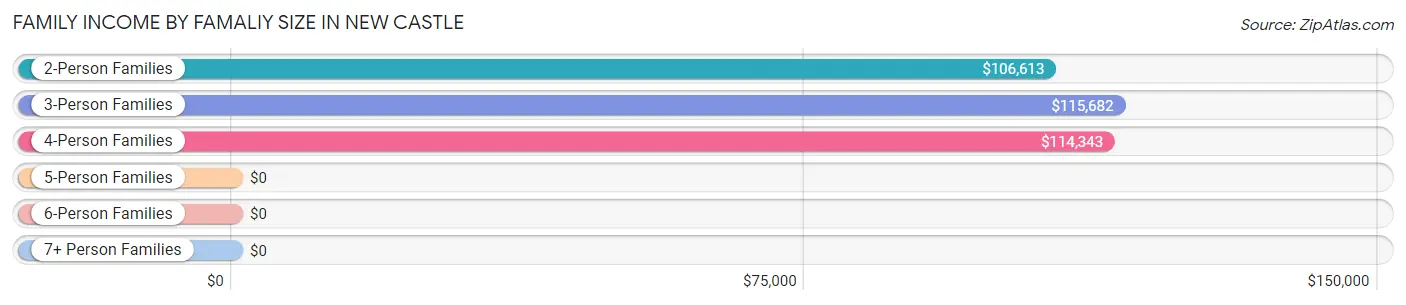
| Income Bracket | # Families | Median Income |
| 2-Person Families | 946 (60.6%) | $106,613 |
| 3-Person Families | 284 (18.2%) | $115,682 |
| 4-Person Families | 297 (19.0%) | $114,343 |
| 5-Person Families | 35 (2.2%) | $0 |
| 6-Person Families | 0 (0.0%) | $0 |
| 7+ Person Families | 0 (0.0%) | $0 |
| Total | 1,562 (100.0%) | $112,500 |
Family Income by Number of Earners in New Castle
The median family income in New Castle is $112,500, with families comprising 2 earners (751) having the highest median family income of $138,116, while families with 1 earner (495) have the lowest median family income of $73,893, accounting for 48.1% and 31.7% of families, respectively.
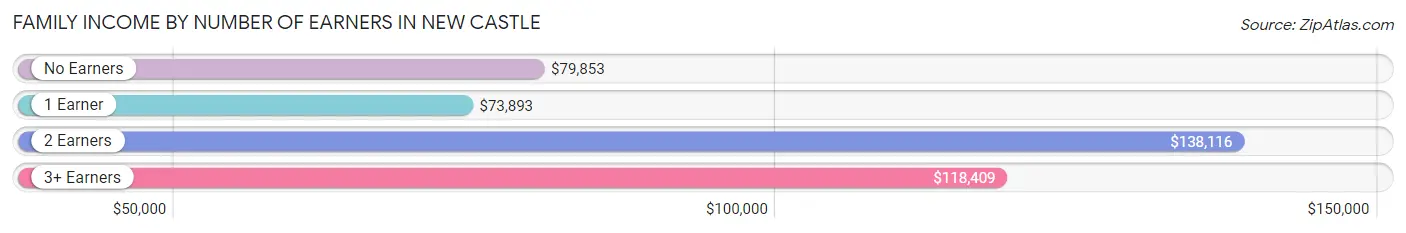
| Number of Earners | # Families | Median Income |
| No Earners | 180 (11.5%) | $79,853 |
| 1 Earner | 495 (31.7%) | $73,893 |
| 2 Earners | 751 (48.1%) | $138,116 |
| 3+ Earners | 136 (8.7%) | $118,409 |
| Total | 1,562 (100.0%) | $112,500 |
Household Income in New Castle
Household Income Brackets in New Castle
With 746 households falling in the category, the $100,000 to $149,999 income range is the most frequent in New Castle, accounting for 27.5% of all households. In contrast, only 68 households (2.5%) fall into the less than $10,000 income bracket, making it the least populous group.
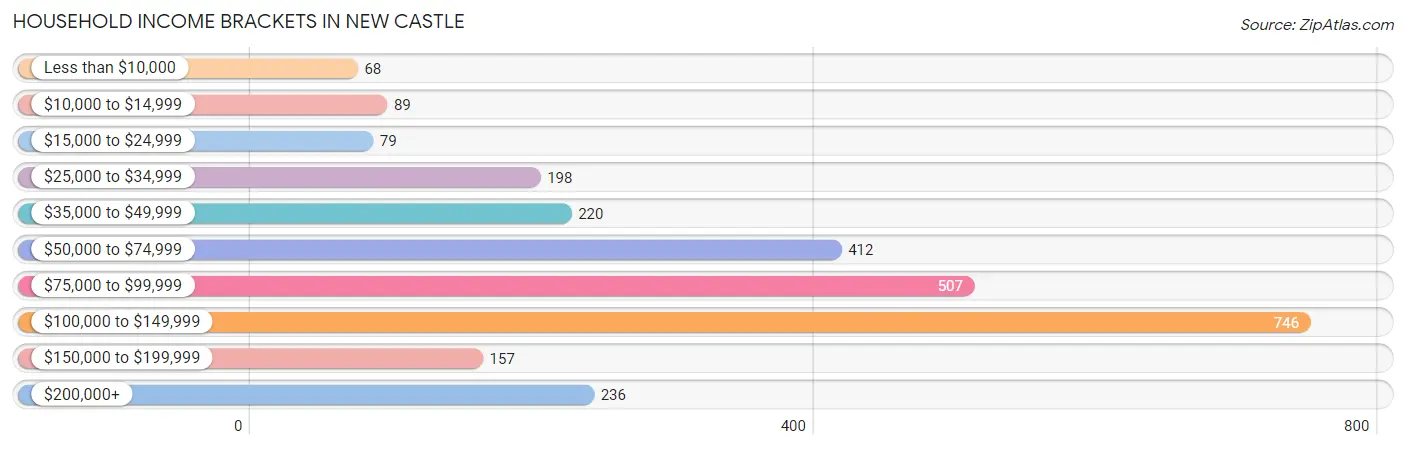
| Income Bracket | # Households | % Households |
| Less than $10,000 | 68 | 2.5% |
| $10,000 to $14,999 | 89 | 3.3% |
| $15,000 to $24,999 | 79 | 2.9% |
| $25,000 to $34,999 | 198 | 7.3% |
| $35,000 to $49,999 | 220 | 8.1% |
| $50,000 to $74,999 | 412 | 15.2% |
| $75,000 to $99,999 | 507 | 18.7% |
| $100,000 to $149,999 | 746 | 27.5% |
| $150,000 to $199,999 | 157 | 5.8% |
| $200,000+ | 236 | 8.7% |
Household Income by Householder Age in New Castle
The median household income in New Castle is $95,884, with the highest median household income of $105,625 found in the 25 to 44 years age bracket for the primary householder. A total of 642 households (23.7%) fall into this category. Meanwhile, the 15 to 24 years age bracket for the primary householder has the lowest median household income of $0, with 46 households (1.7%) in this group.
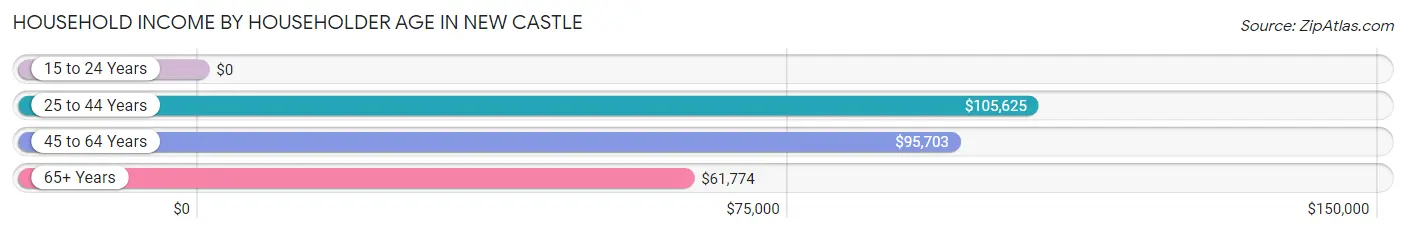
| Income Bracket | # Households | Median Income |
| 15 to 24 Years | 46 (1.7%) | $0 |
| 25 to 44 Years | 642 (23.7%) | $105,625 |
| 45 to 64 Years | 1,159 (42.7%) | $95,703 |
| 65+ Years | 864 (31.9%) | $61,774 |
| Total | 2,711 (100.0%) | $95,884 |
Poverty in New Castle
Income Below Poverty by Sex and Age in New Castle
With 2.6% poverty level for males and 6.0% for females among the residents of New Castle, 6 to 11 year old males and 75 year old and over females are the most vulnerable to poverty, with 21 males (13.9%) and 33 females (11.3%) in their respective age groups living below the poverty level.
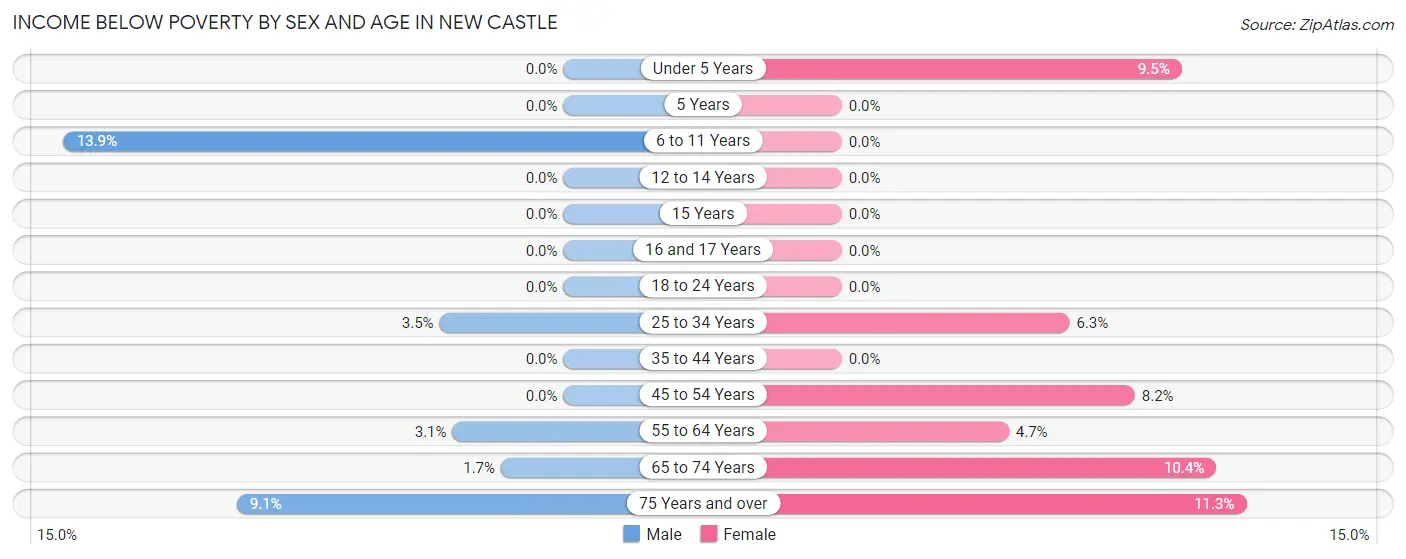
| Age Bracket | Male | Female |
| Under 5 Years | 0 (0.0%) | 7 (9.5%) |
| 5 Years | 0 (0.0%) | 0 (0.0%) |
| 6 to 11 Years | 21 (13.9%) | 0 (0.0%) |
| 12 to 14 Years | 0 (0.0%) | 0 (0.0%) |
| 15 Years | 0 (0.0%) | 0 (0.0%) |
| 16 and 17 Years | 0 (0.0%) | 0 (0.0%) |
| 18 to 24 Years | 0 (0.0%) | 0 (0.0%) |
| 25 to 34 Years | 11 (3.5%) | 26 (6.3%) |
| 35 to 44 Years | 0 (0.0%) | 0 (0.0%) |
| 45 to 54 Years | 0 (0.0%) | 47 (8.2%) |
| 55 to 64 Years | 15 (3.1%) | 27 (4.6%) |
| 65 to 74 Years | 7 (1.7%) | 30 (10.4%) |
| 75 Years and over | 16 (9.1%) | 33 (11.3%) |
| Total | 70 (2.6%) | 170 (6.0%) |
Income Above Poverty by Sex and Age in New Castle
According to the poverty statistics in New Castle, males aged under 5 years and females aged 6 to 11 years are the age groups that are most secure financially, with 100.0% of males and 100.0% of females in these age groups living above the poverty line.
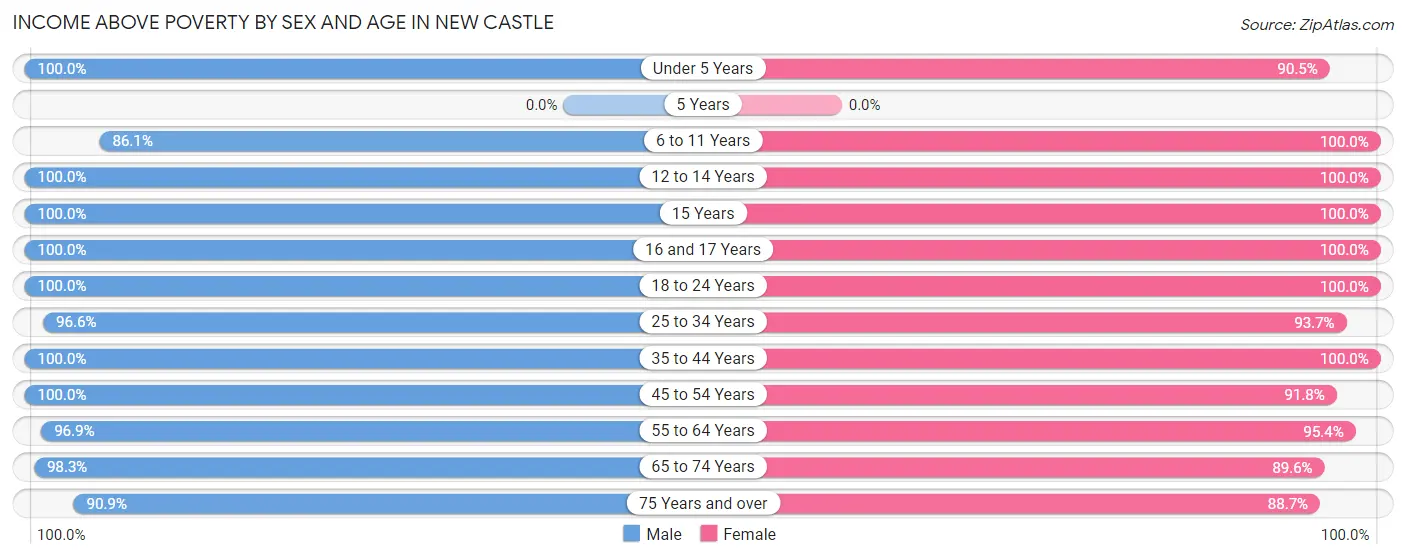
| Age Bracket | Male | Female |
| Under 5 Years | 155 (100.0%) | 67 (90.5%) |
| 5 Years | 0 (0.0%) | 0 (0.0%) |
| 6 to 11 Years | 130 (86.1%) | 180 (100.0%) |
| 12 to 14 Years | 48 (100.0%) | 28 (100.0%) |
| 15 Years | 4 (100.0%) | 16 (100.0%) |
| 16 and 17 Years | 82 (100.0%) | 33 (100.0%) |
| 18 to 24 Years | 144 (100.0%) | 92 (100.0%) |
| 25 to 34 Years | 308 (96.6%) | 384 (93.7%) |
| 35 to 44 Years | 425 (100.0%) | 240 (100.0%) |
| 45 to 54 Years | 320 (100.0%) | 529 (91.8%) |
| 55 to 64 Years | 470 (96.9%) | 554 (95.4%) |
| 65 to 74 Years | 396 (98.3%) | 258 (89.6%) |
| 75 Years and over | 160 (90.9%) | 260 (88.7%) |
| Total | 2,642 (97.4%) | 2,641 (94.0%) |
Income Below Poverty Among Married-Couple Families in New Castle
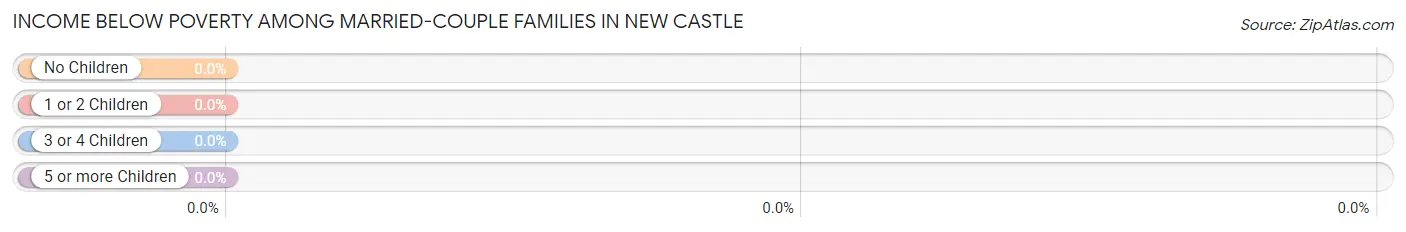
| Children | Above Poverty | Below Poverty |
| No Children | 915 (100.0%) | 0 (0.0%) |
| 1 or 2 Children | 330 (100.0%) | 0 (0.0%) |
| 3 or 4 Children | 15 (100.0%) | 0 (0.0%) |
| 5 or more Children | 0 (0.0%) | 0 (0.0%) |
| Total | 1,260 (100.0%) | 0 (0.0%) |
Income Below Poverty Among Single-Parent Households in New Castle
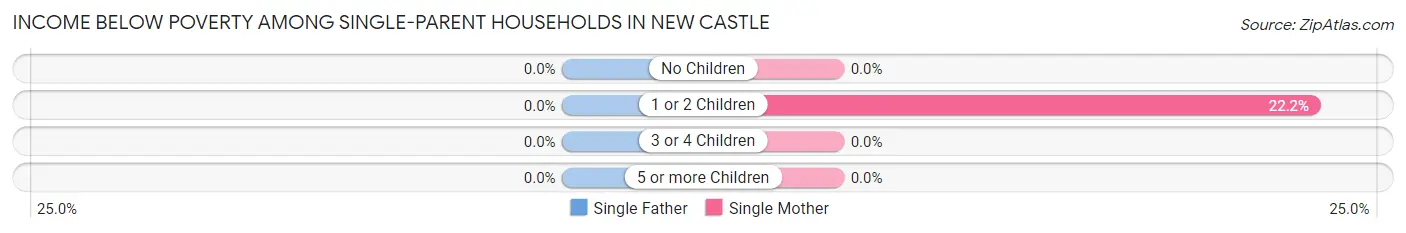
| Children | Single Father | Single Mother |
| No Children | 0 (0.0%) | 0 (0.0%) |
| 1 or 2 Children | 0 (0.0%) | 20 (22.2%) |
| 3 or 4 Children | 0 (0.0%) | 0 (0.0%) |
| 5 or more Children | 0 (0.0%) | 0 (0.0%) |
| Total | 0 (0.0%) | 20 (9.8%) |
Income Below Poverty Among Married-Couple vs Single-Parent Households in New Castle
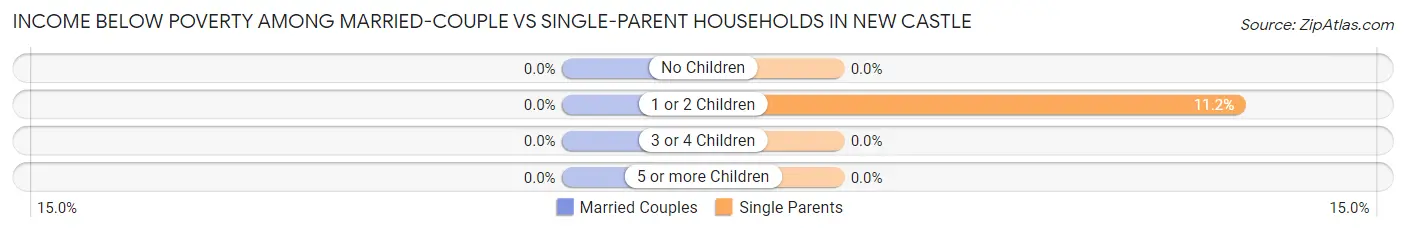
| Children | Married-Couple Families | Single-Parent Households |
| No Children | 0 (0.0%) | 0 (0.0%) |
| 1 or 2 Children | 0 (0.0%) | 20 (11.2%) |
| 3 or 4 Children | 0 (0.0%) | 0 (0.0%) |
| 5 or more Children | 0 (0.0%) | 0 (0.0%) |
| Total | 0 (0.0%) | 20 (6.6%) |
Race in New Castle
The most populous races in New Castle are White / Caucasian (3,618 | 65.5%), Black / African American (1,593 | 28.8%), and Hispanic or Latino (294 | 5.3%).
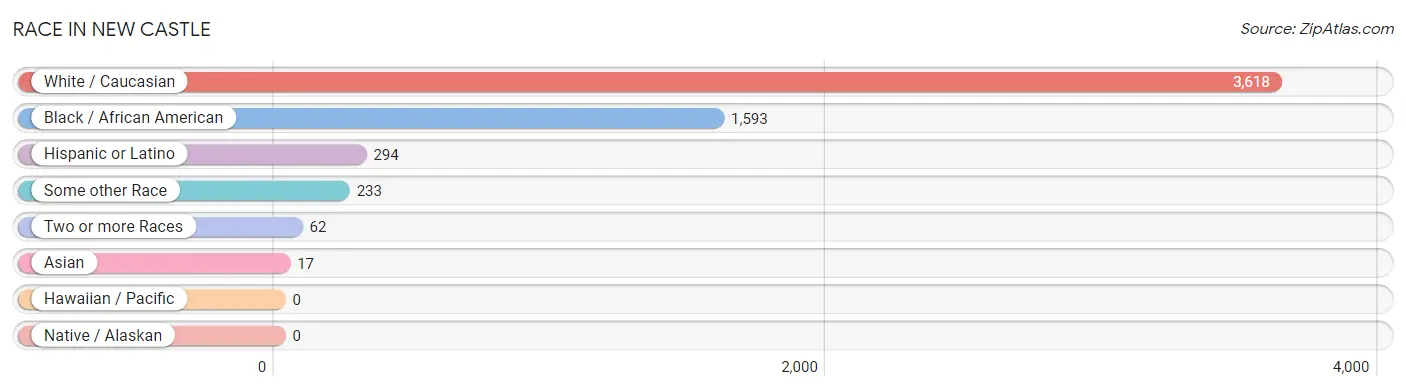
| Race | # Population | % Population |
| Asian | 17 | 0.3% |
| Black / African American | 1,593 | 28.8% |
| Hawaiian / Pacific | 0 | 0.0% |
| Hispanic or Latino | 294 | 5.3% |
| Native / Alaskan | 0 | 0.0% |
| White / Caucasian | 3,618 | 65.5% |
| Two or more Races | 62 | 1.1% |
| Some other Race | 233 | 4.2% |
| Total | 5,523 | 100.0% |
Ancestry in New Castle
The most populous ancestries reported in New Castle are English (1,216 | 22.0%), Irish (1,050 | 19.0%), German (896 | 16.2%), Polish (355 | 6.4%), and Italian (312 | 5.7%), together accounting for 69.3% of all New Castle residents.
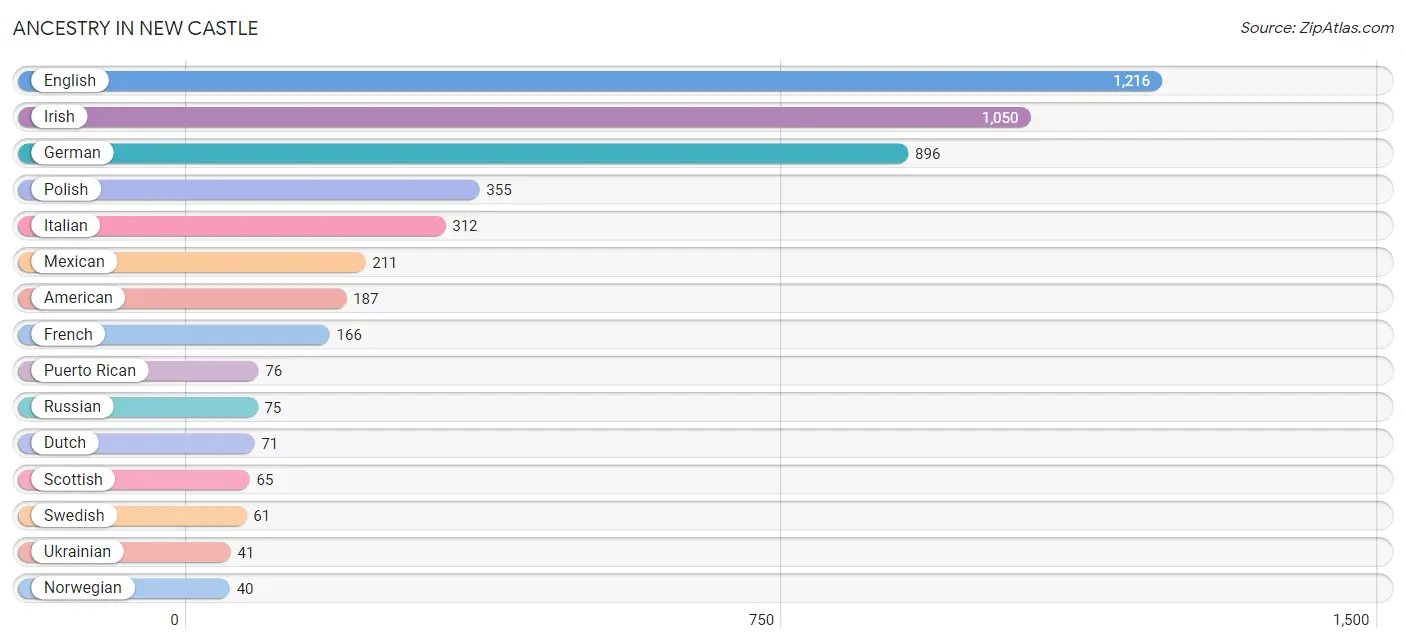
| Ancestry | # Population | % Population |
| African | 30 | 0.5% |
| American | 187 | 3.4% |
| Austrian | 7 | 0.1% |
| Bhutanese | 4 | 0.1% |
| British | 25 | 0.4% |
| Central American | 2 | 0.0% |
| Croatian | 12 | 0.2% |
| Czech | 14 | 0.3% |
| Czechoslovakian | 7 | 0.1% |
| Dutch | 71 | 1.3% |
| Eastern European | 6 | 0.1% |
| English | 1,216 | 22.0% |
| European | 31 | 0.6% |
| French | 166 | 3.0% |
| French Canadian | 8 | 0.1% |
| German | 896 | 16.2% |
| Greek | 22 | 0.4% |
| Guyanese | 19 | 0.3% |
| Hungarian | 39 | 0.7% |
| Irish | 1,050 | 19.0% |
| Italian | 312 | 5.7% |
| Jamaican | 5 | 0.1% |
| Mexican | 211 | 3.8% |
| Norwegian | 40 | 0.7% |
| Panamanian | 2 | 0.0% |
| Polish | 355 | 6.4% |
| Portuguese | 5 | 0.1% |
| Puerto Rican | 76 | 1.4% |
| Russian | 75 | 1.4% |
| Scotch-Irish | 25 | 0.4% |
| Scottish | 65 | 1.2% |
| South African | 9 | 0.2% |
| Spaniard | 5 | 0.1% |
| Subsaharan African | 39 | 0.7% |
| Swedish | 61 | 1.1% |
| Swiss | 7 | 0.1% |
| Thai | 13 | 0.2% |
| Ukrainian | 41 | 0.7% | View All 38 Rows |
Immigrants in New Castle
The most numerous immigrant groups reported in New Castle came from Europe (162 | 2.9%), Latin America (135 | 2.4%), Central America (130 | 2.4%), Mexico (128 | 2.3%), and England (116 | 2.1%), together accounting for 12.1% of all New Castle residents.
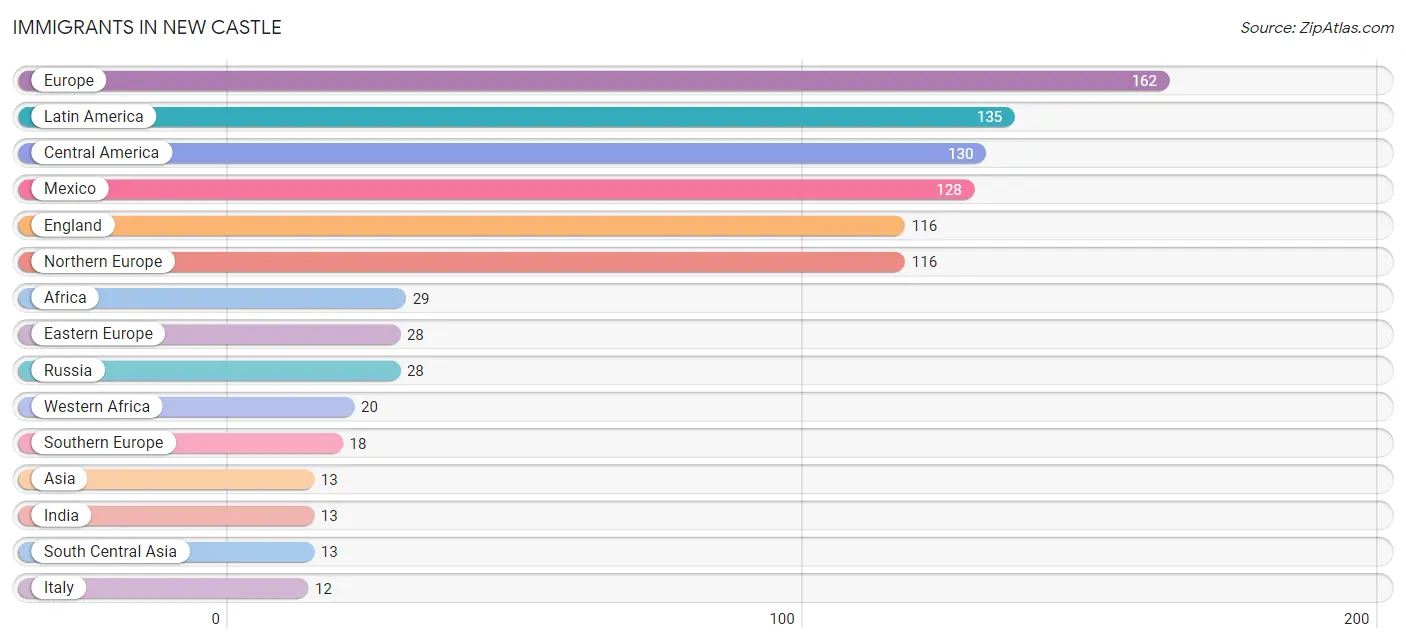
| Immigration Origin | # Population | % Population |
| Africa | 29 | 0.5% |
| Asia | 13 | 0.2% |
| Canada | 9 | 0.2% |
| Caribbean | 5 | 0.1% |
| Central America | 130 | 2.4% |
| Eastern Europe | 28 | 0.5% |
| England | 116 | 2.1% |
| Europe | 162 | 2.9% |
| Greece | 6 | 0.1% |
| India | 13 | 0.2% |
| Italy | 12 | 0.2% |
| Jamaica | 5 | 0.1% |
| Latin America | 135 | 2.4% |
| Mexico | 128 | 2.3% |
| Northern Europe | 116 | 2.1% |
| Panama | 2 | 0.0% |
| Russia | 28 | 0.5% |
| South Africa | 9 | 0.2% |
| South Central Asia | 13 | 0.2% |
| Southern Europe | 18 | 0.3% |
| Western Africa | 20 | 0.4% | View All 21 Rows |
Sex and Age in New Castle
Sex and Age in New Castle
The most populous age groups in New Castle are 65 to 69 Years (310 | 11.4%) for men and 45 to 49 Years (318 | 11.3%) for women.
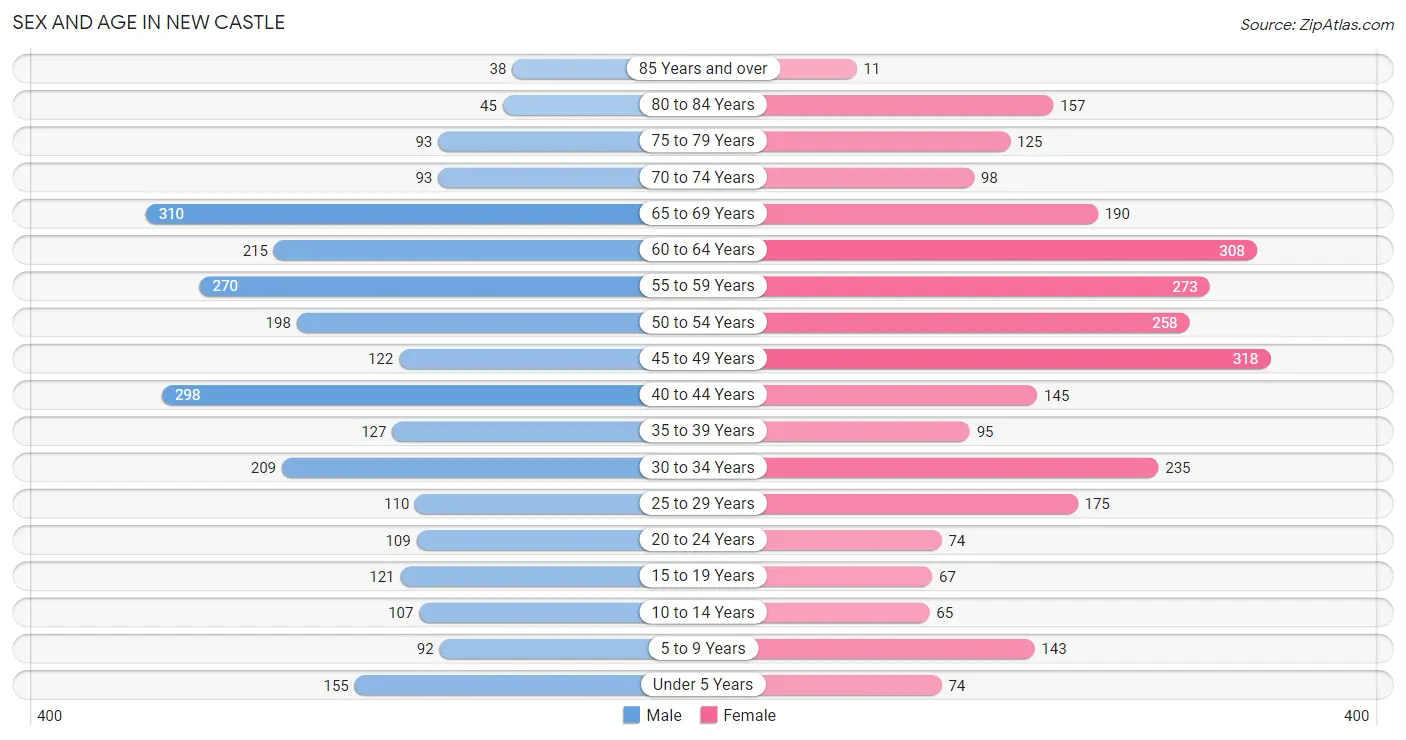
| Age Bracket | Male | Female |
| Under 5 Years | 155 (5.7%) | 74 (2.6%) |
| 5 to 9 Years | 92 (3.4%) | 143 (5.1%) |
| 10 to 14 Years | 107 (4.0%) | 65 (2.3%) |
| 15 to 19 Years | 121 (4.5%) | 67 (2.4%) |
| 20 to 24 Years | 109 (4.0%) | 74 (2.6%) |
| 25 to 29 Years | 110 (4.1%) | 175 (6.2%) |
| 30 to 34 Years | 209 (7.7%) | 235 (8.4%) |
| 35 to 39 Years | 127 (4.7%) | 95 (3.4%) |
| 40 to 44 Years | 298 (11.0%) | 145 (5.2%) |
| 45 to 49 Years | 122 (4.5%) | 318 (11.3%) |
| 50 to 54 Years | 198 (7.3%) | 258 (9.2%) |
| 55 to 59 Years | 270 (10.0%) | 273 (9.7%) |
| 60 to 64 Years | 215 (7.9%) | 308 (11.0%) |
| 65 to 69 Years | 310 (11.4%) | 190 (6.8%) |
| 70 to 74 Years | 93 (3.4%) | 98 (3.5%) |
| 75 to 79 Years | 93 (3.4%) | 125 (4.4%) |
| 80 to 84 Years | 45 (1.7%) | 157 (5.6%) |
| 85 Years and over | 38 (1.4%) | 11 (0.4%) |
| Total | 2,712 (100.0%) | 2,811 (100.0%) |
Families and Households in New Castle
Median Family Size in New Castle
The median family size in New Castle is 2.64 persons per family, with single female/mother families (204 | 13.1%) accounting for the largest median family size of 3 persons per family. On the other hand, married-couple families (1,260 | 80.7%) represent the smallest median family size with 2.58 persons per family.
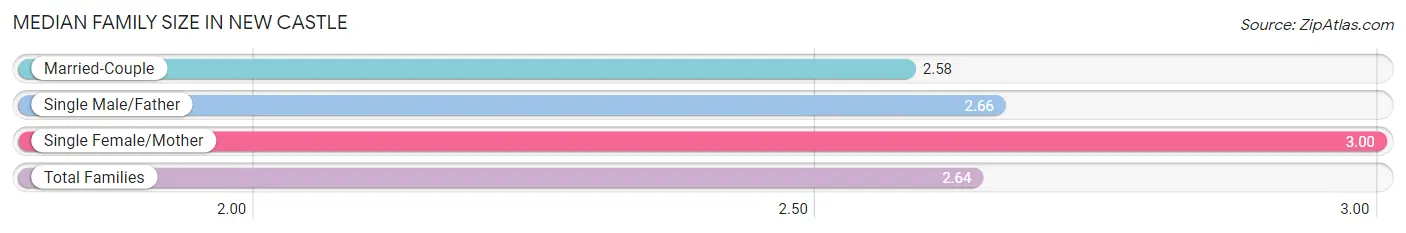
| Family Type | # Families | Family Size |
| Married-Couple | 1,260 (80.7%) | 2.58 |
| Single Male/Father | 98 (6.3%) | 2.66 |
| Single Female/Mother | 204 (13.1%) | 3.00 |
| Total Families | 1,562 (100.0%) | 2.64 |
Median Household Size in New Castle
The median household size in New Castle is 2.04 persons per household, with single male/father households (98 | 3.6%) accounting for the largest median household size of 3.11 persons per household. non-family households (1,149 | 42.4%) represent the smallest median household size with 1.15 persons per household.
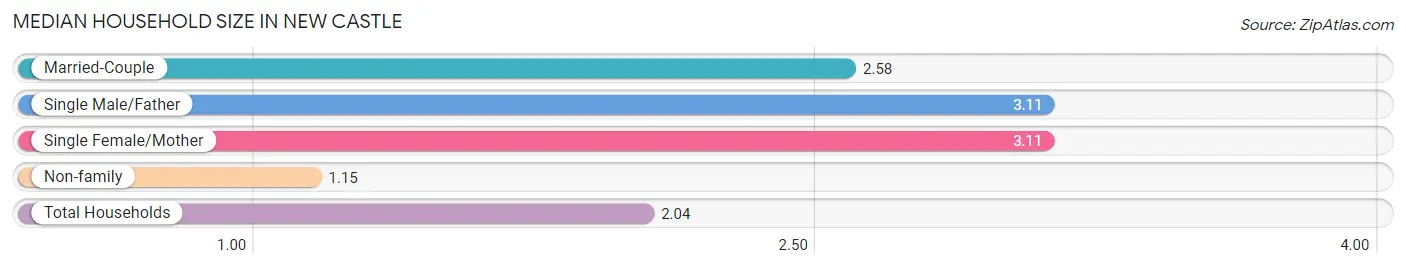
| Household Type | # Households | Household Size |
| Married-Couple | 1,260 (46.5%) | 2.58 |
| Single Male/Father | 98 (3.6%) | 3.11 |
| Single Female/Mother | 204 (7.5%) | 3.11 |
| Non-family | 1,149 (42.4%) | 1.15 |
| Total Households | 2,711 (100.0%) | 2.04 |
Household Size by Marriage Status in New Castle
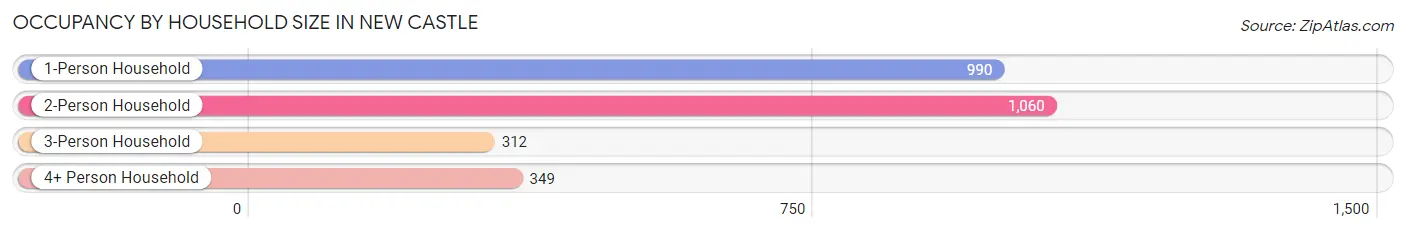
Out of a total of 2,711 households in New Castle, 1,562 (57.6%) are family households, while 1,149 (42.4%) are nonfamily households. The most numerous type of family households are 2-person households, comprising 905, and the most common type of nonfamily households are 1-person households, comprising 990.
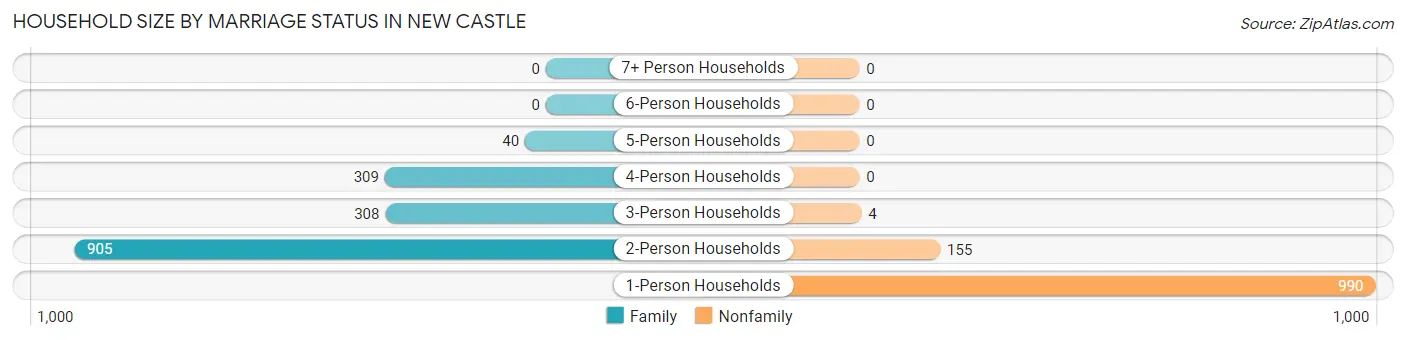
| Household Size | Family Households | Nonfamily Households |
| 1-Person Households | - | 990 (36.5%) |
| 2-Person Households | 905 (33.4%) | 155 (5.7%) |
| 3-Person Households | 308 (11.4%) | 4 (0.2%) |
| 4-Person Households | 309 (11.4%) | 0 (0.0%) |
| 5-Person Households | 40 (1.5%) | 0 (0.0%) |
| 6-Person Households | 0 (0.0%) | 0 (0.0%) |
| 7+ Person Households | 0 (0.0%) | 0 (0.0%) |
| Total | 1,562 (57.6%) | 1,149 (42.4%) |
Female Fertility in New Castle
Fertility by Age in New Castle
Average fertility rate in New Castle is 39.0 births per 1,000 women. Women in the age bracket of 20 to 34 years have the highest fertility rate with 91.0 births per 1,000 women. Women in the age bracket of 20 to 34 years acount for 100.0% of all women with births.
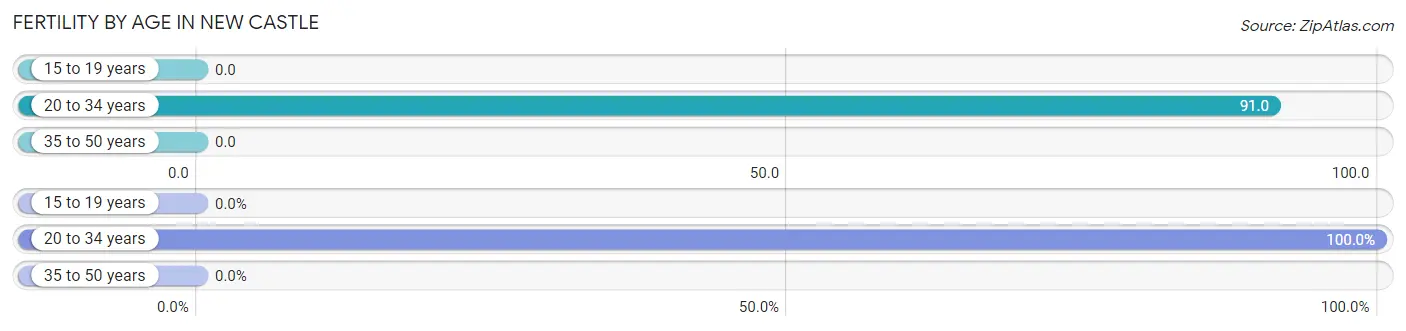
| Age Bracket | Women with Births | Births / 1,000 Women |
| 15 to 19 years | 0 (0.0%) | 0.0 |
| 20 to 34 years | 44 (100.0%) | 91.0 |
| 35 to 50 years | 0 (0.0%) | 0.0 |
| Total | 44 (100.0%) | 39.0 |
Fertility by Age by Marriage Status in New Castle
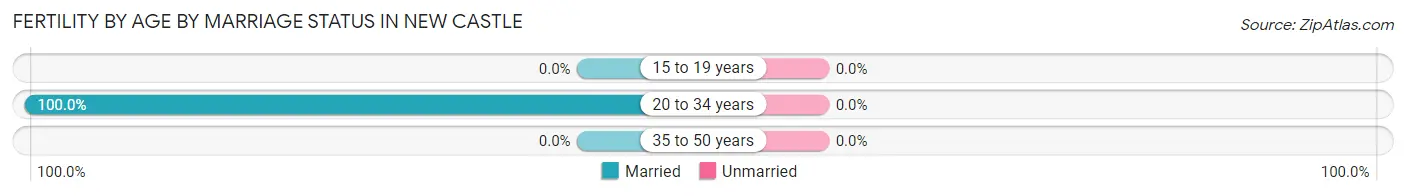
| Age Bracket | Married | Unmarried |
| 15 to 19 years | 0 (0.0%) | 0 (0.0%) |
| 20 to 34 years | 44 (100.0%) | 0 (0.0%) |
| 35 to 50 years | 0 (0.0%) | 0 (0.0%) |
| Total | 44 (100.0%) | 0 (0.0%) |
Fertility by Education in New Castle
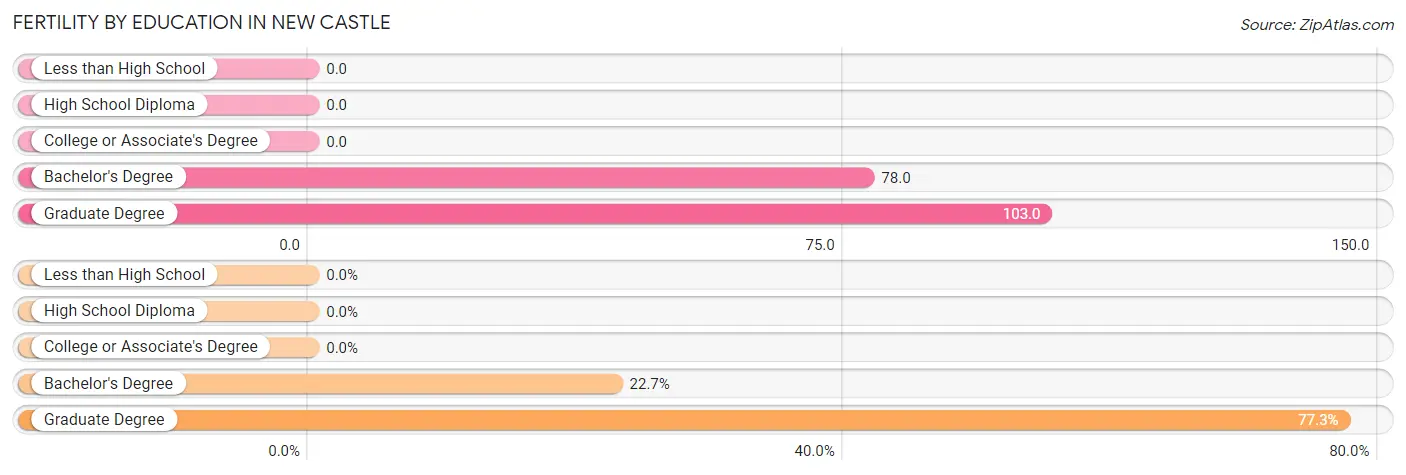
| Educational Attainment | Women with Births | Births / 1,000 Women |
| Less than High School | 0 (0.0%) | 0.0 |
| High School Diploma | 0 (0.0%) | 0.0 |
| College or Associate's Degree | 0 (0.0%) | 0.0 |
| Bachelor's Degree | 10 (22.7%) | 78.0 |
| Graduate Degree | 34 (77.3%) | 103.0 |
| Total | 44 (100.0%) | 39.0 |
Fertility by Education by Marriage Status in New Castle
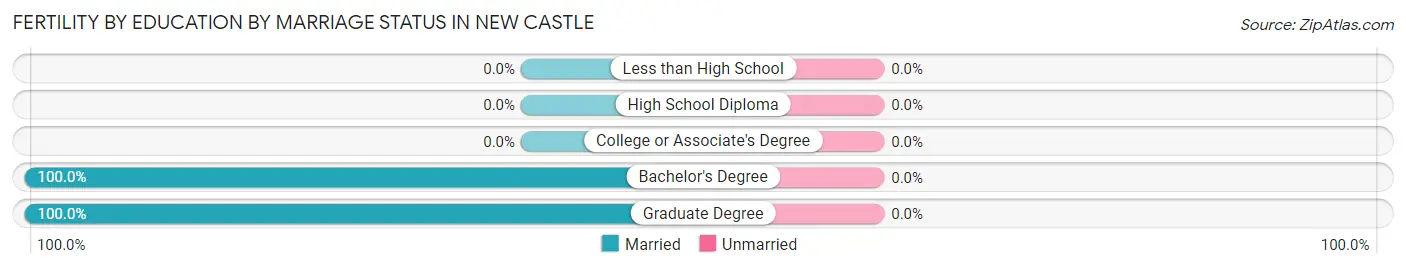
| Educational Attainment | Married | Unmarried |
| Less than High School | 0 (0.0%) | 0 (0.0%) |
| High School Diploma | 0 (0.0%) | 0 (0.0%) |
| College or Associate's Degree | 0 (0.0%) | 0 (0.0%) |
| Bachelor's Degree | 10 (100.0%) | 0 (0.0%) |
| Graduate Degree | 34 (100.0%) | 0 (0.0%) |
| Total | 44 (100.0%) | 0 (0.0%) |
Employment Characteristics in New Castle
Employment by Class of Employer in New Castle
Among the 3,216 employed individuals in New Castle, private company employees (1,937 | 60.2%), not-for-profit organizations (343 | 10.7%), and state government employees (312 | 9.7%) make up the most common classes of employment.
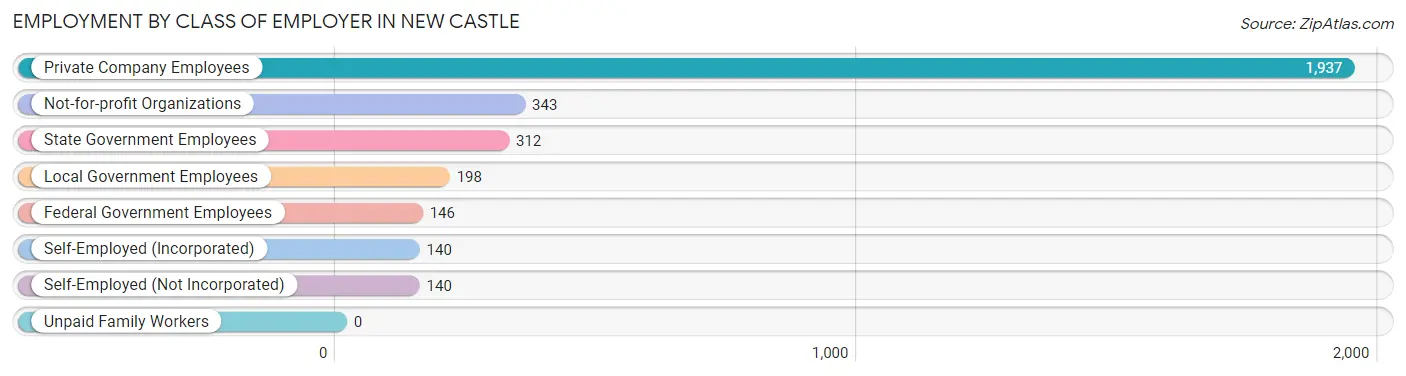
| Employer Class | # Employees | % Employees |
| Private Company Employees | 1,937 | 60.2% |
| Self-Employed (Incorporated) | 140 | 4.3% |
| Self-Employed (Not Incorporated) | 140 | 4.3% |
| Not-for-profit Organizations | 343 | 10.7% |
| Local Government Employees | 198 | 6.2% |
| State Government Employees | 312 | 9.7% |
| Federal Government Employees | 146 | 4.5% |
| Unpaid Family Workers | 0 | 0.0% |
| Total | 3,216 | 100.0% |
Employment Status by Age in New Castle
According to the labor force statistics for New Castle, out of the total population over 16 years of age (4,867), 68.2% or 3,319 individuals are in the labor force, with 1.3% or 43 of them unemployed. The age group with the highest labor force participation rate is 20 to 24 years, with 98.9% or 181 individuals in the labor force. Within the labor force, the 20 to 24 years age range has the highest percentage of unemployed individuals, with 15.5% or 28 of them being unemployed.
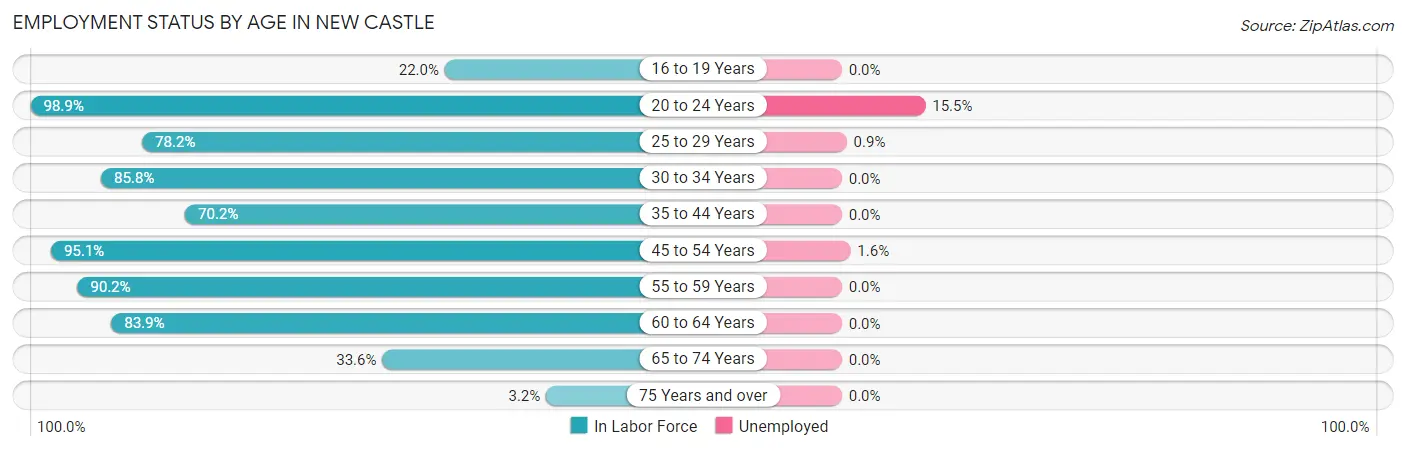
| Age Bracket | In Labor Force | Unemployed |
| 16 to 19 Years | 37 (22.0%) | 0 (0.0%) |
| 20 to 24 Years | 181 (98.9%) | 28 (15.5%) |
| 25 to 29 Years | 223 (78.2%) | 2 (0.9%) |
| 30 to 34 Years | 381 (85.8%) | 0 (0.0%) |
| 35 to 44 Years | 467 (70.2%) | 0 (0.0%) |
| 45 to 54 Years | 852 (95.1%) | 14 (1.6%) |
| 55 to 59 Years | 490 (90.2%) | 0 (0.0%) |
| 60 to 64 Years | 439 (83.9%) | 0 (0.0%) |
| 65 to 74 Years | 232 (33.6%) | 0 (0.0%) |
| 75 Years and over | 15 (3.2%) | 0 (0.0%) |
| Total | 3,319 (68.2%) | 43 (1.3%) |
Employment Status by Educational Attainment in New Castle
According to labor force statistics for New Castle, 85.0% of individuals (2,853) out of the total population between 25 and 64 years of age (3,356) are in the labor force, with 0.6% or 17 of them being unemployed. The group with the highest labor force participation rate are those with the educational attainment of bachelor's degree or higher, with 91.5% or 1,047 individuals in the labor force. Within the labor force, individuals with bachelor's degree or higher education have the highest percentage of unemployment, with 1.5% or 16 of them being unemployed.
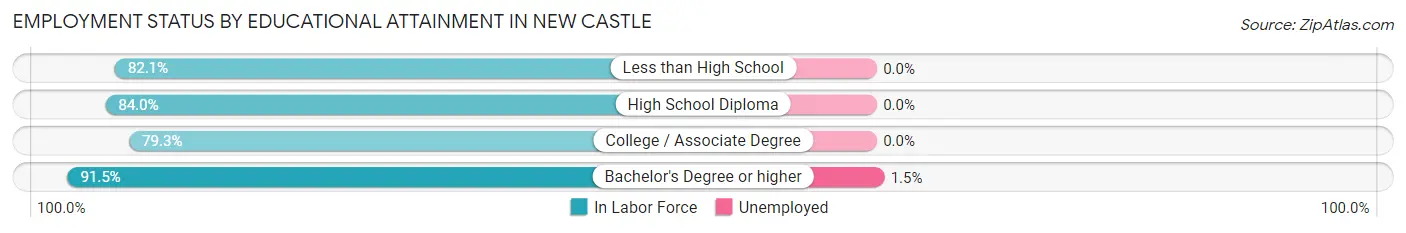
| Educational Attainment | In Labor Force | Unemployed |
| Less than High School | 124 (82.1%) | 0 (0.0%) |
| High School Diploma | 832 (84.0%) | 0 (0.0%) |
| College / Associate Degree | 849 (79.3%) | 0 (0.0%) |
| Bachelor's Degree or higher | 1,047 (91.5%) | 17 (1.5%) |
| Total | 2,853 (85.0%) | 20 (0.6%) |
Employment Occupations by Sex in New Castle
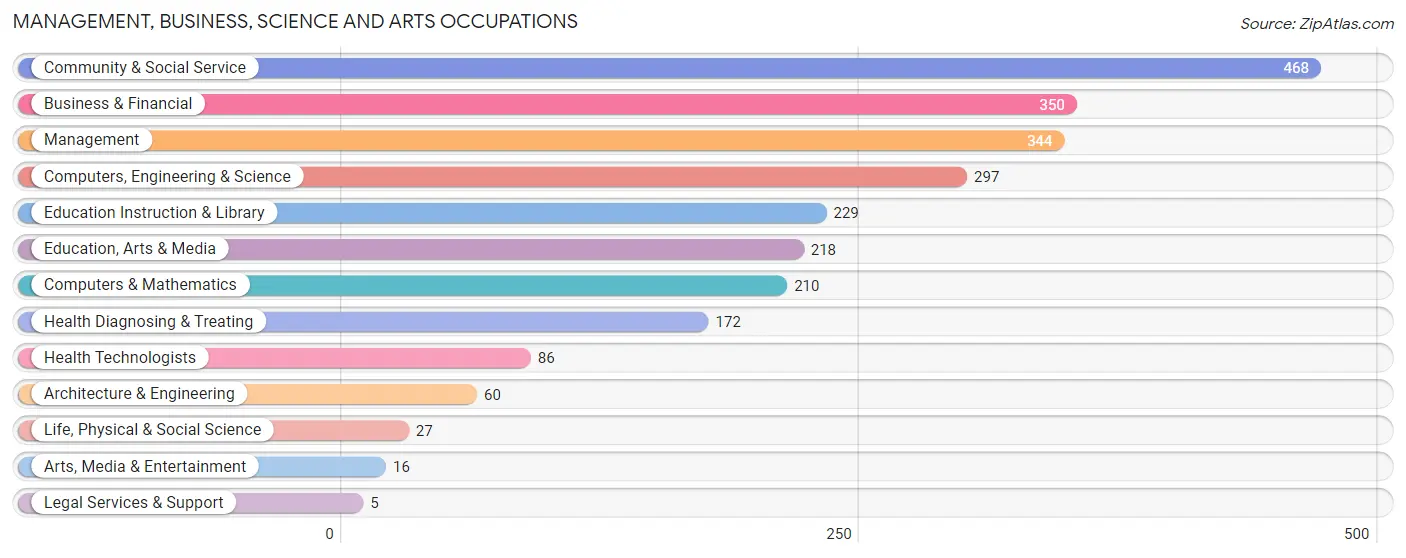
Management, Business, Science and Arts Occupations
The most common Management, Business, Science and Arts occupations in New Castle are Community & Social Service (468 | 14.5%), Business & Financial (350 | 10.9%), Management (344 | 10.7%), Computers, Engineering & Science (297 | 9.2%), and Education Instruction & Library (229 | 7.1%).
Management, Business, Science and Arts Occupations by Sex
Within the Management, Business, Science and Arts occupations in New Castle, the most male-oriented occupations are Arts, Media & Entertainment (100.0%), Life, Physical & Social Science (81.5%), and Education Instruction & Library (59.8%), while the most female-oriented occupations are Legal Services & Support (100.0%), Education, Arts & Media (81.7%), and Architecture & Engineering (73.3%).
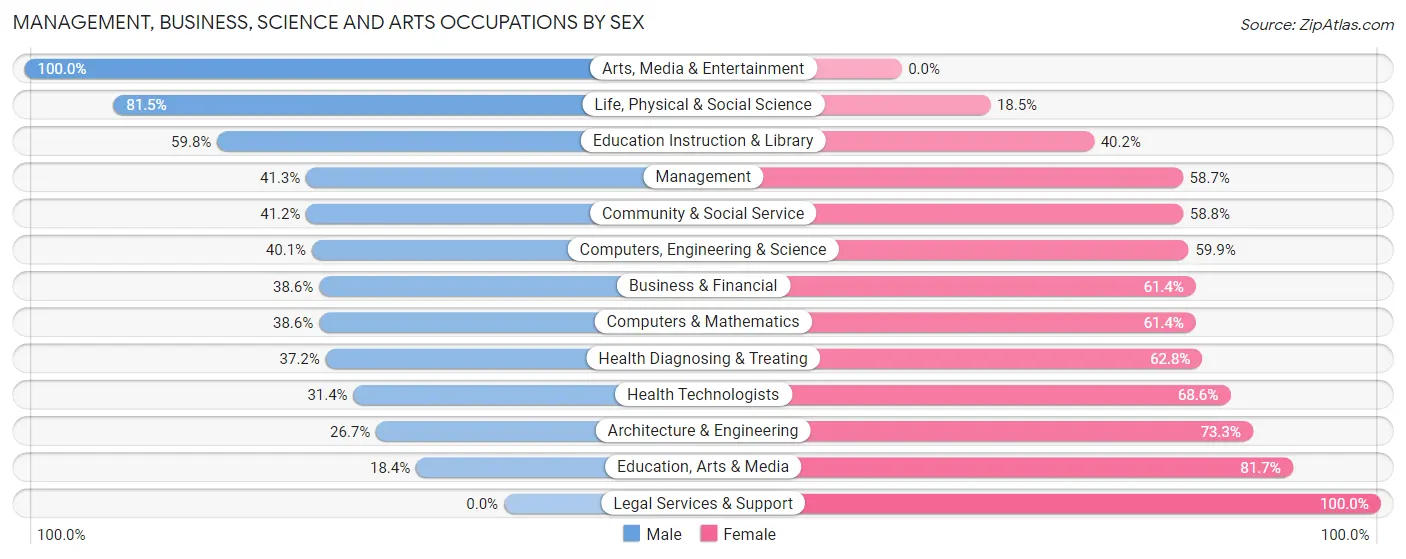
| Occupation | Male | Female |
| Management | 142 (41.3%) | 202 (58.7%) |
| Business & Financial | 135 (38.6%) | 215 (61.4%) |
| Computers, Engineering & Science | 119 (40.1%) | 178 (59.9%) |
| Computers & Mathematics | 81 (38.6%) | 129 (61.4%) |
| Architecture & Engineering | 16 (26.7%) | 44 (73.3%) |
| Life, Physical & Social Science | 22 (81.5%) | 5 (18.5%) |
| Community & Social Service | 193 (41.2%) | 275 (58.8%) |
| Education, Arts & Media | 40 (18.3%) | 178 (81.7%) |
| Legal Services & Support | 0 (0.0%) | 5 (100.0%) |
| Education Instruction & Library | 137 (59.8%) | 92 (40.2%) |
| Arts, Media & Entertainment | 16 (100.0%) | 0 (0.0%) |
| Health Diagnosing & Treating | 64 (37.2%) | 108 (62.8%) |
| Health Technologists | 27 (31.4%) | 59 (68.6%) |
| Total (Category) | 653 (40.0%) | 978 (60.0%) |
| Total (Overall) | 1,497 (46.5%) | 1,720 (53.5%) |
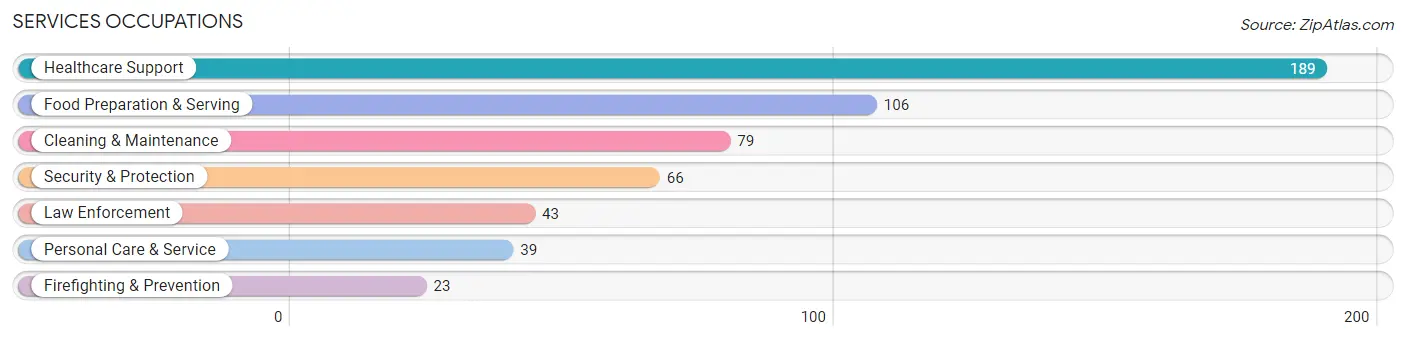
Services Occupations
The most common Services occupations in New Castle are Healthcare Support (189 | 5.9%), Food Preparation & Serving (106 | 3.3%), Cleaning & Maintenance (79 | 2.5%), Security & Protection (66 | 2.1%), and Law Enforcement (43 | 1.3%).
Services Occupations by Sex
Within the Services occupations in New Castle, the most male-oriented occupations are Security & Protection (100.0%), Firefighting & Prevention (100.0%), and Law Enforcement (100.0%), while the most female-oriented occupations are Healthcare Support (100.0%), Food Preparation & Serving (84.9%), and Personal Care & Service (74.4%).
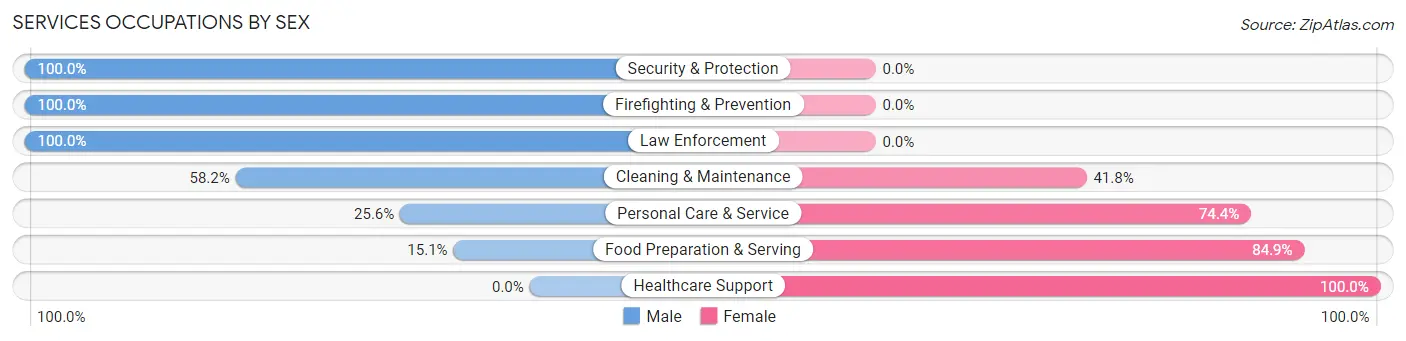
| Occupation | Male | Female |
| Healthcare Support | 0 (0.0%) | 189 (100.0%) |
| Security & Protection | 66 (100.0%) | 0 (0.0%) |
| Firefighting & Prevention | 23 (100.0%) | 0 (0.0%) |
| Law Enforcement | 43 (100.0%) | 0 (0.0%) |
| Food Preparation & Serving | 16 (15.1%) | 90 (84.9%) |
| Cleaning & Maintenance | 46 (58.2%) | 33 (41.8%) |
| Personal Care & Service | 10 (25.6%) | 29 (74.4%) |
| Total (Category) | 138 (28.8%) | 341 (71.2%) |
| Total (Overall) | 1,497 (46.5%) | 1,720 (53.5%) |
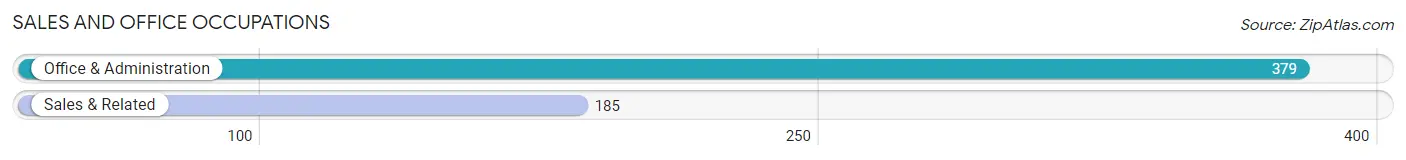
Sales and Office Occupations
The most common Sales and Office occupations in New Castle are Office & Administration (379 | 11.8%), and Sales & Related (185 | 5.8%).
Sales and Office Occupations by Sex
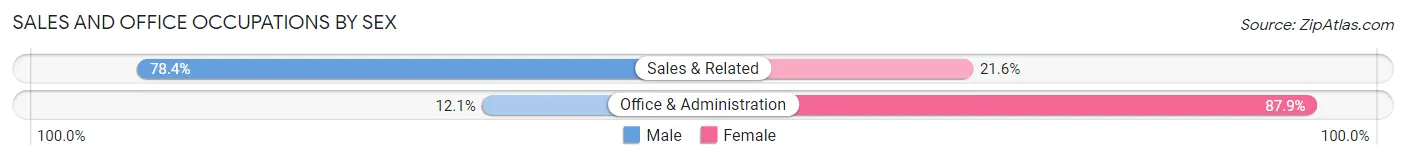
| Occupation | Male | Female |
| Sales & Related | 145 (78.4%) | 40 (21.6%) |
| Office & Administration | 46 (12.1%) | 333 (87.9%) |
| Total (Category) | 191 (33.9%) | 373 (66.1%) |
| Total (Overall) | 1,497 (46.5%) | 1,720 (53.5%) |
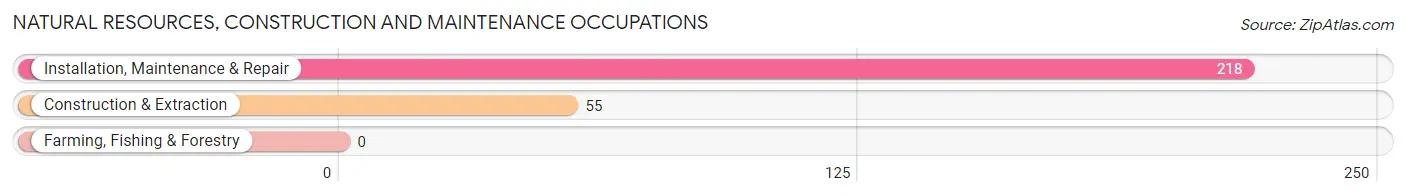
Natural Resources, Construction and Maintenance Occupations
The most common Natural Resources, Construction and Maintenance occupations in New Castle are Installation, Maintenance & Repair (218 | 6.8%), and Construction & Extraction (55 | 1.7%).
Natural Resources, Construction and Maintenance Occupations by Sex
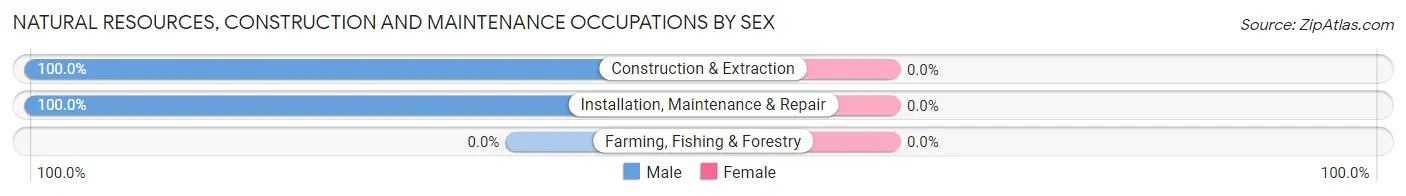
| Occupation | Male | Female |
| Farming, Fishing & Forestry | 0 (0.0%) | 0 (0.0%) |
| Construction & Extraction | 55 (100.0%) | 0 (0.0%) |
| Installation, Maintenance & Repair | 218 (100.0%) | 0 (0.0%) |
| Total (Category) | 273 (100.0%) | 0 (0.0%) |
| Total (Overall) | 1,497 (46.5%) | 1,720 (53.5%) |
Production, Transportation and Moving Occupations
The most common Production, Transportation and Moving occupations in New Castle are Material Moving (158 | 4.9%), Transportation (77 | 2.4%), and Production (35 | 1.1%).
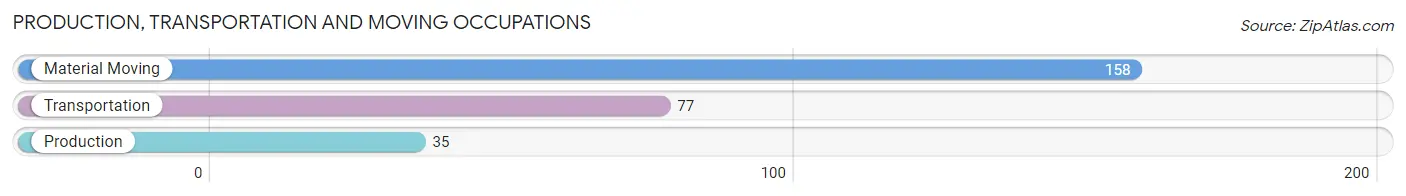
Production, Transportation and Moving Occupations by Sex
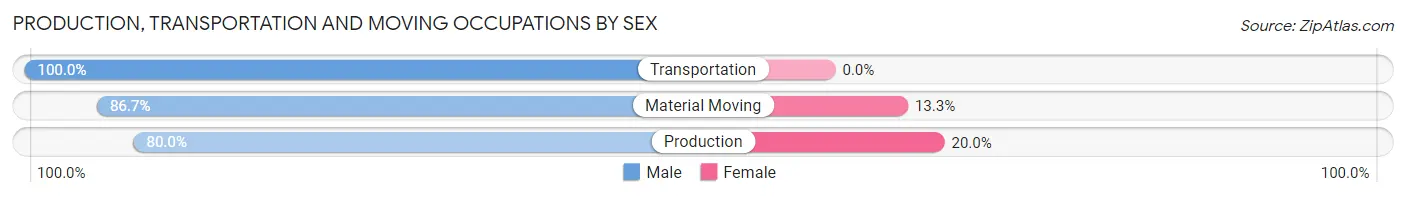
| Occupation | Male | Female |
| Production | 28 (80.0%) | 7 (20.0%) |
| Transportation | 77 (100.0%) | 0 (0.0%) |
| Material Moving | 137 (86.7%) | 21 (13.3%) |
| Total (Category) | 242 (89.6%) | 28 (10.4%) |
| Total (Overall) | 1,497 (46.5%) | 1,720 (53.5%) |
Employment Industries by Sex in New Castle
Employment Industries in New Castle
The major employment industries in New Castle include Educational Services (522 | 16.2%), Health Care & Social Assistance (495 | 15.4%), Retail Trade (313 | 9.7%), Manufacturing (249 | 7.7%), and Finance & Insurance (237 | 7.4%).
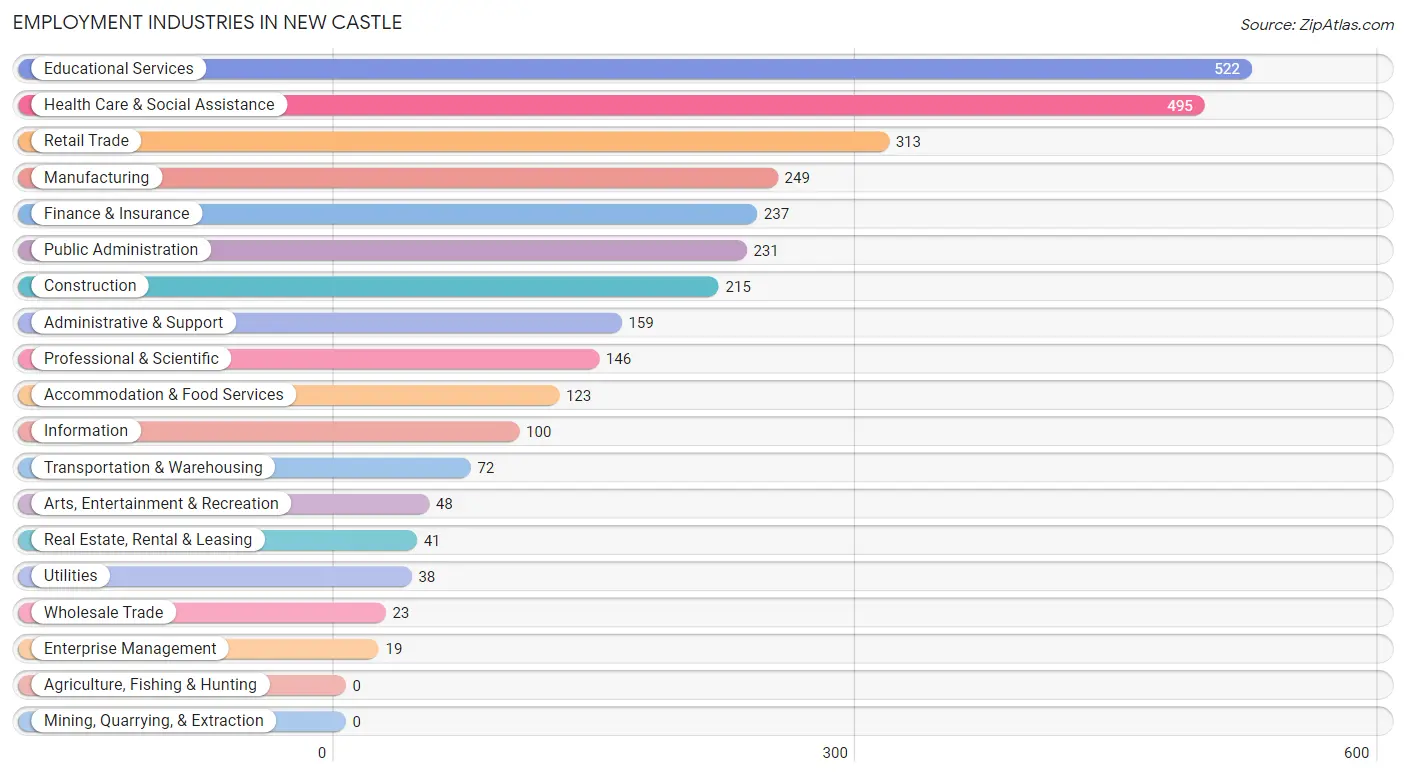
Employment Industries by Sex in New Castle
The New Castle industries that see more men than women are Manufacturing (90.0%), Real Estate, Rental & Leasing (87.8%), and Arts, Entertainment & Recreation (77.1%), whereas the industries that tend to have a higher number of women are Enterprise Management (100.0%), Health Care & Social Assistance (82.4%), and Accommodation & Food Services (82.1%).
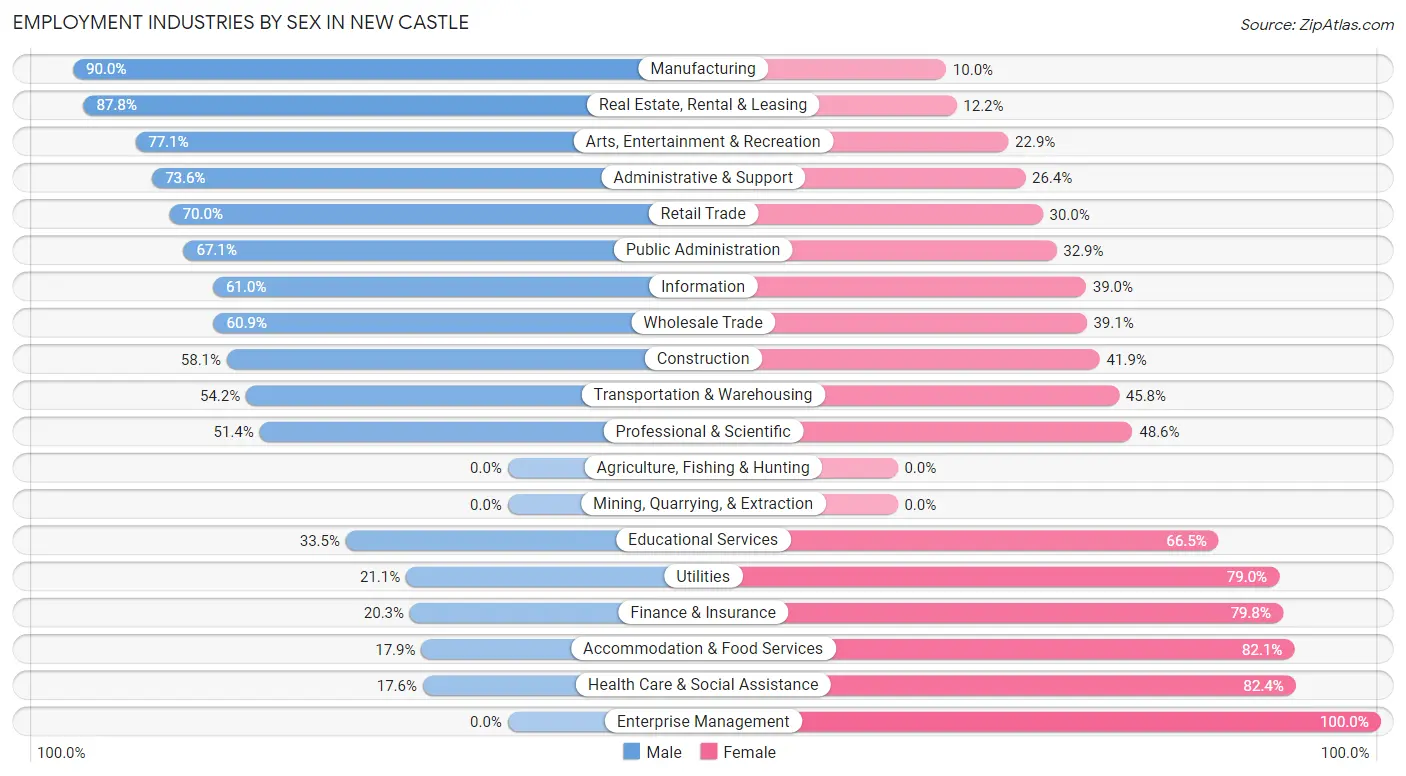
| Industry | Male | Female |
| Agriculture, Fishing & Hunting | 0 (0.0%) | 0 (0.0%) |
| Mining, Quarrying, & Extraction | 0 (0.0%) | 0 (0.0%) |
| Construction | 125 (58.1%) | 90 (41.9%) |
| Manufacturing | 224 (90.0%) | 25 (10.0%) |
| Wholesale Trade | 14 (60.9%) | 9 (39.1%) |
| Retail Trade | 219 (70.0%) | 94 (30.0%) |
| Transportation & Warehousing | 39 (54.2%) | 33 (45.8%) |
| Utilities | 8 (21.0%) | 30 (78.9%) |
| Information | 61 (61.0%) | 39 (39.0%) |
| Finance & Insurance | 48 (20.3%) | 189 (79.7%) |
| Real Estate, Rental & Leasing | 36 (87.8%) | 5 (12.2%) |
| Professional & Scientific | 75 (51.4%) | 71 (48.6%) |
| Enterprise Management | 0 (0.0%) | 19 (100.0%) |
| Administrative & Support | 117 (73.6%) | 42 (26.4%) |
| Educational Services | 175 (33.5%) | 347 (66.5%) |
| Health Care & Social Assistance | 87 (17.6%) | 408 (82.4%) |
| Arts, Entertainment & Recreation | 37 (77.1%) | 11 (22.9%) |
| Accommodation & Food Services | 22 (17.9%) | 101 (82.1%) |
| Public Administration | 155 (67.1%) | 76 (32.9%) |
| Total | 1,497 (46.5%) | 1,720 (53.5%) |
Education in New Castle
School Enrollment in New Castle
The most common levels of schooling among the 631 students in New Castle are elementary school (192 | 30.4%), high school (172 | 27.3%), and middle school (138 | 21.9%).
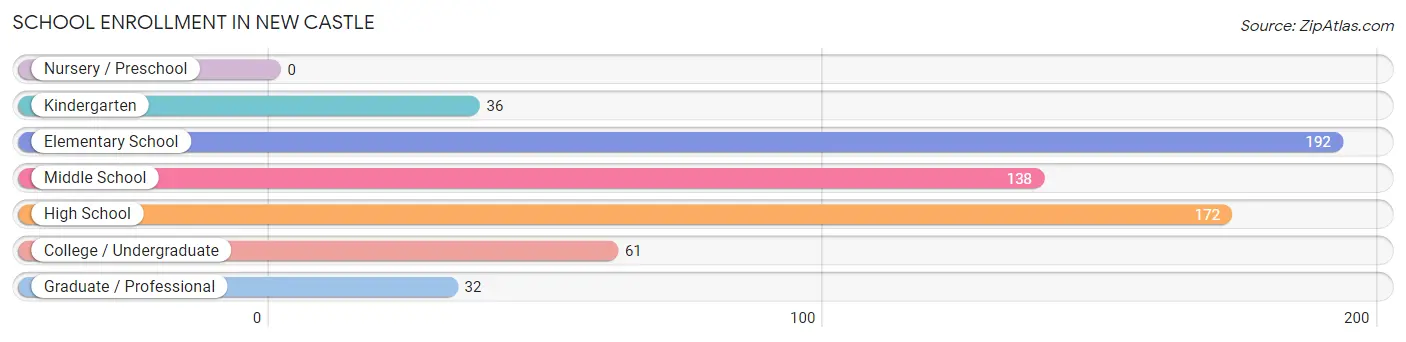
| School Level | # Students | % Students |
| Nursery / Preschool | 0 | 0.0% |
| Kindergarten | 36 | 5.7% |
| Elementary School | 192 | 30.4% |
| Middle School | 138 | 21.9% |
| High School | 172 | 27.3% |
| College / Undergraduate | 61 | 9.7% |
| Graduate / Professional | 32 | 5.1% |
| Total | 631 | 100.0% |
School Enrollment by Age by Funding Source in New Castle
Out of a total of 631 students who are enrolled in schools in New Castle, 143 (22.7%) attend a private institution, while the remaining 488 (77.3%) are enrolled in public schools. The age group of 25 to 34 year olds has the highest likelihood of being enrolled in private schools, with 9 (100.0% in the age bracket) enrolled. Conversely, the age group of 15 to 17 year olds has the lowest likelihood of being enrolled in a private school, with 133 (100.0% in the age bracket) attending a public institution.
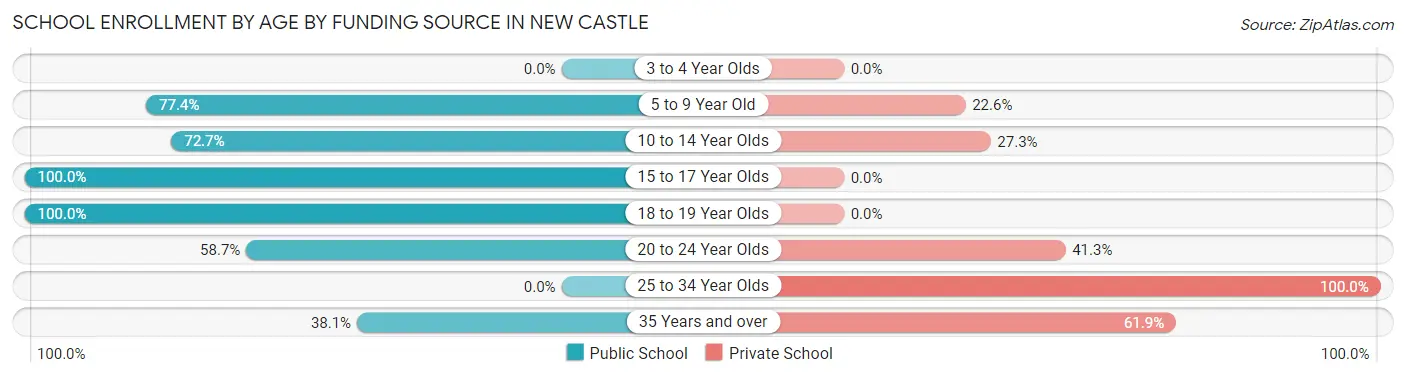
| Age Bracket | Public School | Private School |
| 3 to 4 Year Olds | 0 (0.0%) | 0 (0.0%) |
| 5 to 9 Year Old | 164 (77.4%) | 48 (22.6%) |
| 10 to 14 Year Olds | 125 (72.7%) | 47 (27.3%) |
| 15 to 17 Year Olds | 133 (100.0%) | 0 (0.0%) |
| 18 to 19 Year Olds | 21 (100.0%) | 0 (0.0%) |
| 20 to 24 Year Olds | 37 (58.7%) | 26 (41.3%) |
| 25 to 34 Year Olds | 0 (0.0%) | 9 (100.0%) |
| 35 Years and over | 8 (38.1%) | 13 (61.9%) |
| Total | 488 (77.3%) | 143 (22.7%) |
Educational Attainment by Field of Study in New Castle
Business (359 | 21.9%), arts & humanities (234 | 14.2%), social sciences (188 | 11.5%), education (154 | 9.4%), and literature & languages (129 | 7.9%) are the most common fields of study among 1,642 individuals in New Castle who have obtained a bachelor's degree or higher.
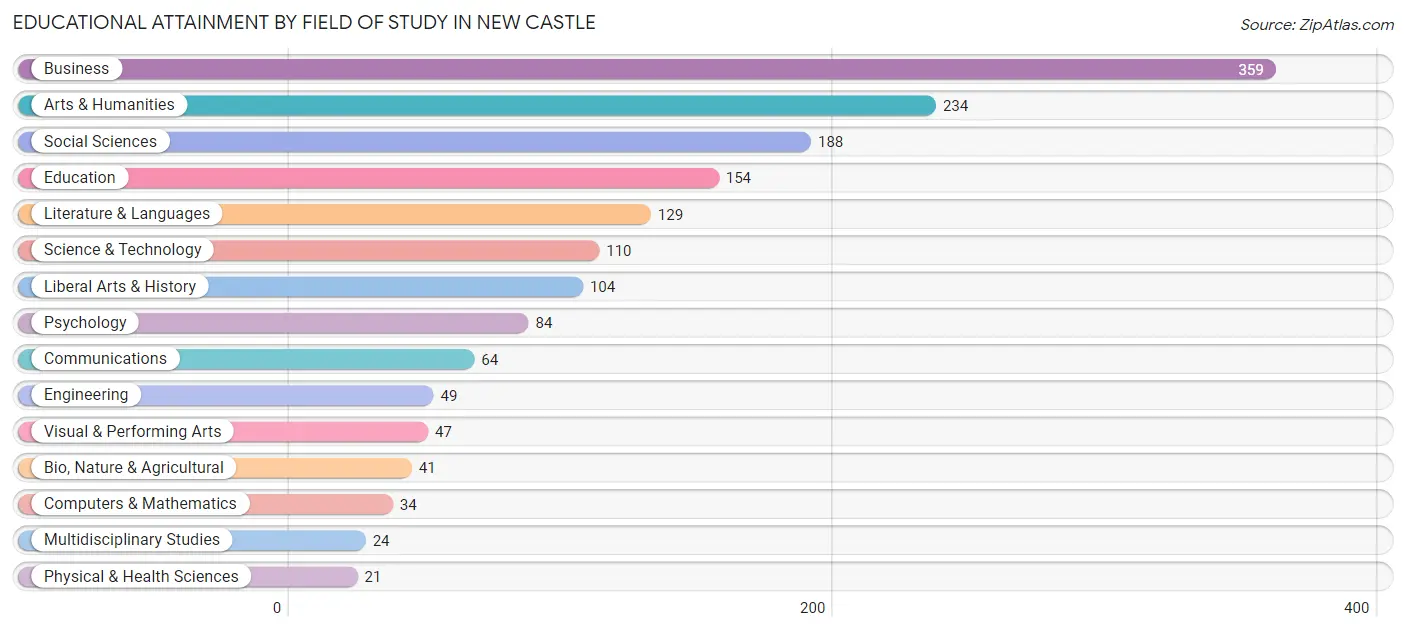
| Field of Study | # Graduates | % Graduates |
| Computers & Mathematics | 34 | 2.1% |
| Bio, Nature & Agricultural | 41 | 2.5% |
| Physical & Health Sciences | 21 | 1.3% |
| Psychology | 84 | 5.1% |
| Social Sciences | 188 | 11.5% |
| Engineering | 49 | 3.0% |
| Multidisciplinary Studies | 24 | 1.5% |
| Science & Technology | 110 | 6.7% |
| Business | 359 | 21.9% |
| Education | 154 | 9.4% |
| Literature & Languages | 129 | 7.9% |
| Liberal Arts & History | 104 | 6.3% |
| Visual & Performing Arts | 47 | 2.9% |
| Communications | 64 | 3.9% |
| Arts & Humanities | 234 | 14.2% |
| Total | 1,642 | 100.0% |
Transportation & Commute in New Castle
Vehicle Availability by Sex in New Castle
The most prevalent vehicle ownership categories in New Castle are males with 2 vehicles (889, accounting for 57.8%) and females with 2 vehicles (777, making up 53.0%).
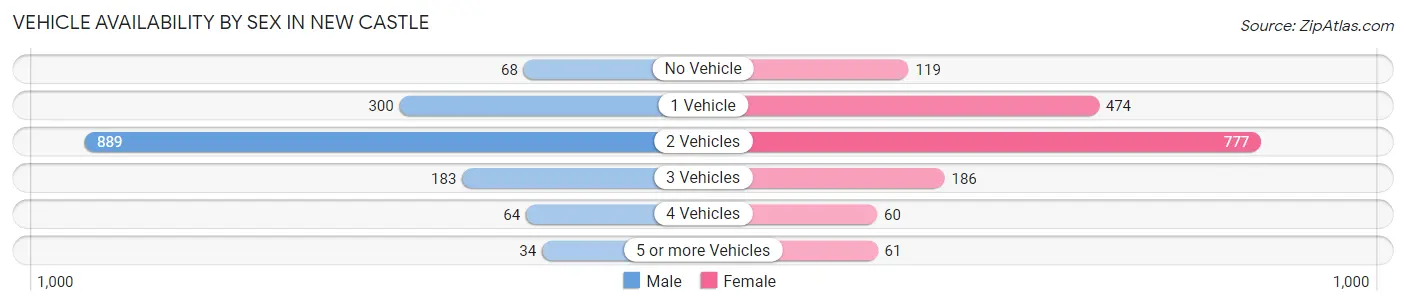
| Vehicles Available | Male | Female |
| No Vehicle | 68 (4.4%) | 119 (7.1%) |
| 1 Vehicle | 300 (19.5%) | 474 (28.3%) |
| 2 Vehicles | 889 (57.8%) | 777 (46.3%) |
| 3 Vehicles | 183 (11.9%) | 186 (11.1%) |
| 4 Vehicles | 64 (4.2%) | 60 (3.6%) |
| 5 or more Vehicles | 34 (2.2%) | 61 (3.6%) |
| Total | 1,538 (100.0%) | 1,677 (100.0%) |
Commute Time in New Castle
The most frequently occuring commute durations in New Castle are 15 to 19 minutes (624 commuters, 22.8%), 25 to 29 minutes (506 commuters, 18.5%), and 20 to 24 minutes (475 commuters, 17.3%).
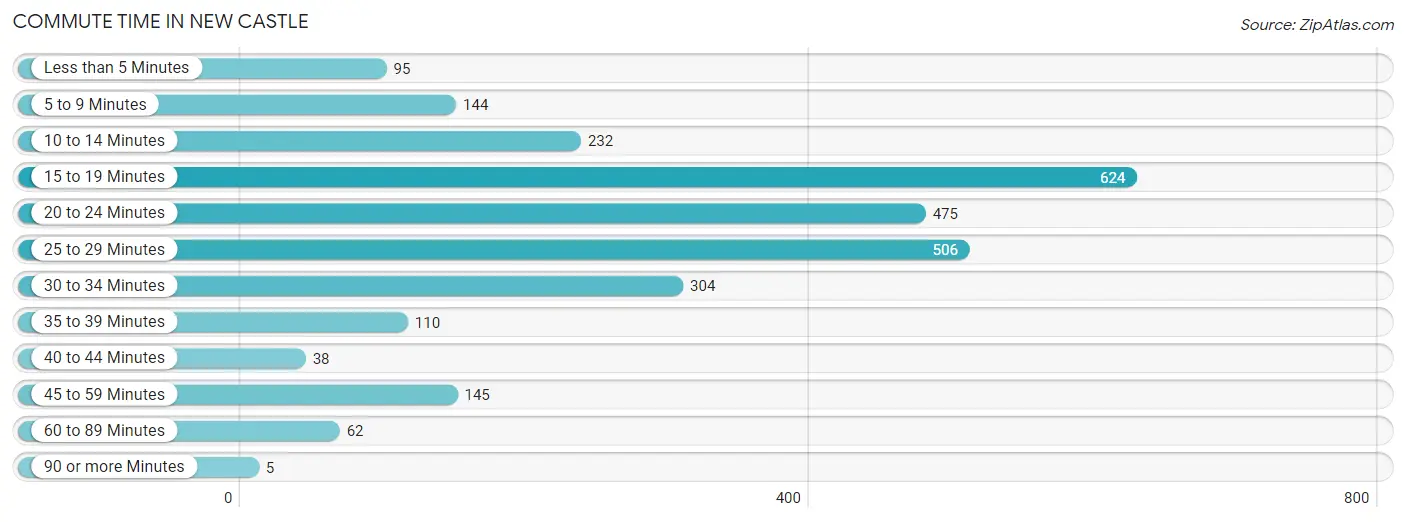
| Commute Time | # Commuters | % Commuters |
| Less than 5 Minutes | 95 | 3.5% |
| 5 to 9 Minutes | 144 | 5.3% |
| 10 to 14 Minutes | 232 | 8.5% |
| 15 to 19 Minutes | 624 | 22.8% |
| 20 to 24 Minutes | 475 | 17.3% |
| 25 to 29 Minutes | 506 | 18.5% |
| 30 to 34 Minutes | 304 | 11.1% |
| 35 to 39 Minutes | 110 | 4.0% |
| 40 to 44 Minutes | 38 | 1.4% |
| 45 to 59 Minutes | 145 | 5.3% |
| 60 to 89 Minutes | 62 | 2.3% |
| 90 or more Minutes | 5 | 0.2% |
Commute Time by Sex in New Castle
The most common commute times in New Castle are 25 to 29 minutes (274 commuters, 22.9%) for males and 15 to 19 minutes (524 commuters, 34.0%) for females.
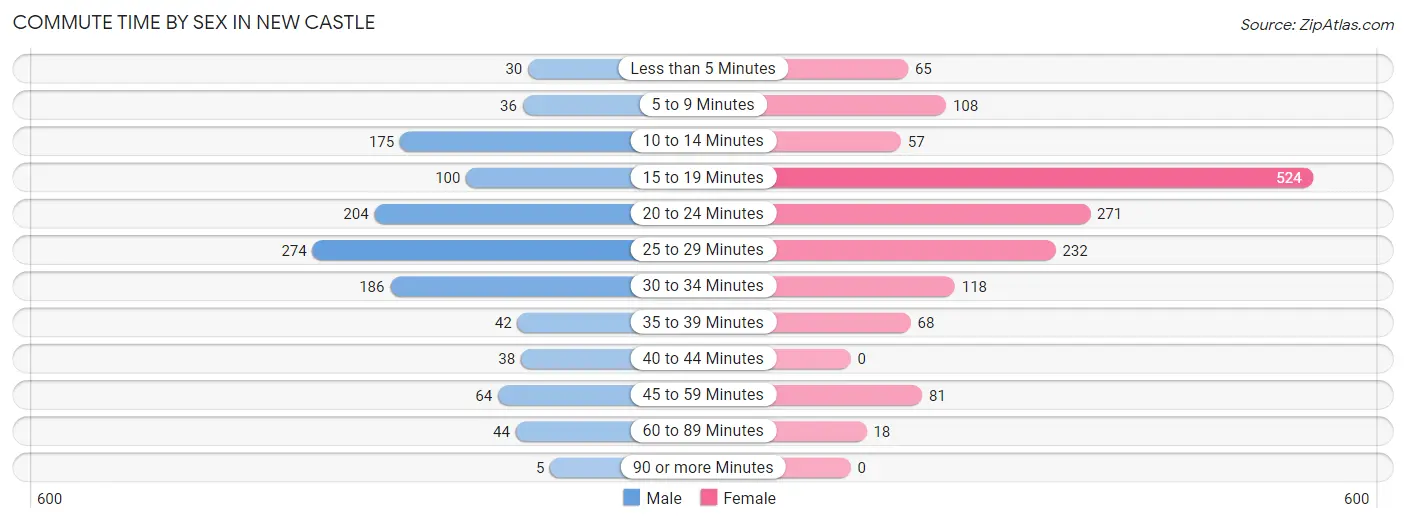
| Commute Time | Male | Female |
| Less than 5 Minutes | 30 (2.5%) | 65 (4.2%) |
| 5 to 9 Minutes | 36 (3.0%) | 108 (7.0%) |
| 10 to 14 Minutes | 175 (14.6%) | 57 (3.7%) |
| 15 to 19 Minutes | 100 (8.4%) | 524 (34.0%) |
| 20 to 24 Minutes | 204 (17.0%) | 271 (17.6%) |
| 25 to 29 Minutes | 274 (22.9%) | 232 (15.0%) |
| 30 to 34 Minutes | 186 (15.5%) | 118 (7.6%) |
| 35 to 39 Minutes | 42 (3.5%) | 68 (4.4%) |
| 40 to 44 Minutes | 38 (3.2%) | 0 (0.0%) |
| 45 to 59 Minutes | 64 (5.3%) | 81 (5.2%) |
| 60 to 89 Minutes | 44 (3.7%) | 18 (1.2%) |
| 90 or more Minutes | 5 (0.4%) | 0 (0.0%) |
Time of Departure to Work by Sex in New Castle
The most frequent times of departure to work in New Castle are 7:00 AM to 7:29 AM (256, 21.4%) for males and 7:00 AM to 7:29 AM (390, 25.3%) for females.
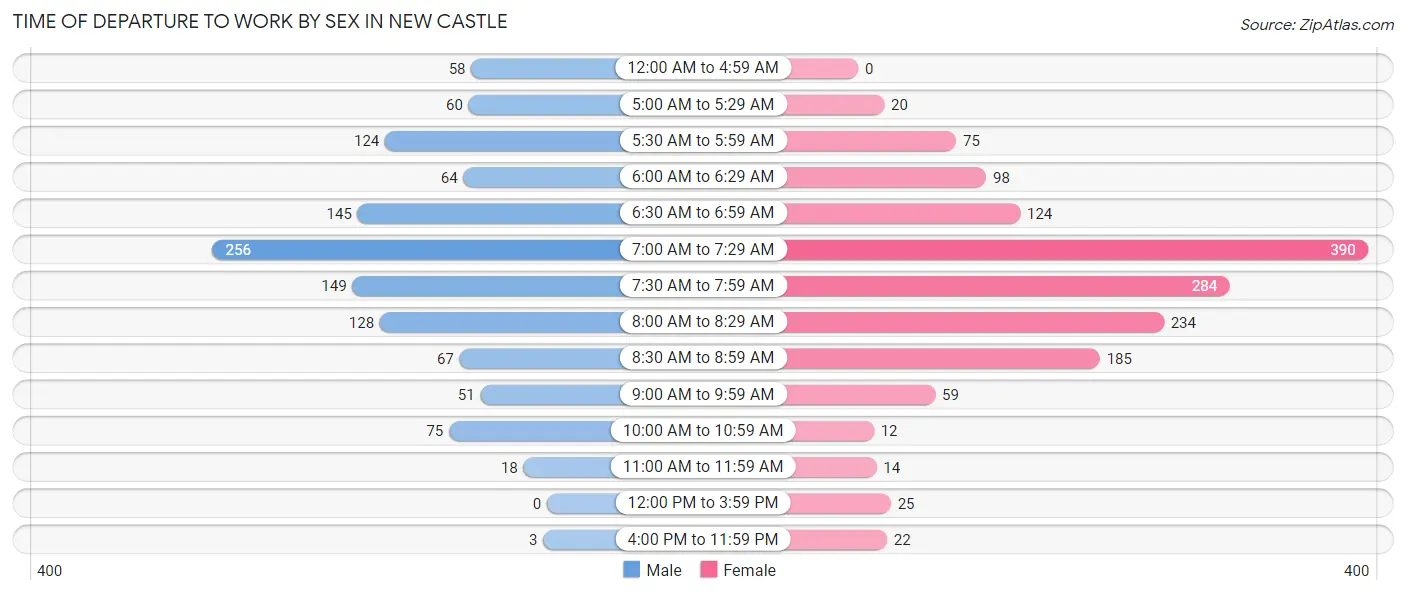
| Time of Departure | Male | Female |
| 12:00 AM to 4:59 AM | 58 (4.8%) | 0 (0.0%) |
| 5:00 AM to 5:29 AM | 60 (5.0%) | 20 (1.3%) |
| 5:30 AM to 5:59 AM | 124 (10.3%) | 75 (4.9%) |
| 6:00 AM to 6:29 AM | 64 (5.3%) | 98 (6.4%) |
| 6:30 AM to 6:59 AM | 145 (12.1%) | 124 (8.0%) |
| 7:00 AM to 7:29 AM | 256 (21.4%) | 390 (25.3%) |
| 7:30 AM to 7:59 AM | 149 (12.4%) | 284 (18.4%) |
| 8:00 AM to 8:29 AM | 128 (10.7%) | 234 (15.2%) |
| 8:30 AM to 8:59 AM | 67 (5.6%) | 185 (12.0%) |
| 9:00 AM to 9:59 AM | 51 (4.3%) | 59 (3.8%) |
| 10:00 AM to 10:59 AM | 75 (6.3%) | 12 (0.8%) |
| 11:00 AM to 11:59 AM | 18 (1.5%) | 14 (0.9%) |
| 12:00 PM to 3:59 PM | 0 (0.0%) | 25 (1.6%) |
| 4:00 PM to 11:59 PM | 3 (0.3%) | 22 (1.4%) |
| Total | 1,198 (100.0%) | 1,542 (100.0%) |
Housing Occupancy in New Castle
Occupancy by Ownership in New Castle
Of the total 2,711 dwellings in New Castle, owner-occupied units account for 1,680 (62.0%), while renter-occupied units make up 1,031 (38.0%).
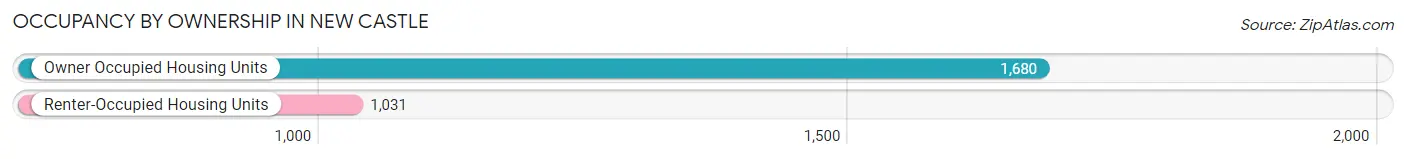
| Occupancy | # Housing Units | % Housing Units |
| Owner Occupied Housing Units | 1,680 | 62.0% |
| Renter-Occupied Housing Units | 1,031 | 38.0% |
| Total Occupied Housing Units | 2,711 | 100.0% |
Occupancy by Household Size in New Castle
| Household Size | # Housing Units | % Housing Units |
| 1-Person Household | 990 | 36.5% |
| 2-Person Household | 1,060 | 39.1% |
| 3-Person Household | 312 | 11.5% |
| 4+ Person Household | 349 | 12.9% |
| Total Housing Units | 2,711 | 100.0% |
Occupancy by Ownership by Household Size in New Castle
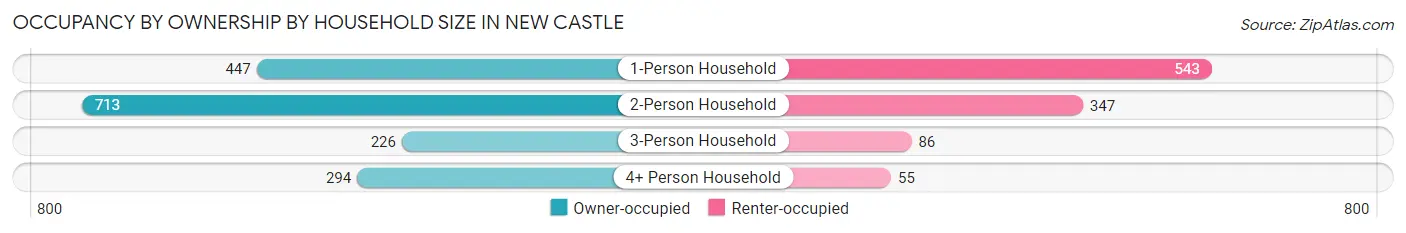
| Household Size | Owner-occupied | Renter-occupied |
| 1-Person Household | 447 (45.2%) | 543 (54.8%) |
| 2-Person Household | 713 (67.3%) | 347 (32.7%) |
| 3-Person Household | 226 (72.4%) | 86 (27.6%) |
| 4+ Person Household | 294 (84.2%) | 55 (15.8%) |
| Total Housing Units | 1,680 (62.0%) | 1,031 (38.0%) |
Occupancy by Educational Attainment in New Castle
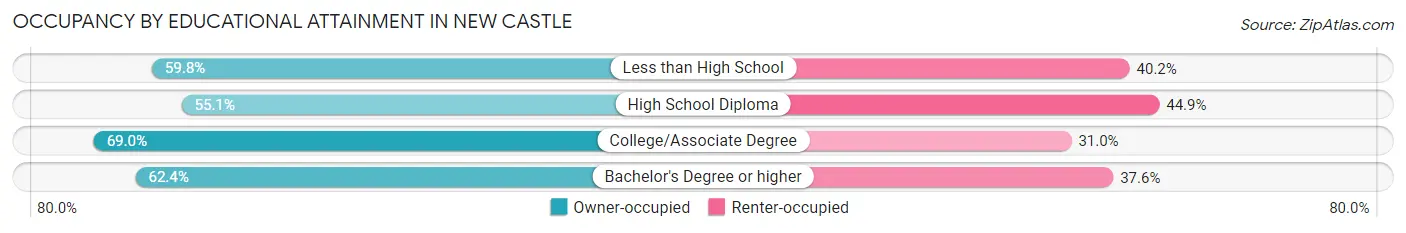
| Household Size | Owner-occupied | Renter-occupied |
| Less than High School | 61 (59.8%) | 41 (40.2%) |
| High School Diploma | 449 (55.1%) | 366 (44.9%) |
| College/Associate Degree | 526 (69.0%) | 236 (31.0%) |
| Bachelor's Degree or higher | 644 (62.4%) | 388 (37.6%) |
Occupancy by Age of Householder in New Castle
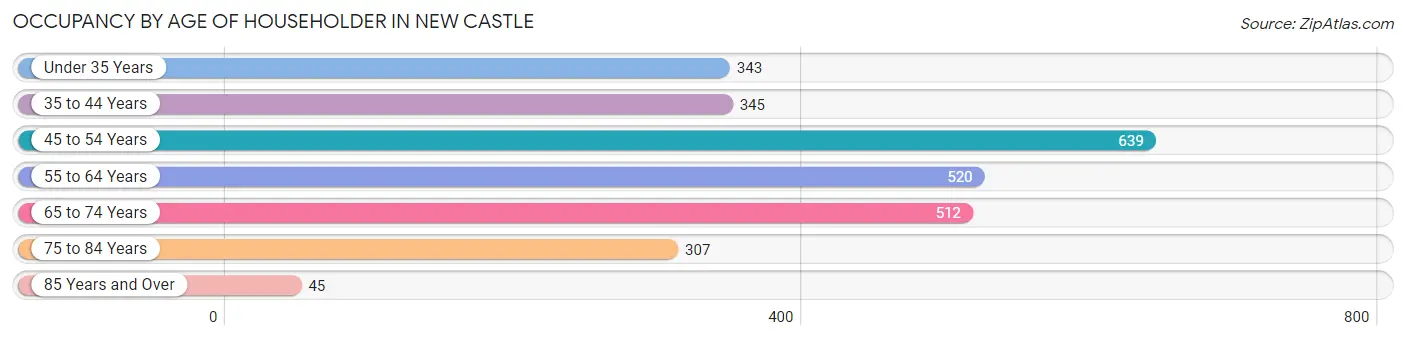
| Age Bracket | # Households | % Households |
| Under 35 Years | 343 | 12.7% |
| 35 to 44 Years | 345 | 12.7% |
| 45 to 54 Years | 639 | 23.6% |
| 55 to 64 Years | 520 | 19.2% |
| 65 to 74 Years | 512 | 18.9% |
| 75 to 84 Years | 307 | 11.3% |
| 85 Years and Over | 45 | 1.7% |
| Total | 2,711 | 100.0% |
Housing Finances in New Castle
Median Income by Occupancy in New Castle
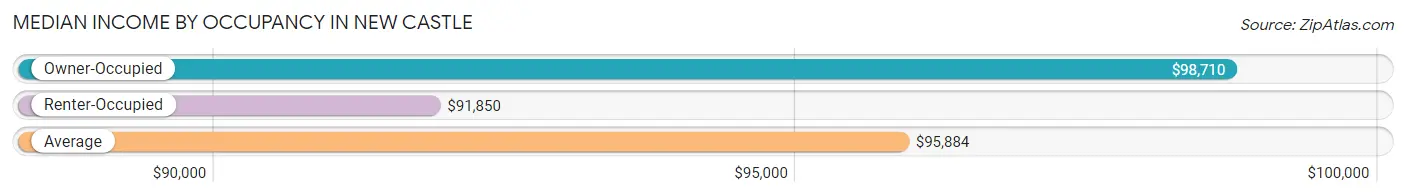
| Occupancy Type | # Households | Median Income |
| Owner-Occupied | 1,680 (62.0%) | $98,710 |
| Renter-Occupied | 1,031 (38.0%) | $91,850 |
| Average | 2,711 (100.0%) | $95,884 |
Occupancy by Householder Income Bracket in New Castle
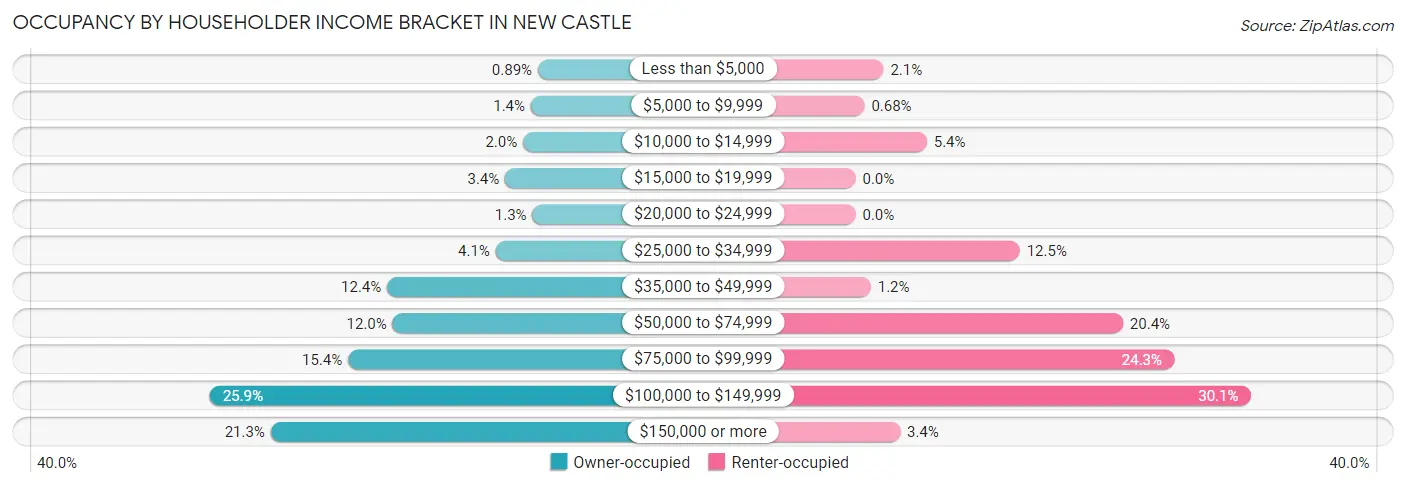
| Income Bracket | Owner-occupied | Renter-occupied |
| Less than $5,000 | 15 (0.9%) | 22 (2.1%) |
| $5,000 to $9,999 | 24 (1.4%) | 7 (0.7%) |
| $10,000 to $14,999 | 34 (2.0%) | 56 (5.4%) |
| $15,000 to $19,999 | 57 (3.4%) | 0 (0.0%) |
| $20,000 to $24,999 | 22 (1.3%) | 0 (0.0%) |
| $25,000 to $34,999 | 69 (4.1%) | 129 (12.5%) |
| $35,000 to $49,999 | 208 (12.4%) | 12 (1.2%) |
| $50,000 to $74,999 | 201 (12.0%) | 210 (20.4%) |
| $75,000 to $99,999 | 258 (15.4%) | 250 (24.2%) |
| $100,000 to $149,999 | 435 (25.9%) | 310 (30.1%) |
| $150,000 or more | 357 (21.2%) | 35 (3.4%) |
| Total | 1,680 (100.0%) | 1,031 (100.0%) |
Monthly Housing Cost Tiers in New Castle
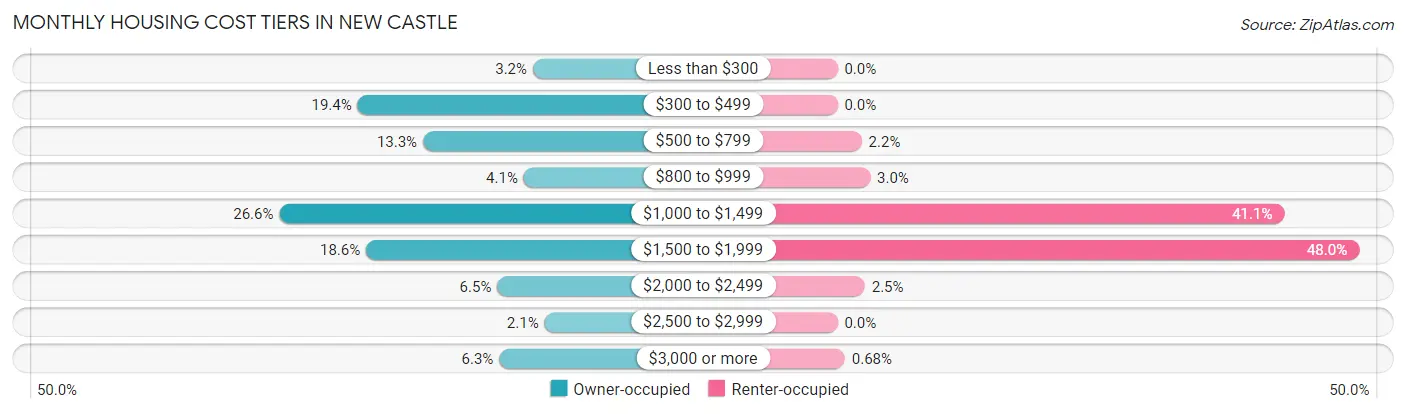
| Monthly Cost | Owner-occupied | Renter-occupied |
| Less than $300 | 54 (3.2%) | 0 (0.0%) |
| $300 to $499 | 325 (19.4%) | 0 (0.0%) |
| $500 to $799 | 224 (13.3%) | 23 (2.2%) |
| $800 to $999 | 68 (4.1%) | 31 (3.0%) |
| $1,000 to $1,499 | 446 (26.6%) | 424 (41.1%) |
| $1,500 to $1,999 | 312 (18.6%) | 495 (48.0%) |
| $2,000 to $2,499 | 109 (6.5%) | 26 (2.5%) |
| $2,500 to $2,999 | 36 (2.1%) | 0 (0.0%) |
| $3,000 or more | 106 (6.3%) | 7 (0.7%) |
| Total | 1,680 (100.0%) | 1,031 (100.0%) |
Physical Housing Characteristics in New Castle
Housing Structures in New Castle
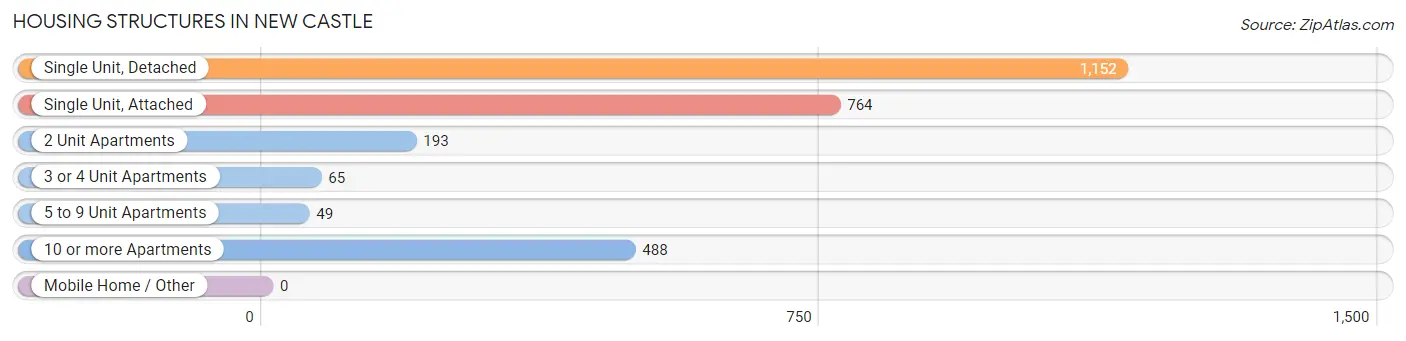
| Structure Type | # Housing Units | % Housing Units |
| Single Unit, Detached | 1,152 | 42.5% |
| Single Unit, Attached | 764 | 28.2% |
| 2 Unit Apartments | 193 | 7.1% |
| 3 or 4 Unit Apartments | 65 | 2.4% |
| 5 to 9 Unit Apartments | 49 | 1.8% |
| 10 or more Apartments | 488 | 18.0% |
| Mobile Home / Other | 0 | 0.0% |
| Total | 2,711 | 100.0% |
Housing Structures by Occupancy in New Castle
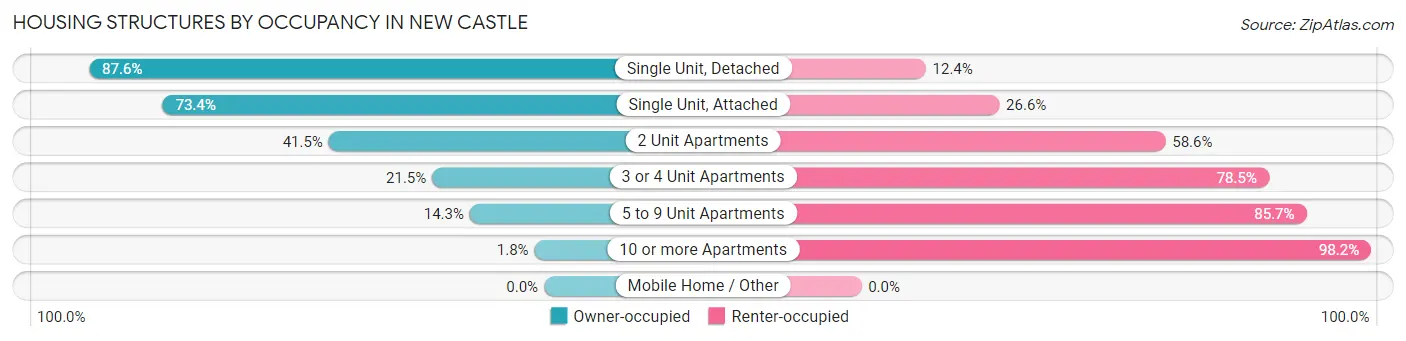
| Structure Type | Owner-occupied | Renter-occupied |
| Single Unit, Detached | 1,009 (87.6%) | 143 (12.4%) |
| Single Unit, Attached | 561 (73.4%) | 203 (26.6%) |
| 2 Unit Apartments | 80 (41.4%) | 113 (58.6%) |
| 3 or 4 Unit Apartments | 14 (21.5%) | 51 (78.5%) |
| 5 to 9 Unit Apartments | 7 (14.3%) | 42 (85.7%) |
| 10 or more Apartments | 9 (1.8%) | 479 (98.2%) |
| Mobile Home / Other | 0 (0.0%) | 0 (0.0%) |
| Total | 1,680 (62.0%) | 1,031 (38.0%) |
Housing Structures by Number of Rooms in New Castle
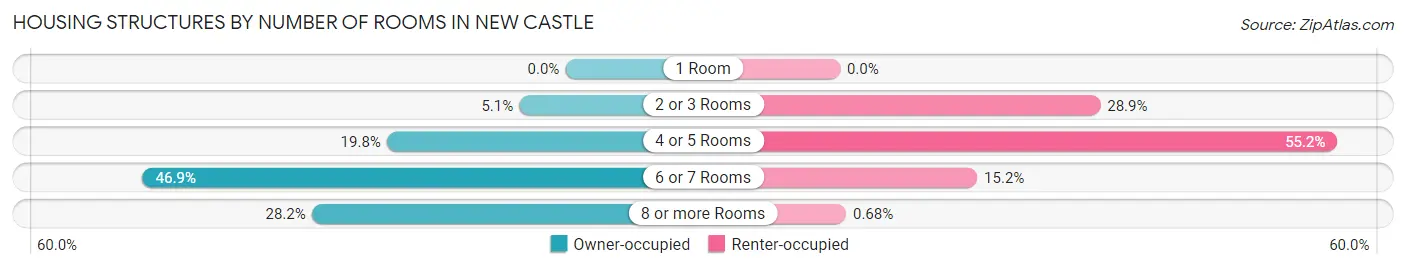
| Number of Rooms | Owner-occupied | Renter-occupied |
| 1 Room | 0 (0.0%) | 0 (0.0%) |
| 2 or 3 Rooms | 86 (5.1%) | 298 (28.9%) |
| 4 or 5 Rooms | 333 (19.8%) | 569 (55.2%) |
| 6 or 7 Rooms | 788 (46.9%) | 157 (15.2%) |
| 8 or more Rooms | 473 (28.1%) | 7 (0.7%) |
| Total | 1,680 (100.0%) | 1,031 (100.0%) |
Housing Structure by Heating Type in New Castle
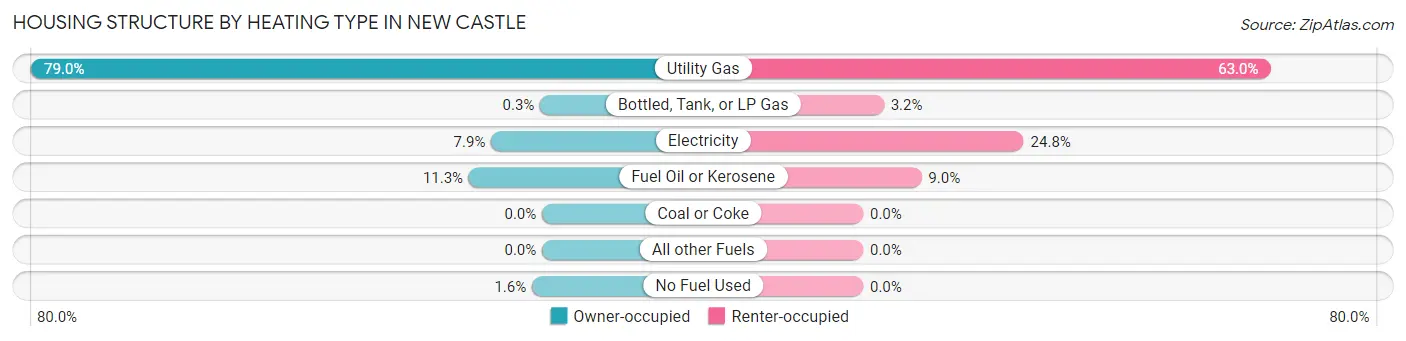
| Heating Type | Owner-occupied | Renter-occupied |
| Utility Gas | 1,327 (79.0%) | 649 (62.9%) |
| Bottled, Tank, or LP Gas | 5 (0.3%) | 33 (3.2%) |
| Electricity | 132 (7.9%) | 256 (24.8%) |
| Fuel Oil or Kerosene | 190 (11.3%) | 93 (9.0%) |
| Coal or Coke | 0 (0.0%) | 0 (0.0%) |
| All other Fuels | 0 (0.0%) | 0 (0.0%) |
| No Fuel Used | 26 (1.5%) | 0 (0.0%) |
| Total | 1,680 (100.0%) | 1,031 (100.0%) |
Household Vehicle Usage in New Castle
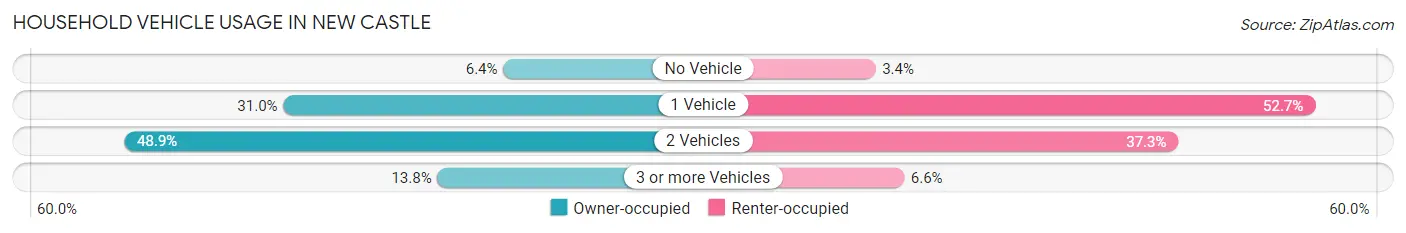
| Vehicles per Household | Owner-occupied | Renter-occupied |
| No Vehicle | 107 (6.4%) | 35 (3.4%) |
| 1 Vehicle | 521 (31.0%) | 543 (52.7%) |
| 2 Vehicles | 821 (48.9%) | 385 (37.3%) |
| 3 or more Vehicles | 231 (13.8%) | 68 (6.6%) |
| Total | 1,680 (100.0%) | 1,031 (100.0%) |
Real Estate & Mortgages in New Castle
Real Estate and Mortgage Overview in New Castle
| Characteristic | Without Mortgage | With Mortgage |
| Housing Units | 636 | 1,044 |
| Median Property Value | $232,600 | $252,000 |
| Median Household Income | $74,737 | $311 |
| Monthly Housing Costs | $394 | $106 |
| Real Estate Taxes | $1,202 | $7 |
Property Value by Mortgage Status in New Castle
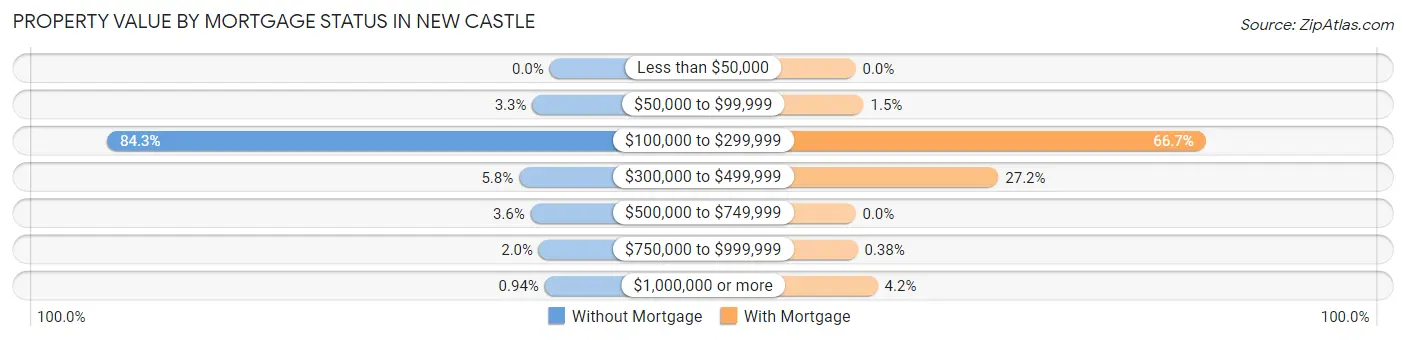
| Property Value | Without Mortgage | With Mortgage |
| Less than $50,000 | 0 (0.0%) | 0 (0.0%) |
| $50,000 to $99,999 | 21 (3.3%) | 16 (1.5%) |
| $100,000 to $299,999 | 536 (84.3%) | 696 (66.7%) |
| $300,000 to $499,999 | 37 (5.8%) | 284 (27.2%) |
| $500,000 to $749,999 | 23 (3.6%) | 0 (0.0%) |
| $750,000 to $999,999 | 13 (2.0%) | 4 (0.4%) |
| $1,000,000 or more | 6 (0.9%) | 44 (4.2%) |
| Total | 636 (100.0%) | 1,044 (100.0%) |
Household Income by Mortgage Status in New Castle
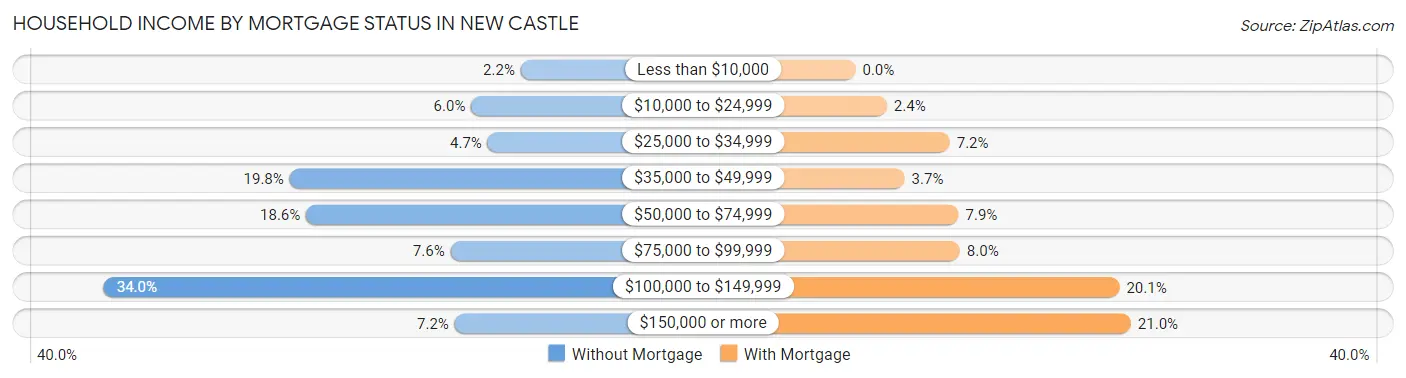
| Household Income | Without Mortgage | With Mortgage |
| Less than $10,000 | 14 (2.2%) | 0 (0.0%) |
| $10,000 to $24,999 | 38 (6.0%) | 25 (2.4%) |
| $25,000 to $34,999 | 30 (4.7%) | 75 (7.2%) |
| $35,000 to $49,999 | 126 (19.8%) | 39 (3.7%) |
| $50,000 to $74,999 | 118 (18.5%) | 82 (7.9%) |
| $75,000 to $99,999 | 48 (7.5%) | 83 (8.0%) |
| $100,000 to $149,999 | 216 (34.0%) | 210 (20.1%) |
| $150,000 or more | 46 (7.2%) | 219 (21.0%) |
| Total | 636 (100.0%) | 1,044 (100.0%) |
Property Value to Household Income Ratio in New Castle
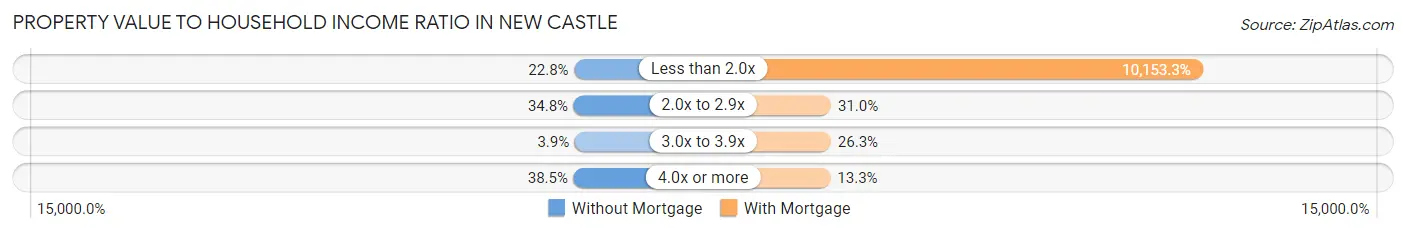
| Value-to-Income Ratio | Without Mortgage | With Mortgage |
| Less than 2.0x | 145 (22.8%) | 106,000 (10,153.3%) |
| 2.0x to 2.9x | 221 (34.7%) | 324 (31.0%) |
| 3.0x to 3.9x | 25 (3.9%) | 274 (26.3%) |
| 4.0x or more | 245 (38.5%) | 139 (13.3%) |
| Total | 636 (100.0%) | 1,044 (100.0%) |
Real Estate Taxes by Mortgage Status in New Castle
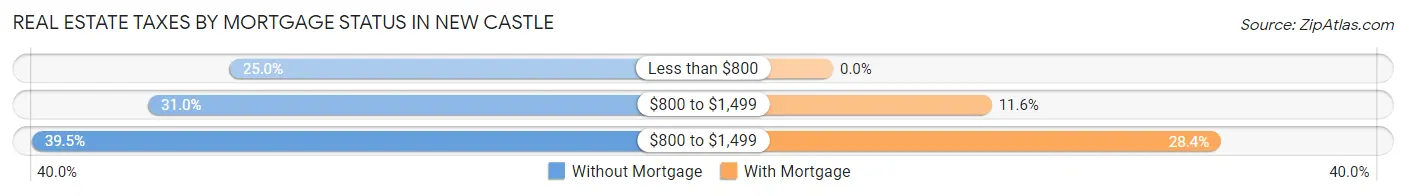
| Property Taxes | Without Mortgage | With Mortgage |
| Less than $800 | 159 (25.0%) | 0 (0.0%) |
| $800 to $1,499 | 197 (31.0%) | 121 (11.6%) |
| $800 to $1,499 | 251 (39.5%) | 296 (28.3%) |
| Total | 636 (100.0%) | 1,044 (100.0%) |
Health & Disability in New Castle
Health Insurance Coverage by Age in New Castle
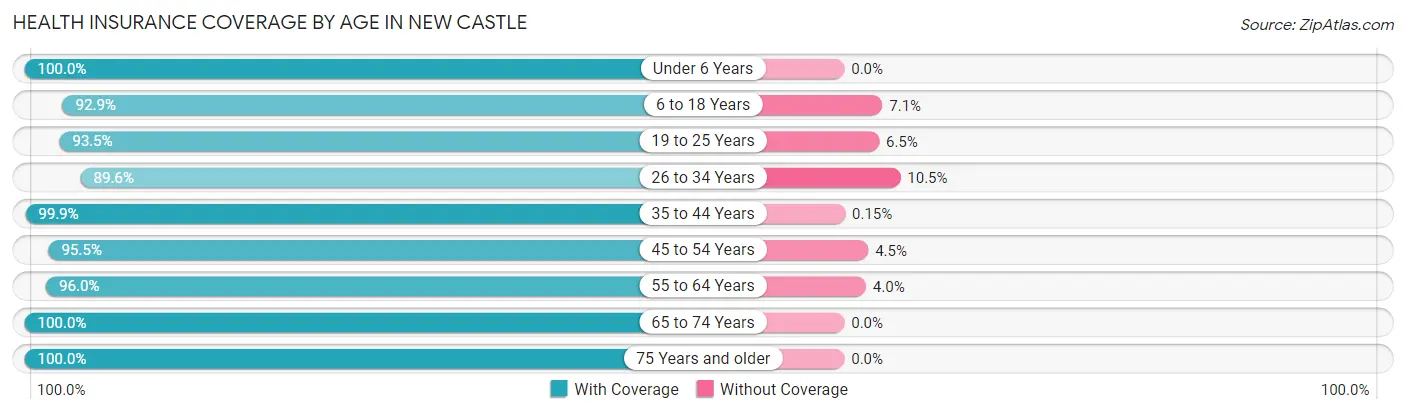
| Age Bracket | With Coverage | Without Coverage |
| Under 6 Years | 229 (100.0%) | 0 (0.0%) |
| 6 to 18 Years | 523 (92.9%) | 40 (7.1%) |
| 19 to 25 Years | 231 (93.5%) | 16 (6.5%) |
| 26 to 34 Years | 574 (89.5%) | 67 (10.4%) |
| 35 to 44 Years | 664 (99.9%) | 1 (0.2%) |
| 45 to 54 Years | 856 (95.5%) | 40 (4.5%) |
| 55 to 64 Years | 1,023 (96.0%) | 43 (4.0%) |
| 65 to 74 Years | 691 (100.0%) | 0 (0.0%) |
| 75 Years and older | 469 (100.0%) | 0 (0.0%) |
| Total | 5,260 (96.2%) | 207 (3.8%) |
Health Insurance Coverage by Citizenship Status in New Castle
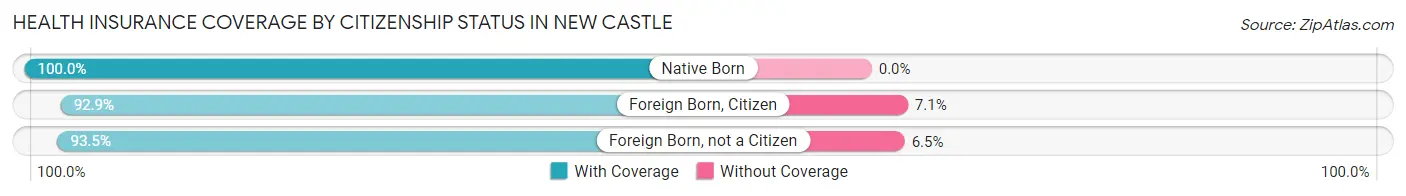
| Citizenship Status | With Coverage | Without Coverage |
| Native Born | 229 (100.0%) | 0 (0.0%) |
| Foreign Born, Citizen | 523 (92.9%) | 40 (7.1%) |
| Foreign Born, not a Citizen | 231 (93.5%) | 16 (6.5%) |
Health Insurance Coverage by Household Income in New Castle
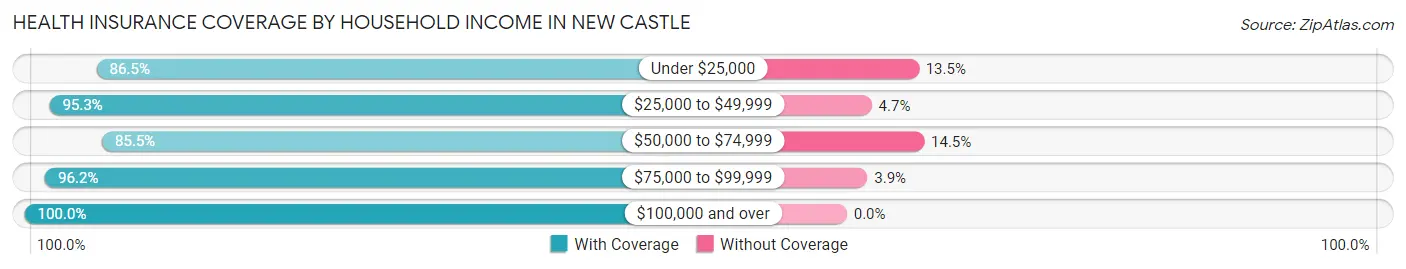
| Household Income | With Coverage | Without Coverage |
| Under $25,000 | 244 (86.5%) | 38 (13.5%) |
| $25,000 to $49,999 | 593 (95.3%) | 29 (4.7%) |
| $50,000 to $74,999 | 584 (85.5%) | 99 (14.5%) |
| $75,000 to $99,999 | 998 (96.2%) | 40 (3.8%) |
| $100,000 and over | 2,841 (100.0%) | 0 (0.0%) |
Public vs Private Health Insurance Coverage by Age in New Castle
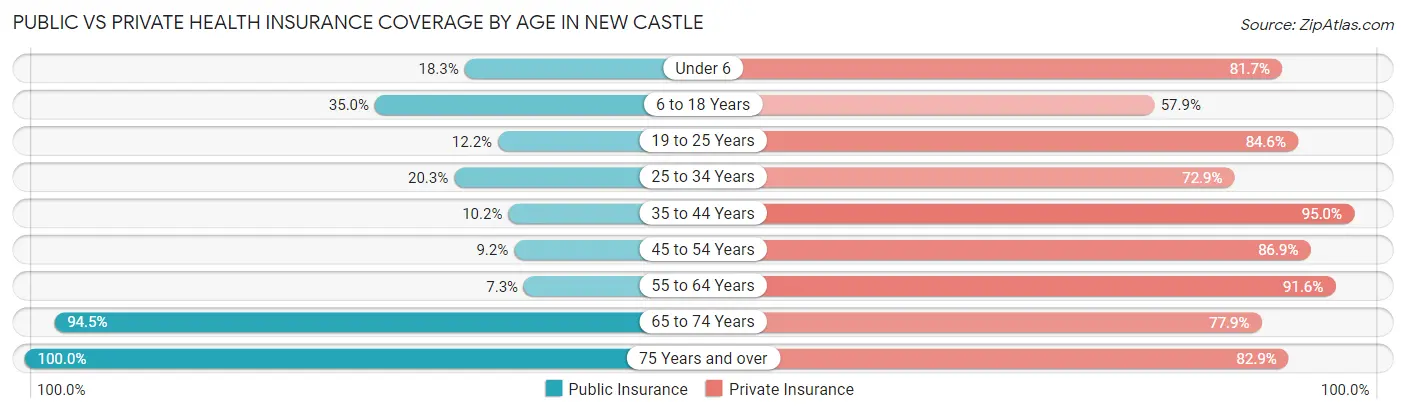
| Age Bracket | Public Insurance | Private Insurance |
| Under 6 | 42 (18.3%) | 187 (81.7%) |
| 6 to 18 Years | 197 (35.0%) | 326 (57.9%) |
| 19 to 25 Years | 30 (12.1%) | 209 (84.6%) |
| 25 to 34 Years | 130 (20.3%) | 467 (72.9%) |
| 35 to 44 Years | 68 (10.2%) | 632 (95.0%) |
| 45 to 54 Years | 82 (9.1%) | 779 (86.9%) |
| 55 to 64 Years | 78 (7.3%) | 976 (91.6%) |
| 65 to 74 Years | 653 (94.5%) | 538 (77.9%) |
| 75 Years and over | 469 (100.0%) | 389 (82.9%) |
| Total | 1,749 (32.0%) | 4,503 (82.4%) |
Disability Status by Sex by Age in New Castle
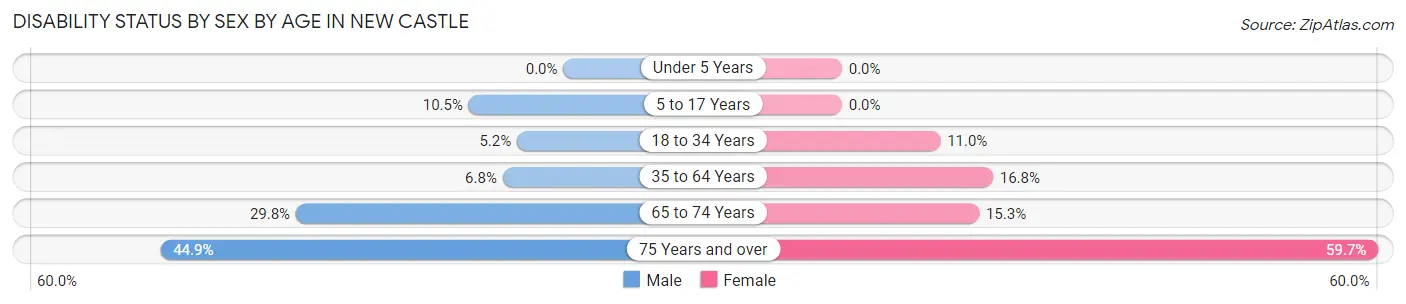
| Age Bracket | Male | Female |
| Under 5 Years | 0 (0.0%) | 0 (0.0%) |
| 5 to 17 Years | 30 (10.5%) | 0 (0.0%) |
| 18 to 34 Years | 21 (5.2%) | 55 (11.0%) |
| 35 to 64 Years | 83 (6.8%) | 235 (16.8%) |
| 65 to 74 Years | 120 (29.8%) | 44 (15.3%) |
| 75 Years and over | 79 (44.9%) | 175 (59.7%) |
Disability Class by Sex by Age in New Castle
Disability Class: Hearing Difficulty
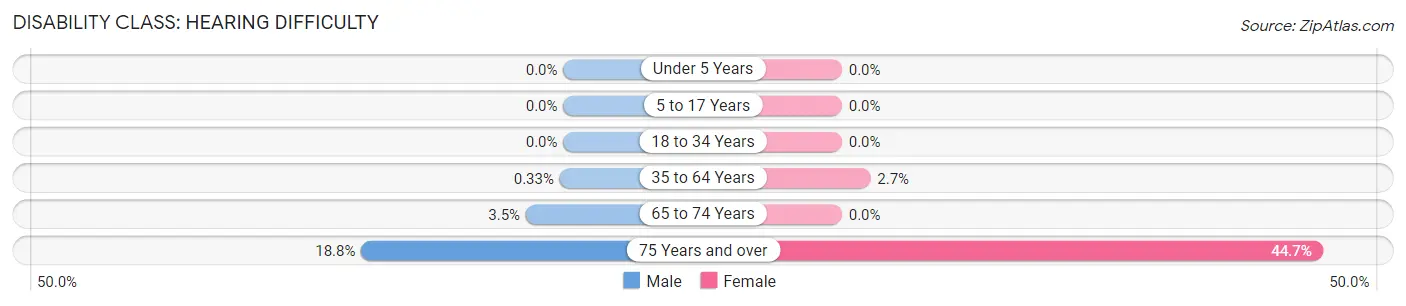
| Age Bracket | Male | Female |
| Under 5 Years | 0 (0.0%) | 0 (0.0%) |
| 5 to 17 Years | 0 (0.0%) | 0 (0.0%) |
| 18 to 34 Years | 0 (0.0%) | 0 (0.0%) |
| 35 to 64 Years | 4 (0.3%) | 37 (2.6%) |
| 65 to 74 Years | 14 (3.5%) | 0 (0.0%) |
| 75 Years and over | 33 (18.8%) | 131 (44.7%) |
Disability Class: Vision Difficulty
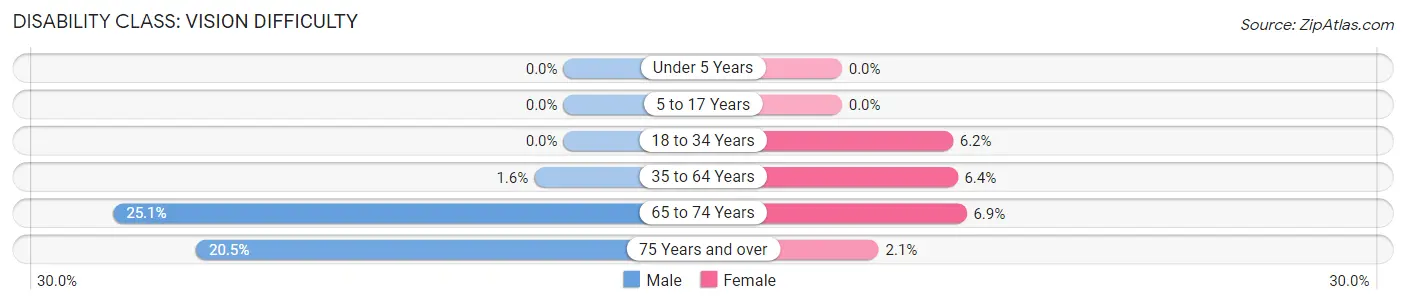
| Age Bracket | Male | Female |
| Under 5 Years | 0 (0.0%) | 0 (0.0%) |
| 5 to 17 Years | 0 (0.0%) | 0 (0.0%) |
| 18 to 34 Years | 0 (0.0%) | 31 (6.2%) |
| 35 to 64 Years | 20 (1.6%) | 90 (6.4%) |
| 65 to 74 Years | 101 (25.1%) | 20 (6.9%) |
| 75 Years and over | 36 (20.4%) | 6 (2.1%) |
Disability Class: Cognitive Difficulty
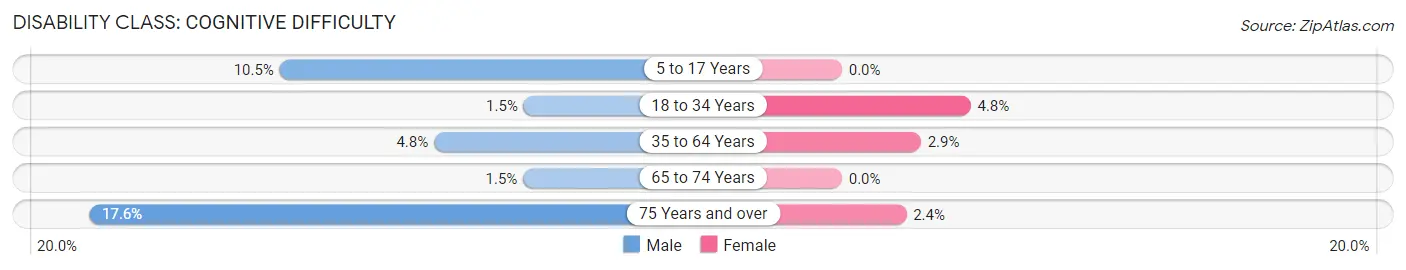
| Age Bracket | Male | Female |
| 5 to 17 Years | 30 (10.5%) | 0 (0.0%) |
| 18 to 34 Years | 6 (1.5%) | 24 (4.8%) |
| 35 to 64 Years | 59 (4.8%) | 41 (2.9%) |
| 65 to 74 Years | 6 (1.5%) | 0 (0.0%) |
| 75 Years and over | 31 (17.6%) | 7 (2.4%) |
Disability Class: Ambulatory Difficulty
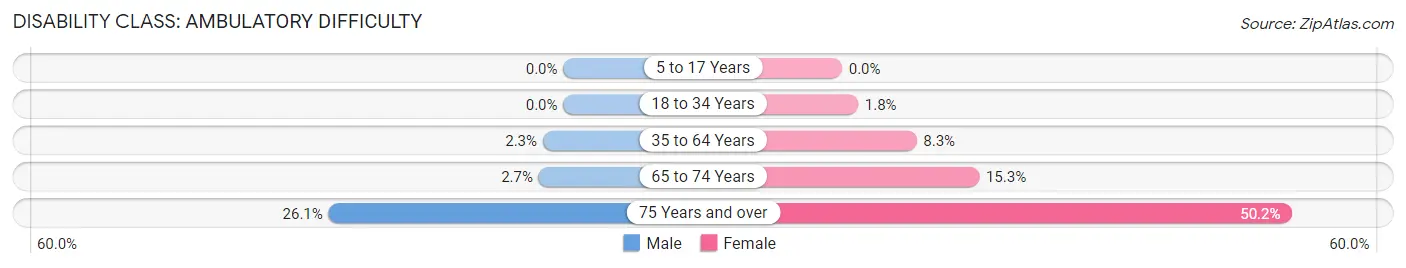
| Age Bracket | Male | Female |
| 5 to 17 Years | 0 (0.0%) | 0 (0.0%) |
| 18 to 34 Years | 0 (0.0%) | 9 (1.8%) |
| 35 to 64 Years | 28 (2.3%) | 116 (8.3%) |
| 65 to 74 Years | 11 (2.7%) | 44 (15.3%) |
| 75 Years and over | 46 (26.1%) | 147 (50.2%) |
Disability Class: Self-Care Difficulty
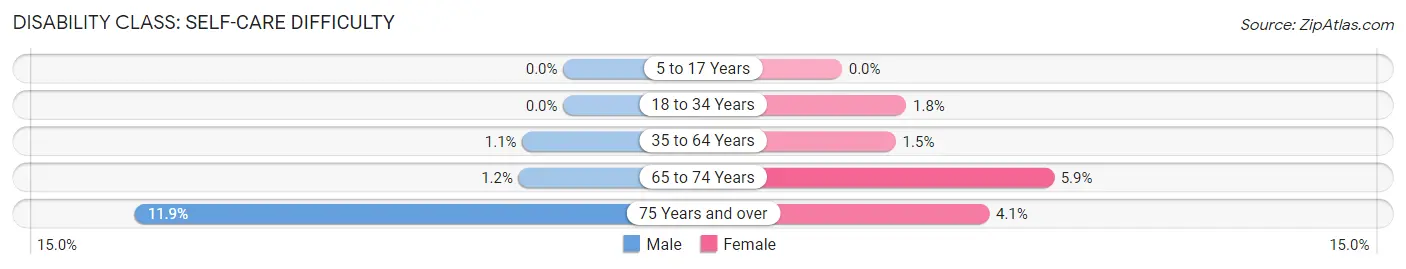
| Age Bracket | Male | Female |
| 5 to 17 Years | 0 (0.0%) | 0 (0.0%) |
| 18 to 34 Years | 0 (0.0%) | 9 (1.8%) |
| 35 to 64 Years | 14 (1.1%) | 21 (1.5%) |
| 65 to 74 Years | 5 (1.2%) | 17 (5.9%) |
| 75 Years and over | 21 (11.9%) | 12 (4.1%) |
Technology Access in New Castle
Computing Device Access in New Castle
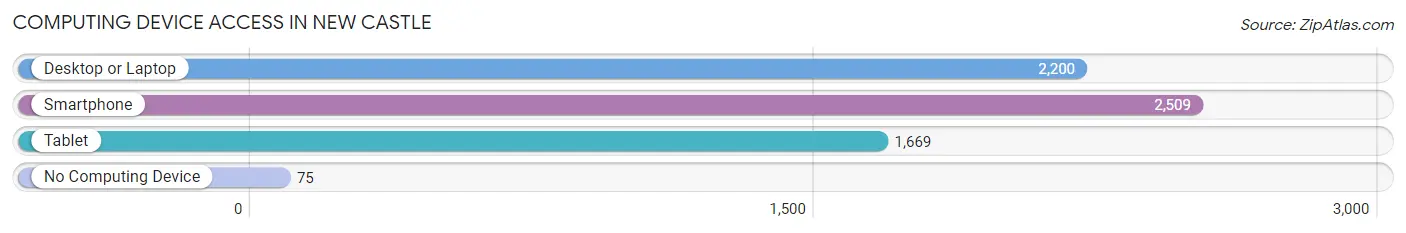
| Device Type | # Households | % Households |
| Desktop or Laptop | 2,200 | 81.1% |
| Smartphone | 2,509 | 92.5% |
| Tablet | 1,669 | 61.6% |
| No Computing Device | 75 | 2.8% |
| Total | 2,711 | 100.0% |
Internet Access in New Castle
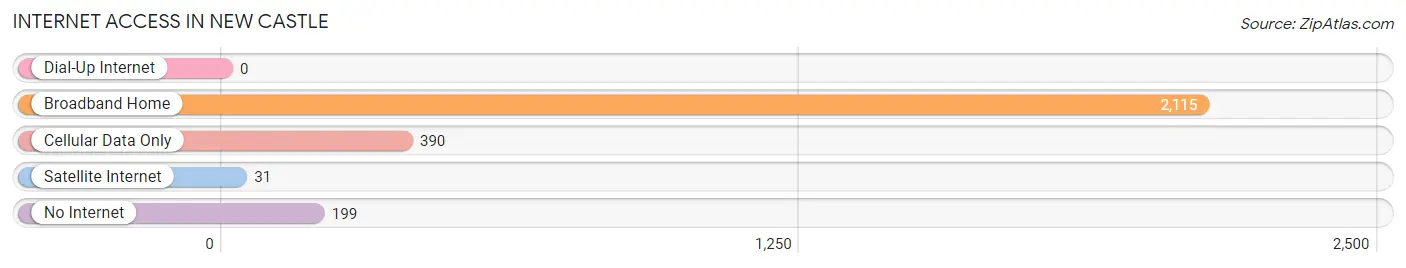
| Internet Type | # Households | % Households |
| Dial-Up Internet | 0 | 0.0% |
| Broadband Home | 2,115 | 78.0% |
| Cellular Data Only | 390 | 14.4% |
| Satellite Internet | 31 | 1.1% |
| No Internet | 199 | 7.3% |
| Total | 2,711 | 100.0% |
New Castle Summary
New Castle, Delaware is a small city located in New Castle County, Delaware. It is situated on the Delaware River, just south of Wilmington. The city has a population of 5,285 as of the 2010 census, making it the second-smallest city in the state.
History
New Castle was founded in 1651 by Dutch settlers, making it one of the oldest cities in the United States. The city was originally known as Fort Casimir, and was the first Dutch settlement in the Delaware Valley. The city was renamed New Castle in 1673, after the Dutch city of Nieuw Amsterdam.
In 1664, the English took control of the area, and the city was renamed New Castle. The city was the capital of the Delaware Colony from 1704 to 1776, and was the site of the signing of the Declaration of Independence in 1776.
During the American Revolution, the city was occupied by the British, and was the site of a major battle in 1777. The city was also the site of a major naval battle in 1782.
In the 19th century, the city was an important port and shipbuilding center. The city was also the site of a major shipbuilding yard during the Civil War.
Geography
New Castle is located at 39°41'N 75°35'W. The city is situated on the Delaware River, just south of Wilmington. The city has a total area of 1.3 square miles, all of which is land.
The city is located in the humid subtropical climate zone, with hot, humid summers and mild winters. The average temperature in the summer is around 80°F, and the average temperature in the winter is around 40°F.
Economy
The economy of New Castle is largely based on manufacturing and services. The city is home to several large manufacturing companies, including DuPont, AstraZeneca, and Hercules. The city is also home to several large service companies, including Christiana Care Health System and the University of Delaware.
The city is also home to several small businesses, including restaurants, retail stores, and professional services.
Demographics
As of the 2010 census, the population of New Castle was 5,285. The racial makeup of the city was 79.3% White, 11.2% African American, 0.3% Native American, 2.2% Asian, 0.1% Pacific Islander, 4.2% from other races, and 2.9% from two or more races. Hispanic or Latino of any race were 8.3% of the population.
The median income for a household in the city was $45,938, and the median income for a family was $54,844. The per capita income for the city was $22,945. About 11.2% of families and 14.2% of the population were below the poverty line, including 19.2% of those under age 18 and 8.2% of those age 65 or over.
Common Questions
What is Per Capita Income in New Castle?
Per Capita income in New Castle is $53,997.
What is the Median Family Income in New Castle?
Median Family Income in New Castle is $112,500.
What is the Median Household income in New Castle?
Median Household Income in New Castle is $95,884.
What is Income or Wage Gap in New Castle?
Income or Wage Gap in New Castle is 9.4%.
Women in New Castle earn 90.6 cents for every dollar earned by a man.
What is Inequality or Gini Index in New Castle?
Inequality or Gini Index in New Castle is 0.39.
What is the Total Population of New Castle?
Total Population of New Castle is 5,523.
What is the Total Male Population of New Castle?
Total Male Population of New Castle is 2,712.
What is the Total Female Population of New Castle?
Total Female Population of New Castle is 2,811.
What is the Ratio of Males per 100 Females in New Castle?
There are 96.48 Males per 100 Females in New Castle.
What is the Ratio of Females per 100 Males in New Castle?
There are 103.65 Females per 100 Males in New Castle.
What is the Median Population Age in New Castle?
Median Population Age in New Castle is 49.2 Years.
What is the Average Family Size in New Castle
Average Family Size in New Castle is 2.6 People.
What is the Average Household Size in New Castle
Average Household Size in New Castle is 2.0 People.
How Large is the Labor Force in New Castle?
There are 3,319 People in the Labor Forcein in New Castle.
What is the Percentage of People in the Labor Force in New Castle?
68.2% of People are in the Labor Force in New Castle.
What is the Unemployment Rate in New Castle?
Unemployment Rate in New Castle is 1.3%.