Elsmere, DE Map & Demographics
Elsmere Map
Elsmere Overview
$30,900
PER CAPITA INCOME
$78,505
AVG FAMILY INCOME
$70,773
AVG HOUSEHOLD INCOME
5.6%
WAGE / INCOME GAP [ % ]
94.4¢/ $1
WAGE / INCOME GAP [ $ ]
0.42
INEQUALITY / GINI INDEX
6,194
TOTAL POPULATION
3,022
MALE POPULATION
3,172
FEMALE POPULATION
95.27
MALES / 100 FEMALES
104.96
FEMALES / 100 MALES
34.2
MEDIAN AGE
3.6
AVG FAMILY SIZE
2.7
AVG HOUSEHOLD SIZE
3,256
LABOR FORCE [ PEOPLE ]
67.9%
PERCENT IN LABOR FORCE
5.2%
UNEMPLOYMENT RATE
Elsmere Area Codes
Income in Elsmere
Income Overview in Elsmere
Per Capita Income in Elsmere is $30,900, while median incomes of families and households are $78,505 and $70,773 respectively.
| Characteristic | Number | Measure |
| Per Capita Income | 6,194 | $30,900 |
| Median Family Income | 1,353 | $78,505 |
| Mean Family Income | 1,353 | $83,418 |
| Median Household Income | 2,282 | $70,773 |
| Mean Household Income | 2,282 | $80,033 |
| Income Deficit | 1,353 | $0 |
| Wage / Income Gap (%) | 6,194 | 5.60% |
| Wage / Income Gap ($) | 6,194 | 94.40¢ per $1 |
| Gini / Inequality Index | 6,194 | 0.42 |
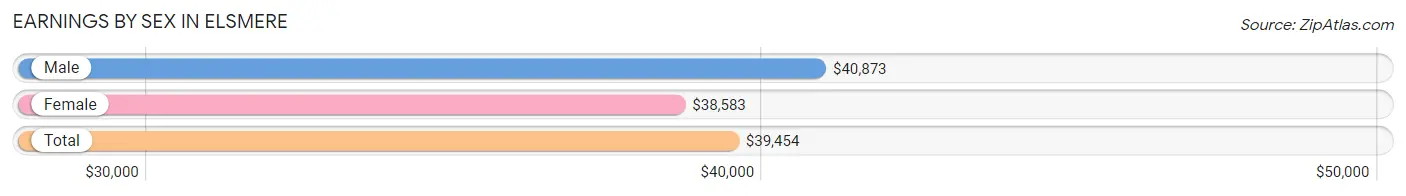
Earnings by Sex in Elsmere
Average Earnings in Elsmere are $39,454, $40,873 for men and $38,583 for women, a difference of 5.6%.
| Sex | Number | Average Earnings |
| Male | 1,636 (50.0%) | $40,873 |
| Female | 1,637 (50.0%) | $38,583 |
| Total | 3,273 (100.0%) | $39,454 |
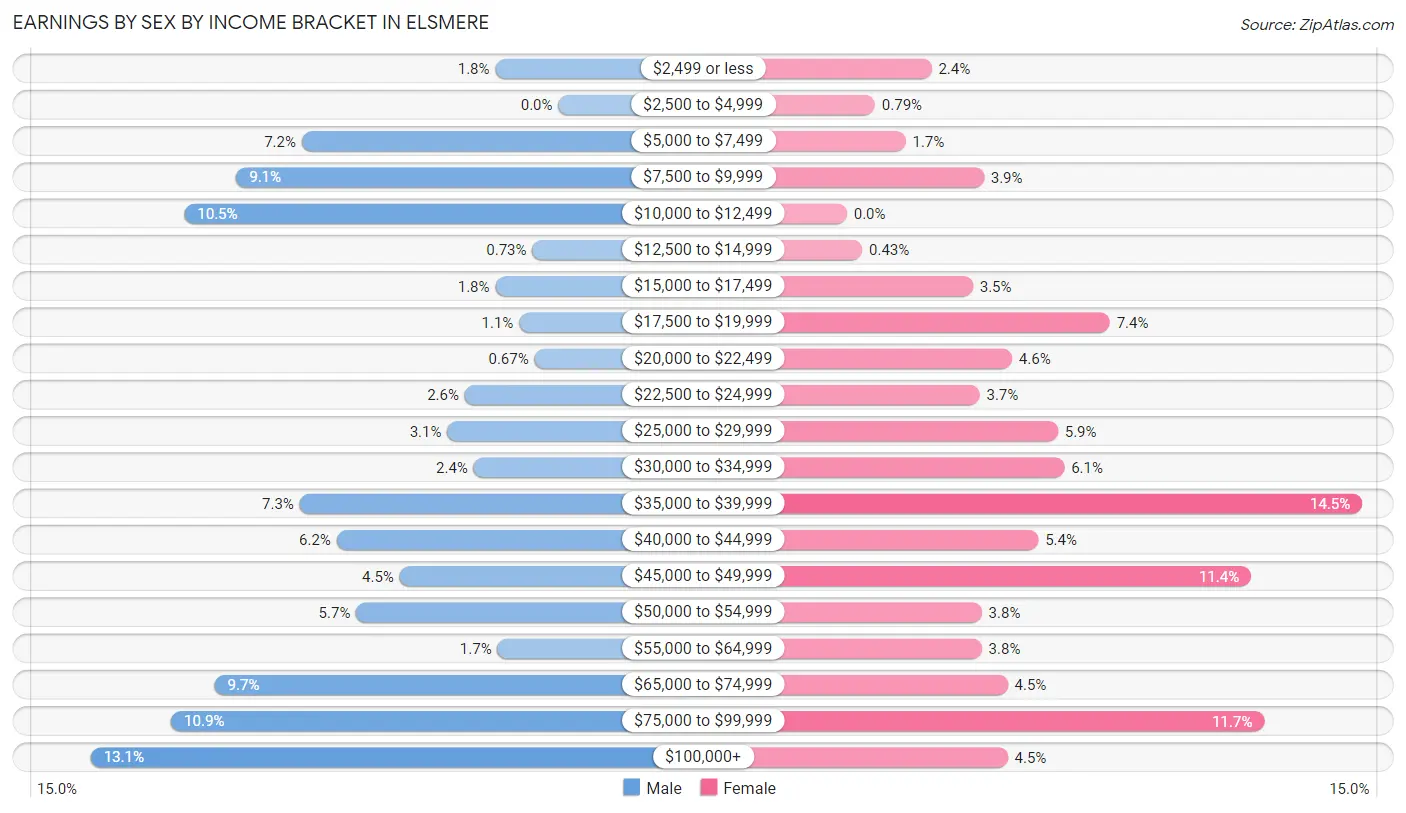
Earnings by Sex by Income Bracket in Elsmere
The most common earnings brackets in Elsmere are $100,000+ for men (215 | 13.1%) and $35,000 to $39,999 for women (237 | 14.5%).
| Income | Male | Female |
| $2,499 or less | 29 (1.8%) | 39 (2.4%) |
| $2,500 to $4,999 | 0 (0.0%) | 13 (0.8%) |
| $5,000 to $7,499 | 118 (7.2%) | 27 (1.7%) |
| $7,500 to $9,999 | 148 (9.0%) | 63 (3.8%) |
| $10,000 to $12,499 | 172 (10.5%) | 0 (0.0%) |
| $12,500 to $14,999 | 12 (0.7%) | 7 (0.4%) |
| $15,000 to $17,499 | 29 (1.8%) | 58 (3.5%) |
| $17,500 to $19,999 | 18 (1.1%) | 121 (7.4%) |
| $20,000 to $22,499 | 11 (0.7%) | 76 (4.6%) |
| $22,500 to $24,999 | 43 (2.6%) | 61 (3.7%) |
| $25,000 to $29,999 | 51 (3.1%) | 97 (5.9%) |
| $30,000 to $34,999 | 39 (2.4%) | 100 (6.1%) |
| $35,000 to $39,999 | 119 (7.3%) | 237 (14.5%) |
| $40,000 to $44,999 | 102 (6.2%) | 88 (5.4%) |
| $45,000 to $49,999 | 73 (4.5%) | 186 (11.4%) |
| $50,000 to $54,999 | 93 (5.7%) | 62 (3.8%) |
| $55,000 to $64,999 | 28 (1.7%) | 62 (3.8%) |
| $65,000 to $74,999 | 158 (9.7%) | 74 (4.5%) |
| $75,000 to $99,999 | 178 (10.9%) | 192 (11.7%) |
| $100,000+ | 215 (13.1%) | 74 (4.5%) |
| Total | 1,636 (100.0%) | 1,637 (100.0%) |
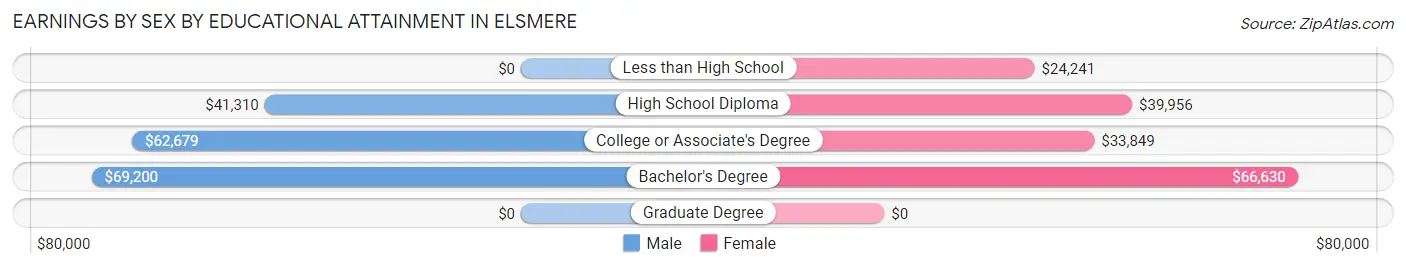
Earnings by Sex by Educational Attainment in Elsmere
Average earnings in Elsmere are $50,270 for men and $38,794 for women, a difference of 22.8%. Men with an educational attainment of bachelor's degree enjoy the highest average annual earnings of $69,200, while those with high school diploma education earn the least with $41,310. Women with an educational attainment of bachelor's degree earn the most with the average annual earnings of $66,630, while those with less than high school education have the smallest earnings of $24,241.
| Educational Attainment | Male Income | Female Income |
| Less than High School | - | - |
| High School Diploma | $41,310 | $39,956 |
| College or Associate's Degree | $62,679 | $33,849 |
| Bachelor's Degree | $69,200 | $66,630 |
| Graduate Degree | - | - |
| Total | $50,270 | $38,794 |
Family Income in Elsmere
Family Income Brackets in Elsmere
According to the Elsmere family income data, there are 361 families falling into the $100,000 to $149,999 income range, which is the most common income bracket and makes up 26.7% of all families. Conversely, the $10,000 to $14,999 income bracket is the least frequent group with only 5 families (0.4%) belonging to this category.
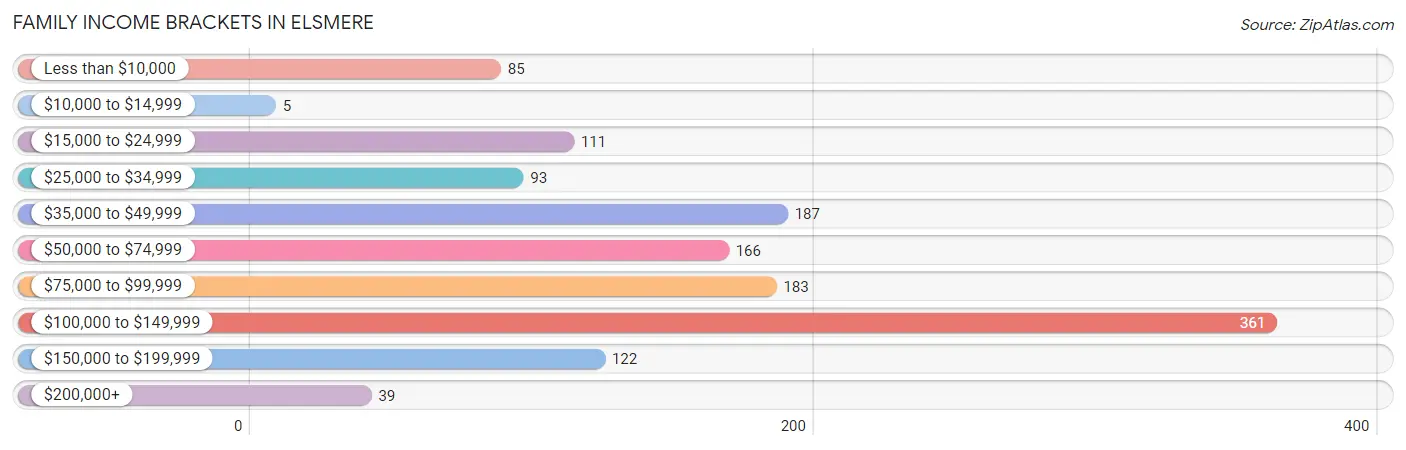
| Income Bracket | # Families | % Families |
| Less than $10,000 | 85 | 6.3% |
| $10,000 to $14,999 | 5 | 0.4% |
| $15,000 to $24,999 | 111 | 8.2% |
| $25,000 to $34,999 | 93 | 6.9% |
| $35,000 to $49,999 | 187 | 13.8% |
| $50,000 to $74,999 | 166 | 12.3% |
| $75,000 to $99,999 | 183 | 13.5% |
| $100,000 to $149,999 | 361 | 26.7% |
| $150,000 to $199,999 | 122 | 9.0% |
| $200,000+ | 39 | 2.9% |
Family Income by Famaliy Size in Elsmere
4-person families (269 | 19.9%) account for the highest median family income in Elsmere with $108,438 per family, while 2-person families (513 | 37.9%) have the highest median income of $39,718 per family member.
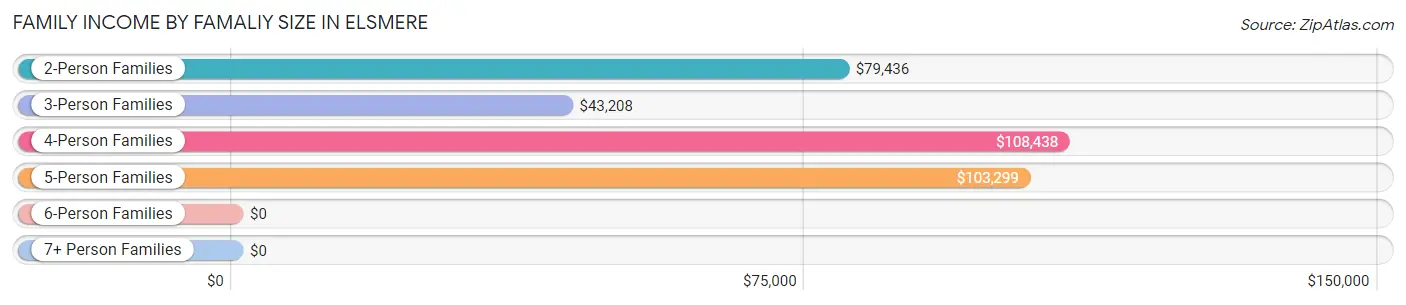
| Income Bracket | # Families | Median Income |
| 2-Person Families | 513 (37.9%) | $79,436 |
| 3-Person Families | 389 (28.7%) | $43,208 |
| 4-Person Families | 269 (19.9%) | $108,438 |
| 5-Person Families | 170 (12.6%) | $103,299 |
| 6-Person Families | 12 (0.9%) | $0 |
| 7+ Person Families | 0 (0.0%) | $0 |
| Total | 1,353 (100.0%) | $78,505 |
Family Income by Number of Earners in Elsmere
The median family income in Elsmere is $78,505, with families comprising 2 earners (513) having the highest median family income of $108,750, while families with no earners (134) have the lowest median family income of $42,083, accounting for 37.9% and 9.9% of families, respectively.
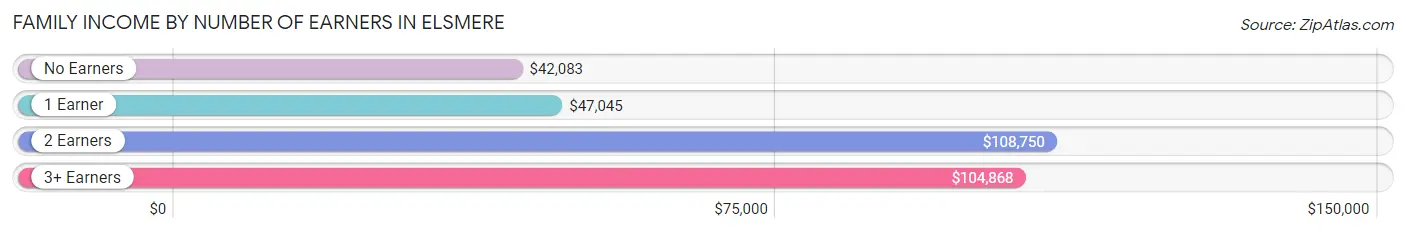
| Number of Earners | # Families | Median Income |
| No Earners | 134 (9.9%) | $42,083 |
| 1 Earner | 526 (38.9%) | $47,045 |
| 2 Earners | 513 (37.9%) | $108,750 |
| 3+ Earners | 180 (13.3%) | $104,868 |
| Total | 1,353 (100.0%) | $78,505 |
Household Income in Elsmere
Household Income Brackets in Elsmere
With 452 households falling in the category, the $100,000 to $149,999 income range is the most frequent in Elsmere, accounting for 19.8% of all households. In contrast, only 96 households (4.2%) fall into the $150,000 to $199,999 income bracket, making it the least populous group.
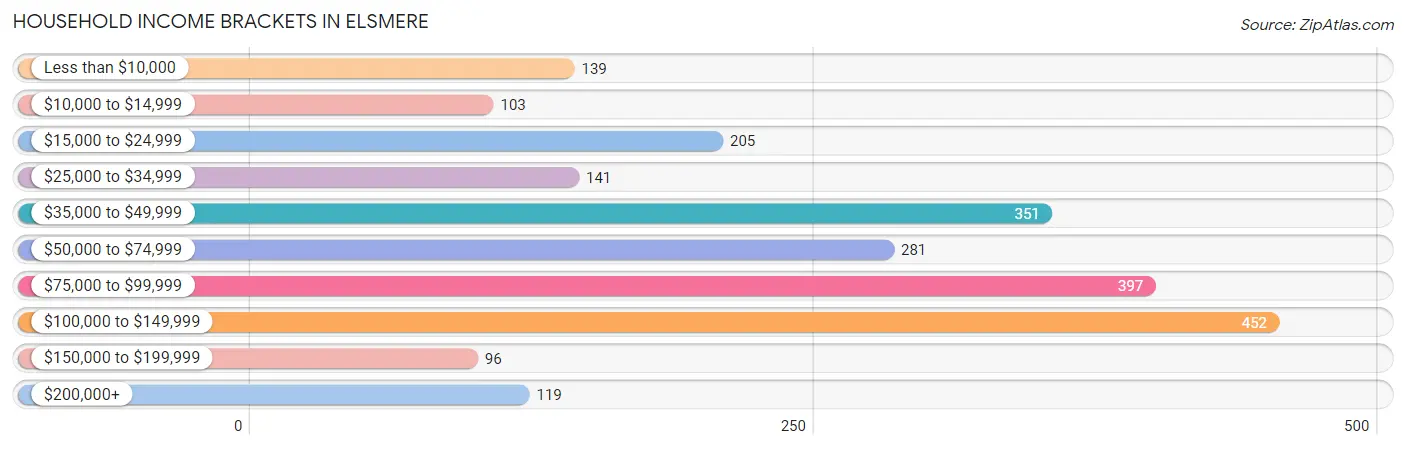
| Income Bracket | # Households | % Households |
| Less than $10,000 | 139 | 6.1% |
| $10,000 to $14,999 | 103 | 4.5% |
| $15,000 to $24,999 | 205 | 9.0% |
| $25,000 to $34,999 | 141 | 6.2% |
| $35,000 to $49,999 | 351 | 15.4% |
| $50,000 to $74,999 | 281 | 12.3% |
| $75,000 to $99,999 | 397 | 17.4% |
| $100,000 to $149,999 | 452 | 19.8% |
| $150,000 to $199,999 | 96 | 4.2% |
| $200,000+ | 119 | 5.2% |
Household Income by Householder Age in Elsmere
The median household income in Elsmere is $70,773, with the highest median household income of $83,817 found in the 25 to 44 years age bracket for the primary householder. A total of 921 households (40.4%) fall into this category. Meanwhile, the 15 to 24 years age bracket for the primary householder has the lowest median household income of $0, with 76 households (3.3%) in this group.
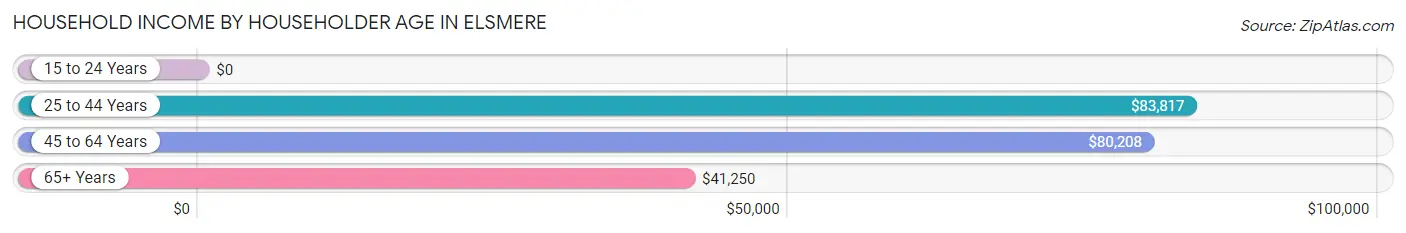
| Income Bracket | # Households | Median Income |
| 15 to 24 Years | 76 (3.3%) | $0 |
| 25 to 44 Years | 921 (40.4%) | $83,817 |
| 45 to 64 Years | 755 (33.1%) | $80,208 |
| 65+ Years | 530 (23.2%) | $41,250 |
| Total | 2,282 (100.0%) | $70,773 |
Poverty in Elsmere
Income Below Poverty by Sex and Age in Elsmere
With 16.2% poverty level for males and 24.4% for females among the residents of Elsmere, 6 to 11 year old males and 5 year old females are the most vulnerable to poverty, with 69 males (31.9%) and 62 females (86.1%) in their respective age groups living below the poverty level.
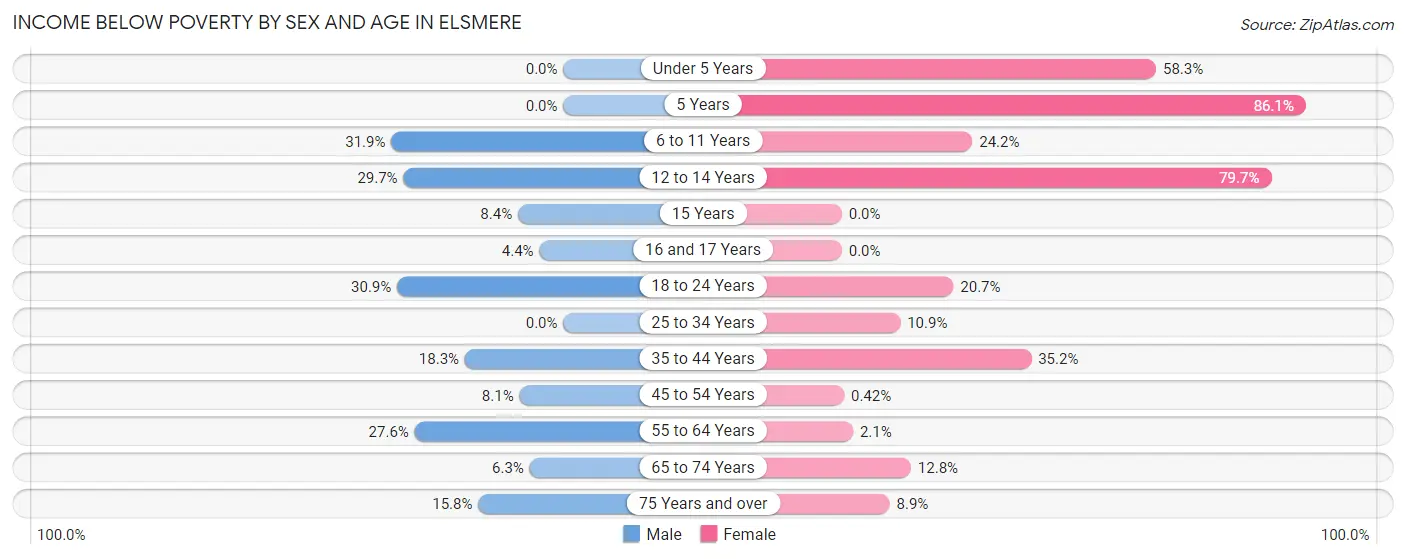
| Age Bracket | Male | Female |
| Under 5 Years | 0 (0.0%) | 133 (58.3%) |
| 5 Years | 0 (0.0%) | 62 (86.1%) |
| 6 to 11 Years | 69 (31.9%) | 94 (24.2%) |
| 12 to 14 Years | 65 (29.7%) | 106 (79.7%) |
| 15 Years | 8 (8.4%) | 0 (0.0%) |
| 16 and 17 Years | 14 (4.4%) | 0 (0.0%) |
| 18 to 24 Years | 125 (30.9%) | 29 (20.7%) |
| 25 to 34 Years | 0 (0.0%) | 51 (10.8%) |
| 35 to 44 Years | 76 (18.3%) | 237 (35.2%) |
| 45 to 54 Years | 24 (8.1%) | 1 (0.4%) |
| 55 to 64 Years | 77 (27.6%) | 7 (2.1%) |
| 65 to 74 Years | 11 (6.2%) | 39 (12.8%) |
| 75 Years and over | 21 (15.8%) | 11 (8.9%) |
| Total | 490 (16.2%) | 770 (24.4%) |
Income Above Poverty by Sex and Age in Elsmere
According to the poverty statistics in Elsmere, males aged under 5 years and females aged 16 and 17 years are the age groups that are most secure financially, with 100.0% of males and 100.0% of females in these age groups living above the poverty line.
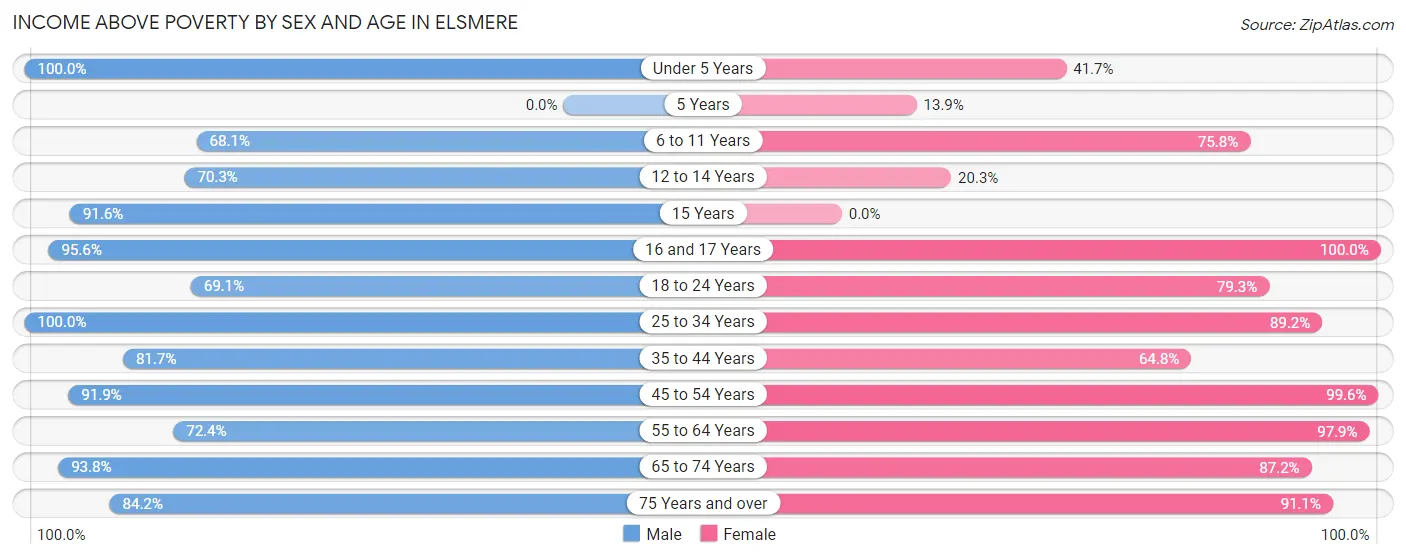
| Age Bracket | Male | Female |
| Under 5 Years | 35 (100.0%) | 95 (41.7%) |
| 5 Years | 0 (0.0%) | 10 (13.9%) |
| 6 to 11 Years | 147 (68.1%) | 294 (75.8%) |
| 12 to 14 Years | 154 (70.3%) | 27 (20.3%) |
| 15 Years | 87 (91.6%) | 0 (0.0%) |
| 16 and 17 Years | 301 (95.6%) | 53 (100.0%) |
| 18 to 24 Years | 280 (69.1%) | 111 (79.3%) |
| 25 to 34 Years | 438 (100.0%) | 419 (89.1%) |
| 35 to 44 Years | 340 (81.7%) | 437 (64.8%) |
| 45 to 54 Years | 271 (91.9%) | 236 (99.6%) |
| 55 to 64 Years | 202 (72.4%) | 329 (97.9%) |
| 65 to 74 Years | 165 (93.8%) | 265 (87.2%) |
| 75 Years and over | 112 (84.2%) | 113 (91.1%) |
| Total | 2,532 (83.8%) | 2,389 (75.6%) |
Income Below Poverty Among Married-Couple Families in Elsmere
The poverty statistics for married-couple families in Elsmere show that 5.3% or 34 of the total 647 families live below the poverty line. Families with 1 or 2 children have the highest poverty rate of 9.9%, comprising of 28 families. On the other hand, families with 3 or 4 children have the lowest poverty rate of 0.0%, which includes 0 families.
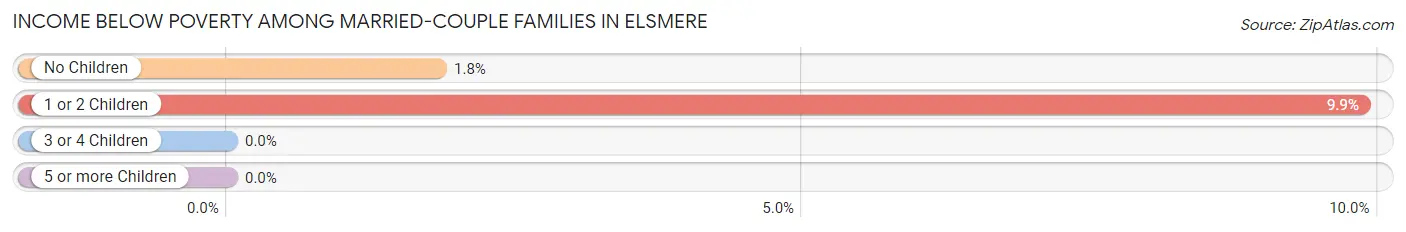
| Children | Above Poverty | Below Poverty |
| No Children | 323 (98.2%) | 6 (1.8%) |
| 1 or 2 Children | 256 (90.1%) | 28 (9.9%) |
| 3 or 4 Children | 34 (100.0%) | 0 (0.0%) |
| 5 or more Children | 0 (0.0%) | 0 (0.0%) |
| Total | 613 (94.7%) | 34 (5.3%) |
Income Below Poverty Among Single-Parent Households in Elsmere
According to the poverty data in Elsmere, 24.3% or 64 single-father households and 33.2% or 147 single-mother households are living below the poverty line. Among single-father households, those with 1 or 2 children have the highest poverty rate, with 64 households (41.6%) experiencing poverty. Likewise, among single-mother households, those with 1 or 2 children have the highest poverty rate, with 147 households (49.2%) falling below the poverty line.
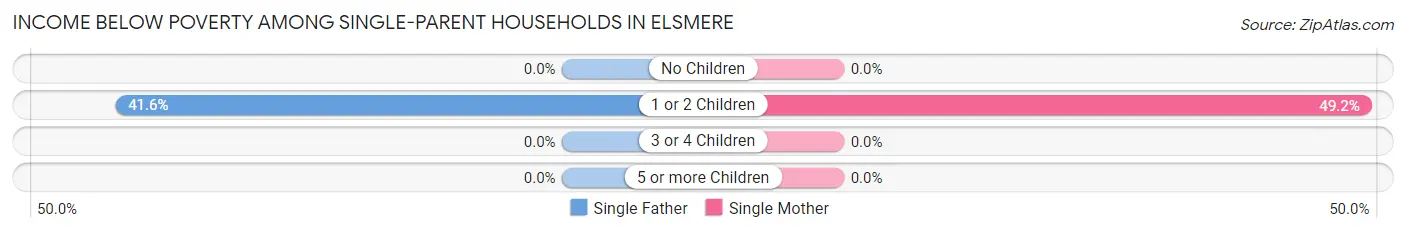
| Children | Single Father | Single Mother |
| No Children | 0 (0.0%) | 0 (0.0%) |
| 1 or 2 Children | 64 (41.6%) | 147 (49.2%) |
| 3 or 4 Children | 0 (0.0%) | 0 (0.0%) |
| 5 or more Children | 0 (0.0%) | 0 (0.0%) |
| Total | 64 (24.3%) | 147 (33.2%) |
Income Below Poverty Among Married-Couple vs Single-Parent Households in Elsmere
The poverty data for Elsmere shows that 34 of the married-couple family households (5.3%) and 211 of the single-parent households (29.9%) are living below the poverty level. Within the married-couple family households, those with 1 or 2 children have the highest poverty rate, with 28 households (9.9%) falling below the poverty line. Among the single-parent households, those with 1 or 2 children have the highest poverty rate, with 211 household (46.6%) living below poverty.
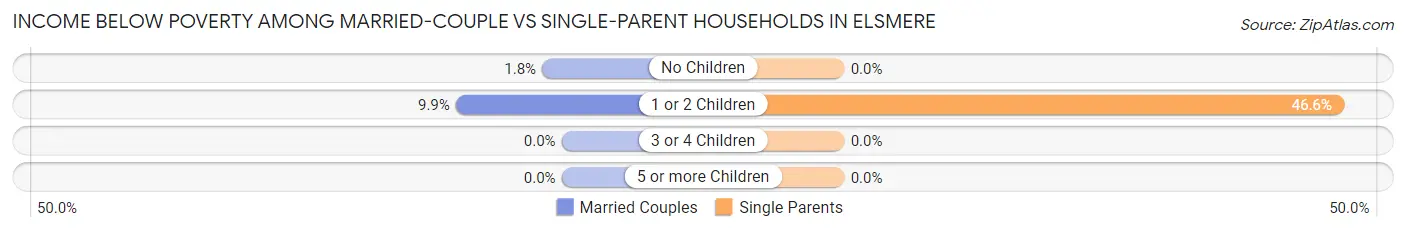
| Children | Married-Couple Families | Single-Parent Households |
| No Children | 6 (1.8%) | 0 (0.0%) |
| 1 or 2 Children | 28 (9.9%) | 211 (46.6%) |
| 3 or 4 Children | 0 (0.0%) | 0 (0.0%) |
| 5 or more Children | 0 (0.0%) | 0 (0.0%) |
| Total | 34 (5.3%) | 211 (29.9%) |
Race in Elsmere
The most populous races in Elsmere are White / Caucasian (3,979 | 64.2%), Hispanic or Latino (1,994 | 32.2%), and Black / African American (920 | 14.8%).
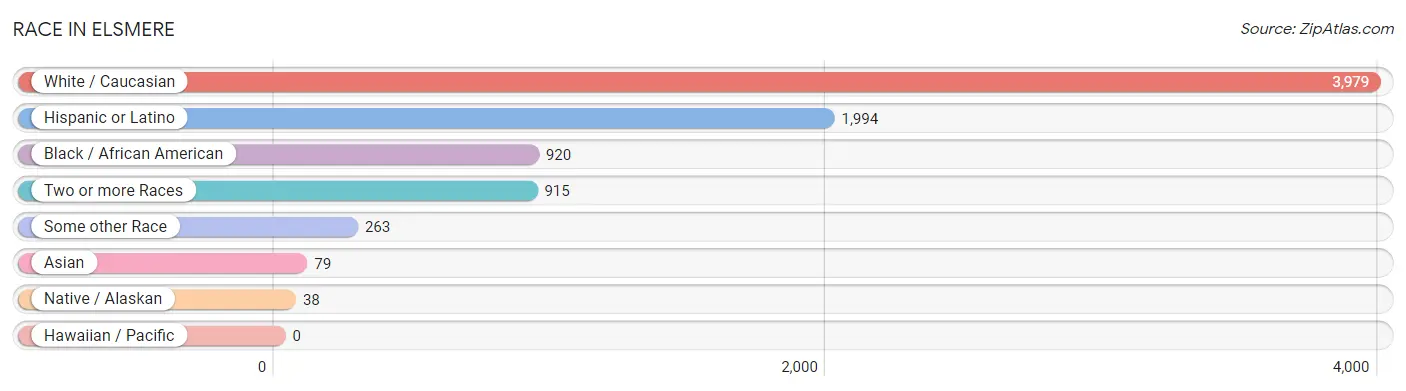
| Race | # Population | % Population |
| Asian | 79 | 1.3% |
| Black / African American | 920 | 14.8% |
| Hawaiian / Pacific | 0 | 0.0% |
| Hispanic or Latino | 1,994 | 32.2% |
| Native / Alaskan | 38 | 0.6% |
| White / Caucasian | 3,979 | 64.2% |
| Two or more Races | 915 | 14.8% |
| Some other Race | 263 | 4.3% |
| Total | 6,194 | 100.0% |
Ancestry in Elsmere
The most populous ancestries reported in Elsmere are Mexican (1,111 | 17.9%), Irish (1,069 | 17.3%), German (560 | 9.0%), Italian (556 | 9.0%), and English (443 | 7.1%), together accounting for 60.4% of all Elsmere residents.
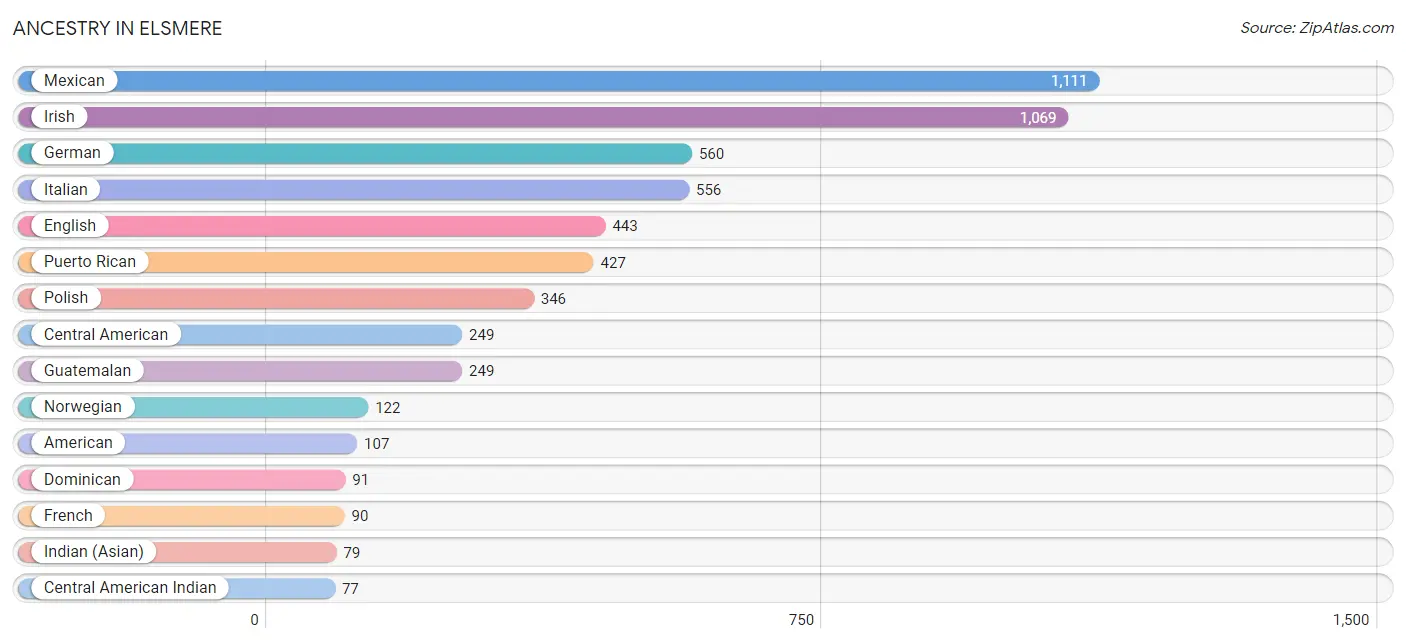
| Ancestry | # Population | % Population |
| African | 50 | 0.8% |
| American | 107 | 1.7% |
| British | 5 | 0.1% |
| British West Indian | 12 | 0.2% |
| Canadian | 24 | 0.4% |
| Celtic | 11 | 0.2% |
| Central American | 249 | 4.0% |
| Central American Indian | 77 | 1.2% |
| Croatian | 8 | 0.1% |
| Danish | 11 | 0.2% |
| Dominican | 91 | 1.5% |
| Dutch | 17 | 0.3% |
| Eastern European | 11 | 0.2% |
| English | 443 | 7.1% |
| European | 74 | 1.2% |
| French | 90 | 1.5% |
| German | 560 | 9.0% |
| Guatemalan | 249 | 4.0% |
| Indian (Asian) | 79 | 1.3% |
| Irish | 1,069 | 17.3% |
| Italian | 556 | 9.0% |
| Jamaican | 43 | 0.7% |
| Mexican | 1,111 | 17.9% |
| Norwegian | 122 | 2.0% |
| Pakistani | 25 | 0.4% |
| Polish | 346 | 5.6% |
| Puerto Rican | 427 | 6.9% |
| Russian | 24 | 0.4% |
| Scotch-Irish | 69 | 1.1% |
| Scottish | 26 | 0.4% |
| Spaniard | 41 | 0.7% |
| Spanish | 42 | 0.7% |
| Subsaharan African | 50 | 0.8% |
| Swedish | 12 | 0.2% |
| Swiss | 1 | 0.0% |
| Thai | 10 | 0.2% |
| Trinidadian and Tobagonian | 51 | 0.8% |
| Ukrainian | 16 | 0.3% |
| Welsh | 46 | 0.7% | View All 39 Rows |
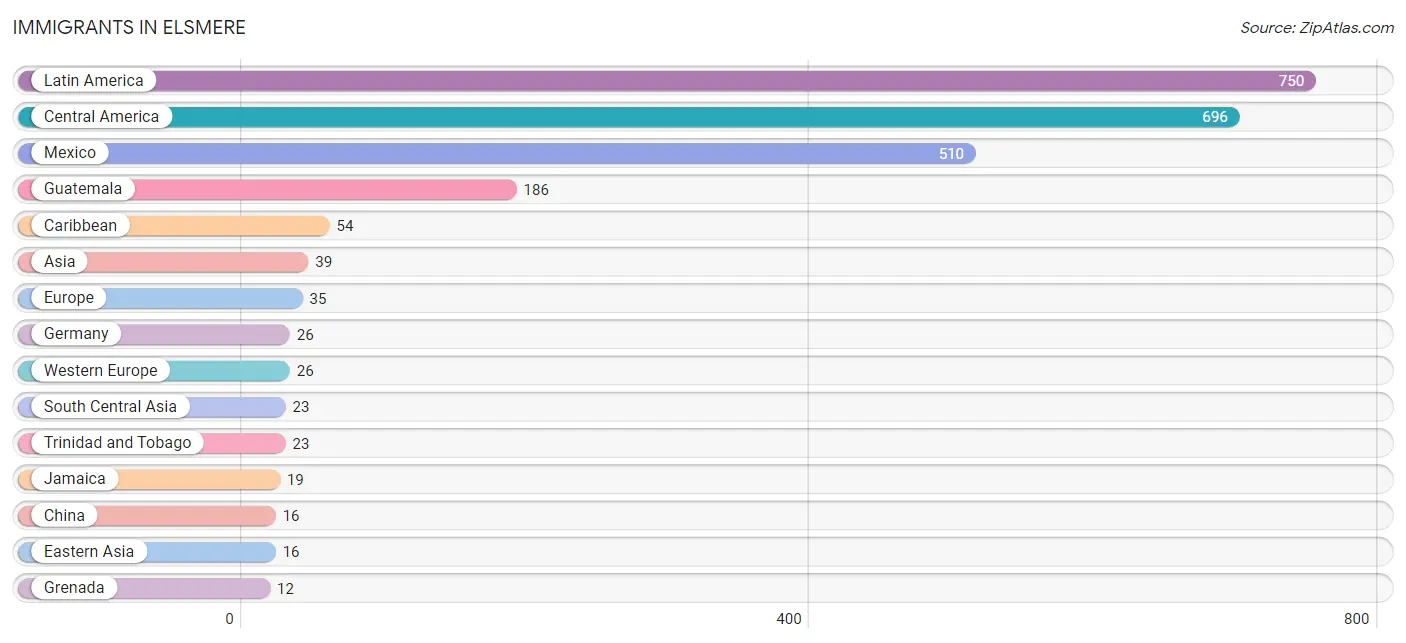
Immigrants in Elsmere
The most numerous immigrant groups reported in Elsmere came from Latin America (750 | 12.1%), Central America (696 | 11.2%), Mexico (510 | 8.2%), Guatemala (186 | 3.0%), and Caribbean (54 | 0.9%), together accounting for 35.4% of all Elsmere residents.
| Immigration Origin | # Population | % Population |
| Asia | 39 | 0.6% |
| Bangladesh | 11 | 0.2% |
| Caribbean | 54 | 0.9% |
| Central America | 696 | 11.2% |
| China | 16 | 0.3% |
| Eastern Asia | 16 | 0.3% |
| Eastern Europe | 1 | 0.0% |
| Europe | 35 | 0.6% |
| Germany | 26 | 0.4% |
| Grenada | 12 | 0.2% |
| Guatemala | 186 | 3.0% |
| India | 12 | 0.2% |
| Italy | 8 | 0.1% |
| Jamaica | 19 | 0.3% |
| Latin America | 750 | 12.1% |
| Mexico | 510 | 8.2% |
| Poland | 1 | 0.0% |
| South Central Asia | 23 | 0.4% |
| Southern Europe | 8 | 0.1% |
| Trinidad and Tobago | 23 | 0.4% |
| Western Europe | 26 | 0.4% | View All 21 Rows |
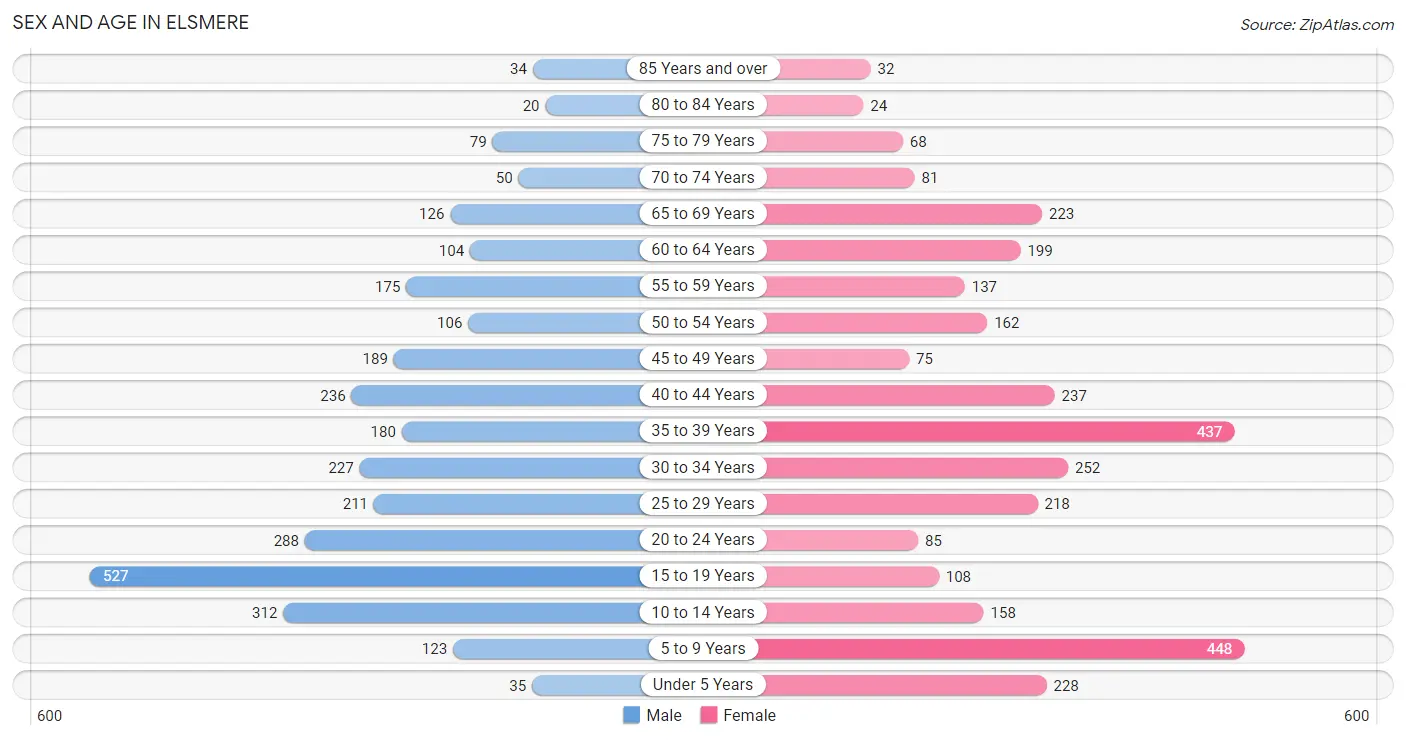
Sex and Age in Elsmere
Sex and Age in Elsmere
The most populous age groups in Elsmere are 15 to 19 Years (527 | 17.4%) for men and 5 to 9 Years (448 | 14.1%) for women.
| Age Bracket | Male | Female |
| Under 5 Years | 35 (1.2%) | 228 (7.2%) |
| 5 to 9 Years | 123 (4.1%) | 448 (14.1%) |
| 10 to 14 Years | 312 (10.3%) | 158 (5.0%) |
| 15 to 19 Years | 527 (17.4%) | 108 (3.4%) |
| 20 to 24 Years | 288 (9.5%) | 85 (2.7%) |
| 25 to 29 Years | 211 (7.0%) | 218 (6.9%) |
| 30 to 34 Years | 227 (7.5%) | 252 (7.9%) |
| 35 to 39 Years | 180 (6.0%) | 437 (13.8%) |
| 40 to 44 Years | 236 (7.8%) | 237 (7.5%) |
| 45 to 49 Years | 189 (6.2%) | 75 (2.4%) |
| 50 to 54 Years | 106 (3.5%) | 162 (5.1%) |
| 55 to 59 Years | 175 (5.8%) | 137 (4.3%) |
| 60 to 64 Years | 104 (3.4%) | 199 (6.3%) |
| 65 to 69 Years | 126 (4.2%) | 223 (7.0%) |
| 70 to 74 Years | 50 (1.7%) | 81 (2.5%) |
| 75 to 79 Years | 79 (2.6%) | 68 (2.1%) |
| 80 to 84 Years | 20 (0.7%) | 24 (0.8%) |
| 85 Years and over | 34 (1.1%) | 32 (1.0%) |
| Total | 3,022 (100.0%) | 3,172 (100.0%) |
Families and Households in Elsmere
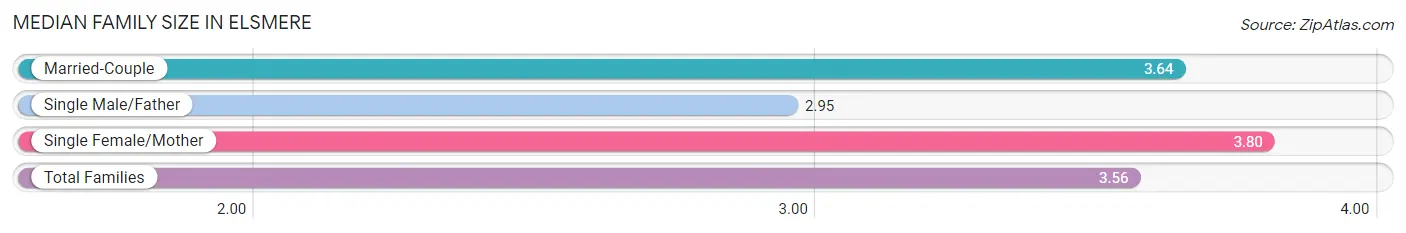
Median Family Size in Elsmere
The median family size in Elsmere is 3.56 persons per family, with single female/mother families (443 | 32.7%) accounting for the largest median family size of 3.8 persons per family. On the other hand, single male/father families (263 | 19.4%) represent the smallest median family size with 2.95 persons per family.
| Family Type | # Families | Family Size |
| Married-Couple | 647 (47.8%) | 3.64 |
| Single Male/Father | 263 (19.4%) | 2.95 |
| Single Female/Mother | 443 (32.7%) | 3.80 |
| Total Families | 1,353 (100.0%) | 3.56 |
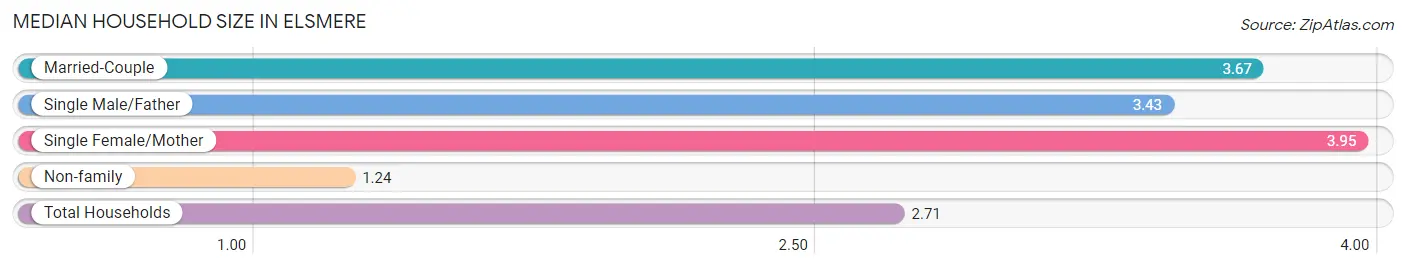
Median Household Size in Elsmere
The median household size in Elsmere is 2.71 persons per household, with single female/mother households (443 | 19.4%) accounting for the largest median household size of 3.95 persons per household. non-family households (929 | 40.7%) represent the smallest median household size with 1.24 persons per household.
| Household Type | # Households | Household Size |
| Married-Couple | 647 (28.3%) | 3.67 |
| Single Male/Father | 263 (11.5%) | 3.43 |
| Single Female/Mother | 443 (19.4%) | 3.95 |
| Non-family | 929 (40.7%) | 1.24 |
| Total Households | 2,282 (100.0%) | 2.71 |
Household Size by Marriage Status in Elsmere
Out of a total of 2,282 households in Elsmere, 1,353 (59.3%) are family households, while 929 (40.7%) are nonfamily households. The most numerous type of family households are 2-person households, comprising 445, and the most common type of nonfamily households are 1-person households, comprising 737.
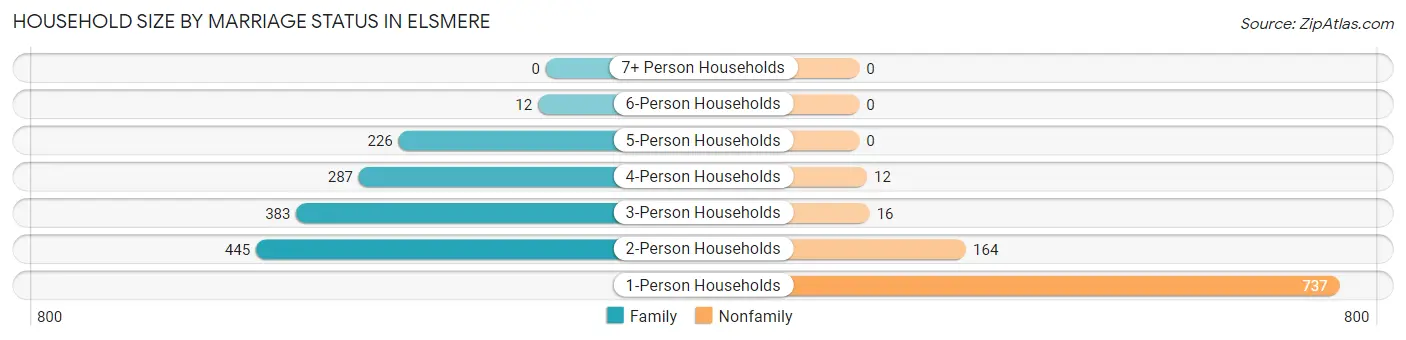
| Household Size | Family Households | Nonfamily Households |
| 1-Person Households | - | 737 (32.3%) |
| 2-Person Households | 445 (19.5%) | 164 (7.2%) |
| 3-Person Households | 383 (16.8%) | 16 (0.7%) |
| 4-Person Households | 287 (12.6%) | 12 (0.5%) |
| 5-Person Households | 226 (9.9%) | 0 (0.0%) |
| 6-Person Households | 12 (0.5%) | 0 (0.0%) |
| 7+ Person Households | 0 (0.0%) | 0 (0.0%) |
| Total | 1,353 (59.3%) | 929 (40.7%) |
Female Fertility in Elsmere
Fertility by Age in Elsmere
Average fertility rate in Elsmere is 80.0 births per 1,000 women. Women in the age bracket of 35 to 50 years have the highest fertility rate with 143.0 births per 1,000 women. Women in the age bracket of 35 to 50 years acount for 94.7% of all women with births.
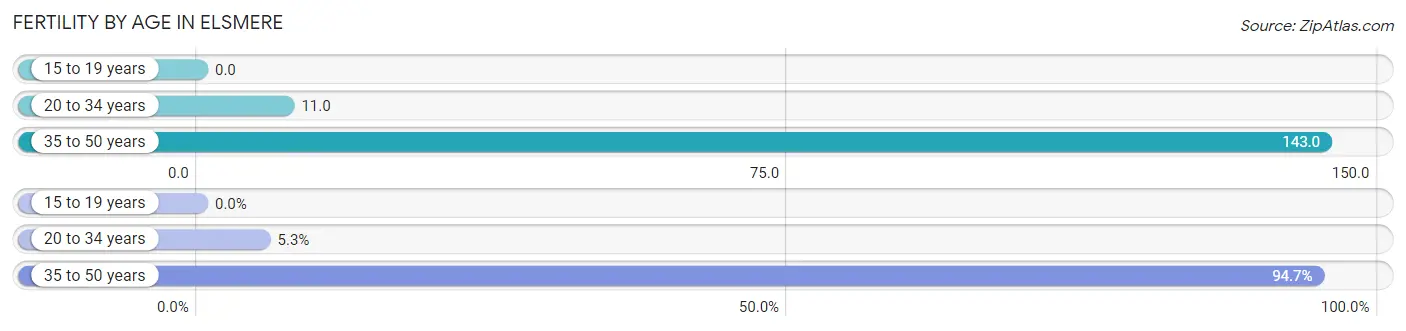
| Age Bracket | Women with Births | Births / 1,000 Women |
| 15 to 19 years | 0 (0.0%) | 0.0 |
| 20 to 34 years | 6 (5.3%) | 11.0 |
| 35 to 50 years | 107 (94.7%) | 143.0 |
| Total | 113 (100.0%) | 80.0 |
Fertility by Age by Marriage Status in Elsmere
60.2% of women with births (113) in Elsmere are married. The highest percentage of unmarried women with births falls into 35 to 50 years age bracket with 42.1% of them unmarried at the time of birth, while the lowest percentage of unmarried women with births belong to 20 to 34 years age bracket with 0.0% of them unmarried.
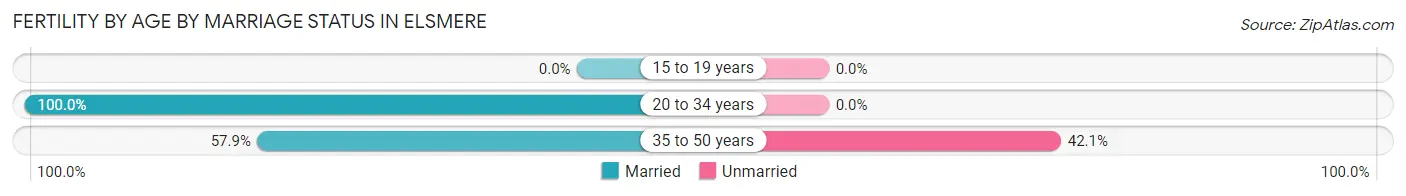
| Age Bracket | Married | Unmarried |
| 15 to 19 years | 0 (0.0%) | 0 (0.0%) |
| 20 to 34 years | 6 (100.0%) | 0 (0.0%) |
| 35 to 50 years | 62 (57.9%) | 45 (42.1%) |
| Total | 68 (60.2%) | 45 (39.8%) |
Fertility by Education in Elsmere
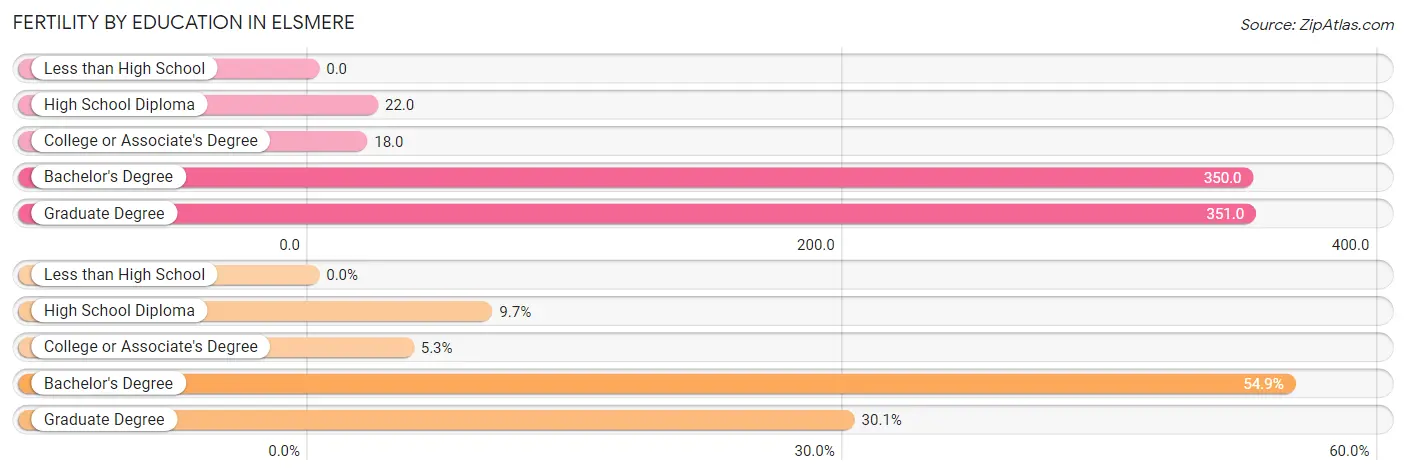
| Educational Attainment | Women with Births | Births / 1,000 Women |
| Less than High School | 0 (0.0%) | 0.0 |
| High School Diploma | 11 (9.7%) | 22.0 |
| College or Associate's Degree | 6 (5.3%) | 18.0 |
| Bachelor's Degree | 62 (54.9%) | 350.0 |
| Graduate Degree | 34 (30.1%) | 351.0 |
| Total | 113 (100.0%) | 80.0 |
Fertility by Education by Marriage Status in Elsmere
39.8% of women with births in Elsmere are unmarried. Women with the educational attainment of high school diploma are most likely to be married with 100.0% of them married at childbirth, while women with the educational attainment of graduate degree are least likely to be married with 100.0% of them unmarried at childbirth.
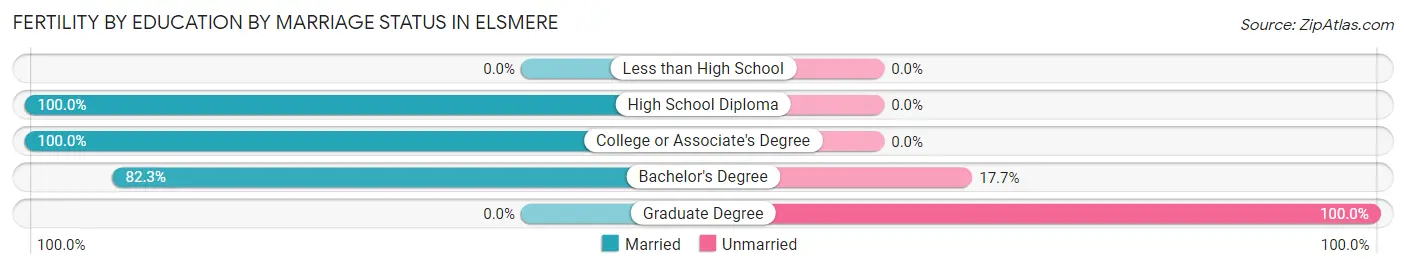
| Educational Attainment | Married | Unmarried |
| Less than High School | 0 (0.0%) | 0 (0.0%) |
| High School Diploma | 11 (100.0%) | 0 (0.0%) |
| College or Associate's Degree | 6 (100.0%) | 0 (0.0%) |
| Bachelor's Degree | 51 (82.3%) | 11 (17.7%) |
| Graduate Degree | 0 (0.0%) | 34 (100.0%) |
| Total | 68 (60.2%) | 45 (39.8%) |
Employment Characteristics in Elsmere
Employment by Class of Employer in Elsmere
Among the 3,062 employed individuals in Elsmere, private company employees (1,969 | 64.3%), not-for-profit organizations (373 | 12.2%), and state government employees (294 | 9.6%) make up the most common classes of employment.
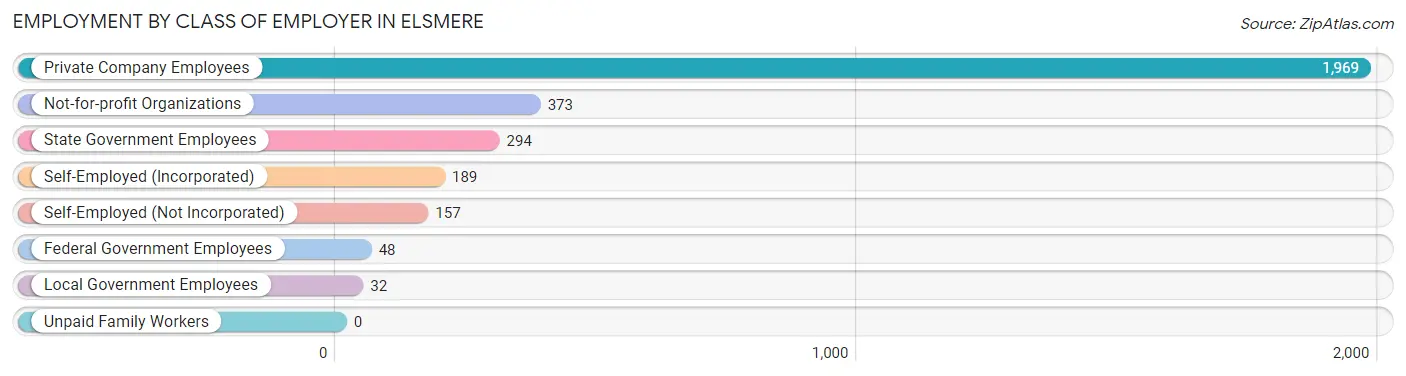
| Employer Class | # Employees | % Employees |
| Private Company Employees | 1,969 | 64.3% |
| Self-Employed (Incorporated) | 189 | 6.2% |
| Self-Employed (Not Incorporated) | 157 | 5.1% |
| Not-for-profit Organizations | 373 | 12.2% |
| Local Government Employees | 32 | 1.1% |
| State Government Employees | 294 | 9.6% |
| Federal Government Employees | 48 | 1.6% |
| Unpaid Family Workers | 0 | 0.0% |
| Total | 3,062 | 100.0% |
Employment Status by Age in Elsmere
According to the labor force statistics for Elsmere, out of the total population over 16 years of age (4,795), 67.9% or 3,256 individuals are in the labor force, with 5.2% or 169 of them unemployed. The age group with the highest labor force participation rate is 45 to 54 years, with 94.4% or 502 individuals in the labor force. Within the labor force, the 20 to 24 years age range has the highest percentage of unemployed individuals, with 36.3% or 87 of them being unemployed.
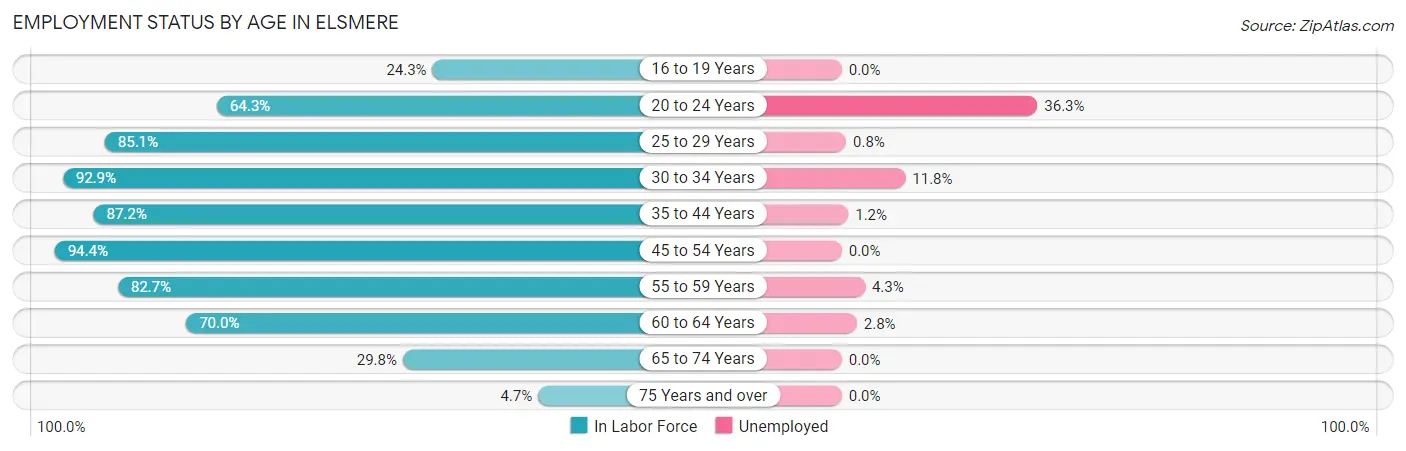
| Age Bracket | In Labor Force | Unemployed |
| 16 to 19 Years | 131 (24.3%) | 0 (0.0%) |
| 20 to 24 Years | 240 (64.3%) | 87 (36.3%) |
| 25 to 29 Years | 365 (85.1%) | 3 (0.8%) |
| 30 to 34 Years | 445 (92.9%) | 53 (11.8%) |
| 35 to 44 Years | 950 (87.2%) | 11 (1.2%) |
| 45 to 54 Years | 502 (94.4%) | 0 (0.0%) |
| 55 to 59 Years | 258 (82.7%) | 11 (4.3%) |
| 60 to 64 Years | 212 (70.0%) | 6 (2.8%) |
| 65 to 74 Years | 143 (29.8%) | 0 (0.0%) |
| 75 Years and over | 12 (4.7%) | 0 (0.0%) |
| Total | 3,256 (67.9%) | 169 (5.2%) |
Employment Status by Educational Attainment in Elsmere
According to labor force statistics for Elsmere, 86.9% of individuals (2,733) out of the total population between 25 and 64 years of age (3,145) are in the labor force, with 3.0% or 82 of them being unemployed. The group with the highest labor force participation rate are those with the educational attainment of bachelor's degree or higher, with 93.6% or 568 individuals in the labor force. Within the labor force, individuals with less than high school education have the highest percentage of unemployment, with 5.0% or 24 of them being unemployed.
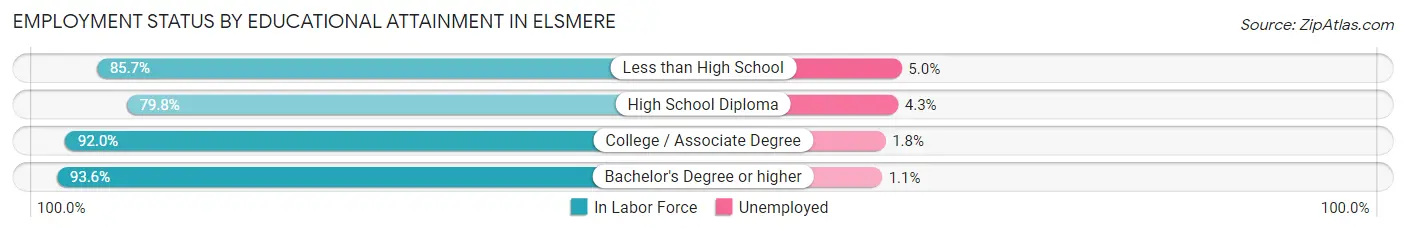
| Educational Attainment | In Labor Force | Unemployed |
| Less than High School | 478 (85.7%) | 28 (5.0%) |
| High School Diploma | 889 (79.8%) | 48 (4.3%) |
| College / Associate Degree | 797 (92.0%) | 16 (1.8%) |
| Bachelor's Degree or higher | 568 (93.6%) | 7 (1.1%) |
| Total | 2,733 (86.9%) | 94 (3.0%) |
Employment Occupations by Sex in Elsmere
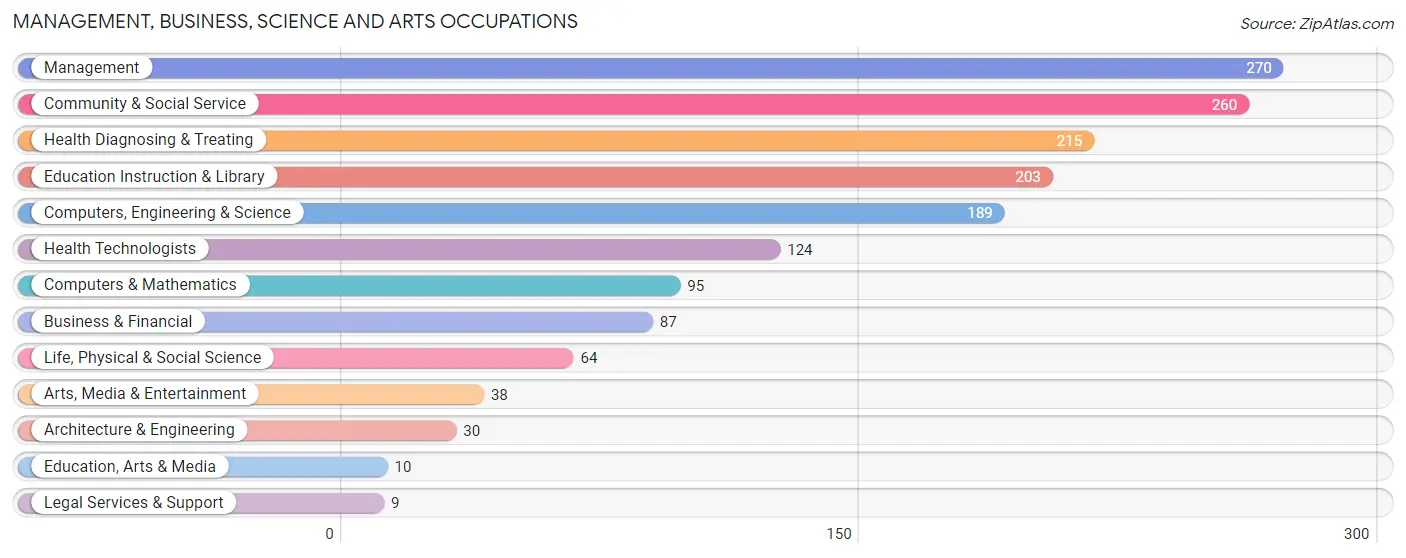
Management, Business, Science and Arts Occupations
The most common Management, Business, Science and Arts occupations in Elsmere are Management (270 | 8.8%), Community & Social Service (260 | 8.5%), Health Diagnosing & Treating (215 | 7.0%), Education Instruction & Library (203 | 6.6%), and Computers, Engineering & Science (189 | 6.1%).
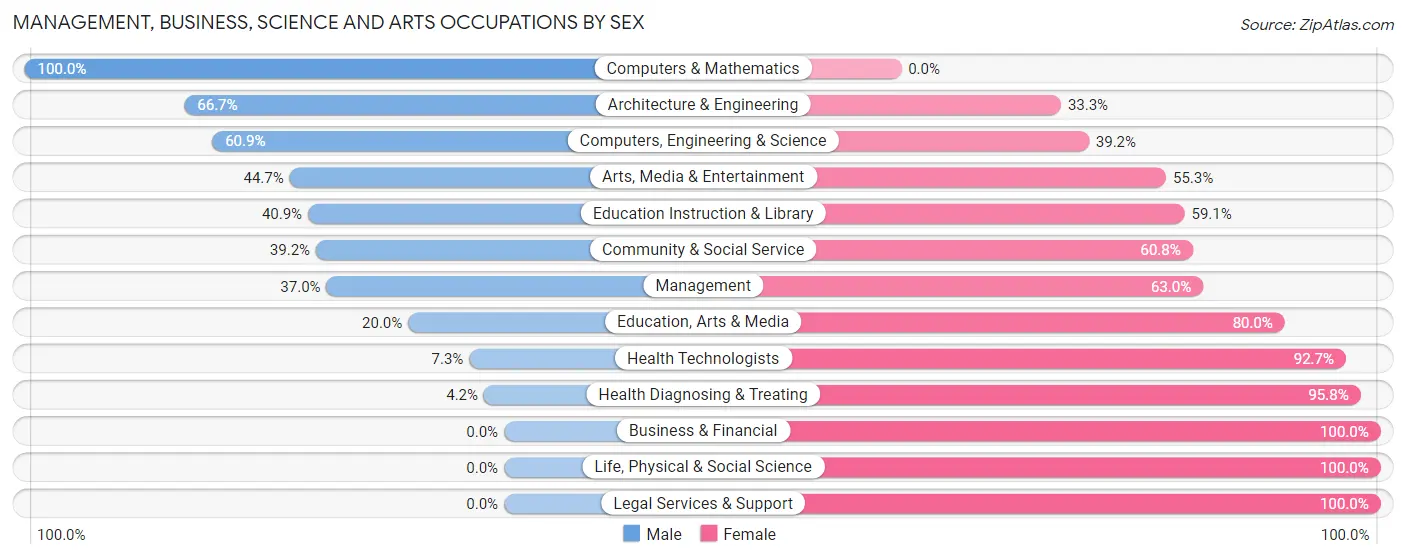
Management, Business, Science and Arts Occupations by Sex
Within the Management, Business, Science and Arts occupations in Elsmere, the most male-oriented occupations are Computers & Mathematics (100.0%), Architecture & Engineering (66.7%), and Computers, Engineering & Science (60.9%), while the most female-oriented occupations are Business & Financial (100.0%), Life, Physical & Social Science (100.0%), and Legal Services & Support (100.0%).
| Occupation | Male | Female |
| Management | 100 (37.0%) | 170 (63.0%) |
| Business & Financial | 0 (0.0%) | 87 (100.0%) |
| Computers, Engineering & Science | 115 (60.9%) | 74 (39.2%) |
| Computers & Mathematics | 95 (100.0%) | 0 (0.0%) |
| Architecture & Engineering | 20 (66.7%) | 10 (33.3%) |
| Life, Physical & Social Science | 0 (0.0%) | 64 (100.0%) |
| Community & Social Service | 102 (39.2%) | 158 (60.8%) |
| Education, Arts & Media | 2 (20.0%) | 8 (80.0%) |
| Legal Services & Support | 0 (0.0%) | 9 (100.0%) |
| Education Instruction & Library | 83 (40.9%) | 120 (59.1%) |
| Arts, Media & Entertainment | 17 (44.7%) | 21 (55.3%) |
| Health Diagnosing & Treating | 9 (4.2%) | 206 (95.8%) |
| Health Technologists | 9 (7.3%) | 115 (92.7%) |
| Total (Category) | 326 (31.9%) | 695 (68.1%) |
| Total (Overall) | 1,468 (47.7%) | 1,607 (52.3%) |
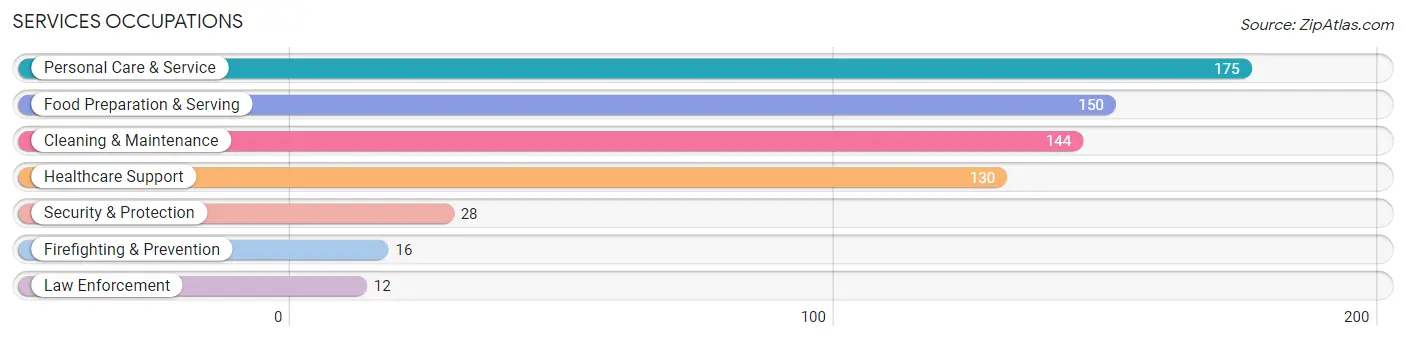
Services Occupations
The most common Services occupations in Elsmere are Personal Care & Service (175 | 5.7%), Food Preparation & Serving (150 | 4.9%), Cleaning & Maintenance (144 | 4.7%), Healthcare Support (130 | 4.2%), and Security & Protection (28 | 0.9%).
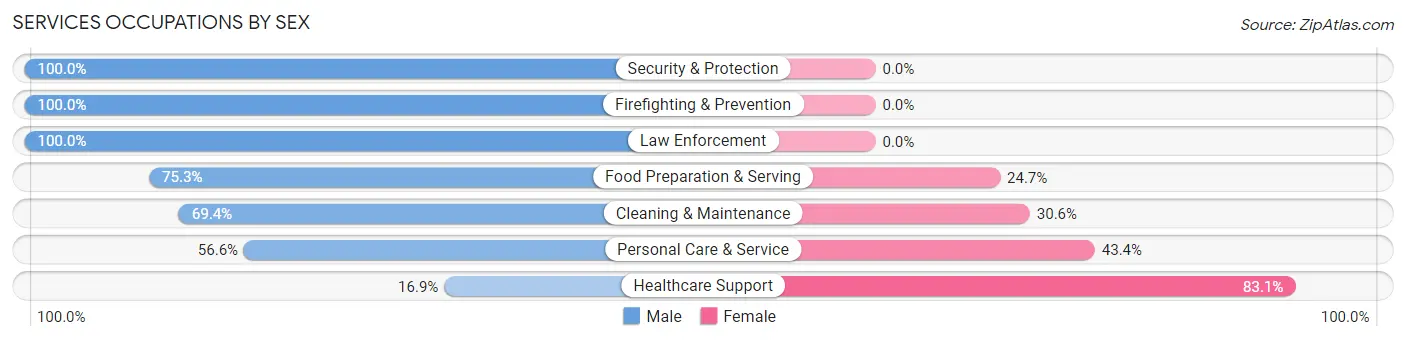
Services Occupations by Sex
Within the Services occupations in Elsmere, the most male-oriented occupations are Security & Protection (100.0%), Firefighting & Prevention (100.0%), and Law Enforcement (100.0%), while the most female-oriented occupations are Healthcare Support (83.1%), Personal Care & Service (43.4%), and Cleaning & Maintenance (30.6%).
| Occupation | Male | Female |
| Healthcare Support | 22 (16.9%) | 108 (83.1%) |
| Security & Protection | 28 (100.0%) | 0 (0.0%) |
| Firefighting & Prevention | 16 (100.0%) | 0 (0.0%) |
| Law Enforcement | 12 (100.0%) | 0 (0.0%) |
| Food Preparation & Serving | 113 (75.3%) | 37 (24.7%) |
| Cleaning & Maintenance | 100 (69.4%) | 44 (30.6%) |
| Personal Care & Service | 99 (56.6%) | 76 (43.4%) |
| Total (Category) | 362 (57.7%) | 265 (42.3%) |
| Total (Overall) | 1,468 (47.7%) | 1,607 (52.3%) |
Sales and Office Occupations
The most common Sales and Office occupations in Elsmere are Office & Administration (524 | 17.0%), and Sales & Related (263 | 8.6%).

Sales and Office Occupations by Sex
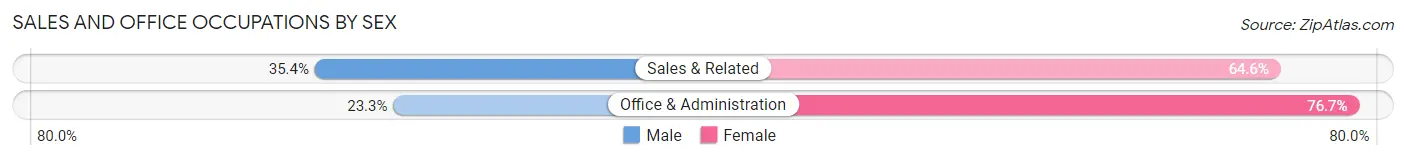
| Occupation | Male | Female |
| Sales & Related | 93 (35.4%) | 170 (64.6%) |
| Office & Administration | 122 (23.3%) | 402 (76.7%) |
| Total (Category) | 215 (27.3%) | 572 (72.7%) |
| Total (Overall) | 1,468 (47.7%) | 1,607 (52.3%) |
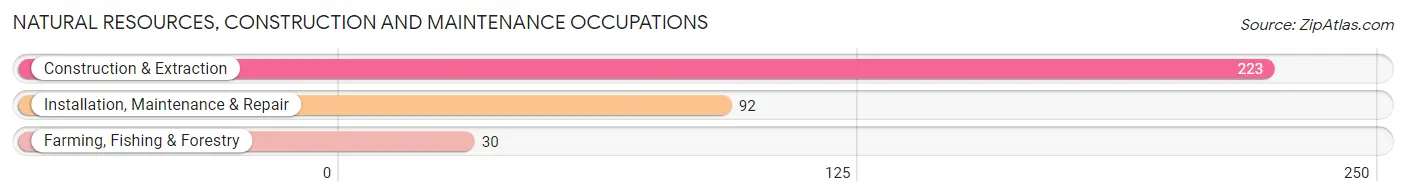
Natural Resources, Construction and Maintenance Occupations
The most common Natural Resources, Construction and Maintenance occupations in Elsmere are Construction & Extraction (223 | 7.2%), Installation, Maintenance & Repair (92 | 3.0%), and Farming, Fishing & Forestry (30 | 1.0%).
Natural Resources, Construction and Maintenance Occupations by Sex
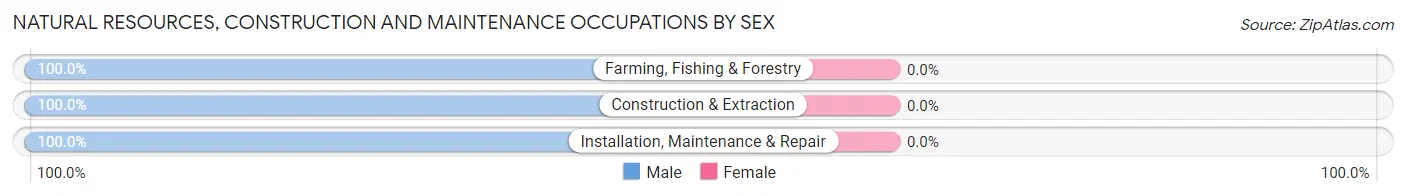
| Occupation | Male | Female |
| Farming, Fishing & Forestry | 30 (100.0%) | 0 (0.0%) |
| Construction & Extraction | 223 (100.0%) | 0 (0.0%) |
| Installation, Maintenance & Repair | 92 (100.0%) | 0 (0.0%) |
| Total (Category) | 345 (100.0%) | 0 (0.0%) |
| Total (Overall) | 1,468 (47.7%) | 1,607 (52.3%) |
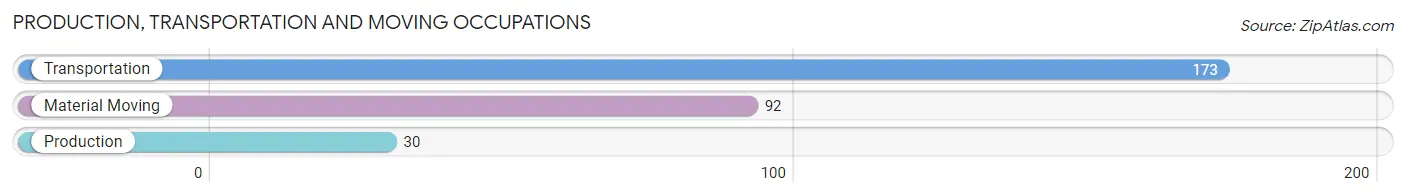
Production, Transportation and Moving Occupations
The most common Production, Transportation and Moving occupations in Elsmere are Transportation (173 | 5.6%), Material Moving (92 | 3.0%), and Production (30 | 1.0%).
Production, Transportation and Moving Occupations by Sex
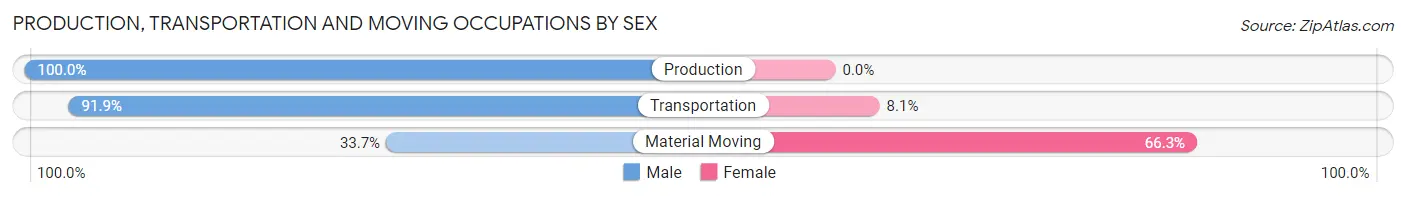
| Occupation | Male | Female |
| Production | 30 (100.0%) | 0 (0.0%) |
| Transportation | 159 (91.9%) | 14 (8.1%) |
| Material Moving | 31 (33.7%) | 61 (66.3%) |
| Total (Category) | 220 (74.6%) | 75 (25.4%) |
| Total (Overall) | 1,468 (47.7%) | 1,607 (52.3%) |
Employment Industries by Sex in Elsmere
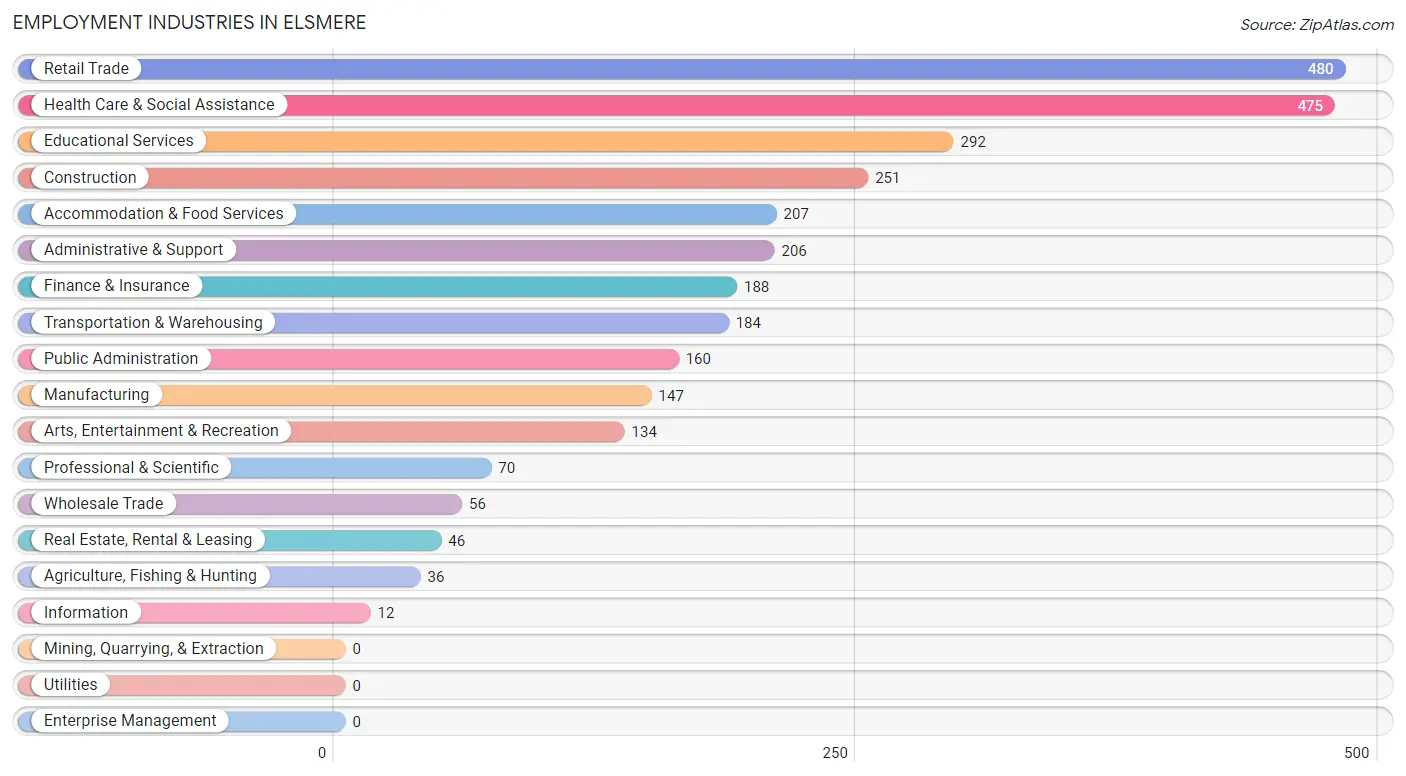
Employment Industries in Elsmere
The major employment industries in Elsmere include Retail Trade (480 | 15.6%), Health Care & Social Assistance (475 | 15.4%), Educational Services (292 | 9.5%), Construction (251 | 8.2%), and Accommodation & Food Services (207 | 6.7%).
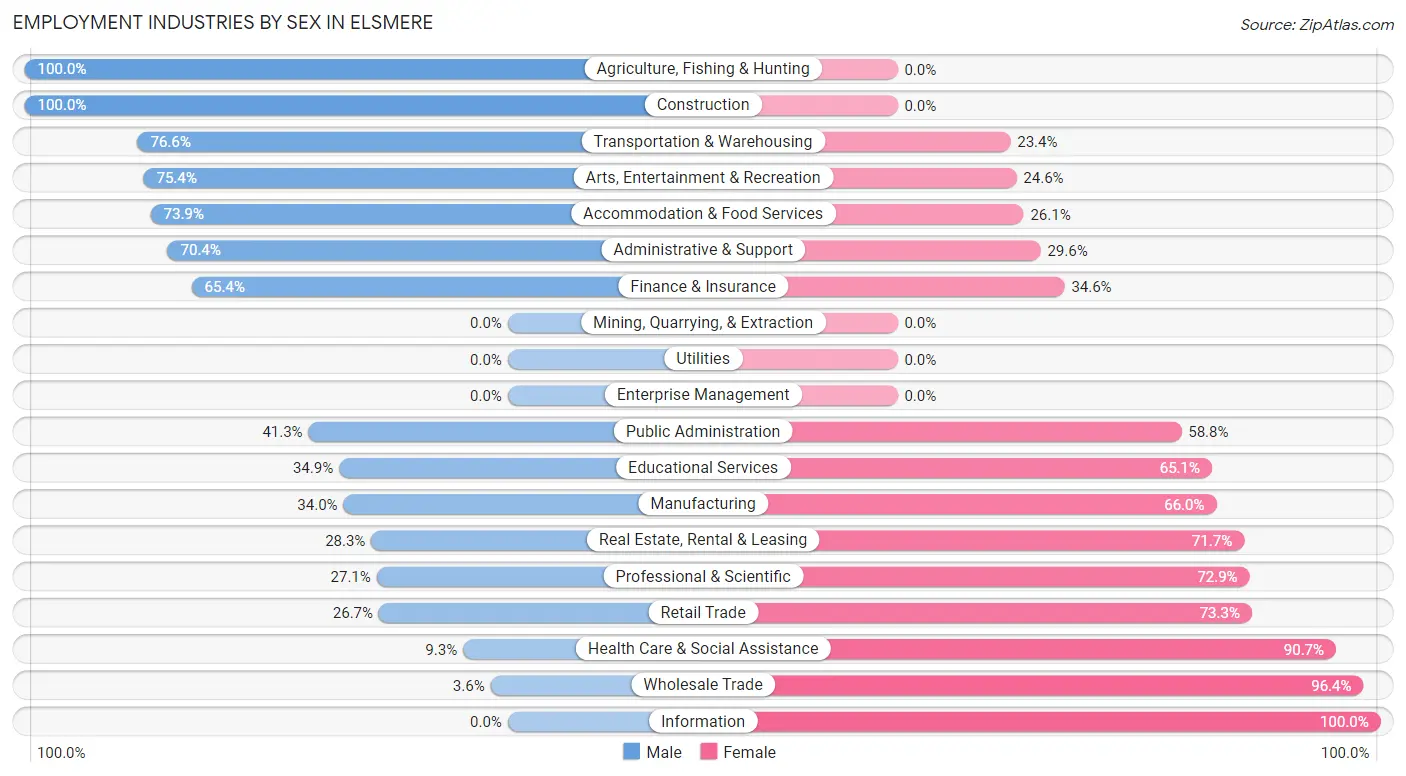
Employment Industries by Sex in Elsmere
The Elsmere industries that see more men than women are Agriculture, Fishing & Hunting (100.0%), Construction (100.0%), and Transportation & Warehousing (76.6%), whereas the industries that tend to have a higher number of women are Information (100.0%), Wholesale Trade (96.4%), and Health Care & Social Assistance (90.7%).
| Industry | Male | Female |
| Agriculture, Fishing & Hunting | 36 (100.0%) | 0 (0.0%) |
| Mining, Quarrying, & Extraction | 0 (0.0%) | 0 (0.0%) |
| Construction | 251 (100.0%) | 0 (0.0%) |
| Manufacturing | 50 (34.0%) | 97 (66.0%) |
| Wholesale Trade | 2 (3.6%) | 54 (96.4%) |
| Retail Trade | 128 (26.7%) | 352 (73.3%) |
| Transportation & Warehousing | 141 (76.6%) | 43 (23.4%) |
| Utilities | 0 (0.0%) | 0 (0.0%) |
| Information | 0 (0.0%) | 12 (100.0%) |
| Finance & Insurance | 123 (65.4%) | 65 (34.6%) |
| Real Estate, Rental & Leasing | 13 (28.3%) | 33 (71.7%) |
| Professional & Scientific | 19 (27.1%) | 51 (72.9%) |
| Enterprise Management | 0 (0.0%) | 0 (0.0%) |
| Administrative & Support | 145 (70.4%) | 61 (29.6%) |
| Educational Services | 102 (34.9%) | 190 (65.1%) |
| Health Care & Social Assistance | 44 (9.3%) | 431 (90.7%) |
| Arts, Entertainment & Recreation | 101 (75.4%) | 33 (24.6%) |
| Accommodation & Food Services | 153 (73.9%) | 54 (26.1%) |
| Public Administration | 66 (41.2%) | 94 (58.8%) |
| Total | 1,468 (47.7%) | 1,607 (52.3%) |
Education in Elsmere
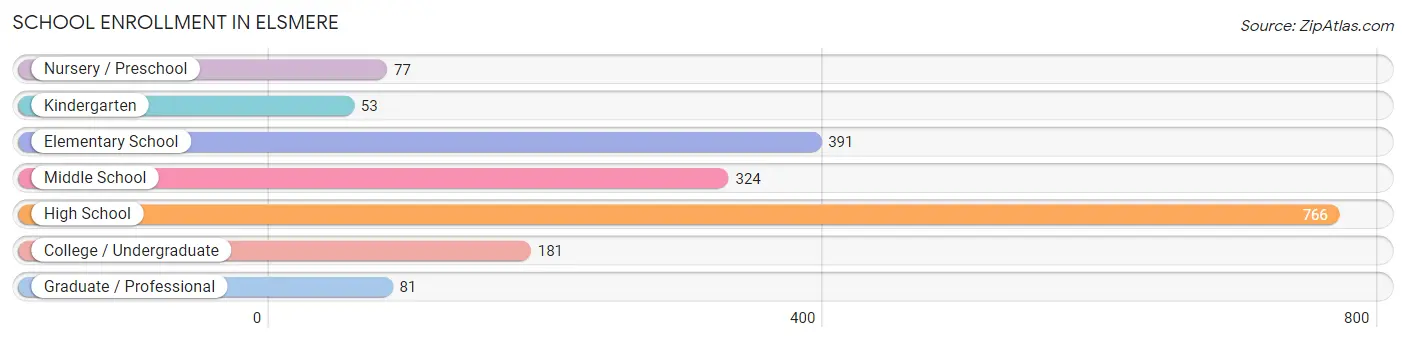
School Enrollment in Elsmere
The most common levels of schooling among the 1,873 students in Elsmere are high school (766 | 40.9%), elementary school (391 | 20.9%), and middle school (324 | 17.3%).
| School Level | # Students | % Students |
| Nursery / Preschool | 77 | 4.1% |
| Kindergarten | 53 | 2.8% |
| Elementary School | 391 | 20.9% |
| Middle School | 324 | 17.3% |
| High School | 766 | 40.9% |
| College / Undergraduate | 181 | 9.7% |
| Graduate / Professional | 81 | 4.3% |
| Total | 1,873 | 100.0% |
School Enrollment by Age by Funding Source in Elsmere
Out of a total of 1,873 students who are enrolled in schools in Elsmere, 170 (9.1%) attend a private institution, while the remaining 1,703 (90.9%) are enrolled in public schools. The age group of 3 to 4 year olds has the highest likelihood of being enrolled in private schools, with 15 (100.0% in the age bracket) enrolled. Conversely, the age group of 18 to 19 year olds has the lowest likelihood of being enrolled in a private school, with 131 (100.0% in the age bracket) attending a public institution.
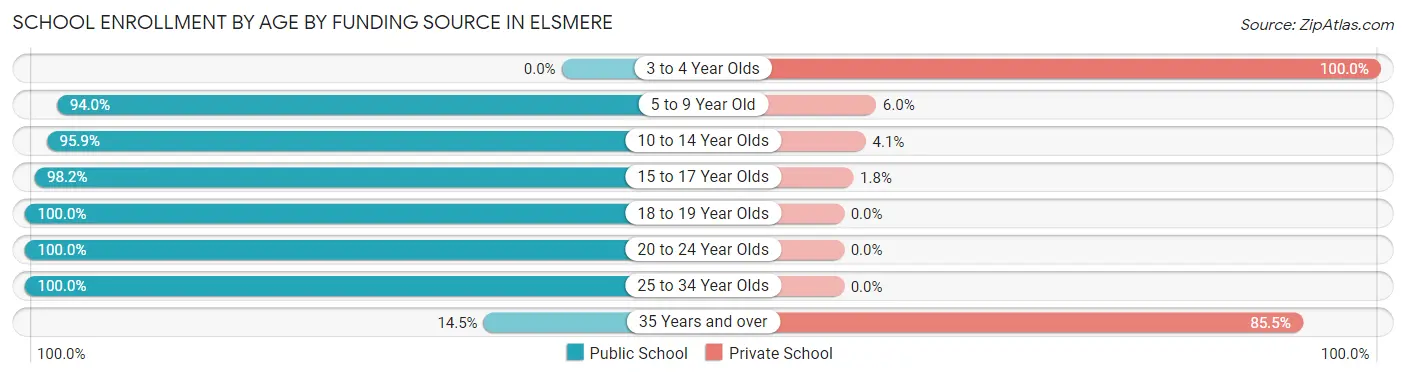
| Age Bracket | Public School | Private School |
| 3 to 4 Year Olds | 0 (0.0%) | 15 (100.0%) |
| 5 to 9 Year Old | 454 (94.0%) | 29 (6.0%) |
| 10 to 14 Year Olds | 422 (95.9%) | 18 (4.1%) |
| 15 to 17 Year Olds | 444 (98.2%) | 8 (1.8%) |
| 18 to 19 Year Olds | 131 (100.0%) | 0 (0.0%) |
| 20 to 24 Year Olds | 136 (100.0%) | 0 (0.0%) |
| 25 to 34 Year Olds | 99 (100.0%) | 0 (0.0%) |
| 35 Years and over | 17 (14.5%) | 100 (85.5%) |
| Total | 1,703 (90.9%) | 170 (9.1%) |
Educational Attainment by Field of Study in Elsmere
Science & technology (131 | 19.1%), literature & languages (96 | 14.0%), psychology (95 | 13.9%), arts & humanities (64 | 9.3%), and business (51 | 7.4%) are the most common fields of study among 685 individuals in Elsmere who have obtained a bachelor's degree or higher.
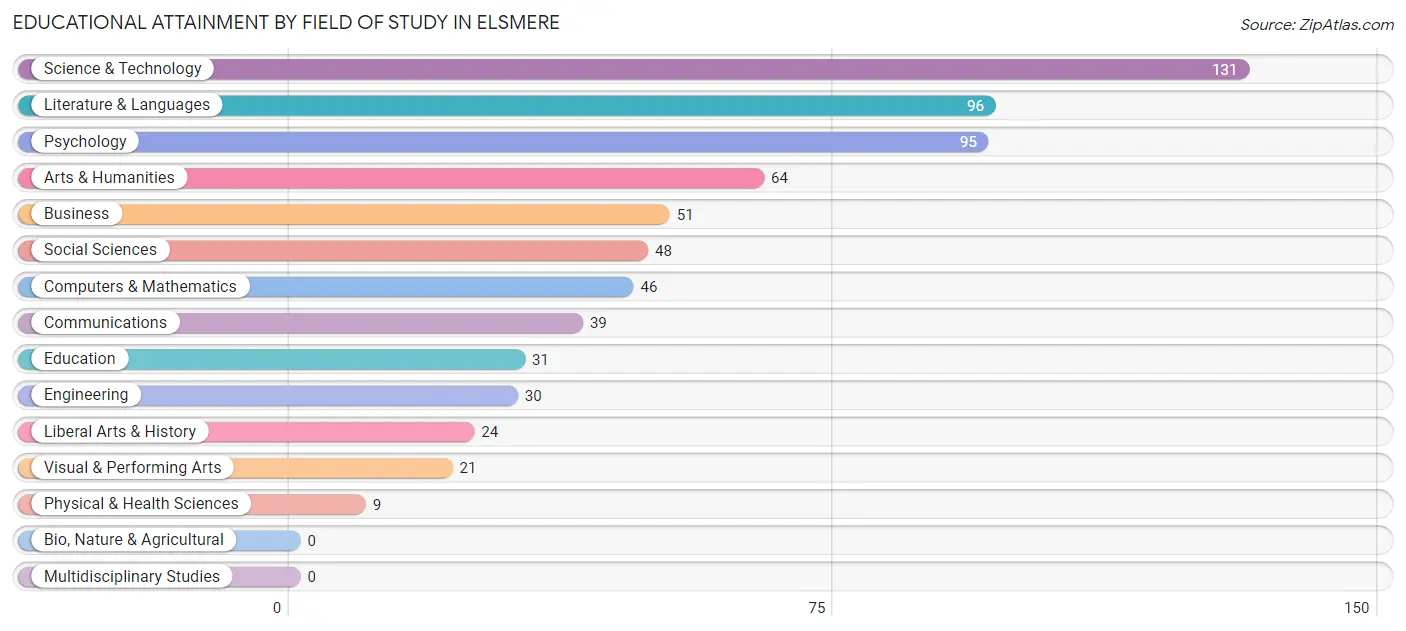
| Field of Study | # Graduates | % Graduates |
| Computers & Mathematics | 46 | 6.7% |
| Bio, Nature & Agricultural | 0 | 0.0% |
| Physical & Health Sciences | 9 | 1.3% |
| Psychology | 95 | 13.9% |
| Social Sciences | 48 | 7.0% |
| Engineering | 30 | 4.4% |
| Multidisciplinary Studies | 0 | 0.0% |
| Science & Technology | 131 | 19.1% |
| Business | 51 | 7.4% |
| Education | 31 | 4.5% |
| Literature & Languages | 96 | 14.0% |
| Liberal Arts & History | 24 | 3.5% |
| Visual & Performing Arts | 21 | 3.1% |
| Communications | 39 | 5.7% |
| Arts & Humanities | 64 | 9.3% |
| Total | 685 | 100.0% |
Transportation & Commute in Elsmere
Vehicle Availability by Sex in Elsmere
The most prevalent vehicle ownership categories in Elsmere are males with 2 vehicles (677, accounting for 46.6%) and females with 2 vehicles (643, making up 42.1%).
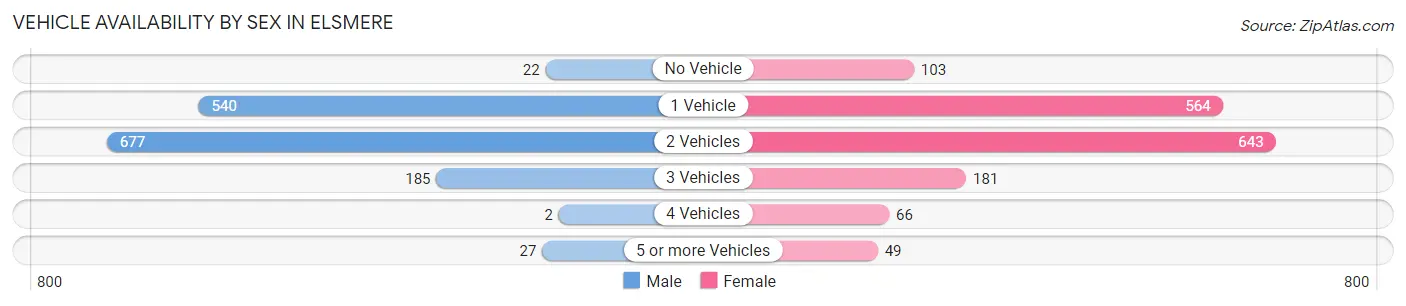
| Vehicles Available | Male | Female |
| No Vehicle | 22 (1.5%) | 103 (6.4%) |
| 1 Vehicle | 540 (37.2%) | 564 (35.1%) |
| 2 Vehicles | 677 (46.6%) | 643 (40.0%) |
| 3 Vehicles | 185 (12.7%) | 181 (11.3%) |
| 4 Vehicles | 2 (0.1%) | 66 (4.1%) |
| 5 or more Vehicles | 27 (1.9%) | 49 (3.0%) |
| Total | 1,453 (100.0%) | 1,606 (100.0%) |
Commute Time in Elsmere
The most frequently occuring commute durations in Elsmere are 15 to 19 minutes (717 commuters, 25.5%), 20 to 24 minutes (323 commuters, 11.5%), and 10 to 14 minutes (318 commuters, 11.3%).
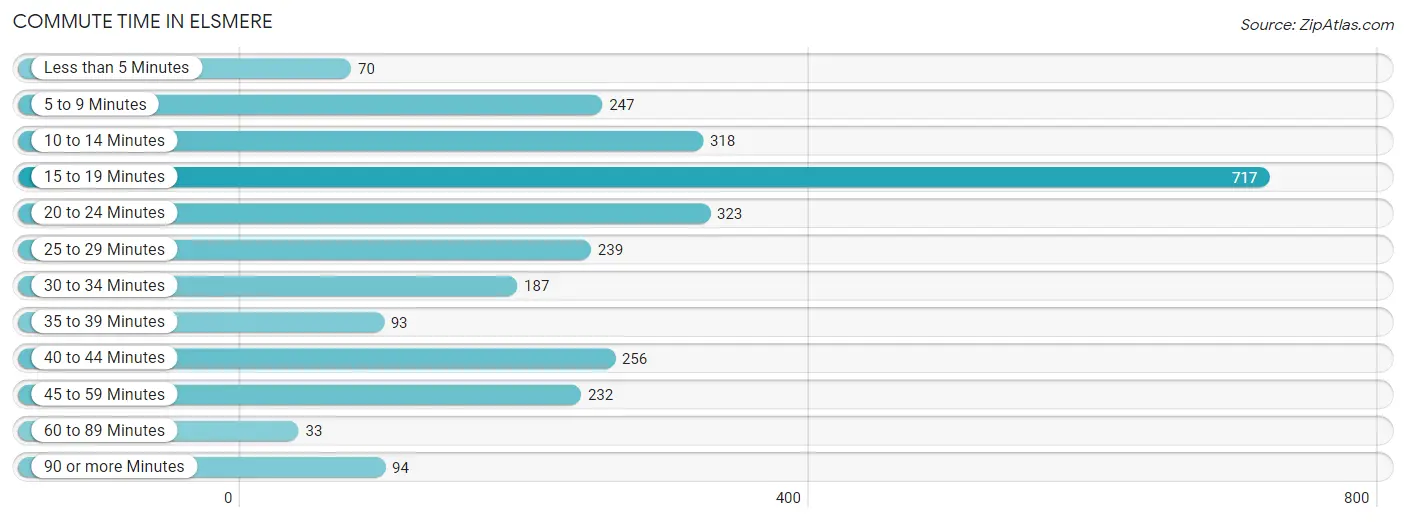
| Commute Time | # Commuters | % Commuters |
| Less than 5 Minutes | 70 | 2.5% |
| 5 to 9 Minutes | 247 | 8.8% |
| 10 to 14 Minutes | 318 | 11.3% |
| 15 to 19 Minutes | 717 | 25.5% |
| 20 to 24 Minutes | 323 | 11.5% |
| 25 to 29 Minutes | 239 | 8.5% |
| 30 to 34 Minutes | 187 | 6.7% |
| 35 to 39 Minutes | 93 | 3.3% |
| 40 to 44 Minutes | 256 | 9.1% |
| 45 to 59 Minutes | 232 | 8.3% |
| 60 to 89 Minutes | 33 | 1.2% |
| 90 or more Minutes | 94 | 3.4% |
Commute Time by Sex in Elsmere
The most common commute times in Elsmere are 15 to 19 minutes (295 commuters, 23.0%) for males and 15 to 19 minutes (422 commuters, 27.6%) for females.
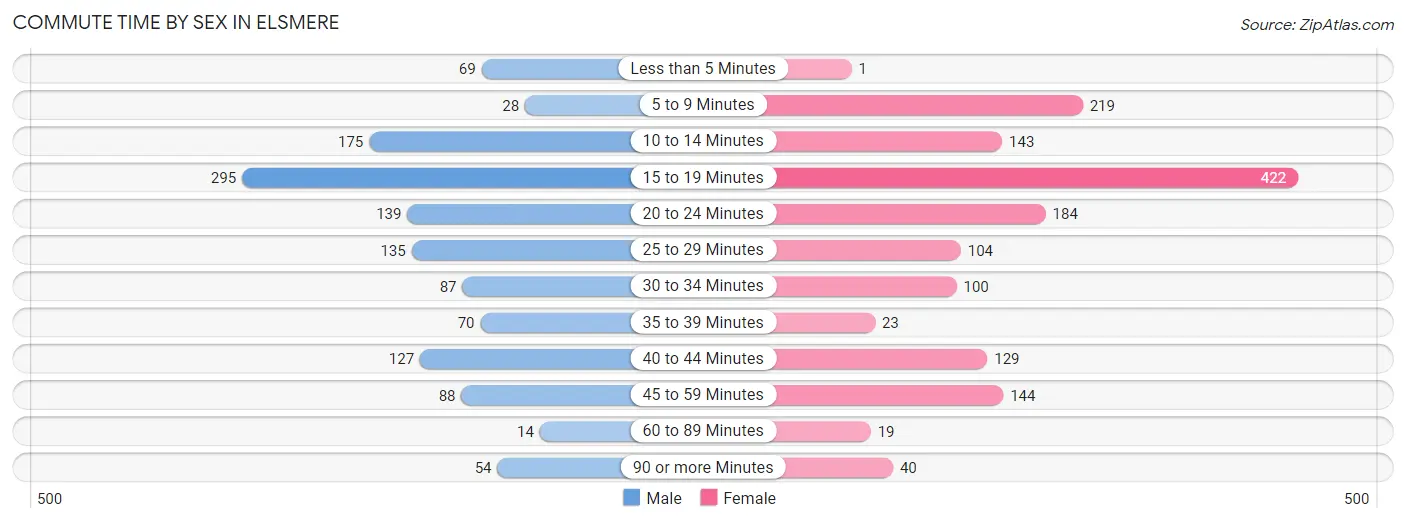
| Commute Time | Male | Female |
| Less than 5 Minutes | 69 (5.4%) | 1 (0.1%) |
| 5 to 9 Minutes | 28 (2.2%) | 219 (14.3%) |
| 10 to 14 Minutes | 175 (13.7%) | 143 (9.4%) |
| 15 to 19 Minutes | 295 (23.0%) | 422 (27.6%) |
| 20 to 24 Minutes | 139 (10.8%) | 184 (12.0%) |
| 25 to 29 Minutes | 135 (10.5%) | 104 (6.8%) |
| 30 to 34 Minutes | 87 (6.8%) | 100 (6.5%) |
| 35 to 39 Minutes | 70 (5.5%) | 23 (1.5%) |
| 40 to 44 Minutes | 127 (9.9%) | 129 (8.4%) |
| 45 to 59 Minutes | 88 (6.9%) | 144 (9.4%) |
| 60 to 89 Minutes | 14 (1.1%) | 19 (1.2%) |
| 90 or more Minutes | 54 (4.2%) | 40 (2.6%) |
Time of Departure to Work by Sex in Elsmere
The most frequent times of departure to work in Elsmere are 7:00 AM to 7:29 AM (282, 22.0%) for males and 8:00 AM to 8:29 AM (204, 13.4%) for females.
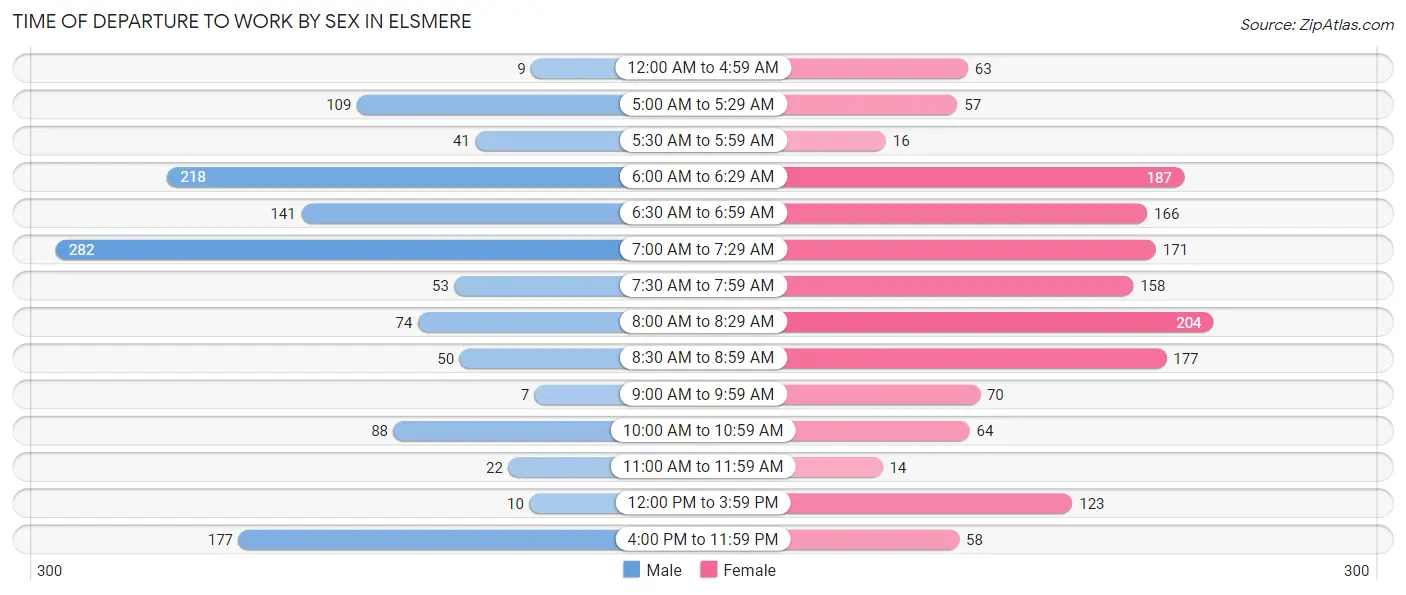
| Time of Departure | Male | Female |
| 12:00 AM to 4:59 AM | 9 (0.7%) | 63 (4.1%) |
| 5:00 AM to 5:29 AM | 109 (8.5%) | 57 (3.7%) |
| 5:30 AM to 5:59 AM | 41 (3.2%) | 16 (1.1%) |
| 6:00 AM to 6:29 AM | 218 (17.0%) | 187 (12.2%) |
| 6:30 AM to 6:59 AM | 141 (11.0%) | 166 (10.9%) |
| 7:00 AM to 7:29 AM | 282 (22.0%) | 171 (11.2%) |
| 7:30 AM to 7:59 AM | 53 (4.1%) | 158 (10.3%) |
| 8:00 AM to 8:29 AM | 74 (5.8%) | 204 (13.4%) |
| 8:30 AM to 8:59 AM | 50 (3.9%) | 177 (11.6%) |
| 9:00 AM to 9:59 AM | 7 (0.5%) | 70 (4.6%) |
| 10:00 AM to 10:59 AM | 88 (6.9%) | 64 (4.2%) |
| 11:00 AM to 11:59 AM | 22 (1.7%) | 14 (0.9%) |
| 12:00 PM to 3:59 PM | 10 (0.8%) | 123 (8.1%) |
| 4:00 PM to 11:59 PM | 177 (13.8%) | 58 (3.8%) |
| Total | 1,281 (100.0%) | 1,528 (100.0%) |
Housing Occupancy in Elsmere
Occupancy by Ownership in Elsmere
Of the total 2,282 dwellings in Elsmere, owner-occupied units account for 1,508 (66.1%), while renter-occupied units make up 774 (33.9%).
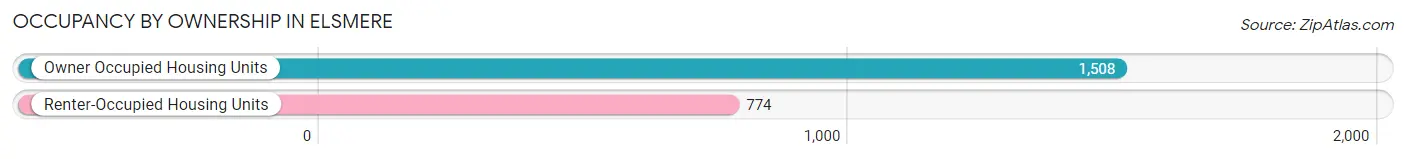
| Occupancy | # Housing Units | % Housing Units |
| Owner Occupied Housing Units | 1,508 | 66.1% |
| Renter-Occupied Housing Units | 774 | 33.9% |
| Total Occupied Housing Units | 2,282 | 100.0% |
Occupancy by Household Size in Elsmere
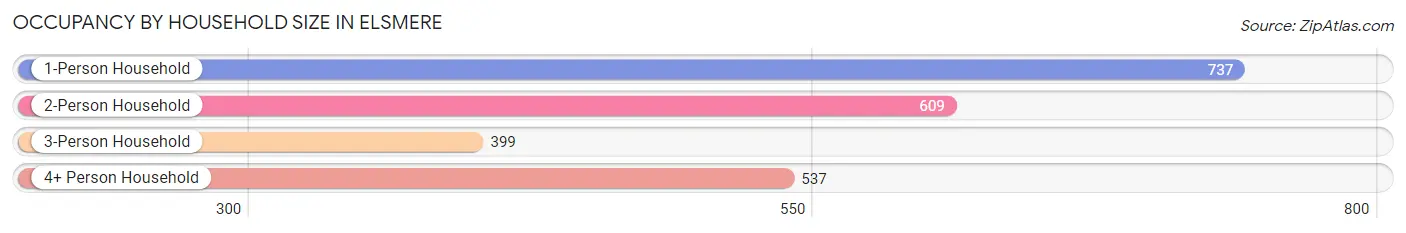
| Household Size | # Housing Units | % Housing Units |
| 1-Person Household | 737 | 32.3% |
| 2-Person Household | 609 | 26.7% |
| 3-Person Household | 399 | 17.5% |
| 4+ Person Household | 537 | 23.5% |
| Total Housing Units | 2,282 | 100.0% |
Occupancy by Ownership by Household Size in Elsmere
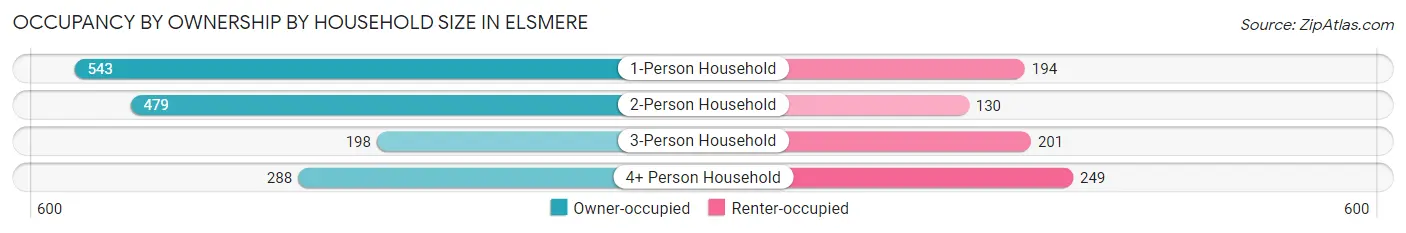
| Household Size | Owner-occupied | Renter-occupied |
| 1-Person Household | 543 (73.7%) | 194 (26.3%) |
| 2-Person Household | 479 (78.6%) | 130 (21.3%) |
| 3-Person Household | 198 (49.6%) | 201 (50.4%) |
| 4+ Person Household | 288 (53.6%) | 249 (46.4%) |
| Total Housing Units | 1,508 (66.1%) | 774 (33.9%) |
Occupancy by Educational Attainment in Elsmere
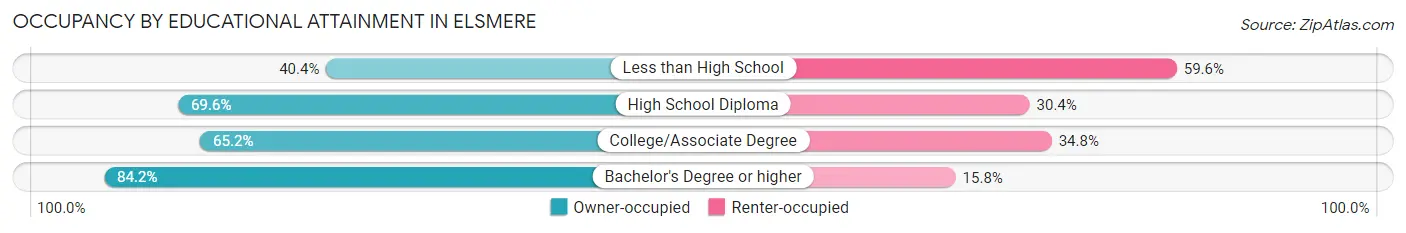
| Household Size | Owner-occupied | Renter-occupied |
| Less than High School | 166 (40.4%) | 245 (59.6%) |
| High School Diploma | 501 (69.6%) | 219 (30.4%) |
| College/Associate Degree | 440 (65.2%) | 235 (34.8%) |
| Bachelor's Degree or higher | 401 (84.2%) | 75 (15.8%) |
Occupancy by Age of Householder in Elsmere
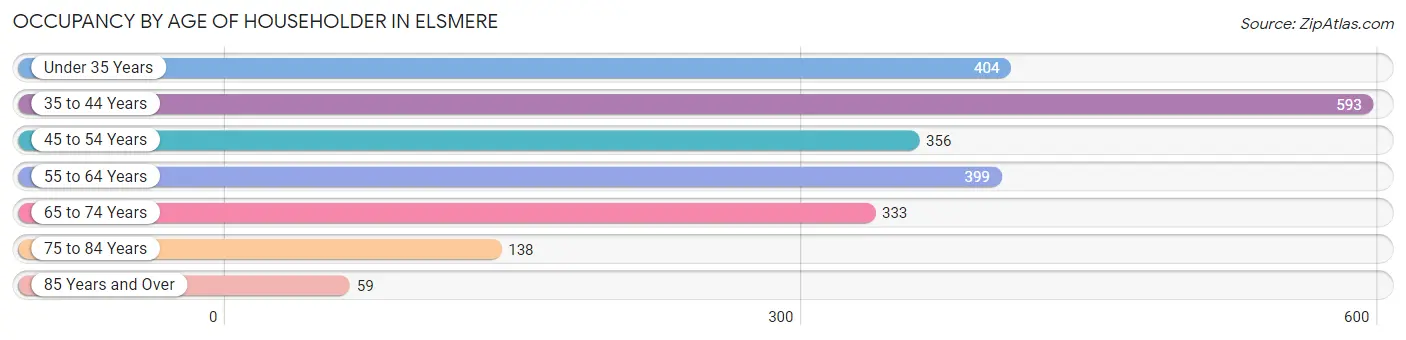
| Age Bracket | # Households | % Households |
| Under 35 Years | 404 | 17.7% |
| 35 to 44 Years | 593 | 26.0% |
| 45 to 54 Years | 356 | 15.6% |
| 55 to 64 Years | 399 | 17.5% |
| 65 to 74 Years | 333 | 14.6% |
| 75 to 84 Years | 138 | 6.0% |
| 85 Years and Over | 59 | 2.6% |
| Total | 2,282 | 100.0% |
Housing Finances in Elsmere
Median Income by Occupancy in Elsmere
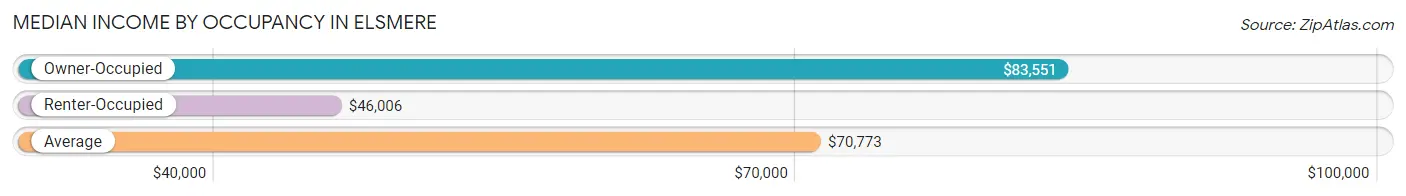
| Occupancy Type | # Households | Median Income |
| Owner-Occupied | 1,508 (66.1%) | $83,551 |
| Renter-Occupied | 774 (33.9%) | $46,006 |
| Average | 2,282 (100.0%) | $70,773 |
Occupancy by Householder Income Bracket in Elsmere
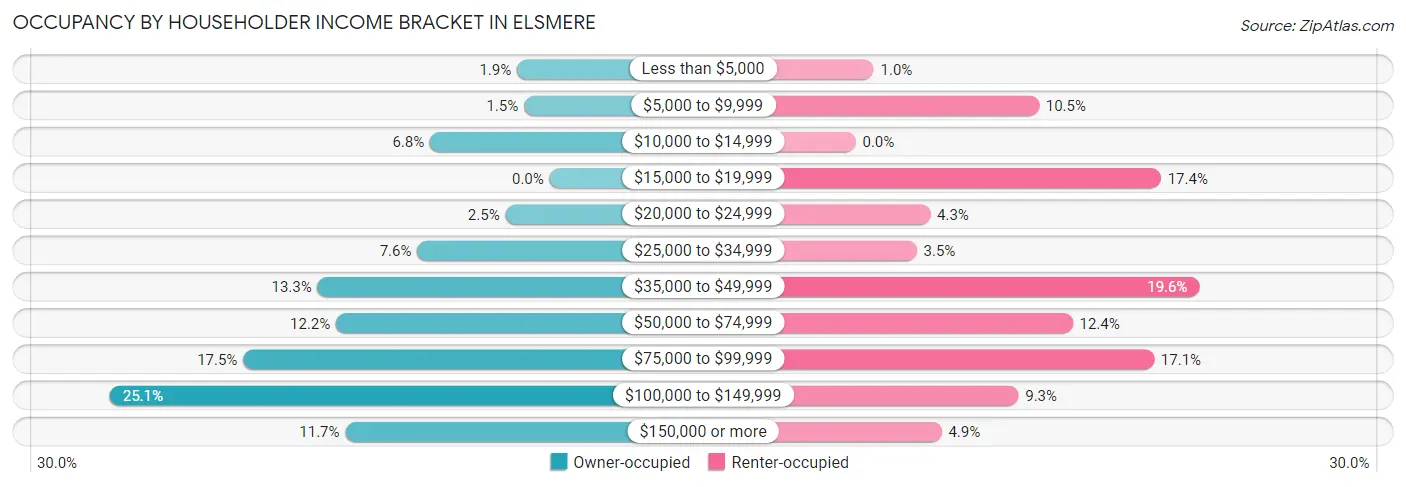
| Income Bracket | Owner-occupied | Renter-occupied |
| Less than $5,000 | 28 (1.9%) | 8 (1.0%) |
| $5,000 to $9,999 | 22 (1.5%) | 81 (10.5%) |
| $10,000 to $14,999 | 103 (6.8%) | 0 (0.0%) |
| $15,000 to $19,999 | 0 (0.0%) | 135 (17.4%) |
| $20,000 to $24,999 | 38 (2.5%) | 33 (4.3%) |
| $25,000 to $34,999 | 114 (7.6%) | 27 (3.5%) |
| $35,000 to $49,999 | 200 (13.3%) | 152 (19.6%) |
| $50,000 to $74,999 | 184 (12.2%) | 96 (12.4%) |
| $75,000 to $99,999 | 264 (17.5%) | 132 (17.1%) |
| $100,000 to $149,999 | 379 (25.1%) | 72 (9.3%) |
| $150,000 or more | 176 (11.7%) | 38 (4.9%) |
| Total | 1,508 (100.0%) | 774 (100.0%) |
Monthly Housing Cost Tiers in Elsmere
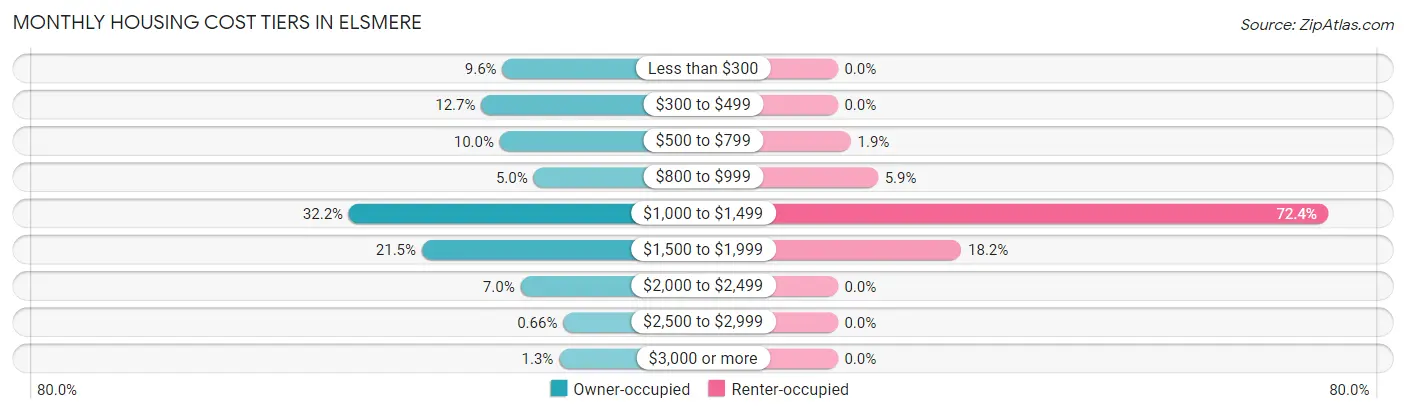
| Monthly Cost | Owner-occupied | Renter-occupied |
| Less than $300 | 145 (9.6%) | 0 (0.0%) |
| $300 to $499 | 192 (12.7%) | 0 (0.0%) |
| $500 to $799 | 151 (10.0%) | 15 (1.9%) |
| $800 to $999 | 76 (5.0%) | 46 (5.9%) |
| $1,000 to $1,499 | 486 (32.2%) | 560 (72.4%) |
| $1,500 to $1,999 | 324 (21.5%) | 141 (18.2%) |
| $2,000 to $2,499 | 105 (7.0%) | 0 (0.0%) |
| $2,500 to $2,999 | 10 (0.7%) | 0 (0.0%) |
| $3,000 or more | 19 (1.3%) | 0 (0.0%) |
| Total | 1,508 (100.0%) | 774 (100.0%) |
Physical Housing Characteristics in Elsmere
Housing Structures in Elsmere
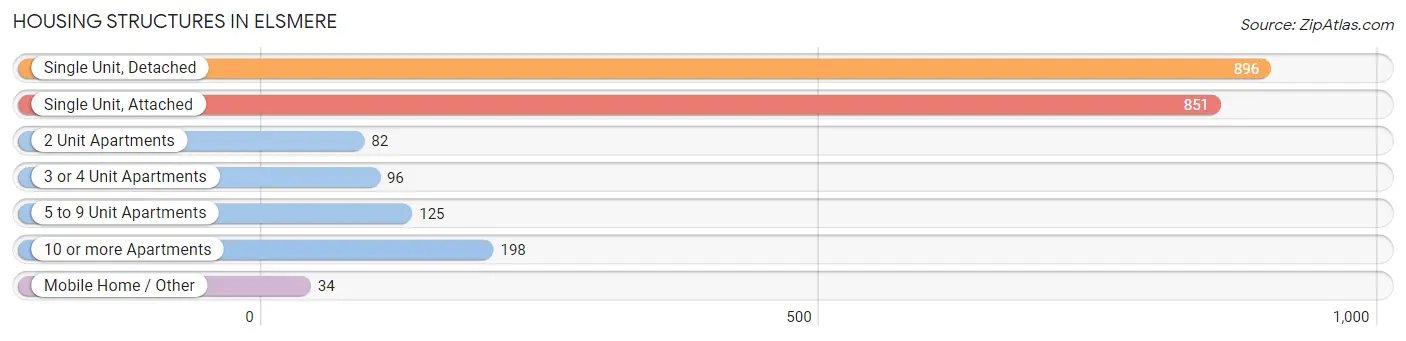
| Structure Type | # Housing Units | % Housing Units |
| Single Unit, Detached | 896 | 39.3% |
| Single Unit, Attached | 851 | 37.3% |
| 2 Unit Apartments | 82 | 3.6% |
| 3 or 4 Unit Apartments | 96 | 4.2% |
| 5 to 9 Unit Apartments | 125 | 5.5% |
| 10 or more Apartments | 198 | 8.7% |
| Mobile Home / Other | 34 | 1.5% |
| Total | 2,282 | 100.0% |
Housing Structures by Occupancy in Elsmere
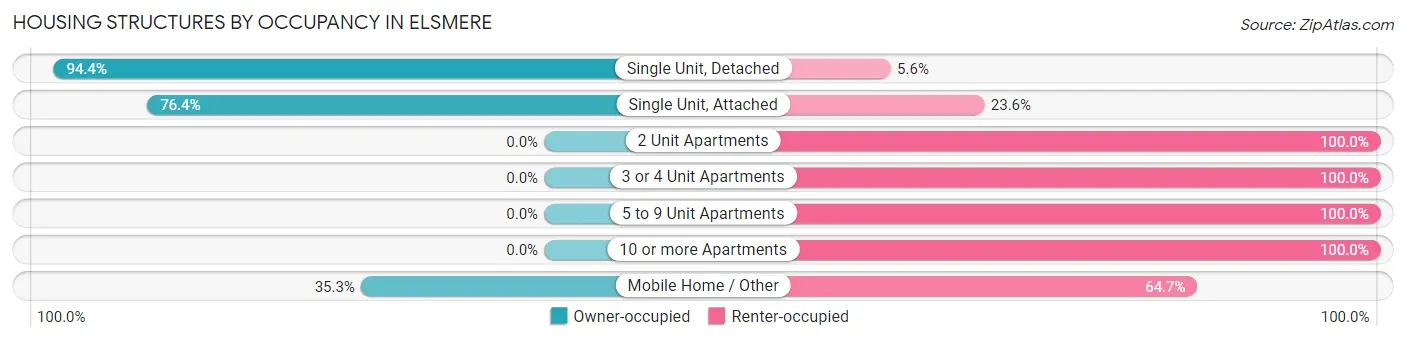
| Structure Type | Owner-occupied | Renter-occupied |
| Single Unit, Detached | 846 (94.4%) | 50 (5.6%) |
| Single Unit, Attached | 650 (76.4%) | 201 (23.6%) |
| 2 Unit Apartments | 0 (0.0%) | 82 (100.0%) |
| 3 or 4 Unit Apartments | 0 (0.0%) | 96 (100.0%) |
| 5 to 9 Unit Apartments | 0 (0.0%) | 125 (100.0%) |
| 10 or more Apartments | 0 (0.0%) | 198 (100.0%) |
| Mobile Home / Other | 12 (35.3%) | 22 (64.7%) |
| Total | 1,508 (66.1%) | 774 (33.9%) |
Housing Structures by Number of Rooms in Elsmere
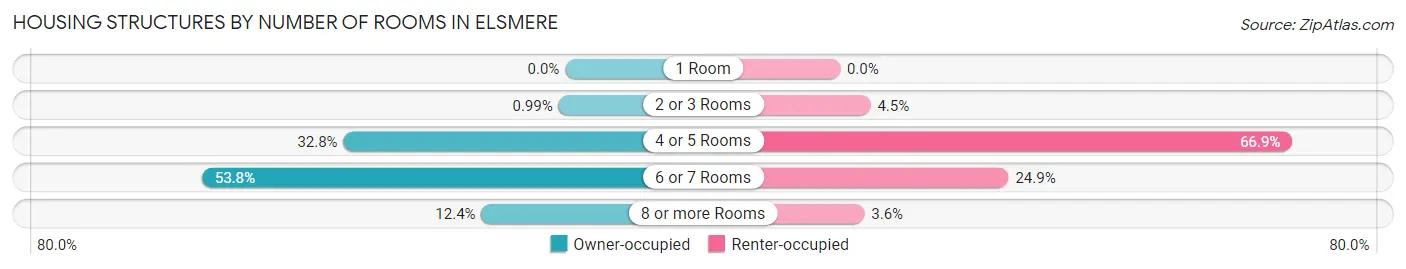
| Number of Rooms | Owner-occupied | Renter-occupied |
| 1 Room | 0 (0.0%) | 0 (0.0%) |
| 2 or 3 Rooms | 15 (1.0%) | 35 (4.5%) |
| 4 or 5 Rooms | 495 (32.8%) | 518 (66.9%) |
| 6 or 7 Rooms | 811 (53.8%) | 193 (24.9%) |
| 8 or more Rooms | 187 (12.4%) | 28 (3.6%) |
| Total | 1,508 (100.0%) | 774 (100.0%) |
Housing Structure by Heating Type in Elsmere
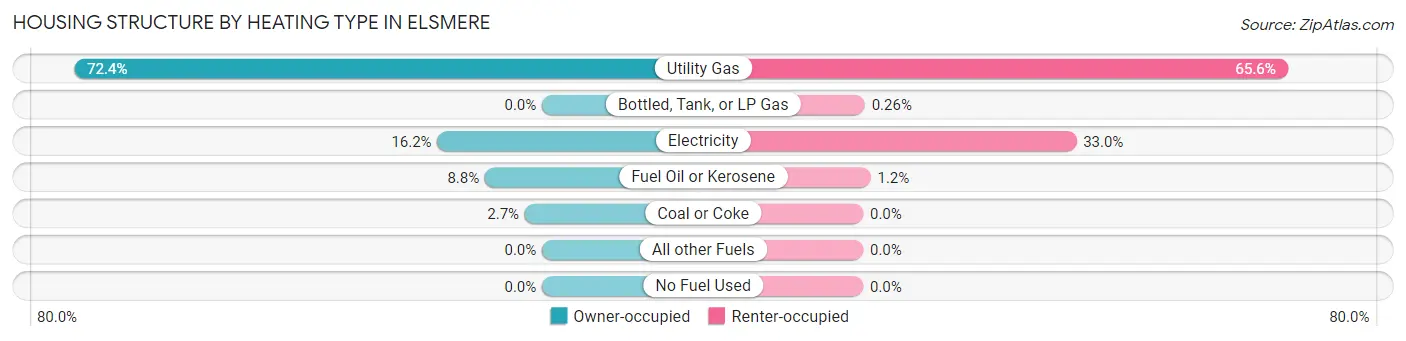
| Heating Type | Owner-occupied | Renter-occupied |
| Utility Gas | 1,091 (72.4%) | 508 (65.6%) |
| Bottled, Tank, or LP Gas | 0 (0.0%) | 2 (0.3%) |
| Electricity | 244 (16.2%) | 255 (33.0%) |
| Fuel Oil or Kerosene | 133 (8.8%) | 9 (1.2%) |
| Coal or Coke | 40 (2.6%) | 0 (0.0%) |
| All other Fuels | 0 (0.0%) | 0 (0.0%) |
| No Fuel Used | 0 (0.0%) | 0 (0.0%) |
| Total | 1,508 (100.0%) | 774 (100.0%) |
Household Vehicle Usage in Elsmere
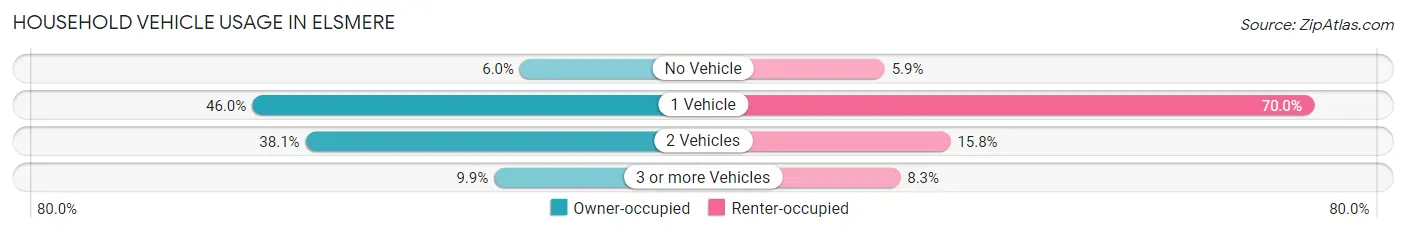
| Vehicles per Household | Owner-occupied | Renter-occupied |
| No Vehicle | 91 (6.0%) | 46 (5.9%) |
| 1 Vehicle | 694 (46.0%) | 542 (70.0%) |
| 2 Vehicles | 574 (38.1%) | 122 (15.8%) |
| 3 or more Vehicles | 149 (9.9%) | 64 (8.3%) |
| Total | 1,508 (100.0%) | 774 (100.0%) |
Real Estate & Mortgages in Elsmere
Real Estate and Mortgage Overview in Elsmere
| Characteristic | Without Mortgage | With Mortgage |
| Housing Units | 446 | 1,062 |
| Median Property Value | $178,100 | $207,600 |
| Median Household Income | $51,081 | $147 |
| Monthly Housing Costs | $438 | $19 |
| Real Estate Taxes | $1,796 | $19 |
Property Value by Mortgage Status in Elsmere
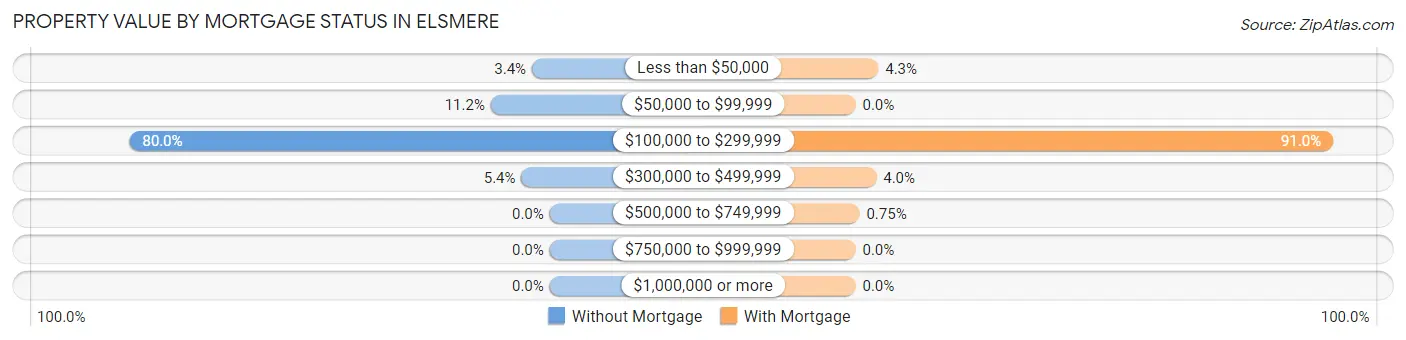
| Property Value | Without Mortgage | With Mortgage |
| Less than $50,000 | 15 (3.4%) | 46 (4.3%) |
| $50,000 to $99,999 | 50 (11.2%) | 0 (0.0%) |
| $100,000 to $299,999 | 357 (80.0%) | 966 (91.0%) |
| $300,000 to $499,999 | 24 (5.4%) | 42 (4.0%) |
| $500,000 to $749,999 | 0 (0.0%) | 8 (0.7%) |
| $750,000 to $999,999 | 0 (0.0%) | 0 (0.0%) |
| $1,000,000 or more | 0 (0.0%) | 0 (0.0%) |
| Total | 446 (100.0%) | 1,062 (100.0%) |
Household Income by Mortgage Status in Elsmere
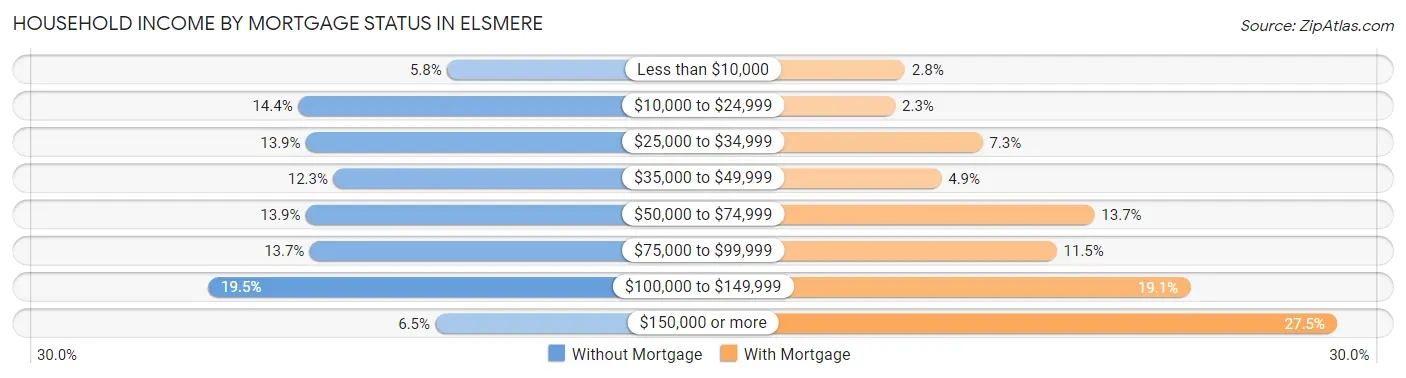
| Household Income | Without Mortgage | With Mortgage |
| Less than $10,000 | 26 (5.8%) | 30 (2.8%) |
| $10,000 to $24,999 | 64 (14.3%) | 24 (2.3%) |
| $25,000 to $34,999 | 62 (13.9%) | 77 (7.2%) |
| $35,000 to $49,999 | 55 (12.3%) | 52 (4.9%) |
| $50,000 to $74,999 | 62 (13.9%) | 145 (13.7%) |
| $75,000 to $99,999 | 61 (13.7%) | 122 (11.5%) |
| $100,000 to $149,999 | 87 (19.5%) | 203 (19.1%) |
| $150,000 or more | 29 (6.5%) | 292 (27.5%) |
| Total | 446 (100.0%) | 1,062 (100.0%) |
Property Value to Household Income Ratio in Elsmere
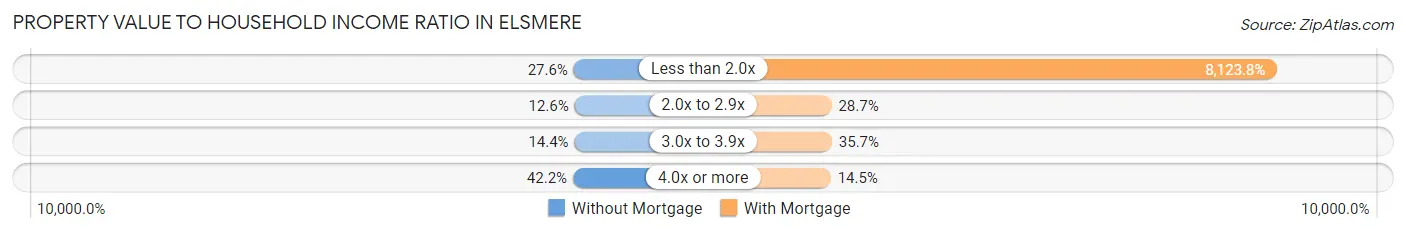
| Value-to-Income Ratio | Without Mortgage | With Mortgage |
| Less than 2.0x | 123 (27.6%) | 86,275 (8,123.8%) |
| 2.0x to 2.9x | 56 (12.6%) | 305 (28.7%) |
| 3.0x to 3.9x | 64 (14.3%) | 379 (35.7%) |
| 4.0x or more | 188 (42.1%) | 154 (14.5%) |
| Total | 446 (100.0%) | 1,062 (100.0%) |
Real Estate Taxes by Mortgage Status in Elsmere
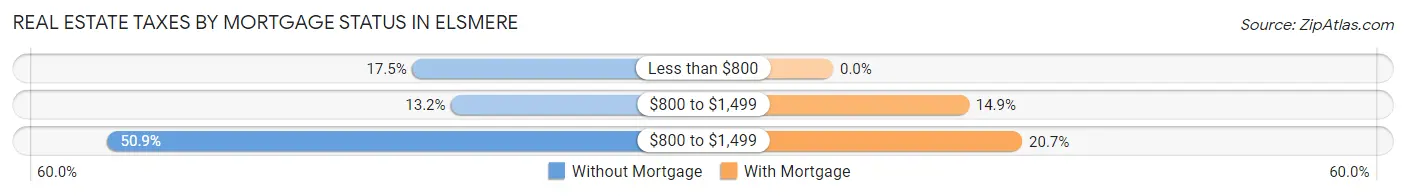
| Property Taxes | Without Mortgage | With Mortgage |
| Less than $800 | 78 (17.5%) | 0 (0.0%) |
| $800 to $1,499 | 59 (13.2%) | 158 (14.9%) |
| $800 to $1,499 | 227 (50.9%) | 220 (20.7%) |
| Total | 446 (100.0%) | 1,062 (100.0%) |
Health & Disability in Elsmere
Health Insurance Coverage by Age in Elsmere
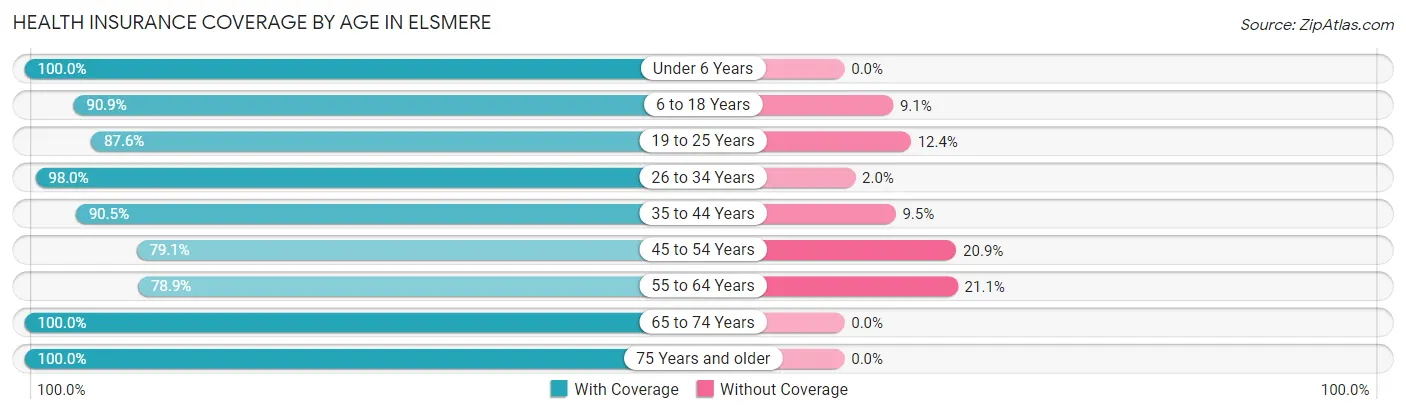
| Age Bracket | With Coverage | Without Coverage |
| Under 6 Years | 335 (100.0%) | 0 (0.0%) |
| 6 to 18 Years | 1,372 (90.9%) | 137 (9.1%) |
| 19 to 25 Years | 538 (87.6%) | 76 (12.4%) |
| 26 to 34 Years | 733 (98.0%) | 15 (2.0%) |
| 35 to 44 Years | 986 (90.5%) | 104 (9.5%) |
| 45 to 54 Years | 421 (79.1%) | 111 (20.9%) |
| 55 to 64 Years | 485 (78.9%) | 130 (21.1%) |
| 65 to 74 Years | 480 (100.0%) | 0 (0.0%) |
| 75 Years and older | 257 (100.0%) | 0 (0.0%) |
| Total | 5,607 (90.7%) | 573 (9.3%) |
Health Insurance Coverage by Citizenship Status in Elsmere
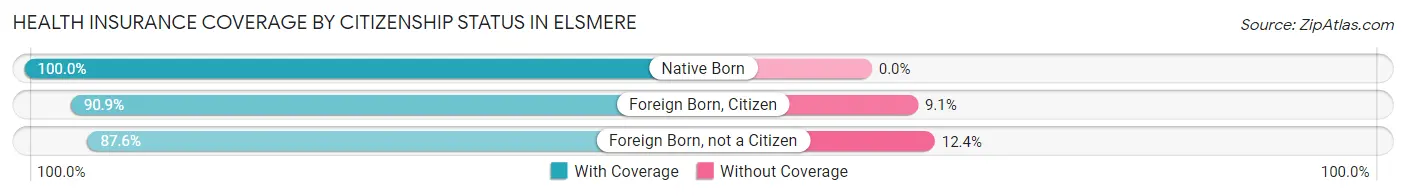
| Citizenship Status | With Coverage | Without Coverage |
| Native Born | 335 (100.0%) | 0 (0.0%) |
| Foreign Born, Citizen | 1,372 (90.9%) | 137 (9.1%) |
| Foreign Born, not a Citizen | 538 (87.6%) | 76 (12.4%) |
Health Insurance Coverage by Household Income in Elsmere
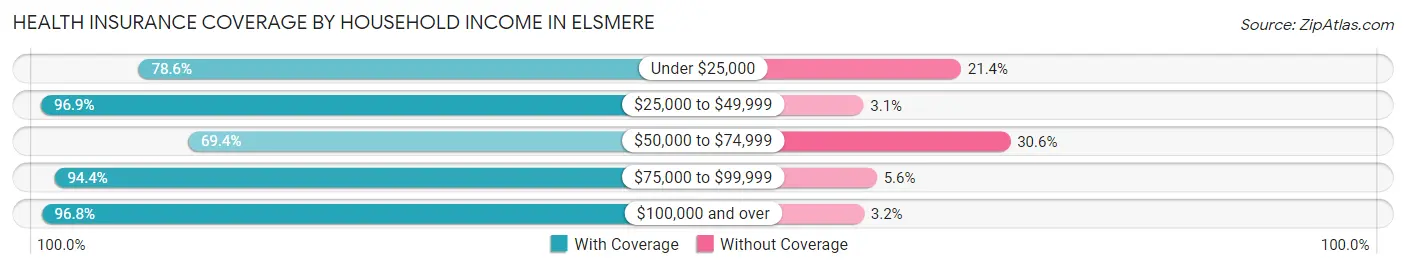
| Household Income | With Coverage | Without Coverage |
| Under $25,000 | 721 (78.6%) | 196 (21.4%) |
| $25,000 to $49,999 | 1,094 (96.9%) | 35 (3.1%) |
| $50,000 to $74,999 | 478 (69.4%) | 211 (30.6%) |
| $75,000 to $99,999 | 826 (94.4%) | 49 (5.6%) |
| $100,000 and over | 2,477 (96.8%) | 82 (3.2%) |
Public vs Private Health Insurance Coverage by Age in Elsmere
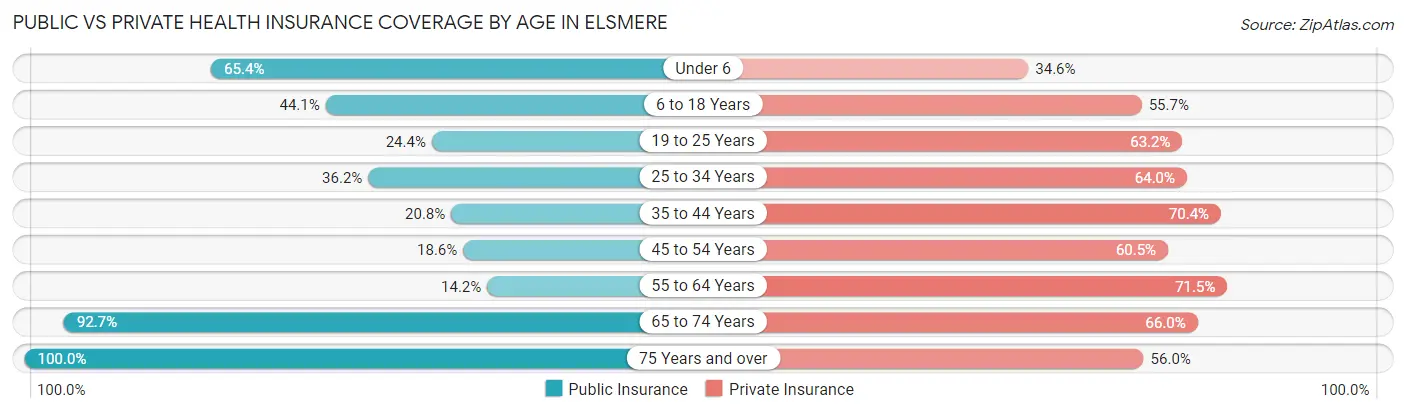
| Age Bracket | Public Insurance | Private Insurance |
| Under 6 | 219 (65.4%) | 116 (34.6%) |
| 6 to 18 Years | 666 (44.1%) | 840 (55.7%) |
| 19 to 25 Years | 150 (24.4%) | 388 (63.2%) |
| 25 to 34 Years | 271 (36.2%) | 479 (64.0%) |
| 35 to 44 Years | 227 (20.8%) | 767 (70.4%) |
| 45 to 54 Years | 99 (18.6%) | 322 (60.5%) |
| 55 to 64 Years | 87 (14.1%) | 440 (71.5%) |
| 65 to 74 Years | 445 (92.7%) | 317 (66.0%) |
| 75 Years and over | 257 (100.0%) | 144 (56.0%) |
| Total | 2,421 (39.2%) | 3,813 (61.7%) |
Disability Status by Sex by Age in Elsmere
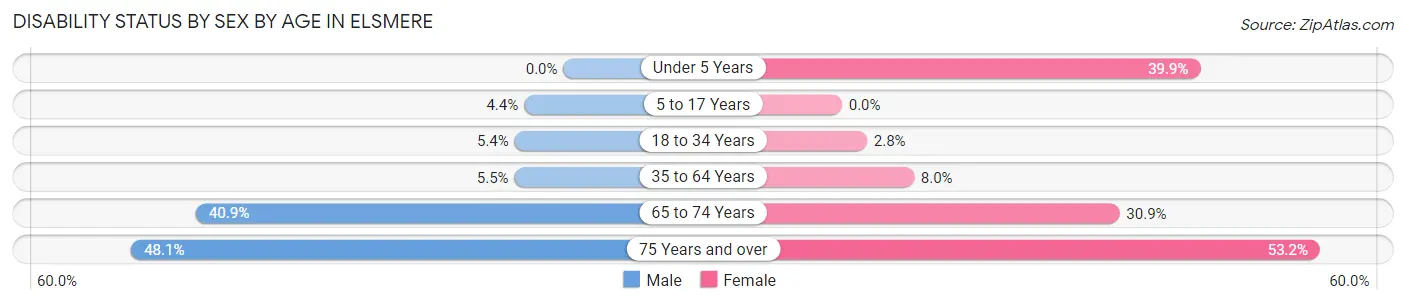
| Age Bracket | Male | Female |
| Under 5 Years | 0 (0.0%) | 91 (39.9%) |
| 5 to 17 Years | 37 (4.4%) | 0 (0.0%) |
| 18 to 34 Years | 45 (5.4%) | 17 (2.8%) |
| 35 to 64 Years | 54 (5.4%) | 100 (8.0%) |
| 65 to 74 Years | 72 (40.9%) | 94 (30.9%) |
| 75 Years and over | 64 (48.1%) | 66 (53.2%) |
Disability Class by Sex by Age in Elsmere
Disability Class: Hearing Difficulty
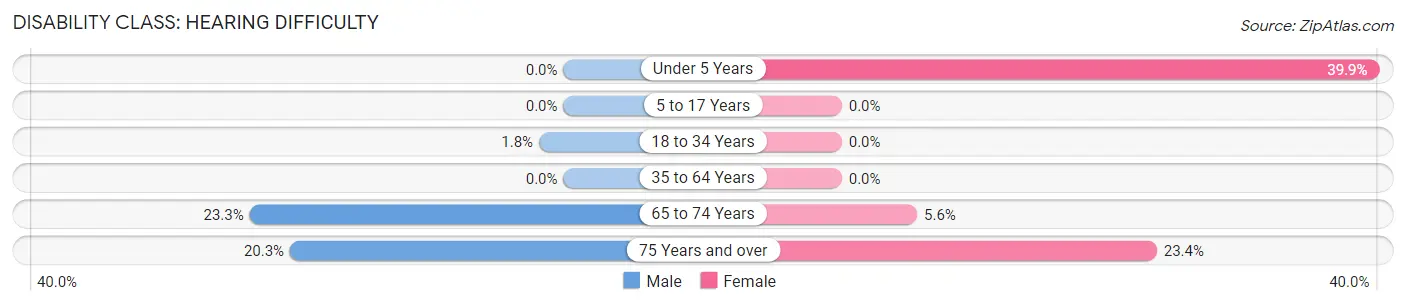
| Age Bracket | Male | Female |
| Under 5 Years | 0 (0.0%) | 91 (39.9%) |
| 5 to 17 Years | 0 (0.0%) | 0 (0.0%) |
| 18 to 34 Years | 15 (1.8%) | 0 (0.0%) |
| 35 to 64 Years | 0 (0.0%) | 0 (0.0%) |
| 65 to 74 Years | 41 (23.3%) | 17 (5.6%) |
| 75 Years and over | 27 (20.3%) | 29 (23.4%) |
Disability Class: Vision Difficulty
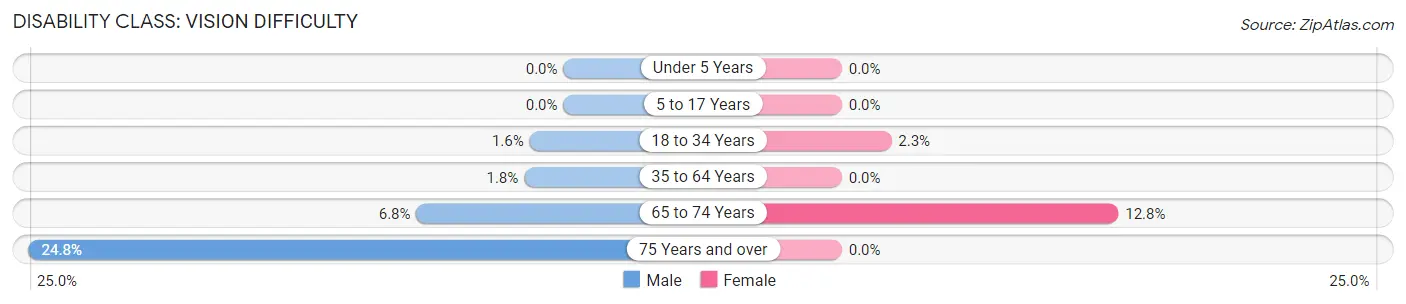
| Age Bracket | Male | Female |
| Under 5 Years | 0 (0.0%) | 0 (0.0%) |
| 5 to 17 Years | 0 (0.0%) | 0 (0.0%) |
| 18 to 34 Years | 13 (1.6%) | 14 (2.3%) |
| 35 to 64 Years | 18 (1.8%) | 0 (0.0%) |
| 65 to 74 Years | 12 (6.8%) | 39 (12.8%) |
| 75 Years and over | 33 (24.8%) | 0 (0.0%) |
Disability Class: Cognitive Difficulty
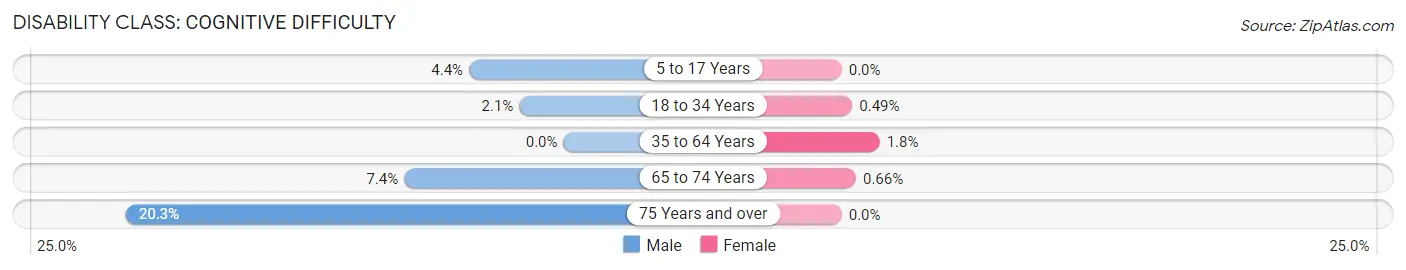
| Age Bracket | Male | Female |
| 5 to 17 Years | 37 (4.4%) | 0 (0.0%) |
| 18 to 34 Years | 17 (2.1%) | 3 (0.5%) |
| 35 to 64 Years | 0 (0.0%) | 22 (1.8%) |
| 65 to 74 Years | 13 (7.4%) | 2 (0.7%) |
| 75 Years and over | 27 (20.3%) | 0 (0.0%) |
Disability Class: Ambulatory Difficulty
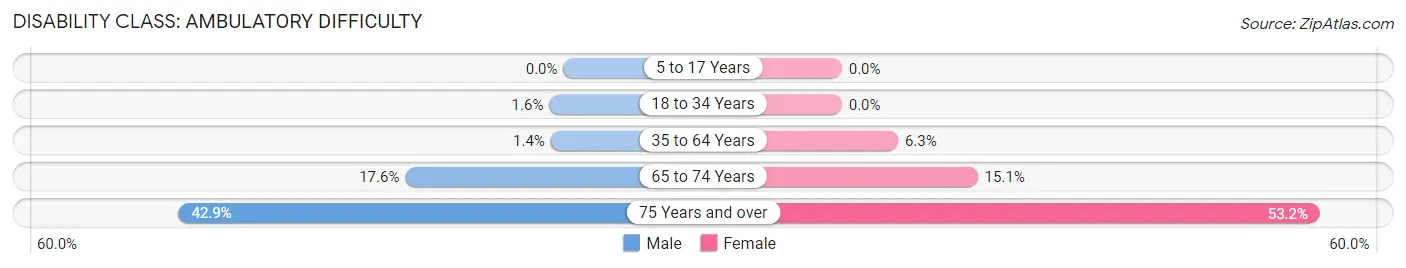
| Age Bracket | Male | Female |
| 5 to 17 Years | 0 (0.0%) | 0 (0.0%) |
| 18 to 34 Years | 13 (1.6%) | 0 (0.0%) |
| 35 to 64 Years | 14 (1.4%) | 78 (6.3%) |
| 65 to 74 Years | 31 (17.6%) | 46 (15.1%) |
| 75 Years and over | 57 (42.9%) | 66 (53.2%) |
Disability Class: Self-Care Difficulty
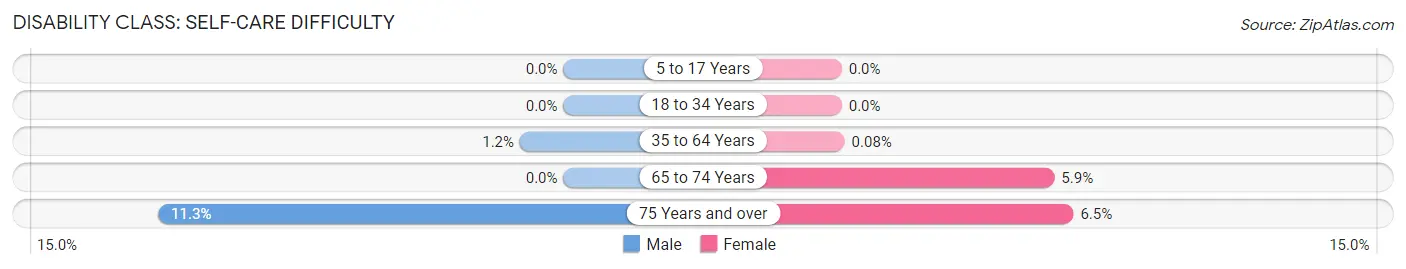
| Age Bracket | Male | Female |
| 5 to 17 Years | 0 (0.0%) | 0 (0.0%) |
| 18 to 34 Years | 0 (0.0%) | 0 (0.0%) |
| 35 to 64 Years | 12 (1.2%) | 1 (0.1%) |
| 65 to 74 Years | 0 (0.0%) | 18 (5.9%) |
| 75 Years and over | 15 (11.3%) | 8 (6.5%) |
Technology Access in Elsmere
Computing Device Access in Elsmere
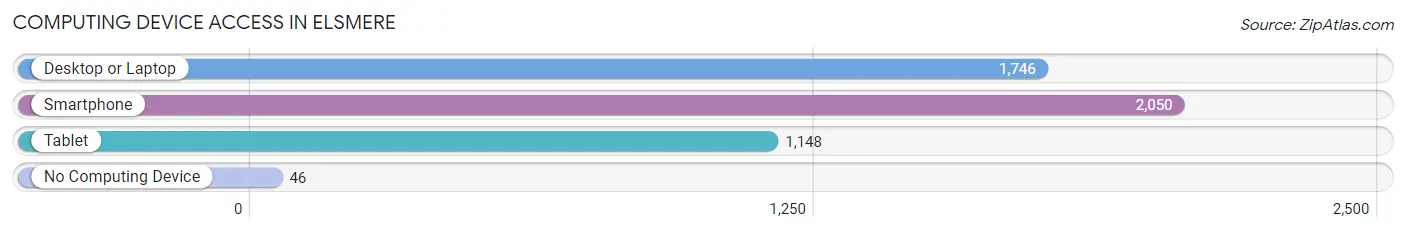
| Device Type | # Households | % Households |
| Desktop or Laptop | 1,746 | 76.5% |
| Smartphone | 2,050 | 89.8% |
| Tablet | 1,148 | 50.3% |
| No Computing Device | 46 | 2.0% |
| Total | 2,282 | 100.0% |
Internet Access in Elsmere
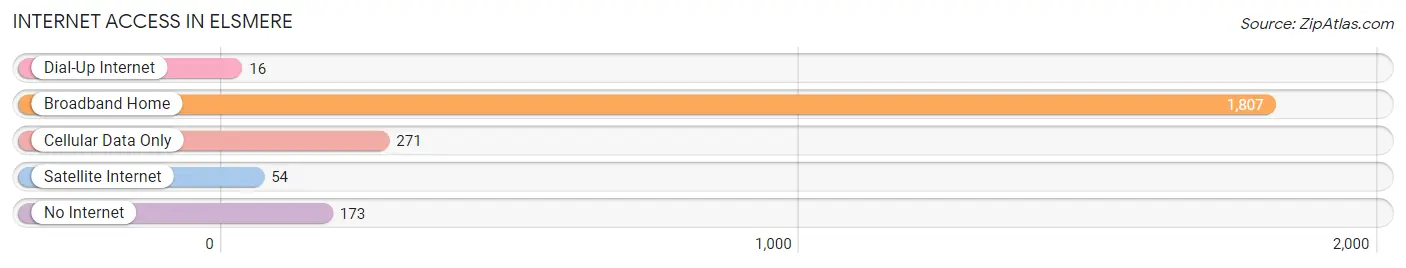
| Internet Type | # Households | % Households |
| Dial-Up Internet | 16 | 0.7% |
| Broadband Home | 1,807 | 79.2% |
| Cellular Data Only | 271 | 11.9% |
| Satellite Internet | 54 | 2.4% |
| No Internet | 173 | 7.6% |
| Total | 2,282 | 100.0% |
Elsmere Summary
Elsmere, Delaware is a small town located in New Castle County, Delaware. It is situated just north of Wilmington and is part of the Wilmington Metropolitan Statistical Area. The town has a population of 4,743 as of the 2010 census.
History
Elsmere was founded in 1891 by the Delaware and Maryland Railroad Company. The town was named after the Elsmere family, who owned a large tract of land in the area. The town was incorporated in 1895 and was the first town in New Castle County to be incorporated.
The town was originally a farming community, but in the early 20th century, it began to develop into a residential community. The town was home to a number of small businesses, including a grocery store, a hardware store, and a movie theater.
In the 1950s, the town began to experience rapid growth due to its proximity to Wilmington. The town was annexed by Wilmington in 1967, but it was later reincorporated as an independent town in 1971.
Geography
Elsmere is located at 39°44'N 75°33'W. It is situated in the northern part of New Castle County, just north of Wilmington. The town is bordered by the city of Wilmington to the south, the town of Bellefonte to the east, and the town of Edgemoor to the west.
The town has a total area of 1.2 square miles, all of which is land. The town is located in the Piedmont region of Delaware and is part of the Atlantic Coastal Plain. The town is located in the Christina River watershed.
Economy
The economy of Elsmere is largely based on the service industry. The town is home to a number of small businesses, including restaurants, retail stores, and professional services. The town is also home to a number of manufacturing companies, including a plastics manufacturer and a metal fabrication company.
The town is also home to a number of government offices, including the Elsmere Police Department and the Elsmere Fire Department. The town is also home to a number of educational institutions, including the Elsmere Elementary School and the Elsmere Middle School.
Demographics
As of the 2010 census, the population of Elsmere was 4,743. The racial makeup of the town was 79.3% White, 11.2% African American, 0.3% Native American, 2.2% Asian, 0.1% Pacific Islander, 4.2% from other races, and 2.9% from two or more races. Hispanic or Latino of any race were 8.2% of the population.
The median household income in Elsmere was $50,902, and the median family income was $60,902. The per capita income in Elsmere was $25,902. About 8.2% of families and 10.2% of the population were below the poverty line, including 14.2% of those under age 18 and 6.2% of those age 65 or over.
Common Questions
What is Per Capita Income in Elsmere?
Per Capita income in Elsmere is $30,900.
What is the Median Family Income in Elsmere?
Median Family Income in Elsmere is $78,505.
What is the Median Household income in Elsmere?
Median Household Income in Elsmere is $70,773.
What is Income or Wage Gap in Elsmere?
Income or Wage Gap in Elsmere is 5.6%.
Women in Elsmere earn 94.4 cents for every dollar earned by a man.
What is Inequality or Gini Index in Elsmere?
Inequality or Gini Index in Elsmere is 0.42.
What is the Total Population of Elsmere?
Total Population of Elsmere is 6,194.
What is the Total Male Population of Elsmere?
Total Male Population of Elsmere is 3,022.
What is the Total Female Population of Elsmere?
Total Female Population of Elsmere is 3,172.
What is the Ratio of Males per 100 Females in Elsmere?
There are 95.27 Males per 100 Females in Elsmere.
What is the Ratio of Females per 100 Males in Elsmere?
There are 104.96 Females per 100 Males in Elsmere.
What is the Median Population Age in Elsmere?
Median Population Age in Elsmere is 34.2 Years.
What is the Average Family Size in Elsmere
Average Family Size in Elsmere is 3.6 People.
What is the Average Household Size in Elsmere
Average Household Size in Elsmere is 2.7 People.
How Large is the Labor Force in Elsmere?
There are 3,256 People in the Labor Forcein in Elsmere.
What is the Percentage of People in the Labor Force in Elsmere?
67.9% of People are in the Labor Force in Elsmere.
What is the Unemployment Rate in Elsmere?
Unemployment Rate in Elsmere is 5.2%.