Bear, DE Map & Demographics
Bear Map
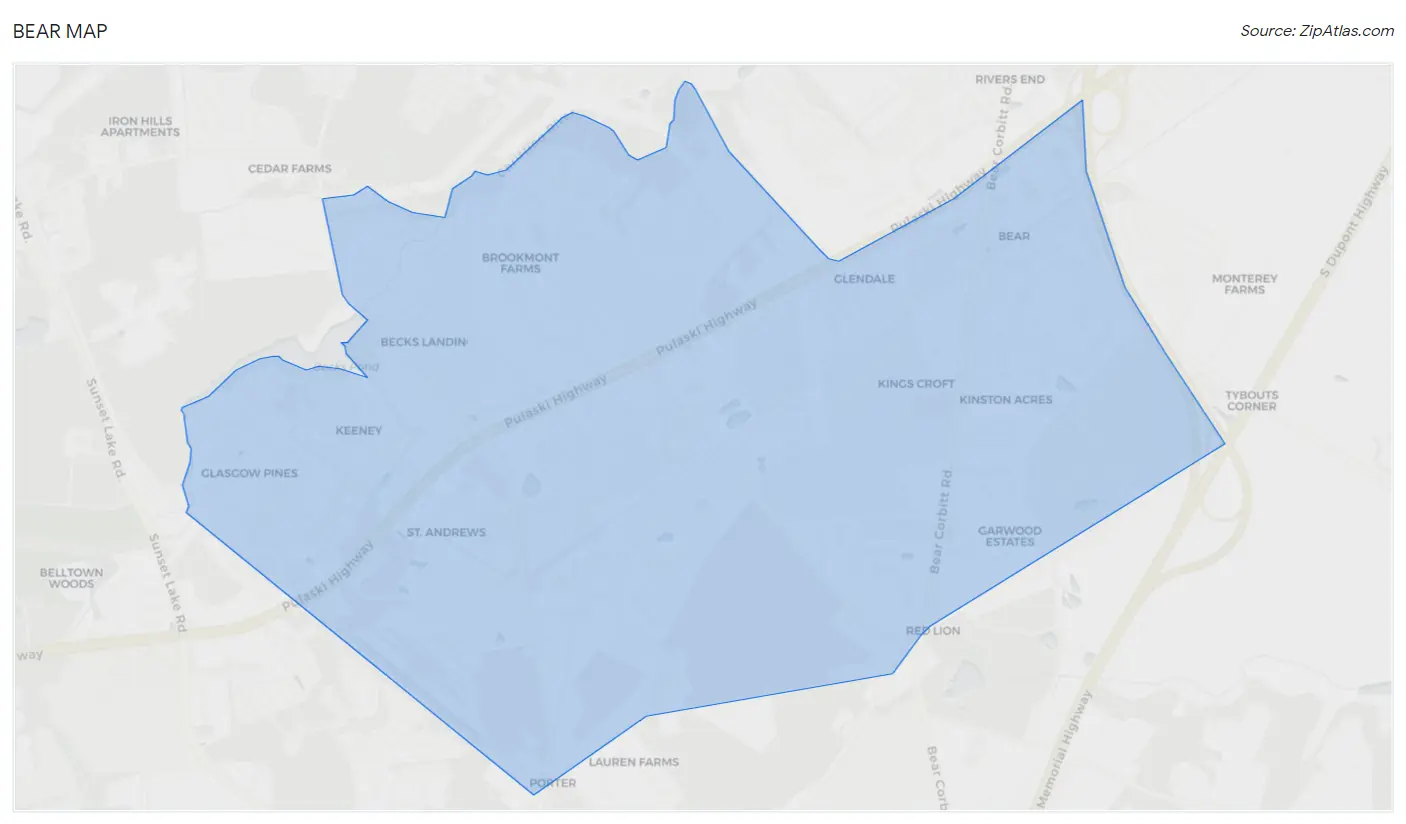
Bear Overview
$38,426
PER CAPITA INCOME
$90,629
AVG FAMILY INCOME
$83,852
AVG HOUSEHOLD INCOME
24.4%
WAGE / INCOME GAP [ % ]
75.6¢/ $1
WAGE / INCOME GAP [ $ ]
$8,181
FAMILY INCOME DEFICIT
0.38
INEQUALITY / GINI INDEX
23,070
TOTAL POPULATION
11,316
MALE POPULATION
11,754
FEMALE POPULATION
96.27
MALES / 100 FEMALES
103.87
FEMALES / 100 MALES
37.7
MEDIAN AGE
3.5
AVG FAMILY SIZE
2.7
AVG HOUSEHOLD SIZE
13,780
LABOR FORCE [ PEOPLE ]
74.0%
PERCENT IN LABOR FORCE
7.7%
UNEMPLOYMENT RATE
Bear Zip Codes
Bear Area Codes
Income in Bear
Income Overview in Bear
Per Capita Income in Bear is $38,426, while median incomes of families and households are $90,629 and $83,852 respectively.
| Characteristic | Number | Measure |
| Per Capita Income | 23,070 | $38,426 |
| Median Family Income | 4,982 | $90,629 |
| Mean Family Income | 4,982 | $105,731 |
| Median Household Income | 8,600 | $83,852 |
| Mean Household Income | 8,600 | $99,338 |
| Income Deficit | 4,982 | $8,181 |
| Wage / Income Gap (%) | 23,070 | 24.37% |
| Wage / Income Gap ($) | 23,070 | 75.63¢ per $1 |
| Gini / Inequality Index | 23,070 | 0.38 |
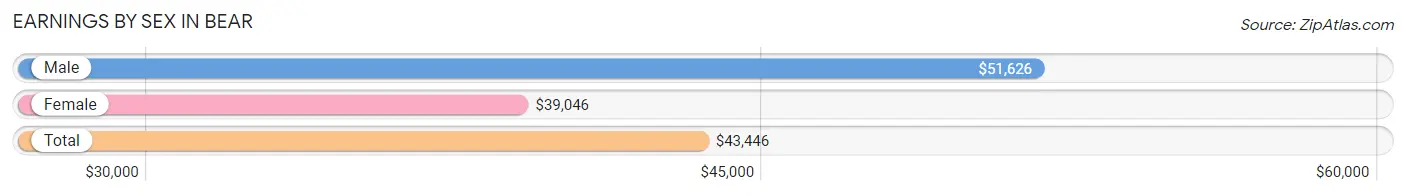
Earnings by Sex in Bear
Average Earnings in Bear are $43,446, $51,626 for men and $39,046 for women, a difference of 24.4%.
| Sex | Number | Average Earnings |
| Male | 6,965 (50.9%) | $51,626 |
| Female | 6,725 (49.1%) | $39,046 |
| Total | 13,690 (100.0%) | $43,446 |
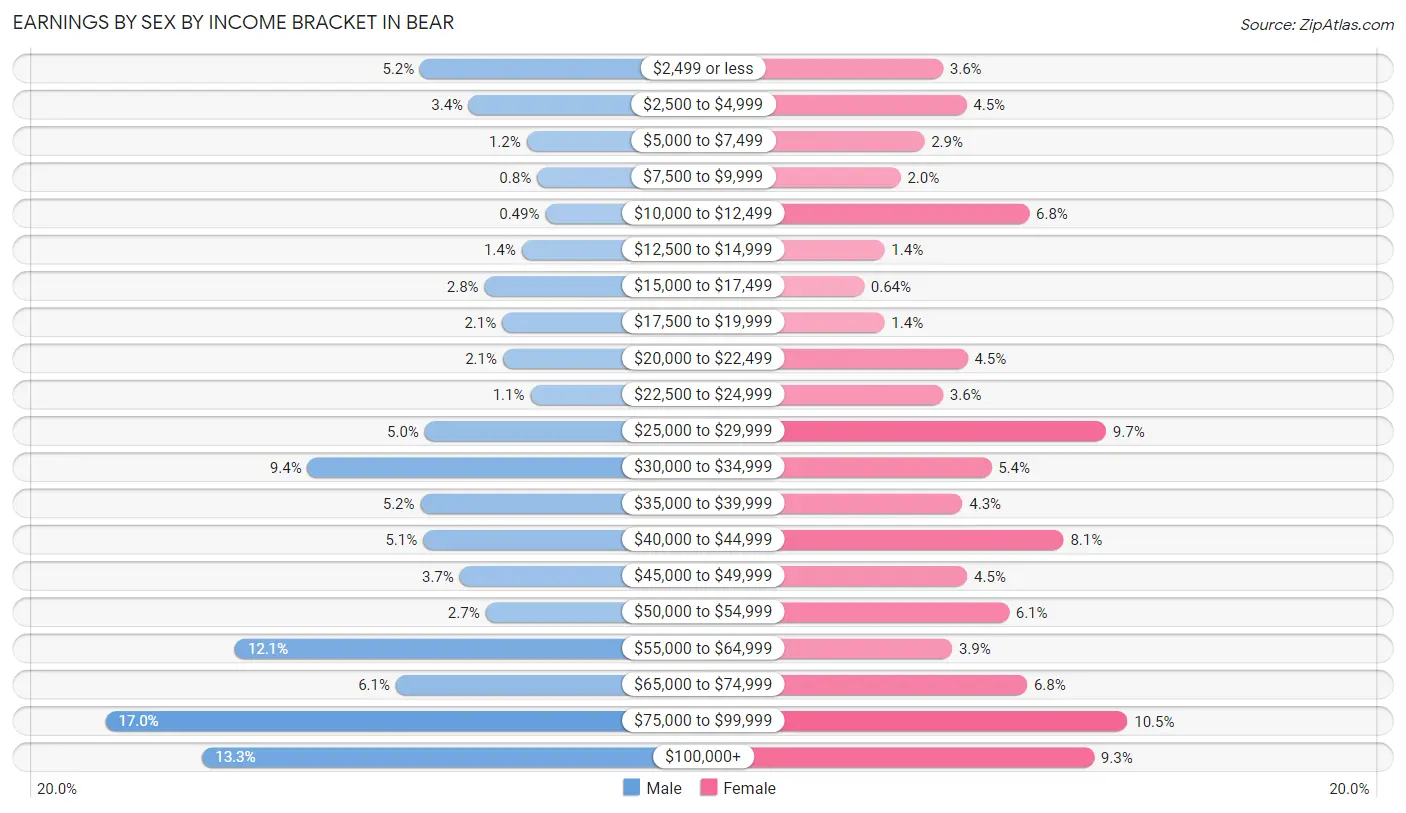
Earnings by Sex by Income Bracket in Bear
The most common earnings brackets in Bear are $75,000 to $99,999 for men (1,182 | 17.0%) and $75,000 to $99,999 for women (707 | 10.5%).
| Income | Male | Female |
| $2,499 or less | 361 (5.2%) | 242 (3.6%) |
| $2,500 to $4,999 | 233 (3.4%) | 301 (4.5%) |
| $5,000 to $7,499 | 83 (1.2%) | 195 (2.9%) |
| $7,500 to $9,999 | 56 (0.8%) | 135 (2.0%) |
| $10,000 to $12,499 | 34 (0.5%) | 459 (6.8%) |
| $12,500 to $14,999 | 96 (1.4%) | 95 (1.4%) |
| $15,000 to $17,499 | 193 (2.8%) | 43 (0.6%) |
| $17,500 to $19,999 | 147 (2.1%) | 95 (1.4%) |
| $20,000 to $22,499 | 145 (2.1%) | 304 (4.5%) |
| $22,500 to $24,999 | 73 (1.1%) | 242 (3.6%) |
| $25,000 to $29,999 | 349 (5.0%) | 653 (9.7%) |
| $30,000 to $34,999 | 655 (9.4%) | 364 (5.4%) |
| $35,000 to $39,999 | 360 (5.2%) | 291 (4.3%) |
| $40,000 to $44,999 | 353 (5.1%) | 546 (8.1%) |
| $45,000 to $49,999 | 258 (3.7%) | 303 (4.5%) |
| $50,000 to $54,999 | 190 (2.7%) | 408 (6.1%) |
| $55,000 to $64,999 | 844 (12.1%) | 265 (3.9%) |
| $65,000 to $74,999 | 424 (6.1%) | 454 (6.8%) |
| $75,000 to $99,999 | 1,182 (17.0%) | 707 (10.5%) |
| $100,000+ | 929 (13.3%) | 623 (9.3%) |
| Total | 6,965 (100.0%) | 6,725 (100.0%) |
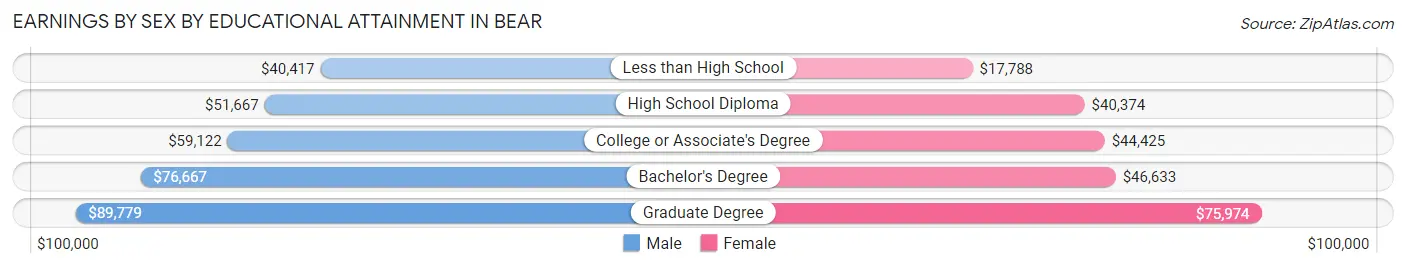
Earnings by Sex by Educational Attainment in Bear
Average earnings in Bear are $57,338 for men and $43,416 for women, a difference of 24.3%. Men with an educational attainment of graduate degree enjoy the highest average annual earnings of $89,779, while those with less than high school education earn the least with $40,417. Women with an educational attainment of graduate degree earn the most with the average annual earnings of $75,974, while those with less than high school education have the smallest earnings of $17,788.
| Educational Attainment | Male Income | Female Income |
| Less than High School | $40,417 | $17,788 |
| High School Diploma | $51,667 | $40,374 |
| College or Associate's Degree | $59,122 | $44,425 |
| Bachelor's Degree | $76,667 | $46,633 |
| Graduate Degree | $89,779 | $75,974 |
| Total | $57,338 | $43,416 |
Family Income in Bear
Family Income Brackets in Bear
According to the Bear family income data, there are 1,146 families falling into the $100,000 to $149,999 income range, which is the most common income bracket and makes up 23.0% of all families. Conversely, the $10,000 to $14,999 income bracket is the least frequent group with only 35 families (0.7%) belonging to this category.
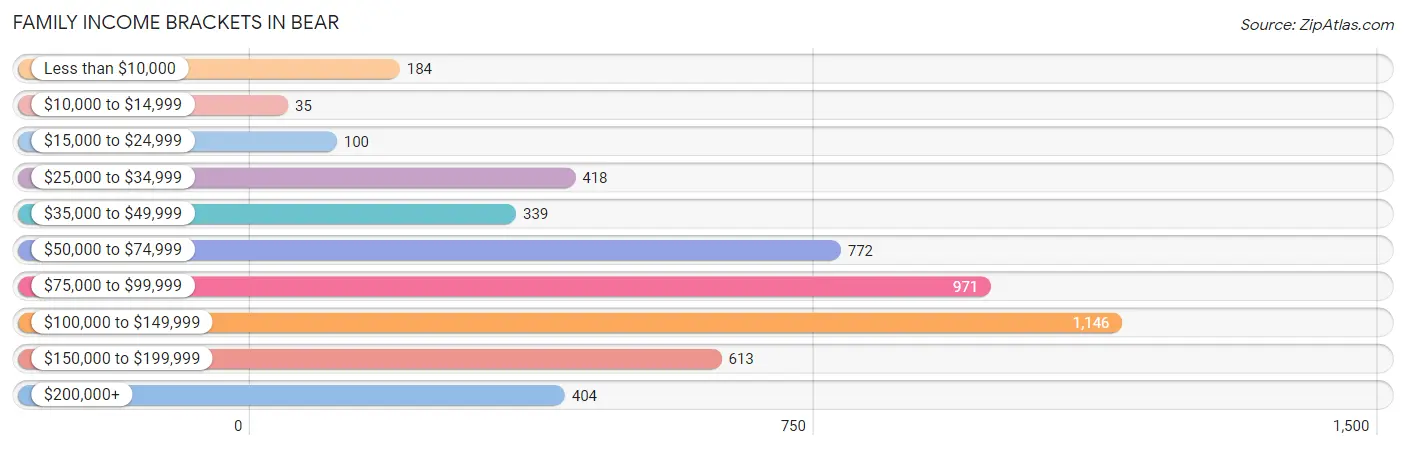
| Income Bracket | # Families | % Families |
| Less than $10,000 | 184 | 3.7% |
| $10,000 to $14,999 | 35 | 0.7% |
| $15,000 to $24,999 | 100 | 2.0% |
| $25,000 to $34,999 | 418 | 8.4% |
| $35,000 to $49,999 | 339 | 6.8% |
| $50,000 to $74,999 | 772 | 15.5% |
| $75,000 to $99,999 | 971 | 19.5% |
| $100,000 to $149,999 | 1,146 | 23.0% |
| $150,000 to $199,999 | 613 | 12.3% |
| $200,000+ | 404 | 8.1% |
Family Income by Famaliy Size in Bear
6-person families (192 | 3.8%) account for the highest median family income in Bear with $137,500 per family, while 2-person families (1,991 | 40.0%) have the highest median income of $44,698 per family member.
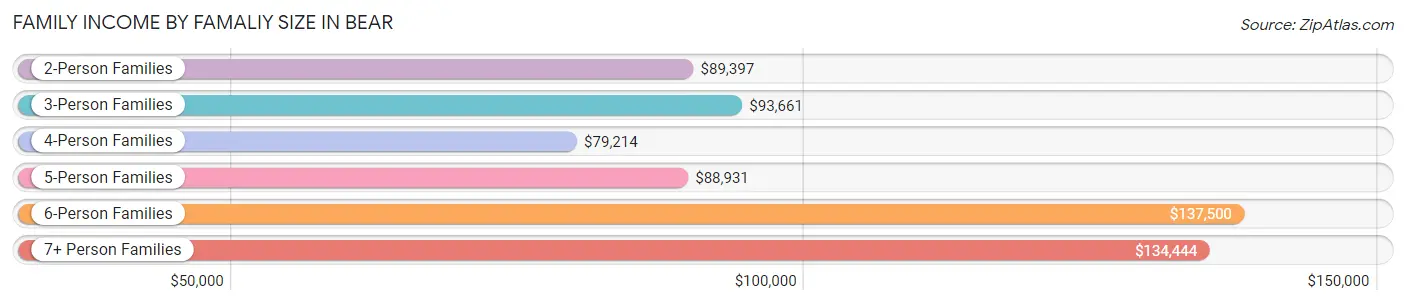
| Income Bracket | # Families | Median Income |
| 2-Person Families | 1,991 (40.0%) | $89,397 |
| 3-Person Families | 1,116 (22.4%) | $93,661 |
| 4-Person Families | 916 (18.4%) | $79,214 |
| 5-Person Families | 655 (13.2%) | $88,931 |
| 6-Person Families | 192 (3.8%) | $137,500 |
| 7+ Person Families | 112 (2.2%) | $134,444 |
| Total | 4,982 (100.0%) | $90,629 |
Family Income by Number of Earners in Bear
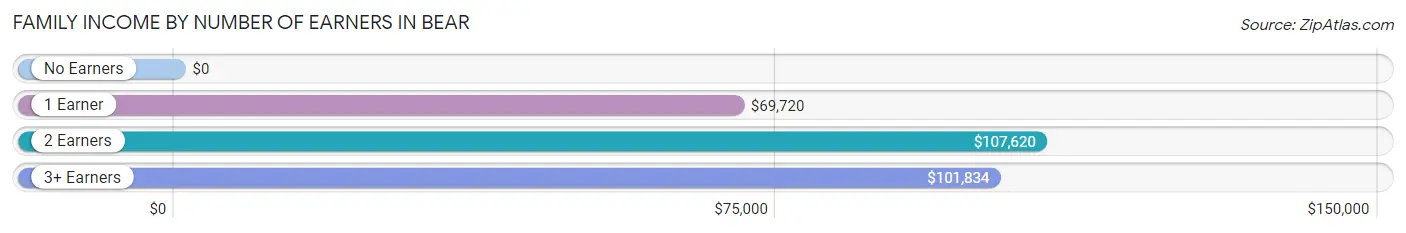
| Number of Earners | # Families | Median Income |
| No Earners | 406 (8.2%) | $0 |
| 1 Earner | 1,674 (33.6%) | $69,720 |
| 2 Earners | 1,949 (39.1%) | $107,620 |
| 3+ Earners | 953 (19.1%) | $101,834 |
| Total | 4,982 (100.0%) | $90,629 |
Household Income in Bear
Household Income Brackets in Bear
With 2,090 households falling in the category, the $75,000 to $99,999 income range is the most frequent in Bear, accounting for 24.3% of all households. In contrast, only 60 households (0.7%) fall into the $10,000 to $14,999 income bracket, making it the least populous group.
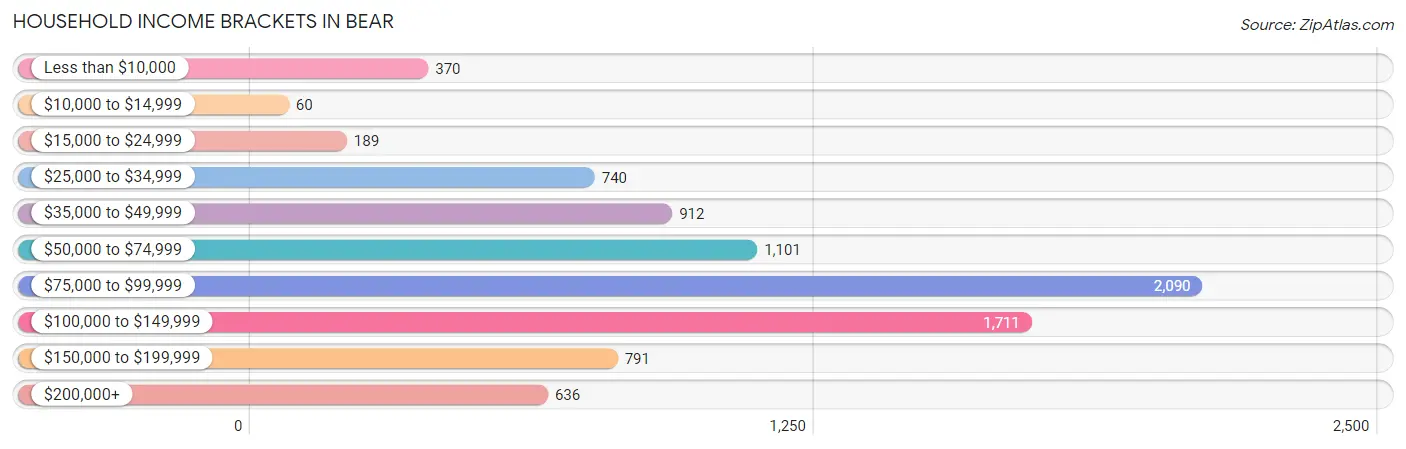
| Income Bracket | # Households | % Households |
| Less than $10,000 | 370 | 4.3% |
| $10,000 to $14,999 | 60 | 0.7% |
| $15,000 to $24,999 | 189 | 2.2% |
| $25,000 to $34,999 | 740 | 8.6% |
| $35,000 to $49,999 | 912 | 10.6% |
| $50,000 to $74,999 | 1,101 | 12.8% |
| $75,000 to $99,999 | 2,090 | 24.3% |
| $100,000 to $149,999 | 1,711 | 19.9% |
| $150,000 to $199,999 | 791 | 9.2% |
| $200,000+ | 636 | 7.4% |
Household Income by Householder Age in Bear
The median household income in Bear is $83,852, with the highest median household income of $91,299 found in the 25 to 44 years age bracket for the primary householder. A total of 3,155 households (36.7%) fall into this category. Meanwhile, the 15 to 24 years age bracket for the primary householder has the lowest median household income of $0, with 101 households (1.2%) in this group.
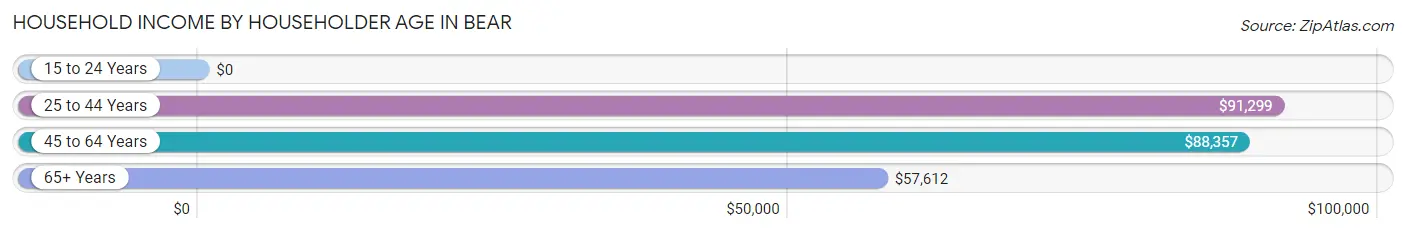
| Income Bracket | # Households | Median Income |
| 15 to 24 Years | 101 (1.2%) | $0 |
| 25 to 44 Years | 3,155 (36.7%) | $91,299 |
| 45 to 64 Years | 3,474 (40.4%) | $88,357 |
| 65+ Years | 1,870 (21.7%) | $57,612 |
| Total | 8,600 (100.0%) | $83,852 |
Poverty in Bear
Income Below Poverty by Sex and Age in Bear
With 6.6% poverty level for males and 12.0% for females among the residents of Bear, 16 and 17 year old males and 12 to 14 year old females are the most vulnerable to poverty, with 77 males (28.9%) and 93 females (36.5%) in their respective age groups living below the poverty level.
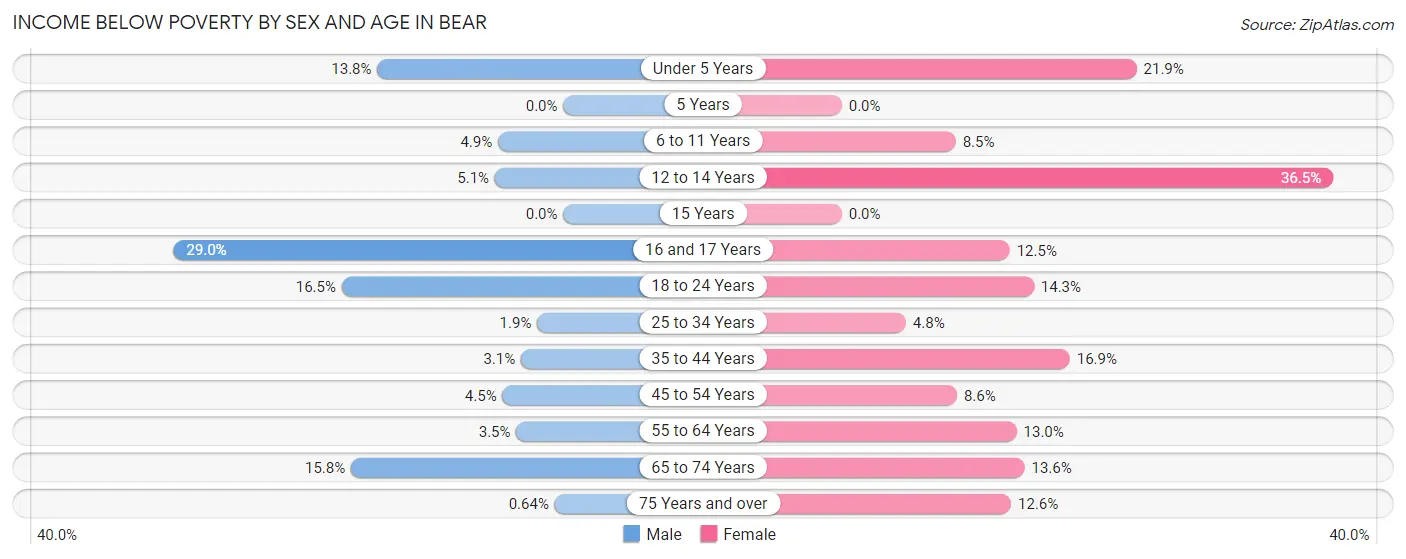
| Age Bracket | Male | Female |
| Under 5 Years | 96 (13.8%) | 109 (21.9%) |
| 5 Years | 0 (0.0%) | 0 (0.0%) |
| 6 to 11 Years | 45 (4.9%) | 92 (8.5%) |
| 12 to 14 Years | 18 (5.1%) | 93 (36.5%) |
| 15 Years | 0 (0.0%) | 0 (0.0%) |
| 16 and 17 Years | 77 (28.9%) | 47 (12.5%) |
| 18 to 24 Years | 165 (16.5%) | 161 (14.3%) |
| 25 to 34 Years | 35 (1.9%) | 89 (4.8%) |
| 35 to 44 Years | 57 (3.1%) | 240 (16.9%) |
| 45 to 54 Years | 71 (4.5%) | 117 (8.6%) |
| 55 to 64 Years | 47 (3.5%) | 208 (13.0%) |
| 65 to 74 Years | 134 (15.8%) | 181 (13.6%) |
| 75 Years and over | 2 (0.6%) | 70 (12.6%) |
| Total | 747 (6.6%) | 1,407 (12.0%) |
Income Above Poverty by Sex and Age in Bear
According to the poverty statistics in Bear, males aged 5 years and females aged 5 years are the age groups that are most secure financially, with 100.0% of males and 100.0% of females in these age groups living above the poverty line.
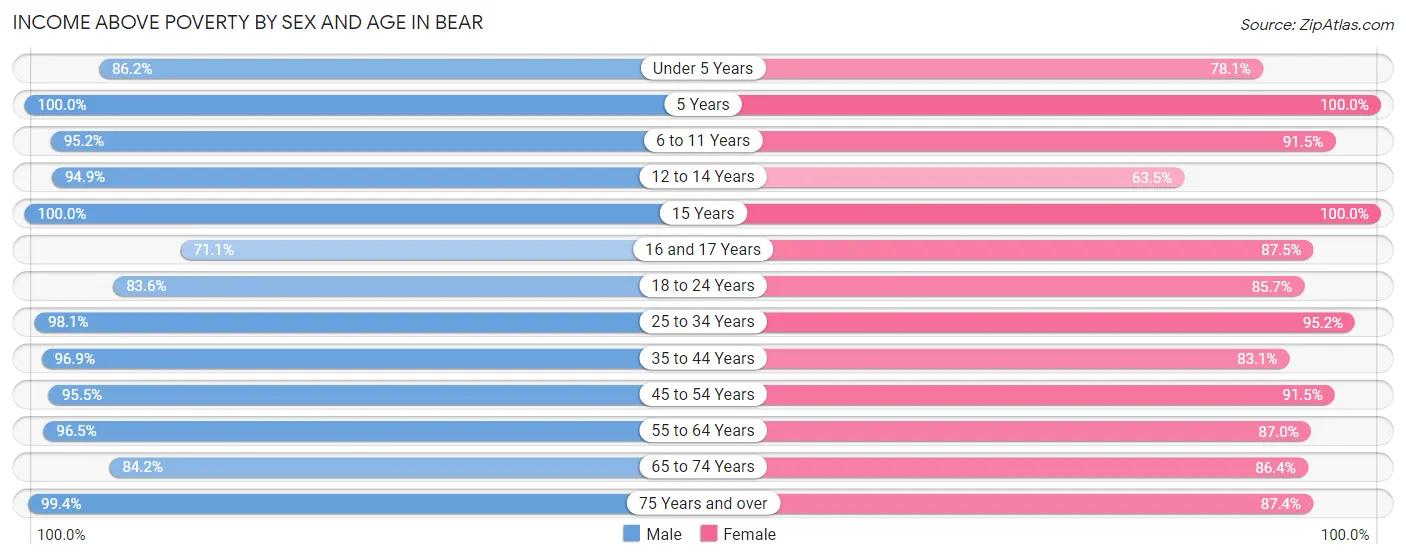
| Age Bracket | Male | Female |
| Under 5 Years | 599 (86.2%) | 389 (78.1%) |
| 5 Years | 254 (100.0%) | 114 (100.0%) |
| 6 to 11 Years | 883 (95.2%) | 995 (91.5%) |
| 12 to 14 Years | 336 (94.9%) | 162 (63.5%) |
| 15 Years | 110 (100.0%) | 127 (100.0%) |
| 16 and 17 Years | 189 (71.1%) | 330 (87.5%) |
| 18 to 24 Years | 838 (83.6%) | 968 (85.7%) |
| 25 to 34 Years | 1,765 (98.1%) | 1,780 (95.2%) |
| 35 to 44 Years | 1,760 (96.9%) | 1,178 (83.1%) |
| 45 to 54 Years | 1,500 (95.5%) | 1,251 (91.4%) |
| 55 to 64 Years | 1,299 (96.5%) | 1,395 (87.0%) |
| 65 to 74 Years | 716 (84.2%) | 1,153 (86.4%) |
| 75 Years and over | 312 (99.4%) | 487 (87.4%) |
| Total | 10,561 (93.4%) | 10,329 (88.0%) |
Income Below Poverty Among Married-Couple Families in Bear
The poverty statistics for married-couple families in Bear show that 7.0% or 209 of the total 2,978 families live below the poverty line. Families with 3 or 4 children have the highest poverty rate of 12.1%, comprising of 35 families. On the other hand, families with 5 or more children have the lowest poverty rate of 0.0%, which includes 0 families.
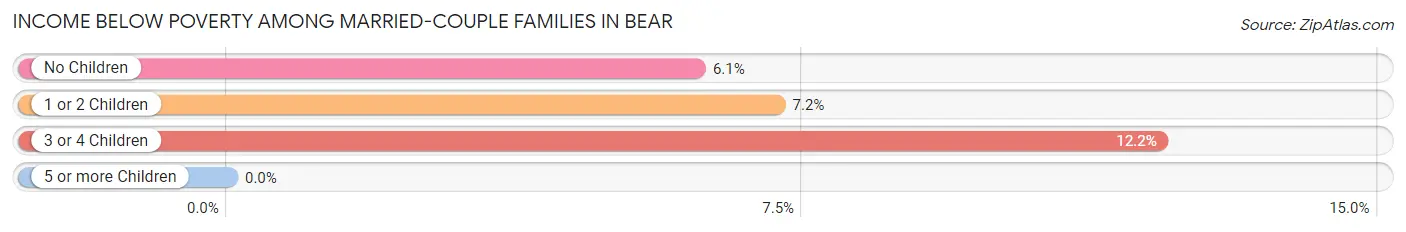
| Children | Above Poverty | Below Poverty |
| No Children | 1,551 (93.9%) | 101 (6.1%) |
| 1 or 2 Children | 948 (92.8%) | 73 (7.1%) |
| 3 or 4 Children | 253 (87.8%) | 35 (12.1%) |
| 5 or more Children | 17 (100.0%) | 0 (0.0%) |
| Total | 2,769 (93.0%) | 209 (7.0%) |
Income Below Poverty Among Single-Parent Households in Bear
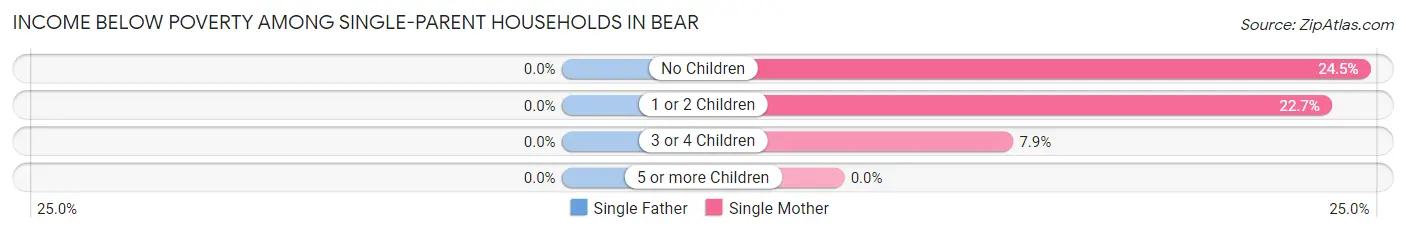
| Children | Single Father | Single Mother |
| No Children | 0 (0.0%) | 128 (24.5%) |
| 1 or 2 Children | 0 (0.0%) | 142 (22.7%) |
| 3 or 4 Children | 0 (0.0%) | 11 (7.9%) |
| 5 or more Children | 0 (0.0%) | 0 (0.0%) |
| Total | 0 (0.0%) | 281 (21.8%) |
Income Below Poverty Among Married-Couple vs Single-Parent Households in Bear
The poverty data for Bear shows that 209 of the married-couple family households (7.0%) and 281 of the single-parent households (14.0%) are living below the poverty level. Within the married-couple family households, those with 3 or 4 children have the highest poverty rate, with 35 households (12.1%) falling below the poverty line. Among the single-parent households, those with no children have the highest poverty rate, with 128 household (15.0%) living below poverty.
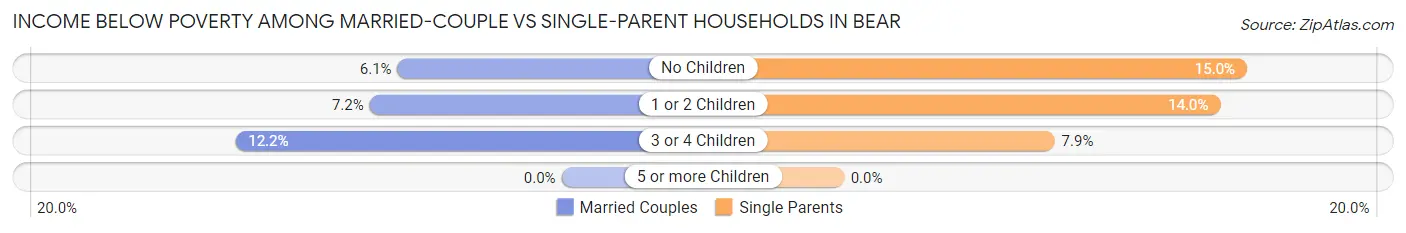
| Children | Married-Couple Families | Single-Parent Households |
| No Children | 101 (6.1%) | 128 (15.0%) |
| 1 or 2 Children | 73 (7.1%) | 142 (14.0%) |
| 3 or 4 Children | 35 (12.1%) | 11 (7.9%) |
| 5 or more Children | 0 (0.0%) | 0 (0.0%) |
| Total | 209 (7.0%) | 281 (14.0%) |
Race in Bear
The most populous races in Bear are Black / African American (8,947 | 38.8%), White / Caucasian (8,307 | 36.0%), and Hispanic or Latino (5,333 | 23.1%).
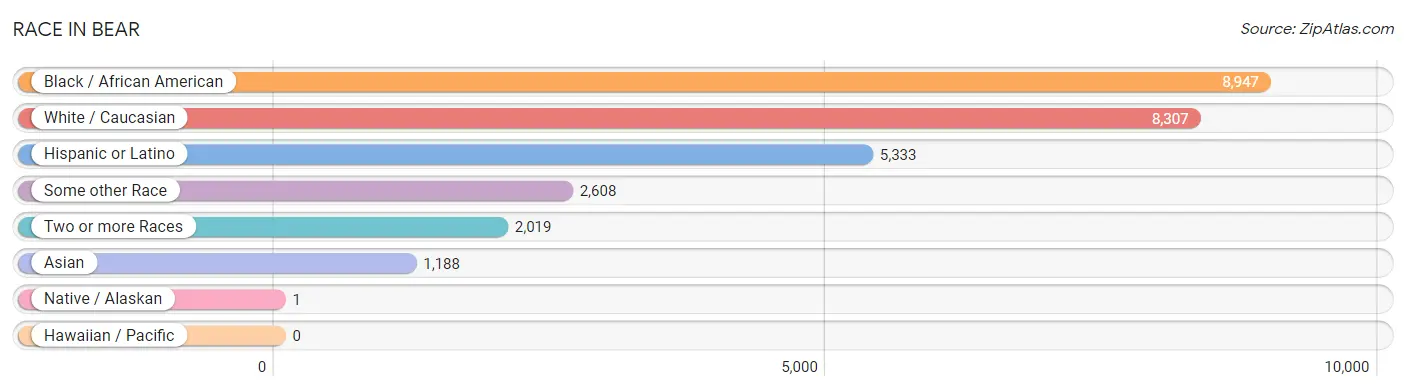
| Race | # Population | % Population |
| Asian | 1,188 | 5.1% |
| Black / African American | 8,947 | 38.8% |
| Hawaiian / Pacific | 0 | 0.0% |
| Hispanic or Latino | 5,333 | 23.1% |
| Native / Alaskan | 1 | 0.0% |
| White / Caucasian | 8,307 | 36.0% |
| Two or more Races | 2,019 | 8.7% |
| Some other Race | 2,608 | 11.3% |
| Total | 23,070 | 100.0% |
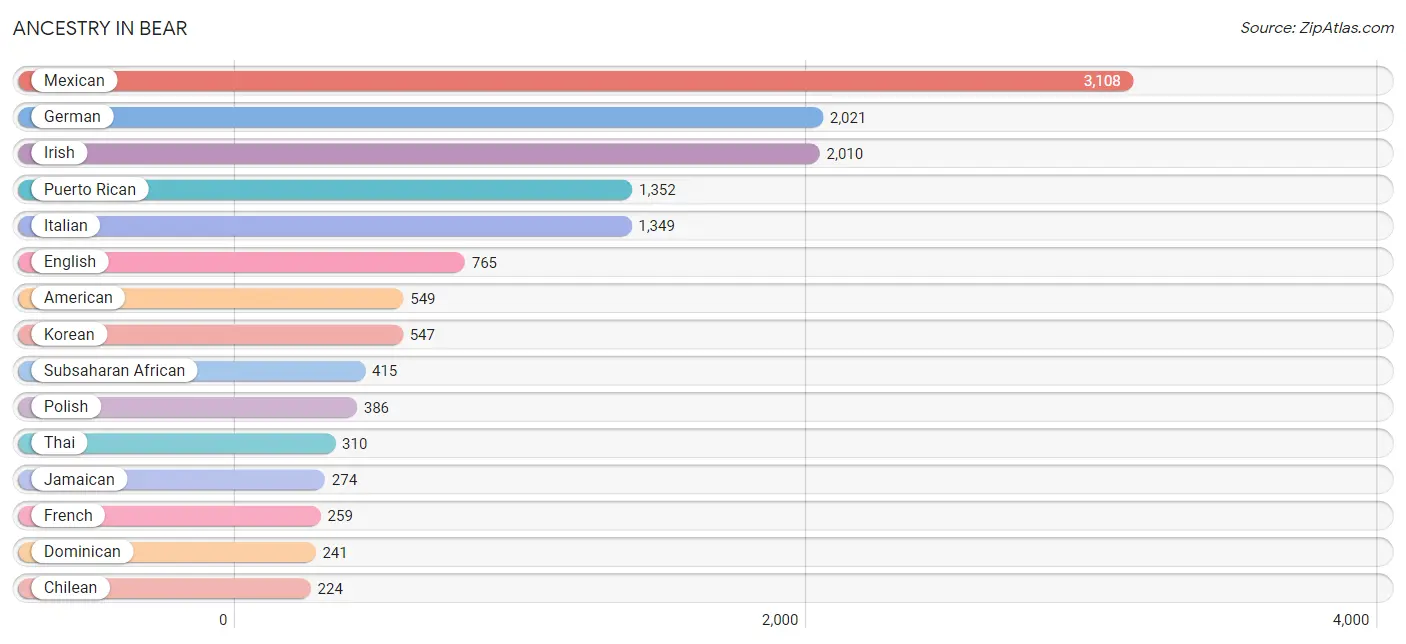
Ancestry in Bear
The most populous ancestries reported in Bear are Mexican (3,108 | 13.5%), German (2,021 | 8.8%), Irish (2,010 | 8.7%), Puerto Rican (1,352 | 5.9%), and Italian (1,349 | 5.9%), together accounting for 42.6% of all Bear residents.
| Ancestry | # Population | % Population |
| Afghan | 97 | 0.4% |
| African | 68 | 0.3% |
| American | 549 | 2.4% |
| Australian | 47 | 0.2% |
| Bhutanese | 54 | 0.2% |
| British | 100 | 0.4% |
| Bulgarian | 60 | 0.3% |
| Canadian | 2 | 0.0% |
| Central American | 83 | 0.4% |
| Chilean | 224 | 1.0% |
| Choctaw | 91 | 0.4% |
| Costa Rican | 55 | 0.2% |
| Cuban | 67 | 0.3% |
| Danish | 32 | 0.1% |
| Dominican | 241 | 1.0% |
| Dutch | 92 | 0.4% |
| Eastern European | 167 | 0.7% |
| English | 765 | 3.3% |
| European | 17 | 0.1% |
| Filipino | 65 | 0.3% |
| Finnish | 11 | 0.1% |
| French | 259 | 1.1% |
| French Canadian | 16 | 0.1% |
| German | 2,021 | 8.8% |
| German Russian | 14 | 0.1% |
| Ghanaian | 121 | 0.5% |
| Haitian | 199 | 0.9% |
| Hungarian | 14 | 0.1% |
| Indian (Asian) | 58 | 0.3% |
| Irish | 2,010 | 8.7% |
| Italian | 1,349 | 5.9% |
| Jamaican | 274 | 1.2% |
| Kenyan | 7 | 0.0% |
| Korean | 547 | 2.4% |
| Lithuanian | 12 | 0.1% |
| Mexican | 3,108 | 13.5% |
| Nigerian | 196 | 0.9% |
| Northern European | 12 | 0.1% |
| Norwegian | 39 | 0.2% |
| Panamanian | 28 | 0.1% |
| Pennsylvania German | 15 | 0.1% |
| Polish | 386 | 1.7% |
| Portuguese | 18 | 0.1% |
| Puerto Rican | 1,352 | 5.9% |
| Romanian | 28 | 0.1% |
| Russian | 135 | 0.6% |
| Scandinavian | 21 | 0.1% |
| Scotch-Irish | 55 | 0.2% |
| Scottish | 38 | 0.2% |
| Slovak | 13 | 0.1% |
| South American | 224 | 1.0% |
| Spaniard | 156 | 0.7% |
| Spanish | 86 | 0.4% |
| Sri Lankan | 77 | 0.3% |
| Subsaharan African | 415 | 1.8% |
| Swedish | 81 | 0.4% |
| Thai | 310 | 1.3% |
| Trinidadian and Tobagonian | 83 | 0.4% |
| U.S. Virgin Islander | 1 | 0.0% |
| Ukrainian | 87 | 0.4% |
| Welsh | 20 | 0.1% | View All 61 Rows |
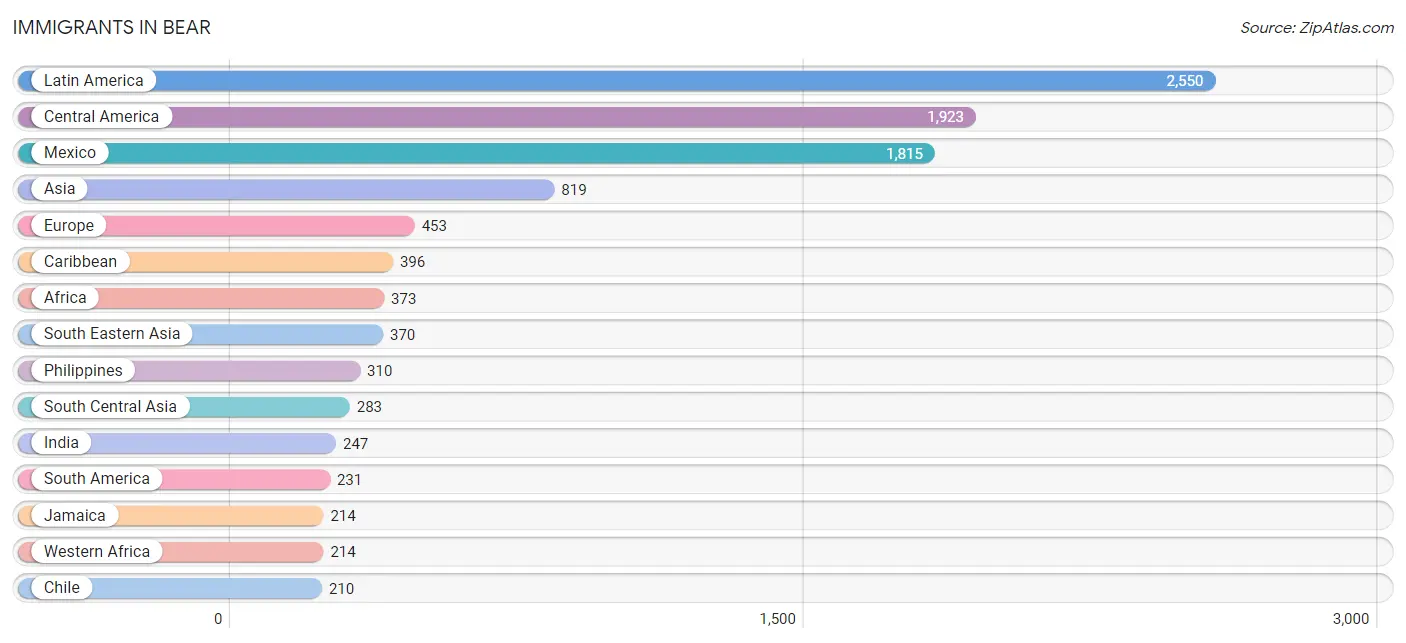
Immigrants in Bear
The most numerous immigrant groups reported in Bear came from Latin America (2,550 | 11.1%), Central America (1,923 | 8.3%), Mexico (1,815 | 7.9%), Asia (819 | 3.5%), and Europe (453 | 2.0%), together accounting for 32.8% of all Bear residents.
| Immigration Origin | # Population | % Population |
| Afghanistan | 36 | 0.2% |
| Africa | 373 | 1.6% |
| Asia | 819 | 3.5% |
| Australia | 27 | 0.1% |
| Brazil | 21 | 0.1% |
| Bulgaria | 60 | 0.3% |
| Canada | 2 | 0.0% |
| Caribbean | 396 | 1.7% |
| Central America | 1,923 | 8.3% |
| Chile | 210 | 0.9% |
| China | 128 | 0.5% |
| Costa Rica | 80 | 0.4% |
| Dominican Republic | 43 | 0.2% |
| Eastern Africa | 159 | 0.7% |
| Eastern Asia | 157 | 0.7% |
| Eastern Europe | 136 | 0.6% |
| Europe | 453 | 2.0% |
| Germany | 44 | 0.2% |
| Ghana | 133 | 0.6% |
| Haiti | 55 | 0.2% |
| India | 247 | 1.1% |
| Italy | 89 | 0.4% |
| Jamaica | 214 | 0.9% |
| Japan | 29 | 0.1% |
| Kenya | 159 | 0.7% |
| Latin America | 2,550 | 11.1% |
| Liberia | 23 | 0.1% |
| Mexico | 1,815 | 7.9% |
| Netherlands | 159 | 0.7% |
| Nigeria | 58 | 0.3% |
| Oceania | 27 | 0.1% |
| Panama | 28 | 0.1% |
| Philippines | 310 | 1.3% |
| Russia | 51 | 0.2% |
| South America | 231 | 1.0% |
| South Central Asia | 283 | 1.2% |
| South Eastern Asia | 370 | 1.6% |
| Southern Europe | 114 | 0.5% |
| Spain | 25 | 0.1% |
| Taiwan | 65 | 0.3% |
| Trinidad and Tobago | 83 | 0.4% |
| Turkey | 9 | 0.0% |
| Ukraine | 25 | 0.1% |
| Vietnam | 60 | 0.3% |
| Western Africa | 214 | 0.9% |
| Western Asia | 9 | 0.0% |
| Western Europe | 203 | 0.9% | View All 47 Rows |
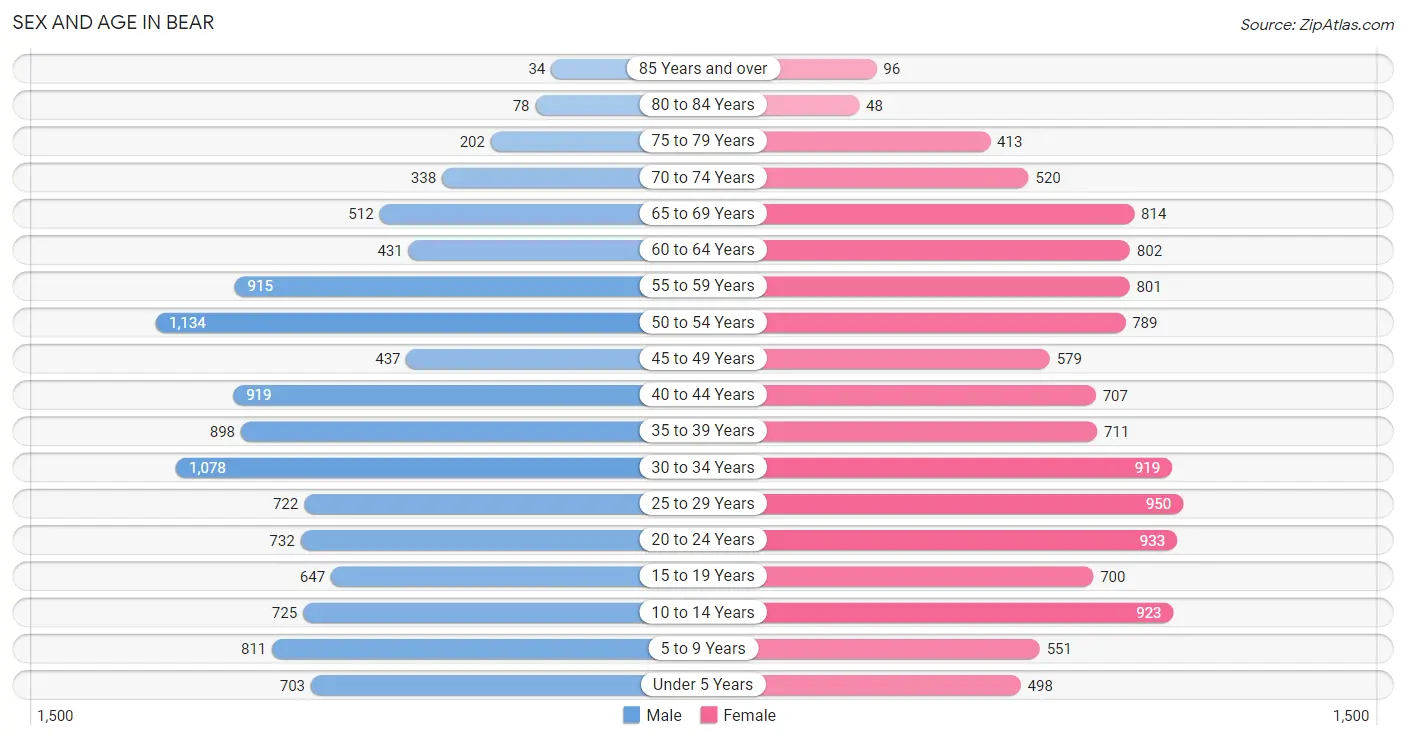
Sex and Age in Bear
Sex and Age in Bear
The most populous age groups in Bear are 50 to 54 Years (1,134 | 10.0%) for men and 25 to 29 Years (950 | 8.1%) for women.
| Age Bracket | Male | Female |
| Under 5 Years | 703 (6.2%) | 498 (4.2%) |
| 5 to 9 Years | 811 (7.2%) | 551 (4.7%) |
| 10 to 14 Years | 725 (6.4%) | 923 (7.9%) |
| 15 to 19 Years | 647 (5.7%) | 700 (6.0%) |
| 20 to 24 Years | 732 (6.5%) | 933 (7.9%) |
| 25 to 29 Years | 722 (6.4%) | 950 (8.1%) |
| 30 to 34 Years | 1,078 (9.5%) | 919 (7.8%) |
| 35 to 39 Years | 898 (7.9%) | 711 (6.0%) |
| 40 to 44 Years | 919 (8.1%) | 707 (6.0%) |
| 45 to 49 Years | 437 (3.9%) | 579 (4.9%) |
| 50 to 54 Years | 1,134 (10.0%) | 789 (6.7%) |
| 55 to 59 Years | 915 (8.1%) | 801 (6.8%) |
| 60 to 64 Years | 431 (3.8%) | 802 (6.8%) |
| 65 to 69 Years | 512 (4.5%) | 814 (6.9%) |
| 70 to 74 Years | 338 (3.0%) | 520 (4.4%) |
| 75 to 79 Years | 202 (1.8%) | 413 (3.5%) |
| 80 to 84 Years | 78 (0.7%) | 48 (0.4%) |
| 85 Years and over | 34 (0.3%) | 96 (0.8%) |
| Total | 11,316 (100.0%) | 11,754 (100.0%) |
Families and Households in Bear
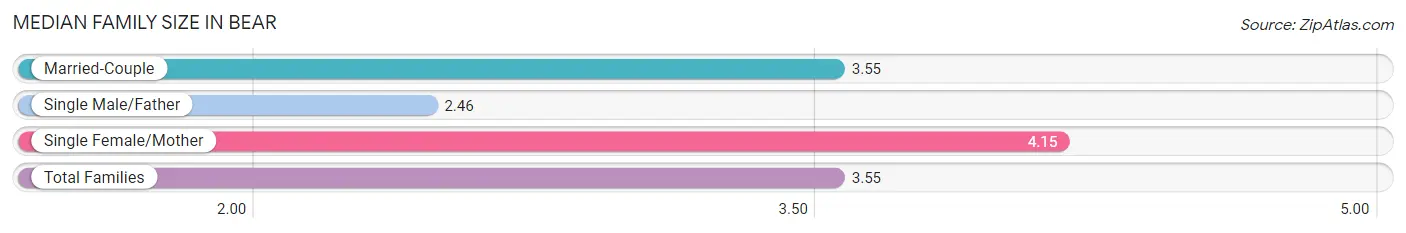
Median Family Size in Bear
The median family size in Bear is 3.55 persons per family, with single female/mother families (1,287 | 25.8%) accounting for the largest median family size of 4.15 persons per family. On the other hand, single male/father families (717 | 14.4%) represent the smallest median family size with 2.46 persons per family.
| Family Type | # Families | Family Size |
| Married-Couple | 2,978 (59.8%) | 3.55 |
| Single Male/Father | 717 (14.4%) | 2.46 |
| Single Female/Mother | 1,287 (25.8%) | 4.15 |
| Total Families | 4,982 (100.0%) | 3.55 |
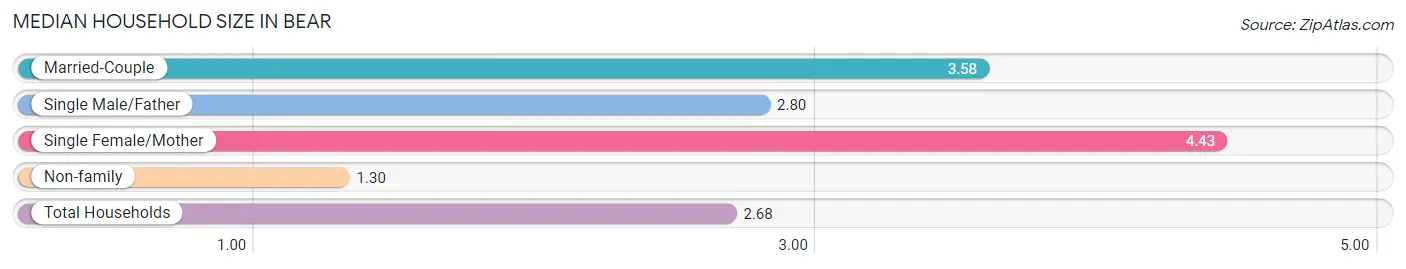
Median Household Size in Bear
The median household size in Bear is 2.68 persons per household, with single female/mother households (1,287 | 15.0%) accounting for the largest median household size of 4.43 persons per household. non-family households (3,618 | 42.1%) represent the smallest median household size with 1.30 persons per household.
| Household Type | # Households | Household Size |
| Married-Couple | 2,978 (34.6%) | 3.58 |
| Single Male/Father | 717 (8.3%) | 2.80 |
| Single Female/Mother | 1,287 (15.0%) | 4.43 |
| Non-family | 3,618 (42.1%) | 1.30 |
| Total Households | 8,600 (100.0%) | 2.68 |
Household Size by Marriage Status in Bear
Out of a total of 8,600 households in Bear, 4,982 (57.9%) are family households, while 3,618 (42.1%) are nonfamily households. The most numerous type of family households are 2-person households, comprising 1,734, and the most common type of nonfamily households are 1-person households, comprising 2,657.
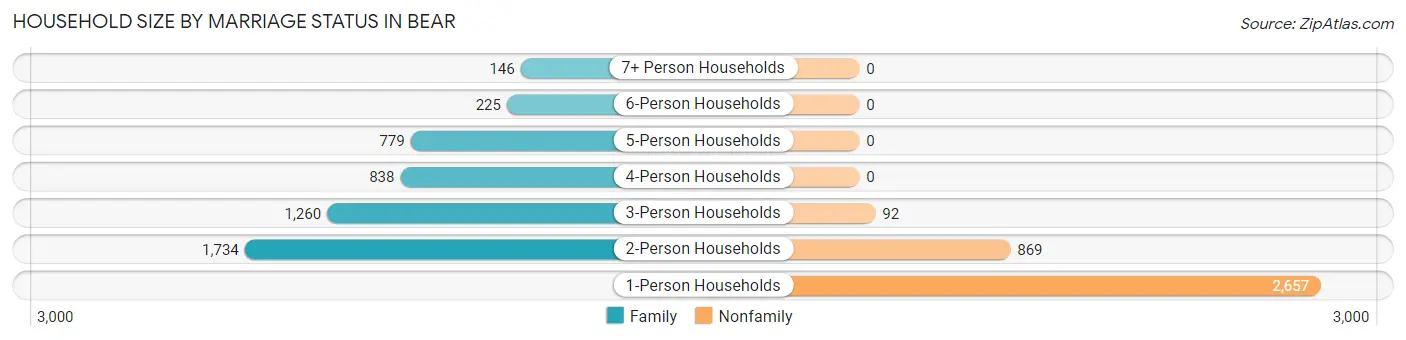
| Household Size | Family Households | Nonfamily Households |
| 1-Person Households | - | 2,657 (30.9%) |
| 2-Person Households | 1,734 (20.2%) | 869 (10.1%) |
| 3-Person Households | 1,260 (14.6%) | 92 (1.1%) |
| 4-Person Households | 838 (9.7%) | 0 (0.0%) |
| 5-Person Households | 779 (9.1%) | 0 (0.0%) |
| 6-Person Households | 225 (2.6%) | 0 (0.0%) |
| 7+ Person Households | 146 (1.7%) | 0 (0.0%) |
| Total | 4,982 (57.9%) | 3,618 (42.1%) |
Female Fertility in Bear
Fertility by Age in Bear
Average fertility rate in Bear is 32.0 births per 1,000 women. Women in the age bracket of 20 to 34 years have the highest fertility rate with 56.0 births per 1,000 women. Women in the age bracket of 20 to 34 years acount for 84.9% of all women with births.
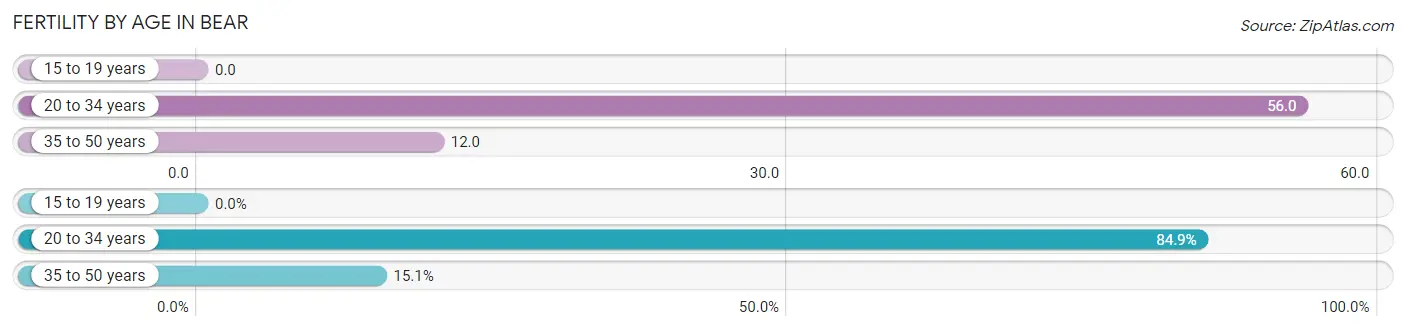
| Age Bracket | Women with Births | Births / 1,000 Women |
| 15 to 19 years | 0 (0.0%) | 0.0 |
| 20 to 34 years | 157 (84.9%) | 56.0 |
| 35 to 50 years | 28 (15.1%) | 12.0 |
| Total | 185 (100.0%) | 32.0 |
Fertility by Age by Marriage Status in Bear
94.1% of women with births (185) in Bear are married. The highest percentage of unmarried women with births falls into 20 to 34 years age bracket with 7.0% of them unmarried at the time of birth, while the lowest percentage of unmarried women with births belong to 35 to 50 years age bracket with 0.0% of them unmarried.
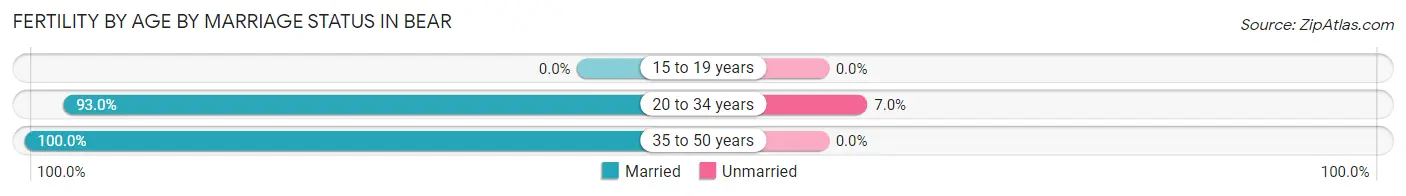
| Age Bracket | Married | Unmarried |
| 15 to 19 years | 0 (0.0%) | 0 (0.0%) |
| 20 to 34 years | 146 (93.0%) | 11 (7.0%) |
| 35 to 50 years | 28 (100.0%) | 0 (0.0%) |
| Total | 174 (94.1%) | 11 (5.9%) |
Fertility by Education in Bear
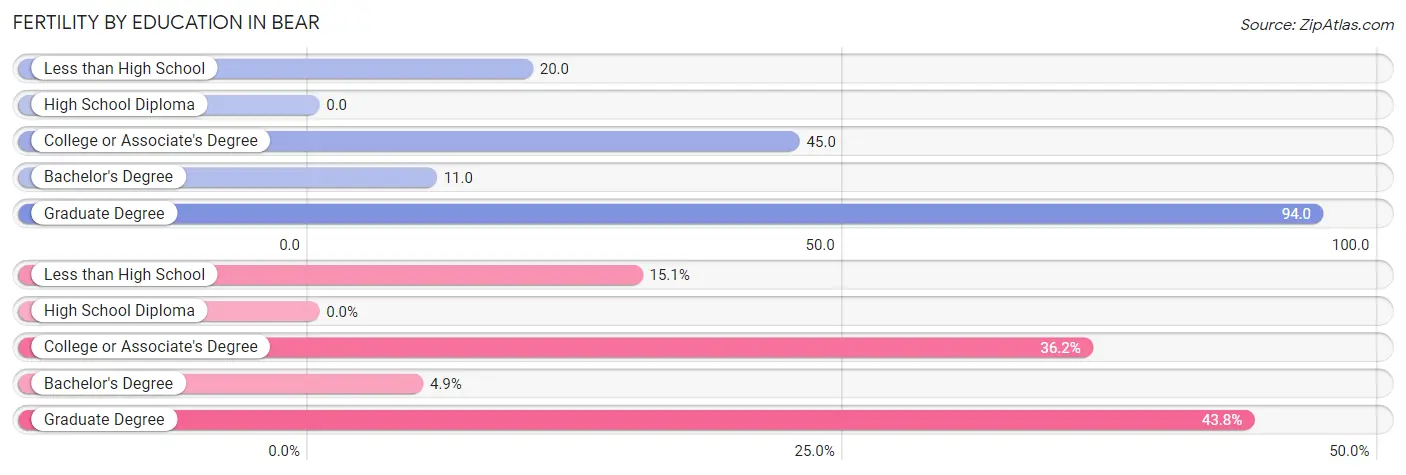
| Educational Attainment | Women with Births | Births / 1,000 Women |
| Less than High School | 28 (15.1%) | 20.0 |
| High School Diploma | 0 (0.0%) | 0.0 |
| College or Associate's Degree | 67 (36.2%) | 45.0 |
| Bachelor's Degree | 9 (4.9%) | 11.0 |
| Graduate Degree | 81 (43.8%) | 94.0 |
| Total | 185 (100.0%) | 32.0 |
Fertility by Education by Marriage Status in Bear
5.9% of women with births in Bear are unmarried. Women with the educational attainment of less than high school are most likely to be married with 100.0% of them married at childbirth, while women with the educational attainment of college or associate's degree are least likely to be married with 16.4% of them unmarried at childbirth.
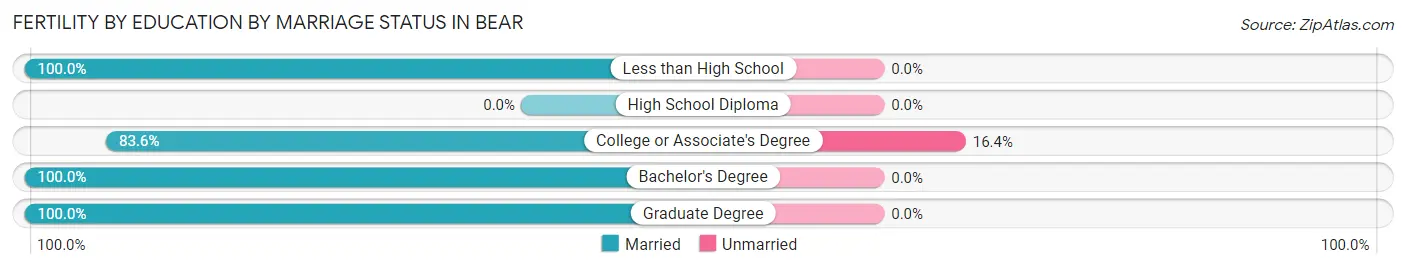
| Educational Attainment | Married | Unmarried |
| Less than High School | 28 (100.0%) | 0 (0.0%) |
| High School Diploma | 0 (0.0%) | 0 (0.0%) |
| College or Associate's Degree | 56 (83.6%) | 11 (16.4%) |
| Bachelor's Degree | 9 (100.0%) | 0 (0.0%) |
| Graduate Degree | 81 (100.0%) | 0 (0.0%) |
| Total | 174 (94.1%) | 11 (5.9%) |
Employment Characteristics in Bear
Employment by Class of Employer in Bear
Among the 12,215 employed individuals in Bear, private company employees (8,691 | 71.2%), not-for-profit organizations (1,150 | 9.4%), and state government employees (826 | 6.8%) make up the most common classes of employment.
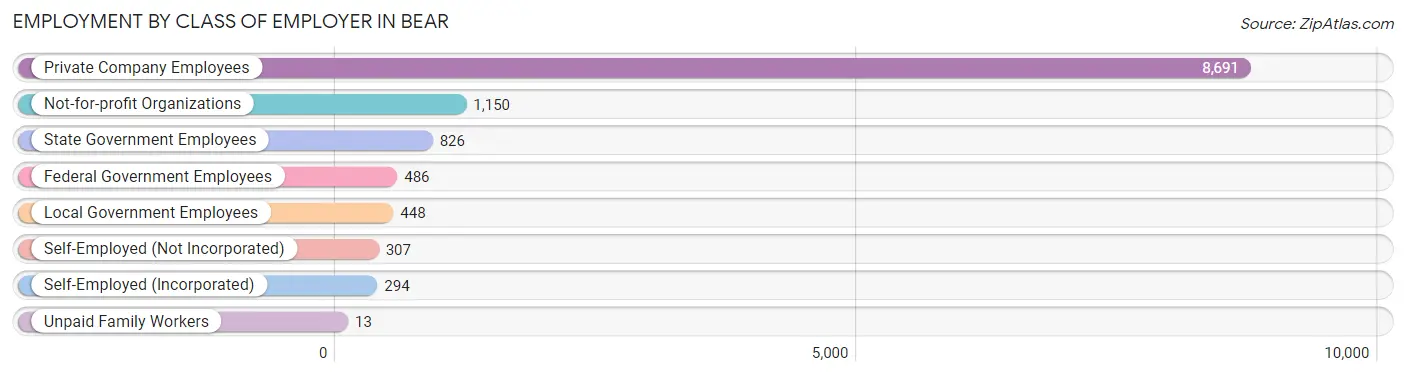
| Employer Class | # Employees | % Employees |
| Private Company Employees | 8,691 | 71.2% |
| Self-Employed (Incorporated) | 294 | 2.4% |
| Self-Employed (Not Incorporated) | 307 | 2.5% |
| Not-for-profit Organizations | 1,150 | 9.4% |
| Local Government Employees | 448 | 3.7% |
| State Government Employees | 826 | 6.8% |
| Federal Government Employees | 486 | 4.0% |
| Unpaid Family Workers | 13 | 0.1% |
| Total | 12,215 | 100.0% |
Employment Status by Age in Bear
According to the labor force statistics for Bear, out of the total population over 16 years of age (18,622), 74.0% or 13,780 individuals are in the labor force, with 7.7% or 1,061 of them unemployed. The age group with the highest labor force participation rate is 20 to 24 years, with 94.4% or 1,572 individuals in the labor force. Within the labor force, the 16 to 19 years age range has the highest percentage of unemployed individuals, with 24.0% or 145 of them being unemployed.
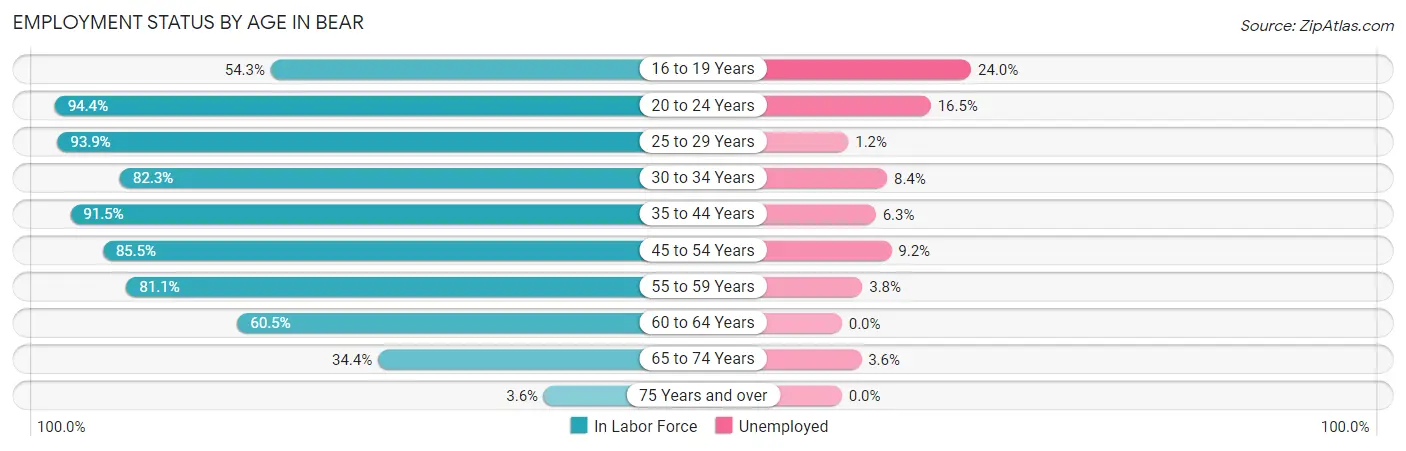
| Age Bracket | In Labor Force | Unemployed |
| 16 to 19 Years | 603 (54.3%) | 145 (24.0%) |
| 20 to 24 Years | 1,572 (94.4%) | 259 (16.5%) |
| 25 to 29 Years | 1,570 (93.9%) | 19 (1.2%) |
| 30 to 34 Years | 1,644 (82.3%) | 138 (8.4%) |
| 35 to 44 Years | 2,960 (91.5%) | 186 (6.3%) |
| 45 to 54 Years | 2,513 (85.5%) | 231 (9.2%) |
| 55 to 59 Years | 1,392 (81.1%) | 53 (3.8%) |
| 60 to 64 Years | 746 (60.5%) | 0 (0.0%) |
| 65 to 74 Years | 751 (34.4%) | 27 (3.6%) |
| 75 Years and over | 31 (3.6%) | 0 (0.0%) |
| Total | 13,780 (74.0%) | 1,061 (7.7%) |
Employment Status by Educational Attainment in Bear
According to labor force statistics for Bear, 84.6% of individuals (10,822) out of the total population between 25 and 64 years of age (12,792) are in the labor force, with 5.8% or 628 of them being unemployed. The group with the highest labor force participation rate are those with the educational attainment of bachelor's degree or higher, with 89.8% or 3,885 individuals in the labor force. Within the labor force, individuals with high school diploma education have the highest percentage of unemployment, with 8.1% or 265 of them being unemployed.
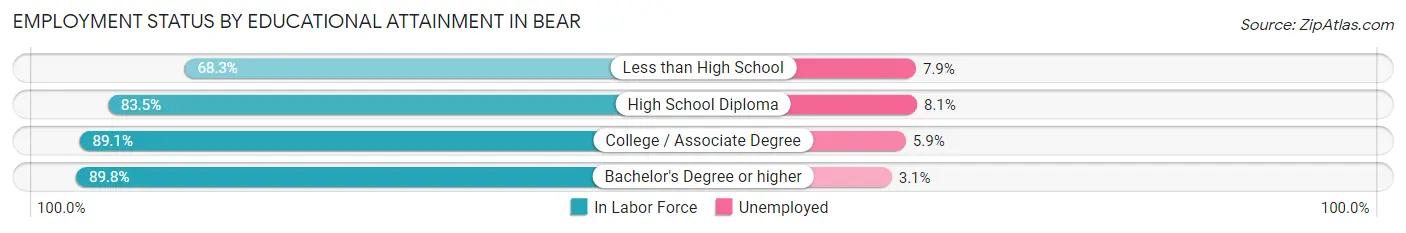
| Educational Attainment | In Labor Force | Unemployed |
| Less than High School | 1,269 (68.3%) | 147 (7.9%) |
| High School Diploma | 3,269 (83.5%) | 317 (8.1%) |
| College / Associate Degree | 2,399 (89.1%) | 159 (5.9%) |
| Bachelor's Degree or higher | 3,885 (89.8%) | 134 (3.1%) |
| Total | 10,822 (84.6%) | 742 (5.8%) |
Employment Occupations by Sex in Bear
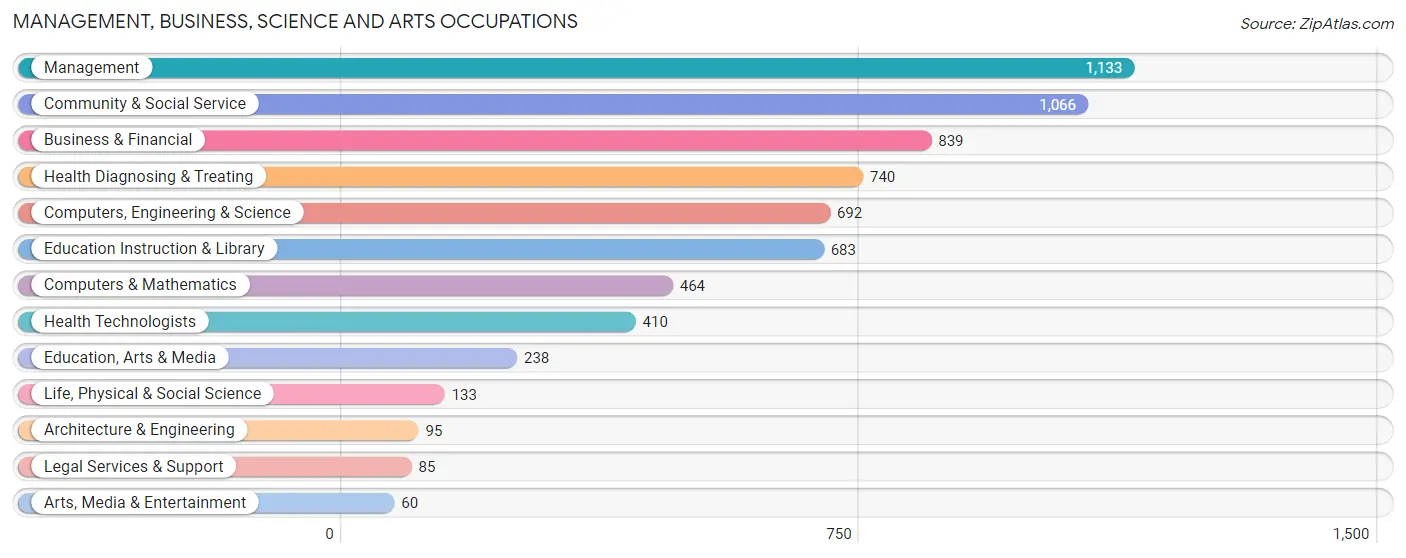
Management, Business, Science and Arts Occupations
The most common Management, Business, Science and Arts occupations in Bear are Management (1,133 | 9.0%), Community & Social Service (1,066 | 8.5%), Business & Financial (839 | 6.7%), Health Diagnosing & Treating (740 | 5.9%), and Computers, Engineering & Science (692 | 5.5%).
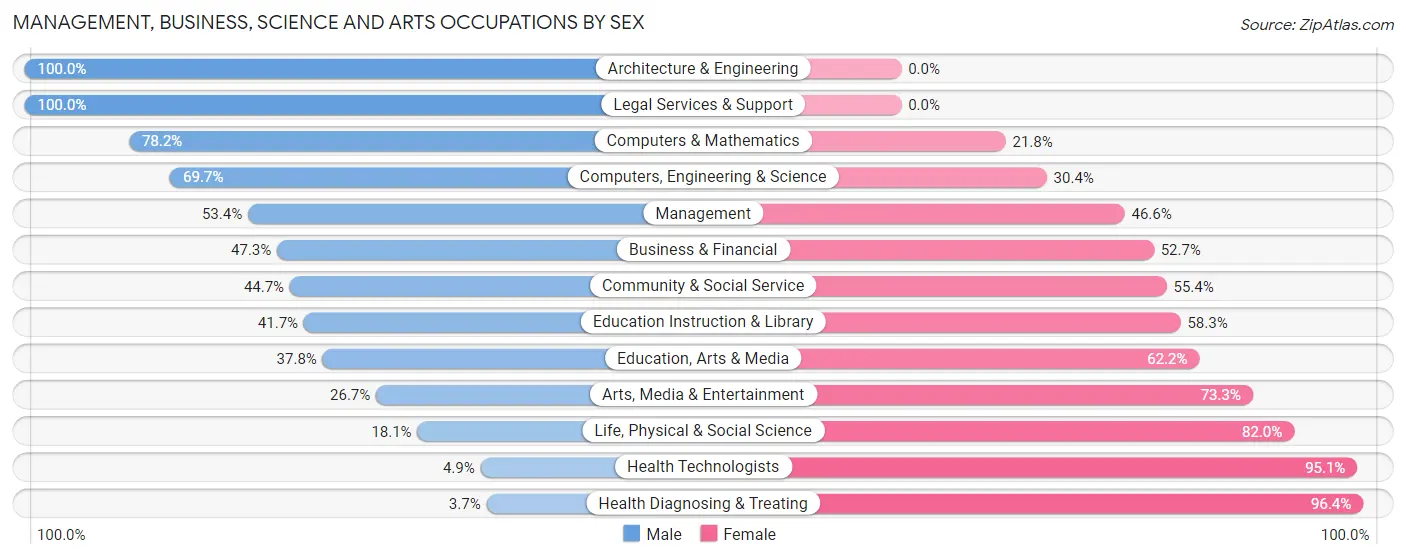
Management, Business, Science and Arts Occupations by Sex
Within the Management, Business, Science and Arts occupations in Bear, the most male-oriented occupations are Architecture & Engineering (100.0%), Legal Services & Support (100.0%), and Computers & Mathematics (78.2%), while the most female-oriented occupations are Health Diagnosing & Treating (96.4%), Health Technologists (95.1%), and Life, Physical & Social Science (82.0%).
| Occupation | Male | Female |
| Management | 605 (53.4%) | 528 (46.6%) |
| Business & Financial | 397 (47.3%) | 442 (52.7%) |
| Computers, Engineering & Science | 482 (69.7%) | 210 (30.3%) |
| Computers & Mathematics | 363 (78.2%) | 101 (21.8%) |
| Architecture & Engineering | 95 (100.0%) | 0 (0.0%) |
| Life, Physical & Social Science | 24 (18.0%) | 109 (82.0%) |
| Community & Social Service | 476 (44.7%) | 590 (55.3%) |
| Education, Arts & Media | 90 (37.8%) | 148 (62.2%) |
| Legal Services & Support | 85 (100.0%) | 0 (0.0%) |
| Education Instruction & Library | 285 (41.7%) | 398 (58.3%) |
| Arts, Media & Entertainment | 16 (26.7%) | 44 (73.3%) |
| Health Diagnosing & Treating | 27 (3.6%) | 713 (96.4%) |
| Health Technologists | 20 (4.9%) | 390 (95.1%) |
| Total (Category) | 1,987 (44.5%) | 2,483 (55.5%) |
| Total (Overall) | 6,362 (50.7%) | 6,177 (49.3%) |
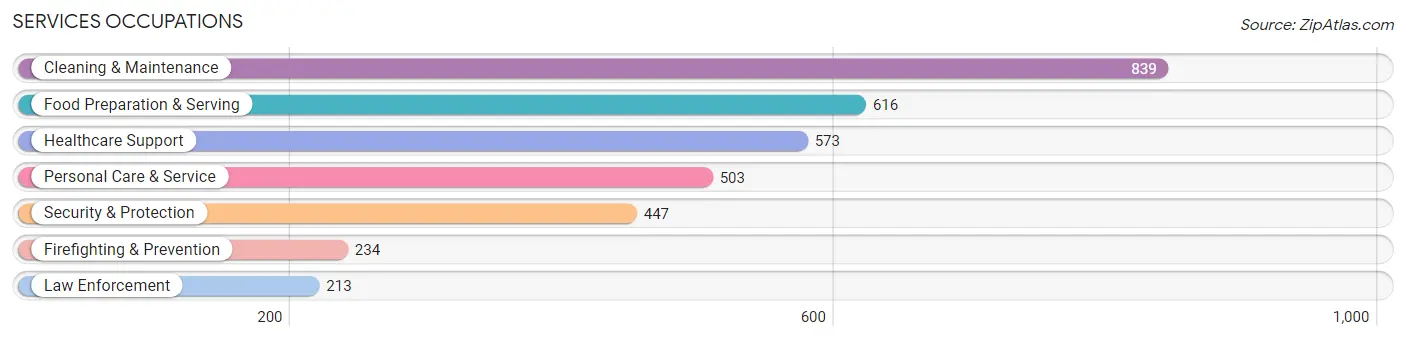
Services Occupations
The most common Services occupations in Bear are Cleaning & Maintenance (839 | 6.7%), Food Preparation & Serving (616 | 4.9%), Healthcare Support (573 | 4.6%), Personal Care & Service (503 | 4.0%), and Security & Protection (447 | 3.6%).
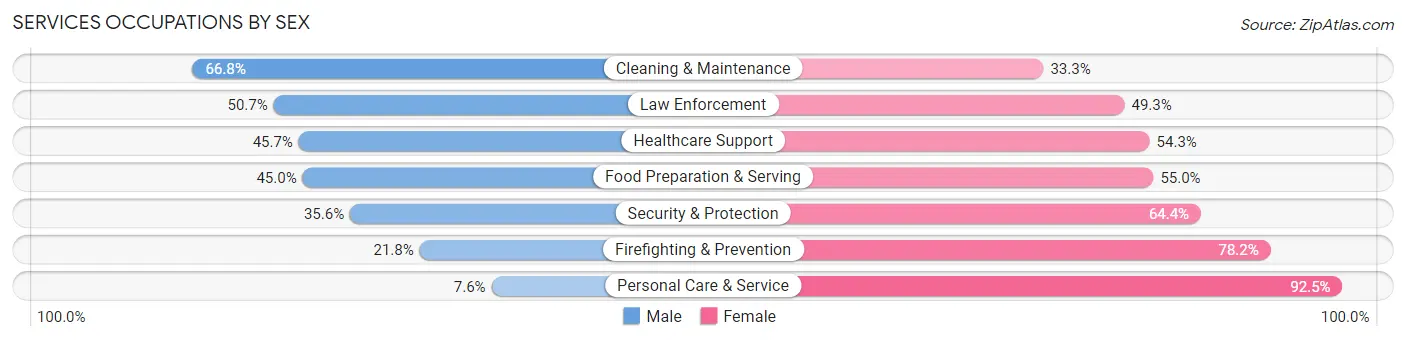
Services Occupations by Sex
Within the Services occupations in Bear, the most male-oriented occupations are Cleaning & Maintenance (66.7%), Law Enforcement (50.7%), and Healthcare Support (45.7%), while the most female-oriented occupations are Personal Care & Service (92.4%), Firefighting & Prevention (78.2%), and Security & Protection (64.4%).
| Occupation | Male | Female |
| Healthcare Support | 262 (45.7%) | 311 (54.3%) |
| Security & Protection | 159 (35.6%) | 288 (64.4%) |
| Firefighting & Prevention | 51 (21.8%) | 183 (78.2%) |
| Law Enforcement | 108 (50.7%) | 105 (49.3%) |
| Food Preparation & Serving | 277 (45.0%) | 339 (55.0%) |
| Cleaning & Maintenance | 560 (66.7%) | 279 (33.3%) |
| Personal Care & Service | 38 (7.5%) | 465 (92.4%) |
| Total (Category) | 1,296 (43.5%) | 1,682 (56.5%) |
| Total (Overall) | 6,362 (50.7%) | 6,177 (49.3%) |
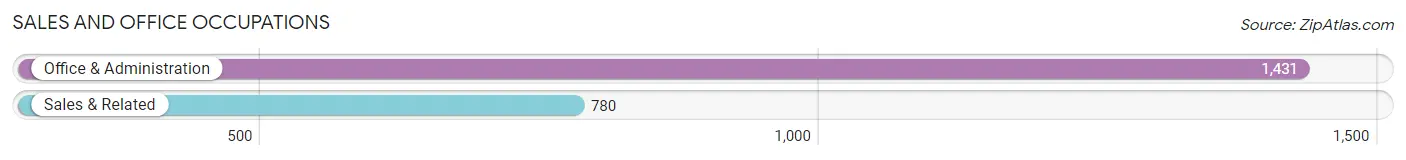
Sales and Office Occupations
The most common Sales and Office occupations in Bear are Office & Administration (1,431 | 11.4%), and Sales & Related (780 | 6.2%).
Sales and Office Occupations by Sex
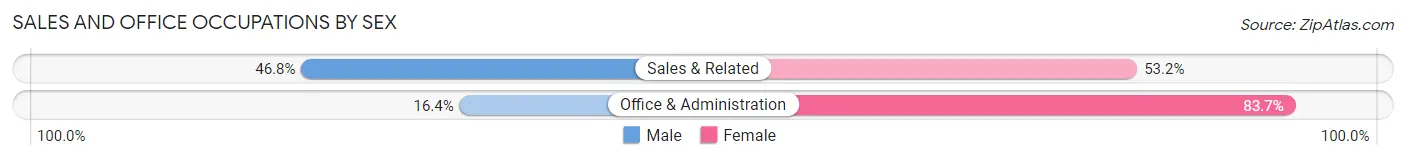
| Occupation | Male | Female |
| Sales & Related | 365 (46.8%) | 415 (53.2%) |
| Office & Administration | 234 (16.4%) | 1,197 (83.7%) |
| Total (Category) | 599 (27.1%) | 1,612 (72.9%) |
| Total (Overall) | 6,362 (50.7%) | 6,177 (49.3%) |
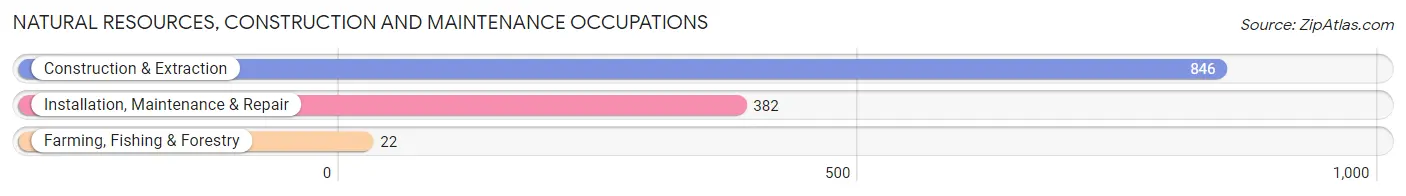
Natural Resources, Construction and Maintenance Occupations
The most common Natural Resources, Construction and Maintenance occupations in Bear are Construction & Extraction (846 | 6.8%), Installation, Maintenance & Repair (382 | 3.0%), and Farming, Fishing & Forestry (22 | 0.2%).
Natural Resources, Construction and Maintenance Occupations by Sex
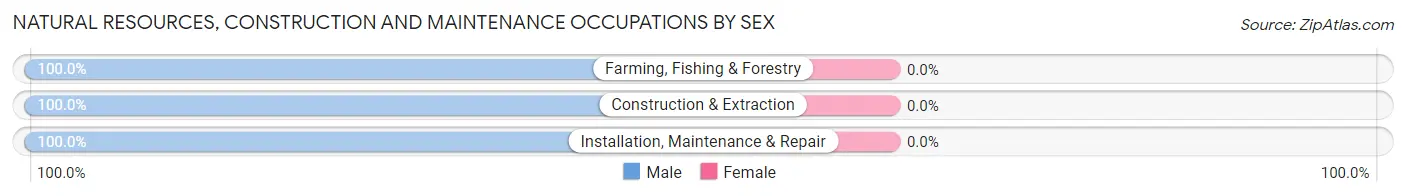
| Occupation | Male | Female |
| Farming, Fishing & Forestry | 22 (100.0%) | 0 (0.0%) |
| Construction & Extraction | 846 (100.0%) | 0 (0.0%) |
| Installation, Maintenance & Repair | 382 (100.0%) | 0 (0.0%) |
| Total (Category) | 1,250 (100.0%) | 0 (0.0%) |
| Total (Overall) | 6,362 (50.7%) | 6,177 (49.3%) |
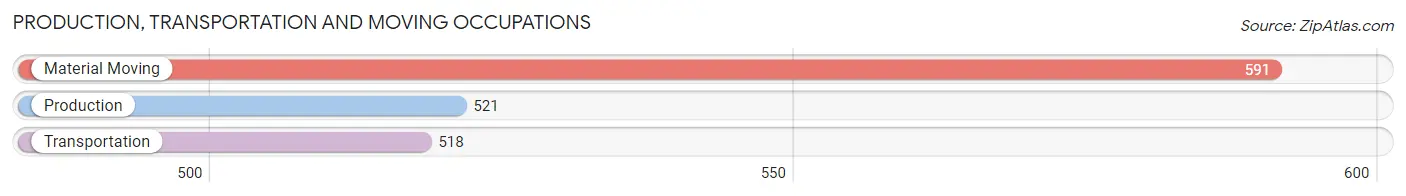
Production, Transportation and Moving Occupations
The most common Production, Transportation and Moving occupations in Bear are Material Moving (591 | 4.7%), Production (521 | 4.2%), and Transportation (518 | 4.1%).
Production, Transportation and Moving Occupations by Sex
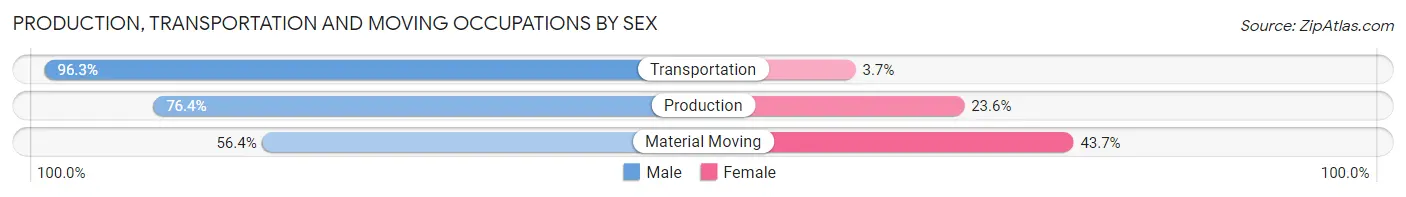
| Occupation | Male | Female |
| Production | 398 (76.4%) | 123 (23.6%) |
| Transportation | 499 (96.3%) | 19 (3.7%) |
| Material Moving | 333 (56.4%) | 258 (43.6%) |
| Total (Category) | 1,230 (75.5%) | 400 (24.5%) |
| Total (Overall) | 6,362 (50.7%) | 6,177 (49.3%) |
Employment Industries by Sex in Bear
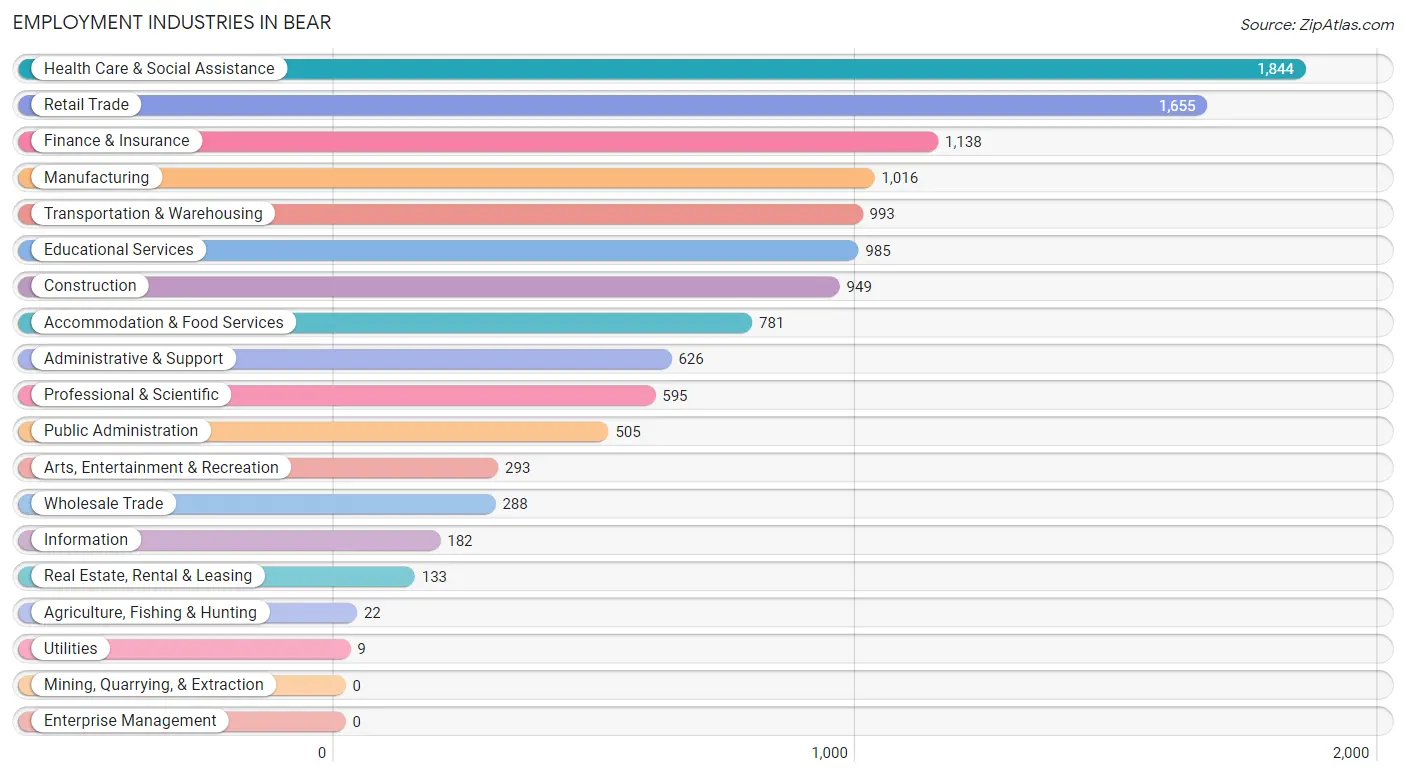
Employment Industries in Bear
The major employment industries in Bear include Health Care & Social Assistance (1,844 | 14.7%), Retail Trade (1,655 | 13.2%), Finance & Insurance (1,138 | 9.1%), Manufacturing (1,016 | 8.1%), and Transportation & Warehousing (993 | 7.9%).
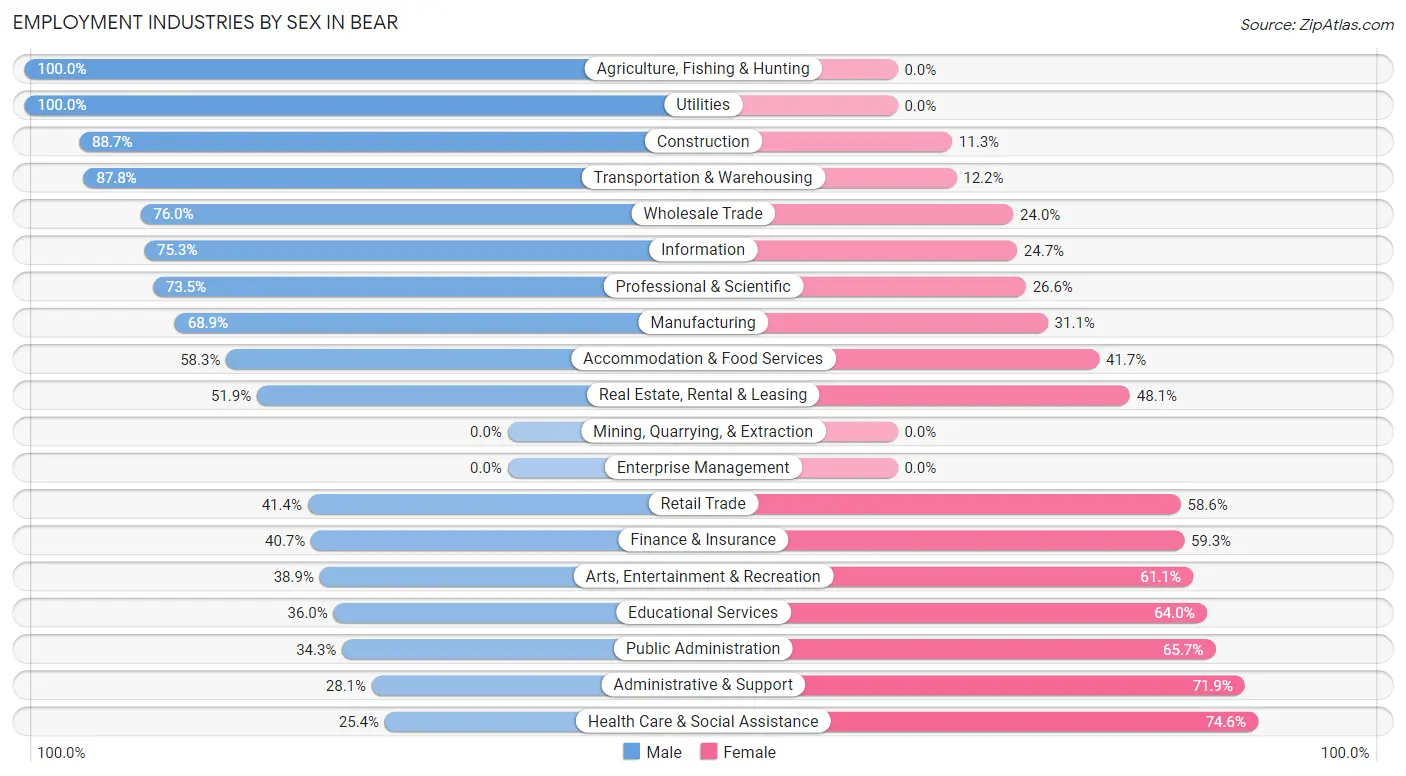
Employment Industries by Sex in Bear
The Bear industries that see more men than women are Agriculture, Fishing & Hunting (100.0%), Utilities (100.0%), and Construction (88.7%), whereas the industries that tend to have a higher number of women are Health Care & Social Assistance (74.6%), Administrative & Support (71.9%), and Public Administration (65.7%).
| Industry | Male | Female |
| Agriculture, Fishing & Hunting | 22 (100.0%) | 0 (0.0%) |
| Mining, Quarrying, & Extraction | 0 (0.0%) | 0 (0.0%) |
| Construction | 842 (88.7%) | 107 (11.3%) |
| Manufacturing | 700 (68.9%) | 316 (31.1%) |
| Wholesale Trade | 219 (76.0%) | 69 (24.0%) |
| Retail Trade | 685 (41.4%) | 970 (58.6%) |
| Transportation & Warehousing | 872 (87.8%) | 121 (12.2%) |
| Utilities | 9 (100.0%) | 0 (0.0%) |
| Information | 137 (75.3%) | 45 (24.7%) |
| Finance & Insurance | 463 (40.7%) | 675 (59.3%) |
| Real Estate, Rental & Leasing | 69 (51.9%) | 64 (48.1%) |
| Professional & Scientific | 437 (73.5%) | 158 (26.6%) |
| Enterprise Management | 0 (0.0%) | 0 (0.0%) |
| Administrative & Support | 176 (28.1%) | 450 (71.9%) |
| Educational Services | 355 (36.0%) | 630 (64.0%) |
| Health Care & Social Assistance | 469 (25.4%) | 1,375 (74.6%) |
| Arts, Entertainment & Recreation | 114 (38.9%) | 179 (61.1%) |
| Accommodation & Food Services | 455 (58.3%) | 326 (41.7%) |
| Public Administration | 173 (34.3%) | 332 (65.7%) |
| Total | 6,362 (50.7%) | 6,177 (49.3%) |
Education in Bear
School Enrollment in Bear
The most common levels of schooling among the 6,079 students in Bear are middle school (1,466 | 24.1%), high school (1,282 | 21.1%), and elementary school (1,116 | 18.4%).
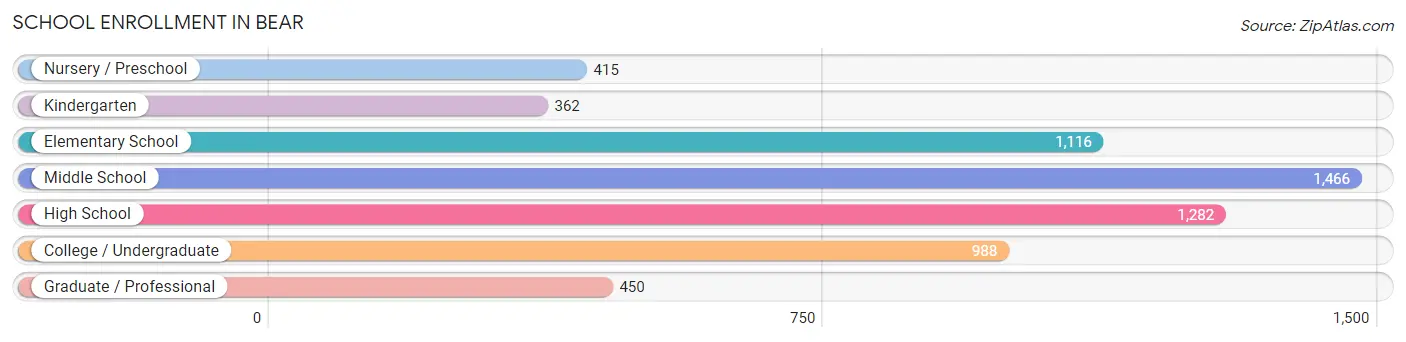
| School Level | # Students | % Students |
| Nursery / Preschool | 415 | 6.8% |
| Kindergarten | 362 | 5.9% |
| Elementary School | 1,116 | 18.4% |
| Middle School | 1,466 | 24.1% |
| High School | 1,282 | 21.1% |
| College / Undergraduate | 988 | 16.3% |
| Graduate / Professional | 450 | 7.4% |
| Total | 6,079 | 100.0% |
School Enrollment by Age by Funding Source in Bear
Out of a total of 6,079 students who are enrolled in schools in Bear, 924 (15.2%) attend a private institution, while the remaining 5,155 (84.8%) are enrolled in public schools. The age group of 3 to 4 year olds has the highest likelihood of being enrolled in private schools, with 238 (74.6% in the age bracket) enrolled. Conversely, the age group of 5 to 9 year old has the lowest likelihood of being enrolled in a private school, with 1,310 (96.2% in the age bracket) attending a public institution.
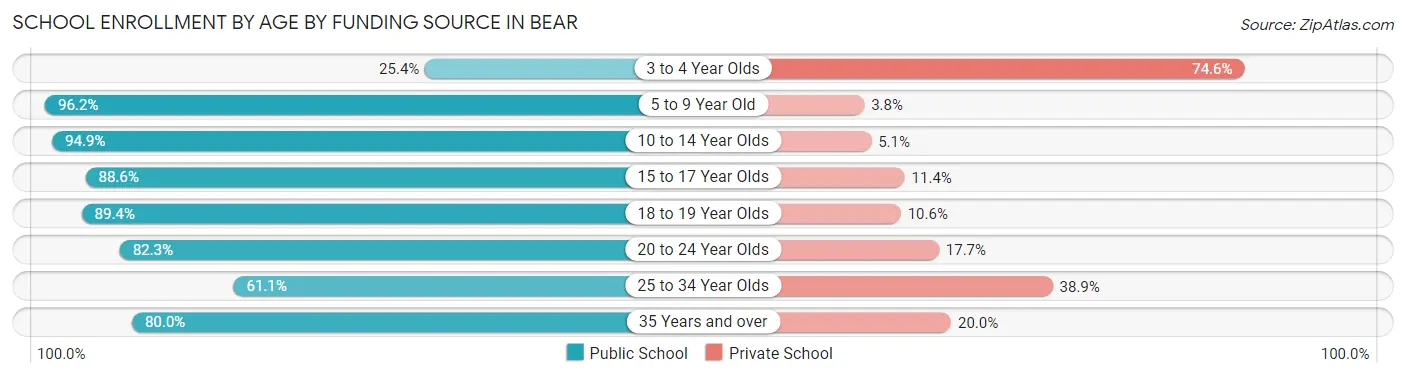
| Age Bracket | Public School | Private School |
| 3 to 4 Year Olds | 81 (25.4%) | 238 (74.6%) |
| 5 to 9 Year Old | 1,310 (96.2%) | 52 (3.8%) |
| 10 to 14 Year Olds | 1,555 (94.9%) | 84 (5.1%) |
| 15 to 17 Year Olds | 780 (88.6%) | 100 (11.4%) |
| 18 to 19 Year Olds | 269 (89.4%) | 32 (10.6%) |
| 20 to 24 Year Olds | 501 (82.3%) | 108 (17.7%) |
| 25 to 34 Year Olds | 372 (61.1%) | 237 (38.9%) |
| 35 Years and over | 288 (80.0%) | 72 (20.0%) |
| Total | 5,155 (84.8%) | 924 (15.2%) |
Educational Attainment by Field of Study in Bear
Business (994 | 17.2%), science & technology (980 | 17.0%), education (452 | 7.8%), engineering (432 | 7.5%), and social sciences (408 | 7.1%) are the most common fields of study among 5,767 individuals in Bear who have obtained a bachelor's degree or higher.
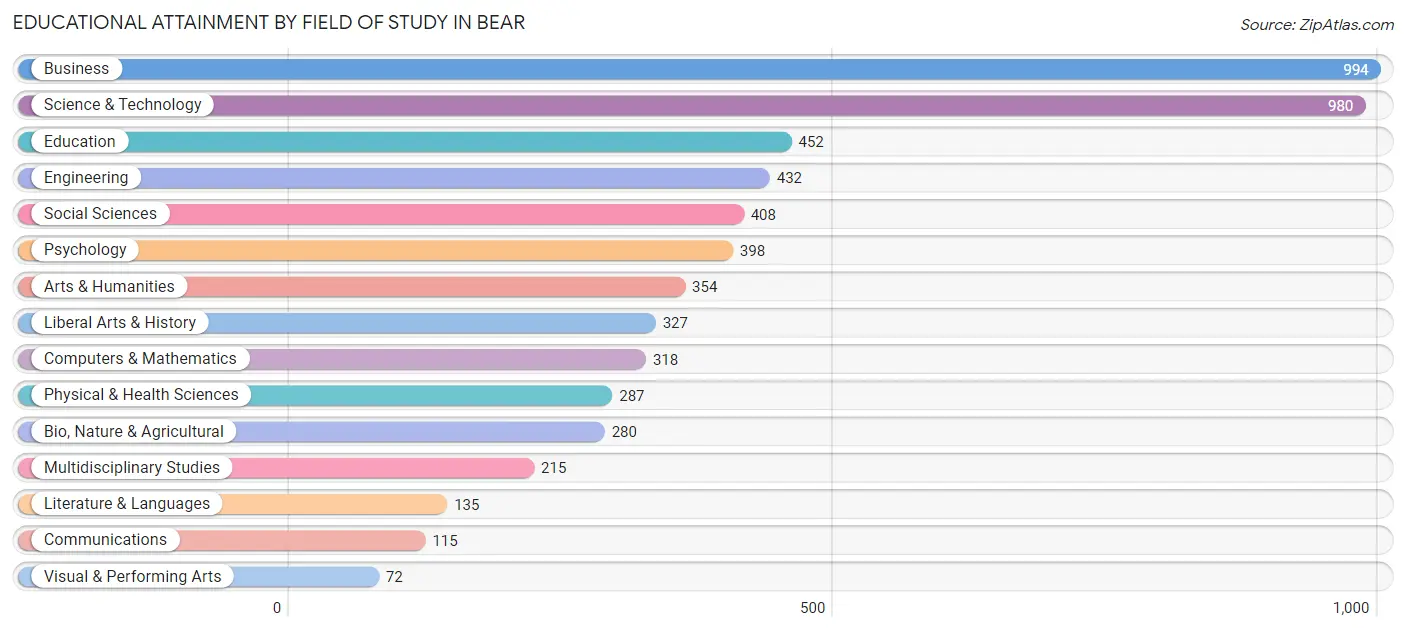
| Field of Study | # Graduates | % Graduates |
| Computers & Mathematics | 318 | 5.5% |
| Bio, Nature & Agricultural | 280 | 4.9% |
| Physical & Health Sciences | 287 | 5.0% |
| Psychology | 398 | 6.9% |
| Social Sciences | 408 | 7.1% |
| Engineering | 432 | 7.5% |
| Multidisciplinary Studies | 215 | 3.7% |
| Science & Technology | 980 | 17.0% |
| Business | 994 | 17.2% |
| Education | 452 | 7.8% |
| Literature & Languages | 135 | 2.3% |
| Liberal Arts & History | 327 | 5.7% |
| Visual & Performing Arts | 72 | 1.3% |
| Communications | 115 | 2.0% |
| Arts & Humanities | 354 | 6.1% |
| Total | 5,767 | 100.0% |
Transportation & Commute in Bear
Vehicle Availability by Sex in Bear
The most prevalent vehicle ownership categories in Bear are males with 2 vehicles (3,328, accounting for 52.2%) and females with 2 vehicles (2,922, making up 57.0%).
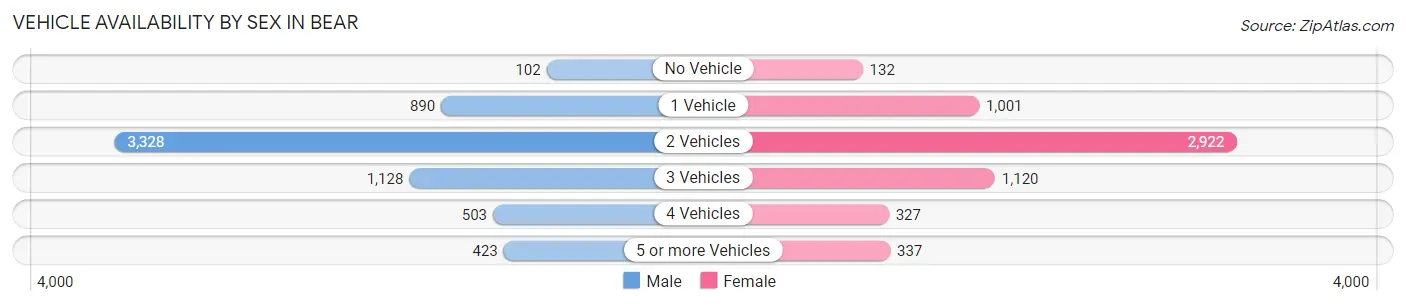
| Vehicles Available | Male | Female |
| No Vehicle | 102 (1.6%) | 132 (2.3%) |
| 1 Vehicle | 890 (14.0%) | 1,001 (17.1%) |
| 2 Vehicles | 3,328 (52.2%) | 2,922 (50.0%) |
| 3 Vehicles | 1,128 (17.7%) | 1,120 (19.2%) |
| 4 Vehicles | 503 (7.9%) | 327 (5.6%) |
| 5 or more Vehicles | 423 (6.6%) | 337 (5.8%) |
| Total | 6,374 (100.0%) | 5,839 (100.0%) |
Commute Time in Bear
The most frequently occuring commute durations in Bear are 15 to 19 minutes (2,643 commuters, 23.3%), 20 to 24 minutes (2,069 commuters, 18.2%), and 30 to 34 minutes (1,713 commuters, 15.1%).
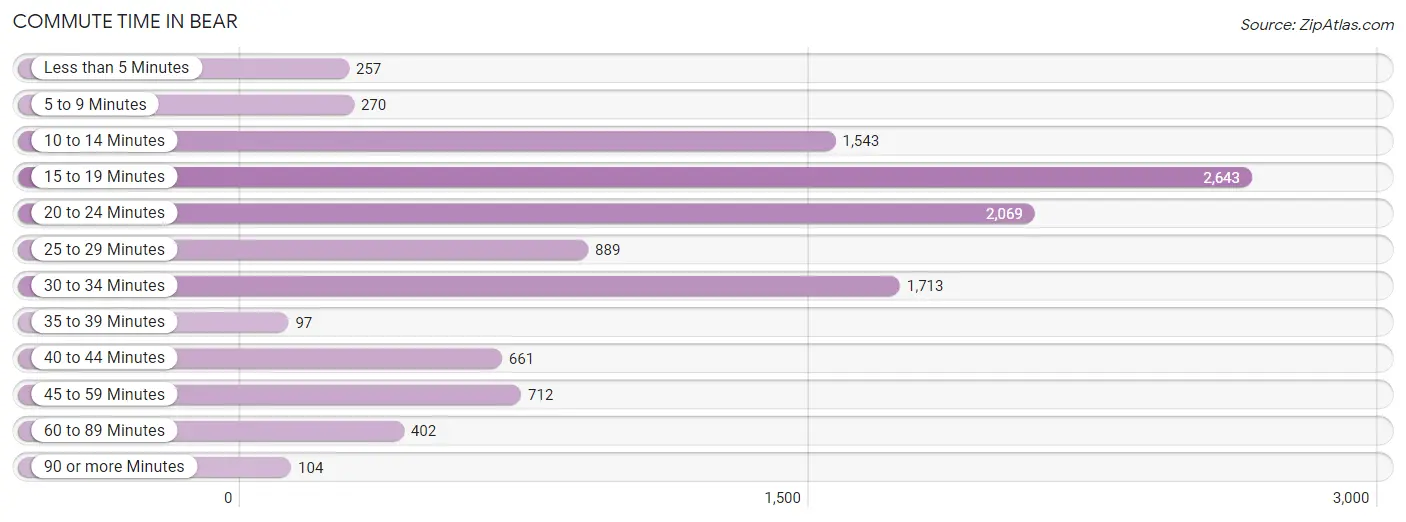
| Commute Time | # Commuters | % Commuters |
| Less than 5 Minutes | 257 | 2.3% |
| 5 to 9 Minutes | 270 | 2.4% |
| 10 to 14 Minutes | 1,543 | 13.6% |
| 15 to 19 Minutes | 2,643 | 23.3% |
| 20 to 24 Minutes | 2,069 | 18.2% |
| 25 to 29 Minutes | 889 | 7.8% |
| 30 to 34 Minutes | 1,713 | 15.1% |
| 35 to 39 Minutes | 97 | 0.9% |
| 40 to 44 Minutes | 661 | 5.8% |
| 45 to 59 Minutes | 712 | 6.3% |
| 60 to 89 Minutes | 402 | 3.5% |
| 90 or more Minutes | 104 | 0.9% |
Commute Time by Sex in Bear
The most common commute times in Bear are 15 to 19 minutes (1,129 commuters, 19.3%) for males and 15 to 19 minutes (1,514 commuters, 27.5%) for females.
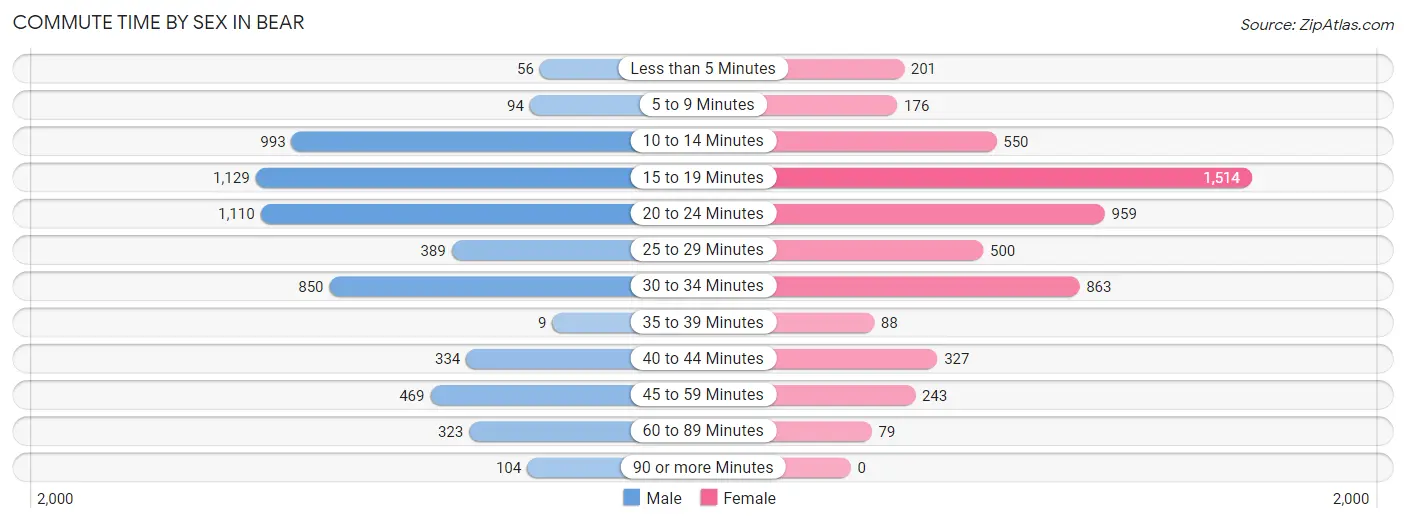
| Commute Time | Male | Female |
| Less than 5 Minutes | 56 (1.0%) | 201 (3.6%) |
| 5 to 9 Minutes | 94 (1.6%) | 176 (3.2%) |
| 10 to 14 Minutes | 993 (17.0%) | 550 (10.0%) |
| 15 to 19 Minutes | 1,129 (19.3%) | 1,514 (27.5%) |
| 20 to 24 Minutes | 1,110 (18.9%) | 959 (17.4%) |
| 25 to 29 Minutes | 389 (6.6%) | 500 (9.1%) |
| 30 to 34 Minutes | 850 (14.5%) | 863 (15.7%) |
| 35 to 39 Minutes | 9 (0.2%) | 88 (1.6%) |
| 40 to 44 Minutes | 334 (5.7%) | 327 (5.9%) |
| 45 to 59 Minutes | 469 (8.0%) | 243 (4.4%) |
| 60 to 89 Minutes | 323 (5.5%) | 79 (1.4%) |
| 90 or more Minutes | 104 (1.8%) | 0 (0.0%) |
Time of Departure to Work by Sex in Bear
The most frequent times of departure to work in Bear are 7:00 AM to 7:29 AM (854, 14.6%) for males and 6:30 AM to 6:59 AM (954, 17.3%) for females.
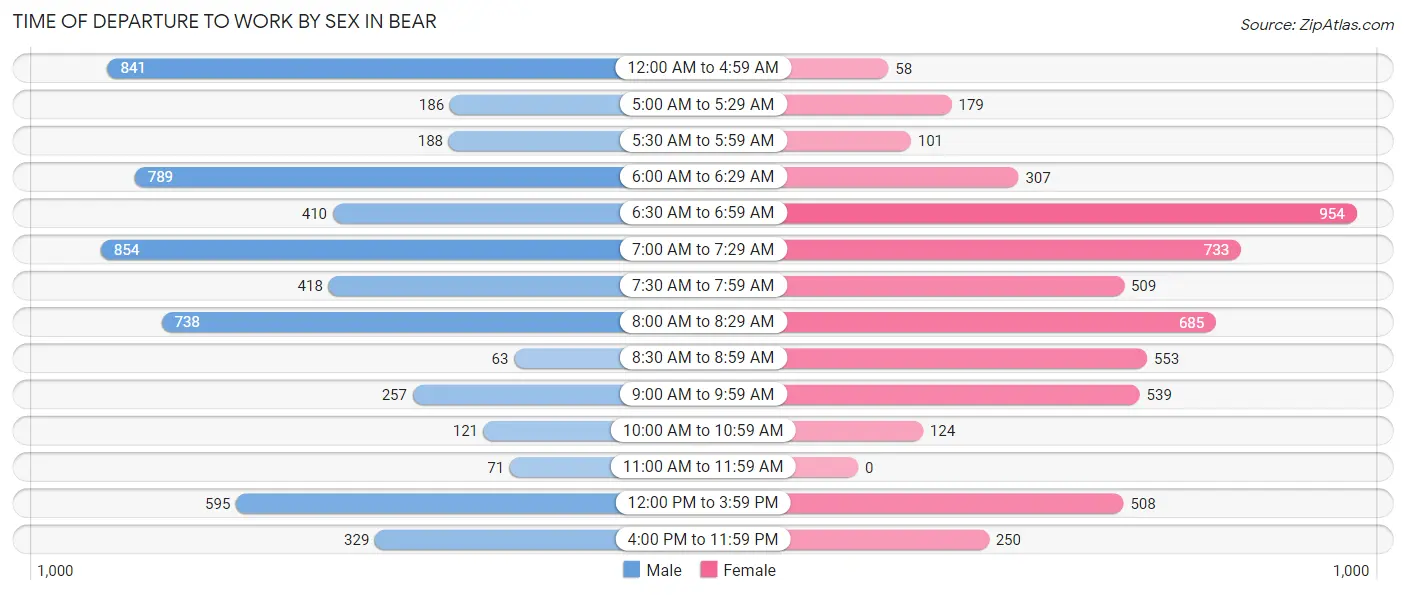
| Time of Departure | Male | Female |
| 12:00 AM to 4:59 AM | 841 (14.3%) | 58 (1.1%) |
| 5:00 AM to 5:29 AM | 186 (3.2%) | 179 (3.3%) |
| 5:30 AM to 5:59 AM | 188 (3.2%) | 101 (1.8%) |
| 6:00 AM to 6:29 AM | 789 (13.5%) | 307 (5.6%) |
| 6:30 AM to 6:59 AM | 410 (7.0%) | 954 (17.3%) |
| 7:00 AM to 7:29 AM | 854 (14.6%) | 733 (13.3%) |
| 7:30 AM to 7:59 AM | 418 (7.1%) | 509 (9.2%) |
| 8:00 AM to 8:29 AM | 738 (12.6%) | 685 (12.4%) |
| 8:30 AM to 8:59 AM | 63 (1.1%) | 553 (10.1%) |
| 9:00 AM to 9:59 AM | 257 (4.4%) | 539 (9.8%) |
| 10:00 AM to 10:59 AM | 121 (2.1%) | 124 (2.2%) |
| 11:00 AM to 11:59 AM | 71 (1.2%) | 0 (0.0%) |
| 12:00 PM to 3:59 PM | 595 (10.2%) | 508 (9.2%) |
| 4:00 PM to 11:59 PM | 329 (5.6%) | 250 (4.5%) |
| Total | 5,860 (100.0%) | 5,500 (100.0%) |
Housing Occupancy in Bear
Occupancy by Ownership in Bear
Of the total 8,600 dwellings in Bear, owner-occupied units account for 5,427 (63.1%), while renter-occupied units make up 3,173 (36.9%).
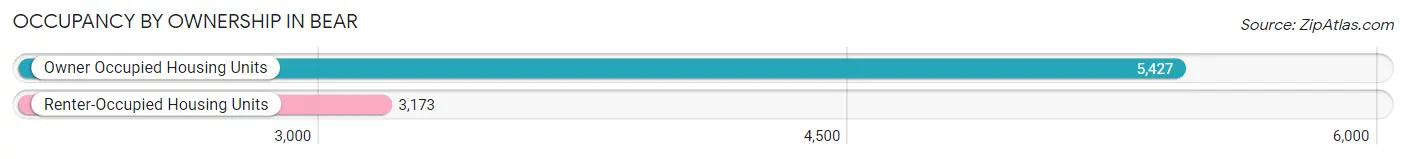
| Occupancy | # Housing Units | % Housing Units |
| Owner Occupied Housing Units | 5,427 | 63.1% |
| Renter-Occupied Housing Units | 3,173 | 36.9% |
| Total Occupied Housing Units | 8,600 | 100.0% |
Occupancy by Household Size in Bear
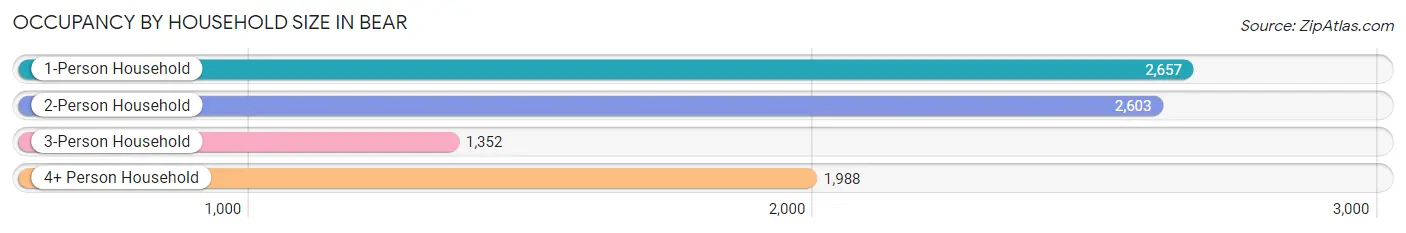
| Household Size | # Housing Units | % Housing Units |
| 1-Person Household | 2,657 | 30.9% |
| 2-Person Household | 2,603 | 30.3% |
| 3-Person Household | 1,352 | 15.7% |
| 4+ Person Household | 1,988 | 23.1% |
| Total Housing Units | 8,600 | 100.0% |
Occupancy by Ownership by Household Size in Bear
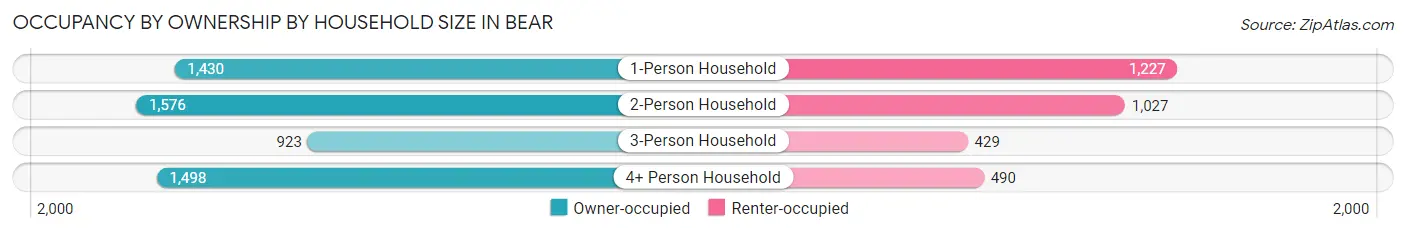
| Household Size | Owner-occupied | Renter-occupied |
| 1-Person Household | 1,430 (53.8%) | 1,227 (46.2%) |
| 2-Person Household | 1,576 (60.6%) | 1,027 (39.5%) |
| 3-Person Household | 923 (68.3%) | 429 (31.7%) |
| 4+ Person Household | 1,498 (75.3%) | 490 (24.6%) |
| Total Housing Units | 5,427 (63.1%) | 3,173 (36.9%) |
Occupancy by Educational Attainment in Bear
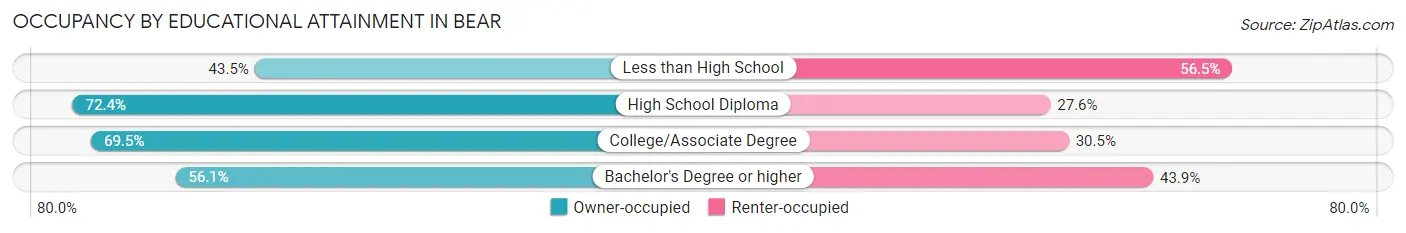
| Household Size | Owner-occupied | Renter-occupied |
| Less than High School | 335 (43.5%) | 435 (56.5%) |
| High School Diploma | 1,710 (72.4%) | 653 (27.6%) |
| College/Associate Degree | 1,640 (69.5%) | 721 (30.5%) |
| Bachelor's Degree or higher | 1,742 (56.1%) | 1,364 (43.9%) |
Occupancy by Age of Householder in Bear
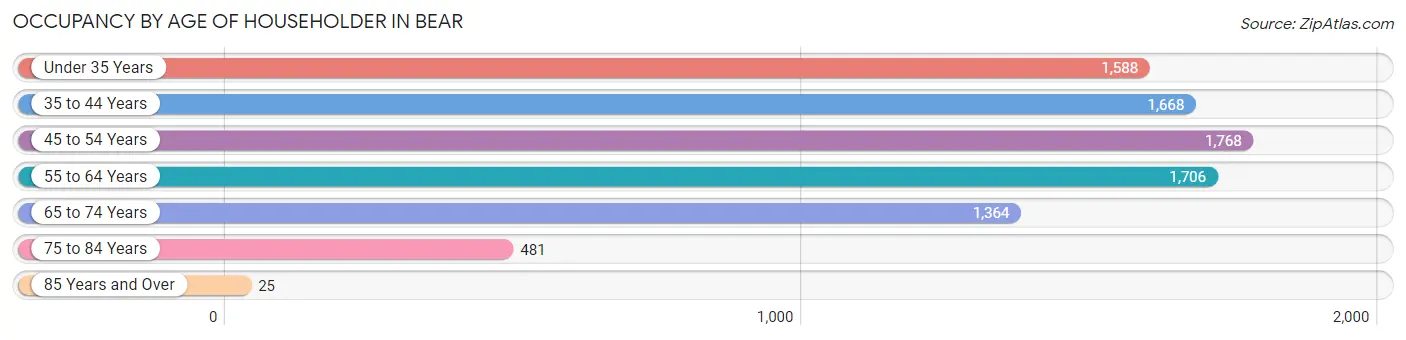
| Age Bracket | # Households | % Households |
| Under 35 Years | 1,588 | 18.5% |
| 35 to 44 Years | 1,668 | 19.4% |
| 45 to 54 Years | 1,768 | 20.6% |
| 55 to 64 Years | 1,706 | 19.8% |
| 65 to 74 Years | 1,364 | 15.9% |
| 75 to 84 Years | 481 | 5.6% |
| 85 Years and Over | 25 | 0.3% |
| Total | 8,600 | 100.0% |
Housing Finances in Bear
Median Income by Occupancy in Bear
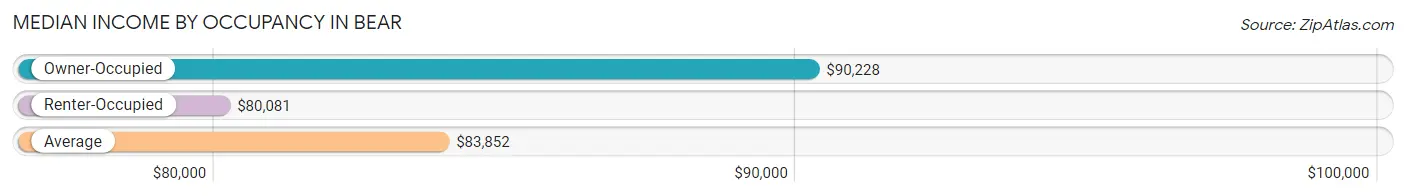
| Occupancy Type | # Households | Median Income |
| Owner-Occupied | 5,427 (63.1%) | $90,228 |
| Renter-Occupied | 3,173 (36.9%) | $80,081 |
| Average | 8,600 (100.0%) | $83,852 |
Occupancy by Householder Income Bracket in Bear
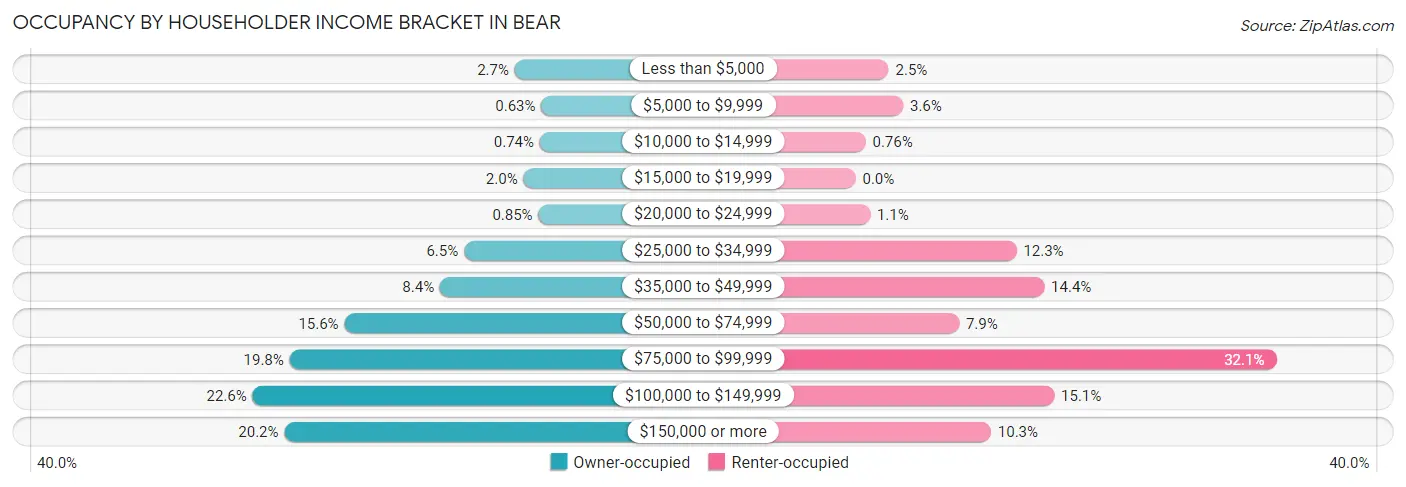
| Income Bracket | Owner-occupied | Renter-occupied |
| Less than $5,000 | 144 (2.6%) | 80 (2.5%) |
| $5,000 to $9,999 | 34 (0.6%) | 115 (3.6%) |
| $10,000 to $14,999 | 40 (0.7%) | 24 (0.8%) |
| $15,000 to $19,999 | 108 (2.0%) | 0 (0.0%) |
| $20,000 to $24,999 | 46 (0.9%) | 35 (1.1%) |
| $25,000 to $34,999 | 354 (6.5%) | 389 (12.3%) |
| $35,000 to $49,999 | 453 (8.4%) | 456 (14.4%) |
| $50,000 to $74,999 | 848 (15.6%) | 250 (7.9%) |
| $75,000 to $99,999 | 1,075 (19.8%) | 1,017 (32.1%) |
| $100,000 to $149,999 | 1,228 (22.6%) | 480 (15.1%) |
| $150,000 or more | 1,097 (20.2%) | 327 (10.3%) |
| Total | 5,427 (100.0%) | 3,173 (100.0%) |
Monthly Housing Cost Tiers in Bear
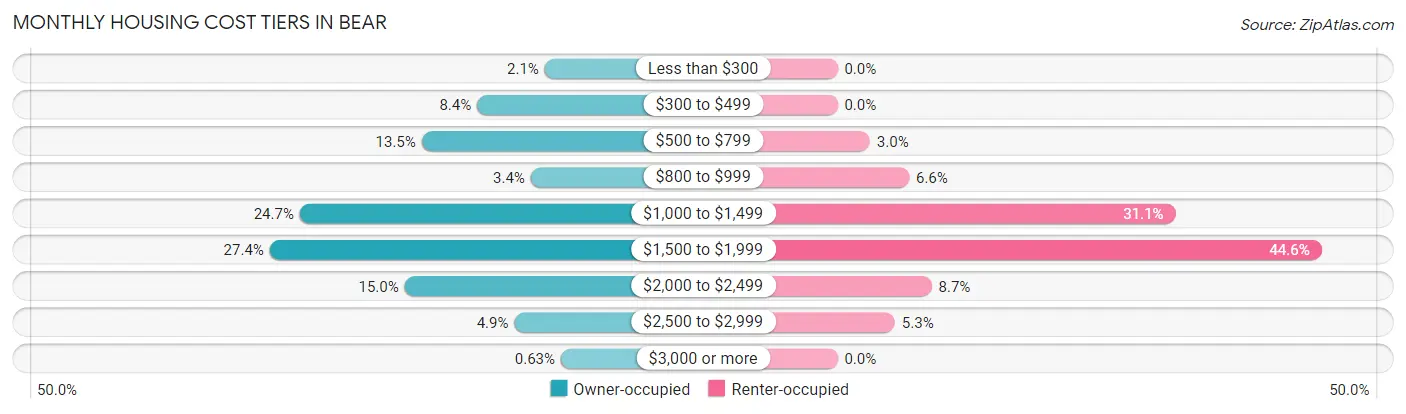
| Monthly Cost | Owner-occupied | Renter-occupied |
| Less than $300 | 115 (2.1%) | 0 (0.0%) |
| $300 to $499 | 453 (8.4%) | 0 (0.0%) |
| $500 to $799 | 730 (13.5%) | 95 (3.0%) |
| $800 to $999 | 185 (3.4%) | 209 (6.6%) |
| $1,000 to $1,499 | 1,339 (24.7%) | 987 (31.1%) |
| $1,500 to $1,999 | 1,489 (27.4%) | 1,414 (44.6%) |
| $2,000 to $2,499 | 815 (15.0%) | 275 (8.7%) |
| $2,500 to $2,999 | 267 (4.9%) | 168 (5.3%) |
| $3,000 or more | 34 (0.6%) | 0 (0.0%) |
| Total | 5,427 (100.0%) | 3,173 (100.0%) |
Physical Housing Characteristics in Bear
Housing Structures in Bear
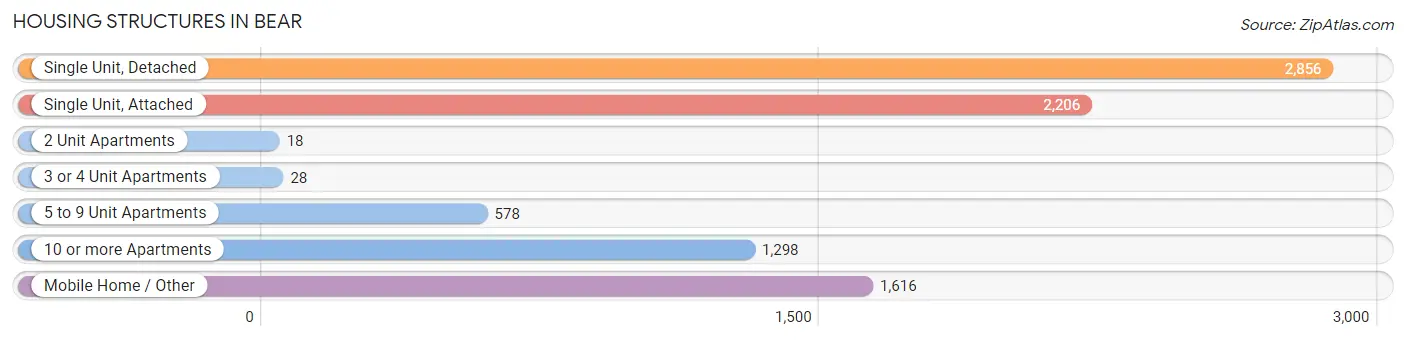
| Structure Type | # Housing Units | % Housing Units |
| Single Unit, Detached | 2,856 | 33.2% |
| Single Unit, Attached | 2,206 | 25.7% |
| 2 Unit Apartments | 18 | 0.2% |
| 3 or 4 Unit Apartments | 28 | 0.3% |
| 5 to 9 Unit Apartments | 578 | 6.7% |
| 10 or more Apartments | 1,298 | 15.1% |
| Mobile Home / Other | 1,616 | 18.8% |
| Total | 8,600 | 100.0% |
Housing Structures by Occupancy in Bear
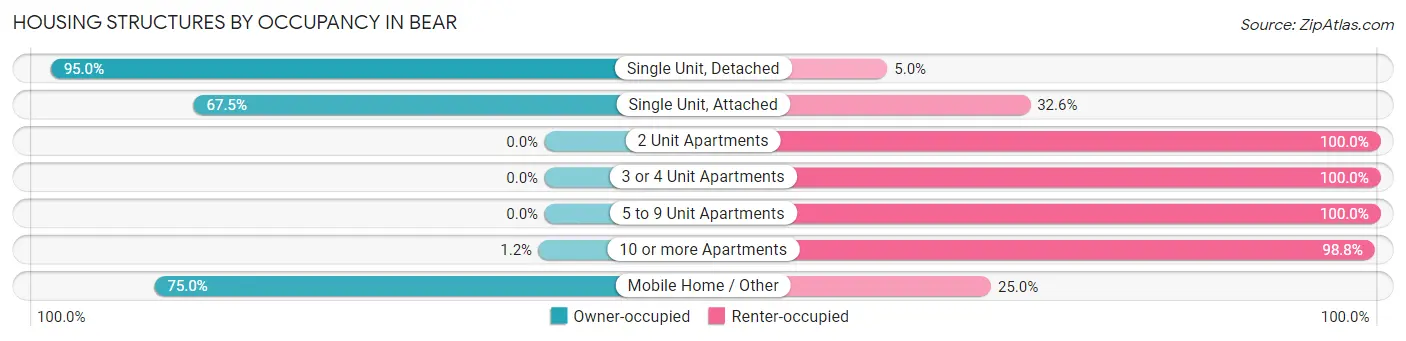
| Structure Type | Owner-occupied | Renter-occupied |
| Single Unit, Detached | 2,712 (95.0%) | 144 (5.0%) |
| Single Unit, Attached | 1,488 (67.4%) | 718 (32.6%) |
| 2 Unit Apartments | 0 (0.0%) | 18 (100.0%) |
| 3 or 4 Unit Apartments | 0 (0.0%) | 28 (100.0%) |
| 5 to 9 Unit Apartments | 0 (0.0%) | 578 (100.0%) |
| 10 or more Apartments | 15 (1.2%) | 1,283 (98.8%) |
| Mobile Home / Other | 1,212 (75.0%) | 404 (25.0%) |
| Total | 5,427 (63.1%) | 3,173 (36.9%) |
Housing Structures by Number of Rooms in Bear
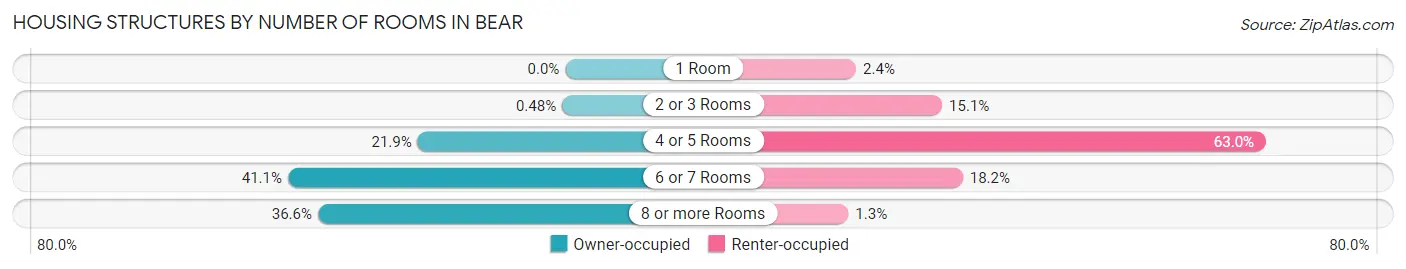
| Number of Rooms | Owner-occupied | Renter-occupied |
| 1 Room | 0 (0.0%) | 76 (2.4%) |
| 2 or 3 Rooms | 26 (0.5%) | 480 (15.1%) |
| 4 or 5 Rooms | 1,186 (21.8%) | 2,000 (63.0%) |
| 6 or 7 Rooms | 2,228 (41.0%) | 577 (18.2%) |
| 8 or more Rooms | 1,987 (36.6%) | 40 (1.3%) |
| Total | 5,427 (100.0%) | 3,173 (100.0%) |
Housing Structure by Heating Type in Bear
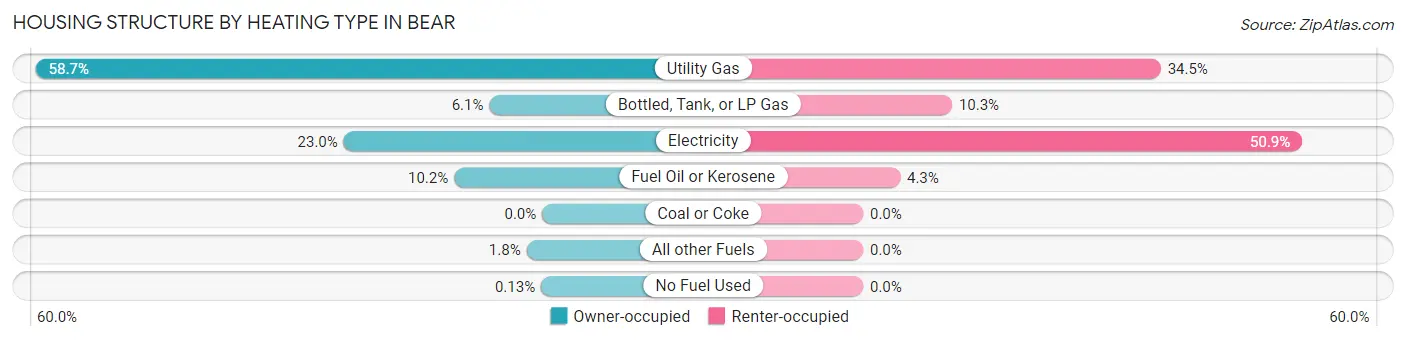
| Heating Type | Owner-occupied | Renter-occupied |
| Utility Gas | 3,187 (58.7%) | 1,095 (34.5%) |
| Bottled, Tank, or LP Gas | 332 (6.1%) | 327 (10.3%) |
| Electricity | 1,249 (23.0%) | 1,615 (50.9%) |
| Fuel Oil or Kerosene | 554 (10.2%) | 136 (4.3%) |
| Coal or Coke | 0 (0.0%) | 0 (0.0%) |
| All other Fuels | 98 (1.8%) | 0 (0.0%) |
| No Fuel Used | 7 (0.1%) | 0 (0.0%) |
| Total | 5,427 (100.0%) | 3,173 (100.0%) |
Household Vehicle Usage in Bear
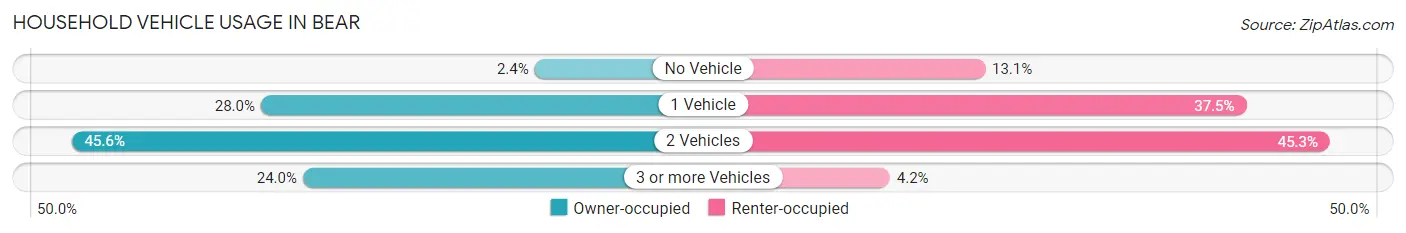
| Vehicles per Household | Owner-occupied | Renter-occupied |
| No Vehicle | 130 (2.4%) | 415 (13.1%) |
| 1 Vehicle | 1,517 (28.0%) | 1,189 (37.5%) |
| 2 Vehicles | 2,476 (45.6%) | 1,436 (45.3%) |
| 3 or more Vehicles | 1,304 (24.0%) | 133 (4.2%) |
| Total | 5,427 (100.0%) | 3,173 (100.0%) |
Real Estate & Mortgages in Bear
Real Estate and Mortgage Overview in Bear
| Characteristic | Without Mortgage | With Mortgage |
| Housing Units | 1,804 | 3,623 |
| Median Property Value | $67,900 | $307,500 |
| Median Household Income | $69,238 | $985 |
| Monthly Housing Costs | $645 | $34 |
| Real Estate Taxes | $1,008 | $203 |
Property Value by Mortgage Status in Bear
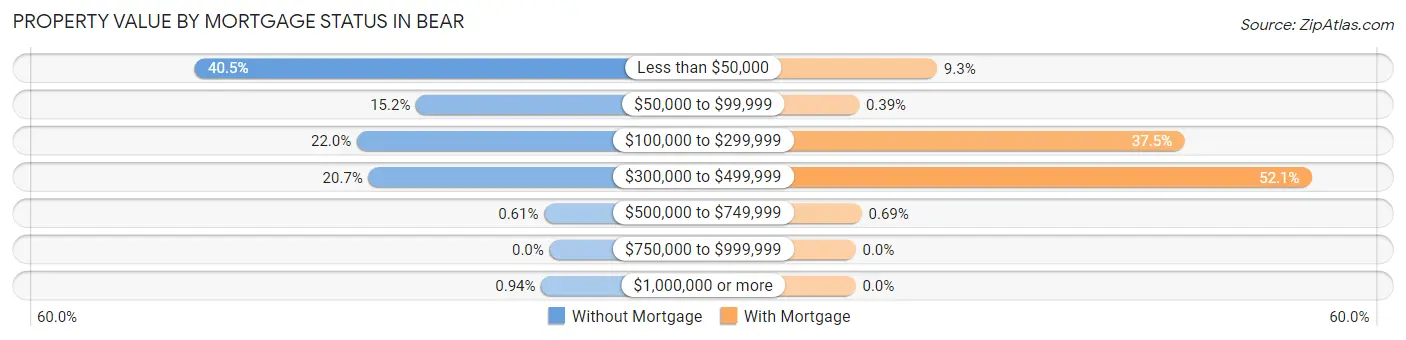
| Property Value | Without Mortgage | With Mortgage |
| Less than $50,000 | 731 (40.5%) | 337 (9.3%) |
| $50,000 to $99,999 | 275 (15.2%) | 14 (0.4%) |
| $100,000 to $299,999 | 397 (22.0%) | 1,360 (37.5%) |
| $300,000 to $499,999 | 373 (20.7%) | 1,887 (52.1%) |
| $500,000 to $749,999 | 11 (0.6%) | 25 (0.7%) |
| $750,000 to $999,999 | 0 (0.0%) | 0 (0.0%) |
| $1,000,000 or more | 17 (0.9%) | 0 (0.0%) |
| Total | 1,804 (100.0%) | 3,623 (100.0%) |
Household Income by Mortgage Status in Bear
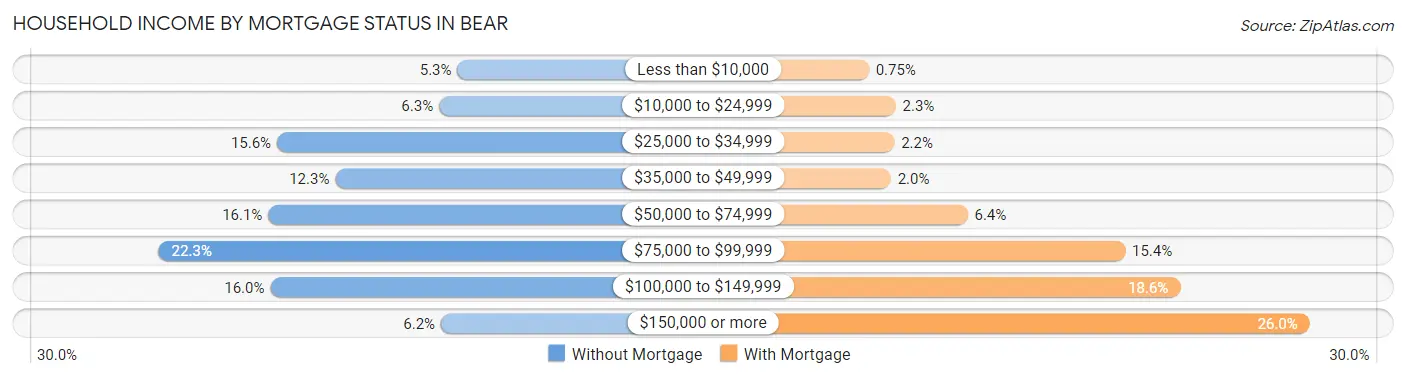
| Household Income | Without Mortgage | With Mortgage |
| Less than $10,000 | 95 (5.3%) | 27 (0.7%) |
| $10,000 to $24,999 | 114 (6.3%) | 83 (2.3%) |
| $25,000 to $34,999 | 281 (15.6%) | 80 (2.2%) |
| $35,000 to $49,999 | 221 (12.2%) | 73 (2.0%) |
| $50,000 to $74,999 | 290 (16.1%) | 232 (6.4%) |
| $75,000 to $99,999 | 403 (22.3%) | 558 (15.4%) |
| $100,000 to $149,999 | 288 (16.0%) | 672 (18.5%) |
| $150,000 or more | 112 (6.2%) | 940 (26.0%) |
| Total | 1,804 (100.0%) | 3,623 (100.0%) |
Property Value to Household Income Ratio in Bear
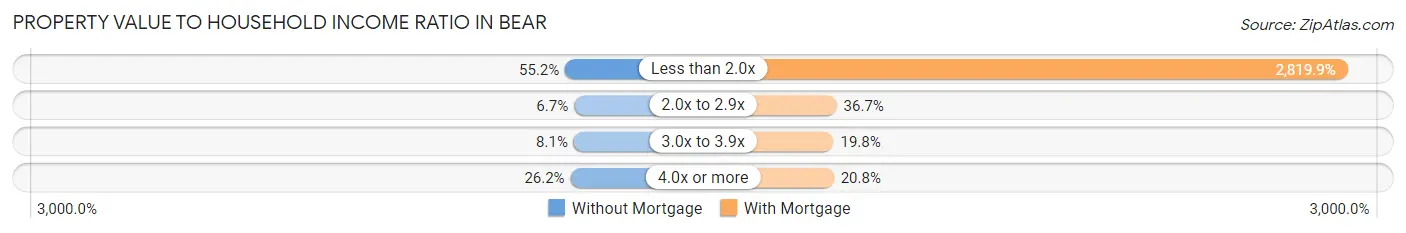
| Value-to-Income Ratio | Without Mortgage | With Mortgage |
| Less than 2.0x | 996 (55.2%) | 102,166 (2,819.9%) |
| 2.0x to 2.9x | 120 (6.7%) | 1,331 (36.7%) |
| 3.0x to 3.9x | 146 (8.1%) | 716 (19.8%) |
| 4.0x or more | 472 (26.2%) | 754 (20.8%) |
| Total | 1,804 (100.0%) | 3,623 (100.0%) |
Real Estate Taxes by Mortgage Status in Bear
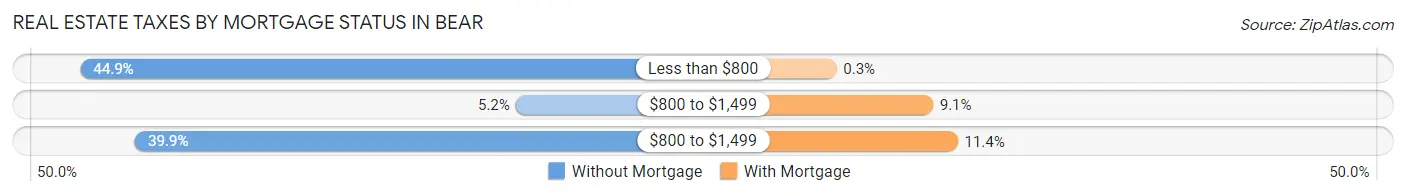
| Property Taxes | Without Mortgage | With Mortgage |
| Less than $800 | 810 (44.9%) | 11 (0.3%) |
| $800 to $1,499 | 93 (5.2%) | 330 (9.1%) |
| $800 to $1,499 | 720 (39.9%) | 412 (11.4%) |
| Total | 1,804 (100.0%) | 3,623 (100.0%) |
Health & Disability in Bear
Health Insurance Coverage by Age in Bear
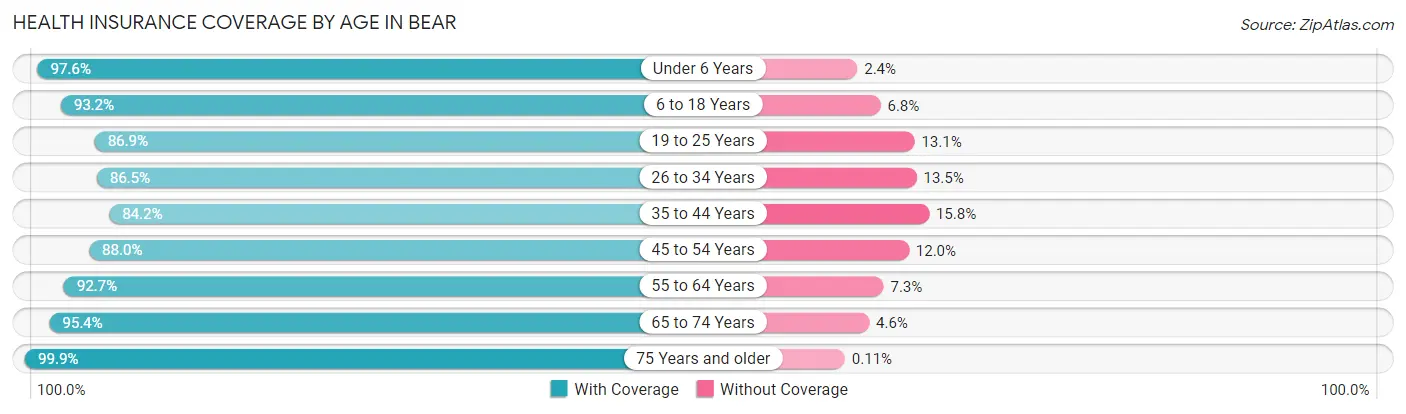
| Age Bracket | With Coverage | Without Coverage |
| Under 6 Years | 1,531 (97.6%) | 38 (2.4%) |
| 6 to 18 Years | 3,462 (93.2%) | 251 (6.8%) |
| 19 to 25 Years | 1,952 (86.9%) | 294 (13.1%) |
| 26 to 34 Years | 2,878 (86.5%) | 448 (13.5%) |
| 35 to 44 Years | 2,597 (84.2%) | 487 (15.8%) |
| 45 to 54 Years | 2,585 (88.0%) | 354 (12.0%) |
| 55 to 64 Years | 2,733 (92.7%) | 216 (7.3%) |
| 65 to 74 Years | 2,083 (95.4%) | 101 (4.6%) |
| 75 Years and older | 870 (99.9%) | 1 (0.1%) |
| Total | 20,691 (90.4%) | 2,190 (9.6%) |
Health Insurance Coverage by Citizenship Status in Bear
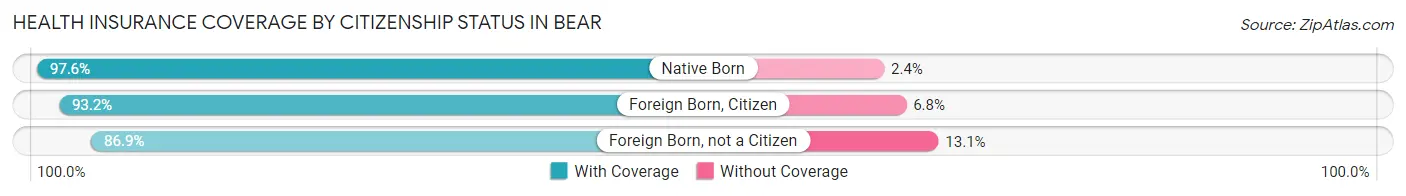
| Citizenship Status | With Coverage | Without Coverage |
| Native Born | 1,531 (97.6%) | 38 (2.4%) |
| Foreign Born, Citizen | 3,462 (93.2%) | 251 (6.8%) |
| Foreign Born, not a Citizen | 1,952 (86.9%) | 294 (13.1%) |
Health Insurance Coverage by Household Income in Bear
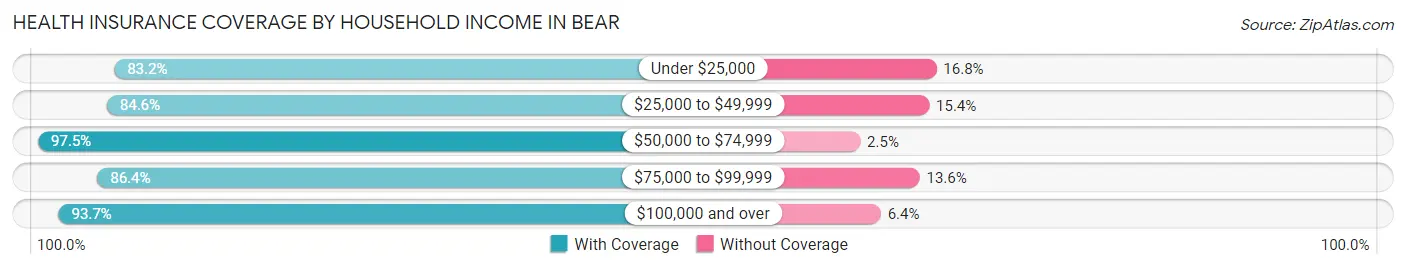
| Household Income | With Coverage | Without Coverage |
| Under $25,000 | 877 (83.2%) | 177 (16.8%) |
| $25,000 to $49,999 | 2,930 (84.6%) | 534 (15.4%) |
| $50,000 to $74,999 | 2,418 (97.5%) | 62 (2.5%) |
| $75,000 to $99,999 | 4,856 (86.4%) | 766 (13.6%) |
| $100,000 and over | 9,606 (93.6%) | 651 (6.4%) |
Public vs Private Health Insurance Coverage by Age in Bear
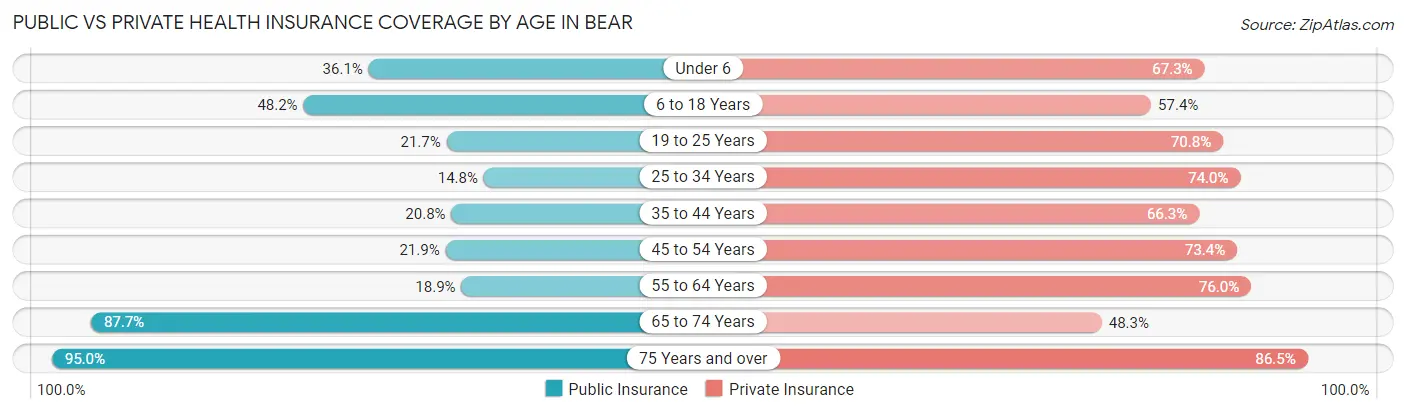
| Age Bracket | Public Insurance | Private Insurance |
| Under 6 | 567 (36.1%) | 1,056 (67.3%) |
| 6 to 18 Years | 1,791 (48.2%) | 2,132 (57.4%) |
| 19 to 25 Years | 487 (21.7%) | 1,589 (70.8%) |
| 25 to 34 Years | 491 (14.8%) | 2,460 (74.0%) |
| 35 to 44 Years | 641 (20.8%) | 2,045 (66.3%) |
| 45 to 54 Years | 643 (21.9%) | 2,156 (73.4%) |
| 55 to 64 Years | 558 (18.9%) | 2,240 (76.0%) |
| 65 to 74 Years | 1,915 (87.7%) | 1,054 (48.3%) |
| 75 Years and over | 827 (95.0%) | 753 (86.5%) |
| Total | 7,920 (34.6%) | 15,485 (67.7%) |
Disability Status by Sex by Age in Bear
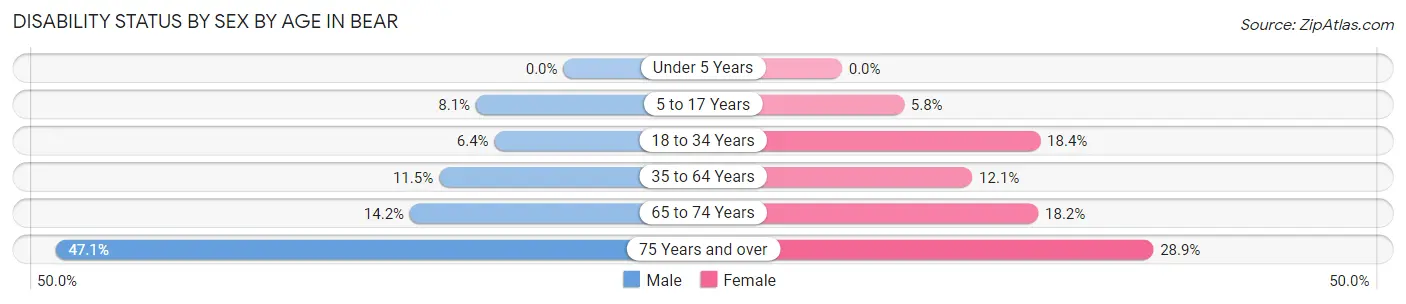
| Age Bracket | Male | Female |
| Under 5 Years | 0 (0.0%) | 0 (0.0%) |
| 5 to 17 Years | 155 (8.1%) | 114 (5.8%) |
| 18 to 34 Years | 177 (6.4%) | 552 (18.4%) |
| 35 to 64 Years | 529 (11.5%) | 531 (12.1%) |
| 65 to 74 Years | 121 (14.2%) | 243 (18.2%) |
| 75 Years and over | 148 (47.1%) | 161 (28.9%) |
Disability Class by Sex by Age in Bear
Disability Class: Hearing Difficulty
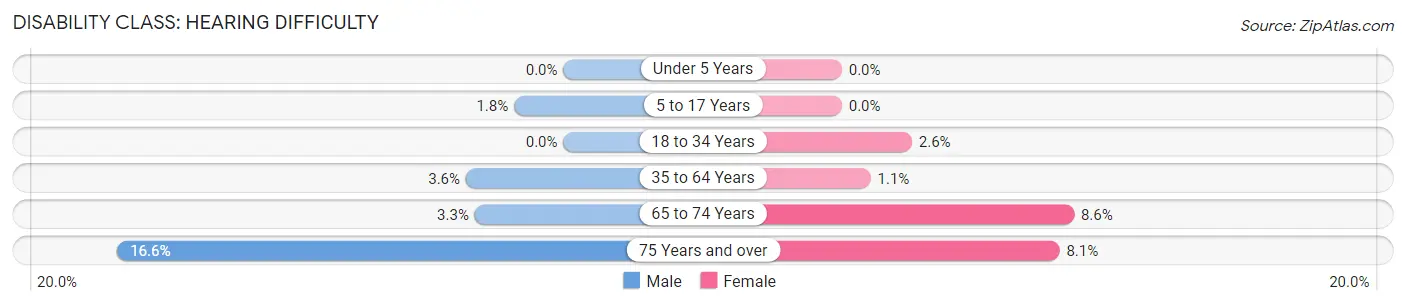
| Age Bracket | Male | Female |
| Under 5 Years | 0 (0.0%) | 0 (0.0%) |
| 5 to 17 Years | 35 (1.8%) | 0 (0.0%) |
| 18 to 34 Years | 0 (0.0%) | 78 (2.6%) |
| 35 to 64 Years | 166 (3.6%) | 47 (1.1%) |
| 65 to 74 Years | 28 (3.3%) | 115 (8.6%) |
| 75 Years and over | 52 (16.6%) | 45 (8.1%) |
Disability Class: Vision Difficulty
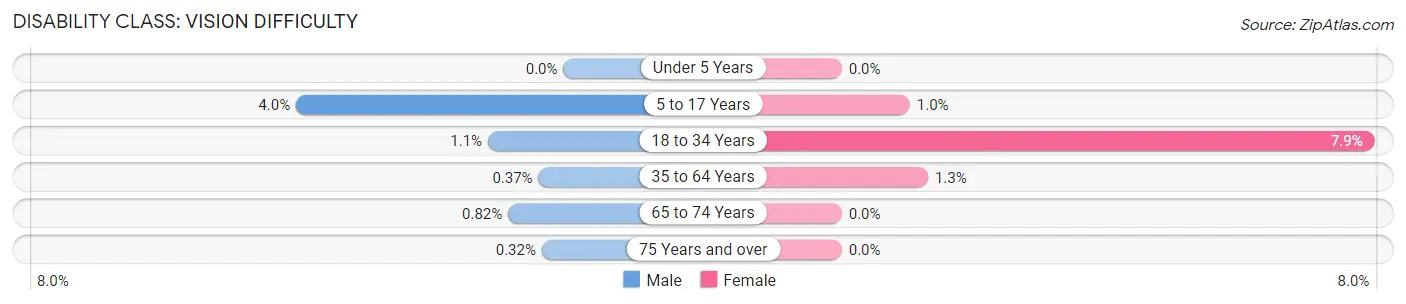
| Age Bracket | Male | Female |
| Under 5 Years | 0 (0.0%) | 0 (0.0%) |
| 5 to 17 Years | 76 (4.0%) | 20 (1.0%) |
| 18 to 34 Years | 31 (1.1%) | 237 (7.9%) |
| 35 to 64 Years | 17 (0.4%) | 56 (1.3%) |
| 65 to 74 Years | 7 (0.8%) | 0 (0.0%) |
| 75 Years and over | 1 (0.3%) | 0 (0.0%) |
Disability Class: Cognitive Difficulty
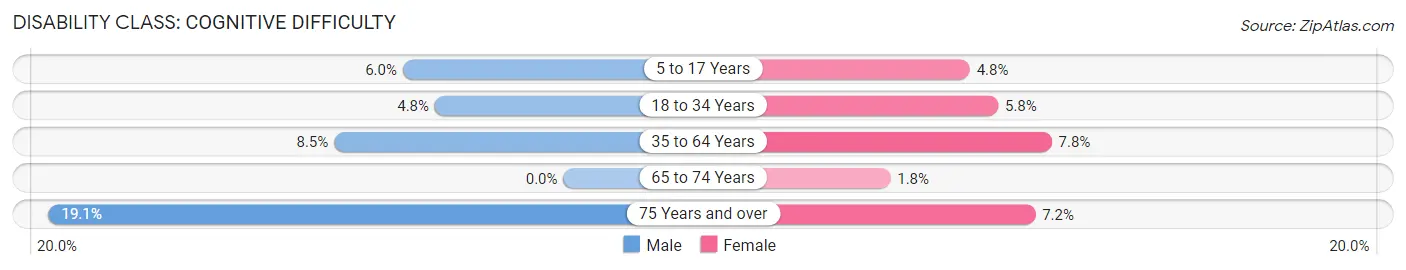
| Age Bracket | Male | Female |
| 5 to 17 Years | 114 (6.0%) | 94 (4.8%) |
| 18 to 34 Years | 132 (4.8%) | 174 (5.8%) |
| 35 to 64 Years | 390 (8.5%) | 342 (7.8%) |
| 65 to 74 Years | 0 (0.0%) | 24 (1.8%) |
| 75 Years and over | 60 (19.1%) | 40 (7.2%) |
Disability Class: Ambulatory Difficulty
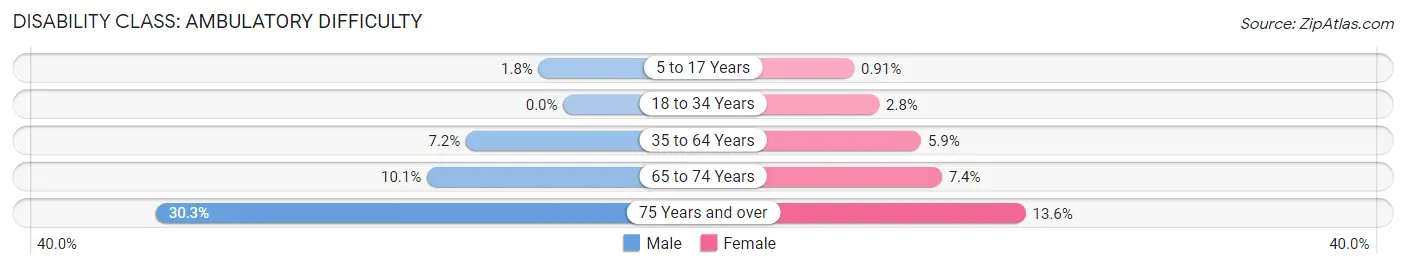
| Age Bracket | Male | Female |
| 5 to 17 Years | 35 (1.8%) | 18 (0.9%) |
| 18 to 34 Years | 0 (0.0%) | 83 (2.8%) |
| 35 to 64 Years | 331 (7.2%) | 258 (5.9%) |
| 65 to 74 Years | 86 (10.1%) | 99 (7.4%) |
| 75 Years and over | 95 (30.2%) | 76 (13.6%) |
Disability Class: Self-Care Difficulty
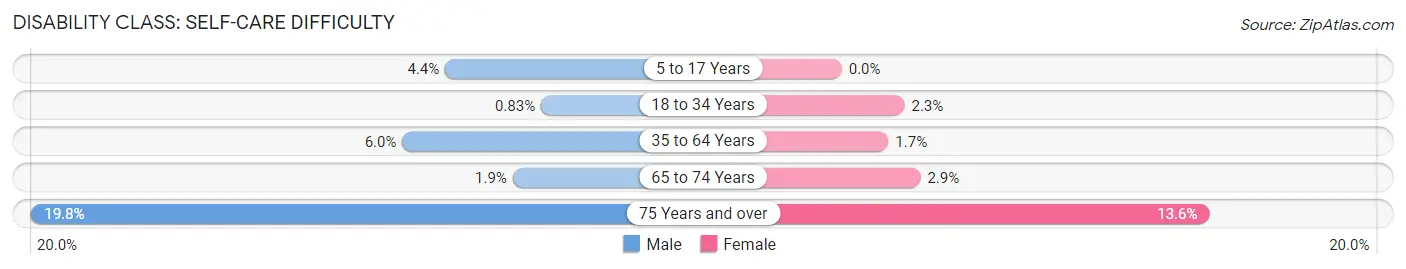
| Age Bracket | Male | Female |
| 5 to 17 Years | 84 (4.4%) | 0 (0.0%) |
| 18 to 34 Years | 23 (0.8%) | 70 (2.3%) |
| 35 to 64 Years | 274 (6.0%) | 76 (1.7%) |
| 65 to 74 Years | 16 (1.9%) | 39 (2.9%) |
| 75 Years and over | 62 (19.8%) | 76 (13.6%) |
Technology Access in Bear
Computing Device Access in Bear
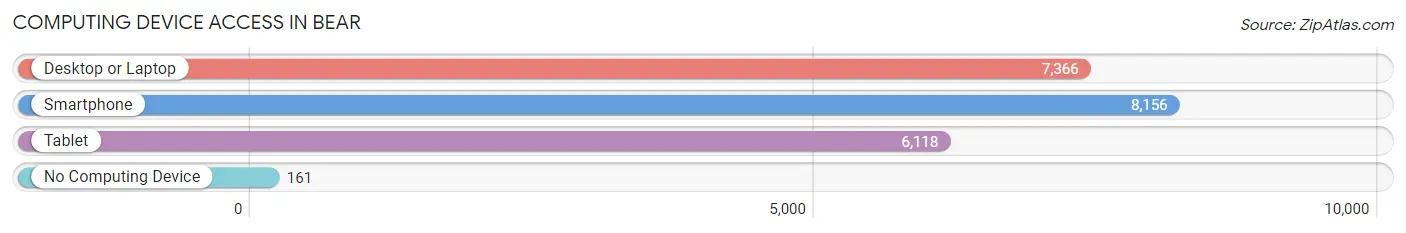
| Device Type | # Households | % Households |
| Desktop or Laptop | 7,366 | 85.7% |
| Smartphone | 8,156 | 94.8% |
| Tablet | 6,118 | 71.1% |
| No Computing Device | 161 | 1.9% |
| Total | 8,600 | 100.0% |
Internet Access in Bear
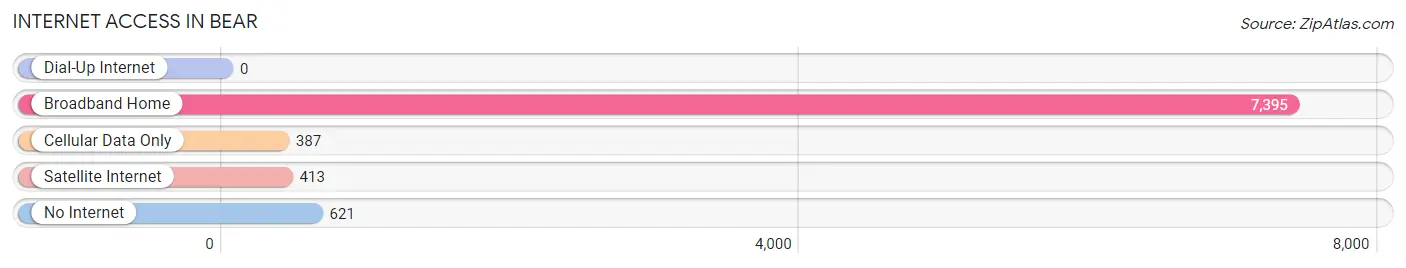
| Internet Type | # Households | % Households |
| Dial-Up Internet | 0 | 0.0% |
| Broadband Home | 7,395 | 86.0% |
| Cellular Data Only | 387 | 4.5% |
| Satellite Internet | 413 | 4.8% |
| No Internet | 621 | 7.2% |
| Total | 8,600 | 100.0% |
Bear Summary
DE History
Delaware is one of the original 13 colonies and was the first state to ratify the Constitution in 1787. The state was founded by Dutch settlers in 1638 and was named after the Delaware River. The area was originally inhabited by Native American tribes, including the Lenape, Nanticoke, and Susquehannock. The Dutch were the first Europeans to settle in the area, and they established a trading post at Zwaanendael in 1631. The area was later taken over by the English, who established the three counties of New Castle, Kent, and Sussex in 1682.
During the American Revolution, Delaware was a major supplier of gunpowder and other supplies to the Continental Army. The state was also the site of several important battles, including the Battle of Cooch’s Bridge in 1777. After the war, Delaware became a prosperous agricultural state, and its economy was based on the production of wheat, corn, and other grains.
In the 19th century, Delaware became an important industrial center, with the development of the DuPont Company and other major industries. The state also became a major transportation hub, with the construction of the Chesapeake and Delaware Canal in 1829.
In the 20th century, Delaware became a major center for banking and finance, and it is now home to several major corporations, including DuPont, AstraZeneca, and Bank of America. The state is also home to several universities, including the University of Delaware and Delaware State University.
Geography
Delaware is located in the Mid-Atlantic region of the United States, bordered by Pennsylvania to the north, Maryland to the south, and the Atlantic Ocean to the east. The state is divided into three counties: New Castle, Kent, and Sussex. The state has a total area of 1,982 square miles, making it the second smallest state in the country.
The state is mostly flat, with the highest point being Ebright Azimuth, which is located at 447 feet above sea level. The state is home to several rivers, including the Delaware River, which forms the eastern border of the state. The state also has several lakes, including Silver Lake and Trap Pond.
Economy
Delaware has a diverse economy, with a mix of manufacturing, services, and agriculture. The state’s largest industries are chemical manufacturing, finance, and insurance. The state is also home to several major corporations, including DuPont, AstraZeneca, and Bank of America.
Agriculture is an important part of the state’s economy, with the production of corn, soybeans, wheat, and other grains. The state is also home to several wineries and breweries, as well as a thriving seafood industry.
Demographics
As of 2019, Delaware had a population of 973,764, making it the 45th most populous state in the country. The state has a population density of 488 people per square mile, making it the sixth most densely populated state in the country.
The largest racial group in Delaware is White, making up 62.3% of the population. African Americans make up 22.2% of the population, while Hispanics and Latinos make up 8.7%. The state also has a large Asian population, making up 4.3% of the population.
The median household income in Delaware is $62,852, and the median home value is $239,400. The state has a poverty rate of 11.2%, and the unemployment rate is 4.2%.
Common Questions
What is Per Capita Income in Bear?
Per Capita income in Bear is $38,426.
What is the Median Family Income in Bear?
Median Family Income in Bear is $90,629.
What is the Median Household income in Bear?
Median Household Income in Bear is $83,852.
What is Income or Wage Gap in Bear?
Income or Wage Gap in Bear is 24.4%.
Women in Bear earn 75.6 cents for every dollar earned by a man.
What is Family Income Deficit in Bear?
Family Income Deficit in Bear is $8,181.
Families that are below poverty line in Bear earn $8,181 less on average than the poverty threshold level.
What is Inequality or Gini Index in Bear?
Inequality or Gini Index in Bear is 0.38.
What is the Total Population of Bear?
Total Population of Bear is 23,070.
What is the Total Male Population of Bear?
Total Male Population of Bear is 11,316.
What is the Total Female Population of Bear?
Total Female Population of Bear is 11,754.
What is the Ratio of Males per 100 Females in Bear?
There are 96.27 Males per 100 Females in Bear.
What is the Ratio of Females per 100 Males in Bear?
There are 103.87 Females per 100 Males in Bear.
What is the Median Population Age in Bear?
Median Population Age in Bear is 37.7 Years.
What is the Average Family Size in Bear
Average Family Size in Bear is 3.5 People.
What is the Average Household Size in Bear
Average Household Size in Bear is 2.7 People.
How Large is the Labor Force in Bear?
There are 13,780 People in the Labor Forcein in Bear.
What is the Percentage of People in the Labor Force in Bear?
74.0% of People are in the Labor Force in Bear.
What is the Unemployment Rate in Bear?
Unemployment Rate in Bear is 7.7%.