Newark, DE Map & Demographics
Newark Map
Newark Overview
$32,240
PER CAPITA INCOME
$106,453
AVG FAMILY INCOME
$67,738
AVG HOUSEHOLD INCOME
61.7%
WAGE / INCOME GAP [ % ]
38.3¢/ $1
WAGE / INCOME GAP [ $ ]
$11,979
FAMILY INCOME DEFICIT
0.48
INEQUALITY / GINI INDEX
30,655
TOTAL POPULATION
14,781
MALE POPULATION
15,874
FEMALE POPULATION
93.11
MALES / 100 FEMALES
107.39
FEMALES / 100 MALES
22.6
MEDIAN AGE
3.1
AVG FAMILY SIZE
2.5
AVG HOUSEHOLD SIZE
14,389
LABOR FORCE [ PEOPLE ]
52.0%
PERCENT IN LABOR FORCE
7.0%
UNEMPLOYMENT RATE
Newark Area Codes
Income in Newark
Income Overview in Newark
Per Capita Income in Newark is $32,240, while median incomes of families and households are $106,453 and $67,738 respectively.
| Characteristic | Number | Measure |
| Per Capita Income | 30,655 | $32,240 |
| Median Family Income | 4,300 | $106,453 |
| Mean Family Income | 4,300 | $130,529 |
| Median Household Income | 9,191 | $67,738 |
| Mean Household Income | 9,191 | $89,617 |
| Income Deficit | 4,300 | $11,979 |
| Wage / Income Gap (%) | 30,655 | 61.72% |
| Wage / Income Gap ($) | 30,655 | 38.28¢ per $1 |
| Gini / Inequality Index | 30,655 | 0.48 |
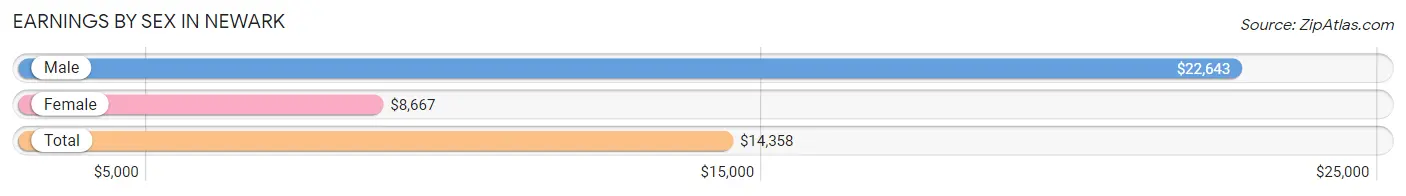
Earnings by Sex in Newark
Average Earnings in Newark are $14,358, $22,643 for men and $8,667 for women, a difference of 61.7%.
| Sex | Number | Average Earnings |
| Male | 9,052 (47.6%) | $22,643 |
| Female | 9,981 (52.4%) | $8,667 |
| Total | 19,033 (100.0%) | $14,358 |
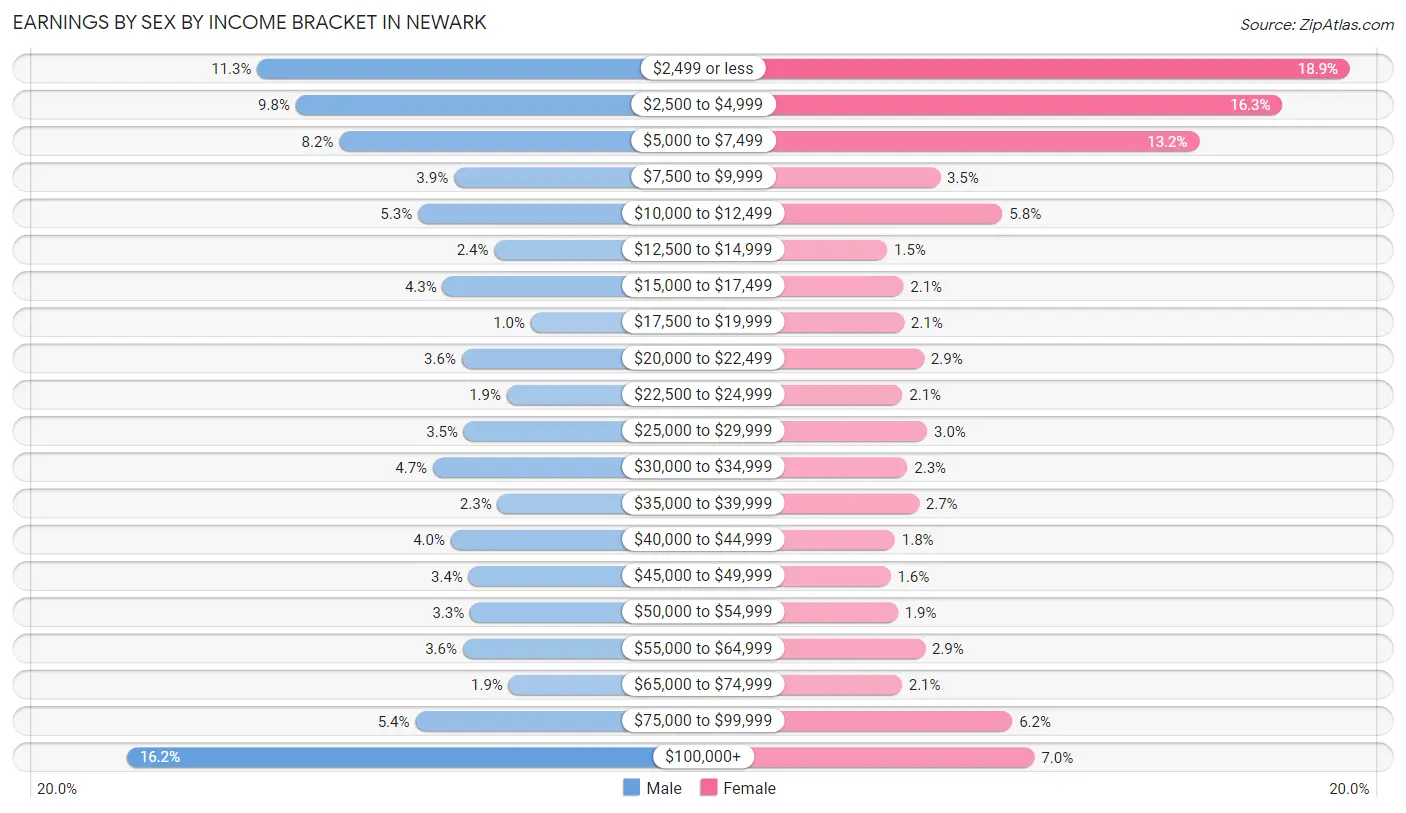
Earnings by Sex by Income Bracket in Newark
The most common earnings brackets in Newark are $100,000+ for men (1,464 | 16.2%) and $2,499 or less for women (1,881 | 18.9%).
| Income | Male | Female |
| $2,499 or less | 1,021 (11.3%) | 1,881 (18.9%) |
| $2,500 to $4,999 | 891 (9.8%) | 1,629 (16.3%) |
| $5,000 to $7,499 | 743 (8.2%) | 1,318 (13.2%) |
| $7,500 to $9,999 | 354 (3.9%) | 348 (3.5%) |
| $10,000 to $12,499 | 476 (5.3%) | 582 (5.8%) |
| $12,500 to $14,999 | 217 (2.4%) | 151 (1.5%) |
| $15,000 to $17,499 | 393 (4.3%) | 212 (2.1%) |
| $17,500 to $19,999 | 93 (1.0%) | 214 (2.1%) |
| $20,000 to $22,499 | 328 (3.6%) | 288 (2.9%) |
| $22,500 to $24,999 | 175 (1.9%) | 208 (2.1%) |
| $25,000 to $29,999 | 320 (3.5%) | 300 (3.0%) |
| $30,000 to $34,999 | 425 (4.7%) | 227 (2.3%) |
| $35,000 to $39,999 | 206 (2.3%) | 269 (2.7%) |
| $40,000 to $44,999 | 365 (4.0%) | 180 (1.8%) |
| $45,000 to $49,999 | 304 (3.4%) | 164 (1.6%) |
| $50,000 to $54,999 | 300 (3.3%) | 191 (1.9%) |
| $55,000 to $64,999 | 324 (3.6%) | 292 (2.9%) |
| $65,000 to $74,999 | 168 (1.9%) | 206 (2.1%) |
| $75,000 to $99,999 | 485 (5.4%) | 619 (6.2%) |
| $100,000+ | 1,464 (16.2%) | 702 (7.0%) |
| Total | 9,052 (100.0%) | 9,981 (100.0%) |
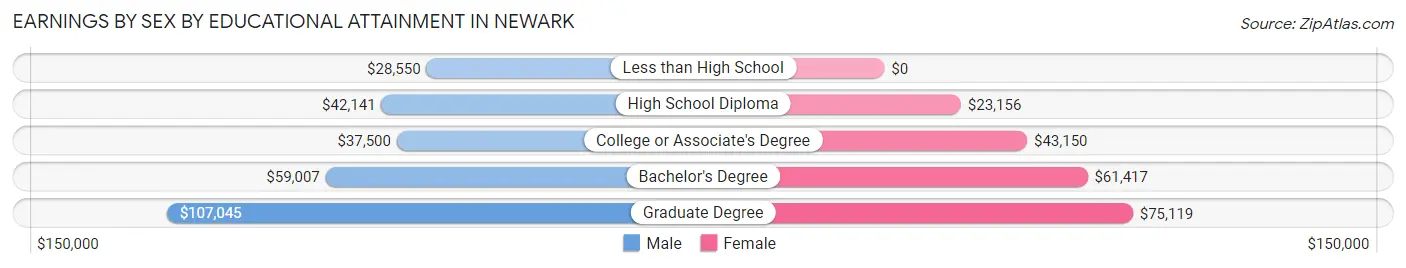
Earnings by Sex by Educational Attainment in Newark
Average earnings in Newark are $51,102 for men and $49,671 for women, a difference of 2.8%. Men with an educational attainment of graduate degree enjoy the highest average annual earnings of $107,045, while those with less than high school education earn the least with $28,550. Women with an educational attainment of graduate degree earn the most with the average annual earnings of $75,119, while those with high school diploma education have the smallest earnings of $23,156.
| Educational Attainment | Male Income | Female Income |
| Less than High School | $28,550 | $0 |
| High School Diploma | $42,141 | $23,156 |
| College or Associate's Degree | $37,500 | $43,150 |
| Bachelor's Degree | $59,007 | $61,417 |
| Graduate Degree | $107,045 | $75,119 |
| Total | $51,102 | $49,671 |
Family Income in Newark
Family Income Brackets in Newark
According to the Newark family income data, there are 899 families falling into the $100,000 to $149,999 income range, which is the most common income bracket and makes up 20.9% of all families. Conversely, the $10,000 to $14,999 income bracket is the least frequent group with only 26 families (0.6%) belonging to this category.
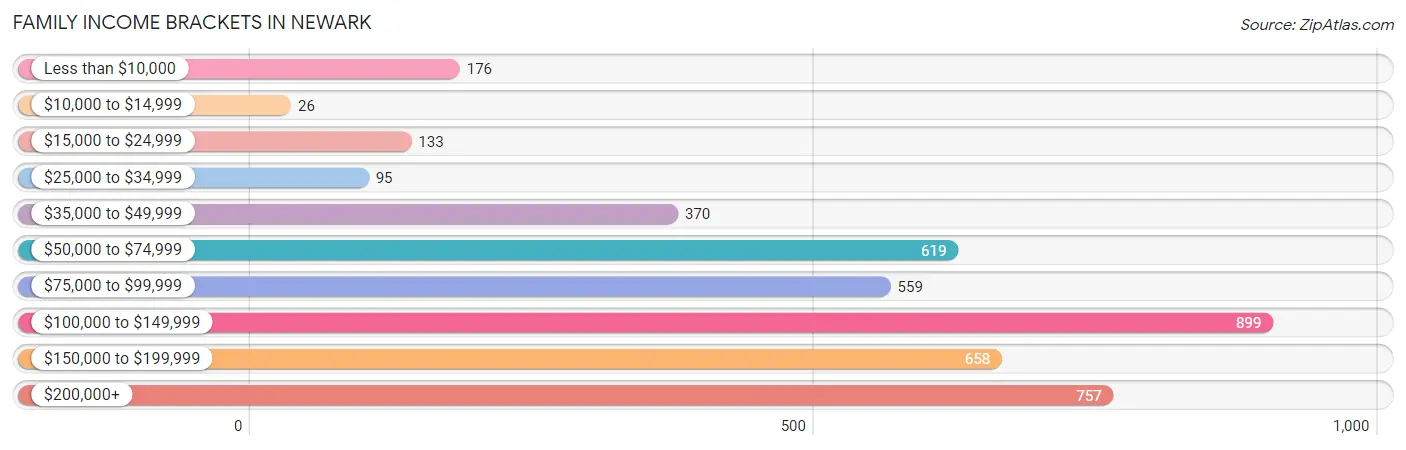
| Income Bracket | # Families | % Families |
| Less than $10,000 | 176 | 4.1% |
| $10,000 to $14,999 | 26 | 0.6% |
| $15,000 to $24,999 | 133 | 3.1% |
| $25,000 to $34,999 | 95 | 2.2% |
| $35,000 to $49,999 | 370 | 8.6% |
| $50,000 to $74,999 | 619 | 14.4% |
| $75,000 to $99,999 | 559 | 13.0% |
| $100,000 to $149,999 | 899 | 20.9% |
| $150,000 to $199,999 | 658 | 15.3% |
| $200,000+ | 757 | 17.6% |
Family Income by Famaliy Size in Newark
4-person families (746 | 17.3%) account for the highest median family income in Newark with $156,750 per family, while 2-person families (2,237 | 52.0%) have the highest median income of $49,132 per family member.
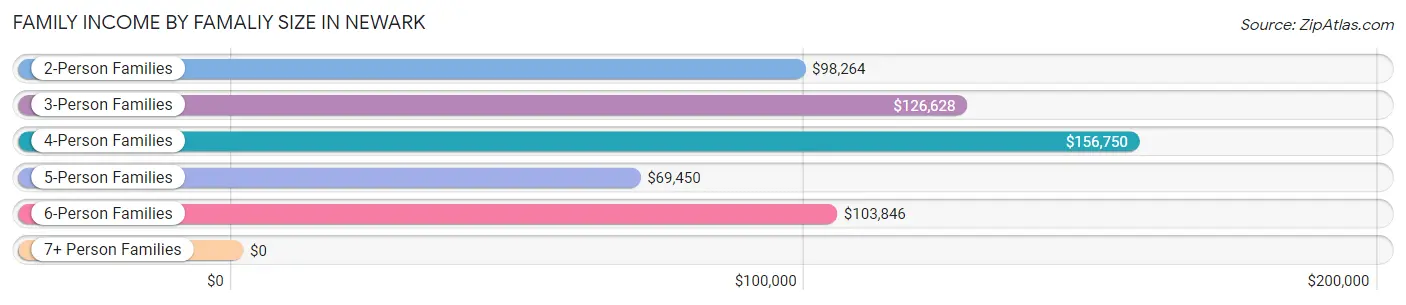
| Income Bracket | # Families | Median Income |
| 2-Person Families | 2,237 (52.0%) | $98,264 |
| 3-Person Families | 880 (20.5%) | $126,628 |
| 4-Person Families | 746 (17.3%) | $156,750 |
| 5-Person Families | 326 (7.6%) | $69,450 |
| 6-Person Families | 100 (2.3%) | $103,846 |
| 7+ Person Families | 11 (0.3%) | $0 |
| Total | 4,300 (100.0%) | $106,453 |
Family Income by Number of Earners in Newark
The median family income in Newark is $106,453, with families comprising 3+ earners (351) having the highest median family income of $161,402, while families with no earners (878) have the lowest median family income of $84,702, accounting for 8.2% and 20.4% of families, respectively.
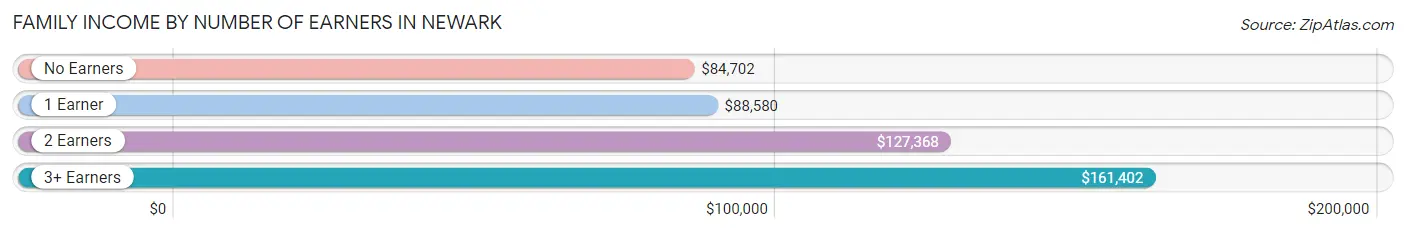
| Number of Earners | # Families | Median Income |
| No Earners | 878 (20.4%) | $84,702 |
| 1 Earner | 1,209 (28.1%) | $88,580 |
| 2 Earners | 1,862 (43.3%) | $127,368 |
| 3+ Earners | 351 (8.2%) | $161,402 |
| Total | 4,300 (100.0%) | $106,453 |
Household Income in Newark
Household Income Brackets in Newark
With 1,360 households falling in the category, the $100,000 to $149,999 income range is the most frequent in Newark, accounting for 14.8% of all households. In contrast, only 276 households (3.0%) fall into the $10,000 to $14,999 income bracket, making it the least populous group.
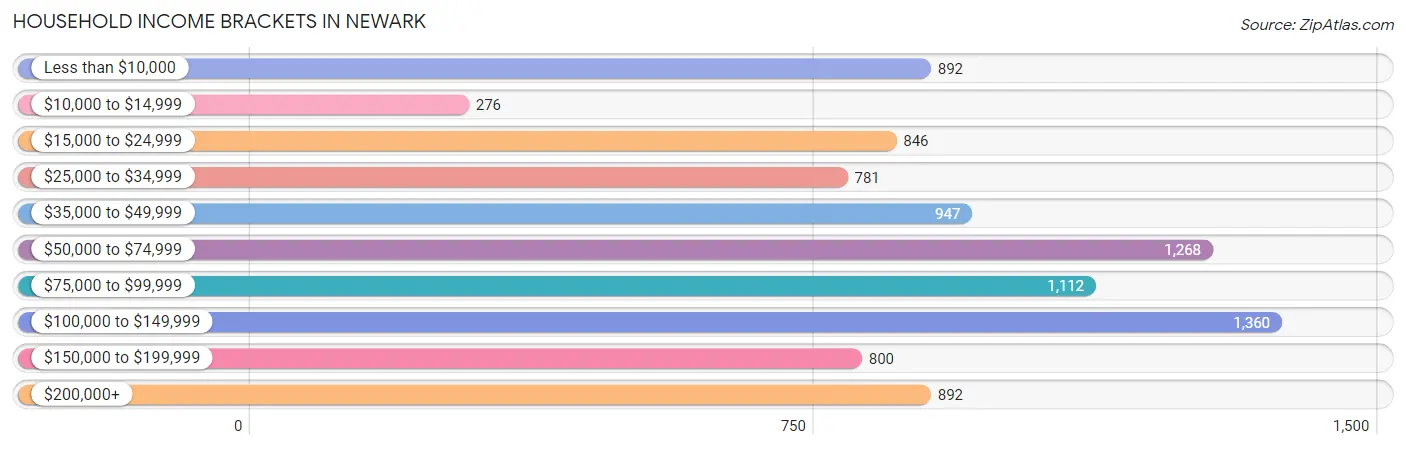
| Income Bracket | # Households | % Households |
| Less than $10,000 | 892 | 9.7% |
| $10,000 to $14,999 | 276 | 3.0% |
| $15,000 to $24,999 | 846 | 9.2% |
| $25,000 to $34,999 | 781 | 8.5% |
| $35,000 to $49,999 | 947 | 10.3% |
| $50,000 to $74,999 | 1,268 | 13.8% |
| $75,000 to $99,999 | 1,112 | 12.1% |
| $100,000 to $149,999 | 1,360 | 14.8% |
| $150,000 to $199,999 | 800 | 8.7% |
| $200,000+ | 892 | 9.7% |
Household Income by Householder Age in Newark
The median household income in Newark is $67,738, with the highest median household income of $100,795 found in the 45 to 64 years age bracket for the primary householder. A total of 2,407 households (26.2%) fall into this category. Meanwhile, the 15 to 24 years age bracket for the primary householder has the lowest median household income of $16,632, with 1,836 households (20.0%) in this group.
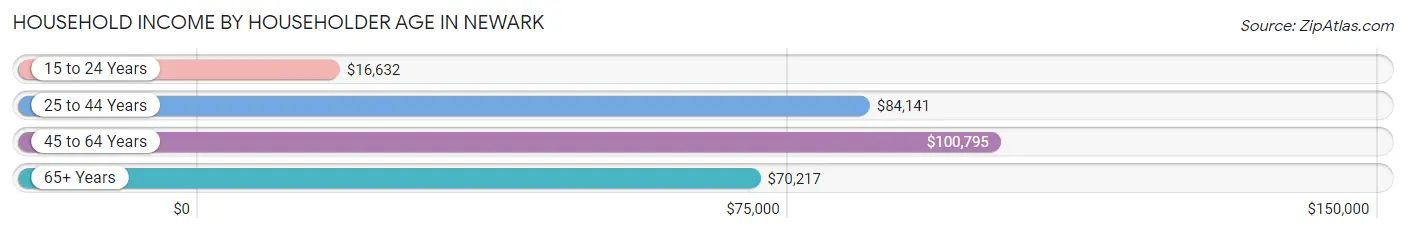
| Income Bracket | # Households | Median Income |
| 15 to 24 Years | 1,836 (20.0%) | $16,632 |
| 25 to 44 Years | 2,460 (26.8%) | $84,141 |
| 45 to 64 Years | 2,407 (26.2%) | $100,795 |
| 65+ Years | 2,488 (27.1%) | $70,217 |
| Total | 9,191 (100.0%) | $67,738 |
Poverty in Newark
Income Below Poverty by Sex and Age in Newark
With 23.5% poverty level for males and 25.4% for females among the residents of Newark, 18 to 24 year old males and 18 to 24 year old females are the most vulnerable to poverty, with 2,037 males (61.9%) and 2,169 females (71.9%) in their respective age groups living below the poverty level.
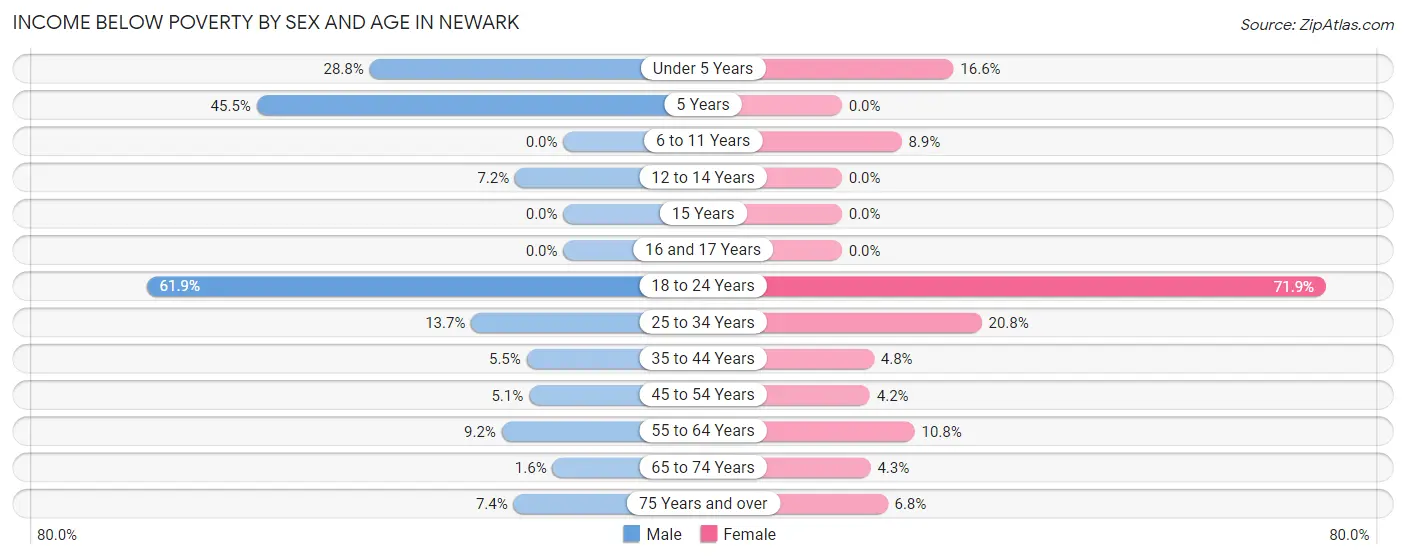
| Age Bracket | Male | Female |
| Under 5 Years | 97 (28.8%) | 60 (16.6%) |
| 5 Years | 46 (45.5%) | 0 (0.0%) |
| 6 to 11 Years | 0 (0.0%) | 72 (8.9%) |
| 12 to 14 Years | 18 (7.2%) | 0 (0.0%) |
| 15 Years | 0 (0.0%) | 0 (0.0%) |
| 16 and 17 Years | 0 (0.0%) | 0 (0.0%) |
| 18 to 24 Years | 2,037 (61.9%) | 2,169 (71.9%) |
| 25 to 34 Years | 289 (13.7%) | 293 (20.7%) |
| 35 to 44 Years | 60 (5.4%) | 36 (4.8%) |
| 45 to 54 Years | 51 (5.1%) | 42 (4.2%) |
| 55 to 64 Years | 93 (9.2%) | 145 (10.8%) |
| 65 to 74 Years | 14 (1.6%) | 48 (4.3%) |
| 75 Years and over | 64 (7.4%) | 68 (6.8%) |
| Total | 2,769 (23.5%) | 2,933 (25.4%) |
Income Above Poverty by Sex and Age in Newark
According to the poverty statistics in Newark, males aged 6 to 11 years and females aged 5 years are the age groups that are most secure financially, with 100.0% of males and 100.0% of females in these age groups living above the poverty line.
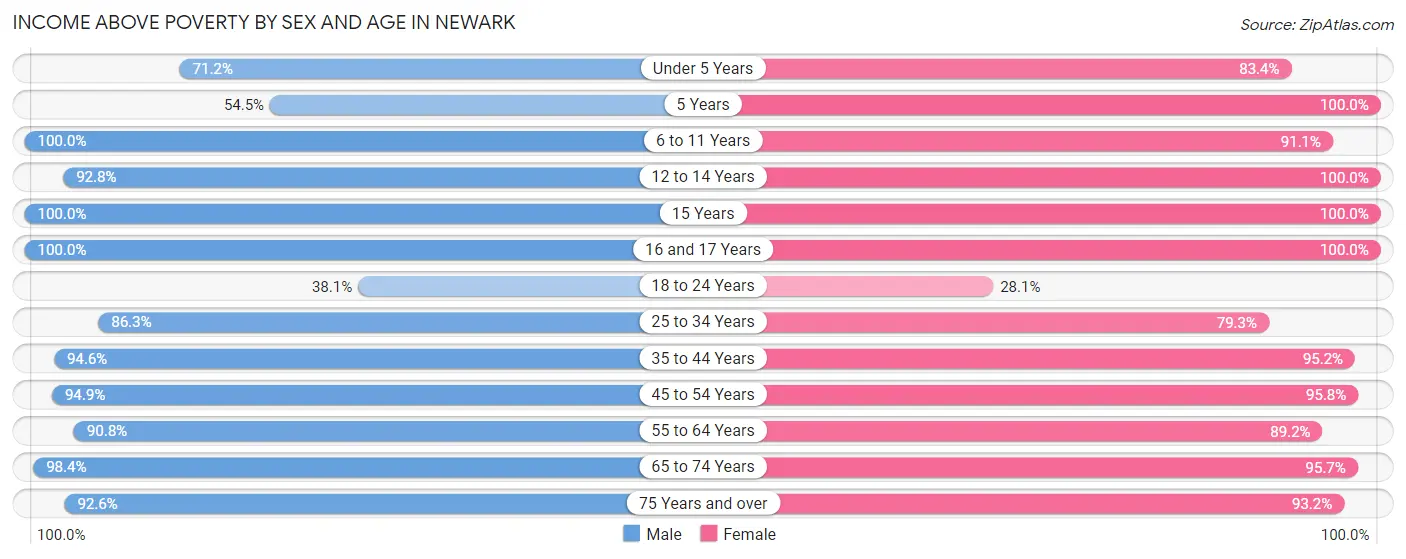
| Age Bracket | Male | Female |
| Under 5 Years | 240 (71.2%) | 302 (83.4%) |
| 5 Years | 55 (54.5%) | 72 (100.0%) |
| 6 to 11 Years | 428 (100.0%) | 741 (91.1%) |
| 12 to 14 Years | 233 (92.8%) | 358 (100.0%) |
| 15 Years | 177 (100.0%) | 85 (100.0%) |
| 16 and 17 Years | 239 (100.0%) | 191 (100.0%) |
| 18 to 24 Years | 1,255 (38.1%) | 848 (28.1%) |
| 25 to 34 Years | 1,823 (86.3%) | 1,119 (79.2%) |
| 35 to 44 Years | 1,041 (94.6%) | 720 (95.2%) |
| 45 to 54 Years | 950 (94.9%) | 965 (95.8%) |
| 55 to 64 Years | 922 (90.8%) | 1,197 (89.2%) |
| 65 to 74 Years | 855 (98.4%) | 1,079 (95.7%) |
| 75 Years and over | 801 (92.6%) | 934 (93.2%) |
| Total | 9,019 (76.5%) | 8,611 (74.6%) |
Income Below Poverty Among Married-Couple Families in Newark
The poverty statistics for married-couple families in Newark show that 5.2% or 185 of the total 3,563 families live below the poverty line. Families with 1 or 2 children have the highest poverty rate of 7.8%, comprising of 76 families. On the other hand, families with 3 or 4 children have the lowest poverty rate of 0.4%, which includes 1 families.
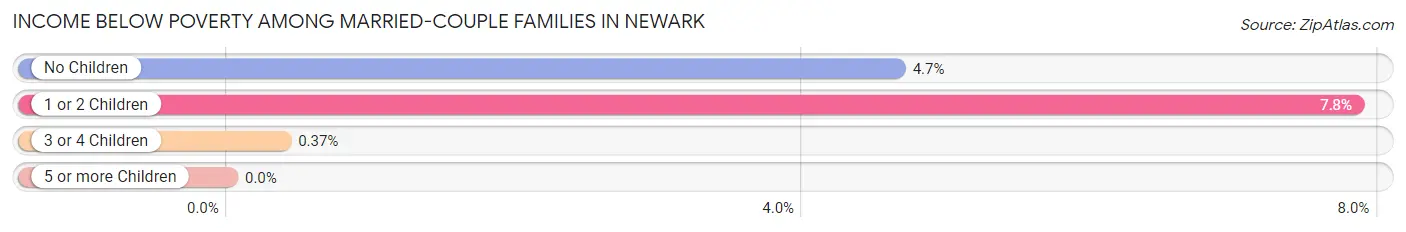
| Children | Above Poverty | Below Poverty |
| No Children | 2,214 (95.4%) | 108 (4.6%) |
| 1 or 2 Children | 893 (92.2%) | 76 (7.8%) |
| 3 or 4 Children | 271 (99.6%) | 1 (0.4%) |
| 5 or more Children | 0 (0.0%) | 0 (0.0%) |
| Total | 3,378 (94.8%) | 185 (5.2%) |
Income Below Poverty Among Single-Parent Households in Newark
According to the poverty data in Newark, 15.4% or 35 single-father households and 19.0% or 97 single-mother households are living below the poverty line. Among single-father households, those with no children have the highest poverty rate, with 35 households (33.7%) experiencing poverty. Likewise, among single-mother households, those with 3 or 4 children have the highest poverty rate, with 27 households (45.0%) falling below the poverty line.
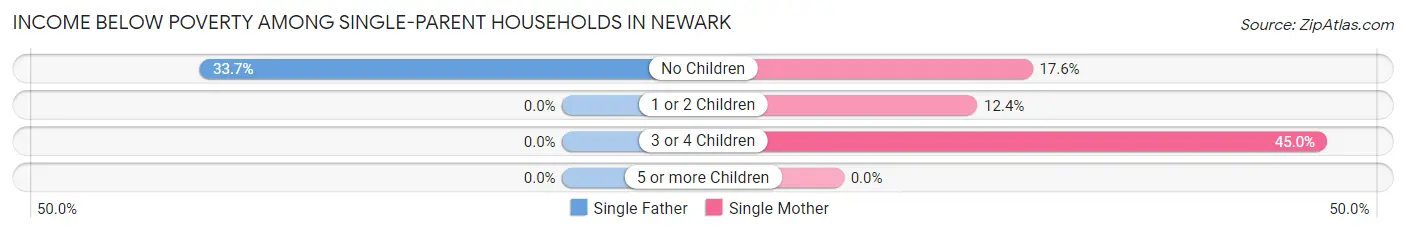
| Children | Single Father | Single Mother |
| No Children | 35 (33.7%) | 48 (17.6%) |
| 1 or 2 Children | 0 (0.0%) | 22 (12.4%) |
| 3 or 4 Children | 0 (0.0%) | 27 (45.0%) |
| 5 or more Children | 0 (0.0%) | 0 (0.0%) |
| Total | 35 (15.4%) | 97 (19.0%) |
Income Below Poverty Among Married-Couple vs Single-Parent Households in Newark
The poverty data for Newark shows that 185 of the married-couple family households (5.2%) and 132 of the single-parent households (17.9%) are living below the poverty level. Within the married-couple family households, those with 1 or 2 children have the highest poverty rate, with 76 households (7.8%) falling below the poverty line. Among the single-parent households, those with 3 or 4 children have the highest poverty rate, with 27 household (45.0%) living below poverty.
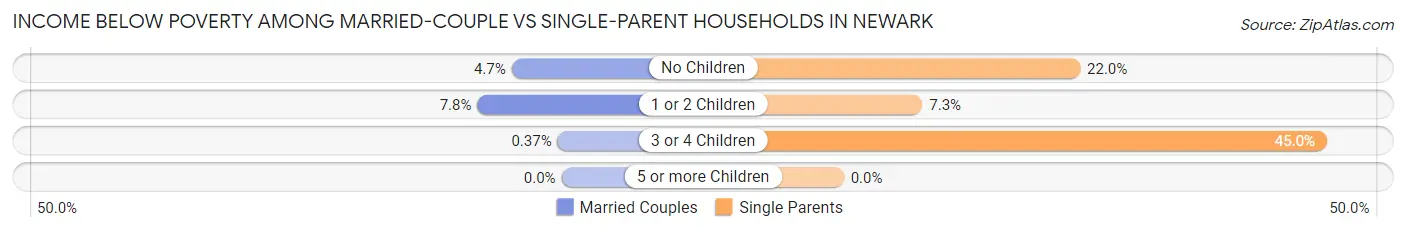
| Children | Married-Couple Families | Single-Parent Households |
| No Children | 108 (4.6%) | 83 (22.0%) |
| 1 or 2 Children | 76 (7.8%) | 22 (7.3%) |
| 3 or 4 Children | 1 (0.4%) | 27 (45.0%) |
| 5 or more Children | 0 (0.0%) | 0 (0.0%) |
| Total | 185 (5.2%) | 132 (17.9%) |
Race in Newark
The most populous races in Newark are White / Caucasian (21,564 | 70.3%), Hispanic or Latino (3,239 | 10.6%), and Two or more Races (3,037 | 9.9%).
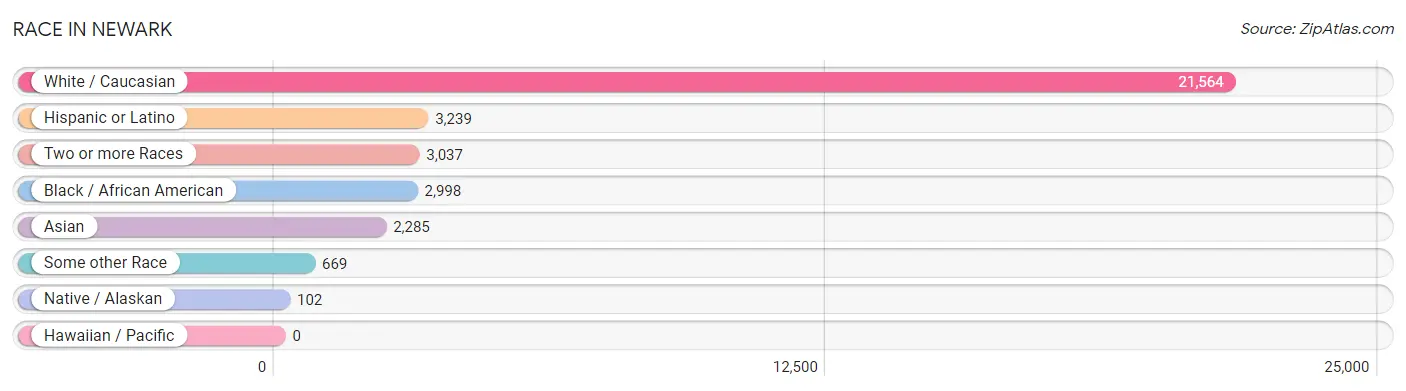
| Race | # Population | % Population |
| Asian | 2,285 | 7.4% |
| Black / African American | 2,998 | 9.8% |
| Hawaiian / Pacific | 0 | 0.0% |
| Hispanic or Latino | 3,239 | 10.6% |
| Native / Alaskan | 102 | 0.3% |
| White / Caucasian | 21,564 | 70.3% |
| Two or more Races | 3,037 | 9.9% |
| Some other Race | 669 | 2.2% |
| Total | 30,655 | 100.0% |
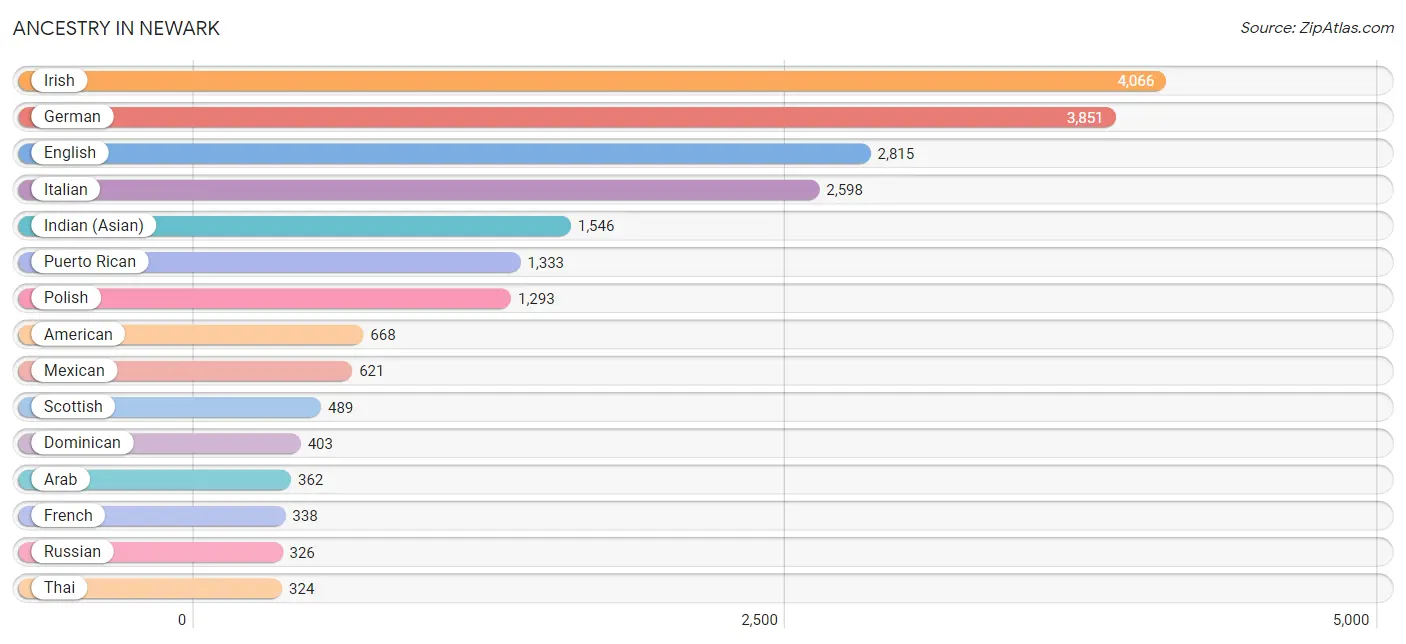
Ancestry in Newark
The most populous ancestries reported in Newark are Irish (4,066 | 13.3%), German (3,851 | 12.6%), English (2,815 | 9.2%), Italian (2,598 | 8.5%), and Indian (Asian) (1,546 | 5.0%), together accounting for 48.5% of all Newark residents.
| Ancestry | # Population | % Population |
| African | 84 | 0.3% |
| Albanian | 57 | 0.2% |
| American | 668 | 2.2% |
| Arab | 362 | 1.2% |
| Argentinean | 116 | 0.4% |
| Armenian | 26 | 0.1% |
| Australian | 25 | 0.1% |
| Austrian | 67 | 0.2% |
| Belgian | 34 | 0.1% |
| Bhutanese | 22 | 0.1% |
| Bolivian | 28 | 0.1% |
| Brazilian | 46 | 0.2% |
| British | 240 | 0.8% |
| British West Indian | 19 | 0.1% |
| Burmese | 120 | 0.4% |
| Canadian | 51 | 0.2% |
| Carpatho Rusyn | 26 | 0.1% |
| Central American | 146 | 0.5% |
| Central American Indian | 49 | 0.2% |
| Cherokee | 58 | 0.2% |
| Colombian | 121 | 0.4% |
| Croatian | 21 | 0.1% |
| Cuban | 44 | 0.1% |
| Czech | 39 | 0.1% |
| Danish | 113 | 0.4% |
| Delaware | 6 | 0.0% |
| Dominican | 403 | 1.3% |
| Dutch | 286 | 0.9% |
| Eastern European | 120 | 0.4% |
| Ecuadorian | 15 | 0.1% |
| Egyptian | 15 | 0.1% |
| English | 2,815 | 9.2% |
| Estonian | 12 | 0.0% |
| Ethiopian | 19 | 0.1% |
| European | 304 | 1.0% |
| Finnish | 21 | 0.1% |
| French | 338 | 1.1% |
| French American Indian | 9 | 0.0% |
| French Canadian | 173 | 0.6% |
| German | 3,851 | 12.6% |
| Ghanaian | 86 | 0.3% |
| Greek | 281 | 0.9% |
| Guatemalan | 6 | 0.0% |
| Guyanese | 26 | 0.1% |
| Haitian | 3 | 0.0% |
| Honduran | 101 | 0.3% |
| Hungarian | 84 | 0.3% |
| Indian (Asian) | 1,546 | 5.0% |
| Indonesian | 23 | 0.1% |
| Iranian | 97 | 0.3% |
| Irish | 4,066 | 13.3% |
| Israeli | 17 | 0.1% |
| Italian | 2,598 | 8.5% |
| Jamaican | 66 | 0.2% |
| Kenyan | 4 | 0.0% |
| Korean | 175 | 0.6% |
| Laotian | 86 | 0.3% |
| Lebanese | 104 | 0.3% |
| Liberian | 8 | 0.0% |
| Lithuanian | 65 | 0.2% |
| Lumbee | 13 | 0.0% |
| Malaysian | 18 | 0.1% |
| Maltese | 6 | 0.0% |
| Mexican | 621 | 2.0% |
| Nigerian | 13 | 0.0% |
| Northern European | 64 | 0.2% |
| Norwegian | 94 | 0.3% |
| Pakistani | 4 | 0.0% |
| Panamanian | 27 | 0.1% |
| Pennsylvania German | 31 | 0.1% |
| Peruvian | 16 | 0.1% |
| Polish | 1,293 | 4.2% |
| Portuguese | 58 | 0.2% |
| Puerto Rican | 1,333 | 4.3% |
| Romanian | 20 | 0.1% |
| Russian | 326 | 1.1% |
| Salvadoran | 12 | 0.0% |
| Scandinavian | 80 | 0.3% |
| Scotch-Irish | 221 | 0.7% |
| Scottish | 489 | 1.6% |
| Serbian | 87 | 0.3% |
| Slavic | 4 | 0.0% |
| Slovak | 72 | 0.2% |
| Slovene | 9 | 0.0% |
| South African | 42 | 0.1% |
| South American | 296 | 1.0% |
| Spaniard | 317 | 1.0% |
| Spanish | 16 | 0.1% |
| Sri Lankan | 49 | 0.2% |
| Subsaharan African | 302 | 1.0% |
| Swedish | 134 | 0.4% |
| Swiss | 192 | 0.6% |
| Syrian | 45 | 0.2% |
| Thai | 324 | 1.1% |
| Turkish | 198 | 0.6% |
| Ukrainian | 104 | 0.3% |
| Vietnamese | 18 | 0.1% |
| Welsh | 146 | 0.5% |
| West Indian | 35 | 0.1% |
| Yugoslavian | 9 | 0.0% | View All 100 Rows |
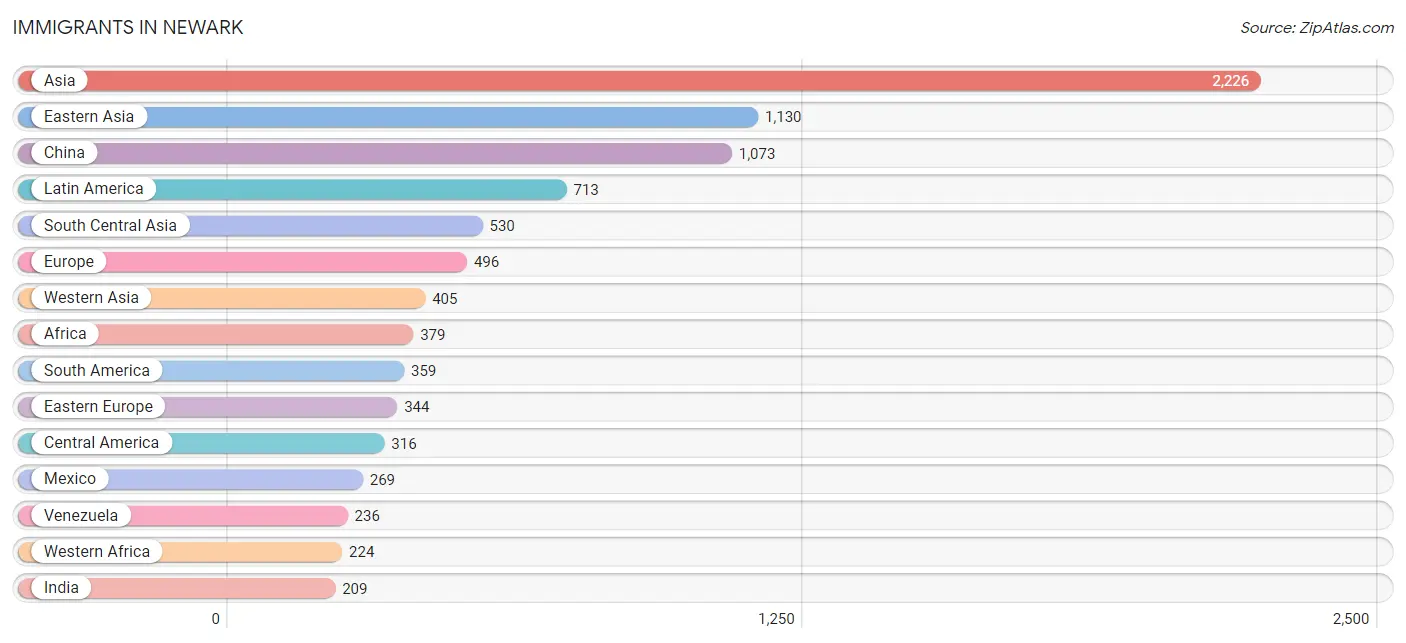
Immigrants in Newark
The most numerous immigrant groups reported in Newark came from Asia (2,226 | 7.3%), Eastern Asia (1,130 | 3.7%), China (1,073 | 3.5%), Latin America (713 | 2.3%), and South Central Asia (530 | 1.7%), together accounting for 18.5% of all Newark residents.
| Immigration Origin | # Population | % Population |
| Africa | 379 | 1.2% |
| Albania | 34 | 0.1% |
| Argentina | 10 | 0.0% |
| Asia | 2,226 | 7.3% |
| Australia | 12 | 0.0% |
| Bangladesh | 18 | 0.1% |
| Brazil | 84 | 0.3% |
| Canada | 130 | 0.4% |
| Caribbean | 38 | 0.1% |
| Central America | 316 | 1.0% |
| China | 1,073 | 3.5% |
| Colombia | 29 | 0.1% |
| Czechoslovakia | 10 | 0.0% |
| Dominican Republic | 3 | 0.0% |
| Eastern Africa | 78 | 0.3% |
| Eastern Asia | 1,130 | 3.7% |
| Eastern Europe | 344 | 1.1% |
| England | 10 | 0.0% |
| Ethiopia | 19 | 0.1% |
| Europe | 496 | 1.6% |
| France | 25 | 0.1% |
| Germany | 10 | 0.0% |
| Ghana | 70 | 0.2% |
| Guatemala | 5 | 0.0% |
| Honduras | 42 | 0.1% |
| Hungary | 10 | 0.0% |
| India | 209 | 0.7% |
| Indonesia | 38 | 0.1% |
| Iran | 136 | 0.4% |
| Italy | 4 | 0.0% |
| Jamaica | 24 | 0.1% |
| Japan | 13 | 0.0% |
| Kenya | 59 | 0.2% |
| Korea | 44 | 0.1% |
| Latin America | 713 | 2.3% |
| Lebanon | 4 | 0.0% |
| Liberia | 8 | 0.0% |
| Mexico | 269 | 0.9% |
| Nepal | 22 | 0.1% |
| Netherlands | 62 | 0.2% |
| Nigeria | 146 | 0.5% |
| Northern Africa | 48 | 0.2% |
| Northern Europe | 24 | 0.1% |
| Oceania | 12 | 0.0% |
| Pakistan | 27 | 0.1% |
| Philippines | 9 | 0.0% |
| Poland | 72 | 0.2% |
| Portugal | 27 | 0.1% |
| Russia | 81 | 0.3% |
| Saudi Arabia | 88 | 0.3% |
| Serbia | 87 | 0.3% |
| South Africa | 29 | 0.1% |
| South America | 359 | 1.2% |
| South Central Asia | 530 | 1.7% |
| South Eastern Asia | 161 | 0.5% |
| Southern Europe | 31 | 0.1% |
| Syria | 22 | 0.1% |
| Taiwan | 30 | 0.1% |
| Thailand | 18 | 0.1% |
| Turkey | 131 | 0.4% |
| Ukraine | 50 | 0.2% |
| Venezuela | 236 | 0.8% |
| Vietnam | 96 | 0.3% |
| Western Africa | 224 | 0.7% |
| Western Asia | 405 | 1.3% |
| Western Europe | 97 | 0.3% | View All 66 Rows |
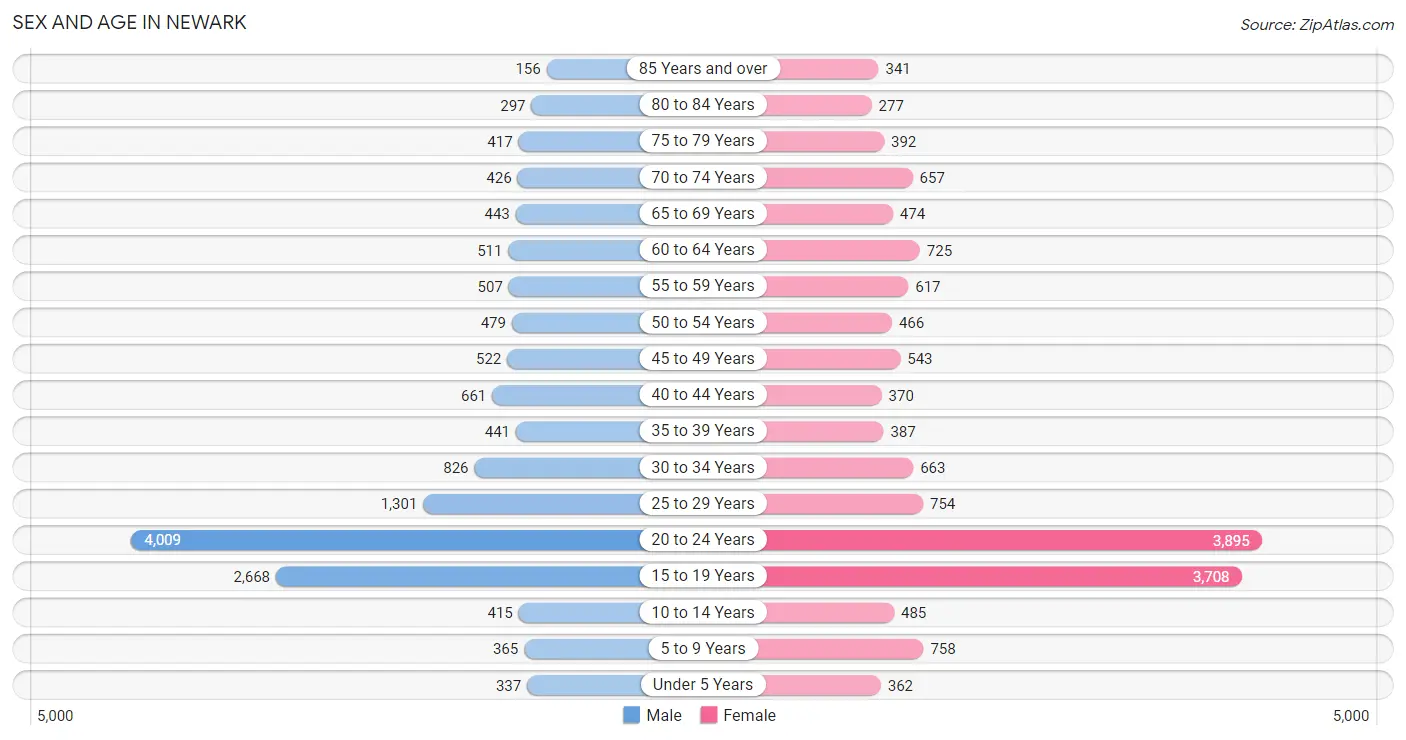
Sex and Age in Newark
Sex and Age in Newark
The most populous age groups in Newark are 20 to 24 Years (4,009 | 27.1%) for men and 20 to 24 Years (3,895 | 24.5%) for women.
| Age Bracket | Male | Female |
| Under 5 Years | 337 (2.3%) | 362 (2.3%) |
| 5 to 9 Years | 365 (2.5%) | 758 (4.8%) |
| 10 to 14 Years | 415 (2.8%) | 485 (3.1%) |
| 15 to 19 Years | 2,668 (18.0%) | 3,708 (23.4%) |
| 20 to 24 Years | 4,009 (27.1%) | 3,895 (24.5%) |
| 25 to 29 Years | 1,301 (8.8%) | 754 (4.8%) |
| 30 to 34 Years | 826 (5.6%) | 663 (4.2%) |
| 35 to 39 Years | 441 (3.0%) | 387 (2.4%) |
| 40 to 44 Years | 661 (4.5%) | 370 (2.3%) |
| 45 to 49 Years | 522 (3.5%) | 543 (3.4%) |
| 50 to 54 Years | 479 (3.2%) | 466 (2.9%) |
| 55 to 59 Years | 507 (3.4%) | 617 (3.9%) |
| 60 to 64 Years | 511 (3.5%) | 725 (4.6%) |
| 65 to 69 Years | 443 (3.0%) | 474 (3.0%) |
| 70 to 74 Years | 426 (2.9%) | 657 (4.1%) |
| 75 to 79 Years | 417 (2.8%) | 392 (2.5%) |
| 80 to 84 Years | 297 (2.0%) | 277 (1.7%) |
| 85 Years and over | 156 (1.1%) | 341 (2.1%) |
| Total | 14,781 (100.0%) | 15,874 (100.0%) |
Families and Households in Newark
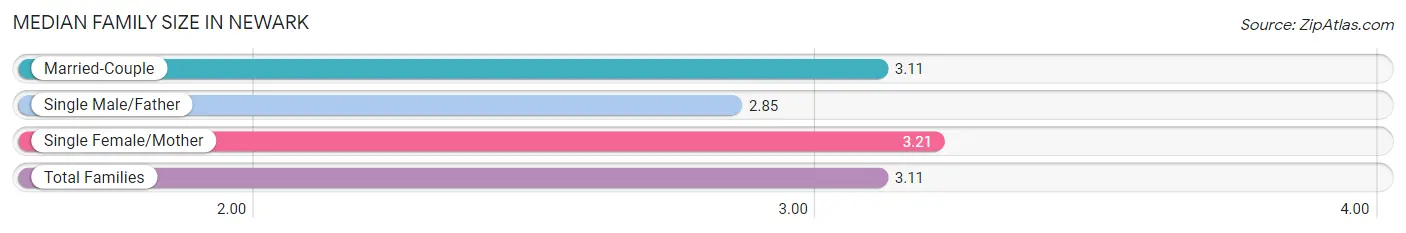
Median Family Size in Newark
The median family size in Newark is 3.11 persons per family, with single female/mother families (510 | 11.9%) accounting for the largest median family size of 3.21 persons per family. On the other hand, single male/father families (227 | 5.3%) represent the smallest median family size with 2.85 persons per family.
| Family Type | # Families | Family Size |
| Married-Couple | 3,563 (82.9%) | 3.11 |
| Single Male/Father | 227 (5.3%) | 2.85 |
| Single Female/Mother | 510 (11.9%) | 3.21 |
| Total Families | 4,300 (100.0%) | 3.11 |
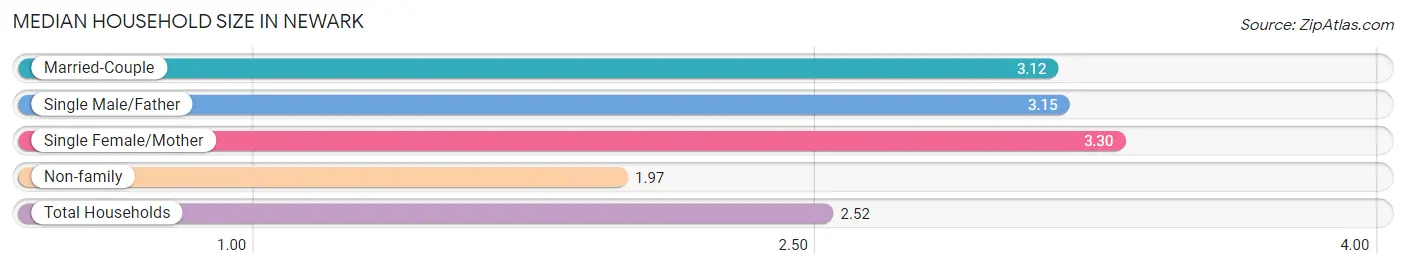
Median Household Size in Newark
The median household size in Newark is 2.52 persons per household, with single female/mother households (510 | 5.6%) accounting for the largest median household size of 3.3 persons per household. non-family households (4,891 | 53.2%) represent the smallest median household size with 1.97 persons per household.
| Household Type | # Households | Household Size |
| Married-Couple | 3,563 (38.8%) | 3.12 |
| Single Male/Father | 227 (2.5%) | 3.15 |
| Single Female/Mother | 510 (5.6%) | 3.30 |
| Non-family | 4,891 (53.2%) | 1.97 |
| Total Households | 9,191 (100.0%) | 2.52 |
Household Size by Marriage Status in Newark
Out of a total of 9,191 households in Newark, 4,300 (46.8%) are family households, while 4,891 (53.2%) are nonfamily households. The most numerous type of family households are 2-person households, comprising 2,192, and the most common type of nonfamily households are 1-person households, comprising 2,891.
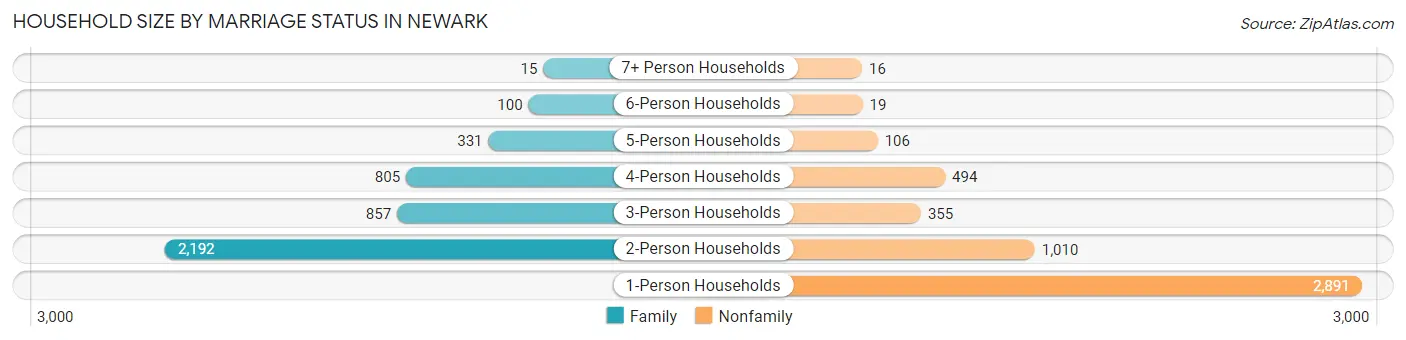
| Household Size | Family Households | Nonfamily Households |
| 1-Person Households | - | 2,891 (31.5%) |
| 2-Person Households | 2,192 (23.8%) | 1,010 (11.0%) |
| 3-Person Households | 857 (9.3%) | 355 (3.9%) |
| 4-Person Households | 805 (8.8%) | 494 (5.4%) |
| 5-Person Households | 331 (3.6%) | 106 (1.1%) |
| 6-Person Households | 100 (1.1%) | 19 (0.2%) |
| 7+ Person Households | 15 (0.2%) | 16 (0.2%) |
| Total | 4,300 (46.8%) | 4,891 (53.2%) |
Female Fertility in Newark
Fertility by Age in Newark
Average fertility rate in Newark is 19.0 births per 1,000 women. Women in the age bracket of 35 to 50 years have the highest fertility rate with 53.0 births per 1,000 women. Women in the age bracket of 20 to 34 years acount for 64.3% of all women with births.
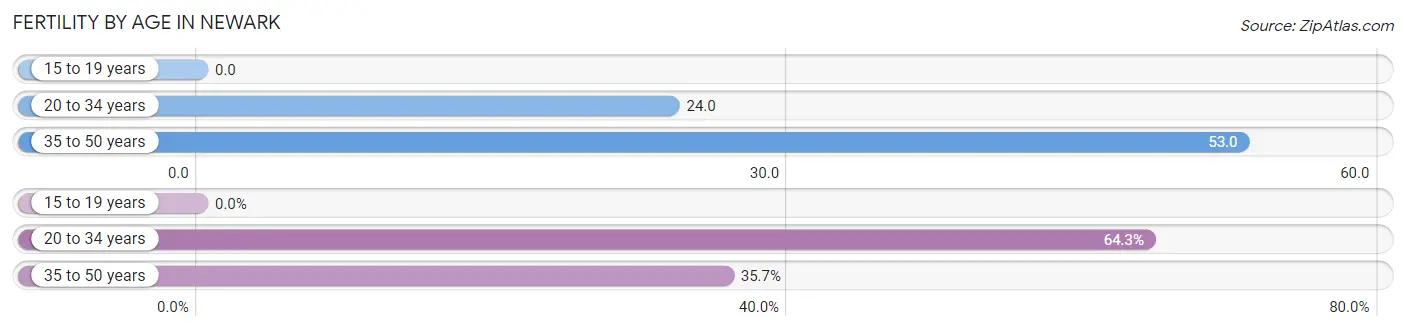
| Age Bracket | Women with Births | Births / 1,000 Women |
| 15 to 19 years | 0 (0.0%) | 0.0 |
| 20 to 34 years | 128 (64.3%) | 24.0 |
| 35 to 50 years | 71 (35.7%) | 53.0 |
| Total | 199 (100.0%) | 19.0 |
Fertility by Age by Marriage Status in Newark
67.3% of women with births (199) in Newark are married. The highest percentage of unmarried women with births falls into 20 to 34 years age bracket with 35.2% of them unmarried at the time of birth, while the lowest percentage of unmarried women with births belong to 35 to 50 years age bracket with 28.2% of them unmarried.
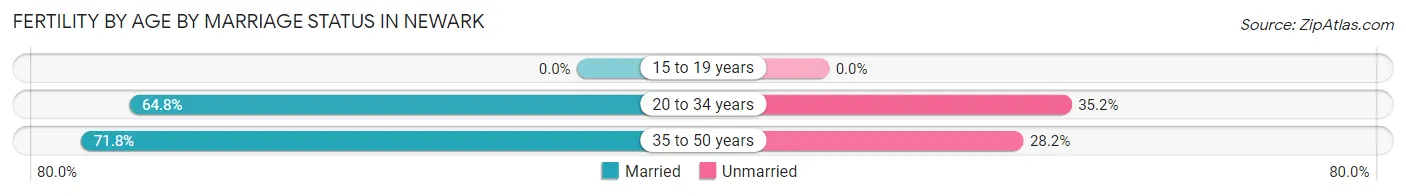
| Age Bracket | Married | Unmarried |
| 15 to 19 years | 0 (0.0%) | 0 (0.0%) |
| 20 to 34 years | 83 (64.8%) | 45 (35.2%) |
| 35 to 50 years | 51 (71.8%) | 20 (28.2%) |
| Total | 134 (67.3%) | 65 (32.7%) |
Fertility by Education in Newark
Average fertility rate in Newark is 19.0 births per 1,000 women. Women with the education attainment of graduate degree have the highest fertility rate of 63.0 births per 1,000 women, while women with the education attainment of high school diploma have the lowest fertility at 8.0 births per 1,000 women. Women with the education attainment of college or associate's degree represent 49.2% of all women with births.
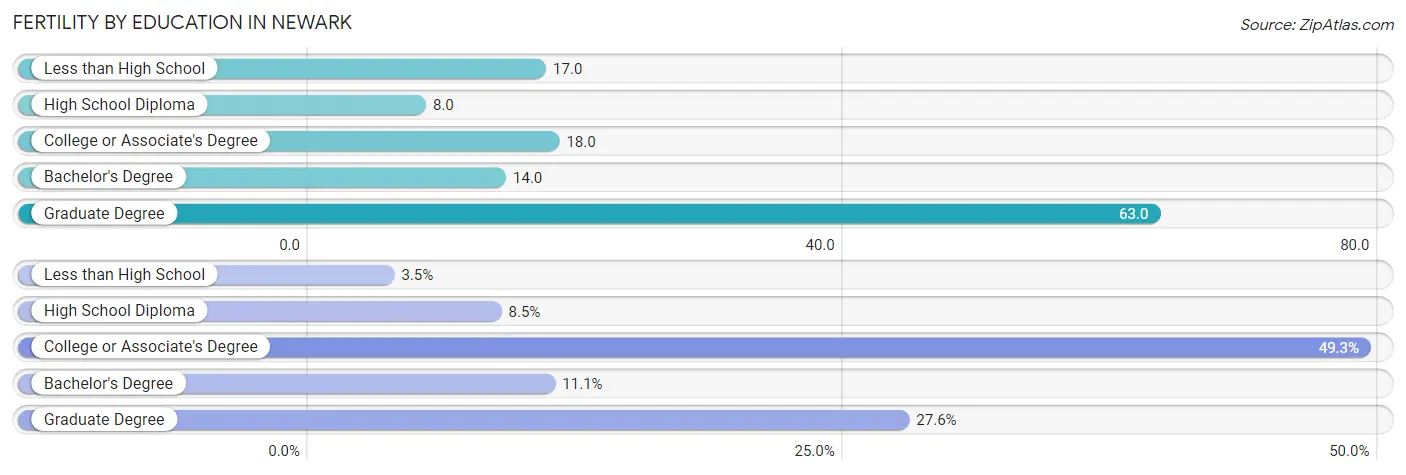
| Educational Attainment | Women with Births | Births / 1,000 Women |
| Less than High School | 7 (3.5%) | 17.0 |
| High School Diploma | 17 (8.5%) | 8.0 |
| College or Associate's Degree | 98 (49.2%) | 18.0 |
| Bachelor's Degree | 22 (11.1%) | 14.0 |
| Graduate Degree | 55 (27.6%) | 63.0 |
| Total | 199 (100.0%) | 19.0 |
Fertility by Education by Marriage Status in Newark
32.7% of women with births in Newark are unmarried. Women with the educational attainment of graduate degree are most likely to be married with 100.0% of them married at childbirth, while women with the educational attainment of less than high school are least likely to be married with 100.0% of them unmarried at childbirth.
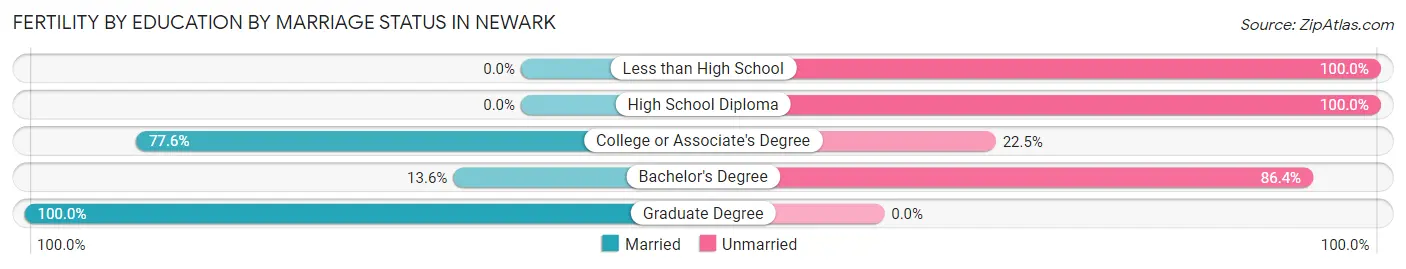
| Educational Attainment | Married | Unmarried |
| Less than High School | 0 (0.0%) | 7 (100.0%) |
| High School Diploma | 0 (0.0%) | 17 (100.0%) |
| College or Associate's Degree | 76 (77.5%) | 22 (22.5%) |
| Bachelor's Degree | 3 (13.6%) | 19 (86.4%) |
| Graduate Degree | 55 (100.0%) | 0 (0.0%) |
| Total | 134 (67.3%) | 65 (32.7%) |
Employment Characteristics in Newark
Employment by Class of Employer in Newark
Among the 13,011 employed individuals in Newark, private company employees (8,517 | 65.5%), state government employees (1,738 | 13.4%), and not-for-profit organizations (1,438 | 11.1%) make up the most common classes of employment.
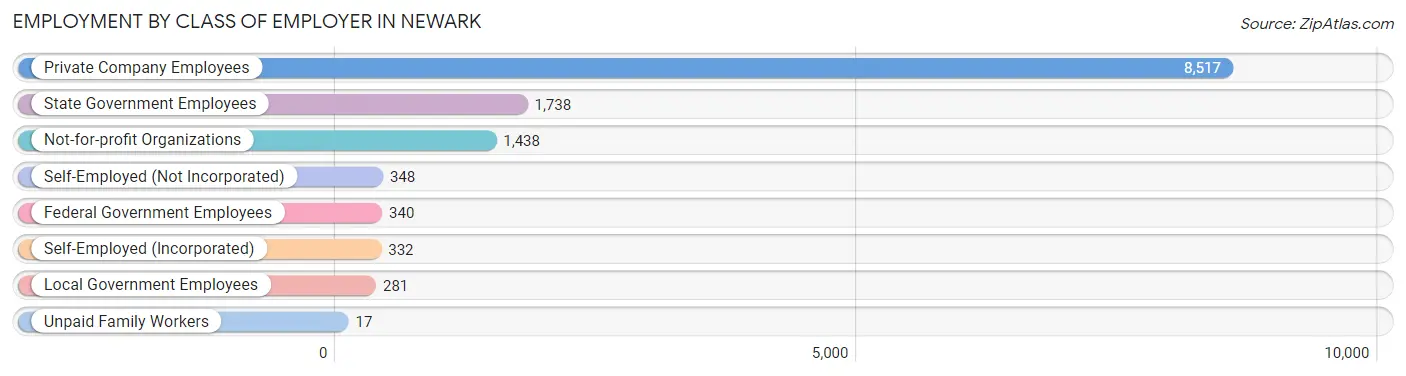
| Employer Class | # Employees | % Employees |
| Private Company Employees | 8,517 | 65.5% |
| Self-Employed (Incorporated) | 332 | 2.5% |
| Self-Employed (Not Incorporated) | 348 | 2.7% |
| Not-for-profit Organizations | 1,438 | 11.1% |
| Local Government Employees | 281 | 2.2% |
| State Government Employees | 1,738 | 13.4% |
| Federal Government Employees | 340 | 2.6% |
| Unpaid Family Workers | 17 | 0.1% |
| Total | 13,011 | 100.0% |
Employment Status by Age in Newark
According to the labor force statistics for Newark, out of the total population over 16 years of age (27,671), 52.0% or 14,389 individuals are in the labor force, with 7.0% or 1,007 of them unemployed. The age group with the highest labor force participation rate is 45 to 54 years, with 89.4% or 1,797 individuals in the labor force. Within the labor force, the 30 to 34 years age range has the highest percentage of unemployed individuals, with 16.1% or 179 of them being unemployed.
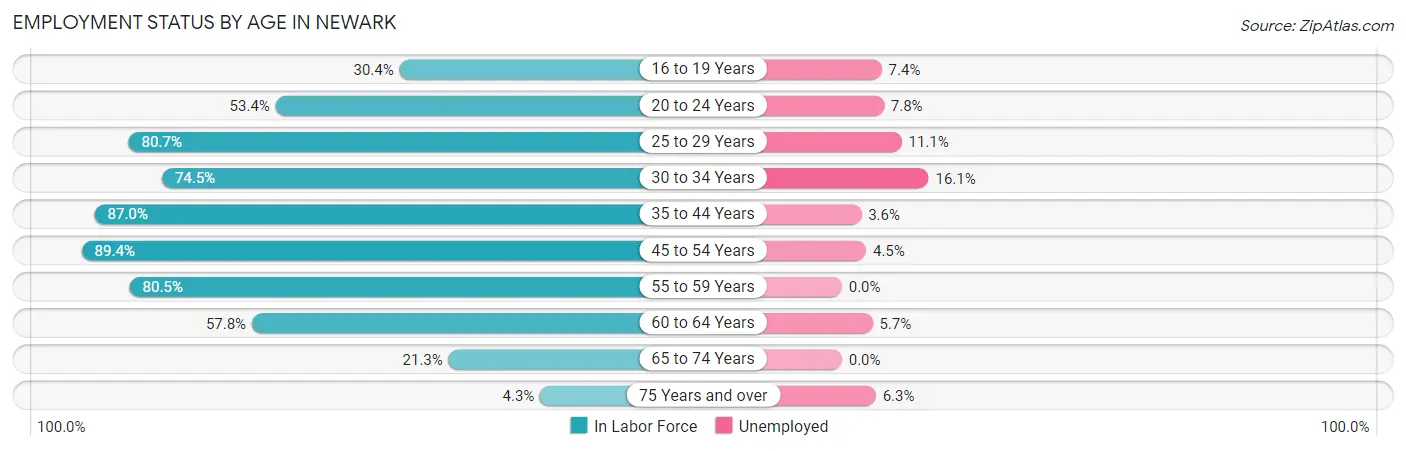
| Age Bracket | In Labor Force | Unemployed |
| 16 to 19 Years | 1,859 (30.4%) | 138 (7.4%) |
| 20 to 24 Years | 4,221 (53.4%) | 329 (7.8%) |
| 25 to 29 Years | 1,658 (80.7%) | 184 (11.1%) |
| 30 to 34 Years | 1,109 (74.5%) | 179 (16.1%) |
| 35 to 44 Years | 1,617 (87.0%) | 58 (3.6%) |
| 45 to 54 Years | 1,797 (89.4%) | 81 (4.5%) |
| 55 to 59 Years | 905 (80.5%) | 0 (0.0%) |
| 60 to 64 Years | 714 (57.8%) | 41 (5.7%) |
| 65 to 74 Years | 426 (21.3%) | 0 (0.0%) |
| 75 Years and over | 81 (4.3%) | 5 (6.3%) |
| Total | 14,389 (52.0%) | 1,007 (7.0%) |
Employment Status by Educational Attainment in Newark
According to labor force statistics for Newark, 79.8% of individuals (7,799) out of the total population between 25 and 64 years of age (9,773) are in the labor force, with 7.0% or 546 of them being unemployed. The group with the highest labor force participation rate are those with the educational attainment of bachelor's degree or higher, with 80.6% or 4,705 individuals in the labor force. Within the labor force, individuals with college / associate degree education have the highest percentage of unemployment, with 9.8% or 201 of them being unemployed.
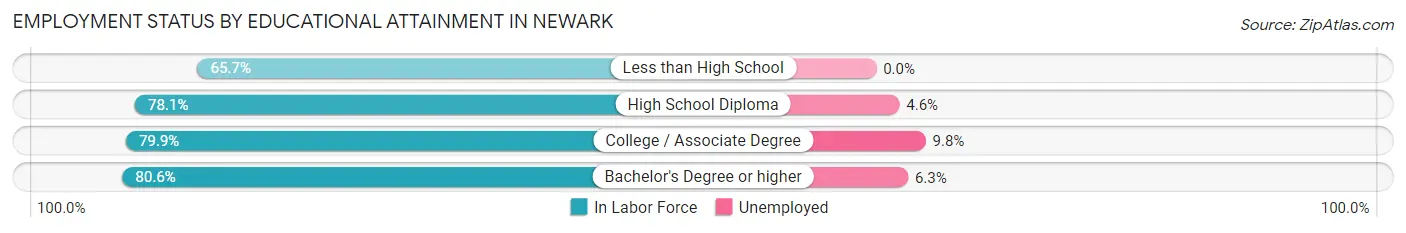
| Educational Attainment | In Labor Force | Unemployed |
| Less than High School | 109 (65.7%) | 0 (0.0%) |
| High School Diploma | 936 (78.1%) | 55 (4.6%) |
| College / Associate Degree | 2,053 (79.9%) | 252 (9.8%) |
| Bachelor's Degree or higher | 4,705 (80.6%) | 368 (6.3%) |
| Total | 7,799 (79.8%) | 684 (7.0%) |
Employment Occupations by Sex in Newark
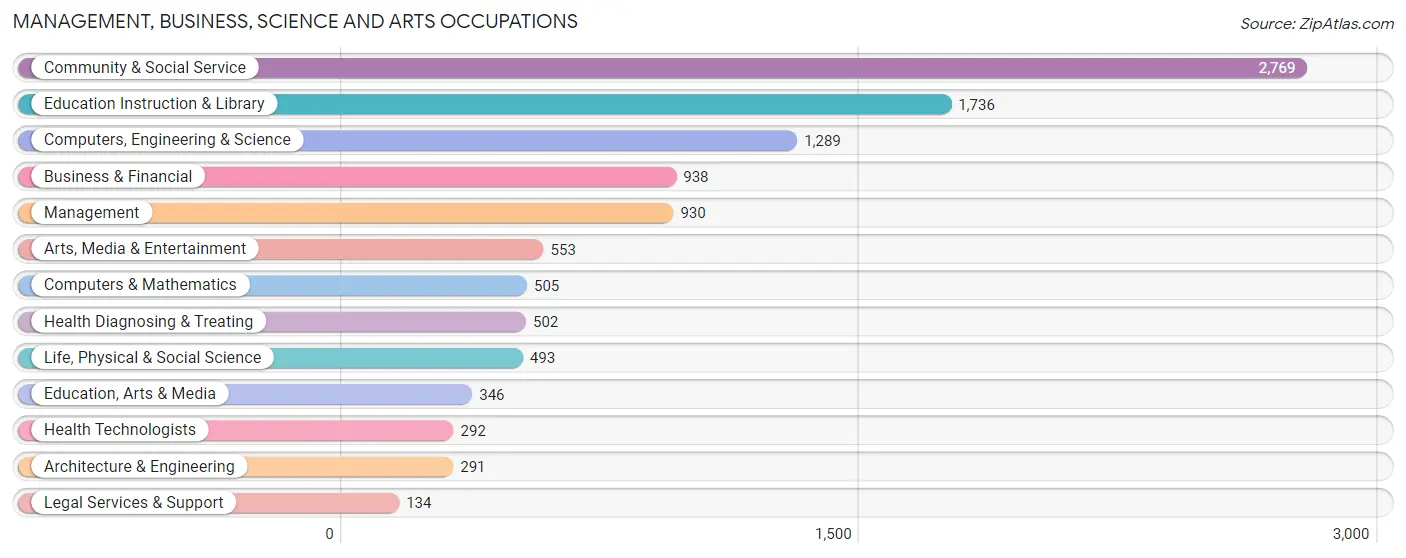
Management, Business, Science and Arts Occupations
The most common Management, Business, Science and Arts occupations in Newark are Community & Social Service (2,769 | 20.8%), Education Instruction & Library (1,736 | 13.1%), Computers, Engineering & Science (1,289 | 9.7%), Business & Financial (938 | 7.1%), and Management (930 | 7.0%).
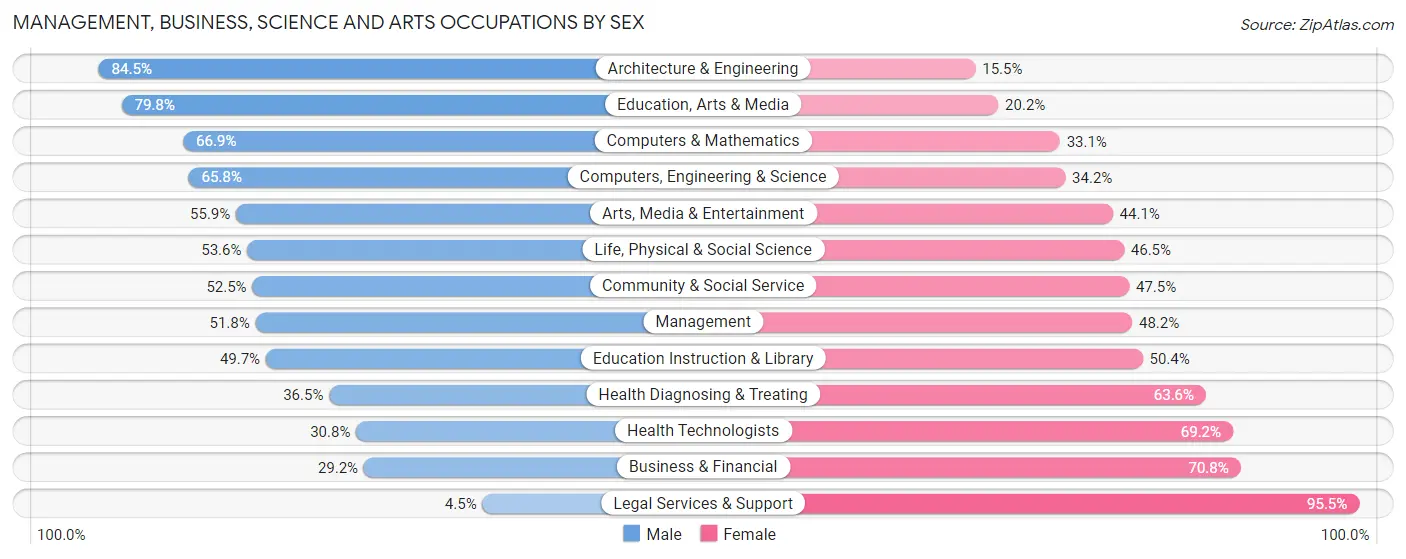
Management, Business, Science and Arts Occupations by Sex
Within the Management, Business, Science and Arts occupations in Newark, the most male-oriented occupations are Architecture & Engineering (84.5%), Education, Arts & Media (79.8%), and Computers & Mathematics (66.9%), while the most female-oriented occupations are Legal Services & Support (95.5%), Business & Financial (70.8%), and Health Technologists (69.2%).
| Occupation | Male | Female |
| Management | 482 (51.8%) | 448 (48.2%) |
| Business & Financial | 274 (29.2%) | 664 (70.8%) |
| Computers, Engineering & Science | 848 (65.8%) | 441 (34.2%) |
| Computers & Mathematics | 338 (66.9%) | 167 (33.1%) |
| Architecture & Engineering | 246 (84.5%) | 45 (15.5%) |
| Life, Physical & Social Science | 264 (53.5%) | 229 (46.5%) |
| Community & Social Service | 1,453 (52.5%) | 1,316 (47.5%) |
| Education, Arts & Media | 276 (79.8%) | 70 (20.2%) |
| Legal Services & Support | 6 (4.5%) | 128 (95.5%) |
| Education Instruction & Library | 862 (49.6%) | 874 (50.3%) |
| Arts, Media & Entertainment | 309 (55.9%) | 244 (44.1%) |
| Health Diagnosing & Treating | 183 (36.4%) | 319 (63.5%) |
| Health Technologists | 90 (30.8%) | 202 (69.2%) |
| Total (Category) | 3,240 (50.4%) | 3,188 (49.6%) |
| Total (Overall) | 6,555 (49.3%) | 6,737 (50.7%) |
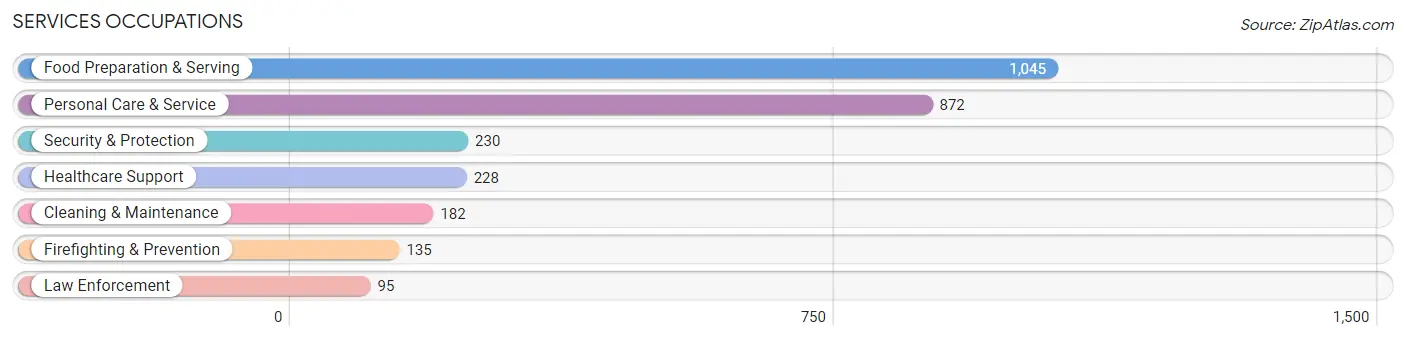
Services Occupations
The most common Services occupations in Newark are Food Preparation & Serving (1,045 | 7.9%), Personal Care & Service (872 | 6.6%), Security & Protection (230 | 1.7%), Healthcare Support (228 | 1.7%), and Cleaning & Maintenance (182 | 1.4%).
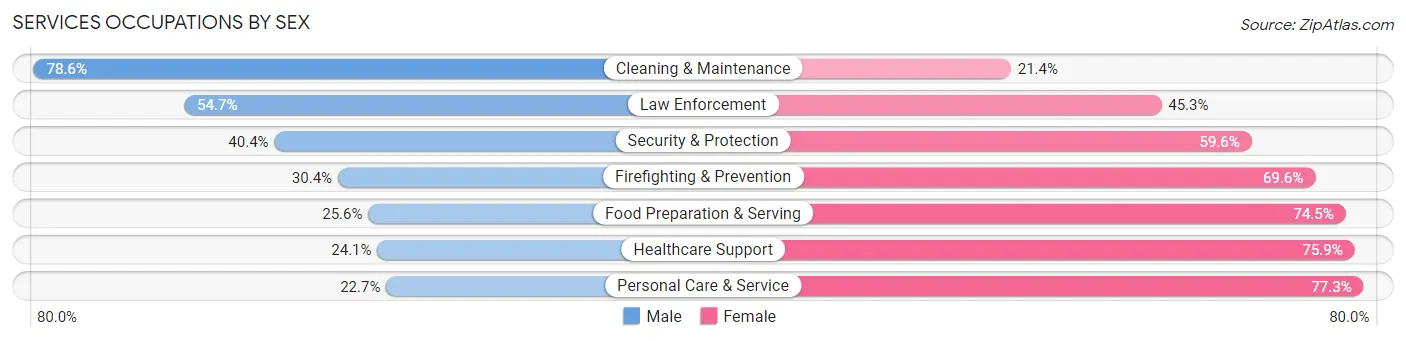
Services Occupations by Sex
Within the Services occupations in Newark, the most male-oriented occupations are Cleaning & Maintenance (78.6%), Law Enforcement (54.7%), and Security & Protection (40.4%), while the most female-oriented occupations are Personal Care & Service (77.3%), Healthcare Support (75.9%), and Food Preparation & Serving (74.5%).
| Occupation | Male | Female |
| Healthcare Support | 55 (24.1%) | 173 (75.9%) |
| Security & Protection | 93 (40.4%) | 137 (59.6%) |
| Firefighting & Prevention | 41 (30.4%) | 94 (69.6%) |
| Law Enforcement | 52 (54.7%) | 43 (45.3%) |
| Food Preparation & Serving | 267 (25.6%) | 778 (74.5%) |
| Cleaning & Maintenance | 143 (78.6%) | 39 (21.4%) |
| Personal Care & Service | 198 (22.7%) | 674 (77.3%) |
| Total (Category) | 756 (29.6%) | 1,801 (70.4%) |
| Total (Overall) | 6,555 (49.3%) | 6,737 (50.7%) |
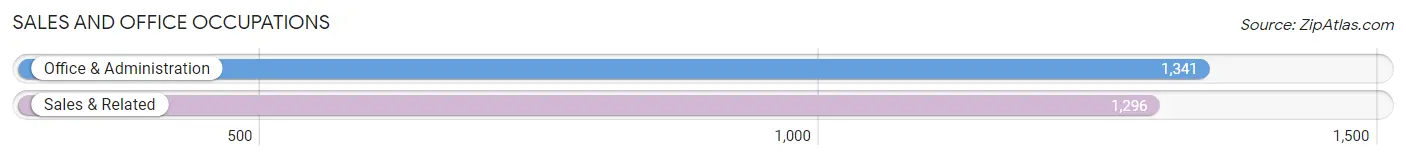
Sales and Office Occupations
The most common Sales and Office occupations in Newark are Office & Administration (1,341 | 10.1%), and Sales & Related (1,296 | 9.8%).
Sales and Office Occupations by Sex
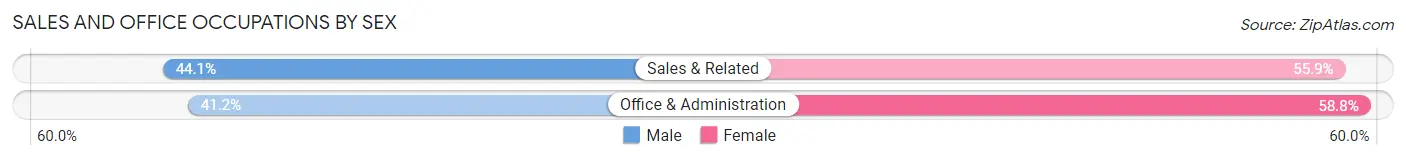
| Occupation | Male | Female |
| Sales & Related | 571 (44.1%) | 725 (55.9%) |
| Office & Administration | 552 (41.2%) | 789 (58.8%) |
| Total (Category) | 1,123 (42.6%) | 1,514 (57.4%) |
| Total (Overall) | 6,555 (49.3%) | 6,737 (50.7%) |
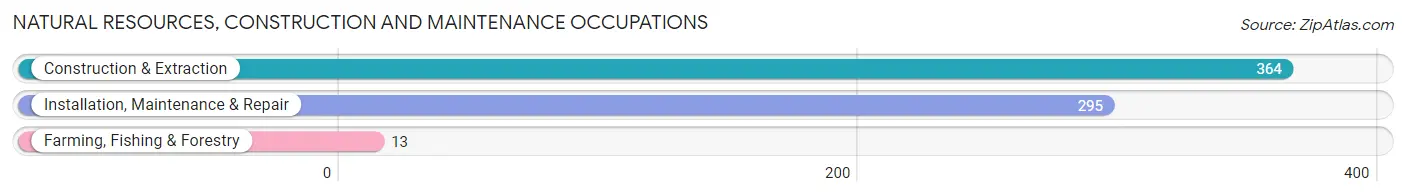
Natural Resources, Construction and Maintenance Occupations
The most common Natural Resources, Construction and Maintenance occupations in Newark are Construction & Extraction (364 | 2.7%), Installation, Maintenance & Repair (295 | 2.2%), and Farming, Fishing & Forestry (13 | 0.1%).
Natural Resources, Construction and Maintenance Occupations by Sex
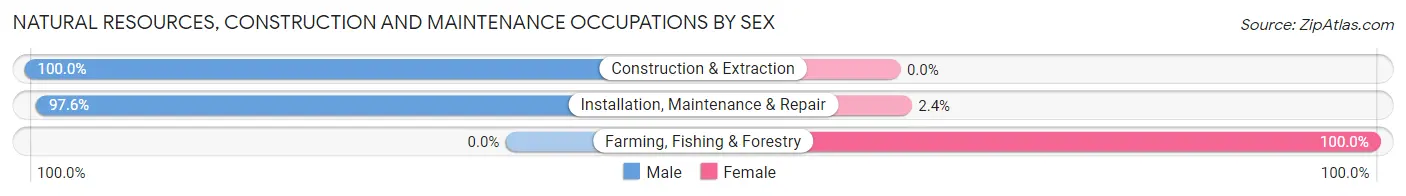
| Occupation | Male | Female |
| Farming, Fishing & Forestry | 0 (0.0%) | 13 (100.0%) |
| Construction & Extraction | 364 (100.0%) | 0 (0.0%) |
| Installation, Maintenance & Repair | 288 (97.6%) | 7 (2.4%) |
| Total (Category) | 652 (97.0%) | 20 (3.0%) |
| Total (Overall) | 6,555 (49.3%) | 6,737 (50.7%) |
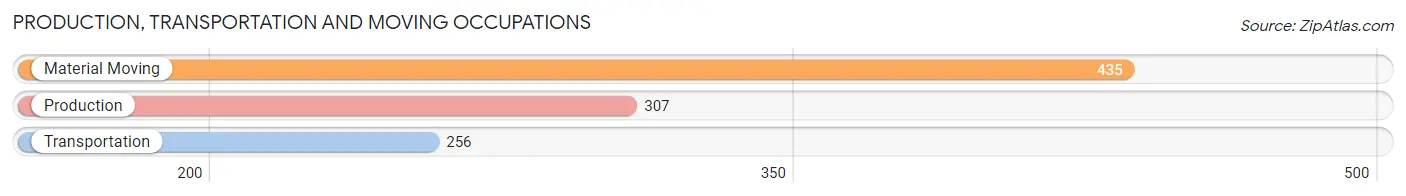
Production, Transportation and Moving Occupations
The most common Production, Transportation and Moving occupations in Newark are Material Moving (435 | 3.3%), Production (307 | 2.3%), and Transportation (256 | 1.9%).
Production, Transportation and Moving Occupations by Sex
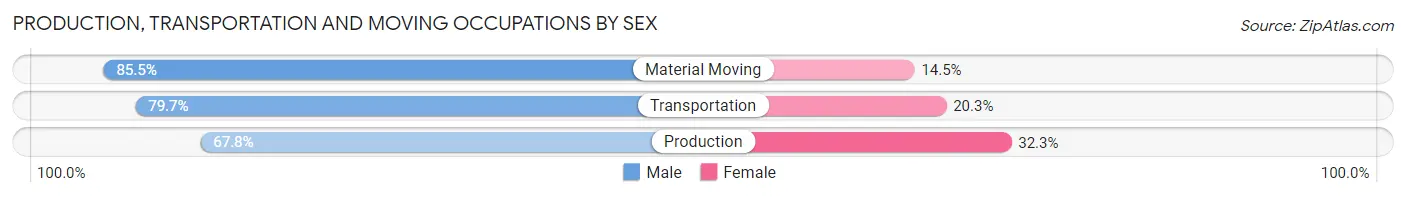
| Occupation | Male | Female |
| Production | 208 (67.7%) | 99 (32.3%) |
| Transportation | 204 (79.7%) | 52 (20.3%) |
| Material Moving | 372 (85.5%) | 63 (14.5%) |
| Total (Category) | 784 (78.6%) | 214 (21.4%) |
| Total (Overall) | 6,555 (49.3%) | 6,737 (50.7%) |
Employment Industries by Sex in Newark
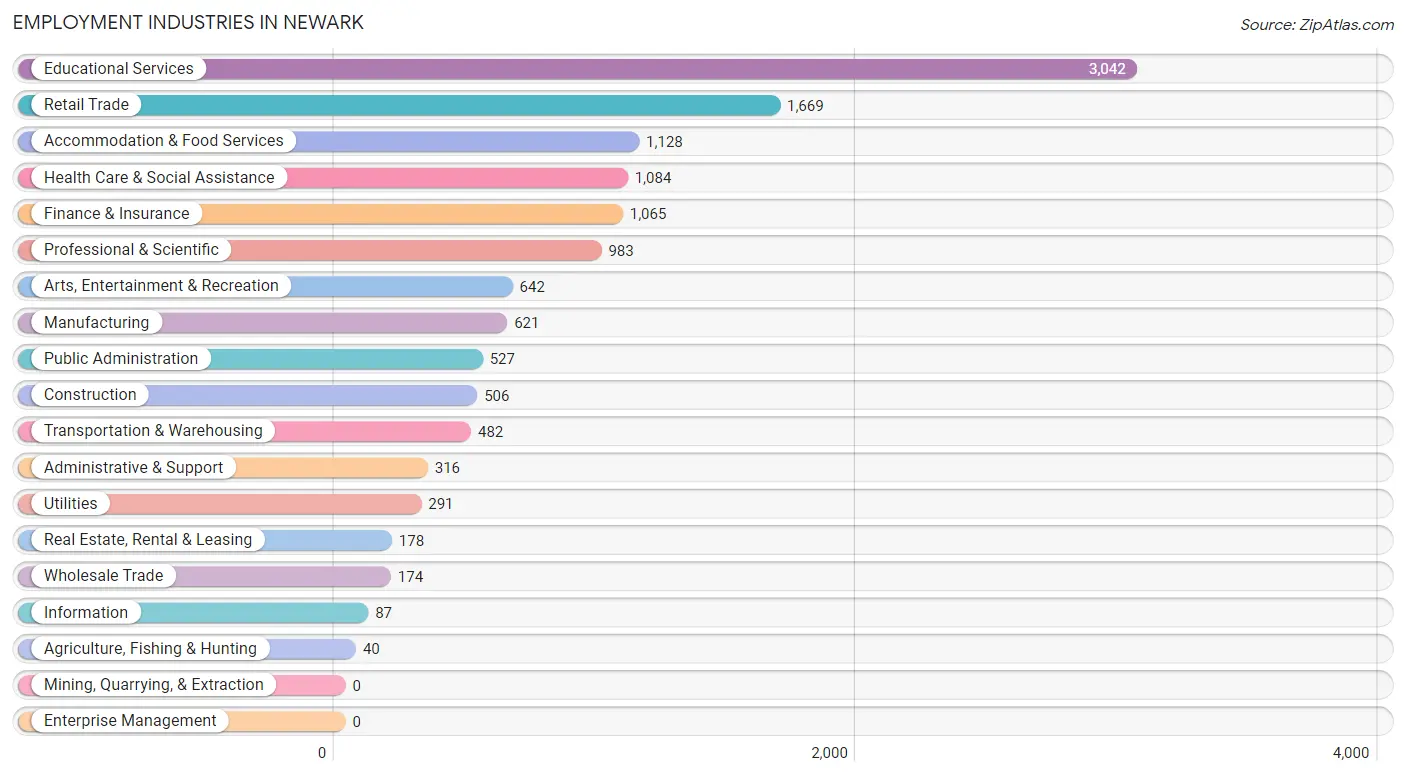
Employment Industries in Newark
The major employment industries in Newark include Educational Services (3,042 | 22.9%), Retail Trade (1,669 | 12.6%), Accommodation & Food Services (1,128 | 8.5%), Health Care & Social Assistance (1,084 | 8.2%), and Finance & Insurance (1,065 | 8.0%).
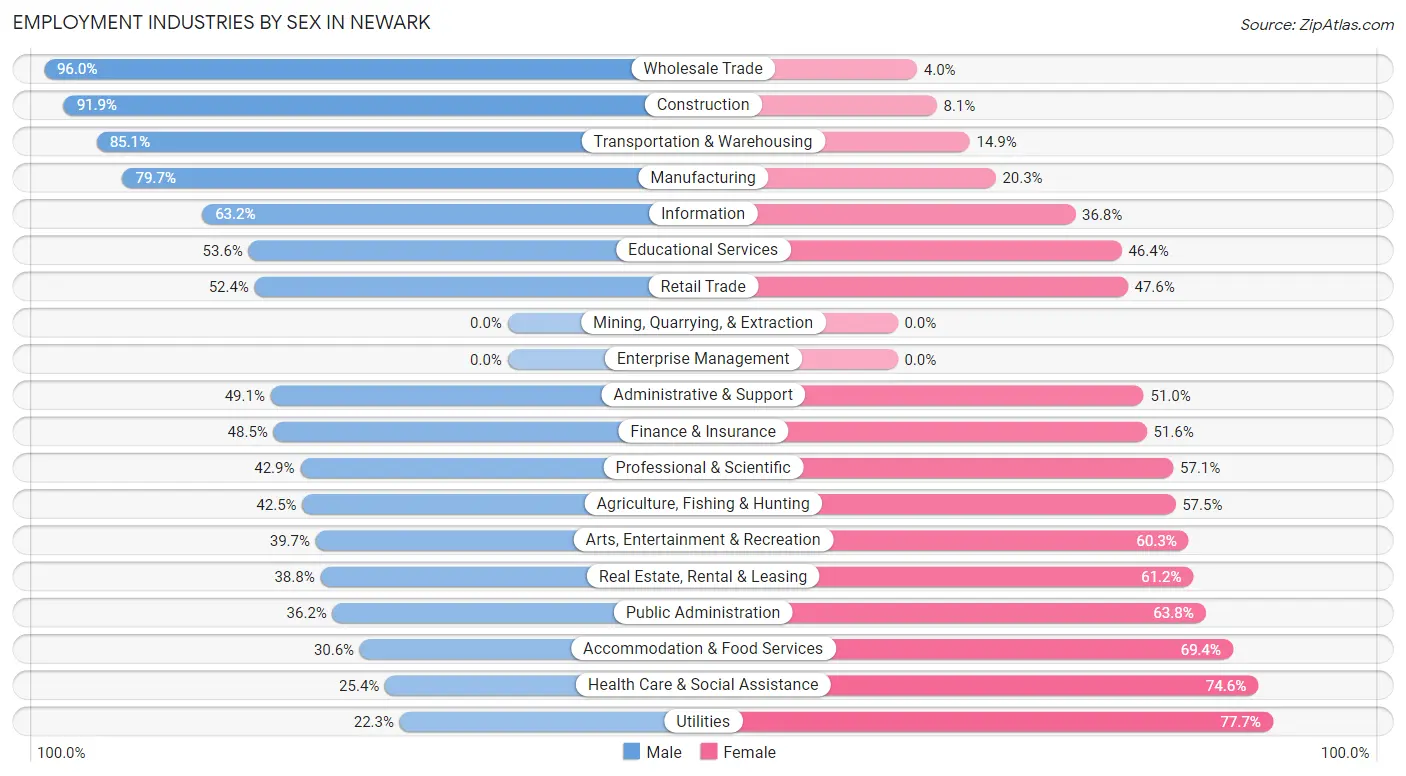
Employment Industries by Sex in Newark
The Newark industries that see more men than women are Wholesale Trade (96.0%), Construction (91.9%), and Transportation & Warehousing (85.1%), whereas the industries that tend to have a higher number of women are Utilities (77.7%), Health Care & Social Assistance (74.6%), and Accommodation & Food Services (69.4%).
| Industry | Male | Female |
| Agriculture, Fishing & Hunting | 17 (42.5%) | 23 (57.5%) |
| Mining, Quarrying, & Extraction | 0 (0.0%) | 0 (0.0%) |
| Construction | 465 (91.9%) | 41 (8.1%) |
| Manufacturing | 495 (79.7%) | 126 (20.3%) |
| Wholesale Trade | 167 (96.0%) | 7 (4.0%) |
| Retail Trade | 874 (52.4%) | 795 (47.6%) |
| Transportation & Warehousing | 410 (85.1%) | 72 (14.9%) |
| Utilities | 65 (22.3%) | 226 (77.7%) |
| Information | 55 (63.2%) | 32 (36.8%) |
| Finance & Insurance | 516 (48.4%) | 549 (51.5%) |
| Real Estate, Rental & Leasing | 69 (38.8%) | 109 (61.2%) |
| Professional & Scientific | 422 (42.9%) | 561 (57.1%) |
| Enterprise Management | 0 (0.0%) | 0 (0.0%) |
| Administrative & Support | 155 (49.0%) | 161 (50.9%) |
| Educational Services | 1,631 (53.6%) | 1,411 (46.4%) |
| Health Care & Social Assistance | 275 (25.4%) | 809 (74.6%) |
| Arts, Entertainment & Recreation | 255 (39.7%) | 387 (60.3%) |
| Accommodation & Food Services | 345 (30.6%) | 783 (69.4%) |
| Public Administration | 191 (36.2%) | 336 (63.8%) |
| Total | 6,555 (49.3%) | 6,737 (50.7%) |
Education in Newark
School Enrollment in Newark
The most common levels of schooling among the 16,448 students in Newark are college / undergraduate (12,258 | 74.5%), graduate / professional (1,175 | 7.1%), and elementary school (1,017 | 6.2%).
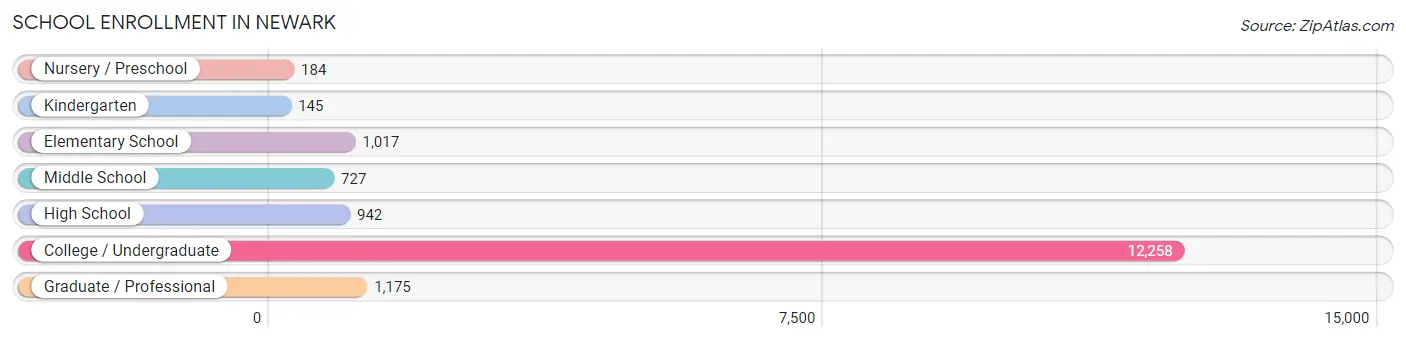
| School Level | # Students | % Students |
| Nursery / Preschool | 184 | 1.1% |
| Kindergarten | 145 | 0.9% |
| Elementary School | 1,017 | 6.2% |
| Middle School | 727 | 4.4% |
| High School | 942 | 5.7% |
| College / Undergraduate | 12,258 | 74.5% |
| Graduate / Professional | 1,175 | 7.1% |
| Total | 16,448 | 100.0% |
School Enrollment by Age by Funding Source in Newark
Out of a total of 16,448 students who are enrolled in schools in Newark, 1,447 (8.8%) attend a private institution, while the remaining 15,001 (91.2%) are enrolled in public schools. The age group of 3 to 4 year olds has the highest likelihood of being enrolled in private schools, with 120 (85.7% in the age bracket) enrolled. Conversely, the age group of 25 to 34 year olds has the lowest likelihood of being enrolled in a private school, with 1,024 (95.7% in the age bracket) attending a public institution.
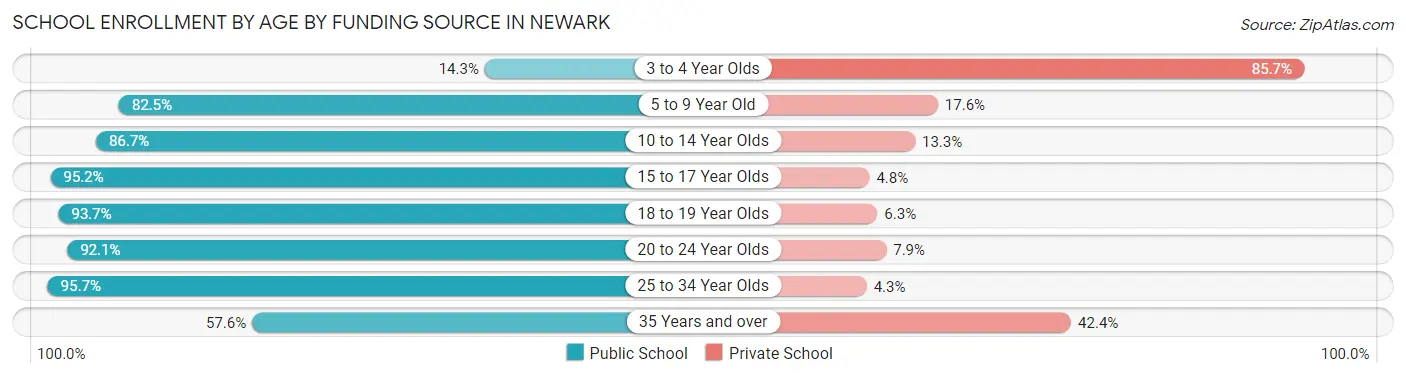
| Age Bracket | Public School | Private School |
| 3 to 4 Year Olds | 20 (14.3%) | 120 (85.7%) |
| 5 to 9 Year Old | 921 (82.5%) | 196 (17.5%) |
| 10 to 14 Year Olds | 776 (86.7%) | 119 (13.3%) |
| 15 to 17 Year Olds | 753 (95.2%) | 38 (4.8%) |
| 18 to 19 Year Olds | 5,191 (93.7%) | 348 (6.3%) |
| 20 to 24 Year Olds | 6,240 (92.1%) | 538 (7.9%) |
| 25 to 34 Year Olds | 1,024 (95.7%) | 46 (4.3%) |
| 35 Years and over | 68 (57.6%) | 50 (42.4%) |
| Total | 15,001 (91.2%) | 1,447 (8.8%) |
Educational Attainment by Field of Study in Newark
Business (1,088 | 12.9%), education (874 | 10.4%), engineering (842 | 10.0%), bio, nature & agricultural (814 | 9.7%), and science & technology (715 | 8.5%) are the most common fields of study among 8,439 individuals in Newark who have obtained a bachelor's degree or higher.
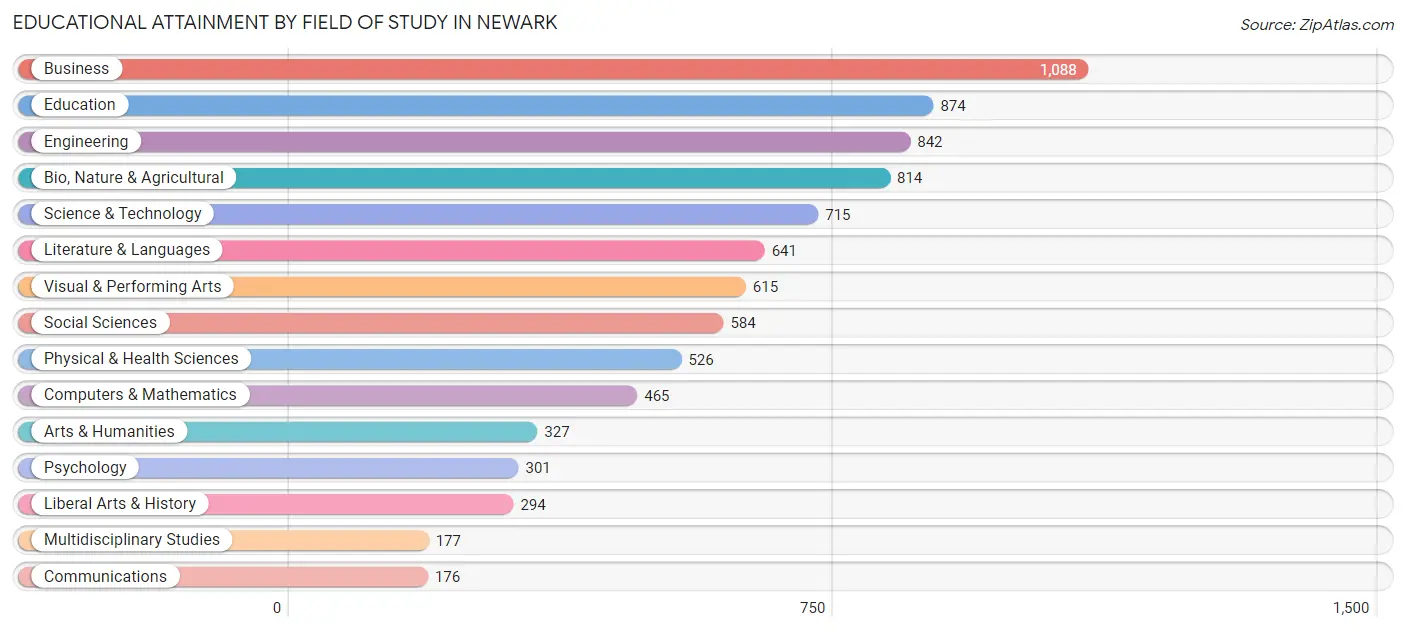
| Field of Study | # Graduates | % Graduates |
| Computers & Mathematics | 465 | 5.5% |
| Bio, Nature & Agricultural | 814 | 9.7% |
| Physical & Health Sciences | 526 | 6.2% |
| Psychology | 301 | 3.6% |
| Social Sciences | 584 | 6.9% |
| Engineering | 842 | 10.0% |
| Multidisciplinary Studies | 177 | 2.1% |
| Science & Technology | 715 | 8.5% |
| Business | 1,088 | 12.9% |
| Education | 874 | 10.4% |
| Literature & Languages | 641 | 7.6% |
| Liberal Arts & History | 294 | 3.5% |
| Visual & Performing Arts | 615 | 7.3% |
| Communications | 176 | 2.1% |
| Arts & Humanities | 327 | 3.9% |
| Total | 8,439 | 100.0% |
Transportation & Commute in Newark
Vehicle Availability by Sex in Newark
The most prevalent vehicle ownership categories in Newark are males with 2 vehicles (2,513, accounting for 45.0%) and females with 2 vehicles (2,207, making up 50.3%).
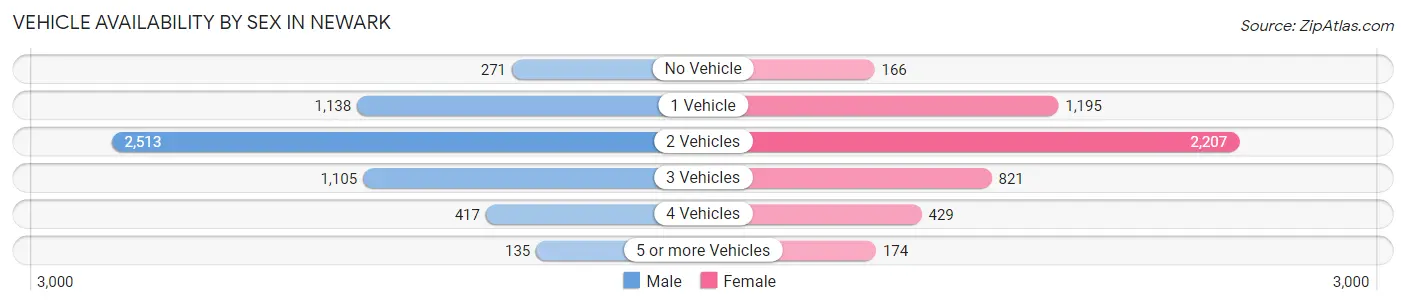
| Vehicles Available | Male | Female |
| No Vehicle | 271 (4.9%) | 166 (3.3%) |
| 1 Vehicle | 1,138 (20.4%) | 1,195 (23.9%) |
| 2 Vehicles | 2,513 (45.0%) | 2,207 (44.2%) |
| 3 Vehicles | 1,105 (19.8%) | 821 (16.5%) |
| 4 Vehicles | 417 (7.5%) | 429 (8.6%) |
| 5 or more Vehicles | 135 (2.4%) | 174 (3.5%) |
| Total | 5,579 (100.0%) | 4,992 (100.0%) |
Commute Time in Newark
The most frequently occuring commute durations in Newark are 10 to 14 minutes (2,236 commuters, 20.5%), 15 to 19 minutes (1,818 commuters, 16.7%), and 5 to 9 minutes (1,682 commuters, 15.4%).
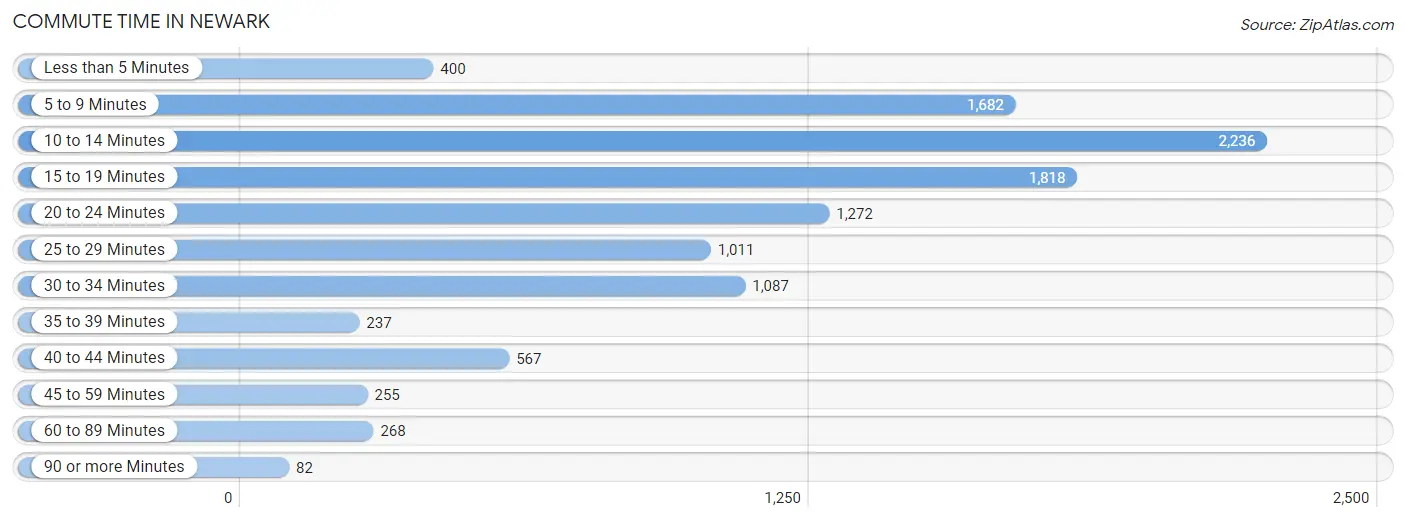
| Commute Time | # Commuters | % Commuters |
| Less than 5 Minutes | 400 | 3.7% |
| 5 to 9 Minutes | 1,682 | 15.4% |
| 10 to 14 Minutes | 2,236 | 20.5% |
| 15 to 19 Minutes | 1,818 | 16.7% |
| 20 to 24 Minutes | 1,272 | 11.7% |
| 25 to 29 Minutes | 1,011 | 9.3% |
| 30 to 34 Minutes | 1,087 | 10.0% |
| 35 to 39 Minutes | 237 | 2.2% |
| 40 to 44 Minutes | 567 | 5.2% |
| 45 to 59 Minutes | 255 | 2.3% |
| 60 to 89 Minutes | 268 | 2.5% |
| 90 or more Minutes | 82 | 0.7% |
Commute Time by Sex in Newark
The most common commute times in Newark are 10 to 14 minutes (1,355 commuters, 24.6%) for males and 15 to 19 minutes (1,009 commuters, 18.6%) for females.
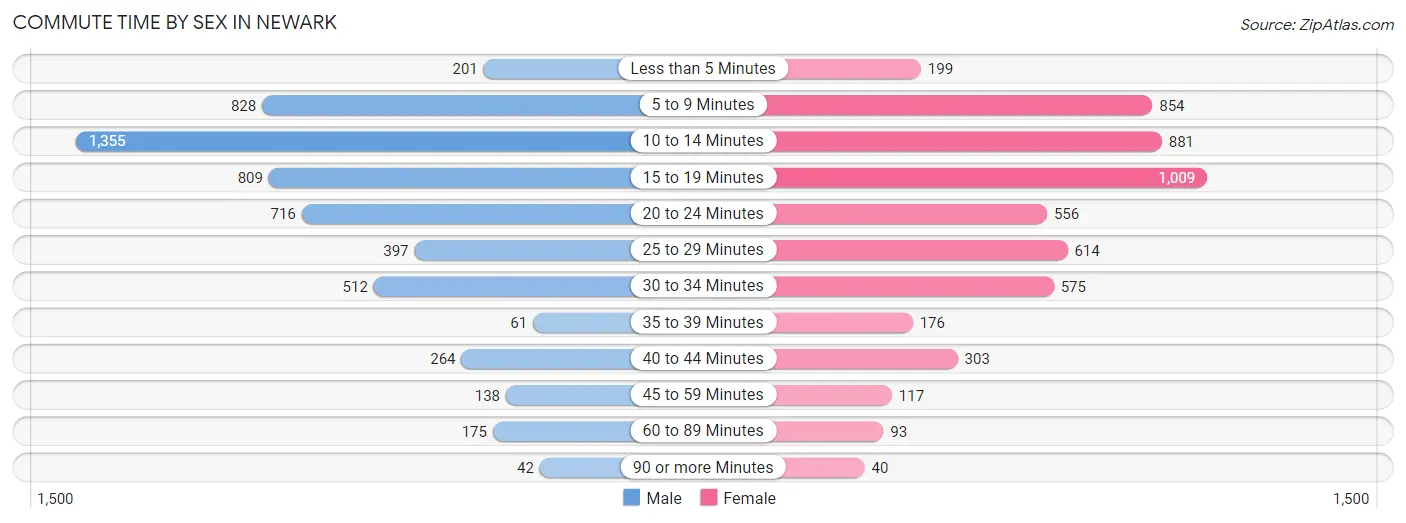
| Commute Time | Male | Female |
| Less than 5 Minutes | 201 (3.7%) | 199 (3.7%) |
| 5 to 9 Minutes | 828 (15.1%) | 854 (15.8%) |
| 10 to 14 Minutes | 1,355 (24.6%) | 881 (16.3%) |
| 15 to 19 Minutes | 809 (14.7%) | 1,009 (18.6%) |
| 20 to 24 Minutes | 716 (13.0%) | 556 (10.3%) |
| 25 to 29 Minutes | 397 (7.2%) | 614 (11.3%) |
| 30 to 34 Minutes | 512 (9.3%) | 575 (10.6%) |
| 35 to 39 Minutes | 61 (1.1%) | 176 (3.3%) |
| 40 to 44 Minutes | 264 (4.8%) | 303 (5.6%) |
| 45 to 59 Minutes | 138 (2.5%) | 117 (2.2%) |
| 60 to 89 Minutes | 175 (3.2%) | 93 (1.7%) |
| 90 or more Minutes | 42 (0.8%) | 40 (0.7%) |
Time of Departure to Work by Sex in Newark
The most frequent times of departure to work in Newark are 7:30 AM to 7:59 AM (1,091, 19.8%) for males and 7:30 AM to 7:59 AM (980, 18.1%) for females.
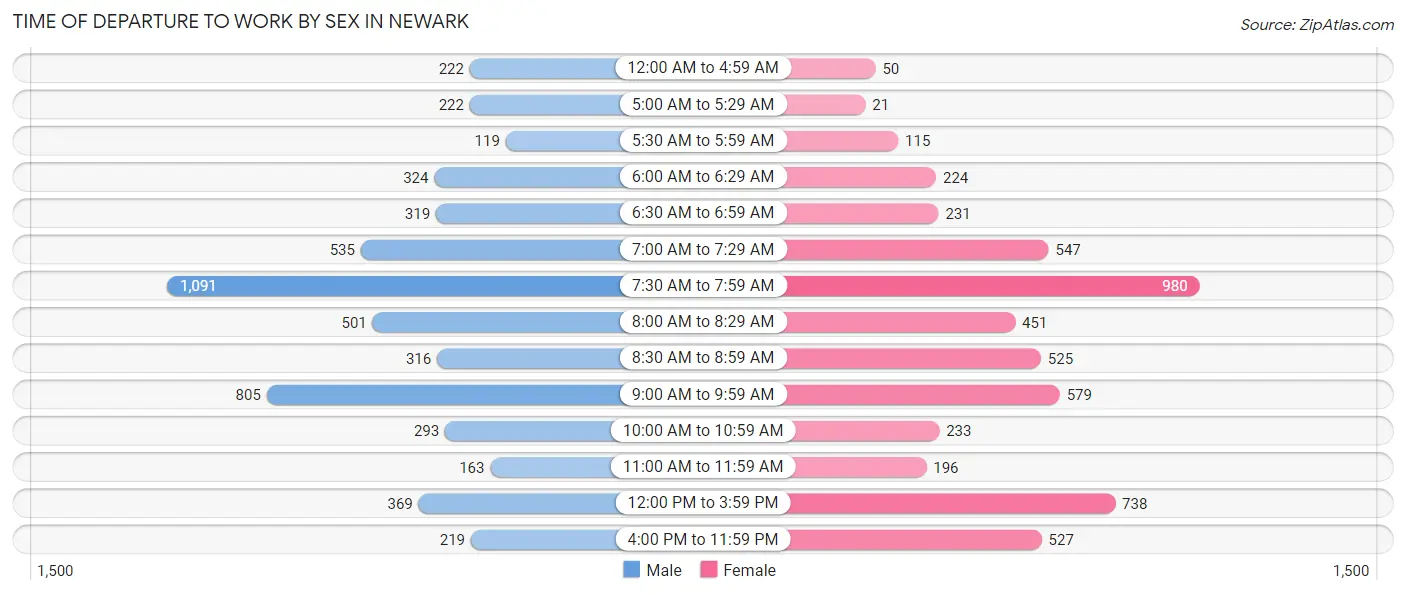
| Time of Departure | Male | Female |
| 12:00 AM to 4:59 AM | 222 (4.0%) | 50 (0.9%) |
| 5:00 AM to 5:29 AM | 222 (4.0%) | 21 (0.4%) |
| 5:30 AM to 5:59 AM | 119 (2.2%) | 115 (2.1%) |
| 6:00 AM to 6:29 AM | 324 (5.9%) | 224 (4.1%) |
| 6:30 AM to 6:59 AM | 319 (5.8%) | 231 (4.3%) |
| 7:00 AM to 7:29 AM | 535 (9.7%) | 547 (10.1%) |
| 7:30 AM to 7:59 AM | 1,091 (19.8%) | 980 (18.1%) |
| 8:00 AM to 8:29 AM | 501 (9.1%) | 451 (8.3%) |
| 8:30 AM to 8:59 AM | 316 (5.8%) | 525 (9.7%) |
| 9:00 AM to 9:59 AM | 805 (14.6%) | 579 (10.7%) |
| 10:00 AM to 10:59 AM | 293 (5.3%) | 233 (4.3%) |
| 11:00 AM to 11:59 AM | 163 (3.0%) | 196 (3.6%) |
| 12:00 PM to 3:59 PM | 369 (6.7%) | 738 (13.6%) |
| 4:00 PM to 11:59 PM | 219 (4.0%) | 527 (9.7%) |
| Total | 5,498 (100.0%) | 5,417 (100.0%) |
Housing Occupancy in Newark
Occupancy by Ownership in Newark
Of the total 9,191 dwellings in Newark, owner-occupied units account for 4,789 (52.1%), while renter-occupied units make up 4,402 (47.9%).
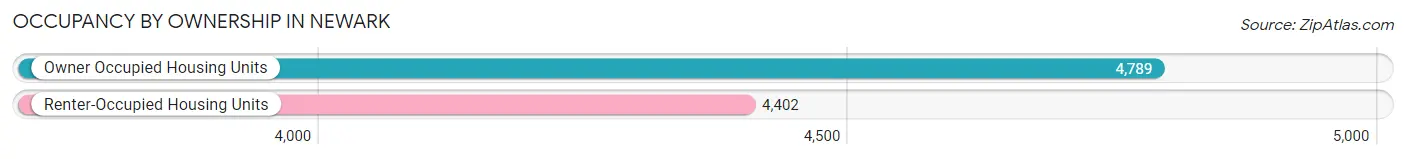
| Occupancy | # Housing Units | % Housing Units |
| Owner Occupied Housing Units | 4,789 | 52.1% |
| Renter-Occupied Housing Units | 4,402 | 47.9% |
| Total Occupied Housing Units | 9,191 | 100.0% |
Occupancy by Household Size in Newark
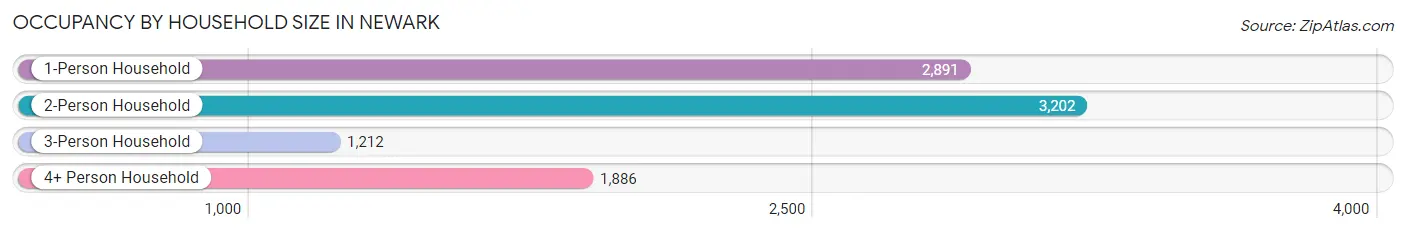
| Household Size | # Housing Units | % Housing Units |
| 1-Person Household | 2,891 | 31.5% |
| 2-Person Household | 3,202 | 34.8% |
| 3-Person Household | 1,212 | 13.2% |
| 4+ Person Household | 1,886 | 20.5% |
| Total Housing Units | 9,191 | 100.0% |
Occupancy by Ownership by Household Size in Newark
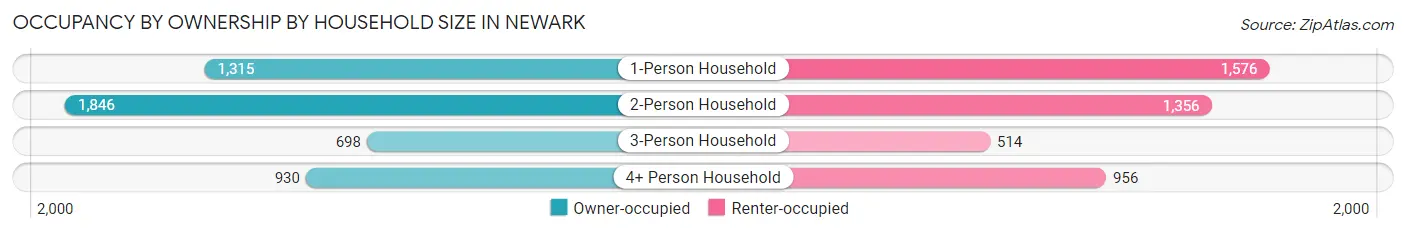
| Household Size | Owner-occupied | Renter-occupied |
| 1-Person Household | 1,315 (45.5%) | 1,576 (54.5%) |
| 2-Person Household | 1,846 (57.7%) | 1,356 (42.3%) |
| 3-Person Household | 698 (57.6%) | 514 (42.4%) |
| 4+ Person Household | 930 (49.3%) | 956 (50.7%) |
| Total Housing Units | 4,789 (52.1%) | 4,402 (47.9%) |
Occupancy by Educational Attainment in Newark
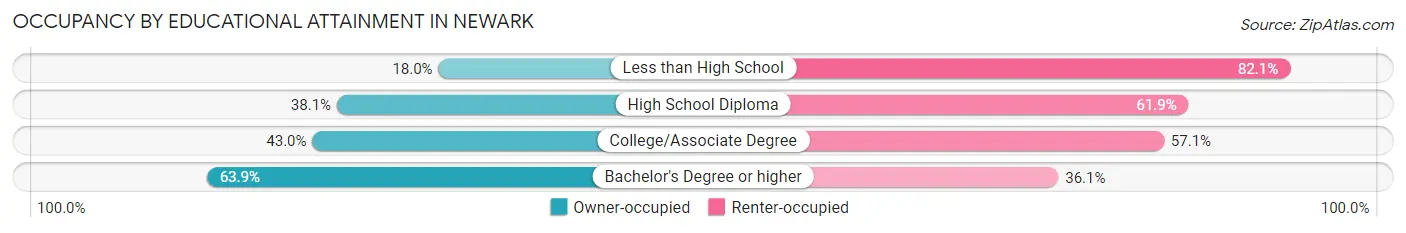
| Household Size | Owner-occupied | Renter-occupied |
| Less than High School | 21 (17.9%) | 96 (82.1%) |
| High School Diploma | 548 (38.1%) | 891 (61.9%) |
| College/Associate Degree | 1,350 (42.9%) | 1,793 (57.1%) |
| Bachelor's Degree or higher | 2,870 (63.9%) | 1,622 (36.1%) |
Occupancy by Age of Householder in Newark
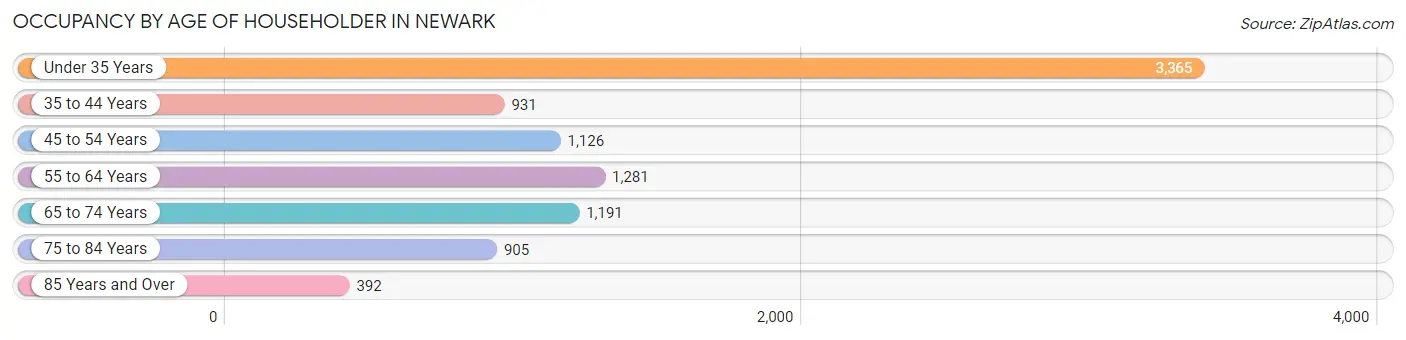
| Age Bracket | # Households | % Households |
| Under 35 Years | 3,365 | 36.6% |
| 35 to 44 Years | 931 | 10.1% |
| 45 to 54 Years | 1,126 | 12.2% |
| 55 to 64 Years | 1,281 | 13.9% |
| 65 to 74 Years | 1,191 | 13.0% |
| 75 to 84 Years | 905 | 9.9% |
| 85 Years and Over | 392 | 4.3% |
| Total | 9,191 | 100.0% |
Housing Finances in Newark
Median Income by Occupancy in Newark
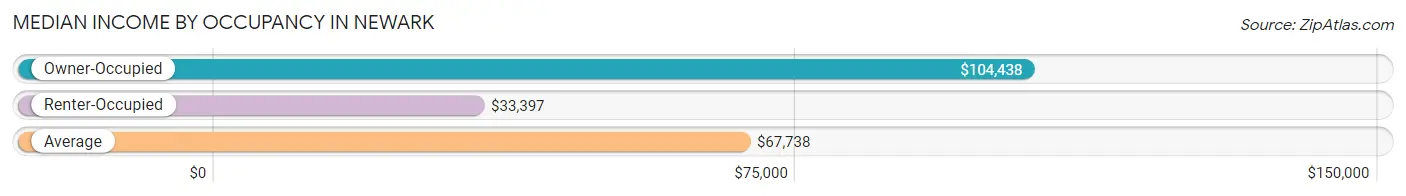
| Occupancy Type | # Households | Median Income |
| Owner-Occupied | 4,789 (52.1%) | $104,438 |
| Renter-Occupied | 4,402 (47.9%) | $33,397 |
| Average | 9,191 (100.0%) | $67,738 |
Occupancy by Householder Income Bracket in Newark
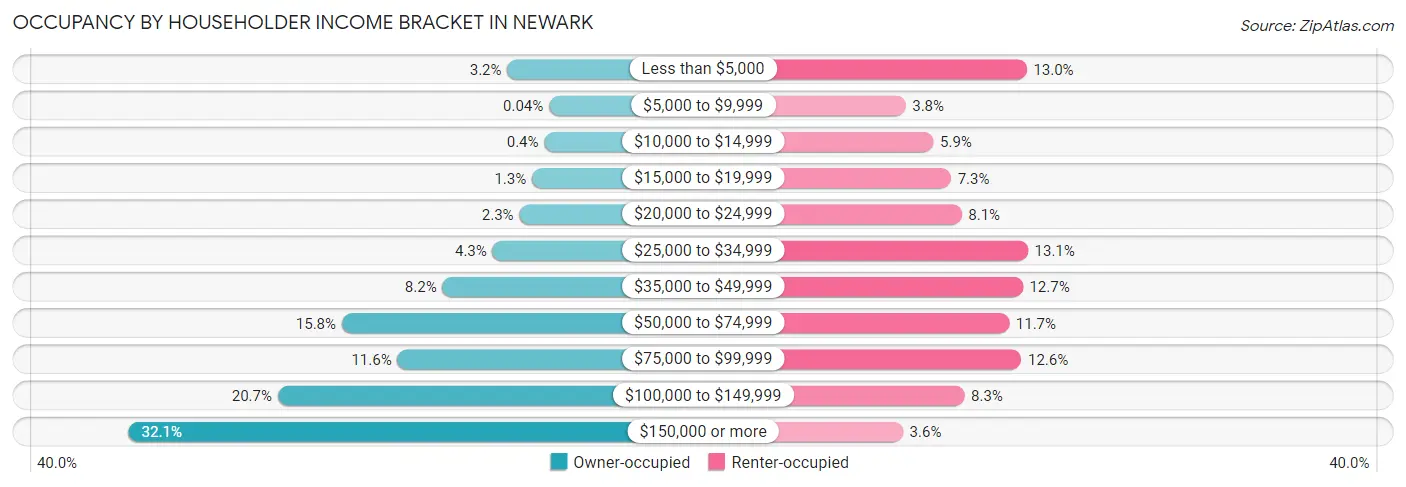
| Income Bracket | Owner-occupied | Renter-occupied |
| Less than $5,000 | 154 (3.2%) | 573 (13.0%) |
| $5,000 to $9,999 | 2 (0.0%) | 167 (3.8%) |
| $10,000 to $14,999 | 19 (0.4%) | 260 (5.9%) |
| $15,000 to $19,999 | 64 (1.3%) | 319 (7.2%) |
| $20,000 to $24,999 | 110 (2.3%) | 355 (8.1%) |
| $25,000 to $34,999 | 208 (4.3%) | 577 (13.1%) |
| $35,000 to $49,999 | 391 (8.2%) | 560 (12.7%) |
| $50,000 to $74,999 | 758 (15.8%) | 514 (11.7%) |
| $75,000 to $99,999 | 555 (11.6%) | 555 (12.6%) |
| $100,000 to $149,999 | 992 (20.7%) | 364 (8.3%) |
| $150,000 or more | 1,536 (32.1%) | 158 (3.6%) |
| Total | 4,789 (100.0%) | 4,402 (100.0%) |
Monthly Housing Cost Tiers in Newark
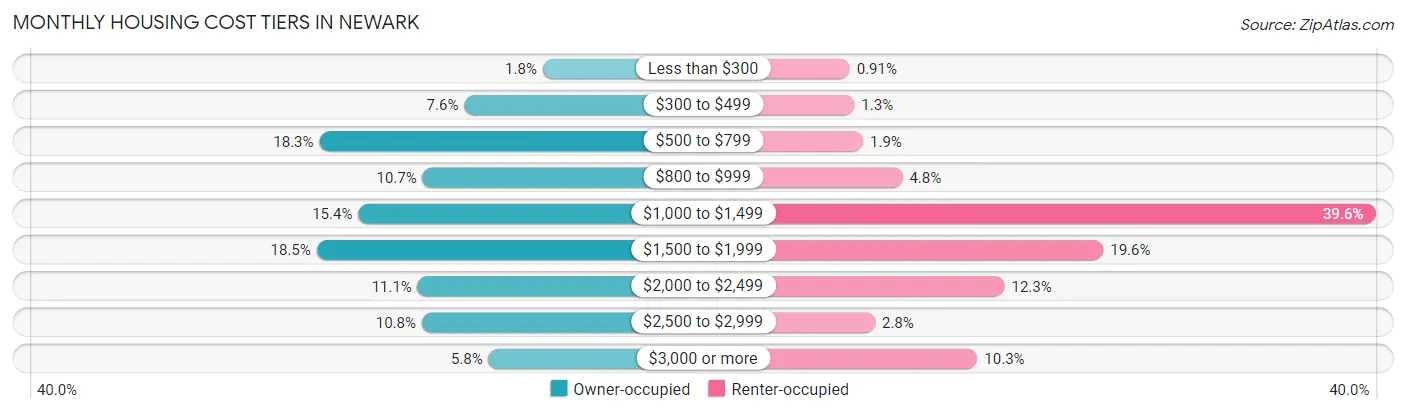
| Monthly Cost | Owner-occupied | Renter-occupied |
| Less than $300 | 88 (1.8%) | 40 (0.9%) |
| $300 to $499 | 365 (7.6%) | 55 (1.3%) |
| $500 to $799 | 876 (18.3%) | 83 (1.9%) |
| $800 to $999 | 512 (10.7%) | 211 (4.8%) |
| $1,000 to $1,499 | 739 (15.4%) | 1,743 (39.6%) |
| $1,500 to $1,999 | 886 (18.5%) | 862 (19.6%) |
| $2,000 to $2,499 | 529 (11.1%) | 542 (12.3%) |
| $2,500 to $2,999 | 515 (10.7%) | 122 (2.8%) |
| $3,000 or more | 279 (5.8%) | 454 (10.3%) |
| Total | 4,789 (100.0%) | 4,402 (100.0%) |
Physical Housing Characteristics in Newark
Housing Structures in Newark
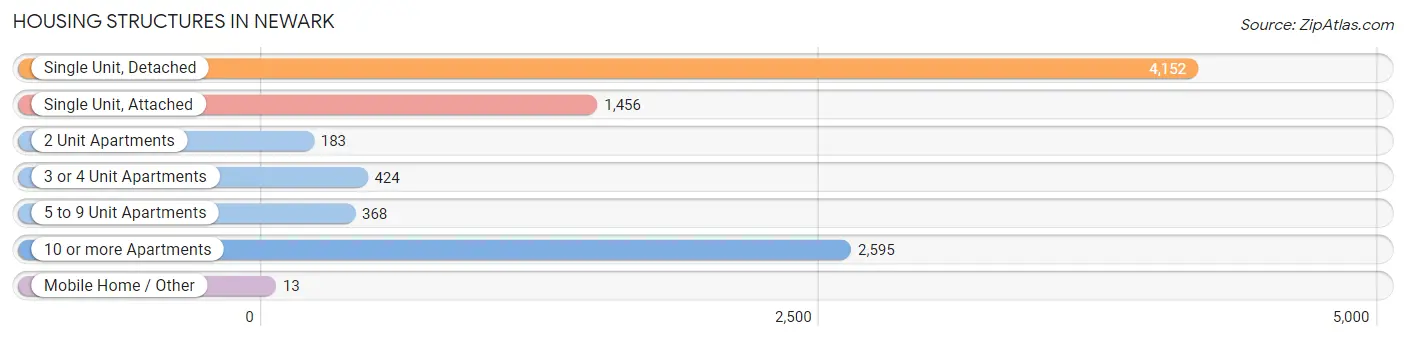
| Structure Type | # Housing Units | % Housing Units |
| Single Unit, Detached | 4,152 | 45.2% |
| Single Unit, Attached | 1,456 | 15.8% |
| 2 Unit Apartments | 183 | 2.0% |
| 3 or 4 Unit Apartments | 424 | 4.6% |
| 5 to 9 Unit Apartments | 368 | 4.0% |
| 10 or more Apartments | 2,595 | 28.2% |
| Mobile Home / Other | 13 | 0.1% |
| Total | 9,191 | 100.0% |
Housing Structures by Occupancy in Newark
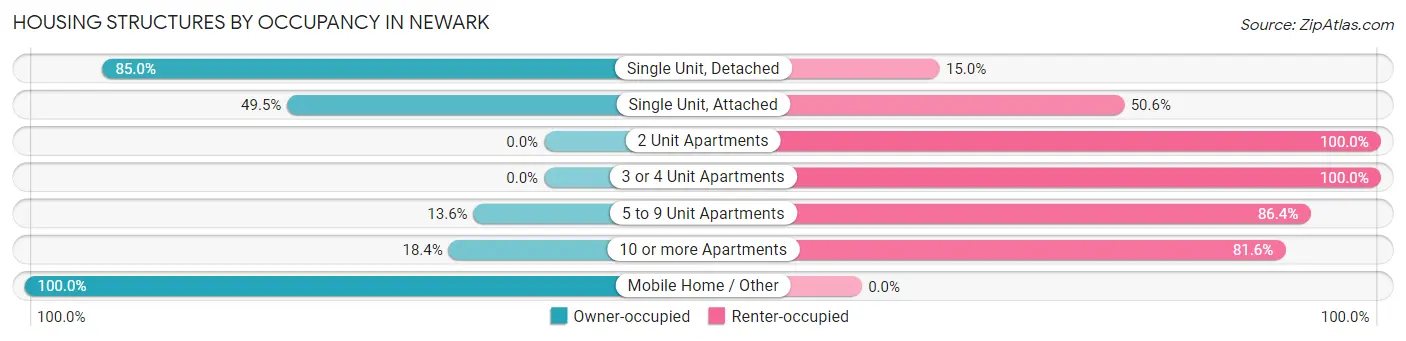
| Structure Type | Owner-occupied | Renter-occupied |
| Single Unit, Detached | 3,529 (85.0%) | 623 (15.0%) |
| Single Unit, Attached | 720 (49.4%) | 736 (50.5%) |
| 2 Unit Apartments | 0 (0.0%) | 183 (100.0%) |
| 3 or 4 Unit Apartments | 0 (0.0%) | 424 (100.0%) |
| 5 to 9 Unit Apartments | 50 (13.6%) | 318 (86.4%) |
| 10 or more Apartments | 477 (18.4%) | 2,118 (81.6%) |
| Mobile Home / Other | 13 (100.0%) | 0 (0.0%) |
| Total | 4,789 (52.1%) | 4,402 (47.9%) |
Housing Structures by Number of Rooms in Newark
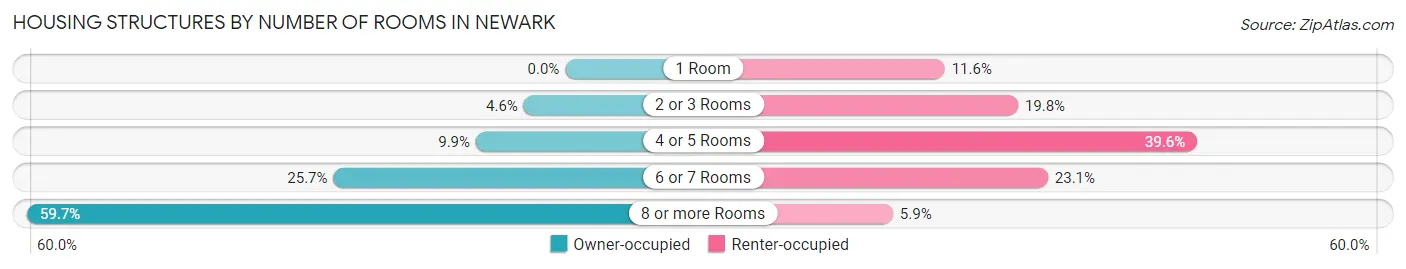
| Number of Rooms | Owner-occupied | Renter-occupied |
| 1 Room | 0 (0.0%) | 512 (11.6%) |
| 2 or 3 Rooms | 221 (4.6%) | 870 (19.8%) |
| 4 or 5 Rooms | 475 (9.9%) | 1,745 (39.6%) |
| 6 or 7 Rooms | 1,232 (25.7%) | 1,016 (23.1%) |
| 8 or more Rooms | 2,861 (59.7%) | 259 (5.9%) |
| Total | 4,789 (100.0%) | 4,402 (100.0%) |
Housing Structure by Heating Type in Newark
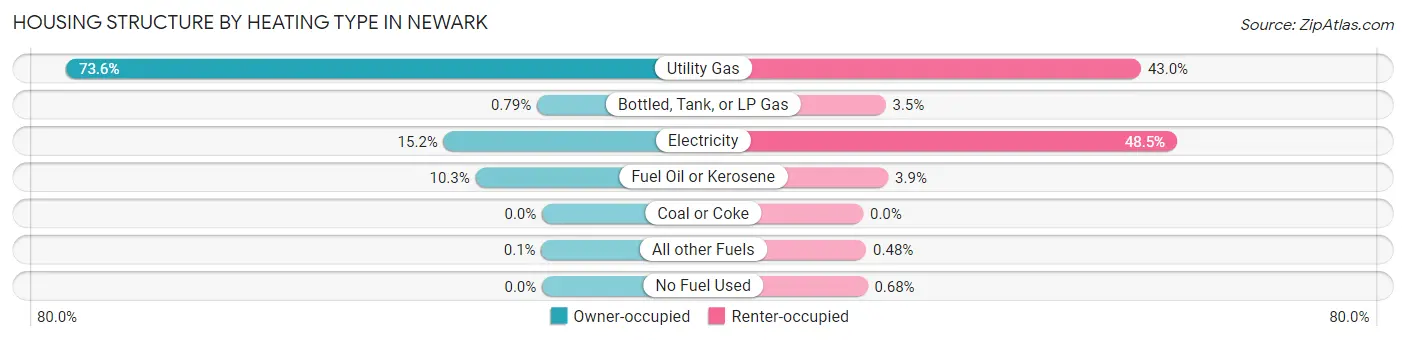
| Heating Type | Owner-occupied | Renter-occupied |
| Utility Gas | 3,524 (73.6%) | 1,891 (43.0%) |
| Bottled, Tank, or LP Gas | 38 (0.8%) | 153 (3.5%) |
| Electricity | 729 (15.2%) | 2,136 (48.5%) |
| Fuel Oil or Kerosene | 493 (10.3%) | 171 (3.9%) |
| Coal or Coke | 0 (0.0%) | 0 (0.0%) |
| All other Fuels | 5 (0.1%) | 21 (0.5%) |
| No Fuel Used | 0 (0.0%) | 30 (0.7%) |
| Total | 4,789 (100.0%) | 4,402 (100.0%) |
Household Vehicle Usage in Newark
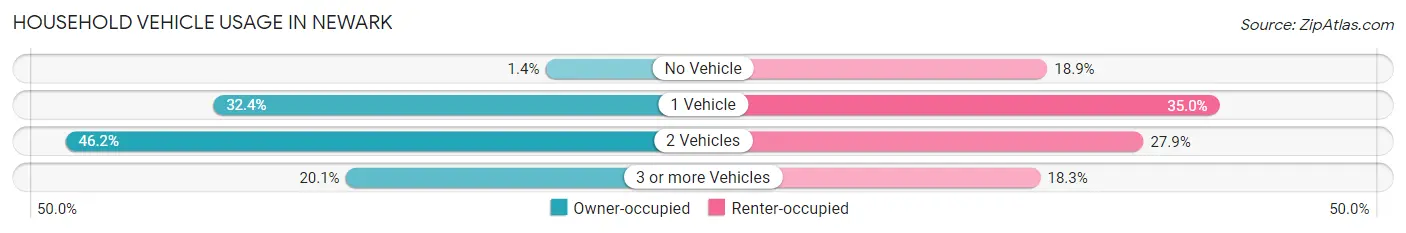
| Vehicles per Household | Owner-occupied | Renter-occupied |
| No Vehicle | 67 (1.4%) | 832 (18.9%) |
| 1 Vehicle | 1,551 (32.4%) | 1,539 (35.0%) |
| 2 Vehicles | 2,211 (46.2%) | 1,227 (27.9%) |
| 3 or more Vehicles | 960 (20.1%) | 804 (18.3%) |
| Total | 4,789 (100.0%) | 4,402 (100.0%) |
Real Estate & Mortgages in Newark
Real Estate and Mortgage Overview in Newark
| Characteristic | Without Mortgage | With Mortgage |
| Housing Units | 1,769 | 3,020 |
| Median Property Value | $351,700 | $325,900 |
| Median Household Income | $82,171 | $1,131 |
| Monthly Housing Costs | $660 | $279 |
| Real Estate Taxes | $2,802 | $43 |
Property Value by Mortgage Status in Newark
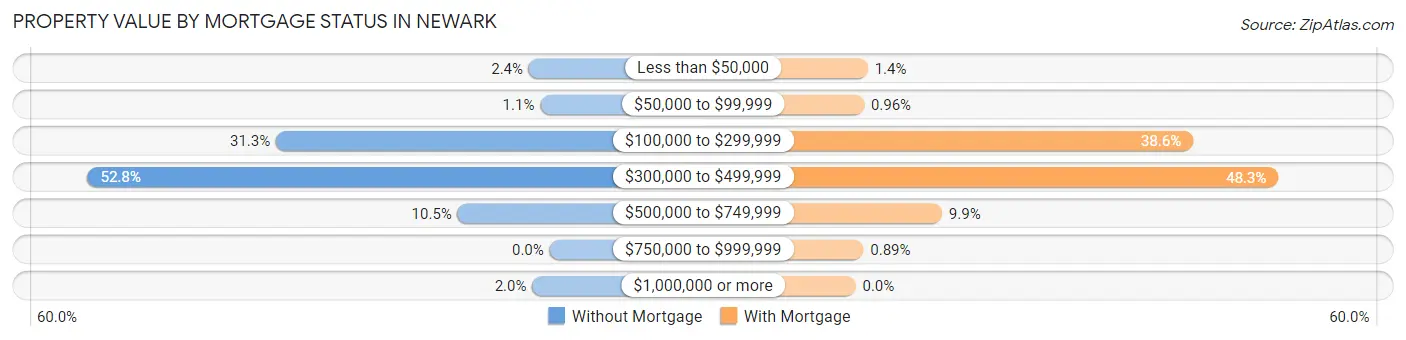
| Property Value | Without Mortgage | With Mortgage |
| Less than $50,000 | 42 (2.4%) | 42 (1.4%) |
| $50,000 to $99,999 | 19 (1.1%) | 29 (1.0%) |
| $100,000 to $299,999 | 553 (31.3%) | 1,165 (38.6%) |
| $300,000 to $499,999 | 934 (52.8%) | 1,459 (48.3%) |
| $500,000 to $749,999 | 186 (10.5%) | 298 (9.9%) |
| $750,000 to $999,999 | 0 (0.0%) | 27 (0.9%) |
| $1,000,000 or more | 35 (2.0%) | 0 (0.0%) |
| Total | 1,769 (100.0%) | 3,020 (100.0%) |
Household Income by Mortgage Status in Newark
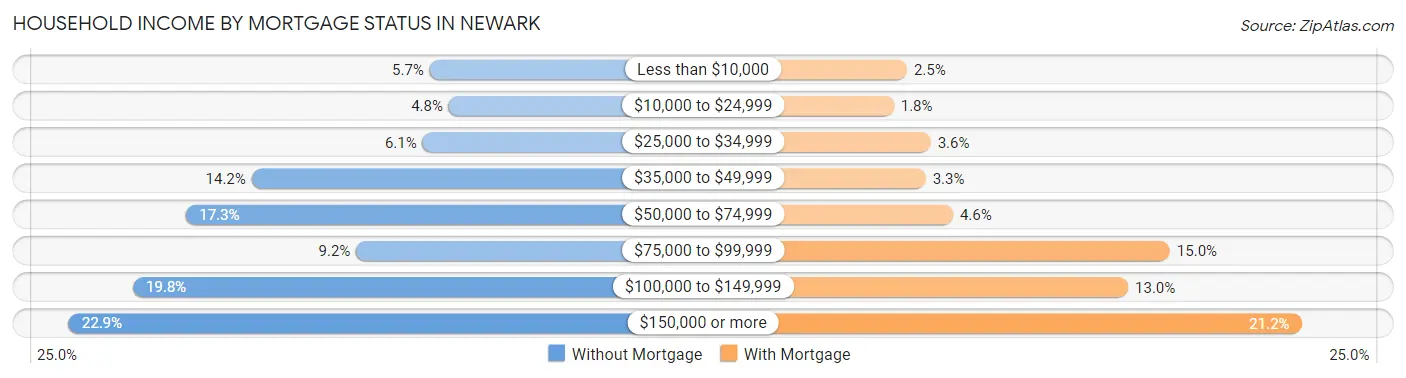
| Household Income | Without Mortgage | With Mortgage |
| Less than $10,000 | 101 (5.7%) | 74 (2.5%) |
| $10,000 to $24,999 | 85 (4.8%) | 55 (1.8%) |
| $25,000 to $34,999 | 107 (6.0%) | 108 (3.6%) |
| $35,000 to $49,999 | 251 (14.2%) | 101 (3.3%) |
| $50,000 to $74,999 | 306 (17.3%) | 140 (4.6%) |
| $75,000 to $99,999 | 163 (9.2%) | 452 (15.0%) |
| $100,000 to $149,999 | 351 (19.8%) | 392 (13.0%) |
| $150,000 or more | 405 (22.9%) | 641 (21.2%) |
| Total | 1,769 (100.0%) | 3,020 (100.0%) |
Property Value to Household Income Ratio in Newark
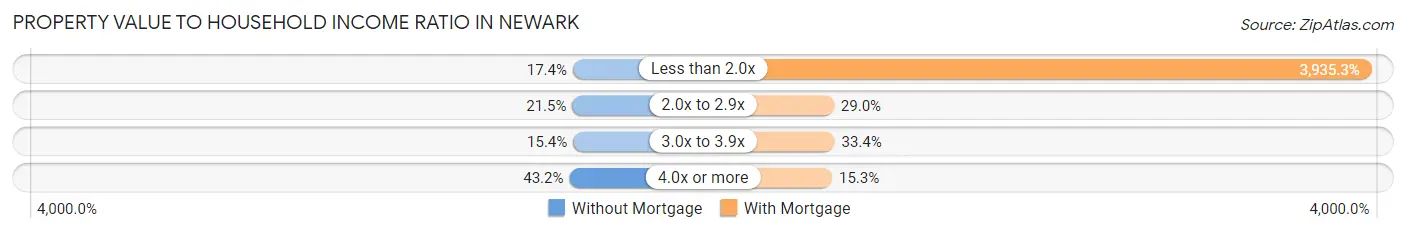
| Value-to-Income Ratio | Without Mortgage | With Mortgage |
| Less than 2.0x | 308 (17.4%) | 118,846 (3,935.3%) |
| 2.0x to 2.9x | 381 (21.5%) | 876 (29.0%) |
| 3.0x to 3.9x | 273 (15.4%) | 1,008 (33.4%) |
| 4.0x or more | 765 (43.2%) | 463 (15.3%) |
| Total | 1,769 (100.0%) | 3,020 (100.0%) |
Real Estate Taxes by Mortgage Status in Newark
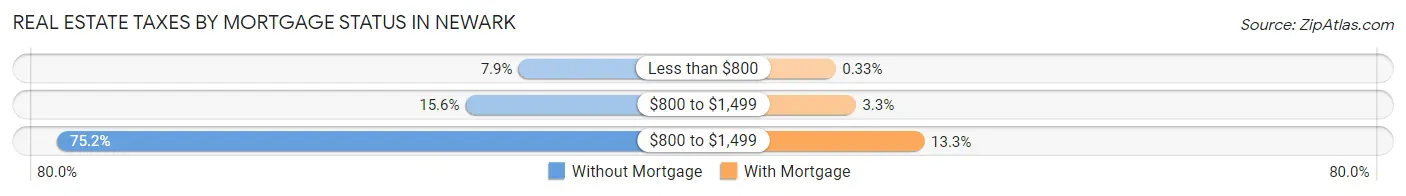
| Property Taxes | Without Mortgage | With Mortgage |
| Less than $800 | 139 (7.9%) | 10 (0.3%) |
| $800 to $1,499 | 276 (15.6%) | 99 (3.3%) |
| $800 to $1,499 | 1,331 (75.2%) | 402 (13.3%) |
| Total | 1,769 (100.0%) | 3,020 (100.0%) |
Health & Disability in Newark
Health Insurance Coverage by Age in Newark
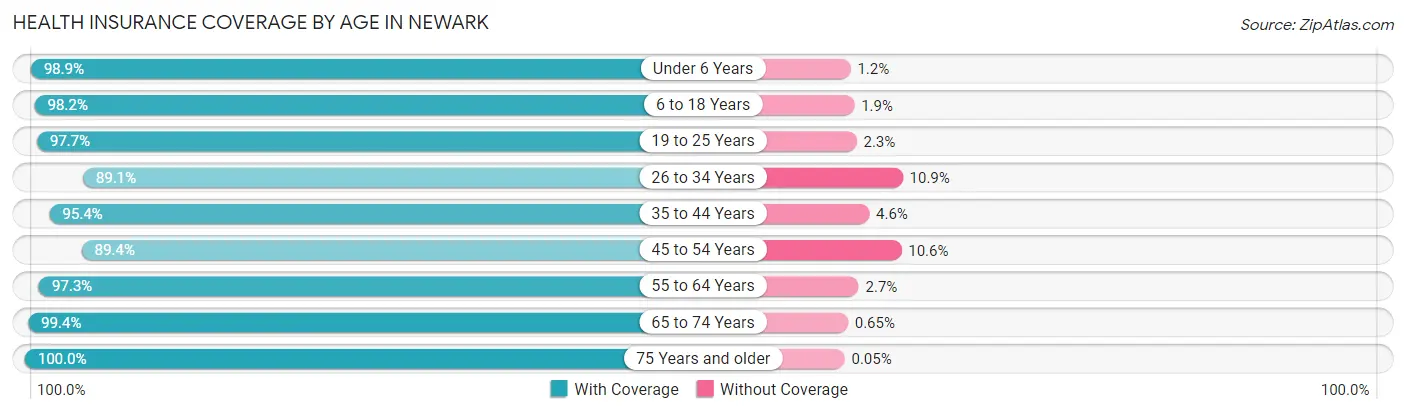
| Age Bracket | With Coverage | Without Coverage |
| Under 6 Years | 862 (98.9%) | 10 (1.1%) |
| 6 to 18 Years | 5,095 (98.2%) | 96 (1.8%) |
| 19 to 25 Years | 11,098 (97.7%) | 259 (2.3%) |
| 26 to 34 Years | 2,714 (89.1%) | 331 (10.9%) |
| 35 to 44 Years | 1,771 (95.4%) | 86 (4.6%) |
| 45 to 54 Years | 1,782 (89.4%) | 212 (10.6%) |
| 55 to 64 Years | 2,294 (97.3%) | 63 (2.7%) |
| 65 to 74 Years | 1,983 (99.4%) | 13 (0.6%) |
| 75 Years and older | 1,866 (100.0%) | 1 (0.1%) |
| Total | 29,465 (96.5%) | 1,071 (3.5%) |
Health Insurance Coverage by Citizenship Status in Newark
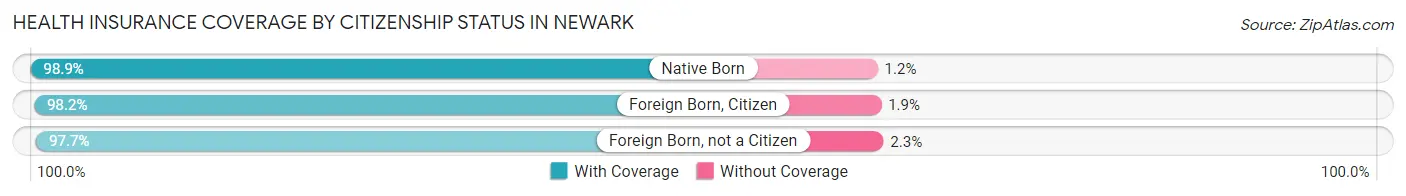
| Citizenship Status | With Coverage | Without Coverage |
| Native Born | 862 (98.9%) | 10 (1.1%) |
| Foreign Born, Citizen | 5,095 (98.2%) | 96 (1.8%) |
| Foreign Born, not a Citizen | 11,098 (97.7%) | 259 (2.3%) |
Health Insurance Coverage by Household Income in Newark
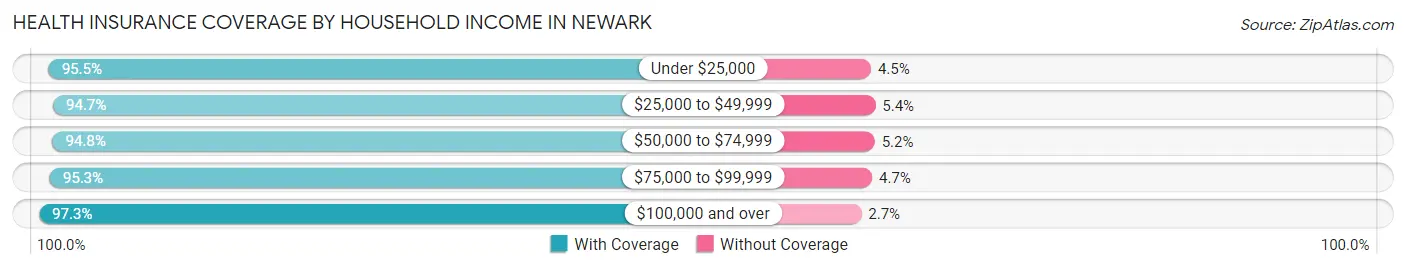
| Household Income | With Coverage | Without Coverage |
| Under $25,000 | 4,402 (95.5%) | 209 (4.5%) |
| $25,000 to $49,999 | 3,574 (94.7%) | 202 (5.3%) |
| $50,000 to $74,999 | 2,858 (94.8%) | 158 (5.2%) |
| $75,000 to $99,999 | 2,213 (95.3%) | 110 (4.7%) |
| $100,000 and over | 9,085 (97.3%) | 254 (2.7%) |
Public vs Private Health Insurance Coverage by Age in Newark
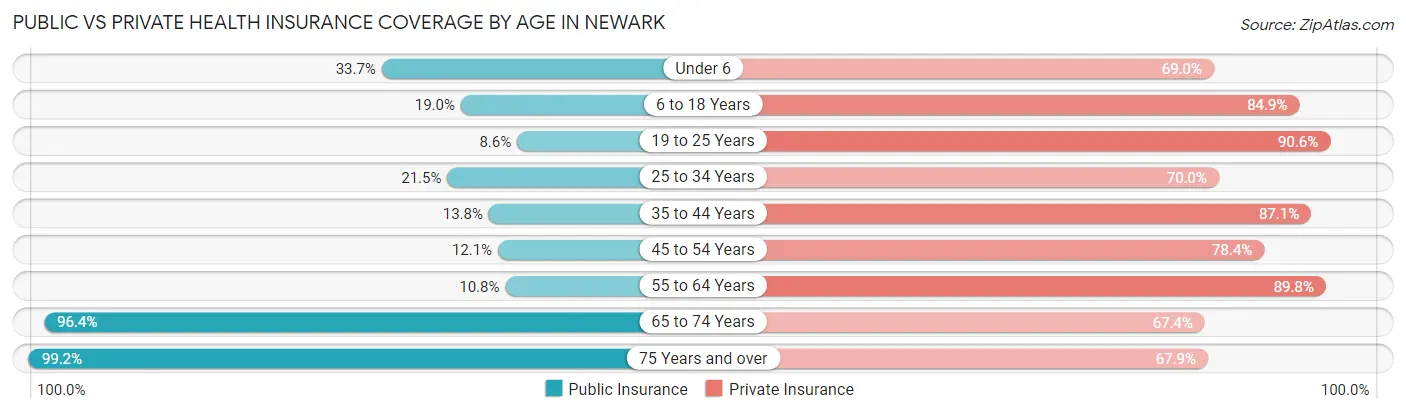
| Age Bracket | Public Insurance | Private Insurance |
| Under 6 | 294 (33.7%) | 602 (69.0%) |
| 6 to 18 Years | 988 (19.0%) | 4,407 (84.9%) |
| 19 to 25 Years | 977 (8.6%) | 10,293 (90.6%) |
| 25 to 34 Years | 656 (21.5%) | 2,131 (70.0%) |
| 35 to 44 Years | 257 (13.8%) | 1,617 (87.1%) |
| 45 to 54 Years | 242 (12.1%) | 1,563 (78.4%) |
| 55 to 64 Years | 254 (10.8%) | 2,117 (89.8%) |
| 65 to 74 Years | 1,924 (96.4%) | 1,345 (67.4%) |
| 75 Years and over | 1,852 (99.2%) | 1,268 (67.9%) |
| Total | 7,444 (24.4%) | 25,343 (83.0%) |
Disability Status by Sex by Age in Newark
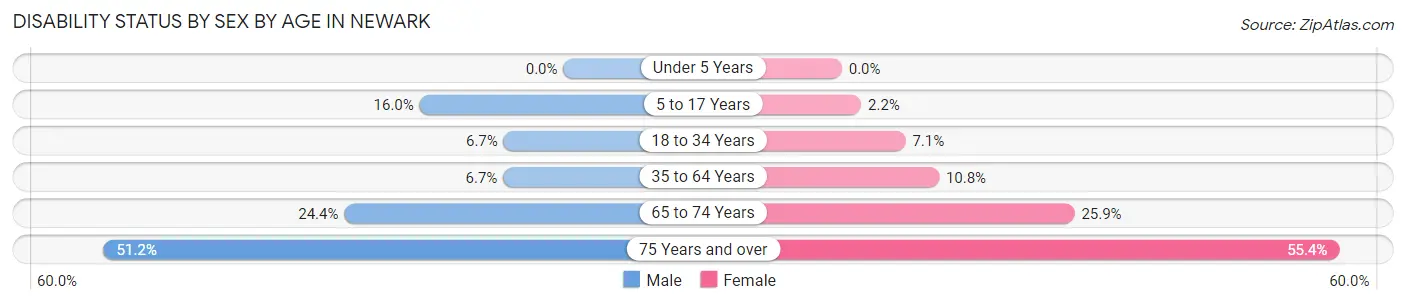
| Age Bracket | Male | Female |
| Under 5 Years | 0 (0.0%) | 0 (0.0%) |
| 5 to 17 Years | 199 (16.0%) | 34 (2.1%) |
| 18 to 34 Years | 551 (6.7%) | 613 (7.1%) |
| 35 to 64 Years | 208 (6.7%) | 336 (10.8%) |
| 65 to 74 Years | 212 (24.4%) | 292 (25.9%) |
| 75 Years and over | 443 (51.2%) | 555 (55.4%) |
Disability Class by Sex by Age in Newark
Disability Class: Hearing Difficulty
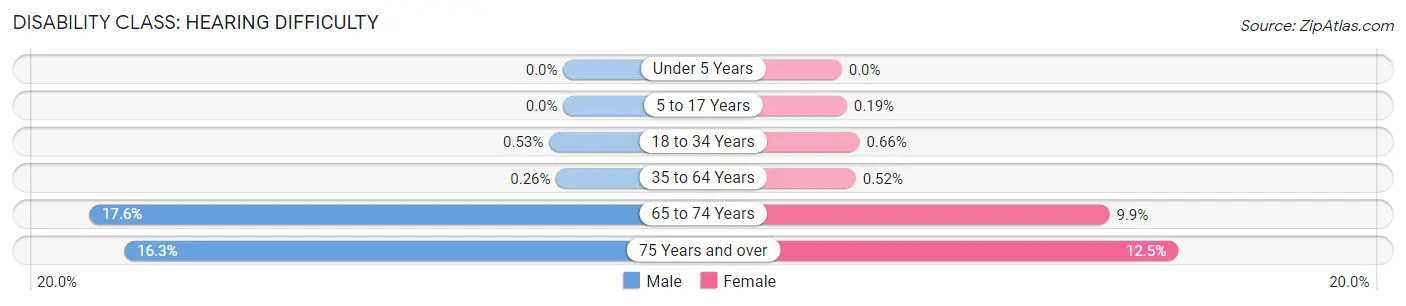
| Age Bracket | Male | Female |
| Under 5 Years | 0 (0.0%) | 0 (0.0%) |
| 5 to 17 Years | 0 (0.0%) | 3 (0.2%) |
| 18 to 34 Years | 44 (0.5%) | 57 (0.7%) |
| 35 to 64 Years | 8 (0.3%) | 16 (0.5%) |
| 65 to 74 Years | 153 (17.6%) | 112 (9.9%) |
| 75 Years and over | 141 (16.3%) | 125 (12.5%) |
Disability Class: Vision Difficulty
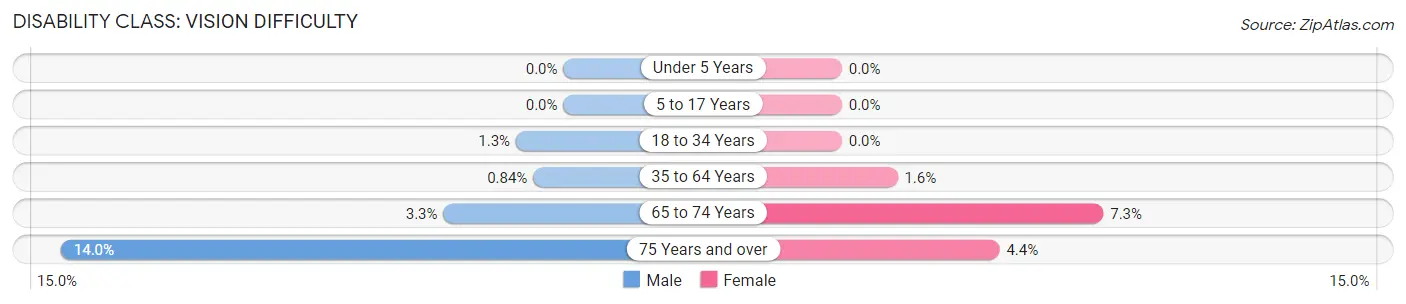
| Age Bracket | Male | Female |
| Under 5 Years | 0 (0.0%) | 0 (0.0%) |
| 5 to 17 Years | 0 (0.0%) | 0 (0.0%) |
| 18 to 34 Years | 109 (1.3%) | 0 (0.0%) |
| 35 to 64 Years | 26 (0.8%) | 48 (1.5%) |
| 65 to 74 Years | 29 (3.3%) | 82 (7.3%) |
| 75 Years and over | 121 (14.0%) | 44 (4.4%) |
Disability Class: Cognitive Difficulty
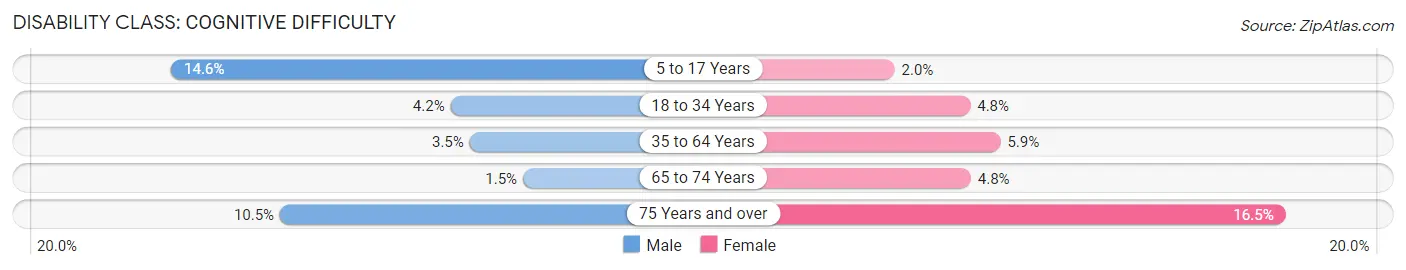
| Age Bracket | Male | Female |
| 5 to 17 Years | 181 (14.6%) | 31 (2.0%) |
| 18 to 34 Years | 347 (4.2%) | 413 (4.8%) |
| 35 to 64 Years | 108 (3.5%) | 183 (5.9%) |
| 65 to 74 Years | 13 (1.5%) | 54 (4.8%) |
| 75 Years and over | 91 (10.5%) | 165 (16.5%) |
Disability Class: Ambulatory Difficulty
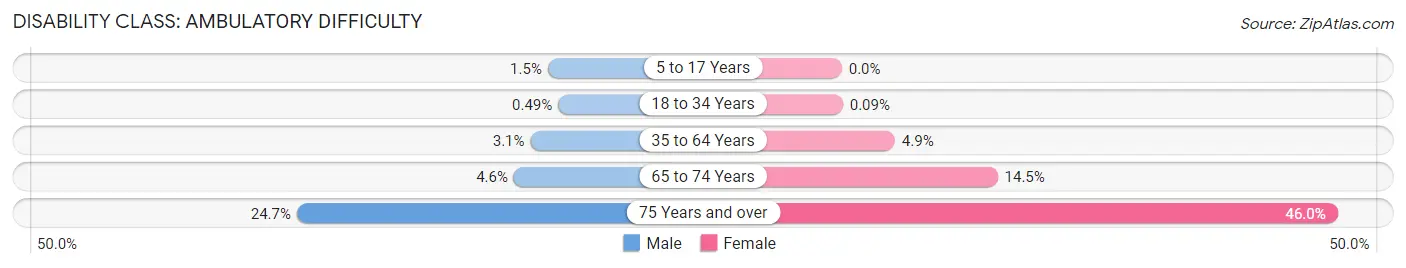
| Age Bracket | Male | Female |
| 5 to 17 Years | 18 (1.5%) | 0 (0.0%) |
| 18 to 34 Years | 41 (0.5%) | 8 (0.1%) |
| 35 to 64 Years | 95 (3.1%) | 153 (4.9%) |
| 65 to 74 Years | 40 (4.6%) | 163 (14.5%) |
| 75 Years and over | 214 (24.7%) | 461 (46.0%) |
Disability Class: Self-Care Difficulty
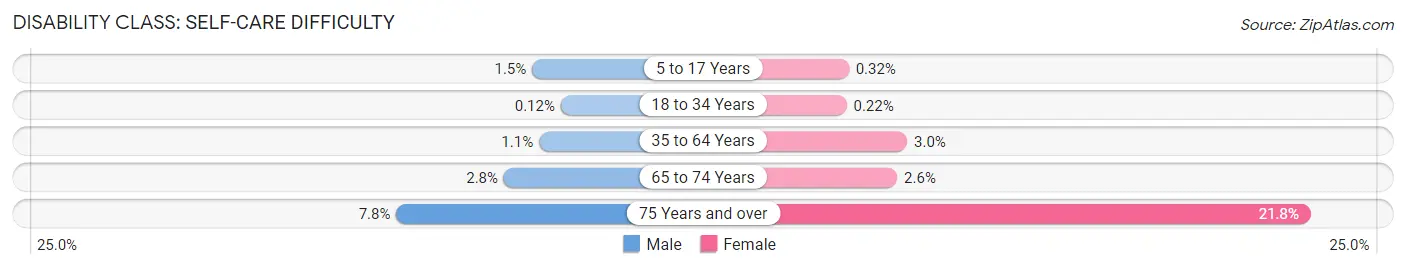
| Age Bracket | Male | Female |
| 5 to 17 Years | 18 (1.5%) | 5 (0.3%) |
| 18 to 34 Years | 10 (0.1%) | 19 (0.2%) |
| 35 to 64 Years | 35 (1.1%) | 94 (3.0%) |
| 65 to 74 Years | 24 (2.8%) | 29 (2.6%) |
| 75 Years and over | 67 (7.7%) | 218 (21.8%) |
Technology Access in Newark
Computing Device Access in Newark
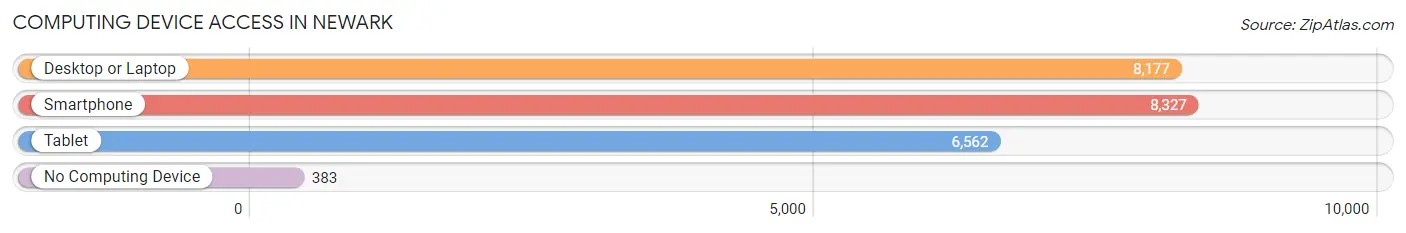
| Device Type | # Households | % Households |
| Desktop or Laptop | 8,177 | 89.0% |
| Smartphone | 8,327 | 90.6% |
| Tablet | 6,562 | 71.4% |
| No Computing Device | 383 | 4.2% |
| Total | 9,191 | 100.0% |
Internet Access in Newark
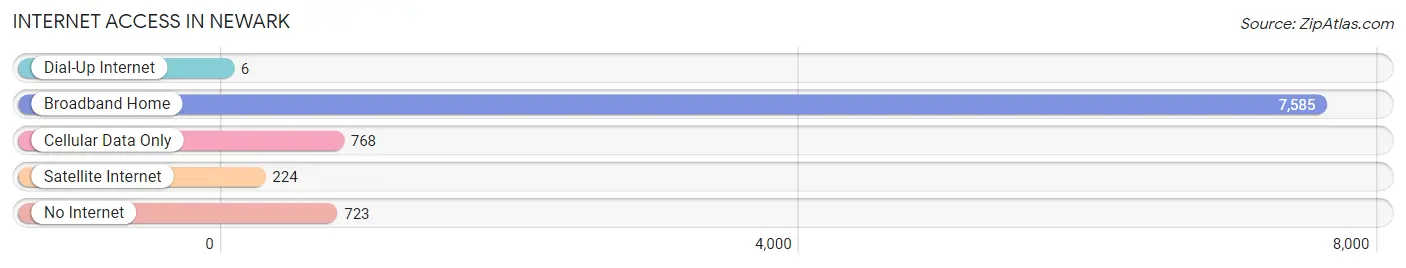
| Internet Type | # Households | % Households |
| Dial-Up Internet | 6 | 0.1% |
| Broadband Home | 7,585 | 82.5% |
| Cellular Data Only | 768 | 8.4% |
| Satellite Internet | 224 | 2.4% |
| No Internet | 723 | 7.9% |
| Total | 9,191 | 100.0% |
Newark Summary
Newark, Delaware is a city located in New Castle County, Delaware, United States. It is located about 12 miles southwest of Wilmington, and is part of the Philadelphia metropolitan area. As of the 2010 census, the population of Newark was 31,454, making it the largest city in the state of Delaware.
History
The area now known as Newark was first settled by Europeans in 1694, when a Swedish trading post was established near the present-day site of the University of Delaware. The area was then part of the Dutch colony of New Netherland, and later part of the Province of Pennsylvania. In 1758, the area was transferred to the British crown, and in 1763, it became part of the newly-formed colony of Delaware.
In 1776, the city of Newark was founded by a group of settlers from New Jersey. The city was named after Newark, New Jersey, and was incorporated in 1833. During the 19th century, Newark was a major center of industry, with several mills and factories located in the city.
Geography
Newark is located at 39°41'N 75°44'W (39.68, -75.73). According to the United States Census Bureau, the city has a total area of 8.7 square miles (22.5 km2), of which 8.6 square miles (22.3 km2) is land and 0.1 square miles (0.2 km2) is water.
The city is located in the Piedmont region of Delaware, and is bordered by the Christina River to the east and White Clay Creek to the west. The city is located in the humid subtropical climate zone, and experiences hot, humid summers and mild winters.
Economy
Newark is a major economic center in the state of Delaware. The city is home to several large corporations, including AstraZeneca, Bank of America, DuPont, and W.L. Gore & Associates. The city is also home to the University of Delaware, which is the largest employer in the city.
The city's economy is also supported by a large number of small businesses, including restaurants, retail stores, and professional services. Newark is also home to several large shopping centers, including the Christiana Mall and the University of Delaware Shopping Center.
Demographics
As of the 2010 census, there were 31,454 people, 11,945 households, and 7,845 families residing in the city. The population density was 3,637.2 people per square mile (1,406.2/km2). There were 12,845 housing units at an average density of 1,491.2 per square mile (575.2/km2). The racial makeup of the city was 77.2% White, 11.3% African American, 0.4% Native American, 5.7% Asian, 0.1% Pacific Islander, 2.3% from other races, and 3.1% from two or more races. Hispanic or Latino of any race were 6.7% of the population.
The median income for a household in the city was $50,945, and the median income for a family was $63,945. Males had a median income of $45,945 versus $35,945 for females. The per capita income for the city was $25,945. About 5.2% of families and 8.2% of the population were below the poverty line, including 10.2% of those under age 18 and 6.2% of those age 65 or over.
Common Questions
What is Per Capita Income in Newark?
Per Capita income in Newark is $32,240.
What is the Median Family Income in Newark?
Median Family Income in Newark is $106,453.
What is the Median Household income in Newark?
Median Household Income in Newark is $67,738.
What is Income or Wage Gap in Newark?
Income or Wage Gap in Newark is 61.7%.
Women in Newark earn 38.3 cents for every dollar earned by a man.
What is Family Income Deficit in Newark?
Family Income Deficit in Newark is $11,979.
Families that are below poverty line in Newark earn $11,979 less on average than the poverty threshold level.
What is Inequality or Gini Index in Newark?
Inequality or Gini Index in Newark is 0.48.
What is the Total Population of Newark?
Total Population of Newark is 30,655.
What is the Total Male Population of Newark?
Total Male Population of Newark is 14,781.
What is the Total Female Population of Newark?
Total Female Population of Newark is 15,874.
What is the Ratio of Males per 100 Females in Newark?
There are 93.11 Males per 100 Females in Newark.
What is the Ratio of Females per 100 Males in Newark?
There are 107.39 Females per 100 Males in Newark.
What is the Median Population Age in Newark?
Median Population Age in Newark is 22.6 Years.
What is the Average Family Size in Newark
Average Family Size in Newark is 3.1 People.
What is the Average Household Size in Newark
Average Household Size in Newark is 2.5 People.
How Large is the Labor Force in Newark?
There are 14,389 People in the Labor Forcein in Newark.
What is the Percentage of People in the Labor Force in Newark?
52.0% of People are in the Labor Force in Newark.
What is the Unemployment Rate in Newark?
Unemployment Rate in Newark is 7.0%.