Blanchard, ID Map & Demographics
Blanchard Map
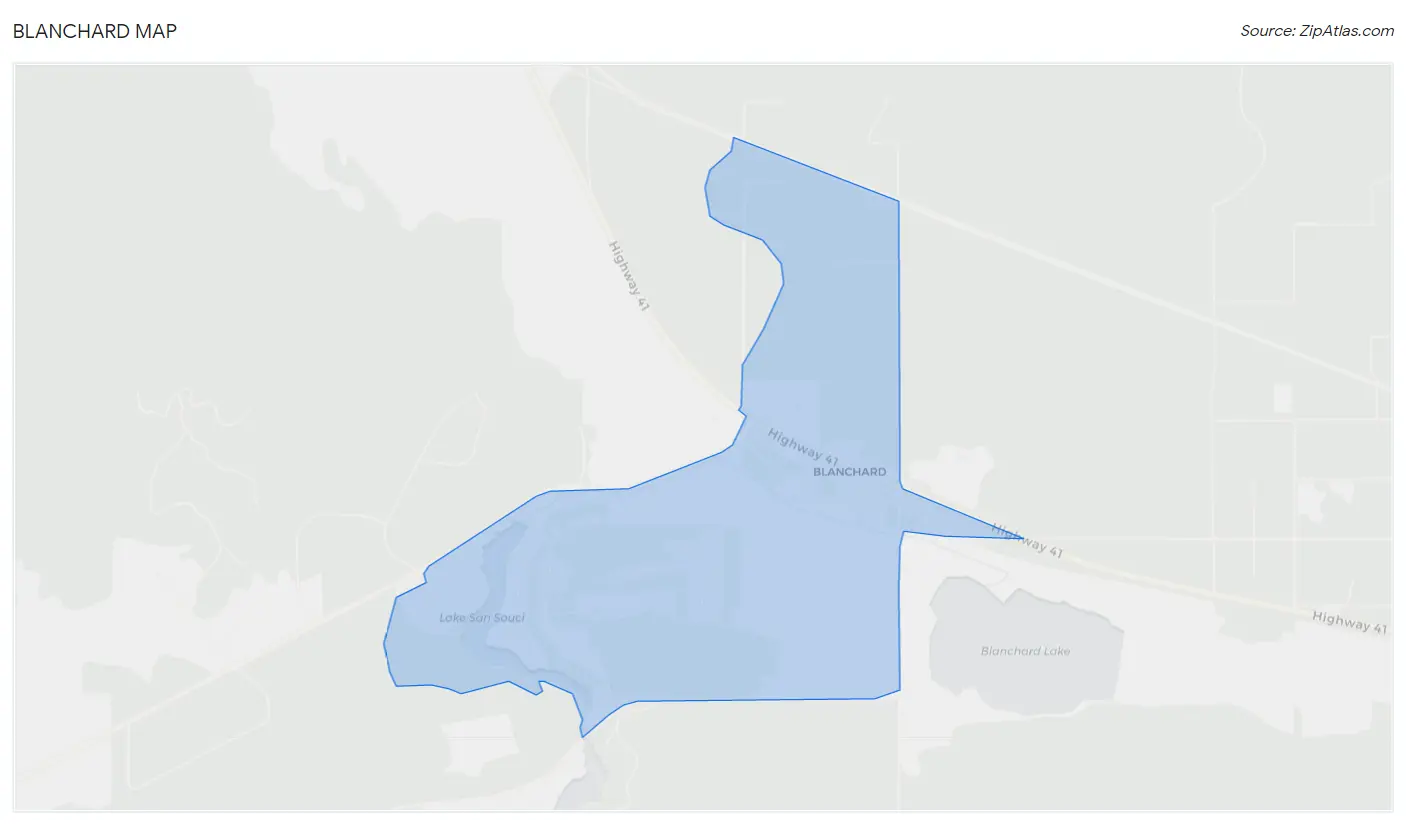
Blanchard Overview
$60,886
PER CAPITA INCOME
$52,555
AVG HOUSEHOLD INCOME
0.47
INEQUALITY / GINI INDEX
438
TOTAL POPULATION
289
MALE POPULATION
149
FEMALE POPULATION
193.96
MALES / 100 FEMALES
51.56
FEMALES / 100 MALES
68.3
MEDIAN AGE
2.0
AVG FAMILY SIZE
1.6
AVG HOUSEHOLD SIZE
28
LABOR FORCE [ PEOPLE ]
6.5%
PERCENT IN LABOR FORCE
Blanchard Zip Codes
Blanchard Area Codes
Income in Blanchard
Income Overview in Blanchard
| Characteristic | Number | Measure |
| Per Capita Income | 438 | $60,886 |
| Median Family Income | 155 | $0 |
| Mean Family Income | 155 | $134,366 |
| Median Household Income | 281 | $52,555 |
| Mean Household Income | 281 | $94,374 |
| Income Deficit | 155 | $0 |
| Wage / Income Gap (%) | 438 | 0.00% |
| Wage / Income Gap ($) | 438 | 100.00¢ per $1 |
| Gini / Inequality Index | 438 | 0.47 |
Earnings by Sex in Blanchard
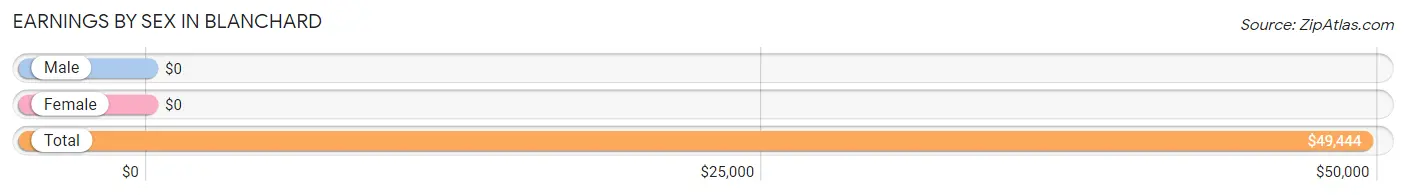
| Sex | Number | Average Earnings |
| Male | 32 (69.6%) | $0 |
| Female | 14 (30.4%) | $0 |
| Total | 46 (100.0%) | $49,444 |
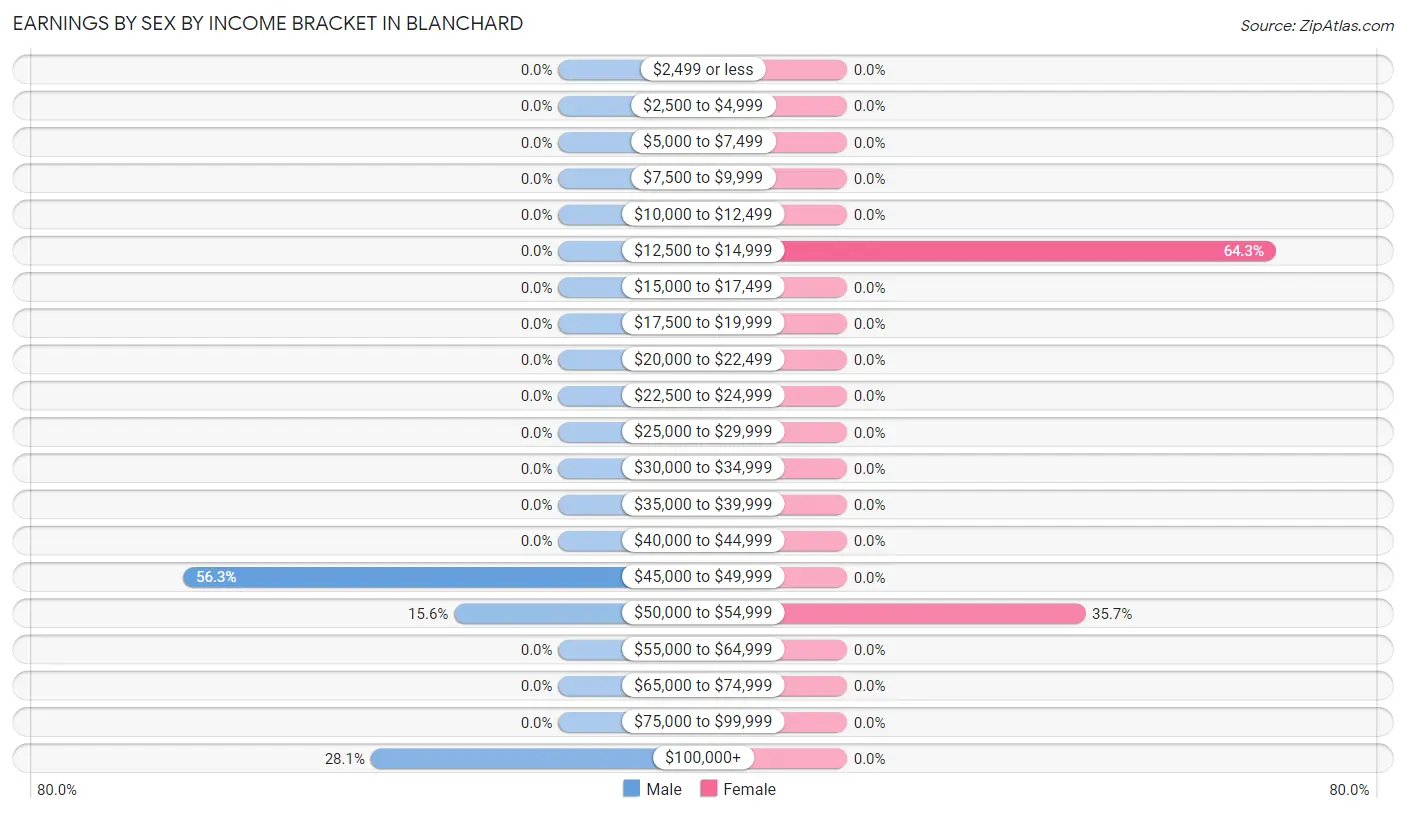
Earnings by Sex by Income Bracket in Blanchard
The most common earnings brackets in Blanchard are $45,000 to $49,999 for men (18 | 56.2%) and $12,500 to $14,999 for women (9 | 64.3%).
| Income | Male | Female |
| $2,499 or less | 0 (0.0%) | 0 (0.0%) |
| $2,500 to $4,999 | 0 (0.0%) | 0 (0.0%) |
| $5,000 to $7,499 | 0 (0.0%) | 0 (0.0%) |
| $7,500 to $9,999 | 0 (0.0%) | 0 (0.0%) |
| $10,000 to $12,499 | 0 (0.0%) | 0 (0.0%) |
| $12,500 to $14,999 | 0 (0.0%) | 9 (64.3%) |
| $15,000 to $17,499 | 0 (0.0%) | 0 (0.0%) |
| $17,500 to $19,999 | 0 (0.0%) | 0 (0.0%) |
| $20,000 to $22,499 | 0 (0.0%) | 0 (0.0%) |
| $22,500 to $24,999 | 0 (0.0%) | 0 (0.0%) |
| $25,000 to $29,999 | 0 (0.0%) | 0 (0.0%) |
| $30,000 to $34,999 | 0 (0.0%) | 0 (0.0%) |
| $35,000 to $39,999 | 0 (0.0%) | 0 (0.0%) |
| $40,000 to $44,999 | 0 (0.0%) | 0 (0.0%) |
| $45,000 to $49,999 | 18 (56.2%) | 0 (0.0%) |
| $50,000 to $54,999 | 5 (15.6%) | 5 (35.7%) |
| $55,000 to $64,999 | 0 (0.0%) | 0 (0.0%) |
| $65,000 to $74,999 | 0 (0.0%) | 0 (0.0%) |
| $75,000 to $99,999 | 0 (0.0%) | 0 (0.0%) |
| $100,000+ | 9 (28.1%) | 0 (0.0%) |
| Total | 32 (100.0%) | 14 (100.0%) |
Earnings by Sex by Educational Attainment in Blanchard
| Educational Attainment | Male Income | Female Income |
| Less than High School | - | - |
| High School Diploma | - | - |
| College or Associate's Degree | - | - |
| Bachelor's Degree | - | - |
| Graduate Degree | - | - |
| Total | - | - |
Family Income in Blanchard
Family Income Brackets in Blanchard
According to the Blanchard family income data, there are 63 families falling into the $50,000 to $74,999 income range, which is the most common income bracket and makes up 40.6% of all families.
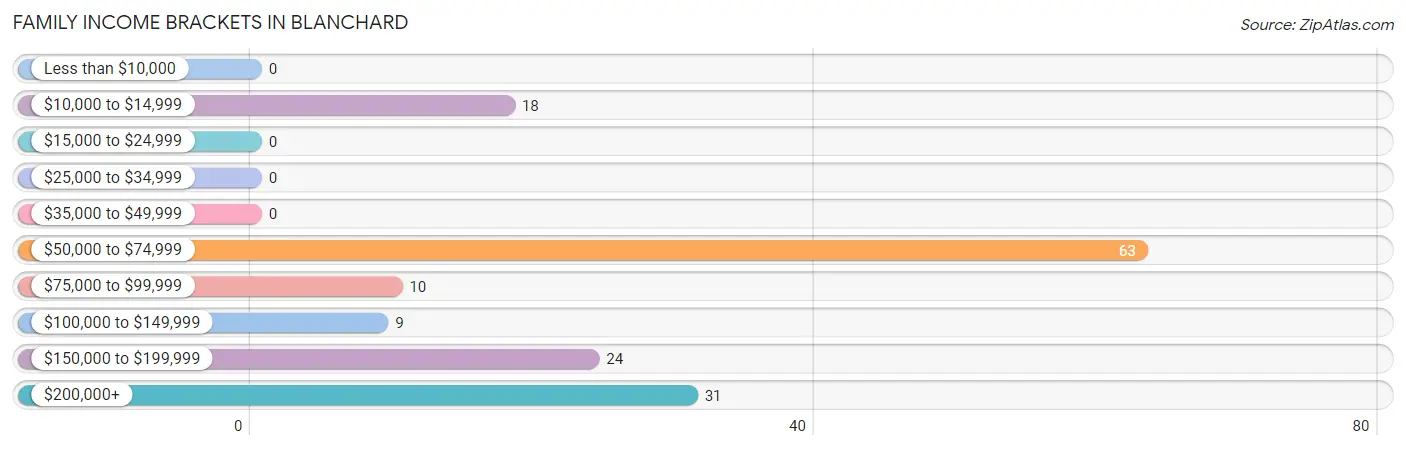
| Income Bracket | # Families | % Families |
| Less than $10,000 | 0 | 0.0% |
| $10,000 to $14,999 | 18 | 11.6% |
| $15,000 to $24,999 | 0 | 0.0% |
| $25,000 to $34,999 | 0 | 0.0% |
| $35,000 to $49,999 | 0 | 0.0% |
| $50,000 to $74,999 | 63 | 40.6% |
| $75,000 to $99,999 | 10 | 6.5% |
| $100,000 to $149,999 | 9 | 5.8% |
| $150,000 to $199,999 | 24 | 15.5% |
| $200,000+ | 31 | 20.0% |
Family Income by Famaliy Size in Blanchard
| Income Bracket | # Families | Median Income |
| 2-Person Families | 146 (94.2%) | $0 |
| 3-Person Families | 0 (0.0%) | $0 |
| 4-Person Families | 9 (5.8%) | $0 |
| 5-Person Families | 0 (0.0%) | $0 |
| 6-Person Families | 0 (0.0%) | $0 |
| 7+ Person Families | 0 (0.0%) | $0 |
| Total | 155 (100.0%) | $0 |
Family Income by Number of Earners in Blanchard
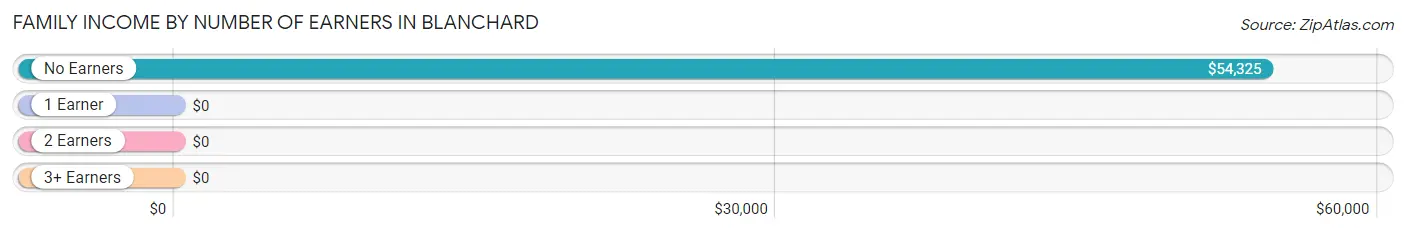
| Number of Earners | # Families | Median Income |
| No Earners | 128 (82.6%) | $54,325 |
| 1 Earner | 18 (11.6%) | $0 |
| 2 Earners | 9 (5.8%) | $0 |
| 3+ Earners | 0 (0.0%) | $0 |
| Total | 155 (100.0%) | $0 |
Household Income in Blanchard
Household Income Brackets in Blanchard
With 103 households falling in the category, the $35,000 to $49,999 income range is the most frequent in Blanchard, accounting for 36.6% of all households.
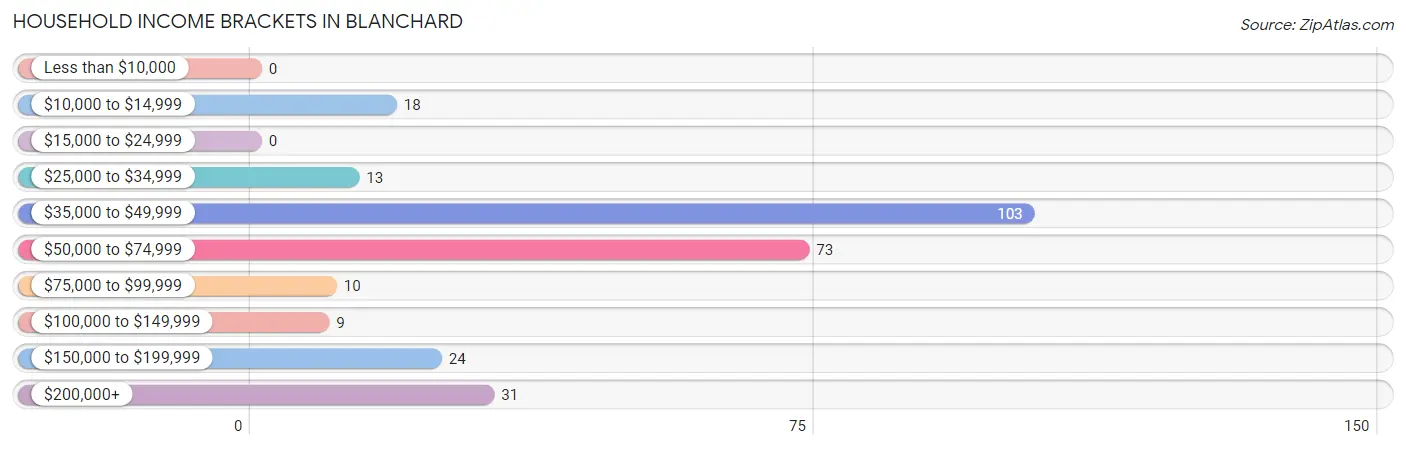
| Income Bracket | # Households | % Households |
| Less than $10,000 | 0 | 0.0% |
| $10,000 to $14,999 | 18 | 6.4% |
| $15,000 to $24,999 | 0 | 0.0% |
| $25,000 to $34,999 | 13 | 4.6% |
| $35,000 to $49,999 | 103 | 36.7% |
| $50,000 to $74,999 | 73 | 26.0% |
| $75,000 to $99,999 | 10 | 3.6% |
| $100,000 to $149,999 | 9 | 3.2% |
| $150,000 to $199,999 | 24 | 8.5% |
| $200,000+ | 31 | 11.0% |
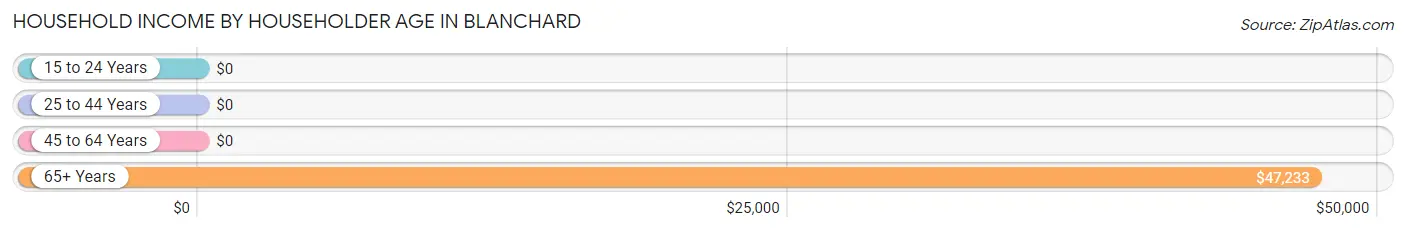
Household Income by Householder Age in Blanchard
The median household income in Blanchard is $52,555, with the highest median household income of $47,233 found in the 65+ years age bracket for the primary householder. A total of 246 households (87.5%) fall into this category.
| Income Bracket | # Households | Median Income |
| 15 to 24 Years | 0 (0.0%) | $0 |
| 25 to 44 Years | 19 (6.8%) | $0 |
| 45 to 64 Years | 16 (5.7%) | $0 |
| 65+ Years | 246 (87.5%) | $47,233 |
| Total | 281 (100.0%) | $52,555 |
Poverty in Blanchard
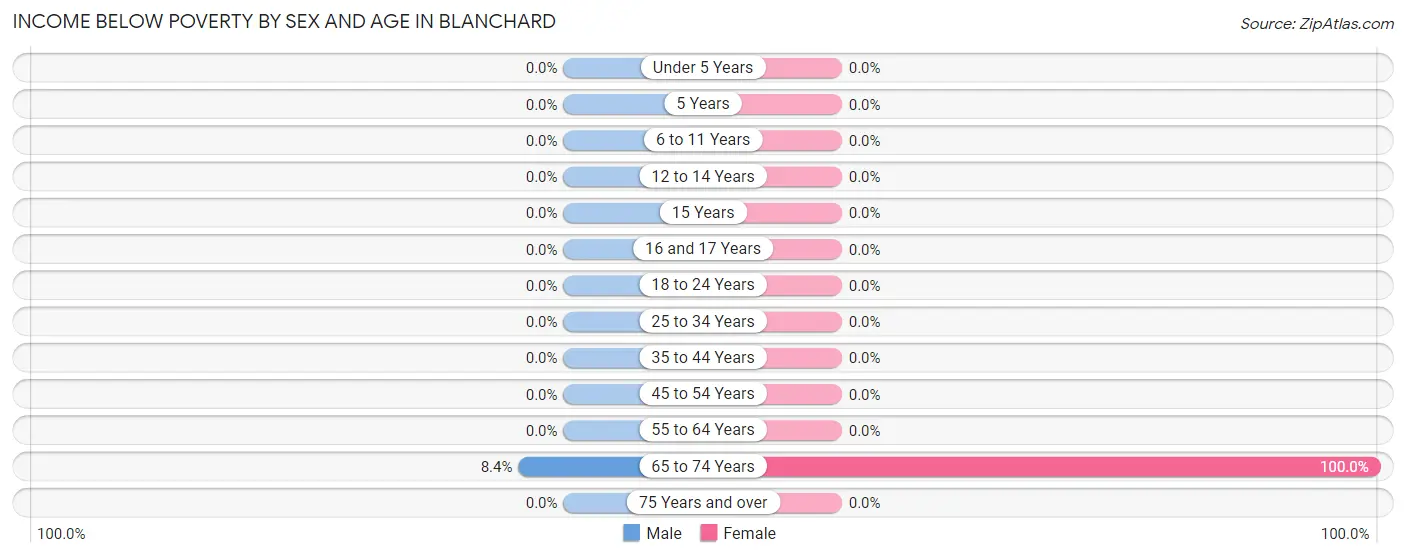
Income Below Poverty by Sex and Age in Blanchard
With 6.2% poverty level for males and 12.1% for females among the residents of Blanchard, 65 to 74 year old males and 65 to 74 year old females are the most vulnerable to poverty, with 18 males (8.4%) and 18 females (100.0%) in their respective age groups living below the poverty level.
| Age Bracket | Male | Female |
| Under 5 Years | 0 (0.0%) | 0 (0.0%) |
| 5 Years | 0 (0.0%) | 0 (0.0%) |
| 6 to 11 Years | 0 (0.0%) | 0 (0.0%) |
| 12 to 14 Years | 0 (0.0%) | 0 (0.0%) |
| 15 Years | 0 (0.0%) | 0 (0.0%) |
| 16 and 17 Years | 0 (0.0%) | 0 (0.0%) |
| 18 to 24 Years | 0 (0.0%) | 0 (0.0%) |
| 25 to 34 Years | 0 (0.0%) | 0 (0.0%) |
| 35 to 44 Years | 0 (0.0%) | 0 (0.0%) |
| 45 to 54 Years | 0 (0.0%) | 0 (0.0%) |
| 55 to 64 Years | 0 (0.0%) | 0 (0.0%) |
| 65 to 74 Years | 18 (8.4%) | 18 (100.0%) |
| 75 Years and over | 0 (0.0%) | 0 (0.0%) |
| Total | 18 (6.2%) | 18 (12.1%) |
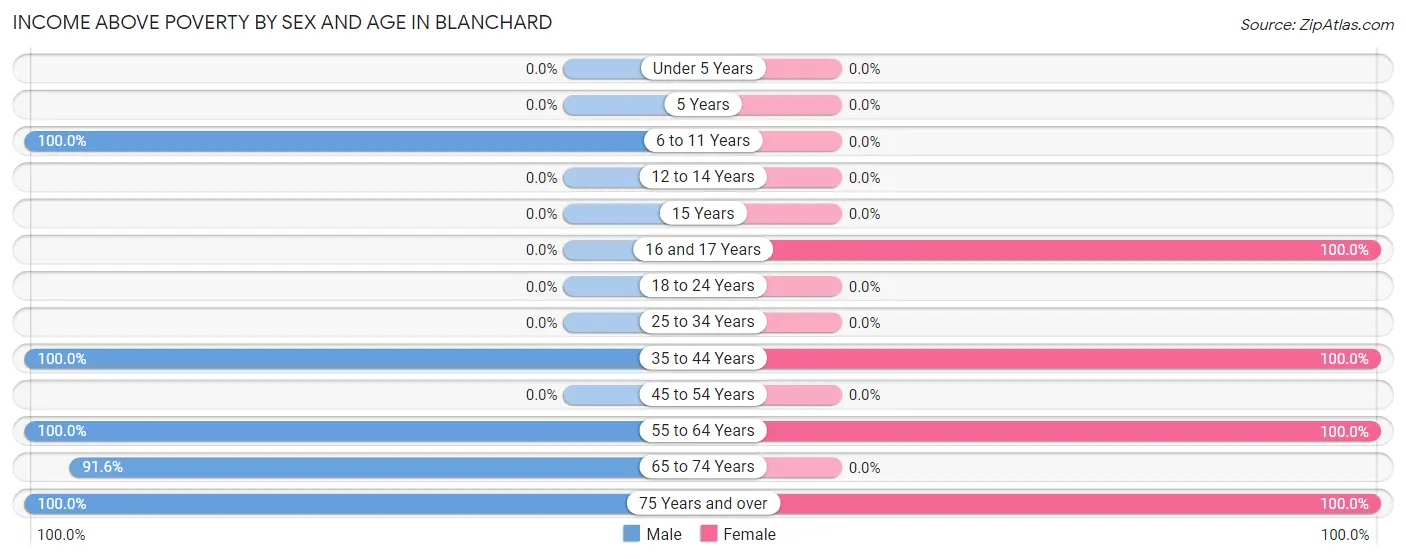
Income Above Poverty by Sex and Age in Blanchard
According to the poverty statistics in Blanchard, males aged 6 to 11 years and females aged 16 and 17 years are the age groups that are most secure financially, with 100.0% of males and 100.0% of females in these age groups living above the poverty line.
| Age Bracket | Male | Female |
| Under 5 Years | 0 (0.0%) | 0 (0.0%) |
| 5 Years | 0 (0.0%) | 0 (0.0%) |
| 6 to 11 Years | 9 (100.0%) | 0 (0.0%) |
| 12 to 14 Years | 0 (0.0%) | 0 (0.0%) |
| 15 Years | 0 (0.0%) | 0 (0.0%) |
| 16 and 17 Years | 0 (0.0%) | 10 (100.0%) |
| 18 to 24 Years | 0 (0.0%) | 0 (0.0%) |
| 25 to 34 Years | 0 (0.0%) | 0 (0.0%) |
| 35 to 44 Years | 14 (100.0%) | 14 (100.0%) |
| 45 to 54 Years | 0 (0.0%) | 0 (0.0%) |
| 55 to 64 Years | 18 (100.0%) | 33 (100.0%) |
| 65 to 74 Years | 197 (91.6%) | 0 (0.0%) |
| 75 Years and over | 33 (100.0%) | 74 (100.0%) |
| Total | 271 (93.8%) | 131 (87.9%) |
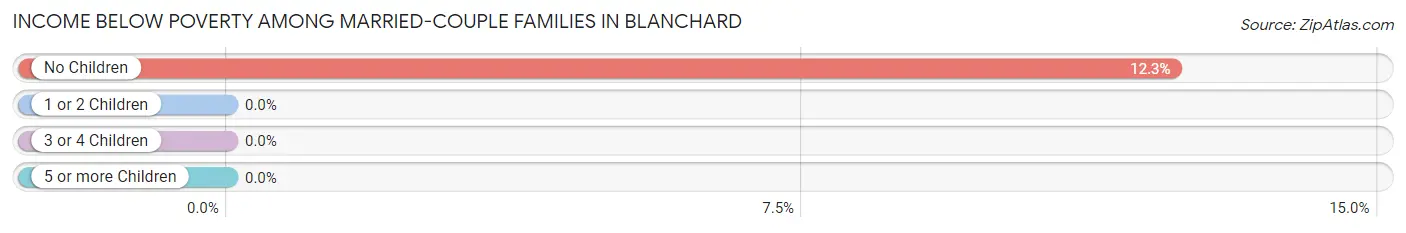
Income Below Poverty Among Married-Couple Families in Blanchard
The poverty statistics for married-couple families in Blanchard show that 11.6% or 18 of the total 155 families live below the poverty line. Families with no children have the highest poverty rate of 12.3%, comprising of 18 families. On the other hand, families with 1 or 2 children have the lowest poverty rate of 0.0%, which includes 0 families.
| Children | Above Poverty | Below Poverty |
| No Children | 128 (87.7%) | 18 (12.3%) |
| 1 or 2 Children | 9 (100.0%) | 0 (0.0%) |
| 3 or 4 Children | 0 (0.0%) | 0 (0.0%) |
| 5 or more Children | 0 (0.0%) | 0 (0.0%) |
| Total | 137 (88.4%) | 18 (11.6%) |
Income Below Poverty Among Single-Parent Households in Blanchard
| Children | Single Father | Single Mother |
| No Children | 0 (0.0%) | 0 (0.0%) |
| 1 or 2 Children | 0 (0.0%) | 0 (0.0%) |
| 3 or 4 Children | 0 (0.0%) | 0 (0.0%) |
| 5 or more Children | 0 (0.0%) | 0 (0.0%) |
| Total | 0 (0.0%) | 0 (0.0%) |
Income Below Poverty Among Married-Couple vs Single-Parent Households in Blanchard
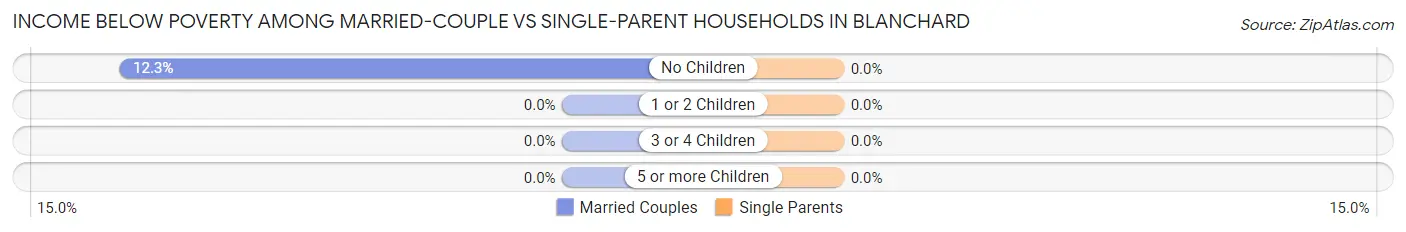
| Children | Married-Couple Families | Single-Parent Households |
| No Children | 18 (12.3%) | 0 (0.0%) |
| 1 or 2 Children | 0 (0.0%) | 0 (0.0%) |
| 3 or 4 Children | 0 (0.0%) | 0 (0.0%) |
| 5 or more Children | 0 (0.0%) | 0 (0.0%) |
| Total | 18 (11.6%) | 0 (0.0%) |
Race in Blanchard
The most populous races in Blanchard are , and White / Caucasian (438 | 100.0%).
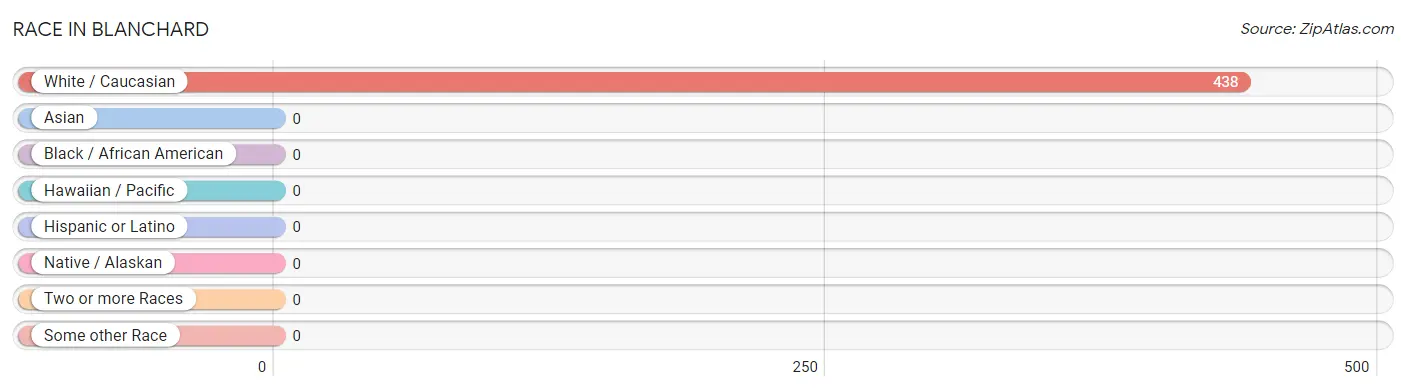
| Race | # Population | % Population |
| Asian | 0 | 0.0% |
| Black / African American | 0 | 0.0% |
| Hawaiian / Pacific | 0 | 0.0% |
| Hispanic or Latino | 0 | 0.0% |
| Native / Alaskan | 0 | 0.0% |
| White / Caucasian | 438 | 100.0% |
| Two or more Races | 0 | 0.0% |
| Some other Race | 0 | 0.0% |
| Total | 438 | 100.0% |
Ancestry in Blanchard
The most populous ancestries reported in Blanchard are English (320 | 73.1%), German (186 | 42.5%), Irish (42 | 9.6%), Italian (35 | 8.0%), and Swedish (34 | 7.8%), together accounting for 140.9% of all Blanchard residents.
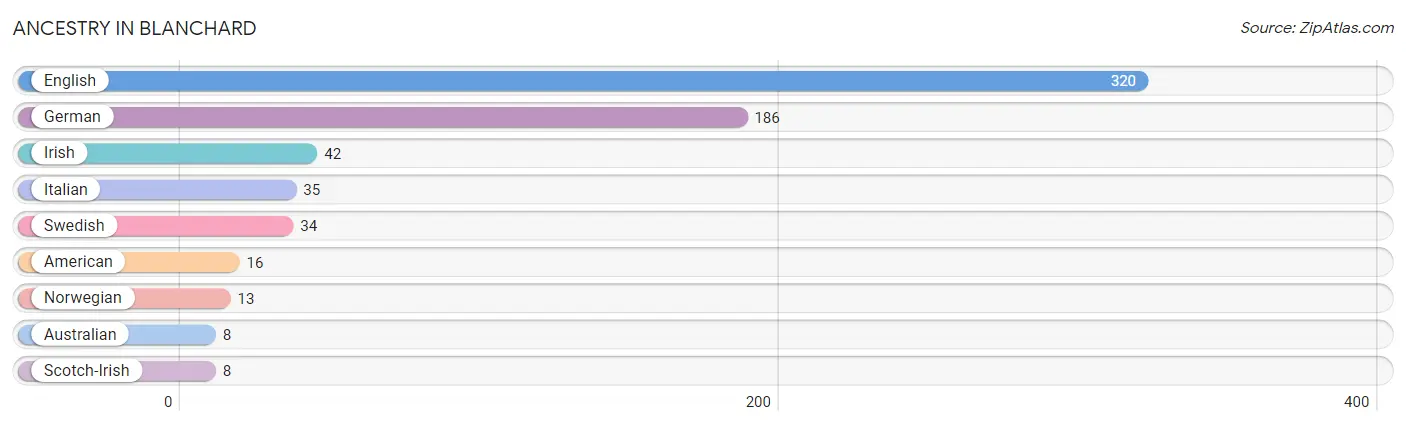
| Ancestry | # Population | % Population |
| American | 16 | 3.6% |
| Australian | 8 | 1.8% |
| English | 320 | 73.1% |
| German | 186 | 42.5% |
| Irish | 42 | 9.6% |
| Italian | 35 | 8.0% |
| Norwegian | 13 | 3.0% |
| Scotch-Irish | 8 | 1.8% |
| Swedish | 34 | 7.8% | View All 9 Rows |
Immigrants in Blanchard
The most numerous immigrant groups reported in Blanchard came from , and Canada (15 | 3.4%), together accounting for 3.4% of all Blanchard residents.

| Immigration Origin | # Population | % Population |
| Canada | 15 | 3.4% | View All 1 Rows |
Sex and Age in Blanchard
Sex and Age in Blanchard
The most populous age groups in Blanchard are 65 to 69 Years (152 | 52.6%) for men and 75 to 79 Years (63 | 42.3%) for women.
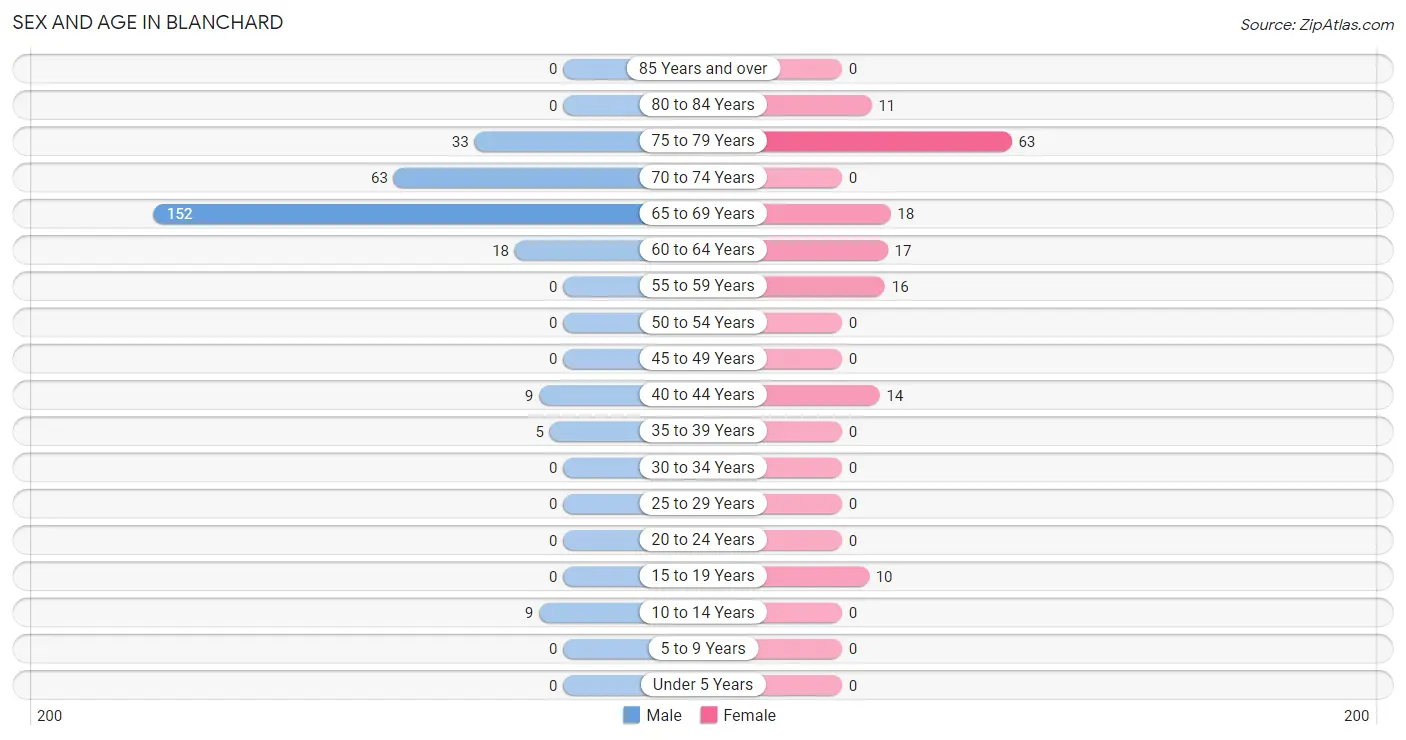
| Age Bracket | Male | Female |
| Under 5 Years | 0 (0.0%) | 0 (0.0%) |
| 5 to 9 Years | 0 (0.0%) | 0 (0.0%) |
| 10 to 14 Years | 9 (3.1%) | 0 (0.0%) |
| 15 to 19 Years | 0 (0.0%) | 10 (6.7%) |
| 20 to 24 Years | 0 (0.0%) | 0 (0.0%) |
| 25 to 29 Years | 0 (0.0%) | 0 (0.0%) |
| 30 to 34 Years | 0 (0.0%) | 0 (0.0%) |
| 35 to 39 Years | 5 (1.7%) | 0 (0.0%) |
| 40 to 44 Years | 9 (3.1%) | 14 (9.4%) |
| 45 to 49 Years | 0 (0.0%) | 0 (0.0%) |
| 50 to 54 Years | 0 (0.0%) | 0 (0.0%) |
| 55 to 59 Years | 0 (0.0%) | 16 (10.7%) |
| 60 to 64 Years | 18 (6.2%) | 17 (11.4%) |
| 65 to 69 Years | 152 (52.6%) | 18 (12.1%) |
| 70 to 74 Years | 63 (21.8%) | 0 (0.0%) |
| 75 to 79 Years | 33 (11.4%) | 63 (42.3%) |
| 80 to 84 Years | 0 (0.0%) | 11 (7.4%) |
| 85 Years and over | 0 (0.0%) | 0 (0.0%) |
| Total | 289 (100.0%) | 149 (100.0%) |
Families and Households in Blanchard
Median Family Size in Blanchard
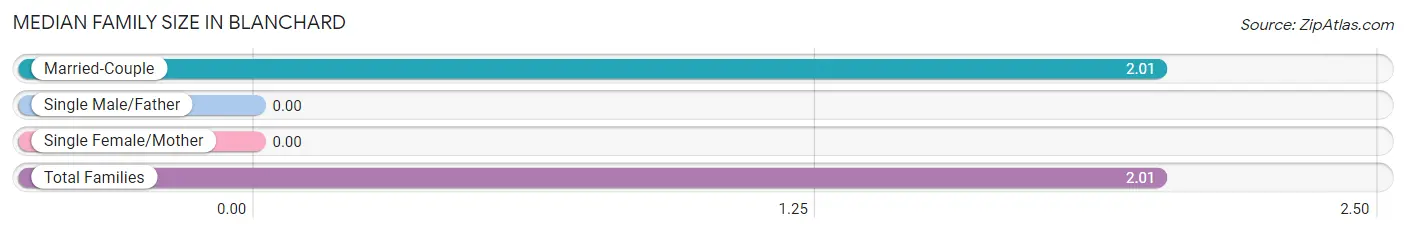
| Family Type | # Families | Family Size |
| Married-Couple | 155 (100.0%) | 2.01 |
| Single Male/Father | 0 (0.0%) | - |
| Single Female/Mother | 0 (0.0%) | - |
| Total Families | 155 (100.0%) | 2.01 |
Median Household Size in Blanchard
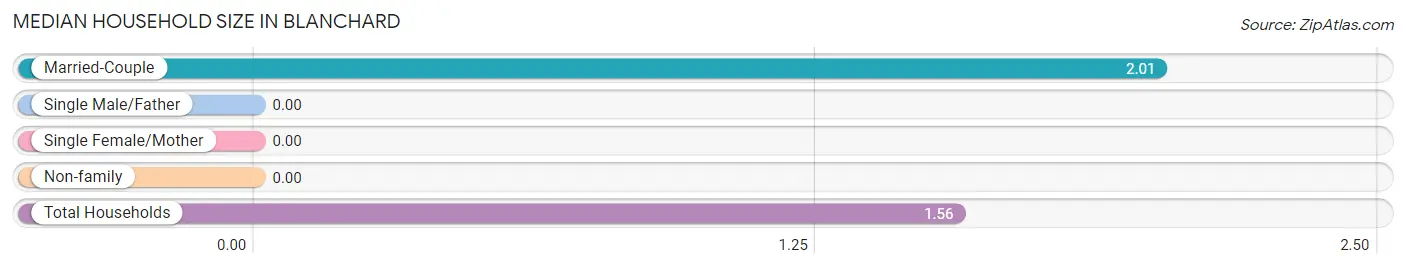
| Household Type | # Households | Household Size |
| Married-Couple | 155 (55.2%) | 2.01 |
| Single Male/Father | 0 (0.0%) | - |
| Single Female/Mother | 0 (0.0%) | - |
| Non-family | 126 (44.8%) | - |
| Total Households | 281 (100.0%) | 1.56 |
Household Size by Marriage Status in Blanchard
Out of a total of 281 households in Blanchard, 155 (55.2%) are family households, while 126 (44.8%) are nonfamily households. The most numerous type of family households are 2-person households, comprising 146, and the most common type of nonfamily households are 1-person households, comprising 126.
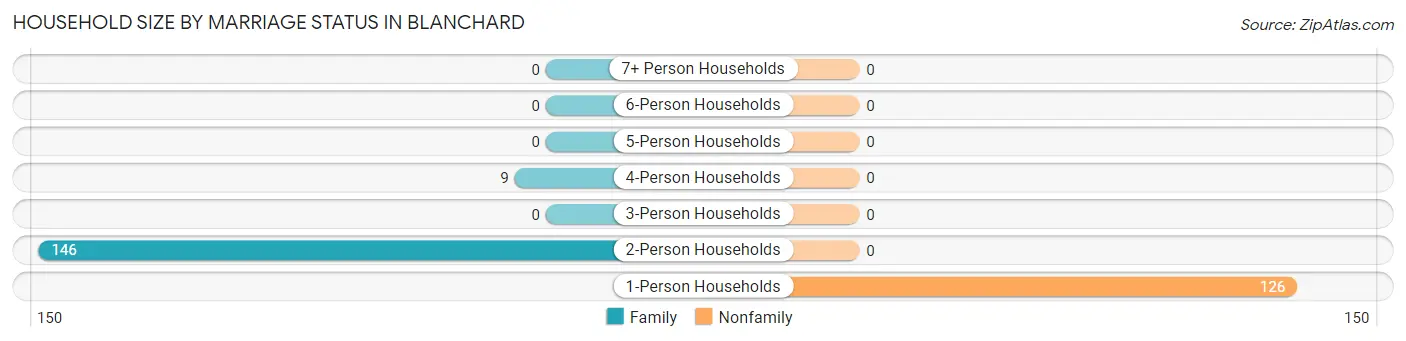
| Household Size | Family Households | Nonfamily Households |
| 1-Person Households | - | 126 (44.8%) |
| 2-Person Households | 146 (52.0%) | 0 (0.0%) |
| 3-Person Households | 0 (0.0%) | 0 (0.0%) |
| 4-Person Households | 9 (3.2%) | 0 (0.0%) |
| 5-Person Households | 0 (0.0%) | 0 (0.0%) |
| 6-Person Households | 0 (0.0%) | 0 (0.0%) |
| 7+ Person Households | 0 (0.0%) | 0 (0.0%) |
| Total | 155 (55.2%) | 126 (44.8%) |
Female Fertility in Blanchard
Fertility by Age in Blanchard
| Age Bracket | Women with Births | Births / 1,000 Women |
| 15 to 19 years | 0 (0.0%) | 0.0 |
| 20 to 34 years | 0 (0.0%) | 0.0 |
| 35 to 50 years | 0 (0.0%) | 0.0 |
| Total | 0 (0.0%) | 0.0 |
Fertility by Age by Marriage Status in Blanchard
| Age Bracket | Married | Unmarried |
| 15 to 19 years | 0 (0.0%) | 0 (0.0%) |
| 20 to 34 years | 0 (0.0%) | 0 (0.0%) |
| 35 to 50 years | 0 (0.0%) | 0 (0.0%) |
| Total | 0 (0.0%) | 0 (0.0%) |
Fertility by Education in Blanchard
| Educational Attainment | Women with Births | Births / 1,000 Women |
| Less than High School | 0 (0.0%) | 0.0 |
| High School Diploma | 0 (0.0%) | 0.0 |
| College or Associate's Degree | 0 (0.0%) | 0.0 |
| Bachelor's Degree | 0 (0.0%) | 0.0 |
| Graduate Degree | 0 (0.0%) | 0.0 |
| Total | 0 (0.0%) | 0.0 |
Fertility by Education by Marriage Status in Blanchard
| Educational Attainment | Married | Unmarried |
| Less than High School | 0 (0.0%) | 0 (0.0%) |
| High School Diploma | 0 (0.0%) | 0 (0.0%) |
| College or Associate's Degree | 0 (0.0%) | 0 (0.0%) |
| Bachelor's Degree | 0 (0.0%) | 0 (0.0%) |
| Graduate Degree | 0 (0.0%) | 0 (0.0%) |
| Total | 0 (0.0%) | 0 (0.0%) |
Employment Characteristics in Blanchard
Employment by Class of Employer in Blanchard
Among the 28 employed individuals in Blanchard, self-employed (incorporated) (14 | 50.0%), unpaid family workers (9 | 32.1%), and federal government employees (5 | 17.9%) make up the most common classes of employment.
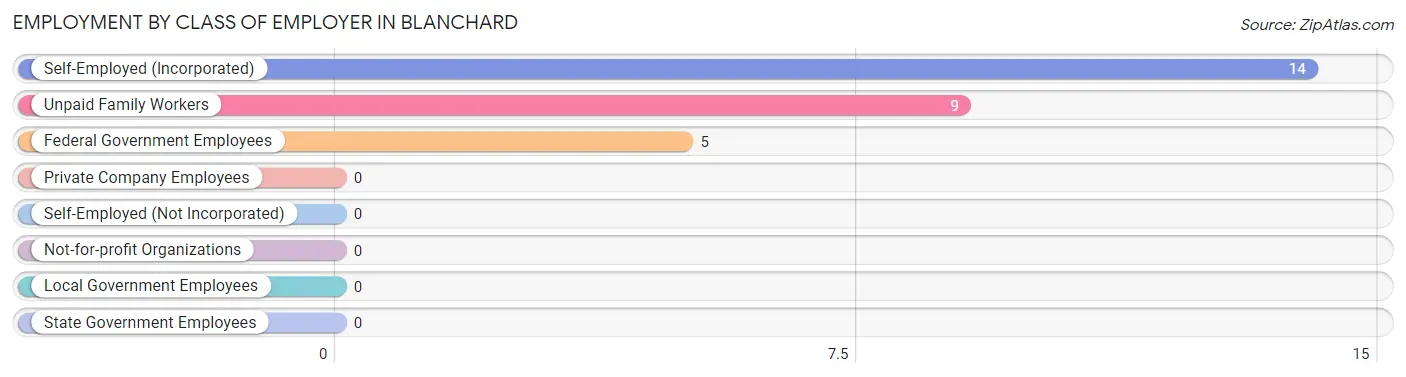
| Employer Class | # Employees | % Employees |
| Private Company Employees | 0 | 0.0% |
| Self-Employed (Incorporated) | 14 | 50.0% |
| Self-Employed (Not Incorporated) | 0 | 0.0% |
| Not-for-profit Organizations | 0 | 0.0% |
| Local Government Employees | 0 | 0.0% |
| State Government Employees | 0 | 0.0% |
| Federal Government Employees | 5 | 17.9% |
| Unpaid Family Workers | 9 | 32.1% |
| Total | 28 | 100.0% |
Employment Status by Age in Blanchard
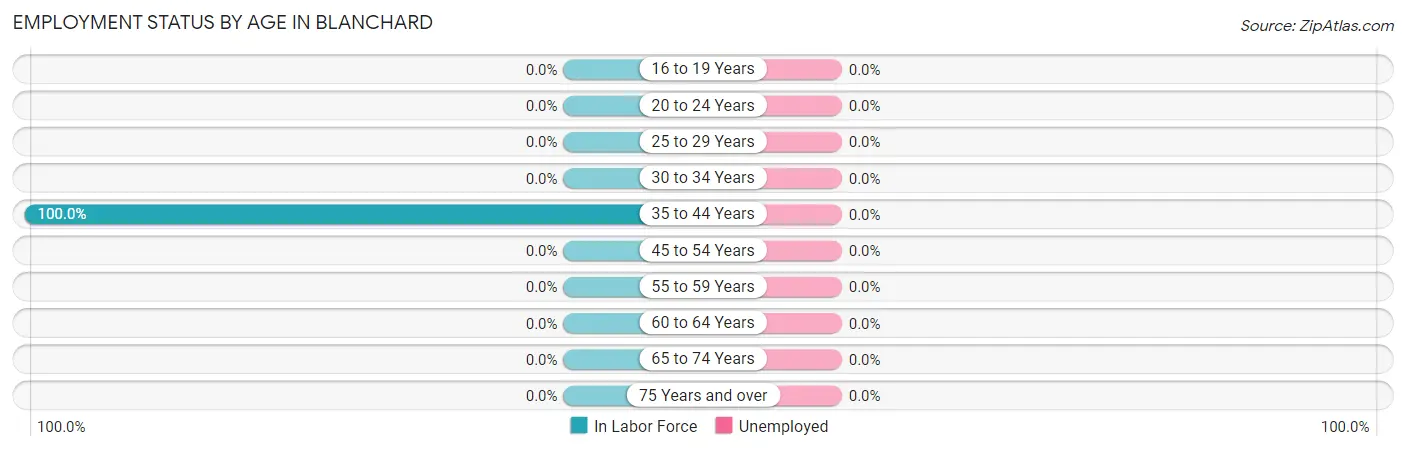
| Age Bracket | In Labor Force | Unemployed |
| 16 to 19 Years | 0 (0.0%) | 0 (0.0%) |
| 20 to 24 Years | 0 (0.0%) | 0 (0.0%) |
| 25 to 29 Years | 0 (0.0%) | 0 (0.0%) |
| 30 to 34 Years | 0 (0.0%) | 0 (0.0%) |
| 35 to 44 Years | 28 (100.0%) | 0 (0.0%) |
| 45 to 54 Years | 0 (0.0%) | 0 (0.0%) |
| 55 to 59 Years | 0 (0.0%) | 0 (0.0%) |
| 60 to 64 Years | 0 (0.0%) | 0 (0.0%) |
| 65 to 74 Years | 0 (0.0%) | 0 (0.0%) |
| 75 Years and over | 0 (0.0%) | 0 (0.0%) |
| Total | 28 (6.5%) | 0 (0.0%) |
Employment Status by Educational Attainment in Blanchard
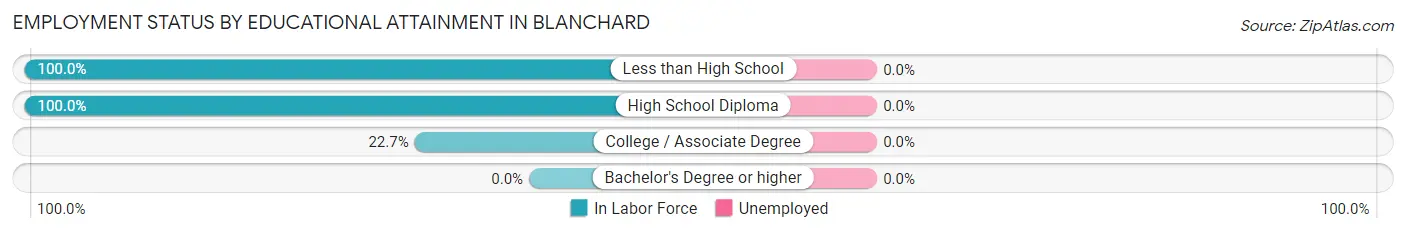
| Educational Attainment | In Labor Force | Unemployed |
| Less than High School | 5 (100.0%) | 0 (0.0%) |
| High School Diploma | 18 (100.0%) | 0 (0.0%) |
| College / Associate Degree | 5 (22.7%) | 0 (0.0%) |
| Bachelor's Degree or higher | 0 (0.0%) | 0 (0.0%) |
| Total | 28 (35.4%) | 0 (0.0%) |
Employment Occupations by Sex in Blanchard
Management, Business, Science and Arts Occupations
The most common Management, Business, Science and Arts occupations in Blanchard are , and Management (9 | 32.1%).
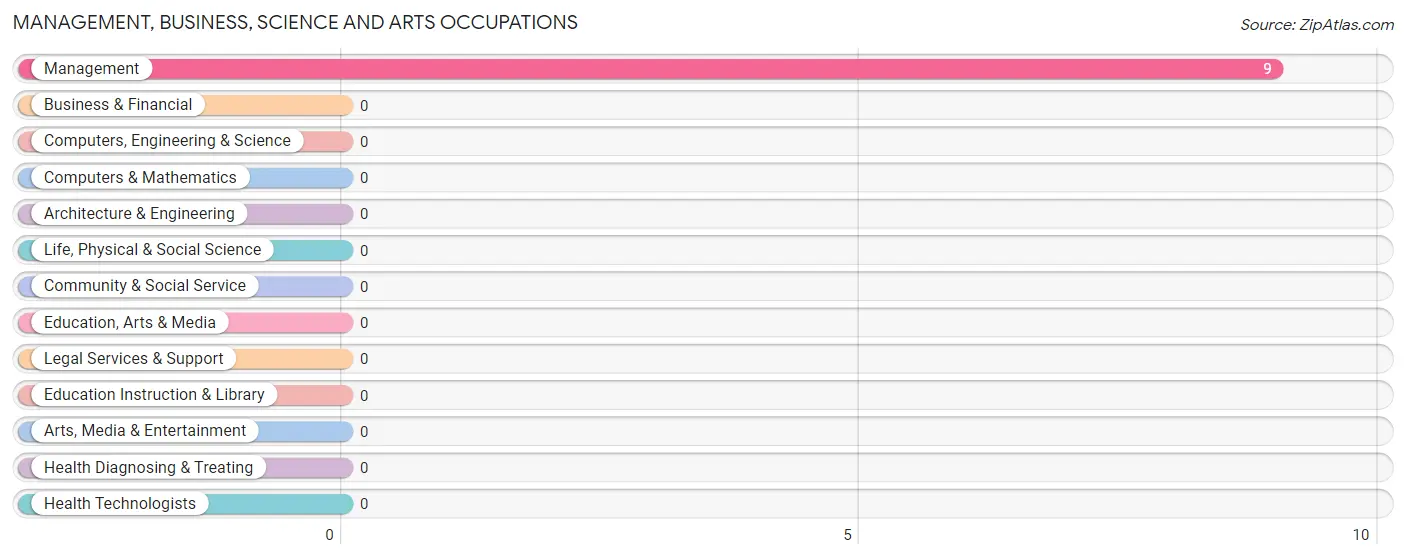
Management, Business, Science and Arts Occupations by Sex
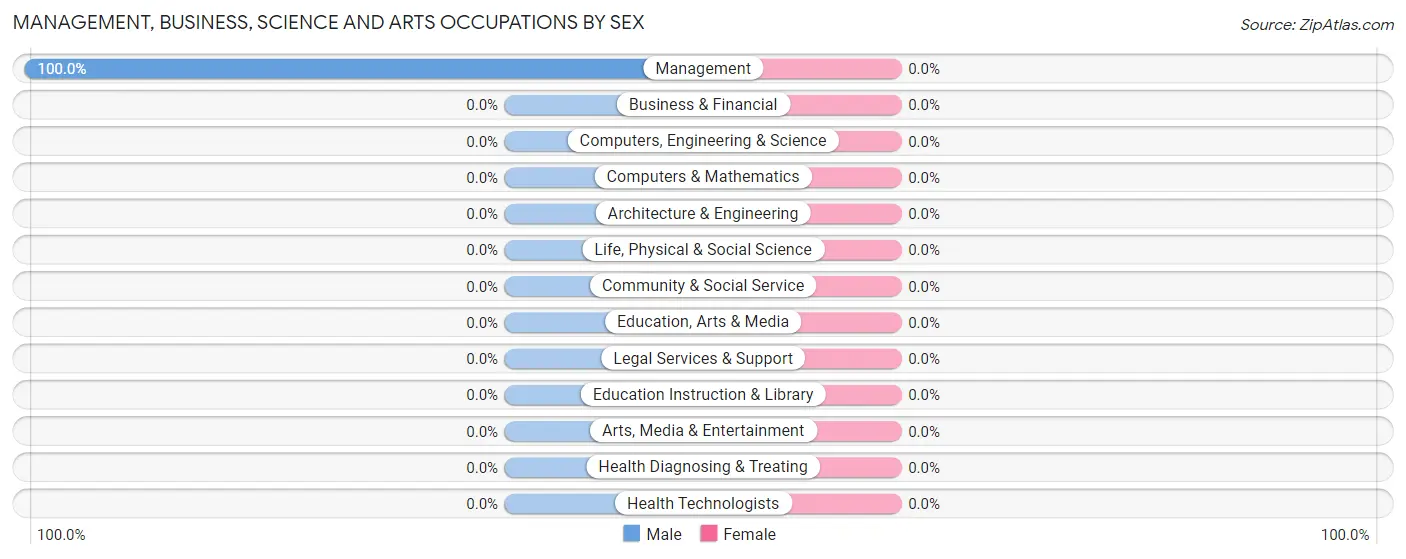
| Occupation | Male | Female |
| Management | 9 (100.0%) | 0 (0.0%) |
| Business & Financial | 0 (0.0%) | 0 (0.0%) |
| Computers, Engineering & Science | 0 (0.0%) | 0 (0.0%) |
| Computers & Mathematics | 0 (0.0%) | 0 (0.0%) |
| Architecture & Engineering | 0 (0.0%) | 0 (0.0%) |
| Life, Physical & Social Science | 0 (0.0%) | 0 (0.0%) |
| Community & Social Service | 0 (0.0%) | 0 (0.0%) |
| Education, Arts & Media | 0 (0.0%) | 0 (0.0%) |
| Legal Services & Support | 0 (0.0%) | 0 (0.0%) |
| Education Instruction & Library | 0 (0.0%) | 0 (0.0%) |
| Arts, Media & Entertainment | 0 (0.0%) | 0 (0.0%) |
| Health Diagnosing & Treating | 0 (0.0%) | 0 (0.0%) |
| Health Technologists | 0 (0.0%) | 0 (0.0%) |
| Total (Category) | 9 (100.0%) | 0 (0.0%) |
| Total (Overall) | 14 (50.0%) | 14 (50.0%) |
Services Occupations
Services Occupations by Sex
| Occupation | Male | Female |
| Healthcare Support | 0 (0.0%) | 0 (0.0%) |
| Security & Protection | 0 (0.0%) | 0 (0.0%) |
| Firefighting & Prevention | 0 (0.0%) | 0 (0.0%) |
| Law Enforcement | 0 (0.0%) | 0 (0.0%) |
| Food Preparation & Serving | 0 (0.0%) | 0 (0.0%) |
| Cleaning & Maintenance | 0 (0.0%) | 0 (0.0%) |
| Personal Care & Service | 0 (0.0%) | 0 (0.0%) |
| Total (Category) | 0 (0.0%) | 0 (0.0%) |
| Total (Overall) | 14 (50.0%) | 14 (50.0%) |
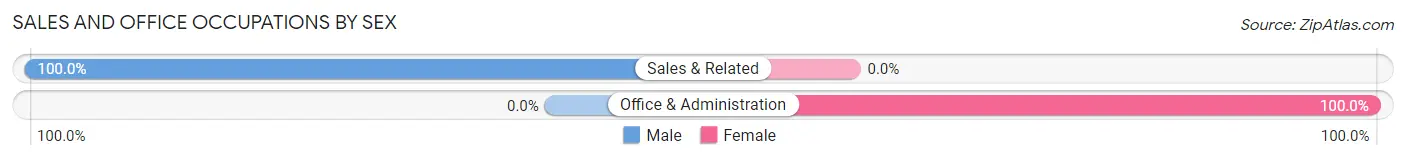
Sales and Office Occupations
The most common Sales and Office occupations in Blanchard are Office & Administration (14 | 50.0%), and Sales & Related (5 | 17.9%).
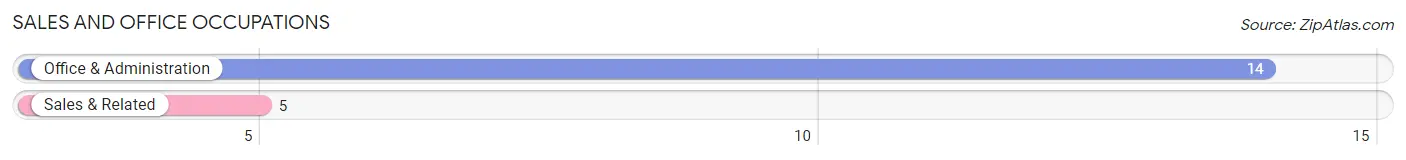
Sales and Office Occupations by Sex
| Occupation | Male | Female |
| Sales & Related | 5 (100.0%) | 0 (0.0%) |
| Office & Administration | 0 (0.0%) | 14 (100.0%) |
| Total (Category) | 5 (26.3%) | 14 (73.7%) |
| Total (Overall) | 14 (50.0%) | 14 (50.0%) |
Natural Resources, Construction and Maintenance Occupations
Natural Resources, Construction and Maintenance Occupations by Sex
| Occupation | Male | Female |
| Farming, Fishing & Forestry | 0 (0.0%) | 0 (0.0%) |
| Construction & Extraction | 0 (0.0%) | 0 (0.0%) |
| Installation, Maintenance & Repair | 0 (0.0%) | 0 (0.0%) |
| Total (Category) | 0 (0.0%) | 0 (0.0%) |
| Total (Overall) | 14 (50.0%) | 14 (50.0%) |
Production, Transportation and Moving Occupations
Production, Transportation and Moving Occupations by Sex
| Occupation | Male | Female |
| Production | 0 (0.0%) | 0 (0.0%) |
| Transportation | 0 (0.0%) | 0 (0.0%) |
| Material Moving | 0 (0.0%) | 0 (0.0%) |
| Total (Category) | 0 (0.0%) | 0 (0.0%) |
| Total (Overall) | 14 (50.0%) | 14 (50.0%) |
Employment Industries by Sex in Blanchard
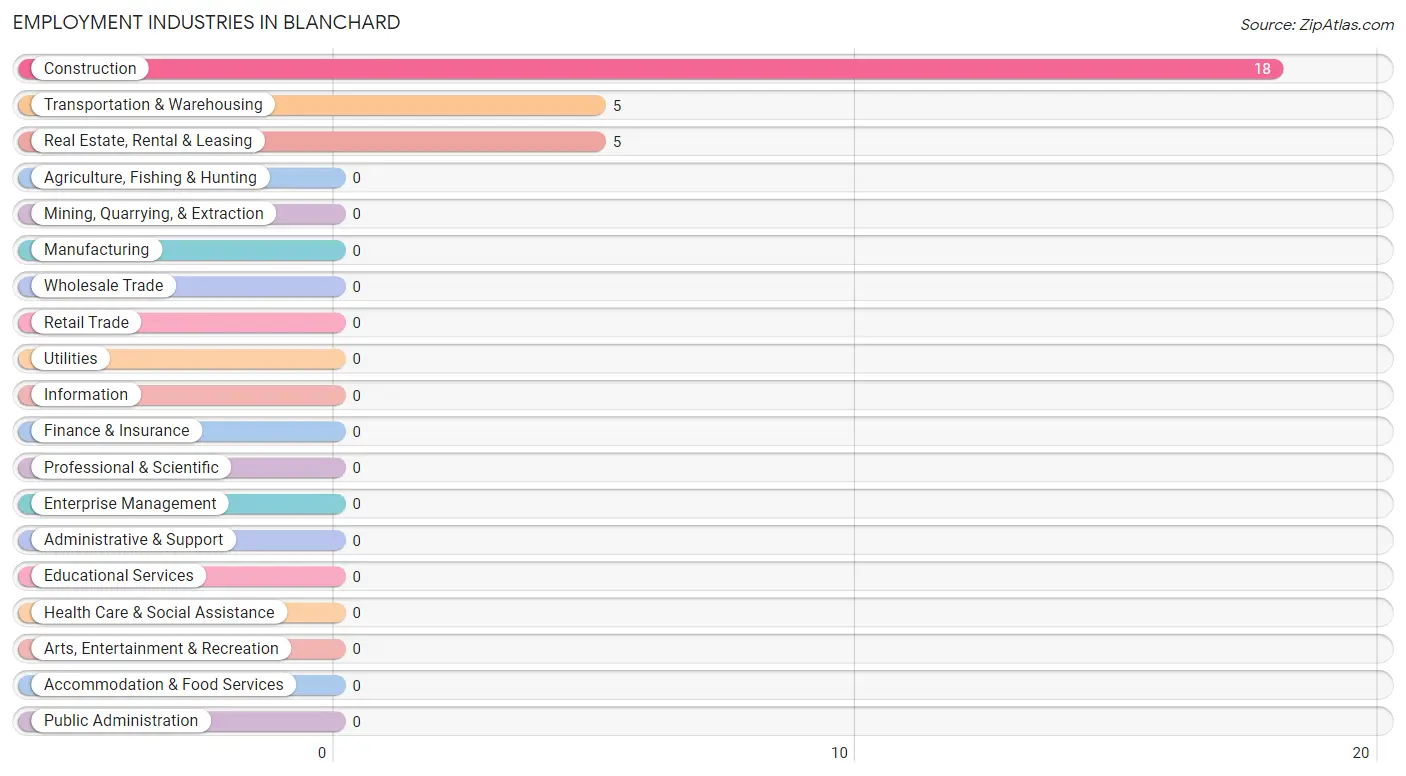
Employment Industries in Blanchard
The major employment industries in Blanchard include Construction (18 | 64.3%), Transportation & Warehousing (5 | 17.9%), and Real Estate, Rental & Leasing (5 | 17.9%).
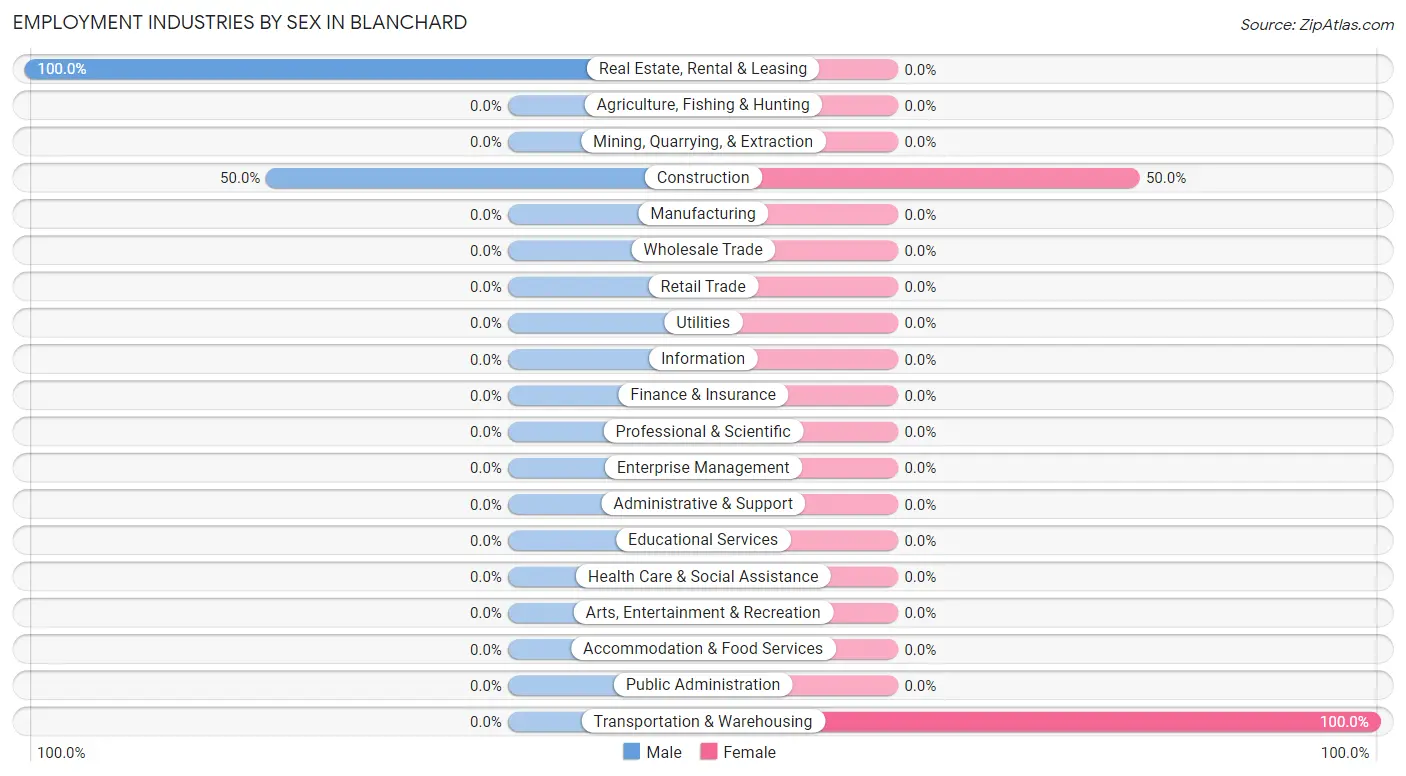
Employment Industries by Sex in Blanchard
The Blanchard industries that see more men than women are Real Estate, Rental & Leasing (100.0%), and Construction (50.0%), whereas the industries that tend to have a higher number of women are Transportation & Warehousing (100.0%), and Construction (50.0%).
| Industry | Male | Female |
| Agriculture, Fishing & Hunting | 0 (0.0%) | 0 (0.0%) |
| Mining, Quarrying, & Extraction | 0 (0.0%) | 0 (0.0%) |
| Construction | 9 (50.0%) | 9 (50.0%) |
| Manufacturing | 0 (0.0%) | 0 (0.0%) |
| Wholesale Trade | 0 (0.0%) | 0 (0.0%) |
| Retail Trade | 0 (0.0%) | 0 (0.0%) |
| Transportation & Warehousing | 0 (0.0%) | 5 (100.0%) |
| Utilities | 0 (0.0%) | 0 (0.0%) |
| Information | 0 (0.0%) | 0 (0.0%) |
| Finance & Insurance | 0 (0.0%) | 0 (0.0%) |
| Real Estate, Rental & Leasing | 5 (100.0%) | 0 (0.0%) |
| Professional & Scientific | 0 (0.0%) | 0 (0.0%) |
| Enterprise Management | 0 (0.0%) | 0 (0.0%) |
| Administrative & Support | 0 (0.0%) | 0 (0.0%) |
| Educational Services | 0 (0.0%) | 0 (0.0%) |
| Health Care & Social Assistance | 0 (0.0%) | 0 (0.0%) |
| Arts, Entertainment & Recreation | 0 (0.0%) | 0 (0.0%) |
| Accommodation & Food Services | 0 (0.0%) | 0 (0.0%) |
| Public Administration | 0 (0.0%) | 0 (0.0%) |
| Total | 14 (50.0%) | 14 (50.0%) |
Education in Blanchard
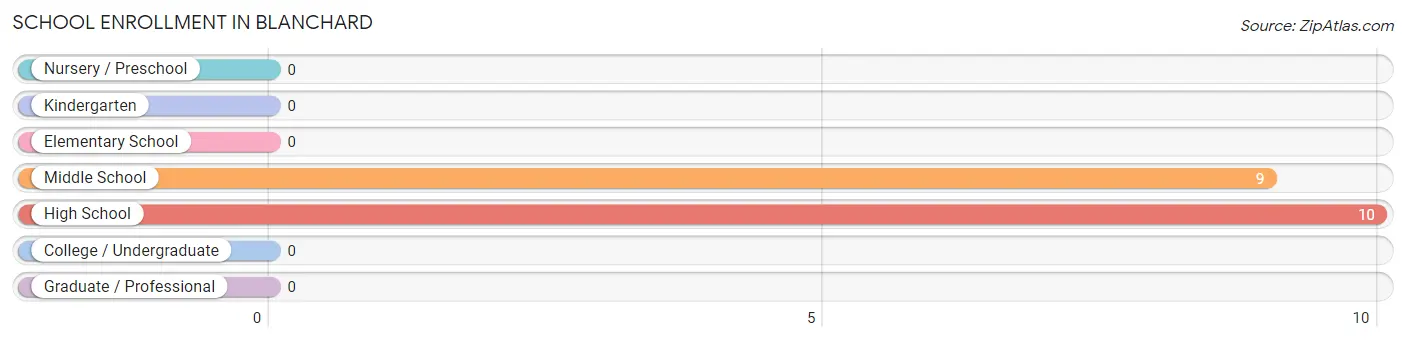
School Enrollment in Blanchard
The most common levels of schooling among the 19 students in Blanchard are high school (10 | 52.6%), and middle school (9 | 47.4%).
| School Level | # Students | % Students |
| Nursery / Preschool | 0 | 0.0% |
| Kindergarten | 0 | 0.0% |
| Elementary School | 0 | 0.0% |
| Middle School | 9 | 47.4% |
| High School | 10 | 52.6% |
| College / Undergraduate | 0 | 0.0% |
| Graduate / Professional | 0 | 0.0% |
| Total | 19 | 100.0% |
School Enrollment by Age by Funding Source in Blanchard
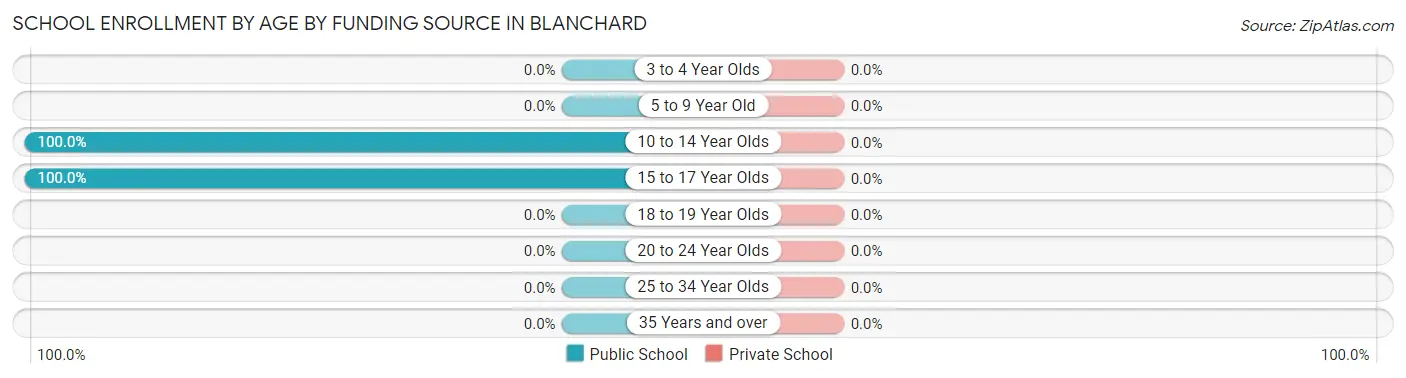
| Age Bracket | Public School | Private School |
| 3 to 4 Year Olds | 0 (0.0%) | 0 (0.0%) |
| 5 to 9 Year Old | 0 (0.0%) | 0 (0.0%) |
| 10 to 14 Year Olds | 9 (100.0%) | 0 (0.0%) |
| 15 to 17 Year Olds | 10 (100.0%) | 0 (0.0%) |
| 18 to 19 Year Olds | 0 (0.0%) | 0 (0.0%) |
| 20 to 24 Year Olds | 0 (0.0%) | 0 (0.0%) |
| 25 to 34 Year Olds | 0 (0.0%) | 0 (0.0%) |
| 35 Years and over | 0 (0.0%) | 0 (0.0%) |
| Total | 19 (100.0%) | 0 (0.0%) |
Educational Attainment by Field of Study in Blanchard
Bio, nature & agricultural (114 | 37.9%), liberal arts & history (71 | 23.6%), education (67 | 22.3%), business (24 | 8.0%), and psychology (15 | 5.0%) are the most common fields of study among 301 individuals in Blanchard who have obtained a bachelor's degree or higher.
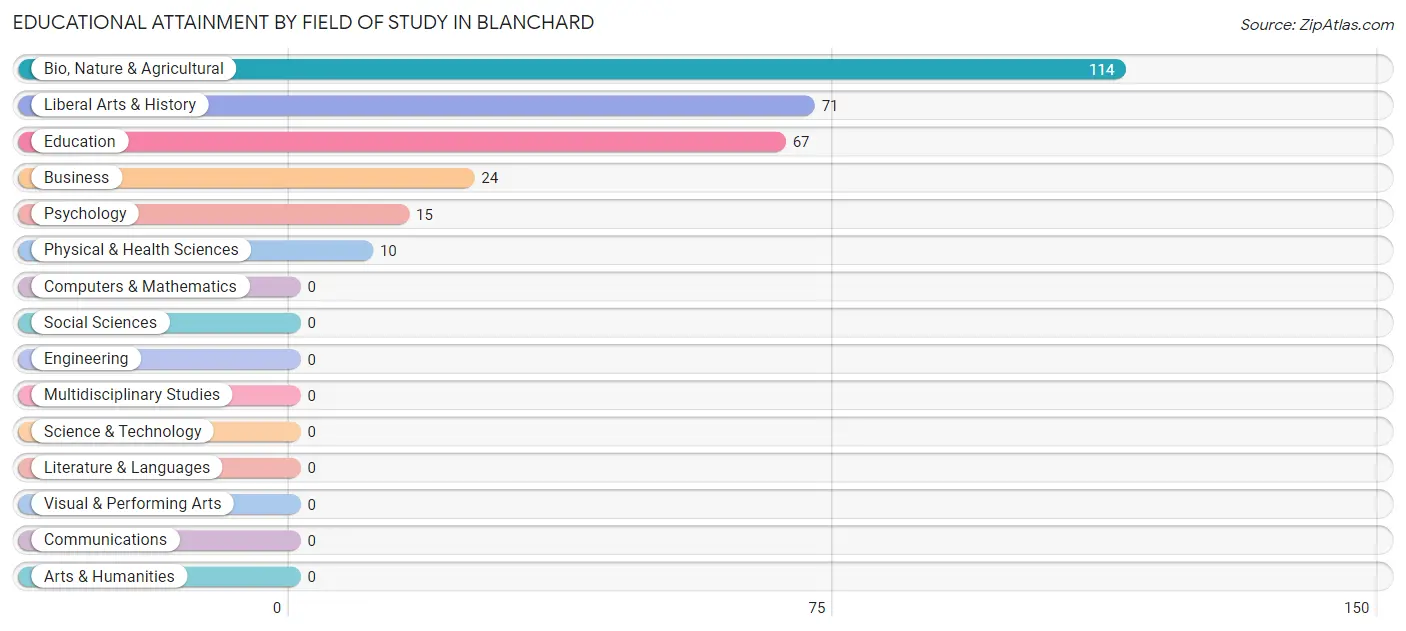
| Field of Study | # Graduates | % Graduates |
| Computers & Mathematics | 0 | 0.0% |
| Bio, Nature & Agricultural | 114 | 37.9% |
| Physical & Health Sciences | 10 | 3.3% |
| Psychology | 15 | 5.0% |
| Social Sciences | 0 | 0.0% |
| Engineering | 0 | 0.0% |
| Multidisciplinary Studies | 0 | 0.0% |
| Science & Technology | 0 | 0.0% |
| Business | 24 | 8.0% |
| Education | 67 | 22.3% |
| Literature & Languages | 0 | 0.0% |
| Liberal Arts & History | 71 | 23.6% |
| Visual & Performing Arts | 0 | 0.0% |
| Communications | 0 | 0.0% |
| Arts & Humanities | 0 | 0.0% |
| Total | 301 | 100.0% |
Transportation & Commute in Blanchard
Vehicle Availability by Sex in Blanchard
The most prevalent vehicle ownership categories in Blanchard are males with 3 vehicles (9, accounting for 64.3%) and females with 3 vehicles (9, making up 64.3%).
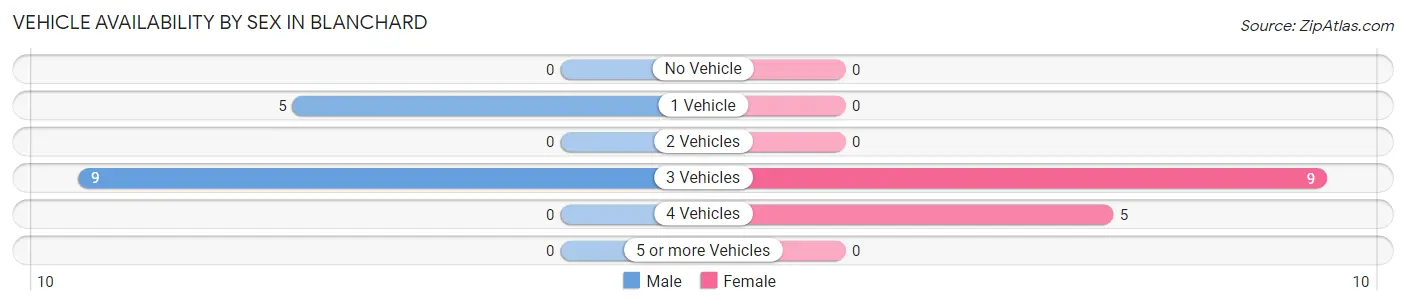
| Vehicles Available | Male | Female |
| No Vehicle | 0 (0.0%) | 0 (0.0%) |
| 1 Vehicle | 5 (35.7%) | 0 (0.0%) |
| 2 Vehicles | 0 (0.0%) | 0 (0.0%) |
| 3 Vehicles | 9 (64.3%) | 9 (64.3%) |
| 4 Vehicles | 0 (0.0%) | 5 (35.7%) |
| 5 or more Vehicles | 0 (0.0%) | 0 (0.0%) |
| Total | 14 (100.0%) | 14 (100.0%) |
Commute Time in Blanchard
The most frequently occuring commute durations in Blanchard are 25 to 29 minutes (18 commuters, 78.3%), 5 to 9 minutes (5 commuters, 21.7%), and less than 5 minutes (0 commuters, 0.0%).
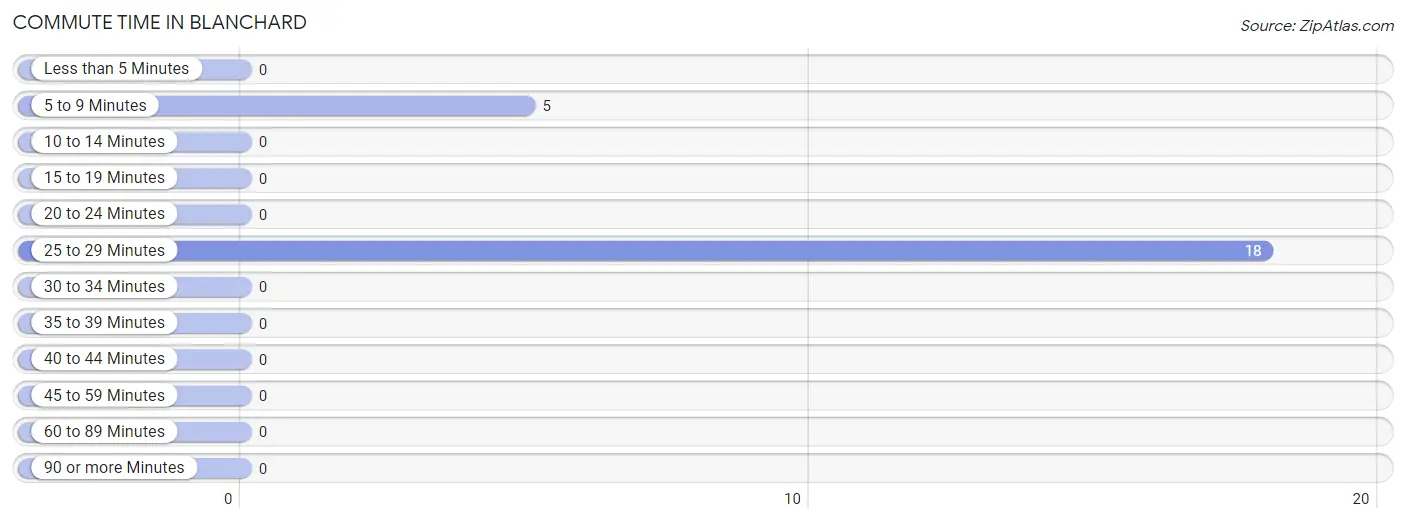
| Commute Time | # Commuters | % Commuters |
| Less than 5 Minutes | 0 | 0.0% |
| 5 to 9 Minutes | 5 | 21.7% |
| 10 to 14 Minutes | 0 | 0.0% |
| 15 to 19 Minutes | 0 | 0.0% |
| 20 to 24 Minutes | 0 | 0.0% |
| 25 to 29 Minutes | 18 | 78.3% |
| 30 to 34 Minutes | 0 | 0.0% |
| 35 to 39 Minutes | 0 | 0.0% |
| 40 to 44 Minutes | 0 | 0.0% |
| 45 to 59 Minutes | 0 | 0.0% |
| 60 to 89 Minutes | 0 | 0.0% |
| 90 or more Minutes | 0 | 0.0% |
Commute Time by Sex in Blanchard
The most common commute times in Blanchard are 25 to 29 minutes (9 commuters, 100.0%) for males and 25 to 29 minutes (9 commuters, 64.3%) for females.
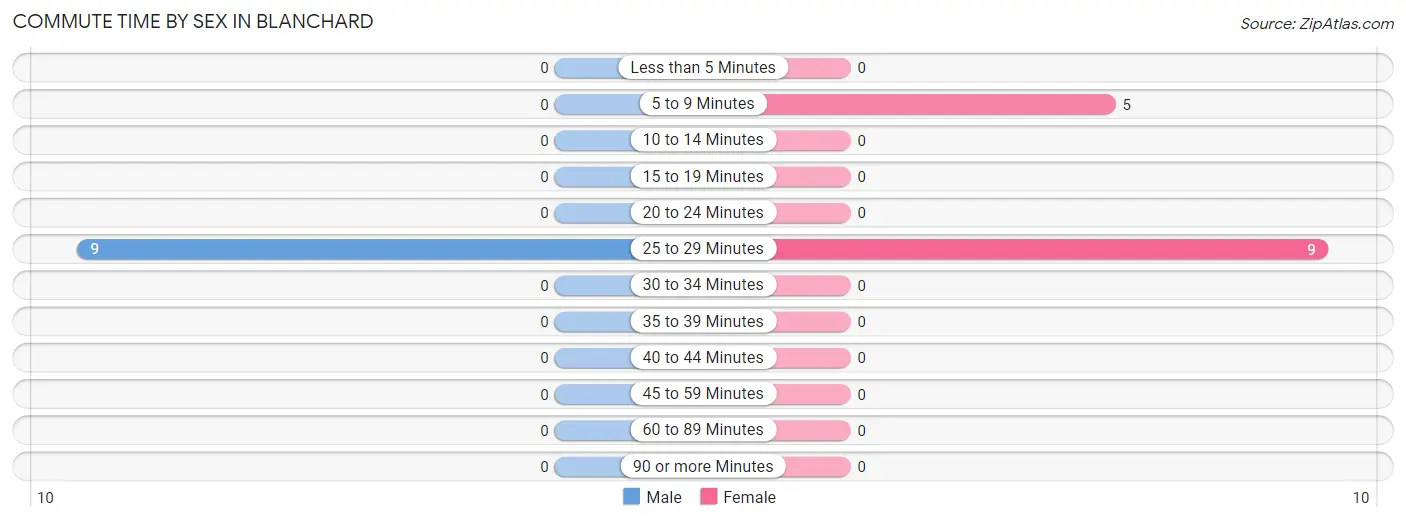
| Commute Time | Male | Female |
| Less than 5 Minutes | 0 (0.0%) | 0 (0.0%) |
| 5 to 9 Minutes | 0 (0.0%) | 5 (35.7%) |
| 10 to 14 Minutes | 0 (0.0%) | 0 (0.0%) |
| 15 to 19 Minutes | 0 (0.0%) | 0 (0.0%) |
| 20 to 24 Minutes | 0 (0.0%) | 0 (0.0%) |
| 25 to 29 Minutes | 9 (100.0%) | 9 (64.3%) |
| 30 to 34 Minutes | 0 (0.0%) | 0 (0.0%) |
| 35 to 39 Minutes | 0 (0.0%) | 0 (0.0%) |
| 40 to 44 Minutes | 0 (0.0%) | 0 (0.0%) |
| 45 to 59 Minutes | 0 (0.0%) | 0 (0.0%) |
| 60 to 89 Minutes | 0 (0.0%) | 0 (0.0%) |
| 90 or more Minutes | 0 (0.0%) | 0 (0.0%) |
Time of Departure to Work by Sex in Blanchard
The most frequent times of departure to work in Blanchard are 6:00 AM to 6:29 AM (9, 100.0%) for males and 8:30 AM to 8:59 AM (9, 64.3%) for females.
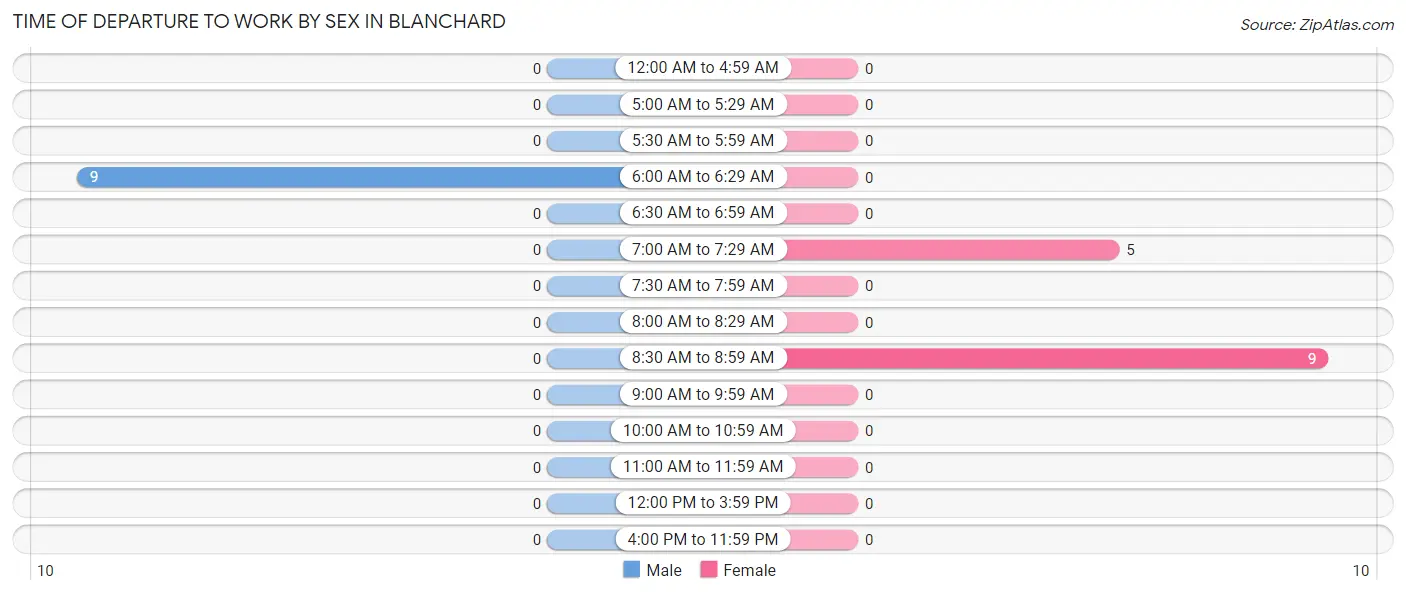
| Time of Departure | Male | Female |
| 12:00 AM to 4:59 AM | 0 (0.0%) | 0 (0.0%) |
| 5:00 AM to 5:29 AM | 0 (0.0%) | 0 (0.0%) |
| 5:30 AM to 5:59 AM | 0 (0.0%) | 0 (0.0%) |
| 6:00 AM to 6:29 AM | 9 (100.0%) | 0 (0.0%) |
| 6:30 AM to 6:59 AM | 0 (0.0%) | 0 (0.0%) |
| 7:00 AM to 7:29 AM | 0 (0.0%) | 5 (35.7%) |
| 7:30 AM to 7:59 AM | 0 (0.0%) | 0 (0.0%) |
| 8:00 AM to 8:29 AM | 0 (0.0%) | 0 (0.0%) |
| 8:30 AM to 8:59 AM | 0 (0.0%) | 9 (64.3%) |
| 9:00 AM to 9:59 AM | 0 (0.0%) | 0 (0.0%) |
| 10:00 AM to 10:59 AM | 0 (0.0%) | 0 (0.0%) |
| 11:00 AM to 11:59 AM | 0 (0.0%) | 0 (0.0%) |
| 12:00 PM to 3:59 PM | 0 (0.0%) | 0 (0.0%) |
| 4:00 PM to 11:59 PM | 0 (0.0%) | 0 (0.0%) |
| Total | 9 (100.0%) | 14 (100.0%) |
Housing Occupancy in Blanchard
Occupancy by Ownership in Blanchard
Of the total 281 dwellings in Blanchard, owner-occupied units account for 263 (93.6%), while renter-occupied units make up 18 (6.4%).
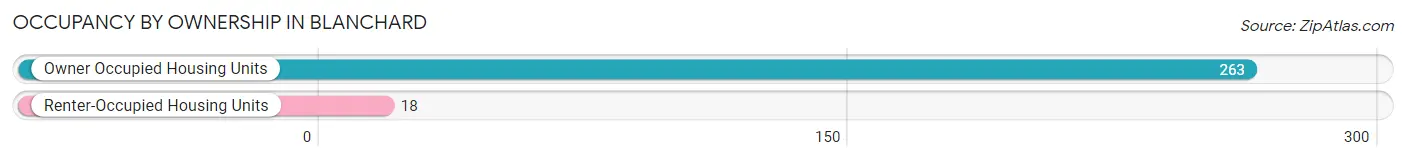
| Occupancy | # Housing Units | % Housing Units |
| Owner Occupied Housing Units | 263 | 93.6% |
| Renter-Occupied Housing Units | 18 | 6.4% |
| Total Occupied Housing Units | 281 | 100.0% |
Occupancy by Household Size in Blanchard
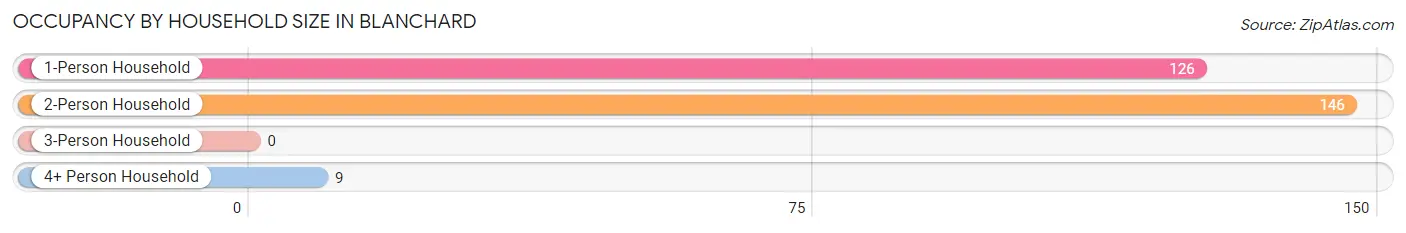
| Household Size | # Housing Units | % Housing Units |
| 1-Person Household | 126 | 44.8% |
| 2-Person Household | 146 | 52.0% |
| 3-Person Household | 0 | 0.0% |
| 4+ Person Household | 9 | 3.2% |
| Total Housing Units | 281 | 100.0% |
Occupancy by Ownership by Household Size in Blanchard
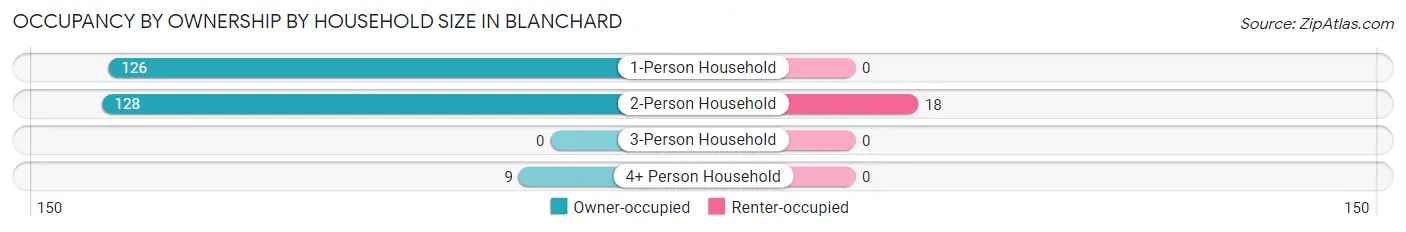
| Household Size | Owner-occupied | Renter-occupied |
| 1-Person Household | 126 (100.0%) | 0 (0.0%) |
| 2-Person Household | 128 (87.7%) | 18 (12.3%) |
| 3-Person Household | 0 (0.0%) | 0 (0.0%) |
| 4+ Person Household | 9 (100.0%) | 0 (0.0%) |
| Total Housing Units | 263 (93.6%) | 18 (6.4%) |
Occupancy by Educational Attainment in Blanchard
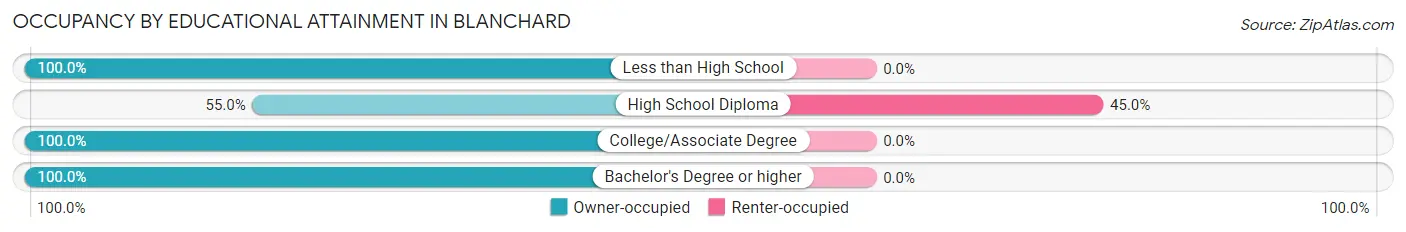
| Household Size | Owner-occupied | Renter-occupied |
| Less than High School | 5 (100.0%) | 0 (0.0%) |
| High School Diploma | 22 (55.0%) | 18 (45.0%) |
| College/Associate Degree | 29 (100.0%) | 0 (0.0%) |
| Bachelor's Degree or higher | 207 (100.0%) | 0 (0.0%) |
Occupancy by Age of Householder in Blanchard
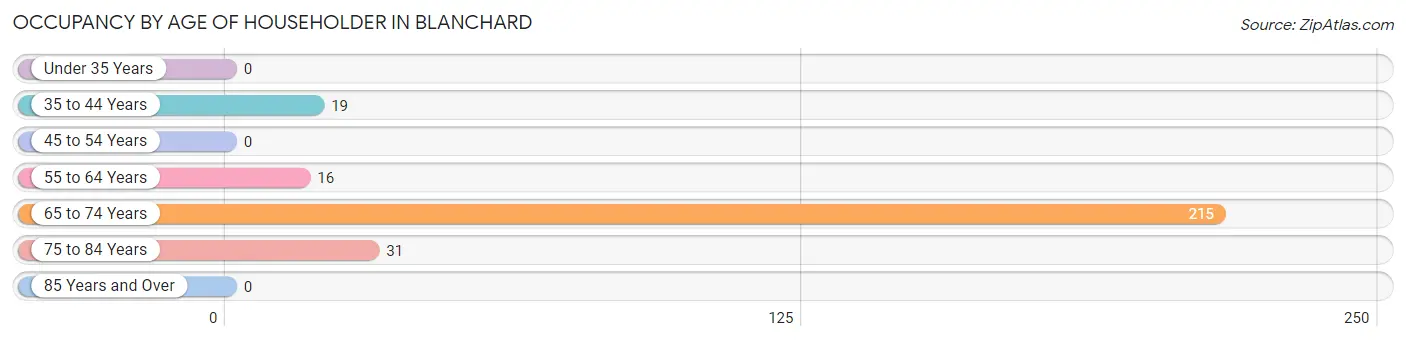
| Age Bracket | # Households | % Households |
| Under 35 Years | 0 | 0.0% |
| 35 to 44 Years | 19 | 6.8% |
| 45 to 54 Years | 0 | 0.0% |
| 55 to 64 Years | 16 | 5.7% |
| 65 to 74 Years | 215 | 76.5% |
| 75 to 84 Years | 31 | 11.0% |
| 85 Years and Over | 0 | 0.0% |
| Total | 281 | 100.0% |
Housing Finances in Blanchard
Median Income by Occupancy in Blanchard
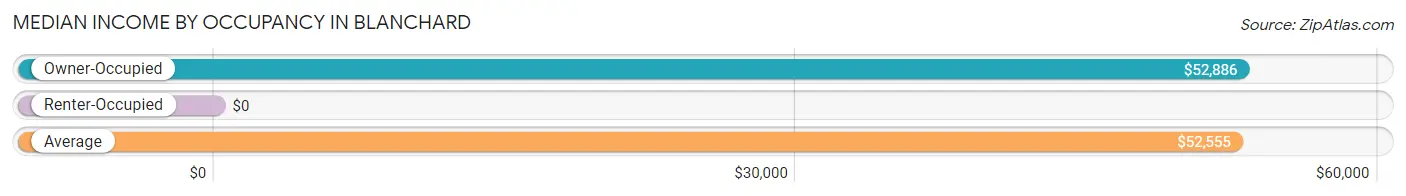
| Occupancy Type | # Households | Median Income |
| Owner-Occupied | 263 (93.6%) | $52,886 |
| Renter-Occupied | 18 (6.4%) | $0 |
| Average | 281 (100.0%) | $52,555 |
Occupancy by Householder Income Bracket in Blanchard
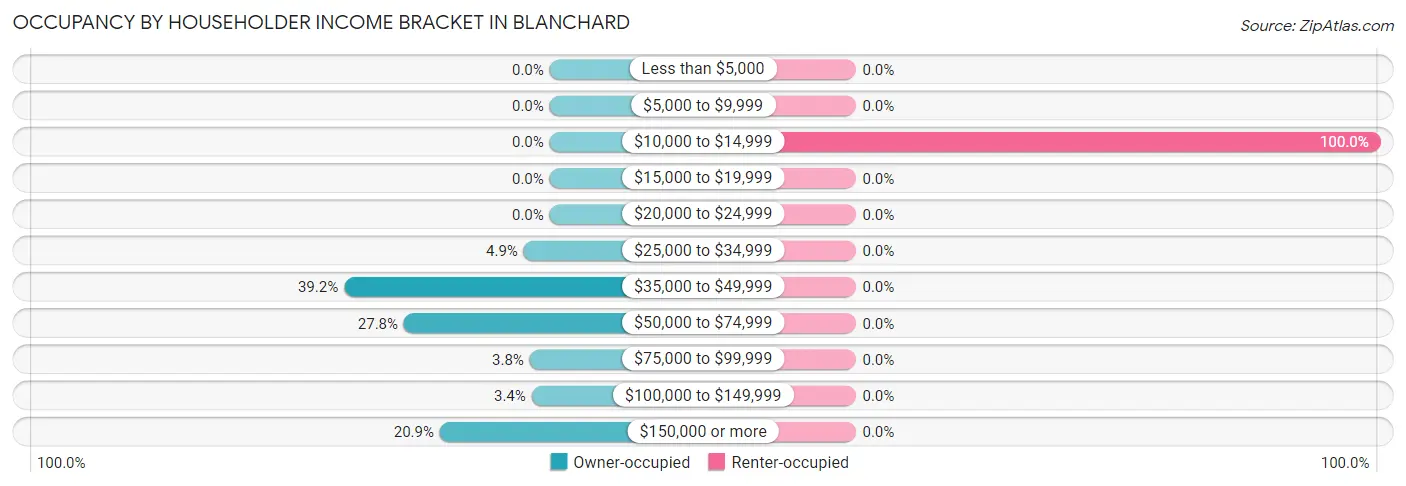
| Income Bracket | Owner-occupied | Renter-occupied |
| Less than $5,000 | 0 (0.0%) | 0 (0.0%) |
| $5,000 to $9,999 | 0 (0.0%) | 0 (0.0%) |
| $10,000 to $14,999 | 0 (0.0%) | 18 (100.0%) |
| $15,000 to $19,999 | 0 (0.0%) | 0 (0.0%) |
| $20,000 to $24,999 | 0 (0.0%) | 0 (0.0%) |
| $25,000 to $34,999 | 13 (4.9%) | 0 (0.0%) |
| $35,000 to $49,999 | 103 (39.2%) | 0 (0.0%) |
| $50,000 to $74,999 | 73 (27.8%) | 0 (0.0%) |
| $75,000 to $99,999 | 10 (3.8%) | 0 (0.0%) |
| $100,000 to $149,999 | 9 (3.4%) | 0 (0.0%) |
| $150,000 or more | 55 (20.9%) | 0 (0.0%) |
| Total | 263 (100.0%) | 18 (100.0%) |
Monthly Housing Cost Tiers in Blanchard
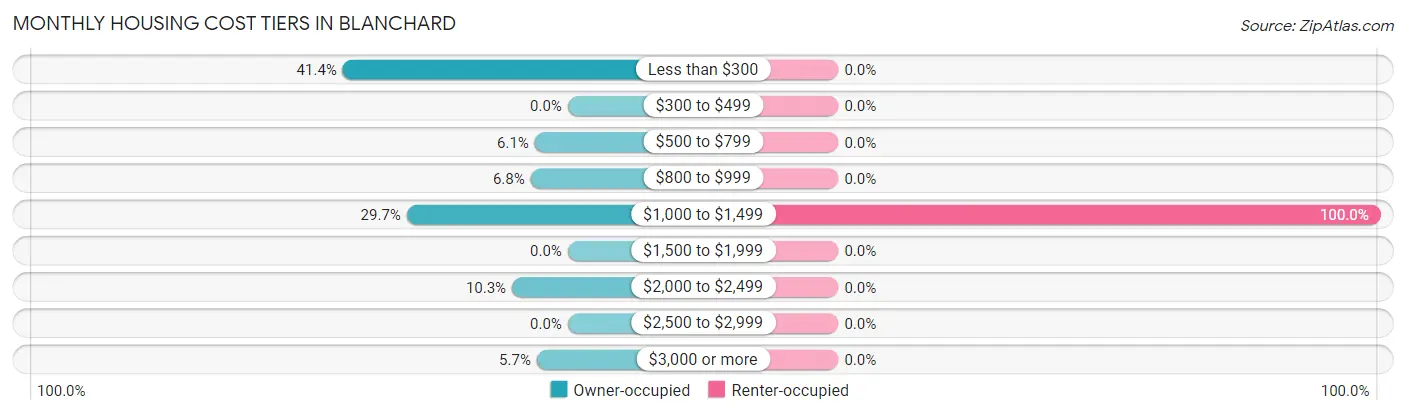
| Monthly Cost | Owner-occupied | Renter-occupied |
| Less than $300 | 109 (41.4%) | 0 (0.0%) |
| $300 to $499 | 0 (0.0%) | 0 (0.0%) |
| $500 to $799 | 16 (6.1%) | 0 (0.0%) |
| $800 to $999 | 18 (6.8%) | 0 (0.0%) |
| $1,000 to $1,499 | 78 (29.7%) | 18 (100.0%) |
| $1,500 to $1,999 | 0 (0.0%) | 0 (0.0%) |
| $2,000 to $2,499 | 27 (10.3%) | 0 (0.0%) |
| $2,500 to $2,999 | 0 (0.0%) | 0 (0.0%) |
| $3,000 or more | 15 (5.7%) | 0 (0.0%) |
| Total | 263 (100.0%) | 18 (100.0%) |
Physical Housing Characteristics in Blanchard
Housing Structures in Blanchard
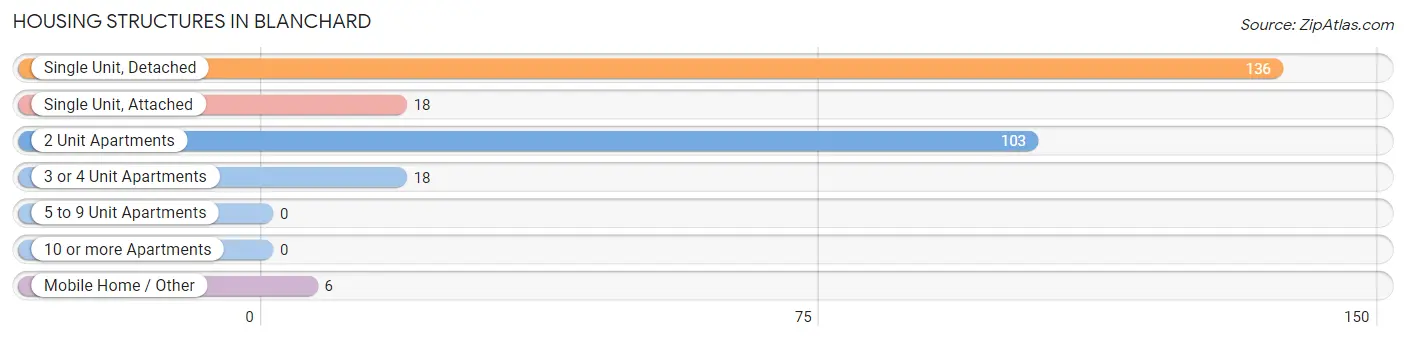
| Structure Type | # Housing Units | % Housing Units |
| Single Unit, Detached | 136 | 48.4% |
| Single Unit, Attached | 18 | 6.4% |
| 2 Unit Apartments | 103 | 36.6% |
| 3 or 4 Unit Apartments | 18 | 6.4% |
| 5 to 9 Unit Apartments | 0 | 0.0% |
| 10 or more Apartments | 0 | 0.0% |
| Mobile Home / Other | 6 | 2.1% |
| Total | 281 | 100.0% |
Housing Structures by Occupancy in Blanchard
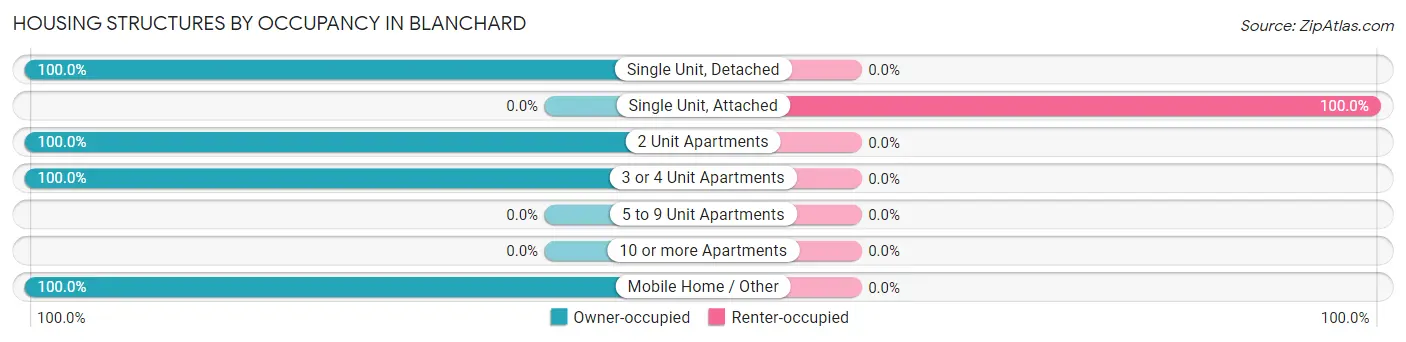
| Structure Type | Owner-occupied | Renter-occupied |
| Single Unit, Detached | 136 (100.0%) | 0 (0.0%) |
| Single Unit, Attached | 0 (0.0%) | 18 (100.0%) |
| 2 Unit Apartments | 103 (100.0%) | 0 (0.0%) |
| 3 or 4 Unit Apartments | 18 (100.0%) | 0 (0.0%) |
| 5 to 9 Unit Apartments | 0 (0.0%) | 0 (0.0%) |
| 10 or more Apartments | 0 (0.0%) | 0 (0.0%) |
| Mobile Home / Other | 6 (100.0%) | 0 (0.0%) |
| Total | 263 (93.6%) | 18 (6.4%) |
Housing Structures by Number of Rooms in Blanchard
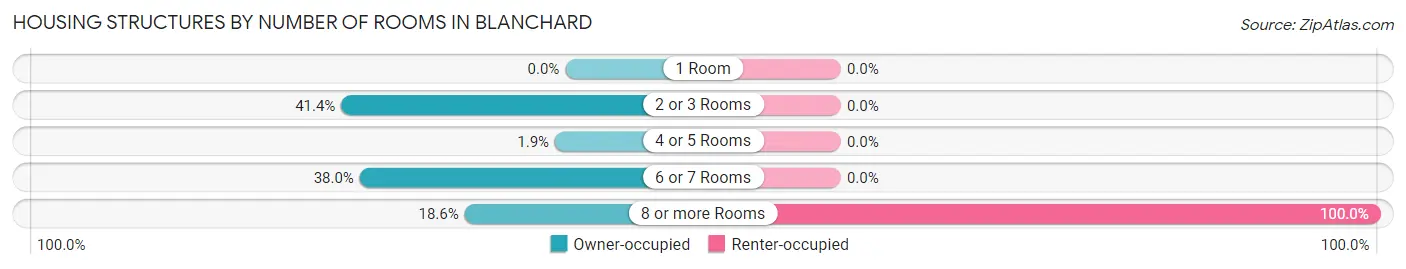
| Number of Rooms | Owner-occupied | Renter-occupied |
| 1 Room | 0 (0.0%) | 0 (0.0%) |
| 2 or 3 Rooms | 109 (41.4%) | 0 (0.0%) |
| 4 or 5 Rooms | 5 (1.9%) | 0 (0.0%) |
| 6 or 7 Rooms | 100 (38.0%) | 0 (0.0%) |
| 8 or more Rooms | 49 (18.6%) | 18 (100.0%) |
| Total | 263 (100.0%) | 18 (100.0%) |
Housing Structure by Heating Type in Blanchard
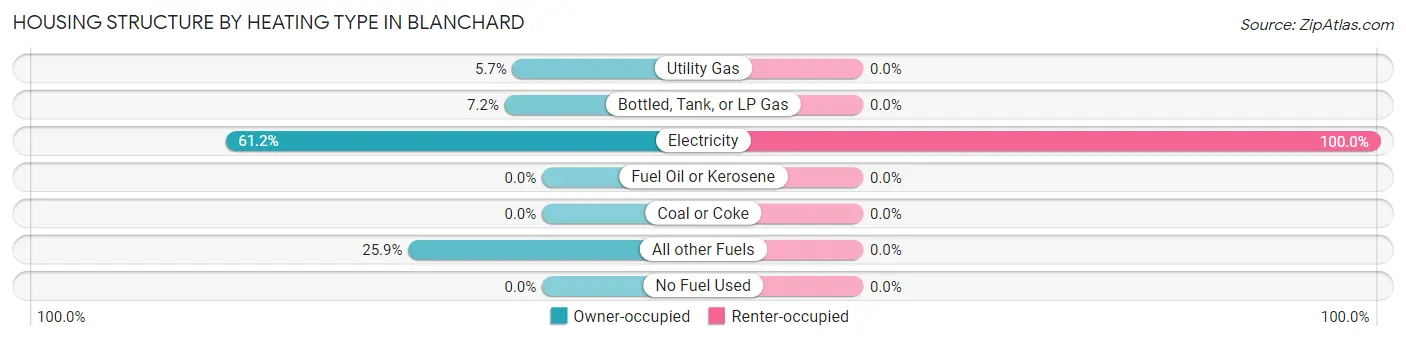
| Heating Type | Owner-occupied | Renter-occupied |
| Utility Gas | 15 (5.7%) | 0 (0.0%) |
| Bottled, Tank, or LP Gas | 19 (7.2%) | 0 (0.0%) |
| Electricity | 161 (61.2%) | 18 (100.0%) |
| Fuel Oil or Kerosene | 0 (0.0%) | 0 (0.0%) |
| Coal or Coke | 0 (0.0%) | 0 (0.0%) |
| All other Fuels | 68 (25.9%) | 0 (0.0%) |
| No Fuel Used | 0 (0.0%) | 0 (0.0%) |
| Total | 263 (100.0%) | 18 (100.0%) |
Household Vehicle Usage in Blanchard
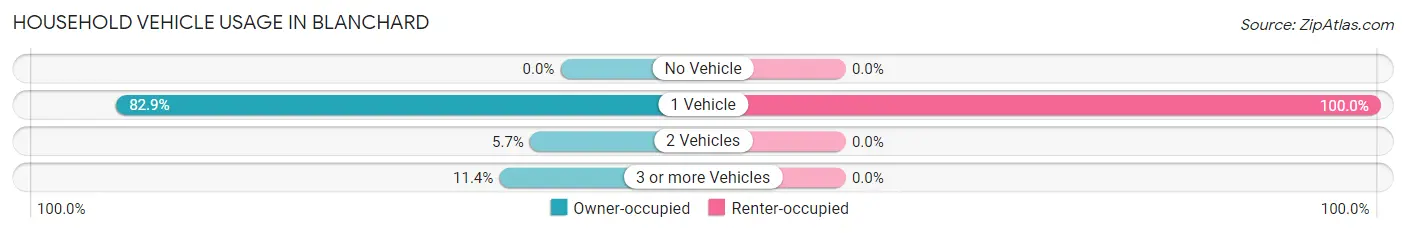
| Vehicles per Household | Owner-occupied | Renter-occupied |
| No Vehicle | 0 (0.0%) | 0 (0.0%) |
| 1 Vehicle | 218 (82.9%) | 18 (100.0%) |
| 2 Vehicles | 15 (5.7%) | 0 (0.0%) |
| 3 or more Vehicles | 30 (11.4%) | 0 (0.0%) |
| Total | 263 (100.0%) | 18 (100.0%) |
Real Estate & Mortgages in Blanchard
Real Estate and Mortgage Overview in Blanchard
| Characteristic | Without Mortgage | With Mortgage |
| Housing Units | 138 | 125 |
| Median Property Value | $230,600 | $0 |
| Median Household Income | $46,359 | $33 |
| Monthly Housing Costs | $232 | $15 |
| Real Estate Taxes | $922 | $0 |
Property Value by Mortgage Status in Blanchard
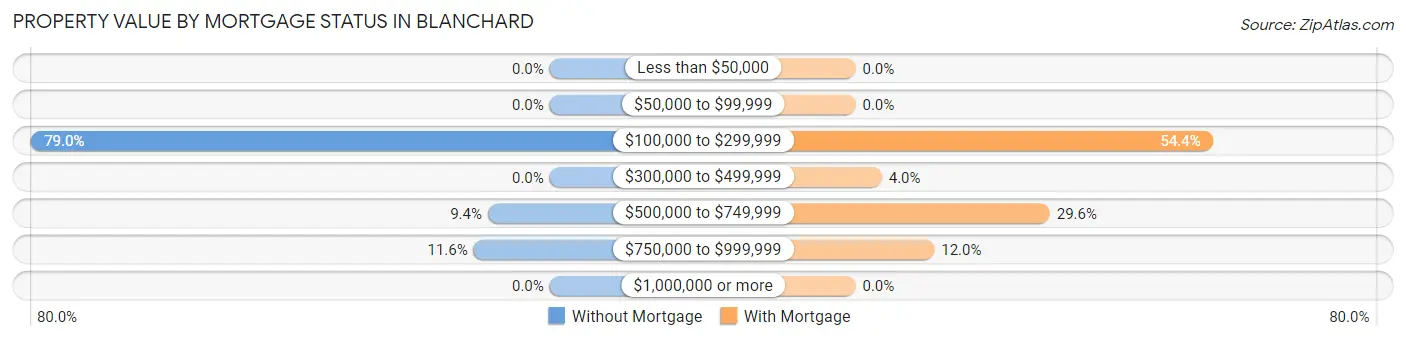
| Property Value | Without Mortgage | With Mortgage |
| Less than $50,000 | 0 (0.0%) | 0 (0.0%) |
| $50,000 to $99,999 | 0 (0.0%) | 0 (0.0%) |
| $100,000 to $299,999 | 109 (79.0%) | 68 (54.4%) |
| $300,000 to $499,999 | 0 (0.0%) | 5 (4.0%) |
| $500,000 to $749,999 | 13 (9.4%) | 37 (29.6%) |
| $750,000 to $999,999 | 16 (11.6%) | 15 (12.0%) |
| $1,000,000 or more | 0 (0.0%) | 0 (0.0%) |
| Total | 138 (100.0%) | 125 (100.0%) |
Household Income by Mortgage Status in Blanchard
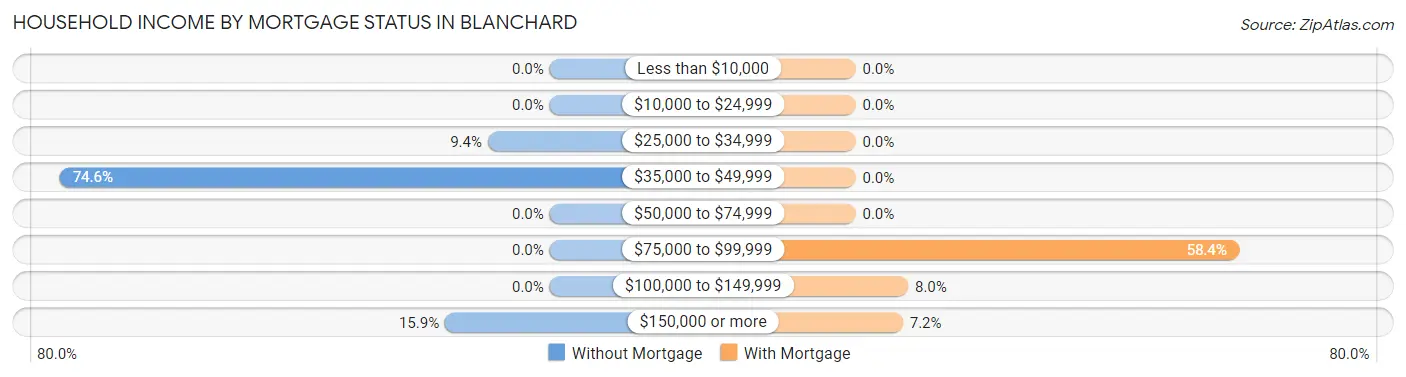
| Household Income | Without Mortgage | With Mortgage |
| Less than $10,000 | 0 (0.0%) | 0 (0.0%) |
| $10,000 to $24,999 | 0 (0.0%) | 0 (0.0%) |
| $25,000 to $34,999 | 13 (9.4%) | 0 (0.0%) |
| $35,000 to $49,999 | 103 (74.6%) | 0 (0.0%) |
| $50,000 to $74,999 | 0 (0.0%) | 0 (0.0%) |
| $75,000 to $99,999 | 0 (0.0%) | 73 (58.4%) |
| $100,000 to $149,999 | 0 (0.0%) | 10 (8.0%) |
| $150,000 or more | 22 (15.9%) | 9 (7.2%) |
| Total | 138 (100.0%) | 125 (100.0%) |
Property Value to Household Income Ratio in Blanchard
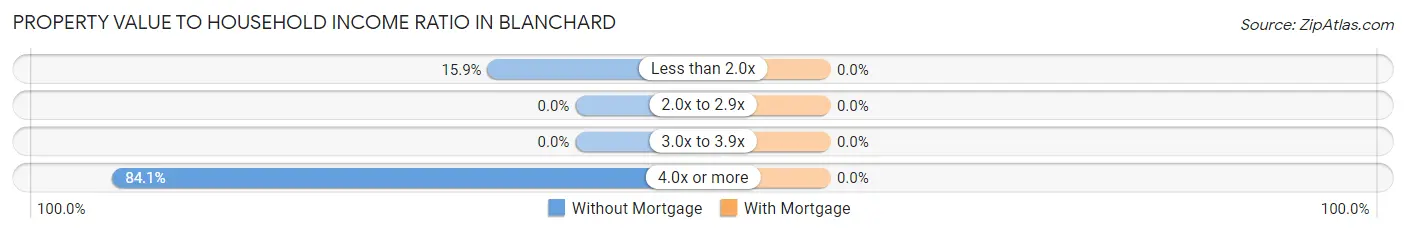
| Value-to-Income Ratio | Without Mortgage | With Mortgage |
| Less than 2.0x | 22 (15.9%) | 0 (0.0%) |
| 2.0x to 2.9x | 0 (0.0%) | 0 (0.0%) |
| 3.0x to 3.9x | 0 (0.0%) | 0 (0.0%) |
| 4.0x or more | 116 (84.1%) | 0 (0.0%) |
| Total | 138 (100.0%) | 125 (100.0%) |
Real Estate Taxes by Mortgage Status in Blanchard
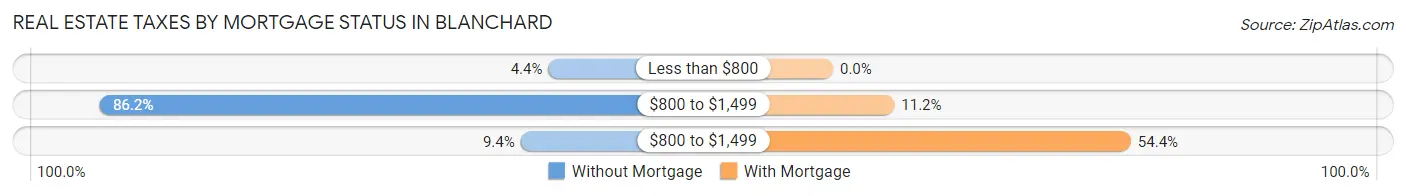
| Property Taxes | Without Mortgage | With Mortgage |
| Less than $800 | 6 (4.3%) | 0 (0.0%) |
| $800 to $1,499 | 119 (86.2%) | 14 (11.2%) |
| $800 to $1,499 | 13 (9.4%) | 68 (54.4%) |
| Total | 138 (100.0%) | 125 (100.0%) |
Health & Disability in Blanchard
Health Insurance Coverage by Age in Blanchard
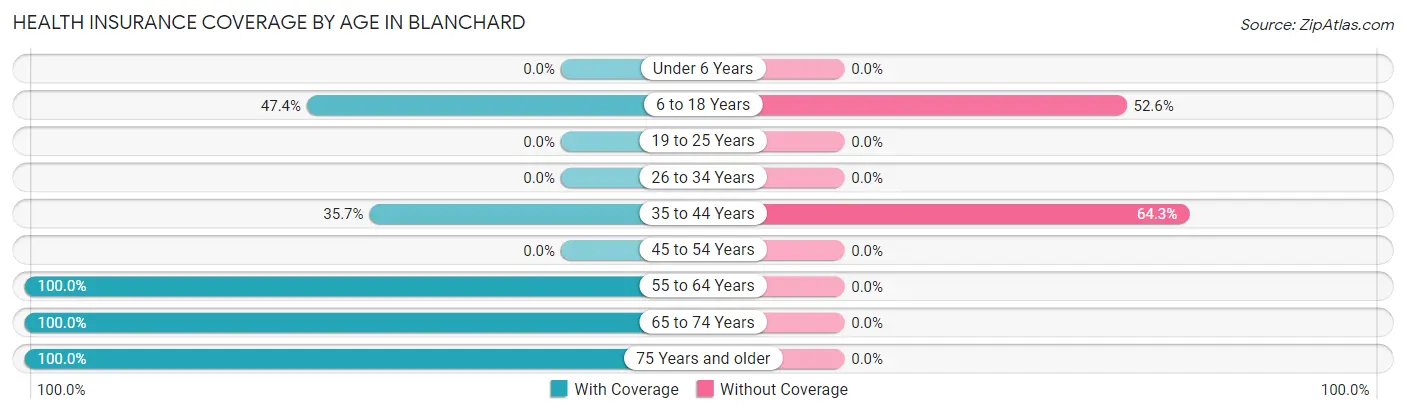
| Age Bracket | With Coverage | Without Coverage |
| Under 6 Years | 0 (0.0%) | 0 (0.0%) |
| 6 to 18 Years | 9 (47.4%) | 10 (52.6%) |
| 19 to 25 Years | 0 (0.0%) | 0 (0.0%) |
| 26 to 34 Years | 0 (0.0%) | 0 (0.0%) |
| 35 to 44 Years | 10 (35.7%) | 18 (64.3%) |
| 45 to 54 Years | 0 (0.0%) | 0 (0.0%) |
| 55 to 64 Years | 51 (100.0%) | 0 (0.0%) |
| 65 to 74 Years | 233 (100.0%) | 0 (0.0%) |
| 75 Years and older | 107 (100.0%) | 0 (0.0%) |
| Total | 410 (93.6%) | 28 (6.4%) |
Health Insurance Coverage by Citizenship Status in Blanchard
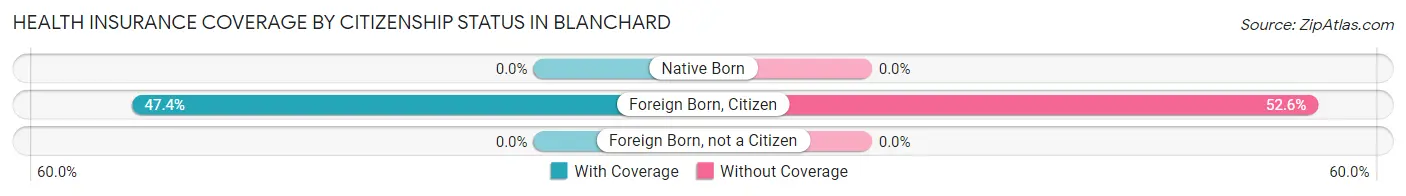
| Citizenship Status | With Coverage | Without Coverage |
| Native Born | 0 (0.0%) | 0 (0.0%) |
| Foreign Born, Citizen | 9 (47.4%) | 10 (52.6%) |
| Foreign Born, not a Citizen | 0 (0.0%) | 0 (0.0%) |
Health Insurance Coverage by Household Income in Blanchard
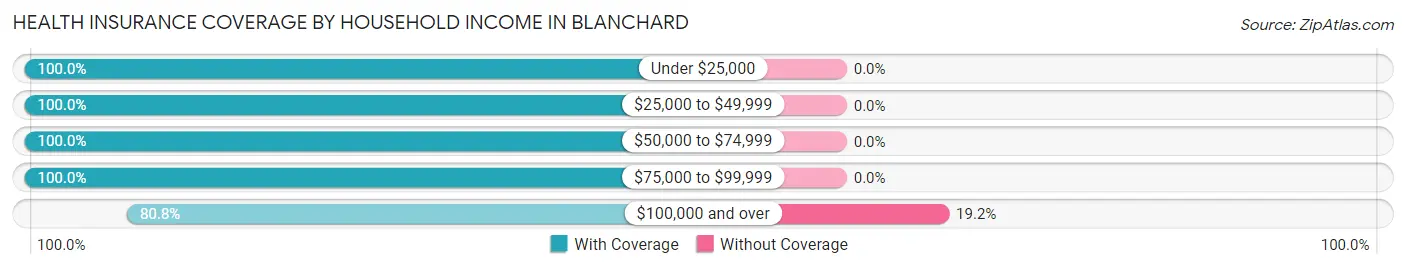
| Household Income | With Coverage | Without Coverage |
| Under $25,000 | 36 (100.0%) | 0 (0.0%) |
| $25,000 to $49,999 | 116 (100.0%) | 0 (0.0%) |
| $50,000 to $74,999 | 124 (100.0%) | 0 (0.0%) |
| $75,000 to $99,999 | 16 (100.0%) | 0 (0.0%) |
| $100,000 and over | 118 (80.8%) | 28 (19.2%) |
Public vs Private Health Insurance Coverage by Age in Blanchard
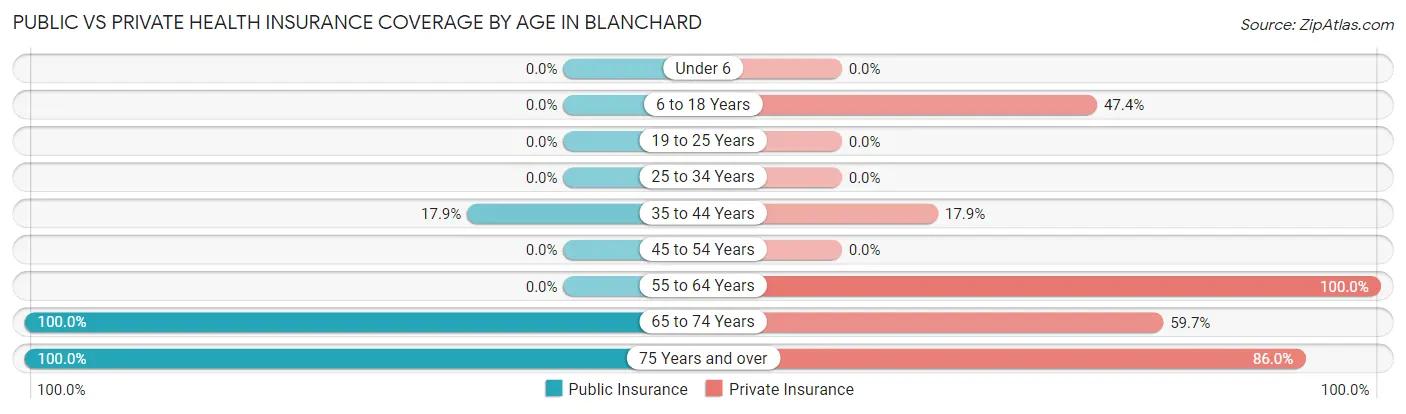
| Age Bracket | Public Insurance | Private Insurance |
| Under 6 | 0 (0.0%) | 0 (0.0%) |
| 6 to 18 Years | 0 (0.0%) | 9 (47.4%) |
| 19 to 25 Years | 0 (0.0%) | 0 (0.0%) |
| 25 to 34 Years | 0 (0.0%) | 0 (0.0%) |
| 35 to 44 Years | 5 (17.9%) | 5 (17.9%) |
| 45 to 54 Years | 0 (0.0%) | 0 (0.0%) |
| 55 to 64 Years | 0 (0.0%) | 51 (100.0%) |
| 65 to 74 Years | 233 (100.0%) | 139 (59.7%) |
| 75 Years and over | 107 (100.0%) | 92 (86.0%) |
| Total | 345 (78.8%) | 296 (67.6%) |
Disability Status by Sex by Age in Blanchard
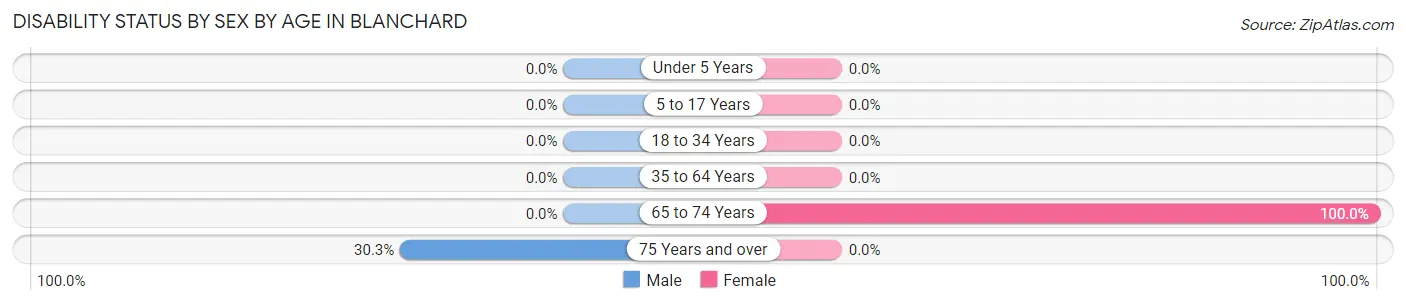
| Age Bracket | Male | Female |
| Under 5 Years | 0 (0.0%) | 0 (0.0%) |
| 5 to 17 Years | 0 (0.0%) | 0 (0.0%) |
| 18 to 34 Years | 0 (0.0%) | 0 (0.0%) |
| 35 to 64 Years | 0 (0.0%) | 0 (0.0%) |
| 65 to 74 Years | 0 (0.0%) | 18 (100.0%) |
| 75 Years and over | 10 (30.3%) | 0 (0.0%) |
Disability Class by Sex by Age in Blanchard
Disability Class: Hearing Difficulty
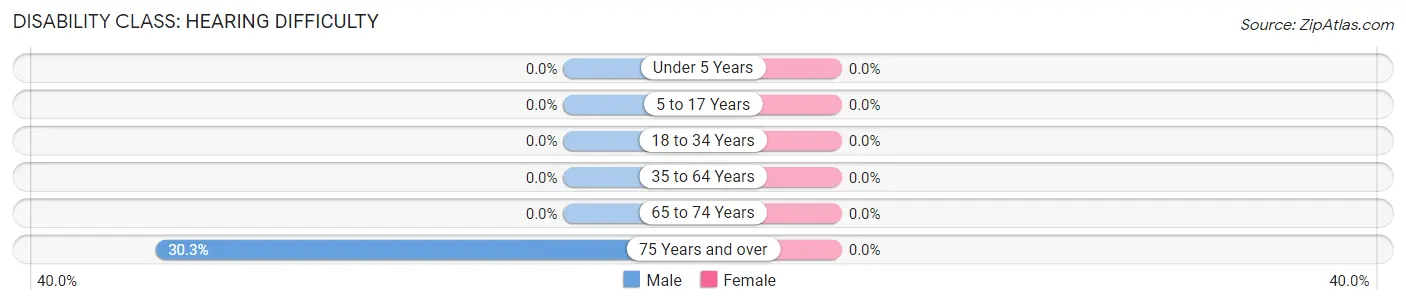
| Age Bracket | Male | Female |
| Under 5 Years | 0 (0.0%) | 0 (0.0%) |
| 5 to 17 Years | 0 (0.0%) | 0 (0.0%) |
| 18 to 34 Years | 0 (0.0%) | 0 (0.0%) |
| 35 to 64 Years | 0 (0.0%) | 0 (0.0%) |
| 65 to 74 Years | 0 (0.0%) | 0 (0.0%) |
| 75 Years and over | 10 (30.3%) | 0 (0.0%) |
Disability Class: Vision Difficulty
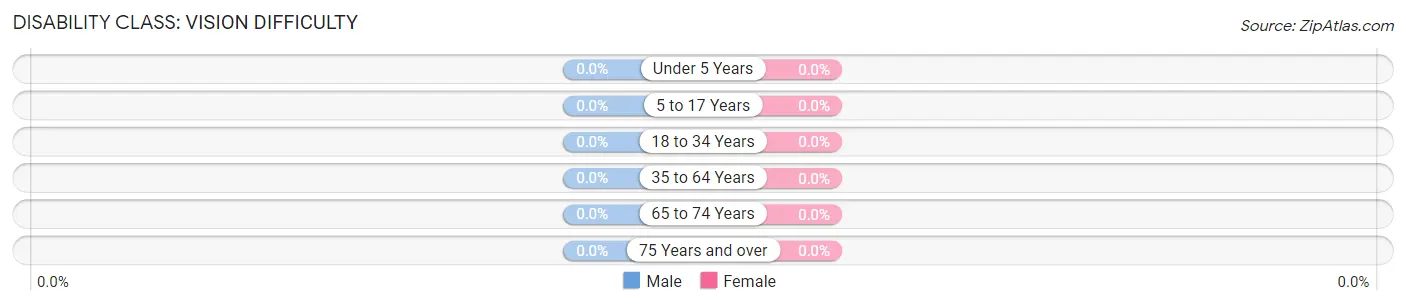
| Age Bracket | Male | Female |
| Under 5 Years | 0 (0.0%) | 0 (0.0%) |
| 5 to 17 Years | 0 (0.0%) | 0 (0.0%) |
| 18 to 34 Years | 0 (0.0%) | 0 (0.0%) |
| 35 to 64 Years | 0 (0.0%) | 0 (0.0%) |
| 65 to 74 Years | 0 (0.0%) | 0 (0.0%) |
| 75 Years and over | 0 (0.0%) | 0 (0.0%) |
Disability Class: Cognitive Difficulty
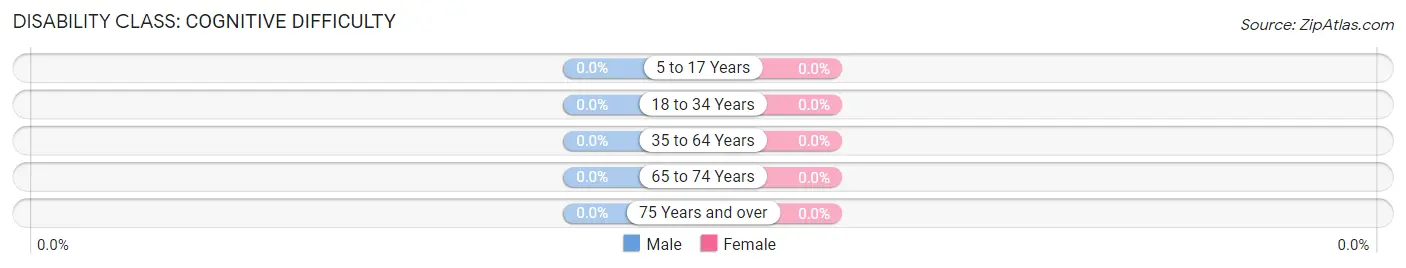
| Age Bracket | Male | Female |
| 5 to 17 Years | 0 (0.0%) | 0 (0.0%) |
| 18 to 34 Years | 0 (0.0%) | 0 (0.0%) |
| 35 to 64 Years | 0 (0.0%) | 0 (0.0%) |
| 65 to 74 Years | 0 (0.0%) | 0 (0.0%) |
| 75 Years and over | 0 (0.0%) | 0 (0.0%) |
Disability Class: Ambulatory Difficulty
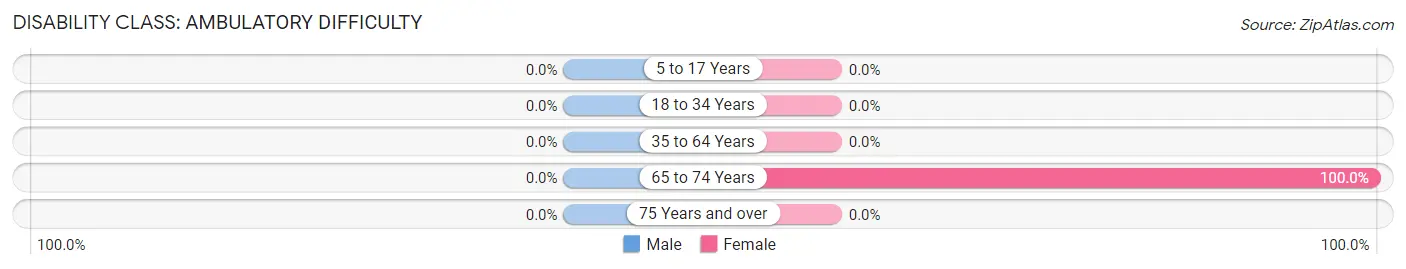
| Age Bracket | Male | Female |
| 5 to 17 Years | 0 (0.0%) | 0 (0.0%) |
| 18 to 34 Years | 0 (0.0%) | 0 (0.0%) |
| 35 to 64 Years | 0 (0.0%) | 0 (0.0%) |
| 65 to 74 Years | 0 (0.0%) | 18 (100.0%) |
| 75 Years and over | 0 (0.0%) | 0 (0.0%) |
Disability Class: Self-Care Difficulty
| Age Bracket | Male | Female |
| 5 to 17 Years | 0 (0.0%) | 0 (0.0%) |
| 18 to 34 Years | 0 (0.0%) | 0 (0.0%) |
| 35 to 64 Years | 0 (0.0%) | 0 (0.0%) |
| 65 to 74 Years | 0 (0.0%) | 0 (0.0%) |
| 75 Years and over | 0 (0.0%) | 0 (0.0%) |
Technology Access in Blanchard
Computing Device Access in Blanchard
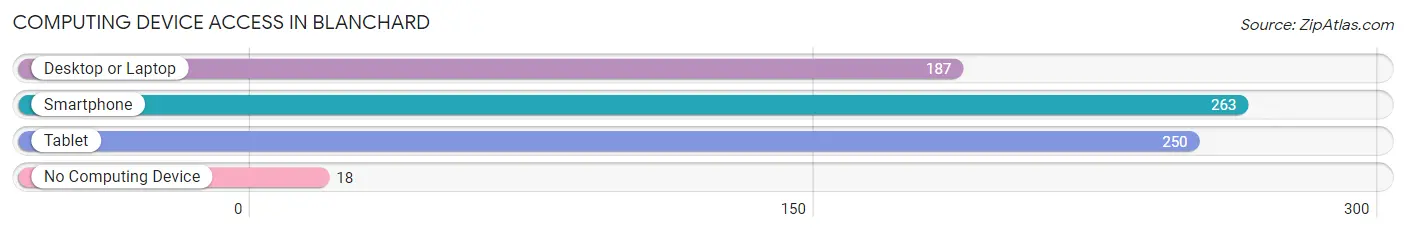
| Device Type | # Households | % Households |
| Desktop or Laptop | 187 | 66.5% |
| Smartphone | 263 | 93.6% |
| Tablet | 250 | 89.0% |
| No Computing Device | 18 | 6.4% |
| Total | 281 | 100.0% |
Internet Access in Blanchard
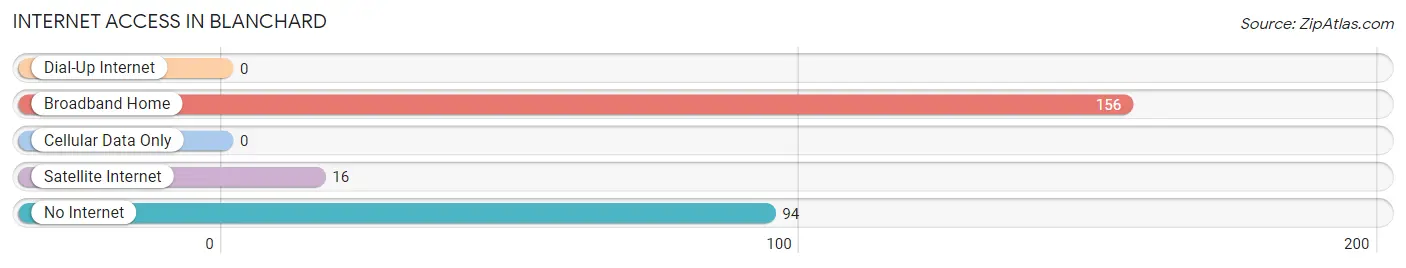
| Internet Type | # Households | % Households |
| Dial-Up Internet | 0 | 0.0% |
| Broadband Home | 156 | 55.5% |
| Cellular Data Only | 0 | 0.0% |
| Satellite Internet | 16 | 5.7% |
| No Internet | 94 | 33.5% |
| Total | 281 | 100.0% |
Blanchard Summary
Blanchard is a small city located in the state of Idaho, in the United States. It is situated in the northern part of the state, in Bonner County, and is part of the Sandpoint metropolitan area. The city has a population of approximately 1,500 people, and is known for its rural atmosphere and small-town charm.
History
Blanchard was founded in 1883 by a group of settlers from Wisconsin. The city was named after the Blanchard family, who were among the first settlers in the area. The city was originally a logging and farming community, and the first post office was established in 1884.
In the early 1900s, the city began to grow and develop, and by the 1920s, it had become a popular tourist destination. The city was known for its beautiful scenery and outdoor activities, and it was also home to several resorts and hotels.
In the 1950s, the city began to experience a decline in population, as many of the residents moved away to larger cities. However, in recent years, the city has seen a resurgence in population, as people have moved back to the area to take advantage of the rural atmosphere and small-town charm.
Geography
Blanchard is located in the northern part of Idaho, in Bonner County. The city is situated in the Selkirk Mountains, and is surrounded by forests and lakes. The city is located near the Pend Oreille River, and is approximately 25 miles north of the city of Sandpoint.
The city has a total area of 1.2 square miles, and has an elevation of 2,717 feet. The climate in Blanchard is generally mild, with warm summers and cold winters.
Economy
The economy of Blanchard is largely based on tourism and outdoor recreation. The city is home to several resorts and hotels, as well as a variety of restaurants and shops. The city is also home to several small businesses, including a lumber mill, a sawmill, and a furniture factory.
In addition, the city is home to several farms, which produce a variety of crops, including potatoes, wheat, and hay. The city is also home to several logging companies, which harvest timber from the surrounding forests.
Demographics
As of the 2010 census, the population of Blanchard was 1,500 people. The racial makeup of the city was 95.3% White, 0.7% Native American, 0.3% Asian, 0.2% African American, and 3.5% from other races. The median household income in Blanchard was $37,500, and the median age was 44.
Blanchard is a small city with a rural atmosphere and small-town charm. The city is home to a variety of businesses and attractions, and is a popular destination for tourists and outdoor enthusiasts. The city is also home to a diverse population, with a variety of backgrounds and cultures.
Common Questions
What is Per Capita Income in Blanchard?
Per Capita income in Blanchard is $60,886.
What is the Median Household income in Blanchard?
Median Household Income in Blanchard is $52,555.
What is Inequality or Gini Index in Blanchard?
Inequality or Gini Index in Blanchard is 0.47.
What is the Total Population of Blanchard?
Total Population of Blanchard is 438.
What is the Total Male Population of Blanchard?
Total Male Population of Blanchard is 289.
What is the Total Female Population of Blanchard?
Total Female Population of Blanchard is 149.
What is the Ratio of Males per 100 Females in Blanchard?
There are 193.96 Males per 100 Females in Blanchard.
What is the Ratio of Females per 100 Males in Blanchard?
There are 51.56 Females per 100 Males in Blanchard.
What is the Median Population Age in Blanchard?
Median Population Age in Blanchard is 68.3 Years.
What is the Average Family Size in Blanchard
Average Family Size in Blanchard is 2.0 People.
What is the Average Household Size in Blanchard
Average Household Size in Blanchard is 1.6 People.
How Large is the Labor Force in Blanchard?
There are 28 People in the Labor Forcein in Blanchard.
What is the Percentage of People in the Labor Force in Blanchard?
6.5% of People are in the Labor Force in Blanchard.