Pronghorn, OR Map & Demographics
Pronghorn Map
Pronghorn Overview
$127,585
PER CAPITA INCOME
$250,001
AVG FAMILY INCOME
99.0%
WAGE / INCOME GAP [ % ]
1.0¢/ $1
WAGE / INCOME GAP [ $ ]
0.53
INEQUALITY / GINI INDEX
183
TOTAL POPULATION
55
MALE POPULATION
128
FEMALE POPULATION
42.97
MALES / 100 FEMALES
232.73
FEMALES / 100 MALES
72.2
MEDIAN AGE
3.0
AVG FAMILY SIZE
2.6
AVG HOUSEHOLD SIZE
109
LABOR FORCE [ PEOPLE ]
59.6%
PERCENT IN LABOR FORCE
Income in Pronghorn
Income Overview in Pronghorn
| Characteristic | Number | Measure |
| Per Capita Income | 183 | $127,585 |
| Median Family Income | 55 | $250,001 |
| Mean Family Income | 55 | $398,565 |
| Median Household Income | 70 | $0 |
| Mean Household Income | 70 | $318,690 |
| Income Deficit | 55 | $0 |
| Wage / Income Gap (%) | 183 | 99.00% |
| Wage / Income Gap ($) | 183 | 1.00¢ per $1 |
| Gini / Inequality Index | 183 | 0.53 |
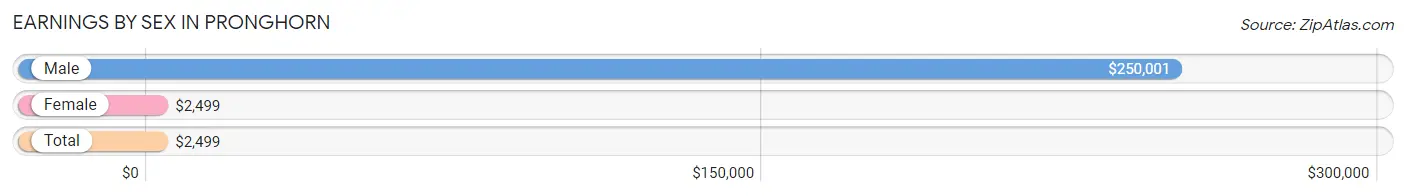
Earnings by Sex in Pronghorn
Average Earnings in Pronghorn are $2,499, $250,001 for men and $2,499 for women, a difference of 99.0%.
| Sex | Number | Average Earnings |
| Male | 28 (24.6%) | $250,001 |
| Female | 86 (75.4%) | $2,499 |
| Total | 114 (100.0%) | $2,499 |
Earnings by Sex by Income Bracket in Pronghorn
The most common earnings brackets in Pronghorn are $100,000+ for men (20 | 71.4%) and $2,499 or less for women (72 | 83.7%).
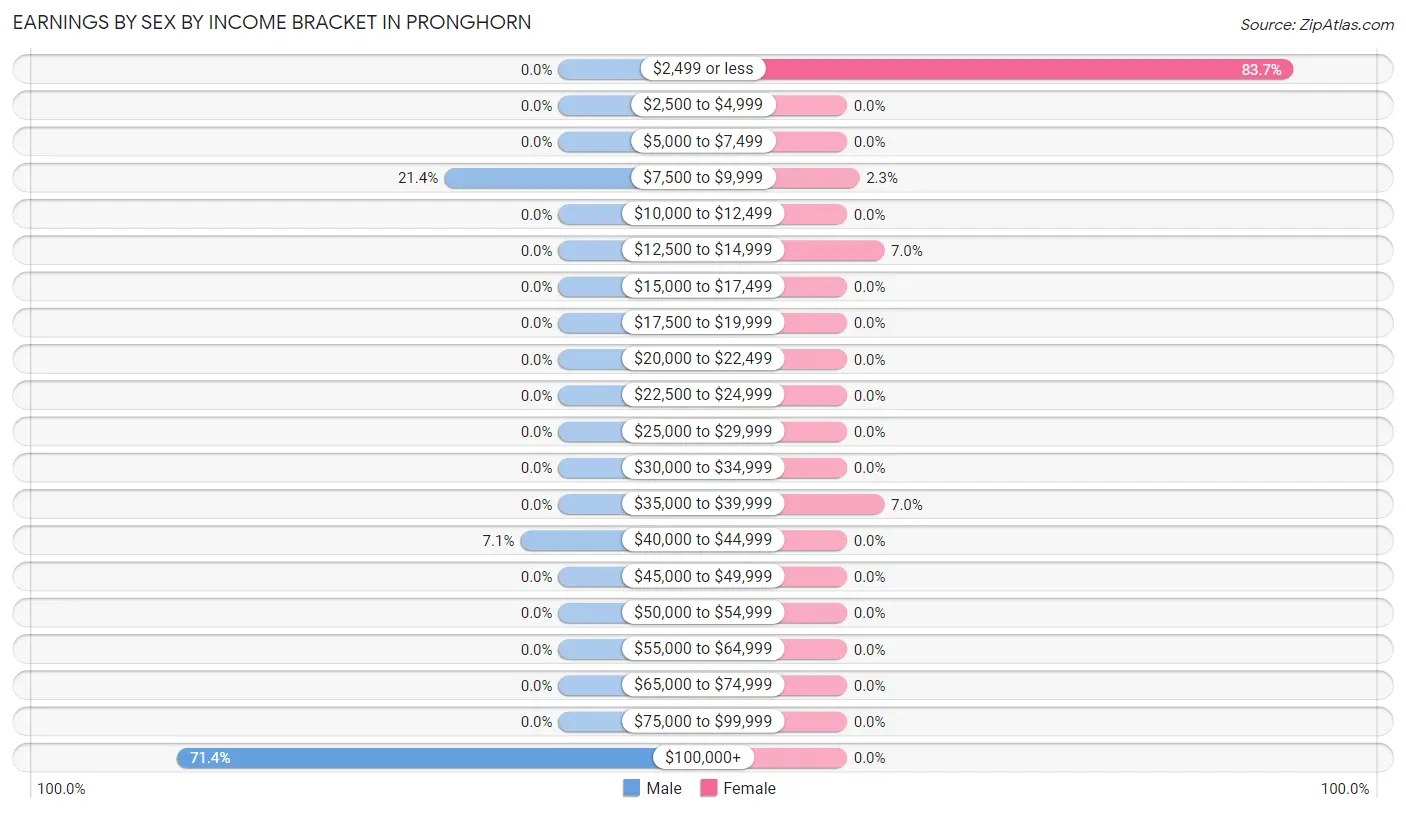
| Income | Male | Female |
| $2,499 or less | 0 (0.0%) | 72 (83.7%) |
| $2,500 to $4,999 | 0 (0.0%) | 0 (0.0%) |
| $5,000 to $7,499 | 0 (0.0%) | 0 (0.0%) |
| $7,500 to $9,999 | 6 (21.4%) | 2 (2.3%) |
| $10,000 to $12,499 | 0 (0.0%) | 0 (0.0%) |
| $12,500 to $14,999 | 0 (0.0%) | 6 (7.0%) |
| $15,000 to $17,499 | 0 (0.0%) | 0 (0.0%) |
| $17,500 to $19,999 | 0 (0.0%) | 0 (0.0%) |
| $20,000 to $22,499 | 0 (0.0%) | 0 (0.0%) |
| $22,500 to $24,999 | 0 (0.0%) | 0 (0.0%) |
| $25,000 to $29,999 | 0 (0.0%) | 0 (0.0%) |
| $30,000 to $34,999 | 0 (0.0%) | 0 (0.0%) |
| $35,000 to $39,999 | 0 (0.0%) | 6 (7.0%) |
| $40,000 to $44,999 | 2 (7.1%) | 0 (0.0%) |
| $45,000 to $49,999 | 0 (0.0%) | 0 (0.0%) |
| $50,000 to $54,999 | 0 (0.0%) | 0 (0.0%) |
| $55,000 to $64,999 | 0 (0.0%) | 0 (0.0%) |
| $65,000 to $74,999 | 0 (0.0%) | 0 (0.0%) |
| $75,000 to $99,999 | 0 (0.0%) | 0 (0.0%) |
| $100,000+ | 20 (71.4%) | 0 (0.0%) |
| Total | 28 (100.0%) | 86 (100.0%) |
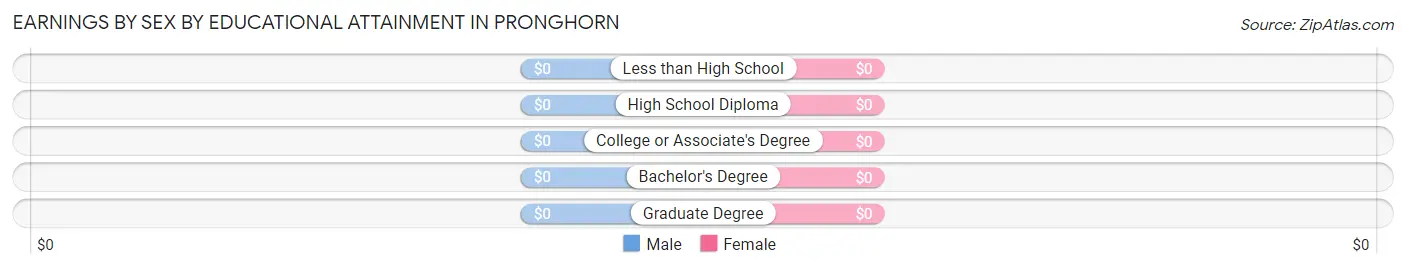
Earnings by Sex by Educational Attainment in Pronghorn
| Educational Attainment | Male Income | Female Income |
| Less than High School | - | - |
| High School Diploma | - | - |
| College or Associate's Degree | - | - |
| Bachelor's Degree | - | - |
| Graduate Degree | - | - |
| Total | $250,001 | $2,499 |
Family Income in Pronghorn
Family Income Brackets in Pronghorn
According to the Pronghorn family income data, there are 40 families falling into the $200,000+ income range, which is the most common income bracket and makes up 72.7% of all families.
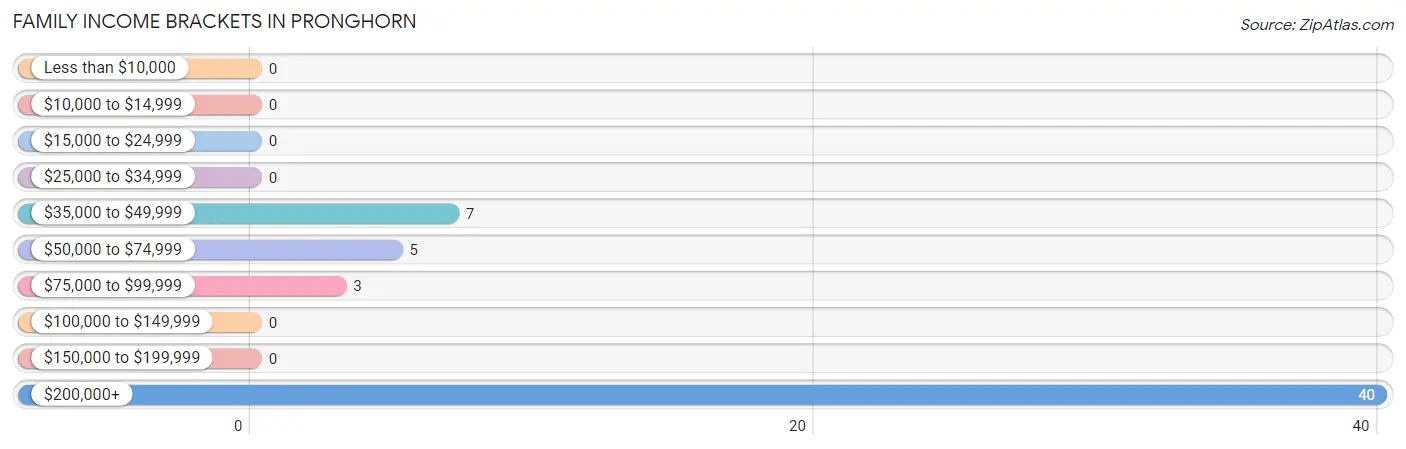
| Income Bracket | # Families | % Families |
| Less than $10,000 | 0 | 0.0% |
| $10,000 to $14,999 | 0 | 0.0% |
| $15,000 to $24,999 | 0 | 0.0% |
| $25,000 to $34,999 | 0 | 0.0% |
| $35,000 to $49,999 | 7 | 12.7% |
| $50,000 to $74,999 | 5 | 9.1% |
| $75,000 to $99,999 | 3 | 5.5% |
| $100,000 to $149,999 | 0 | 0.0% |
| $150,000 to $199,999 | 0 | 0.0% |
| $200,000+ | 40 | 72.7% |
Family Income by Famaliy Size in Pronghorn
2-person families (50 | 90.9%) account for the highest median family income in Pronghorn with $250,001 per family, while 2-person families (50 | 90.9%) have the highest median income of $125,000 per family member.
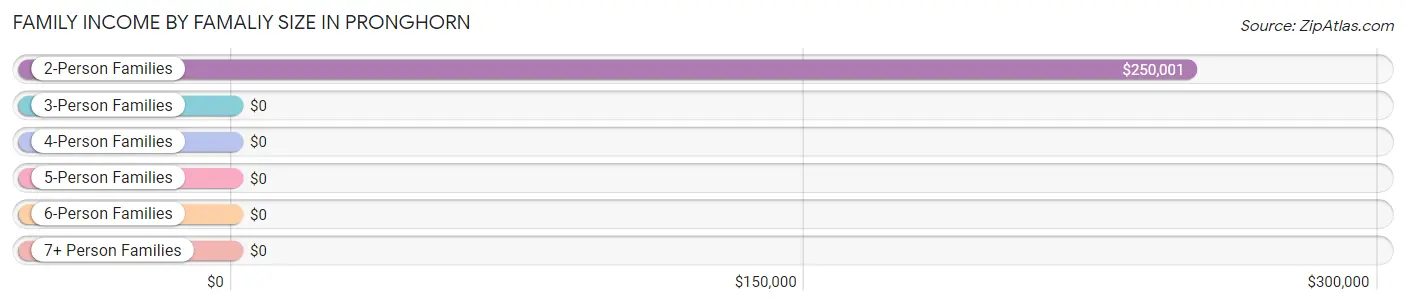
| Income Bracket | # Families | Median Income |
| 2-Person Families | 50 (90.9%) | $250,001 |
| 3-Person Families | 5 (9.1%) | $0 |
| 4-Person Families | 0 (0.0%) | $0 |
| 5-Person Families | 0 (0.0%) | $0 |
| 6-Person Families | 0 (0.0%) | $0 |
| 7+ Person Families | 0 (0.0%) | $0 |
| Total | 55 (100.0%) | $250,001 |
Family Income by Number of Earners in Pronghorn
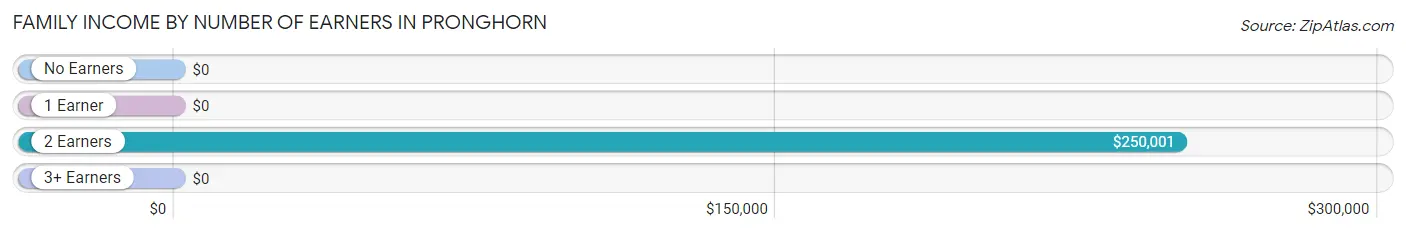
| Number of Earners | # Families | Median Income |
| No Earners | 24 (43.6%) | $0 |
| 1 Earner | 3 (5.4%) | $0 |
| 2 Earners | 28 (50.9%) | $250,001 |
| 3+ Earners | 0 (0.0%) | $0 |
| Total | 55 (100.0%) | $250,001 |
Household Income in Pronghorn
Household Income Brackets in Pronghorn
With 40 households falling in the category, the $200,000+ income range is the most frequent in Pronghorn, accounting for 57.1% of all households.
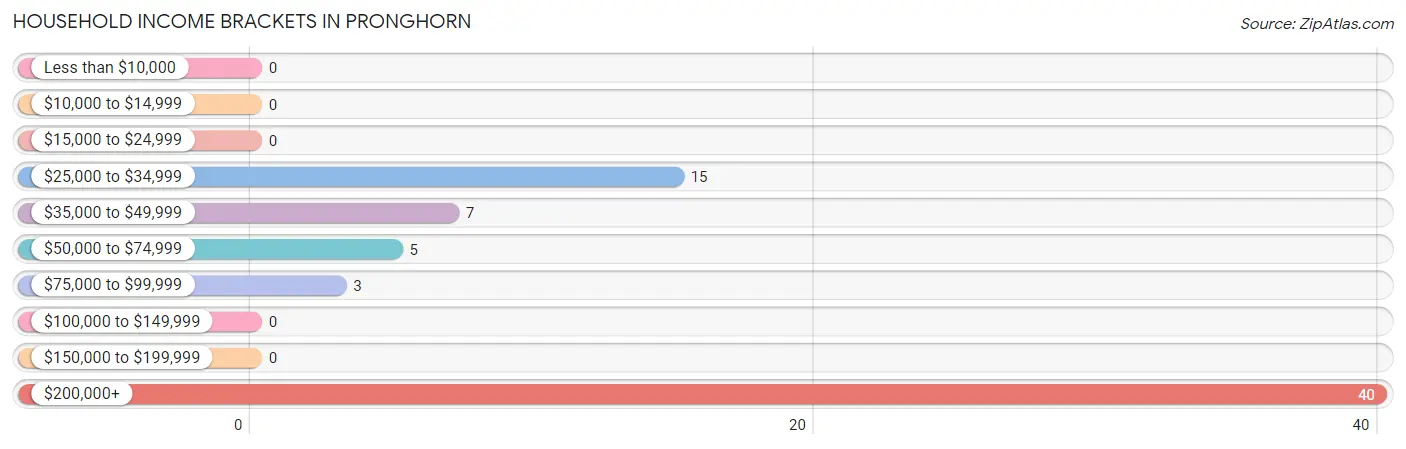
| Income Bracket | # Households | % Households |
| Less than $10,000 | 0 | 0.0% |
| $10,000 to $14,999 | 0 | 0.0% |
| $15,000 to $24,999 | 0 | 0.0% |
| $25,000 to $34,999 | 15 | 21.4% |
| $35,000 to $49,999 | 7 | 10.0% |
| $50,000 to $74,999 | 5 | 7.1% |
| $75,000 to $99,999 | 3 | 4.3% |
| $100,000 to $149,999 | 0 | 0.0% |
| $150,000 to $199,999 | 0 | 0.0% |
| $200,000+ | 40 | 57.1% |
Household Income by Householder Age in Pronghorn
The median household income in Pronghorn is $0, with the highest median household income of $250,001 found in the 45 to 64 years age bracket for the primary householder. A total of 11 households (15.7%) fall into this category.
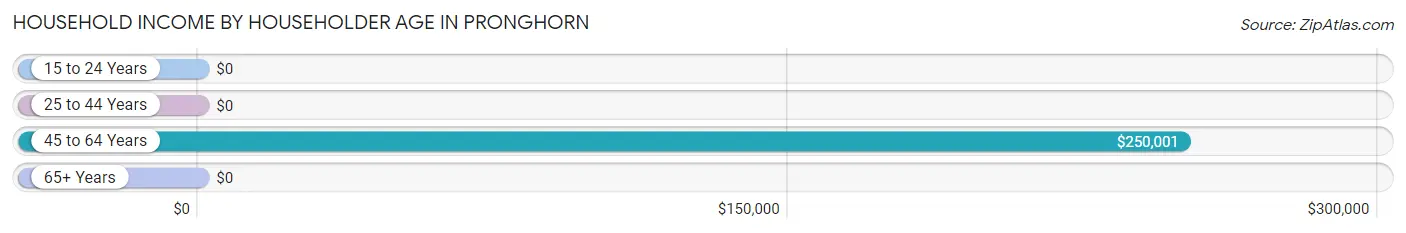
| Income Bracket | # Households | Median Income |
| 15 to 24 Years | 0 (0.0%) | $0 |
| 25 to 44 Years | 0 (0.0%) | $0 |
| 45 to 64 Years | 11 (15.7%) | $250,001 |
| 65+ Years | 59 (84.3%) | $0 |
| Total | 70 (100.0%) | $0 |
Poverty in Pronghorn
Income Below Poverty by Sex and Age in Pronghorn
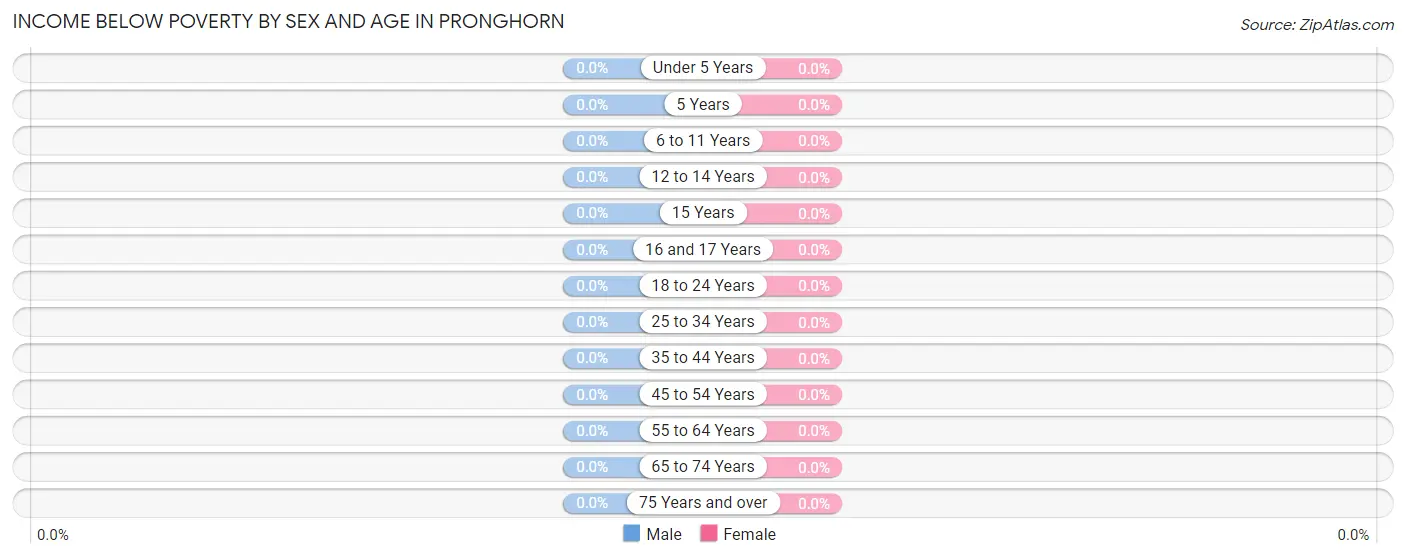
| Age Bracket | Male | Female |
| Under 5 Years | 0 (0.0%) | 0 (0.0%) |
| 5 Years | 0 (0.0%) | 0 (0.0%) |
| 6 to 11 Years | 0 (0.0%) | 0 (0.0%) |
| 12 to 14 Years | 0 (0.0%) | 0 (0.0%) |
| 15 Years | 0 (0.0%) | 0 (0.0%) |
| 16 and 17 Years | 0 (0.0%) | 0 (0.0%) |
| 18 to 24 Years | 0 (0.0%) | 0 (0.0%) |
| 25 to 34 Years | 0 (0.0%) | 0 (0.0%) |
| 35 to 44 Years | 0 (0.0%) | 0 (0.0%) |
| 45 to 54 Years | 0 (0.0%) | 0 (0.0%) |
| 55 to 64 Years | 0 (0.0%) | 0 (0.0%) |
| 65 to 74 Years | 0 (0.0%) | 0 (0.0%) |
| 75 Years and over | 0 (0.0%) | 0 (0.0%) |
| Total | 0 (0.0%) | 0 (0.0%) |
Income Above Poverty by Sex and Age in Pronghorn
According to the poverty statistics in Pronghorn, males aged 55 to 64 years and females aged 18 to 24 years are the age groups that are most secure financially, with 100.0% of males and 100.0% of females in these age groups living above the poverty line.
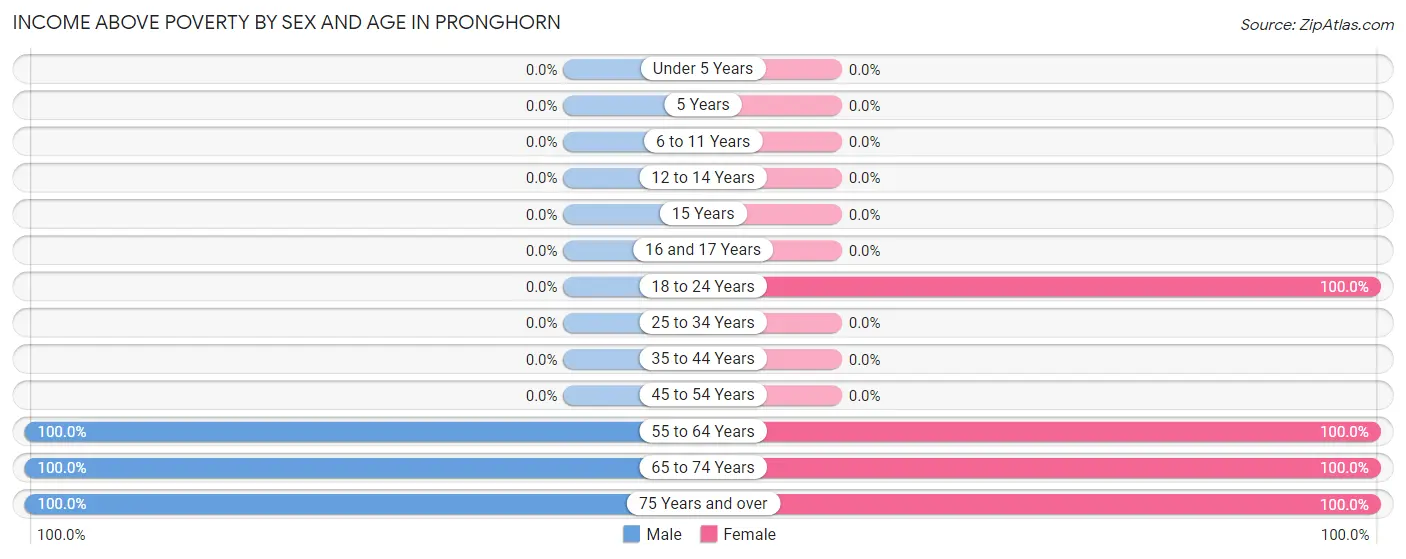
| Age Bracket | Male | Female |
| Under 5 Years | 0 (0.0%) | 0 (0.0%) |
| 5 Years | 0 (0.0%) | 0 (0.0%) |
| 6 to 11 Years | 0 (0.0%) | 0 (0.0%) |
| 12 to 14 Years | 0 (0.0%) | 0 (0.0%) |
| 15 Years | 0 (0.0%) | 0 (0.0%) |
| 16 and 17 Years | 0 (0.0%) | 0 (0.0%) |
| 18 to 24 Years | 0 (0.0%) | 6 (100.0%) |
| 25 to 34 Years | 0 (0.0%) | 0 (0.0%) |
| 35 to 44 Years | 0 (0.0%) | 0 (0.0%) |
| 45 to 54 Years | 0 (0.0%) | 0 (0.0%) |
| 55 to 64 Years | 11 (100.0%) | 11 (100.0%) |
| 65 to 74 Years | 22 (100.0%) | 105 (100.0%) |
| 75 Years and over | 22 (100.0%) | 6 (100.0%) |
| Total | 55 (100.0%) | 128 (100.0%) |
Income Below Poverty Among Married-Couple Families in Pronghorn
| Children | Above Poverty | Below Poverty |
| No Children | 55 (100.0%) | 0 (0.0%) |
| 1 or 2 Children | 0 (0.0%) | 0 (0.0%) |
| 3 or 4 Children | 0 (0.0%) | 0 (0.0%) |
| 5 or more Children | 0 (0.0%) | 0 (0.0%) |
| Total | 55 (100.0%) | 0 (0.0%) |
Income Below Poverty Among Single-Parent Households in Pronghorn
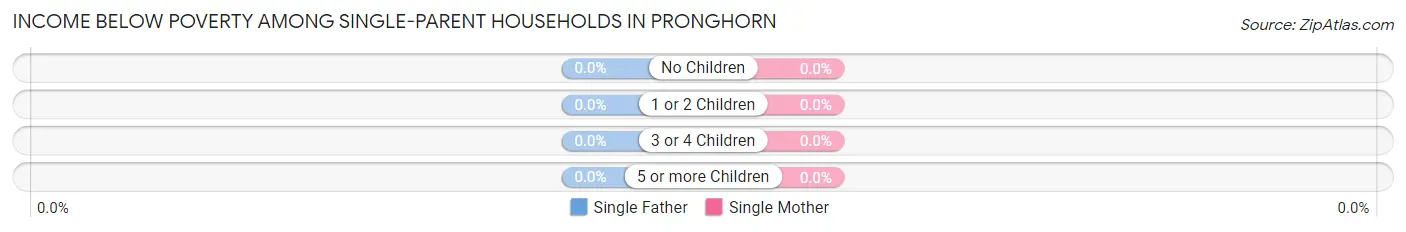
| Children | Single Father | Single Mother |
| No Children | 0 (0.0%) | 0 (0.0%) |
| 1 or 2 Children | 0 (0.0%) | 0 (0.0%) |
| 3 or 4 Children | 0 (0.0%) | 0 (0.0%) |
| 5 or more Children | 0 (0.0%) | 0 (0.0%) |
| Total | 0 (0.0%) | 0 (0.0%) |
Income Below Poverty Among Married-Couple vs Single-Parent Households in Pronghorn
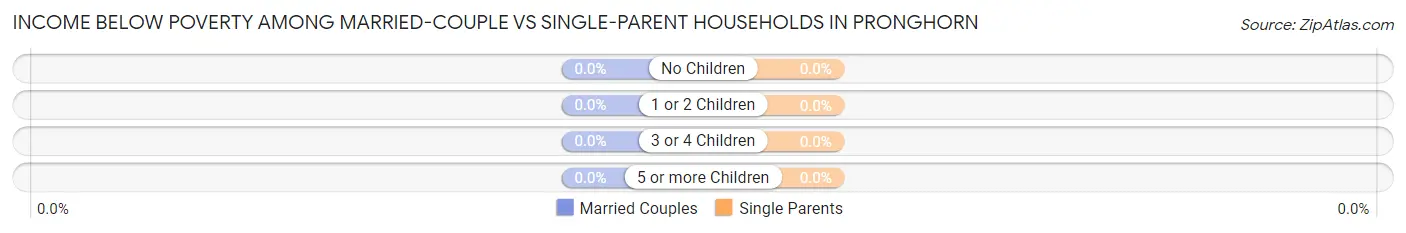
| Children | Married-Couple Families | Single-Parent Households |
| No Children | 0 (0.0%) | 0 (0.0%) |
| 1 or 2 Children | 0 (0.0%) | 0 (0.0%) |
| 3 or 4 Children | 0 (0.0%) | 0 (0.0%) |
| 5 or more Children | 0 (0.0%) | 0 (0.0%) |
| Total | 0 (0.0%) | 0 (0.0%) |
Race in Pronghorn
The most populous races in Pronghorn are White / Caucasian (114 | 62.3%), and Asian (69 | 37.7%).
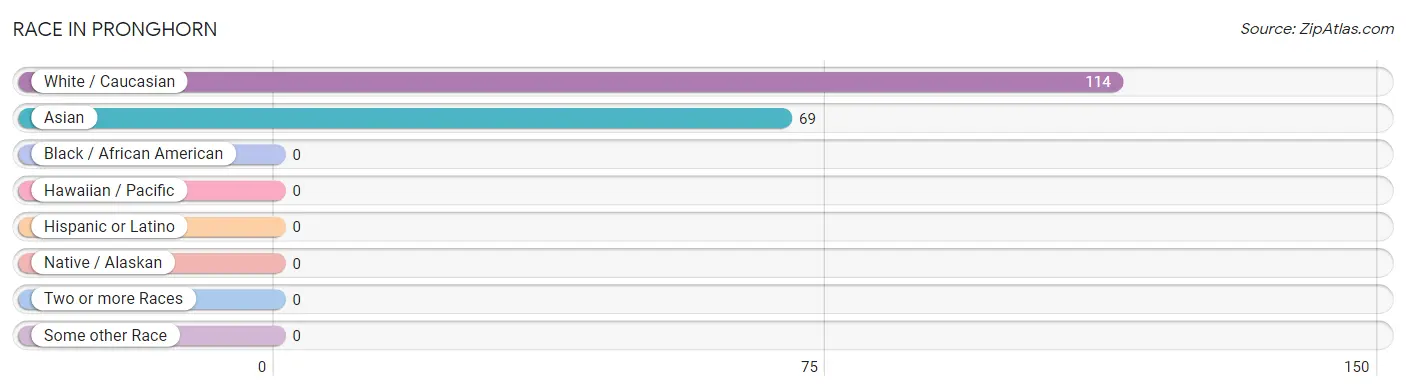
| Race | # Population | % Population |
| Asian | 69 | 37.7% |
| Black / African American | 0 | 0.0% |
| Hawaiian / Pacific | 0 | 0.0% |
| Hispanic or Latino | 0 | 0.0% |
| Native / Alaskan | 0 | 0.0% |
| White / Caucasian | 114 | 62.3% |
| Two or more Races | 0 | 0.0% |
| Some other Race | 0 | 0.0% |
| Total | 183 | 100.0% |
Ancestry in Pronghorn
The most populous ancestries reported in Pronghorn are Bhutanese (69 | 37.7%), English (34 | 18.6%), German (30 | 16.4%), French (21 | 11.5%), and Danish (15 | 8.2%), together accounting for 92.3% of all Pronghorn residents.
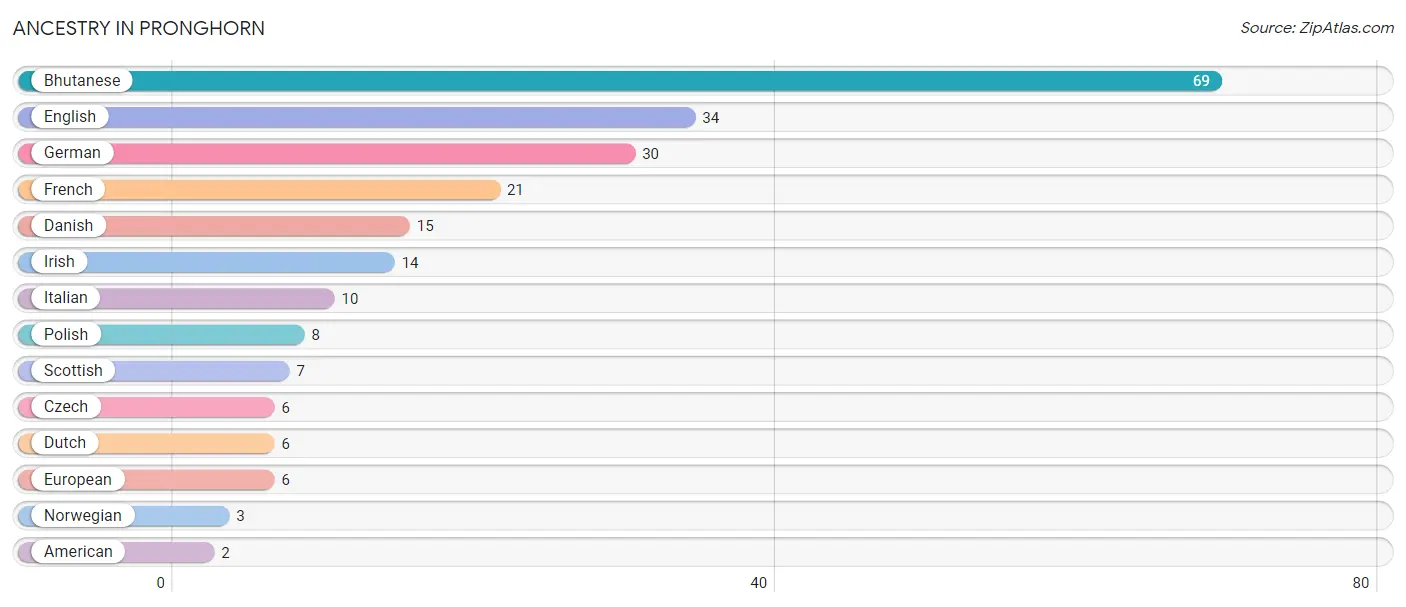
| Ancestry | # Population | % Population |
| American | 2 | 1.1% |
| Bhutanese | 69 | 37.7% |
| Czech | 6 | 3.3% |
| Danish | 15 | 8.2% |
| Dutch | 6 | 3.3% |
| English | 34 | 18.6% |
| European | 6 | 3.3% |
| French | 21 | 11.5% |
| German | 30 | 16.4% |
| Irish | 14 | 7.6% |
| Italian | 10 | 5.5% |
| Norwegian | 3 | 1.6% |
| Polish | 8 | 4.4% |
| Scottish | 7 | 3.8% | View All 14 Rows |
Immigrants in Pronghorn
The most numerous immigrant groups reported in Pronghorn came from Asia (69 | 37.7%), Eastern Asia (69 | 37.7%), Japan (69 | 37.7%), Europe (2 | 1.1%), and Italy (2 | 1.1%), together accounting for 115.3% of all Pronghorn residents.
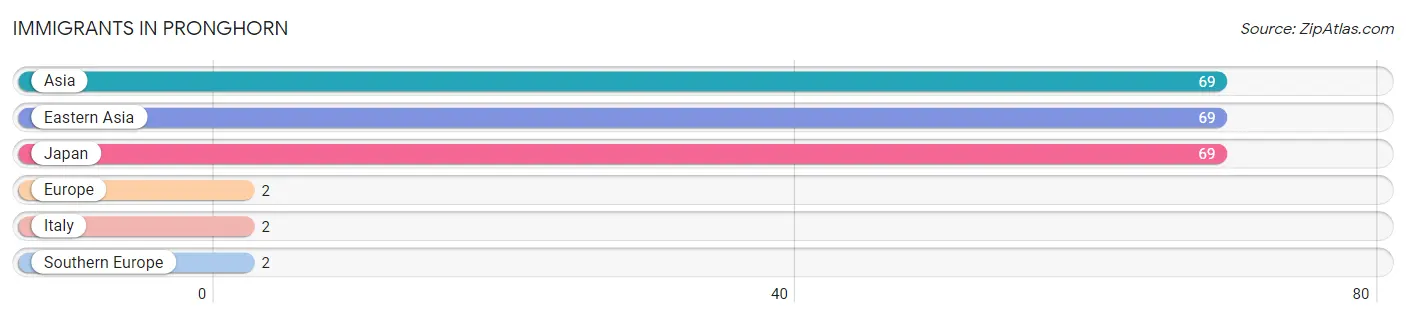
| Immigration Origin | # Population | % Population |
| Asia | 69 | 37.7% |
| Eastern Asia | 69 | 37.7% |
| Europe | 2 | 1.1% |
| Italy | 2 | 1.1% |
| Japan | 69 | 37.7% |
| Southern Europe | 2 | 1.1% | View All 6 Rows |
Sex and Age in Pronghorn
Sex and Age in Pronghorn
The most populous age groups in Pronghorn are 75 to 79 Years (22 | 40.0%) for men and 70 to 74 Years (85 | 66.4%) for women.
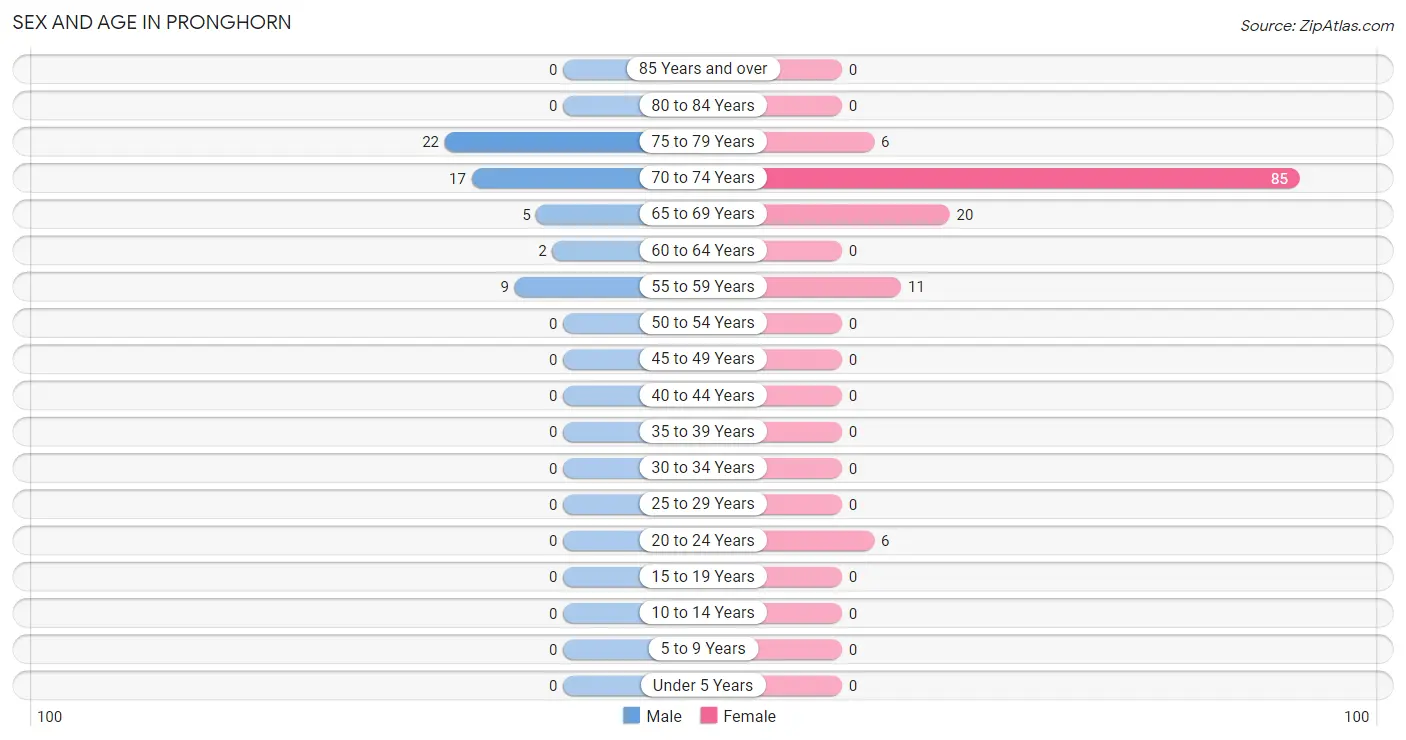
| Age Bracket | Male | Female |
| Under 5 Years | 0 (0.0%) | 0 (0.0%) |
| 5 to 9 Years | 0 (0.0%) | 0 (0.0%) |
| 10 to 14 Years | 0 (0.0%) | 0 (0.0%) |
| 15 to 19 Years | 0 (0.0%) | 0 (0.0%) |
| 20 to 24 Years | 0 (0.0%) | 6 (4.7%) |
| 25 to 29 Years | 0 (0.0%) | 0 (0.0%) |
| 30 to 34 Years | 0 (0.0%) | 0 (0.0%) |
| 35 to 39 Years | 0 (0.0%) | 0 (0.0%) |
| 40 to 44 Years | 0 (0.0%) | 0 (0.0%) |
| 45 to 49 Years | 0 (0.0%) | 0 (0.0%) |
| 50 to 54 Years | 0 (0.0%) | 0 (0.0%) |
| 55 to 59 Years | 9 (16.4%) | 11 (8.6%) |
| 60 to 64 Years | 2 (3.6%) | 0 (0.0%) |
| 65 to 69 Years | 5 (9.1%) | 20 (15.6%) |
| 70 to 74 Years | 17 (30.9%) | 85 (66.4%) |
| 75 to 79 Years | 22 (40.0%) | 6 (4.7%) |
| 80 to 84 Years | 0 (0.0%) | 0 (0.0%) |
| 85 Years and over | 0 (0.0%) | 0 (0.0%) |
| Total | 55 (100.0%) | 128 (100.0%) |
Families and Households in Pronghorn
Median Family Size in Pronghorn
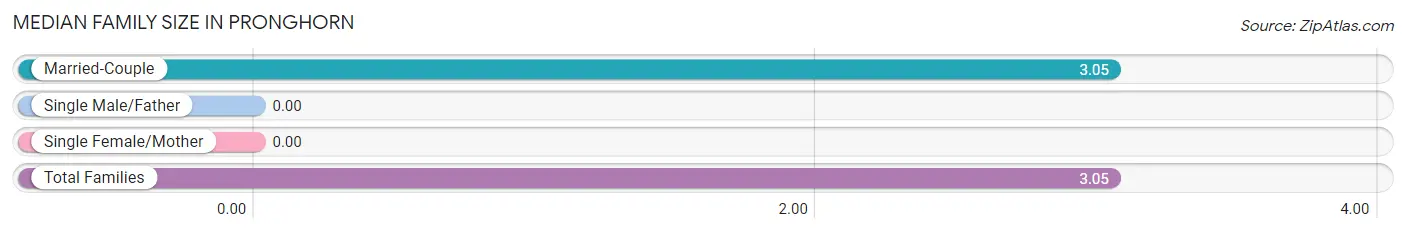
| Family Type | # Families | Family Size |
| Married-Couple | 55 (100.0%) | 3.05 |
| Single Male/Father | 0 (0.0%) | - |
| Single Female/Mother | 0 (0.0%) | - |
| Total Families | 55 (100.0%) | 3.05 |
Median Household Size in Pronghorn
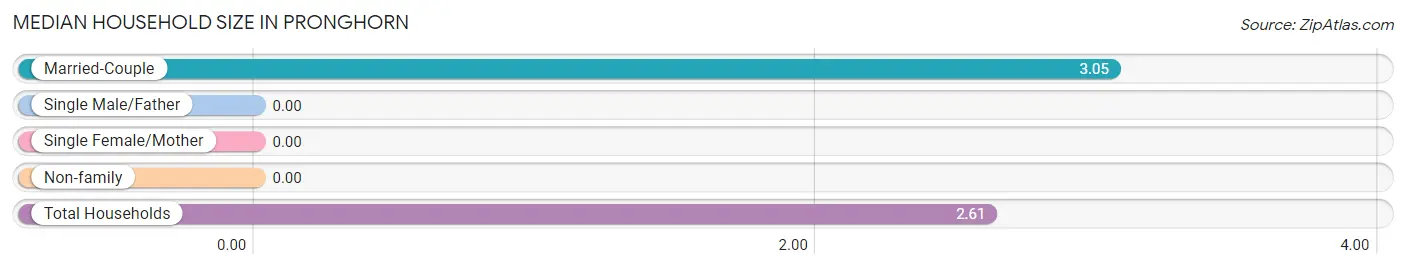
| Household Type | # Households | Household Size |
| Married-Couple | 55 (78.6%) | 3.05 |
| Single Male/Father | 0 (0.0%) | - |
| Single Female/Mother | 0 (0.0%) | - |
| Non-family | 15 (21.4%) | - |
| Total Households | 70 (100.0%) | 2.61 |
Household Size by Marriage Status in Pronghorn
Out of a total of 70 households in Pronghorn, 55 (78.6%) are family households, while 15 (21.4%) are nonfamily households. The most numerous type of family households are 2-person households, comprising 50, and the most common type of nonfamily households are 1-person households, comprising 15.
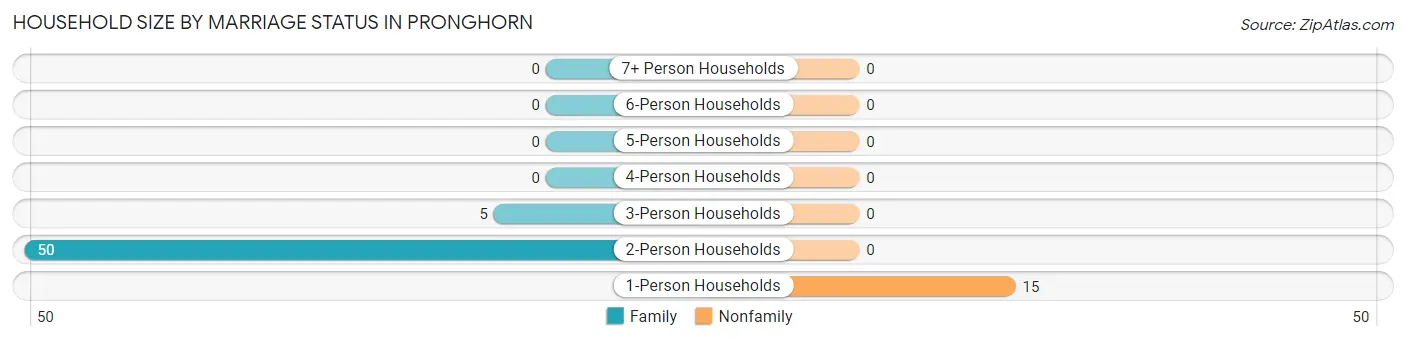
| Household Size | Family Households | Nonfamily Households |
| 1-Person Households | - | 15 (21.4%) |
| 2-Person Households | 50 (71.4%) | 0 (0.0%) |
| 3-Person Households | 5 (7.1%) | 0 (0.0%) |
| 4-Person Households | 0 (0.0%) | 0 (0.0%) |
| 5-Person Households | 0 (0.0%) | 0 (0.0%) |
| 6-Person Households | 0 (0.0%) | 0 (0.0%) |
| 7+ Person Households | 0 (0.0%) | 0 (0.0%) |
| Total | 55 (78.6%) | 15 (21.4%) |
Female Fertility in Pronghorn
Fertility by Age in Pronghorn
| Age Bracket | Women with Births | Births / 1,000 Women |
| 15 to 19 years | 0 (0.0%) | 0.0 |
| 20 to 34 years | 0 (0.0%) | 0.0 |
| 35 to 50 years | 0 (0.0%) | 0.0 |
| Total | 0 (0.0%) | 0.0 |
Fertility by Age by Marriage Status in Pronghorn
| Age Bracket | Married | Unmarried |
| 15 to 19 years | 0 (0.0%) | 0 (0.0%) |
| 20 to 34 years | 0 (0.0%) | 0 (0.0%) |
| 35 to 50 years | 0 (0.0%) | 0 (0.0%) |
| Total | 0 (0.0%) | 0 (0.0%) |
Fertility by Education in Pronghorn
| Educational Attainment | Women with Births | Births / 1,000 Women |
| Less than High School | 0 (0.0%) | 0.0 |
| High School Diploma | 0 (0.0%) | 0.0 |
| College or Associate's Degree | 0 (0.0%) | 0.0 |
| Bachelor's Degree | 0 (0.0%) | 0.0 |
| Graduate Degree | 0 (0.0%) | 0.0 |
| Total | 0 (0.0%) | 0.0 |
Fertility by Education by Marriage Status in Pronghorn
| Educational Attainment | Married | Unmarried |
| Less than High School | 0 (0.0%) | 0 (0.0%) |
| High School Diploma | 0 (0.0%) | 0 (0.0%) |
| College or Associate's Degree | 0 (0.0%) | 0 (0.0%) |
| Bachelor's Degree | 0 (0.0%) | 0 (0.0%) |
| Graduate Degree | 0 (0.0%) | 0 (0.0%) |
| Total | 0 (0.0%) | 0 (0.0%) |
Employment Characteristics in Pronghorn
Employment by Class of Employer in Pronghorn
Among the 109 employed individuals in Pronghorn, self-employed (incorporated) (84 | 77.1%), private company employees (13 | 11.9%), and self-employed (not incorporated) (12 | 11.0%) make up the most common classes of employment.
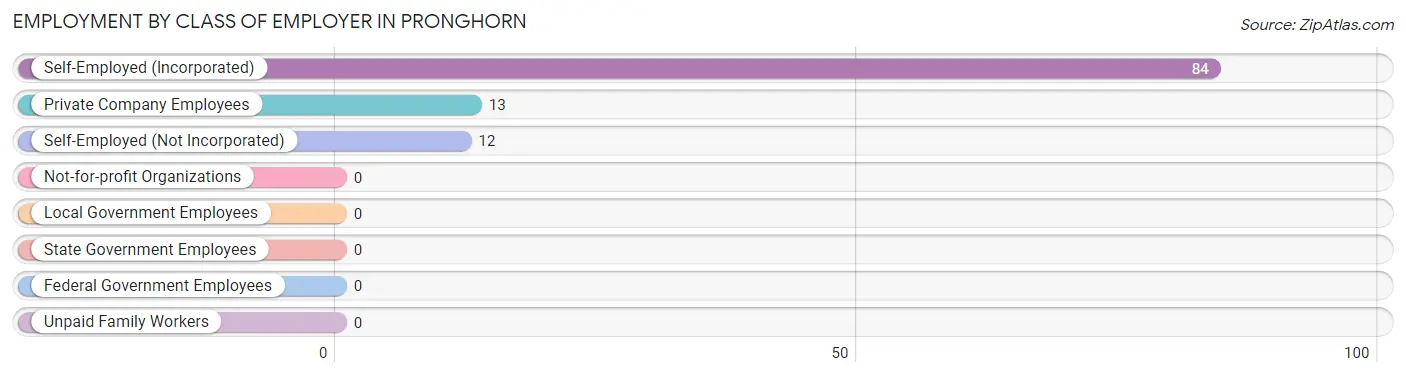
| Employer Class | # Employees | % Employees |
| Private Company Employees | 13 | 11.9% |
| Self-Employed (Incorporated) | 84 | 77.1% |
| Self-Employed (Not Incorporated) | 12 | 11.0% |
| Not-for-profit Organizations | 0 | 0.0% |
| Local Government Employees | 0 | 0.0% |
| State Government Employees | 0 | 0.0% |
| Federal Government Employees | 0 | 0.0% |
| Unpaid Family Workers | 0 | 0.0% |
| Total | 109 | 100.0% |
Employment Status by Age in Pronghorn
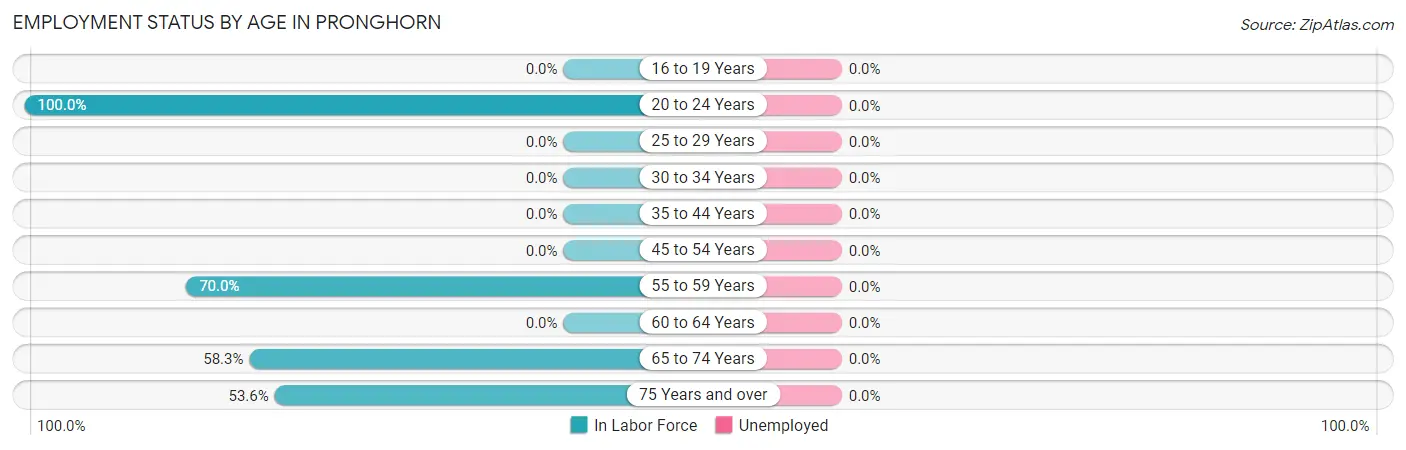
| Age Bracket | In Labor Force | Unemployed |
| 16 to 19 Years | 0 (0.0%) | 0 (0.0%) |
| 20 to 24 Years | 6 (100.0%) | 0 (0.0%) |
| 25 to 29 Years | 0 (0.0%) | 0 (0.0%) |
| 30 to 34 Years | 0 (0.0%) | 0 (0.0%) |
| 35 to 44 Years | 0 (0.0%) | 0 (0.0%) |
| 45 to 54 Years | 0 (0.0%) | 0 (0.0%) |
| 55 to 59 Years | 14 (70.0%) | 0 (0.0%) |
| 60 to 64 Years | 0 (0.0%) | 0 (0.0%) |
| 65 to 74 Years | 74 (58.3%) | 0 (0.0%) |
| 75 Years and over | 15 (53.6%) | 0 (0.0%) |
| Total | 109 (59.6%) | 0 (0.0%) |
Employment Status by Educational Attainment in Pronghorn
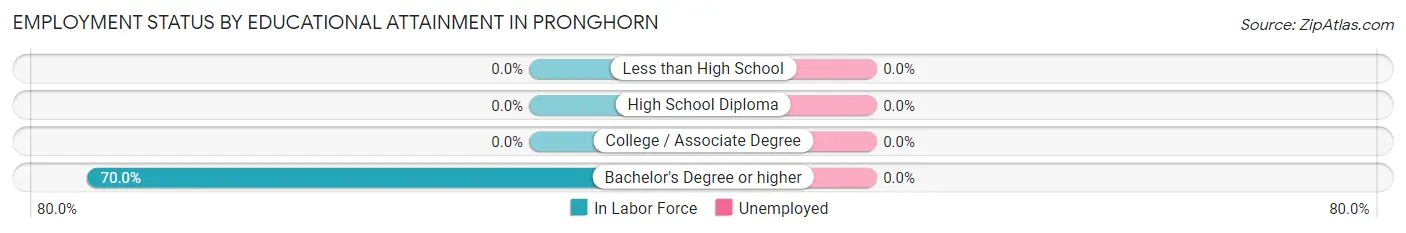
| Educational Attainment | In Labor Force | Unemployed |
| Less than High School | 0 (0.0%) | 0 (0.0%) |
| High School Diploma | 0 (0.0%) | 0 (0.0%) |
| College / Associate Degree | 0 (0.0%) | 0 (0.0%) |
| Bachelor's Degree or higher | 14 (70.0%) | 0 (0.0%) |
| Total | 14 (63.6%) | 0 (0.0%) |
Employment Occupations by Sex in Pronghorn
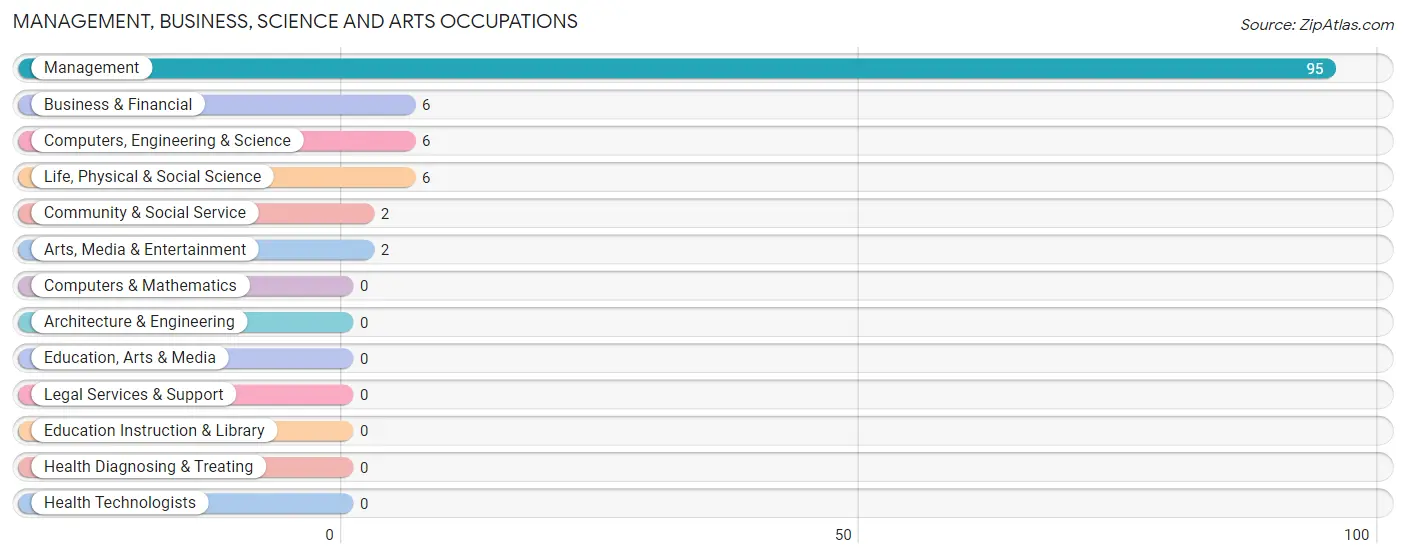
Management, Business, Science and Arts Occupations
The most common Management, Business, Science and Arts occupations in Pronghorn are Management (95 | 87.2%), Business & Financial (6 | 5.5%), Computers, Engineering & Science (6 | 5.5%), Life, Physical & Social Science (6 | 5.5%), and Community & Social Service (2 | 1.8%).
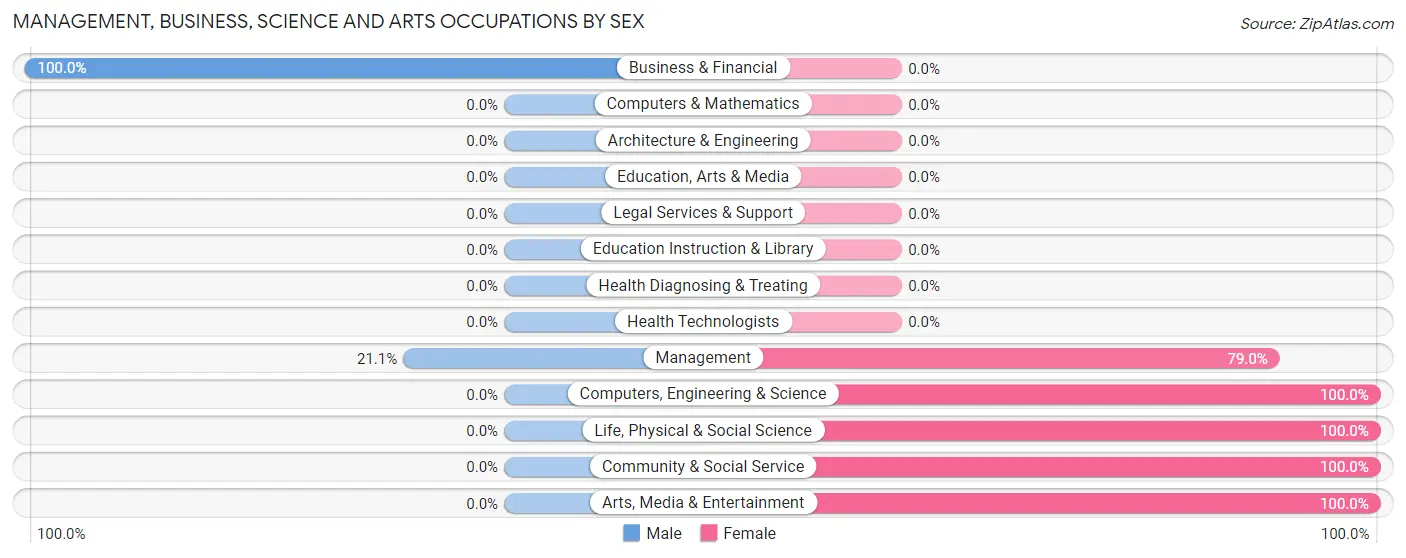
Management, Business, Science and Arts Occupations by Sex
Within the Management, Business, Science and Arts occupations in Pronghorn, the most male-oriented occupations are Business & Financial (100.0%), and Management (21.0%), while the most female-oriented occupations are Computers, Engineering & Science (100.0%), Life, Physical & Social Science (100.0%), and Community & Social Service (100.0%).
| Occupation | Male | Female |
| Management | 20 (21.0%) | 75 (78.9%) |
| Business & Financial | 6 (100.0%) | 0 (0.0%) |
| Computers, Engineering & Science | 0 (0.0%) | 6 (100.0%) |
| Computers & Mathematics | 0 (0.0%) | 0 (0.0%) |
| Architecture & Engineering | 0 (0.0%) | 0 (0.0%) |
| Life, Physical & Social Science | 0 (0.0%) | 6 (100.0%) |
| Community & Social Service | 0 (0.0%) | 2 (100.0%) |
| Education, Arts & Media | 0 (0.0%) | 0 (0.0%) |
| Legal Services & Support | 0 (0.0%) | 0 (0.0%) |
| Education Instruction & Library | 0 (0.0%) | 0 (0.0%) |
| Arts, Media & Entertainment | 0 (0.0%) | 2 (100.0%) |
| Health Diagnosing & Treating | 0 (0.0%) | 0 (0.0%) |
| Health Technologists | 0 (0.0%) | 0 (0.0%) |
| Total (Category) | 26 (23.8%) | 83 (76.1%) |
| Total (Overall) | 26 (23.8%) | 83 (76.1%) |
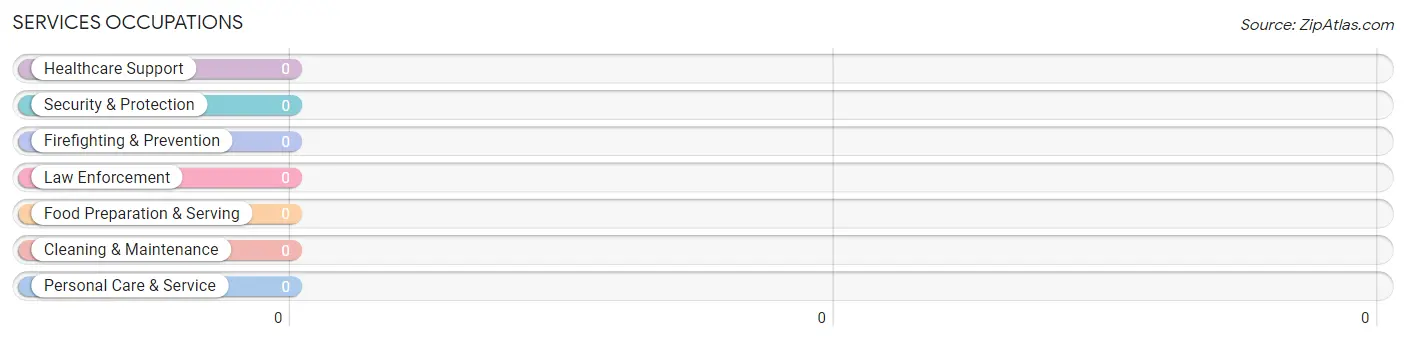
Services Occupations
Services Occupations by Sex
| Occupation | Male | Female |
| Healthcare Support | 0 (0.0%) | 0 (0.0%) |
| Security & Protection | 0 (0.0%) | 0 (0.0%) |
| Firefighting & Prevention | 0 (0.0%) | 0 (0.0%) |
| Law Enforcement | 0 (0.0%) | 0 (0.0%) |
| Food Preparation & Serving | 0 (0.0%) | 0 (0.0%) |
| Cleaning & Maintenance | 0 (0.0%) | 0 (0.0%) |
| Personal Care & Service | 0 (0.0%) | 0 (0.0%) |
| Total (Category) | 0 (0.0%) | 0 (0.0%) |
| Total (Overall) | 26 (23.8%) | 83 (76.1%) |
Sales and Office Occupations
Sales and Office Occupations by Sex
| Occupation | Male | Female |
| Sales & Related | 0 (0.0%) | 0 (0.0%) |
| Office & Administration | 0 (0.0%) | 0 (0.0%) |
| Total (Category) | 0 (0.0%) | 0 (0.0%) |
| Total (Overall) | 26 (23.8%) | 83 (76.1%) |
Natural Resources, Construction and Maintenance Occupations
Natural Resources, Construction and Maintenance Occupations by Sex
| Occupation | Male | Female |
| Farming, Fishing & Forestry | 0 (0.0%) | 0 (0.0%) |
| Construction & Extraction | 0 (0.0%) | 0 (0.0%) |
| Installation, Maintenance & Repair | 0 (0.0%) | 0 (0.0%) |
| Total (Category) | 0 (0.0%) | 0 (0.0%) |
| Total (Overall) | 26 (23.8%) | 83 (76.1%) |
Production, Transportation and Moving Occupations
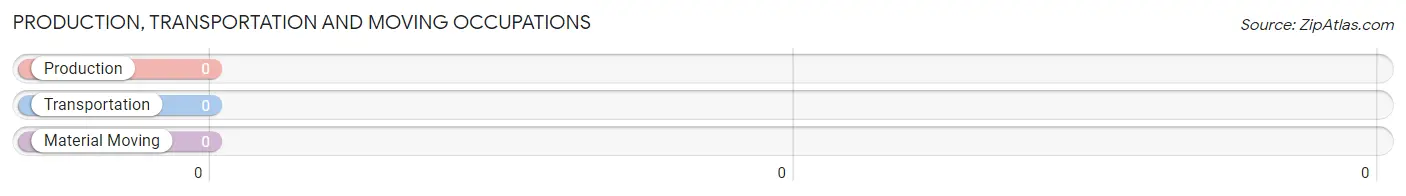
Production, Transportation and Moving Occupations by Sex
| Occupation | Male | Female |
| Production | 0 (0.0%) | 0 (0.0%) |
| Transportation | 0 (0.0%) | 0 (0.0%) |
| Material Moving | 0 (0.0%) | 0 (0.0%) |
| Total (Category) | 0 (0.0%) | 0 (0.0%) |
| Total (Overall) | 26 (23.8%) | 83 (76.1%) |
Employment Industries by Sex in Pronghorn
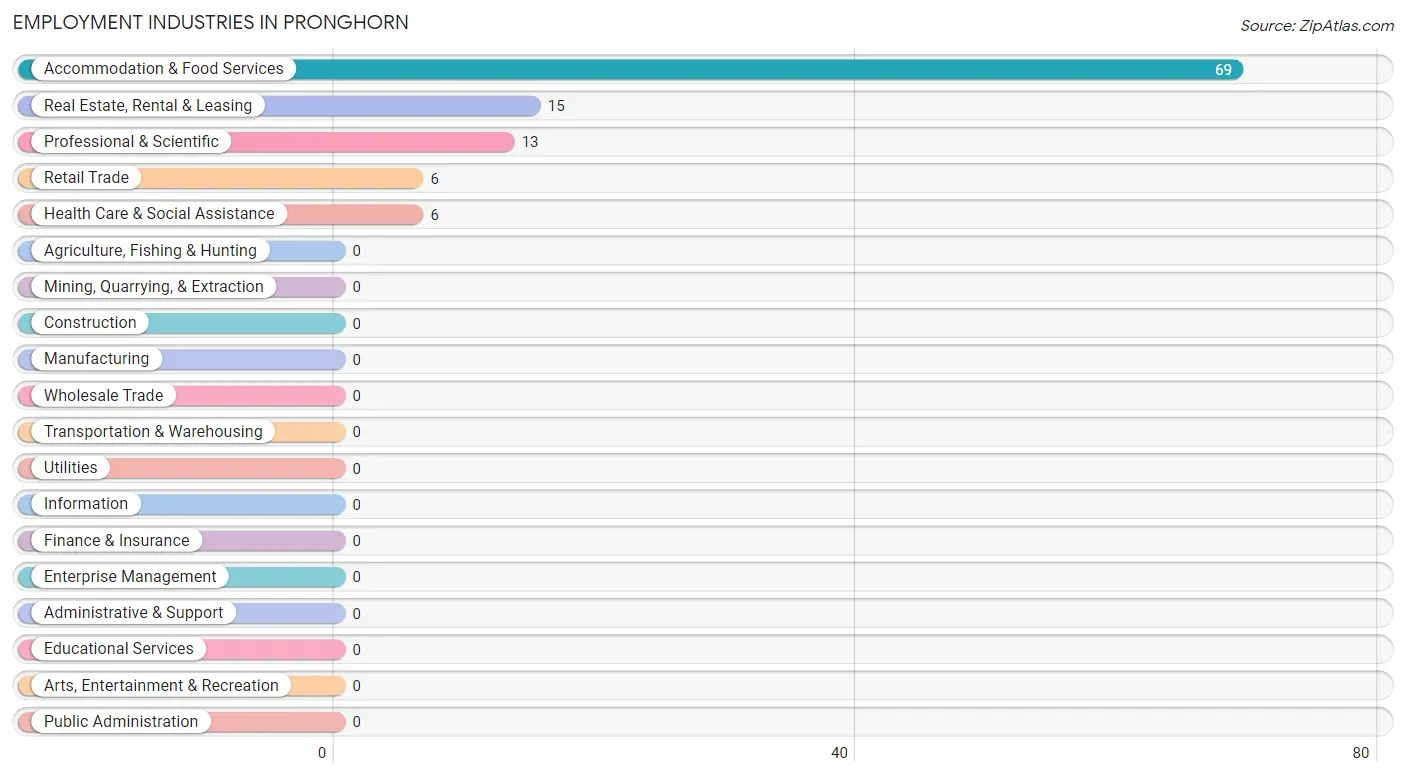
Employment Industries in Pronghorn
The major employment industries in Pronghorn include Accommodation & Food Services (69 | 63.3%), Real Estate, Rental & Leasing (15 | 13.8%), Professional & Scientific (13 | 11.9%), Retail Trade (6 | 5.5%), and Health Care & Social Assistance (6 | 5.5%).
Employment Industries by Sex in Pronghorn
The Pronghorn industries that see more men than women are Real Estate, Rental & Leasing (100.0%), and Professional & Scientific (84.6%), whereas the industries that tend to have a higher number of women are Retail Trade (100.0%), Health Care & Social Assistance (100.0%), and Accommodation & Food Services (100.0%).
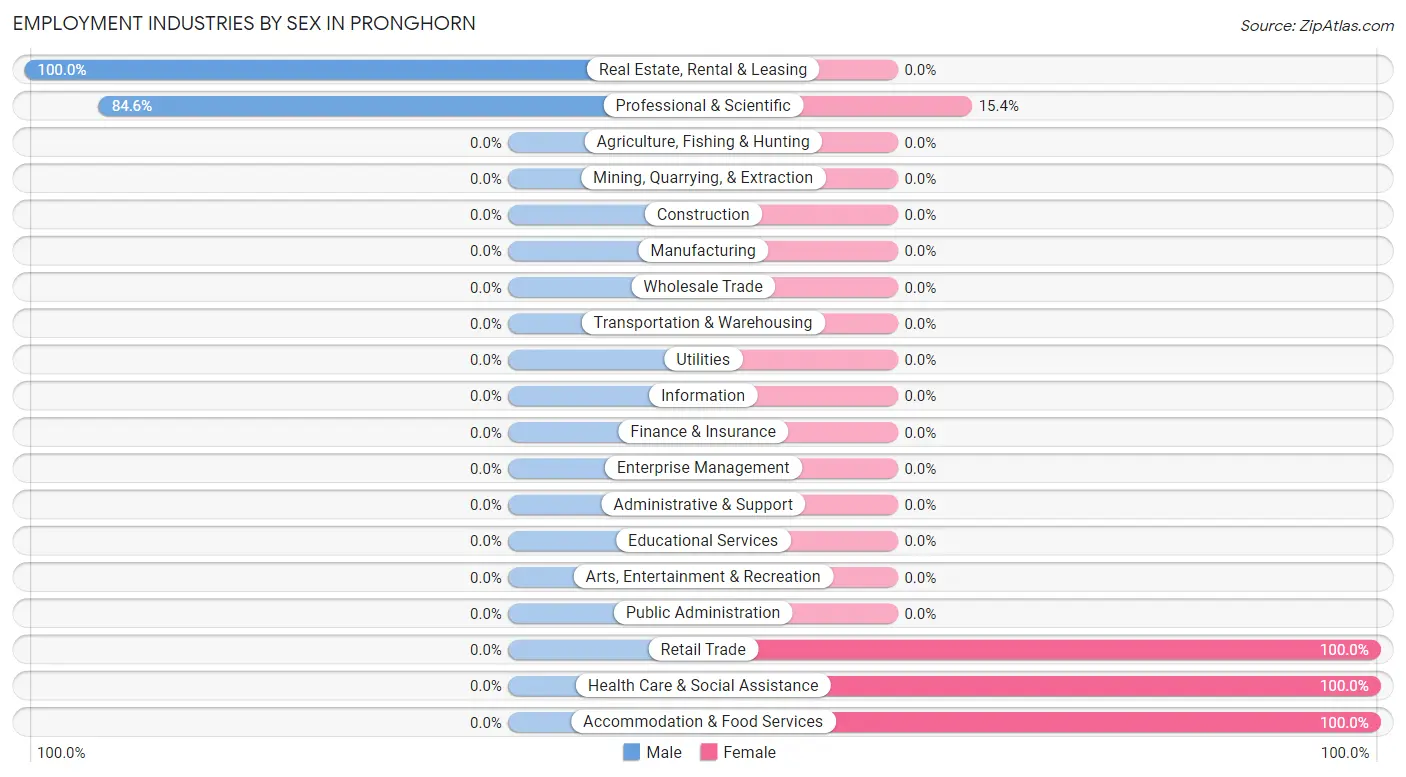
| Industry | Male | Female |
| Agriculture, Fishing & Hunting | 0 (0.0%) | 0 (0.0%) |
| Mining, Quarrying, & Extraction | 0 (0.0%) | 0 (0.0%) |
| Construction | 0 (0.0%) | 0 (0.0%) |
| Manufacturing | 0 (0.0%) | 0 (0.0%) |
| Wholesale Trade | 0 (0.0%) | 0 (0.0%) |
| Retail Trade | 0 (0.0%) | 6 (100.0%) |
| Transportation & Warehousing | 0 (0.0%) | 0 (0.0%) |
| Utilities | 0 (0.0%) | 0 (0.0%) |
| Information | 0 (0.0%) | 0 (0.0%) |
| Finance & Insurance | 0 (0.0%) | 0 (0.0%) |
| Real Estate, Rental & Leasing | 15 (100.0%) | 0 (0.0%) |
| Professional & Scientific | 11 (84.6%) | 2 (15.4%) |
| Enterprise Management | 0 (0.0%) | 0 (0.0%) |
| Administrative & Support | 0 (0.0%) | 0 (0.0%) |
| Educational Services | 0 (0.0%) | 0 (0.0%) |
| Health Care & Social Assistance | 0 (0.0%) | 6 (100.0%) |
| Arts, Entertainment & Recreation | 0 (0.0%) | 0 (0.0%) |
| Accommodation & Food Services | 0 (0.0%) | 69 (100.0%) |
| Public Administration | 0 (0.0%) | 0 (0.0%) |
| Total | 26 (23.8%) | 83 (76.1%) |
Education in Pronghorn
School Enrollment in Pronghorn
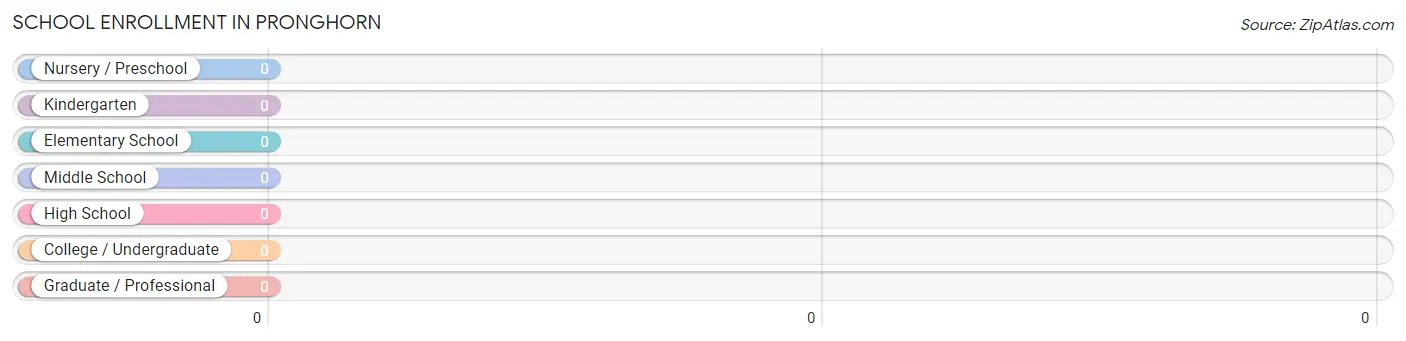
| School Level | # Students | % Students |
| Nursery / Preschool | 0 | 0.0% |
| Kindergarten | 0 | 0.0% |
| Elementary School | 0 | 0.0% |
| Middle School | 0 | 0.0% |
| High School | 0 | 0.0% |
| College / Undergraduate | 0 | 0.0% |
| Graduate / Professional | 0 | 0.0% |
| Total | 0 | 0.0% |
School Enrollment by Age by Funding Source in Pronghorn
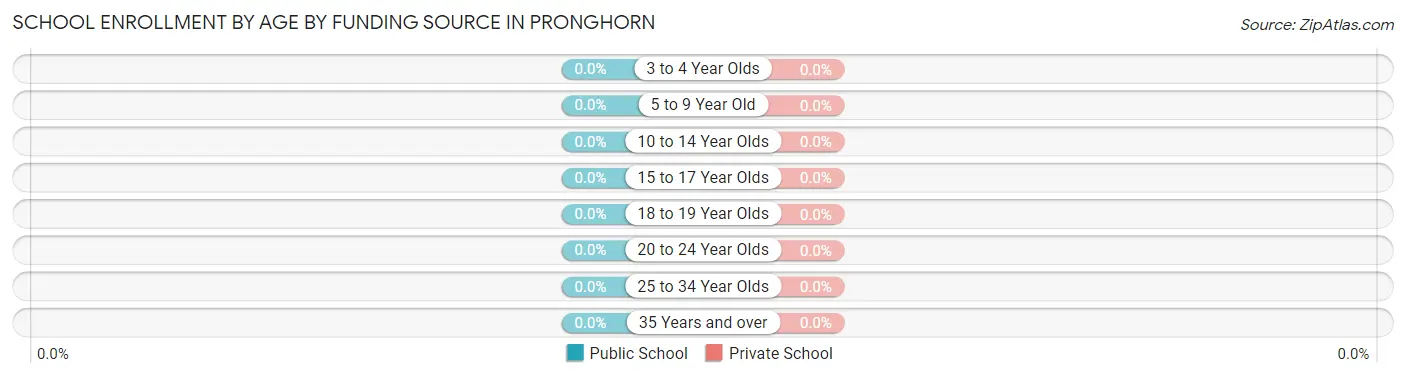
| Age Bracket | Public School | Private School |
| 3 to 4 Year Olds | 0 (0.0%) | 0 (0.0%) |
| 5 to 9 Year Old | 0 (0.0%) | 0 (0.0%) |
| 10 to 14 Year Olds | 0 (0.0%) | 0 (0.0%) |
| 15 to 17 Year Olds | 0 (0.0%) | 0 (0.0%) |
| 18 to 19 Year Olds | 0 (0.0%) | 0 (0.0%) |
| 20 to 24 Year Olds | 0 (0.0%) | 0 (0.0%) |
| 25 to 34 Year Olds | 0 (0.0%) | 0 (0.0%) |
| 35 Years and over | 0 (0.0%) | 0 (0.0%) |
| Total | 0 (0.0%) | 0 (0.0%) |
Educational Attainment by Field of Study in Pronghorn
Literature & languages (90 | 53.9%), business (27 | 16.2%), psychology (9 | 5.4%), science & technology (8 | 4.8%), and communications (8 | 4.8%) are the most common fields of study among 167 individuals in Pronghorn who have obtained a bachelor's degree or higher.
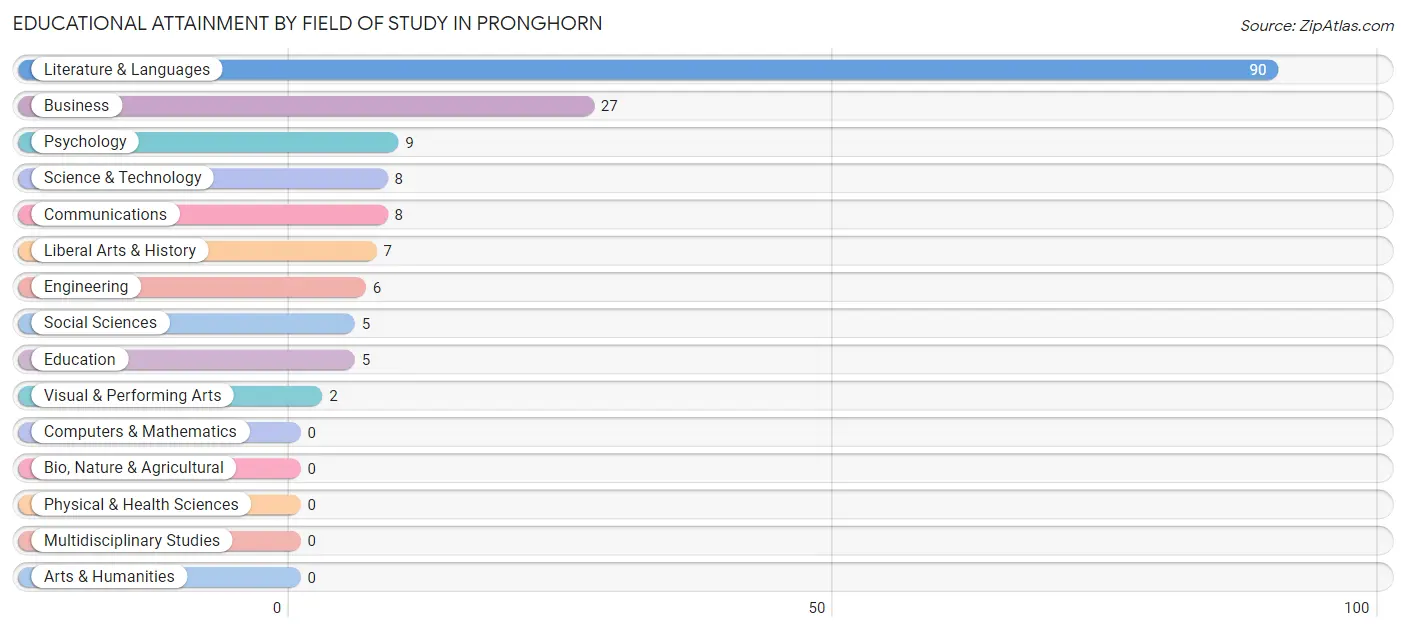
| Field of Study | # Graduates | % Graduates |
| Computers & Mathematics | 0 | 0.0% |
| Bio, Nature & Agricultural | 0 | 0.0% |
| Physical & Health Sciences | 0 | 0.0% |
| Psychology | 9 | 5.4% |
| Social Sciences | 5 | 3.0% |
| Engineering | 6 | 3.6% |
| Multidisciplinary Studies | 0 | 0.0% |
| Science & Technology | 8 | 4.8% |
| Business | 27 | 16.2% |
| Education | 5 | 3.0% |
| Literature & Languages | 90 | 53.9% |
| Liberal Arts & History | 7 | 4.2% |
| Visual & Performing Arts | 2 | 1.2% |
| Communications | 8 | 4.8% |
| Arts & Humanities | 0 | 0.0% |
| Total | 167 | 100.0% |
Transportation & Commute in Pronghorn
Vehicle Availability by Sex in Pronghorn
The most prevalent vehicle ownership categories in Pronghorn are males with 2 vehicles (21, accounting for 80.8%) and females with 2 vehicles (77, making up 25.3%).
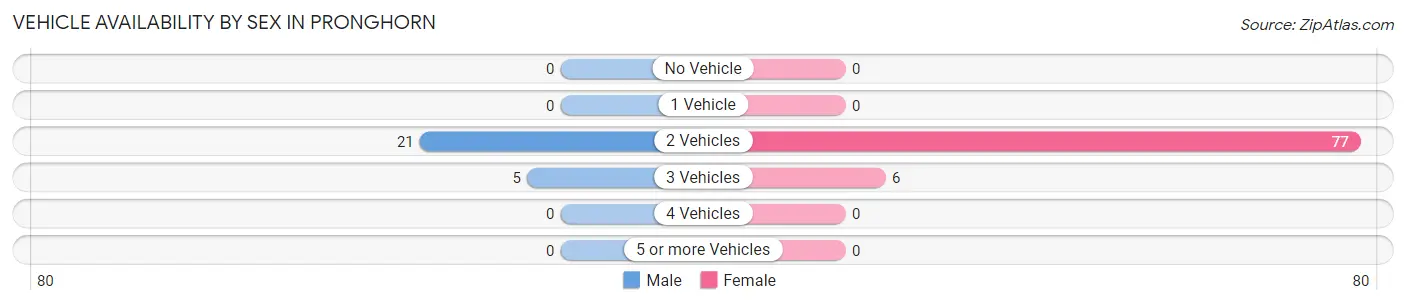
| Vehicles Available | Male | Female |
| No Vehicle | 0 (0.0%) | 0 (0.0%) |
| 1 Vehicle | 0 (0.0%) | 0 (0.0%) |
| 2 Vehicles | 21 (80.8%) | 77 (92.8%) |
| 3 Vehicles | 5 (19.2%) | 6 (7.2%) |
| 4 Vehicles | 0 (0.0%) | 0 (0.0%) |
| 5 or more Vehicles | 0 (0.0%) | 0 (0.0%) |
| Total | 26 (100.0%) | 83 (100.0%) |
Commute Time in Pronghorn
The most frequently occuring commute durations in Pronghorn are 30 to 34 minutes (80 commuters, 84.2%), less than 5 minutes (15 commuters, 15.8%), and 5 to 9 minutes (0 commuters, 0.0%).
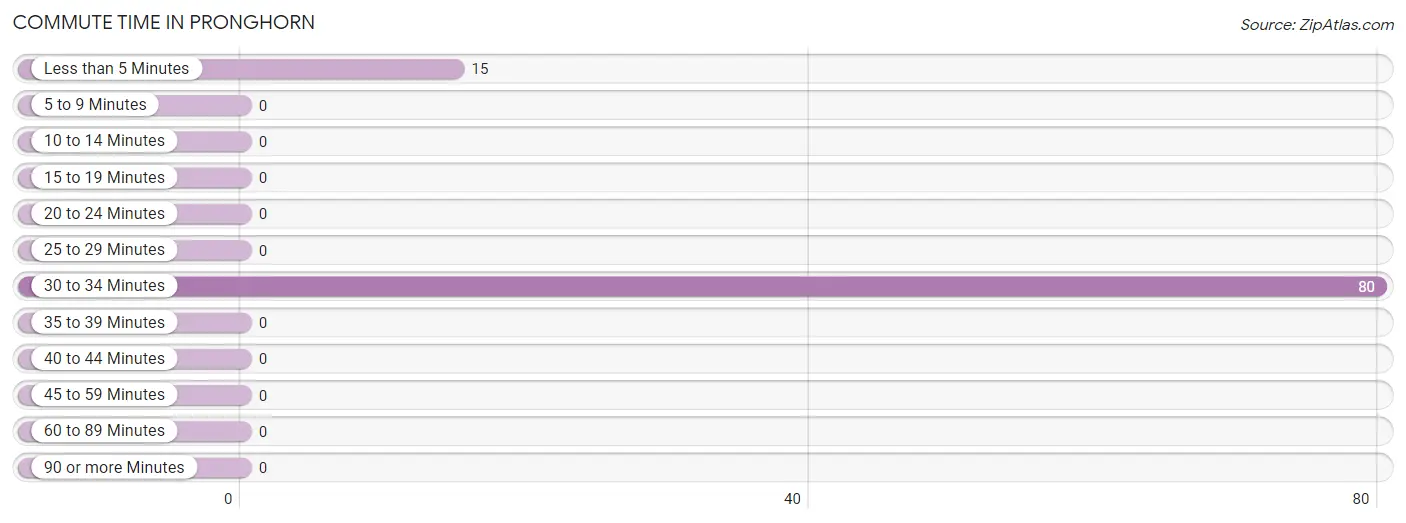
| Commute Time | # Commuters | % Commuters |
| Less than 5 Minutes | 15 | 15.8% |
| 5 to 9 Minutes | 0 | 0.0% |
| 10 to 14 Minutes | 0 | 0.0% |
| 15 to 19 Minutes | 0 | 0.0% |
| 20 to 24 Minutes | 0 | 0.0% |
| 25 to 29 Minutes | 0 | 0.0% |
| 30 to 34 Minutes | 80 | 84.2% |
| 35 to 39 Minutes | 0 | 0.0% |
| 40 to 44 Minutes | 0 | 0.0% |
| 45 to 59 Minutes | 0 | 0.0% |
| 60 to 89 Minutes | 0 | 0.0% |
| 90 or more Minutes | 0 | 0.0% |
Commute Time by Sex in Pronghorn
The most common commute times in Pronghorn are less than 5 minutes (15 commuters, 75.0%) for males and 30 to 34 minutes (75 commuters, 100.0%) for females.
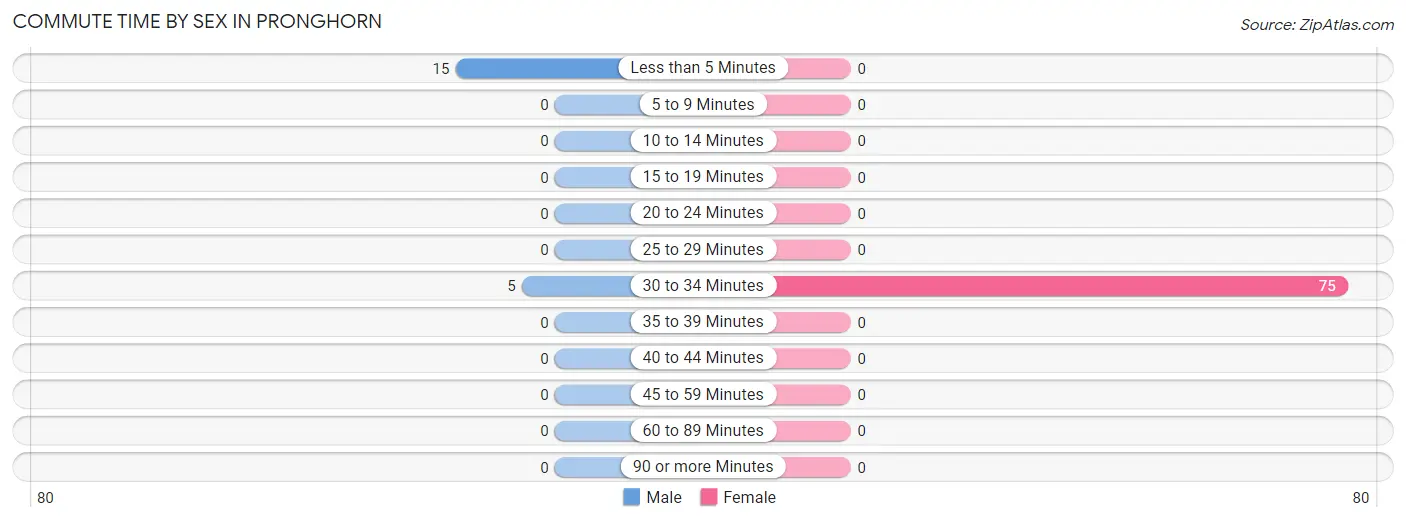
| Commute Time | Male | Female |
| Less than 5 Minutes | 15 (75.0%) | 0 (0.0%) |
| 5 to 9 Minutes | 0 (0.0%) | 0 (0.0%) |
| 10 to 14 Minutes | 0 (0.0%) | 0 (0.0%) |
| 15 to 19 Minutes | 0 (0.0%) | 0 (0.0%) |
| 20 to 24 Minutes | 0 (0.0%) | 0 (0.0%) |
| 25 to 29 Minutes | 0 (0.0%) | 0 (0.0%) |
| 30 to 34 Minutes | 5 (25.0%) | 75 (100.0%) |
| 35 to 39 Minutes | 0 (0.0%) | 0 (0.0%) |
| 40 to 44 Minutes | 0 (0.0%) | 0 (0.0%) |
| 45 to 59 Minutes | 0 (0.0%) | 0 (0.0%) |
| 60 to 89 Minutes | 0 (0.0%) | 0 (0.0%) |
| 90 or more Minutes | 0 (0.0%) | 0 (0.0%) |
Time of Departure to Work by Sex in Pronghorn
The most frequent times of departure to work in Pronghorn are 8:00 AM to 8:29 AM (15, 75.0%) for males and 8:00 AM to 8:29 AM (75, 100.0%) for females.
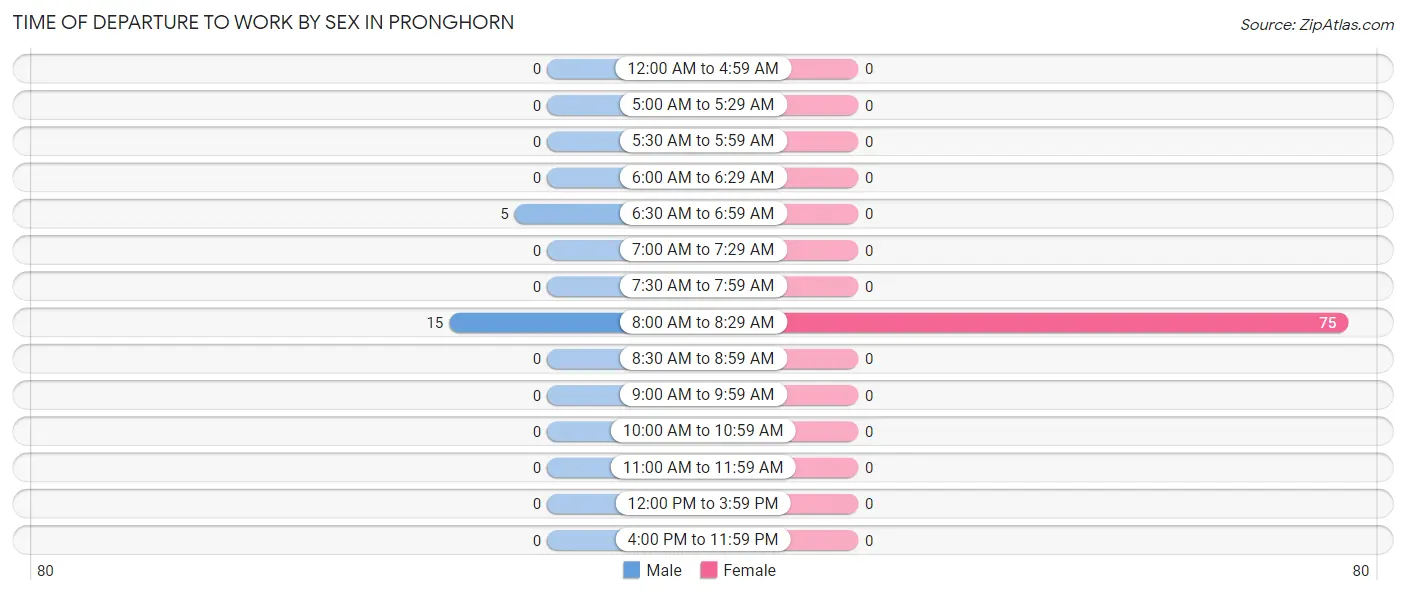
| Time of Departure | Male | Female |
| 12:00 AM to 4:59 AM | 0 (0.0%) | 0 (0.0%) |
| 5:00 AM to 5:29 AM | 0 (0.0%) | 0 (0.0%) |
| 5:30 AM to 5:59 AM | 0 (0.0%) | 0 (0.0%) |
| 6:00 AM to 6:29 AM | 0 (0.0%) | 0 (0.0%) |
| 6:30 AM to 6:59 AM | 5 (25.0%) | 0 (0.0%) |
| 7:00 AM to 7:29 AM | 0 (0.0%) | 0 (0.0%) |
| 7:30 AM to 7:59 AM | 0 (0.0%) | 0 (0.0%) |
| 8:00 AM to 8:29 AM | 15 (75.0%) | 75 (100.0%) |
| 8:30 AM to 8:59 AM | 0 (0.0%) | 0 (0.0%) |
| 9:00 AM to 9:59 AM | 0 (0.0%) | 0 (0.0%) |
| 10:00 AM to 10:59 AM | 0 (0.0%) | 0 (0.0%) |
| 11:00 AM to 11:59 AM | 0 (0.0%) | 0 (0.0%) |
| 12:00 PM to 3:59 PM | 0 (0.0%) | 0 (0.0%) |
| 4:00 PM to 11:59 PM | 0 (0.0%) | 0 (0.0%) |
| Total | 20 (100.0%) | 75 (100.0%) |
Housing Occupancy in Pronghorn
Occupancy by Ownership in Pronghorn
Of the total 70 dwellings in Pronghorn, owner-occupied units account for 70 (100.0%), while renter-occupied units make up 0 (0.0%).
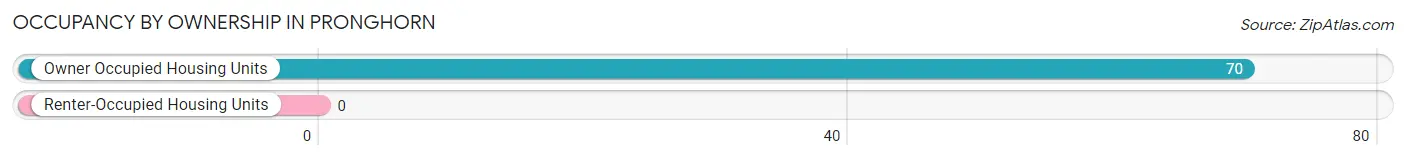
| Occupancy | # Housing Units | % Housing Units |
| Owner Occupied Housing Units | 70 | 100.0% |
| Renter-Occupied Housing Units | 0 | 0.0% |
| Total Occupied Housing Units | 70 | 100.0% |
Occupancy by Household Size in Pronghorn
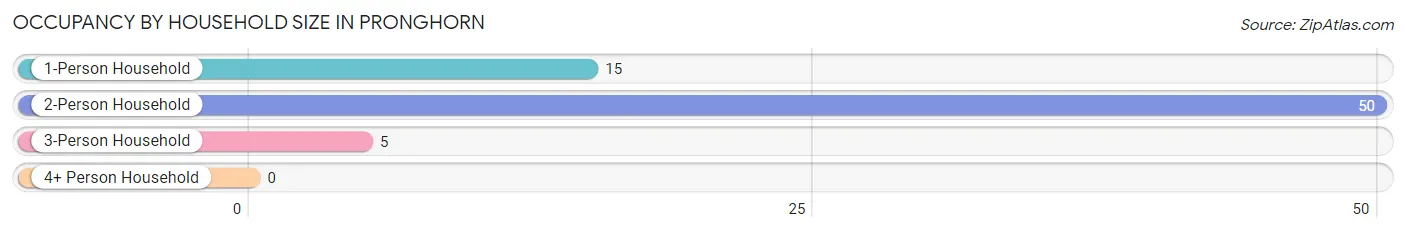
| Household Size | # Housing Units | % Housing Units |
| 1-Person Household | 15 | 21.4% |
| 2-Person Household | 50 | 71.4% |
| 3-Person Household | 5 | 7.1% |
| 4+ Person Household | 0 | 0.0% |
| Total Housing Units | 70 | 100.0% |
Occupancy by Ownership by Household Size in Pronghorn
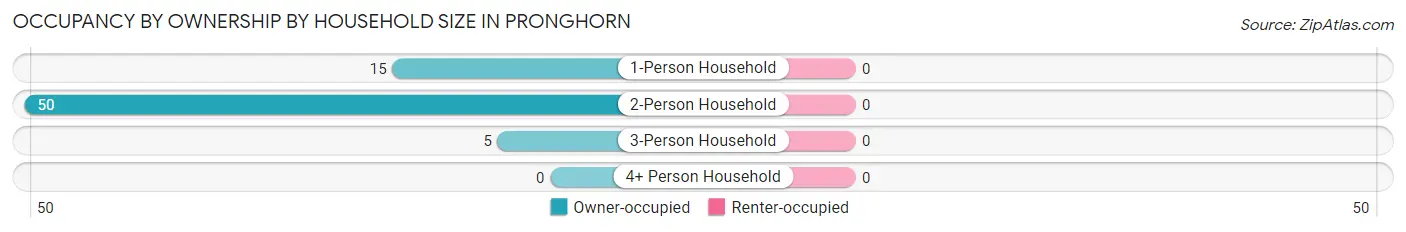
| Household Size | Owner-occupied | Renter-occupied |
| 1-Person Household | 15 (100.0%) | 0 (0.0%) |
| 2-Person Household | 50 (100.0%) | 0 (0.0%) |
| 3-Person Household | 5 (100.0%) | 0 (0.0%) |
| 4+ Person Household | 0 (0.0%) | 0 (0.0%) |
| Total Housing Units | 70 (100.0%) | 0 (0.0%) |
Occupancy by Educational Attainment in Pronghorn
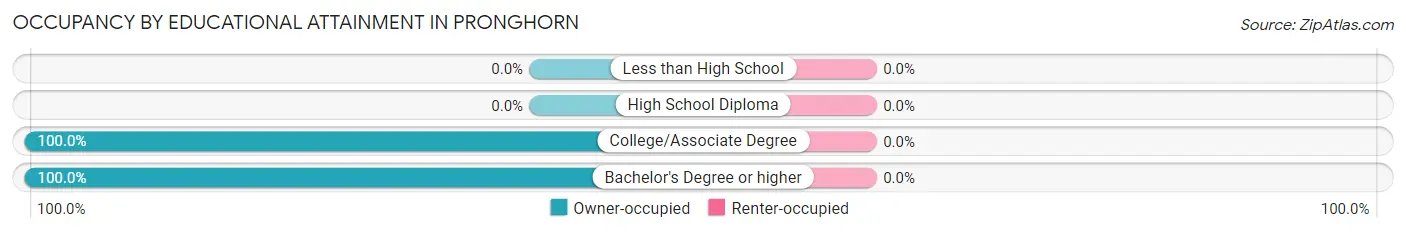
| Household Size | Owner-occupied | Renter-occupied |
| Less than High School | 0 (0.0%) | 0 (0.0%) |
| High School Diploma | 0 (0.0%) | 0 (0.0%) |
| College/Associate Degree | 10 (100.0%) | 0 (0.0%) |
| Bachelor's Degree or higher | 60 (100.0%) | 0 (0.0%) |
Occupancy by Age of Householder in Pronghorn
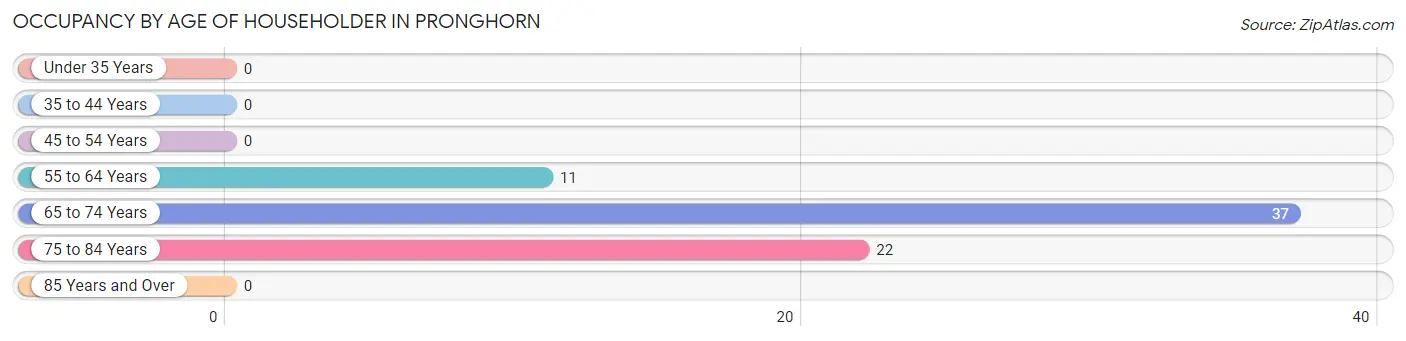
| Age Bracket | # Households | % Households |
| Under 35 Years | 0 | 0.0% |
| 35 to 44 Years | 0 | 0.0% |
| 45 to 54 Years | 0 | 0.0% |
| 55 to 64 Years | 11 | 15.7% |
| 65 to 74 Years | 37 | 52.9% |
| 75 to 84 Years | 22 | 31.4% |
| 85 Years and Over | 0 | 0.0% |
| Total | 70 | 100.0% |
Housing Finances in Pronghorn
Median Income by Occupancy in Pronghorn
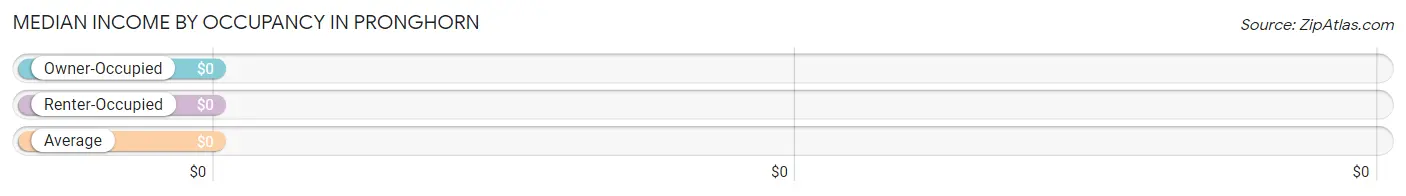
| Occupancy Type | # Households | Median Income |
| Owner-Occupied | 70 (100.0%) | $0 |
| Renter-Occupied | 0 (0.0%) | $0 |
| Average | 70 (100.0%) | $0 |
Occupancy by Householder Income Bracket in Pronghorn
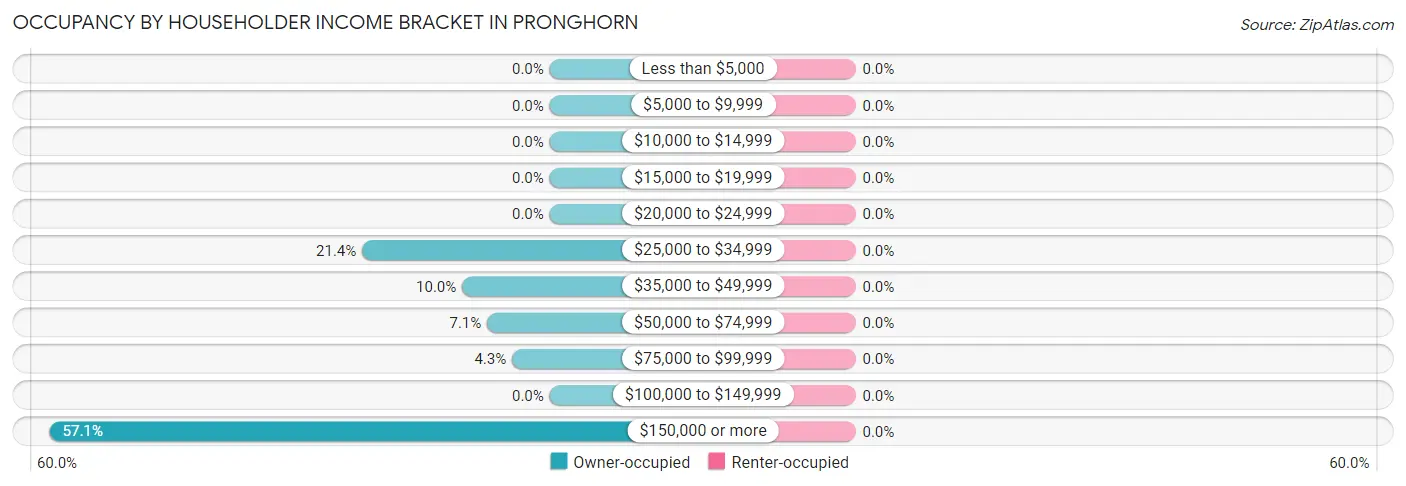
| Income Bracket | Owner-occupied | Renter-occupied |
| Less than $5,000 | 0 (0.0%) | 0 (0.0%) |
| $5,000 to $9,999 | 0 (0.0%) | 0 (0.0%) |
| $10,000 to $14,999 | 0 (0.0%) | 0 (0.0%) |
| $15,000 to $19,999 | 0 (0.0%) | 0 (0.0%) |
| $20,000 to $24,999 | 0 (0.0%) | 0 (0.0%) |
| $25,000 to $34,999 | 15 (21.4%) | 0 (0.0%) |
| $35,000 to $49,999 | 7 (10.0%) | 0 (0.0%) |
| $50,000 to $74,999 | 5 (7.1%) | 0 (0.0%) |
| $75,000 to $99,999 | 3 (4.3%) | 0 (0.0%) |
| $100,000 to $149,999 | 0 (0.0%) | 0 (0.0%) |
| $150,000 or more | 40 (57.1%) | 0 (0.0%) |
| Total | 70 (100.0%) | 0 (0.0%) |
Monthly Housing Cost Tiers in Pronghorn
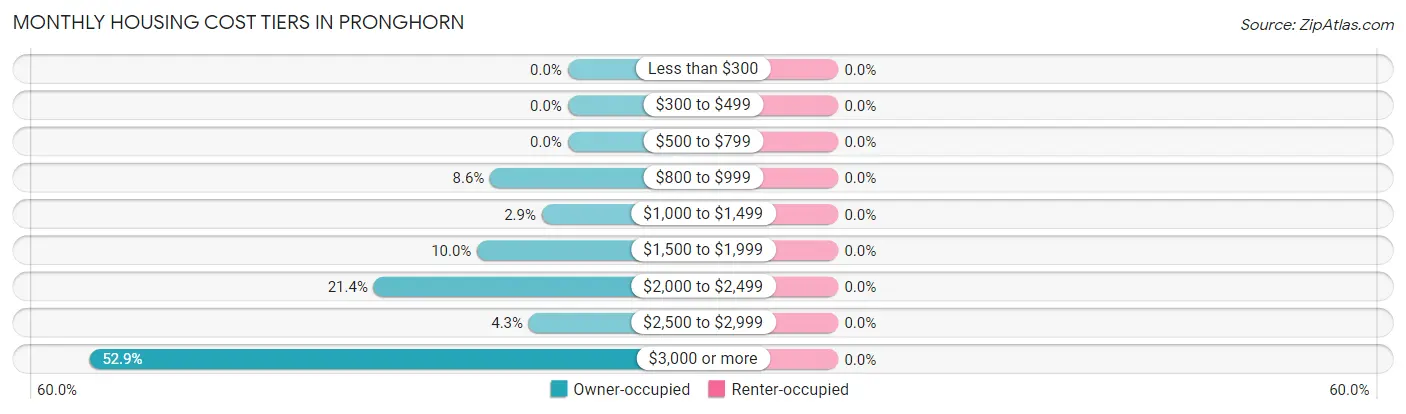
| Monthly Cost | Owner-occupied | Renter-occupied |
| Less than $300 | 0 (0.0%) | 0 (0.0%) |
| $300 to $499 | 0 (0.0%) | 0 (0.0%) |
| $500 to $799 | 0 (0.0%) | 0 (0.0%) |
| $800 to $999 | 6 (8.6%) | 0 (0.0%) |
| $1,000 to $1,499 | 2 (2.9%) | 0 (0.0%) |
| $1,500 to $1,999 | 7 (10.0%) | 0 (0.0%) |
| $2,000 to $2,499 | 15 (21.4%) | 0 (0.0%) |
| $2,500 to $2,999 | 3 (4.3%) | 0 (0.0%) |
| $3,000 or more | 37 (52.9%) | 0 (0.0%) |
| Total | 70 (100.0%) | 0 (0.0%) |
Physical Housing Characteristics in Pronghorn
Housing Structures in Pronghorn
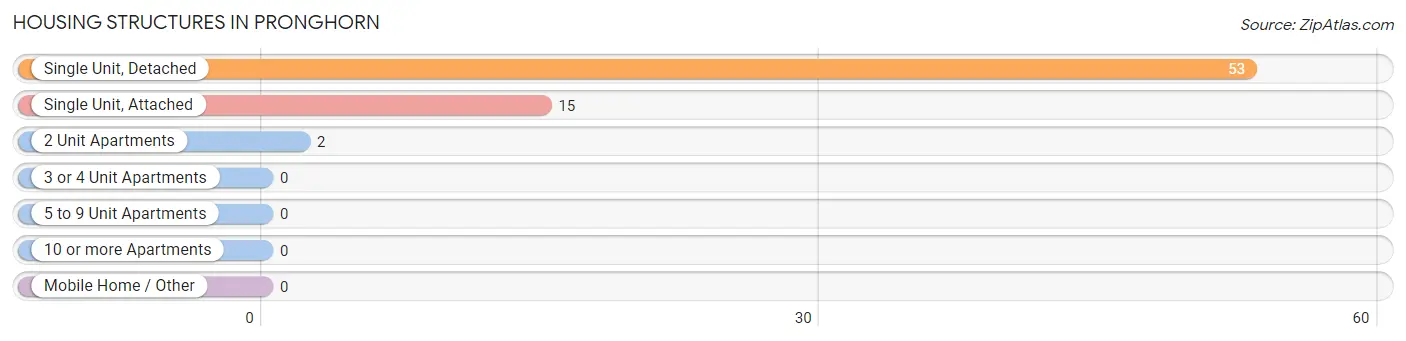
| Structure Type | # Housing Units | % Housing Units |
| Single Unit, Detached | 53 | 75.7% |
| Single Unit, Attached | 15 | 21.4% |
| 2 Unit Apartments | 2 | 2.9% |
| 3 or 4 Unit Apartments | 0 | 0.0% |
| 5 to 9 Unit Apartments | 0 | 0.0% |
| 10 or more Apartments | 0 | 0.0% |
| Mobile Home / Other | 0 | 0.0% |
| Total | 70 | 100.0% |
Housing Structures by Occupancy in Pronghorn
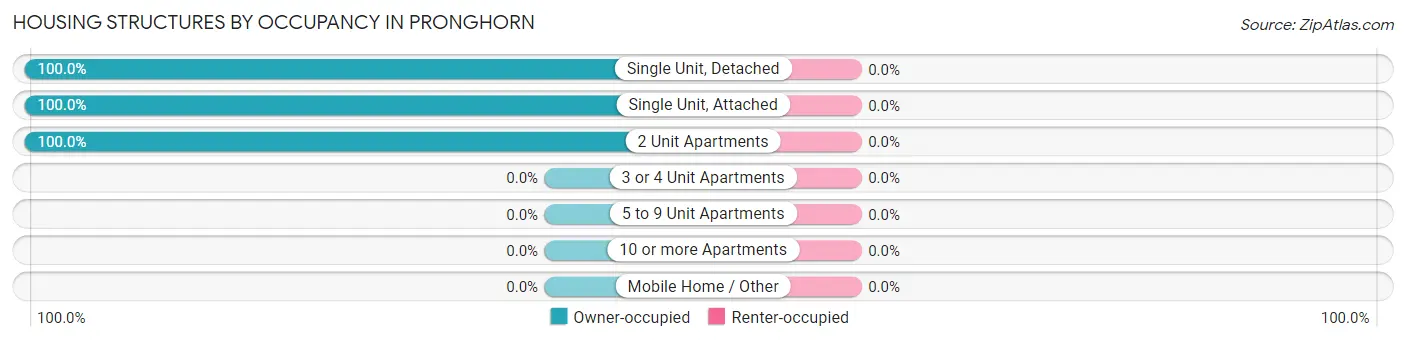
| Structure Type | Owner-occupied | Renter-occupied |
| Single Unit, Detached | 53 (100.0%) | 0 (0.0%) |
| Single Unit, Attached | 15 (100.0%) | 0 (0.0%) |
| 2 Unit Apartments | 2 (100.0%) | 0 (0.0%) |
| 3 or 4 Unit Apartments | 0 (0.0%) | 0 (0.0%) |
| 5 to 9 Unit Apartments | 0 (0.0%) | 0 (0.0%) |
| 10 or more Apartments | 0 (0.0%) | 0 (0.0%) |
| Mobile Home / Other | 0 (0.0%) | 0 (0.0%) |
| Total | 70 (100.0%) | 0 (0.0%) |
Housing Structures by Number of Rooms in Pronghorn
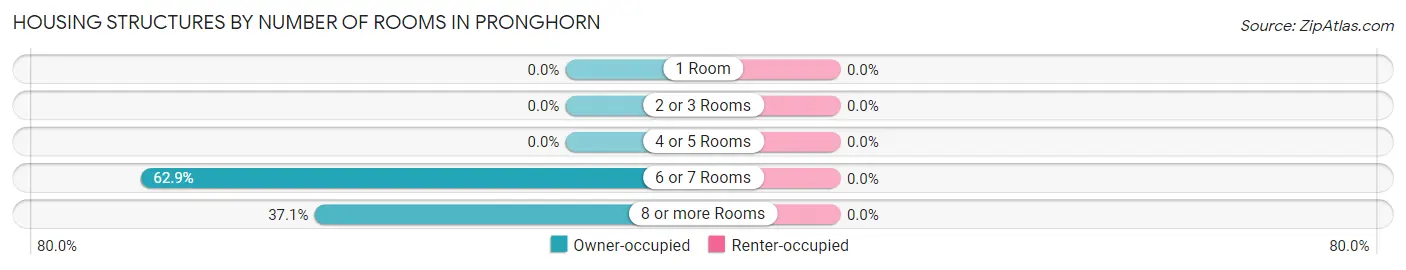
| Number of Rooms | Owner-occupied | Renter-occupied |
| 1 Room | 0 (0.0%) | 0 (0.0%) |
| 2 or 3 Rooms | 0 (0.0%) | 0 (0.0%) |
| 4 or 5 Rooms | 0 (0.0%) | 0 (0.0%) |
| 6 or 7 Rooms | 44 (62.9%) | 0 (0.0%) |
| 8 or more Rooms | 26 (37.1%) | 0 (0.0%) |
| Total | 70 (100.0%) | 0 (0.0%) |
Housing Structure by Heating Type in Pronghorn
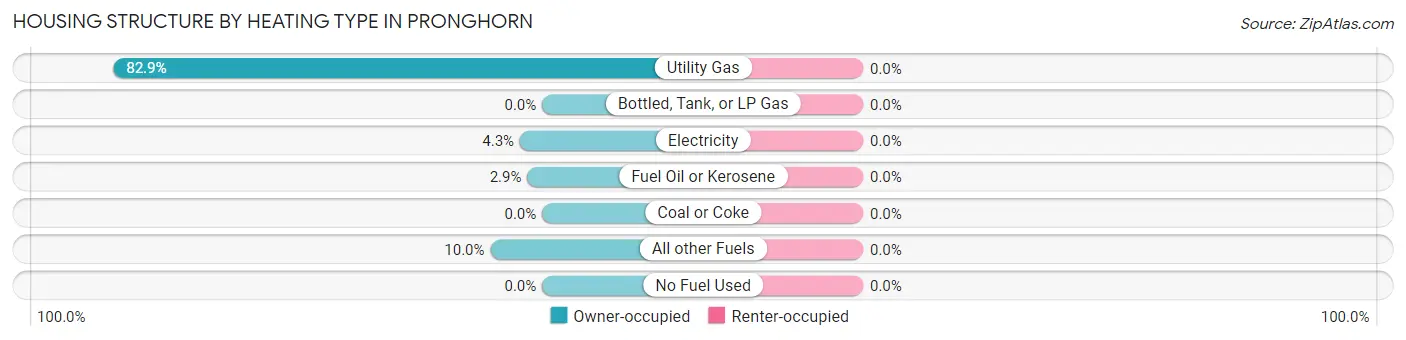
| Heating Type | Owner-occupied | Renter-occupied |
| Utility Gas | 58 (82.9%) | 0 (0.0%) |
| Bottled, Tank, or LP Gas | 0 (0.0%) | 0 (0.0%) |
| Electricity | 3 (4.3%) | 0 (0.0%) |
| Fuel Oil or Kerosene | 2 (2.9%) | 0 (0.0%) |
| Coal or Coke | 0 (0.0%) | 0 (0.0%) |
| All other Fuels | 7 (10.0%) | 0 (0.0%) |
| No Fuel Used | 0 (0.0%) | 0 (0.0%) |
| Total | 70 (100.0%) | 0 (0.0%) |
Household Vehicle Usage in Pronghorn
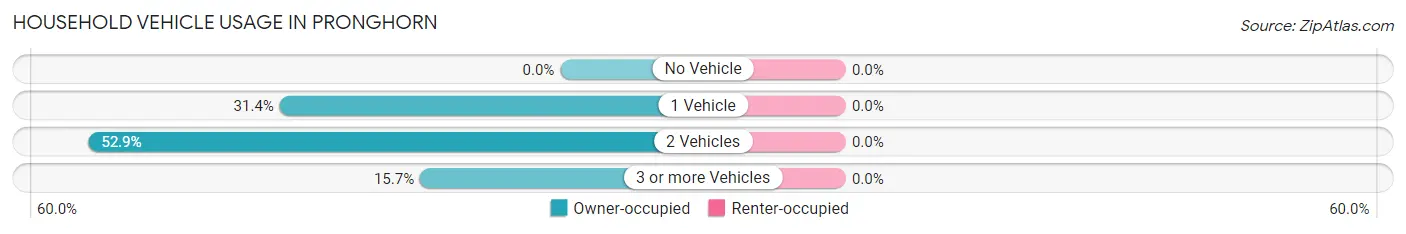
| Vehicles per Household | Owner-occupied | Renter-occupied |
| No Vehicle | 0 (0.0%) | 0 (0.0%) |
| 1 Vehicle | 22 (31.4%) | 0 (0.0%) |
| 2 Vehicles | 37 (52.9%) | 0 (0.0%) |
| 3 or more Vehicles | 11 (15.7%) | 0 (0.0%) |
| Total | 70 (100.0%) | 0 (0.0%) |
Real Estate & Mortgages in Pronghorn
Real Estate and Mortgage Overview in Pronghorn
| Characteristic | Without Mortgage | With Mortgage |
| Housing Units | 36 | 34 |
| Median Property Value | $1,150,000 | $1,402,200 |
| Median Household Income | $250,001 | $13 |
| Monthly Housing Costs | $1,501 | $31 |
| Real Estate Taxes | $8,864 | $0 |
Property Value by Mortgage Status in Pronghorn
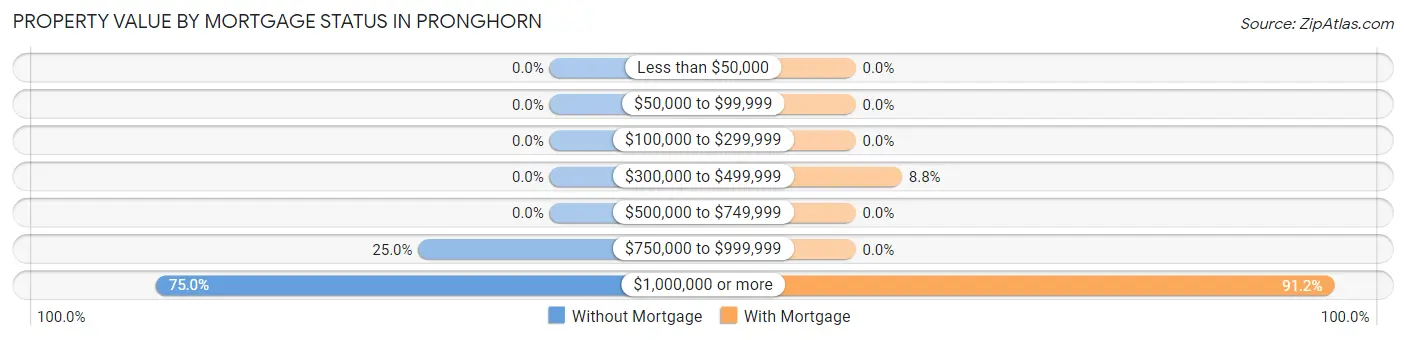
| Property Value | Without Mortgage | With Mortgage |
| Less than $50,000 | 0 (0.0%) | 0 (0.0%) |
| $50,000 to $99,999 | 0 (0.0%) | 0 (0.0%) |
| $100,000 to $299,999 | 0 (0.0%) | 0 (0.0%) |
| $300,000 to $499,999 | 0 (0.0%) | 3 (8.8%) |
| $500,000 to $749,999 | 0 (0.0%) | 0 (0.0%) |
| $750,000 to $999,999 | 9 (25.0%) | 0 (0.0%) |
| $1,000,000 or more | 27 (75.0%) | 31 (91.2%) |
| Total | 36 (100.0%) | 34 (100.0%) |
Household Income by Mortgage Status in Pronghorn
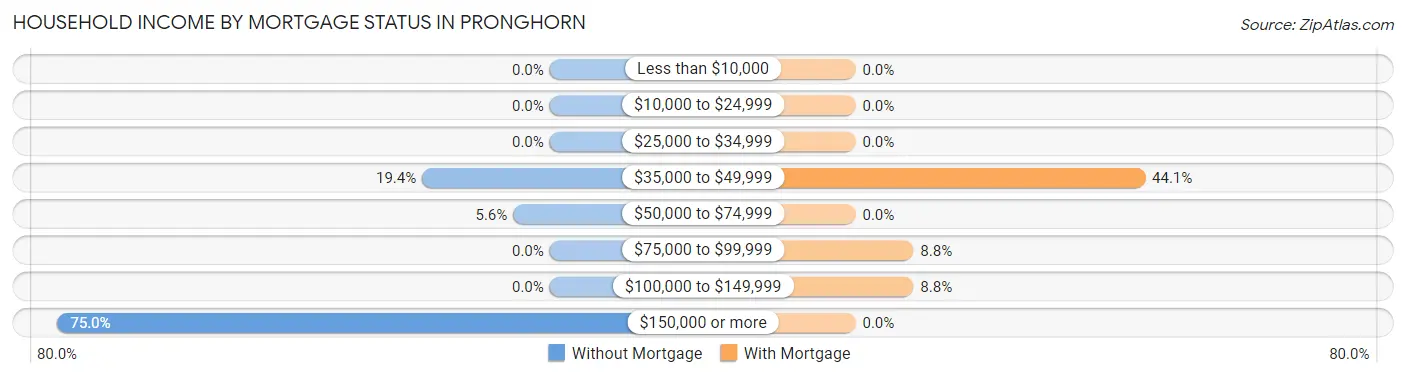
| Household Income | Without Mortgage | With Mortgage |
| Less than $10,000 | 0 (0.0%) | 0 (0.0%) |
| $10,000 to $24,999 | 0 (0.0%) | 0 (0.0%) |
| $25,000 to $34,999 | 0 (0.0%) | 0 (0.0%) |
| $35,000 to $49,999 | 7 (19.4%) | 15 (44.1%) |
| $50,000 to $74,999 | 2 (5.6%) | 0 (0.0%) |
| $75,000 to $99,999 | 0 (0.0%) | 3 (8.8%) |
| $100,000 to $149,999 | 0 (0.0%) | 3 (8.8%) |
| $150,000 or more | 27 (75.0%) | 0 (0.0%) |
| Total | 36 (100.0%) | 34 (100.0%) |
Property Value to Household Income Ratio in Pronghorn
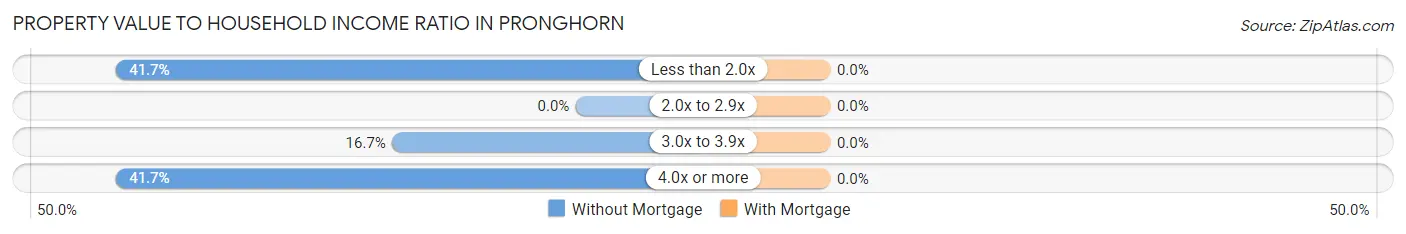
| Value-to-Income Ratio | Without Mortgage | With Mortgage |
| Less than 2.0x | 15 (41.7%) | 0 (0.0%) |
| 2.0x to 2.9x | 0 (0.0%) | 0 (0.0%) |
| 3.0x to 3.9x | 6 (16.7%) | 0 (0.0%) |
| 4.0x or more | 15 (41.7%) | 0 (0.0%) |
| Total | 36 (100.0%) | 34 (100.0%) |
Real Estate Taxes by Mortgage Status in Pronghorn
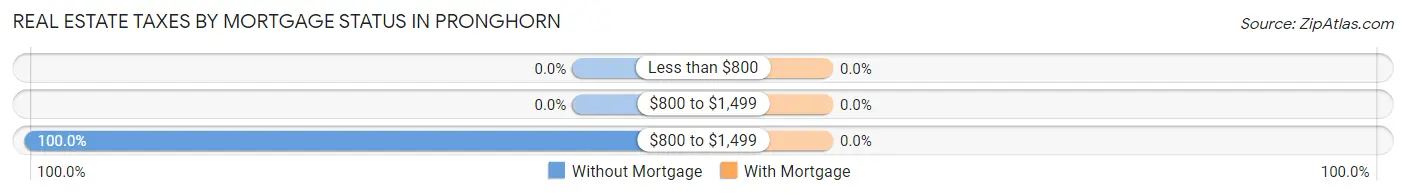
| Property Taxes | Without Mortgage | With Mortgage |
| Less than $800 | 0 (0.0%) | 0 (0.0%) |
| $800 to $1,499 | 0 (0.0%) | 0 (0.0%) |
| $800 to $1,499 | 36 (100.0%) | 0 (0.0%) |
| Total | 36 (100.0%) | 34 (100.0%) |
Health & Disability in Pronghorn
Health Insurance Coverage by Age in Pronghorn
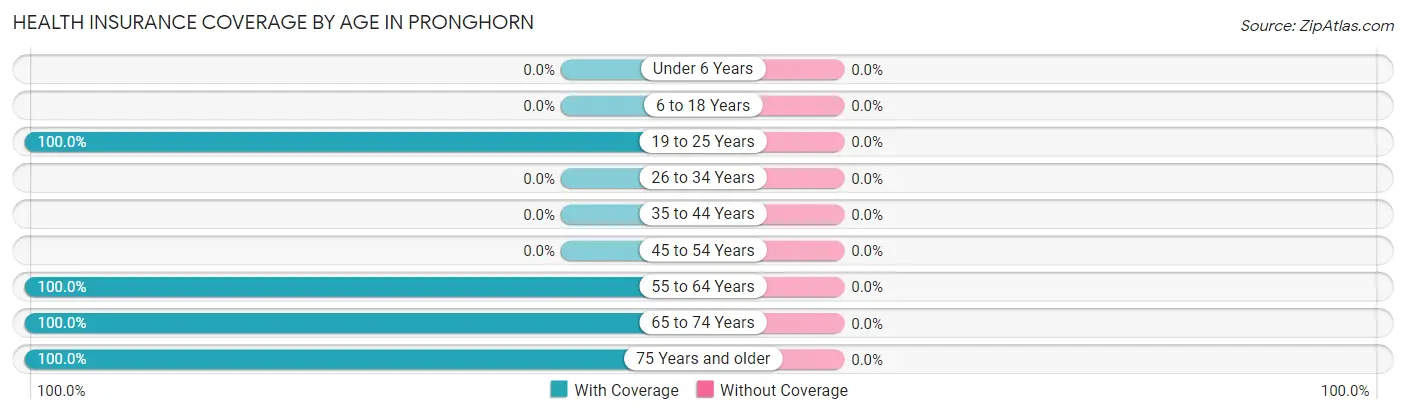
| Age Bracket | With Coverage | Without Coverage |
| Under 6 Years | 0 (0.0%) | 0 (0.0%) |
| 6 to 18 Years | 0 (0.0%) | 0 (0.0%) |
| 19 to 25 Years | 6 (100.0%) | 0 (0.0%) |
| 26 to 34 Years | 0 (0.0%) | 0 (0.0%) |
| 35 to 44 Years | 0 (0.0%) | 0 (0.0%) |
| 45 to 54 Years | 0 (0.0%) | 0 (0.0%) |
| 55 to 64 Years | 22 (100.0%) | 0 (0.0%) |
| 65 to 74 Years | 127 (100.0%) | 0 (0.0%) |
| 75 Years and older | 28 (100.0%) | 0 (0.0%) |
| Total | 183 (100.0%) | 0 (0.0%) |
Health Insurance Coverage by Citizenship Status in Pronghorn
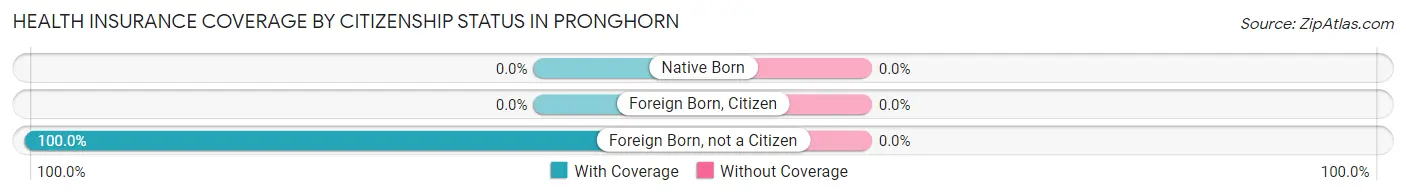
| Citizenship Status | With Coverage | Without Coverage |
| Native Born | 0 (0.0%) | 0 (0.0%) |
| Foreign Born, Citizen | 0 (0.0%) | 0 (0.0%) |
| Foreign Born, not a Citizen | 6 (100.0%) | 0 (0.0%) |
Health Insurance Coverage by Household Income in Pronghorn
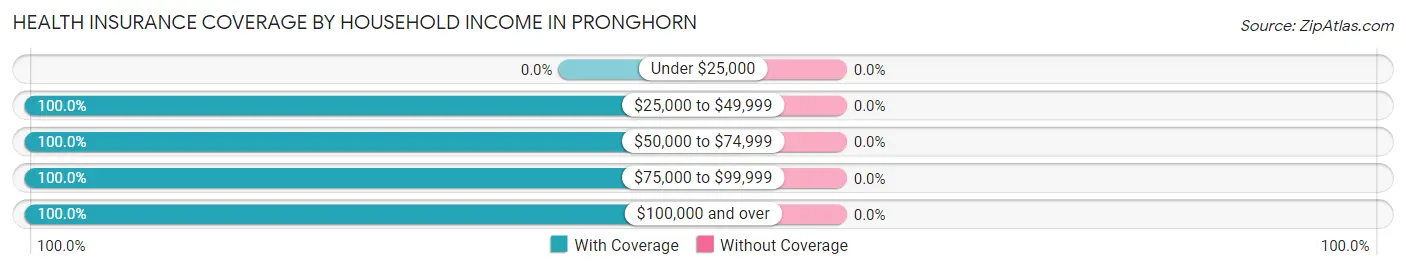
| Household Income | With Coverage | Without Coverage |
| Under $25,000 | 0 (0.0%) | 0 (0.0%) |
| $25,000 to $49,999 | 28 (100.0%) | 0 (0.0%) |
| $50,000 to $74,999 | 10 (100.0%) | 0 (0.0%) |
| $75,000 to $99,999 | 6 (100.0%) | 0 (0.0%) |
| $100,000 and over | 139 (100.0%) | 0 (0.0%) |
Public vs Private Health Insurance Coverage by Age in Pronghorn
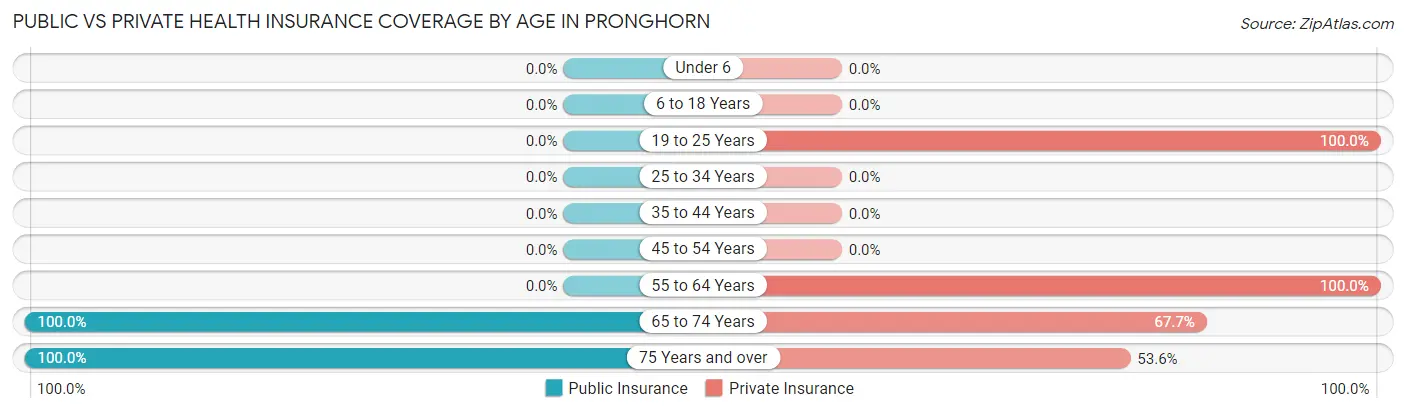
| Age Bracket | Public Insurance | Private Insurance |
| Under 6 | 0 (0.0%) | 0 (0.0%) |
| 6 to 18 Years | 0 (0.0%) | 0 (0.0%) |
| 19 to 25 Years | 0 (0.0%) | 6 (100.0%) |
| 25 to 34 Years | 0 (0.0%) | 0 (0.0%) |
| 35 to 44 Years | 0 (0.0%) | 0 (0.0%) |
| 45 to 54 Years | 0 (0.0%) | 0 (0.0%) |
| 55 to 64 Years | 0 (0.0%) | 22 (100.0%) |
| 65 to 74 Years | 127 (100.0%) | 86 (67.7%) |
| 75 Years and over | 28 (100.0%) | 15 (53.6%) |
| Total | 155 (84.7%) | 129 (70.5%) |
Disability Status by Sex by Age in Pronghorn
| Age Bracket | Male | Female |
| Under 5 Years | 0 (0.0%) | 0 (0.0%) |
| 5 to 17 Years | 0 (0.0%) | 0 (0.0%) |
| 18 to 34 Years | 0 (0.0%) | 0 (0.0%) |
| 35 to 64 Years | 0 (0.0%) | 0 (0.0%) |
| 65 to 74 Years | 0 (0.0%) | 5 (4.8%) |
| 75 Years and over | 0 (0.0%) | 6 (100.0%) |
Disability Class by Sex by Age in Pronghorn
Disability Class: Hearing Difficulty
| Age Bracket | Male | Female |
| Under 5 Years | 0 (0.0%) | 0 (0.0%) |
| 5 to 17 Years | 0 (0.0%) | 0 (0.0%) |
| 18 to 34 Years | 0 (0.0%) | 0 (0.0%) |
| 35 to 64 Years | 0 (0.0%) | 0 (0.0%) |
| 65 to 74 Years | 0 (0.0%) | 0 (0.0%) |
| 75 Years and over | 0 (0.0%) | 0 (0.0%) |
Disability Class: Vision Difficulty
| Age Bracket | Male | Female |
| Under 5 Years | 0 (0.0%) | 0 (0.0%) |
| 5 to 17 Years | 0 (0.0%) | 0 (0.0%) |
| 18 to 34 Years | 0 (0.0%) | 0 (0.0%) |
| 35 to 64 Years | 0 (0.0%) | 0 (0.0%) |
| 65 to 74 Years | 0 (0.0%) | 0 (0.0%) |
| 75 Years and over | 0 (0.0%) | 0 (0.0%) |
Disability Class: Cognitive Difficulty
| Age Bracket | Male | Female |
| 5 to 17 Years | 0 (0.0%) | 0 (0.0%) |
| 18 to 34 Years | 0 (0.0%) | 0 (0.0%) |
| 35 to 64 Years | 0 (0.0%) | 0 (0.0%) |
| 65 to 74 Years | 0 (0.0%) | 0 (0.0%) |
| 75 Years and over | 0 (0.0%) | 0 (0.0%) |
Disability Class: Ambulatory Difficulty
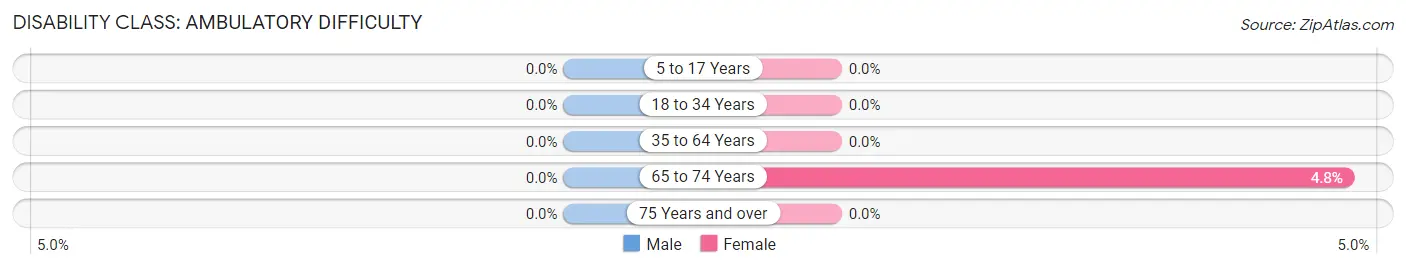
| Age Bracket | Male | Female |
| 5 to 17 Years | 0 (0.0%) | 0 (0.0%) |
| 18 to 34 Years | 0 (0.0%) | 0 (0.0%) |
| 35 to 64 Years | 0 (0.0%) | 0 (0.0%) |
| 65 to 74 Years | 0 (0.0%) | 5 (4.8%) |
| 75 Years and over | 0 (0.0%) | 0 (0.0%) |
Disability Class: Self-Care Difficulty
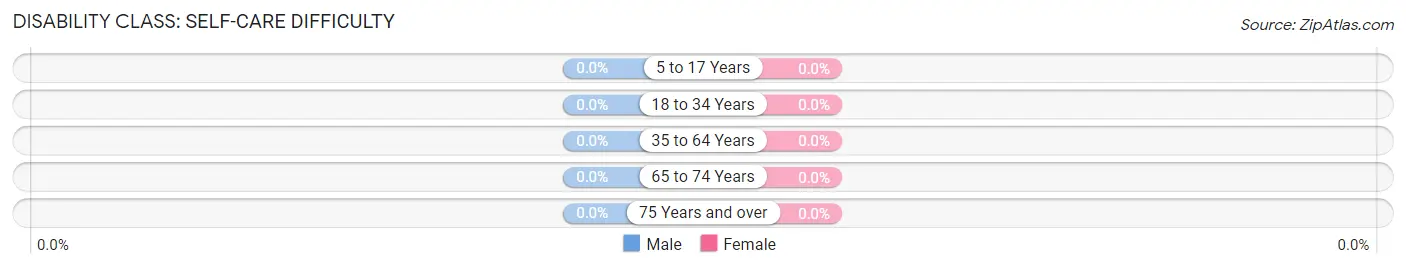
| Age Bracket | Male | Female |
| 5 to 17 Years | 0 (0.0%) | 0 (0.0%) |
| 18 to 34 Years | 0 (0.0%) | 0 (0.0%) |
| 35 to 64 Years | 0 (0.0%) | 0 (0.0%) |
| 65 to 74 Years | 0 (0.0%) | 0 (0.0%) |
| 75 Years and over | 0 (0.0%) | 0 (0.0%) |
Technology Access in Pronghorn
Computing Device Access in Pronghorn
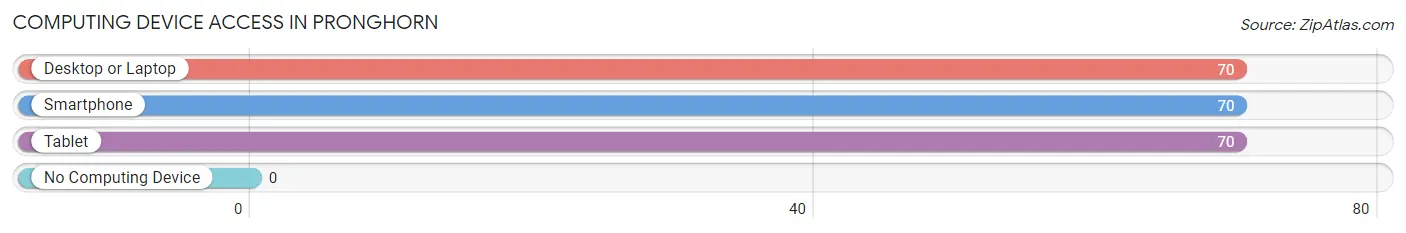
| Device Type | # Households | % Households |
| Desktop or Laptop | 70 | 100.0% |
| Smartphone | 70 | 100.0% |
| Tablet | 70 | 100.0% |
| No Computing Device | 0 | 0.0% |
| Total | 70 | 100.0% |
Internet Access in Pronghorn
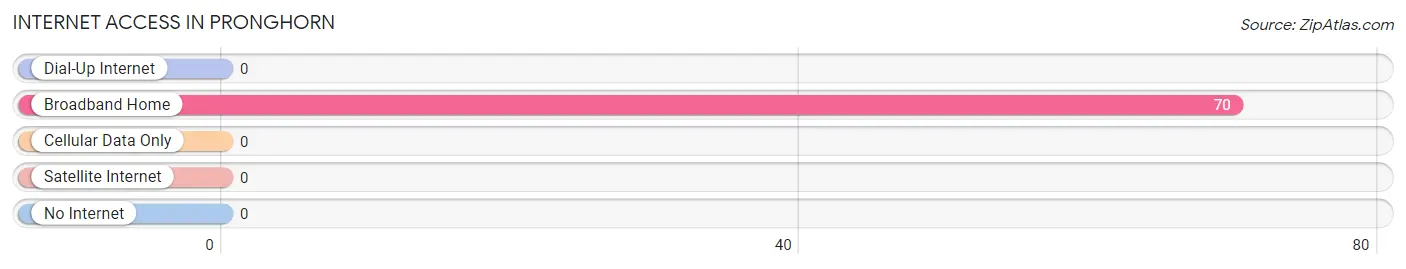
| Internet Type | # Households | % Households |
| Dial-Up Internet | 0 | 0.0% |
| Broadband Home | 70 | 100.0% |
| Cellular Data Only | 0 | 0.0% |
| Satellite Internet | 0 | 0.0% |
| No Internet | 0 | 0.0% |
| Total | 70 | 100.0% |
Pronghorn Summary
Pronghorn, Oregon is a small town located in the high desert of Central Oregon. It is situated in the foothills of the Cascade Mountains, about 30 miles east of Bend. The town was founded in the late 1800s and has a population of about 1,000 people.
History
Pronghorn, Oregon was founded in 1883 by a group of settlers from the Midwest. The town was named after the pronghorn antelope, which were plentiful in the area at the time. The settlers were attracted to the area by the abundance of natural resources, including timber, water, and minerals.
The town quickly grew and by the early 1900s, it had become a bustling center of commerce and industry. The town was home to several sawmills, a flour mill, a brickyard, and a number of other businesses. The town also had a railroad station, which connected it to the rest of the state.
In the 1920s, the town began to decline as the timber industry moved away and the railroad station closed. The town was further impacted by the Great Depression and World War II. By the 1950s, the population had dropped to just over 500 people.
Geography
Pronghorn, Oregon is located in the high desert of Central Oregon. It is situated in the foothills of the Cascade Mountains, about 30 miles east of Bend. The town is surrounded by rolling hills and sagebrush-covered plains. The area is known for its dry climate and hot summers.
The town is located at an elevation of 3,400 feet and is situated on the banks of the Deschutes River. The river is a popular destination for fishing, rafting, and kayaking. The area is also home to a variety of wildlife, including deer, elk, and pronghorn antelope.
Economy
Pronghorn, Oregon is a small town with a limited economy. The town is home to a few small businesses, including a grocery store, a hardware store, and a few restaurants. The town also has a few small manufacturing businesses, including a woodworking shop and a metal fabrication shop.
The town is also home to a number of tourist attractions, including the Deschutes River, the Cascade Mountains, and the nearby Pronghorn National Wildlife Refuge. The refuge is home to a variety of wildlife, including pronghorn antelope, deer, elk, and bighorn sheep.
Demographics
As of the 2010 census, the population of Pronghorn, Oregon was 1,000 people. The town is predominantly white, with about 90% of the population identifying as Caucasian. The town also has a small Hispanic population, with about 5% of the population identifying as Hispanic or Latino.
The median household income in Pronghorn is $41,000, which is slightly lower than the national average. The town has a poverty rate of about 10%, which is slightly higher than the national average. The town also has a high rate of unemployment, with about 15% of the population unemployed.
Common Questions
What is Per Capita Income in Pronghorn?
Per Capita income in Pronghorn is $127,585.
What is the Median Family Income in Pronghorn?
Median Family Income in Pronghorn is $250,001.
What is Income or Wage Gap in Pronghorn?
Income or Wage Gap in Pronghorn is 99.0%.
Women in Pronghorn earn 1.0 cents for every dollar earned by a man.
What is Inequality or Gini Index in Pronghorn?
Inequality or Gini Index in Pronghorn is 0.53.
What is the Total Population of Pronghorn?
Total Population of Pronghorn is 183.
What is the Total Male Population of Pronghorn?
Total Male Population of Pronghorn is 55.
What is the Total Female Population of Pronghorn?
Total Female Population of Pronghorn is 128.
What is the Ratio of Males per 100 Females in Pronghorn?
There are 42.97 Males per 100 Females in Pronghorn.
What is the Ratio of Females per 100 Males in Pronghorn?
There are 232.73 Females per 100 Males in Pronghorn.
What is the Median Population Age in Pronghorn?
Median Population Age in Pronghorn is 72.2 Years.
What is the Average Family Size in Pronghorn
Average Family Size in Pronghorn is 3.0 People.
What is the Average Household Size in Pronghorn
Average Household Size in Pronghorn is 2.6 People.
How Large is the Labor Force in Pronghorn?
There are 109 People in the Labor Forcein in Pronghorn.
What is the Percentage of People in the Labor Force in Pronghorn?
59.6% of People are in the Labor Force in Pronghorn.