Brenda, AZ Map & Demographics
Brenda Map
Brenda Overview
$29,442
PER CAPITA INCOME
$51,114
AVG FAMILY INCOME
$49,040
AVG HOUSEHOLD INCOME
0.26
INEQUALITY / GINI INDEX
716
TOTAL POPULATION
340
MALE POPULATION
376
FEMALE POPULATION
90.43
MALES / 100 FEMALES
110.59
FEMALES / 100 MALES
76.5
MEDIAN AGE
2.1
AVG FAMILY SIZE
1.8
AVG HOUSEHOLD SIZE
93
LABOR FORCE [ PEOPLE ]
13.2%
PERCENT IN LABOR FORCE
Income in Brenda
Income Overview in Brenda
Per Capita Income in Brenda is $29,442, while median incomes of families and households are $51,114 and $49,040 respectively.
| Characteristic | Number | Measure |
| Per Capita Income | 716 | $29,442 |
| Median Family Income | 263 | $51,114 |
| Mean Family Income | 263 | $57,766 |
| Median Household Income | 405 | $49,040 |
| Mean Household Income | 405 | $50,467 |
| Income Deficit | 263 | $0 |
| Wage / Income Gap (%) | 716 | 0.00% |
| Wage / Income Gap ($) | 716 | 100.00¢ per $1 |
| Gini / Inequality Index | 716 | 0.26 |
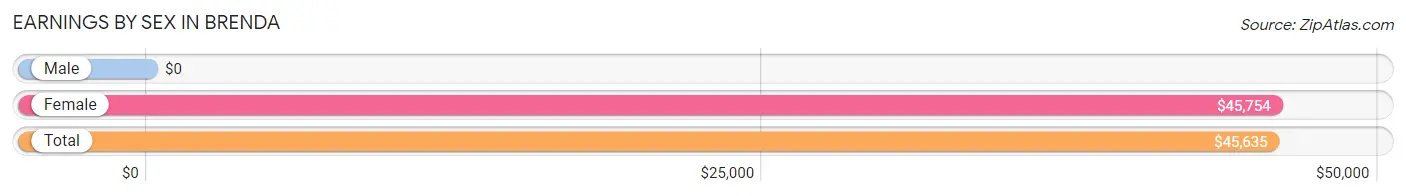
Earnings by Sex in Brenda
| Sex | Number | Average Earnings |
| Male | 26 (22.8%) | $0 |
| Female | 88 (77.2%) | $45,754 |
| Total | 114 (100.0%) | $45,635 |
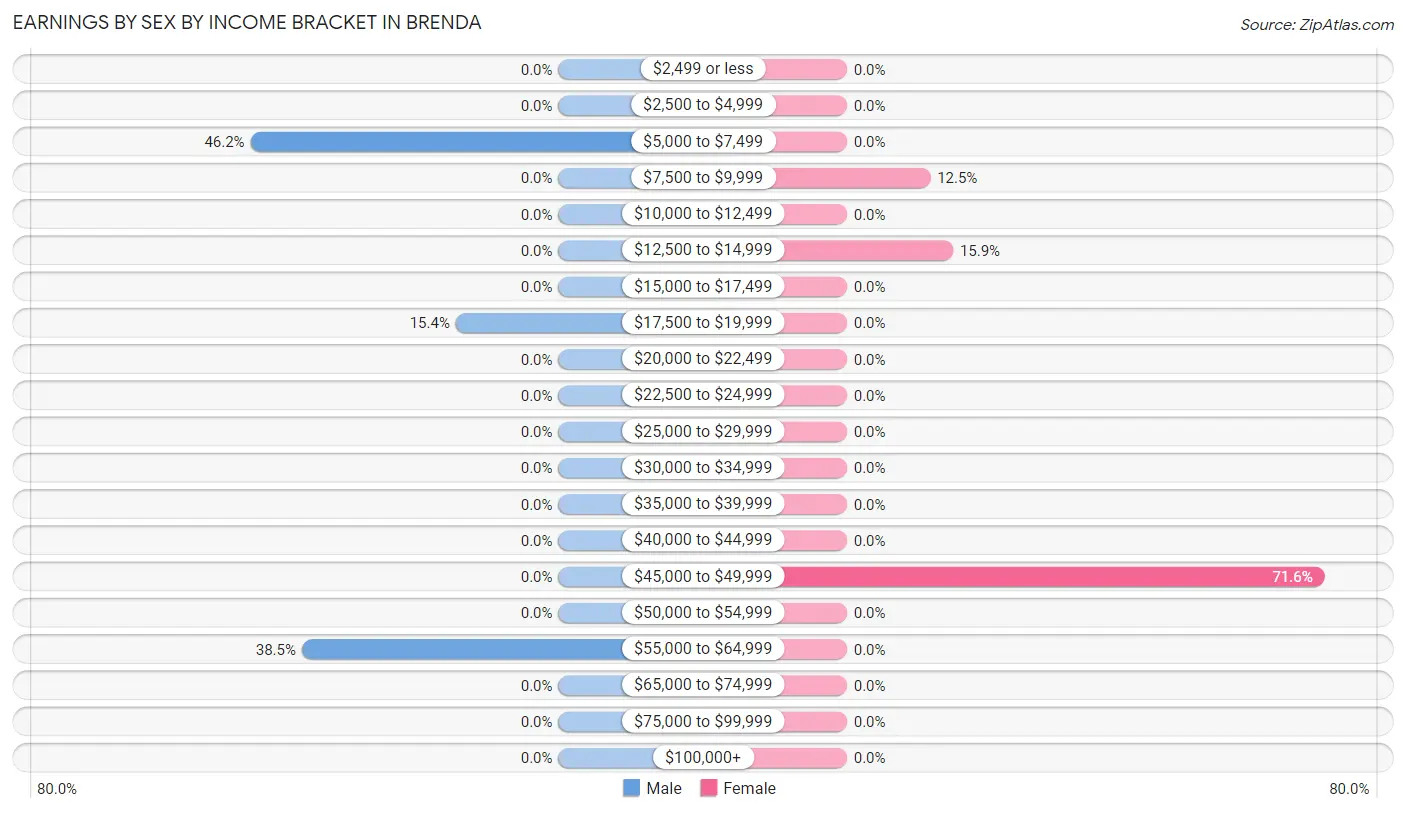
Earnings by Sex by Income Bracket in Brenda
The most common earnings brackets in Brenda are $5,000 to $7,499 for men (12 | 46.2%) and $45,000 to $49,999 for women (63 | 71.6%).
| Income | Male | Female |
| $2,499 or less | 0 (0.0%) | 0 (0.0%) |
| $2,500 to $4,999 | 0 (0.0%) | 0 (0.0%) |
| $5,000 to $7,499 | 12 (46.2%) | 0 (0.0%) |
| $7,500 to $9,999 | 0 (0.0%) | 11 (12.5%) |
| $10,000 to $12,499 | 0 (0.0%) | 0 (0.0%) |
| $12,500 to $14,999 | 0 (0.0%) | 14 (15.9%) |
| $15,000 to $17,499 | 0 (0.0%) | 0 (0.0%) |
| $17,500 to $19,999 | 4 (15.4%) | 0 (0.0%) |
| $20,000 to $22,499 | 0 (0.0%) | 0 (0.0%) |
| $22,500 to $24,999 | 0 (0.0%) | 0 (0.0%) |
| $25,000 to $29,999 | 0 (0.0%) | 0 (0.0%) |
| $30,000 to $34,999 | 0 (0.0%) | 0 (0.0%) |
| $35,000 to $39,999 | 0 (0.0%) | 0 (0.0%) |
| $40,000 to $44,999 | 0 (0.0%) | 0 (0.0%) |
| $45,000 to $49,999 | 0 (0.0%) | 63 (71.6%) |
| $50,000 to $54,999 | 0 (0.0%) | 0 (0.0%) |
| $55,000 to $64,999 | 10 (38.5%) | 0 (0.0%) |
| $65,000 to $74,999 | 0 (0.0%) | 0 (0.0%) |
| $75,000 to $99,999 | 0 (0.0%) | 0 (0.0%) |
| $100,000+ | 0 (0.0%) | 0 (0.0%) |
| Total | 26 (100.0%) | 88 (100.0%) |
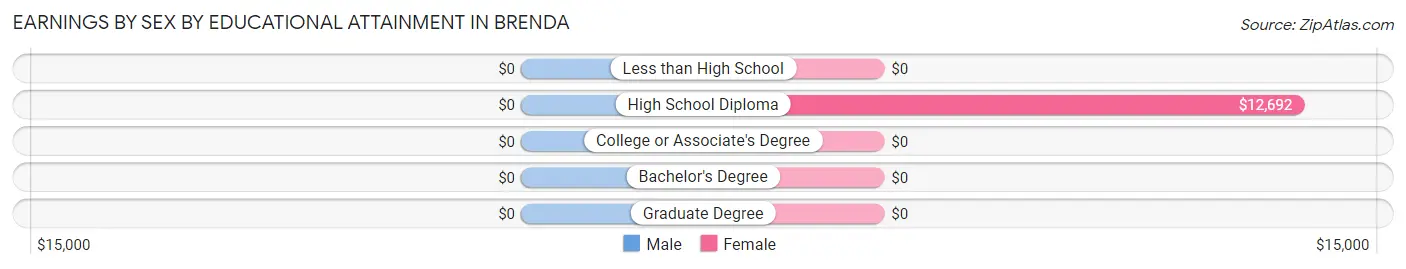
Earnings by Sex by Educational Attainment in Brenda
| Educational Attainment | Male Income | Female Income |
| Less than High School | - | - |
| High School Diploma | - | - |
| College or Associate's Degree | - | - |
| Bachelor's Degree | - | - |
| Graduate Degree | - | - |
| Total | - | - |
Family Income in Brenda
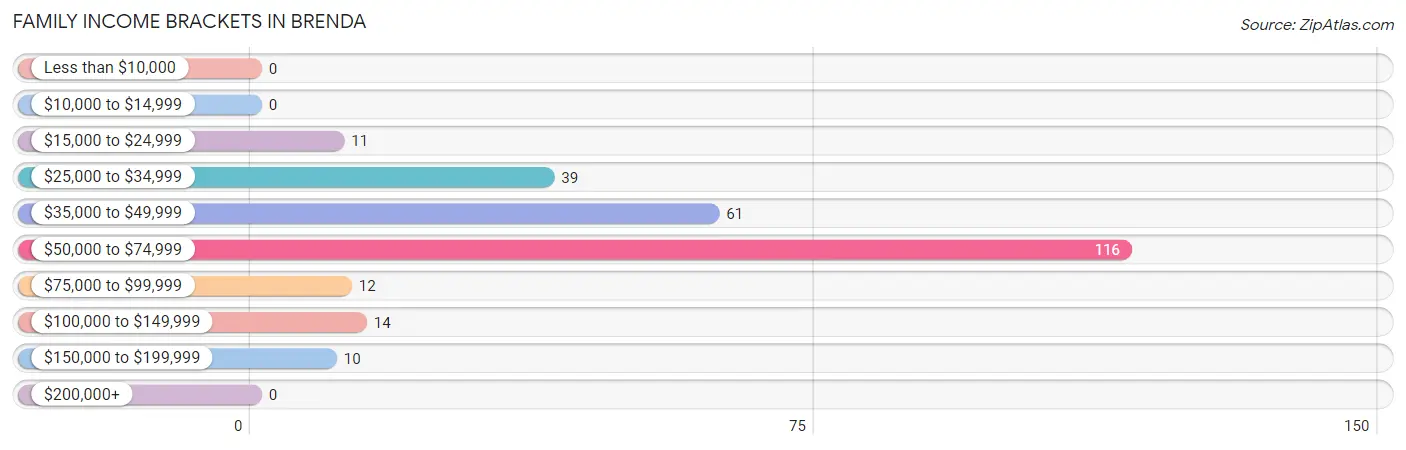
Family Income Brackets in Brenda
According to the Brenda family income data, there are 116 families falling into the $50,000 to $74,999 income range, which is the most common income bracket and makes up 44.1% of all families.
| Income Bracket | # Families | % Families |
| Less than $10,000 | 0 | 0.0% |
| $10,000 to $14,999 | 0 | 0.0% |
| $15,000 to $24,999 | 11 | 4.2% |
| $25,000 to $34,999 | 39 | 14.8% |
| $35,000 to $49,999 | 61 | 23.2% |
| $50,000 to $74,999 | 116 | 44.1% |
| $75,000 to $99,999 | 12 | 4.6% |
| $100,000 to $149,999 | 14 | 5.3% |
| $150,000 to $199,999 | 10 | 3.8% |
| $200,000+ | 0 | 0.0% |
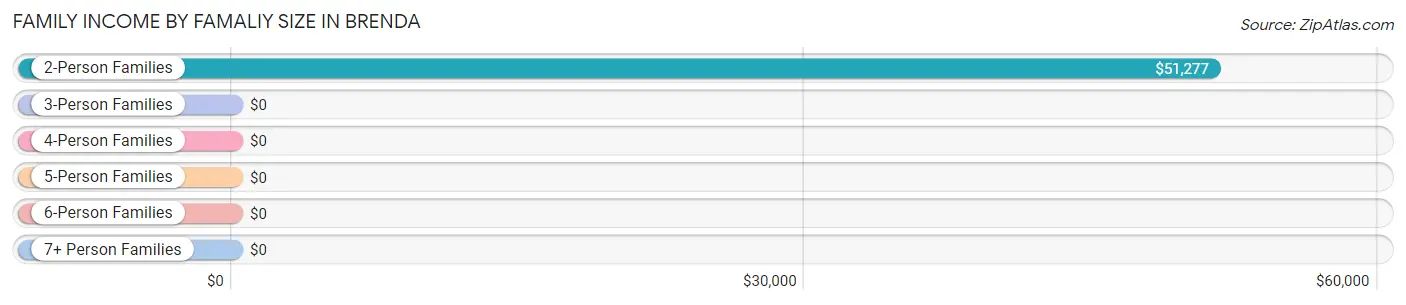
Family Income by Famaliy Size in Brenda
2-person families (257 | 97.7%) account for the highest median family income in Brenda with $51,277 per family, while 2-person families (257 | 97.7%) have the highest median income of $25,638 per family member.
| Income Bracket | # Families | Median Income |
| 2-Person Families | 257 (97.7%) | $51,277 |
| 3-Person Families | 0 (0.0%) | $0 |
| 4-Person Families | 0 (0.0%) | $0 |
| 5-Person Families | 6 (2.3%) | $0 |
| 6-Person Families | 0 (0.0%) | $0 |
| 7+ Person Families | 0 (0.0%) | $0 |
| Total | 263 (100.0%) | $51,114 |
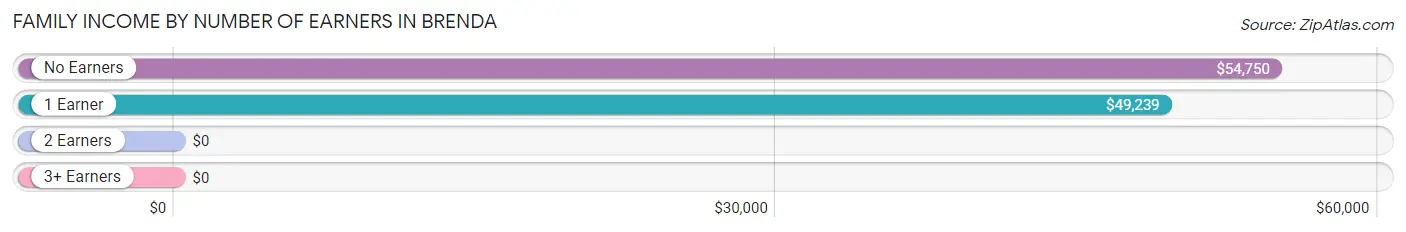
Family Income by Number of Earners in Brenda
| Number of Earners | # Families | Median Income |
| No Earners | 183 (69.6%) | $54,750 |
| 1 Earner | 74 (28.1%) | $49,239 |
| 2 Earners | 6 (2.3%) | $0 |
| 3+ Earners | 0 (0.0%) | $0 |
| Total | 263 (100.0%) | $51,114 |
Household Income in Brenda
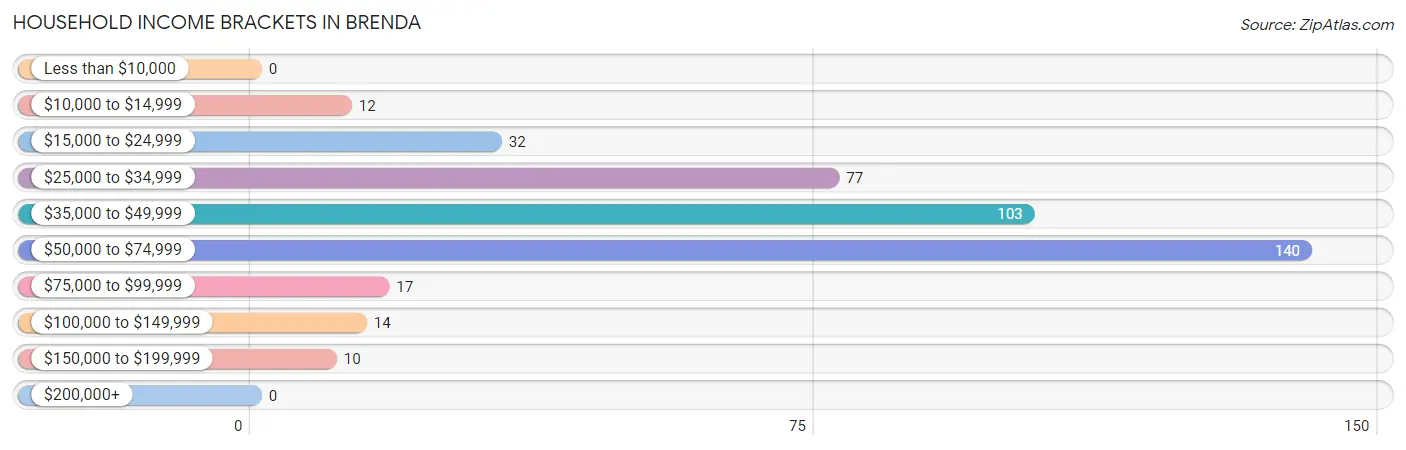
Household Income Brackets in Brenda
With 140 households falling in the category, the $50,000 to $74,999 income range is the most frequent in Brenda, accounting for 34.6% of all households.
| Income Bracket | # Households | % Households |
| Less than $10,000 | 0 | 0.0% |
| $10,000 to $14,999 | 12 | 3.0% |
| $15,000 to $24,999 | 32 | 7.9% |
| $25,000 to $34,999 | 77 | 19.0% |
| $35,000 to $49,999 | 103 | 25.4% |
| $50,000 to $74,999 | 140 | 34.6% |
| $75,000 to $99,999 | 17 | 4.2% |
| $100,000 to $149,999 | 14 | 3.5% |
| $150,000 to $199,999 | 10 | 2.5% |
| $200,000+ | 0 | 0.0% |
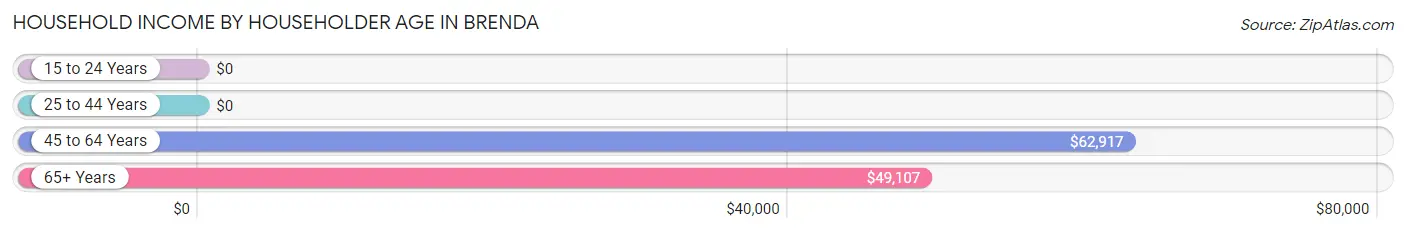
Household Income by Householder Age in Brenda
The median household income in Brenda is $49,040, with the highest median household income of $62,917 found in the 45 to 64 years age bracket for the primary householder. A total of 15 households (3.7%) fall into this category.
| Income Bracket | # Households | Median Income |
| 15 to 24 Years | 0 (0.0%) | $0 |
| 25 to 44 Years | 6 (1.5%) | $0 |
| 45 to 64 Years | 15 (3.7%) | $62,917 |
| 65+ Years | 384 (94.8%) | $49,107 |
| Total | 405 (100.0%) | $49,040 |
Poverty in Brenda
Income Below Poverty by Sex and Age in Brenda
With 1.2% poverty level for males and 4.8% for females among the residents of Brenda, 6 to 11 year old males and 12 to 14 year old females are the most vulnerable to poverty, with 4 males (100.0%) and 5 females (100.0%) in their respective age groups living below the poverty level.

| Age Bracket | Male | Female |
| Under 5 Years | 0 (0.0%) | 0 (0.0%) |
| 5 Years | 0 (0.0%) | 0 (0.0%) |
| 6 to 11 Years | 4 (100.0%) | 0 (0.0%) |
| 12 to 14 Years | 0 (0.0%) | 5 (100.0%) |
| 15 Years | 0 (0.0%) | 0 (0.0%) |
| 16 and 17 Years | 0 (0.0%) | 6 (100.0%) |
| 18 to 24 Years | 0 (0.0%) | 0 (0.0%) |
| 25 to 34 Years | 0 (0.0%) | 0 (0.0%) |
| 35 to 44 Years | 0 (0.0%) | 6 (100.0%) |
| 45 to 54 Years | 0 (0.0%) | 0 (0.0%) |
| 55 to 64 Years | 0 (0.0%) | 1 (1.2%) |
| 65 to 74 Years | 0 (0.0%) | 0 (0.0%) |
| 75 Years and over | 0 (0.0%) | 0 (0.0%) |
| Total | 4 (1.2%) | 18 (4.8%) |
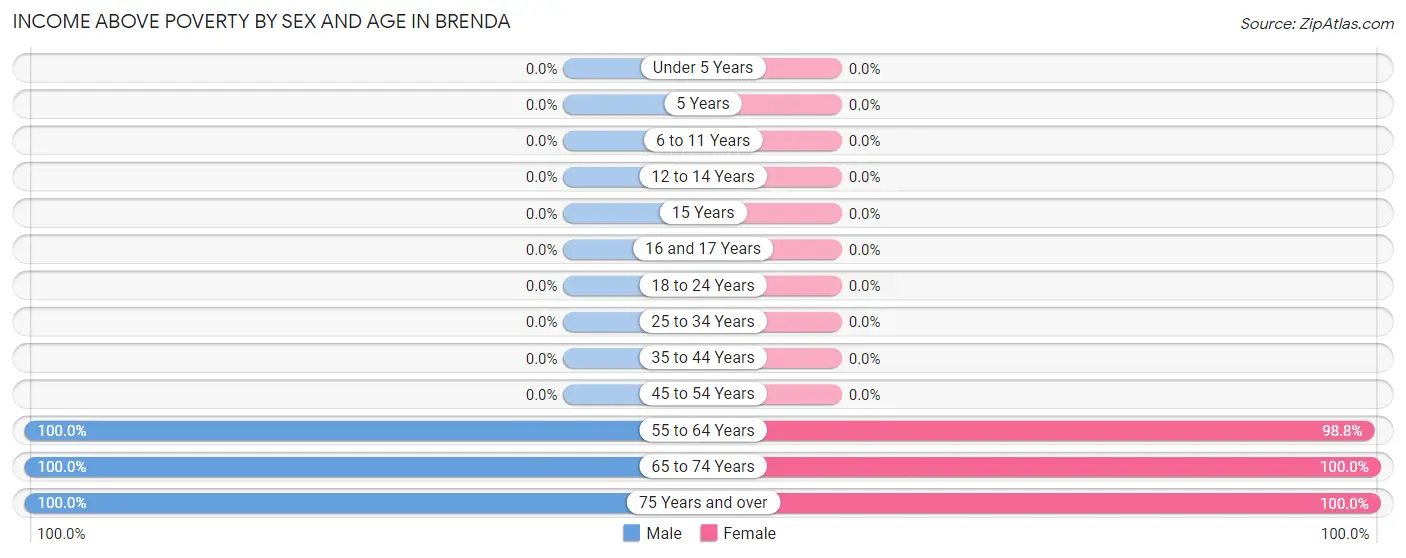
Income Above Poverty by Sex and Age in Brenda
According to the poverty statistics in Brenda, males aged 55 to 64 years and females aged 65 to 74 years are the age groups that are most secure financially, with 100.0% of males and 100.0% of females in these age groups living above the poverty line.
| Age Bracket | Male | Female |
| Under 5 Years | 0 (0.0%) | 0 (0.0%) |
| 5 Years | 0 (0.0%) | 0 (0.0%) |
| 6 to 11 Years | 0 (0.0%) | 0 (0.0%) |
| 12 to 14 Years | 0 (0.0%) | 0 (0.0%) |
| 15 Years | 0 (0.0%) | 0 (0.0%) |
| 16 and 17 Years | 0 (0.0%) | 0 (0.0%) |
| 18 to 24 Years | 0 (0.0%) | 0 (0.0%) |
| 25 to 34 Years | 0 (0.0%) | 0 (0.0%) |
| 35 to 44 Years | 0 (0.0%) | 0 (0.0%) |
| 45 to 54 Years | 0 (0.0%) | 0 (0.0%) |
| 55 to 64 Years | 9 (100.0%) | 85 (98.8%) |
| 65 to 74 Years | 85 (100.0%) | 93 (100.0%) |
| 75 Years and over | 242 (100.0%) | 180 (100.0%) |
| Total | 336 (98.8%) | 358 (95.2%) |
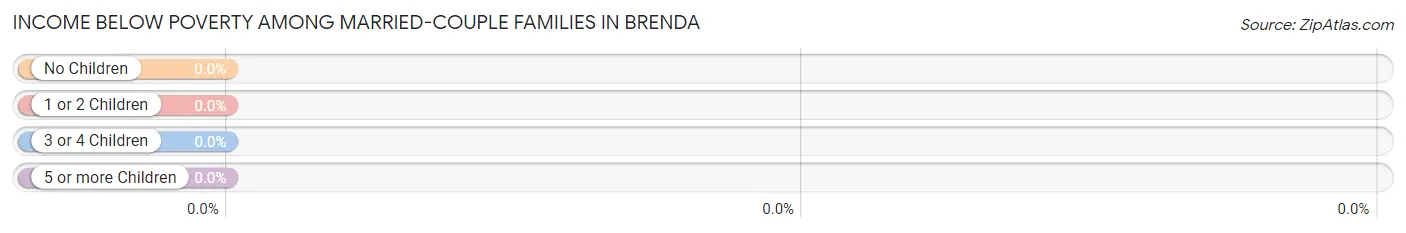
Income Below Poverty Among Married-Couple Families in Brenda
| Children | Above Poverty | Below Poverty |
| No Children | 257 (100.0%) | 0 (0.0%) |
| 1 or 2 Children | 0 (0.0%) | 0 (0.0%) |
| 3 or 4 Children | 0 (0.0%) | 0 (0.0%) |
| 5 or more Children | 0 (0.0%) | 0 (0.0%) |
| Total | 257 (100.0%) | 0 (0.0%) |
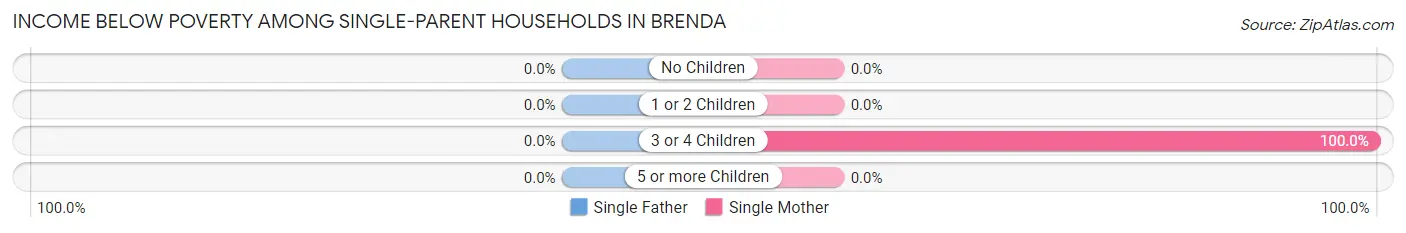
Income Below Poverty Among Single-Parent Households in Brenda
| Children | Single Father | Single Mother |
| No Children | 0 (0.0%) | 0 (0.0%) |
| 1 or 2 Children | 0 (0.0%) | 0 (0.0%) |
| 3 or 4 Children | 0 (0.0%) | 6 (100.0%) |
| 5 or more Children | 0 (0.0%) | 0 (0.0%) |
| Total | 0 (0.0%) | 6 (100.0%) |
Income Below Poverty Among Married-Couple vs Single-Parent Households in Brenda
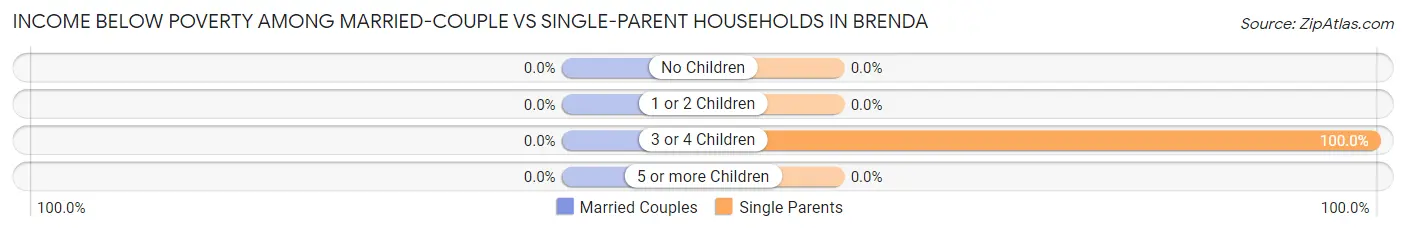
| Children | Married-Couple Families | Single-Parent Households |
| No Children | 0 (0.0%) | 0 (0.0%) |
| 1 or 2 Children | 0 (0.0%) | 0 (0.0%) |
| 3 or 4 Children | 0 (0.0%) | 6 (100.0%) |
| 5 or more Children | 0 (0.0%) | 0 (0.0%) |
| Total | 0 (0.0%) | 6 (100.0%) |
Race in Brenda
The most populous races in Brenda are , and White / Caucasian (716 | 100.0%).
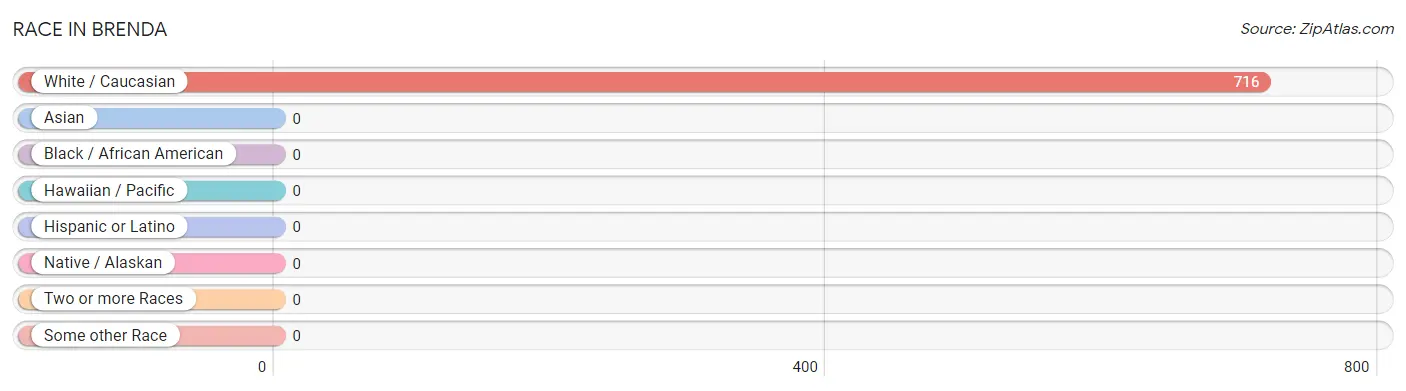
| Race | # Population | % Population |
| Asian | 0 | 0.0% |
| Black / African American | 0 | 0.0% |
| Hawaiian / Pacific | 0 | 0.0% |
| Hispanic or Latino | 0 | 0.0% |
| Native / Alaskan | 0 | 0.0% |
| White / Caucasian | 716 | 100.0% |
| Two or more Races | 0 | 0.0% |
| Some other Race | 0 | 0.0% |
| Total | 716 | 100.0% |
Ancestry in Brenda
The most populous ancestries reported in Brenda are English (262 | 36.6%), German (224 | 31.3%), American (79 | 11.0%), Canadian (64 | 8.9%), and French (42 | 5.9%), together accounting for 93.7% of all Brenda residents.
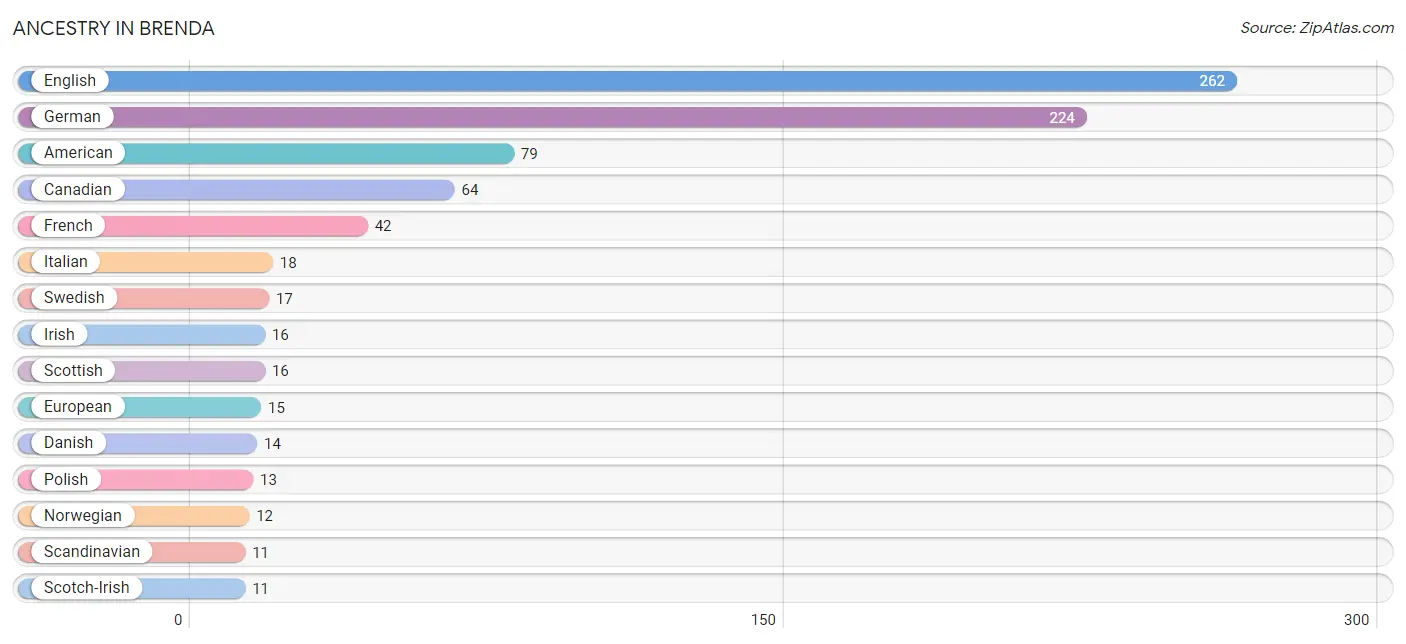
| Ancestry | # Population | % Population |
| American | 79 | 11.0% |
| Canadian | 64 | 8.9% |
| Danish | 14 | 2.0% |
| English | 262 | 36.6% |
| European | 15 | 2.1% |
| French | 42 | 5.9% |
| German | 224 | 31.3% |
| Irish | 16 | 2.2% |
| Italian | 18 | 2.5% |
| Norwegian | 12 | 1.7% |
| Polish | 13 | 1.8% |
| Scandinavian | 11 | 1.5% |
| Scotch-Irish | 11 | 1.5% |
| Scottish | 16 | 2.2% |
| Swedish | 17 | 2.4% | View All 15 Rows |
Immigrants in Brenda
The most numerous immigrant groups reported in Brenda came from , and Canada (78 | 10.9%), together accounting for 10.9% of all Brenda residents.

| Immigration Origin | # Population | % Population |
| Canada | 78 | 10.9% | View All 1 Rows |
Sex and Age in Brenda
Sex and Age in Brenda
The most populous age groups in Brenda are 75 to 79 Years (133 | 39.1%) for men and 80 to 84 Years (125 | 33.2%) for women.
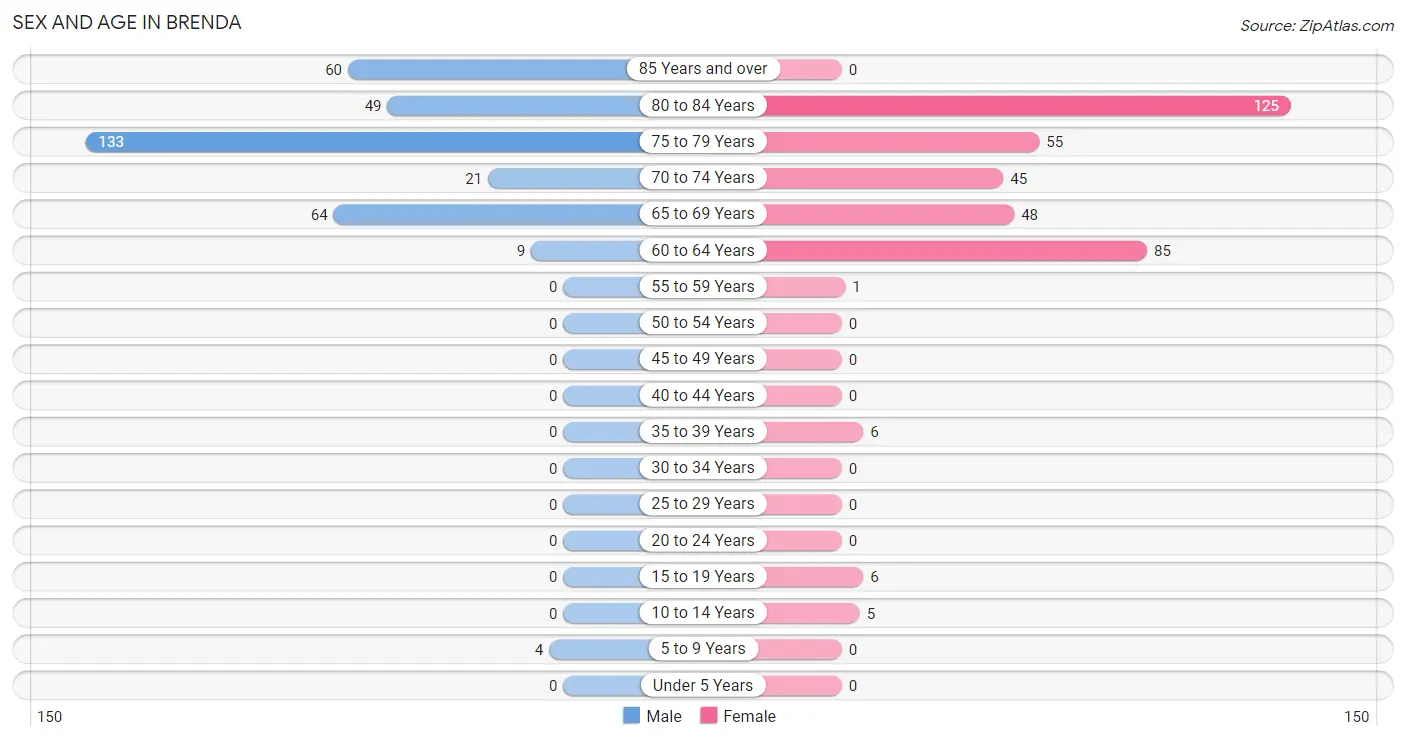
| Age Bracket | Male | Female |
| Under 5 Years | 0 (0.0%) | 0 (0.0%) |
| 5 to 9 Years | 4 (1.2%) | 0 (0.0%) |
| 10 to 14 Years | 0 (0.0%) | 5 (1.3%) |
| 15 to 19 Years | 0 (0.0%) | 6 (1.6%) |
| 20 to 24 Years | 0 (0.0%) | 0 (0.0%) |
| 25 to 29 Years | 0 (0.0%) | 0 (0.0%) |
| 30 to 34 Years | 0 (0.0%) | 0 (0.0%) |
| 35 to 39 Years | 0 (0.0%) | 6 (1.6%) |
| 40 to 44 Years | 0 (0.0%) | 0 (0.0%) |
| 45 to 49 Years | 0 (0.0%) | 0 (0.0%) |
| 50 to 54 Years | 0 (0.0%) | 0 (0.0%) |
| 55 to 59 Years | 0 (0.0%) | 1 (0.3%) |
| 60 to 64 Years | 9 (2.6%) | 85 (22.6%) |
| 65 to 69 Years | 64 (18.8%) | 48 (12.8%) |
| 70 to 74 Years | 21 (6.2%) | 45 (12.0%) |
| 75 to 79 Years | 133 (39.1%) | 55 (14.6%) |
| 80 to 84 Years | 49 (14.4%) | 125 (33.2%) |
| 85 Years and over | 60 (17.6%) | 0 (0.0%) |
| Total | 340 (100.0%) | 376 (100.0%) |
Families and Households in Brenda
Median Family Size in Brenda
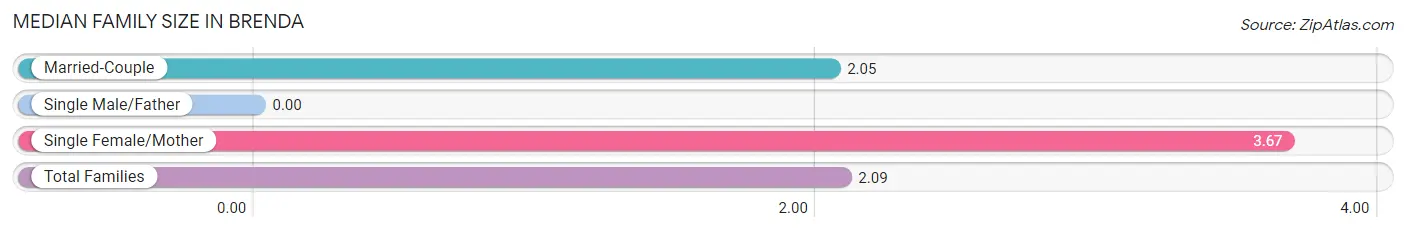
| Family Type | # Families | Family Size |
| Married-Couple | 257 (97.7%) | 2.05 |
| Single Male/Father | 0 (0.0%) | - |
| Single Female/Mother | 6 (2.3%) | 3.67 |
| Total Families | 263 (100.0%) | 2.09 |
Median Household Size in Brenda
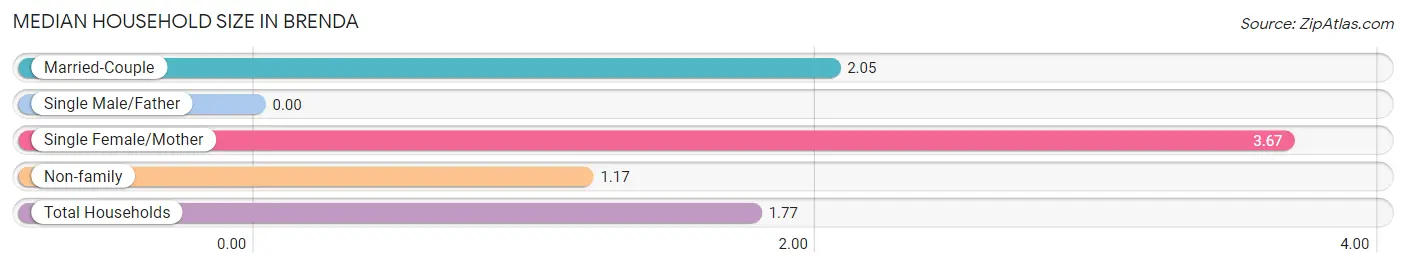
| Household Type | # Households | Household Size |
| Married-Couple | 257 (63.5%) | 2.05 |
| Single Male/Father | 0 (0.0%) | - |
| Single Female/Mother | 6 (1.5%) | 3.67 |
| Non-family | 142 (35.1%) | 1.17 |
| Total Households | 405 (100.0%) | 1.77 |
Household Size by Marriage Status in Brenda
Out of a total of 405 households in Brenda, 263 (64.9%) are family households, while 142 (35.1%) are nonfamily households. The most numerous type of family households are 2-person households, comprising 257, and the most common type of nonfamily households are 1-person households, comprising 126.
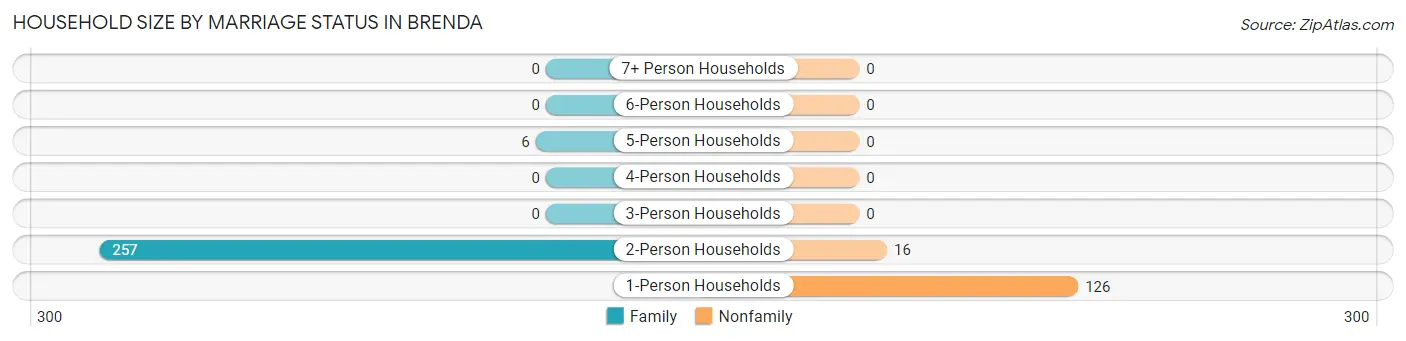
| Household Size | Family Households | Nonfamily Households |
| 1-Person Households | - | 126 (31.1%) |
| 2-Person Households | 257 (63.5%) | 16 (4.0%) |
| 3-Person Households | 0 (0.0%) | 0 (0.0%) |
| 4-Person Households | 0 (0.0%) | 0 (0.0%) |
| 5-Person Households | 6 (1.5%) | 0 (0.0%) |
| 6-Person Households | 0 (0.0%) | 0 (0.0%) |
| 7+ Person Households | 0 (0.0%) | 0 (0.0%) |
| Total | 263 (64.9%) | 142 (35.1%) |
Female Fertility in Brenda
Fertility by Age in Brenda
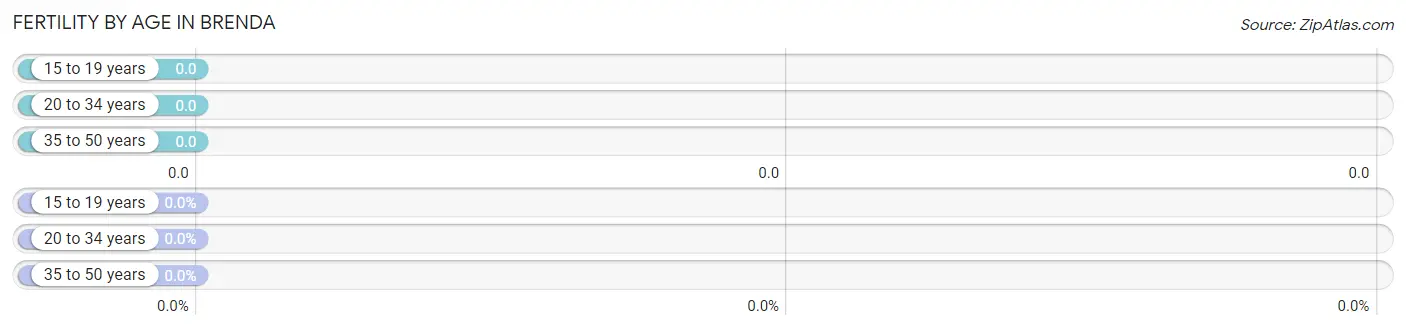
| Age Bracket | Women with Births | Births / 1,000 Women |
| 15 to 19 years | 0 (0.0%) | 0.0 |
| 20 to 34 years | 0 (0.0%) | 0.0 |
| 35 to 50 years | 0 (0.0%) | 0.0 |
| Total | 0 (0.0%) | 0.0 |
Fertility by Age by Marriage Status in Brenda
| Age Bracket | Married | Unmarried |
| 15 to 19 years | 0 (0.0%) | 0 (0.0%) |
| 20 to 34 years | 0 (0.0%) | 0 (0.0%) |
| 35 to 50 years | 0 (0.0%) | 0 (0.0%) |
| Total | 0 (0.0%) | 0 (0.0%) |
Fertility by Education in Brenda
| Educational Attainment | Women with Births | Births / 1,000 Women |
| Less than High School | 0 (0.0%) | 0.0 |
| High School Diploma | 0 (0.0%) | 0.0 |
| College or Associate's Degree | 0 (0.0%) | 0.0 |
| Bachelor's Degree | 0 (0.0%) | 0.0 |
| Graduate Degree | 0 (0.0%) | 0.0 |
| Total | 0 (0.0%) | 0.0 |
Fertility by Education by Marriage Status in Brenda
| Educational Attainment | Married | Unmarried |
| Less than High School | 0 (0.0%) | 0 (0.0%) |
| High School Diploma | 0 (0.0%) | 0 (0.0%) |
| College or Associate's Degree | 0 (0.0%) | 0 (0.0%) |
| Bachelor's Degree | 0 (0.0%) | 0 (0.0%) |
| Graduate Degree | 0 (0.0%) | 0 (0.0%) |
| Total | 0 (0.0%) | 0 (0.0%) |
Employment Characteristics in Brenda
Employment by Class of Employer in Brenda
Among the 93 employed individuals in Brenda, self-employed (incorporated) (63 | 67.7%), and private company employees (30 | 32.3%) make up the most common classes of employment.
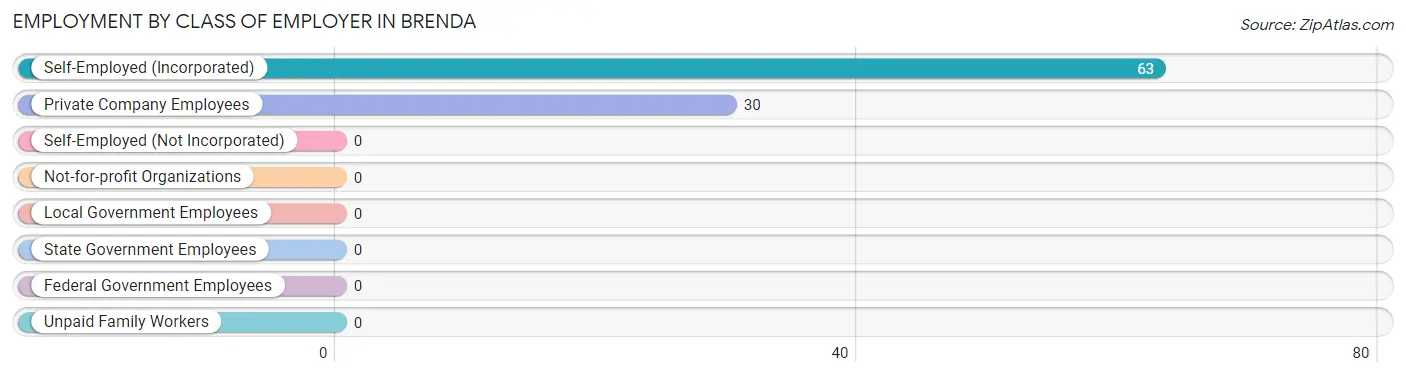
| Employer Class | # Employees | % Employees |
| Private Company Employees | 30 | 32.3% |
| Self-Employed (Incorporated) | 63 | 67.7% |
| Self-Employed (Not Incorporated) | 0 | 0.0% |
| Not-for-profit Organizations | 0 | 0.0% |
| Local Government Employees | 0 | 0.0% |
| State Government Employees | 0 | 0.0% |
| Federal Government Employees | 0 | 0.0% |
| Unpaid Family Workers | 0 | 0.0% |
| Total | 93 | 100.0% |
Employment Status by Age in Brenda
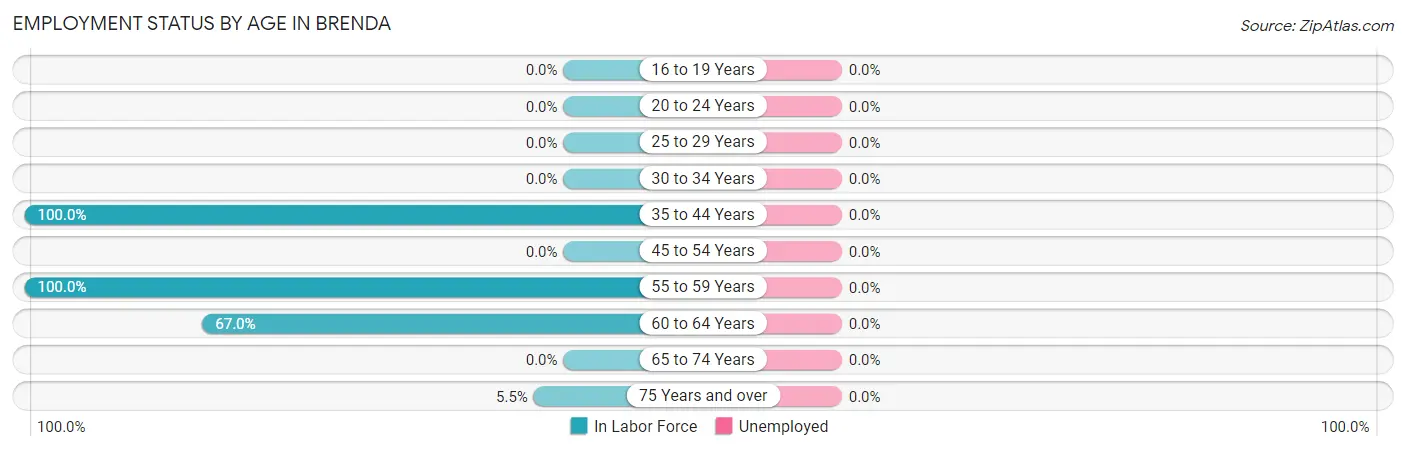
| Age Bracket | In Labor Force | Unemployed |
| 16 to 19 Years | 0 (0.0%) | 0 (0.0%) |
| 20 to 24 Years | 0 (0.0%) | 0 (0.0%) |
| 25 to 29 Years | 0 (0.0%) | 0 (0.0%) |
| 30 to 34 Years | 0 (0.0%) | 0 (0.0%) |
| 35 to 44 Years | 6 (100.0%) | 0 (0.0%) |
| 45 to 54 Years | 0 (0.0%) | 0 (0.0%) |
| 55 to 59 Years | 1 (100.0%) | 0 (0.0%) |
| 60 to 64 Years | 63 (67.0%) | 0 (0.0%) |
| 65 to 74 Years | 0 (0.0%) | 0 (0.0%) |
| 75 Years and over | 23 (5.5%) | 0 (0.0%) |
| Total | 93 (13.2%) | 0 (0.0%) |
Employment Status by Educational Attainment in Brenda
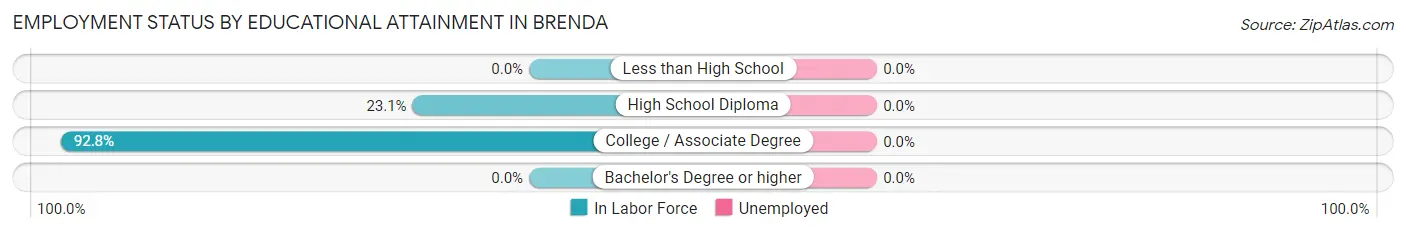
| Educational Attainment | In Labor Force | Unemployed |
| Less than High School | 0 (0.0%) | 0 (0.0%) |
| High School Diploma | 6 (23.1%) | 0 (0.0%) |
| College / Associate Degree | 64 (92.8%) | 0 (0.0%) |
| Bachelor's Degree or higher | 0 (0.0%) | 0 (0.0%) |
| Total | 70 (69.3%) | 0 (0.0%) |
Employment Occupations by Sex in Brenda
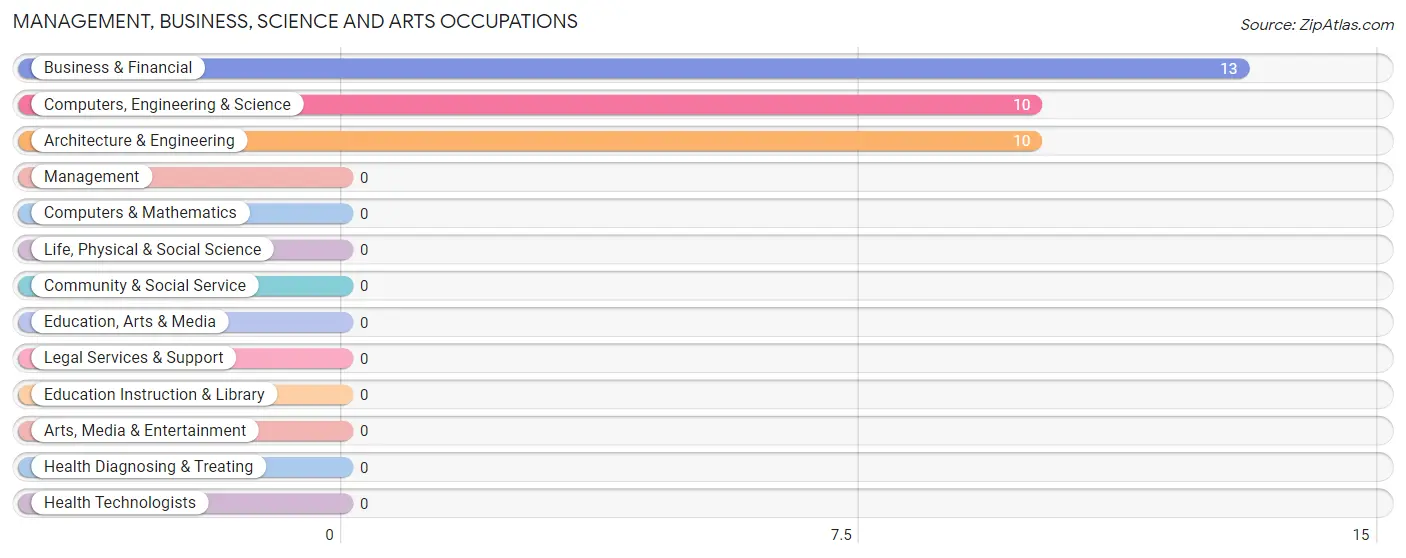
Management, Business, Science and Arts Occupations
The most common Management, Business, Science and Arts occupations in Brenda are Business & Financial (13 | 14.0%), Computers, Engineering & Science (10 | 10.7%), and Architecture & Engineering (10 | 10.7%).
Management, Business, Science and Arts Occupations by Sex
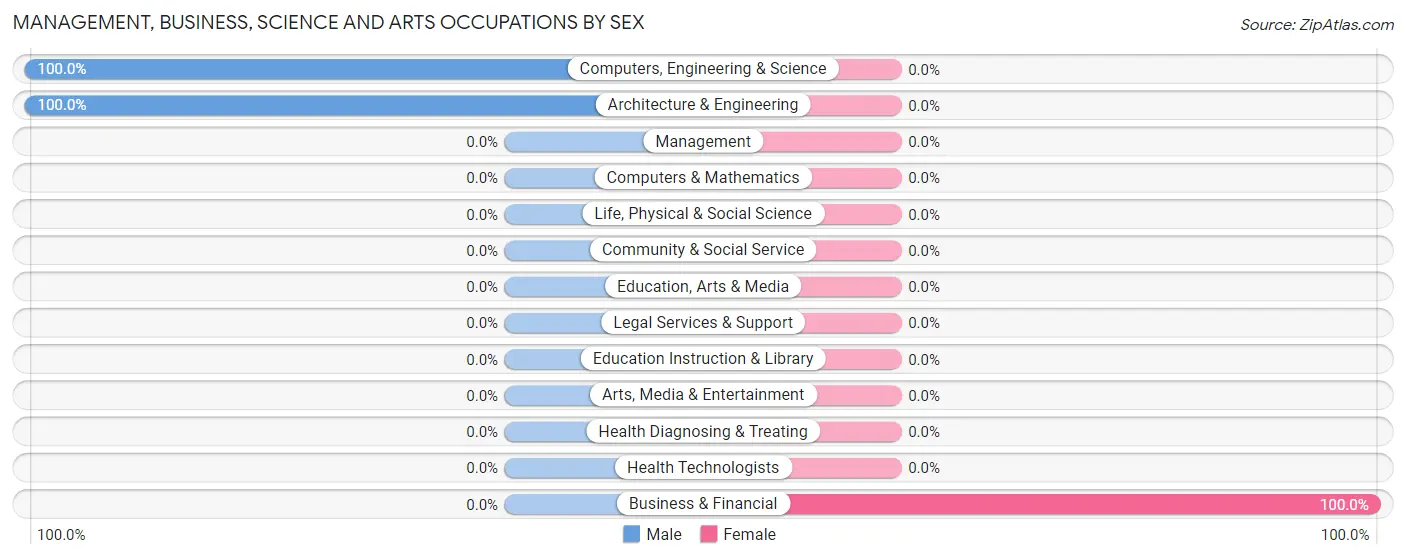
| Occupation | Male | Female |
| Management | 0 (0.0%) | 0 (0.0%) |
| Business & Financial | 0 (0.0%) | 13 (100.0%) |
| Computers, Engineering & Science | 10 (100.0%) | 0 (0.0%) |
| Computers & Mathematics | 0 (0.0%) | 0 (0.0%) |
| Architecture & Engineering | 10 (100.0%) | 0 (0.0%) |
| Life, Physical & Social Science | 0 (0.0%) | 0 (0.0%) |
| Community & Social Service | 0 (0.0%) | 0 (0.0%) |
| Education, Arts & Media | 0 (0.0%) | 0 (0.0%) |
| Legal Services & Support | 0 (0.0%) | 0 (0.0%) |
| Education Instruction & Library | 0 (0.0%) | 0 (0.0%) |
| Arts, Media & Entertainment | 0 (0.0%) | 0 (0.0%) |
| Health Diagnosing & Treating | 0 (0.0%) | 0 (0.0%) |
| Health Technologists | 0 (0.0%) | 0 (0.0%) |
| Total (Category) | 10 (43.5%) | 13 (56.5%) |
| Total (Overall) | 10 (10.7%) | 83 (89.2%) |
Services Occupations
The most common Services occupations in Brenda are , and Healthcare Support (7 | 7.5%).
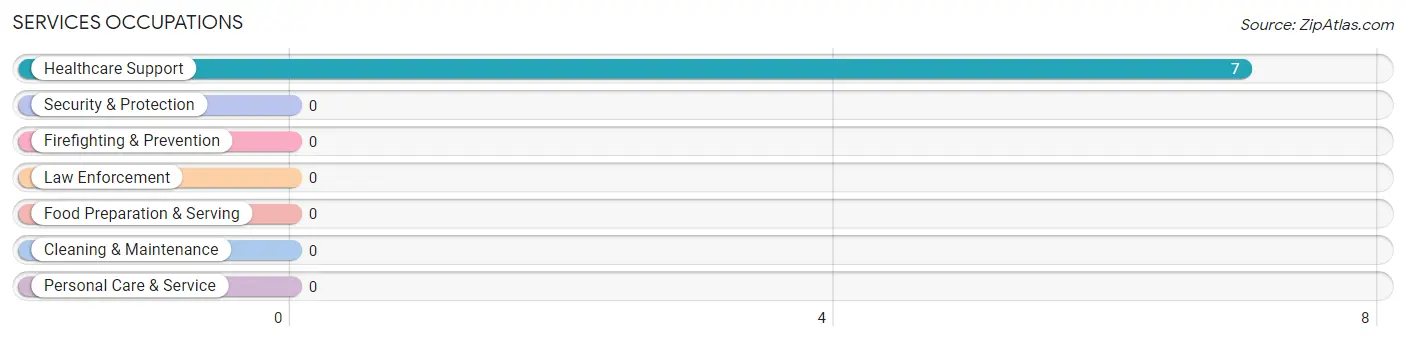
Services Occupations by Sex
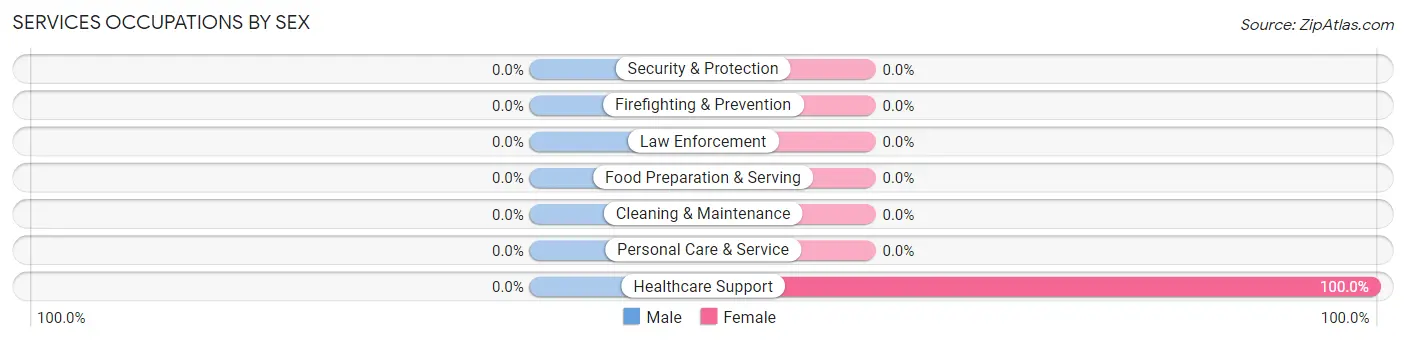
| Occupation | Male | Female |
| Healthcare Support | 0 (0.0%) | 7 (100.0%) |
| Security & Protection | 0 (0.0%) | 0 (0.0%) |
| Firefighting & Prevention | 0 (0.0%) | 0 (0.0%) |
| Law Enforcement | 0 (0.0%) | 0 (0.0%) |
| Food Preparation & Serving | 0 (0.0%) | 0 (0.0%) |
| Cleaning & Maintenance | 0 (0.0%) | 0 (0.0%) |
| Personal Care & Service | 0 (0.0%) | 0 (0.0%) |
| Total (Category) | 0 (0.0%) | 7 (100.0%) |
| Total (Overall) | 10 (10.7%) | 83 (89.2%) |
Sales and Office Occupations
The most common Sales and Office occupations in Brenda are , and Office & Administration (63 | 67.7%).
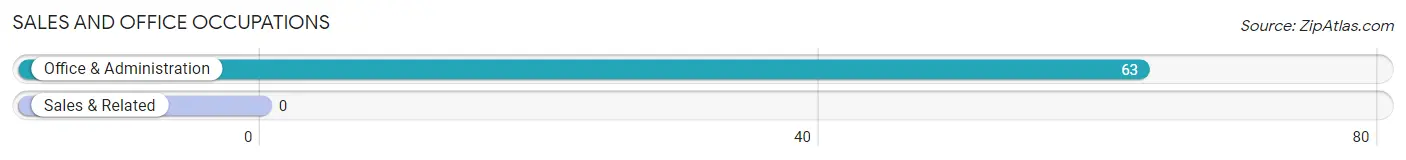
Sales and Office Occupations by Sex
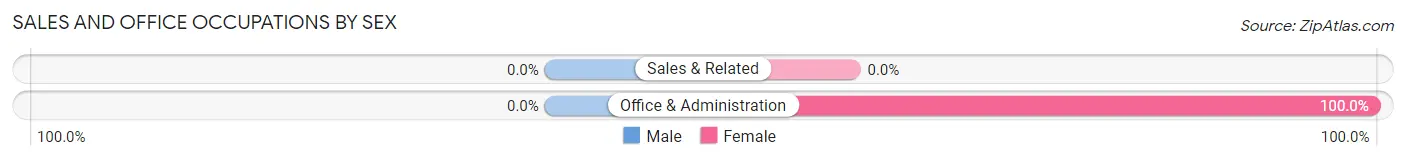
| Occupation | Male | Female |
| Sales & Related | 0 (0.0%) | 0 (0.0%) |
| Office & Administration | 0 (0.0%) | 63 (100.0%) |
| Total (Category) | 0 (0.0%) | 63 (100.0%) |
| Total (Overall) | 10 (10.7%) | 83 (89.2%) |
Natural Resources, Construction and Maintenance Occupations
Natural Resources, Construction and Maintenance Occupations by Sex
| Occupation | Male | Female |
| Farming, Fishing & Forestry | 0 (0.0%) | 0 (0.0%) |
| Construction & Extraction | 0 (0.0%) | 0 (0.0%) |
| Installation, Maintenance & Repair | 0 (0.0%) | 0 (0.0%) |
| Total (Category) | 0 (0.0%) | 0 (0.0%) |
| Total (Overall) | 10 (10.7%) | 83 (89.2%) |
Production, Transportation and Moving Occupations
Production, Transportation and Moving Occupations by Sex
| Occupation | Male | Female |
| Production | 0 (0.0%) | 0 (0.0%) |
| Transportation | 0 (0.0%) | 0 (0.0%) |
| Material Moving | 0 (0.0%) | 0 (0.0%) |
| Total (Category) | 0 (0.0%) | 0 (0.0%) |
| Total (Overall) | 10 (10.7%) | 83 (89.2%) |
Employment Industries by Sex in Brenda
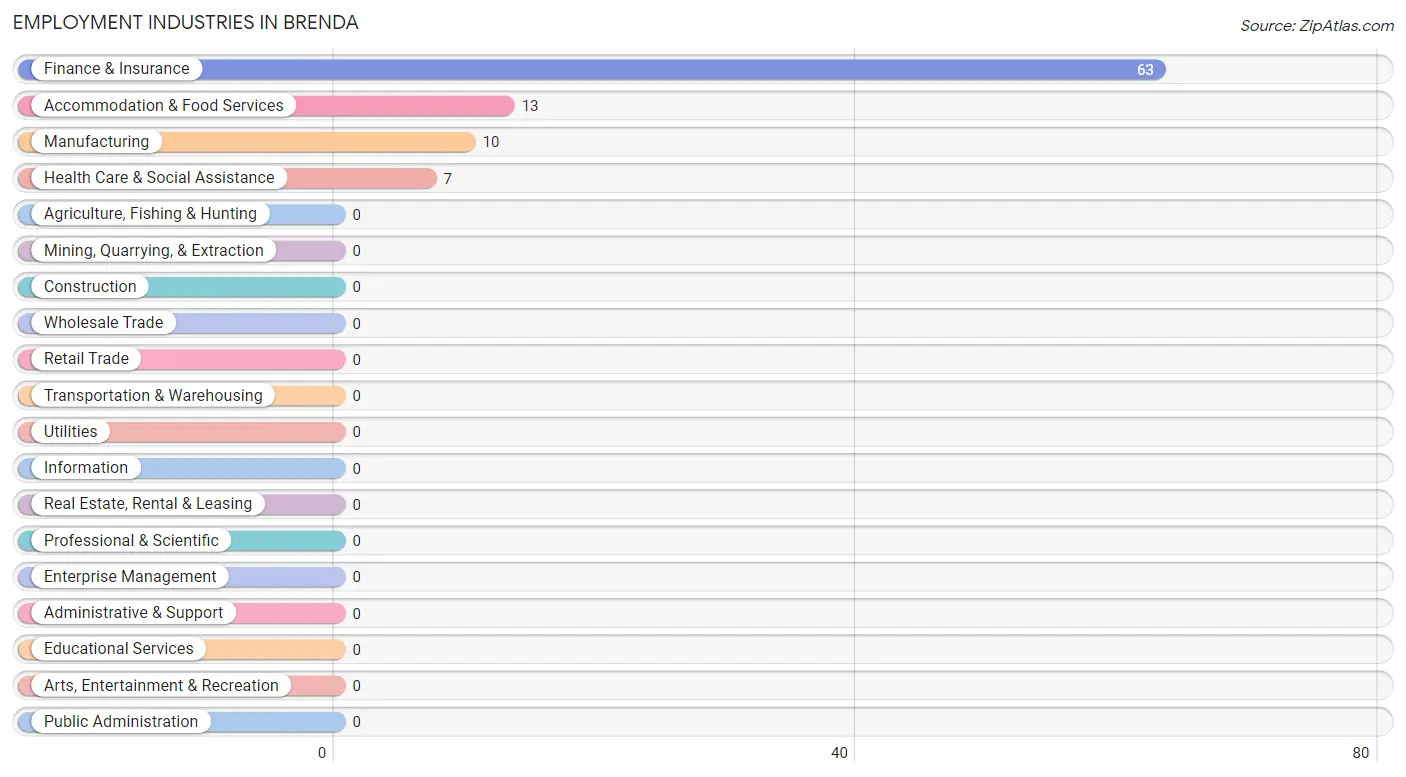
Employment Industries in Brenda
The major employment industries in Brenda include Finance & Insurance (63 | 67.7%), Accommodation & Food Services (13 | 14.0%), Manufacturing (10 | 10.7%), and Health Care & Social Assistance (7 | 7.5%).
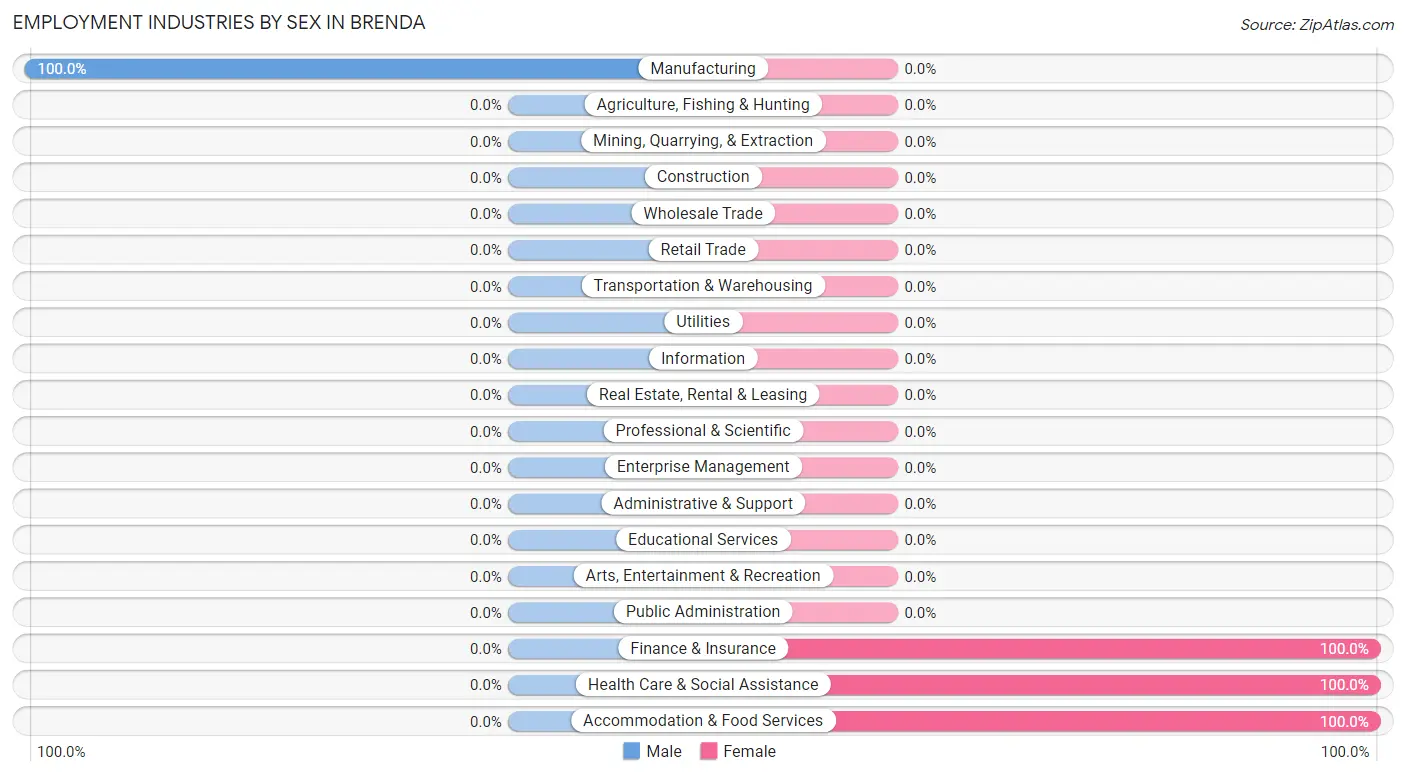
Employment Industries by Sex in Brenda
| Industry | Male | Female |
| Agriculture, Fishing & Hunting | 0 (0.0%) | 0 (0.0%) |
| Mining, Quarrying, & Extraction | 0 (0.0%) | 0 (0.0%) |
| Construction | 0 (0.0%) | 0 (0.0%) |
| Manufacturing | 10 (100.0%) | 0 (0.0%) |
| Wholesale Trade | 0 (0.0%) | 0 (0.0%) |
| Retail Trade | 0 (0.0%) | 0 (0.0%) |
| Transportation & Warehousing | 0 (0.0%) | 0 (0.0%) |
| Utilities | 0 (0.0%) | 0 (0.0%) |
| Information | 0 (0.0%) | 0 (0.0%) |
| Finance & Insurance | 0 (0.0%) | 63 (100.0%) |
| Real Estate, Rental & Leasing | 0 (0.0%) | 0 (0.0%) |
| Professional & Scientific | 0 (0.0%) | 0 (0.0%) |
| Enterprise Management | 0 (0.0%) | 0 (0.0%) |
| Administrative & Support | 0 (0.0%) | 0 (0.0%) |
| Educational Services | 0 (0.0%) | 0 (0.0%) |
| Health Care & Social Assistance | 0 (0.0%) | 7 (100.0%) |
| Arts, Entertainment & Recreation | 0 (0.0%) | 0 (0.0%) |
| Accommodation & Food Services | 0 (0.0%) | 13 (100.0%) |
| Public Administration | 0 (0.0%) | 0 (0.0%) |
| Total | 10 (10.7%) | 83 (89.2%) |
Education in Brenda
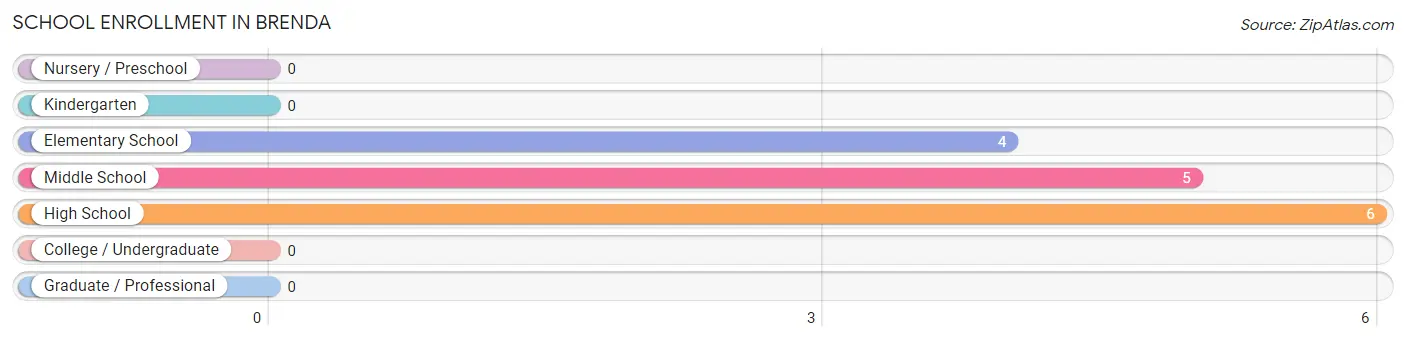
School Enrollment in Brenda
The most common levels of schooling among the 15 students in Brenda are high school (6 | 40.0%), middle school (5 | 33.3%), and elementary school (4 | 26.7%).
| School Level | # Students | % Students |
| Nursery / Preschool | 0 | 0.0% |
| Kindergarten | 0 | 0.0% |
| Elementary School | 4 | 26.7% |
| Middle School | 5 | 33.3% |
| High School | 6 | 40.0% |
| College / Undergraduate | 0 | 0.0% |
| Graduate / Professional | 0 | 0.0% |
| Total | 15 | 100.0% |
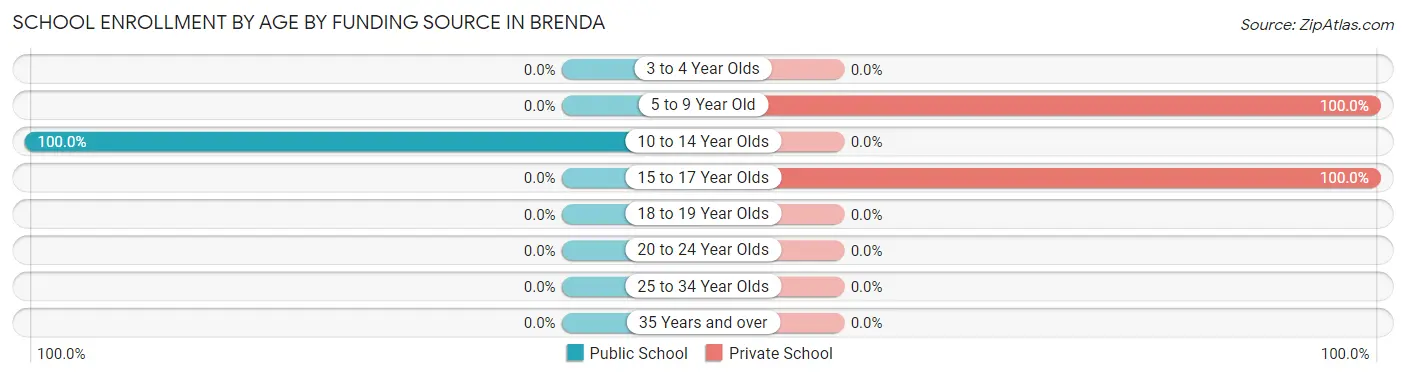
School Enrollment by Age by Funding Source in Brenda
Out of a total of 15 students who are enrolled in schools in Brenda, 10 (66.7%) attend a private institution, while the remaining 5 (33.3%) are enrolled in public schools. The age group of 5 to 9 year old has the highest likelihood of being enrolled in private schools, with 4 (100.0% in the age bracket) enrolled. Conversely, the age group of 10 to 14 year olds has the lowest likelihood of being enrolled in a private school, with 5 (100.0% in the age bracket) attending a public institution.
| Age Bracket | Public School | Private School |
| 3 to 4 Year Olds | 0 (0.0%) | 0 (0.0%) |
| 5 to 9 Year Old | 0 (0.0%) | 4 (100.0%) |
| 10 to 14 Year Olds | 5 (100.0%) | 0 (0.0%) |
| 15 to 17 Year Olds | 0 (0.0%) | 6 (100.0%) |
| 18 to 19 Year Olds | 0 (0.0%) | 0 (0.0%) |
| 20 to 24 Year Olds | 0 (0.0%) | 0 (0.0%) |
| 25 to 34 Year Olds | 0 (0.0%) | 0 (0.0%) |
| 35 Years and over | 0 (0.0%) | 0 (0.0%) |
| Total | 5 (33.3%) | 10 (66.7%) |
Educational Attainment by Field of Study in Brenda
Education (71 | 67.0%), engineering (13 | 12.3%), visual & performing arts (10 | 9.4%), computers & mathematics (6 | 5.7%), and science & technology (4 | 3.8%) are the most common fields of study among 106 individuals in Brenda who have obtained a bachelor's degree or higher.
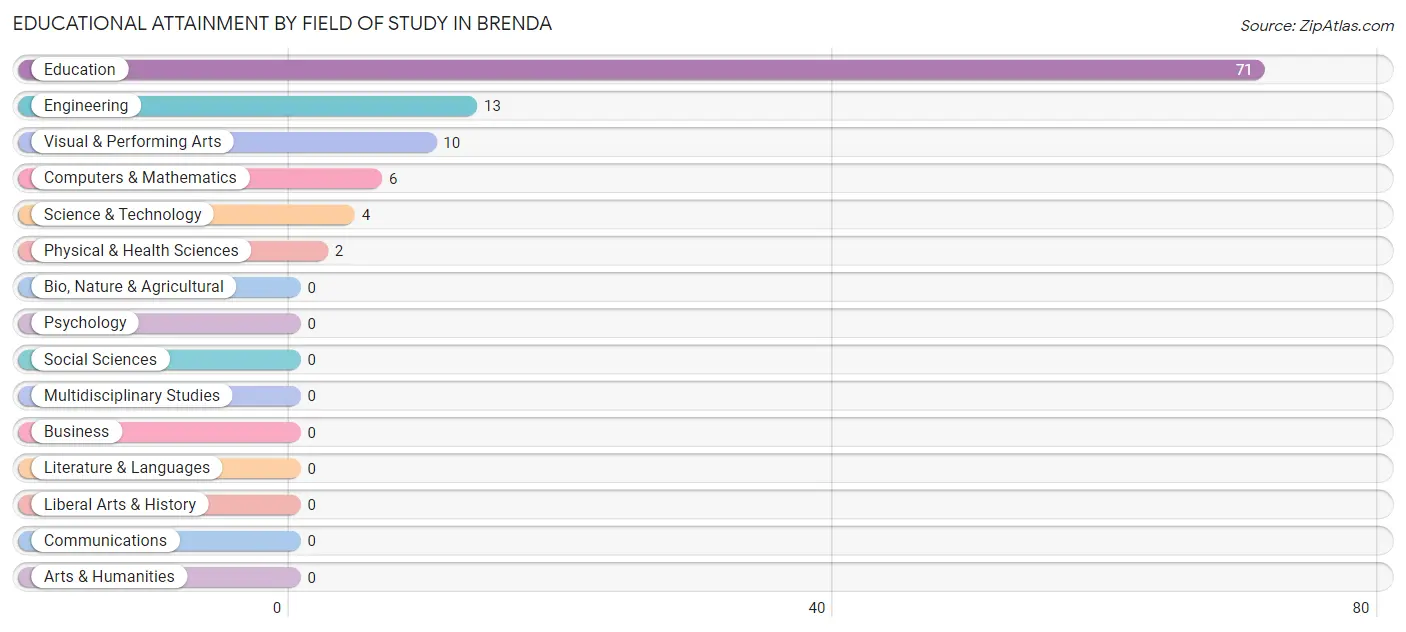
| Field of Study | # Graduates | % Graduates |
| Computers & Mathematics | 6 | 5.7% |
| Bio, Nature & Agricultural | 0 | 0.0% |
| Physical & Health Sciences | 2 | 1.9% |
| Psychology | 0 | 0.0% |
| Social Sciences | 0 | 0.0% |
| Engineering | 13 | 12.3% |
| Multidisciplinary Studies | 0 | 0.0% |
| Science & Technology | 4 | 3.8% |
| Business | 0 | 0.0% |
| Education | 71 | 67.0% |
| Literature & Languages | 0 | 0.0% |
| Liberal Arts & History | 0 | 0.0% |
| Visual & Performing Arts | 10 | 9.4% |
| Communications | 0 | 0.0% |
| Arts & Humanities | 0 | 0.0% |
| Total | 106 | 100.0% |
Transportation & Commute in Brenda
Vehicle Availability by Sex in Brenda
The most prevalent vehicle ownership categories in Brenda are males with 2 vehicles (10, accounting for 100.0%) and females with 2 vehicles (70, making up 12.0%).
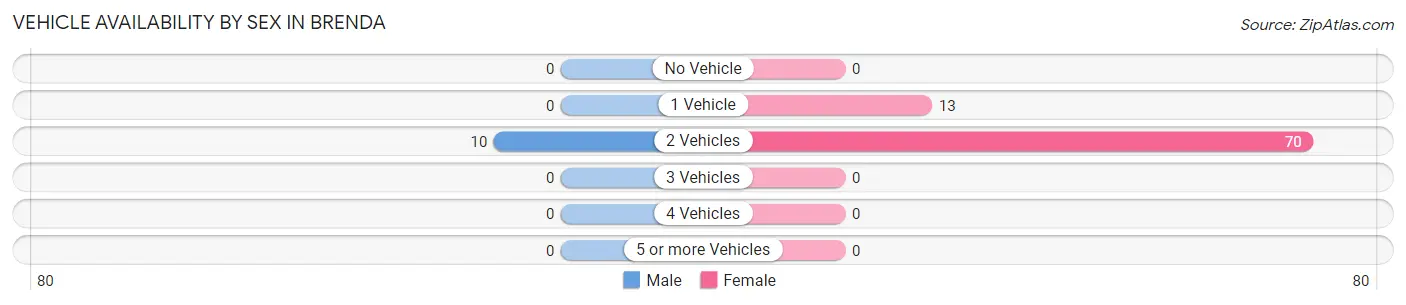
| Vehicles Available | Male | Female |
| No Vehicle | 0 (0.0%) | 0 (0.0%) |
| 1 Vehicle | 0 (0.0%) | 13 (15.7%) |
| 2 Vehicles | 10 (100.0%) | 70 (84.3%) |
| 3 Vehicles | 0 (0.0%) | 0 (0.0%) |
| 4 Vehicles | 0 (0.0%) | 0 (0.0%) |
| 5 or more Vehicles | 0 (0.0%) | 0 (0.0%) |
| Total | 10 (100.0%) | 83 (100.0%) |
Commute Time in Brenda
The most frequently occuring commute durations in Brenda are 20 to 24 minutes (29 commuters, 96.7%), 15 to 19 minutes (1 commuters, 3.3%), and less than 5 minutes (0 commuters, 0.0%).
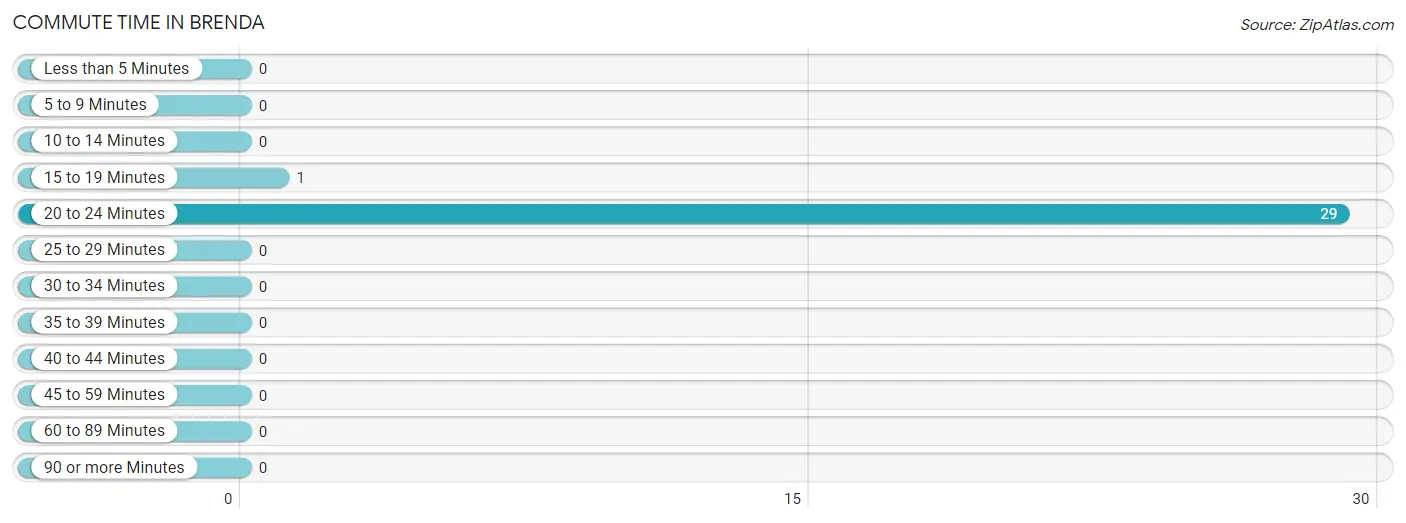
| Commute Time | # Commuters | % Commuters |
| Less than 5 Minutes | 0 | 0.0% |
| 5 to 9 Minutes | 0 | 0.0% |
| 10 to 14 Minutes | 0 | 0.0% |
| 15 to 19 Minutes | 1 | 3.3% |
| 20 to 24 Minutes | 29 | 96.7% |
| 25 to 29 Minutes | 0 | 0.0% |
| 30 to 34 Minutes | 0 | 0.0% |
| 35 to 39 Minutes | 0 | 0.0% |
| 40 to 44 Minutes | 0 | 0.0% |
| 45 to 59 Minutes | 0 | 0.0% |
| 60 to 89 Minutes | 0 | 0.0% |
| 90 or more Minutes | 0 | 0.0% |
Commute Time by Sex in Brenda
The most common commute times in Brenda are 20 to 24 minutes (10 commuters, 100.0%) for males and 20 to 24 minutes (19 commuters, 95.0%) for females.
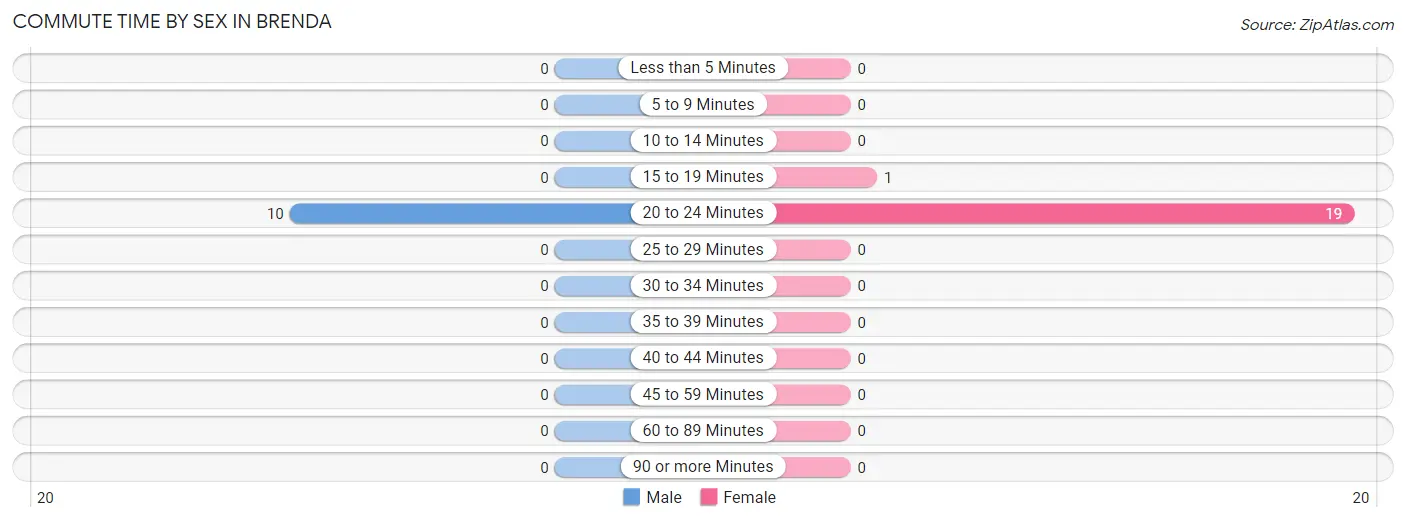
| Commute Time | Male | Female |
| Less than 5 Minutes | 0 (0.0%) | 0 (0.0%) |
| 5 to 9 Minutes | 0 (0.0%) | 0 (0.0%) |
| 10 to 14 Minutes | 0 (0.0%) | 0 (0.0%) |
| 15 to 19 Minutes | 0 (0.0%) | 1 (5.0%) |
| 20 to 24 Minutes | 10 (100.0%) | 19 (95.0%) |
| 25 to 29 Minutes | 0 (0.0%) | 0 (0.0%) |
| 30 to 34 Minutes | 0 (0.0%) | 0 (0.0%) |
| 35 to 39 Minutes | 0 (0.0%) | 0 (0.0%) |
| 40 to 44 Minutes | 0 (0.0%) | 0 (0.0%) |
| 45 to 59 Minutes | 0 (0.0%) | 0 (0.0%) |
| 60 to 89 Minutes | 0 (0.0%) | 0 (0.0%) |
| 90 or more Minutes | 0 (0.0%) | 0 (0.0%) |
Time of Departure to Work by Sex in Brenda
The most frequent times of departure to work in Brenda are 6:00 AM to 6:29 AM (10, 100.0%) for males and 6:30 AM to 6:59 AM (13, 65.0%) for females.
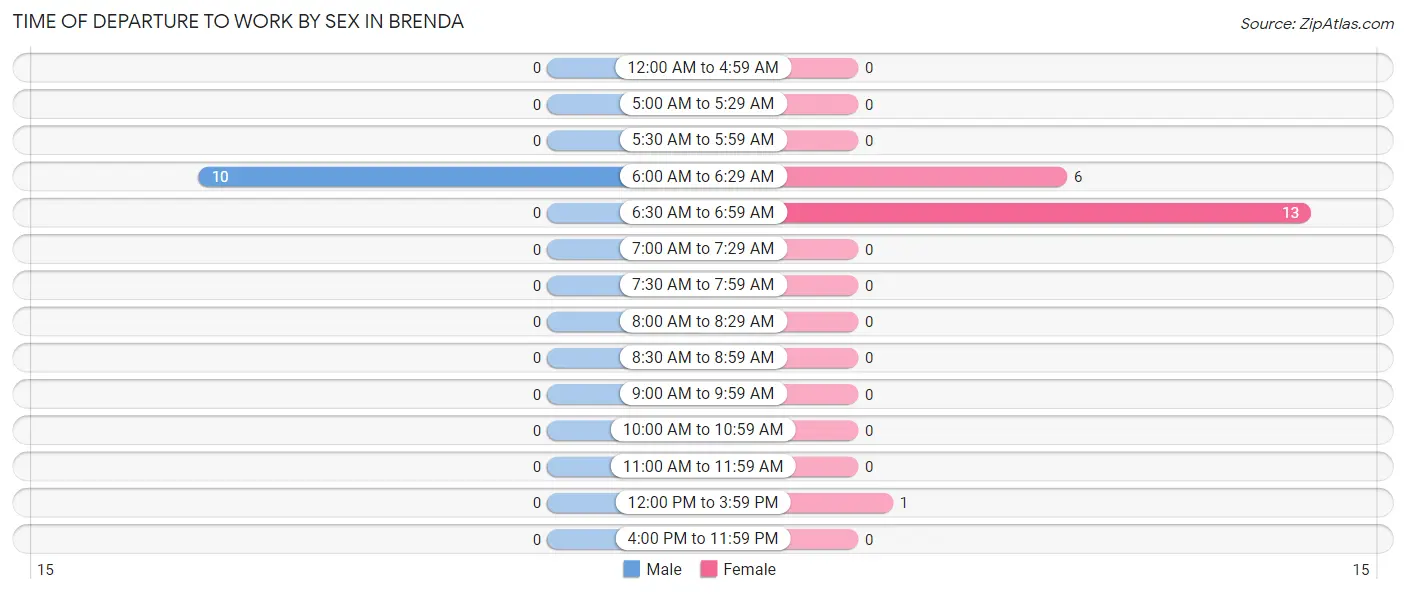
| Time of Departure | Male | Female |
| 12:00 AM to 4:59 AM | 0 (0.0%) | 0 (0.0%) |
| 5:00 AM to 5:29 AM | 0 (0.0%) | 0 (0.0%) |
| 5:30 AM to 5:59 AM | 0 (0.0%) | 0 (0.0%) |
| 6:00 AM to 6:29 AM | 10 (100.0%) | 6 (30.0%) |
| 6:30 AM to 6:59 AM | 0 (0.0%) | 13 (65.0%) |
| 7:00 AM to 7:29 AM | 0 (0.0%) | 0 (0.0%) |
| 7:30 AM to 7:59 AM | 0 (0.0%) | 0 (0.0%) |
| 8:00 AM to 8:29 AM | 0 (0.0%) | 0 (0.0%) |
| 8:30 AM to 8:59 AM | 0 (0.0%) | 0 (0.0%) |
| 9:00 AM to 9:59 AM | 0 (0.0%) | 0 (0.0%) |
| 10:00 AM to 10:59 AM | 0 (0.0%) | 0 (0.0%) |
| 11:00 AM to 11:59 AM | 0 (0.0%) | 0 (0.0%) |
| 12:00 PM to 3:59 PM | 0 (0.0%) | 1 (5.0%) |
| 4:00 PM to 11:59 PM | 0 (0.0%) | 0 (0.0%) |
| Total | 10 (100.0%) | 20 (100.0%) |
Housing Occupancy in Brenda
Occupancy by Ownership in Brenda
Of the total 405 dwellings in Brenda, owner-occupied units account for 405 (100.0%), while renter-occupied units make up 0 (0.0%).
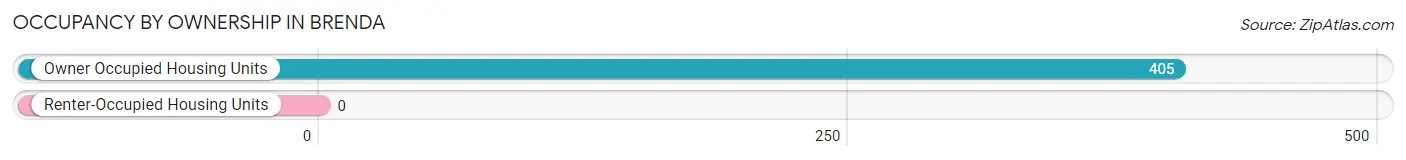
| Occupancy | # Housing Units | % Housing Units |
| Owner Occupied Housing Units | 405 | 100.0% |
| Renter-Occupied Housing Units | 0 | 0.0% |
| Total Occupied Housing Units | 405 | 100.0% |
Occupancy by Household Size in Brenda
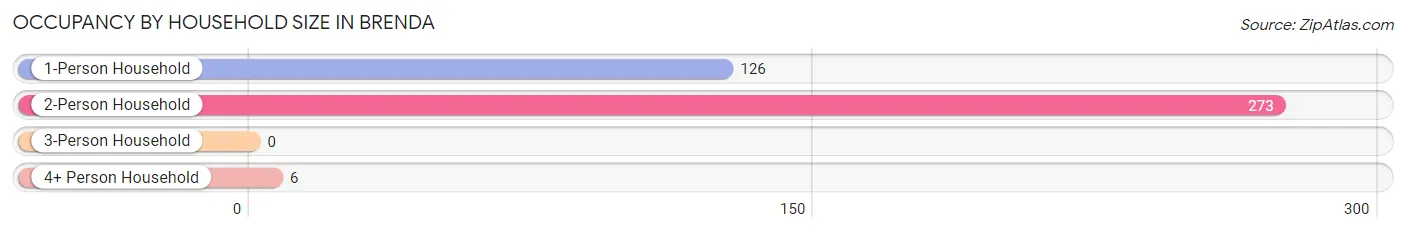
| Household Size | # Housing Units | % Housing Units |
| 1-Person Household | 126 | 31.1% |
| 2-Person Household | 273 | 67.4% |
| 3-Person Household | 0 | 0.0% |
| 4+ Person Household | 6 | 1.5% |
| Total Housing Units | 405 | 100.0% |
Occupancy by Ownership by Household Size in Brenda
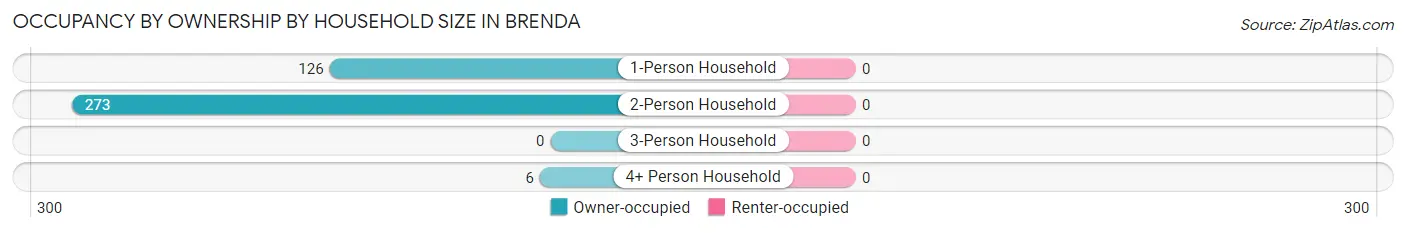
| Household Size | Owner-occupied | Renter-occupied |
| 1-Person Household | 126 (100.0%) | 0 (0.0%) |
| 2-Person Household | 273 (100.0%) | 0 (0.0%) |
| 3-Person Household | 0 (0.0%) | 0 (0.0%) |
| 4+ Person Household | 6 (100.0%) | 0 (0.0%) |
| Total Housing Units | 405 (100.0%) | 0 (0.0%) |
Occupancy by Educational Attainment in Brenda
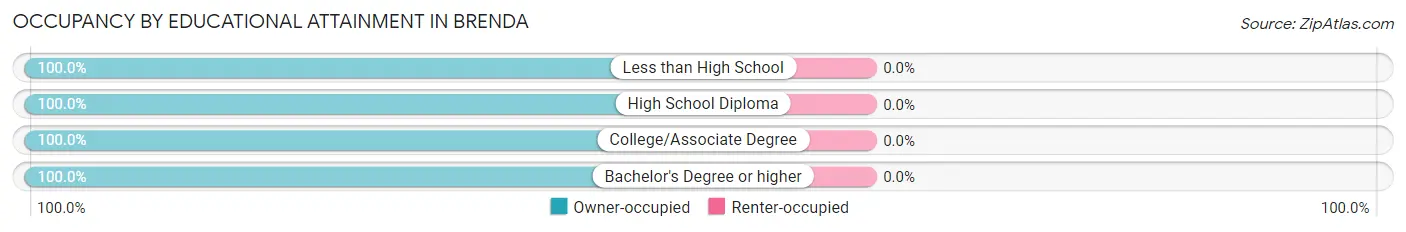
| Household Size | Owner-occupied | Renter-occupied |
| Less than High School | 56 (100.0%) | 0 (0.0%) |
| High School Diploma | 113 (100.0%) | 0 (0.0%) |
| College/Associate Degree | 144 (100.0%) | 0 (0.0%) |
| Bachelor's Degree or higher | 92 (100.0%) | 0 (0.0%) |
Occupancy by Age of Householder in Brenda
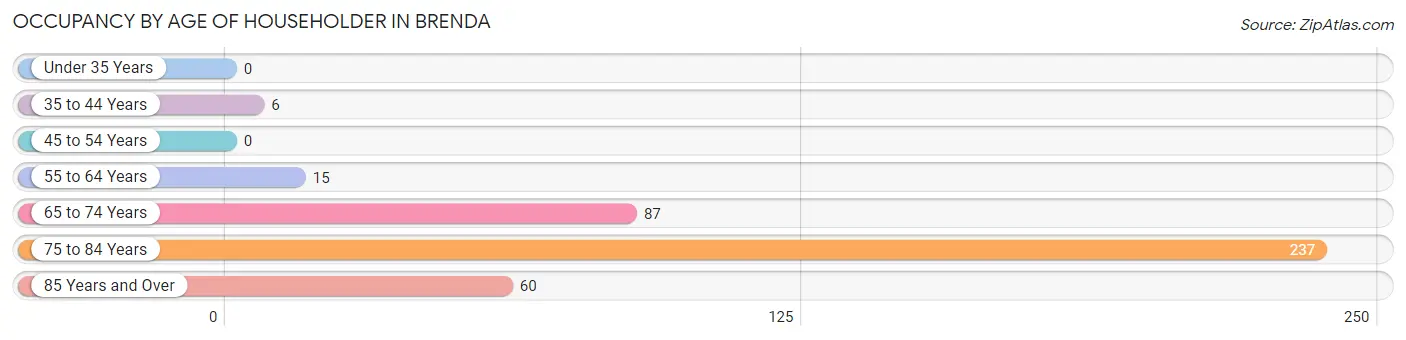
| Age Bracket | # Households | % Households |
| Under 35 Years | 0 | 0.0% |
| 35 to 44 Years | 6 | 1.5% |
| 45 to 54 Years | 0 | 0.0% |
| 55 to 64 Years | 15 | 3.7% |
| 65 to 74 Years | 87 | 21.5% |
| 75 to 84 Years | 237 | 58.5% |
| 85 Years and Over | 60 | 14.8% |
| Total | 405 | 100.0% |
Housing Finances in Brenda
Median Income by Occupancy in Brenda
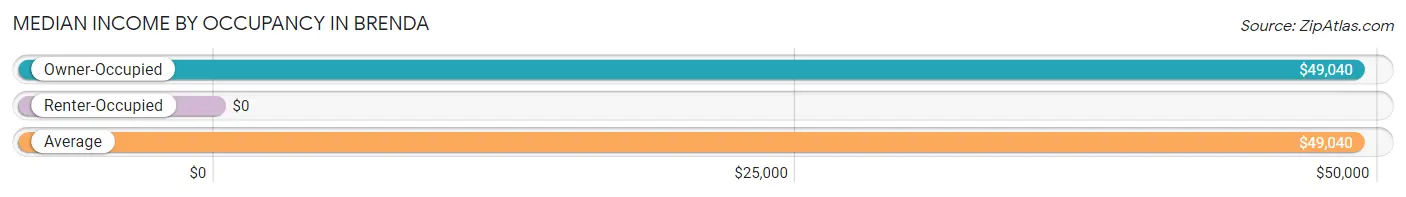
| Occupancy Type | # Households | Median Income |
| Owner-Occupied | 405 (100.0%) | $49,040 |
| Renter-Occupied | 0 (0.0%) | $0 |
| Average | 405 (100.0%) | $49,040 |
Occupancy by Householder Income Bracket in Brenda
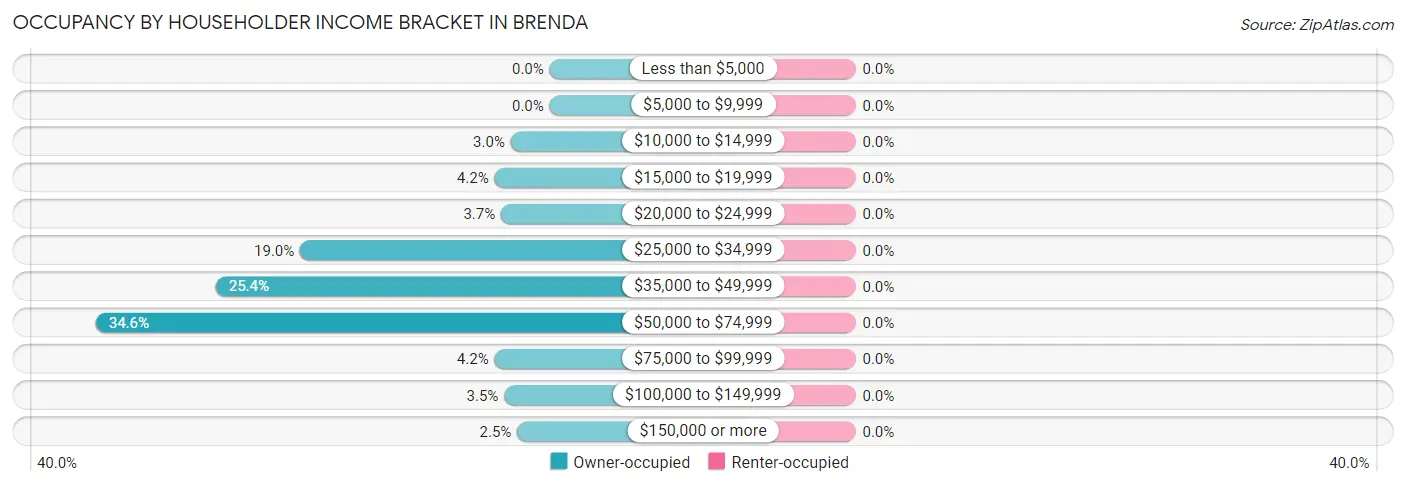
| Income Bracket | Owner-occupied | Renter-occupied |
| Less than $5,000 | 0 (0.0%) | 0 (0.0%) |
| $5,000 to $9,999 | 0 (0.0%) | 0 (0.0%) |
| $10,000 to $14,999 | 12 (3.0%) | 0 (0.0%) |
| $15,000 to $19,999 | 17 (4.2%) | 0 (0.0%) |
| $20,000 to $24,999 | 15 (3.7%) | 0 (0.0%) |
| $25,000 to $34,999 | 77 (19.0%) | 0 (0.0%) |
| $35,000 to $49,999 | 103 (25.4%) | 0 (0.0%) |
| $50,000 to $74,999 | 140 (34.6%) | 0 (0.0%) |
| $75,000 to $99,999 | 17 (4.2%) | 0 (0.0%) |
| $100,000 to $149,999 | 14 (3.5%) | 0 (0.0%) |
| $150,000 or more | 10 (2.5%) | 0 (0.0%) |
| Total | 405 (100.0%) | 0 (0.0%) |
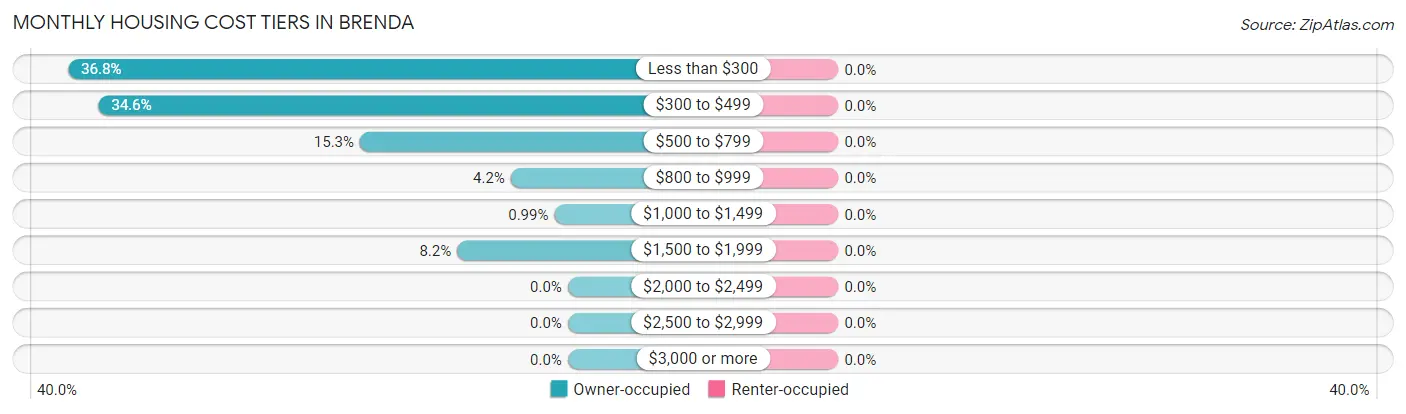
Monthly Housing Cost Tiers in Brenda
| Monthly Cost | Owner-occupied | Renter-occupied |
| Less than $300 | 149 (36.8%) | 0 (0.0%) |
| $300 to $499 | 140 (34.6%) | 0 (0.0%) |
| $500 to $799 | 62 (15.3%) | 0 (0.0%) |
| $800 to $999 | 17 (4.2%) | 0 (0.0%) |
| $1,000 to $1,499 | 4 (1.0%) | 0 (0.0%) |
| $1,500 to $1,999 | 33 (8.2%) | 0 (0.0%) |
| $2,000 to $2,499 | 0 (0.0%) | 0 (0.0%) |
| $2,500 to $2,999 | 0 (0.0%) | 0 (0.0%) |
| $3,000 or more | 0 (0.0%) | 0 (0.0%) |
| Total | 405 (100.0%) | 0 (0.0%) |
Physical Housing Characteristics in Brenda
Housing Structures in Brenda
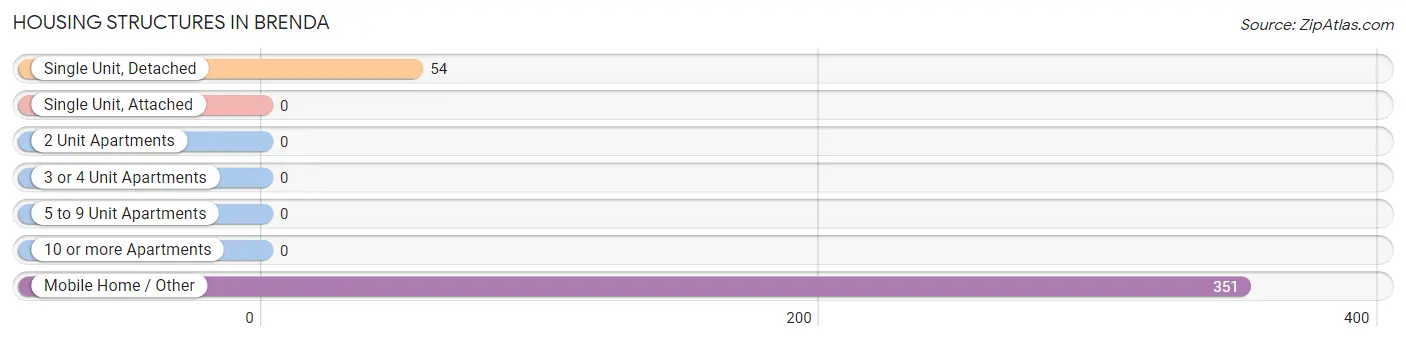
| Structure Type | # Housing Units | % Housing Units |
| Single Unit, Detached | 54 | 13.3% |
| Single Unit, Attached | 0 | 0.0% |
| 2 Unit Apartments | 0 | 0.0% |
| 3 or 4 Unit Apartments | 0 | 0.0% |
| 5 to 9 Unit Apartments | 0 | 0.0% |
| 10 or more Apartments | 0 | 0.0% |
| Mobile Home / Other | 351 | 86.7% |
| Total | 405 | 100.0% |
Housing Structures by Occupancy in Brenda
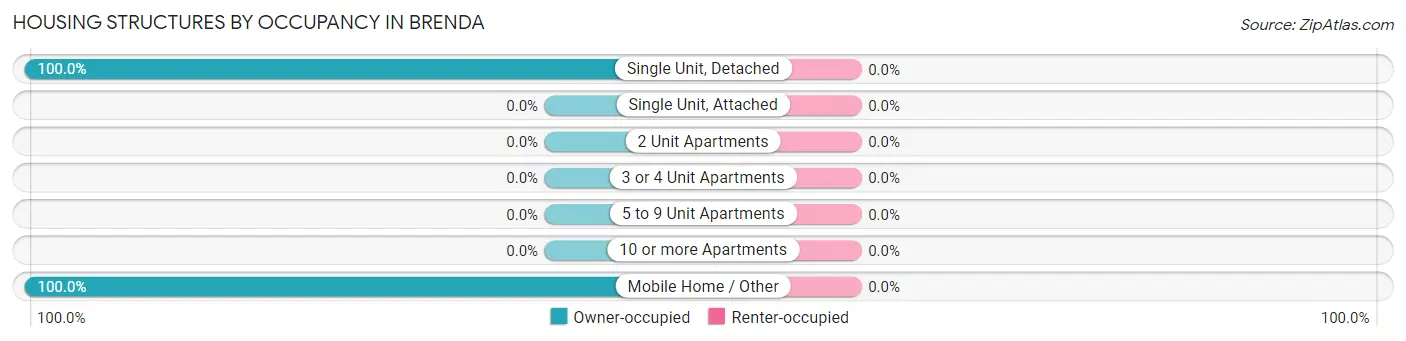
| Structure Type | Owner-occupied | Renter-occupied |
| Single Unit, Detached | 54 (100.0%) | 0 (0.0%) |
| Single Unit, Attached | 0 (0.0%) | 0 (0.0%) |
| 2 Unit Apartments | 0 (0.0%) | 0 (0.0%) |
| 3 or 4 Unit Apartments | 0 (0.0%) | 0 (0.0%) |
| 5 to 9 Unit Apartments | 0 (0.0%) | 0 (0.0%) |
| 10 or more Apartments | 0 (0.0%) | 0 (0.0%) |
| Mobile Home / Other | 351 (100.0%) | 0 (0.0%) |
| Total | 405 (100.0%) | 0 (0.0%) |
Housing Structures by Number of Rooms in Brenda
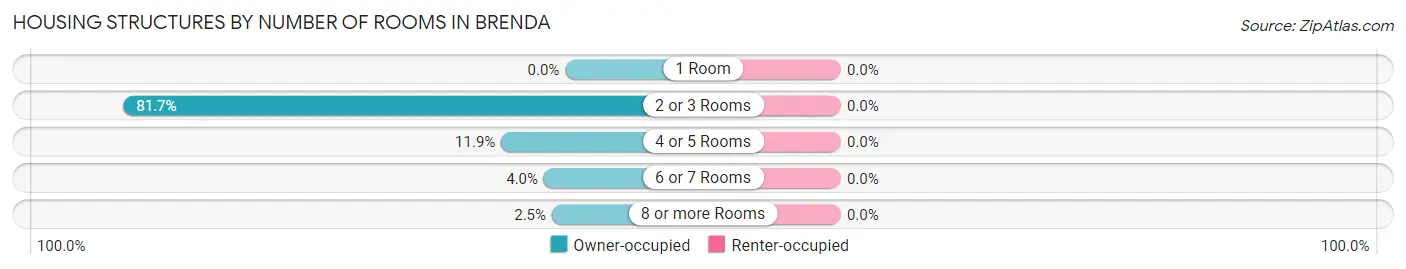
| Number of Rooms | Owner-occupied | Renter-occupied |
| 1 Room | 0 (0.0%) | 0 (0.0%) |
| 2 or 3 Rooms | 331 (81.7%) | 0 (0.0%) |
| 4 or 5 Rooms | 48 (11.8%) | 0 (0.0%) |
| 6 or 7 Rooms | 16 (4.0%) | 0 (0.0%) |
| 8 or more Rooms | 10 (2.5%) | 0 (0.0%) |
| Total | 405 (100.0%) | 0 (0.0%) |
Housing Structure by Heating Type in Brenda
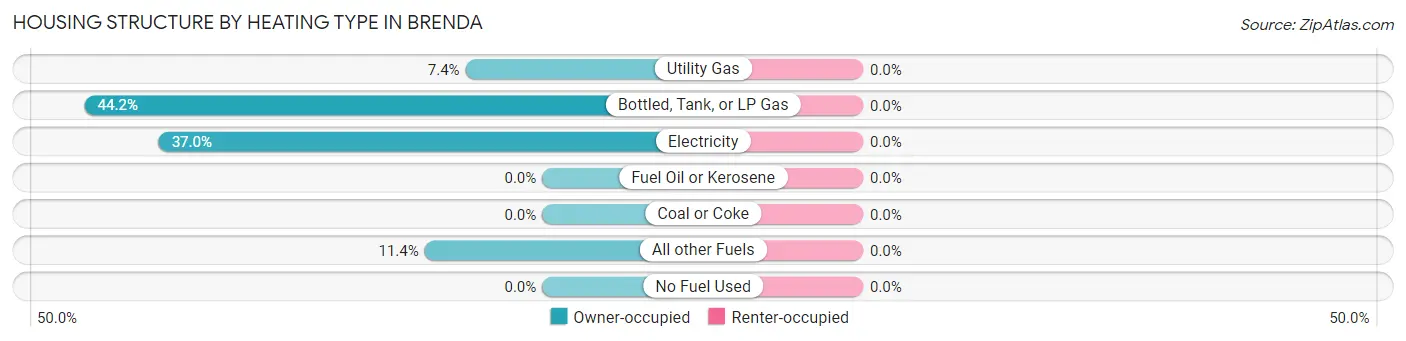
| Heating Type | Owner-occupied | Renter-occupied |
| Utility Gas | 30 (7.4%) | 0 (0.0%) |
| Bottled, Tank, or LP Gas | 179 (44.2%) | 0 (0.0%) |
| Electricity | 150 (37.0%) | 0 (0.0%) |
| Fuel Oil or Kerosene | 0 (0.0%) | 0 (0.0%) |
| Coal or Coke | 0 (0.0%) | 0 (0.0%) |
| All other Fuels | 46 (11.4%) | 0 (0.0%) |
| No Fuel Used | 0 (0.0%) | 0 (0.0%) |
| Total | 405 (100.0%) | 0 (0.0%) |
Household Vehicle Usage in Brenda
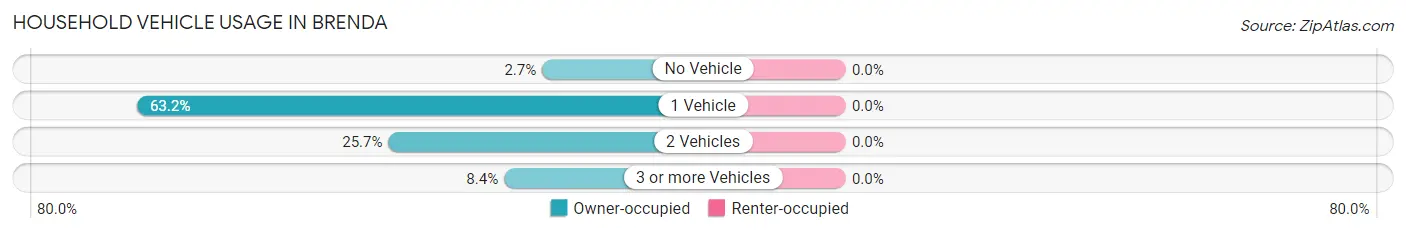
| Vehicles per Household | Owner-occupied | Renter-occupied |
| No Vehicle | 11 (2.7%) | 0 (0.0%) |
| 1 Vehicle | 256 (63.2%) | 0 (0.0%) |
| 2 Vehicles | 104 (25.7%) | 0 (0.0%) |
| 3 or more Vehicles | 34 (8.4%) | 0 (0.0%) |
| Total | 405 (100.0%) | 0 (0.0%) |
Real Estate & Mortgages in Brenda
Real Estate and Mortgage Overview in Brenda
| Characteristic | Without Mortgage | With Mortgage |
| Housing Units | 360 | 45 |
| Median Property Value | $58,500 | $215,900 |
| Median Household Income | $48,214 | $0 |
| Monthly Housing Costs | $384 | $0 |
| Real Estate Taxes | $401 | $33 |
Property Value by Mortgage Status in Brenda
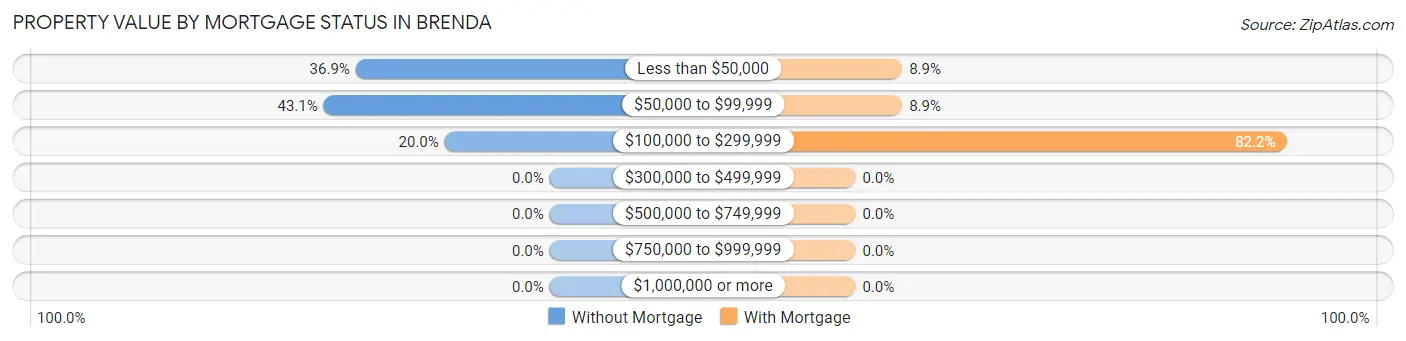
| Property Value | Without Mortgage | With Mortgage |
| Less than $50,000 | 133 (36.9%) | 4 (8.9%) |
| $50,000 to $99,999 | 155 (43.1%) | 4 (8.9%) |
| $100,000 to $299,999 | 72 (20.0%) | 37 (82.2%) |
| $300,000 to $499,999 | 0 (0.0%) | 0 (0.0%) |
| $500,000 to $749,999 | 0 (0.0%) | 0 (0.0%) |
| $750,000 to $999,999 | 0 (0.0%) | 0 (0.0%) |
| $1,000,000 or more | 0 (0.0%) | 0 (0.0%) |
| Total | 360 (100.0%) | 45 (100.0%) |
Household Income by Mortgage Status in Brenda
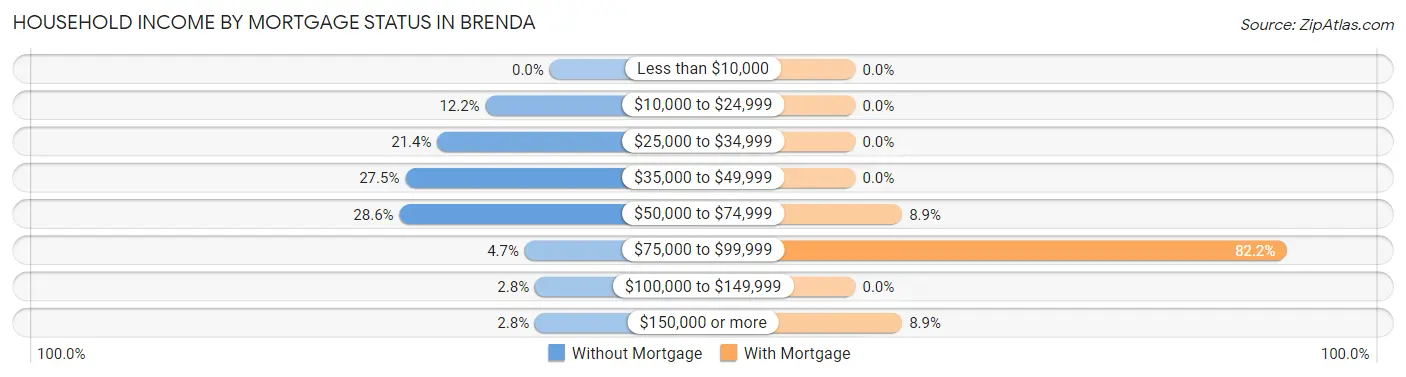
| Household Income | Without Mortgage | With Mortgage |
| Less than $10,000 | 0 (0.0%) | 0 (0.0%) |
| $10,000 to $24,999 | 44 (12.2%) | 0 (0.0%) |
| $25,000 to $34,999 | 77 (21.4%) | 0 (0.0%) |
| $35,000 to $49,999 | 99 (27.5%) | 0 (0.0%) |
| $50,000 to $74,999 | 103 (28.6%) | 4 (8.9%) |
| $75,000 to $99,999 | 17 (4.7%) | 37 (82.2%) |
| $100,000 to $149,999 | 10 (2.8%) | 0 (0.0%) |
| $150,000 or more | 10 (2.8%) | 4 (8.9%) |
| Total | 360 (100.0%) | 45 (100.0%) |
Property Value to Household Income Ratio in Brenda
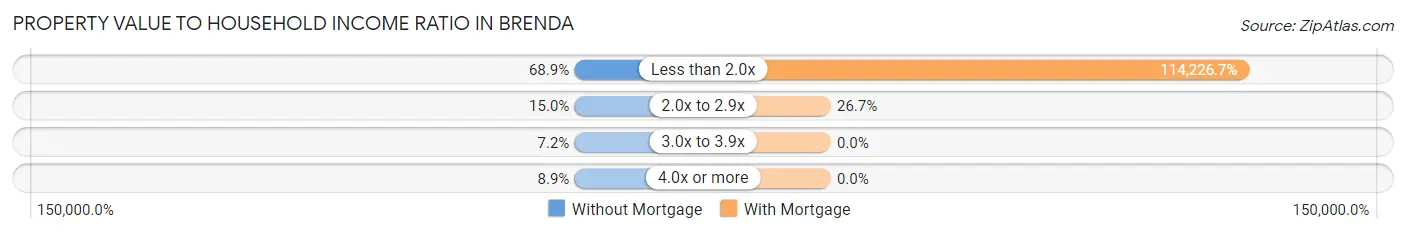
| Value-to-Income Ratio | Without Mortgage | With Mortgage |
| Less than 2.0x | 248 (68.9%) | 51,402 (114,226.7%) |
| 2.0x to 2.9x | 54 (15.0%) | 12 (26.7%) |
| 3.0x to 3.9x | 26 (7.2%) | 0 (0.0%) |
| 4.0x or more | 32 (8.9%) | 0 (0.0%) |
| Total | 360 (100.0%) | 45 (100.0%) |
Real Estate Taxes by Mortgage Status in Brenda
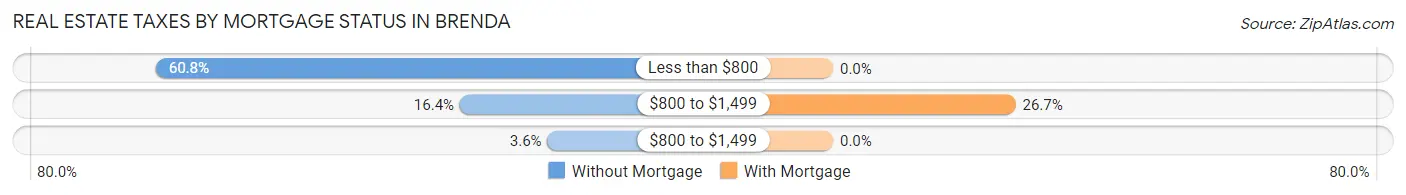
| Property Taxes | Without Mortgage | With Mortgage |
| Less than $800 | 219 (60.8%) | 0 (0.0%) |
| $800 to $1,499 | 59 (16.4%) | 12 (26.7%) |
| $800 to $1,499 | 13 (3.6%) | 0 (0.0%) |
| Total | 360 (100.0%) | 45 (100.0%) |
Health & Disability in Brenda
Health Insurance Coverage by Age in Brenda
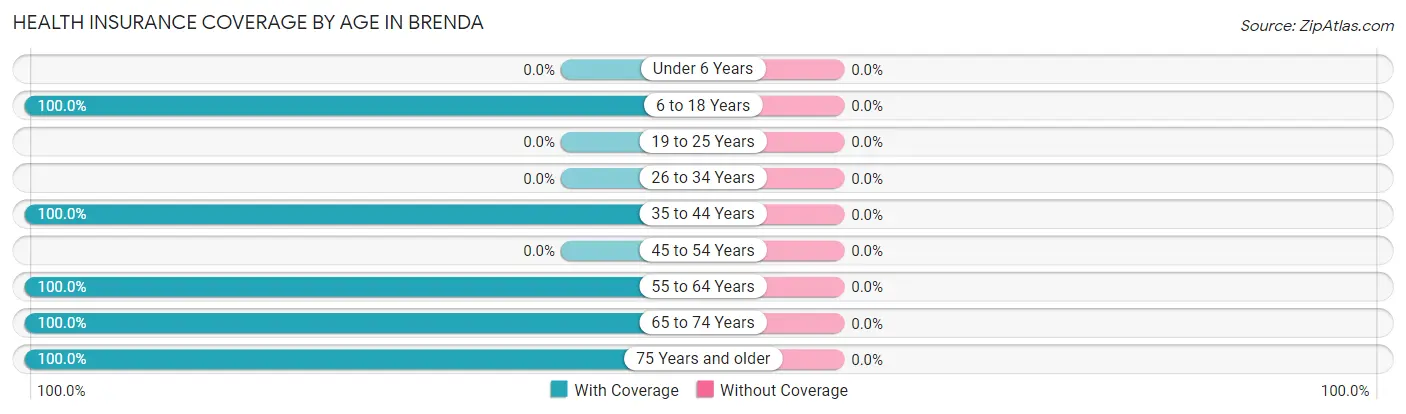
| Age Bracket | With Coverage | Without Coverage |
| Under 6 Years | 0 (0.0%) | 0 (0.0%) |
| 6 to 18 Years | 15 (100.0%) | 0 (0.0%) |
| 19 to 25 Years | 0 (0.0%) | 0 (0.0%) |
| 26 to 34 Years | 0 (0.0%) | 0 (0.0%) |
| 35 to 44 Years | 6 (100.0%) | 0 (0.0%) |
| 45 to 54 Years | 0 (0.0%) | 0 (0.0%) |
| 55 to 64 Years | 95 (100.0%) | 0 (0.0%) |
| 65 to 74 Years | 178 (100.0%) | 0 (0.0%) |
| 75 Years and older | 422 (100.0%) | 0 (0.0%) |
| Total | 716 (100.0%) | 0 (0.0%) |
Health Insurance Coverage by Citizenship Status in Brenda
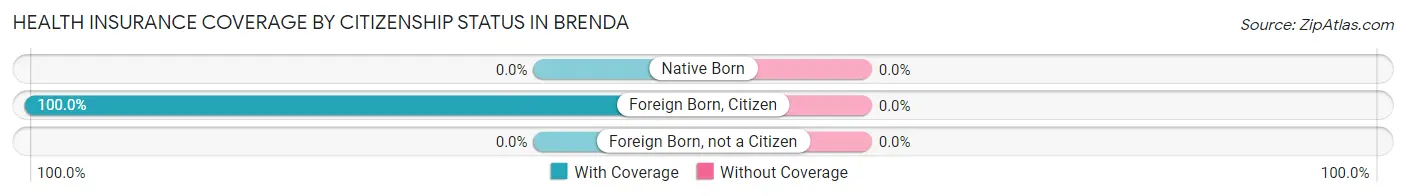
| Citizenship Status | With Coverage | Without Coverage |
| Native Born | 0 (0.0%) | 0 (0.0%) |
| Foreign Born, Citizen | 15 (100.0%) | 0 (0.0%) |
| Foreign Born, not a Citizen | 0 (0.0%) | 0 (0.0%) |
Health Insurance Coverage by Household Income in Brenda
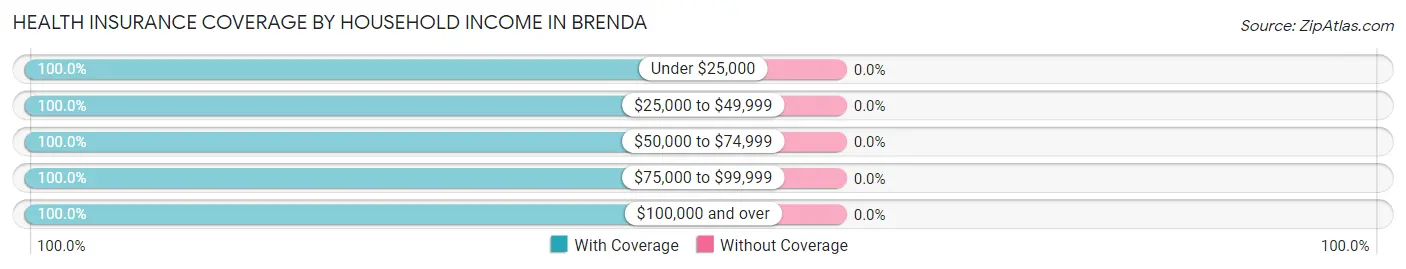
| Household Income | With Coverage | Without Coverage |
| Under $25,000 | 64 (100.0%) | 0 (0.0%) |
| $25,000 to $49,999 | 316 (100.0%) | 0 (0.0%) |
| $50,000 to $74,999 | 251 (100.0%) | 0 (0.0%) |
| $75,000 to $99,999 | 42 (100.0%) | 0 (0.0%) |
| $100,000 and over | 43 (100.0%) | 0 (0.0%) |
Public vs Private Health Insurance Coverage by Age in Brenda
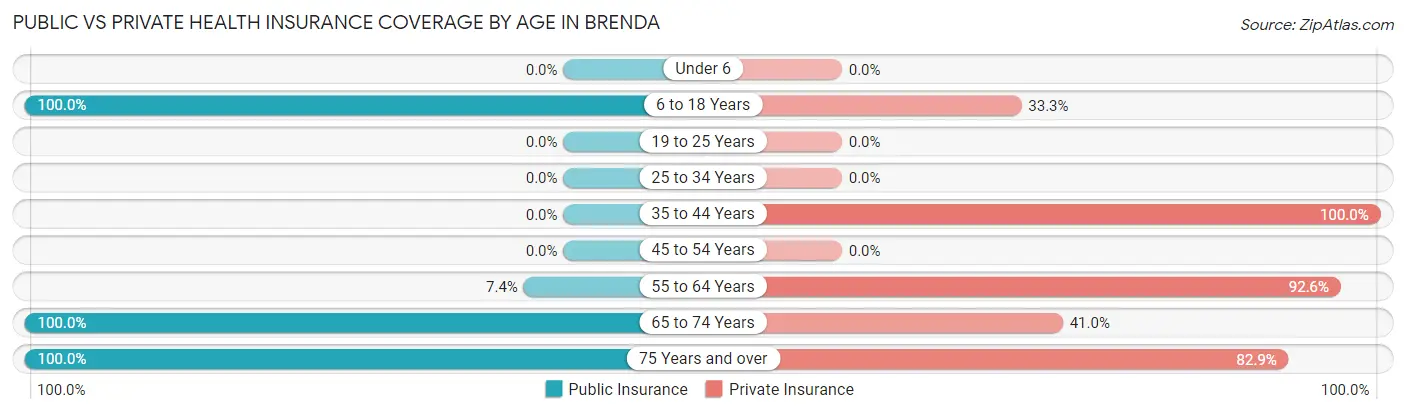
| Age Bracket | Public Insurance | Private Insurance |
| Under 6 | 0 (0.0%) | 0 (0.0%) |
| 6 to 18 Years | 15 (100.0%) | 5 (33.3%) |
| 19 to 25 Years | 0 (0.0%) | 0 (0.0%) |
| 25 to 34 Years | 0 (0.0%) | 0 (0.0%) |
| 35 to 44 Years | 0 (0.0%) | 6 (100.0%) |
| 45 to 54 Years | 0 (0.0%) | 0 (0.0%) |
| 55 to 64 Years | 7 (7.4%) | 88 (92.6%) |
| 65 to 74 Years | 178 (100.0%) | 73 (41.0%) |
| 75 Years and over | 422 (100.0%) | 350 (82.9%) |
| Total | 622 (86.9%) | 522 (72.9%) |
Disability Status by Sex by Age in Brenda
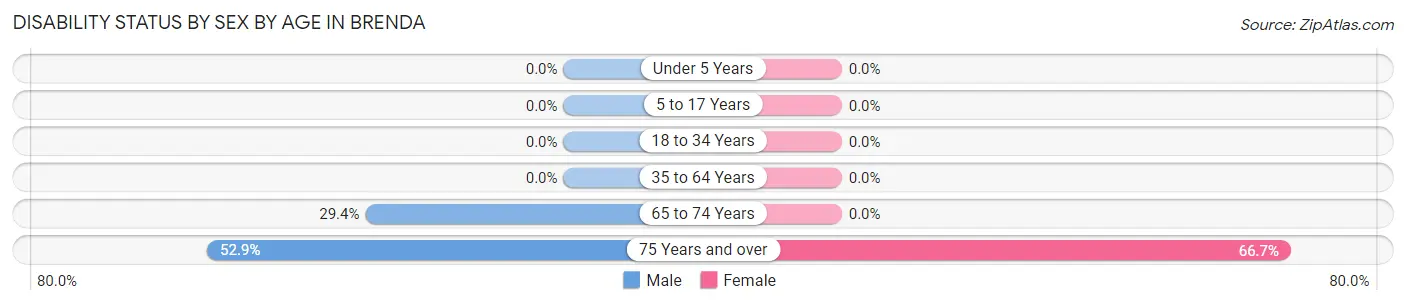
| Age Bracket | Male | Female |
| Under 5 Years | 0 (0.0%) | 0 (0.0%) |
| 5 to 17 Years | 0 (0.0%) | 0 (0.0%) |
| 18 to 34 Years | 0 (0.0%) | 0 (0.0%) |
| 35 to 64 Years | 0 (0.0%) | 0 (0.0%) |
| 65 to 74 Years | 25 (29.4%) | 0 (0.0%) |
| 75 Years and over | 128 (52.9%) | 120 (66.7%) |
Disability Class by Sex by Age in Brenda
Disability Class: Hearing Difficulty
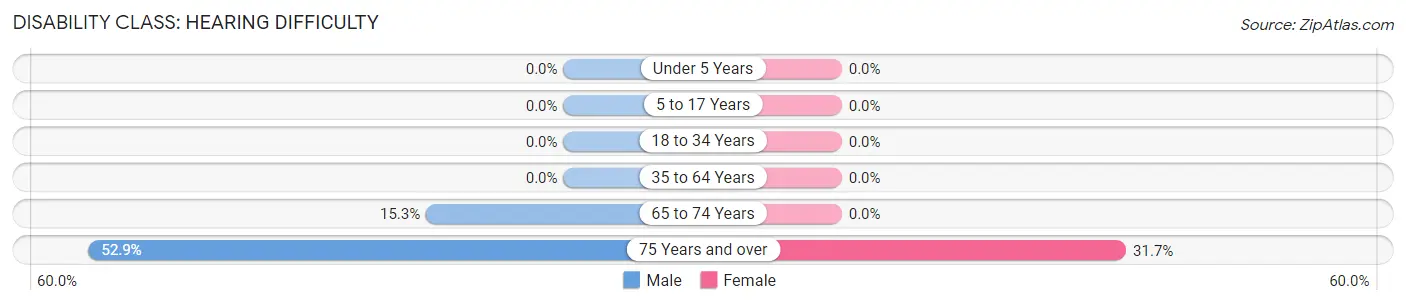
| Age Bracket | Male | Female |
| Under 5 Years | 0 (0.0%) | 0 (0.0%) |
| 5 to 17 Years | 0 (0.0%) | 0 (0.0%) |
| 18 to 34 Years | 0 (0.0%) | 0 (0.0%) |
| 35 to 64 Years | 0 (0.0%) | 0 (0.0%) |
| 65 to 74 Years | 13 (15.3%) | 0 (0.0%) |
| 75 Years and over | 128 (52.9%) | 57 (31.7%) |
Disability Class: Vision Difficulty
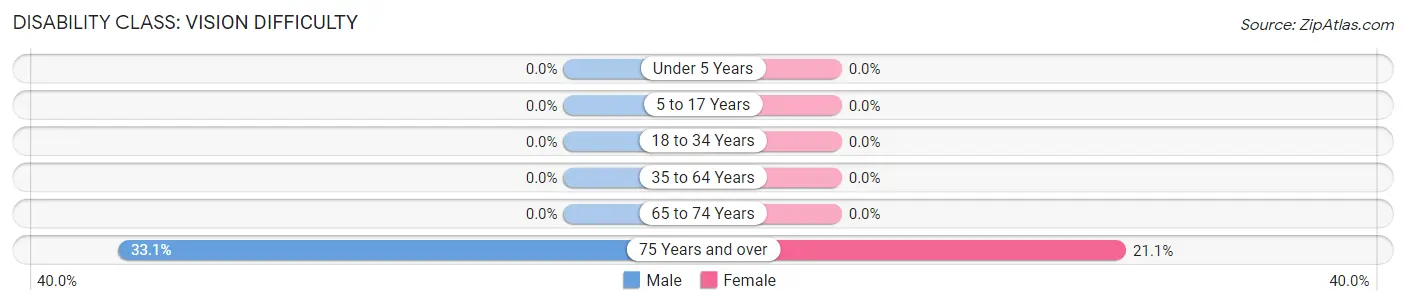
| Age Bracket | Male | Female |
| Under 5 Years | 0 (0.0%) | 0 (0.0%) |
| 5 to 17 Years | 0 (0.0%) | 0 (0.0%) |
| 18 to 34 Years | 0 (0.0%) | 0 (0.0%) |
| 35 to 64 Years | 0 (0.0%) | 0 (0.0%) |
| 65 to 74 Years | 0 (0.0%) | 0 (0.0%) |
| 75 Years and over | 80 (33.1%) | 38 (21.1%) |
Disability Class: Cognitive Difficulty
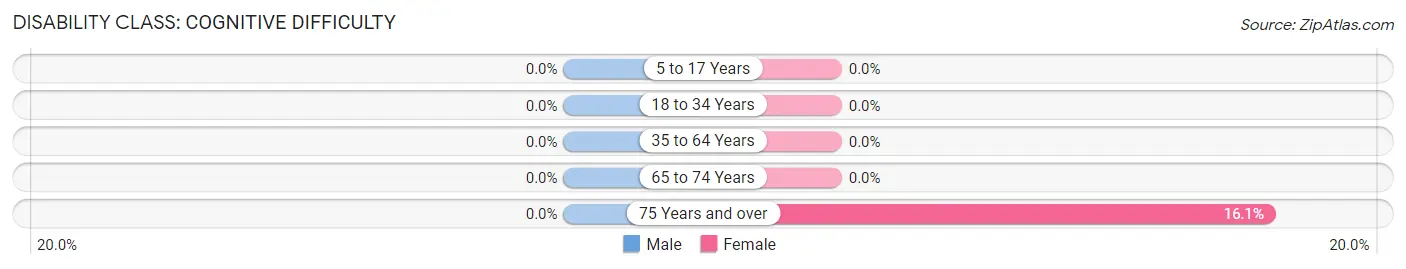
| Age Bracket | Male | Female |
| 5 to 17 Years | 0 (0.0%) | 0 (0.0%) |
| 18 to 34 Years | 0 (0.0%) | 0 (0.0%) |
| 35 to 64 Years | 0 (0.0%) | 0 (0.0%) |
| 65 to 74 Years | 0 (0.0%) | 0 (0.0%) |
| 75 Years and over | 0 (0.0%) | 29 (16.1%) |
Disability Class: Ambulatory Difficulty
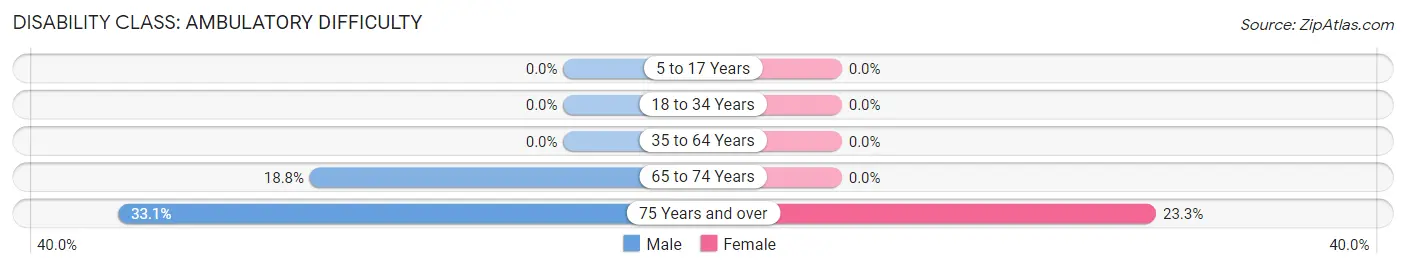
| Age Bracket | Male | Female |
| 5 to 17 Years | 0 (0.0%) | 0 (0.0%) |
| 18 to 34 Years | 0 (0.0%) | 0 (0.0%) |
| 35 to 64 Years | 0 (0.0%) | 0 (0.0%) |
| 65 to 74 Years | 16 (18.8%) | 0 (0.0%) |
| 75 Years and over | 80 (33.1%) | 42 (23.3%) |
Disability Class: Self-Care Difficulty
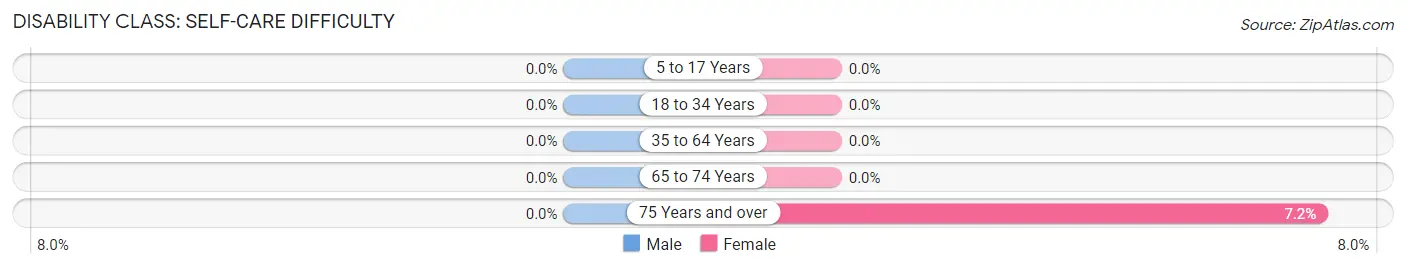
| Age Bracket | Male | Female |
| 5 to 17 Years | 0 (0.0%) | 0 (0.0%) |
| 18 to 34 Years | 0 (0.0%) | 0 (0.0%) |
| 35 to 64 Years | 0 (0.0%) | 0 (0.0%) |
| 65 to 74 Years | 0 (0.0%) | 0 (0.0%) |
| 75 Years and over | 0 (0.0%) | 13 (7.2%) |
Technology Access in Brenda
Computing Device Access in Brenda
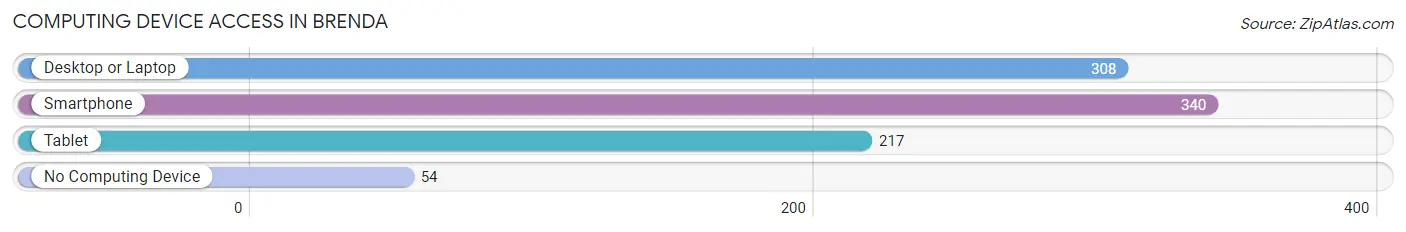
| Device Type | # Households | % Households |
| Desktop or Laptop | 308 | 76.0% |
| Smartphone | 340 | 84.0% |
| Tablet | 217 | 53.6% |
| No Computing Device | 54 | 13.3% |
| Total | 405 | 100.0% |
Internet Access in Brenda
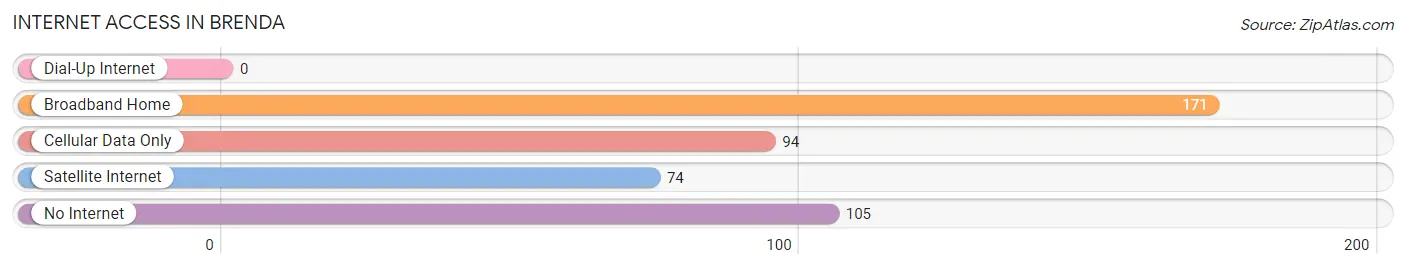
| Internet Type | # Households | % Households |
| Dial-Up Internet | 0 | 0.0% |
| Broadband Home | 171 | 42.2% |
| Cellular Data Only | 94 | 23.2% |
| Satellite Internet | 74 | 18.3% |
| No Internet | 105 | 25.9% |
| Total | 405 | 100.0% |
Brenda Summary
AZ History
Arizona is a state located in the southwestern region of the United States. It is the sixth largest state in the country and is bordered by California, Nevada, Utah, New Mexico, and Mexico. Arizona was admitted to the Union on February 14, 1912, becoming the 48th state. The state was named after the Arizonac River, which was named after the Spanish word for “little spring”.
The first inhabitants of Arizona were the Hohokam people, who lived in the area from around 300 BC to 1450 AD. They were a highly advanced civilization that built irrigation systems and constructed large villages. The Hohokam were eventually replaced by the Pueblo people, who were a more nomadic group. The Pueblo people were eventually replaced by the Apache and Navajo tribes, who were the dominant tribes in the area until the arrival of the Spanish in the 16th century.
The Spanish were the first Europeans to explore Arizona, and they established several missions and forts in the area. In 1821, Mexico gained independence from Spain and Arizona became part of the Mexican state of Sonora. In 1848, the United States acquired Arizona as part of the Treaty of Guadalupe Hidalgo, which ended the Mexican-American War.
In 1863, the Arizona Territory was created by the United States Congress. The territory was divided into four counties, and the capital was established in Prescott. In 1877, the first railroad was built in Arizona, connecting Prescott to the rest of the country.
In 1912, Arizona was admitted to the Union as the 48th state. The state’s population grew rapidly in the following decades, and by the 1950s, Arizona had become an important center for the aerospace industry. In the 1960s, Arizona became a popular tourist destination, and the state’s economy began to diversify.
AZ Geography
Arizona is located in the southwestern region of the United States. It is bordered by California, Nevada, Utah, New Mexico, and Mexico. The state has an area of 113,990 square miles, making it the sixth largest state in the country.
Arizona is divided into two distinct regions: the Colorado Plateau and the Basin and Range Province. The Colorado Plateau is a high desert region located in the northern part of the state. It is characterized by high plateaus, deep canyons, and mesas. The Basin and Range Province is located in the southern part of the state and is characterized by low mountains, valleys, and deserts.
The Colorado River forms the western border of Arizona and is the state’s most important river. Other major rivers in the state include the Gila, Salt, and Verde Rivers.
Arizona is home to several mountain ranges, including the San Francisco Peaks, the White Mountains, and the Chiricahua Mountains. The highest point in the state is Humphreys Peak, which has an elevation of 12,633 feet.
AZ Economy
Arizona’s economy is largely based on tourism, agriculture, and manufacturing. The state is home to several major industries, including aerospace, electronics, and semiconductor manufacturing.
Tourism is a major industry in Arizona, and the state is home to several popular tourist destinations, including the Grand Canyon, Monument Valley, and Sedona. The state also has several national parks, including Saguaro National Park and Petrified Forest National Park.
Agriculture is also an important part of the state’s economy. Arizona is one of the leading producers of cotton, lettuce, and citrus fruits in the United States. The state is also a major producer of cattle, sheep, and dairy products.
Manufacturing is also an important part of the state’s economy. Arizona is home to several major companies, including Intel, Honeywell, and Motorola. The state is also home to several military bases, including Davis-Monthan Air Force Base and Fort Huachuca.
AZ Demographics
As of 2019, the population of Arizona was estimated to be 7.2 million. The state has a population density of 57 people per square mile, making it the 15th most densely populated state in the country.
The largest city in Arizona is Phoenix, which has a population of 1.6 million. Other major cities in the state include Tucson, Mesa, Glendale, and Scottsdale.
The racial makeup of Arizona is 73.3% White, 4.7% Black, 4.2% Asian, and 1.7% Native American. The state also has a large Hispanic population, which makes up 30.2% of the population.
The median household income in Arizona is $56,581, and the median home value is $247,400. The state has a poverty rate of 16.2%, which is slightly higher than the national average.
Common Questions
What is Per Capita Income in Brenda?
Per Capita income in Brenda is $29,442.
What is the Median Family Income in Brenda?
Median Family Income in Brenda is $51,114.
What is the Median Household income in Brenda?
Median Household Income in Brenda is $49,040.
What is Inequality or Gini Index in Brenda?
Inequality or Gini Index in Brenda is 0.26.
What is the Total Population of Brenda?
Total Population of Brenda is 716.
What is the Total Male Population of Brenda?
Total Male Population of Brenda is 340.
What is the Total Female Population of Brenda?
Total Female Population of Brenda is 376.
What is the Ratio of Males per 100 Females in Brenda?
There are 90.43 Males per 100 Females in Brenda.
What is the Ratio of Females per 100 Males in Brenda?
There are 110.59 Females per 100 Males in Brenda.
What is the Median Population Age in Brenda?
Median Population Age in Brenda is 76.5 Years.
What is the Average Family Size in Brenda
Average Family Size in Brenda is 2.1 People.
What is the Average Household Size in Brenda
Average Household Size in Brenda is 1.8 People.
How Large is the Labor Force in Brenda?
There are 93 People in the Labor Forcein in Brenda.
What is the Percentage of People in the Labor Force in Brenda?
13.2% of People are in the Labor Force in Brenda.