Bartow, WV Map & Demographics
Bartow Map
Bartow Overview
$25,738
PER CAPITA INCOME
$75,982
AVG FAMILY INCOME
56.5%
WAGE / INCOME GAP [ % ]
43.5¢/ $1
WAGE / INCOME GAP [ $ ]
0.34
INEQUALITY / GINI INDEX
111
TOTAL POPULATION
46
MALE POPULATION
65
FEMALE POPULATION
70.77
MALES / 100 FEMALES
141.30
FEMALES / 100 MALES
63.5
MEDIAN AGE
2.9
AVG FAMILY SIZE
2.3
AVG HOUSEHOLD SIZE
40
LABOR FORCE [ PEOPLE ]
39.6%
PERCENT IN LABOR FORCE
Bartow Zip Codes
Bartow Area Codes
Income in Bartow
Income Overview in Bartow
| Characteristic | Number | Measure |
| Per Capita Income | 111 | $25,738 |
| Median Family Income | 33 | $75,982 |
| Mean Family Income | 33 | $77,809 |
| Median Household Income | 49 | $0 |
| Mean Household Income | 49 | $58,288 |
| Income Deficit | 33 | $0 |
| Wage / Income Gap (%) | 111 | 56.46% |
| Wage / Income Gap ($) | 111 | 43.54¢ per $1 |
| Gini / Inequality Index | 111 | 0.34 |
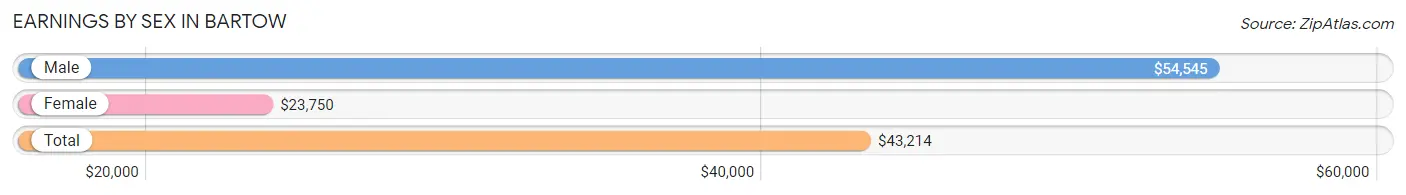
Earnings by Sex in Bartow
Average Earnings in Bartow are $43,214, $54,545 for men and $23,750 for women, a difference of 56.5%.
| Sex | Number | Average Earnings |
| Male | 18 (39.1%) | $54,545 |
| Female | 28 (60.9%) | $23,750 |
| Total | 46 (100.0%) | $43,214 |
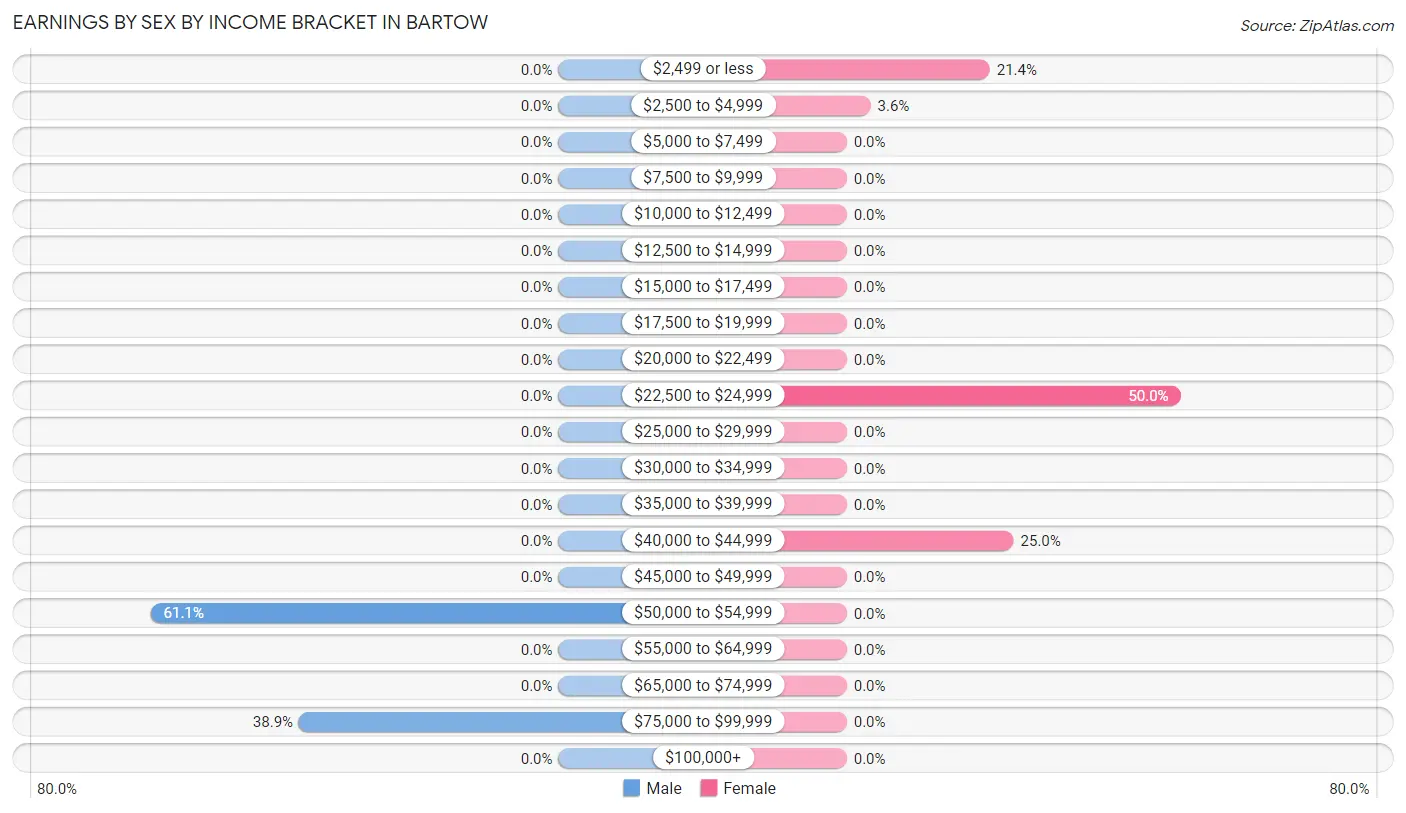
Earnings by Sex by Income Bracket in Bartow
The most common earnings brackets in Bartow are $50,000 to $54,999 for men (11 | 61.1%) and $22,500 to $24,999 for women (14 | 50.0%).
| Income | Male | Female |
| $2,499 or less | 0 (0.0%) | 6 (21.4%) |
| $2,500 to $4,999 | 0 (0.0%) | 1 (3.6%) |
| $5,000 to $7,499 | 0 (0.0%) | 0 (0.0%) |
| $7,500 to $9,999 | 0 (0.0%) | 0 (0.0%) |
| $10,000 to $12,499 | 0 (0.0%) | 0 (0.0%) |
| $12,500 to $14,999 | 0 (0.0%) | 0 (0.0%) |
| $15,000 to $17,499 | 0 (0.0%) | 0 (0.0%) |
| $17,500 to $19,999 | 0 (0.0%) | 0 (0.0%) |
| $20,000 to $22,499 | 0 (0.0%) | 0 (0.0%) |
| $22,500 to $24,999 | 0 (0.0%) | 14 (50.0%) |
| $25,000 to $29,999 | 0 (0.0%) | 0 (0.0%) |
| $30,000 to $34,999 | 0 (0.0%) | 0 (0.0%) |
| $35,000 to $39,999 | 0 (0.0%) | 0 (0.0%) |
| $40,000 to $44,999 | 0 (0.0%) | 7 (25.0%) |
| $45,000 to $49,999 | 0 (0.0%) | 0 (0.0%) |
| $50,000 to $54,999 | 11 (61.1%) | 0 (0.0%) |
| $55,000 to $64,999 | 0 (0.0%) | 0 (0.0%) |
| $65,000 to $74,999 | 0 (0.0%) | 0 (0.0%) |
| $75,000 to $99,999 | 7 (38.9%) | 0 (0.0%) |
| $100,000+ | 0 (0.0%) | 0 (0.0%) |
| Total | 18 (100.0%) | 28 (100.0%) |
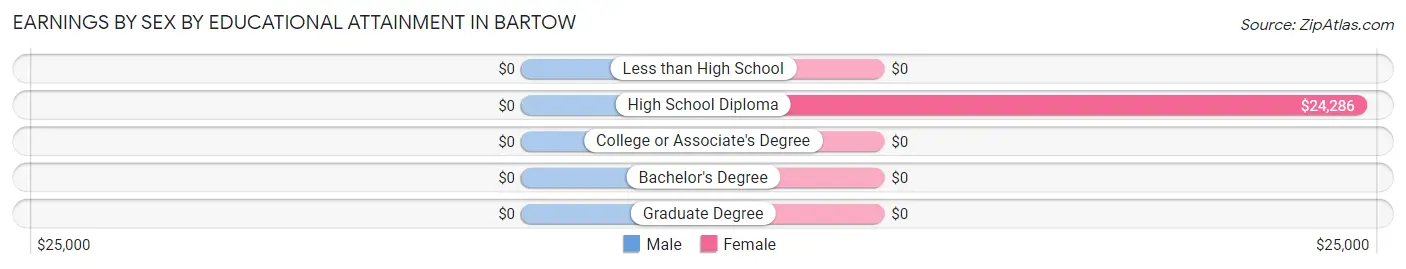
Earnings by Sex by Educational Attainment in Bartow
| Educational Attainment | Male Income | Female Income |
| Less than High School | - | - |
| High School Diploma | - | - |
| College or Associate's Degree | - | - |
| Bachelor's Degree | - | - |
| Graduate Degree | - | - |
| Total | $54,545 | $24,286 |
Family Income in Bartow
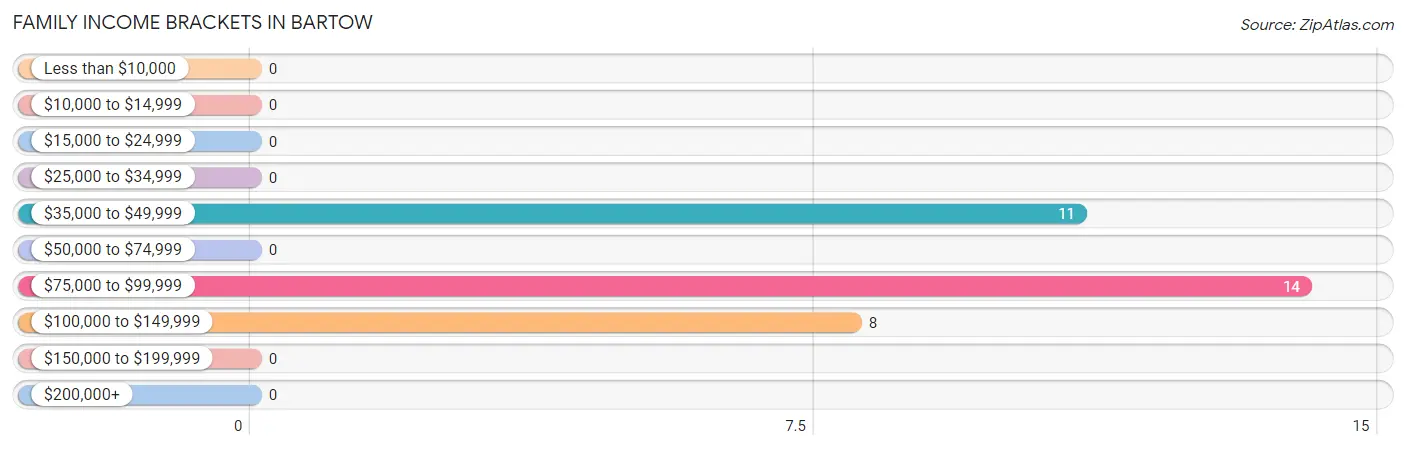
Family Income Brackets in Bartow
According to the Bartow family income data, there are 14 families falling into the $75,000 to $99,999 income range, which is the most common income bracket and makes up 42.4% of all families.
| Income Bracket | # Families | % Families |
| Less than $10,000 | 0 | 0.0% |
| $10,000 to $14,999 | 0 | 0.0% |
| $15,000 to $24,999 | 0 | 0.0% |
| $25,000 to $34,999 | 0 | 0.0% |
| $35,000 to $49,999 | 11 | 33.3% |
| $50,000 to $74,999 | 0 | 0.0% |
| $75,000 to $99,999 | 14 | 42.4% |
| $100,000 to $149,999 | 8 | 24.2% |
| $150,000 to $199,999 | 0 | 0.0% |
| $200,000+ | 0 | 0.0% |
Family Income by Famaliy Size in Bartow
| Income Bracket | # Families | Median Income |
| 2-Person Families | 12 (36.4%) | $0 |
| 3-Person Families | 21 (63.6%) | $0 |
| 4-Person Families | 0 (0.0%) | $0 |
| 5-Person Families | 0 (0.0%) | $0 |
| 6-Person Families | 0 (0.0%) | $0 |
| 7+ Person Families | 0 (0.0%) | $0 |
| Total | 33 (100.0%) | $75,982 |
Family Income by Number of Earners in Bartow
| Number of Earners | # Families | Median Income |
| No Earners | 11 (33.3%) | $0 |
| 1 Earner | 0 (0.0%) | $0 |
| 2 Earners | 15 (45.5%) | $0 |
| 3+ Earners | 7 (21.2%) | $0 |
| Total | 33 (100.0%) | $75,982 |
Household Income in Bartow
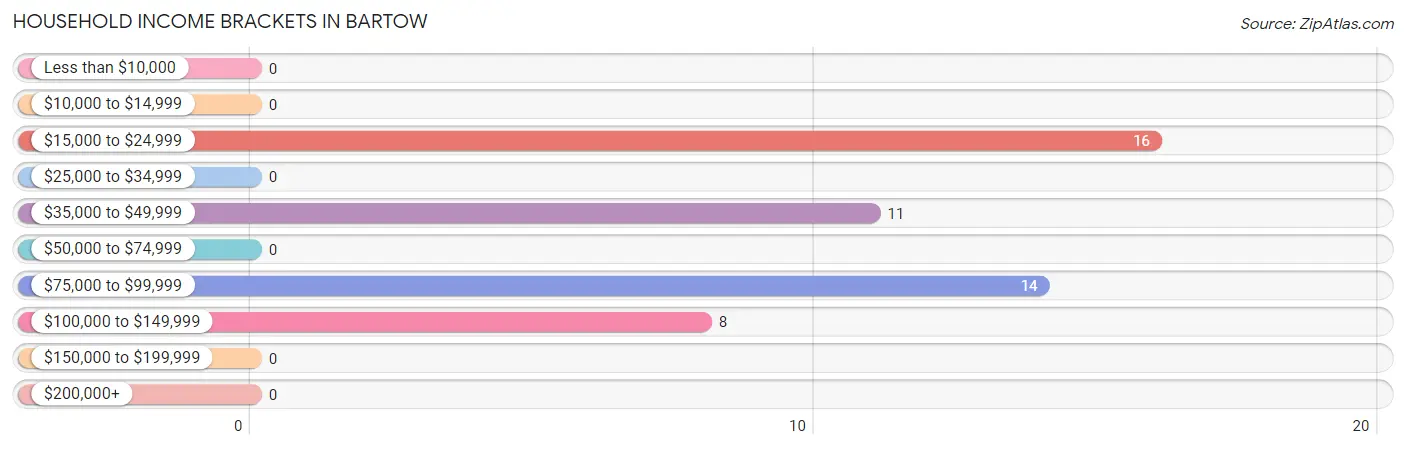
Household Income Brackets in Bartow
With 16 households falling in the category, the $15,000 to $24,999 income range is the most frequent in Bartow, accounting for 32.7% of all households.
| Income Bracket | # Households | % Households |
| Less than $10,000 | 0 | 0.0% |
| $10,000 to $14,999 | 0 | 0.0% |
| $15,000 to $24,999 | 16 | 32.7% |
| $25,000 to $34,999 | 0 | 0.0% |
| $35,000 to $49,999 | 11 | 22.4% |
| $50,000 to $74,999 | 0 | 0.0% |
| $75,000 to $99,999 | 14 | 28.6% |
| $100,000 to $149,999 | 8 | 16.3% |
| $150,000 to $199,999 | 0 | 0.0% |
| $200,000+ | 0 | 0.0% |
Household Income by Householder Age in Bartow
| Income Bracket | # Households | Median Income |
| 15 to 24 Years | 0 (0.0%) | $0 |
| 25 to 44 Years | 14 (28.6%) | $0 |
| 45 to 64 Years | 8 (16.3%) | $0 |
| 65+ Years | 27 (55.1%) | $0 |
| Total | 49 (100.0%) | $0 |
Poverty in Bartow
Income Below Poverty by Sex and Age in Bartow
| Age Bracket | Male | Female |
| Under 5 Years | 0 (0.0%) | 0 (0.0%) |
| 5 Years | 0 (0.0%) | 0 (0.0%) |
| 6 to 11 Years | 0 (0.0%) | 0 (0.0%) |
| 12 to 14 Years | 0 (0.0%) | 0 (0.0%) |
| 15 Years | 0 (0.0%) | 0 (0.0%) |
| 16 and 17 Years | 0 (0.0%) | 0 (0.0%) |
| 18 to 24 Years | 0 (0.0%) | 0 (0.0%) |
| 25 to 34 Years | 0 (0.0%) | 0 (0.0%) |
| 35 to 44 Years | 0 (0.0%) | 0 (0.0%) |
| 45 to 54 Years | 0 (0.0%) | 0 (0.0%) |
| 55 to 64 Years | 0 (0.0%) | 0 (0.0%) |
| 65 to 74 Years | 0 (0.0%) | 0 (0.0%) |
| 75 Years and over | 0 (0.0%) | 0 (0.0%) |
| Total | 0 (0.0%) | 0 (0.0%) |
Income Above Poverty by Sex and Age in Bartow
According to the poverty statistics in Bartow, males aged under 5 years and females aged 16 and 17 years are the age groups that are most secure financially, with 100.0% of males and 100.0% of females in these age groups living above the poverty line.
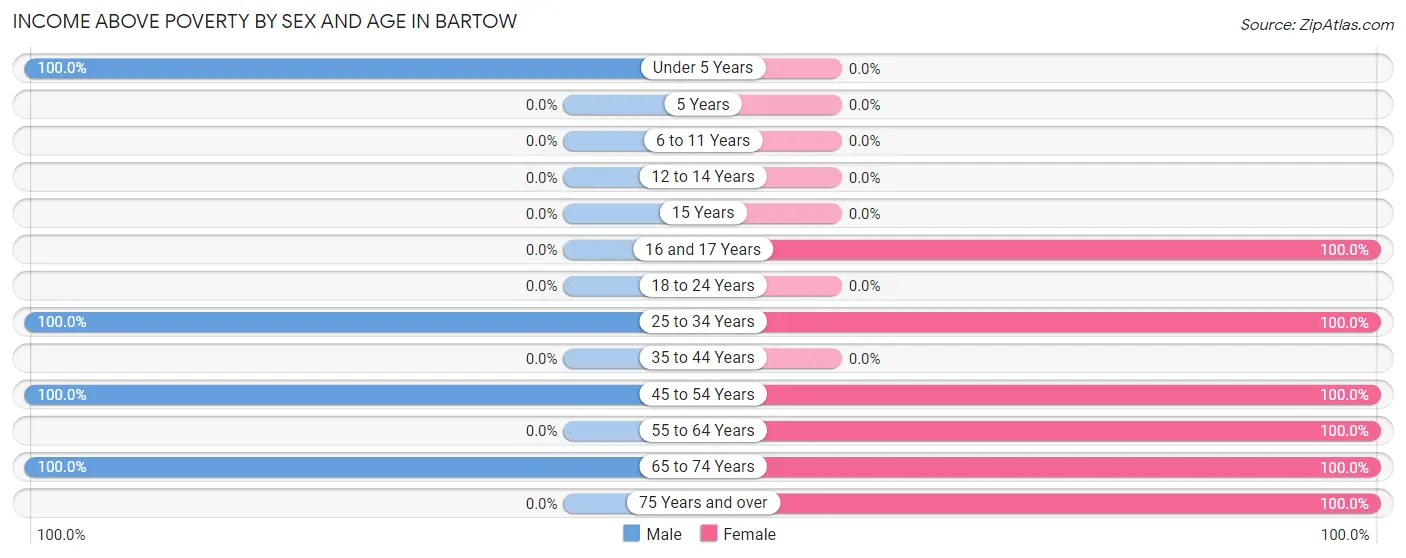
| Age Bracket | Male | Female |
| Under 5 Years | 10 (100.0%) | 0 (0.0%) |
| 5 Years | 0 (0.0%) | 0 (0.0%) |
| 6 to 11 Years | 0 (0.0%) | 0 (0.0%) |
| 12 to 14 Years | 0 (0.0%) | 0 (0.0%) |
| 15 Years | 0 (0.0%) | 0 (0.0%) |
| 16 and 17 Years | 0 (0.0%) | 6 (100.0%) |
| 18 to 24 Years | 0 (0.0%) | 0 (0.0%) |
| 25 to 34 Years | 11 (100.0%) | 14 (100.0%) |
| 35 to 44 Years | 0 (0.0%) | 0 (0.0%) |
| 45 to 54 Years | 7 (100.0%) | 7 (100.0%) |
| 55 to 64 Years | 0 (0.0%) | 1 (100.0%) |
| 65 to 74 Years | 18 (100.0%) | 28 (100.0%) |
| 75 Years and over | 0 (0.0%) | 9 (100.0%) |
| Total | 46 (100.0%) | 65 (100.0%) |
Income Below Poverty Among Married-Couple Families in Bartow
| Children | Above Poverty | Below Poverty |
| No Children | 12 (100.0%) | 0 (0.0%) |
| 1 or 2 Children | 21 (100.0%) | 0 (0.0%) |
| 3 or 4 Children | 0 (0.0%) | 0 (0.0%) |
| 5 or more Children | 0 (0.0%) | 0 (0.0%) |
| Total | 33 (100.0%) | 0 (0.0%) |
Income Below Poverty Among Single-Parent Households in Bartow
| Children | Single Father | Single Mother |
| No Children | 0 (0.0%) | 0 (0.0%) |
| 1 or 2 Children | 0 (0.0%) | 0 (0.0%) |
| 3 or 4 Children | 0 (0.0%) | 0 (0.0%) |
| 5 or more Children | 0 (0.0%) | 0 (0.0%) |
| Total | 0 (0.0%) | 0 (0.0%) |
Income Below Poverty Among Married-Couple vs Single-Parent Households in Bartow
| Children | Married-Couple Families | Single-Parent Households |
| No Children | 0 (0.0%) | 0 (0.0%) |
| 1 or 2 Children | 0 (0.0%) | 0 (0.0%) |
| 3 or 4 Children | 0 (0.0%) | 0 (0.0%) |
| 5 or more Children | 0 (0.0%) | 0 (0.0%) |
| Total | 0 (0.0%) | 0 (0.0%) |
Race in Bartow
The most populous races in Bartow are White / Caucasian (83 | 74.8%), and Asian (28 | 25.2%).
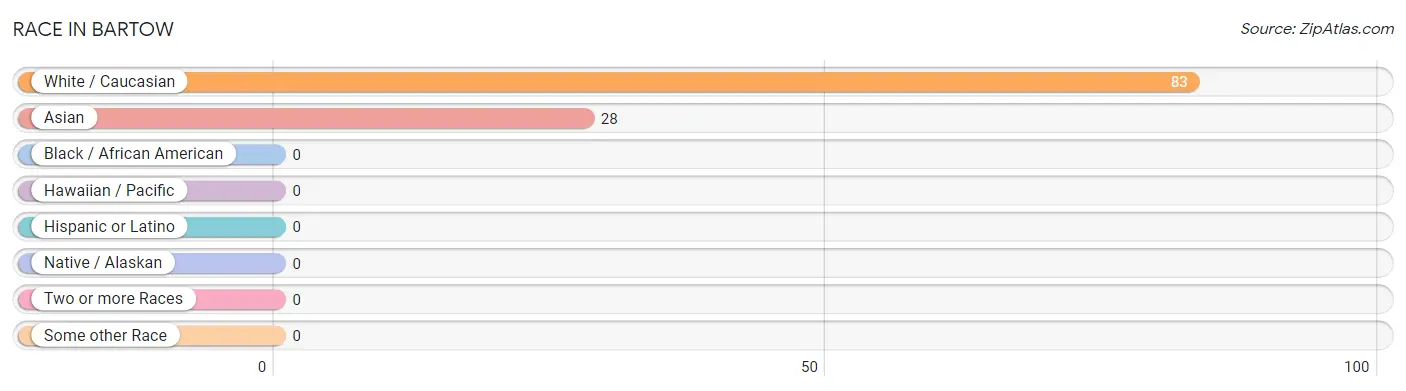
| Race | # Population | % Population |
| Asian | 28 | 25.2% |
| Black / African American | 0 | 0.0% |
| Hawaiian / Pacific | 0 | 0.0% |
| Hispanic or Latino | 0 | 0.0% |
| Native / Alaskan | 0 | 0.0% |
| White / Caucasian | 83 | 74.8% |
| Two or more Races | 0 | 0.0% |
| Some other Race | 0 | 0.0% |
| Total | 111 | 100.0% |
Ancestry in Bartow
The most populous ancestries reported in Bartow are English (33 | 29.7%), Korean (28 | 25.2%), Polish (24 | 21.6%), German (22 | 19.8%), and Irish (16 | 14.4%), together accounting for 110.8% of all Bartow residents.
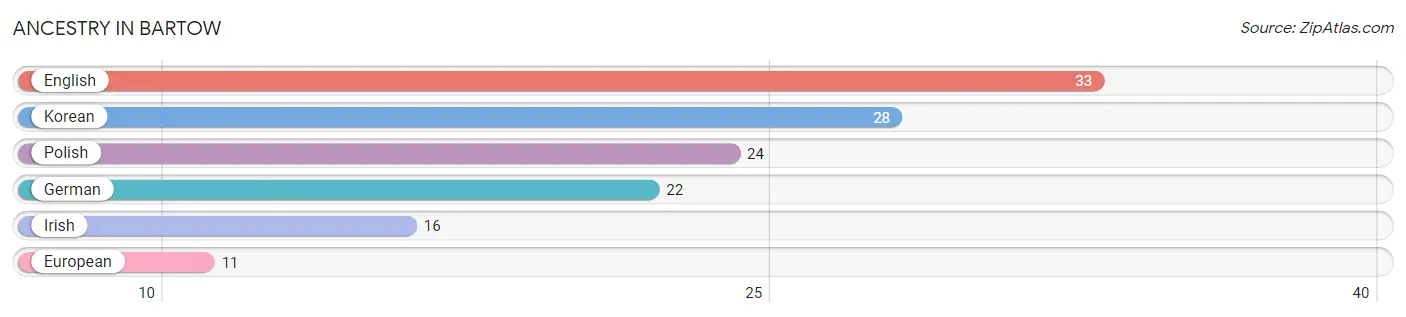
| Ancestry | # Population | % Population |
| English | 33 | 29.7% |
| European | 11 | 9.9% |
| German | 22 | 19.8% |
| Irish | 16 | 14.4% |
| Korean | 28 | 25.2% |
| Polish | 24 | 21.6% | View All 6 Rows |
Immigrants in Bartow
The most numerous immigrant groups reported in Bartow came from Asia (28 | 25.2%), Philippines (28 | 25.2%), and South Eastern Asia (28 | 25.2%), together accounting for 75.7% of all Bartow residents.
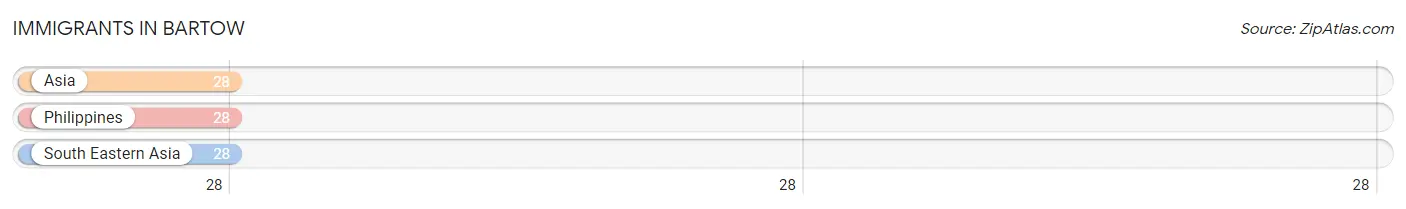
| Immigration Origin | # Population | % Population |
| Asia | 28 | 25.2% |
| Philippines | 28 | 25.2% |
| South Eastern Asia | 28 | 25.2% | View All 3 Rows |
Sex and Age in Bartow
Sex and Age in Bartow
The most populous age groups in Bartow are 30 to 34 Years (11 | 23.9%) for men and 65 to 69 Years (28 | 43.1%) for women.
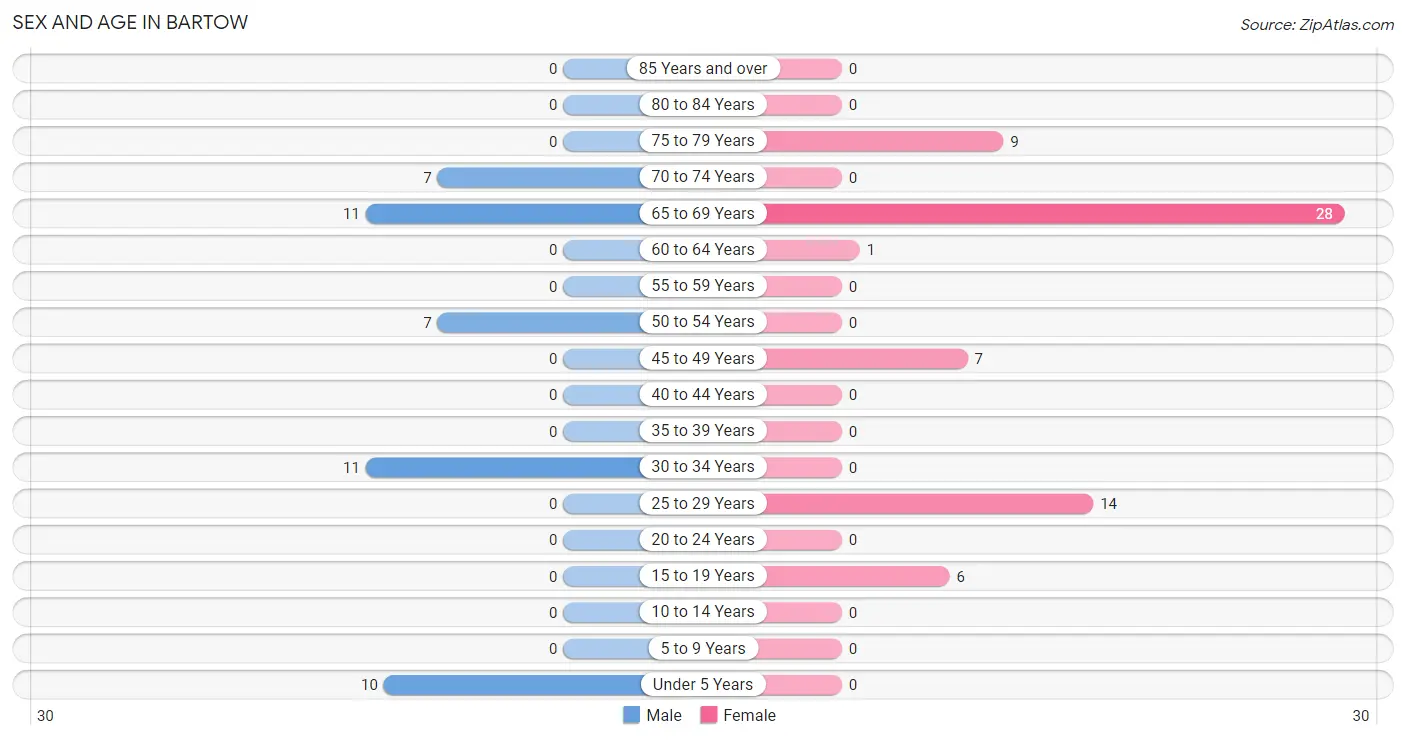
| Age Bracket | Male | Female |
| Under 5 Years | 10 (21.7%) | 0 (0.0%) |
| 5 to 9 Years | 0 (0.0%) | 0 (0.0%) |
| 10 to 14 Years | 0 (0.0%) | 0 (0.0%) |
| 15 to 19 Years | 0 (0.0%) | 6 (9.2%) |
| 20 to 24 Years | 0 (0.0%) | 0 (0.0%) |
| 25 to 29 Years | 0 (0.0%) | 14 (21.5%) |
| 30 to 34 Years | 11 (23.9%) | 0 (0.0%) |
| 35 to 39 Years | 0 (0.0%) | 0 (0.0%) |
| 40 to 44 Years | 0 (0.0%) | 0 (0.0%) |
| 45 to 49 Years | 0 (0.0%) | 7 (10.8%) |
| 50 to 54 Years | 7 (15.2%) | 0 (0.0%) |
| 55 to 59 Years | 0 (0.0%) | 0 (0.0%) |
| 60 to 64 Years | 0 (0.0%) | 1 (1.5%) |
| 65 to 69 Years | 11 (23.9%) | 28 (43.1%) |
| 70 to 74 Years | 7 (15.2%) | 0 (0.0%) |
| 75 to 79 Years | 0 (0.0%) | 9 (13.9%) |
| 80 to 84 Years | 0 (0.0%) | 0 (0.0%) |
| 85 Years and over | 0 (0.0%) | 0 (0.0%) |
| Total | 46 (100.0%) | 65 (100.0%) |
Families and Households in Bartow
Median Family Size in Bartow
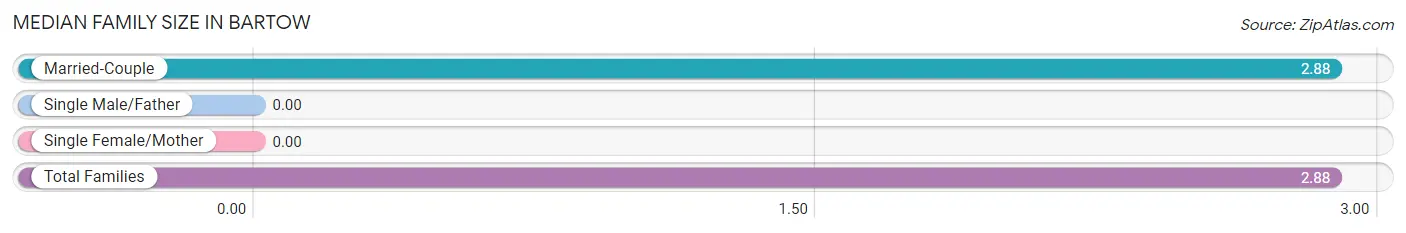
| Family Type | # Families | Family Size |
| Married-Couple | 33 (100.0%) | 2.88 |
| Single Male/Father | 0 (0.0%) | - |
| Single Female/Mother | 0 (0.0%) | - |
| Total Families | 33 (100.0%) | 2.88 |
Median Household Size in Bartow
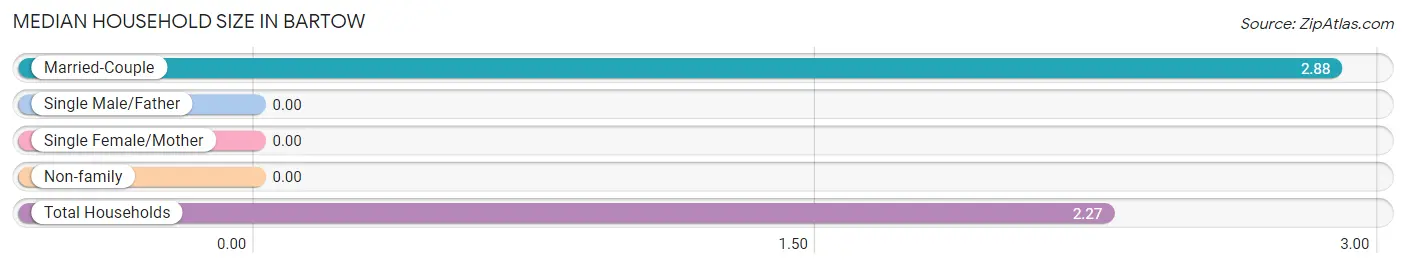
| Household Type | # Households | Household Size |
| Married-Couple | 33 (67.3%) | 2.88 |
| Single Male/Father | 0 (0.0%) | - |
| Single Female/Mother | 0 (0.0%) | - |
| Non-family | 16 (32.7%) | - |
| Total Households | 49 (100.0%) | 2.27 |
Household Size by Marriage Status in Bartow
Out of a total of 49 households in Bartow, 33 (67.3%) are family households, while 16 (32.7%) are nonfamily households. The most numerous type of family households are 3-person households, comprising 21, and the most common type of nonfamily households are 1-person households, comprising 16.
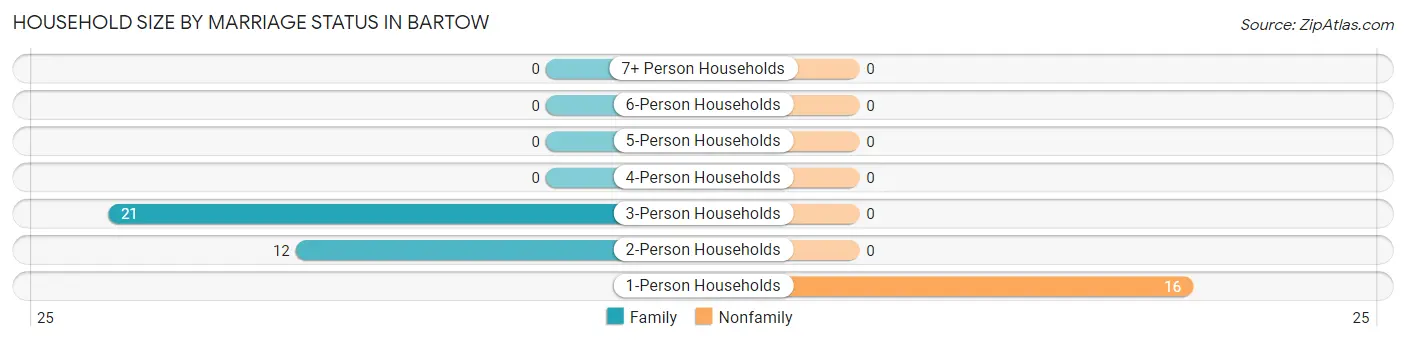
| Household Size | Family Households | Nonfamily Households |
| 1-Person Households | - | 16 (32.7%) |
| 2-Person Households | 12 (24.5%) | 0 (0.0%) |
| 3-Person Households | 21 (42.9%) | 0 (0.0%) |
| 4-Person Households | 0 (0.0%) | 0 (0.0%) |
| 5-Person Households | 0 (0.0%) | 0 (0.0%) |
| 6-Person Households | 0 (0.0%) | 0 (0.0%) |
| 7+ Person Households | 0 (0.0%) | 0 (0.0%) |
| Total | 33 (67.3%) | 16 (32.7%) |
Female Fertility in Bartow
Fertility by Age in Bartow
Average fertility rate in Bartow is 519.0 births per 1,000 women. Women in the age bracket of 20 to 34 years have the highest fertility rate with 1,000.0 births per 1,000 women. Women in the age bracket of 20 to 34 years acount for 100.0% of all women with births.
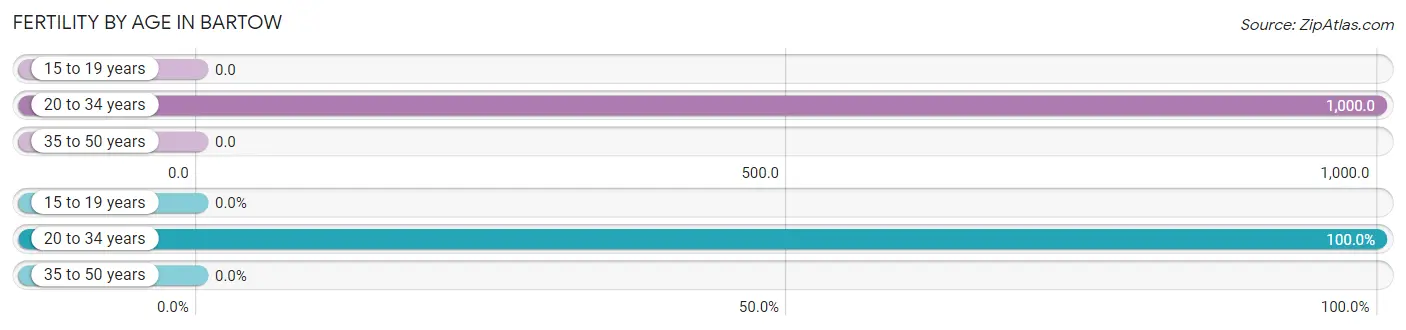
| Age Bracket | Women with Births | Births / 1,000 Women |
| 15 to 19 years | 0 (0.0%) | 0.0 |
| 20 to 34 years | 14 (100.0%) | 1,000.0 |
| 35 to 50 years | 0 (0.0%) | 0.0 |
| Total | 14 (100.0%) | 519.0 |
Fertility by Age by Marriage Status in Bartow
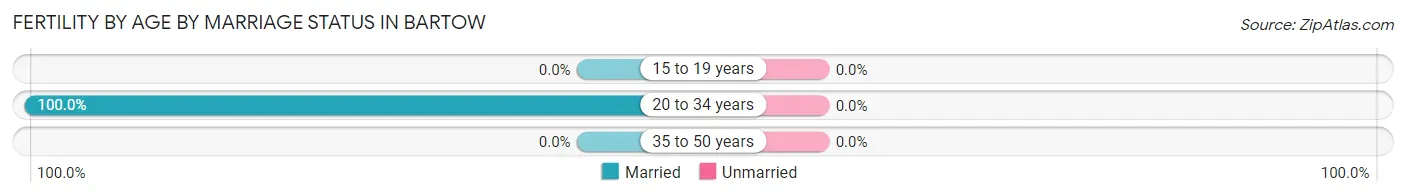
| Age Bracket | Married | Unmarried |
| 15 to 19 years | 0 (0.0%) | 0 (0.0%) |
| 20 to 34 years | 14 (100.0%) | 0 (0.0%) |
| 35 to 50 years | 0 (0.0%) | 0 (0.0%) |
| Total | 14 (100.0%) | 0 (0.0%) |
Fertility by Education in Bartow
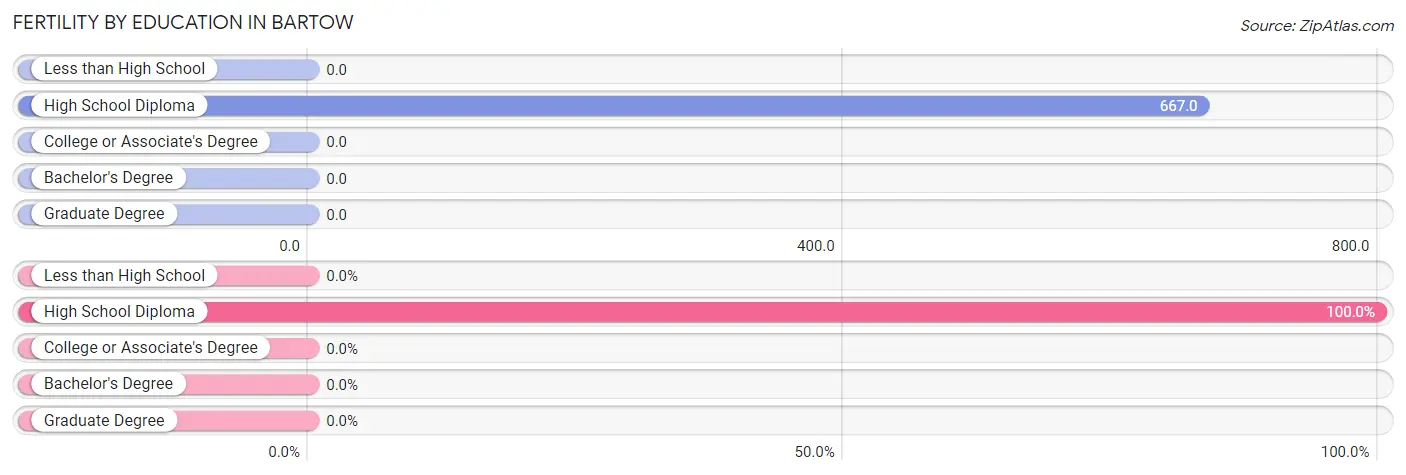
| Educational Attainment | Women with Births | Births / 1,000 Women |
| Less than High School | 0 (0.0%) | 0.0 |
| High School Diploma | 14 (100.0%) | 667.0 |
| College or Associate's Degree | 0 (0.0%) | 0.0 |
| Bachelor's Degree | 0 (0.0%) | 0.0 |
| Graduate Degree | 0 (0.0%) | 0.0 |
| Total | 14 (100.0%) | 519.0 |
Fertility by Education by Marriage Status in Bartow
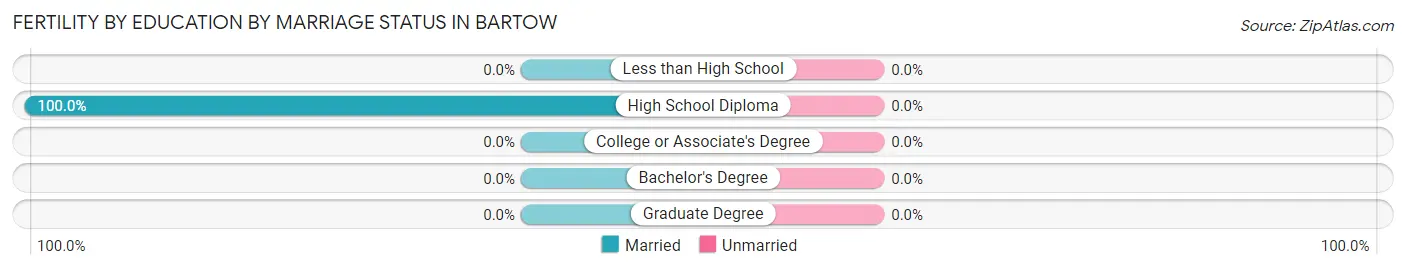
| Educational Attainment | Married | Unmarried |
| Less than High School | 0 (0.0%) | 0 (0.0%) |
| High School Diploma | 14 (100.0%) | 0 (0.0%) |
| College or Associate's Degree | 0 (0.0%) | 0 (0.0%) |
| Bachelor's Degree | 0 (0.0%) | 0 (0.0%) |
| Graduate Degree | 0 (0.0%) | 0 (0.0%) |
| Total | 14 (100.0%) | 0 (0.0%) |
Employment Characteristics in Bartow
Employment by Class of Employer in Bartow
Among the 26 employed individuals in Bartow, self-employed (incorporated) (13 | 50.0%), state government employees (12 | 46.2%), and self-employed (not incorporated) (1 | 3.8%) make up the most common classes of employment.
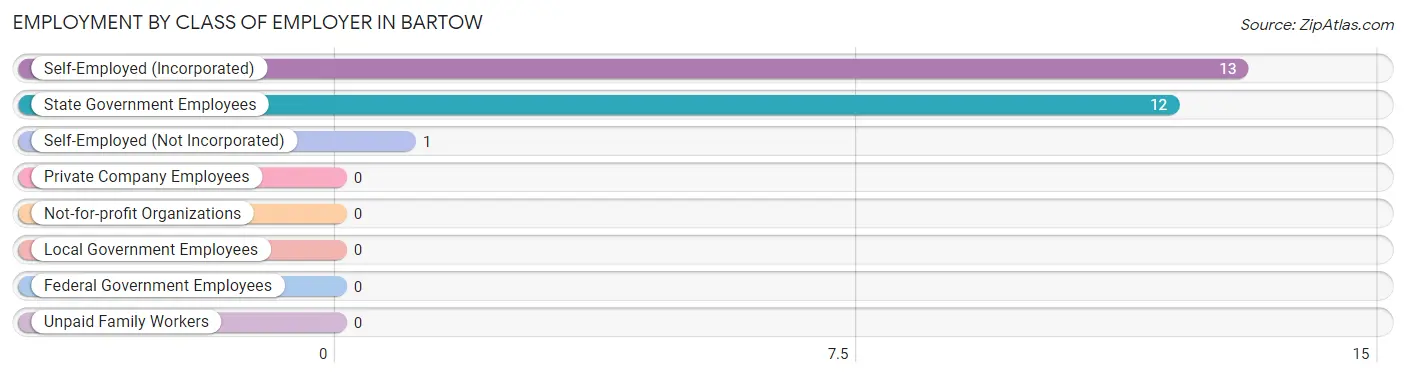
| Employer Class | # Employees | % Employees |
| Private Company Employees | 0 | 0.0% |
| Self-Employed (Incorporated) | 13 | 50.0% |
| Self-Employed (Not Incorporated) | 1 | 3.8% |
| Not-for-profit Organizations | 0 | 0.0% |
| Local Government Employees | 0 | 0.0% |
| State Government Employees | 12 | 46.2% |
| Federal Government Employees | 0 | 0.0% |
| Unpaid Family Workers | 0 | 0.0% |
| Total | 26 | 100.0% |
Employment Status by Age in Bartow
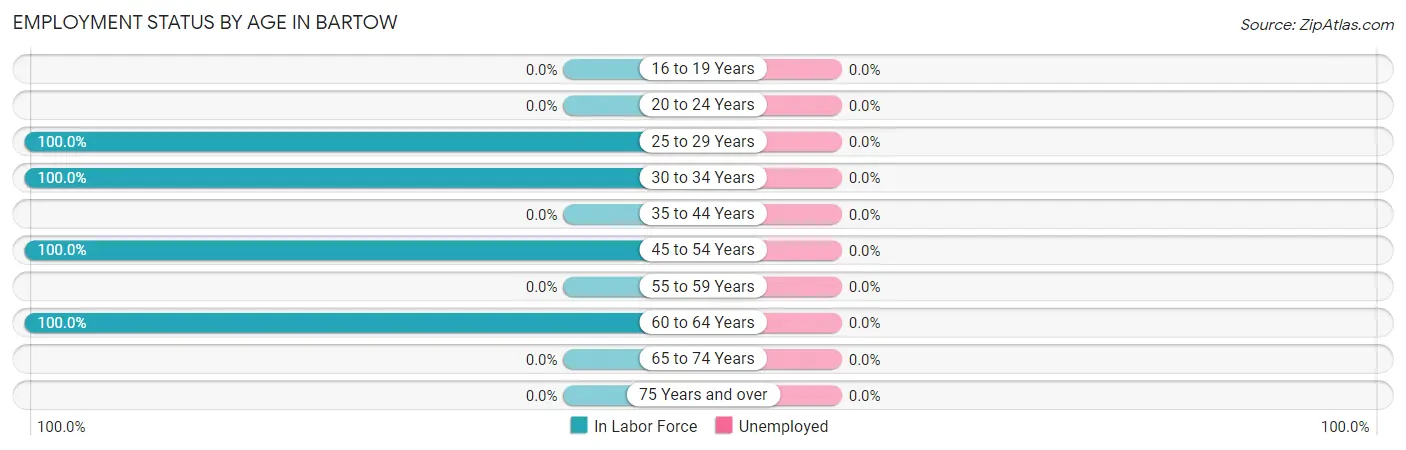
| Age Bracket | In Labor Force | Unemployed |
| 16 to 19 Years | 0 (0.0%) | 0 (0.0%) |
| 20 to 24 Years | 0 (0.0%) | 0 (0.0%) |
| 25 to 29 Years | 14 (100.0%) | 0 (0.0%) |
| 30 to 34 Years | 11 (100.0%) | 0 (0.0%) |
| 35 to 44 Years | 0 (0.0%) | 0 (0.0%) |
| 45 to 54 Years | 14 (100.0%) | 0 (0.0%) |
| 55 to 59 Years | 0 (0.0%) | 0 (0.0%) |
| 60 to 64 Years | 1 (100.0%) | 0 (0.0%) |
| 65 to 74 Years | 0 (0.0%) | 0 (0.0%) |
| 75 Years and over | 0 (0.0%) | 0 (0.0%) |
| Total | 40 (39.6%) | 0 (0.0%) |
Employment Status by Educational Attainment in Bartow
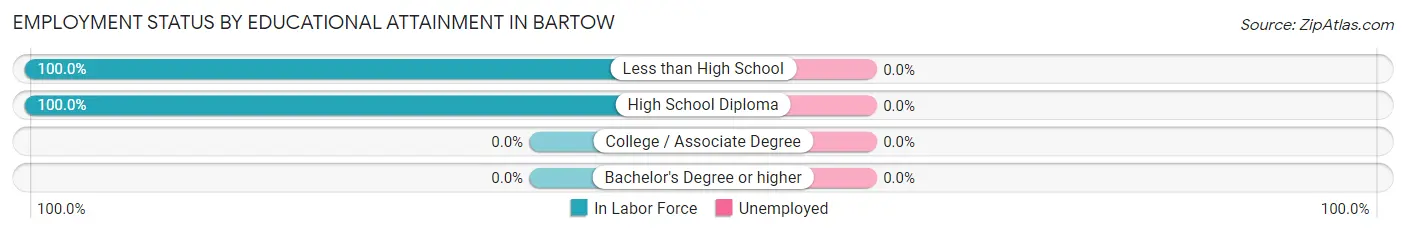
| Educational Attainment | In Labor Force | Unemployed |
| Less than High School | 6 (100.0%) | 0 (0.0%) |
| High School Diploma | 34 (100.0%) | 0 (0.0%) |
| College / Associate Degree | 0 (0.0%) | 0 (0.0%) |
| Bachelor's Degree or higher | 0 (0.0%) | 0 (0.0%) |
| Total | 40 (100.0%) | 0 (0.0%) |
Employment Occupations by Sex in Bartow
Management, Business, Science and Arts Occupations
The most common Management, Business, Science and Arts occupations in Bartow are , and Health Diagnosing & Treating (7 | 17.5%).
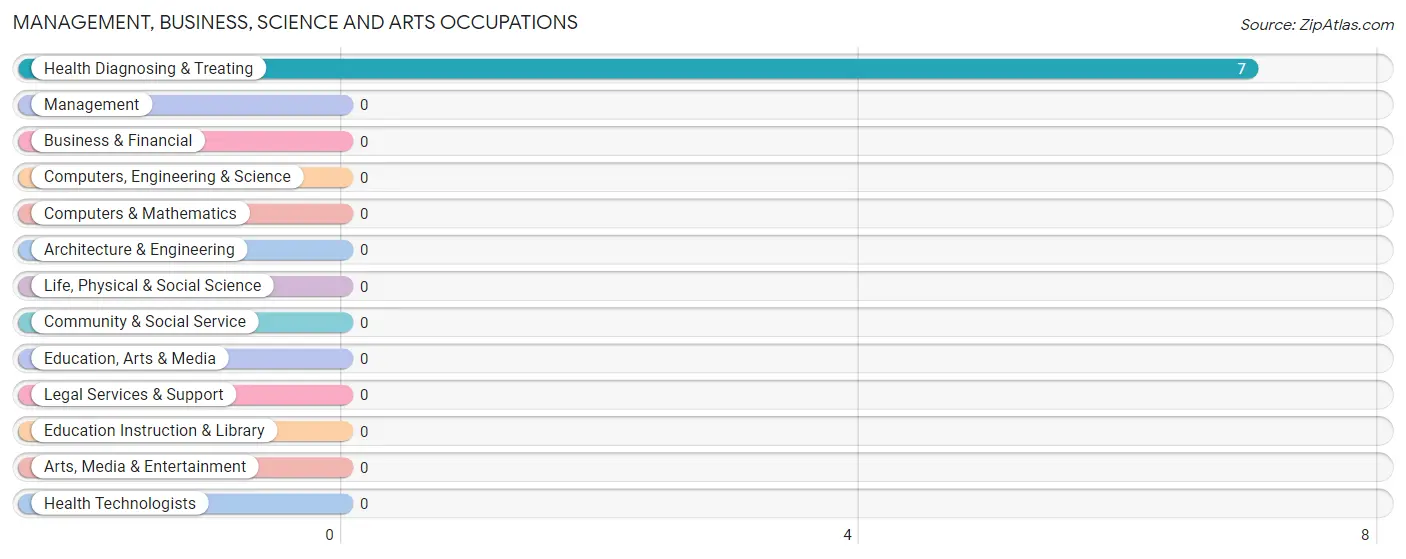
Management, Business, Science and Arts Occupations by Sex
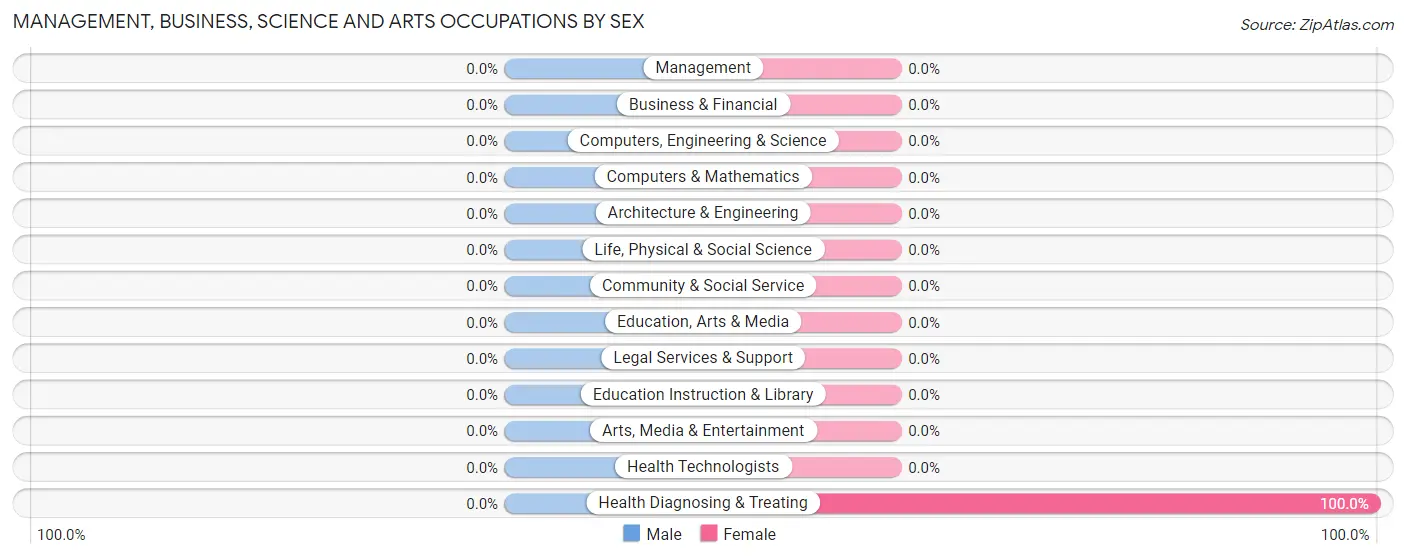
| Occupation | Male | Female |
| Management | 0 (0.0%) | 0 (0.0%) |
| Business & Financial | 0 (0.0%) | 0 (0.0%) |
| Computers, Engineering & Science | 0 (0.0%) | 0 (0.0%) |
| Computers & Mathematics | 0 (0.0%) | 0 (0.0%) |
| Architecture & Engineering | 0 (0.0%) | 0 (0.0%) |
| Life, Physical & Social Science | 0 (0.0%) | 0 (0.0%) |
| Community & Social Service | 0 (0.0%) | 0 (0.0%) |
| Education, Arts & Media | 0 (0.0%) | 0 (0.0%) |
| Legal Services & Support | 0 (0.0%) | 0 (0.0%) |
| Education Instruction & Library | 0 (0.0%) | 0 (0.0%) |
| Arts, Media & Entertainment | 0 (0.0%) | 0 (0.0%) |
| Health Diagnosing & Treating | 0 (0.0%) | 7 (100.0%) |
| Health Technologists | 0 (0.0%) | 0 (0.0%) |
| Total (Category) | 0 (0.0%) | 7 (100.0%) |
| Total (Overall) | 18 (45.0%) | 22 (55.0%) |
Services Occupations
The most common Services occupations in Bartow are Security & Protection (11 | 27.5%), and Law Enforcement (11 | 27.5%).
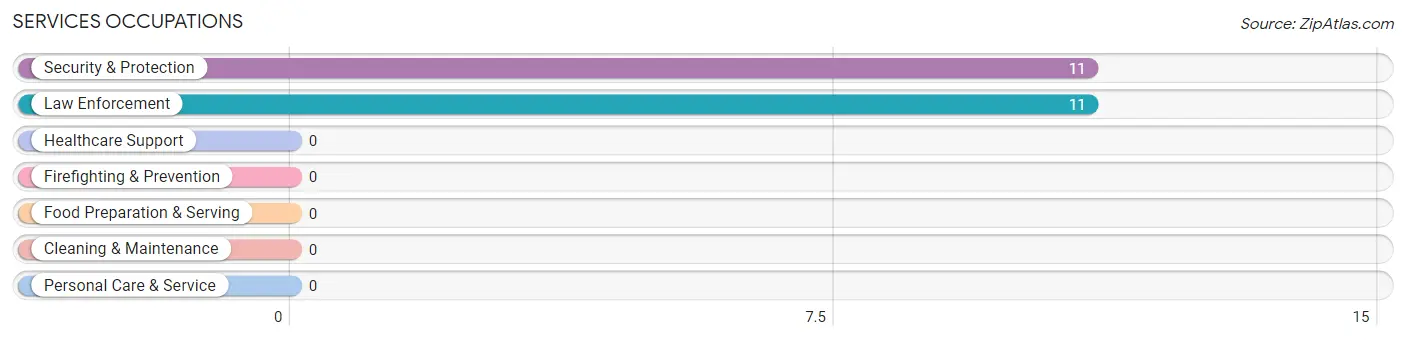
Services Occupations by Sex
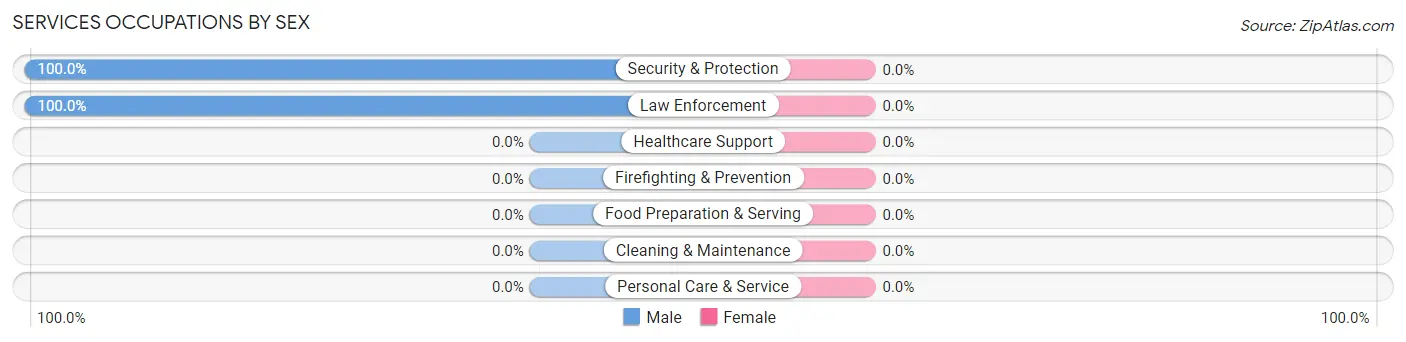
| Occupation | Male | Female |
| Healthcare Support | 0 (0.0%) | 0 (0.0%) |
| Security & Protection | 11 (100.0%) | 0 (0.0%) |
| Firefighting & Prevention | 0 (0.0%) | 0 (0.0%) |
| Law Enforcement | 11 (100.0%) | 0 (0.0%) |
| Food Preparation & Serving | 0 (0.0%) | 0 (0.0%) |
| Cleaning & Maintenance | 0 (0.0%) | 0 (0.0%) |
| Personal Care & Service | 0 (0.0%) | 0 (0.0%) |
| Total (Category) | 11 (100.0%) | 0 (0.0%) |
| Total (Overall) | 18 (45.0%) | 22 (55.0%) |
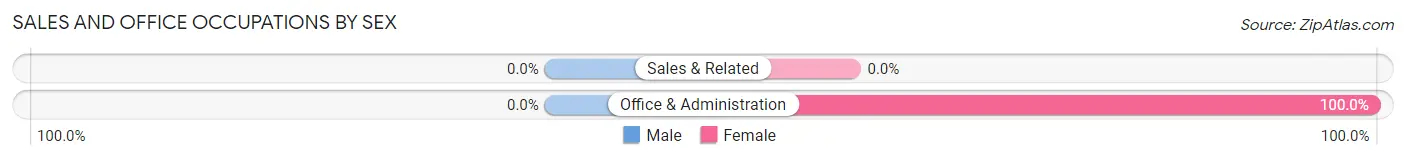
Sales and Office Occupations
The most common Sales and Office occupations in Bartow are , and Office & Administration (15 | 37.5%).
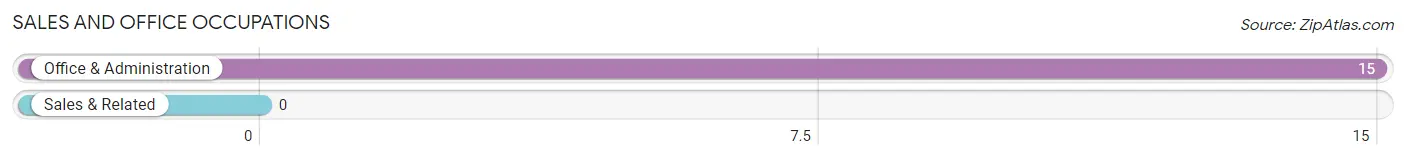
Sales and Office Occupations by Sex
| Occupation | Male | Female |
| Sales & Related | 0 (0.0%) | 0 (0.0%) |
| Office & Administration | 0 (0.0%) | 15 (100.0%) |
| Total (Category) | 0 (0.0%) | 15 (100.0%) |
| Total (Overall) | 18 (45.0%) | 22 (55.0%) |
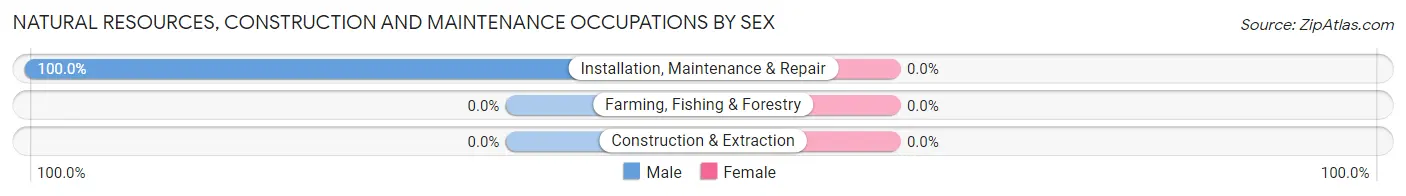
Natural Resources, Construction and Maintenance Occupations
The most common Natural Resources, Construction and Maintenance occupations in Bartow are , and Installation, Maintenance & Repair (6 | 15.0%).
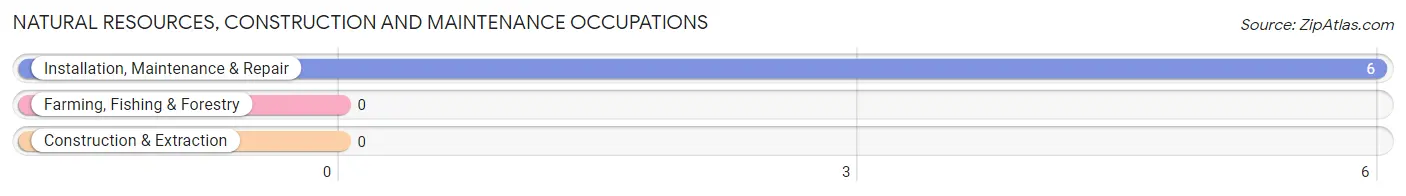
Natural Resources, Construction and Maintenance Occupations by Sex
| Occupation | Male | Female |
| Farming, Fishing & Forestry | 0 (0.0%) | 0 (0.0%) |
| Construction & Extraction | 0 (0.0%) | 0 (0.0%) |
| Installation, Maintenance & Repair | 6 (100.0%) | 0 (0.0%) |
| Total (Category) | 6 (100.0%) | 0 (0.0%) |
| Total (Overall) | 18 (45.0%) | 22 (55.0%) |
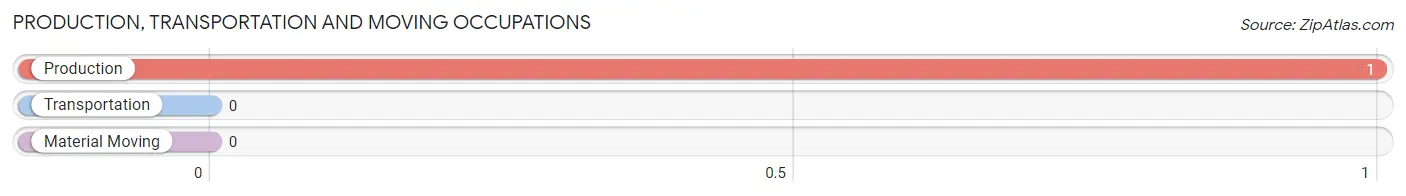
Production, Transportation and Moving Occupations
The most common Production, Transportation and Moving occupations in Bartow are , and Production (1 | 2.5%).
Production, Transportation and Moving Occupations by Sex
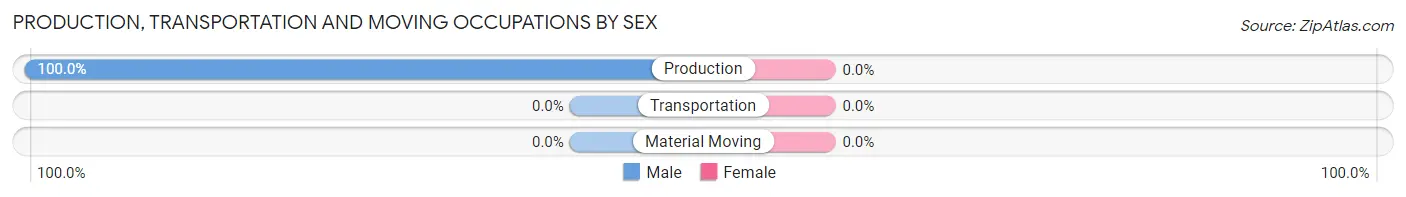
| Occupation | Male | Female |
| Production | 1 (100.0%) | 0 (0.0%) |
| Transportation | 0 (0.0%) | 0 (0.0%) |
| Material Moving | 0 (0.0%) | 0 (0.0%) |
| Total (Category) | 1 (100.0%) | 0 (0.0%) |
| Total (Overall) | 18 (45.0%) | 22 (55.0%) |
Employment Industries by Sex in Bartow
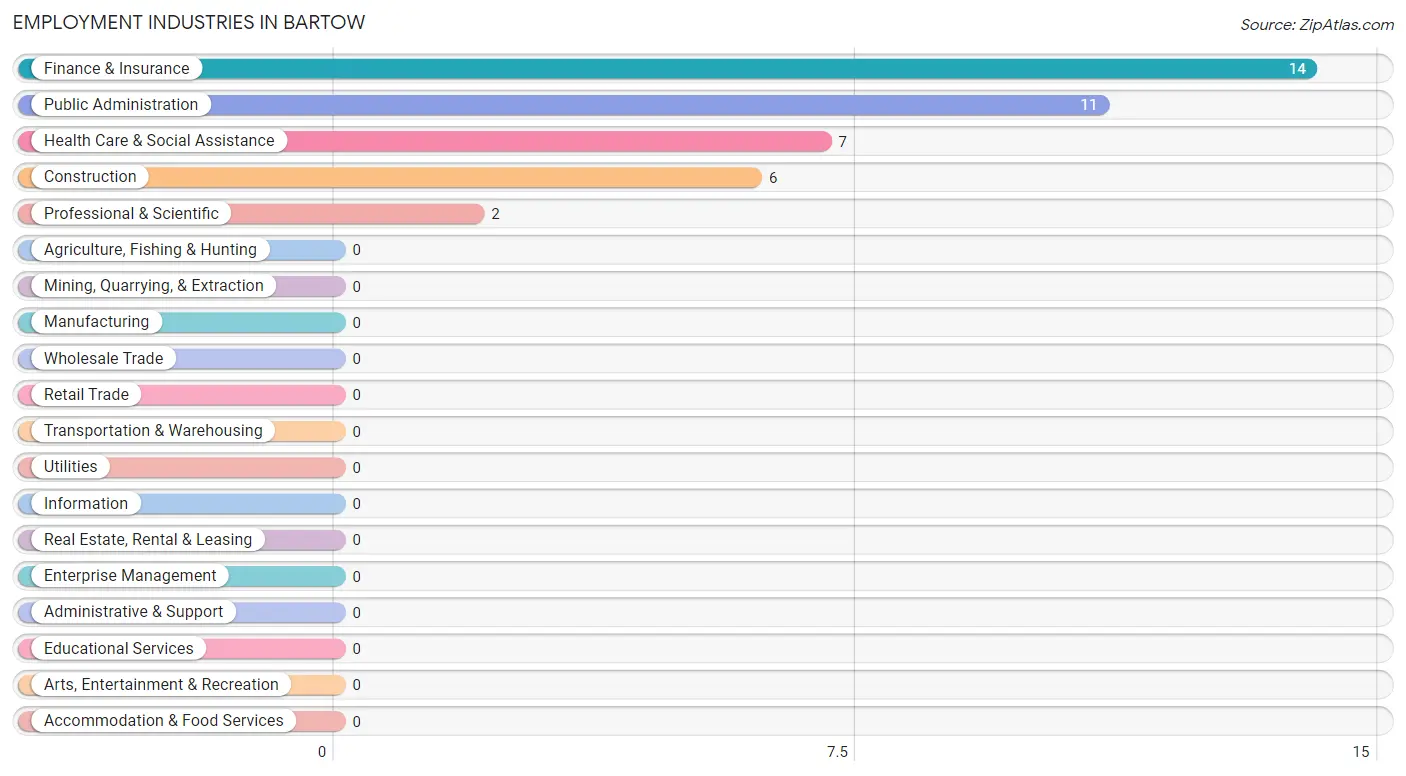
Employment Industries in Bartow
The major employment industries in Bartow include Finance & Insurance (14 | 35.0%), Public Administration (11 | 27.5%), Health Care & Social Assistance (7 | 17.5%), Construction (6 | 15.0%), and Professional & Scientific (2 | 5.0%).
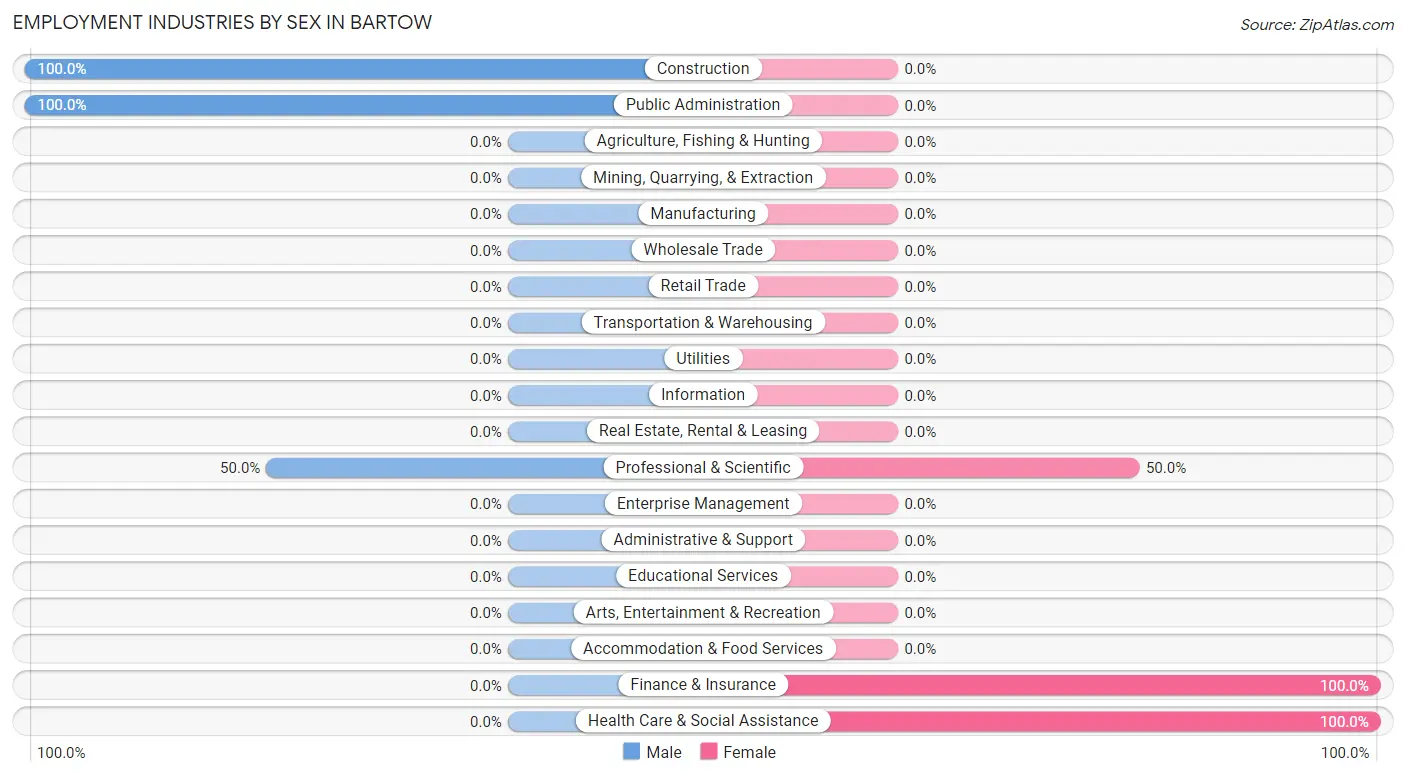
Employment Industries by Sex in Bartow
The Bartow industries that see more men than women are Construction (100.0%), Public Administration (100.0%), and Professional & Scientific (50.0%), whereas the industries that tend to have a higher number of women are Finance & Insurance (100.0%), Health Care & Social Assistance (100.0%), and Professional & Scientific (50.0%).
| Industry | Male | Female |
| Agriculture, Fishing & Hunting | 0 (0.0%) | 0 (0.0%) |
| Mining, Quarrying, & Extraction | 0 (0.0%) | 0 (0.0%) |
| Construction | 6 (100.0%) | 0 (0.0%) |
| Manufacturing | 0 (0.0%) | 0 (0.0%) |
| Wholesale Trade | 0 (0.0%) | 0 (0.0%) |
| Retail Trade | 0 (0.0%) | 0 (0.0%) |
| Transportation & Warehousing | 0 (0.0%) | 0 (0.0%) |
| Utilities | 0 (0.0%) | 0 (0.0%) |
| Information | 0 (0.0%) | 0 (0.0%) |
| Finance & Insurance | 0 (0.0%) | 14 (100.0%) |
| Real Estate, Rental & Leasing | 0 (0.0%) | 0 (0.0%) |
| Professional & Scientific | 1 (50.0%) | 1 (50.0%) |
| Enterprise Management | 0 (0.0%) | 0 (0.0%) |
| Administrative & Support | 0 (0.0%) | 0 (0.0%) |
| Educational Services | 0 (0.0%) | 0 (0.0%) |
| Health Care & Social Assistance | 0 (0.0%) | 7 (100.0%) |
| Arts, Entertainment & Recreation | 0 (0.0%) | 0 (0.0%) |
| Accommodation & Food Services | 0 (0.0%) | 0 (0.0%) |
| Public Administration | 11 (100.0%) | 0 (0.0%) |
| Total | 18 (45.0%) | 22 (55.0%) |
Education in Bartow
School Enrollment in Bartow
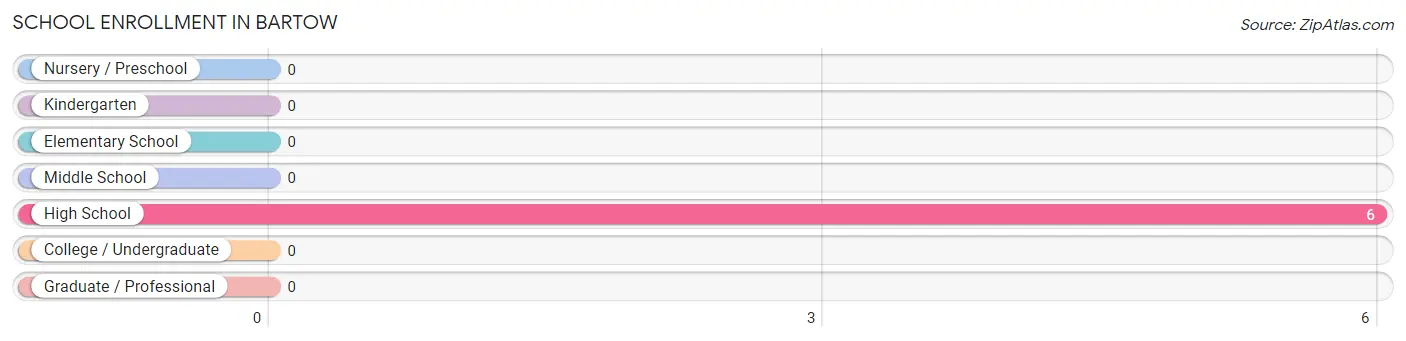
| School Level | # Students | % Students |
| Nursery / Preschool | 0 | 0.0% |
| Kindergarten | 0 | 0.0% |
| Elementary School | 0 | 0.0% |
| Middle School | 0 | 0.0% |
| High School | 6 | 100.0% |
| College / Undergraduate | 0 | 0.0% |
| Graduate / Professional | 0 | 0.0% |
| Total | 6 | 100.0% |
School Enrollment by Age by Funding Source in Bartow
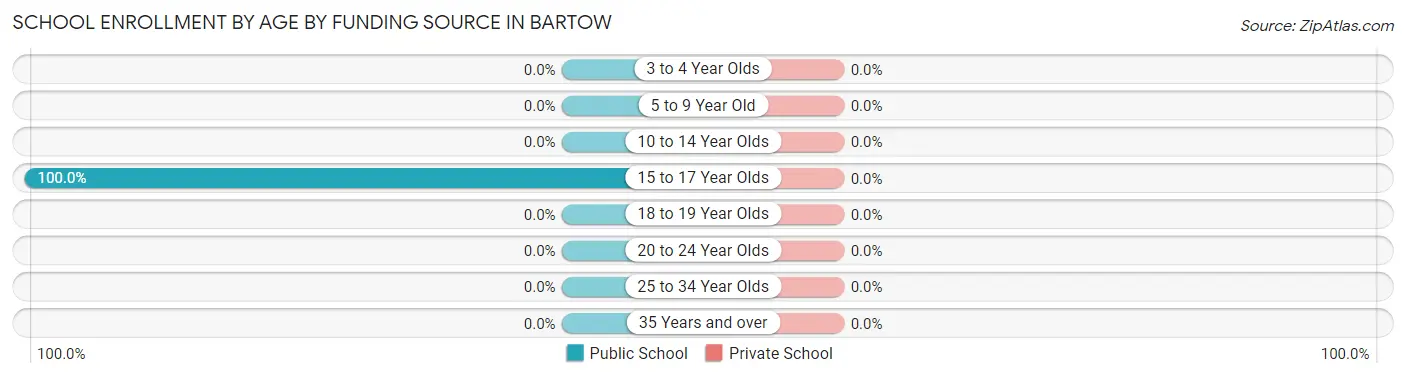
| Age Bracket | Public School | Private School |
| 3 to 4 Year Olds | 0 (0.0%) | 0 (0.0%) |
| 5 to 9 Year Old | 0 (0.0%) | 0 (0.0%) |
| 10 to 14 Year Olds | 0 (0.0%) | 0 (0.0%) |
| 15 to 17 Year Olds | 6 (100.0%) | 0 (0.0%) |
| 18 to 19 Year Olds | 0 (0.0%) | 0 (0.0%) |
| 20 to 24 Year Olds | 0 (0.0%) | 0 (0.0%) |
| 25 to 34 Year Olds | 0 (0.0%) | 0 (0.0%) |
| 35 Years and over | 0 (0.0%) | 0 (0.0%) |
| Total | 6 (100.0%) | 0 (0.0%) |
Educational Attainment by Field of Study in Bartow
, and education (11 | 100.0%) are the most common fields of study among 11 individuals in Bartow who have obtained a bachelor's degree or higher.
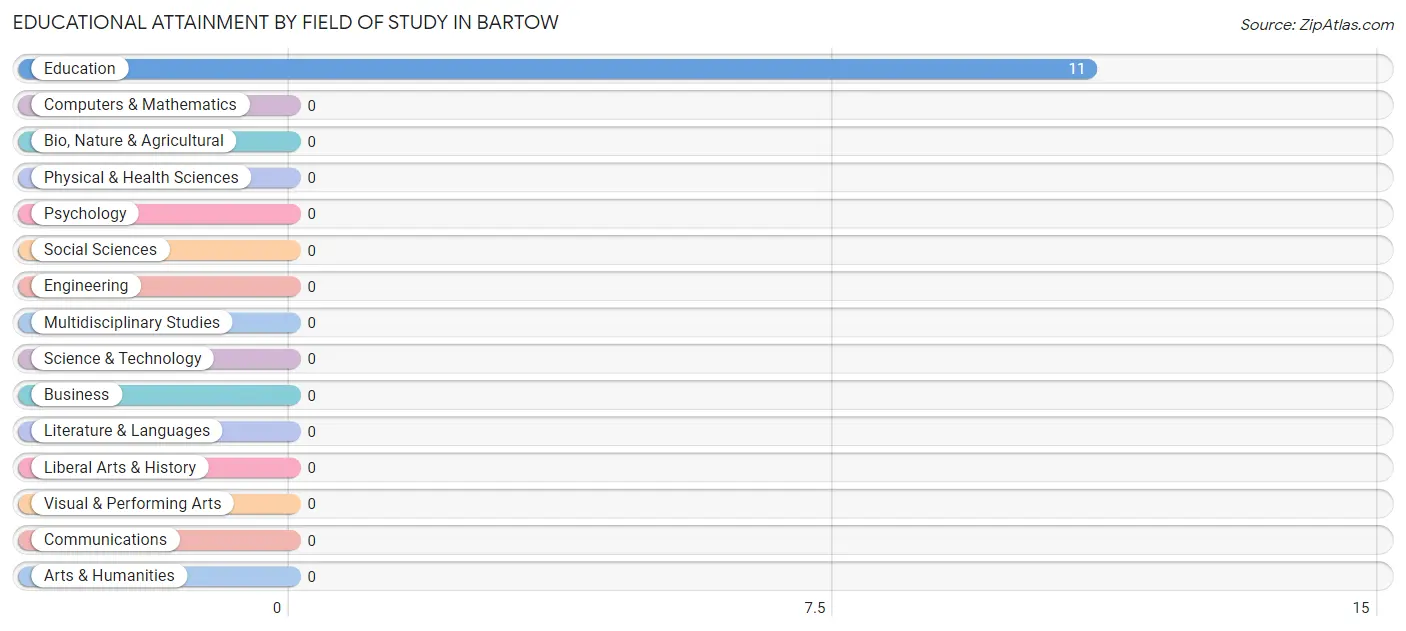
| Field of Study | # Graduates | % Graduates |
| Computers & Mathematics | 0 | 0.0% |
| Bio, Nature & Agricultural | 0 | 0.0% |
| Physical & Health Sciences | 0 | 0.0% |
| Psychology | 0 | 0.0% |
| Social Sciences | 0 | 0.0% |
| Engineering | 0 | 0.0% |
| Multidisciplinary Studies | 0 | 0.0% |
| Science & Technology | 0 | 0.0% |
| Business | 0 | 0.0% |
| Education | 11 | 100.0% |
| Literature & Languages | 0 | 0.0% |
| Liberal Arts & History | 0 | 0.0% |
| Visual & Performing Arts | 0 | 0.0% |
| Communications | 0 | 0.0% |
| Arts & Humanities | 0 | 0.0% |
| Total | 11 | 100.0% |
Transportation & Commute in Bartow
Vehicle Availability by Sex in Bartow
The most prevalent vehicle ownership categories in Bartow are males with 2 vehicles (11, accounting for 61.1%) and females with 2 vehicles (0, making up 137.5%).
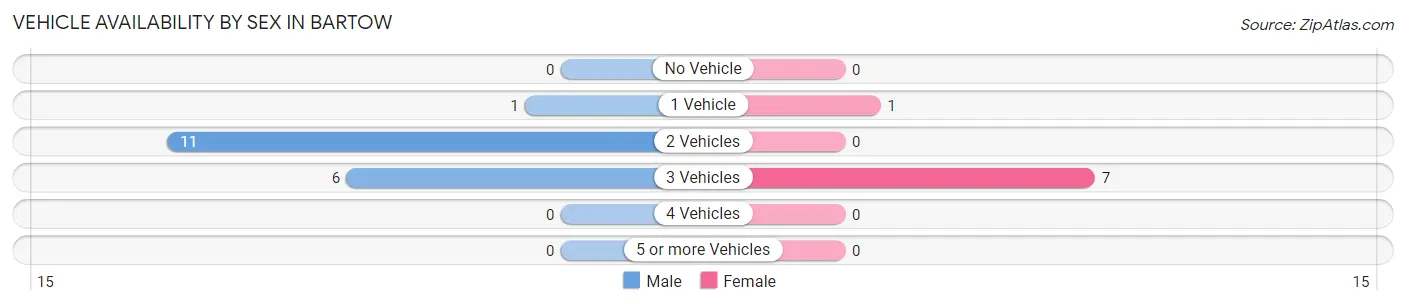
| Vehicles Available | Male | Female |
| No Vehicle | 0 (0.0%) | 0 (0.0%) |
| 1 Vehicle | 1 (5.6%) | 1 (12.5%) |
| 2 Vehicles | 11 (61.1%) | 0 (0.0%) |
| 3 Vehicles | 6 (33.3%) | 7 (87.5%) |
| 4 Vehicles | 0 (0.0%) | 0 (0.0%) |
| 5 or more Vehicles | 0 (0.0%) | 0 (0.0%) |
| Total | 18 (100.0%) | 8 (100.0%) |
Commute Time in Bartow
The most frequently occuring commute durations in Bartow are 5 to 9 minutes (13 commuters, 52.0%), 20 to 24 minutes (12 commuters, 48.0%), and less than 5 minutes (0 commuters, 0.0%).
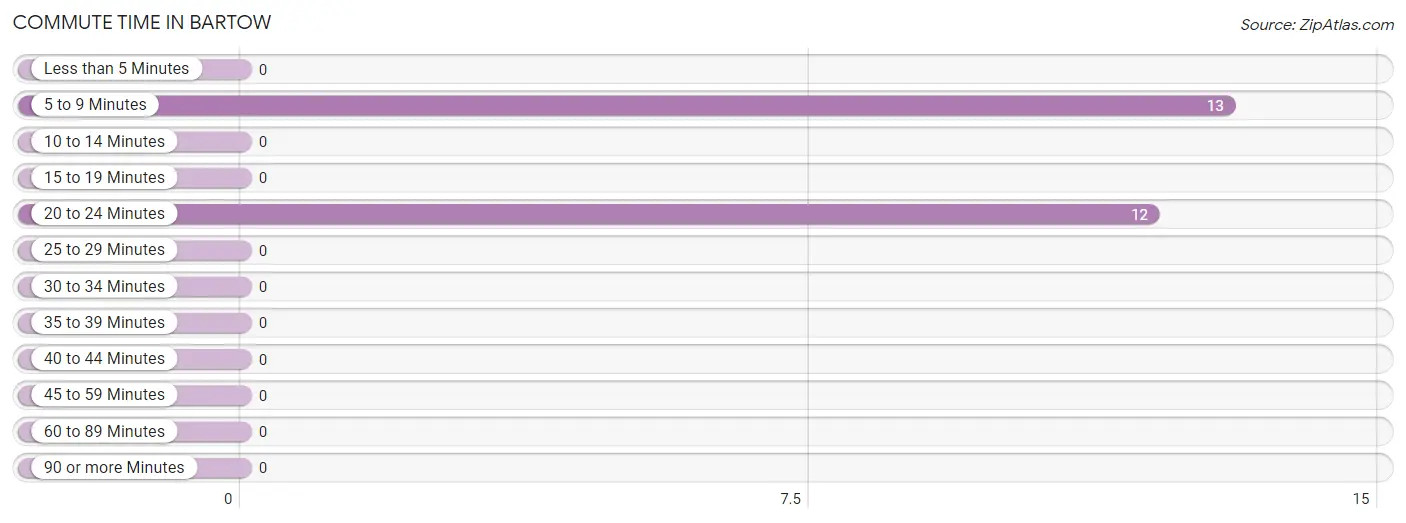
| Commute Time | # Commuters | % Commuters |
| Less than 5 Minutes | 0 | 0.0% |
| 5 to 9 Minutes | 13 | 52.0% |
| 10 to 14 Minutes | 0 | 0.0% |
| 15 to 19 Minutes | 0 | 0.0% |
| 20 to 24 Minutes | 12 | 48.0% |
| 25 to 29 Minutes | 0 | 0.0% |
| 30 to 34 Minutes | 0 | 0.0% |
| 35 to 39 Minutes | 0 | 0.0% |
| 40 to 44 Minutes | 0 | 0.0% |
| 45 to 59 Minutes | 0 | 0.0% |
| 60 to 89 Minutes | 0 | 0.0% |
| 90 or more Minutes | 0 | 0.0% |
Commute Time by Sex in Bartow
The most common commute times in Bartow are 20 to 24 minutes (12 commuters, 66.7%) for males and 5 to 9 minutes (7 commuters, 100.0%) for females.
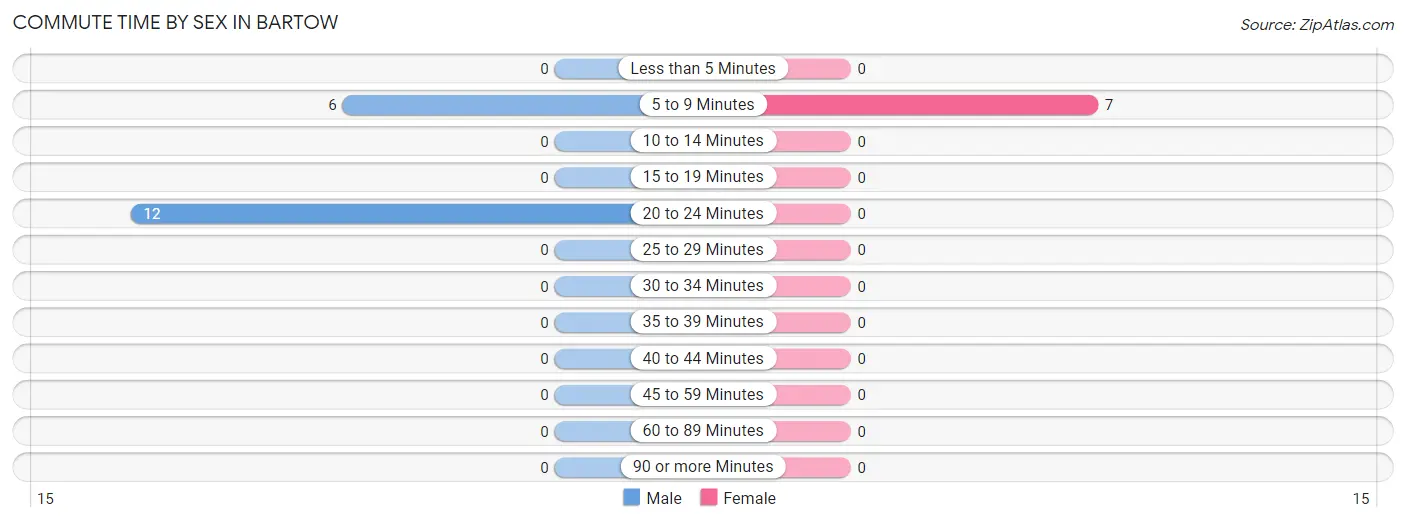
| Commute Time | Male | Female |
| Less than 5 Minutes | 0 (0.0%) | 0 (0.0%) |
| 5 to 9 Minutes | 6 (33.3%) | 7 (100.0%) |
| 10 to 14 Minutes | 0 (0.0%) | 0 (0.0%) |
| 15 to 19 Minutes | 0 (0.0%) | 0 (0.0%) |
| 20 to 24 Minutes | 12 (66.7%) | 0 (0.0%) |
| 25 to 29 Minutes | 0 (0.0%) | 0 (0.0%) |
| 30 to 34 Minutes | 0 (0.0%) | 0 (0.0%) |
| 35 to 39 Minutes | 0 (0.0%) | 0 (0.0%) |
| 40 to 44 Minutes | 0 (0.0%) | 0 (0.0%) |
| 45 to 59 Minutes | 0 (0.0%) | 0 (0.0%) |
| 60 to 89 Minutes | 0 (0.0%) | 0 (0.0%) |
| 90 or more Minutes | 0 (0.0%) | 0 (0.0%) |
Time of Departure to Work by Sex in Bartow
The most frequent times of departure to work in Bartow are 4:00 PM to 11:59 PM (11, 61.1%) for males and 8:30 AM to 8:59 AM (7, 100.0%) for females.
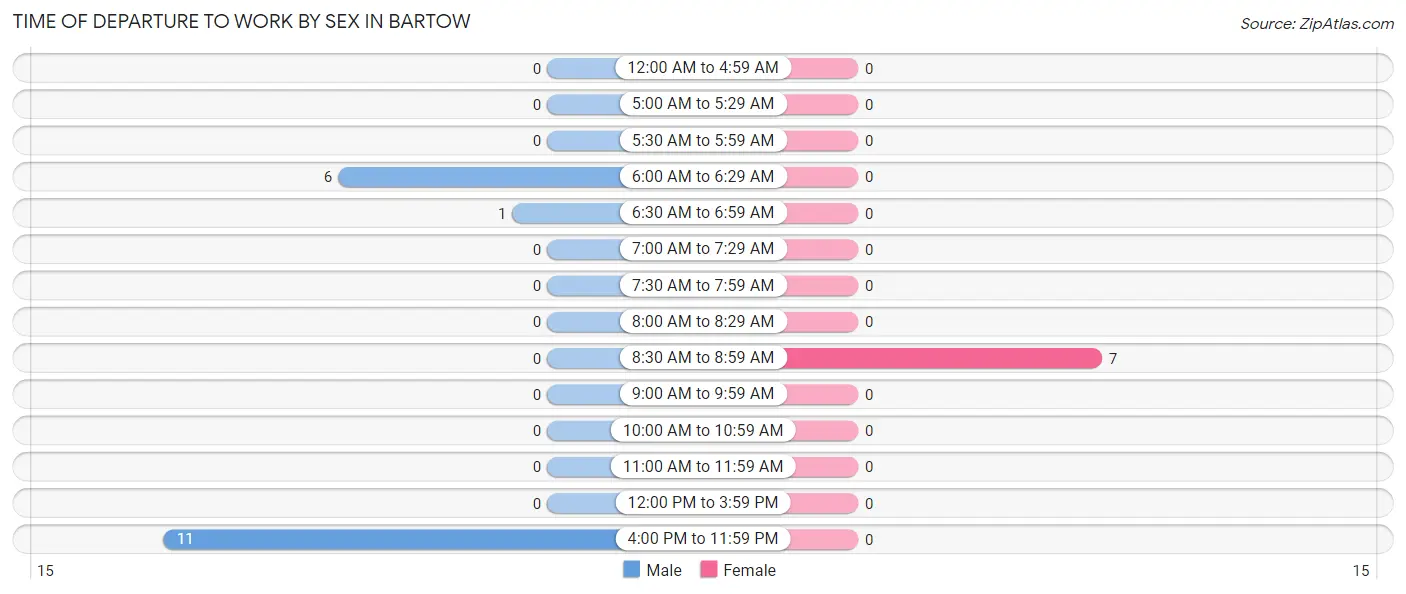
| Time of Departure | Male | Female |
| 12:00 AM to 4:59 AM | 0 (0.0%) | 0 (0.0%) |
| 5:00 AM to 5:29 AM | 0 (0.0%) | 0 (0.0%) |
| 5:30 AM to 5:59 AM | 0 (0.0%) | 0 (0.0%) |
| 6:00 AM to 6:29 AM | 6 (33.3%) | 0 (0.0%) |
| 6:30 AM to 6:59 AM | 1 (5.6%) | 0 (0.0%) |
| 7:00 AM to 7:29 AM | 0 (0.0%) | 0 (0.0%) |
| 7:30 AM to 7:59 AM | 0 (0.0%) | 0 (0.0%) |
| 8:00 AM to 8:29 AM | 0 (0.0%) | 0 (0.0%) |
| 8:30 AM to 8:59 AM | 0 (0.0%) | 7 (100.0%) |
| 9:00 AM to 9:59 AM | 0 (0.0%) | 0 (0.0%) |
| 10:00 AM to 10:59 AM | 0 (0.0%) | 0 (0.0%) |
| 11:00 AM to 11:59 AM | 0 (0.0%) | 0 (0.0%) |
| 12:00 PM to 3:59 PM | 0 (0.0%) | 0 (0.0%) |
| 4:00 PM to 11:59 PM | 11 (61.1%) | 0 (0.0%) |
| Total | 18 (100.0%) | 7 (100.0%) |
Housing Occupancy in Bartow
Occupancy by Ownership in Bartow
Of the total 49 dwellings in Bartow, owner-occupied units account for 40 (81.6%), while renter-occupied units make up 9 (18.4%).
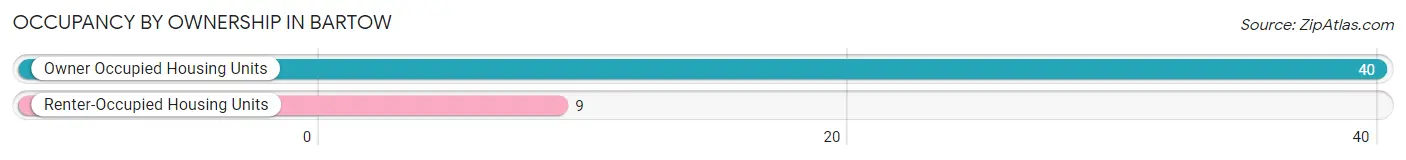
| Occupancy | # Housing Units | % Housing Units |
| Owner Occupied Housing Units | 40 | 81.6% |
| Renter-Occupied Housing Units | 9 | 18.4% |
| Total Occupied Housing Units | 49 | 100.0% |
Occupancy by Household Size in Bartow
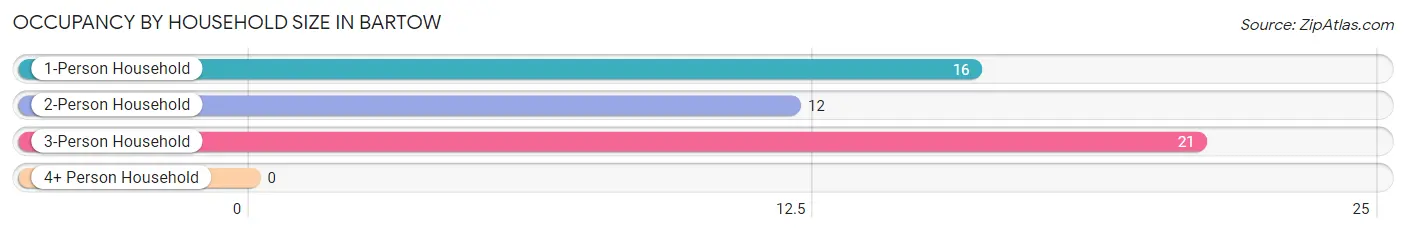
| Household Size | # Housing Units | % Housing Units |
| 1-Person Household | 16 | 32.7% |
| 2-Person Household | 12 | 24.5% |
| 3-Person Household | 21 | 42.9% |
| 4+ Person Household | 0 | 0.0% |
| Total Housing Units | 49 | 100.0% |
Occupancy by Ownership by Household Size in Bartow
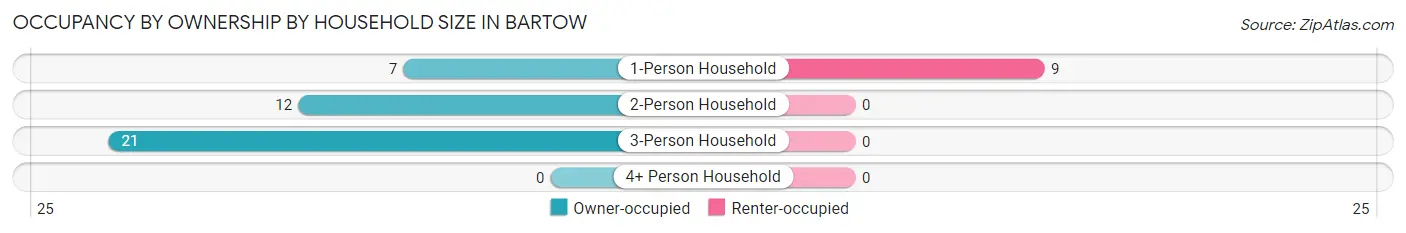
| Household Size | Owner-occupied | Renter-occupied |
| 1-Person Household | 7 (43.8%) | 9 (56.2%) |
| 2-Person Household | 12 (100.0%) | 0 (0.0%) |
| 3-Person Household | 21 (100.0%) | 0 (0.0%) |
| 4+ Person Household | 0 (0.0%) | 0 (0.0%) |
| Total Housing Units | 40 (81.6%) | 9 (18.4%) |
Occupancy by Educational Attainment in Bartow
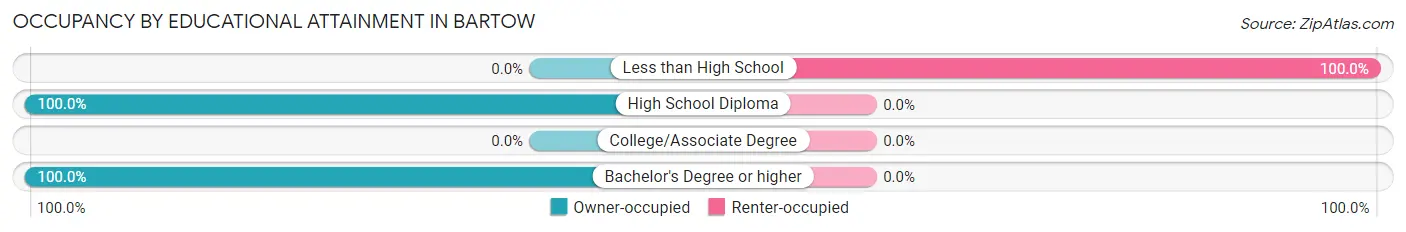
| Household Size | Owner-occupied | Renter-occupied |
| Less than High School | 0 (0.0%) | 9 (100.0%) |
| High School Diploma | 29 (100.0%) | 0 (0.0%) |
| College/Associate Degree | 0 (0.0%) | 0 (0.0%) |
| Bachelor's Degree or higher | 11 (100.0%) | 0 (0.0%) |
Occupancy by Age of Householder in Bartow
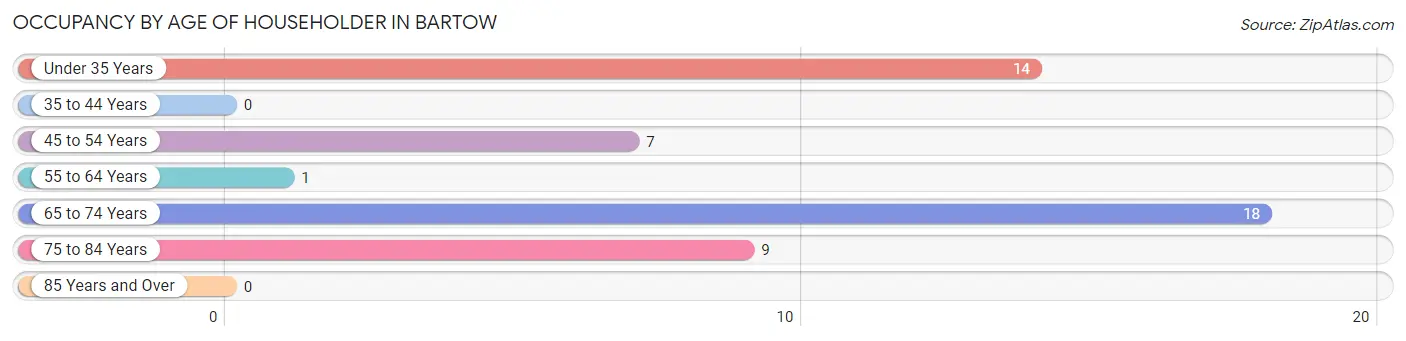
| Age Bracket | # Households | % Households |
| Under 35 Years | 14 | 28.6% |
| 35 to 44 Years | 0 | 0.0% |
| 45 to 54 Years | 7 | 14.3% |
| 55 to 64 Years | 1 | 2.0% |
| 65 to 74 Years | 18 | 36.7% |
| 75 to 84 Years | 9 | 18.4% |
| 85 Years and Over | 0 | 0.0% |
| Total | 49 | 100.0% |
Housing Finances in Bartow
Median Income by Occupancy in Bartow
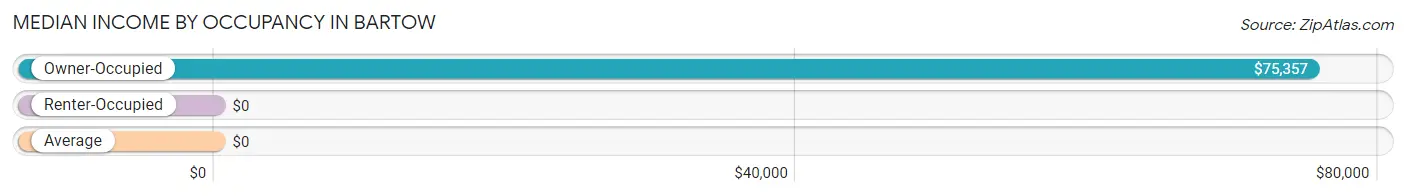
| Occupancy Type | # Households | Median Income |
| Owner-Occupied | 40 (81.6%) | $75,357 |
| Renter-Occupied | 9 (18.4%) | $0 |
| Average | 49 (100.0%) | $0 |
Occupancy by Householder Income Bracket in Bartow
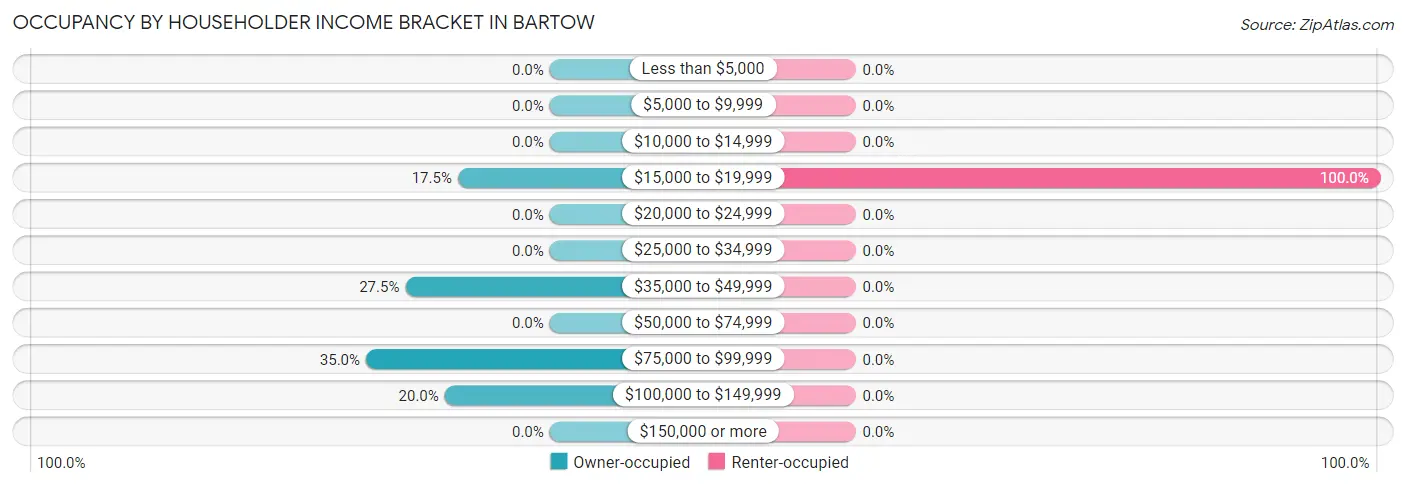
| Income Bracket | Owner-occupied | Renter-occupied |
| Less than $5,000 | 0 (0.0%) | 0 (0.0%) |
| $5,000 to $9,999 | 0 (0.0%) | 0 (0.0%) |
| $10,000 to $14,999 | 0 (0.0%) | 0 (0.0%) |
| $15,000 to $19,999 | 7 (17.5%) | 9 (100.0%) |
| $20,000 to $24,999 | 0 (0.0%) | 0 (0.0%) |
| $25,000 to $34,999 | 0 (0.0%) | 0 (0.0%) |
| $35,000 to $49,999 | 11 (27.5%) | 0 (0.0%) |
| $50,000 to $74,999 | 0 (0.0%) | 0 (0.0%) |
| $75,000 to $99,999 | 14 (35.0%) | 0 (0.0%) |
| $100,000 to $149,999 | 8 (20.0%) | 0 (0.0%) |
| $150,000 or more | 0 (0.0%) | 0 (0.0%) |
| Total | 40 (100.0%) | 9 (100.0%) |
Monthly Housing Cost Tiers in Bartow
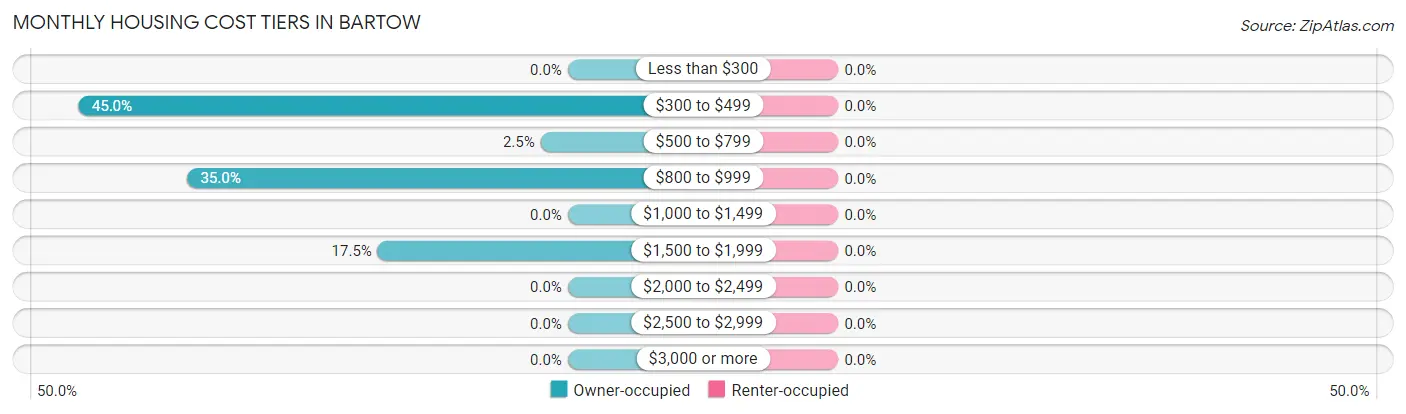
| Monthly Cost | Owner-occupied | Renter-occupied |
| Less than $300 | 0 (0.0%) | 0 (0.0%) |
| $300 to $499 | 18 (45.0%) | 0 (0.0%) |
| $500 to $799 | 1 (2.5%) | 0 (0.0%) |
| $800 to $999 | 14 (35.0%) | 0 (0.0%) |
| $1,000 to $1,499 | 0 (0.0%) | 0 (0.0%) |
| $1,500 to $1,999 | 7 (17.5%) | 0 (0.0%) |
| $2,000 to $2,499 | 0 (0.0%) | 0 (0.0%) |
| $2,500 to $2,999 | 0 (0.0%) | 0 (0.0%) |
| $3,000 or more | 0 (0.0%) | 0 (0.0%) |
| Total | 40 (100.0%) | 9 (100.0%) |
Physical Housing Characteristics in Bartow
Housing Structures in Bartow
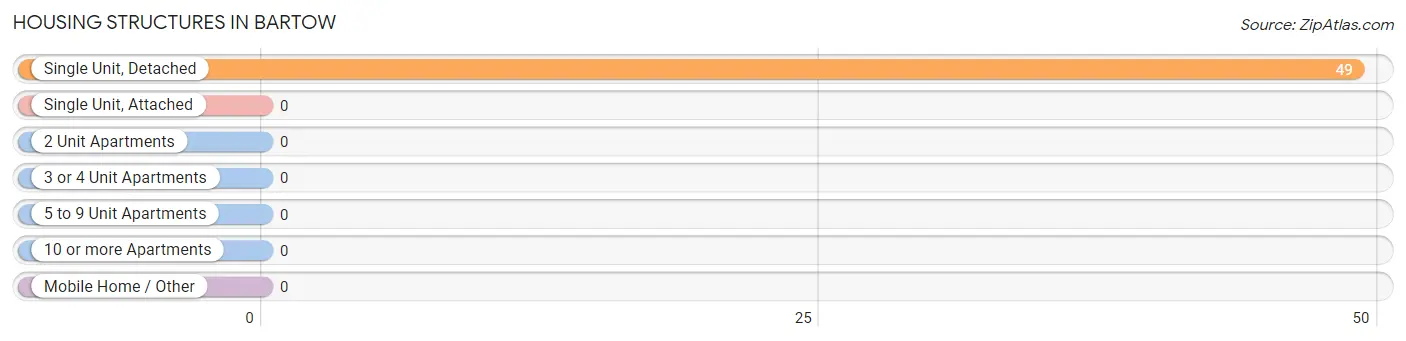
| Structure Type | # Housing Units | % Housing Units |
| Single Unit, Detached | 49 | 100.0% |
| Single Unit, Attached | 0 | 0.0% |
| 2 Unit Apartments | 0 | 0.0% |
| 3 or 4 Unit Apartments | 0 | 0.0% |
| 5 to 9 Unit Apartments | 0 | 0.0% |
| 10 or more Apartments | 0 | 0.0% |
| Mobile Home / Other | 0 | 0.0% |
| Total | 49 | 100.0% |
Housing Structures by Occupancy in Bartow
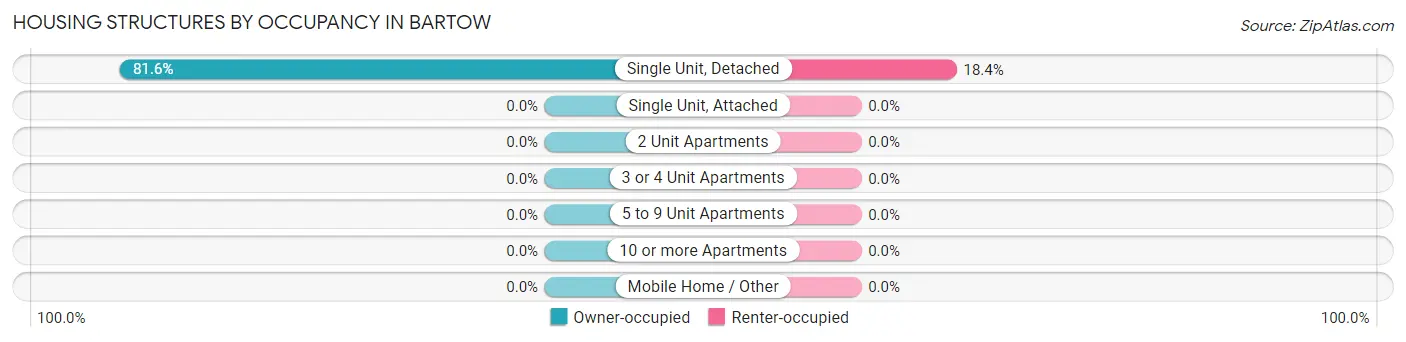
| Structure Type | Owner-occupied | Renter-occupied |
| Single Unit, Detached | 40 (81.6%) | 9 (18.4%) |
| Single Unit, Attached | 0 (0.0%) | 0 (0.0%) |
| 2 Unit Apartments | 0 (0.0%) | 0 (0.0%) |
| 3 or 4 Unit Apartments | 0 (0.0%) | 0 (0.0%) |
| 5 to 9 Unit Apartments | 0 (0.0%) | 0 (0.0%) |
| 10 or more Apartments | 0 (0.0%) | 0 (0.0%) |
| Mobile Home / Other | 0 (0.0%) | 0 (0.0%) |
| Total | 40 (81.6%) | 9 (18.4%) |
Housing Structures by Number of Rooms in Bartow
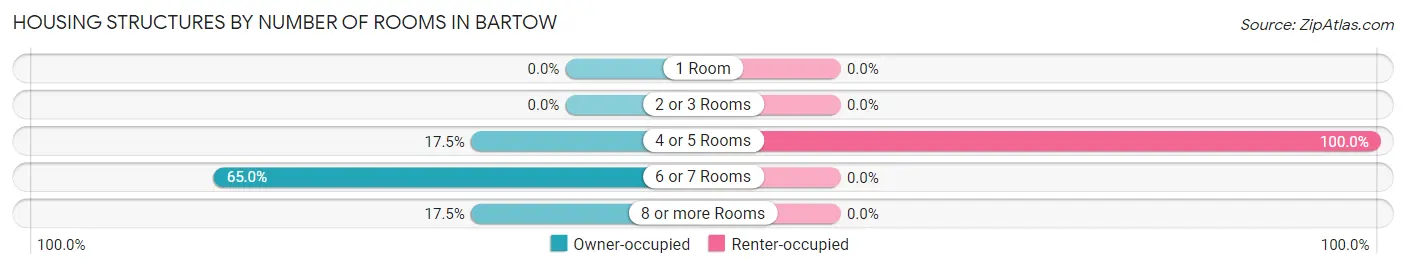
| Number of Rooms | Owner-occupied | Renter-occupied |
| 1 Room | 0 (0.0%) | 0 (0.0%) |
| 2 or 3 Rooms | 0 (0.0%) | 0 (0.0%) |
| 4 or 5 Rooms | 7 (17.5%) | 9 (100.0%) |
| 6 or 7 Rooms | 26 (65.0%) | 0 (0.0%) |
| 8 or more Rooms | 7 (17.5%) | 0 (0.0%) |
| Total | 40 (100.0%) | 9 (100.0%) |
Housing Structure by Heating Type in Bartow
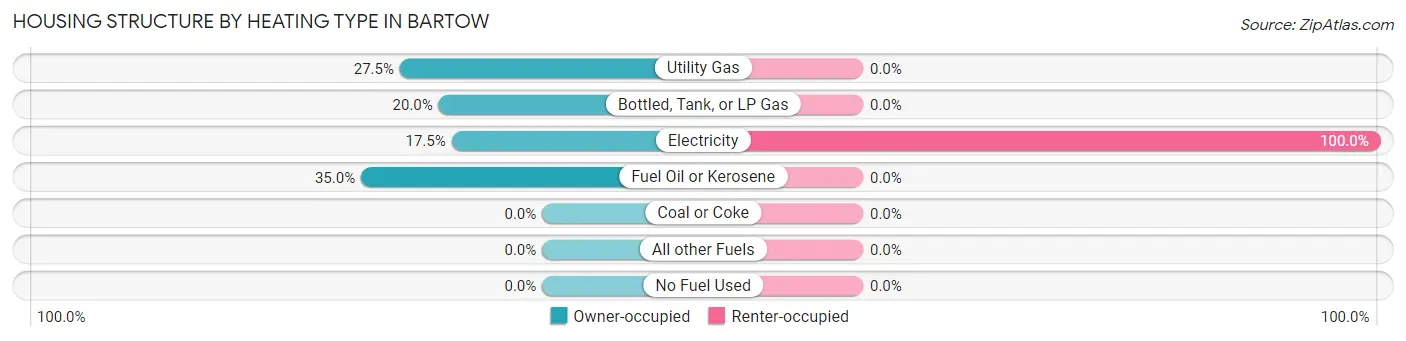
| Heating Type | Owner-occupied | Renter-occupied |
| Utility Gas | 11 (27.5%) | 0 (0.0%) |
| Bottled, Tank, or LP Gas | 8 (20.0%) | 0 (0.0%) |
| Electricity | 7 (17.5%) | 9 (100.0%) |
| Fuel Oil or Kerosene | 14 (35.0%) | 0 (0.0%) |
| Coal or Coke | 0 (0.0%) | 0 (0.0%) |
| All other Fuels | 0 (0.0%) | 0 (0.0%) |
| No Fuel Used | 0 (0.0%) | 0 (0.0%) |
| Total | 40 (100.0%) | 9 (100.0%) |
Household Vehicle Usage in Bartow
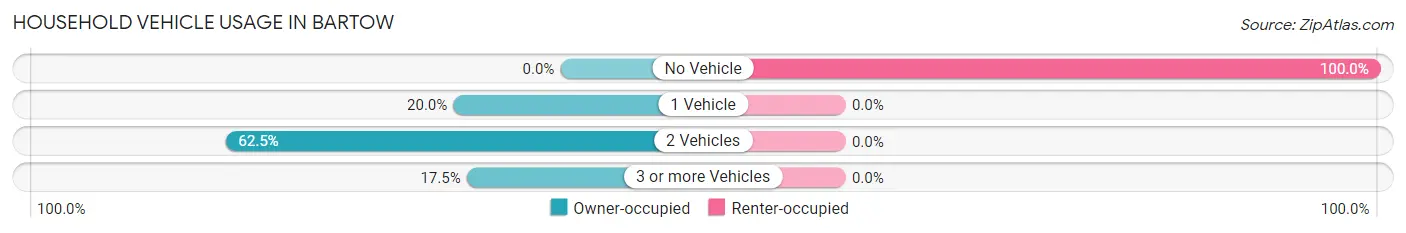
| Vehicles per Household | Owner-occupied | Renter-occupied |
| No Vehicle | 0 (0.0%) | 9 (100.0%) |
| 1 Vehicle | 8 (20.0%) | 0 (0.0%) |
| 2 Vehicles | 25 (62.5%) | 0 (0.0%) |
| 3 or more Vehicles | 7 (17.5%) | 0 (0.0%) |
| Total | 40 (100.0%) | 9 (100.0%) |
Real Estate & Mortgages in Bartow
Real Estate and Mortgage Overview in Bartow
| Characteristic | Without Mortgage | With Mortgage |
| Housing Units | 19 | 21 |
| Median Property Value | $161,800 | $0 |
| Median Household Income | $48,068 | $0 |
| Monthly Housing Costs | $361 | $0 |
| Real Estate Taxes | - | - |
Property Value by Mortgage Status in Bartow
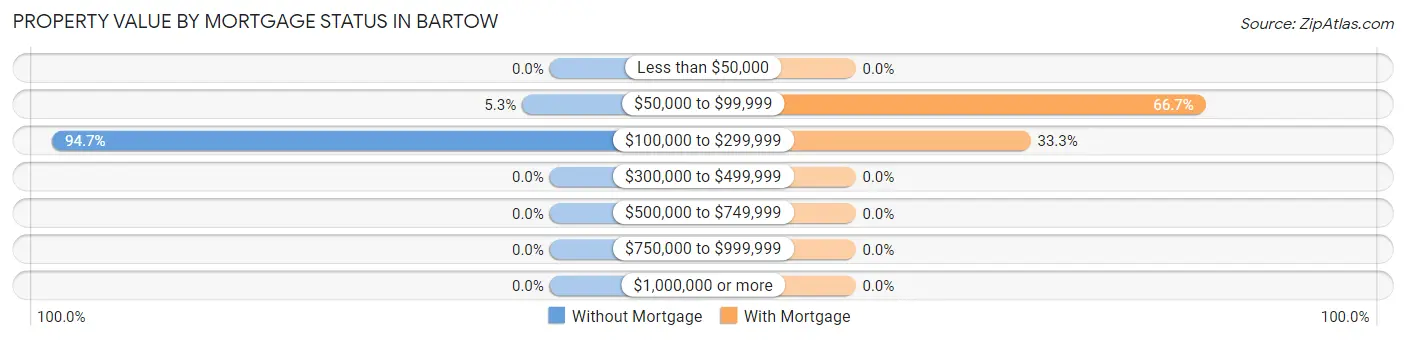
| Property Value | Without Mortgage | With Mortgage |
| Less than $50,000 | 0 (0.0%) | 0 (0.0%) |
| $50,000 to $99,999 | 1 (5.3%) | 14 (66.7%) |
| $100,000 to $299,999 | 18 (94.7%) | 7 (33.3%) |
| $300,000 to $499,999 | 0 (0.0%) | 0 (0.0%) |
| $500,000 to $749,999 | 0 (0.0%) | 0 (0.0%) |
| $750,000 to $999,999 | 0 (0.0%) | 0 (0.0%) |
| $1,000,000 or more | 0 (0.0%) | 0 (0.0%) |
| Total | 19 (100.0%) | 21 (100.0%) |
Household Income by Mortgage Status in Bartow
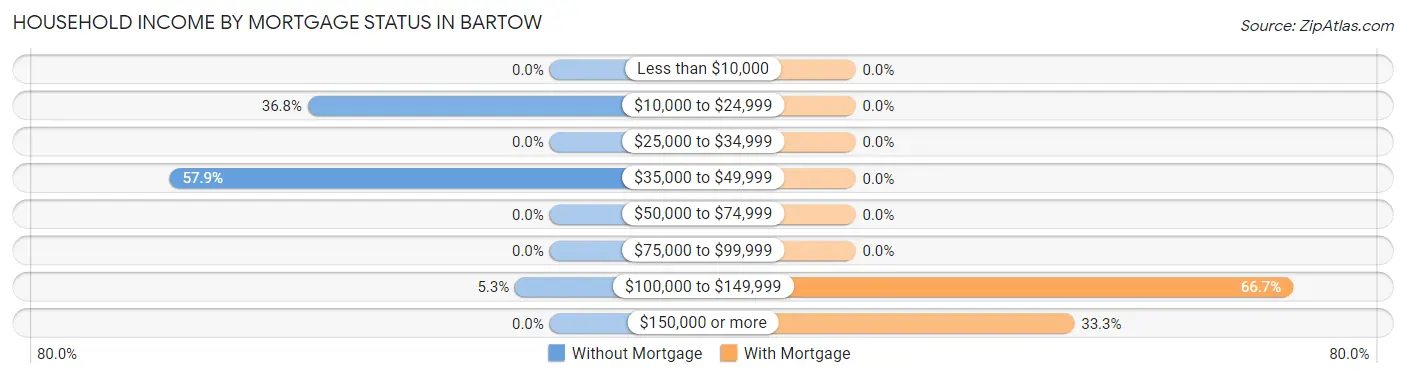
| Household Income | Without Mortgage | With Mortgage |
| Less than $10,000 | 0 (0.0%) | 0 (0.0%) |
| $10,000 to $24,999 | 7 (36.8%) | 0 (0.0%) |
| $25,000 to $34,999 | 0 (0.0%) | 0 (0.0%) |
| $35,000 to $49,999 | 11 (57.9%) | 0 (0.0%) |
| $50,000 to $74,999 | 0 (0.0%) | 0 (0.0%) |
| $75,000 to $99,999 | 0 (0.0%) | 0 (0.0%) |
| $100,000 to $149,999 | 1 (5.3%) | 14 (66.7%) |
| $150,000 or more | 0 (0.0%) | 7 (33.3%) |
| Total | 19 (100.0%) | 21 (100.0%) |
Property Value to Household Income Ratio in Bartow
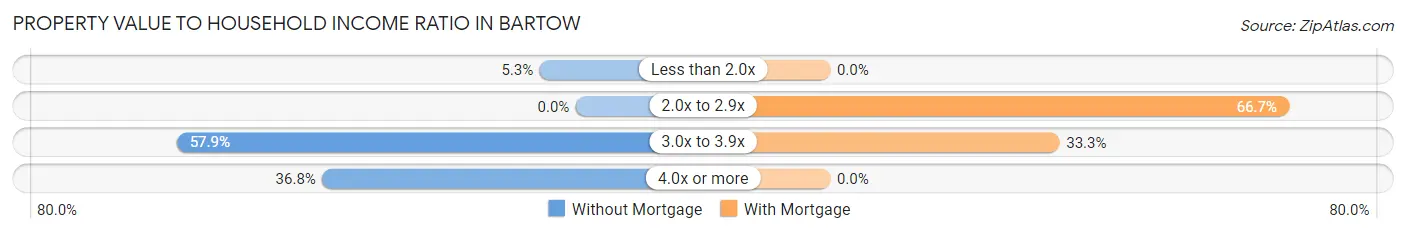
| Value-to-Income Ratio | Without Mortgage | With Mortgage |
| Less than 2.0x | 1 (5.3%) | 0 (0.0%) |
| 2.0x to 2.9x | 0 (0.0%) | 14 (66.7%) |
| 3.0x to 3.9x | 11 (57.9%) | 7 (33.3%) |
| 4.0x or more | 7 (36.8%) | 0 (0.0%) |
| Total | 19 (100.0%) | 21 (100.0%) |
Real Estate Taxes by Mortgage Status in Bartow
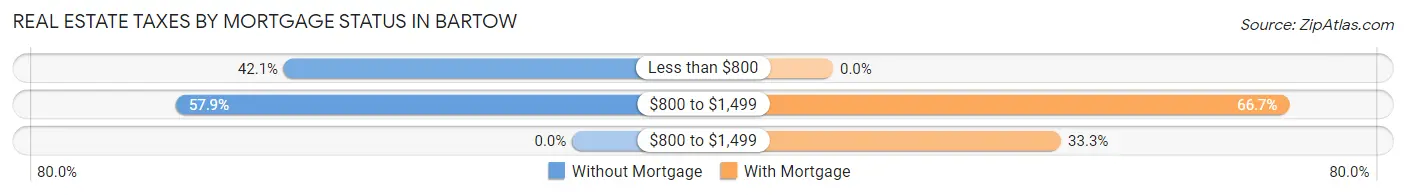
| Property Taxes | Without Mortgage | With Mortgage |
| Less than $800 | 8 (42.1%) | 0 (0.0%) |
| $800 to $1,499 | 11 (57.9%) | 14 (66.7%) |
| $800 to $1,499 | 0 (0.0%) | 7 (33.3%) |
| Total | 19 (100.0%) | 21 (100.0%) |
Health & Disability in Bartow
Health Insurance Coverage by Age in Bartow
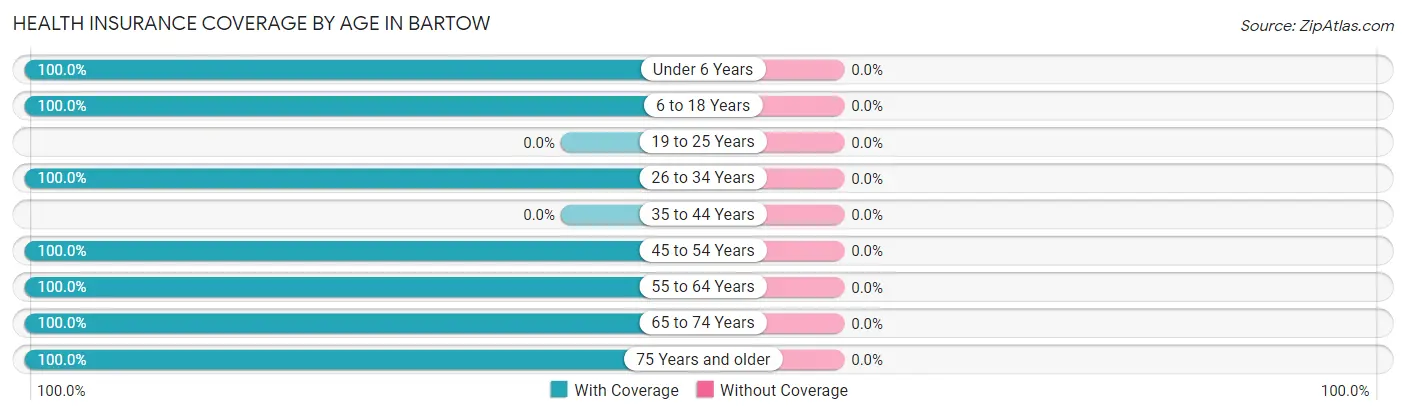
| Age Bracket | With Coverage | Without Coverage |
| Under 6 Years | 10 (100.0%) | 0 (0.0%) |
| 6 to 18 Years | 6 (100.0%) | 0 (0.0%) |
| 19 to 25 Years | 0 (0.0%) | 0 (0.0%) |
| 26 to 34 Years | 25 (100.0%) | 0 (0.0%) |
| 35 to 44 Years | 0 (0.0%) | 0 (0.0%) |
| 45 to 54 Years | 14 (100.0%) | 0 (0.0%) |
| 55 to 64 Years | 1 (100.0%) | 0 (0.0%) |
| 65 to 74 Years | 46 (100.0%) | 0 (0.0%) |
| 75 Years and older | 9 (100.0%) | 0 (0.0%) |
| Total | 111 (100.0%) | 0 (0.0%) |
Health Insurance Coverage by Citizenship Status in Bartow
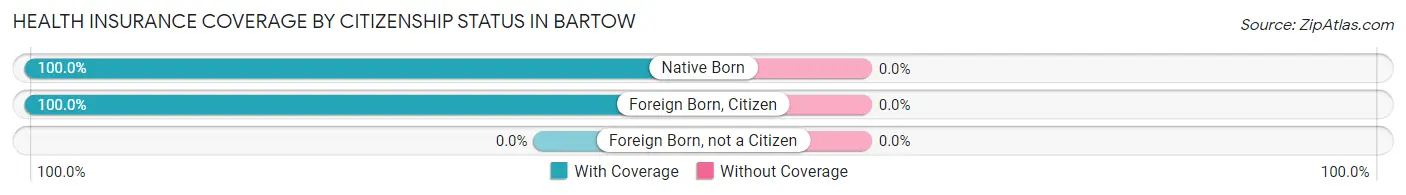
| Citizenship Status | With Coverage | Without Coverage |
| Native Born | 10 (100.0%) | 0 (0.0%) |
| Foreign Born, Citizen | 6 (100.0%) | 0 (0.0%) |
| Foreign Born, not a Citizen | 0 (0.0%) | 0 (0.0%) |
Health Insurance Coverage by Household Income in Bartow
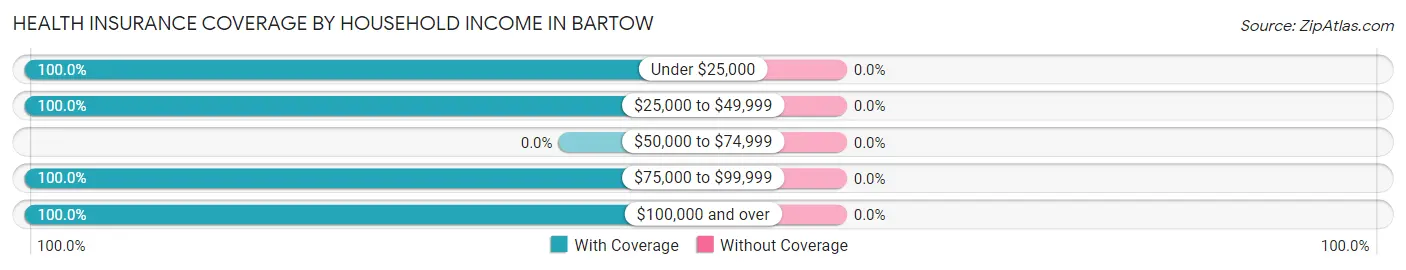
| Household Income | With Coverage | Without Coverage |
| Under $25,000 | 16 (100.0%) | 0 (0.0%) |
| $25,000 to $49,999 | 39 (100.0%) | 0 (0.0%) |
| $50,000 to $74,999 | 0 (0.0%) | 0 (0.0%) |
| $75,000 to $99,999 | 35 (100.0%) | 0 (0.0%) |
| $100,000 and over | 21 (100.0%) | 0 (0.0%) |
Public vs Private Health Insurance Coverage by Age in Bartow
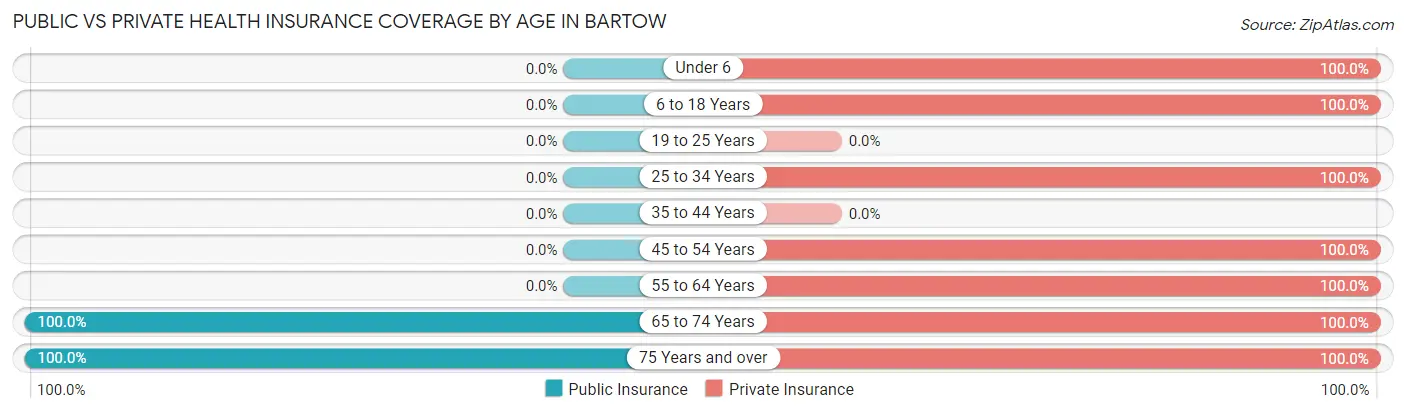
| Age Bracket | Public Insurance | Private Insurance |
| Under 6 | 0 (0.0%) | 10 (100.0%) |
| 6 to 18 Years | 0 (0.0%) | 6 (100.0%) |
| 19 to 25 Years | 0 (0.0%) | 0 (0.0%) |
| 25 to 34 Years | 0 (0.0%) | 25 (100.0%) |
| 35 to 44 Years | 0 (0.0%) | 0 (0.0%) |
| 45 to 54 Years | 0 (0.0%) | 14 (100.0%) |
| 55 to 64 Years | 0 (0.0%) | 1 (100.0%) |
| 65 to 74 Years | 46 (100.0%) | 46 (100.0%) |
| 75 Years and over | 9 (100.0%) | 9 (100.0%) |
| Total | 55 (49.5%) | 111 (100.0%) |
Disability Status by Sex by Age in Bartow
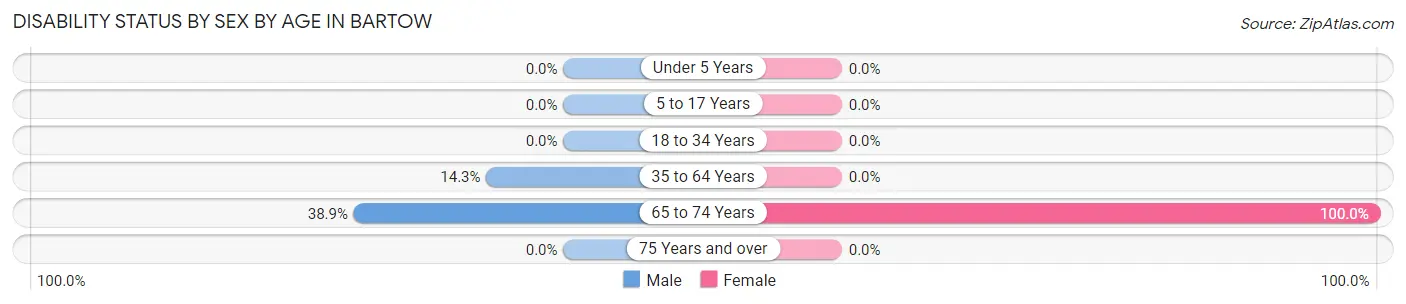
| Age Bracket | Male | Female |
| Under 5 Years | 0 (0.0%) | 0 (0.0%) |
| 5 to 17 Years | 0 (0.0%) | 0 (0.0%) |
| 18 to 34 Years | 0 (0.0%) | 0 (0.0%) |
| 35 to 64 Years | 1 (14.3%) | 0 (0.0%) |
| 65 to 74 Years | 7 (38.9%) | 28 (100.0%) |
| 75 Years and over | 0 (0.0%) | 0 (0.0%) |
Disability Class by Sex by Age in Bartow
Disability Class: Hearing Difficulty
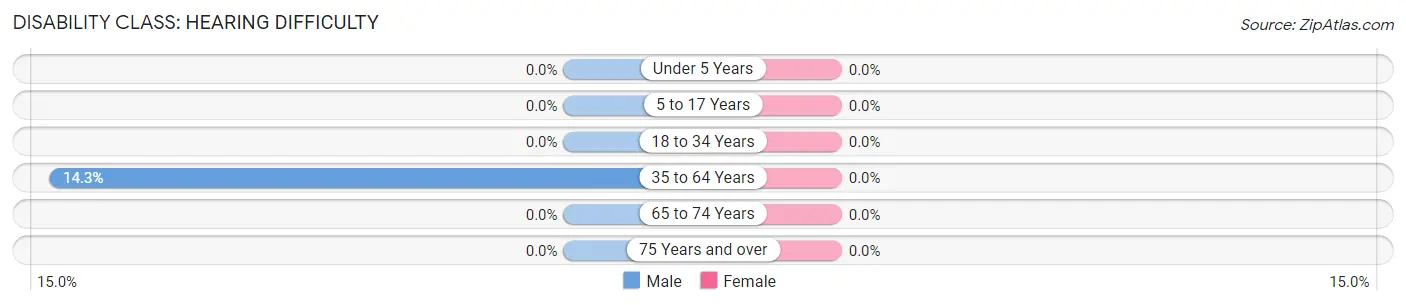
| Age Bracket | Male | Female |
| Under 5 Years | 0 (0.0%) | 0 (0.0%) |
| 5 to 17 Years | 0 (0.0%) | 0 (0.0%) |
| 18 to 34 Years | 0 (0.0%) | 0 (0.0%) |
| 35 to 64 Years | 1 (14.3%) | 0 (0.0%) |
| 65 to 74 Years | 0 (0.0%) | 0 (0.0%) |
| 75 Years and over | 0 (0.0%) | 0 (0.0%) |
Disability Class: Vision Difficulty
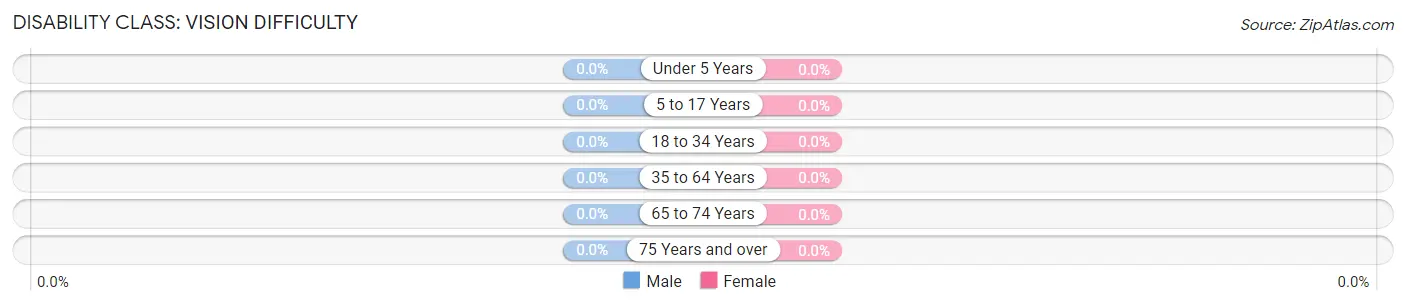
| Age Bracket | Male | Female |
| Under 5 Years | 0 (0.0%) | 0 (0.0%) |
| 5 to 17 Years | 0 (0.0%) | 0 (0.0%) |
| 18 to 34 Years | 0 (0.0%) | 0 (0.0%) |
| 35 to 64 Years | 0 (0.0%) | 0 (0.0%) |
| 65 to 74 Years | 0 (0.0%) | 0 (0.0%) |
| 75 Years and over | 0 (0.0%) | 0 (0.0%) |
Disability Class: Cognitive Difficulty
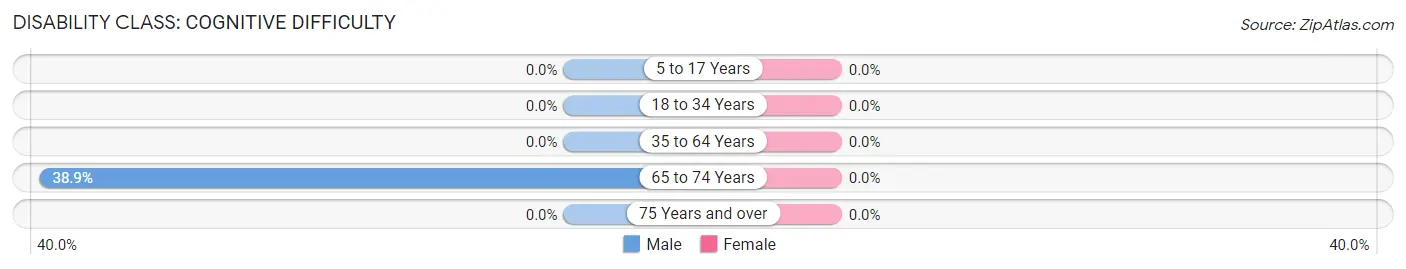
| Age Bracket | Male | Female |
| 5 to 17 Years | 0 (0.0%) | 0 (0.0%) |
| 18 to 34 Years | 0 (0.0%) | 0 (0.0%) |
| 35 to 64 Years | 0 (0.0%) | 0 (0.0%) |
| 65 to 74 Years | 7 (38.9%) | 0 (0.0%) |
| 75 Years and over | 0 (0.0%) | 0 (0.0%) |
Disability Class: Ambulatory Difficulty
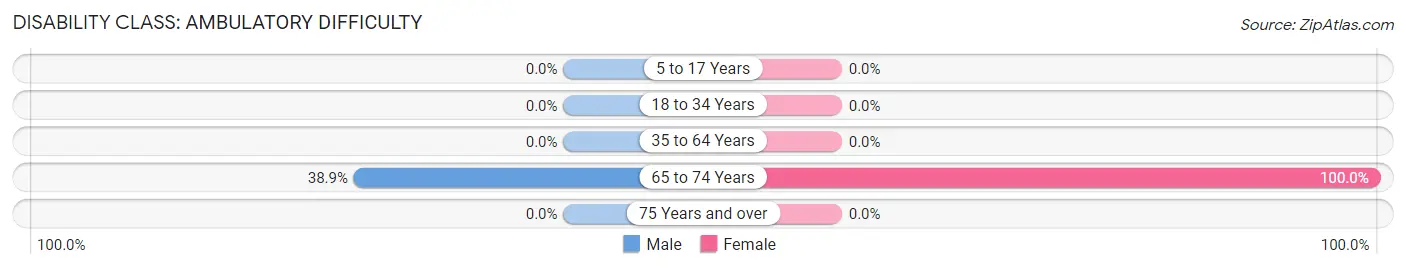
| Age Bracket | Male | Female |
| 5 to 17 Years | 0 (0.0%) | 0 (0.0%) |
| 18 to 34 Years | 0 (0.0%) | 0 (0.0%) |
| 35 to 64 Years | 0 (0.0%) | 0 (0.0%) |
| 65 to 74 Years | 7 (38.9%) | 28 (100.0%) |
| 75 Years and over | 0 (0.0%) | 0 (0.0%) |
Disability Class: Self-Care Difficulty
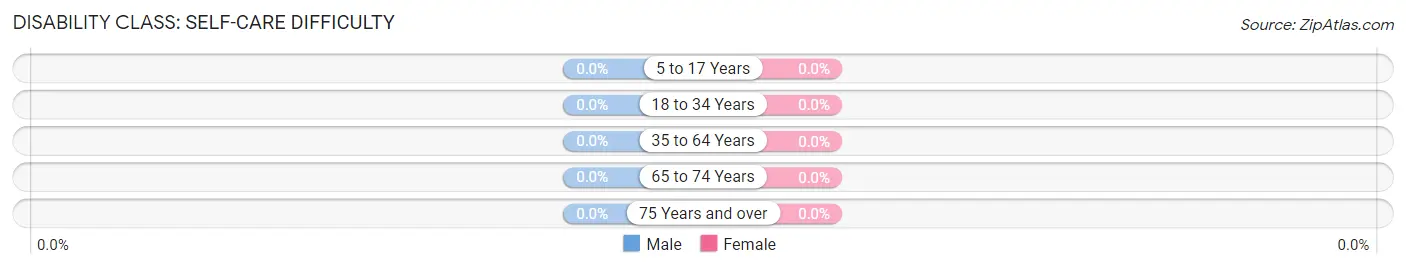
| Age Bracket | Male | Female |
| 5 to 17 Years | 0 (0.0%) | 0 (0.0%) |
| 18 to 34 Years | 0 (0.0%) | 0 (0.0%) |
| 35 to 64 Years | 0 (0.0%) | 0 (0.0%) |
| 65 to 74 Years | 0 (0.0%) | 0 (0.0%) |
| 75 Years and over | 0 (0.0%) | 0 (0.0%) |
Technology Access in Bartow
Computing Device Access in Bartow
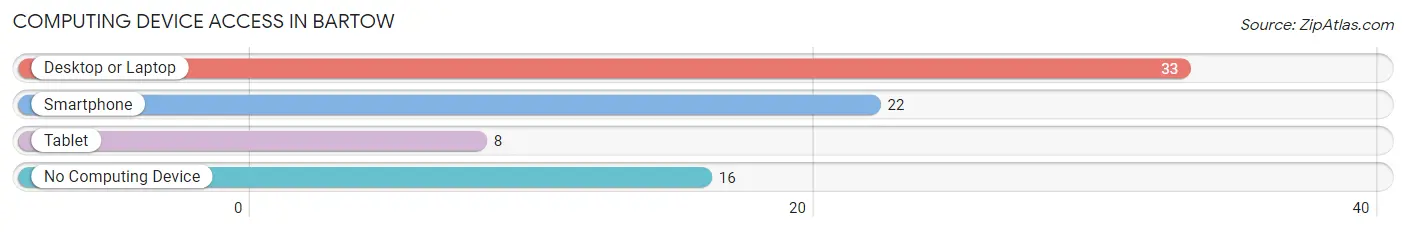
| Device Type | # Households | % Households |
| Desktop or Laptop | 33 | 67.3% |
| Smartphone | 22 | 44.9% |
| Tablet | 8 | 16.3% |
| No Computing Device | 16 | 32.7% |
| Total | 49 | 100.0% |
Internet Access in Bartow
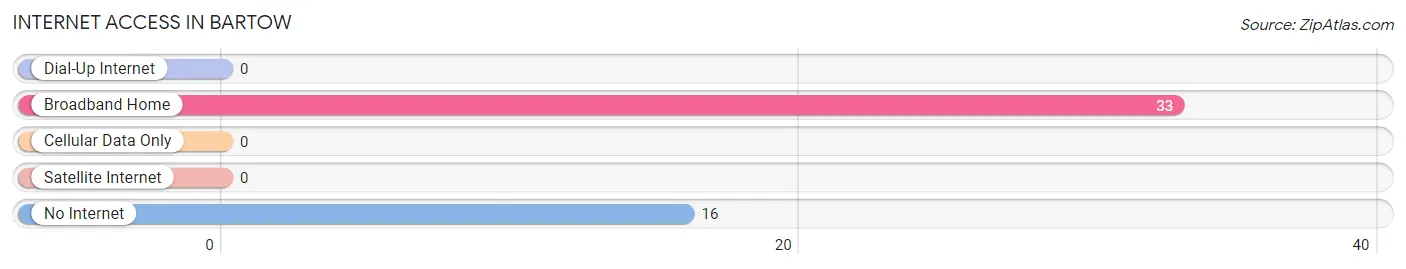
| Internet Type | # Households | % Households |
| Dial-Up Internet | 0 | 0.0% |
| Broadband Home | 33 | 67.3% |
| Cellular Data Only | 0 | 0.0% |
| Satellite Internet | 0 | 0.0% |
| No Internet | 16 | 32.7% |
| Total | 49 | 100.0% |
Bartow Summary
Bartow is a small unincorporated community located in Pocahontas County, West Virginia. It is situated in the Appalachian Mountains, and is surrounded by the Monongahela National Forest. The population of Bartow was estimated to be around 200 people in 2020.
History
Bartow was first settled in the late 1700s by a group of settlers from Pennsylvania. The town was named after a local settler, John Bartow, who was a prominent figure in the area. The town was officially incorporated in 1883.
In the early 1900s, Bartow was a thriving logging and coal mining town. The town was home to several coal mines, and the railroad was a major source of transportation for the town. The town also had a post office, a general store, and a school.
In the 1950s, the coal industry began to decline, and the town's population began to dwindle. By the 1970s, the town was mostly abandoned. In the 1980s, the town was revitalized by the Monongahela National Forest, which brought in new businesses and tourists.
Geography
Bartow is located in the Appalachian Mountains of West Virginia. The town is situated in the Monongahela National Forest, and is surrounded by mountains and forests. The town is located near the Greenbrier River, and is about an hour away from the city of Elkins.
The climate in Bartow is humid continental, with cold winters and hot summers. The average temperature in the summer is around 75 degrees Fahrenheit, and the average temperature in the winter is around 35 degrees Fahrenheit.
Economy
The economy of Bartow is largely based on tourism. The town is a popular destination for outdoor activities such as hiking, camping, fishing, and hunting. The town is also home to several small businesses, including a general store, a post office, and a few restaurants.
Demographics
The population of Bartow was estimated to be around 200 people in 2020. The town is predominantly white, with a small minority population. The median household income in Bartow is around $30,000, and the median home value is around $100,000. The town has a low unemployment rate, and the poverty rate is below the national average.
Common Questions
What is Per Capita Income in Bartow?
Per Capita income in Bartow is $25,738.
What is the Median Family Income in Bartow?
Median Family Income in Bartow is $75,982.
What is Income or Wage Gap in Bartow?
Income or Wage Gap in Bartow is 56.5%.
Women in Bartow earn 43.5 cents for every dollar earned by a man.
What is Inequality or Gini Index in Bartow?
Inequality or Gini Index in Bartow is 0.34.
What is the Total Population of Bartow?
Total Population of Bartow is 111.
What is the Total Male Population of Bartow?
Total Male Population of Bartow is 46.
What is the Total Female Population of Bartow?
Total Female Population of Bartow is 65.
What is the Ratio of Males per 100 Females in Bartow?
There are 70.77 Males per 100 Females in Bartow.
What is the Ratio of Females per 100 Males in Bartow?
There are 141.30 Females per 100 Males in Bartow.
What is the Median Population Age in Bartow?
Median Population Age in Bartow is 63.5 Years.
What is the Average Family Size in Bartow
Average Family Size in Bartow is 2.9 People.
What is the Average Household Size in Bartow
Average Household Size in Bartow is 2.3 People.
How Large is the Labor Force in Bartow?
There are 40 People in the Labor Forcein in Bartow.
What is the Percentage of People in the Labor Force in Bartow?
39.6% of People are in the Labor Force in Bartow.