Cities with the Most Immigrants from Costa Rica in Maryland
RELATED REPORTS & OPTIONS
Costa Rica
Maryland
Compare Cities
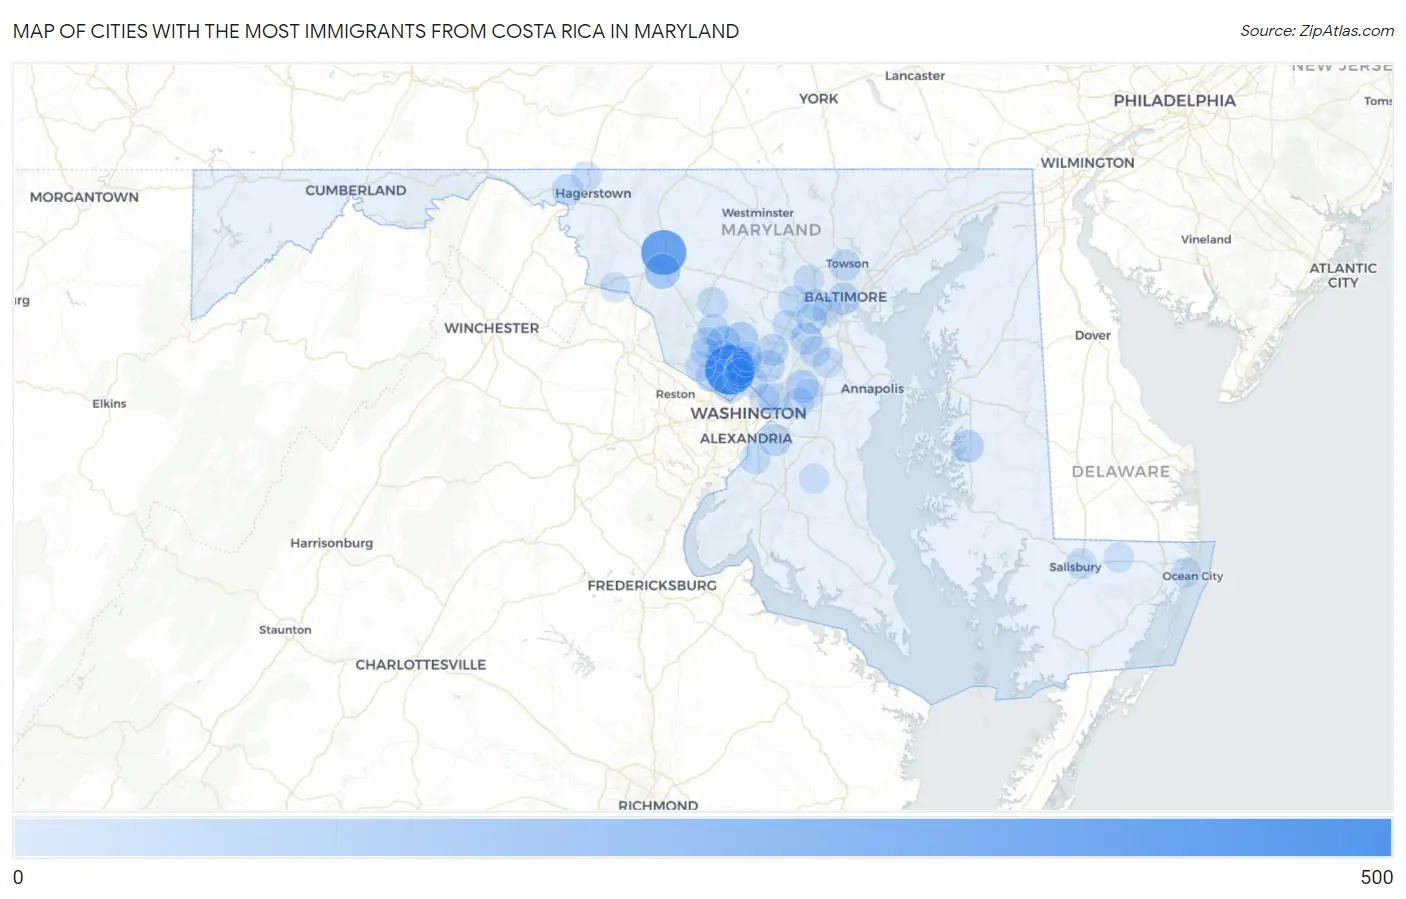
Map of Cities with the Most Immigrants from Costa Rica in Maryland
0
500
Cities with the Most Immigrants from Costa Rica in Maryland
| City | Costa Rica | vs State | vs National | |
| 1. | North Bethesda | 434 | 2,452(17.70%)#1 | 95,844(0.45%)#24 |
| 2. | Frederick | 334 | 2,452(13.62%)#2 | 95,844(0.35%)#31 |
| 3. | Ballenger Creek | 113 | 2,452(4.61%)#3 | 95,844(0.12%)#140 |
| 4. | Olney | 86 | 2,452(3.51%)#4 | 95,844(0.09%)#207 |
| 5. | Redland | 76 | 2,452(3.10%)#5 | 95,844(0.08%)#243 |
| 6. | Glenn Dale | 66 | 2,452(2.69%)#6 | 95,844(0.07%)#290 |
| 7. | Easton | 61 | 2,452(2.49%)#7 | 95,844(0.06%)#317 |
| 8. | Baltimore | 50 | 2,452(2.04%)#8 | 95,844(0.05%)#374 |
| 9. | Rockville | 50 | 2,452(2.04%)#9 | 95,844(0.05%)#378 |
| 10. | Jessup | 49 | 2,452(2.00%)#10 | 95,844(0.05%)#388 |
| 11. | Calverton | 48 | 2,452(1.96%)#11 | 95,844(0.05%)#397 |
| 12. | Camp Springs | 43 | 2,452(1.75%)#12 | 95,844(0.04%)#440 |
| 13. | Burtonsville | 43 | 2,452(1.75%)#13 | 95,844(0.04%)#441 |
| 14. | Montgomery Village | 37 | 2,452(1.51%)#14 | 95,844(0.04%)#504 |
| 15. | Wheaton | 36 | 2,452(1.47%)#15 | 95,844(0.04%)#510 |
| 16. | Towson | 35 | 2,452(1.43%)#16 | 95,844(0.04%)#521 |
| 17. | Bladensburg | 34 | 2,452(1.39%)#17 | 95,844(0.04%)#534 |
| 18. | Wilson Conococheague | 34 | 2,452(1.39%)#18 | 95,844(0.04%)#537 |
| 19. | Bethesda | 32 | 2,452(1.31%)#19 | 95,844(0.03%)#560 |
| 20. | Catonsville | 32 | 2,452(1.31%)#20 | 95,844(0.03%)#563 |
| 21. | Potomac | 31 | 2,452(1.26%)#21 | 95,844(0.03%)#581 |
| 22. | Fort Washington | 30 | 2,452(1.22%)#22 | 95,844(0.03%)#598 |
| 23. | Silver Spring | 29 | 2,452(1.18%)#23 | 95,844(0.03%)#607 |
| 24. | Ellicott City | 28 | 2,452(1.14%)#24 | 95,844(0.03%)#634 |
| 25. | South Kensington | 26 | 2,452(1.06%)#25 | 95,844(0.03%)#670 |
| 26. | Flower Hill | 24 | 2,452(0.98%)#26 | 95,844(0.03%)#704 |
| 27. | Gaithersburg | 23 | 2,452(0.94%)#27 | 95,844(0.02%)#714 |
| 28. | Salisbury | 15 | 2,452(0.61%)#28 | 95,844(0.02%)#912 |
| 29. | Columbia | 14 | 2,452(0.57%)#29 | 95,844(0.01%)#944 |
| 30. | Ilchester | 14 | 2,452(0.57%)#30 | 95,844(0.01%)#955 |
| 31. | Damascus | 13 | 2,452(0.53%)#31 | 95,844(0.01%)#992 |
| 32. | Fort Meade | 13 | 2,452(0.53%)#32 | 95,844(0.01%)#1,000 |
| 33. | Travilah | 12 | 2,452(0.49%)#33 | 95,844(0.01%)#1,044 |
| 34. | North Kensington | 12 | 2,452(0.49%)#34 | 95,844(0.01%)#1,048 |
| 35. | Odenton | 11 | 2,452(0.45%)#35 | 95,844(0.01%)#1,072 |
| 36. | Milford Mill | 11 | 2,452(0.45%)#36 | 95,844(0.01%)#1,077 |
| 37. | Mitchellville | 11 | 2,452(0.45%)#37 | 95,844(0.01%)#1,093 |
| 38. | Brunswick | 11 | 2,452(0.45%)#38 | 95,844(0.01%)#1,097 |
| 39. | Maugansville | 10 | 2,452(0.41%)#39 | 95,844(0.01%)#1,146 |
| 40. | Baden | 10 | 2,452(0.41%)#40 | 95,844(0.01%)#1,148 |
| 41. | North Potomac | 8 | 2,452(0.33%)#41 | 95,844(0.01%)#1,210 |
| 42. | Mount Rainier | 8 | 2,452(0.33%)#42 | 95,844(0.01%)#1,221 |
| 43. | Fairwood | 7 | 2,452(0.29%)#43 | 95,844(0.01%)#1,272 |
| 44. | Glenmont | 6 | 2,452(0.24%)#44 | 95,844(0.01%)#1,297 |
| 45. | Kensington | 6 | 2,452(0.24%)#45 | 95,844(0.01%)#1,314 |
| 46. | Layhill | 5 | 2,452(0.20%)#46 | 95,844(0.01%)#1,350 |
| 47. | Arbutus | 4 | 2,452(0.16%)#47 | 95,844(0.00%)#1,369 |
| 48. | Pittsville | 3 | 2,452(0.12%)#48 | 95,844(0.00%)#1,399 |
| 49. | West Ocean City | 1 | 2,452(0.04%)#49 | 95,844(0.00%)#1,437 |
Common Questions
What are the Top 10 Cities with the Most Immigrants from Costa Rica in Maryland?
Top 10 Cities with the Most Immigrants from Costa Rica in Maryland are:
#1
434
#2
334
#3
113
#4
86
#5
76
#6
66
#7
61
#8
50
#9
50
#10
49
What city has the Most Immigrants from Costa Rica in Maryland?
North Bethesda has the Most Immigrants from Costa Rica in Maryland with 434.
What is the Total Immigrants from Costa Rica in the State of Maryland?
Total Immigrants from Costa Rica in Maryland is 2,452.
What is the Total Immigrants from Costa Rica in the United States?
Total Immigrants from Costa Rica in the United States is 95,844.