Laguna Hills, CA Map & Demographics
Laguna Hills Map
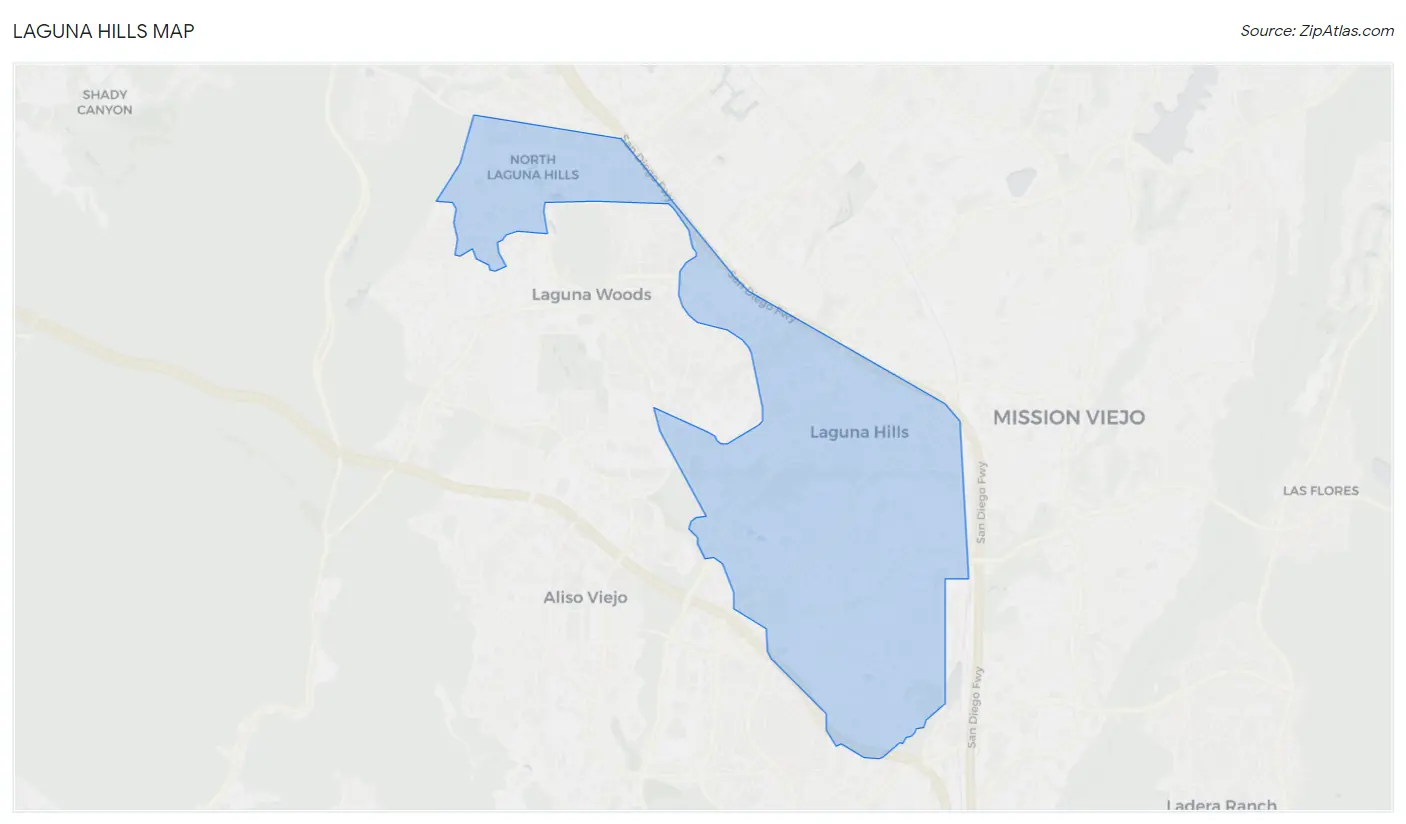
Laguna Hills Overview
$64,750
PER CAPITA INCOME
$145,202
AVG FAMILY INCOME
$122,902
AVG HOUSEHOLD INCOME
24.8%
WAGE / INCOME GAP [ % ]
75.2¢/ $1
WAGE / INCOME GAP [ $ ]
$8,728
FAMILY INCOME DEFICIT
0.49
INEQUALITY / GINI INDEX
31,170
TOTAL POPULATION
15,168
MALE POPULATION
16,002
FEMALE POPULATION
94.79
MALES / 100 FEMALES
105.50
FEMALES / 100 MALES
43.8
MEDIAN AGE
3.2
AVG FAMILY SIZE
2.6
AVG HOUSEHOLD SIZE
17,063
LABOR FORCE [ PEOPLE ]
65.8%
PERCENT IN LABOR FORCE
5.0%
UNEMPLOYMENT RATE
Laguna Hills Zip Codes
Income in Laguna Hills
Income Overview in Laguna Hills
Per Capita Income in Laguna Hills is $64,750, while median incomes of families and households are $145,202 and $122,902 respectively.
| Characteristic | Number | Measure |
| Per Capita Income | 31,170 | $64,750 |
| Median Family Income | 7,985 | $145,202 |
| Mean Family Income | 7,985 | $200,788 |
| Median Household Income | 11,525 | $122,902 |
| Mean Household Income | 11,525 | $172,203 |
| Income Deficit | 7,985 | $8,728 |
| Wage / Income Gap (%) | 31,170 | 24.80% |
| Wage / Income Gap ($) | 31,170 | 75.20¢ per $1 |
| Gini / Inequality Index | 31,170 | 0.49 |
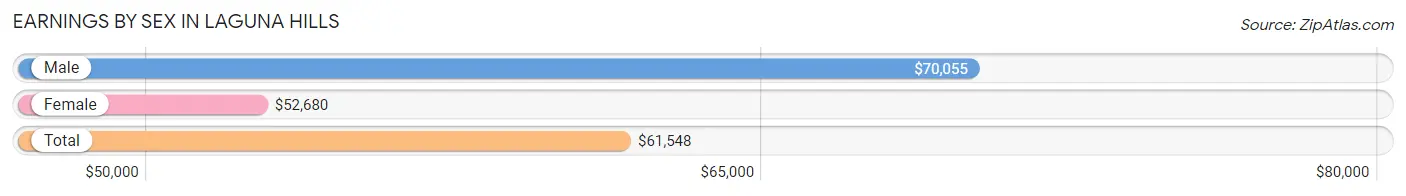
Earnings by Sex in Laguna Hills
Average Earnings in Laguna Hills are $61,548, $70,055 for men and $52,680 for women, a difference of 24.8%.
| Sex | Number | Average Earnings |
| Male | 9,303 (53.9%) | $70,055 |
| Female | 7,955 (46.1%) | $52,680 |
| Total | 17,258 (100.0%) | $61,548 |
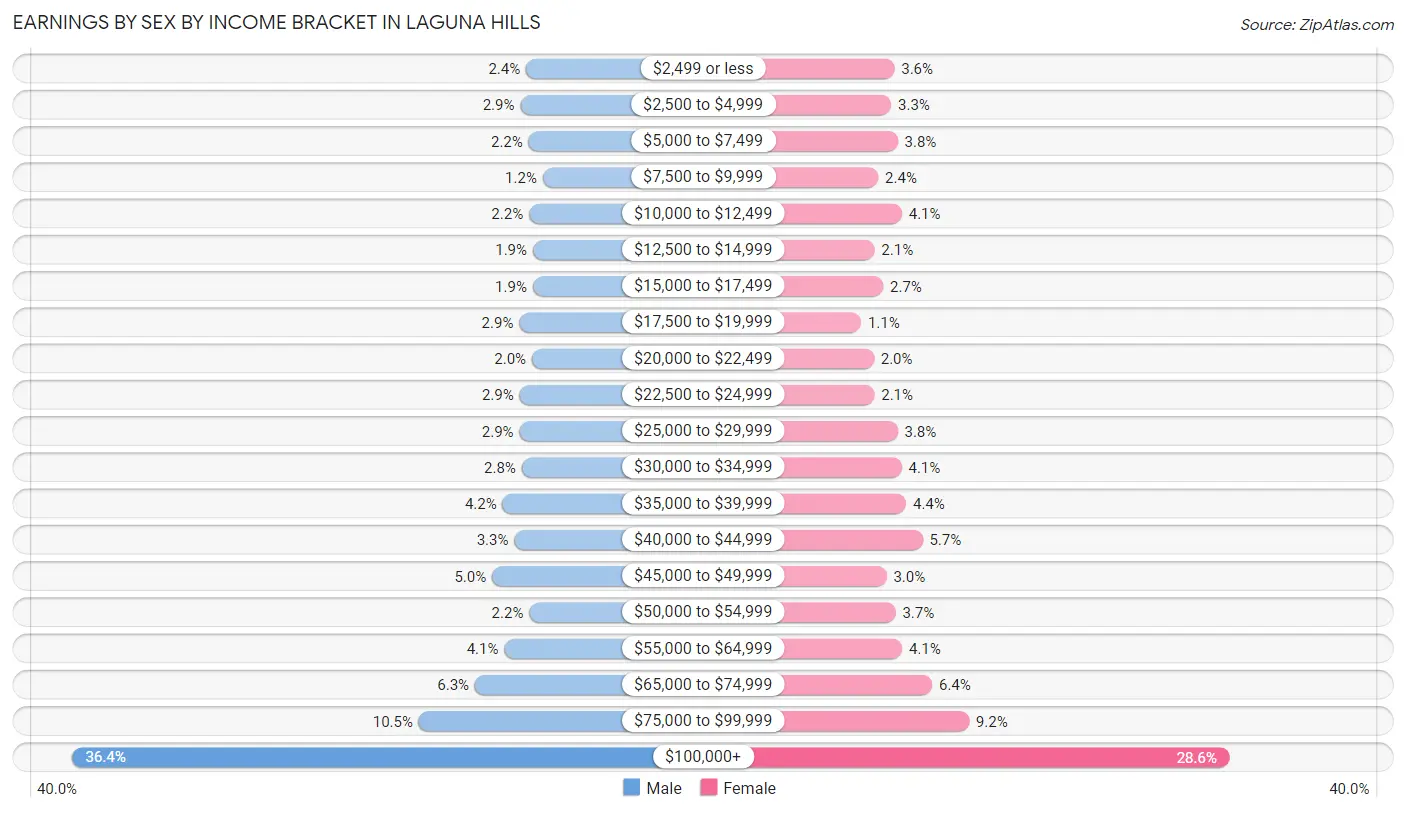
Earnings by Sex by Income Bracket in Laguna Hills
The most common earnings brackets in Laguna Hills are $100,000+ for men (3,387 | 36.4%) and $100,000+ for women (2,277 | 28.6%).
| Income | Male | Female |
| $2,499 or less | 225 (2.4%) | 283 (3.6%) |
| $2,500 to $4,999 | 265 (2.9%) | 264 (3.3%) |
| $5,000 to $7,499 | 207 (2.2%) | 303 (3.8%) |
| $7,500 to $9,999 | 109 (1.2%) | 187 (2.4%) |
| $10,000 to $12,499 | 205 (2.2%) | 328 (4.1%) |
| $12,500 to $14,999 | 178 (1.9%) | 165 (2.1%) |
| $15,000 to $17,499 | 179 (1.9%) | 216 (2.7%) |
| $17,500 to $19,999 | 273 (2.9%) | 84 (1.1%) |
| $20,000 to $22,499 | 184 (2.0%) | 161 (2.0%) |
| $22,500 to $24,999 | 271 (2.9%) | 164 (2.1%) |
| $25,000 to $29,999 | 272 (2.9%) | 302 (3.8%) |
| $30,000 to $34,999 | 256 (2.8%) | 326 (4.1%) |
| $35,000 to $39,999 | 389 (4.2%) | 353 (4.4%) |
| $40,000 to $44,999 | 307 (3.3%) | 451 (5.7%) |
| $45,000 to $49,999 | 462 (5.0%) | 236 (3.0%) |
| $50,000 to $54,999 | 203 (2.2%) | 290 (3.6%) |
| $55,000 to $64,999 | 377 (4.1%) | 329 (4.1%) |
| $65,000 to $74,999 | 581 (6.2%) | 508 (6.4%) |
| $75,000 to $99,999 | 973 (10.5%) | 728 (9.1%) |
| $100,000+ | 3,387 (36.4%) | 2,277 (28.6%) |
| Total | 9,303 (100.0%) | 7,955 (100.0%) |
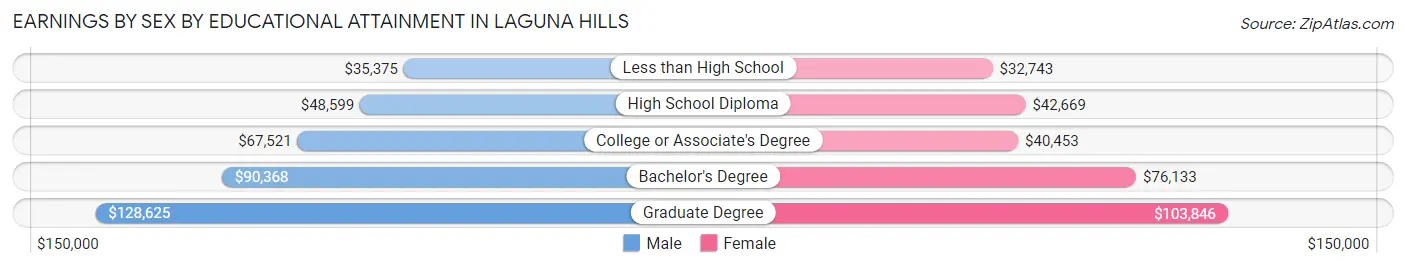
Earnings by Sex by Educational Attainment in Laguna Hills
Average earnings in Laguna Hills are $80,462 for men and $62,522 for women, a difference of 22.3%. Men with an educational attainment of graduate degree enjoy the highest average annual earnings of $128,625, while those with less than high school education earn the least with $35,375. Women with an educational attainment of graduate degree earn the most with the average annual earnings of $103,846, while those with less than high school education have the smallest earnings of $32,743.
| Educational Attainment | Male Income | Female Income |
| Less than High School | $35,375 | $32,743 |
| High School Diploma | $48,599 | $42,669 |
| College or Associate's Degree | $67,521 | $40,453 |
| Bachelor's Degree | $90,368 | $76,133 |
| Graduate Degree | $128,625 | $103,846 |
| Total | $80,462 | $62,522 |
Family Income in Laguna Hills
Family Income Brackets in Laguna Hills
According to the Laguna Hills family income data, there are 2,643 families falling into the $200,000+ income range, which is the most common income bracket and makes up 33.1% of all families. Conversely, the less than $10,000 income bracket is the least frequent group with only 128 families (1.6%) belonging to this category.
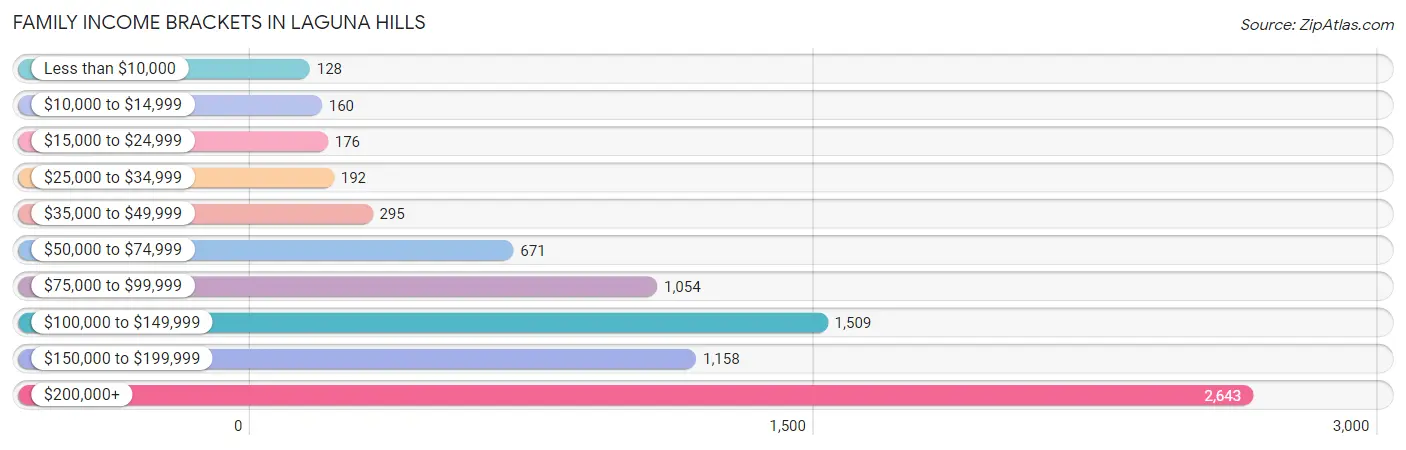
| Income Bracket | # Families | % Families |
| Less than $10,000 | 128 | 1.6% |
| $10,000 to $14,999 | 160 | 2.0% |
| $15,000 to $24,999 | 176 | 2.2% |
| $25,000 to $34,999 | 192 | 2.4% |
| $35,000 to $49,999 | 295 | 3.7% |
| $50,000 to $74,999 | 671 | 8.4% |
| $75,000 to $99,999 | 1,054 | 13.2% |
| $100,000 to $149,999 | 1,509 | 18.9% |
| $150,000 to $199,999 | 1,158 | 14.5% |
| $200,000+ | 2,643 | 33.1% |
Family Income by Famaliy Size in Laguna Hills
6-person families (273 | 3.4%) account for the highest median family income in Laguna Hills with $250,001 per family, while 2-person families (3,547 | 44.4%) have the highest median income of $60,706 per family member.
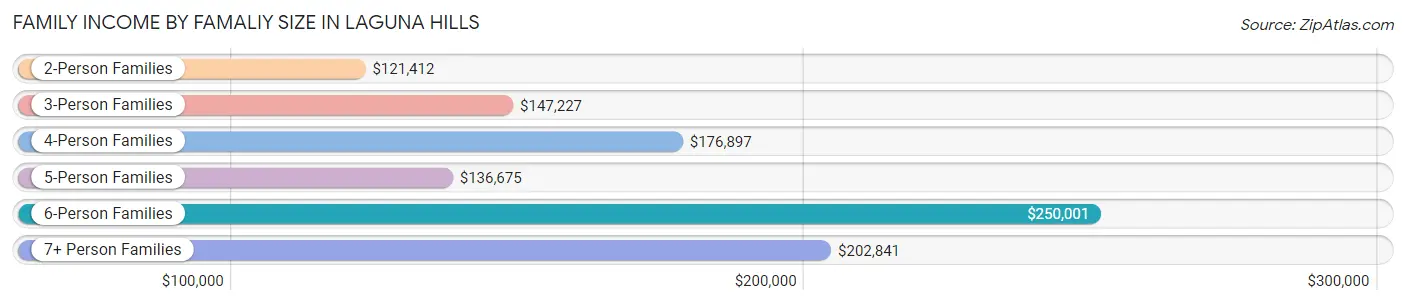
| Income Bracket | # Families | Median Income |
| 2-Person Families | 3,547 (44.4%) | $121,412 |
| 3-Person Families | 1,664 (20.8%) | $147,227 |
| 4-Person Families | 1,532 (19.2%) | $176,897 |
| 5-Person Families | 920 (11.5%) | $136,675 |
| 6-Person Families | 273 (3.4%) | $250,001 |
| 7+ Person Families | 49 (0.6%) | $202,841 |
| Total | 7,985 (100.0%) | $145,202 |
Family Income by Number of Earners in Laguna Hills
The median family income in Laguna Hills is $145,202, with families comprising 3+ earners (1,249) having the highest median family income of $205,806, while families with no earners (1,010) have the lowest median family income of $85,318, accounting for 15.6% and 12.7% of families, respectively.
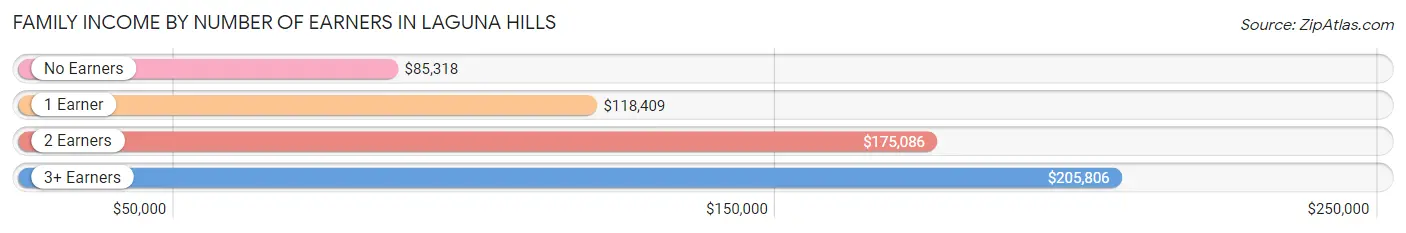
| Number of Earners | # Families | Median Income |
| No Earners | 1,010 (12.7%) | $85,318 |
| 1 Earner | 2,396 (30.0%) | $118,409 |
| 2 Earners | 3,330 (41.7%) | $175,086 |
| 3+ Earners | 1,249 (15.6%) | $205,806 |
| Total | 7,985 (100.0%) | $145,202 |
Household Income in Laguna Hills
Household Income Brackets in Laguna Hills
With 2,939 households falling in the category, the $200,000+ income range is the most frequent in Laguna Hills, accounting for 25.5% of all households. In contrast, only 300 households (2.6%) fall into the $10,000 to $14,999 income bracket, making it the least populous group.
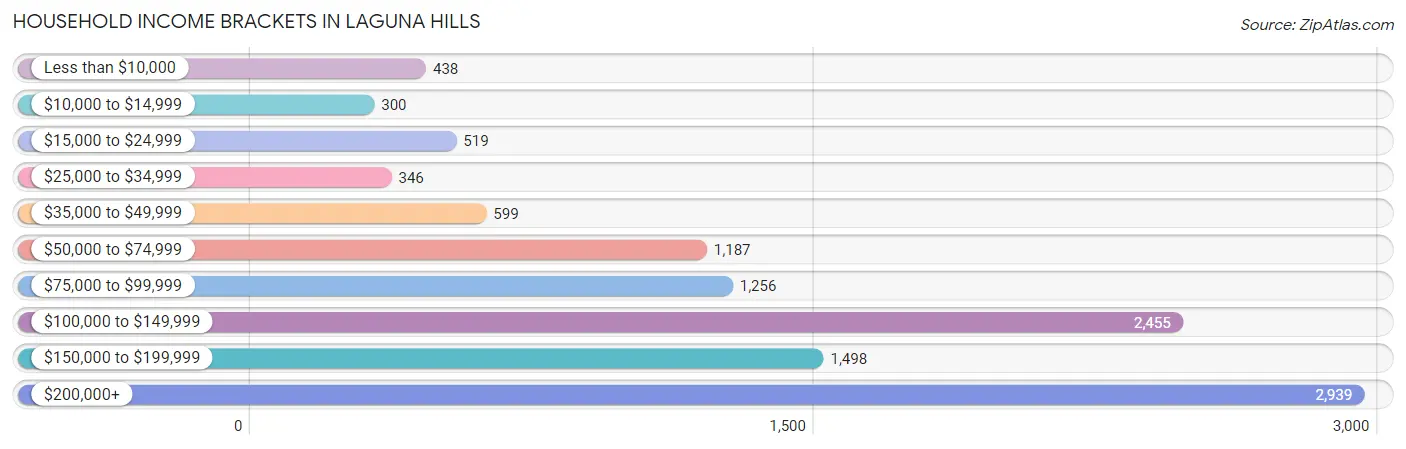
| Income Bracket | # Households | % Households |
| Less than $10,000 | 438 | 3.8% |
| $10,000 to $14,999 | 300 | 2.6% |
| $15,000 to $24,999 | 519 | 4.5% |
| $25,000 to $34,999 | 346 | 3.0% |
| $35,000 to $49,999 | 599 | 5.2% |
| $50,000 to $74,999 | 1,187 | 10.3% |
| $75,000 to $99,999 | 1,256 | 10.9% |
| $100,000 to $149,999 | 2,455 | 21.3% |
| $150,000 to $199,999 | 1,498 | 13.0% |
| $200,000+ | 2,939 | 25.5% |
Household Income by Householder Age in Laguna Hills
The median household income in Laguna Hills is $122,902, with the highest median household income of $142,132 found in the 25 to 44 years age bracket for the primary householder. A total of 2,990 households (25.9%) fall into this category. Meanwhile, the 15 to 24 years age bracket for the primary householder has the lowest median household income of $71,157, with 226 households (2.0%) in this group.
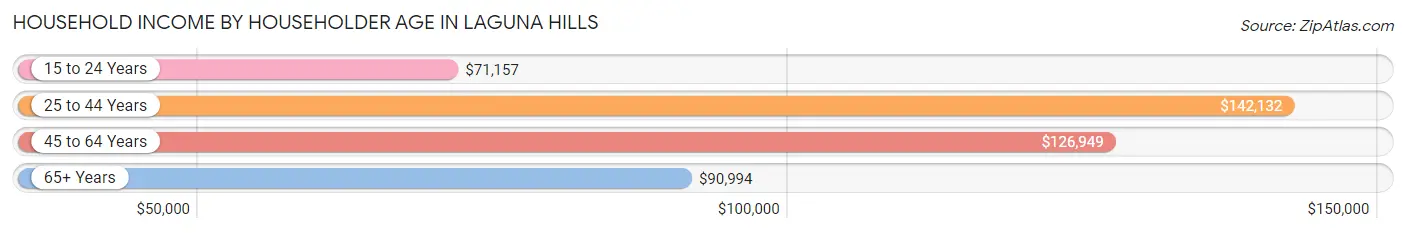
| Income Bracket | # Households | Median Income |
| 15 to 24 Years | 226 (2.0%) | $71,157 |
| 25 to 44 Years | 2,990 (25.9%) | $142,132 |
| 45 to 64 Years | 5,088 (44.2%) | $126,949 |
| 65+ Years | 3,221 (28.0%) | $90,994 |
| Total | 11,525 (100.0%) | $122,902 |
Poverty in Laguna Hills
Income Below Poverty by Sex and Age in Laguna Hills
With 6.5% poverty level for males and 10.0% for females among the residents of Laguna Hills, 16 and 17 year old males and 18 to 24 year old females are the most vulnerable to poverty, with 39 males (14.3%) and 185 females (18.8%) in their respective age groups living below the poverty level.
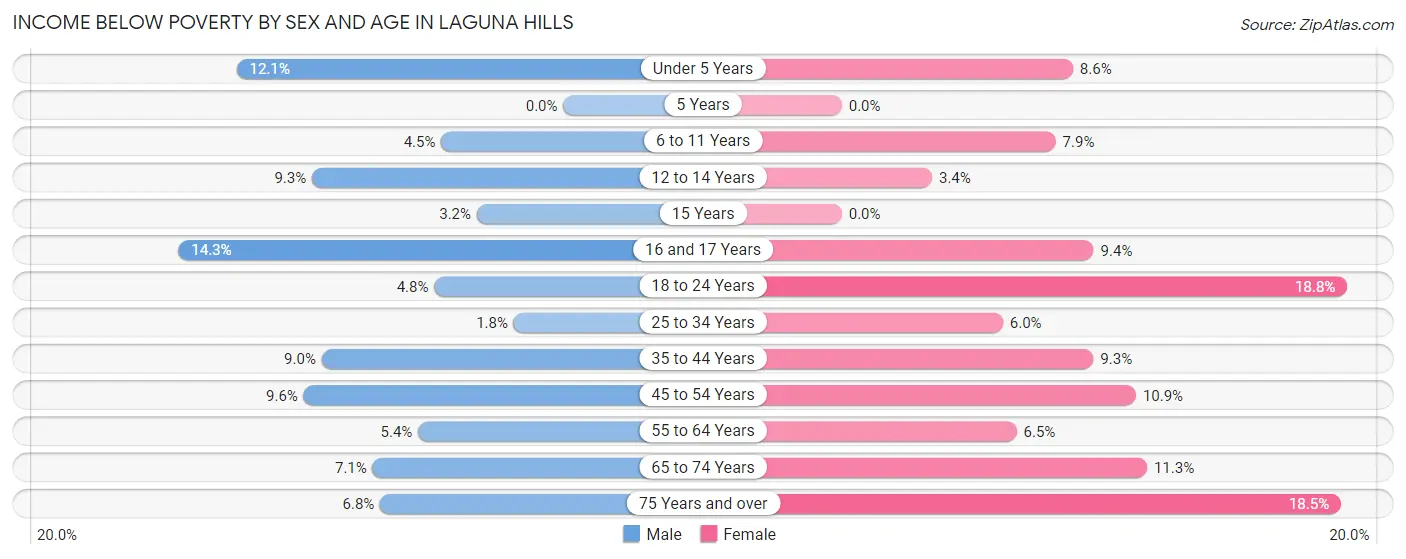
| Age Bracket | Male | Female |
| Under 5 Years | 57 (12.1%) | 55 (8.6%) |
| 5 Years | 0 (0.0%) | 0 (0.0%) |
| 6 to 11 Years | 65 (4.5%) | 82 (7.9%) |
| 12 to 14 Years | 50 (9.3%) | 17 (3.4%) |
| 15 Years | 7 (3.2%) | 0 (0.0%) |
| 16 and 17 Years | 39 (14.3%) | 30 (9.3%) |
| 18 to 24 Years | 60 (4.8%) | 185 (18.8%) |
| 25 to 34 Years | 39 (1.8%) | 121 (6.0%) |
| 35 to 44 Years | 153 (9.0%) | 193 (9.3%) |
| 45 to 54 Years | 221 (9.6%) | 285 (10.9%) |
| 55 to 64 Years | 106 (5.4%) | 138 (6.5%) |
| 65 to 74 Years | 119 (7.1%) | 220 (11.3%) |
| 75 Years and over | 67 (6.8%) | 250 (18.5%) |
| Total | 983 (6.5%) | 1,576 (10.0%) |
Income Above Poverty by Sex and Age in Laguna Hills
According to the poverty statistics in Laguna Hills, males aged 5 years and females aged 5 years are the age groups that are most secure financially, with 100.0% of males and 100.0% of females in these age groups living above the poverty line.
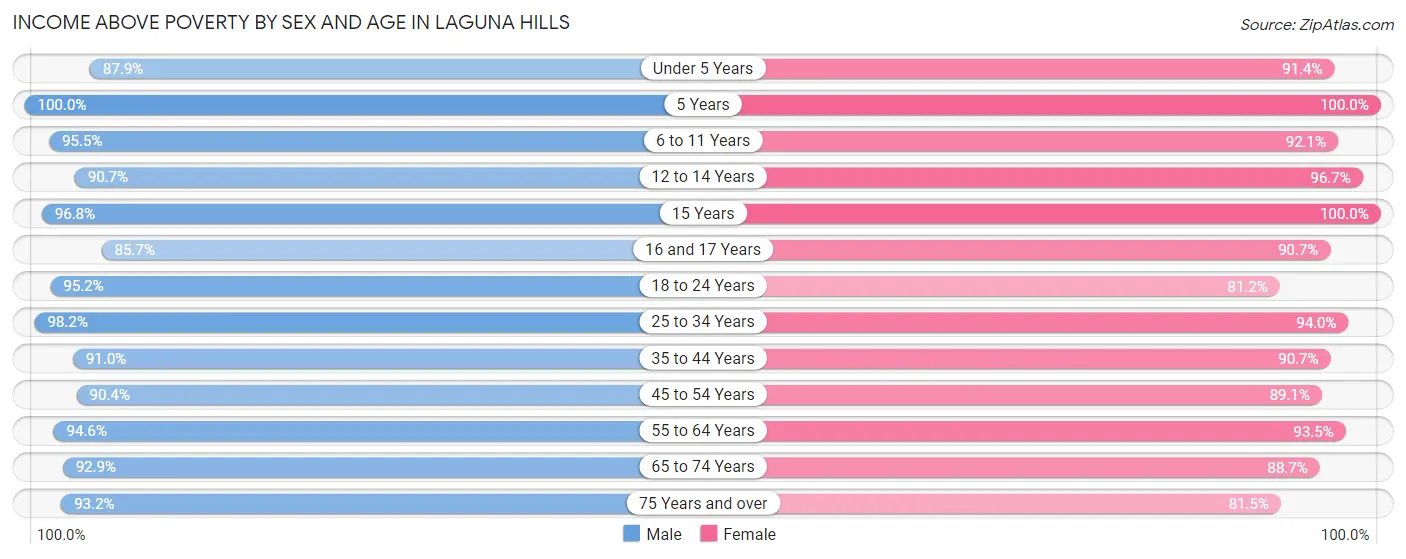
| Age Bracket | Male | Female |
| Under 5 Years | 413 (87.9%) | 586 (91.4%) |
| 5 Years | 142 (100.0%) | 69 (100.0%) |
| 6 to 11 Years | 1,370 (95.5%) | 951 (92.1%) |
| 12 to 14 Years | 486 (90.7%) | 491 (96.7%) |
| 15 Years | 211 (96.8%) | 152 (100.0%) |
| 16 and 17 Years | 234 (85.7%) | 291 (90.6%) |
| 18 to 24 Years | 1,192 (95.2%) | 801 (81.2%) |
| 25 to 34 Years | 2,081 (98.2%) | 1,904 (94.0%) |
| 35 to 44 Years | 1,553 (91.0%) | 1,873 (90.7%) |
| 45 to 54 Years | 2,071 (90.4%) | 2,324 (89.1%) |
| 55 to 64 Years | 1,862 (94.6%) | 1,987 (93.5%) |
| 65 to 74 Years | 1,561 (92.9%) | 1,721 (88.7%) |
| 75 Years and over | 919 (93.2%) | 1,099 (81.5%) |
| Total | 14,095 (93.5%) | 14,249 (90.0%) |
Income Below Poverty Among Married-Couple Families in Laguna Hills
The poverty statistics for married-couple families in Laguna Hills show that 3.8% or 248 of the total 6,462 families live below the poverty line. Families with 3 or 4 children have the highest poverty rate of 11.7%, comprising of 44 families. On the other hand, families with 5 or more children have the lowest poverty rate of 0.0%, which includes 0 families.
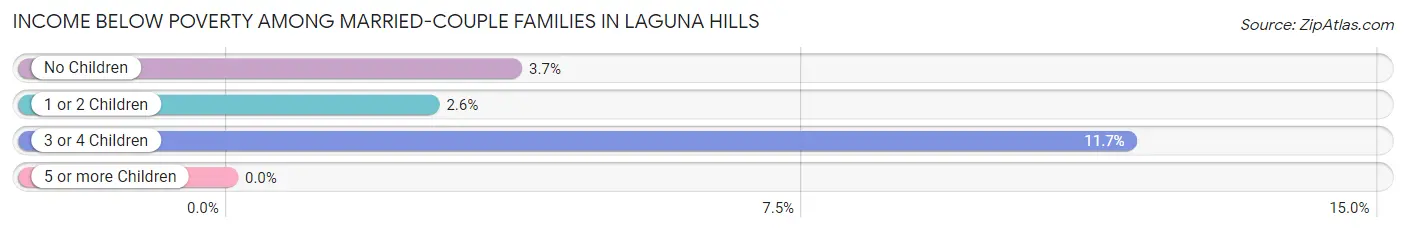
| Children | Above Poverty | Below Poverty |
| No Children | 3,949 (96.3%) | 152 (3.7%) |
| 1 or 2 Children | 1,923 (97.4%) | 52 (2.6%) |
| 3 or 4 Children | 331 (88.3%) | 44 (11.7%) |
| 5 or more Children | 11 (100.0%) | 0 (0.0%) |
| Total | 6,214 (96.2%) | 248 (3.8%) |
Income Below Poverty Among Single-Parent Households in Laguna Hills
According to the poverty data in Laguna Hills, 20.1% or 93 single-father households and 13.9% or 147 single-mother households are living below the poverty line. Among single-father households, those with 1 or 2 children have the highest poverty rate, with 68 households (36.0%) experiencing poverty. Likewise, among single-mother households, those with no children have the highest poverty rate, with 116 households (19.8%) falling below the poverty line.
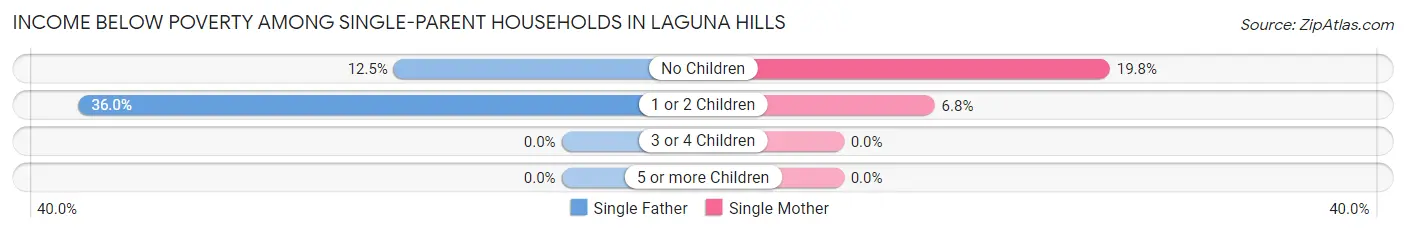
| Children | Single Father | Single Mother |
| No Children | 25 (12.5%) | 116 (19.8%) |
| 1 or 2 Children | 68 (36.0%) | 31 (6.8%) |
| 3 or 4 Children | 0 (0.0%) | 0 (0.0%) |
| 5 or more Children | 0 (0.0%) | 0 (0.0%) |
| Total | 93 (20.1%) | 147 (13.9%) |
Income Below Poverty Among Married-Couple vs Single-Parent Households in Laguna Hills
The poverty data for Laguna Hills shows that 248 of the married-couple family households (3.8%) and 240 of the single-parent households (15.8%) are living below the poverty level. Within the married-couple family households, those with 3 or 4 children have the highest poverty rate, with 44 households (11.7%) falling below the poverty line. Among the single-parent households, those with no children have the highest poverty rate, with 141 household (18.0%) living below poverty.
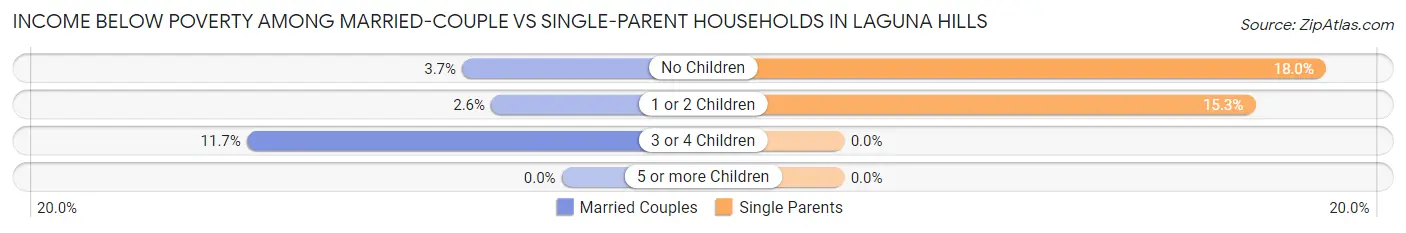
| Children | Married-Couple Families | Single-Parent Households |
| No Children | 152 (3.7%) | 141 (18.0%) |
| 1 or 2 Children | 52 (2.6%) | 99 (15.3%) |
| 3 or 4 Children | 44 (11.7%) | 0 (0.0%) |
| 5 or more Children | 0 (0.0%) | 0 (0.0%) |
| Total | 248 (3.8%) | 240 (15.8%) |
Race in Laguna Hills
The most populous races in Laguna Hills are White / Caucasian (18,928 | 60.7%), Hispanic or Latino (6,206 | 19.9%), and Asian (5,217 | 16.7%).
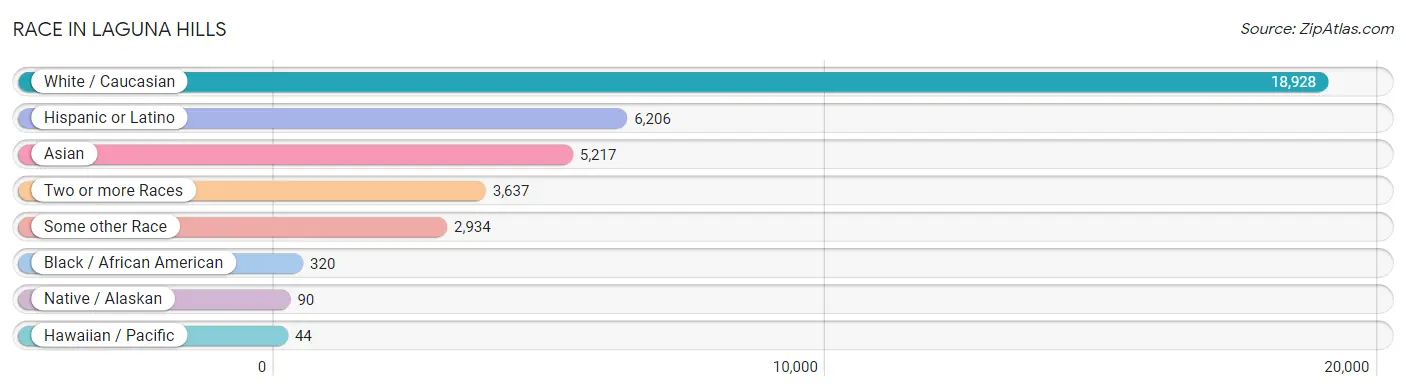
| Race | # Population | % Population |
| Asian | 5,217 | 16.7% |
| Black / African American | 320 | 1.0% |
| Hawaiian / Pacific | 44 | 0.1% |
| Hispanic or Latino | 6,206 | 19.9% |
| Native / Alaskan | 90 | 0.3% |
| White / Caucasian | 18,928 | 60.7% |
| Two or more Races | 3,637 | 11.7% |
| Some other Race | 2,934 | 9.4% |
| Total | 31,170 | 100.0% |
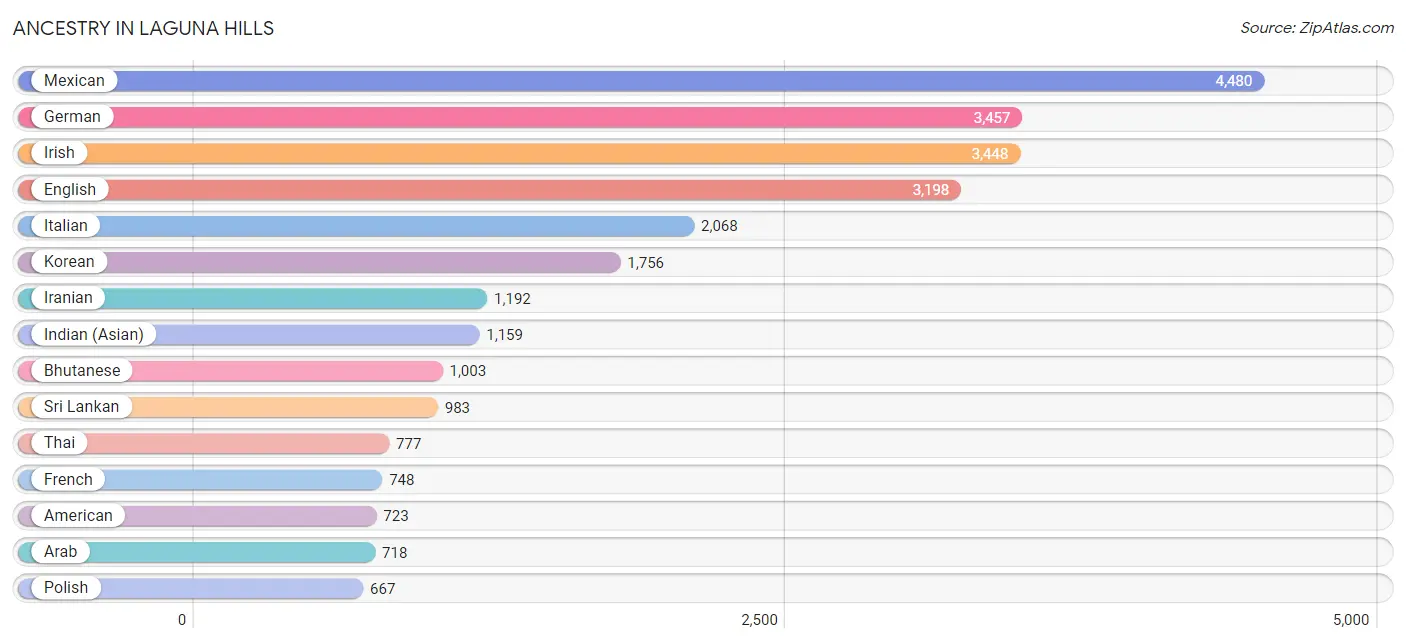
Ancestry in Laguna Hills
The most populous ancestries reported in Laguna Hills are Mexican (4,480 | 14.4%), German (3,457 | 11.1%), Irish (3,448 | 11.1%), English (3,198 | 10.3%), and Italian (2,068 | 6.6%), together accounting for 53.4% of all Laguna Hills residents.
| Ancestry | # Population | % Population |
| Afghan | 117 | 0.4% |
| African | 1 | 0.0% |
| American | 723 | 2.3% |
| Apache | 67 | 0.2% |
| Arab | 718 | 2.3% |
| Argentinean | 70 | 0.2% |
| Armenian | 95 | 0.3% |
| Assyrian / Chaldean / Syriac | 13 | 0.0% |
| Australian | 40 | 0.1% |
| Austrian | 224 | 0.7% |
| Barbadian | 15 | 0.1% |
| Belgian | 10 | 0.0% |
| Bhutanese | 1,003 | 3.2% |
| Blackfeet | 4 | 0.0% |
| Bolivian | 11 | 0.0% |
| Brazilian | 125 | 0.4% |
| British | 326 | 1.1% |
| Bulgarian | 144 | 0.5% |
| Burmese | 550 | 1.8% |
| Canadian | 86 | 0.3% |
| Central American | 228 | 0.7% |
| Central American Indian | 39 | 0.1% |
| Cherokee | 39 | 0.1% |
| Choctaw | 66 | 0.2% |
| Colombian | 295 | 0.9% |
| Costa Rican | 21 | 0.1% |
| Creek | 6 | 0.0% |
| Croatian | 102 | 0.3% |
| Cuban | 98 | 0.3% |
| Czech | 99 | 0.3% |
| Czechoslovakian | 85 | 0.3% |
| Danish | 128 | 0.4% |
| Dutch | 294 | 0.9% |
| Eastern European | 283 | 0.9% |
| Egyptian | 8 | 0.0% |
| English | 3,198 | 10.3% |
| Estonian | 12 | 0.0% |
| European | 553 | 1.8% |
| Filipino | 24 | 0.1% |
| Finnish | 17 | 0.1% |
| French | 748 | 2.4% |
| French American Indian | 17 | 0.1% |
| French Canadian | 125 | 0.4% |
| German | 3,457 | 11.1% |
| Greek | 150 | 0.5% |
| Guamanian / Chamorro | 14 | 0.0% |
| Guatemalan | 138 | 0.4% |
| Hungarian | 175 | 0.6% |
| Indian (Asian) | 1,159 | 3.7% |
| Iranian | 1,192 | 3.8% |
| Iraqi | 10 | 0.0% |
| Irish | 3,448 | 11.1% |
| Israeli | 20 | 0.1% |
| Italian | 2,068 | 6.6% |
| Japanese | 38 | 0.1% |
| Korean | 1,756 | 5.6% |
| Laotian | 125 | 0.4% |
| Latvian | 11 | 0.0% |
| Lebanese | 197 | 0.6% |
| Lithuanian | 15 | 0.1% |
| Malaysian | 9 | 0.0% |
| Mexican | 4,480 | 14.4% |
| Mexican American Indian | 90 | 0.3% |
| Mongolian | 4 | 0.0% |
| Moroccan | 72 | 0.2% |
| Native Hawaiian | 96 | 0.3% |
| Navajo | 23 | 0.1% |
| Nicaraguan | 43 | 0.1% |
| Nigerian | 48 | 0.2% |
| Northern European | 55 | 0.2% |
| Norwegian | 467 | 1.5% |
| Pakistani | 84 | 0.3% |
| Palestinian | 187 | 0.6% |
| Peruvian | 182 | 0.6% |
| Polish | 667 | 2.1% |
| Portuguese | 60 | 0.2% |
| Potawatomi | 3 | 0.0% |
| Puerto Rican | 300 | 1.0% |
| Romanian | 69 | 0.2% |
| Russian | 325 | 1.0% |
| Salvadoran | 26 | 0.1% |
| Scandinavian | 381 | 1.2% |
| Scotch-Irish | 126 | 0.4% |
| Scottish | 388 | 1.2% |
| Serbian | 19 | 0.1% |
| Shoshone | 5 | 0.0% |
| Slovak | 10 | 0.0% |
| South American | 630 | 2.0% |
| Spaniard | 229 | 0.7% |
| Spanish | 152 | 0.5% |
| Sri Lankan | 983 | 3.2% |
| Subsaharan African | 70 | 0.2% |
| Swedish | 336 | 1.1% |
| Swiss | 67 | 0.2% |
| Syrian | 35 | 0.1% |
| Thai | 777 | 2.5% |
| Turkish | 103 | 0.3% |
| Ukrainian | 36 | 0.1% |
| Uruguayan | 5 | 0.0% |
| Venezuelan | 67 | 0.2% |
| Welsh | 124 | 0.4% |
| Yaqui | 39 | 0.1% |
| Yugoslavian | 25 | 0.1% |
| Zimbabwean | 21 | 0.1% | View All 104 Rows |
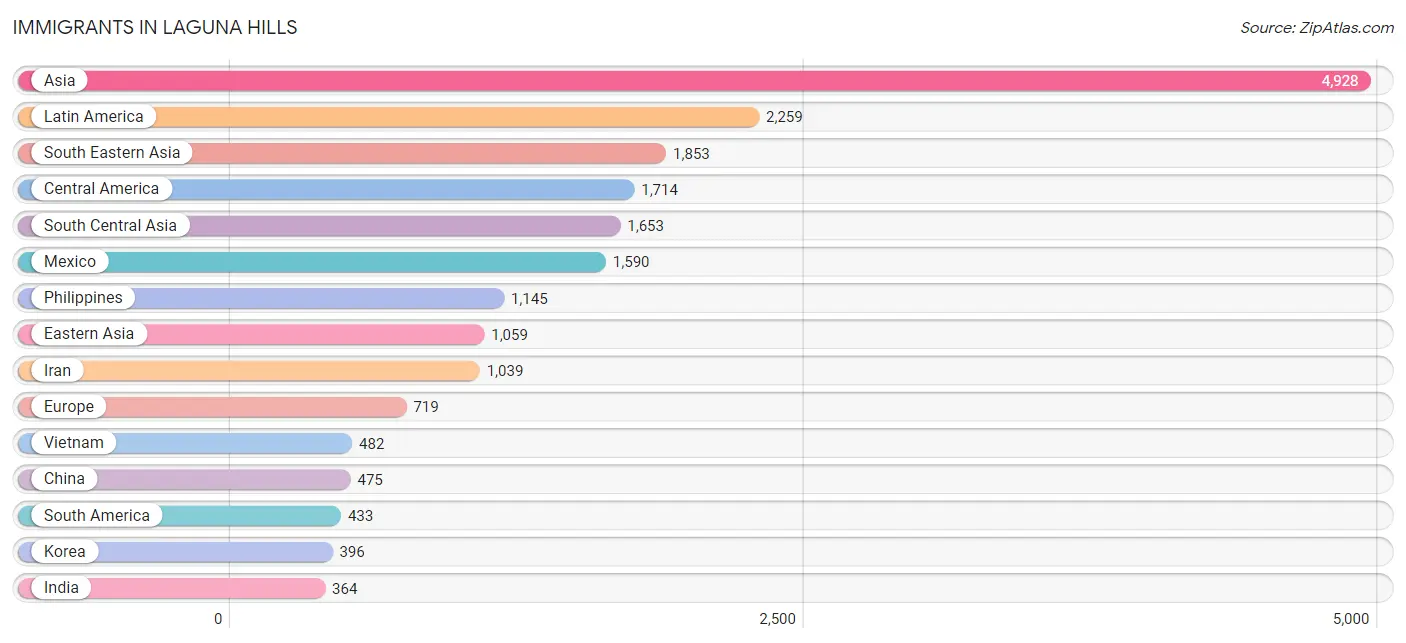
Immigrants in Laguna Hills
The most numerous immigrant groups reported in Laguna Hills came from Asia (4,928 | 15.8%), Latin America (2,259 | 7.2%), South Eastern Asia (1,853 | 5.9%), Central America (1,714 | 5.5%), and South Central Asia (1,653 | 5.3%), together accounting for 39.8% of all Laguna Hills residents.
| Immigration Origin | # Population | % Population |
| Afghanistan | 181 | 0.6% |
| Africa | 91 | 0.3% |
| Argentina | 34 | 0.1% |
| Asia | 4,928 | 15.8% |
| Australia | 24 | 0.1% |
| Austria | 8 | 0.0% |
| Bolivia | 11 | 0.0% |
| Brazil | 31 | 0.1% |
| Bulgaria | 144 | 0.5% |
| Cambodia | 17 | 0.1% |
| Canada | 88 | 0.3% |
| Caribbean | 112 | 0.4% |
| Central America | 1,714 | 5.5% |
| China | 475 | 1.5% |
| Colombia | 221 | 0.7% |
| Cuba | 20 | 0.1% |
| Czechoslovakia | 22 | 0.1% |
| Denmark | 65 | 0.2% |
| Eastern Africa | 21 | 0.1% |
| Eastern Asia | 1,059 | 3.4% |
| Eastern Europe | 267 | 0.9% |
| Egypt | 8 | 0.0% |
| El Salvador | 12 | 0.0% |
| England | 106 | 0.3% |
| Europe | 719 | 2.3% |
| France | 8 | 0.0% |
| Germany | 67 | 0.2% |
| Greece | 22 | 0.1% |
| Guatemala | 93 | 0.3% |
| Hong Kong | 25 | 0.1% |
| India | 364 | 1.2% |
| Indonesia | 115 | 0.4% |
| Iran | 1,039 | 3.3% |
| Iraq | 26 | 0.1% |
| Ireland | 8 | 0.0% |
| Israel | 15 | 0.1% |
| Italy | 30 | 0.1% |
| Jamaica | 92 | 0.3% |
| Japan | 188 | 0.6% |
| Jordan | 208 | 0.7% |
| Korea | 396 | 1.3% |
| Laos | 3 | 0.0% |
| Latin America | 2,259 | 7.2% |
| Latvia | 11 | 0.0% |
| Lebanon | 94 | 0.3% |
| Malaysia | 15 | 0.1% |
| Mexico | 1,590 | 5.1% |
| Morocco | 62 | 0.2% |
| Netherlands | 13 | 0.0% |
| Nicaragua | 11 | 0.0% |
| Northern Africa | 70 | 0.2% |
| Northern Europe | 270 | 0.9% |
| Norway | 20 | 0.1% |
| Oceania | 24 | 0.1% |
| Pakistan | 41 | 0.1% |
| Panama | 8 | 0.0% |
| Peru | 69 | 0.2% |
| Philippines | 1,145 | 3.7% |
| Poland | 9 | 0.0% |
| Romania | 37 | 0.1% |
| Scotland | 10 | 0.0% |
| South America | 433 | 1.4% |
| South Central Asia | 1,653 | 5.3% |
| South Eastern Asia | 1,853 | 5.9% |
| Southern Europe | 52 | 0.2% |
| Sri Lanka | 28 | 0.1% |
| Sweden | 8 | 0.0% |
| Switzerland | 34 | 0.1% |
| Taiwan | 203 | 0.6% |
| Thailand | 73 | 0.2% |
| Turkey | 7 | 0.0% |
| Ukraine | 17 | 0.1% |
| Venezuela | 67 | 0.2% |
| Vietnam | 482 | 1.5% |
| Western Asia | 350 | 1.1% |
| Western Europe | 130 | 0.4% |
| Zimbabwe | 21 | 0.1% | View All 77 Rows |
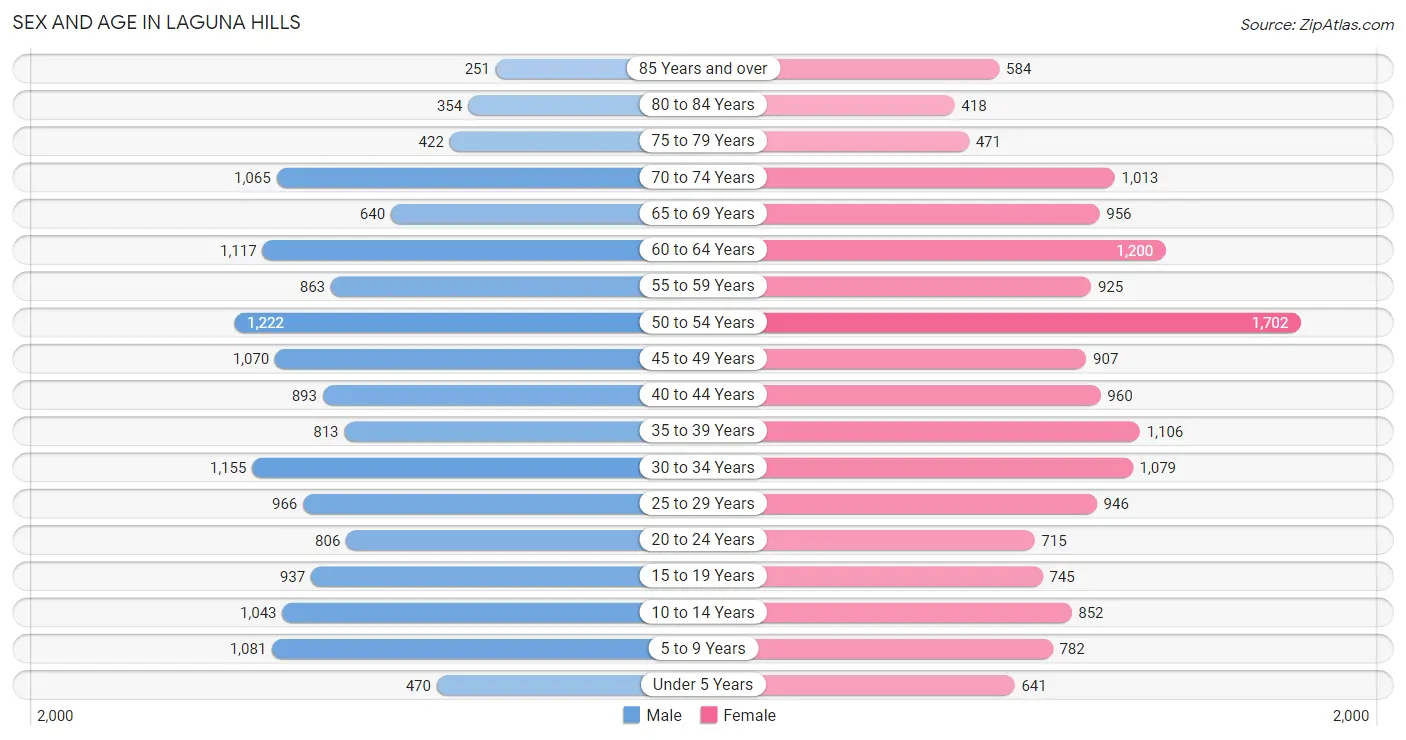
Sex and Age in Laguna Hills
Sex and Age in Laguna Hills
The most populous age groups in Laguna Hills are 50 to 54 Years (1,222 | 8.1%) for men and 50 to 54 Years (1,702 | 10.6%) for women.
| Age Bracket | Male | Female |
| Under 5 Years | 470 (3.1%) | 641 (4.0%) |
| 5 to 9 Years | 1,081 (7.1%) | 782 (4.9%) |
| 10 to 14 Years | 1,043 (6.9%) | 852 (5.3%) |
| 15 to 19 Years | 937 (6.2%) | 745 (4.7%) |
| 20 to 24 Years | 806 (5.3%) | 715 (4.5%) |
| 25 to 29 Years | 966 (6.4%) | 946 (5.9%) |
| 30 to 34 Years | 1,155 (7.6%) | 1,079 (6.7%) |
| 35 to 39 Years | 813 (5.4%) | 1,106 (6.9%) |
| 40 to 44 Years | 893 (5.9%) | 960 (6.0%) |
| 45 to 49 Years | 1,070 (7.0%) | 907 (5.7%) |
| 50 to 54 Years | 1,222 (8.1%) | 1,702 (10.6%) |
| 55 to 59 Years | 863 (5.7%) | 925 (5.8%) |
| 60 to 64 Years | 1,117 (7.4%) | 1,200 (7.5%) |
| 65 to 69 Years | 640 (4.2%) | 956 (6.0%) |
| 70 to 74 Years | 1,065 (7.0%) | 1,013 (6.3%) |
| 75 to 79 Years | 422 (2.8%) | 471 (2.9%) |
| 80 to 84 Years | 354 (2.3%) | 418 (2.6%) |
| 85 Years and over | 251 (1.7%) | 584 (3.6%) |
| Total | 15,168 (100.0%) | 16,002 (100.0%) |
Families and Households in Laguna Hills
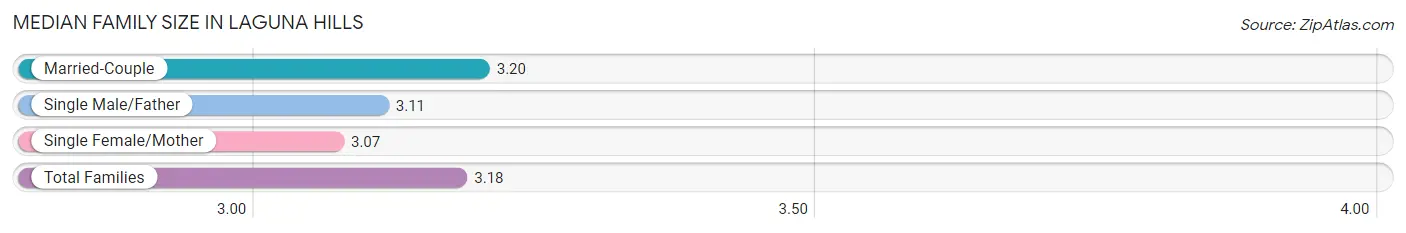
Median Family Size in Laguna Hills
The median family size in Laguna Hills is 3.18 persons per family, with married-couple families (6,462 | 80.9%) accounting for the largest median family size of 3.2 persons per family. On the other hand, single female/mother families (1,060 | 13.3%) represent the smallest median family size with 3.07 persons per family.
| Family Type | # Families | Family Size |
| Married-Couple | 6,462 (80.9%) | 3.20 |
| Single Male/Father | 463 (5.8%) | 3.11 |
| Single Female/Mother | 1,060 (13.3%) | 3.07 |
| Total Families | 7,985 (100.0%) | 3.18 |
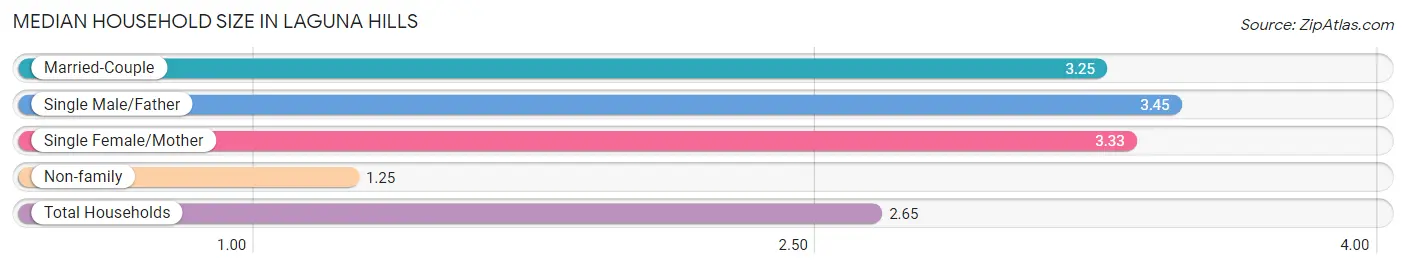
Median Household Size in Laguna Hills
The median household size in Laguna Hills is 2.65 persons per household, with single male/father households (463 | 4.0%) accounting for the largest median household size of 3.45 persons per household. non-family households (3,540 | 30.7%) represent the smallest median household size with 1.25 persons per household.
| Household Type | # Households | Household Size |
| Married-Couple | 6,462 (56.1%) | 3.25 |
| Single Male/Father | 463 (4.0%) | 3.45 |
| Single Female/Mother | 1,060 (9.2%) | 3.33 |
| Non-family | 3,540 (30.7%) | 1.25 |
| Total Households | 11,525 (100.0%) | 2.65 |
Household Size by Marriage Status in Laguna Hills
Out of a total of 11,525 households in Laguna Hills, 7,985 (69.3%) are family households, while 3,540 (30.7%) are nonfamily households. The most numerous type of family households are 2-person households, comprising 3,336, and the most common type of nonfamily households are 1-person households, comprising 2,741.
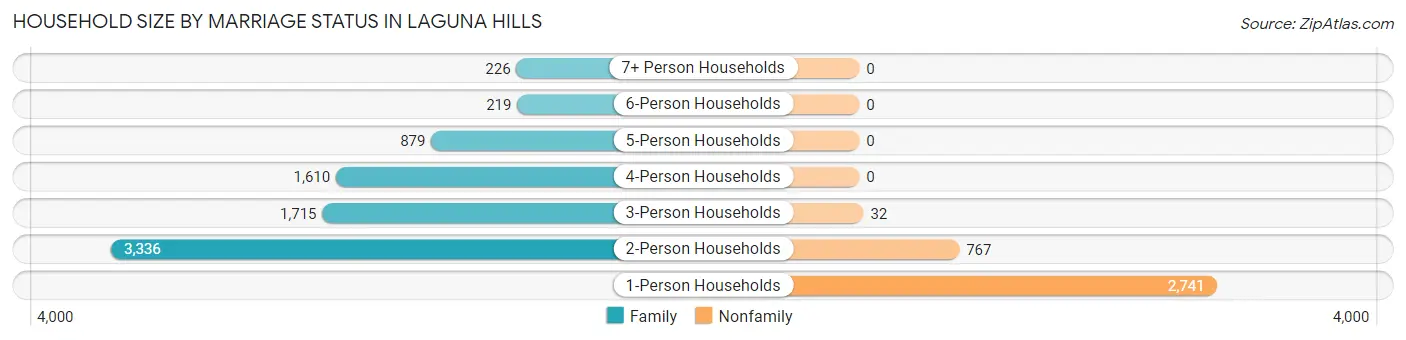
| Household Size | Family Households | Nonfamily Households |
| 1-Person Households | - | 2,741 (23.8%) |
| 2-Person Households | 3,336 (28.9%) | 767 (6.7%) |
| 3-Person Households | 1,715 (14.9%) | 32 (0.3%) |
| 4-Person Households | 1,610 (14.0%) | 0 (0.0%) |
| 5-Person Households | 879 (7.6%) | 0 (0.0%) |
| 6-Person Households | 219 (1.9%) | 0 (0.0%) |
| 7+ Person Households | 226 (2.0%) | 0 (0.0%) |
| Total | 7,985 (69.3%) | 3,540 (30.7%) |
Female Fertility in Laguna Hills
Fertility by Age in Laguna Hills
Average fertility rate in Laguna Hills is 26.0 births per 1,000 women. Women in the age bracket of 35 to 50 years have the highest fertility rate with 40.0 births per 1,000 women. Women in the age bracket of 35 to 50 years acount for 72.5% of all women with births.
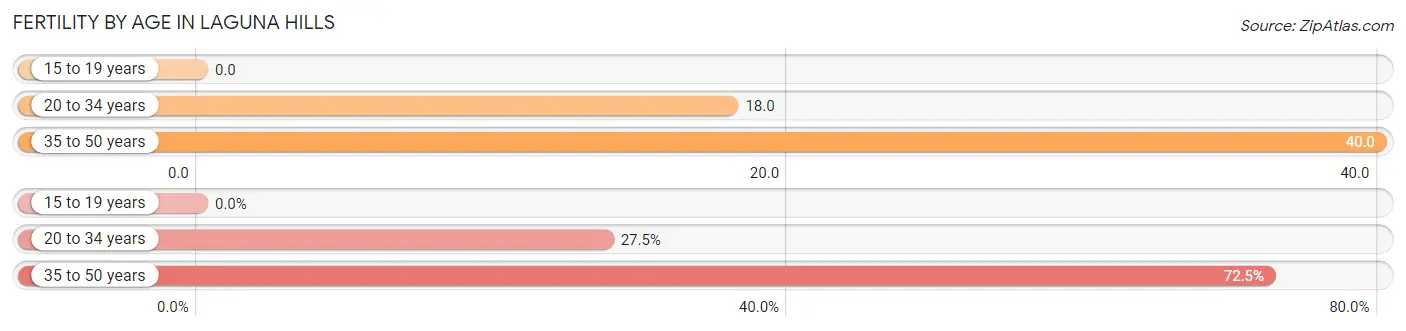
| Age Bracket | Women with Births | Births / 1,000 Women |
| 15 to 19 years | 0 (0.0%) | 0.0 |
| 20 to 34 years | 49 (27.5%) | 18.0 |
| 35 to 50 years | 129 (72.5%) | 40.0 |
| Total | 178 (100.0%) | 26.0 |
Fertility by Age by Marriage Status in Laguna Hills
96.1% of women with births (178) in Laguna Hills are married. The highest percentage of unmarried women with births falls into 35 to 50 years age bracket with 5.4% of them unmarried at the time of birth, while the lowest percentage of unmarried women with births belong to 20 to 34 years age bracket with 0.0% of them unmarried.
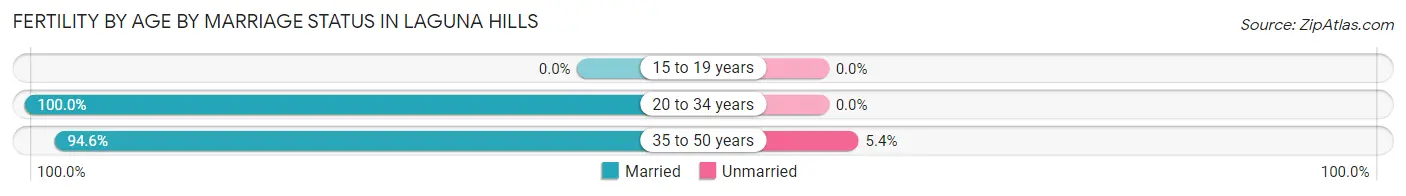
| Age Bracket | Married | Unmarried |
| 15 to 19 years | 0 (0.0%) | 0 (0.0%) |
| 20 to 34 years | 49 (100.0%) | 0 (0.0%) |
| 35 to 50 years | 122 (94.6%) | 7 (5.4%) |
| Total | 171 (96.1%) | 7 (3.9%) |
Fertility by Education in Laguna Hills
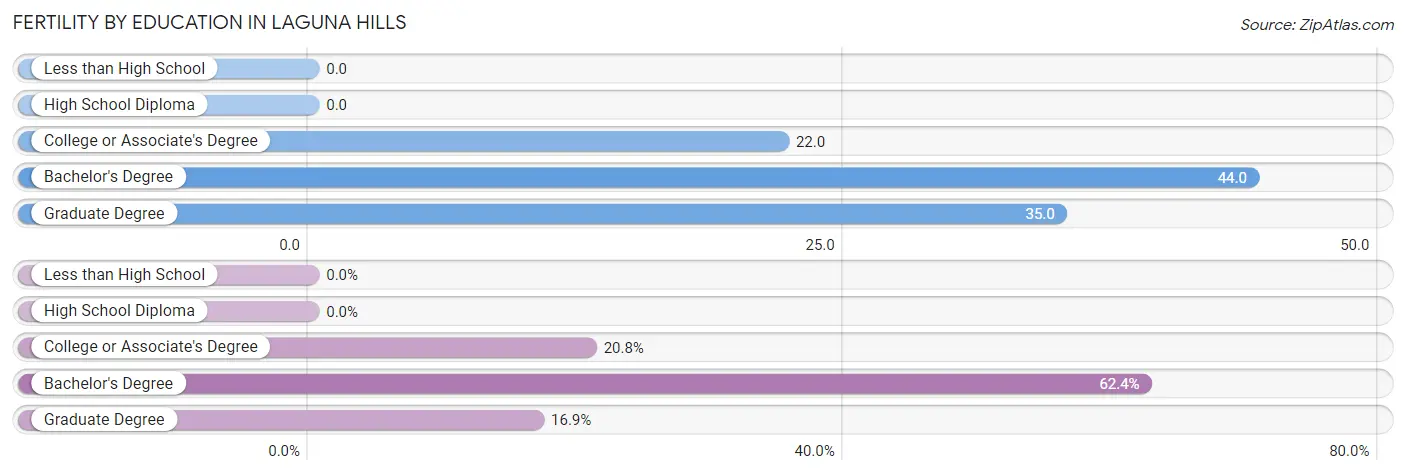
| Educational Attainment | Women with Births | Births / 1,000 Women |
| Less than High School | 0 (0.0%) | 0.0 |
| High School Diploma | 0 (0.0%) | 0.0 |
| College or Associate's Degree | 37 (20.8%) | 22.0 |
| Bachelor's Degree | 111 (62.4%) | 44.0 |
| Graduate Degree | 30 (16.9%) | 35.0 |
| Total | 178 (100.0%) | 26.0 |
Fertility by Education by Marriage Status in Laguna Hills
3.9% of women with births in Laguna Hills are unmarried. Women with the educational attainment of college or associate's degree are most likely to be married with 100.0% of them married at childbirth, while women with the educational attainment of bachelor's degree are least likely to be married with 6.3% of them unmarried at childbirth.
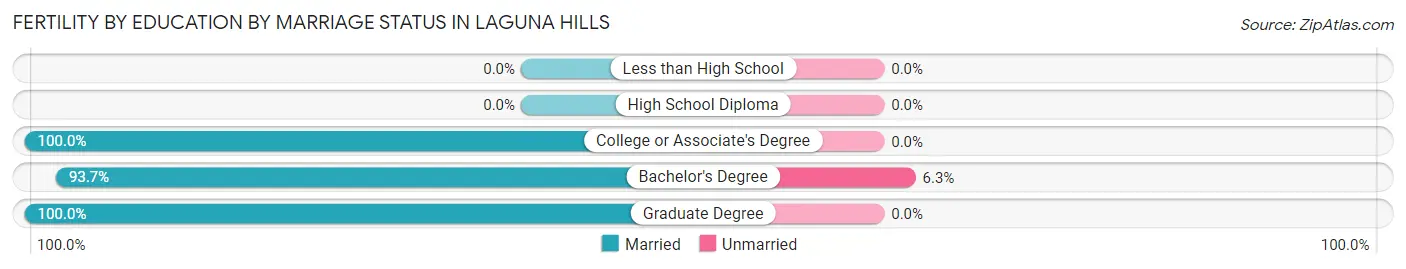
| Educational Attainment | Married | Unmarried |
| Less than High School | 0 (0.0%) | 0 (0.0%) |
| High School Diploma | 0 (0.0%) | 0 (0.0%) |
| College or Associate's Degree | 37 (100.0%) | 0 (0.0%) |
| Bachelor's Degree | 104 (93.7%) | 7 (6.3%) |
| Graduate Degree | 30 (100.0%) | 0 (0.0%) |
| Total | 171 (96.1%) | 7 (3.9%) |
Employment Characteristics in Laguna Hills
Employment by Class of Employer in Laguna Hills
Among the 15,926 employed individuals in Laguna Hills, private company employees (10,507 | 66.0%), self-employed (not incorporated) (1,721 | 10.8%), and local government employees (1,088 | 6.8%) make up the most common classes of employment.
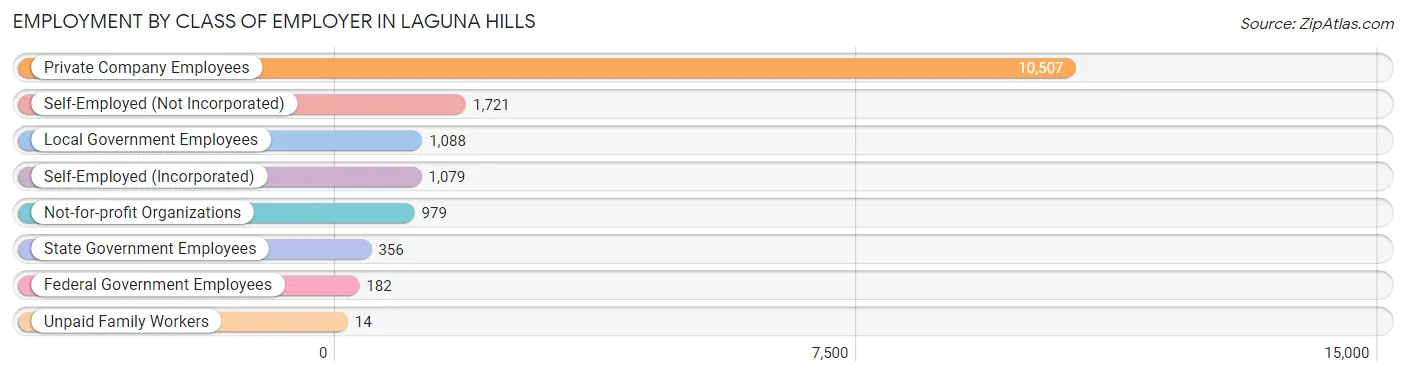
| Employer Class | # Employees | % Employees |
| Private Company Employees | 10,507 | 66.0% |
| Self-Employed (Incorporated) | 1,079 | 6.8% |
| Self-Employed (Not Incorporated) | 1,721 | 10.8% |
| Not-for-profit Organizations | 979 | 6.1% |
| Local Government Employees | 1,088 | 6.8% |
| State Government Employees | 356 | 2.2% |
| Federal Government Employees | 182 | 1.1% |
| Unpaid Family Workers | 14 | 0.1% |
| Total | 15,926 | 100.0% |
Employment Status by Age in Laguna Hills
According to the labor force statistics for Laguna Hills, out of the total population over 16 years of age (25,931), 65.8% or 17,063 individuals are in the labor force, with 5.0% or 853 of them unemployed. The age group with the highest labor force participation rate is 30 to 34 years, with 96.5% or 2,156 individuals in the labor force. Within the labor force, the 25 to 29 years age range has the highest percentage of unemployed individuals, with 7.9% or 124 of them being unemployed.
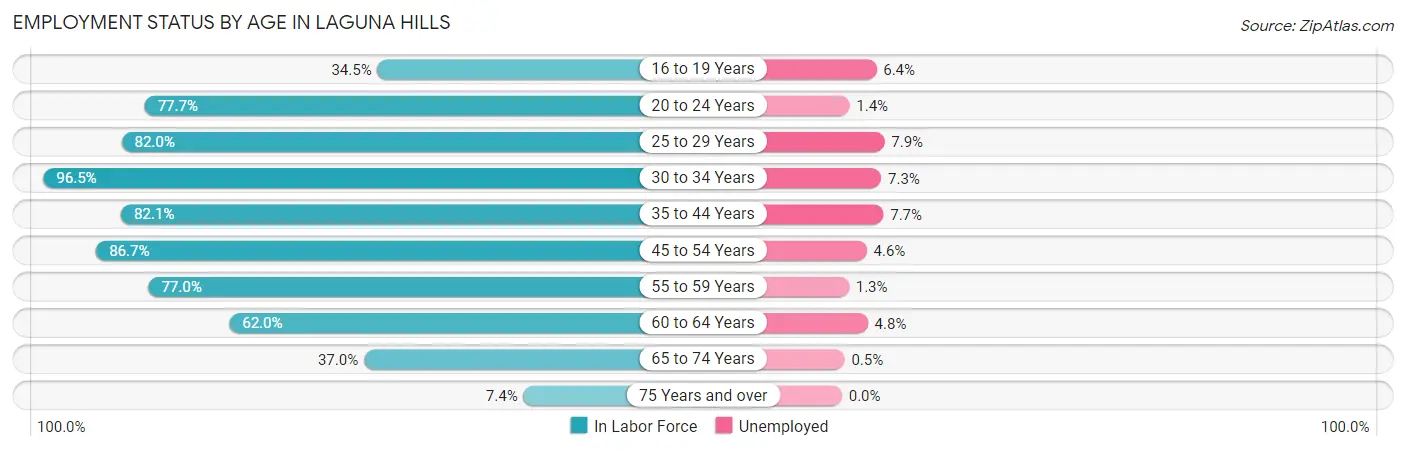
| Age Bracket | In Labor Force | Unemployed |
| 16 to 19 Years | 453 (34.5%) | 29 (6.4%) |
| 20 to 24 Years | 1,182 (77.7%) | 17 (1.4%) |
| 25 to 29 Years | 1,568 (82.0%) | 124 (7.9%) |
| 30 to 34 Years | 2,156 (96.5%) | 157 (7.3%) |
| 35 to 44 Years | 3,097 (82.1%) | 238 (7.7%) |
| 45 to 54 Years | 4,249 (86.7%) | 195 (4.6%) |
| 55 to 59 Years | 1,377 (77.0%) | 18 (1.3%) |
| 60 to 64 Years | 1,437 (62.0%) | 69 (4.8%) |
| 65 to 74 Years | 1,359 (37.0%) | 7 (0.5%) |
| 75 Years and over | 185 (7.4%) | 0 (0.0%) |
| Total | 17,063 (65.8%) | 853 (5.0%) |
Employment Status by Educational Attainment in Laguna Hills
According to labor force statistics for Laguna Hills, 82.0% of individuals (13,878) out of the total population between 25 and 64 years of age (16,924) are in the labor force, with 5.8% or 805 of them being unemployed. The group with the highest labor force participation rate are those with the educational attainment of bachelor's degree or higher, with 85.8% or 7,905 individuals in the labor force. Within the labor force, individuals with college / associate degree education have the highest percentage of unemployment, with 7.0% or 258 of them being unemployed.
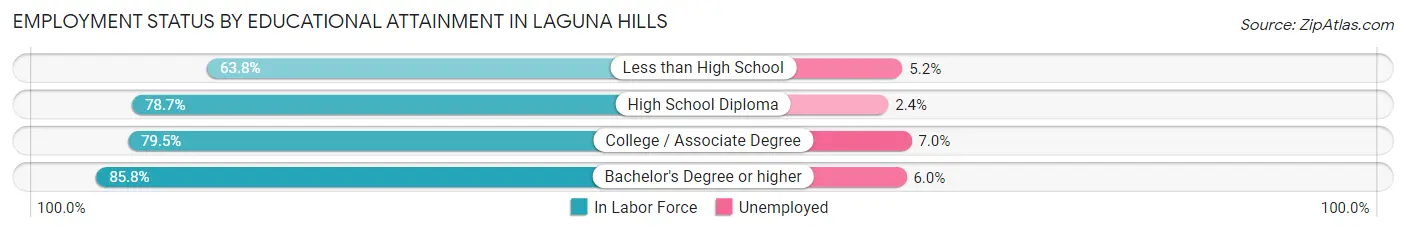
| Educational Attainment | In Labor Force | Unemployed |
| Less than High School | 556 (63.8%) | 45 (5.2%) |
| High School Diploma | 1,738 (78.7%) | 53 (2.4%) |
| College / Associate Degree | 3,682 (79.5%) | 324 (7.0%) |
| Bachelor's Degree or higher | 7,905 (85.8%) | 553 (6.0%) |
| Total | 13,878 (82.0%) | 982 (5.8%) |
Employment Occupations by Sex in Laguna Hills
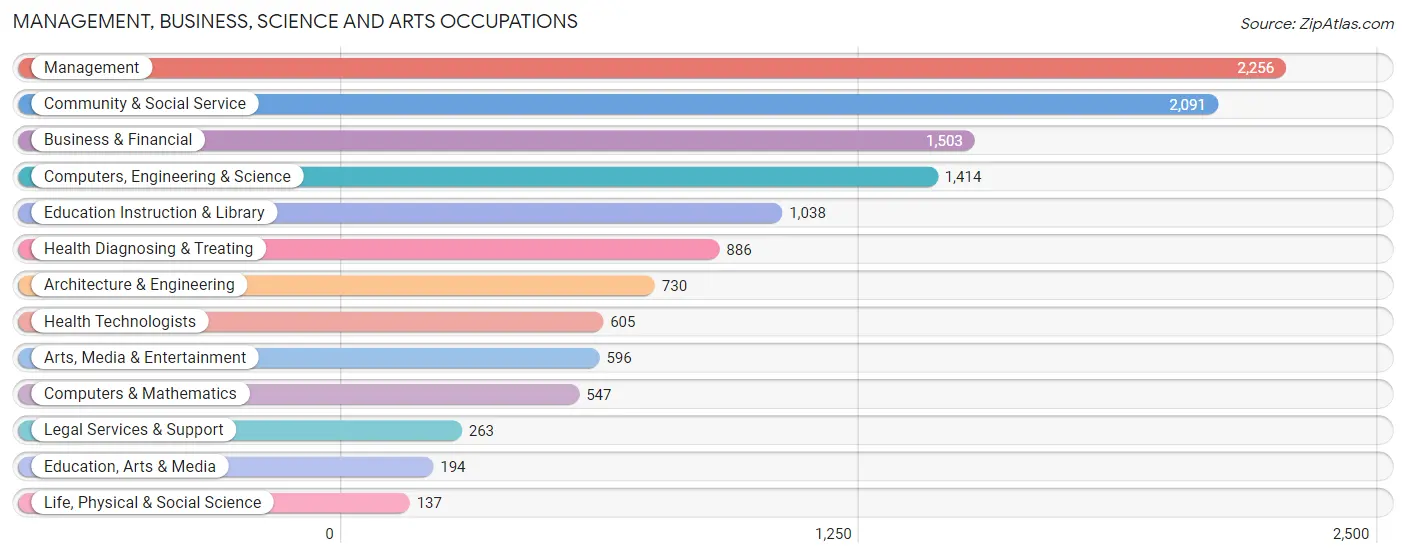
Management, Business, Science and Arts Occupations
The most common Management, Business, Science and Arts occupations in Laguna Hills are Management (2,256 | 14.0%), Community & Social Service (2,091 | 12.9%), Business & Financial (1,503 | 9.3%), Computers, Engineering & Science (1,414 | 8.7%), and Education Instruction & Library (1,038 | 6.4%).
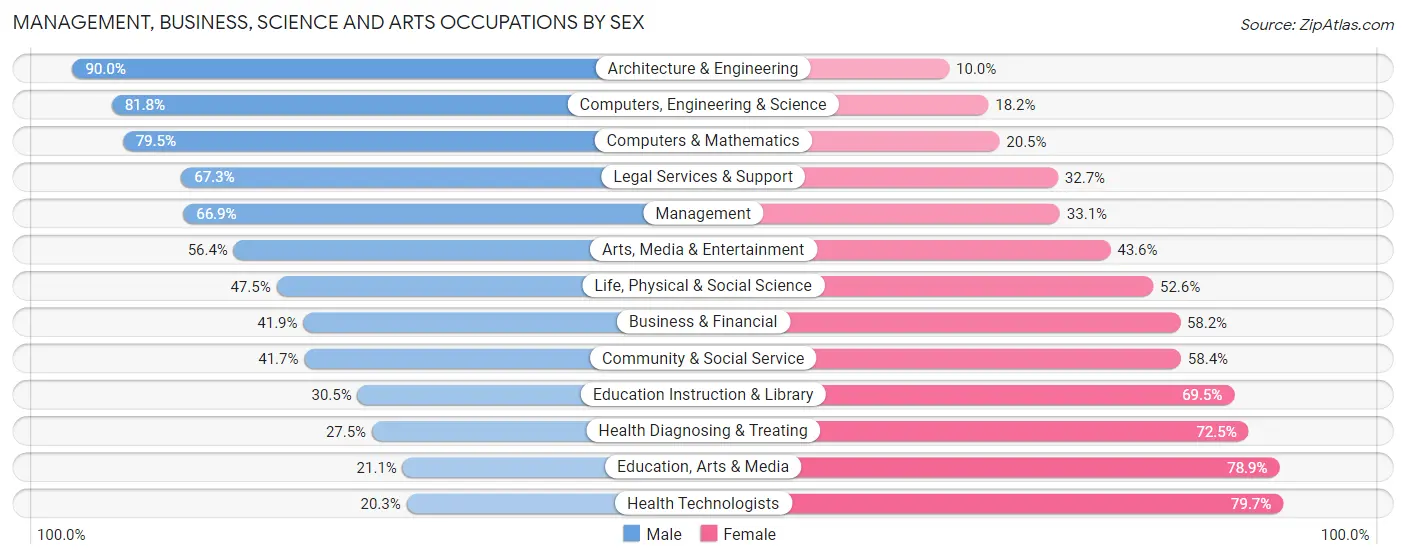
Management, Business, Science and Arts Occupations by Sex
Within the Management, Business, Science and Arts occupations in Laguna Hills, the most male-oriented occupations are Architecture & Engineering (90.0%), Computers, Engineering & Science (81.8%), and Computers & Mathematics (79.5%), while the most female-oriented occupations are Health Technologists (79.7%), Education, Arts & Media (78.9%), and Health Diagnosing & Treating (72.5%).
| Occupation | Male | Female |
| Management | 1,509 (66.9%) | 747 (33.1%) |
| Business & Financial | 629 (41.8%) | 874 (58.2%) |
| Computers, Engineering & Science | 1,157 (81.8%) | 257 (18.2%) |
| Computers & Mathematics | 435 (79.5%) | 112 (20.5%) |
| Architecture & Engineering | 657 (90.0%) | 73 (10.0%) |
| Life, Physical & Social Science | 65 (47.4%) | 72 (52.5%) |
| Community & Social Service | 871 (41.6%) | 1,220 (58.4%) |
| Education, Arts & Media | 41 (21.1%) | 153 (78.9%) |
| Legal Services & Support | 177 (67.3%) | 86 (32.7%) |
| Education Instruction & Library | 317 (30.5%) | 721 (69.5%) |
| Arts, Media & Entertainment | 336 (56.4%) | 260 (43.6%) |
| Health Diagnosing & Treating | 244 (27.5%) | 642 (72.5%) |
| Health Technologists | 123 (20.3%) | 482 (79.7%) |
| Total (Category) | 4,410 (54.1%) | 3,740 (45.9%) |
| Total (Overall) | 8,850 (54.7%) | 7,313 (45.3%) |
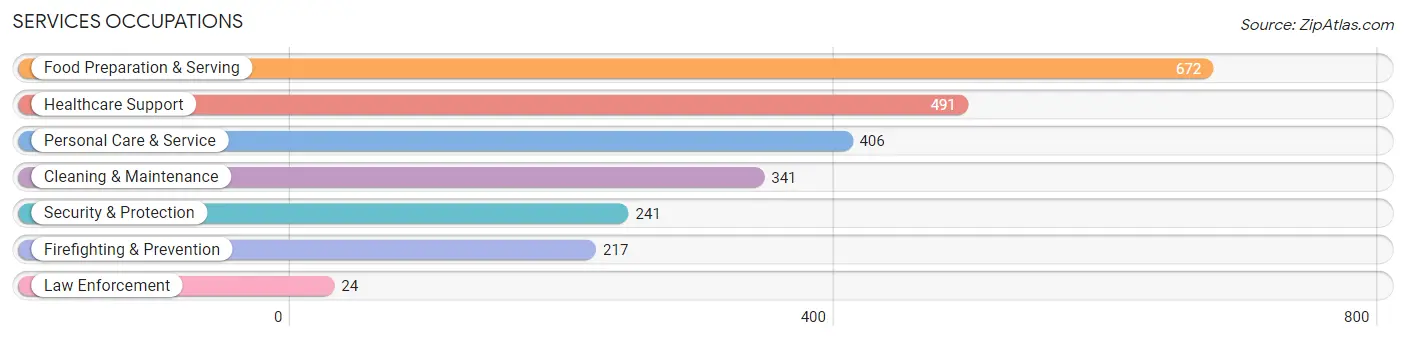
Services Occupations
The most common Services occupations in Laguna Hills are Food Preparation & Serving (672 | 4.2%), Healthcare Support (491 | 3.0%), Personal Care & Service (406 | 2.5%), Cleaning & Maintenance (341 | 2.1%), and Security & Protection (241 | 1.5%).
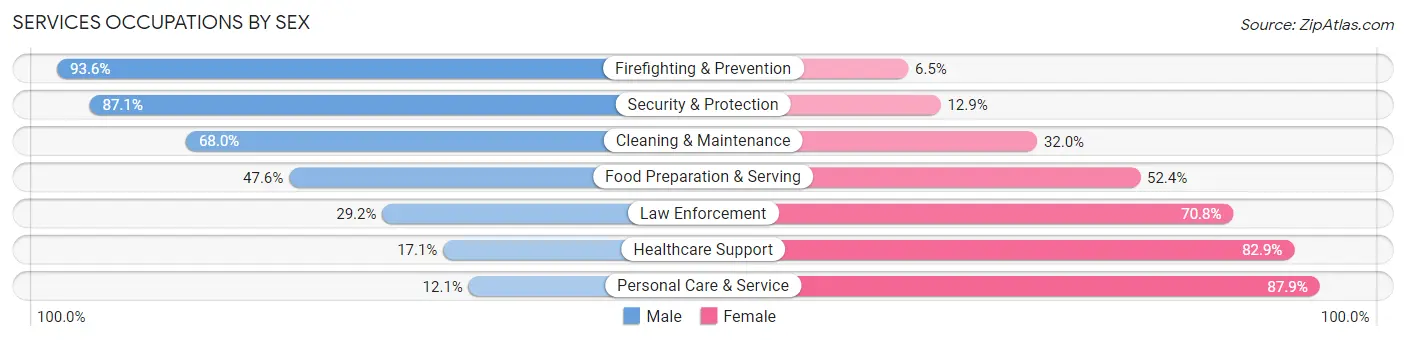
Services Occupations by Sex
Within the Services occupations in Laguna Hills, the most male-oriented occupations are Firefighting & Prevention (93.5%), Security & Protection (87.1%), and Cleaning & Maintenance (68.0%), while the most female-oriented occupations are Personal Care & Service (87.9%), Healthcare Support (82.9%), and Law Enforcement (70.8%).
| Occupation | Male | Female |
| Healthcare Support | 84 (17.1%) | 407 (82.9%) |
| Security & Protection | 210 (87.1%) | 31 (12.9%) |
| Firefighting & Prevention | 203 (93.5%) | 14 (6.5%) |
| Law Enforcement | 7 (29.2%) | 17 (70.8%) |
| Food Preparation & Serving | 320 (47.6%) | 352 (52.4%) |
| Cleaning & Maintenance | 232 (68.0%) | 109 (32.0%) |
| Personal Care & Service | 49 (12.1%) | 357 (87.9%) |
| Total (Category) | 895 (41.6%) | 1,256 (58.4%) |
| Total (Overall) | 8,850 (54.7%) | 7,313 (45.3%) |
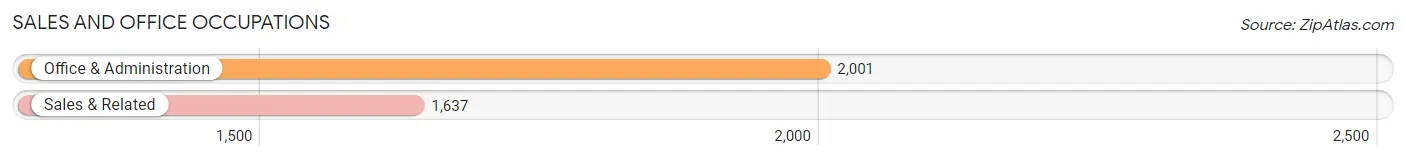
Sales and Office Occupations
The most common Sales and Office occupations in Laguna Hills are Office & Administration (2,001 | 12.4%), and Sales & Related (1,637 | 10.1%).
Sales and Office Occupations by Sex
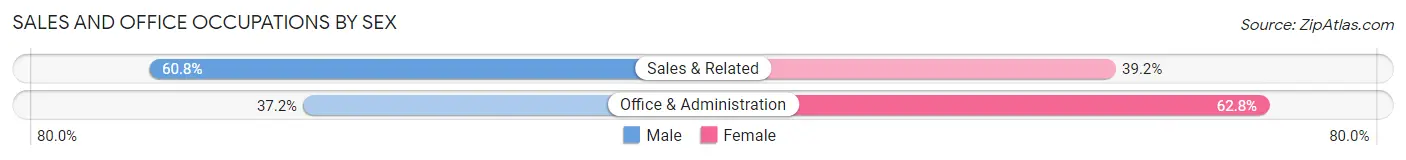
| Occupation | Male | Female |
| Sales & Related | 996 (60.8%) | 641 (39.2%) |
| Office & Administration | 744 (37.2%) | 1,257 (62.8%) |
| Total (Category) | 1,740 (47.8%) | 1,898 (52.2%) |
| Total (Overall) | 8,850 (54.7%) | 7,313 (45.3%) |
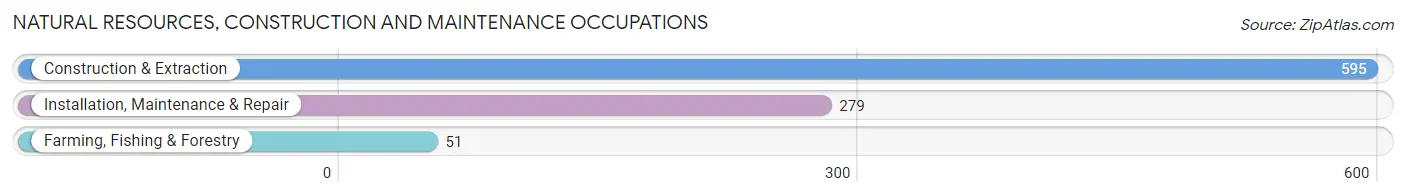
Natural Resources, Construction and Maintenance Occupations
The most common Natural Resources, Construction and Maintenance occupations in Laguna Hills are Construction & Extraction (595 | 3.7%), Installation, Maintenance & Repair (279 | 1.7%), and Farming, Fishing & Forestry (51 | 0.3%).
Natural Resources, Construction and Maintenance Occupations by Sex
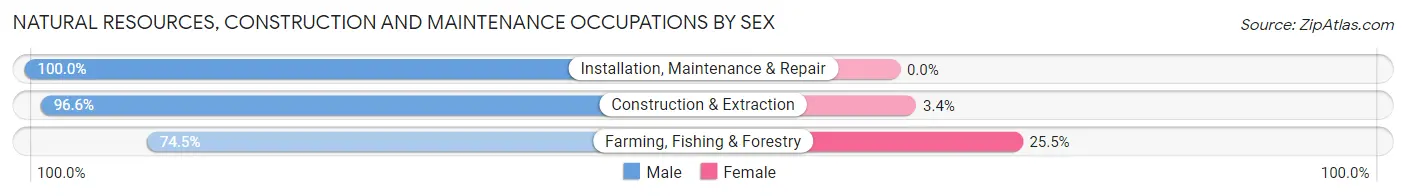
| Occupation | Male | Female |
| Farming, Fishing & Forestry | 38 (74.5%) | 13 (25.5%) |
| Construction & Extraction | 575 (96.6%) | 20 (3.4%) |
| Installation, Maintenance & Repair | 279 (100.0%) | 0 (0.0%) |
| Total (Category) | 892 (96.4%) | 33 (3.6%) |
| Total (Overall) | 8,850 (54.7%) | 7,313 (45.3%) |
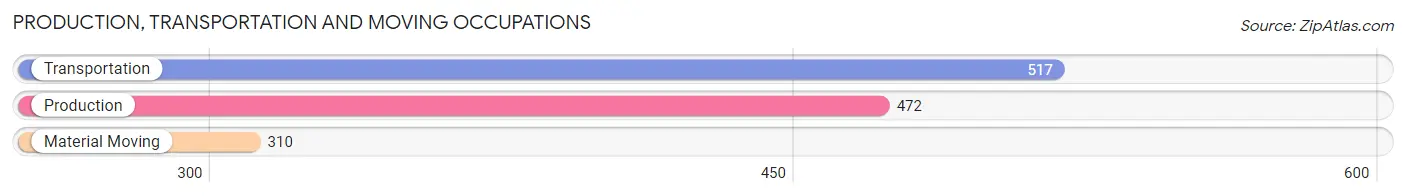
Production, Transportation and Moving Occupations
The most common Production, Transportation and Moving occupations in Laguna Hills are Transportation (517 | 3.2%), Production (472 | 2.9%), and Material Moving (310 | 1.9%).
Production, Transportation and Moving Occupations by Sex
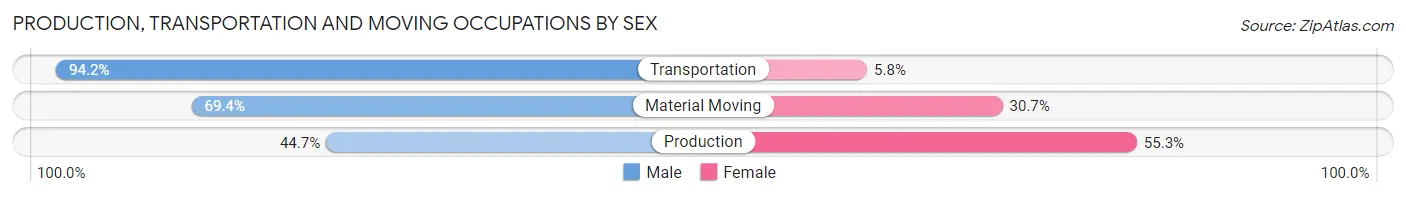
| Occupation | Male | Female |
| Production | 211 (44.7%) | 261 (55.3%) |
| Transportation | 487 (94.2%) | 30 (5.8%) |
| Material Moving | 215 (69.4%) | 95 (30.6%) |
| Total (Category) | 913 (70.3%) | 386 (29.7%) |
| Total (Overall) | 8,850 (54.7%) | 7,313 (45.3%) |
Employment Industries by Sex in Laguna Hills
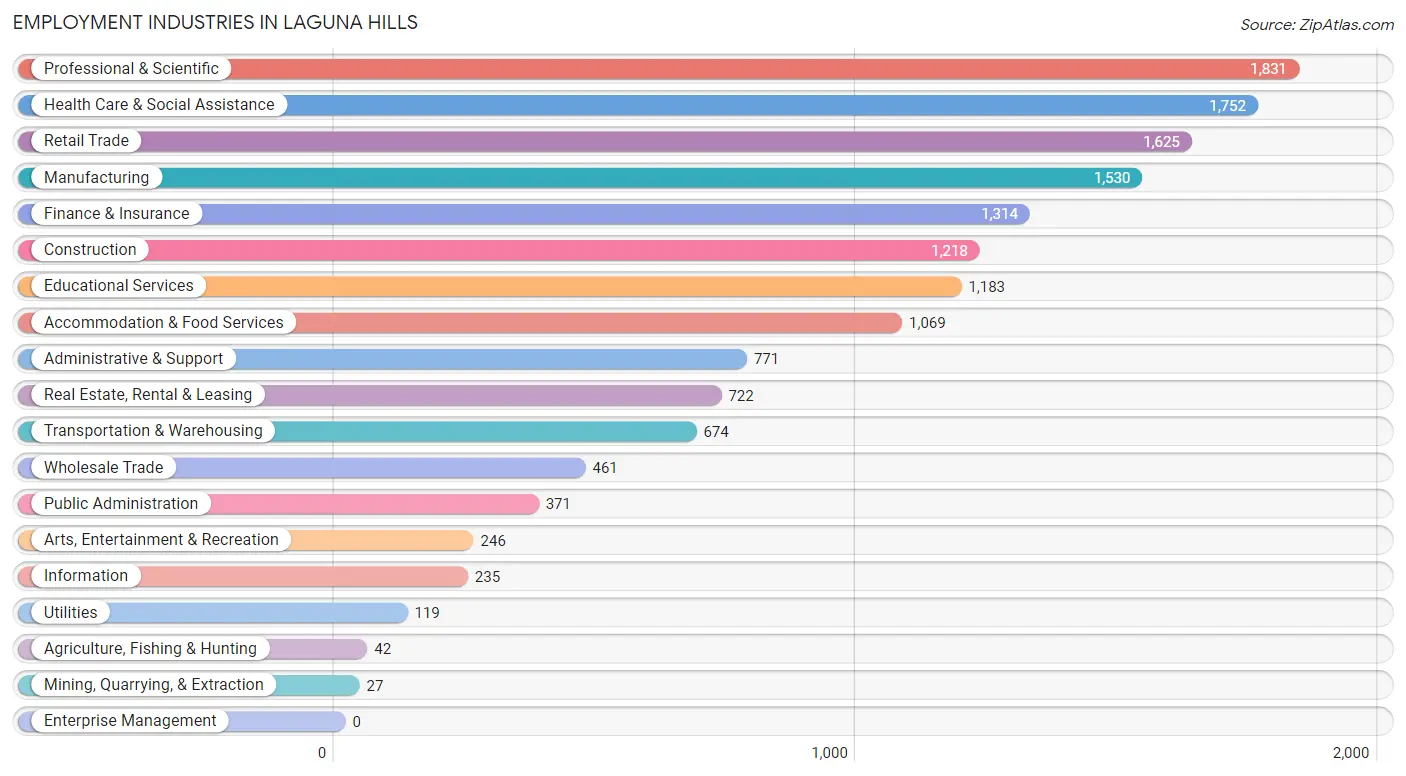
Employment Industries in Laguna Hills
The major employment industries in Laguna Hills include Professional & Scientific (1,831 | 11.3%), Health Care & Social Assistance (1,752 | 10.8%), Retail Trade (1,625 | 10.1%), Manufacturing (1,530 | 9.5%), and Finance & Insurance (1,314 | 8.1%).
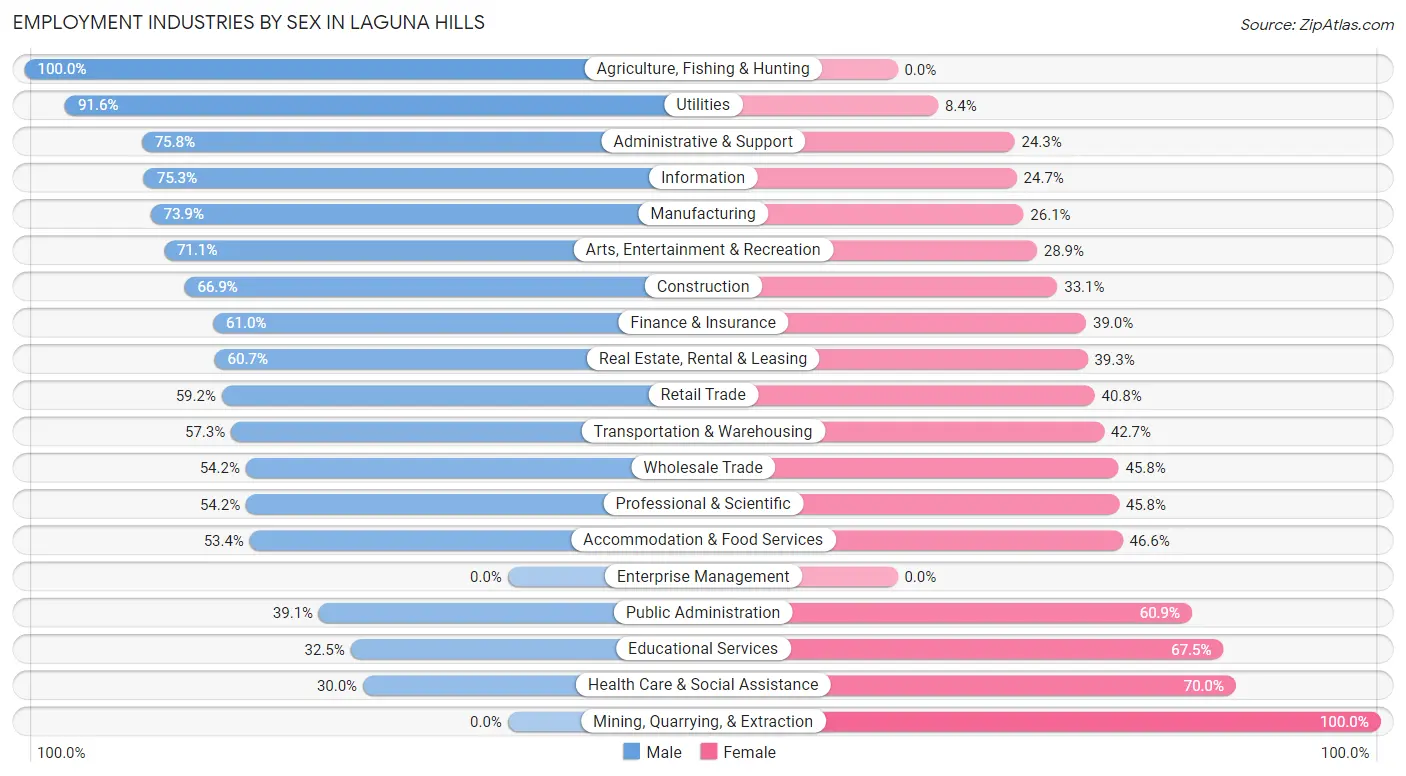
Employment Industries by Sex in Laguna Hills
The Laguna Hills industries that see more men than women are Agriculture, Fishing & Hunting (100.0%), Utilities (91.6%), and Administrative & Support (75.7%), whereas the industries that tend to have a higher number of women are Mining, Quarrying, & Extraction (100.0%), Health Care & Social Assistance (70.0%), and Educational Services (67.5%).
| Industry | Male | Female |
| Agriculture, Fishing & Hunting | 42 (100.0%) | 0 (0.0%) |
| Mining, Quarrying, & Extraction | 0 (0.0%) | 27 (100.0%) |
| Construction | 815 (66.9%) | 403 (33.1%) |
| Manufacturing | 1,131 (73.9%) | 399 (26.1%) |
| Wholesale Trade | 250 (54.2%) | 211 (45.8%) |
| Retail Trade | 962 (59.2%) | 663 (40.8%) |
| Transportation & Warehousing | 386 (57.3%) | 288 (42.7%) |
| Utilities | 109 (91.6%) | 10 (8.4%) |
| Information | 177 (75.3%) | 58 (24.7%) |
| Finance & Insurance | 801 (61.0%) | 513 (39.0%) |
| Real Estate, Rental & Leasing | 438 (60.7%) | 284 (39.3%) |
| Professional & Scientific | 992 (54.2%) | 839 (45.8%) |
| Enterprise Management | 0 (0.0%) | 0 (0.0%) |
| Administrative & Support | 584 (75.7%) | 187 (24.2%) |
| Educational Services | 385 (32.5%) | 798 (67.5%) |
| Health Care & Social Assistance | 525 (30.0%) | 1,227 (70.0%) |
| Arts, Entertainment & Recreation | 175 (71.1%) | 71 (28.9%) |
| Accommodation & Food Services | 571 (53.4%) | 498 (46.6%) |
| Public Administration | 145 (39.1%) | 226 (60.9%) |
| Total | 8,850 (54.7%) | 7,313 (45.3%) |
Education in Laguna Hills
School Enrollment in Laguna Hills
The most common levels of schooling among the 7,142 students in Laguna Hills are college / undergraduate (1,519 | 21.3%), elementary school (1,504 | 21.1%), and high school (1,378 | 19.3%).
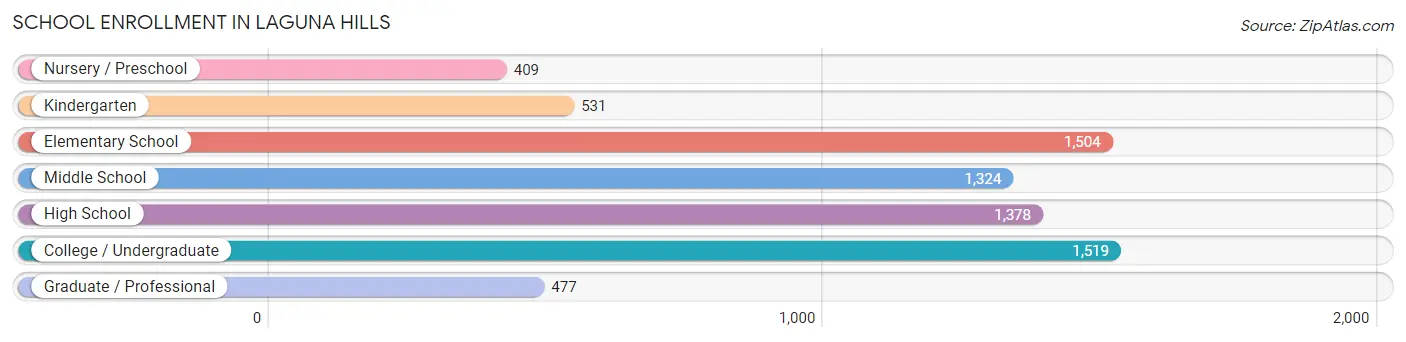
| School Level | # Students | % Students |
| Nursery / Preschool | 409 | 5.7% |
| Kindergarten | 531 | 7.4% |
| Elementary School | 1,504 | 21.1% |
| Middle School | 1,324 | 18.5% |
| High School | 1,378 | 19.3% |
| College / Undergraduate | 1,519 | 21.3% |
| Graduate / Professional | 477 | 6.7% |
| Total | 7,142 | 100.0% |
School Enrollment by Age by Funding Source in Laguna Hills
Out of a total of 7,142 students who are enrolled in schools in Laguna Hills, 1,243 (17.4%) attend a private institution, while the remaining 5,899 (82.6%) are enrolled in public schools. The age group of 3 to 4 year olds has the highest likelihood of being enrolled in private schools, with 162 (50.8% in the age bracket) enrolled. Conversely, the age group of 5 to 9 year old has the lowest likelihood of being enrolled in a private school, with 1,579 (88.0% in the age bracket) attending a public institution.
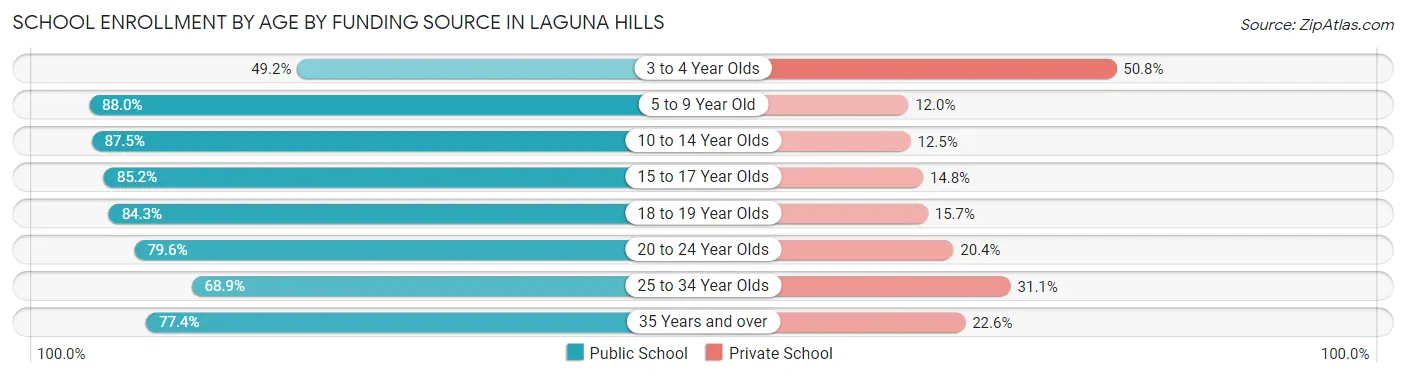
| Age Bracket | Public School | Private School |
| 3 to 4 Year Olds | 157 (49.2%) | 162 (50.8%) |
| 5 to 9 Year Old | 1,579 (88.0%) | 216 (12.0%) |
| 10 to 14 Year Olds | 1,623 (87.5%) | 231 (12.5%) |
| 15 to 17 Year Olds | 803 (85.2%) | 139 (14.8%) |
| 18 to 19 Year Olds | 425 (84.3%) | 79 (15.7%) |
| 20 to 24 Year Olds | 549 (79.6%) | 141 (20.4%) |
| 25 to 34 Year Olds | 350 (68.9%) | 158 (31.1%) |
| 35 Years and over | 410 (77.4%) | 120 (22.6%) |
| Total | 5,899 (82.6%) | 1,243 (17.4%) |
Educational Attainment by Field of Study in Laguna Hills
Business (3,035 | 23.7%), engineering (1,669 | 13.1%), social sciences (1,148 | 9.0%), science & technology (834 | 6.5%), and visual & performing arts (821 | 6.4%) are the most common fields of study among 12,786 individuals in Laguna Hills who have obtained a bachelor's degree or higher.
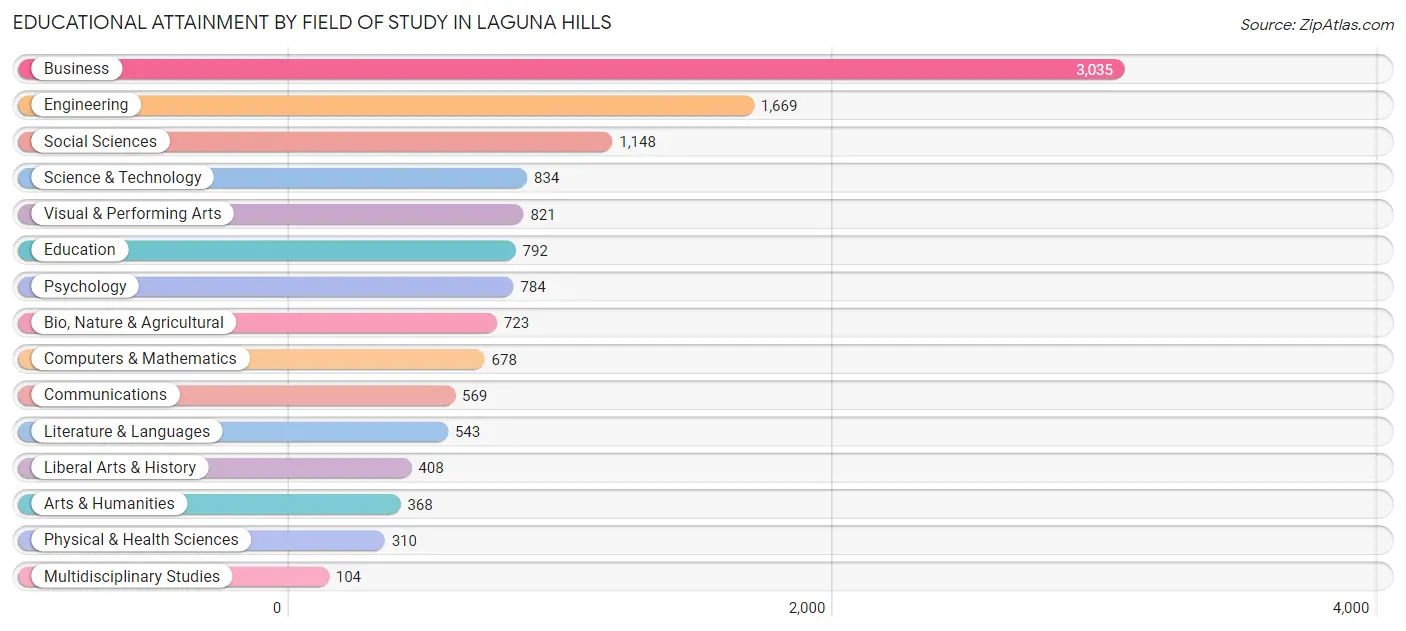
| Field of Study | # Graduates | % Graduates |
| Computers & Mathematics | 678 | 5.3% |
| Bio, Nature & Agricultural | 723 | 5.7% |
| Physical & Health Sciences | 310 | 2.4% |
| Psychology | 784 | 6.1% |
| Social Sciences | 1,148 | 9.0% |
| Engineering | 1,669 | 13.1% |
| Multidisciplinary Studies | 104 | 0.8% |
| Science & Technology | 834 | 6.5% |
| Business | 3,035 | 23.7% |
| Education | 792 | 6.2% |
| Literature & Languages | 543 | 4.3% |
| Liberal Arts & History | 408 | 3.2% |
| Visual & Performing Arts | 821 | 6.4% |
| Communications | 569 | 4.4% |
| Arts & Humanities | 368 | 2.9% |
| Total | 12,786 | 100.0% |
Transportation & Commute in Laguna Hills
Vehicle Availability by Sex in Laguna Hills
The most prevalent vehicle ownership categories in Laguna Hills are males with 2 vehicles (4,155, accounting for 47.5%) and females with 2 vehicles (3,065, making up 58.1%).
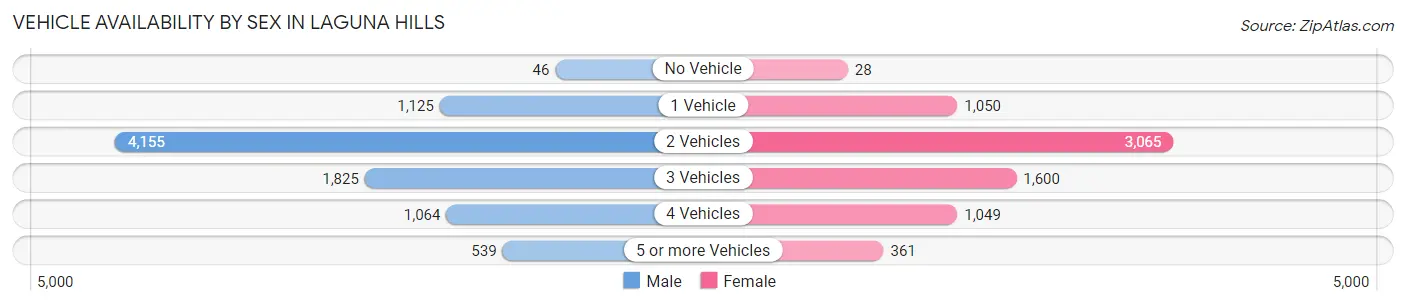
| Vehicles Available | Male | Female |
| No Vehicle | 46 (0.5%) | 28 (0.4%) |
| 1 Vehicle | 1,125 (12.9%) | 1,050 (14.7%) |
| 2 Vehicles | 4,155 (47.5%) | 3,065 (42.8%) |
| 3 Vehicles | 1,825 (20.8%) | 1,600 (22.4%) |
| 4 Vehicles | 1,064 (12.1%) | 1,049 (14.7%) |
| 5 or more Vehicles | 539 (6.2%) | 361 (5.1%) |
| Total | 8,754 (100.0%) | 7,153 (100.0%) |
Commute Time in Laguna Hills
The most frequently occuring commute durations in Laguna Hills are 20 to 24 minutes (2,594 commuters, 19.9%), 15 to 19 minutes (2,381 commuters, 18.2%), and 10 to 14 minutes (2,005 commuters, 15.4%).
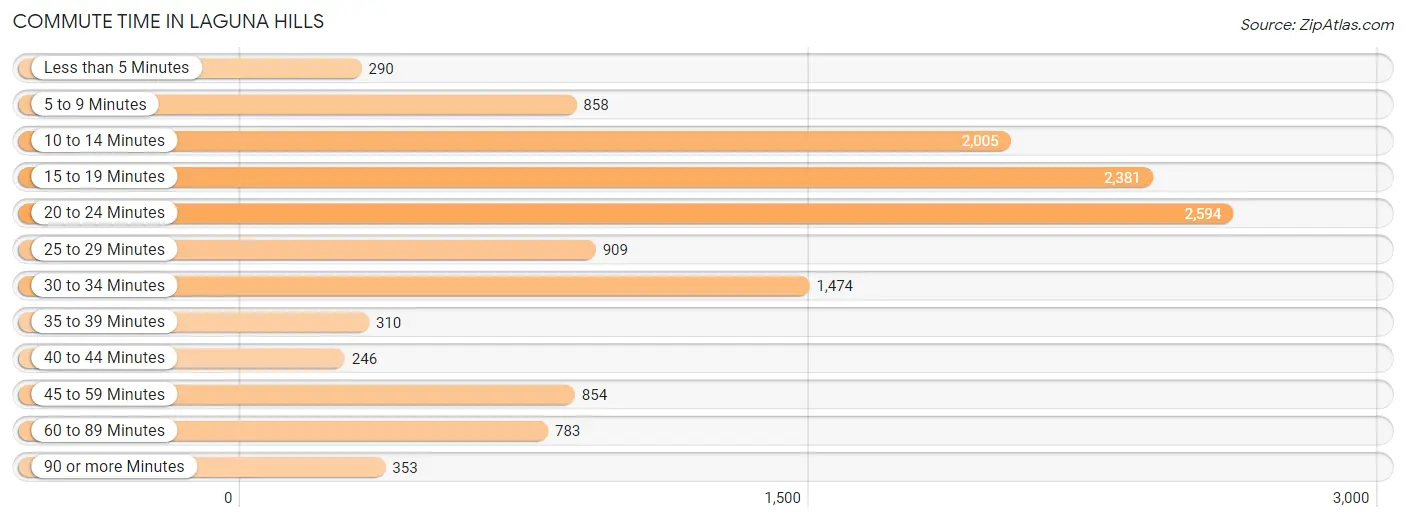
| Commute Time | # Commuters | % Commuters |
| Less than 5 Minutes | 290 | 2.2% |
| 5 to 9 Minutes | 858 | 6.6% |
| 10 to 14 Minutes | 2,005 | 15.4% |
| 15 to 19 Minutes | 2,381 | 18.2% |
| 20 to 24 Minutes | 2,594 | 19.9% |
| 25 to 29 Minutes | 909 | 7.0% |
| 30 to 34 Minutes | 1,474 | 11.3% |
| 35 to 39 Minutes | 310 | 2.4% |
| 40 to 44 Minutes | 246 | 1.9% |
| 45 to 59 Minutes | 854 | 6.5% |
| 60 to 89 Minutes | 783 | 6.0% |
| 90 or more Minutes | 353 | 2.7% |
Commute Time by Sex in Laguna Hills
The most common commute times in Laguna Hills are 15 to 19 minutes (1,359 commuters, 18.8%) for males and 20 to 24 minutes (1,246 commuters, 21.4%) for females.
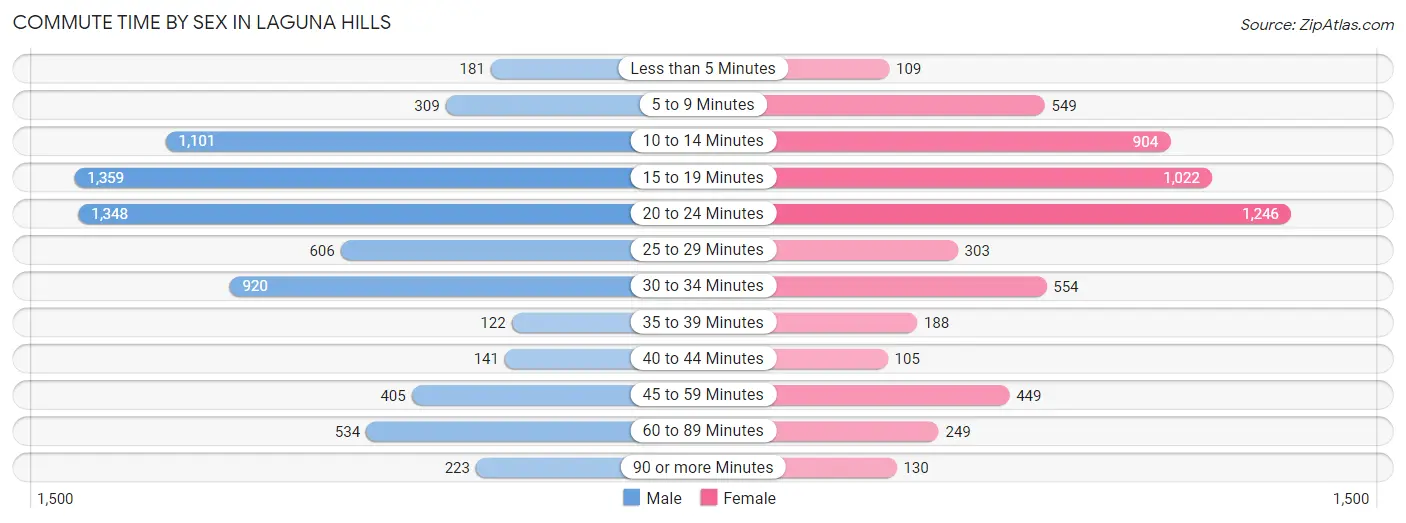
| Commute Time | Male | Female |
| Less than 5 Minutes | 181 (2.5%) | 109 (1.9%) |
| 5 to 9 Minutes | 309 (4.3%) | 549 (9.5%) |
| 10 to 14 Minutes | 1,101 (15.2%) | 904 (15.6%) |
| 15 to 19 Minutes | 1,359 (18.8%) | 1,022 (17.6%) |
| 20 to 24 Minutes | 1,348 (18.6%) | 1,246 (21.4%) |
| 25 to 29 Minutes | 606 (8.4%) | 303 (5.2%) |
| 30 to 34 Minutes | 920 (12.7%) | 554 (9.5%) |
| 35 to 39 Minutes | 122 (1.7%) | 188 (3.2%) |
| 40 to 44 Minutes | 141 (1.9%) | 105 (1.8%) |
| 45 to 59 Minutes | 405 (5.6%) | 449 (7.7%) |
| 60 to 89 Minutes | 534 (7.4%) | 249 (4.3%) |
| 90 or more Minutes | 223 (3.1%) | 130 (2.2%) |
Time of Departure to Work by Sex in Laguna Hills
The most frequent times of departure to work in Laguna Hills are 8:00 AM to 8:29 AM (1,166, 16.1%) for males and 7:00 AM to 7:29 AM (1,051, 18.1%) for females.
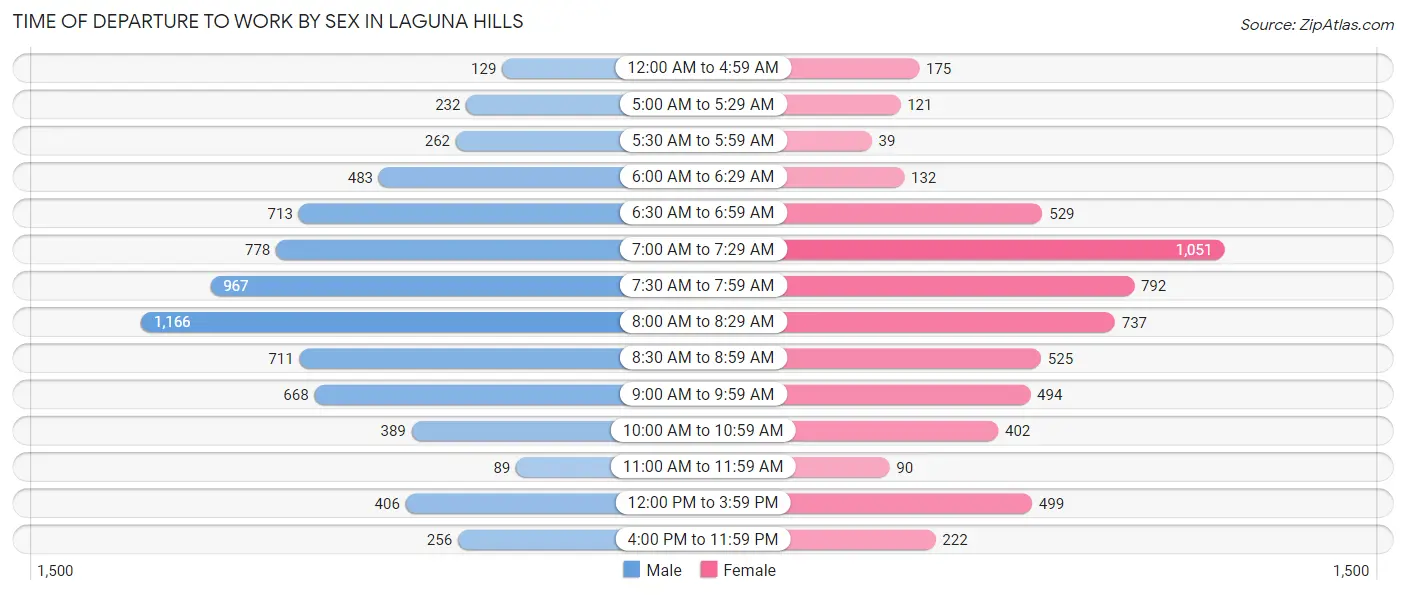
| Time of Departure | Male | Female |
| 12:00 AM to 4:59 AM | 129 (1.8%) | 175 (3.0%) |
| 5:00 AM to 5:29 AM | 232 (3.2%) | 121 (2.1%) |
| 5:30 AM to 5:59 AM | 262 (3.6%) | 39 (0.7%) |
| 6:00 AM to 6:29 AM | 483 (6.7%) | 132 (2.3%) |
| 6:30 AM to 6:59 AM | 713 (9.8%) | 529 (9.1%) |
| 7:00 AM to 7:29 AM | 778 (10.7%) | 1,051 (18.1%) |
| 7:30 AM to 7:59 AM | 967 (13.3%) | 792 (13.6%) |
| 8:00 AM to 8:29 AM | 1,166 (16.1%) | 737 (12.7%) |
| 8:30 AM to 8:59 AM | 711 (9.8%) | 525 (9.0%) |
| 9:00 AM to 9:59 AM | 668 (9.2%) | 494 (8.5%) |
| 10:00 AM to 10:59 AM | 389 (5.4%) | 402 (6.9%) |
| 11:00 AM to 11:59 AM | 89 (1.2%) | 90 (1.5%) |
| 12:00 PM to 3:59 PM | 406 (5.6%) | 499 (8.6%) |
| 4:00 PM to 11:59 PM | 256 (3.5%) | 222 (3.8%) |
| Total | 7,249 (100.0%) | 5,808 (100.0%) |
Housing Occupancy in Laguna Hills
Occupancy by Ownership in Laguna Hills
Of the total 11,525 dwellings in Laguna Hills, owner-occupied units account for 8,149 (70.7%), while renter-occupied units make up 3,376 (29.3%).
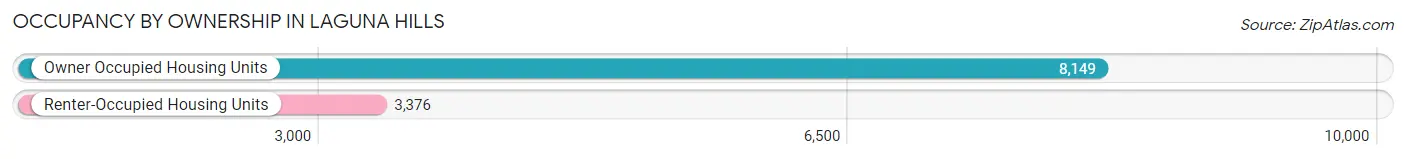
| Occupancy | # Housing Units | % Housing Units |
| Owner Occupied Housing Units | 8,149 | 70.7% |
| Renter-Occupied Housing Units | 3,376 | 29.3% |
| Total Occupied Housing Units | 11,525 | 100.0% |
Occupancy by Household Size in Laguna Hills
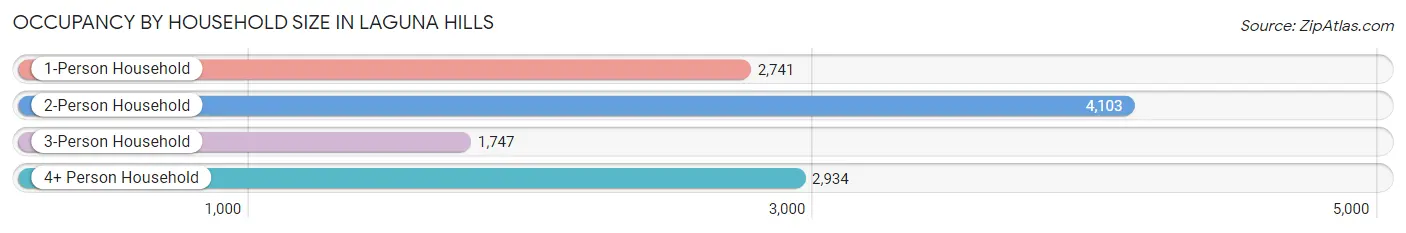
| Household Size | # Housing Units | % Housing Units |
| 1-Person Household | 2,741 | 23.8% |
| 2-Person Household | 4,103 | 35.6% |
| 3-Person Household | 1,747 | 15.2% |
| 4+ Person Household | 2,934 | 25.5% |
| Total Housing Units | 11,525 | 100.0% |
Occupancy by Ownership by Household Size in Laguna Hills
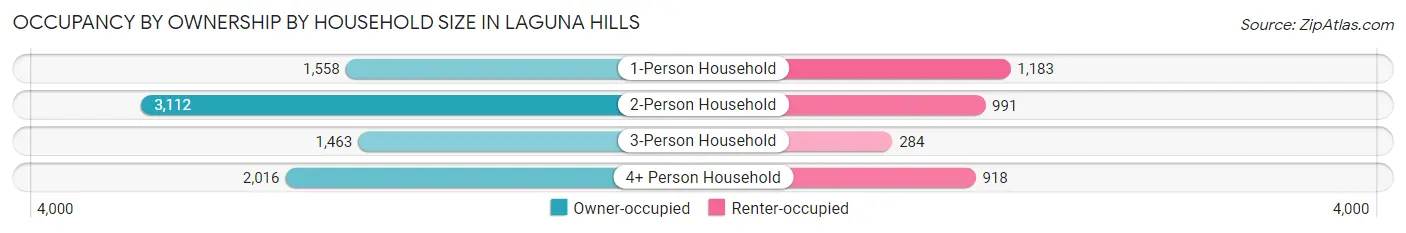
| Household Size | Owner-occupied | Renter-occupied |
| 1-Person Household | 1,558 (56.8%) | 1,183 (43.2%) |
| 2-Person Household | 3,112 (75.8%) | 991 (24.1%) |
| 3-Person Household | 1,463 (83.7%) | 284 (16.3%) |
| 4+ Person Household | 2,016 (68.7%) | 918 (31.3%) |
| Total Housing Units | 8,149 (70.7%) | 3,376 (29.3%) |
Occupancy by Educational Attainment in Laguna Hills
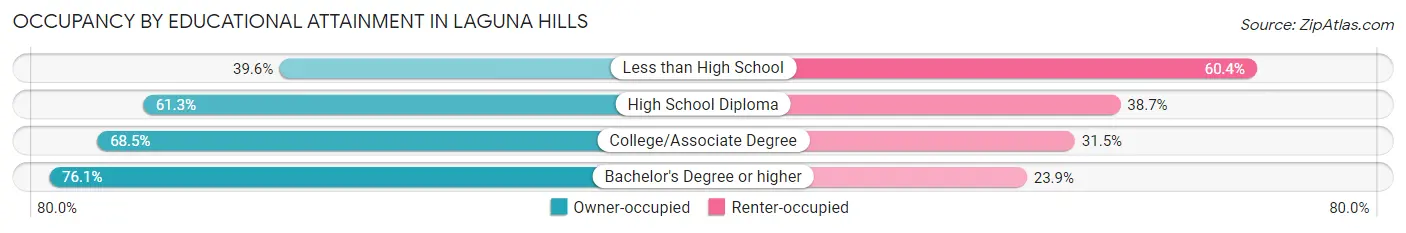
| Household Size | Owner-occupied | Renter-occupied |
| Less than High School | 201 (39.6%) | 306 (60.4%) |
| High School Diploma | 786 (61.3%) | 497 (38.7%) |
| College/Associate Degree | 2,223 (68.5%) | 1,023 (31.5%) |
| Bachelor's Degree or higher | 4,939 (76.1%) | 1,550 (23.9%) |
Occupancy by Age of Householder in Laguna Hills
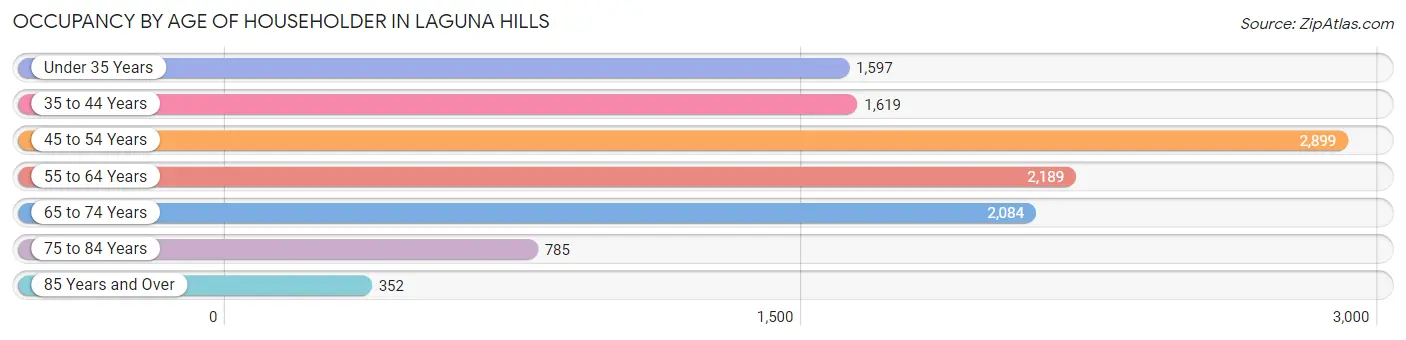
| Age Bracket | # Households | % Households |
| Under 35 Years | 1,597 | 13.9% |
| 35 to 44 Years | 1,619 | 14.1% |
| 45 to 54 Years | 2,899 | 25.2% |
| 55 to 64 Years | 2,189 | 19.0% |
| 65 to 74 Years | 2,084 | 18.1% |
| 75 to 84 Years | 785 | 6.8% |
| 85 Years and Over | 352 | 3.0% |
| Total | 11,525 | 100.0% |
Housing Finances in Laguna Hills
Median Income by Occupancy in Laguna Hills
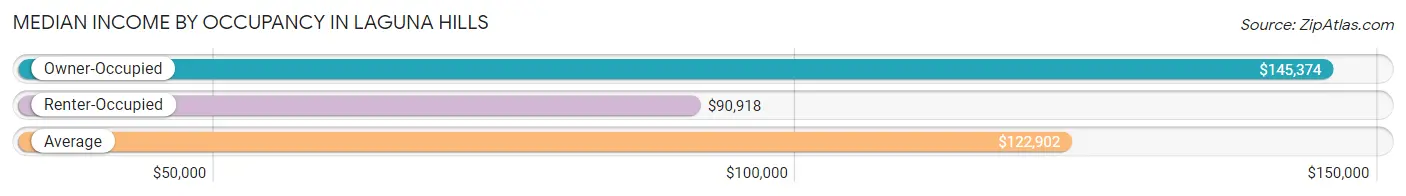
| Occupancy Type | # Households | Median Income |
| Owner-Occupied | 8,149 (70.7%) | $145,374 |
| Renter-Occupied | 3,376 (29.3%) | $90,918 |
| Average | 11,525 (100.0%) | $122,902 |
Occupancy by Householder Income Bracket in Laguna Hills
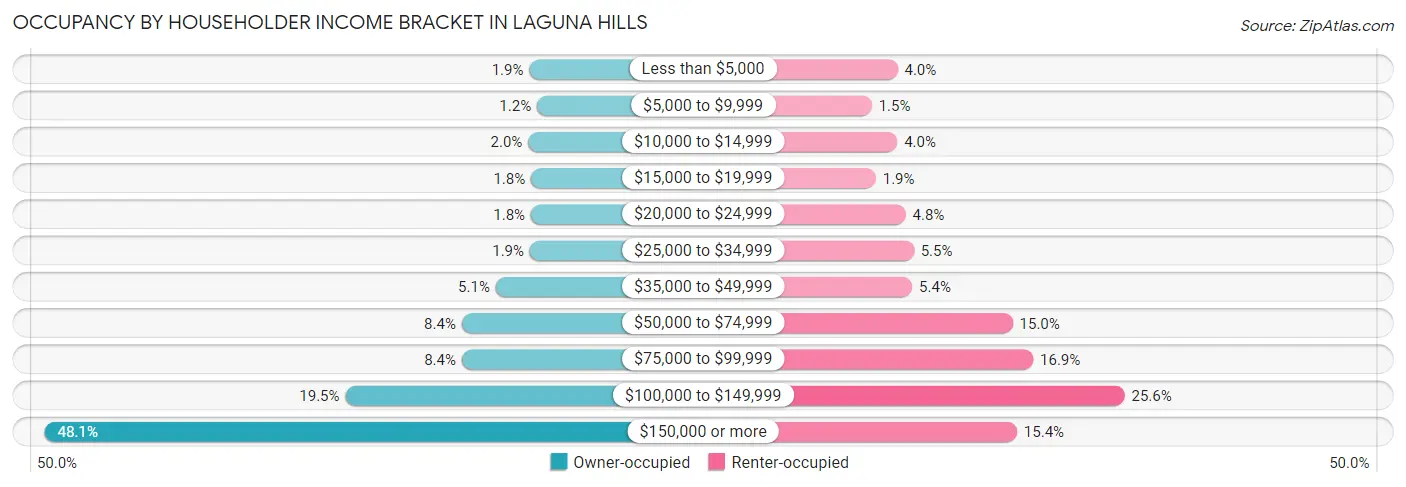
| Income Bracket | Owner-occupied | Renter-occupied |
| Less than $5,000 | 157 (1.9%) | 135 (4.0%) |
| $5,000 to $9,999 | 98 (1.2%) | 52 (1.5%) |
| $10,000 to $14,999 | 166 (2.0%) | 134 (4.0%) |
| $15,000 to $19,999 | 144 (1.8%) | 65 (1.9%) |
| $20,000 to $24,999 | 145 (1.8%) | 161 (4.8%) |
| $25,000 to $34,999 | 153 (1.9%) | 187 (5.5%) |
| $35,000 to $49,999 | 418 (5.1%) | 182 (5.4%) |
| $50,000 to $74,999 | 682 (8.4%) | 505 (15.0%) |
| $75,000 to $99,999 | 681 (8.4%) | 571 (16.9%) |
| $100,000 to $149,999 | 1,585 (19.5%) | 865 (25.6%) |
| $150,000 or more | 3,920 (48.1%) | 519 (15.4%) |
| Total | 8,149 (100.0%) | 3,376 (100.0%) |
Monthly Housing Cost Tiers in Laguna Hills
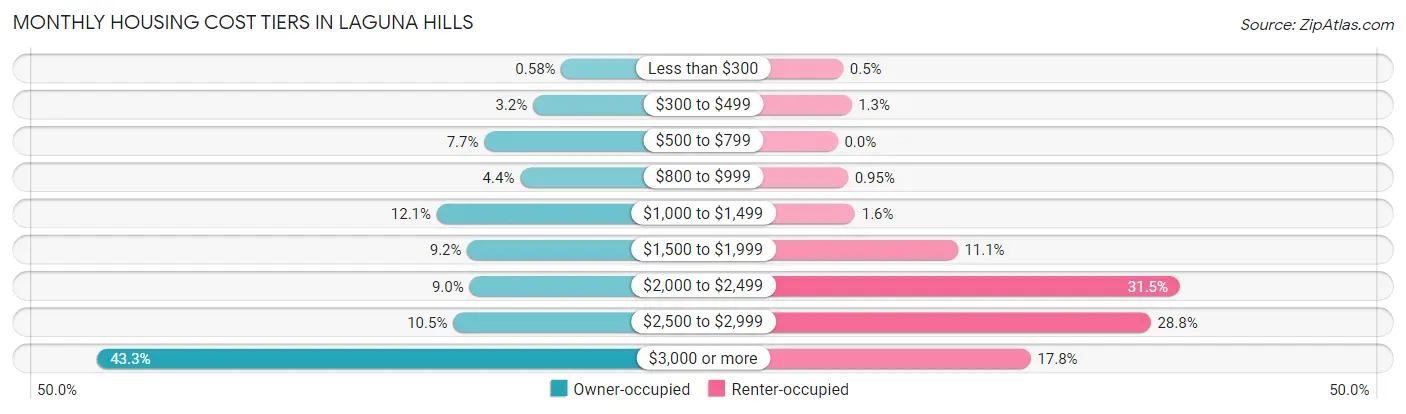
| Monthly Cost | Owner-occupied | Renter-occupied |
| Less than $300 | 47 (0.6%) | 17 (0.5%) |
| $300 to $499 | 260 (3.2%) | 43 (1.3%) |
| $500 to $799 | 626 (7.7%) | 0 (0.0%) |
| $800 to $999 | 356 (4.4%) | 32 (0.9%) |
| $1,000 to $1,499 | 982 (12.0%) | 54 (1.6%) |
| $1,500 to $1,999 | 753 (9.2%) | 373 (11.1%) |
| $2,000 to $2,499 | 737 (9.0%) | 1,064 (31.5%) |
| $2,500 to $2,999 | 859 (10.5%) | 973 (28.8%) |
| $3,000 or more | 3,529 (43.3%) | 600 (17.8%) |
| Total | 8,149 (100.0%) | 3,376 (100.0%) |
Physical Housing Characteristics in Laguna Hills
Housing Structures in Laguna Hills
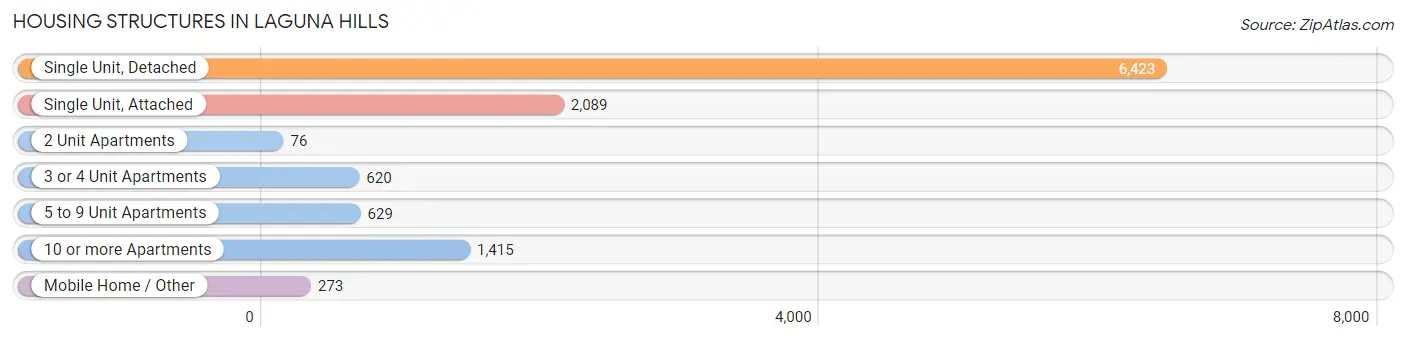
| Structure Type | # Housing Units | % Housing Units |
| Single Unit, Detached | 6,423 | 55.7% |
| Single Unit, Attached | 2,089 | 18.1% |
| 2 Unit Apartments | 76 | 0.7% |
| 3 or 4 Unit Apartments | 620 | 5.4% |
| 5 to 9 Unit Apartments | 629 | 5.5% |
| 10 or more Apartments | 1,415 | 12.3% |
| Mobile Home / Other | 273 | 2.4% |
| Total | 11,525 | 100.0% |
Housing Structures by Occupancy in Laguna Hills
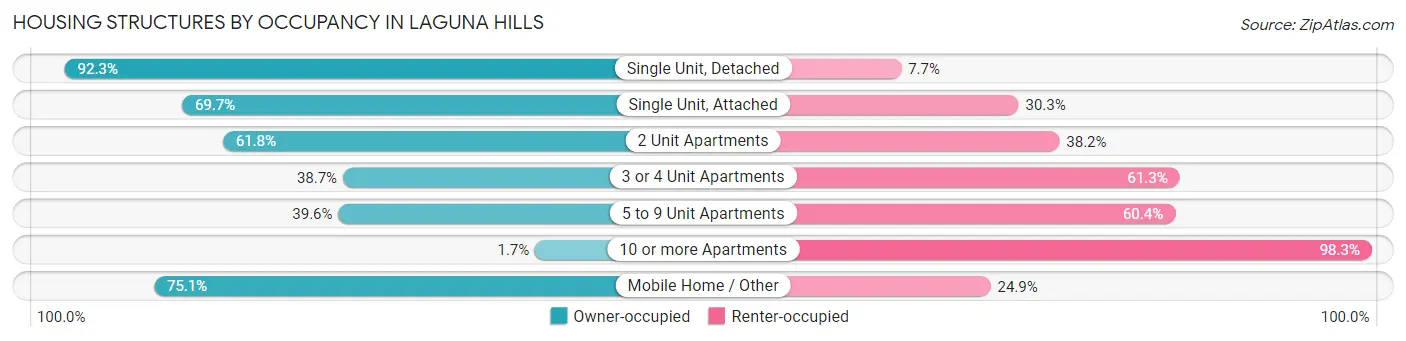
| Structure Type | Owner-occupied | Renter-occupied |
| Single Unit, Detached | 5,928 (92.3%) | 495 (7.7%) |
| Single Unit, Attached | 1,456 (69.7%) | 633 (30.3%) |
| 2 Unit Apartments | 47 (61.8%) | 29 (38.2%) |
| 3 or 4 Unit Apartments | 240 (38.7%) | 380 (61.3%) |
| 5 to 9 Unit Apartments | 249 (39.6%) | 380 (60.4%) |
| 10 or more Apartments | 24 (1.7%) | 1,391 (98.3%) |
| Mobile Home / Other | 205 (75.1%) | 68 (24.9%) |
| Total | 8,149 (70.7%) | 3,376 (29.3%) |
Housing Structures by Number of Rooms in Laguna Hills
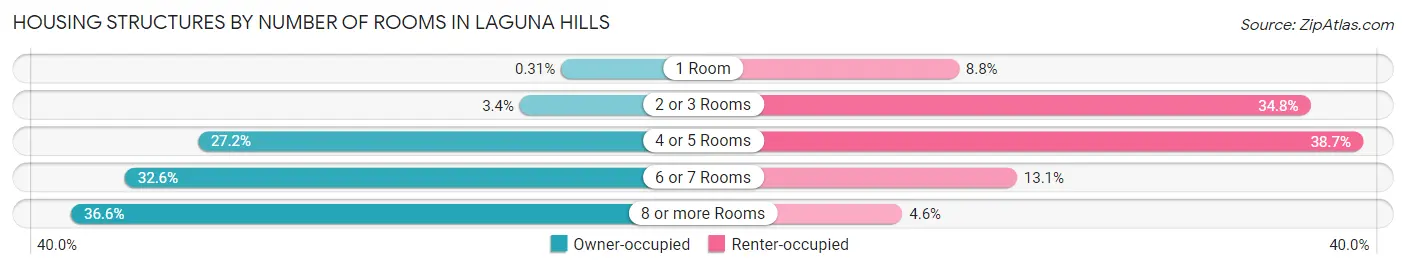
| Number of Rooms | Owner-occupied | Renter-occupied |
| 1 Room | 25 (0.3%) | 297 (8.8%) |
| 2 or 3 Rooms | 274 (3.4%) | 1,175 (34.8%) |
| 4 or 5 Rooms | 2,216 (27.2%) | 1,306 (38.7%) |
| 6 or 7 Rooms | 2,655 (32.6%) | 442 (13.1%) |
| 8 or more Rooms | 2,979 (36.6%) | 156 (4.6%) |
| Total | 8,149 (100.0%) | 3,376 (100.0%) |
Housing Structure by Heating Type in Laguna Hills
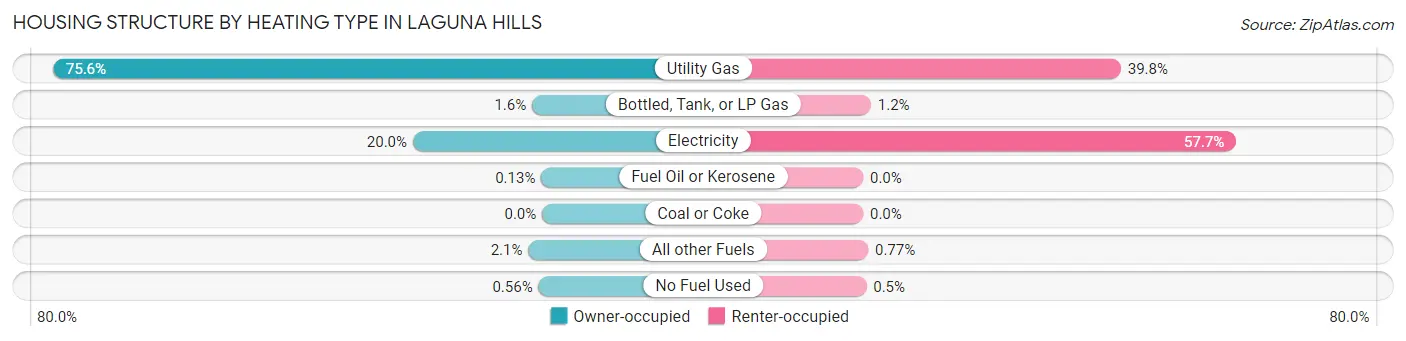
| Heating Type | Owner-occupied | Renter-occupied |
| Utility Gas | 6,163 (75.6%) | 1,345 (39.8%) |
| Bottled, Tank, or LP Gas | 127 (1.6%) | 41 (1.2%) |
| Electricity | 1,628 (20.0%) | 1,947 (57.7%) |
| Fuel Oil or Kerosene | 11 (0.1%) | 0 (0.0%) |
| Coal or Coke | 0 (0.0%) | 0 (0.0%) |
| All other Fuels | 174 (2.1%) | 26 (0.8%) |
| No Fuel Used | 46 (0.6%) | 17 (0.5%) |
| Total | 8,149 (100.0%) | 3,376 (100.0%) |
Household Vehicle Usage in Laguna Hills
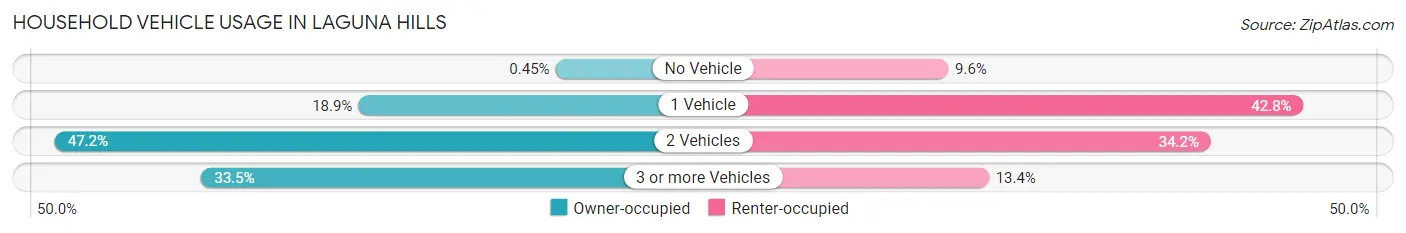
| Vehicles per Household | Owner-occupied | Renter-occupied |
| No Vehicle | 37 (0.4%) | 325 (9.6%) |
| 1 Vehicle | 1,537 (18.9%) | 1,445 (42.8%) |
| 2 Vehicles | 3,845 (47.2%) | 1,153 (34.2%) |
| 3 or more Vehicles | 2,730 (33.5%) | 453 (13.4%) |
| Total | 8,149 (100.0%) | 3,376 (100.0%) |
Real Estate & Mortgages in Laguna Hills
Real Estate and Mortgage Overview in Laguna Hills
| Characteristic | Without Mortgage | With Mortgage |
| Housing Units | 2,365 | 5,784 |
| Median Property Value | $927,900 | $841,100 |
| Median Household Income | $90,545 | $3,141 |
| Monthly Housing Costs | $974 | $3,404 |
| Real Estate Taxes | $5,372 | $51 |
Property Value by Mortgage Status in Laguna Hills
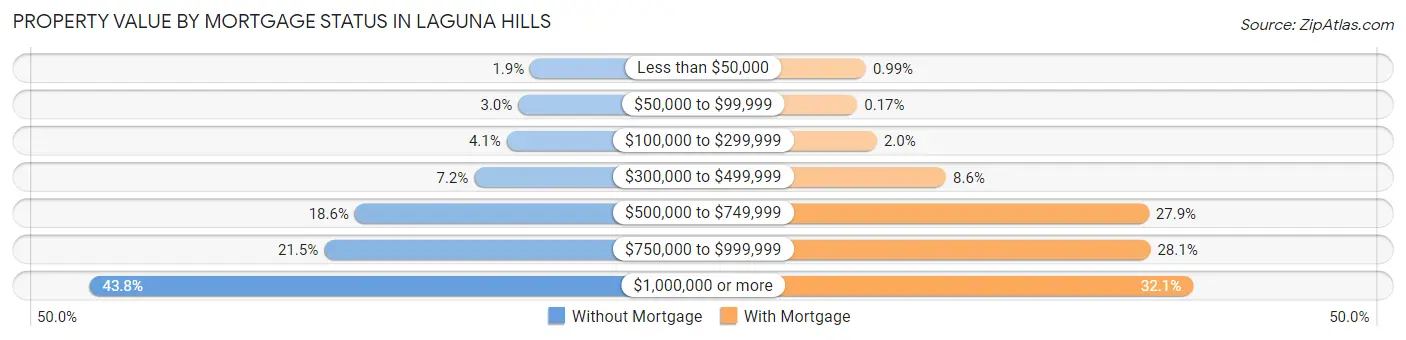
| Property Value | Without Mortgage | With Mortgage |
| Less than $50,000 | 44 (1.9%) | 57 (1.0%) |
| $50,000 to $99,999 | 71 (3.0%) | 10 (0.2%) |
| $100,000 to $299,999 | 97 (4.1%) | 118 (2.0%) |
| $300,000 to $499,999 | 170 (7.2%) | 499 (8.6%) |
| $500,000 to $749,999 | 439 (18.6%) | 1,616 (27.9%) |
| $750,000 to $999,999 | 508 (21.5%) | 1,625 (28.1%) |
| $1,000,000 or more | 1,036 (43.8%) | 1,859 (32.1%) |
| Total | 2,365 (100.0%) | 5,784 (100.0%) |
Household Income by Mortgage Status in Laguna Hills
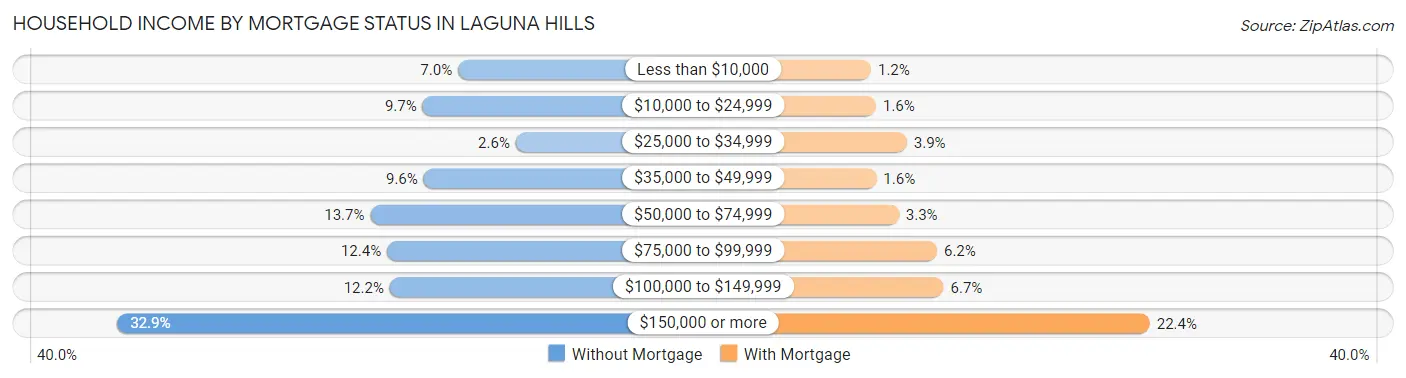
| Household Income | Without Mortgage | With Mortgage |
| Less than $10,000 | 165 (7.0%) | 68 (1.2%) |
| $10,000 to $24,999 | 229 (9.7%) | 90 (1.6%) |
| $25,000 to $34,999 | 61 (2.6%) | 226 (3.9%) |
| $35,000 to $49,999 | 227 (9.6%) | 92 (1.6%) |
| $50,000 to $74,999 | 323 (13.7%) | 191 (3.3%) |
| $75,000 to $99,999 | 293 (12.4%) | 359 (6.2%) |
| $100,000 to $149,999 | 288 (12.2%) | 388 (6.7%) |
| $150,000 or more | 779 (32.9%) | 1,297 (22.4%) |
| Total | 2,365 (100.0%) | 5,784 (100.0%) |
Property Value to Household Income Ratio in Laguna Hills
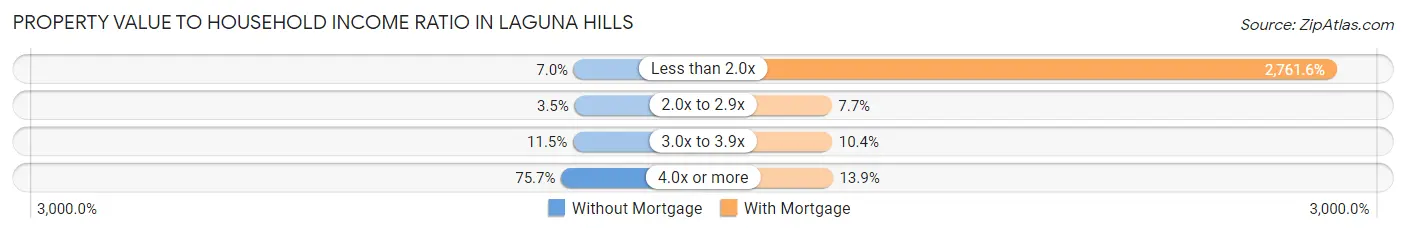
| Value-to-Income Ratio | Without Mortgage | With Mortgage |
| Less than 2.0x | 166 (7.0%) | 159,732 (2,761.6%) |
| 2.0x to 2.9x | 83 (3.5%) | 447 (7.7%) |
| 3.0x to 3.9x | 272 (11.5%) | 602 (10.4%) |
| 4.0x or more | 1,790 (75.7%) | 801 (13.9%) |
| Total | 2,365 (100.0%) | 5,784 (100.0%) |
Real Estate Taxes by Mortgage Status in Laguna Hills
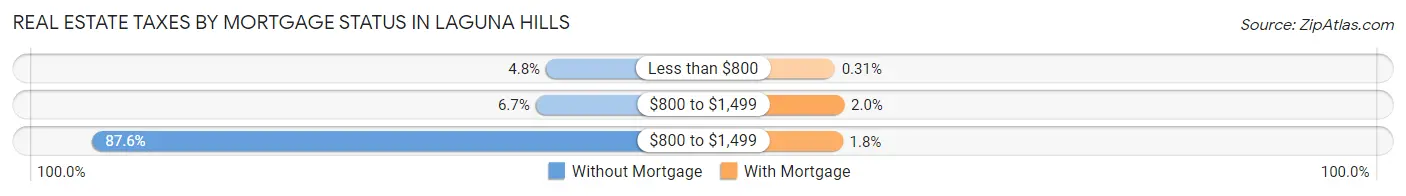
| Property Taxes | Without Mortgage | With Mortgage |
| Less than $800 | 113 (4.8%) | 18 (0.3%) |
| $800 to $1,499 | 158 (6.7%) | 117 (2.0%) |
| $800 to $1,499 | 2,072 (87.6%) | 101 (1.8%) |
| Total | 2,365 (100.0%) | 5,784 (100.0%) |
Health & Disability in Laguna Hills
Health Insurance Coverage by Age in Laguna Hills
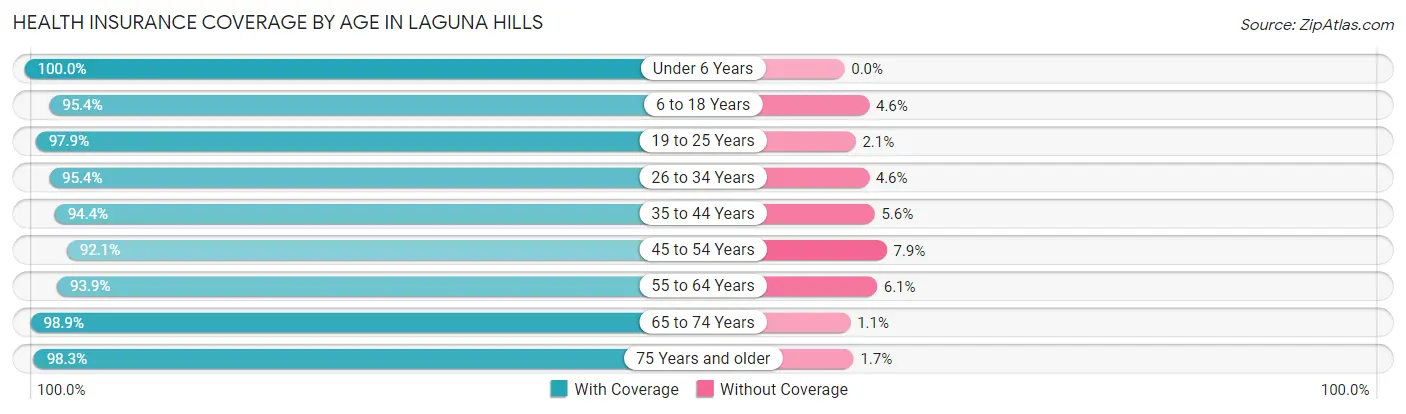
| Age Bracket | With Coverage | Without Coverage |
| Under 6 Years | 1,322 (100.0%) | 0 (0.0%) |
| 6 to 18 Years | 4,576 (95.4%) | 221 (4.6%) |
| 19 to 25 Years | 2,123 (97.9%) | 45 (2.1%) |
| 26 to 34 Years | 3,721 (95.4%) | 178 (4.6%) |
| 35 to 44 Years | 3,560 (94.4%) | 212 (5.6%) |
| 45 to 54 Years | 4,501 (92.1%) | 385 (7.9%) |
| 55 to 64 Years | 3,845 (93.9%) | 248 (6.1%) |
| 65 to 74 Years | 3,581 (98.9%) | 40 (1.1%) |
| 75 Years and older | 2,295 (98.3%) | 40 (1.7%) |
| Total | 29,524 (95.6%) | 1,369 (4.4%) |
Health Insurance Coverage by Citizenship Status in Laguna Hills

| Citizenship Status | With Coverage | Without Coverage |
| Native Born | 1,322 (100.0%) | 0 (0.0%) |
| Foreign Born, Citizen | 4,576 (95.4%) | 221 (4.6%) |
| Foreign Born, not a Citizen | 2,123 (97.9%) | 45 (2.1%) |
Health Insurance Coverage by Household Income in Laguna Hills
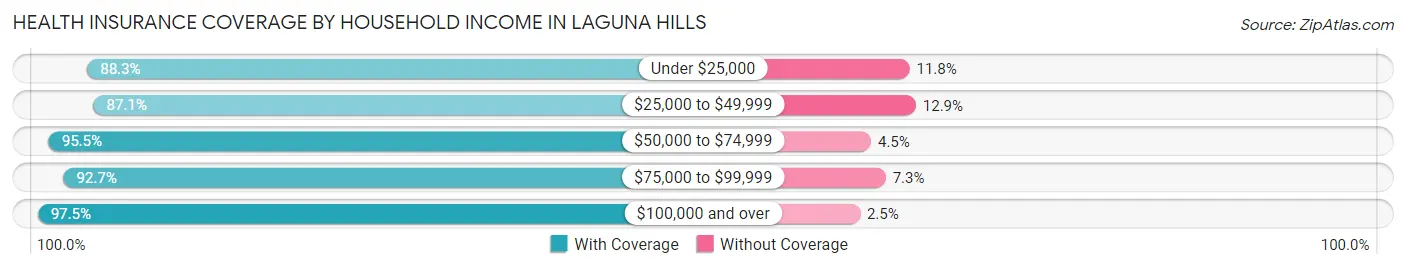
| Household Income | With Coverage | Without Coverage |
| Under $25,000 | 1,742 (88.2%) | 232 (11.7%) |
| $25,000 to $49,999 | 1,836 (87.1%) | 273 (12.9%) |
| $50,000 to $74,999 | 2,500 (95.5%) | 119 (4.5%) |
| $75,000 to $99,999 | 2,810 (92.7%) | 221 (7.3%) |
| $100,000 and over | 20,297 (97.5%) | 513 (2.5%) |
Public vs Private Health Insurance Coverage by Age in Laguna Hills
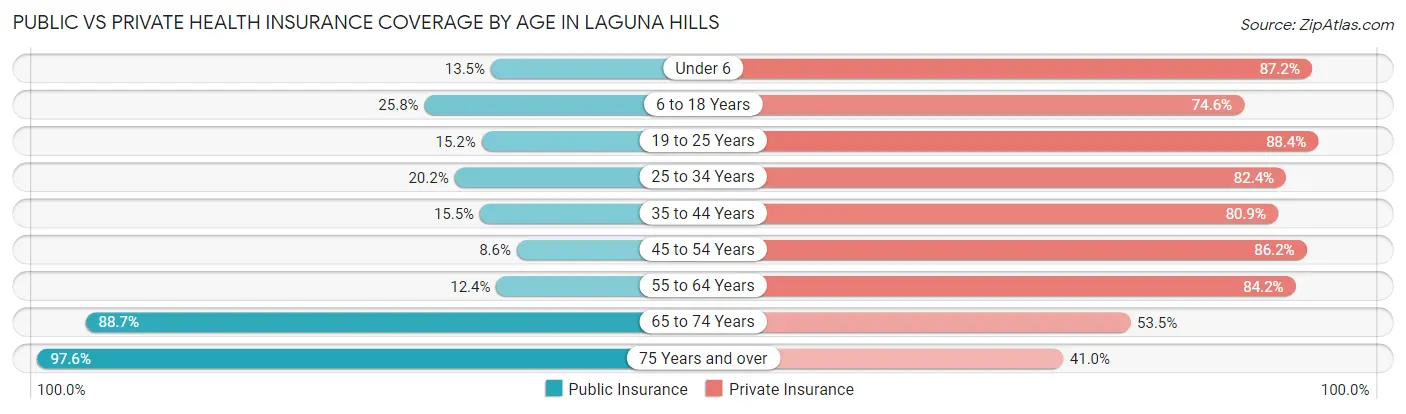
| Age Bracket | Public Insurance | Private Insurance |
| Under 6 | 178 (13.5%) | 1,153 (87.2%) |
| 6 to 18 Years | 1,237 (25.8%) | 3,580 (74.6%) |
| 19 to 25 Years | 329 (15.2%) | 1,917 (88.4%) |
| 25 to 34 Years | 788 (20.2%) | 3,214 (82.4%) |
| 35 to 44 Years | 584 (15.5%) | 3,052 (80.9%) |
| 45 to 54 Years | 422 (8.6%) | 4,213 (86.2%) |
| 55 to 64 Years | 509 (12.4%) | 3,446 (84.2%) |
| 65 to 74 Years | 3,211 (88.7%) | 1,938 (53.5%) |
| 75 Years and over | 2,279 (97.6%) | 958 (41.0%) |
| Total | 9,537 (30.9%) | 23,471 (76.0%) |
Disability Status by Sex by Age in Laguna Hills
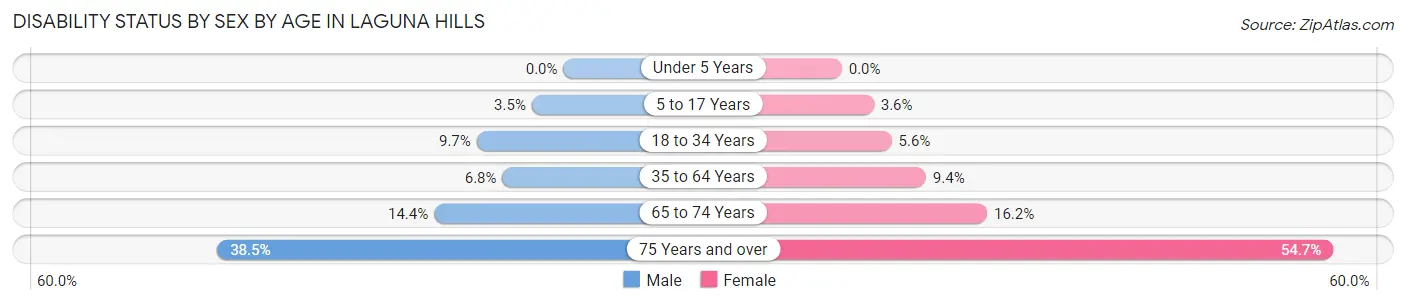
| Age Bracket | Male | Female |
| Under 5 Years | 0 (0.0%) | 0 (0.0%) |
| 5 to 17 Years | 92 (3.5%) | 75 (3.6%) |
| 18 to 34 Years | 323 (9.7%) | 167 (5.6%) |
| 35 to 64 Years | 404 (6.8%) | 637 (9.4%) |
| 65 to 74 Years | 242 (14.4%) | 314 (16.2%) |
| 75 Years and over | 380 (38.5%) | 738 (54.7%) |
Disability Class by Sex by Age in Laguna Hills
Disability Class: Hearing Difficulty
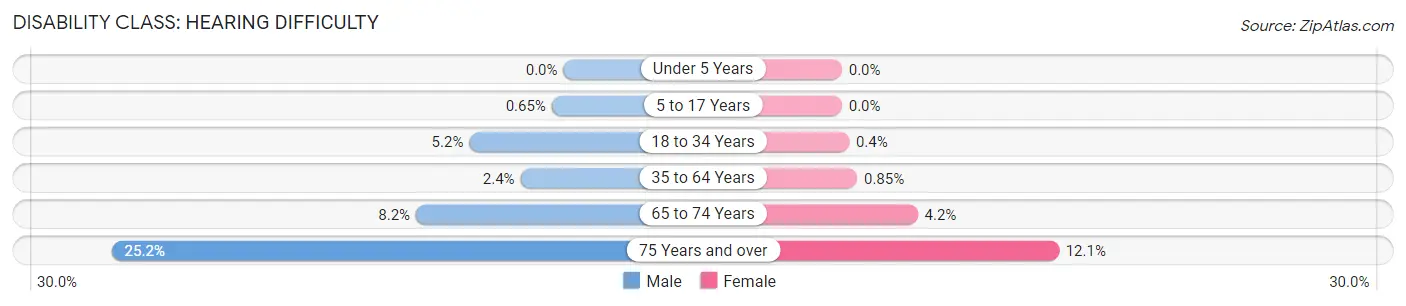
| Age Bracket | Male | Female |
| Under 5 Years | 0 (0.0%) | 0 (0.0%) |
| 5 to 17 Years | 17 (0.6%) | 0 (0.0%) |
| 18 to 34 Years | 175 (5.2%) | 12 (0.4%) |
| 35 to 64 Years | 142 (2.4%) | 58 (0.9%) |
| 65 to 74 Years | 138 (8.2%) | 82 (4.2%) |
| 75 Years and over | 248 (25.2%) | 163 (12.1%) |
Disability Class: Vision Difficulty
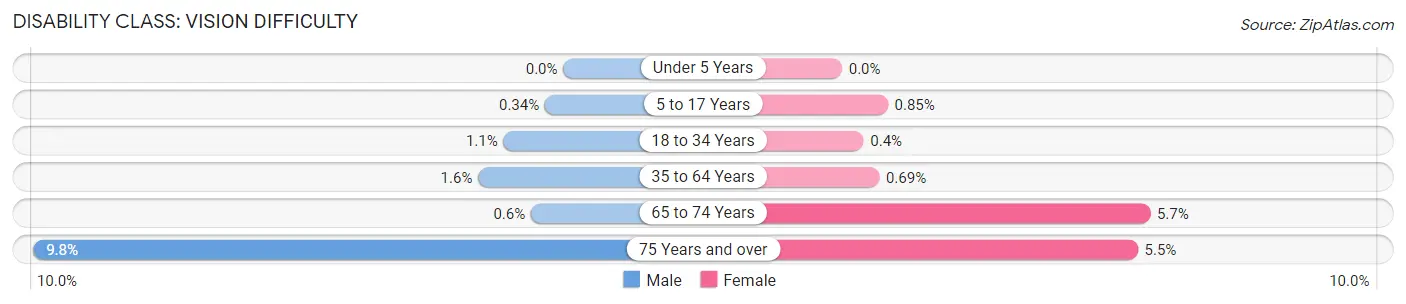
| Age Bracket | Male | Female |
| Under 5 Years | 0 (0.0%) | 0 (0.0%) |
| 5 to 17 Years | 9 (0.3%) | 18 (0.9%) |
| 18 to 34 Years | 37 (1.1%) | 12 (0.4%) |
| 35 to 64 Years | 94 (1.6%) | 47 (0.7%) |
| 65 to 74 Years | 10 (0.6%) | 111 (5.7%) |
| 75 Years and over | 97 (9.8%) | 74 (5.5%) |
Disability Class: Cognitive Difficulty
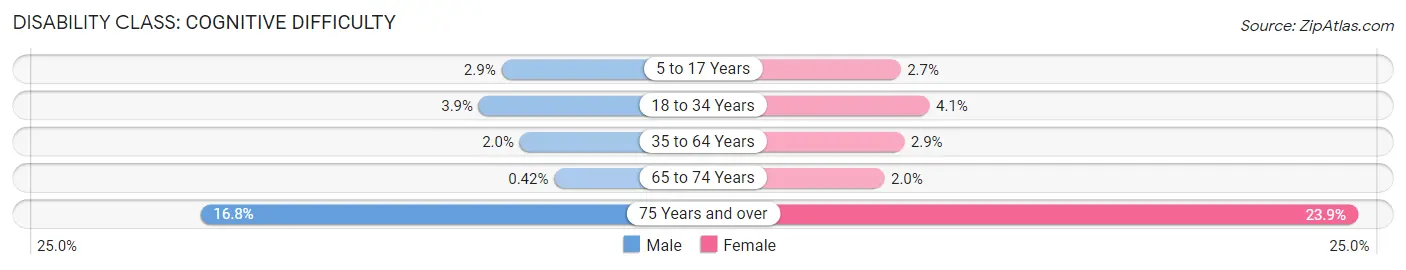
| Age Bracket | Male | Female |
| 5 to 17 Years | 75 (2.9%) | 57 (2.7%) |
| 18 to 34 Years | 131 (3.9%) | 122 (4.1%) |
| 35 to 64 Years | 120 (2.0%) | 196 (2.9%) |
| 65 to 74 Years | 7 (0.4%) | 38 (2.0%) |
| 75 Years and over | 166 (16.8%) | 323 (23.9%) |
Disability Class: Ambulatory Difficulty
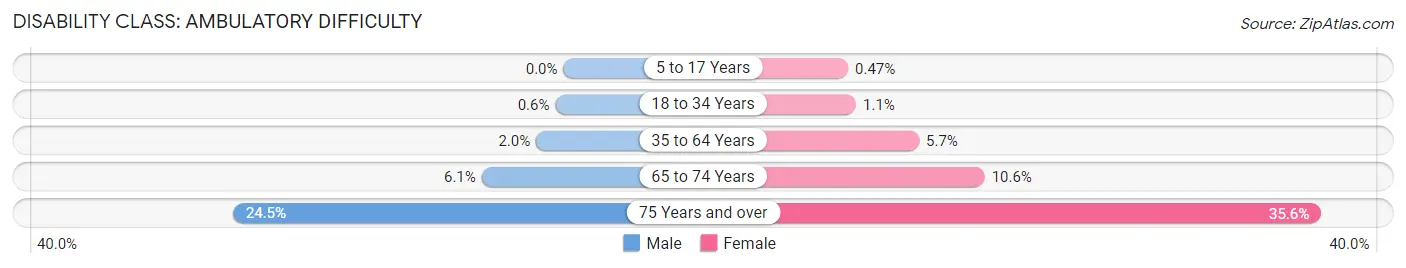
| Age Bracket | Male | Female |
| 5 to 17 Years | 0 (0.0%) | 10 (0.5%) |
| 18 to 34 Years | 20 (0.6%) | 32 (1.1%) |
| 35 to 64 Years | 121 (2.0%) | 390 (5.7%) |
| 65 to 74 Years | 102 (6.1%) | 206 (10.6%) |
| 75 Years and over | 242 (24.5%) | 480 (35.6%) |
Disability Class: Self-Care Difficulty
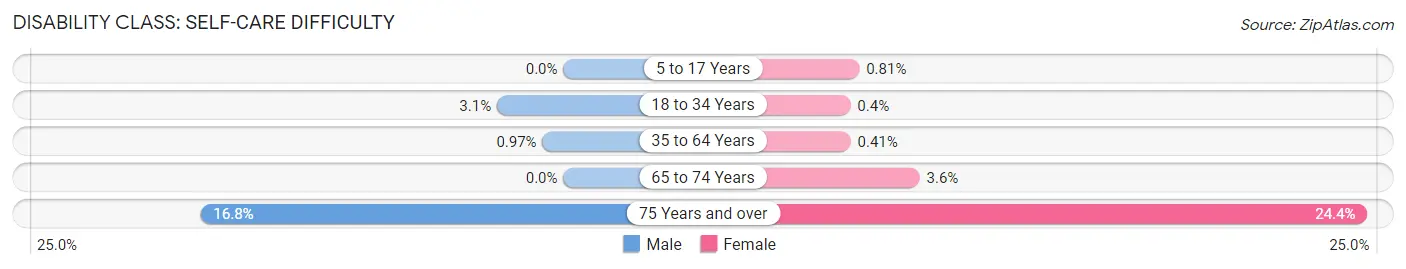
| Age Bracket | Male | Female |
| 5 to 17 Years | 0 (0.0%) | 17 (0.8%) |
| 18 to 34 Years | 103 (3.1%) | 12 (0.4%) |
| 35 to 64 Years | 58 (1.0%) | 28 (0.4%) |
| 65 to 74 Years | 0 (0.0%) | 70 (3.6%) |
| 75 Years and over | 166 (16.8%) | 329 (24.4%) |
Technology Access in Laguna Hills
Computing Device Access in Laguna Hills
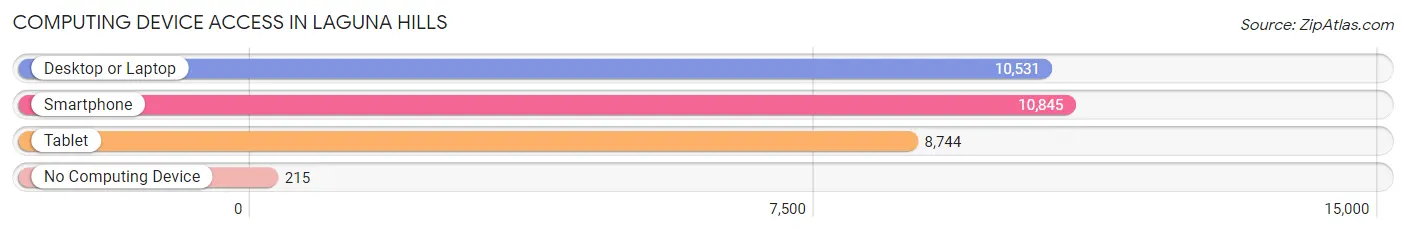
| Device Type | # Households | % Households |
| Desktop or Laptop | 10,531 | 91.4% |
| Smartphone | 10,845 | 94.1% |
| Tablet | 8,744 | 75.9% |
| No Computing Device | 215 | 1.9% |
| Total | 11,525 | 100.0% |
Internet Access in Laguna Hills
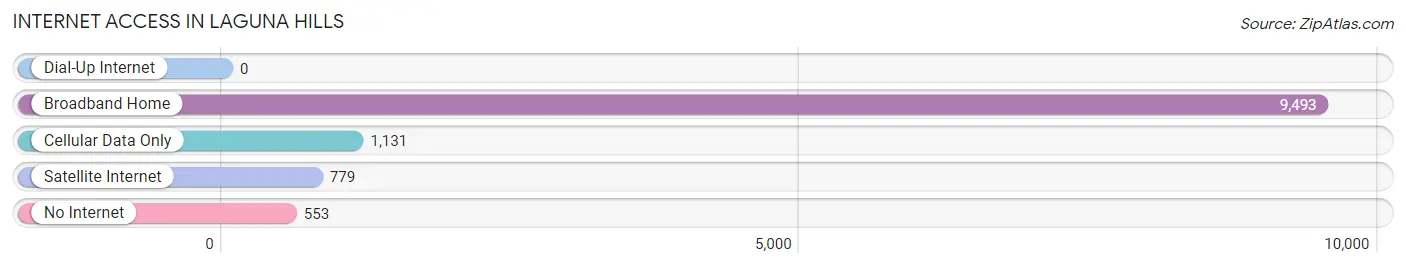
| Internet Type | # Households | % Households |
| Dial-Up Internet | 0 | 0.0% |
| Broadband Home | 9,493 | 82.4% |
| Cellular Data Only | 1,131 | 9.8% |
| Satellite Internet | 779 | 6.8% |
| No Internet | 553 | 4.8% |
| Total | 11,525 | 100.0% |
Laguna Hills Summary
Laguna Hills is a city located in Orange County, California, United States. The city is situated in the San Joaquin Hills, and is bordered by the cities of Aliso Viejo, Laguna Niguel, Laguna Beach, Mission Viejo, and Lake Forest. The population of Laguna Hills was 30,344 at the 2010 census, up from 28,958 at the 2000 census.
Geography
Laguna Hills is located at 33°35'25" North, 117°41'45" West (33.590278, -117.695833). According to the United States Census Bureau, the city has a total area of 6.7 square miles (17.4 km2), all of it land.
The city is built on one of the major land grants developed during the Rancho Era. The land grant was called Rancho Lomas de Santiago de Santa Ana. The city is located on the eastern slopes of the San Joaquin Hills, which are part of the larger Santa Ana Mountains. The city is built on seven hills or knolls: North, Middle, South, West, East, Saddleback, and Serrano.
Climate
Laguna Hills has a Mediterranean climate, with warm, dry summers and mild, wet winters. The average annual temperature is 64.4°F (18°C). The average annual precipitation is 17.2 inches (437 mm).
Demographics
As of the census of 2000, there were 28,958 people, 10,890 households, and 7,845 families residing in the city. The population density was 4,542.2 people per square mile (1,753.7/km2). There were 11,149 housing units at an average density of 1,694.3 per square mile (653.2/km2). The racial makeup of the city was 78.45% White, 1.37% African American, 0.27% Native American, 8.22% Asian, 0.08% Pacific Islander, 7.53% from other races, and 3.48% from two or more races. Hispanic or Latino of any race were 19.77% of the population.
Economy
Laguna Hills is home to a variety of businesses, including technology, retail, and medical. The city is home to the headquarters of several companies, including Allergan, Inc., a pharmaceutical company, and the Irvine Company, a real estate development company.
The city is also home to the Laguna Hills Mall, which is anchored by Macy's, JCPenney, and Sears. The mall also features a variety of specialty stores, restaurants, and a movie theater.
Education
Laguna Hills is served by the Saddleback Valley Unified School District. The district operates several elementary schools, two middle schools, and two high schools. The city is also home to several private schools, including St. Mary's School, a Catholic school, and Laguna Hills High School, a public charter school.
Transportation
Laguna Hills is served by the Orange County Transportation Authority (OCTA). The city is served by several bus routes, as well as the Laguna Hills Metrolink station, which provides service to Los Angeles and San Diego. The city is also served by the I-5 freeway, which runs through the city.
Conclusion
Laguna Hills is a city located in Orange County, California, United States. The city is situated in the San Joaquin Hills, and is bordered by the cities of Aliso Viejo, Laguna Niguel, Laguna Beach, Mission Viejo, and Lake Forest. The population of Laguna Hills was 30,344 at the 2010 census, up from 28,958 at the 2000 census. The city is home to a variety of businesses, including technology, retail, and medical. The city is served by the Orange County Transportation Authority (OCTA), and is also served by the I-5 freeway, which runs through the city. Laguna Hills is served by the Saddleback Valley Unified School District, and is also home to several private schools.
Common Questions
What is Per Capita Income in Laguna Hills?
Per Capita income in Laguna Hills is $64,750.
What is the Median Family Income in Laguna Hills?
Median Family Income in Laguna Hills is $145,202.
What is the Median Household income in Laguna Hills?
Median Household Income in Laguna Hills is $122,902.
What is Income or Wage Gap in Laguna Hills?
Income or Wage Gap in Laguna Hills is 24.8%.
Women in Laguna Hills earn 75.2 cents for every dollar earned by a man.
What is Family Income Deficit in Laguna Hills?
Family Income Deficit in Laguna Hills is $8,728.
Families that are below poverty line in Laguna Hills earn $8,728 less on average than the poverty threshold level.
What is Inequality or Gini Index in Laguna Hills?
Inequality or Gini Index in Laguna Hills is 0.49.
What is the Total Population of Laguna Hills?
Total Population of Laguna Hills is 31,170.
What is the Total Male Population of Laguna Hills?
Total Male Population of Laguna Hills is 15,168.
What is the Total Female Population of Laguna Hills?
Total Female Population of Laguna Hills is 16,002.
What is the Ratio of Males per 100 Females in Laguna Hills?
There are 94.79 Males per 100 Females in Laguna Hills.
What is the Ratio of Females per 100 Males in Laguna Hills?
There are 105.50 Females per 100 Males in Laguna Hills.
What is the Median Population Age in Laguna Hills?
Median Population Age in Laguna Hills is 43.8 Years.
What is the Average Family Size in Laguna Hills
Average Family Size in Laguna Hills is 3.2 People.
What is the Average Household Size in Laguna Hills
Average Household Size in Laguna Hills is 2.6 People.
How Large is the Labor Force in Laguna Hills?
There are 17,063 People in the Labor Forcein in Laguna Hills.
What is the Percentage of People in the Labor Force in Laguna Hills?
65.8% of People are in the Labor Force in Laguna Hills.
What is the Unemployment Rate in Laguna Hills?
Unemployment Rate in Laguna Hills is 5.0%.