Decorah, IA Map & Demographics
Decorah Map
Decorah Overview
$31,226
PER CAPITA INCOME
$79,300
AVG FAMILY INCOME
$57,939
AVG HOUSEHOLD INCOME
41.9%
WAGE / INCOME GAP [ % ]
58.1¢/ $1
WAGE / INCOME GAP [ $ ]
0.45
INEQUALITY / GINI INDEX
7,611
TOTAL POPULATION
3,658
MALE POPULATION
3,953
FEMALE POPULATION
92.54
MALES / 100 FEMALES
108.06
FEMALES / 100 MALES
34.8
MEDIAN AGE
2.6
AVG FAMILY SIZE
2.0
AVG HOUSEHOLD SIZE
4,174
LABOR FORCE [ PEOPLE ]
62.5%
PERCENT IN LABOR FORCE
3.3%
UNEMPLOYMENT RATE
Decorah Zip Codes
Decorah Area Codes
Income in Decorah
Income Overview in Decorah
Per Capita Income in Decorah is $31,226, while median incomes of families and households are $79,300 and $57,939 respectively.
| Characteristic | Number | Measure |
| Per Capita Income | 7,611 | $31,226 |
| Median Family Income | 1,564 | $79,300 |
| Mean Family Income | 1,564 | $103,673 |
| Median Household Income | 2,827 | $57,939 |
| Mean Household Income | 2,827 | $80,659 |
| Income Deficit | 1,564 | $0 |
| Wage / Income Gap (%) | 7,611 | 41.94% |
| Wage / Income Gap ($) | 7,611 | 58.06¢ per $1 |
| Gini / Inequality Index | 7,611 | 0.45 |
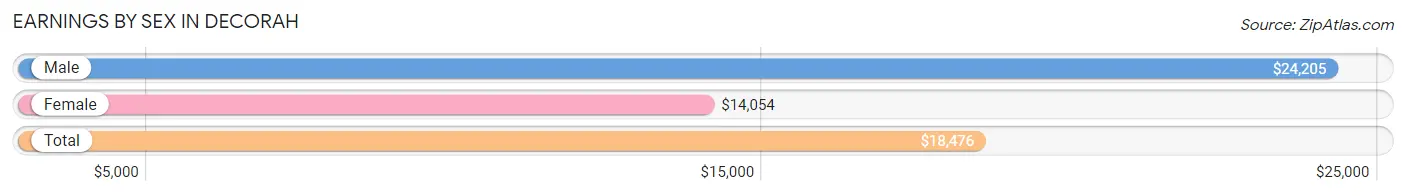
Earnings by Sex in Decorah
Average Earnings in Decorah are $18,476, $24,205 for men and $14,054 for women, a difference of 41.9%.
| Sex | Number | Average Earnings |
| Male | 2,293 (47.4%) | $24,205 |
| Female | 2,544 (52.6%) | $14,054 |
| Total | 4,837 (100.0%) | $18,476 |
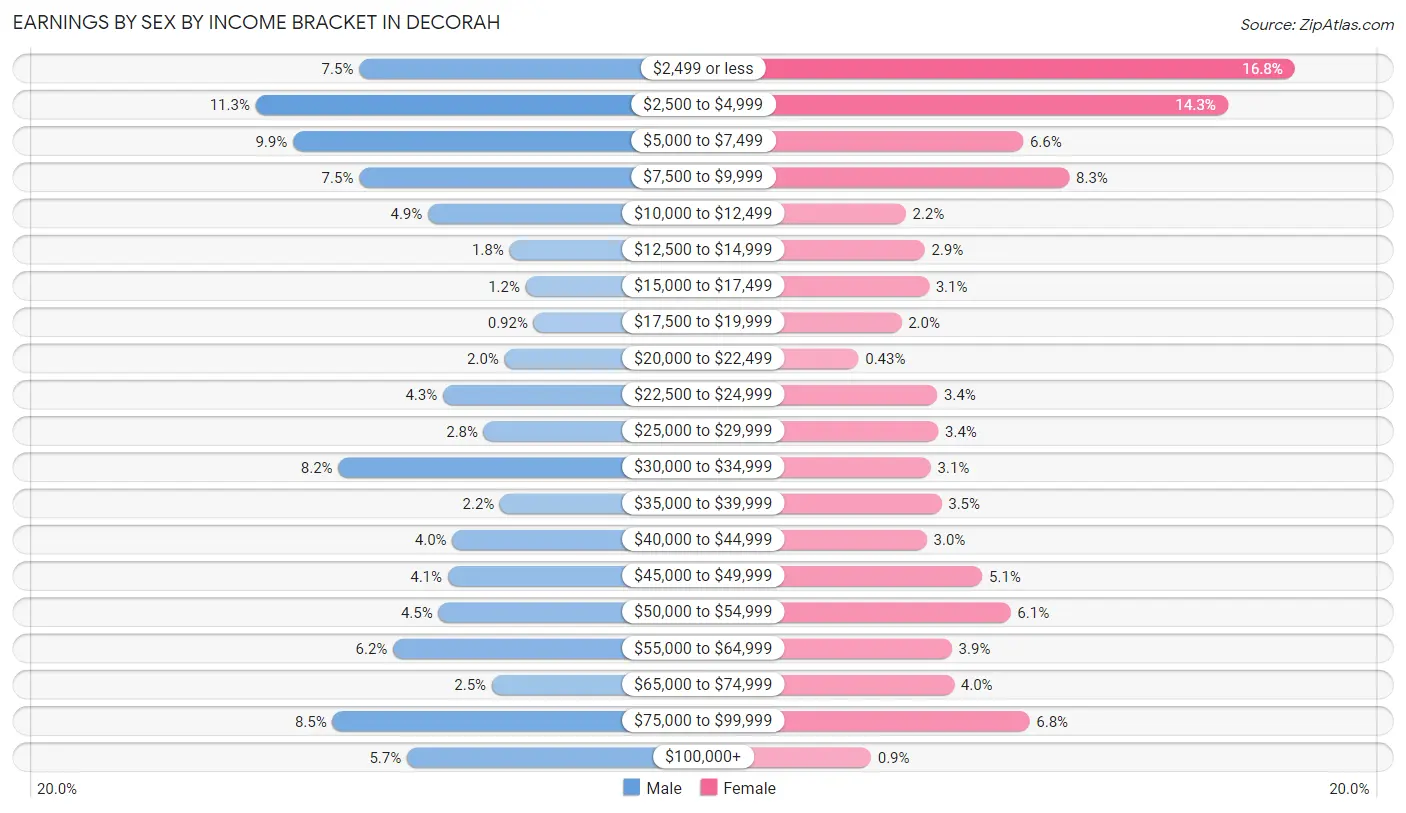
Earnings by Sex by Income Bracket in Decorah
The most common earnings brackets in Decorah are $2,500 to $4,999 for men (260 | 11.3%) and $2,499 or less for women (427 | 16.8%).
| Income | Male | Female |
| $2,499 or less | 171 (7.5%) | 427 (16.8%) |
| $2,500 to $4,999 | 260 (11.3%) | 363 (14.3%) |
| $5,000 to $7,499 | 228 (9.9%) | 168 (6.6%) |
| $7,500 to $9,999 | 171 (7.5%) | 212 (8.3%) |
| $10,000 to $12,499 | 112 (4.9%) | 56 (2.2%) |
| $12,500 to $14,999 | 42 (1.8%) | 74 (2.9%) |
| $15,000 to $17,499 | 28 (1.2%) | 78 (3.1%) |
| $17,500 to $19,999 | 21 (0.9%) | 52 (2.0%) |
| $20,000 to $22,499 | 46 (2.0%) | 11 (0.4%) |
| $22,500 to $24,999 | 99 (4.3%) | 86 (3.4%) |
| $25,000 to $29,999 | 64 (2.8%) | 87 (3.4%) |
| $30,000 to $34,999 | 189 (8.2%) | 80 (3.1%) |
| $35,000 to $39,999 | 50 (2.2%) | 90 (3.5%) |
| $40,000 to $44,999 | 91 (4.0%) | 76 (3.0%) |
| $45,000 to $49,999 | 95 (4.1%) | 129 (5.1%) |
| $50,000 to $54,999 | 103 (4.5%) | 156 (6.1%) |
| $55,000 to $64,999 | 142 (6.2%) | 100 (3.9%) |
| $65,000 to $74,999 | 57 (2.5%) | 102 (4.0%) |
| $75,000 to $99,999 | 194 (8.5%) | 174 (6.8%) |
| $100,000+ | 130 (5.7%) | 23 (0.9%) |
| Total | 2,293 (100.0%) | 2,544 (100.0%) |
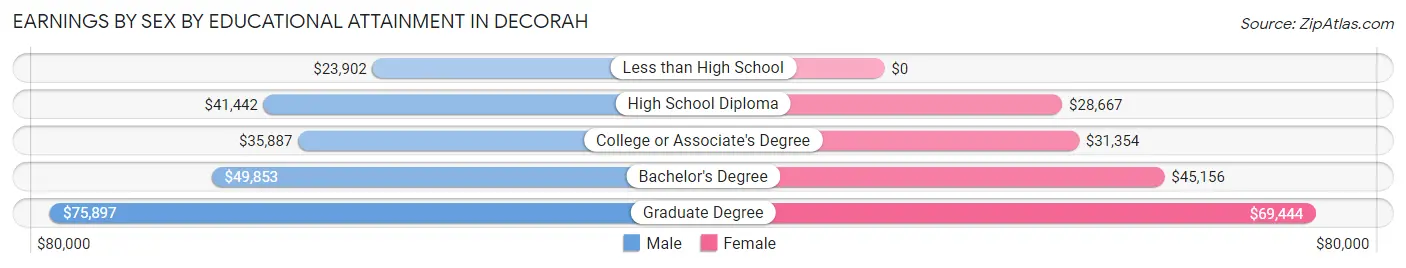
Earnings by Sex by Educational Attainment in Decorah
Average earnings in Decorah are $43,712 for men and $44,107 for women, a difference of 0.9%. Men with an educational attainment of graduate degree enjoy the highest average annual earnings of $75,897, while those with less than high school education earn the least with $23,902. Women with an educational attainment of graduate degree earn the most with the average annual earnings of $69,444, while those with high school diploma education have the smallest earnings of $28,667.
| Educational Attainment | Male Income | Female Income |
| Less than High School | $23,902 | $0 |
| High School Diploma | $41,442 | $28,667 |
| College or Associate's Degree | $35,887 | $31,354 |
| Bachelor's Degree | $49,853 | $45,156 |
| Graduate Degree | $75,897 | $69,444 |
| Total | $43,712 | $44,107 |
Family Income in Decorah
Family Income Brackets in Decorah
According to the Decorah family income data, there are 361 families falling into the $100,000 to $149,999 income range, which is the most common income bracket and makes up 23.1% of all families. Conversely, the less than $10,000 income bracket is the least frequent group with only 5 families (0.3%) belonging to this category.
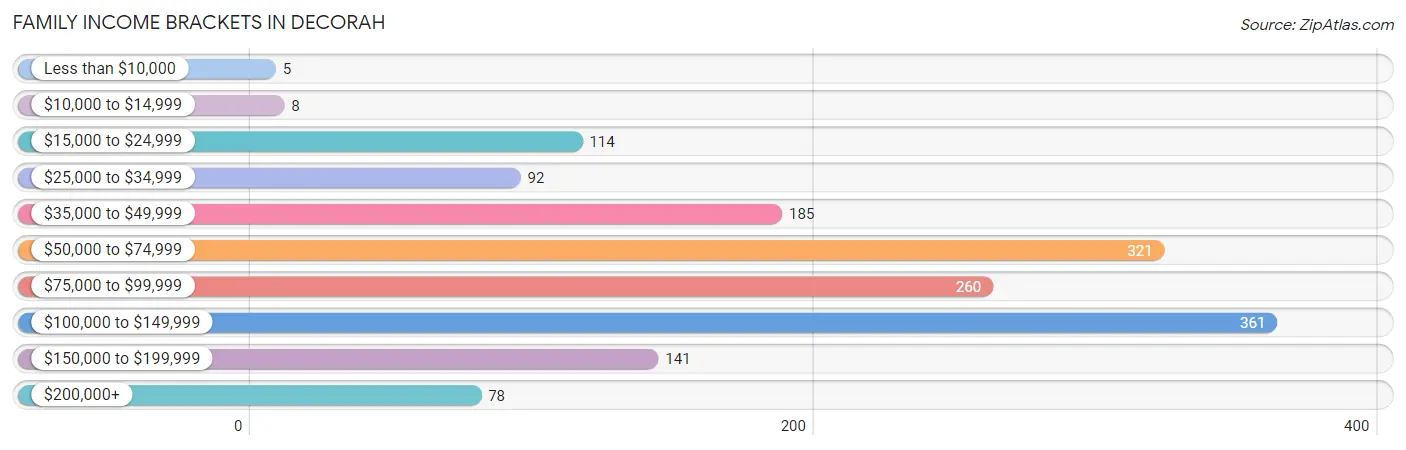
| Income Bracket | # Families | % Families |
| Less than $10,000 | 5 | 0.3% |
| $10,000 to $14,999 | 8 | 0.5% |
| $15,000 to $24,999 | 114 | 7.3% |
| $25,000 to $34,999 | 92 | 5.9% |
| $35,000 to $49,999 | 185 | 11.8% |
| $50,000 to $74,999 | 321 | 20.5% |
| $75,000 to $99,999 | 260 | 16.6% |
| $100,000 to $149,999 | 361 | 23.1% |
| $150,000 to $199,999 | 141 | 9.0% |
| $200,000+ | 78 | 5.0% |
Family Income by Famaliy Size in Decorah
3-person families (230 | 14.7%) account for the highest median family income in Decorah with $100,500 per family, while 2-person families (1,018 | 65.1%) have the highest median income of $35,656 per family member.
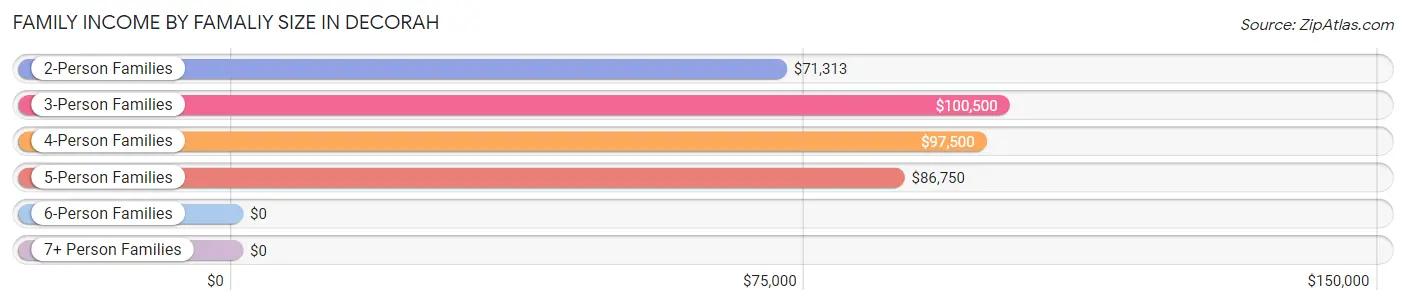
| Income Bracket | # Families | Median Income |
| 2-Person Families | 1,018 (65.1%) | $71,313 |
| 3-Person Families | 230 (14.7%) | $100,500 |
| 4-Person Families | 154 (9.9%) | $97,500 |
| 5-Person Families | 162 (10.4%) | $86,750 |
| 6-Person Families | 0 (0.0%) | $0 |
| 7+ Person Families | 0 (0.0%) | $0 |
| Total | 1,564 (100.0%) | $79,300 |
Family Income by Number of Earners in Decorah
The median family income in Decorah is $79,300, with families comprising 3+ earners (114) having the highest median family income of $111,466, while families with 1 earner (314) have the lowest median family income of $53,068, accounting for 7.3% and 20.1% of families, respectively.
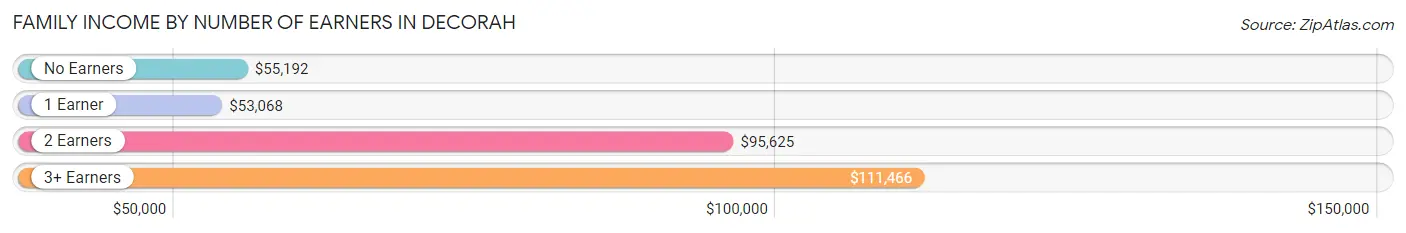
| Number of Earners | # Families | Median Income |
| No Earners | 352 (22.5%) | $55,192 |
| 1 Earner | 314 (20.1%) | $53,068 |
| 2 Earners | 784 (50.1%) | $95,625 |
| 3+ Earners | 114 (7.3%) | $111,466 |
| Total | 1,564 (100.0%) | $79,300 |
Household Income in Decorah
Household Income Brackets in Decorah
With 546 households falling in the category, the $50,000 to $74,999 income range is the most frequent in Decorah, accounting for 19.3% of all households. In contrast, only 45 households (1.6%) fall into the less than $10,000 income bracket, making it the least populous group.
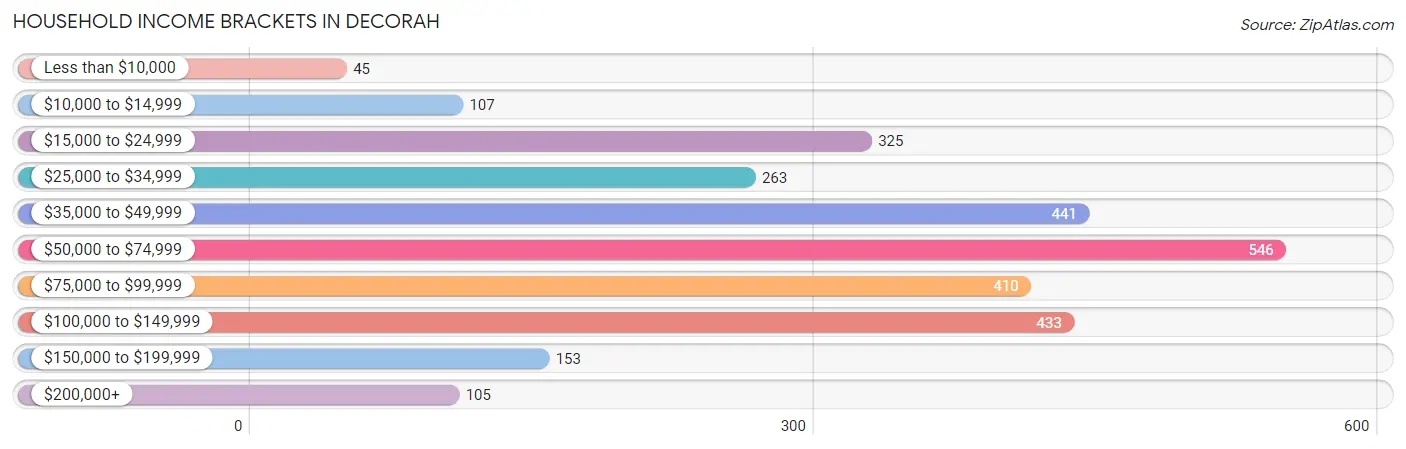
| Income Bracket | # Households | % Households |
| Less than $10,000 | 45 | 1.6% |
| $10,000 to $14,999 | 107 | 3.8% |
| $15,000 to $24,999 | 325 | 11.5% |
| $25,000 to $34,999 | 263 | 9.3% |
| $35,000 to $49,999 | 441 | 15.6% |
| $50,000 to $74,999 | 546 | 19.3% |
| $75,000 to $99,999 | 410 | 14.5% |
| $100,000 to $149,999 | 433 | 15.3% |
| $150,000 to $199,999 | 153 | 5.4% |
| $200,000+ | 105 | 3.7% |
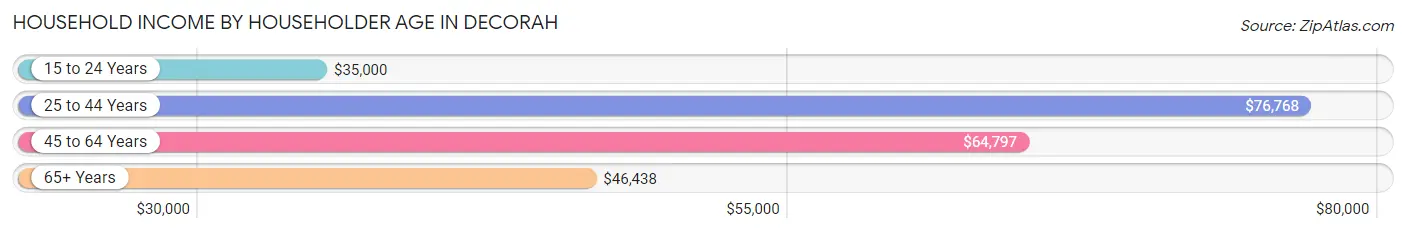
Household Income by Householder Age in Decorah
The median household income in Decorah is $57,939, with the highest median household income of $76,768 found in the 25 to 44 years age bracket for the primary householder. A total of 850 households (30.1%) fall into this category. Meanwhile, the 15 to 24 years age bracket for the primary householder has the lowest median household income of $35,000, with 86 households (3.0%) in this group.
| Income Bracket | # Households | Median Income |
| 15 to 24 Years | 86 (3.0%) | $35,000 |
| 25 to 44 Years | 850 (30.1%) | $76,768 |
| 45 to 64 Years | 770 (27.2%) | $64,797 |
| 65+ Years | 1,121 (39.7%) | $46,438 |
| Total | 2,827 (100.0%) | $57,939 |
Poverty in Decorah
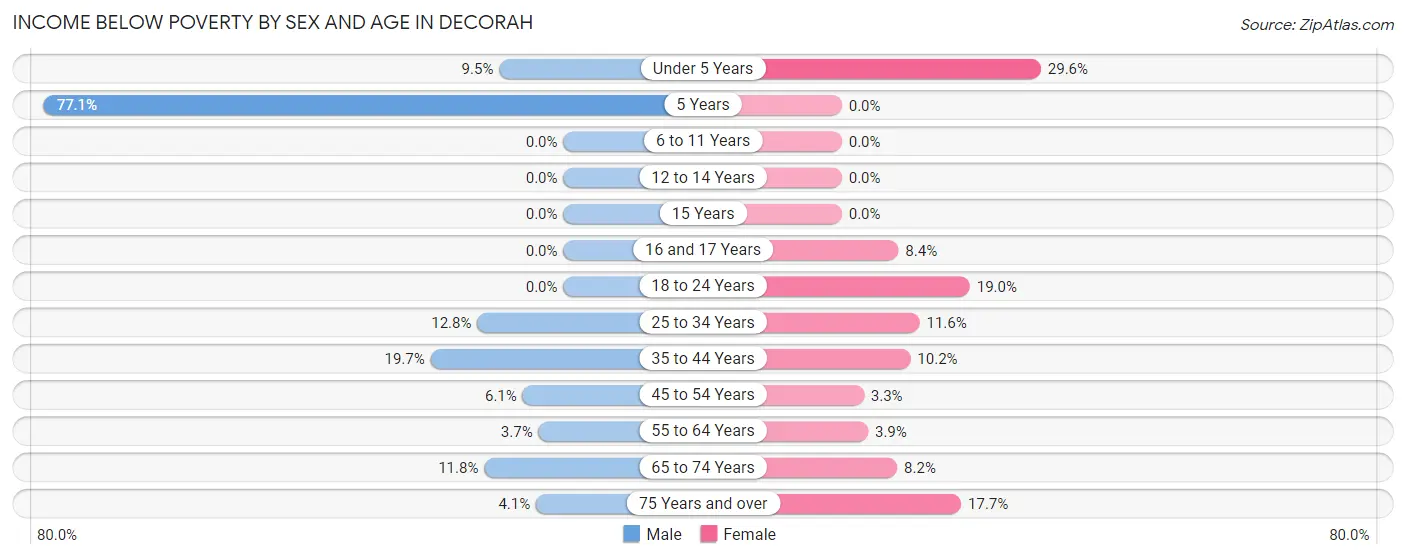
Income Below Poverty by Sex and Age in Decorah
With 9.1% poverty level for males and 10.4% for females among the residents of Decorah, 5 year old males and under 5 year old females are the most vulnerable to poverty, with 27 males (77.1%) and 47 females (29.6%) in their respective age groups living below the poverty level.
| Age Bracket | Male | Female |
| Under 5 Years | 12 (9.5%) | 47 (29.6%) |
| 5 Years | 27 (77.1%) | 0 (0.0%) |
| 6 to 11 Years | 0 (0.0%) | 0 (0.0%) |
| 12 to 14 Years | 0 (0.0%) | 0 (0.0%) |
| 15 Years | 0 (0.0%) | 0 (0.0%) |
| 16 and 17 Years | 0 (0.0%) | 9 (8.4%) |
| 18 to 24 Years | 0 (0.0%) | 27 (19.0%) |
| 25 to 34 Years | 45 (12.8%) | 41 (11.6%) |
| 35 to 44 Years | 70 (19.7%) | 33 (10.2%) |
| 45 to 54 Years | 21 (6.0%) | 10 (3.3%) |
| 55 to 64 Years | 11 (3.7%) | 13 (3.9%) |
| 65 to 74 Years | 51 (11.7%) | 43 (8.2%) |
| 75 Years and over | 14 (4.1%) | 70 (17.7%) |
| Total | 251 (9.1%) | 293 (10.4%) |
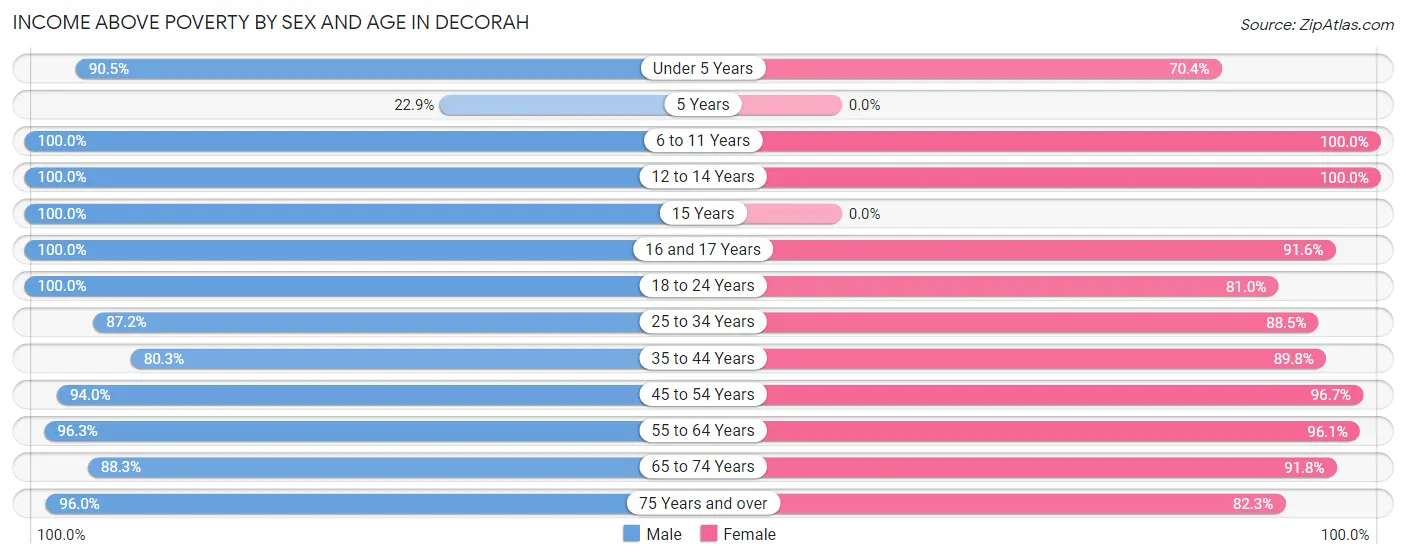
Income Above Poverty by Sex and Age in Decorah
According to the poverty statistics in Decorah, males aged 6 to 11 years and females aged 6 to 11 years are the age groups that are most secure financially, with 100.0% of males and 100.0% of females in these age groups living above the poverty line.
| Age Bracket | Male | Female |
| Under 5 Years | 114 (90.5%) | 112 (70.4%) |
| 5 Years | 8 (22.9%) | 0 (0.0%) |
| 6 to 11 Years | 183 (100.0%) | 126 (100.0%) |
| 12 to 14 Years | 114 (100.0%) | 41 (100.0%) |
| 15 Years | 61 (100.0%) | 0 (0.0%) |
| 16 and 17 Years | 10 (100.0%) | 98 (91.6%) |
| 18 to 24 Years | 108 (100.0%) | 115 (81.0%) |
| 25 to 34 Years | 307 (87.2%) | 314 (88.4%) |
| 35 to 44 Years | 285 (80.3%) | 291 (89.8%) |
| 45 to 54 Years | 326 (94.0%) | 295 (96.7%) |
| 55 to 64 Years | 287 (96.3%) | 320 (96.1%) |
| 65 to 74 Years | 383 (88.2%) | 480 (91.8%) |
| 75 Years and over | 332 (96.0%) | 325 (82.3%) |
| Total | 2,518 (90.9%) | 2,517 (89.6%) |
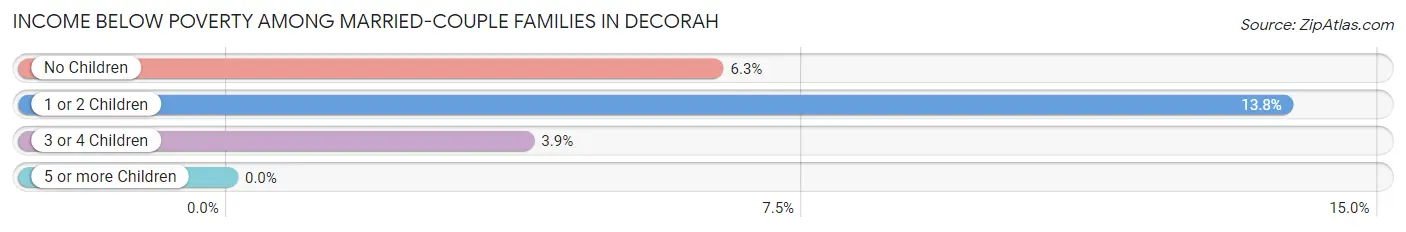
Income Below Poverty Among Married-Couple Families in Decorah
The poverty statistics for married-couple families in Decorah show that 7.7% or 100 of the total 1,306 families live below the poverty line. Families with 1 or 2 children have the highest poverty rate of 13.8%, comprising of 39 families. On the other hand, families with 3 or 4 children have the lowest poverty rate of 3.9%, which includes 6 families.
| Children | Above Poverty | Below Poverty |
| No Children | 813 (93.7%) | 55 (6.3%) |
| 1 or 2 Children | 244 (86.2%) | 39 (13.8%) |
| 3 or 4 Children | 149 (96.1%) | 6 (3.9%) |
| 5 or more Children | 0 (0.0%) | 0 (0.0%) |
| Total | 1,206 (92.3%) | 100 (7.7%) |
Income Below Poverty Among Single-Parent Households in Decorah
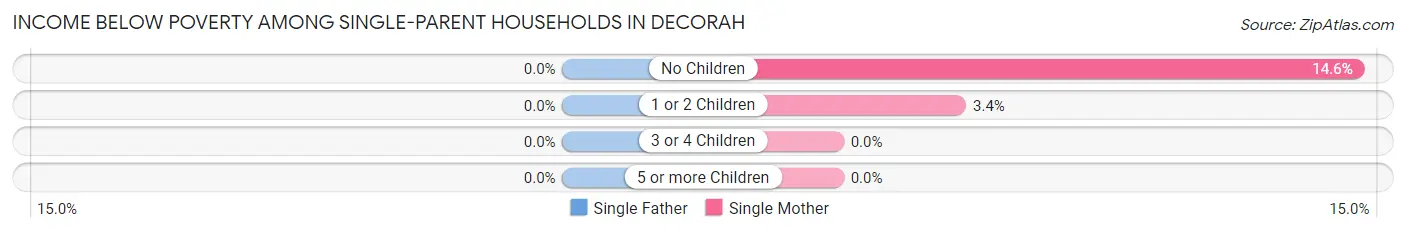
| Children | Single Father | Single Mother |
| No Children | 0 (0.0%) | 16 (14.5%) |
| 1 or 2 Children | 0 (0.0%) | 4 (3.4%) |
| 3 or 4 Children | 0 (0.0%) | 0 (0.0%) |
| 5 or more Children | 0 (0.0%) | 0 (0.0%) |
| Total | 0 (0.0%) | 20 (8.8%) |
Income Below Poverty Among Married-Couple vs Single-Parent Households in Decorah
The poverty data for Decorah shows that 100 of the married-couple family households (7.7%) and 20 of the single-parent households (7.7%) are living below the poverty level. Within the married-couple family households, those with 1 or 2 children have the highest poverty rate, with 39 households (13.8%) falling below the poverty line. Among the single-parent households, those with no children have the highest poverty rate, with 16 household (13.1%) living below poverty.
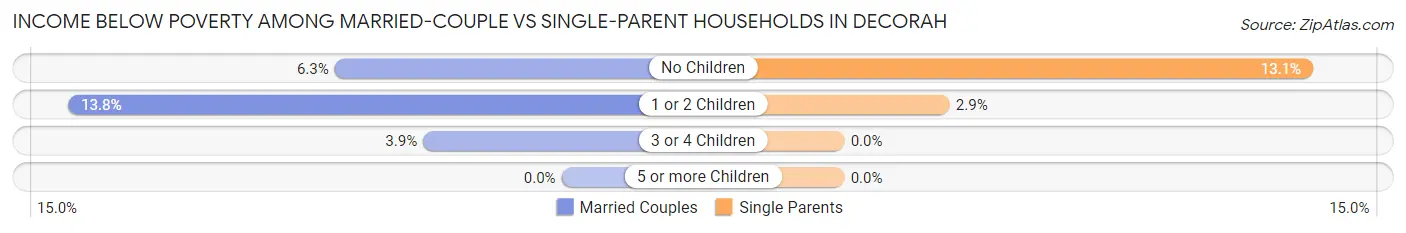
| Children | Married-Couple Families | Single-Parent Households |
| No Children | 55 (6.3%) | 16 (13.1%) |
| 1 or 2 Children | 39 (13.8%) | 4 (2.9%) |
| 3 or 4 Children | 6 (3.9%) | 0 (0.0%) |
| 5 or more Children | 0 (0.0%) | 0 (0.0%) |
| Total | 100 (7.7%) | 20 (7.7%) |
Race in Decorah
The most populous races in Decorah are White / Caucasian (7,194 | 94.5%), Hispanic or Latino (246 | 3.2%), and Two or more Races (187 | 2.5%).
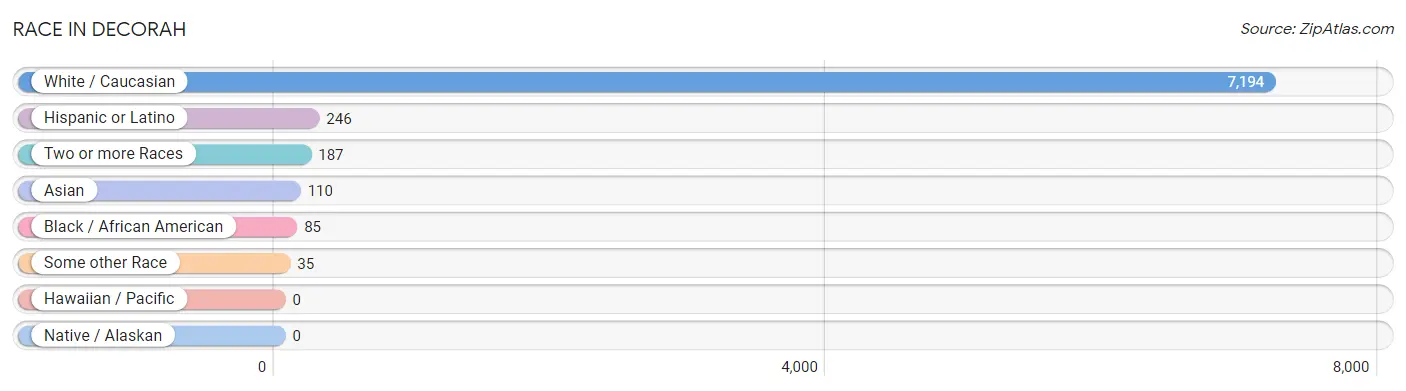
| Race | # Population | % Population |
| Asian | 110 | 1.5% |
| Black / African American | 85 | 1.1% |
| Hawaiian / Pacific | 0 | 0.0% |
| Hispanic or Latino | 246 | 3.2% |
| Native / Alaskan | 0 | 0.0% |
| White / Caucasian | 7,194 | 94.5% |
| Two or more Races | 187 | 2.5% |
| Some other Race | 35 | 0.5% |
| Total | 7,611 | 100.0% |
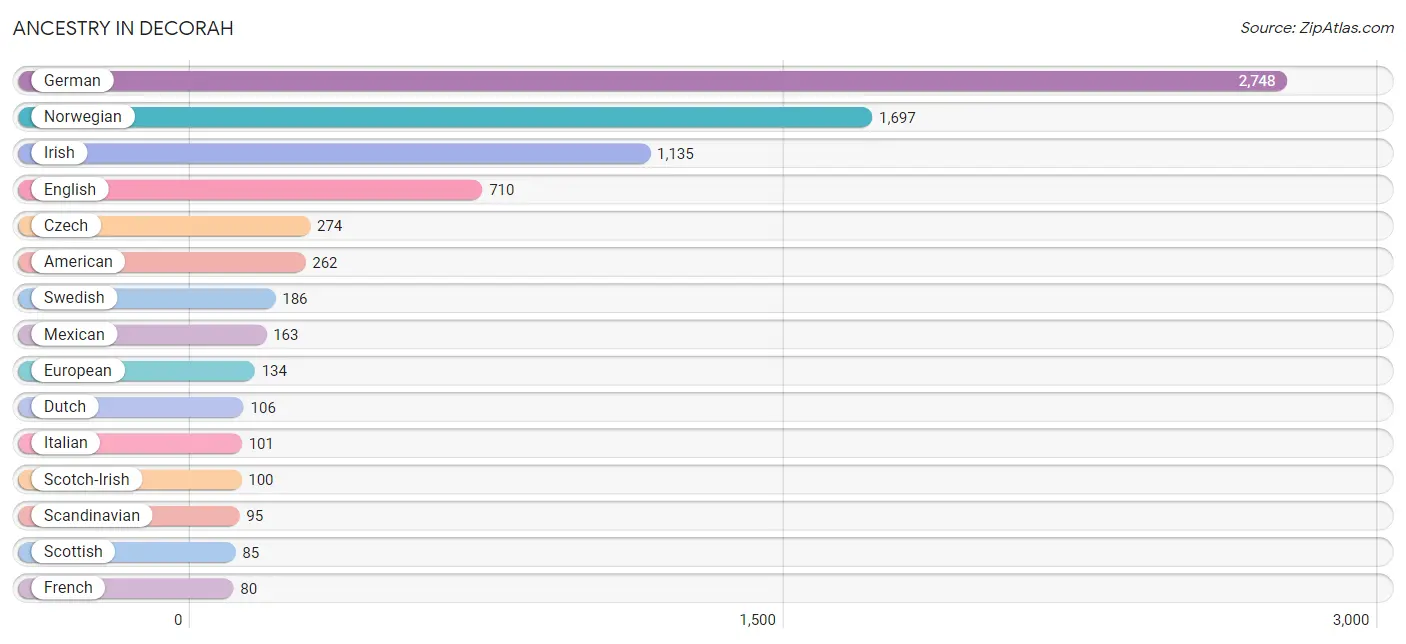
Ancestry in Decorah
The most populous ancestries reported in Decorah are German (2,748 | 36.1%), Norwegian (1,697 | 22.3%), Irish (1,135 | 14.9%), English (710 | 9.3%), and Czech (274 | 3.6%), together accounting for 86.3% of all Decorah residents.
| Ancestry | # Population | % Population |
| African | 7 | 0.1% |
| American | 262 | 3.4% |
| Arab | 11 | 0.1% |
| Armenian | 15 | 0.2% |
| Belgian | 5 | 0.1% |
| Bhutanese | 12 | 0.2% |
| British | 34 | 0.4% |
| Bulgarian | 12 | 0.2% |
| Burmese | 45 | 0.6% |
| Central American | 40 | 0.5% |
| Cherokee | 47 | 0.6% |
| Colombian | 11 | 0.1% |
| Czech | 274 | 3.6% |
| Czechoslovakian | 7 | 0.1% |
| Danish | 39 | 0.5% |
| Dutch | 106 | 1.4% |
| English | 710 | 9.3% |
| European | 134 | 1.8% |
| Finnish | 22 | 0.3% |
| French | 80 | 1.1% |
| French American Indian | 8 | 0.1% |
| French Canadian | 26 | 0.3% |
| German | 2,748 | 36.1% |
| Ghanaian | 11 | 0.1% |
| Greek | 7 | 0.1% |
| Guatemalan | 27 | 0.4% |
| Honduran | 13 | 0.2% |
| Indian (Asian) | 15 | 0.2% |
| Indonesian | 25 | 0.3% |
| Iranian | 4 | 0.1% |
| Irish | 1,135 | 14.9% |
| Italian | 101 | 1.3% |
| Korean | 36 | 0.5% |
| Laotian | 4 | 0.1% |
| Lebanese | 5 | 0.1% |
| Lithuanian | 5 | 0.1% |
| Luxembourger | 6 | 0.1% |
| Malaysian | 8 | 0.1% |
| Mexican | 163 | 2.1% |
| Northern European | 68 | 0.9% |
| Norwegian | 1,697 | 22.3% |
| Polish | 59 | 0.8% |
| Russian | 14 | 0.2% |
| Scandinavian | 95 | 1.3% |
| Scotch-Irish | 100 | 1.3% |
| Scottish | 85 | 1.1% |
| South American | 11 | 0.1% |
| Spaniard | 14 | 0.2% |
| Spanish | 18 | 0.2% |
| Sri Lankan | 15 | 0.2% |
| Subsaharan African | 25 | 0.3% |
| Swedish | 186 | 2.4% |
| Swiss | 38 | 0.5% |
| Thai | 49 | 0.6% |
| Turkish | 11 | 0.1% |
| Ukrainian | 6 | 0.1% |
| Vietnamese | 1 | 0.0% |
| Welsh | 58 | 0.8% |
| Zimbabwean | 7 | 0.1% | View All 59 Rows |
Immigrants in Decorah
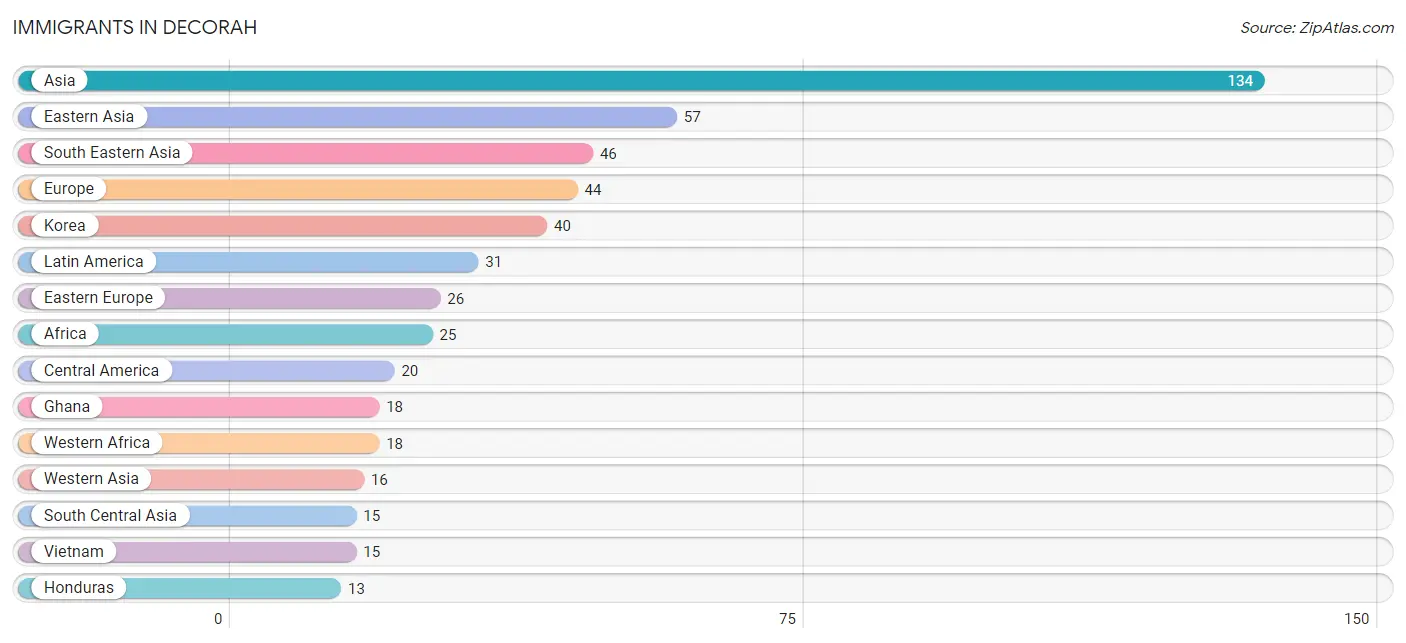
The most numerous immigrant groups reported in Decorah came from Asia (134 | 1.8%), Eastern Asia (57 | 0.7%), South Eastern Asia (46 | 0.6%), Europe (44 | 0.6%), and Korea (40 | 0.5%), together accounting for 4.2% of all Decorah residents.
| Immigration Origin | # Population | % Population |
| Africa | 25 | 0.3% |
| Asia | 134 | 1.8% |
| Bangladesh | 1 | 0.0% |
| Central America | 20 | 0.3% |
| China | 5 | 0.1% |
| Colombia | 11 | 0.1% |
| Eastern Africa | 7 | 0.1% |
| Eastern Asia | 57 | 0.7% |
| Eastern Europe | 26 | 0.3% |
| Europe | 44 | 0.6% |
| Germany | 7 | 0.1% |
| Ghana | 18 | 0.2% |
| Honduras | 13 | 0.2% |
| India | 2 | 0.0% |
| Ireland | 6 | 0.1% |
| Japan | 12 | 0.2% |
| Korea | 40 | 0.5% |
| Latin America | 31 | 0.4% |
| Lebanon | 5 | 0.1% |
| Mexico | 7 | 0.1% |
| Nepal | 8 | 0.1% |
| Northern Europe | 6 | 0.1% |
| Philippines | 2 | 0.0% |
| Russia | 8 | 0.1% |
| South America | 11 | 0.1% |
| South Central Asia | 15 | 0.2% |
| South Eastern Asia | 46 | 0.6% |
| Southern Europe | 5 | 0.1% |
| Spain | 5 | 0.1% |
| Turkey | 11 | 0.1% |
| Ukraine | 11 | 0.1% |
| Vietnam | 15 | 0.2% |
| Western Africa | 18 | 0.2% |
| Western Asia | 16 | 0.2% |
| Western Europe | 7 | 0.1% |
| Zimbabwe | 7 | 0.1% | View All 36 Rows |
Sex and Age in Decorah
Sex and Age in Decorah
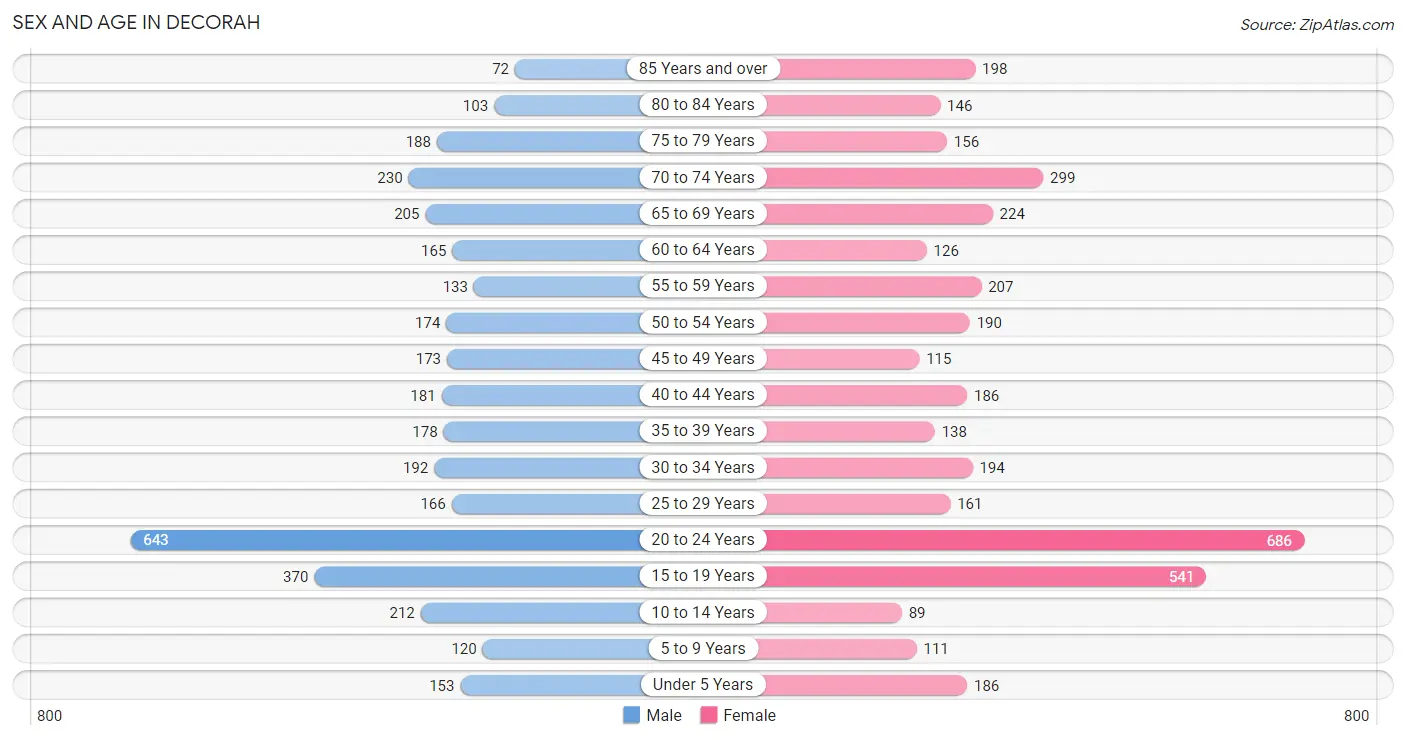
The most populous age groups in Decorah are 20 to 24 Years (643 | 17.6%) for men and 20 to 24 Years (686 | 17.3%) for women.
| Age Bracket | Male | Female |
| Under 5 Years | 153 (4.2%) | 186 (4.7%) |
| 5 to 9 Years | 120 (3.3%) | 111 (2.8%) |
| 10 to 14 Years | 212 (5.8%) | 89 (2.2%) |
| 15 to 19 Years | 370 (10.1%) | 541 (13.7%) |
| 20 to 24 Years | 643 (17.6%) | 686 (17.3%) |
| 25 to 29 Years | 166 (4.5%) | 161 (4.1%) |
| 30 to 34 Years | 192 (5.2%) | 194 (4.9%) |
| 35 to 39 Years | 178 (4.9%) | 138 (3.5%) |
| 40 to 44 Years | 181 (5.0%) | 186 (4.7%) |
| 45 to 49 Years | 173 (4.7%) | 115 (2.9%) |
| 50 to 54 Years | 174 (4.8%) | 190 (4.8%) |
| 55 to 59 Years | 133 (3.6%) | 207 (5.2%) |
| 60 to 64 Years | 165 (4.5%) | 126 (3.2%) |
| 65 to 69 Years | 205 (5.6%) | 224 (5.7%) |
| 70 to 74 Years | 230 (6.3%) | 299 (7.6%) |
| 75 to 79 Years | 188 (5.1%) | 156 (4.0%) |
| 80 to 84 Years | 103 (2.8%) | 146 (3.7%) |
| 85 Years and over | 72 (2.0%) | 198 (5.0%) |
| Total | 3,658 (100.0%) | 3,953 (100.0%) |
Families and Households in Decorah
Median Family Size in Decorah
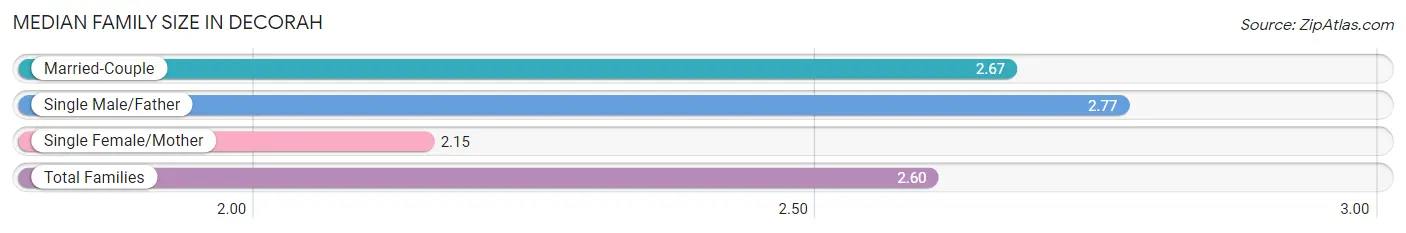
The median family size in Decorah is 2.60 persons per family, with single male/father families (31 | 2.0%) accounting for the largest median family size of 2.77 persons per family. On the other hand, single female/mother families (227 | 14.5%) represent the smallest median family size with 2.15 persons per family.
| Family Type | # Families | Family Size |
| Married-Couple | 1,306 (83.5%) | 2.67 |
| Single Male/Father | 31 (2.0%) | 2.77 |
| Single Female/Mother | 227 (14.5%) | 2.15 |
| Total Families | 1,564 (100.0%) | 2.60 |
Median Household Size in Decorah
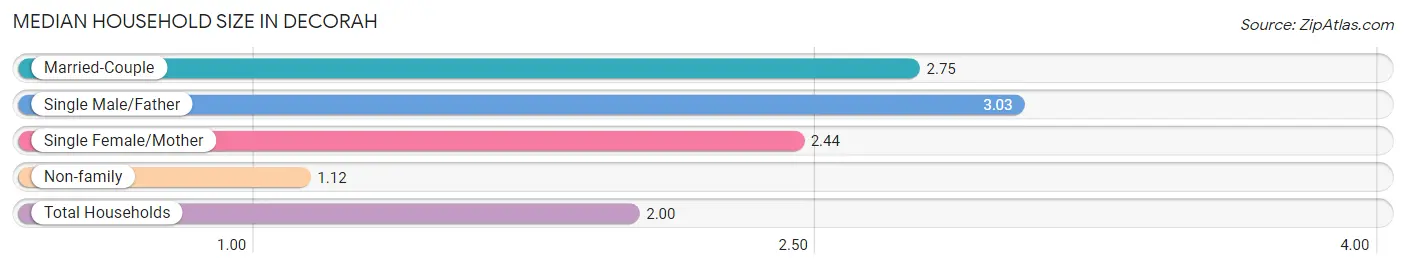
The median household size in Decorah is 2.00 persons per household, with single male/father households (31 | 1.1%) accounting for the largest median household size of 3.03 persons per household. non-family households (1,263 | 44.7%) represent the smallest median household size with 1.12 persons per household.
| Household Type | # Households | Household Size |
| Married-Couple | 1,306 (46.2%) | 2.75 |
| Single Male/Father | 31 (1.1%) | 3.03 |
| Single Female/Mother | 227 (8.0%) | 2.44 |
| Non-family | 1,263 (44.7%) | 1.12 |
| Total Households | 2,827 (100.0%) | 2.00 |
Household Size by Marriage Status in Decorah
Out of a total of 2,827 households in Decorah, 1,564 (55.3%) are family households, while 1,263 (44.7%) are nonfamily households. The most numerous type of family households are 2-person households, comprising 945, and the most common type of nonfamily households are 1-person households, comprising 1,078.
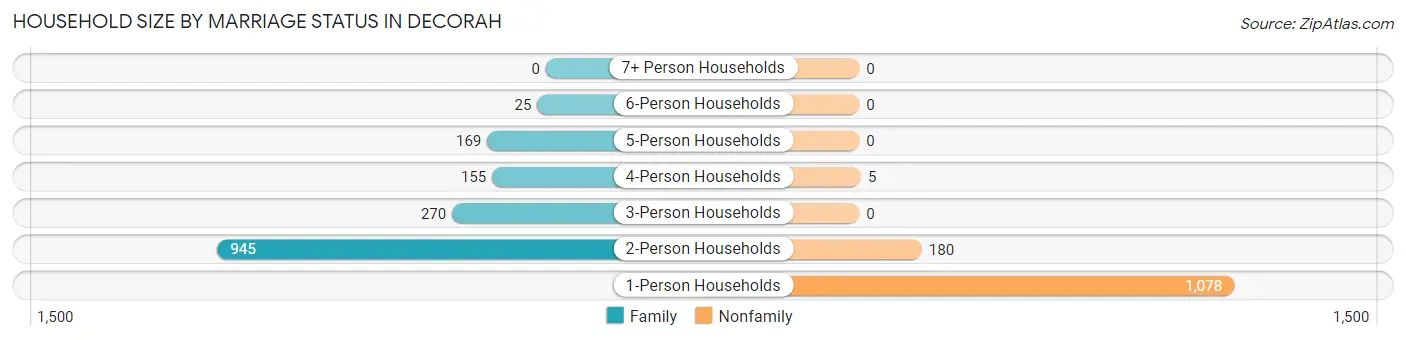
| Household Size | Family Households | Nonfamily Households |
| 1-Person Households | - | 1,078 (38.1%) |
| 2-Person Households | 945 (33.4%) | 180 (6.4%) |
| 3-Person Households | 270 (9.6%) | 0 (0.0%) |
| 4-Person Households | 155 (5.5%) | 5 (0.2%) |
| 5-Person Households | 169 (6.0%) | 0 (0.0%) |
| 6-Person Households | 25 (0.9%) | 0 (0.0%) |
| 7+ Person Households | 0 (0.0%) | 0 (0.0%) |
| Total | 1,564 (55.3%) | 1,263 (44.7%) |
Female Fertility in Decorah
Fertility by Age in Decorah
Average fertility rate in Decorah is 17.0 births per 1,000 women. Women in the age bracket of 20 to 34 years have the highest fertility rate with 34.0 births per 1,000 women. Women in the age bracket of 20 to 34 years acount for 100.0% of all women with births.
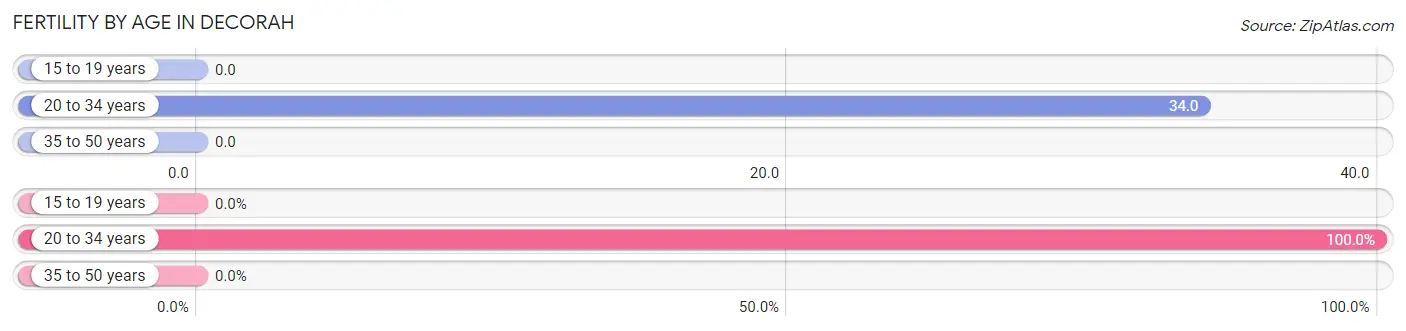
| Age Bracket | Women with Births | Births / 1,000 Women |
| 15 to 19 years | 0 (0.0%) | 0.0 |
| 20 to 34 years | 35 (100.0%) | 34.0 |
| 35 to 50 years | 0 (0.0%) | 0.0 |
| Total | 35 (100.0%) | 17.0 |
Fertility by Age by Marriage Status in Decorah
82.9% of women with births (35) in Decorah are married. The highest percentage of unmarried women with births falls into 20 to 34 years age bracket with 17.1% of them unmarried at the time of birth, while the lowest percentage of unmarried women with births belong to 20 to 34 years age bracket with 17.1% of them unmarried.
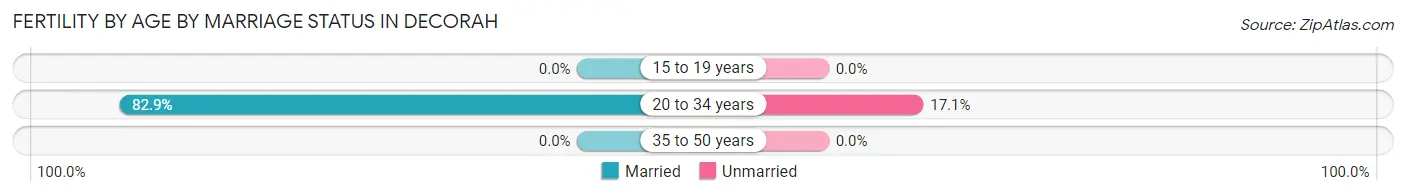
| Age Bracket | Married | Unmarried |
| 15 to 19 years | 0 (0.0%) | 0 (0.0%) |
| 20 to 34 years | 29 (82.9%) | 6 (17.1%) |
| 35 to 50 years | 0 (0.0%) | 0 (0.0%) |
| Total | 29 (82.9%) | 6 (17.1%) |
Fertility by Education in Decorah
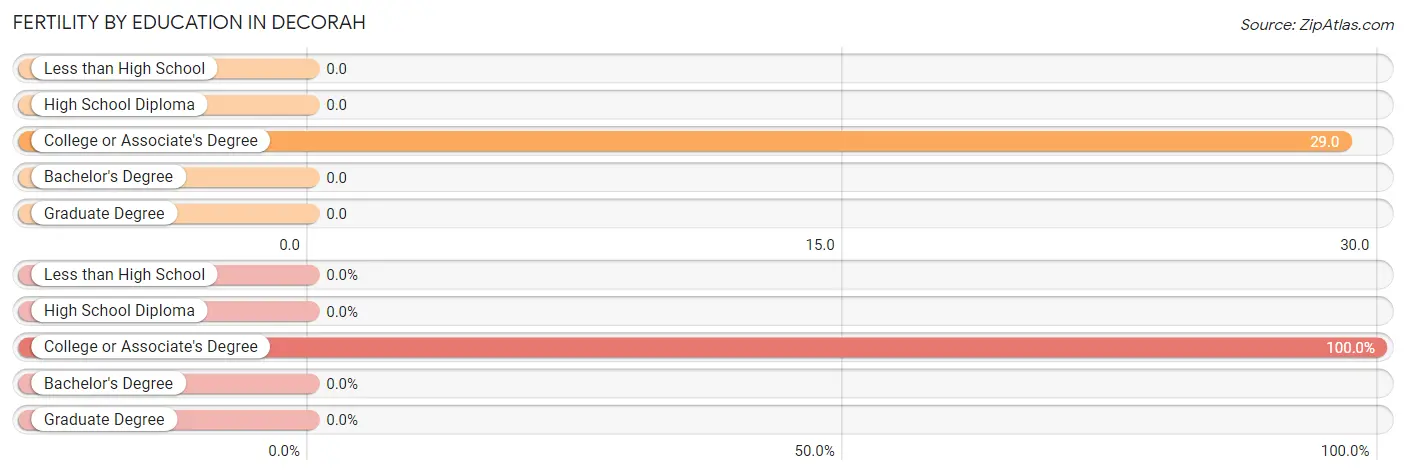
| Educational Attainment | Women with Births | Births / 1,000 Women |
| Less than High School | 0 (0.0%) | 0.0 |
| High School Diploma | 0 (0.0%) | 0.0 |
| College or Associate's Degree | 35 (100.0%) | 29.0 |
| Bachelor's Degree | 0 (0.0%) | 0.0 |
| Graduate Degree | 0 (0.0%) | 0.0 |
| Total | 35 (100.0%) | 17.0 |
Fertility by Education by Marriage Status in Decorah
17.1% of women with births in Decorah are unmarried. Women with the educational attainment of college or associate's degree are most likely to be married with 82.9% of them married at childbirth, while women with the educational attainment of college or associate's degree are least likely to be married with 17.1% of them unmarried at childbirth.
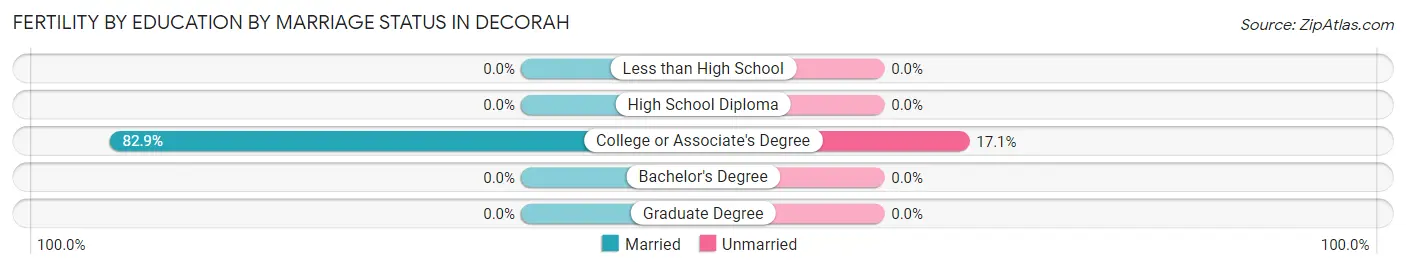
| Educational Attainment | Married | Unmarried |
| Less than High School | 0 (0.0%) | 0 (0.0%) |
| High School Diploma | 0 (0.0%) | 0 (0.0%) |
| College or Associate's Degree | 29 (82.9%) | 6 (17.1%) |
| Bachelor's Degree | 0 (0.0%) | 0 (0.0%) |
| Graduate Degree | 0 (0.0%) | 0 (0.0%) |
| Total | 29 (82.9%) | 6 (17.1%) |
Employment Characteristics in Decorah
Employment by Class of Employer in Decorah
Among the 3,952 employed individuals in Decorah, private company employees (2,163 | 54.7%), not-for-profit organizations (1,060 | 26.8%), and self-employed (not incorporated) (301 | 7.6%) make up the most common classes of employment.
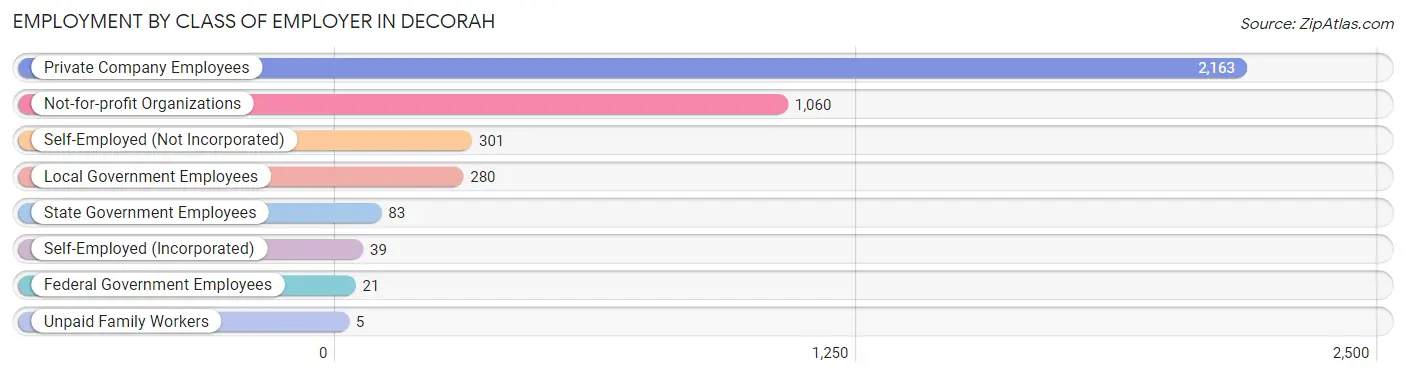
| Employer Class | # Employees | % Employees |
| Private Company Employees | 2,163 | 54.7% |
| Self-Employed (Incorporated) | 39 | 1.0% |
| Self-Employed (Not Incorporated) | 301 | 7.6% |
| Not-for-profit Organizations | 1,060 | 26.8% |
| Local Government Employees | 280 | 7.1% |
| State Government Employees | 83 | 2.1% |
| Federal Government Employees | 21 | 0.5% |
| Unpaid Family Workers | 5 | 0.1% |
| Total | 3,952 | 100.0% |
Employment Status by Age in Decorah
According to the labor force statistics for Decorah, out of the total population over 16 years of age (6,678), 62.5% or 4,174 individuals are in the labor force, with 3.3% or 138 of them unemployed. The age group with the highest labor force participation rate is 30 to 34 years, with 97.9% or 378 individuals in the labor force. Within the labor force, the 65 to 74 years age range has the highest percentage of unemployed individuals, with 11.9% or 33 of them being unemployed.
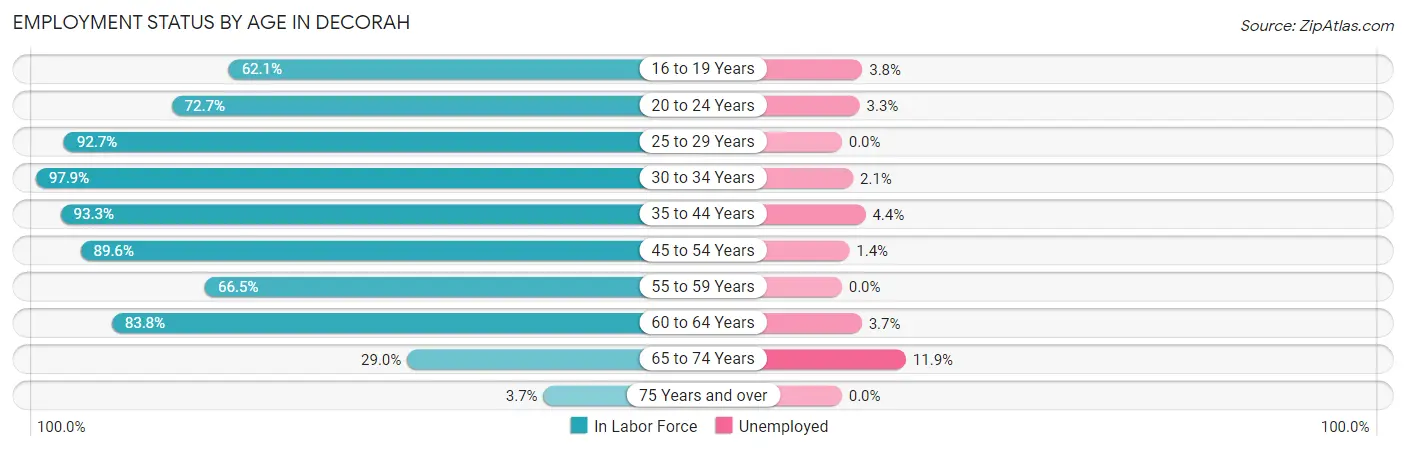
| Age Bracket | In Labor Force | Unemployed |
| 16 to 19 Years | 527 (62.1%) | 20 (3.8%) |
| 20 to 24 Years | 966 (72.7%) | 32 (3.3%) |
| 25 to 29 Years | 303 (92.7%) | 0 (0.0%) |
| 30 to 34 Years | 378 (97.9%) | 8 (2.1%) |
| 35 to 44 Years | 637 (93.3%) | 28 (4.4%) |
| 45 to 54 Years | 584 (89.6%) | 8 (1.4%) |
| 55 to 59 Years | 226 (66.5%) | 0 (0.0%) |
| 60 to 64 Years | 244 (83.8%) | 9 (3.7%) |
| 65 to 74 Years | 278 (29.0%) | 33 (11.9%) |
| 75 Years and over | 32 (3.7%) | 0 (0.0%) |
| Total | 4,174 (62.5%) | 138 (3.3%) |
Employment Status by Educational Attainment in Decorah
According to labor force statistics for Decorah, 88.5% of individuals (2,371) out of the total population between 25 and 64 years of age (2,679) are in the labor force, with 2.2% or 52 of them being unemployed. The group with the highest labor force participation rate are those with the educational attainment of bachelor's degree or higher, with 97.3% or 1,290 individuals in the labor force. Within the labor force, individuals with college / associate degree education have the highest percentage of unemployment, with 3.7% or 23 of them being unemployed.
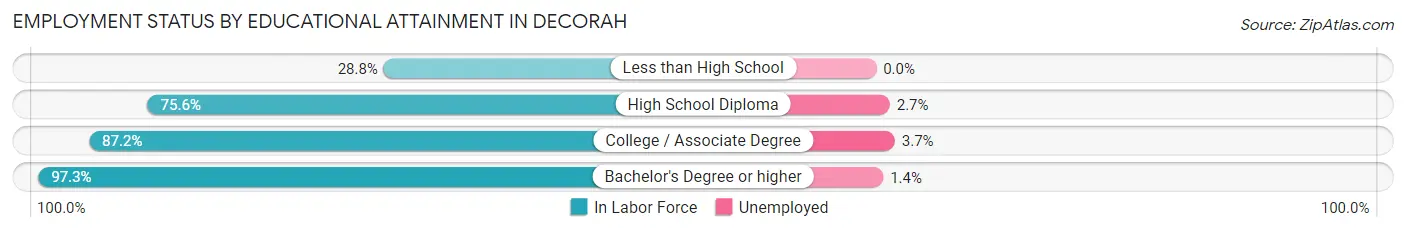
| Educational Attainment | In Labor Force | Unemployed |
| Less than High School | 15 (28.8%) | 0 (0.0%) |
| High School Diploma | 439 (75.6%) | 16 (2.7%) |
| College / Associate Degree | 628 (87.2%) | 27 (3.7%) |
| Bachelor's Degree or higher | 1,290 (97.3%) | 19 (1.4%) |
| Total | 2,371 (88.5%) | 59 (2.2%) |
Employment Occupations by Sex in Decorah
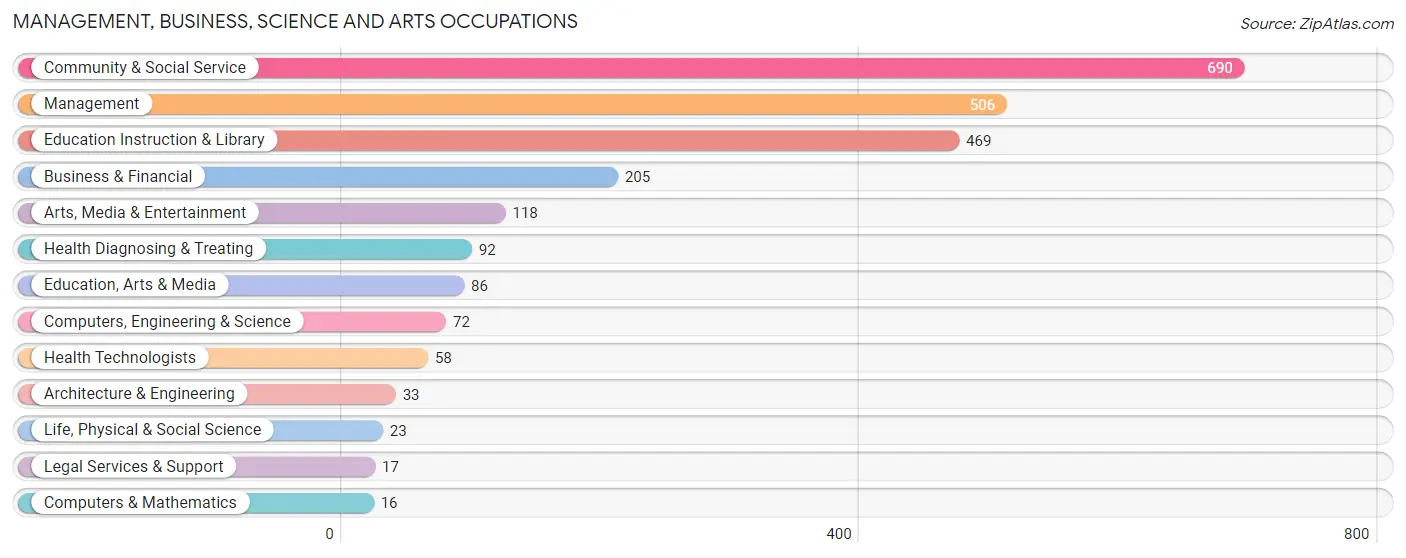
Management, Business, Science and Arts Occupations
The most common Management, Business, Science and Arts occupations in Decorah are Community & Social Service (690 | 17.1%), Management (506 | 12.5%), Education Instruction & Library (469 | 11.6%), Business & Financial (205 | 5.1%), and Arts, Media & Entertainment (118 | 2.9%).
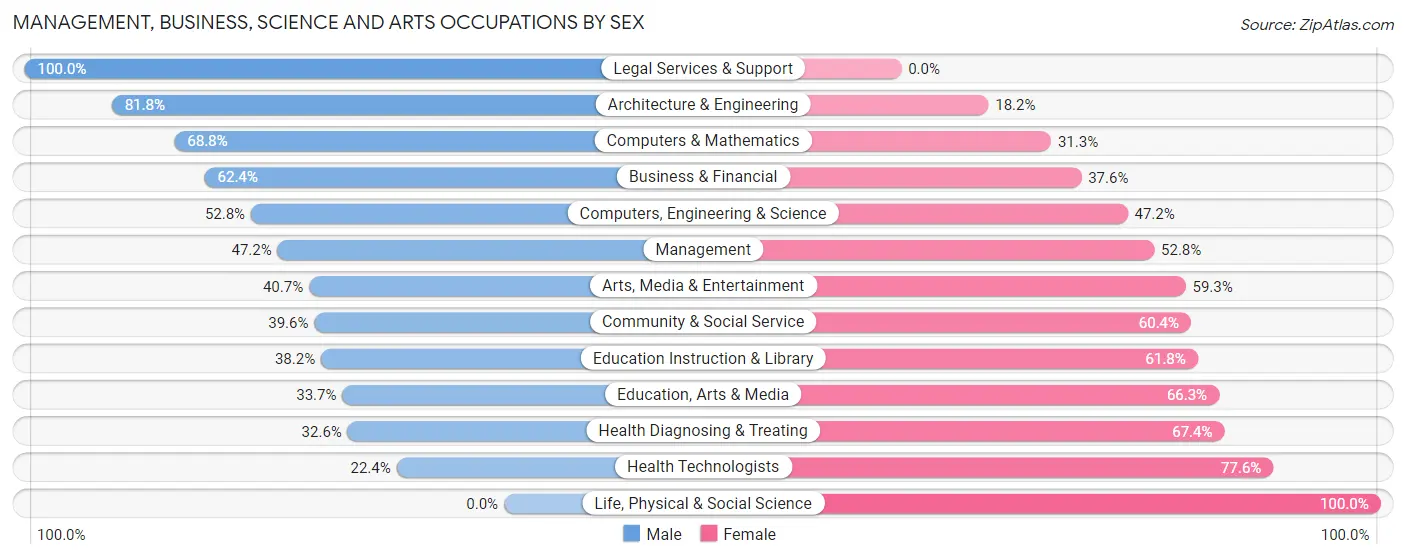
Management, Business, Science and Arts Occupations by Sex
Within the Management, Business, Science and Arts occupations in Decorah, the most male-oriented occupations are Legal Services & Support (100.0%), Architecture & Engineering (81.8%), and Computers & Mathematics (68.8%), while the most female-oriented occupations are Life, Physical & Social Science (100.0%), Health Technologists (77.6%), and Health Diagnosing & Treating (67.4%).
| Occupation | Male | Female |
| Management | 239 (47.2%) | 267 (52.8%) |
| Business & Financial | 128 (62.4%) | 77 (37.6%) |
| Computers, Engineering & Science | 38 (52.8%) | 34 (47.2%) |
| Computers & Mathematics | 11 (68.8%) | 5 (31.2%) |
| Architecture & Engineering | 27 (81.8%) | 6 (18.2%) |
| Life, Physical & Social Science | 0 (0.0%) | 23 (100.0%) |
| Community & Social Service | 273 (39.6%) | 417 (60.4%) |
| Education, Arts & Media | 29 (33.7%) | 57 (66.3%) |
| Legal Services & Support | 17 (100.0%) | 0 (0.0%) |
| Education Instruction & Library | 179 (38.2%) | 290 (61.8%) |
| Arts, Media & Entertainment | 48 (40.7%) | 70 (59.3%) |
| Health Diagnosing & Treating | 30 (32.6%) | 62 (67.4%) |
| Health Technologists | 13 (22.4%) | 45 (77.6%) |
| Total (Category) | 708 (45.2%) | 857 (54.8%) |
| Total (Overall) | 1,899 (47.0%) | 2,138 (53.0%) |
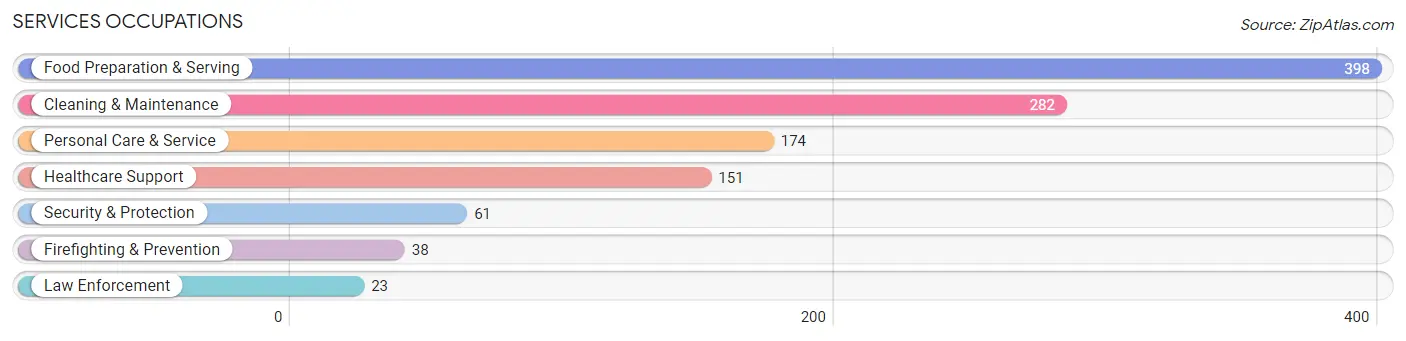
Services Occupations
The most common Services occupations in Decorah are Food Preparation & Serving (398 | 9.9%), Cleaning & Maintenance (282 | 7.0%), Personal Care & Service (174 | 4.3%), Healthcare Support (151 | 3.7%), and Security & Protection (61 | 1.5%).
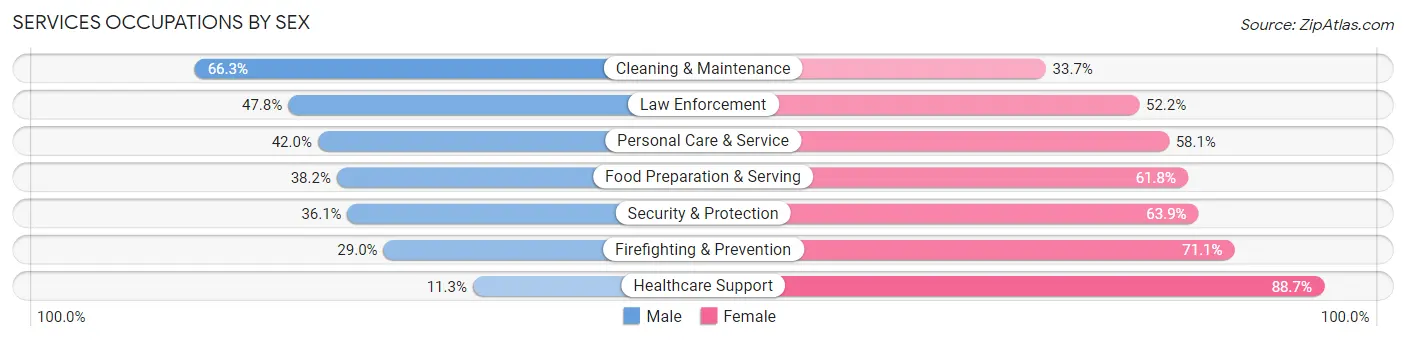
Services Occupations by Sex
Within the Services occupations in Decorah, the most male-oriented occupations are Cleaning & Maintenance (66.3%), Law Enforcement (47.8%), and Personal Care & Service (41.9%), while the most female-oriented occupations are Healthcare Support (88.7%), Firefighting & Prevention (71.1%), and Security & Protection (63.9%).
| Occupation | Male | Female |
| Healthcare Support | 17 (11.3%) | 134 (88.7%) |
| Security & Protection | 22 (36.1%) | 39 (63.9%) |
| Firefighting & Prevention | 11 (28.9%) | 27 (71.1%) |
| Law Enforcement | 11 (47.8%) | 12 (52.2%) |
| Food Preparation & Serving | 152 (38.2%) | 246 (61.8%) |
| Cleaning & Maintenance | 187 (66.3%) | 95 (33.7%) |
| Personal Care & Service | 73 (41.9%) | 101 (58.1%) |
| Total (Category) | 451 (42.3%) | 615 (57.7%) |
| Total (Overall) | 1,899 (47.0%) | 2,138 (53.0%) |
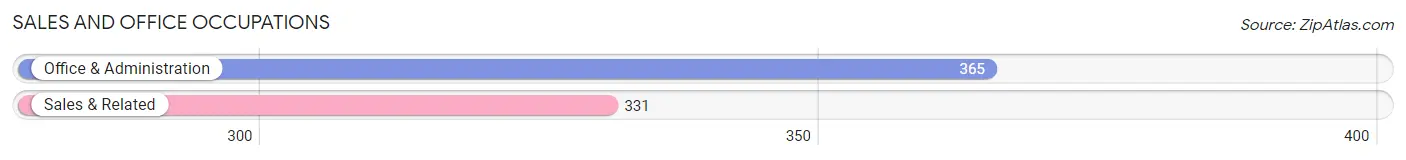
Sales and Office Occupations
The most common Sales and Office occupations in Decorah are Office & Administration (365 | 9.0%), and Sales & Related (331 | 8.2%).
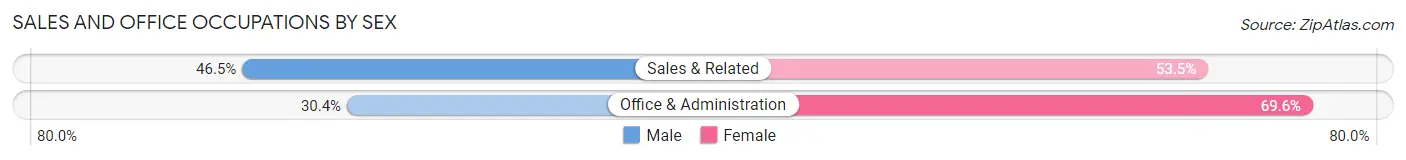
Sales and Office Occupations by Sex
| Occupation | Male | Female |
| Sales & Related | 154 (46.5%) | 177 (53.5%) |
| Office & Administration | 111 (30.4%) | 254 (69.6%) |
| Total (Category) | 265 (38.1%) | 431 (61.9%) |
| Total (Overall) | 1,899 (47.0%) | 2,138 (53.0%) |
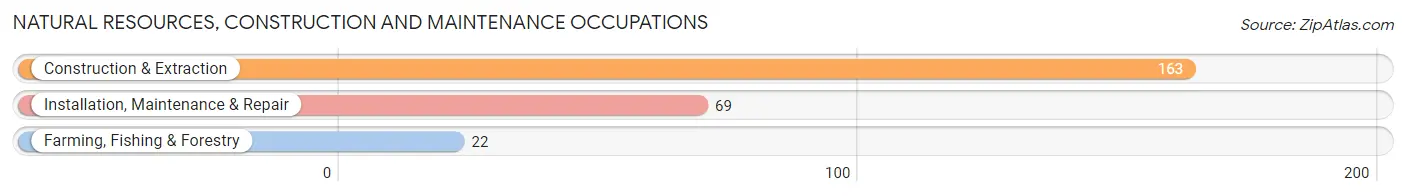
Natural Resources, Construction and Maintenance Occupations
The most common Natural Resources, Construction and Maintenance occupations in Decorah are Construction & Extraction (163 | 4.0%), Installation, Maintenance & Repair (69 | 1.7%), and Farming, Fishing & Forestry (22 | 0.5%).
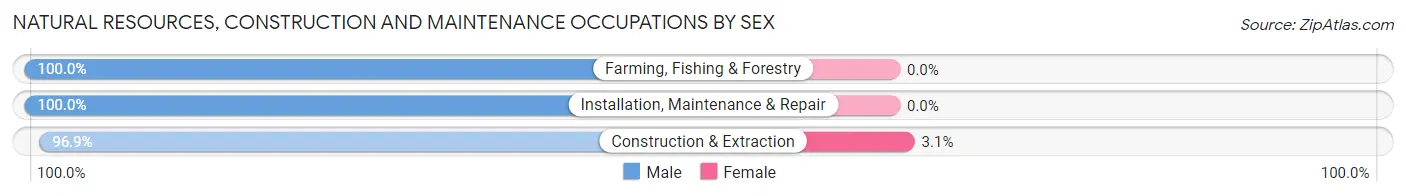
Natural Resources, Construction and Maintenance Occupations by Sex
| Occupation | Male | Female |
| Farming, Fishing & Forestry | 22 (100.0%) | 0 (0.0%) |
| Construction & Extraction | 158 (96.9%) | 5 (3.1%) |
| Installation, Maintenance & Repair | 69 (100.0%) | 0 (0.0%) |
| Total (Category) | 249 (98.0%) | 5 (2.0%) |
| Total (Overall) | 1,899 (47.0%) | 2,138 (53.0%) |
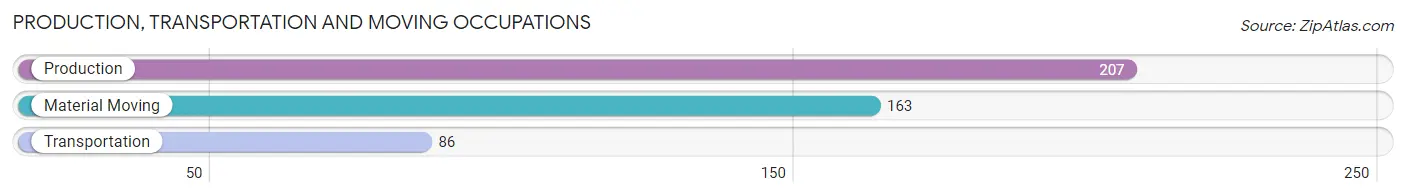
Production, Transportation and Moving Occupations
The most common Production, Transportation and Moving occupations in Decorah are Production (207 | 5.1%), Material Moving (163 | 4.0%), and Transportation (86 | 2.1%).
Production, Transportation and Moving Occupations by Sex
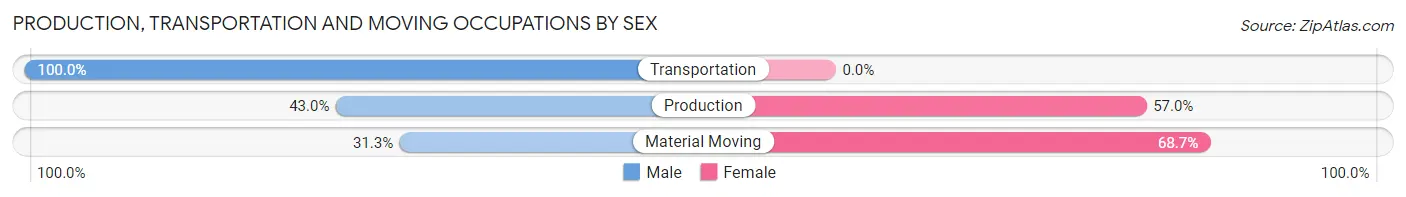
| Occupation | Male | Female |
| Production | 89 (43.0%) | 118 (57.0%) |
| Transportation | 86 (100.0%) | 0 (0.0%) |
| Material Moving | 51 (31.3%) | 112 (68.7%) |
| Total (Category) | 226 (49.6%) | 230 (50.4%) |
| Total (Overall) | 1,899 (47.0%) | 2,138 (53.0%) |
Employment Industries by Sex in Decorah
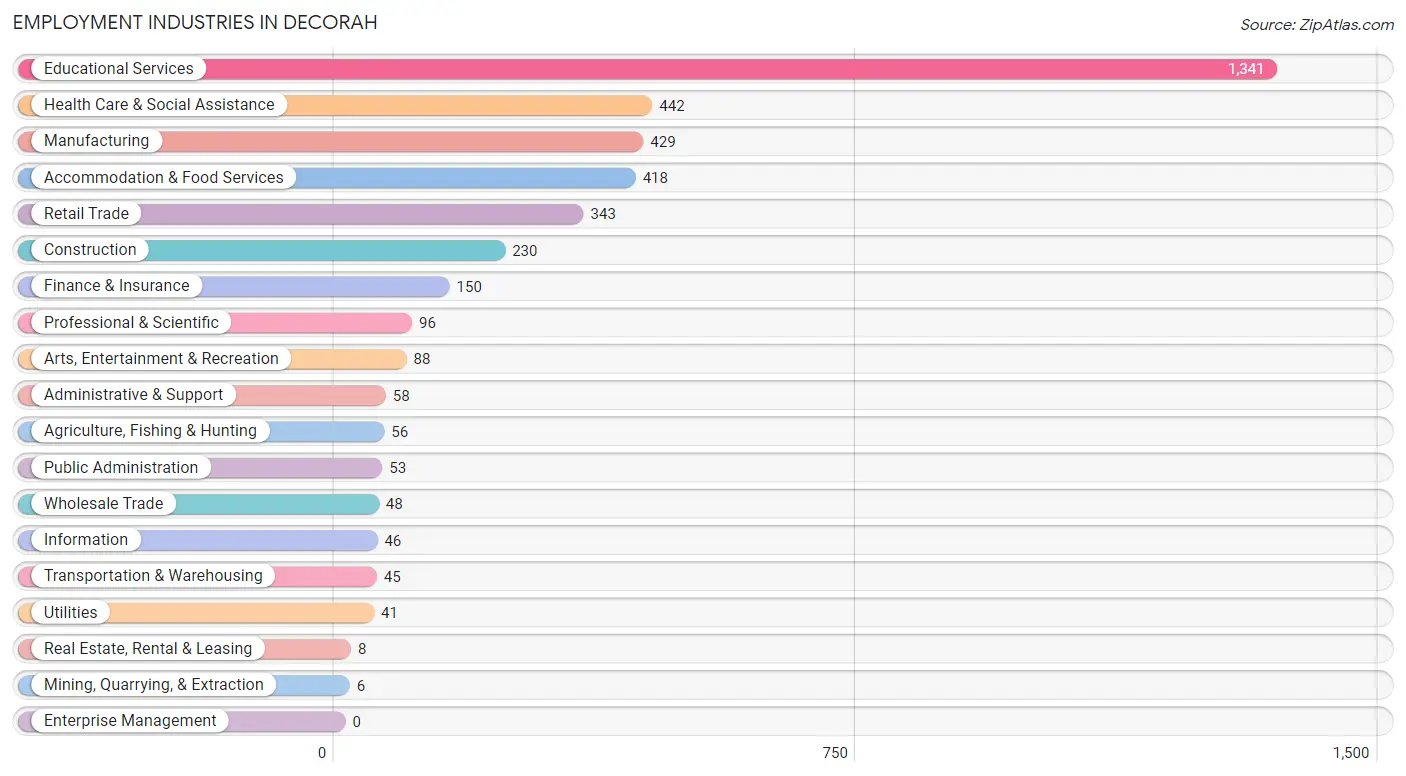
Employment Industries in Decorah
The major employment industries in Decorah include Educational Services (1,341 | 33.2%), Health Care & Social Assistance (442 | 11.0%), Manufacturing (429 | 10.6%), Accommodation & Food Services (418 | 10.3%), and Retail Trade (343 | 8.5%).
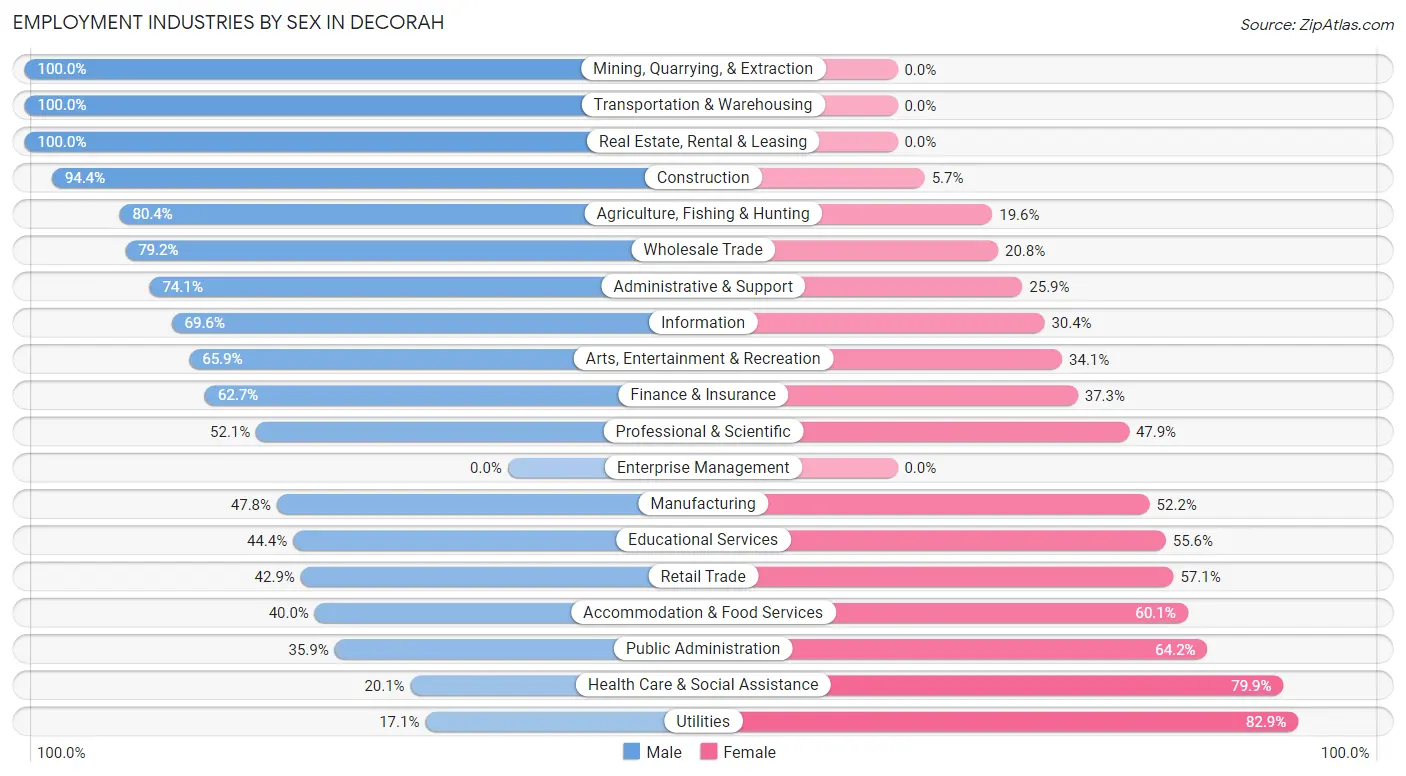
Employment Industries by Sex in Decorah
The Decorah industries that see more men than women are Mining, Quarrying, & Extraction (100.0%), Transportation & Warehousing (100.0%), and Real Estate, Rental & Leasing (100.0%), whereas the industries that tend to have a higher number of women are Utilities (82.9%), Health Care & Social Assistance (79.9%), and Public Administration (64.1%).
| Industry | Male | Female |
| Agriculture, Fishing & Hunting | 45 (80.4%) | 11 (19.6%) |
| Mining, Quarrying, & Extraction | 6 (100.0%) | 0 (0.0%) |
| Construction | 217 (94.4%) | 13 (5.7%) |
| Manufacturing | 205 (47.8%) | 224 (52.2%) |
| Wholesale Trade | 38 (79.2%) | 10 (20.8%) |
| Retail Trade | 147 (42.9%) | 196 (57.1%) |
| Transportation & Warehousing | 45 (100.0%) | 0 (0.0%) |
| Utilities | 7 (17.1%) | 34 (82.9%) |
| Information | 32 (69.6%) | 14 (30.4%) |
| Finance & Insurance | 94 (62.7%) | 56 (37.3%) |
| Real Estate, Rental & Leasing | 8 (100.0%) | 0 (0.0%) |
| Professional & Scientific | 50 (52.1%) | 46 (47.9%) |
| Enterprise Management | 0 (0.0%) | 0 (0.0%) |
| Administrative & Support | 43 (74.1%) | 15 (25.9%) |
| Educational Services | 596 (44.4%) | 745 (55.6%) |
| Health Care & Social Assistance | 89 (20.1%) | 353 (79.9%) |
| Arts, Entertainment & Recreation | 58 (65.9%) | 30 (34.1%) |
| Accommodation & Food Services | 167 (40.0%) | 251 (60.1%) |
| Public Administration | 19 (35.8%) | 34 (64.1%) |
| Total | 1,899 (47.0%) | 2,138 (53.0%) |
Education in Decorah
School Enrollment in Decorah
The most common levels of schooling among the 2,786 students in Decorah are college / undergraduate (1,898 | 68.1%), high school (224 | 8.0%), and middle school (212 | 7.6%).
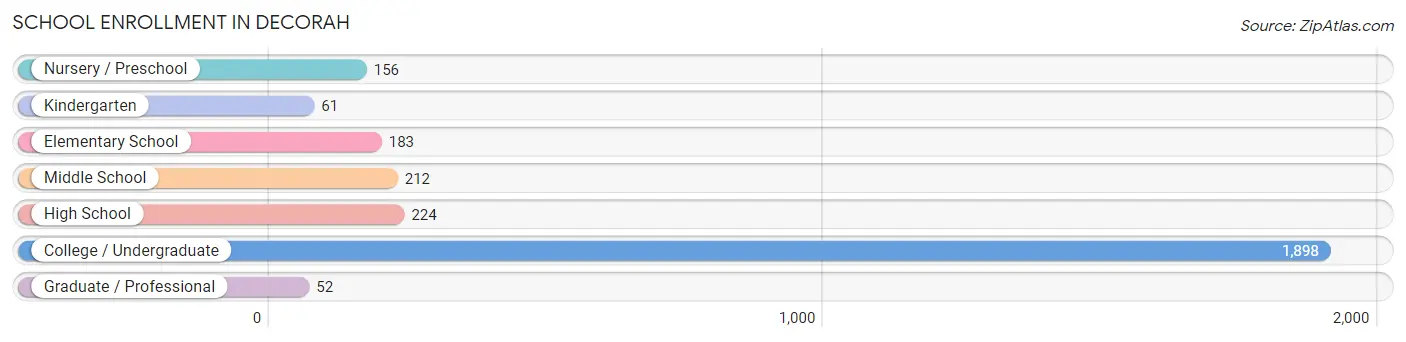
| School Level | # Students | % Students |
| Nursery / Preschool | 156 | 5.6% |
| Kindergarten | 61 | 2.2% |
| Elementary School | 183 | 6.6% |
| Middle School | 212 | 7.6% |
| High School | 224 | 8.0% |
| College / Undergraduate | 1,898 | 68.1% |
| Graduate / Professional | 52 | 1.9% |
| Total | 2,786 | 100.0% |
School Enrollment by Age by Funding Source in Decorah
Out of a total of 2,786 students who are enrolled in schools in Decorah, 1,872 (67.2%) attend a private institution, while the remaining 914 (32.8%) are enrolled in public schools. The age group of 20 to 24 year olds has the highest likelihood of being enrolled in private schools, with 1,109 (96.2% in the age bracket) enrolled. Conversely, the age group of 15 to 17 year olds has the lowest likelihood of being enrolled in a private school, with 156 (99.4% in the age bracket) attending a public institution.
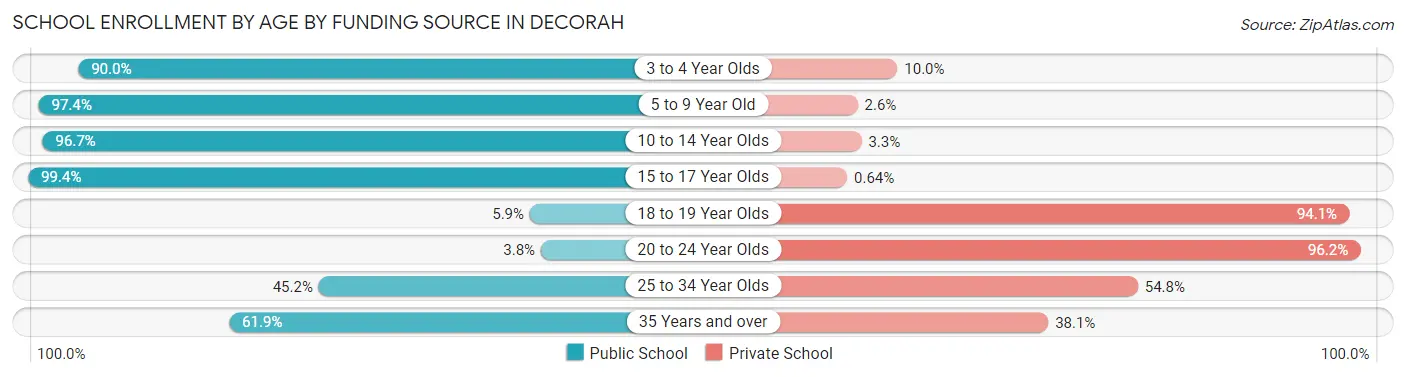
| Age Bracket | Public School | Private School |
| 3 to 4 Year Olds | 108 (90.0%) | 12 (10.0%) |
| 5 to 9 Year Old | 225 (97.4%) | 6 (2.6%) |
| 10 to 14 Year Olds | 291 (96.7%) | 10 (3.3%) |
| 15 to 17 Year Olds | 156 (99.4%) | 1 (0.6%) |
| 18 to 19 Year Olds | 43 (5.9%) | 687 (94.1%) |
| 20 to 24 Year Olds | 44 (3.8%) | 1,109 (96.2%) |
| 25 to 34 Year Olds | 33 (45.2%) | 40 (54.8%) |
| 35 Years and over | 13 (61.9%) | 8 (38.1%) |
| Total | 914 (32.8%) | 1,872 (67.2%) |
Educational Attainment by Field of Study in Decorah
Education (475 | 20.7%), business (346 | 15.1%), science & technology (189 | 8.3%), liberal arts & history (172 | 7.5%), and bio, nature & agricultural (171 | 7.5%) are the most common fields of study among 2,292 individuals in Decorah who have obtained a bachelor's degree or higher.
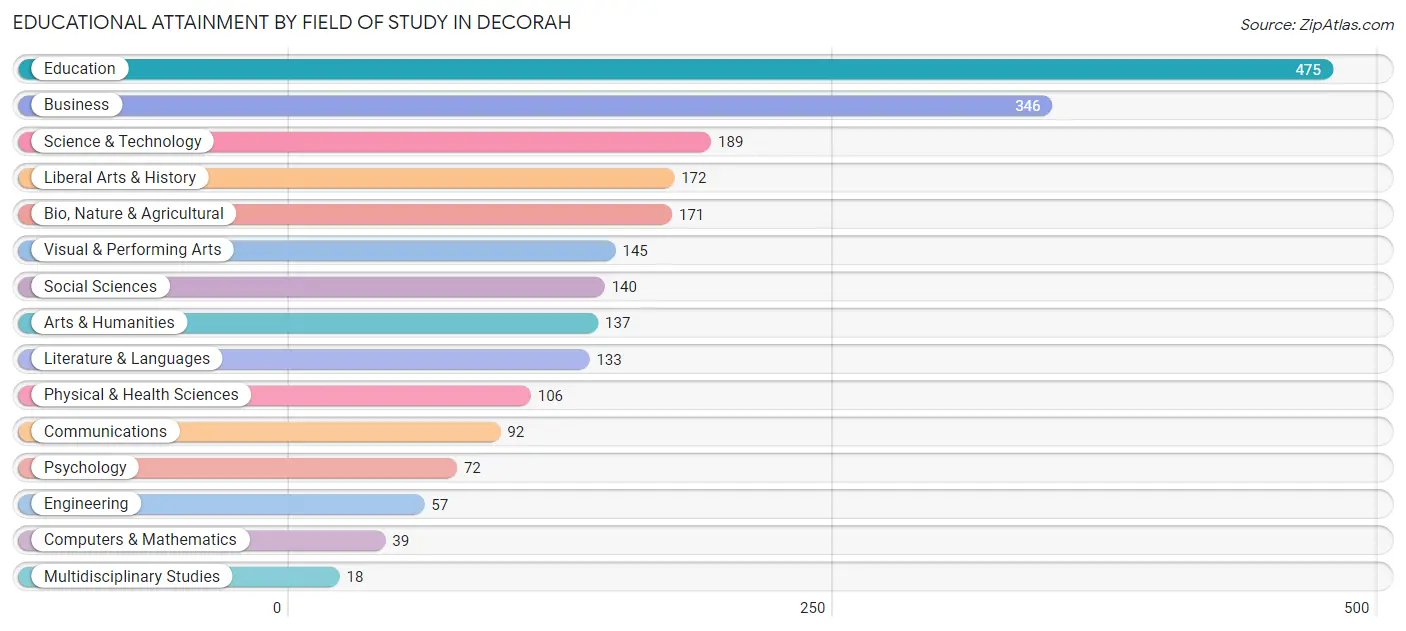
| Field of Study | # Graduates | % Graduates |
| Computers & Mathematics | 39 | 1.7% |
| Bio, Nature & Agricultural | 171 | 7.5% |
| Physical & Health Sciences | 106 | 4.6% |
| Psychology | 72 | 3.1% |
| Social Sciences | 140 | 6.1% |
| Engineering | 57 | 2.5% |
| Multidisciplinary Studies | 18 | 0.8% |
| Science & Technology | 189 | 8.3% |
| Business | 346 | 15.1% |
| Education | 475 | 20.7% |
| Literature & Languages | 133 | 5.8% |
| Liberal Arts & History | 172 | 7.5% |
| Visual & Performing Arts | 145 | 6.3% |
| Communications | 92 | 4.0% |
| Arts & Humanities | 137 | 6.0% |
| Total | 2,292 | 100.0% |
Transportation & Commute in Decorah
Vehicle Availability by Sex in Decorah
The most prevalent vehicle ownership categories in Decorah are males with 2 vehicles (718, accounting for 52.2%) and females with 2 vehicles (731, making up 50.8%).
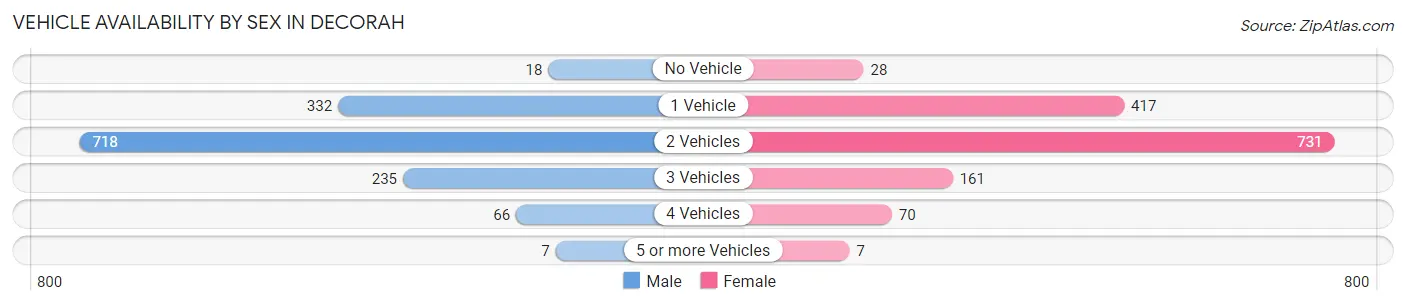
| Vehicles Available | Male | Female |
| No Vehicle | 18 (1.3%) | 28 (2.0%) |
| 1 Vehicle | 332 (24.1%) | 417 (29.5%) |
| 2 Vehicles | 718 (52.2%) | 731 (51.7%) |
| 3 Vehicles | 235 (17.1%) | 161 (11.4%) |
| 4 Vehicles | 66 (4.8%) | 70 (5.0%) |
| 5 or more Vehicles | 7 (0.5%) | 7 (0.5%) |
| Total | 1,376 (100.0%) | 1,414 (100.0%) |
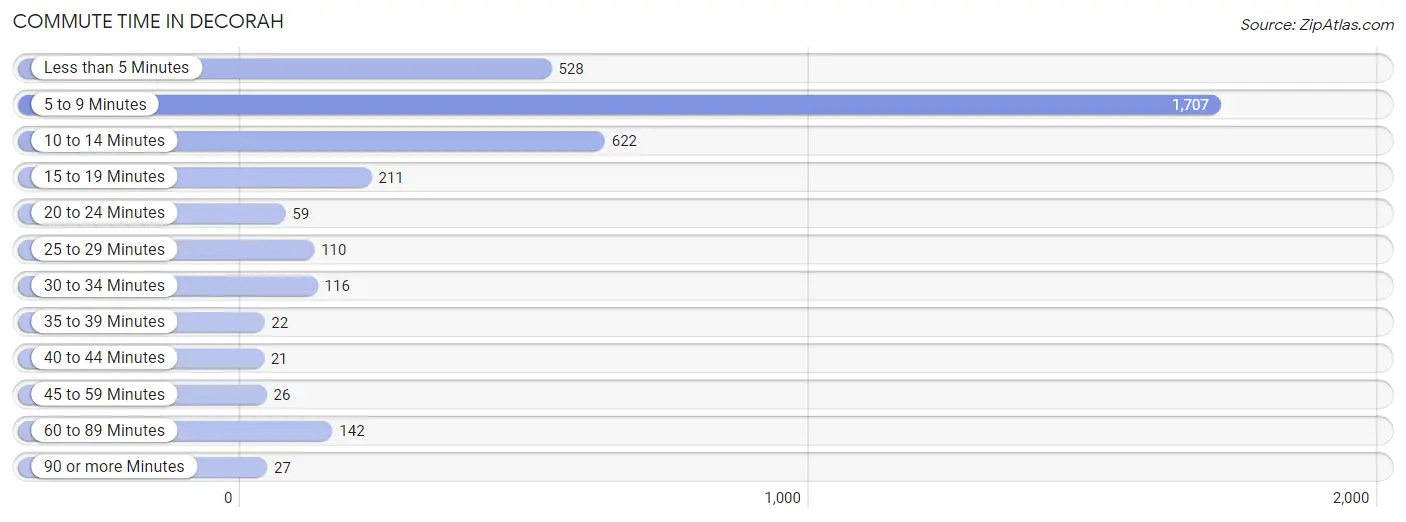
Commute Time in Decorah
The most frequently occuring commute durations in Decorah are 5 to 9 minutes (1,707 commuters, 47.5%), 10 to 14 minutes (622 commuters, 17.3%), and less than 5 minutes (528 commuters, 14.7%).
| Commute Time | # Commuters | % Commuters |
| Less than 5 Minutes | 528 | 14.7% |
| 5 to 9 Minutes | 1,707 | 47.5% |
| 10 to 14 Minutes | 622 | 17.3% |
| 15 to 19 Minutes | 211 | 5.9% |
| 20 to 24 Minutes | 59 | 1.6% |
| 25 to 29 Minutes | 110 | 3.1% |
| 30 to 34 Minutes | 116 | 3.2% |
| 35 to 39 Minutes | 22 | 0.6% |
| 40 to 44 Minutes | 21 | 0.6% |
| 45 to 59 Minutes | 26 | 0.7% |
| 60 to 89 Minutes | 142 | 4.0% |
| 90 or more Minutes | 27 | 0.7% |
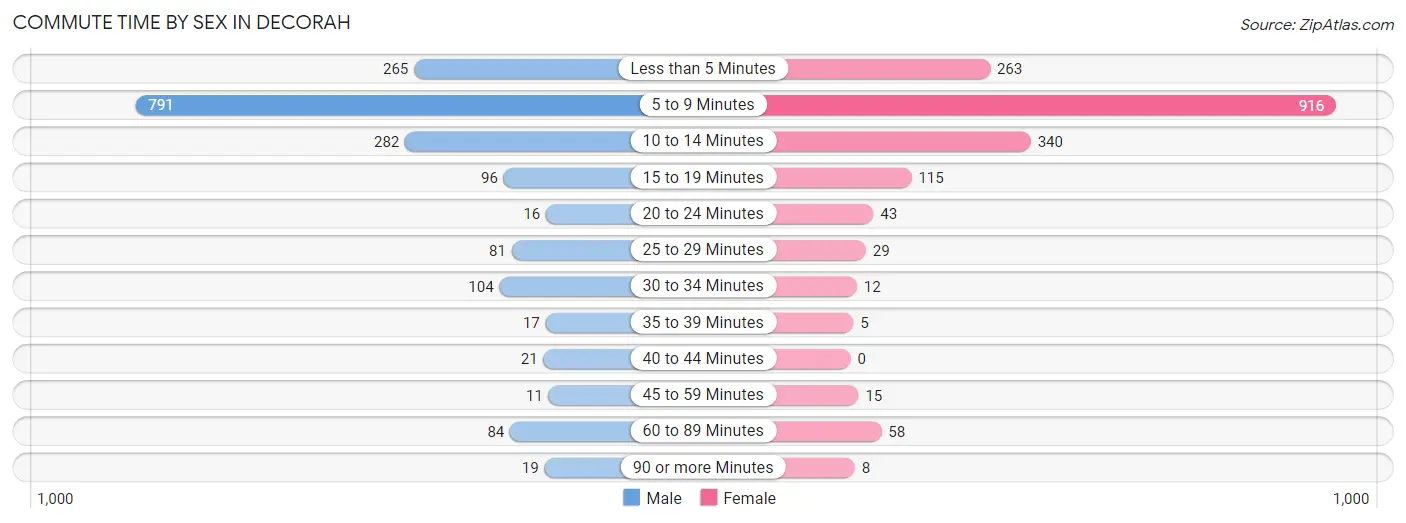
Commute Time by Sex in Decorah
The most common commute times in Decorah are 5 to 9 minutes (791 commuters, 44.3%) for males and 5 to 9 minutes (916 commuters, 50.8%) for females.
| Commute Time | Male | Female |
| Less than 5 Minutes | 265 (14.8%) | 263 (14.6%) |
| 5 to 9 Minutes | 791 (44.3%) | 916 (50.8%) |
| 10 to 14 Minutes | 282 (15.8%) | 340 (18.9%) |
| 15 to 19 Minutes | 96 (5.4%) | 115 (6.4%) |
| 20 to 24 Minutes | 16 (0.9%) | 43 (2.4%) |
| 25 to 29 Minutes | 81 (4.5%) | 29 (1.6%) |
| 30 to 34 Minutes | 104 (5.8%) | 12 (0.7%) |
| 35 to 39 Minutes | 17 (0.9%) | 5 (0.3%) |
| 40 to 44 Minutes | 21 (1.2%) | 0 (0.0%) |
| 45 to 59 Minutes | 11 (0.6%) | 15 (0.8%) |
| 60 to 89 Minutes | 84 (4.7%) | 58 (3.2%) |
| 90 or more Minutes | 19 (1.1%) | 8 (0.4%) |
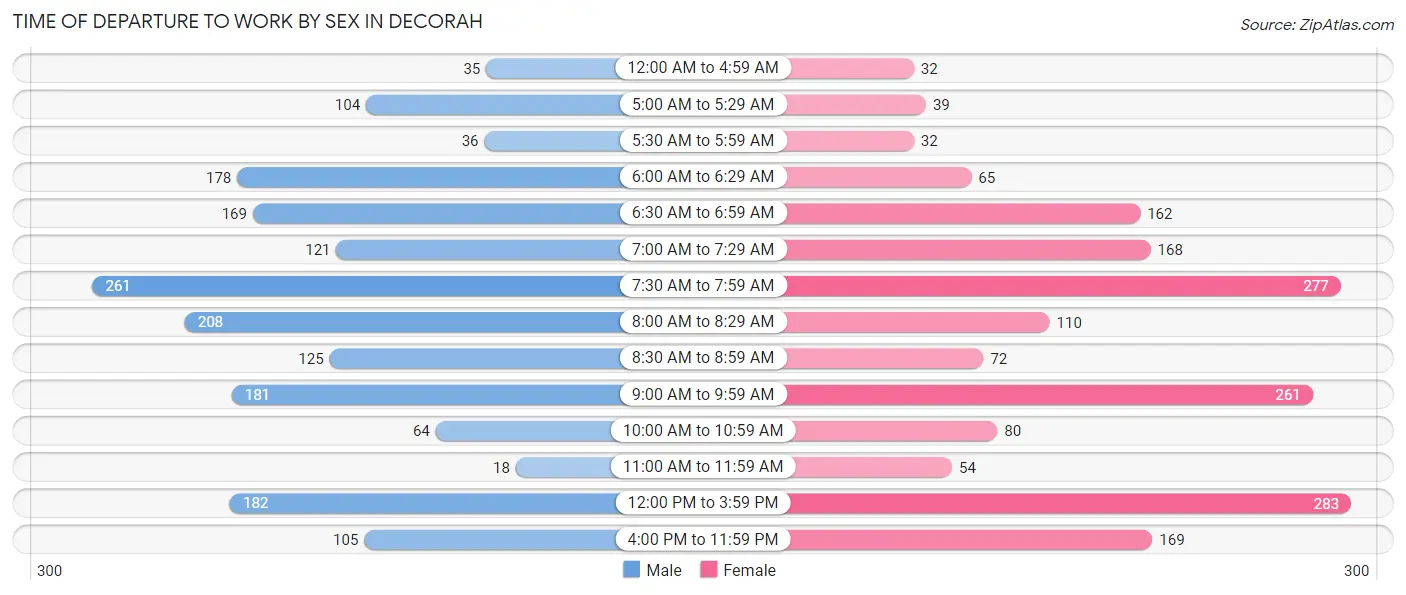
Time of Departure to Work by Sex in Decorah
The most frequent times of departure to work in Decorah are 7:30 AM to 7:59 AM (261, 14.6%) for males and 12:00 PM to 3:59 PM (283, 15.7%) for females.
| Time of Departure | Male | Female |
| 12:00 AM to 4:59 AM | 35 (2.0%) | 32 (1.8%) |
| 5:00 AM to 5:29 AM | 104 (5.8%) | 39 (2.2%) |
| 5:30 AM to 5:59 AM | 36 (2.0%) | 32 (1.8%) |
| 6:00 AM to 6:29 AM | 178 (10.0%) | 65 (3.6%) |
| 6:30 AM to 6:59 AM | 169 (9.5%) | 162 (9.0%) |
| 7:00 AM to 7:29 AM | 121 (6.8%) | 168 (9.3%) |
| 7:30 AM to 7:59 AM | 261 (14.6%) | 277 (15.3%) |
| 8:00 AM to 8:29 AM | 208 (11.6%) | 110 (6.1%) |
| 8:30 AM to 8:59 AM | 125 (7.0%) | 72 (4.0%) |
| 9:00 AM to 9:59 AM | 181 (10.1%) | 261 (14.5%) |
| 10:00 AM to 10:59 AM | 64 (3.6%) | 80 (4.4%) |
| 11:00 AM to 11:59 AM | 18 (1.0%) | 54 (3.0%) |
| 12:00 PM to 3:59 PM | 182 (10.2%) | 283 (15.7%) |
| 4:00 PM to 11:59 PM | 105 (5.9%) | 169 (9.4%) |
| Total | 1,787 (100.0%) | 1,804 (100.0%) |
Housing Occupancy in Decorah
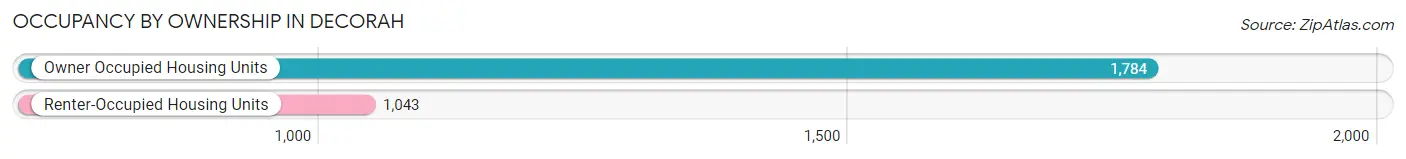
Occupancy by Ownership in Decorah
Of the total 2,827 dwellings in Decorah, owner-occupied units account for 1,784 (63.1%), while renter-occupied units make up 1,043 (36.9%).
| Occupancy | # Housing Units | % Housing Units |
| Owner Occupied Housing Units | 1,784 | 63.1% |
| Renter-Occupied Housing Units | 1,043 | 36.9% |
| Total Occupied Housing Units | 2,827 | 100.0% |
Occupancy by Household Size in Decorah
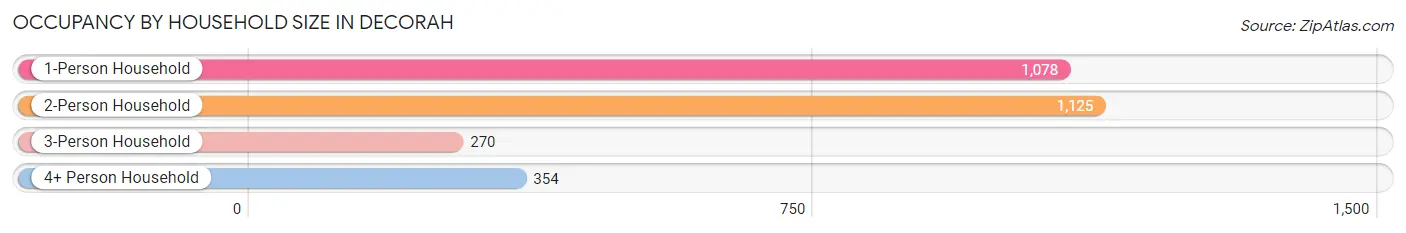
| Household Size | # Housing Units | % Housing Units |
| 1-Person Household | 1,078 | 38.1% |
| 2-Person Household | 1,125 | 39.8% |
| 3-Person Household | 270 | 9.6% |
| 4+ Person Household | 354 | 12.5% |
| Total Housing Units | 2,827 | 100.0% |
Occupancy by Ownership by Household Size in Decorah
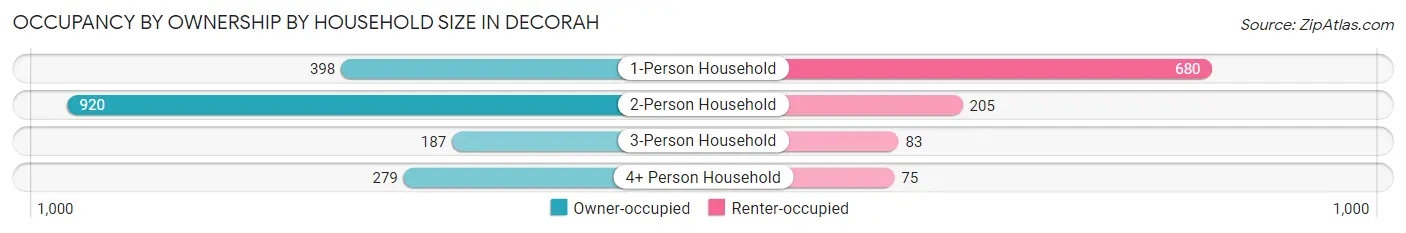
| Household Size | Owner-occupied | Renter-occupied |
| 1-Person Household | 398 (36.9%) | 680 (63.1%) |
| 2-Person Household | 920 (81.8%) | 205 (18.2%) |
| 3-Person Household | 187 (69.3%) | 83 (30.7%) |
| 4+ Person Household | 279 (78.8%) | 75 (21.2%) |
| Total Housing Units | 1,784 (63.1%) | 1,043 (36.9%) |
Occupancy by Educational Attainment in Decorah
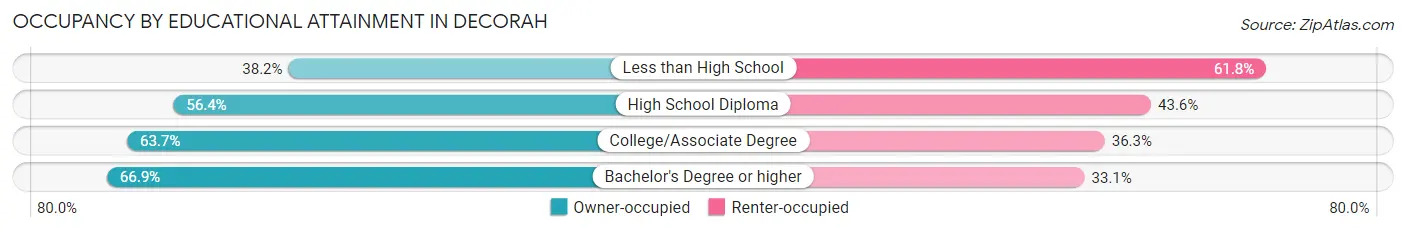
| Household Size | Owner-occupied | Renter-occupied |
| Less than High School | 29 (38.2%) | 47 (61.8%) |
| High School Diploma | 322 (56.4%) | 249 (43.6%) |
| College/Associate Degree | 522 (63.7%) | 297 (36.3%) |
| Bachelor's Degree or higher | 911 (66.9%) | 450 (33.1%) |
Occupancy by Age of Householder in Decorah
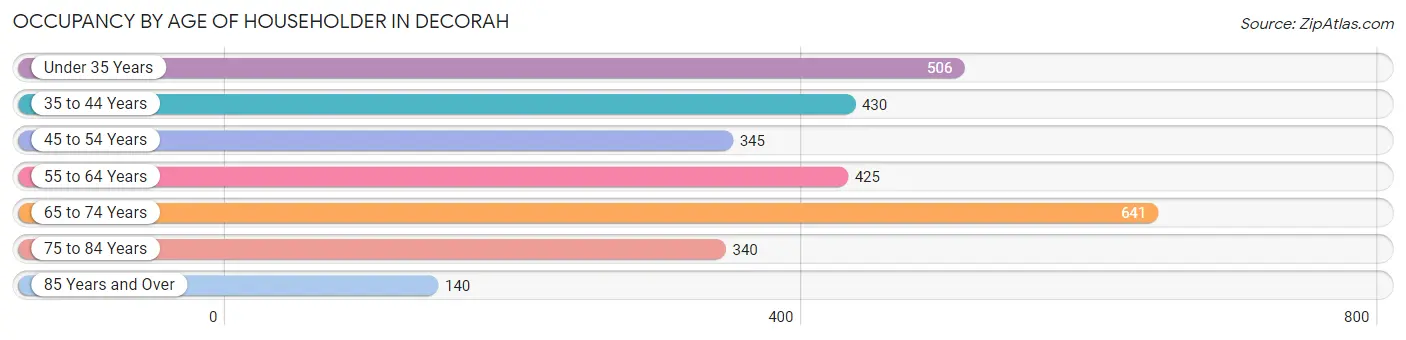
| Age Bracket | # Households | % Households |
| Under 35 Years | 506 | 17.9% |
| 35 to 44 Years | 430 | 15.2% |
| 45 to 54 Years | 345 | 12.2% |
| 55 to 64 Years | 425 | 15.0% |
| 65 to 74 Years | 641 | 22.7% |
| 75 to 84 Years | 340 | 12.0% |
| 85 Years and Over | 140 | 5.0% |
| Total | 2,827 | 100.0% |
Housing Finances in Decorah
Median Income by Occupancy in Decorah
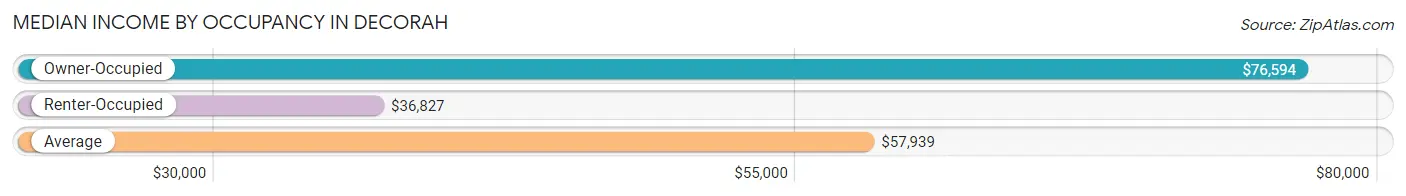
| Occupancy Type | # Households | Median Income |
| Owner-Occupied | 1,784 (63.1%) | $76,594 |
| Renter-Occupied | 1,043 (36.9%) | $36,827 |
| Average | 2,827 (100.0%) | $57,939 |
Occupancy by Householder Income Bracket in Decorah
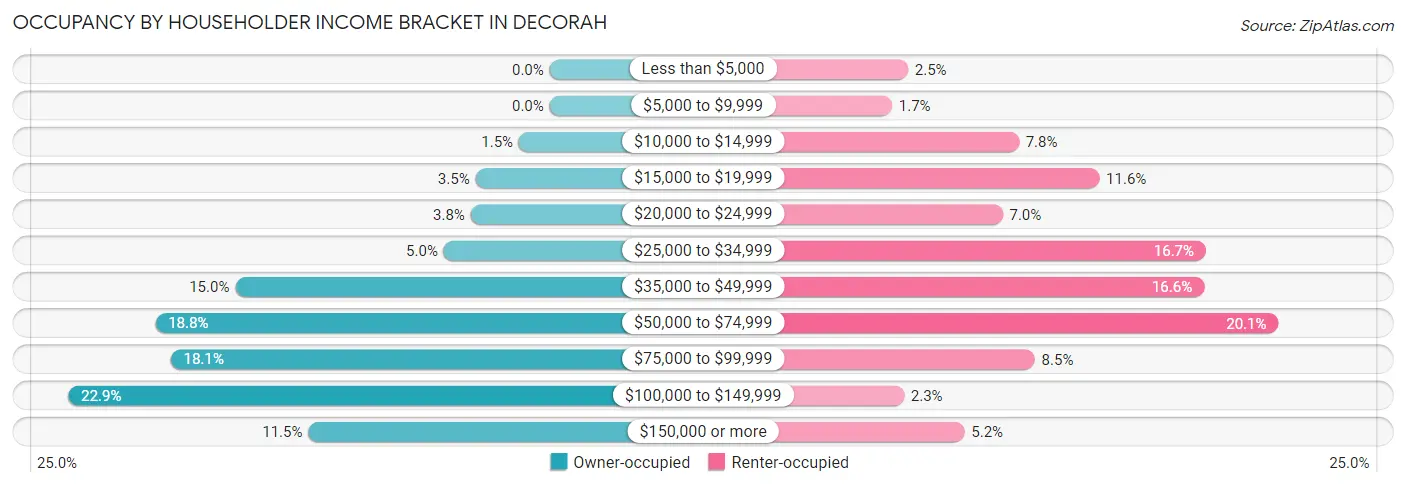
| Income Bracket | Owner-occupied | Renter-occupied |
| Less than $5,000 | 0 (0.0%) | 26 (2.5%) |
| $5,000 to $9,999 | 0 (0.0%) | 18 (1.7%) |
| $10,000 to $14,999 | 26 (1.5%) | 81 (7.8%) |
| $15,000 to $19,999 | 63 (3.5%) | 121 (11.6%) |
| $20,000 to $24,999 | 67 (3.8%) | 73 (7.0%) |
| $25,000 to $34,999 | 90 (5.0%) | 174 (16.7%) |
| $35,000 to $49,999 | 267 (15.0%) | 173 (16.6%) |
| $50,000 to $74,999 | 335 (18.8%) | 210 (20.1%) |
| $75,000 to $99,999 | 322 (18.0%) | 89 (8.5%) |
| $100,000 to $149,999 | 409 (22.9%) | 24 (2.3%) |
| $150,000 or more | 205 (11.5%) | 54 (5.2%) |
| Total | 1,784 (100.0%) | 1,043 (100.0%) |
Monthly Housing Cost Tiers in Decorah
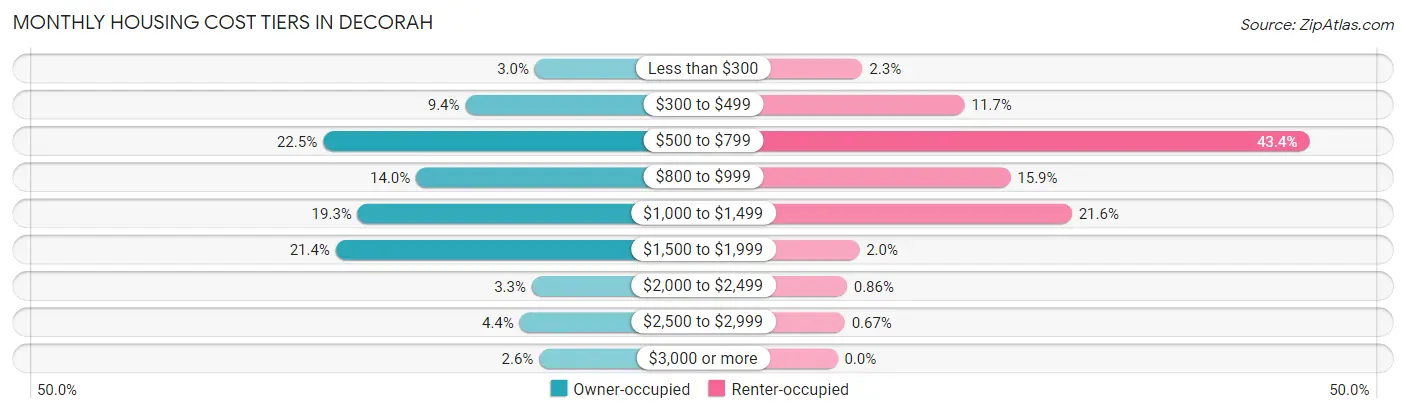
| Monthly Cost | Owner-occupied | Renter-occupied |
| Less than $300 | 54 (3.0%) | 24 (2.3%) |
| $300 to $499 | 168 (9.4%) | 122 (11.7%) |
| $500 to $799 | 402 (22.5%) | 453 (43.4%) |
| $800 to $999 | 249 (14.0%) | 166 (15.9%) |
| $1,000 to $1,499 | 345 (19.3%) | 225 (21.6%) |
| $1,500 to $1,999 | 381 (21.4%) | 21 (2.0%) |
| $2,000 to $2,499 | 59 (3.3%) | 9 (0.9%) |
| $2,500 to $2,999 | 79 (4.4%) | 7 (0.7%) |
| $3,000 or more | 47 (2.6%) | 0 (0.0%) |
| Total | 1,784 (100.0%) | 1,043 (100.0%) |
Physical Housing Characteristics in Decorah
Housing Structures in Decorah
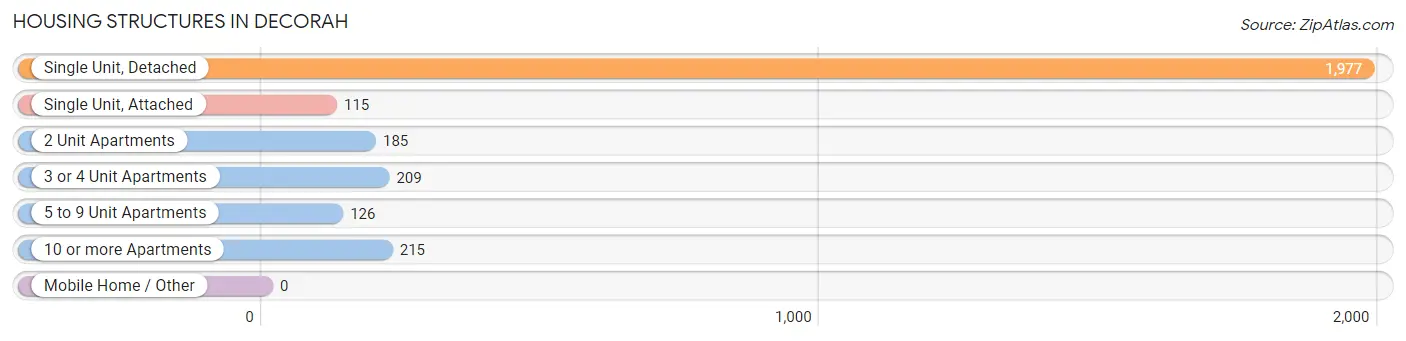
| Structure Type | # Housing Units | % Housing Units |
| Single Unit, Detached | 1,977 | 69.9% |
| Single Unit, Attached | 115 | 4.1% |
| 2 Unit Apartments | 185 | 6.5% |
| 3 or 4 Unit Apartments | 209 | 7.4% |
| 5 to 9 Unit Apartments | 126 | 4.5% |
| 10 or more Apartments | 215 | 7.6% |
| Mobile Home / Other | 0 | 0.0% |
| Total | 2,827 | 100.0% |
Housing Structures by Occupancy in Decorah
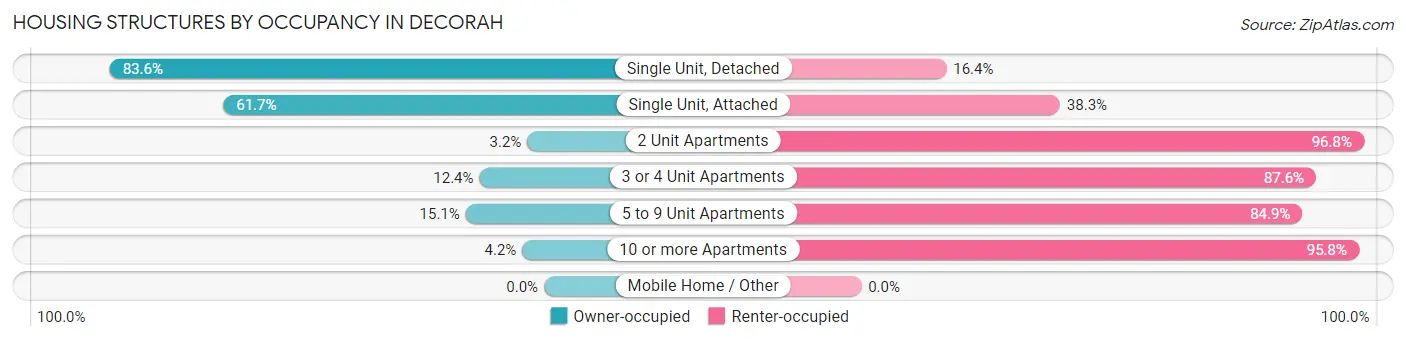
| Structure Type | Owner-occupied | Renter-occupied |
| Single Unit, Detached | 1,653 (83.6%) | 324 (16.4%) |
| Single Unit, Attached | 71 (61.7%) | 44 (38.3%) |
| 2 Unit Apartments | 6 (3.2%) | 179 (96.8%) |
| 3 or 4 Unit Apartments | 26 (12.4%) | 183 (87.6%) |
| 5 to 9 Unit Apartments | 19 (15.1%) | 107 (84.9%) |
| 10 or more Apartments | 9 (4.2%) | 206 (95.8%) |
| Mobile Home / Other | 0 (0.0%) | 0 (0.0%) |
| Total | 1,784 (63.1%) | 1,043 (36.9%) |
Housing Structures by Number of Rooms in Decorah
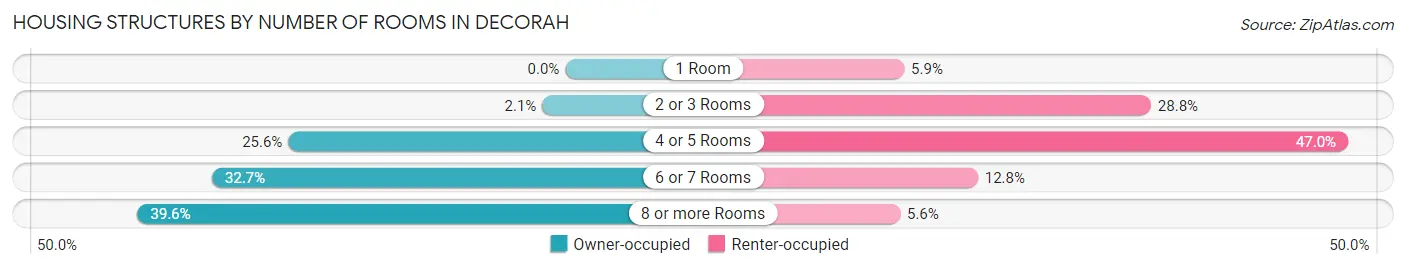
| Number of Rooms | Owner-occupied | Renter-occupied |
| 1 Room | 0 (0.0%) | 62 (5.9%) |
| 2 or 3 Rooms | 38 (2.1%) | 300 (28.8%) |
| 4 or 5 Rooms | 457 (25.6%) | 490 (47.0%) |
| 6 or 7 Rooms | 583 (32.7%) | 133 (12.8%) |
| 8 or more Rooms | 706 (39.6%) | 58 (5.6%) |
| Total | 1,784 (100.0%) | 1,043 (100.0%) |
Housing Structure by Heating Type in Decorah
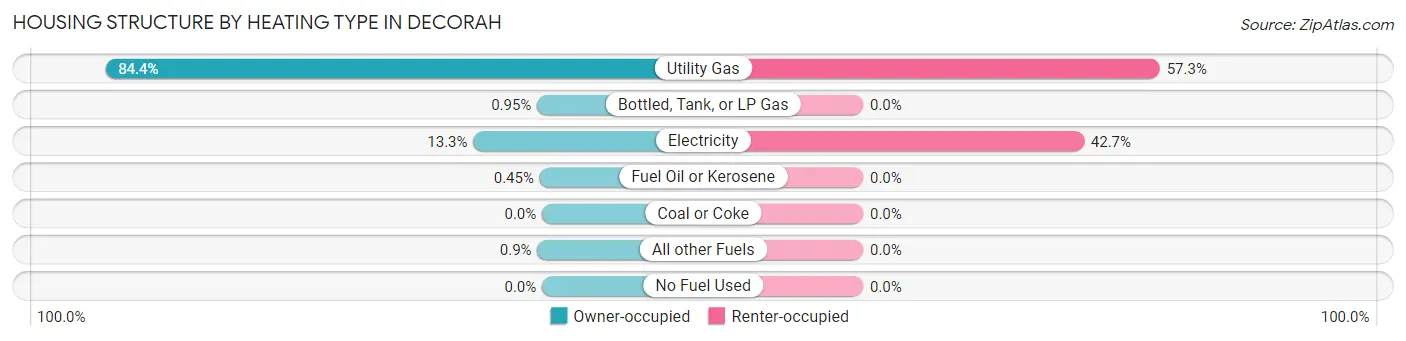
| Heating Type | Owner-occupied | Renter-occupied |
| Utility Gas | 1,506 (84.4%) | 598 (57.3%) |
| Bottled, Tank, or LP Gas | 17 (0.9%) | 0 (0.0%) |
| Electricity | 237 (13.3%) | 445 (42.7%) |
| Fuel Oil or Kerosene | 8 (0.4%) | 0 (0.0%) |
| Coal or Coke | 0 (0.0%) | 0 (0.0%) |
| All other Fuels | 16 (0.9%) | 0 (0.0%) |
| No Fuel Used | 0 (0.0%) | 0 (0.0%) |
| Total | 1,784 (100.0%) | 1,043 (100.0%) |
Household Vehicle Usage in Decorah
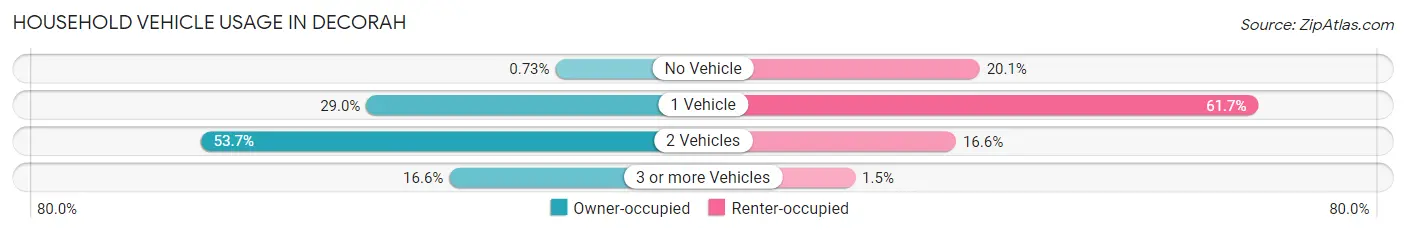
| Vehicles per Household | Owner-occupied | Renter-occupied |
| No Vehicle | 13 (0.7%) | 210 (20.1%) |
| 1 Vehicle | 517 (29.0%) | 644 (61.7%) |
| 2 Vehicles | 958 (53.7%) | 173 (16.6%) |
| 3 or more Vehicles | 296 (16.6%) | 16 (1.5%) |
| Total | 1,784 (100.0%) | 1,043 (100.0%) |
Real Estate & Mortgages in Decorah
Real Estate and Mortgage Overview in Decorah
| Characteristic | Without Mortgage | With Mortgage |
| Housing Units | 740 | 1,044 |
| Median Property Value | $225,000 | $231,700 |
| Median Household Income | $61,734 | $144 |
| Monthly Housing Costs | $614 | $47 |
| Real Estate Taxes | $3,100 | $22 |
Property Value by Mortgage Status in Decorah
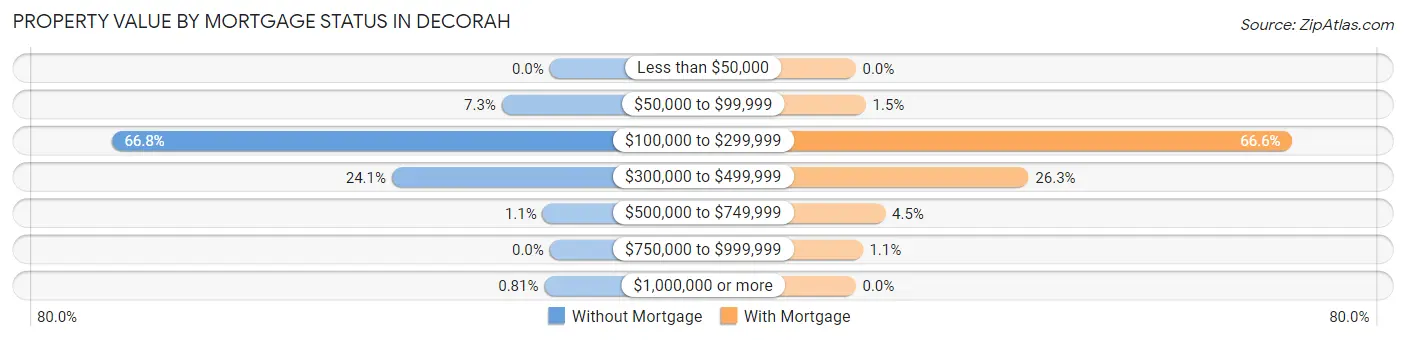
| Property Value | Without Mortgage | With Mortgage |
| Less than $50,000 | 0 (0.0%) | 0 (0.0%) |
| $50,000 to $99,999 | 54 (7.3%) | 16 (1.5%) |
| $100,000 to $299,999 | 494 (66.8%) | 695 (66.6%) |
| $300,000 to $499,999 | 178 (24.0%) | 275 (26.3%) |
| $500,000 to $749,999 | 8 (1.1%) | 47 (4.5%) |
| $750,000 to $999,999 | 0 (0.0%) | 11 (1.1%) |
| $1,000,000 or more | 6 (0.8%) | 0 (0.0%) |
| Total | 740 (100.0%) | 1,044 (100.0%) |
Household Income by Mortgage Status in Decorah
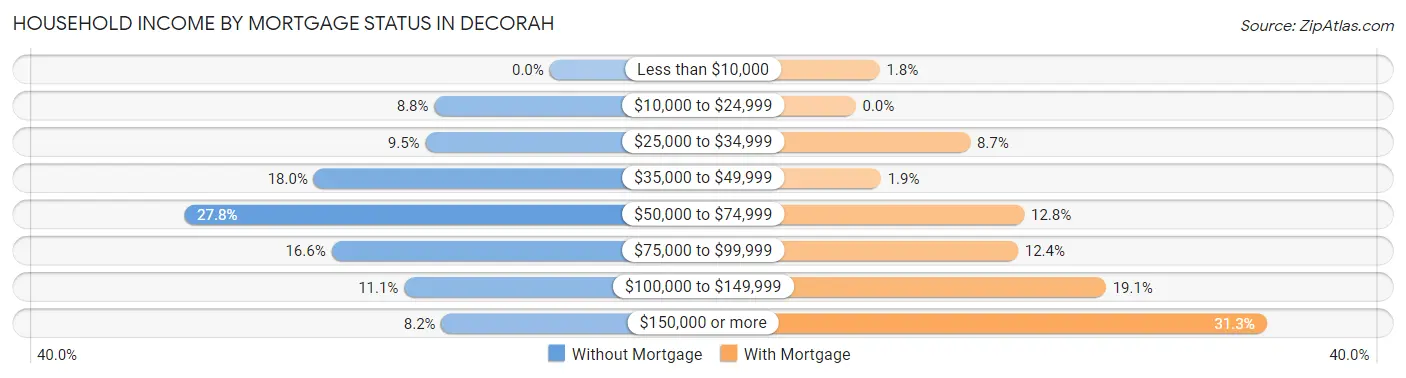
| Household Income | Without Mortgage | With Mortgage |
| Less than $10,000 | 0 (0.0%) | 19 (1.8%) |
| $10,000 to $24,999 | 65 (8.8%) | 0 (0.0%) |
| $25,000 to $34,999 | 70 (9.5%) | 91 (8.7%) |
| $35,000 to $49,999 | 133 (18.0%) | 20 (1.9%) |
| $50,000 to $74,999 | 206 (27.8%) | 134 (12.8%) |
| $75,000 to $99,999 | 123 (16.6%) | 129 (12.4%) |
| $100,000 to $149,999 | 82 (11.1%) | 199 (19.1%) |
| $150,000 or more | 61 (8.2%) | 327 (31.3%) |
| Total | 740 (100.0%) | 1,044 (100.0%) |
Property Value to Household Income Ratio in Decorah
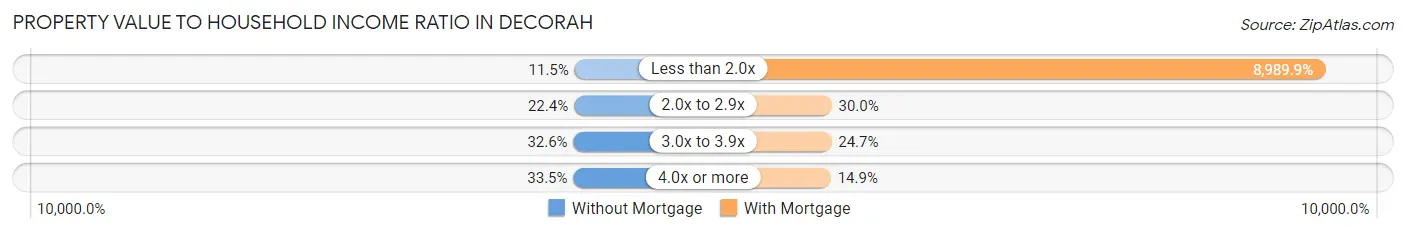
| Value-to-Income Ratio | Without Mortgage | With Mortgage |
| Less than 2.0x | 85 (11.5%) | 93,854 (8,989.8%) |
| 2.0x to 2.9x | 166 (22.4%) | 313 (30.0%) |
| 3.0x to 3.9x | 241 (32.6%) | 258 (24.7%) |
| 4.0x or more | 248 (33.5%) | 155 (14.8%) |
| Total | 740 (100.0%) | 1,044 (100.0%) |
Real Estate Taxes by Mortgage Status in Decorah
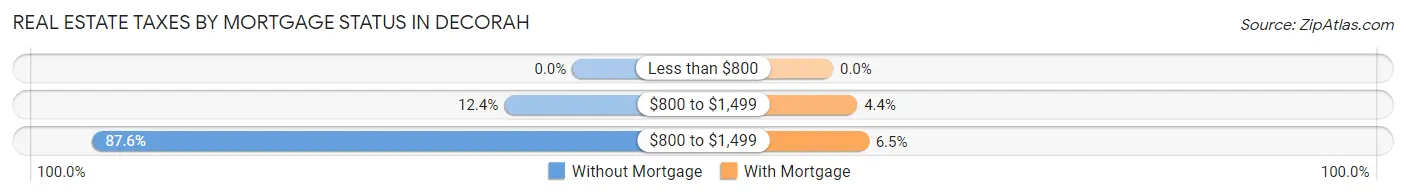
| Property Taxes | Without Mortgage | With Mortgage |
| Less than $800 | 0 (0.0%) | 0 (0.0%) |
| $800 to $1,499 | 92 (12.4%) | 46 (4.4%) |
| $800 to $1,499 | 648 (87.6%) | 68 (6.5%) |
| Total | 740 (100.0%) | 1,044 (100.0%) |
Health & Disability in Decorah
Health Insurance Coverage by Age in Decorah
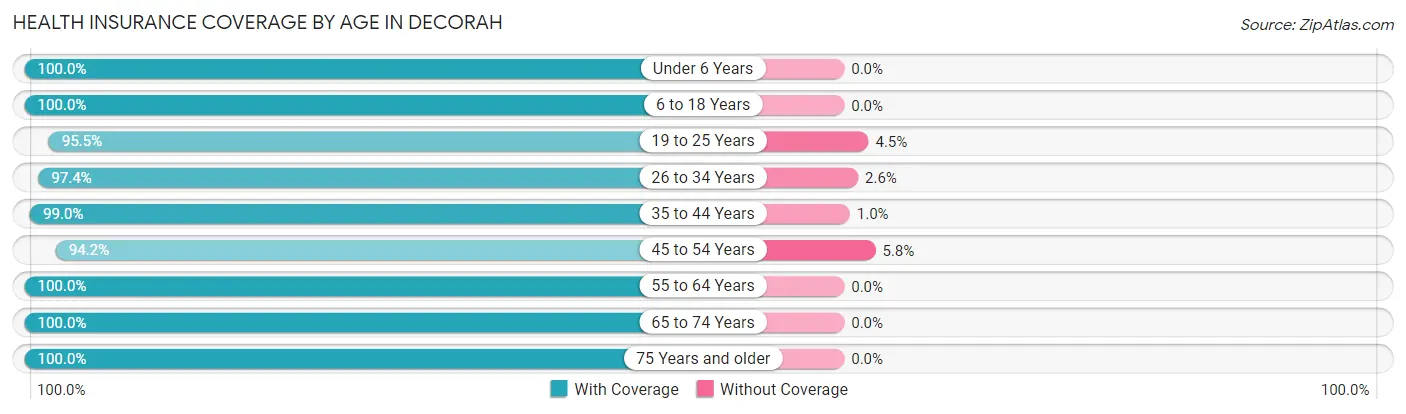
| Age Bracket | With Coverage | Without Coverage |
| Under 6 Years | 407 (100.0%) | 0 (0.0%) |
| 6 to 18 Years | 979 (100.0%) | 0 (0.0%) |
| 19 to 25 Years | 1,690 (95.5%) | 80 (4.5%) |
| 26 to 34 Years | 641 (97.4%) | 17 (2.6%) |
| 35 to 44 Years | 672 (99.0%) | 7 (1.0%) |
| 45 to 54 Years | 614 (94.2%) | 38 (5.8%) |
| 55 to 64 Years | 631 (100.0%) | 0 (0.0%) |
| 65 to 74 Years | 957 (100.0%) | 0 (0.0%) |
| 75 Years and older | 741 (100.0%) | 0 (0.0%) |
| Total | 7,332 (98.1%) | 142 (1.9%) |
Health Insurance Coverage by Citizenship Status in Decorah
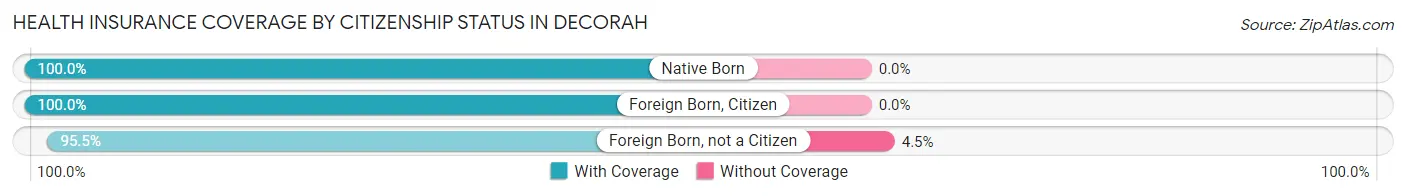
| Citizenship Status | With Coverage | Without Coverage |
| Native Born | 407 (100.0%) | 0 (0.0%) |
| Foreign Born, Citizen | 979 (100.0%) | 0 (0.0%) |
| Foreign Born, not a Citizen | 1,690 (95.5%) | 80 (4.5%) |
Health Insurance Coverage by Household Income in Decorah
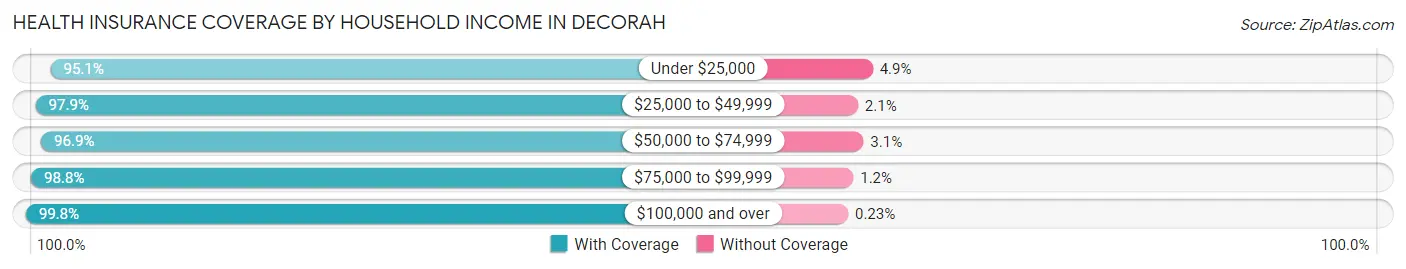
| Household Income | With Coverage | Without Coverage |
| Under $25,000 | 685 (95.1%) | 35 (4.9%) |
| $25,000 to $49,999 | 1,085 (97.9%) | 23 (2.1%) |
| $50,000 to $74,999 | 1,090 (96.9%) | 35 (3.1%) |
| $75,000 to $99,999 | 969 (98.8%) | 12 (1.2%) |
| $100,000 and over | 1,720 (99.8%) | 4 (0.2%) |
Public vs Private Health Insurance Coverage by Age in Decorah
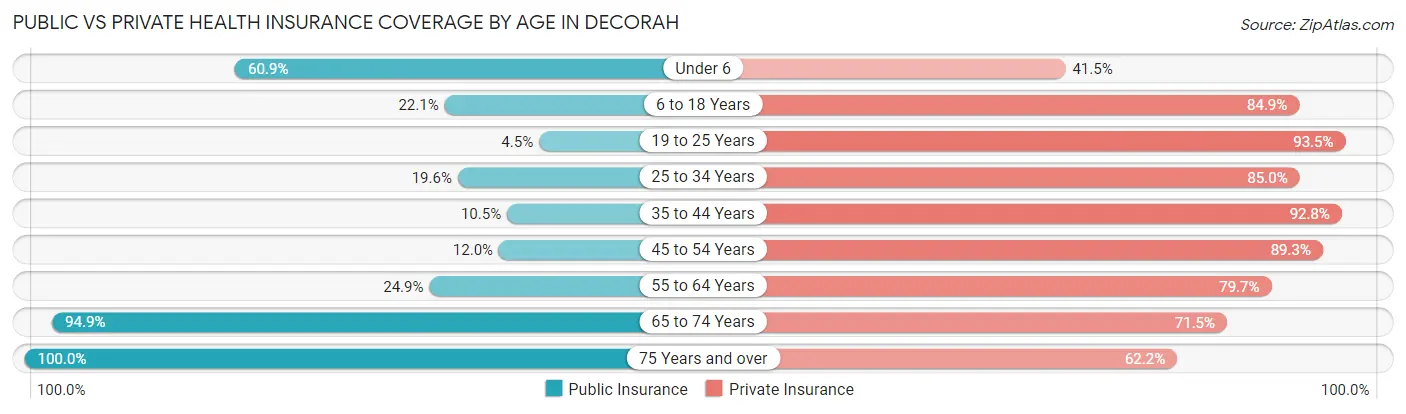
| Age Bracket | Public Insurance | Private Insurance |
| Under 6 | 248 (60.9%) | 169 (41.5%) |
| 6 to 18 Years | 216 (22.1%) | 831 (84.9%) |
| 19 to 25 Years | 80 (4.5%) | 1,654 (93.4%) |
| 25 to 34 Years | 129 (19.6%) | 559 (85.0%) |
| 35 to 44 Years | 71 (10.5%) | 630 (92.8%) |
| 45 to 54 Years | 78 (12.0%) | 582 (89.3%) |
| 55 to 64 Years | 157 (24.9%) | 503 (79.7%) |
| 65 to 74 Years | 908 (94.9%) | 684 (71.5%) |
| 75 Years and over | 741 (100.0%) | 461 (62.2%) |
| Total | 2,628 (35.2%) | 6,073 (81.3%) |
Disability Status by Sex by Age in Decorah
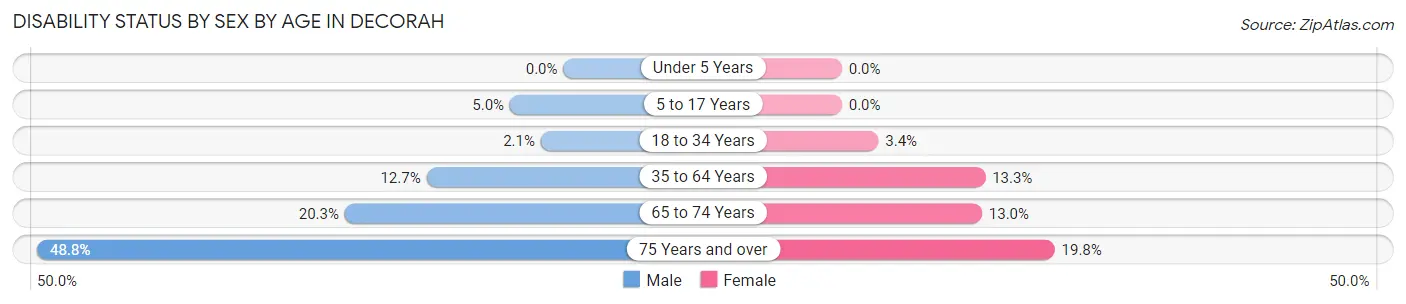
| Age Bracket | Male | Female |
| Under 5 Years | 0 (0.0%) | 0 (0.0%) |
| 5 to 17 Years | 20 (5.0%) | 0 (0.0%) |
| 18 to 34 Years | 27 (2.1%) | 50 (3.4%) |
| 35 to 64 Years | 127 (12.7%) | 128 (13.3%) |
| 65 to 74 Years | 88 (20.3%) | 68 (13.0%) |
| 75 Years and over | 169 (48.8%) | 78 (19.8%) |
Disability Class by Sex by Age in Decorah
Disability Class: Hearing Difficulty

| Age Bracket | Male | Female |
| Under 5 Years | 0 (0.0%) | 0 (0.0%) |
| 5 to 17 Years | 0 (0.0%) | 0 (0.0%) |
| 18 to 34 Years | 0 (0.0%) | 0 (0.0%) |
| 35 to 64 Years | 31 (3.1%) | 18 (1.9%) |
| 65 to 74 Years | 53 (12.2%) | 13 (2.5%) |
| 75 Years and over | 86 (24.9%) | 28 (7.1%) |
Disability Class: Vision Difficulty
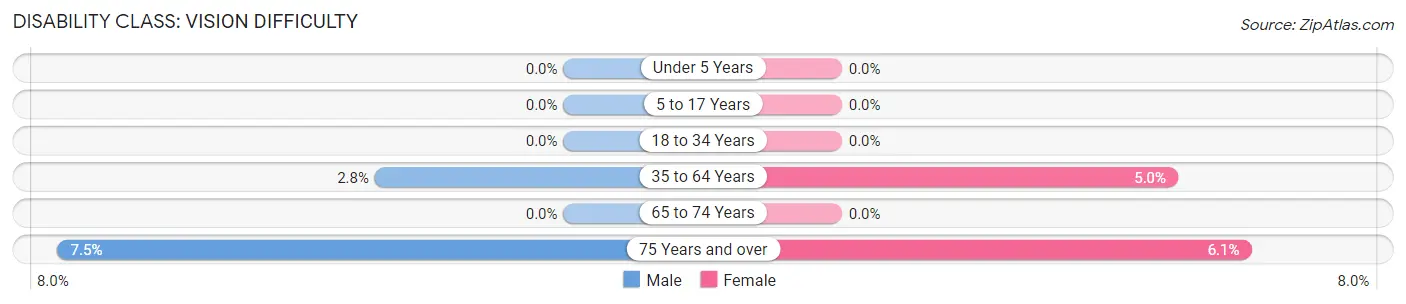
| Age Bracket | Male | Female |
| Under 5 Years | 0 (0.0%) | 0 (0.0%) |
| 5 to 17 Years | 0 (0.0%) | 0 (0.0%) |
| 18 to 34 Years | 0 (0.0%) | 0 (0.0%) |
| 35 to 64 Years | 28 (2.8%) | 48 (5.0%) |
| 65 to 74 Years | 0 (0.0%) | 0 (0.0%) |
| 75 Years and over | 26 (7.5%) | 24 (6.1%) |
Disability Class: Cognitive Difficulty
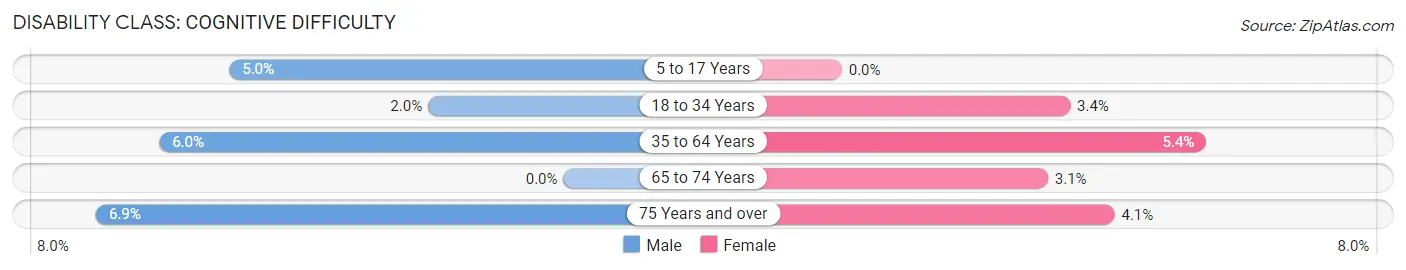
| Age Bracket | Male | Female |
| 5 to 17 Years | 20 (5.0%) | 0 (0.0%) |
| 18 to 34 Years | 26 (2.0%) | 50 (3.4%) |
| 35 to 64 Years | 60 (6.0%) | 52 (5.4%) |
| 65 to 74 Years | 0 (0.0%) | 16 (3.1%) |
| 75 Years and over | 24 (6.9%) | 16 (4.1%) |
Disability Class: Ambulatory Difficulty
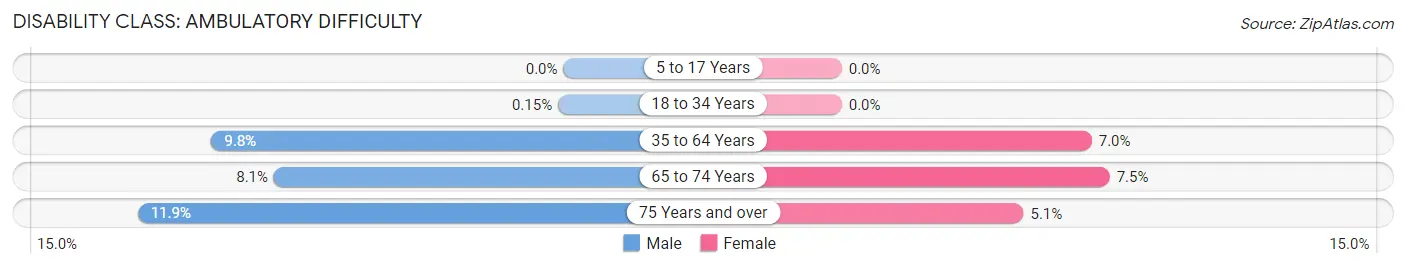
| Age Bracket | Male | Female |
| 5 to 17 Years | 0 (0.0%) | 0 (0.0%) |
| 18 to 34 Years | 2 (0.2%) | 0 (0.0%) |
| 35 to 64 Years | 98 (9.8%) | 67 (7.0%) |
| 65 to 74 Years | 35 (8.1%) | 39 (7.5%) |
| 75 Years and over | 41 (11.8%) | 20 (5.1%) |
Disability Class: Self-Care Difficulty
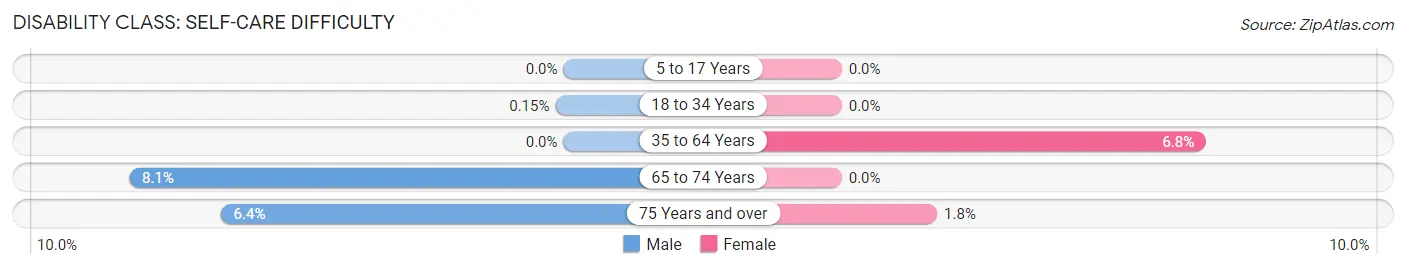
| Age Bracket | Male | Female |
| 5 to 17 Years | 0 (0.0%) | 0 (0.0%) |
| 18 to 34 Years | 2 (0.2%) | 0 (0.0%) |
| 35 to 64 Years | 0 (0.0%) | 65 (6.8%) |
| 65 to 74 Years | 35 (8.1%) | 0 (0.0%) |
| 75 Years and over | 22 (6.4%) | 7 (1.8%) |
Technology Access in Decorah
Computing Device Access in Decorah
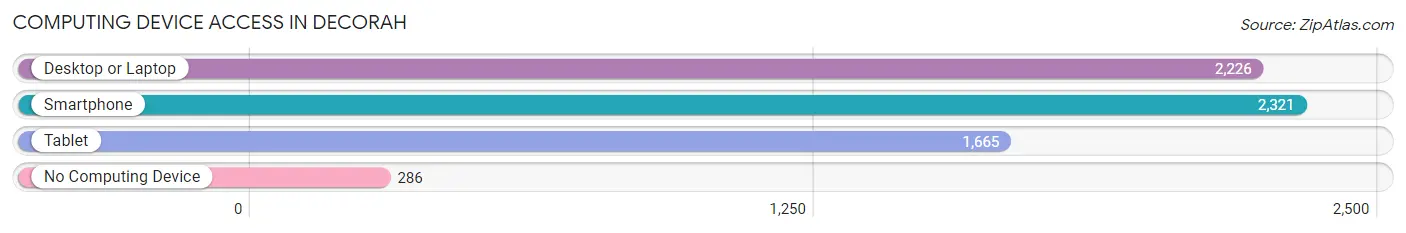
| Device Type | # Households | % Households |
| Desktop or Laptop | 2,226 | 78.7% |
| Smartphone | 2,321 | 82.1% |
| Tablet | 1,665 | 58.9% |
| No Computing Device | 286 | 10.1% |
| Total | 2,827 | 100.0% |
Internet Access in Decorah
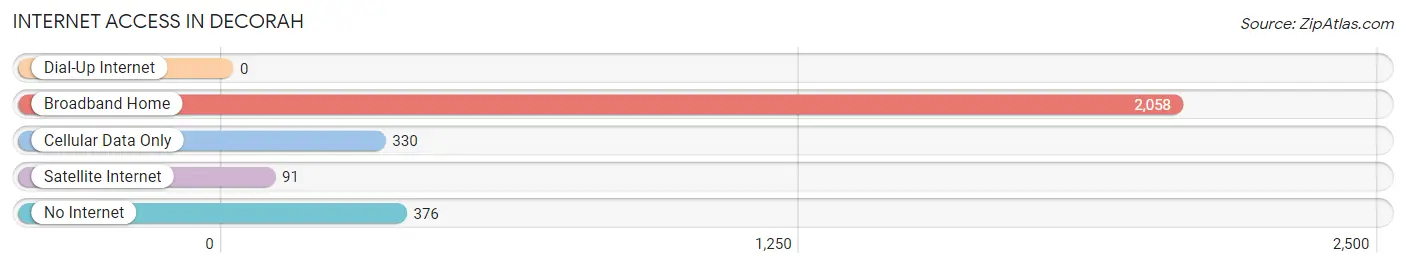
| Internet Type | # Households | % Households |
| Dial-Up Internet | 0 | 0.0% |
| Broadband Home | 2,058 | 72.8% |
| Cellular Data Only | 330 | 11.7% |
| Satellite Internet | 91 | 3.2% |
| No Internet | 376 | 13.3% |
| Total | 2,827 | 100.0% |
Decorah Summary
Decorah, Iowa is a small city located in the northeast corner of the state, in Winneshiek County. It is situated along the Upper Iowa River, and is the county seat. The city has a population of 8,127, according to the 2010 census.
History
Decorah was founded in 1849 by Norwegian immigrants, who named the city after the Norwegian city of the same name. The city was incorporated in 1855, and the first post office was established in 1856. The city was a major center of Norwegian immigration to the United States, and the Norwegian language was spoken in the city until the early 20th century.
The city was an important center of commerce in the 19th century, and was home to several industries, including a woolen mill, a flour mill, and a brewery. The city was also home to several educational institutions, including Luther College, founded in 1861.
Geography
Decorah is located in the northeast corner of Iowa, in Winneshiek County. The city is situated along the Upper Iowa River, and is surrounded by rolling hills and bluffs. The city is located about 30 miles from the Minnesota border, and about 90 miles from the Mississippi River.
The city has a total area of 5.3 square miles, of which 5.2 square miles is land and 0.1 square miles is water. The city has a humid continental climate, with cold winters and hot, humid summers.
Economy
Decorah has a diverse economy, with a mix of manufacturing, retail, and service industries. The city is home to several large employers, including Winneshiek Medical Center, Decorah Newspapers, and the Decorah Hatchery. The city is also home to several small businesses, including restaurants, shops, and galleries.
The city is also home to several educational institutions, including Luther College, the Northeast Iowa Community College, and the Decorah Public Library.
Demographics
According to the 2010 census, Decorah has a population of 8,127. The racial makeup of the city is 95.2% White, 0.7% African American, 0.4% Native American, 1.2% Asian, 0.1% Pacific Islander, 1.2% from other races, and 1.2% from two or more races. Hispanic or Latino of any race were 3.2% of the population.
The median income for a household in the city was $45,945, and the median income for a family was $58,958. The per capita income for the city was $22,945. About 8.2% of families and 11.2% of the population were below the poverty line, including 14.2% of those under age 18 and 8.2% of those age 65 or over.
Common Questions
What is Per Capita Income in Decorah?
Per Capita income in Decorah is $31,226.
What is the Median Family Income in Decorah?
Median Family Income in Decorah is $79,300.
What is the Median Household income in Decorah?
Median Household Income in Decorah is $57,939.
What is Income or Wage Gap in Decorah?
Income or Wage Gap in Decorah is 41.9%.
Women in Decorah earn 58.1 cents for every dollar earned by a man.
What is Inequality or Gini Index in Decorah?
Inequality or Gini Index in Decorah is 0.45.
What is the Total Population of Decorah?
Total Population of Decorah is 7,611.
What is the Total Male Population of Decorah?
Total Male Population of Decorah is 3,658.
What is the Total Female Population of Decorah?
Total Female Population of Decorah is 3,953.
What is the Ratio of Males per 100 Females in Decorah?
There are 92.54 Males per 100 Females in Decorah.
What is the Ratio of Females per 100 Males in Decorah?
There are 108.06 Females per 100 Males in Decorah.
What is the Median Population Age in Decorah?
Median Population Age in Decorah is 34.8 Years.
What is the Average Family Size in Decorah
Average Family Size in Decorah is 2.6 People.
What is the Average Household Size in Decorah
Average Household Size in Decorah is 2.0 People.
How Large is the Labor Force in Decorah?
There are 4,174 People in the Labor Forcein in Decorah.
What is the Percentage of People in the Labor Force in Decorah?
62.5% of People are in the Labor Force in Decorah.
What is the Unemployment Rate in Decorah?
Unemployment Rate in Decorah is 3.3%.