Decatur, IL Map & Demographics
Decatur Map
Decatur Overview
$31,233
PER CAPITA INCOME
$70,663
AVG FAMILY INCOME
$49,039
AVG HOUSEHOLD INCOME
28.6%
WAGE / INCOME GAP [ % ]
71.4¢/ $1
WAGE / INCOME GAP [ $ ]
$12,323
FAMILY INCOME DEFICIT
0.48
INEQUALITY / GINI INDEX
70,975
TOTAL POPULATION
33,662
MALE POPULATION
37,313
FEMALE POPULATION
90.22
MALES / 100 FEMALES
110.85
FEMALES / 100 MALES
39.7
MEDIAN AGE
3.0
AVG FAMILY SIZE
2.2
AVG HOUSEHOLD SIZE
32,713
LABOR FORCE [ PEOPLE ]
56.7%
PERCENT IN LABOR FORCE
8.9%
UNEMPLOYMENT RATE
Decatur Area Codes
Income in Decatur
Income Overview in Decatur
Per Capita Income in Decatur is $31,233, while median incomes of families and households are $70,663 and $49,039 respectively.
| Characteristic | Number | Measure |
| Per Capita Income | 70,975 | $31,233 |
| Median Family Income | 16,258 | $70,663 |
| Mean Family Income | 16,258 | $90,213 |
| Median Household Income | 30,727 | $49,039 |
| Mean Household Income | 30,727 | $70,219 |
| Income Deficit | 16,258 | $12,323 |
| Wage / Income Gap (%) | 70,975 | 28.60% |
| Wage / Income Gap ($) | 70,975 | 71.40¢ per $1 |
| Gini / Inequality Index | 70,975 | 0.48 |
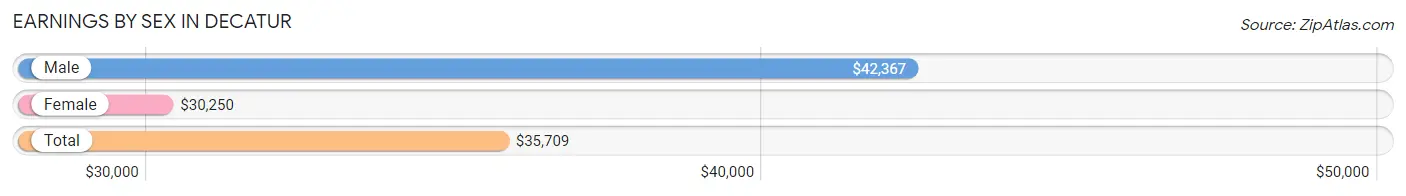
Earnings by Sex in Decatur
Average Earnings in Decatur are $35,709, $42,367 for men and $30,250 for women, a difference of 28.6%.
| Sex | Number | Average Earnings |
| Male | 16,585 (49.3%) | $42,367 |
| Female | 17,064 (50.7%) | $30,250 |
| Total | 33,649 (100.0%) | $35,709 |
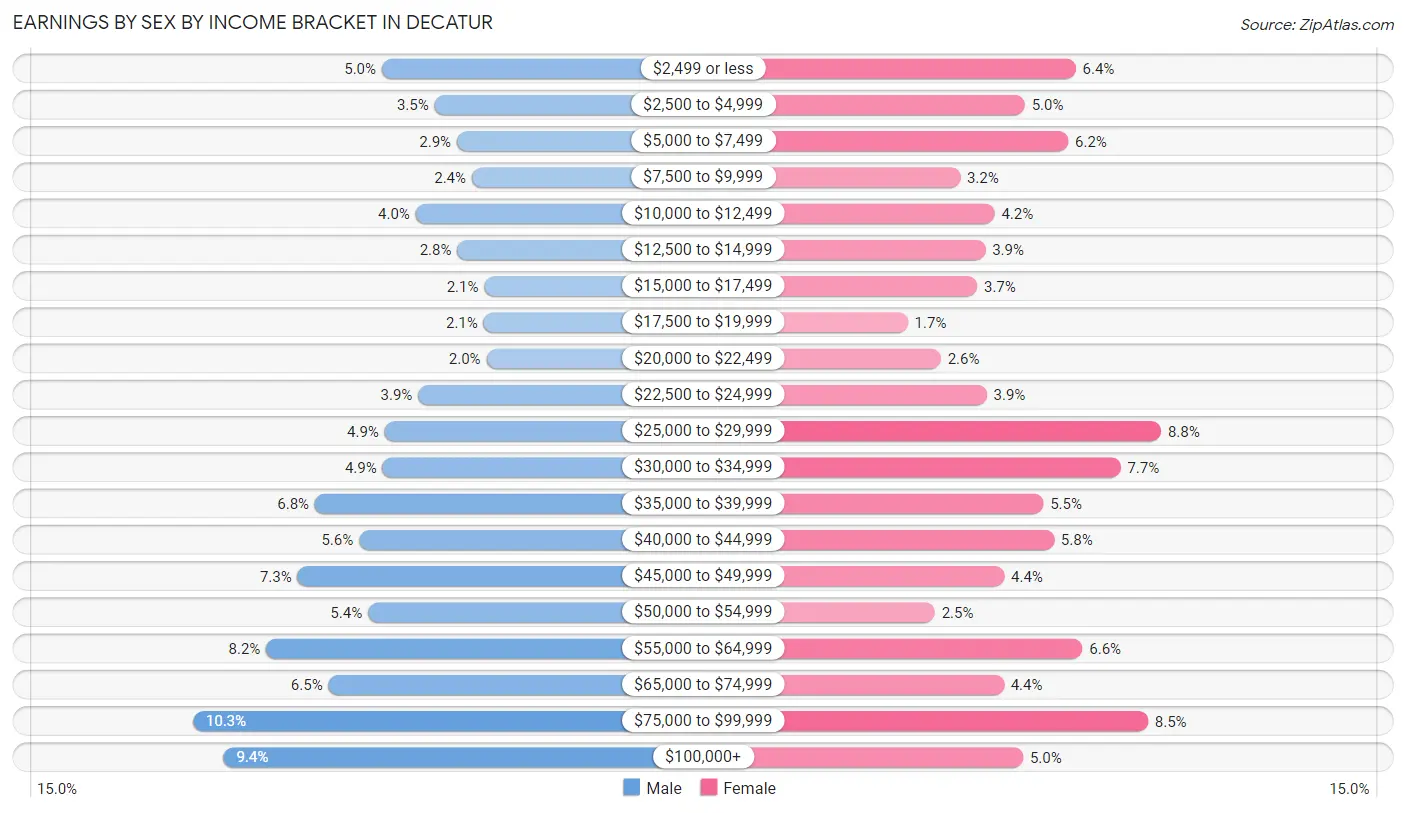
Earnings by Sex by Income Bracket in Decatur
The most common earnings brackets in Decatur are $75,000 to $99,999 for men (1,704 | 10.3%) and $25,000 to $29,999 for women (1,507 | 8.8%).
| Income | Male | Female |
| $2,499 or less | 823 (5.0%) | 1,098 (6.4%) |
| $2,500 to $4,999 | 577 (3.5%) | 854 (5.0%) |
| $5,000 to $7,499 | 473 (2.9%) | 1,061 (6.2%) |
| $7,500 to $9,999 | 403 (2.4%) | 542 (3.2%) |
| $10,000 to $12,499 | 665 (4.0%) | 709 (4.2%) |
| $12,500 to $14,999 | 471 (2.8%) | 664 (3.9%) |
| $15,000 to $17,499 | 345 (2.1%) | 625 (3.7%) |
| $17,500 to $19,999 | 349 (2.1%) | 291 (1.7%) |
| $20,000 to $22,499 | 335 (2.0%) | 451 (2.6%) |
| $22,500 to $24,999 | 653 (3.9%) | 670 (3.9%) |
| $25,000 to $29,999 | 810 (4.9%) | 1,507 (8.8%) |
| $30,000 to $34,999 | 819 (4.9%) | 1,312 (7.7%) |
| $35,000 to $39,999 | 1,134 (6.8%) | 942 (5.5%) |
| $40,000 to $44,999 | 928 (5.6%) | 993 (5.8%) |
| $45,000 to $49,999 | 1,215 (7.3%) | 754 (4.4%) |
| $50,000 to $54,999 | 888 (5.3%) | 421 (2.5%) |
| $55,000 to $64,999 | 1,361 (8.2%) | 1,130 (6.6%) |
| $65,000 to $74,999 | 1,072 (6.5%) | 752 (4.4%) |
| $75,000 to $99,999 | 1,704 (10.3%) | 1,443 (8.5%) |
| $100,000+ | 1,560 (9.4%) | 845 (5.0%) |
| Total | 16,585 (100.0%) | 17,064 (100.0%) |
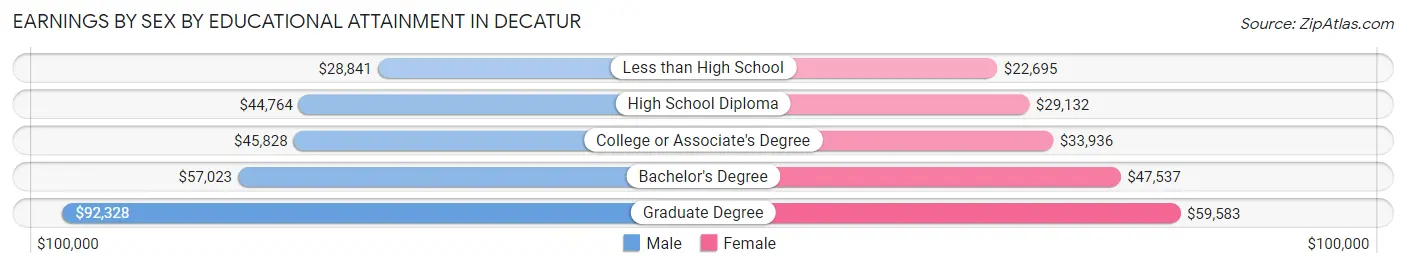
Earnings by Sex by Educational Attainment in Decatur
Average earnings in Decatur are $47,347 for men and $34,827 for women, a difference of 26.4%. Men with an educational attainment of graduate degree enjoy the highest average annual earnings of $92,328, while those with less than high school education earn the least with $28,841. Women with an educational attainment of graduate degree earn the most with the average annual earnings of $59,583, while those with less than high school education have the smallest earnings of $22,695.
| Educational Attainment | Male Income | Female Income |
| Less than High School | $28,841 | $22,695 |
| High School Diploma | $44,764 | $29,132 |
| College or Associate's Degree | $45,828 | $33,936 |
| Bachelor's Degree | $57,023 | $47,537 |
| Graduate Degree | $92,328 | $59,583 |
| Total | $47,347 | $34,827 |
Family Income in Decatur
Family Income Brackets in Decatur
According to the Decatur family income data, there are 2,845 families falling into the $100,000 to $149,999 income range, which is the most common income bracket and makes up 17.5% of all families. Conversely, the $10,000 to $14,999 income bracket is the least frequent group with only 471 families (2.9%) belonging to this category.
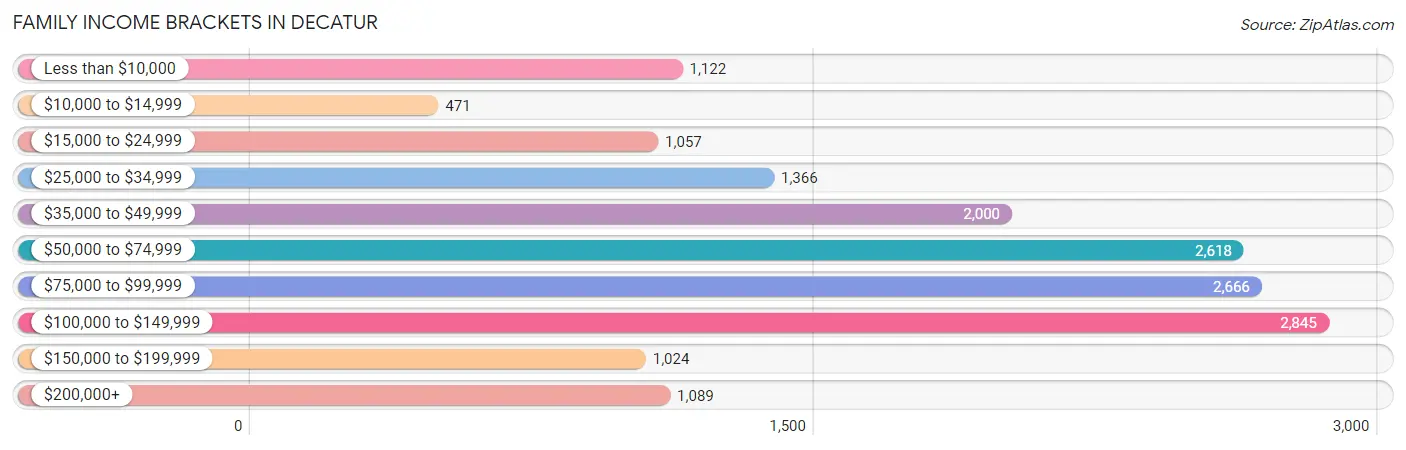
| Income Bracket | # Families | % Families |
| Less than $10,000 | 1,122 | 6.9% |
| $10,000 to $14,999 | 471 | 2.9% |
| $15,000 to $24,999 | 1,057 | 6.5% |
| $25,000 to $34,999 | 1,366 | 8.4% |
| $35,000 to $49,999 | 2,000 | 12.3% |
| $50,000 to $74,999 | 2,618 | 16.1% |
| $75,000 to $99,999 | 2,666 | 16.4% |
| $100,000 to $149,999 | 2,845 | 17.5% |
| $150,000 to $199,999 | 1,024 | 6.3% |
| $200,000+ | 1,089 | 6.7% |
Family Income by Famaliy Size in Decatur
7+ person families (94 | 0.6%) account for the highest median family income in Decatur with $124,583 per family, while 2-person families (9,904 | 60.9%) have the highest median income of $33,574 per family member.
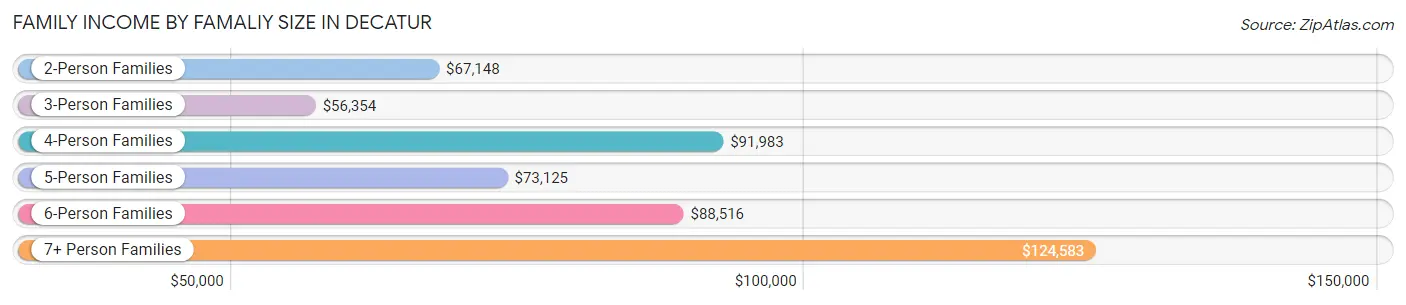
| Income Bracket | # Families | Median Income |
| 2-Person Families | 9,904 (60.9%) | $67,148 |
| 3-Person Families | 3,011 (18.5%) | $56,354 |
| 4-Person Families | 1,693 (10.4%) | $91,983 |
| 5-Person Families | 877 (5.4%) | $73,125 |
| 6-Person Families | 679 (4.2%) | $88,516 |
| 7+ Person Families | 94 (0.6%) | $124,583 |
| Total | 16,258 (100.0%) | $70,663 |
Family Income by Number of Earners in Decatur
The median family income in Decatur is $70,663, with families comprising 3+ earners (925) having the highest median family income of $104,972, while families with no earners (3,558) have the lowest median family income of $45,028, accounting for 5.7% and 21.9% of families, respectively.
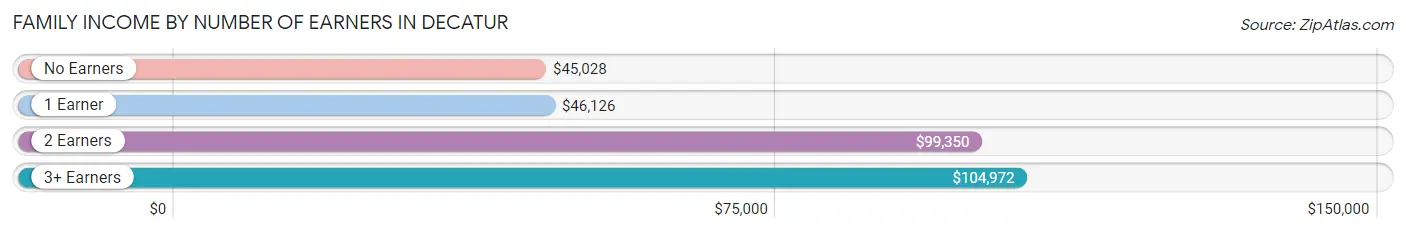
| Number of Earners | # Families | Median Income |
| No Earners | 3,558 (21.9%) | $45,028 |
| 1 Earner | 5,545 (34.1%) | $46,126 |
| 2 Earners | 6,230 (38.3%) | $99,350 |
| 3+ Earners | 925 (5.7%) | $104,972 |
| Total | 16,258 (100.0%) | $70,663 |
Household Income in Decatur
Household Income Brackets in Decatur
With 5,162 households falling in the category, the $50,000 to $74,999 income range is the most frequent in Decatur, accounting for 16.8% of all households. In contrast, only 1,260 households (4.1%) fall into the $150,000 to $199,999 income bracket, making it the least populous group.
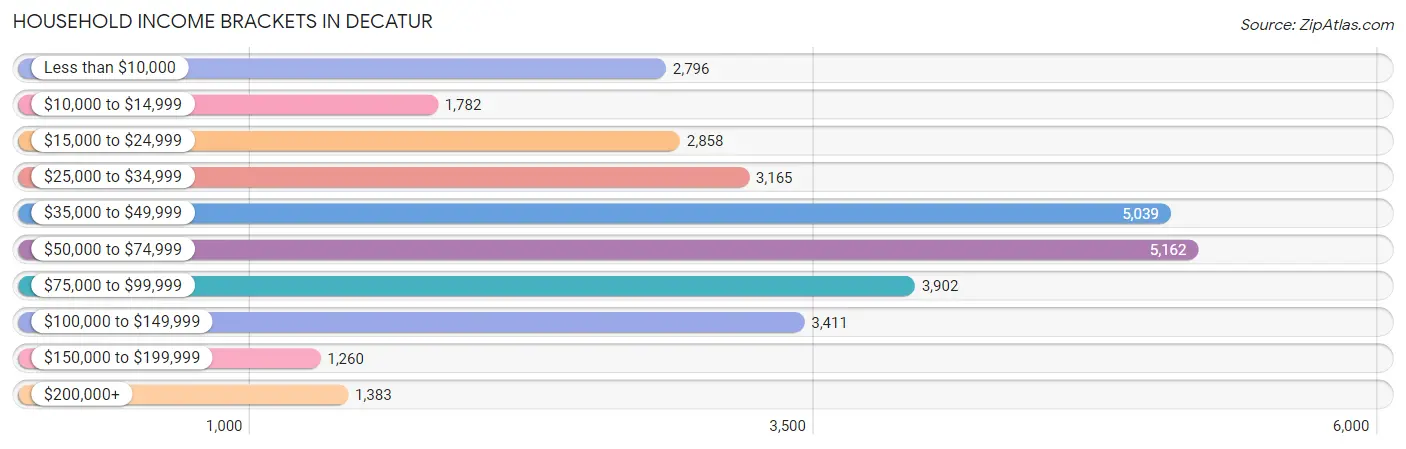
| Income Bracket | # Households | % Households |
| Less than $10,000 | 2,796 | 9.1% |
| $10,000 to $14,999 | 1,782 | 5.8% |
| $15,000 to $24,999 | 2,858 | 9.3% |
| $25,000 to $34,999 | 3,165 | 10.3% |
| $35,000 to $49,999 | 5,039 | 16.4% |
| $50,000 to $74,999 | 5,162 | 16.8% |
| $75,000 to $99,999 | 3,902 | 12.7% |
| $100,000 to $149,999 | 3,411 | 11.1% |
| $150,000 to $199,999 | 1,260 | 4.1% |
| $200,000+ | 1,383 | 4.5% |
Household Income by Householder Age in Decatur
The median household income in Decatur is $49,039, with the highest median household income of $56,952 found in the 45 to 64 years age bracket for the primary householder. A total of 10,308 households (33.6%) fall into this category. Meanwhile, the 15 to 24 years age bracket for the primary householder has the lowest median household income of $28,417, with 1,667 households (5.4%) in this group.
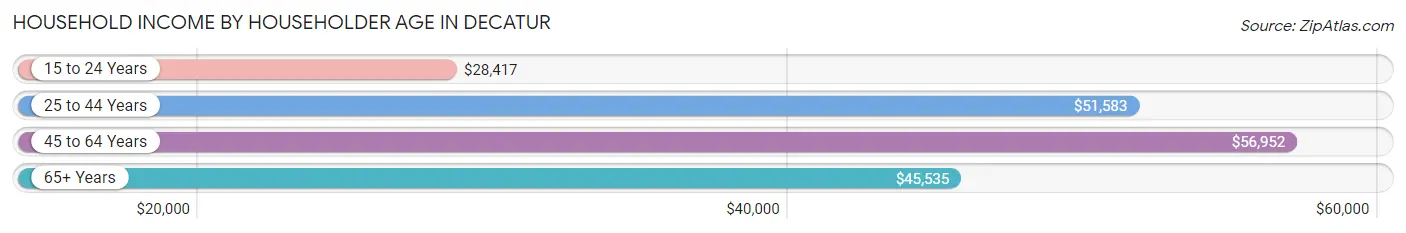
| Income Bracket | # Households | Median Income |
| 15 to 24 Years | 1,667 (5.4%) | $28,417 |
| 25 to 44 Years | 9,356 (30.4%) | $51,583 |
| 45 to 64 Years | 10,308 (33.6%) | $56,952 |
| 65+ Years | 9,396 (30.6%) | $45,535 |
| Total | 30,727 (100.0%) | $49,039 |
Poverty in Decatur
Income Below Poverty by Sex and Age in Decatur
With 16.9% poverty level for males and 21.8% for females among the residents of Decatur, under 5 year old males and 18 to 24 year old females are the most vulnerable to poverty, with 597 males (28.4%) and 1,200 females (36.1%) in their respective age groups living below the poverty level.
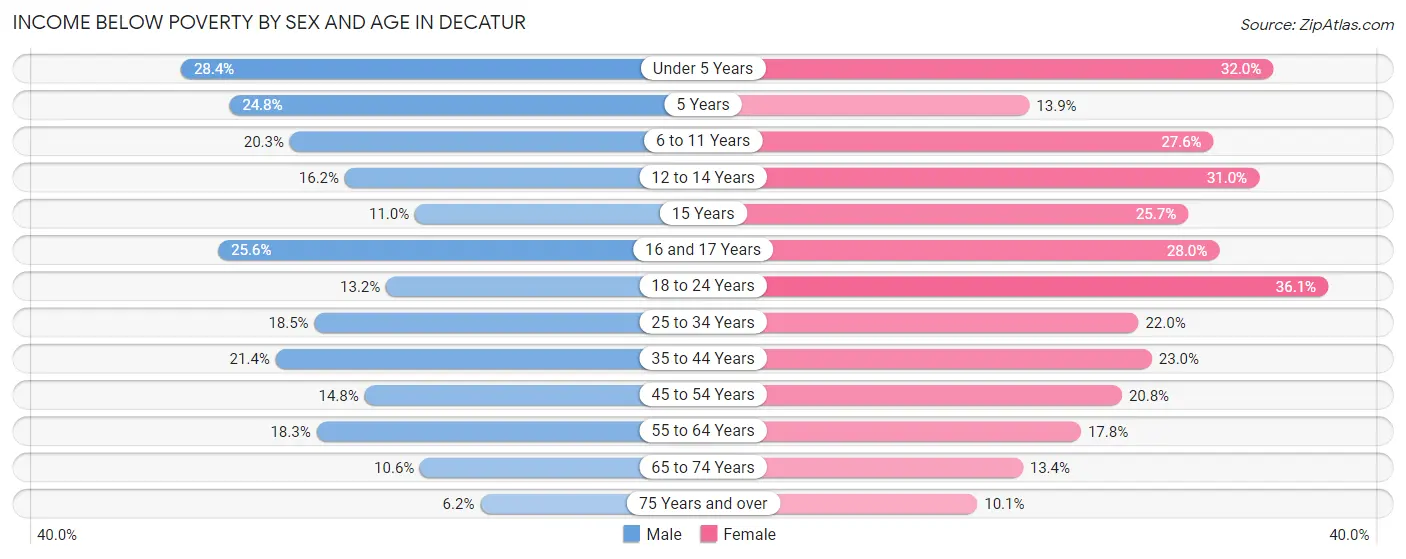
| Age Bracket | Male | Female |
| Under 5 Years | 597 (28.4%) | 660 (32.0%) |
| 5 Years | 121 (24.8%) | 67 (13.9%) |
| 6 to 11 Years | 418 (20.3%) | 629 (27.6%) |
| 12 to 14 Years | 220 (16.2%) | 341 (31.0%) |
| 15 Years | 50 (11.0%) | 146 (25.7%) |
| 16 and 17 Years | 213 (25.6%) | 219 (28.0%) |
| 18 to 24 Years | 387 (13.2%) | 1,200 (36.1%) |
| 25 to 34 Years | 851 (18.5%) | 974 (22.0%) |
| 35 to 44 Years | 729 (21.4%) | 911 (23.0%) |
| 45 to 54 Years | 531 (14.8%) | 804 (20.8%) |
| 55 to 64 Years | 836 (18.3%) | 894 (17.8%) |
| 65 to 74 Years | 373 (10.6%) | 542 (13.4%) |
| 75 Years and over | 149 (6.2%) | 375 (10.1%) |
| Total | 5,475 (16.9%) | 7,762 (21.8%) |
Income Above Poverty by Sex and Age in Decatur
According to the poverty statistics in Decatur, males aged 75 years and over and females aged 75 years and over are the age groups that are most secure financially, with 93.8% of males and 89.9% of females in these age groups living above the poverty line.
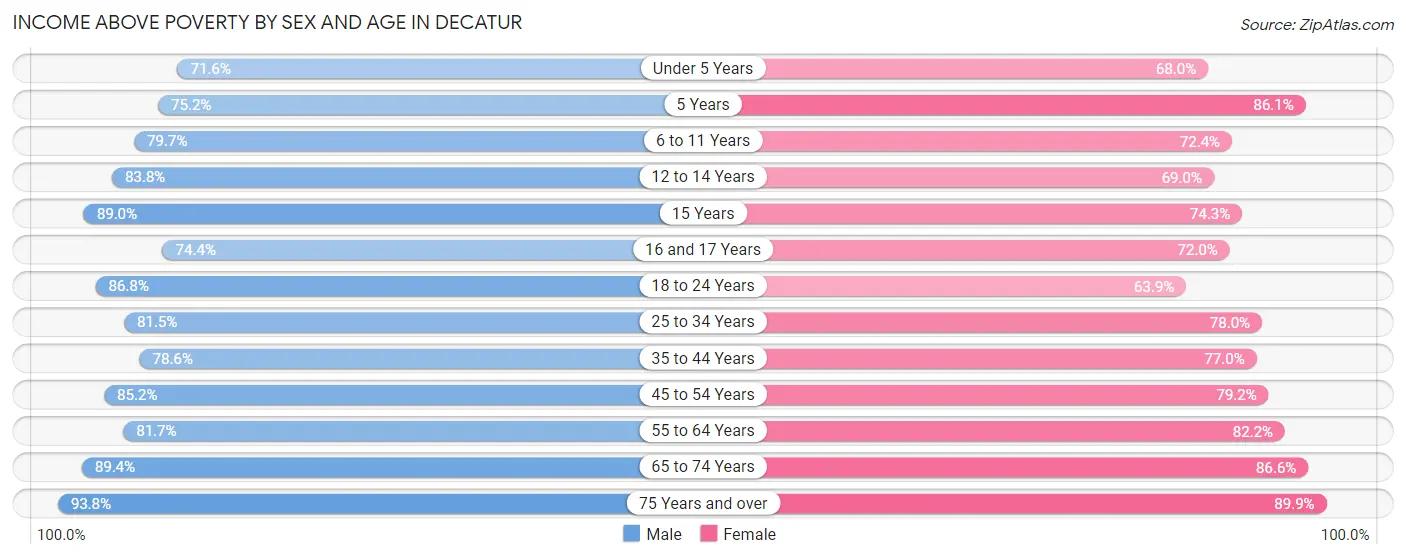
| Age Bracket | Male | Female |
| Under 5 Years | 1,506 (71.6%) | 1,401 (68.0%) |
| 5 Years | 367 (75.2%) | 414 (86.1%) |
| 6 to 11 Years | 1,640 (79.7%) | 1,651 (72.4%) |
| 12 to 14 Years | 1,136 (83.8%) | 760 (69.0%) |
| 15 Years | 404 (89.0%) | 422 (74.3%) |
| 16 and 17 Years | 618 (74.4%) | 563 (72.0%) |
| 18 to 24 Years | 2,553 (86.8%) | 2,125 (63.9%) |
| 25 to 34 Years | 3,753 (81.5%) | 3,447 (78.0%) |
| 35 to 44 Years | 2,684 (78.6%) | 3,046 (77.0%) |
| 45 to 54 Years | 3,066 (85.2%) | 3,062 (79.2%) |
| 55 to 64 Years | 3,726 (81.7%) | 4,141 (82.2%) |
| 65 to 74 Years | 3,137 (89.4%) | 3,492 (86.6%) |
| 75 Years and over | 2,265 (93.8%) | 3,354 (89.9%) |
| Total | 26,855 (83.1%) | 27,878 (78.2%) |
Income Below Poverty Among Married-Couple Families in Decatur
The poverty statistics for married-couple families in Decatur show that 7.1% or 792 of the total 11,166 families live below the poverty line. Families with 5 or more children have the highest poverty rate of 23.4%, comprising of 15 families. On the other hand, families with no children have the lowest poverty rate of 6.0%, which includes 471 families.
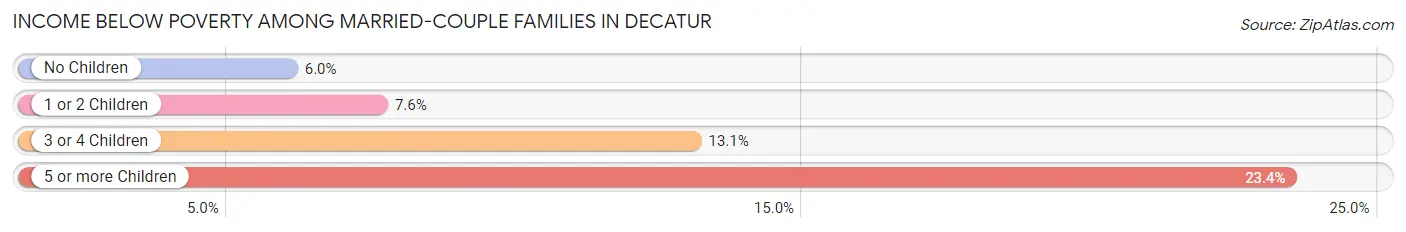
| Children | Above Poverty | Below Poverty |
| No Children | 7,329 (94.0%) | 471 (6.0%) |
| 1 or 2 Children | 2,125 (92.4%) | 175 (7.6%) |
| 3 or 4 Children | 871 (86.9%) | 131 (13.1%) |
| 5 or more Children | 49 (76.6%) | 15 (23.4%) |
| Total | 10,374 (92.9%) | 792 (7.1%) |
Income Below Poverty Among Single-Parent Households in Decatur
According to the poverty data in Decatur, 17.3% or 226 single-father households and 34.1% or 1,292 single-mother households are living below the poverty line. Among single-father households, those with 3 or 4 children have the highest poverty rate, with 15 households (71.4%) experiencing poverty. Likewise, among single-mother households, those with 5 or more children have the highest poverty rate, with 95 households (83.3%) falling below the poverty line.
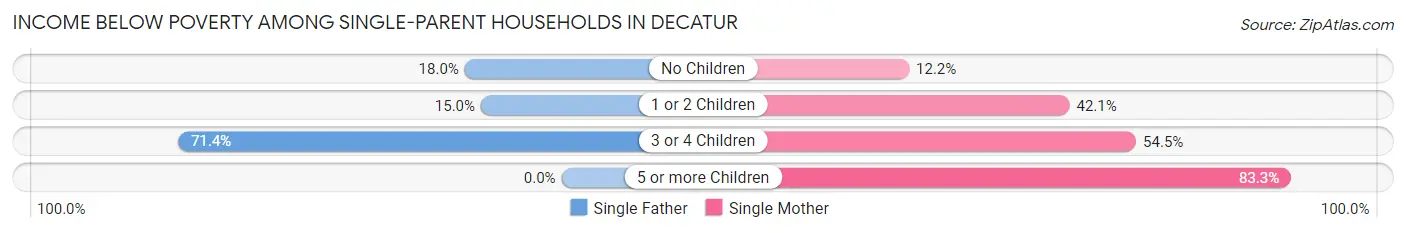
| Children | Single Father | Single Mother |
| No Children | 106 (18.0%) | 155 (12.2%) |
| 1 or 2 Children | 105 (15.0%) | 896 (42.1%) |
| 3 or 4 Children | 15 (71.4%) | 146 (54.5%) |
| 5 or more Children | 0 (0.0%) | 95 (83.3%) |
| Total | 226 (17.3%) | 1,292 (34.1%) |
Income Below Poverty Among Married-Couple vs Single-Parent Households in Decatur
The poverty data for Decatur shows that 792 of the married-couple family households (7.1%) and 1,518 of the single-parent households (29.8%) are living below the poverty level. Within the married-couple family households, those with 5 or more children have the highest poverty rate, with 15 households (23.4%) falling below the poverty line. Among the single-parent households, those with 5 or more children have the highest poverty rate, with 95 household (83.3%) living below poverty.
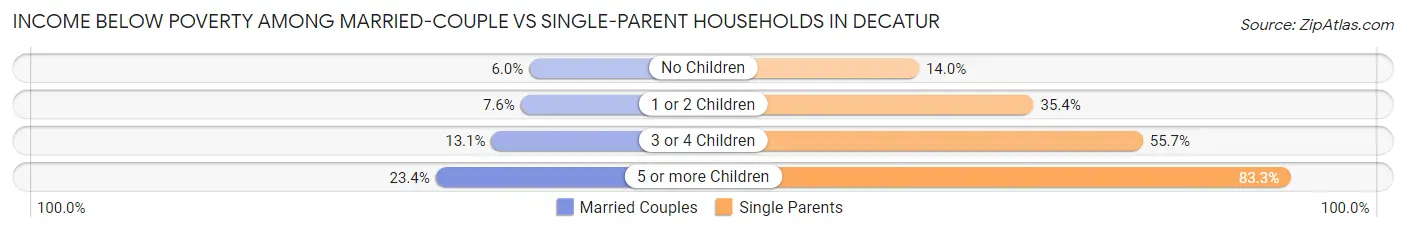
| Children | Married-Couple Families | Single-Parent Households |
| No Children | 471 (6.0%) | 261 (14.0%) |
| 1 or 2 Children | 175 (7.6%) | 1,001 (35.4%) |
| 3 or 4 Children | 131 (13.1%) | 161 (55.7%) |
| 5 or more Children | 15 (23.4%) | 95 (83.3%) |
| Total | 792 (7.1%) | 1,518 (29.8%) |
Race in Decatur
The most populous races in Decatur are White / Caucasian (48,453 | 68.3%), Black / African American (17,064 | 24.0%), and Two or more Races (3,775 | 5.3%).
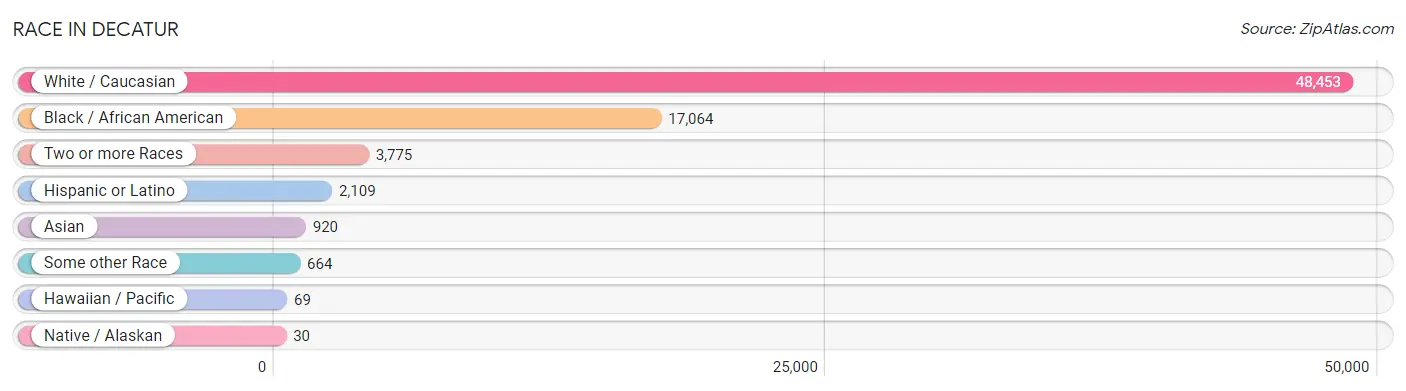
| Race | # Population | % Population |
| Asian | 920 | 1.3% |
| Black / African American | 17,064 | 24.0% |
| Hawaiian / Pacific | 69 | 0.1% |
| Hispanic or Latino | 2,109 | 3.0% |
| Native / Alaskan | 30 | 0.0% |
| White / Caucasian | 48,453 | 68.3% |
| Two or more Races | 3,775 | 5.3% |
| Some other Race | 664 | 0.9% |
| Total | 70,975 | 100.0% |
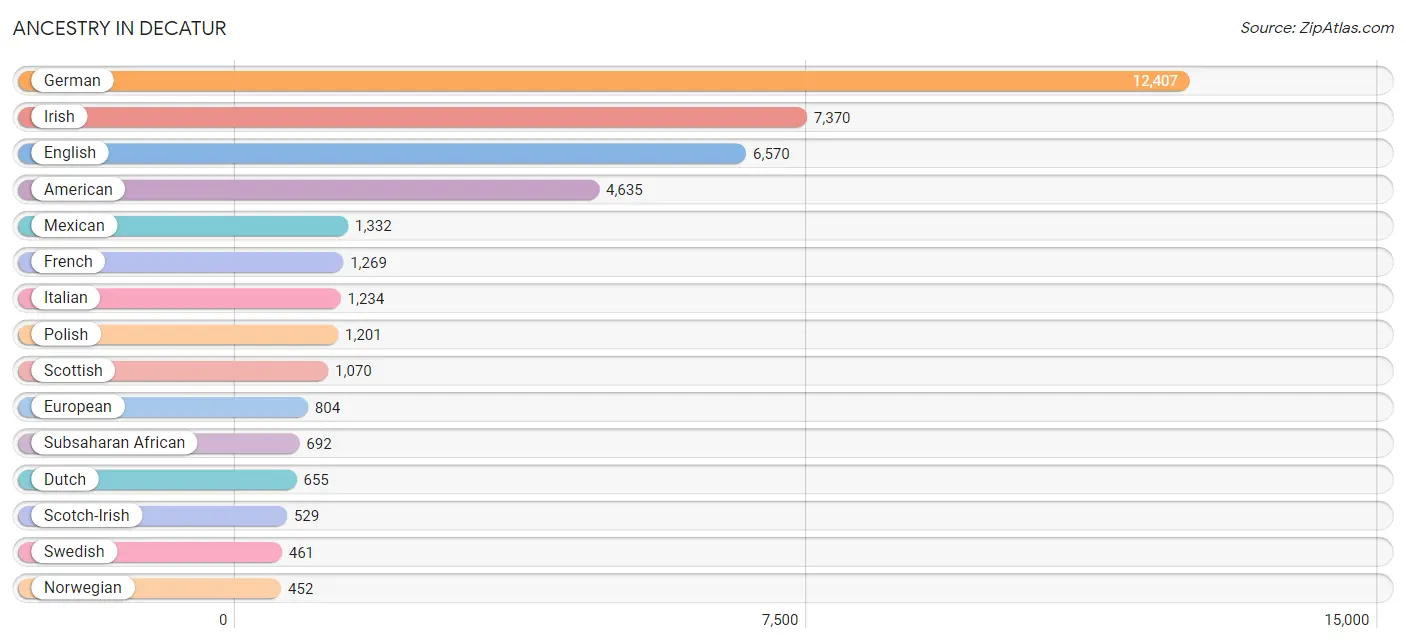
Ancestry in Decatur
The most populous ancestries reported in Decatur are German (12,407 | 17.5%), Irish (7,370 | 10.4%), English (6,570 | 9.3%), American (4,635 | 6.5%), and Mexican (1,332 | 1.9%), together accounting for 45.5% of all Decatur residents.
| Ancestry | # Population | % Population |
| African | 394 | 0.6% |
| Albanian | 24 | 0.0% |
| American | 4,635 | 6.5% |
| Arab | 115 | 0.2% |
| Austrian | 95 | 0.1% |
| Belgian | 40 | 0.1% |
| Bhutanese | 23 | 0.0% |
| Blackfeet | 55 | 0.1% |
| Bolivian | 256 | 0.4% |
| British | 421 | 0.6% |
| Burmese | 145 | 0.2% |
| Canadian | 43 | 0.1% |
| Central American | 40 | 0.1% |
| Cherokee | 195 | 0.3% |
| Cheyenne | 4 | 0.0% |
| Chickasaw | 23 | 0.0% |
| Chilean | 38 | 0.1% |
| Chippewa | 3 | 0.0% |
| Choctaw | 65 | 0.1% |
| Colombian | 43 | 0.1% |
| Cree | 8 | 0.0% |
| Croatian | 35 | 0.1% |
| Cuban | 80 | 0.1% |
| Czech | 82 | 0.1% |
| Czechoslovakian | 20 | 0.0% |
| Danish | 62 | 0.1% |
| Dominican | 12 | 0.0% |
| Dutch | 655 | 0.9% |
| Eastern European | 172 | 0.2% |
| English | 6,570 | 9.3% |
| European | 804 | 1.1% |
| Finnish | 18 | 0.0% |
| French | 1,269 | 1.8% |
| French Canadian | 61 | 0.1% |
| German | 12,407 | 17.5% |
| Ghanaian | 5 | 0.0% |
| Greek | 188 | 0.3% |
| Guamanian / Chamorro | 101 | 0.1% |
| Guatemalan | 33 | 0.1% |
| Hungarian | 79 | 0.1% |
| Indian (Asian) | 151 | 0.2% |
| Inupiat | 2 | 0.0% |
| Irish | 7,370 | 10.4% |
| Iroquois | 4 | 0.0% |
| Israeli | 3 | 0.0% |
| Italian | 1,234 | 1.7% |
| Korean | 312 | 0.4% |
| Laotian | 15 | 0.0% |
| Latvian | 53 | 0.1% |
| Lebanese | 57 | 0.1% |
| Lithuanian | 67 | 0.1% |
| Menominee | 49 | 0.1% |
| Mexican | 1,332 | 1.9% |
| Mexican American Indian | 22 | 0.0% |
| Moroccan | 8 | 0.0% |
| Native Hawaiian | 9 | 0.0% |
| Navajo | 17 | 0.0% |
| New Zealander | 6 | 0.0% |
| Nigerian | 108 | 0.2% |
| Northern European | 25 | 0.0% |
| Norwegian | 452 | 0.6% |
| Pakistani | 25 | 0.0% |
| Pennsylvania German | 85 | 0.1% |
| Polish | 1,201 | 1.7% |
| Portuguese | 41 | 0.1% |
| Puerto Rican | 217 | 0.3% |
| Romanian | 12 | 0.0% |
| Russian | 86 | 0.1% |
| Salvadoran | 7 | 0.0% |
| Scandinavian | 155 | 0.2% |
| Scotch-Irish | 529 | 0.7% |
| Scottish | 1,070 | 1.5% |
| Serbian | 34 | 0.1% |
| Sioux | 5 | 0.0% |
| Slavic | 33 | 0.1% |
| Slovak | 9 | 0.0% |
| Slovene | 20 | 0.0% |
| Somali | 14 | 0.0% |
| South American | 374 | 0.5% |
| Spaniard | 18 | 0.0% |
| Spanish | 12 | 0.0% |
| Sri Lankan | 69 | 0.1% |
| Subsaharan African | 692 | 1.0% |
| Swedish | 461 | 0.6% |
| Swiss | 97 | 0.1% |
| Thai | 209 | 0.3% |
| Turkish | 5 | 0.0% |
| Ugandan | 1 | 0.0% |
| Ukrainian | 28 | 0.0% |
| Uruguayan | 11 | 0.0% |
| Venezuelan | 26 | 0.0% |
| Welsh | 266 | 0.4% |
| Yaqui | 9 | 0.0% |
| Zimbabwean | 80 | 0.1% | View All 94 Rows |
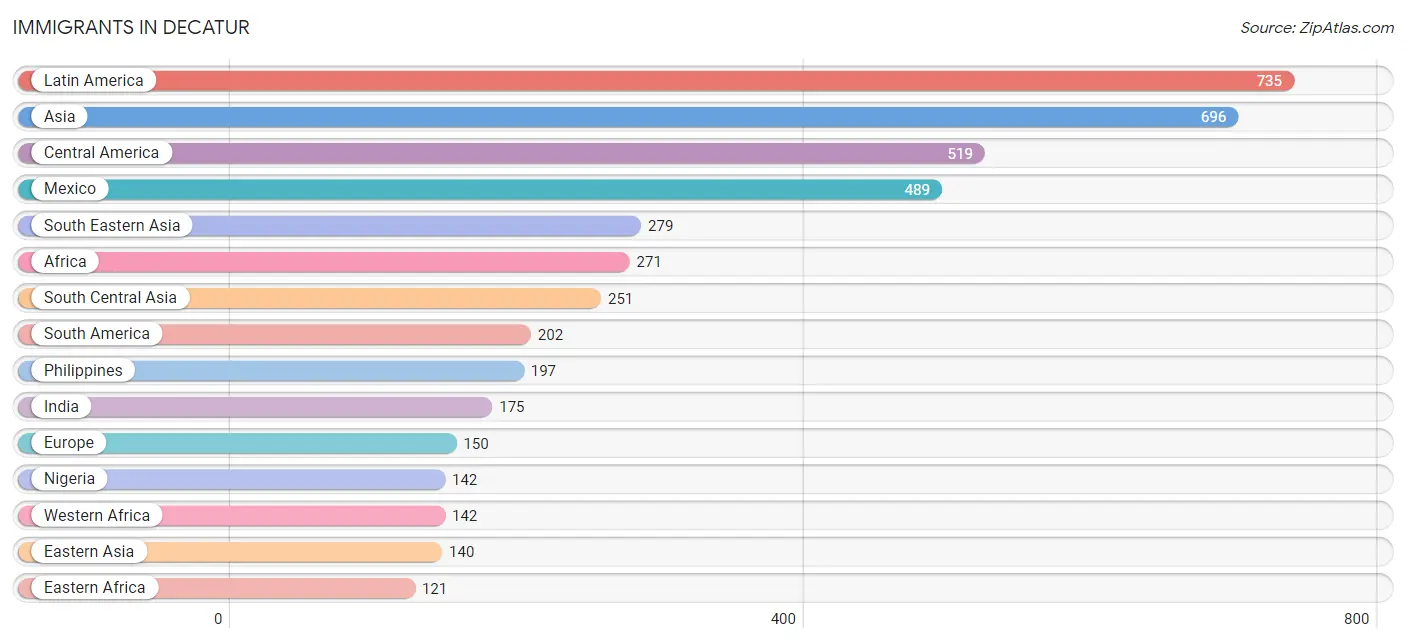
Immigrants in Decatur
The most numerous immigrant groups reported in Decatur came from Latin America (735 | 1.0%), Asia (696 | 1.0%), Central America (519 | 0.7%), Mexico (489 | 0.7%), and South Eastern Asia (279 | 0.4%), together accounting for 3.8% of all Decatur residents.
| Immigration Origin | # Population | % Population |
| Africa | 271 | 0.4% |
| Asia | 696 | 1.0% |
| Austria | 6 | 0.0% |
| Bolivia | 118 | 0.2% |
| Canada | 69 | 0.1% |
| Caribbean | 14 | 0.0% |
| Central America | 519 | 0.7% |
| Chile | 13 | 0.0% |
| China | 106 | 0.2% |
| Colombia | 34 | 0.1% |
| Croatia | 8 | 0.0% |
| Cuba | 8 | 0.0% |
| Dominican Republic | 6 | 0.0% |
| Eastern Africa | 121 | 0.2% |
| Eastern Asia | 140 | 0.2% |
| Eastern Europe | 66 | 0.1% |
| El Salvador | 7 | 0.0% |
| England | 18 | 0.0% |
| Europe | 150 | 0.2% |
| Germany | 43 | 0.1% |
| Greece | 4 | 0.0% |
| Guatemala | 23 | 0.0% |
| Hong Kong | 13 | 0.0% |
| India | 175 | 0.3% |
| Indonesia | 15 | 0.0% |
| Italy | 6 | 0.0% |
| Japan | 23 | 0.0% |
| Korea | 11 | 0.0% |
| Latin America | 735 | 1.0% |
| Malaysia | 10 | 0.0% |
| Mexico | 489 | 0.7% |
| Morocco | 8 | 0.0% |
| Netherlands | 7 | 0.0% |
| Nigeria | 142 | 0.2% |
| North Macedonia | 24 | 0.0% |
| Northern Africa | 8 | 0.0% |
| Northern Europe | 18 | 0.0% |
| Oceania | 6 | 0.0% |
| Pakistan | 66 | 0.1% |
| Philippines | 197 | 0.3% |
| Poland | 3 | 0.0% |
| Serbia | 17 | 0.0% |
| Somalia | 49 | 0.1% |
| South America | 202 | 0.3% |
| South Central Asia | 251 | 0.4% |
| South Eastern Asia | 279 | 0.4% |
| Southern Europe | 10 | 0.0% |
| Sri Lanka | 10 | 0.0% |
| Thailand | 15 | 0.0% |
| Uganda | 1 | 0.0% |
| Ukraine | 14 | 0.0% |
| Uruguay | 11 | 0.0% |
| Venezuela | 26 | 0.0% |
| Vietnam | 42 | 0.1% |
| Western Africa | 142 | 0.2% |
| Western Europe | 56 | 0.1% |
| Zimbabwe | 36 | 0.1% | View All 57 Rows |
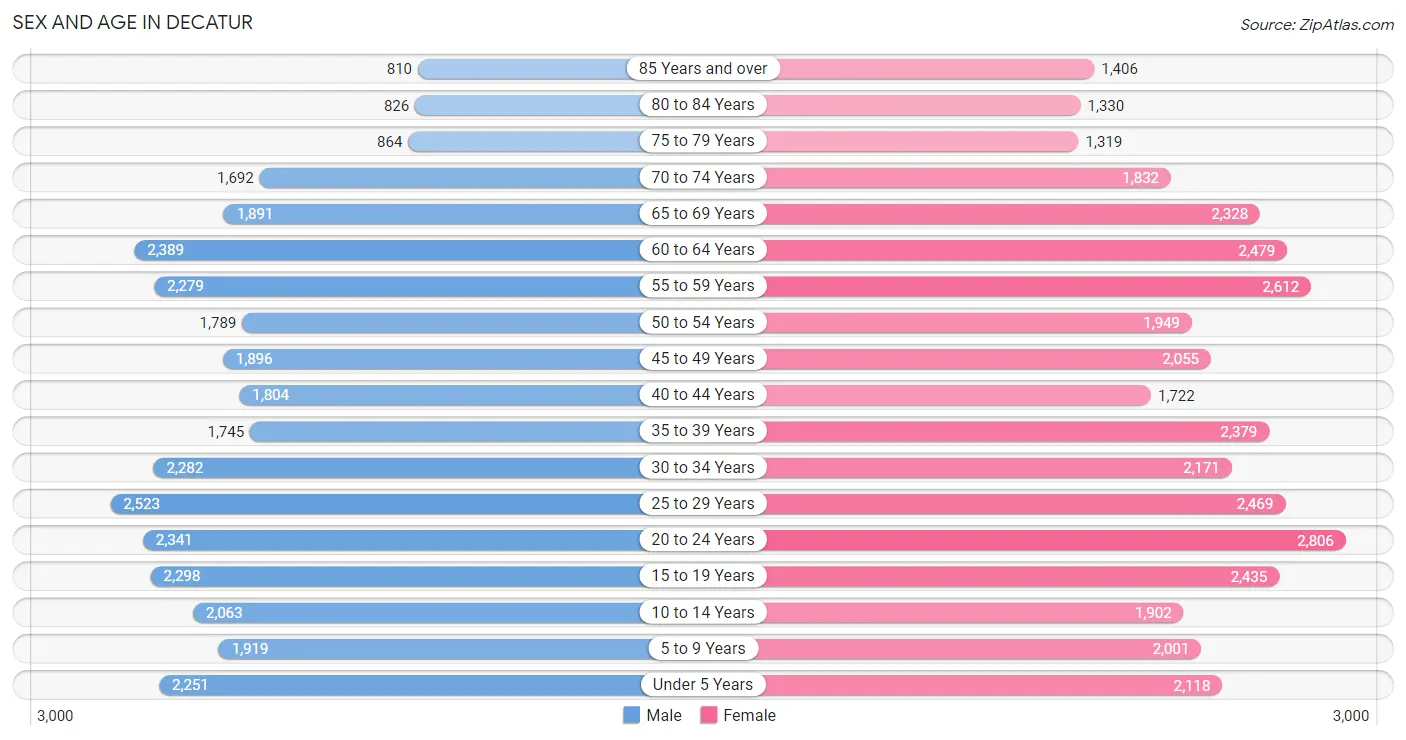
Sex and Age in Decatur
Sex and Age in Decatur
The most populous age groups in Decatur are 25 to 29 Years (2,523 | 7.5%) for men and 20 to 24 Years (2,806 | 7.5%) for women.
| Age Bracket | Male | Female |
| Under 5 Years | 2,251 (6.7%) | 2,118 (5.7%) |
| 5 to 9 Years | 1,919 (5.7%) | 2,001 (5.4%) |
| 10 to 14 Years | 2,063 (6.1%) | 1,902 (5.1%) |
| 15 to 19 Years | 2,298 (6.8%) | 2,435 (6.5%) |
| 20 to 24 Years | 2,341 (7.0%) | 2,806 (7.5%) |
| 25 to 29 Years | 2,523 (7.5%) | 2,469 (6.6%) |
| 30 to 34 Years | 2,282 (6.8%) | 2,171 (5.8%) |
| 35 to 39 Years | 1,745 (5.2%) | 2,379 (6.4%) |
| 40 to 44 Years | 1,804 (5.4%) | 1,722 (4.6%) |
| 45 to 49 Years | 1,896 (5.6%) | 2,055 (5.5%) |
| 50 to 54 Years | 1,789 (5.3%) | 1,949 (5.2%) |
| 55 to 59 Years | 2,279 (6.8%) | 2,612 (7.0%) |
| 60 to 64 Years | 2,389 (7.1%) | 2,479 (6.6%) |
| 65 to 69 Years | 1,891 (5.6%) | 2,328 (6.2%) |
| 70 to 74 Years | 1,692 (5.0%) | 1,832 (4.9%) |
| 75 to 79 Years | 864 (2.6%) | 1,319 (3.5%) |
| 80 to 84 Years | 826 (2.5%) | 1,330 (3.6%) |
| 85 Years and over | 810 (2.4%) | 1,406 (3.8%) |
| Total | 33,662 (100.0%) | 37,313 (100.0%) |
Families and Households in Decatur
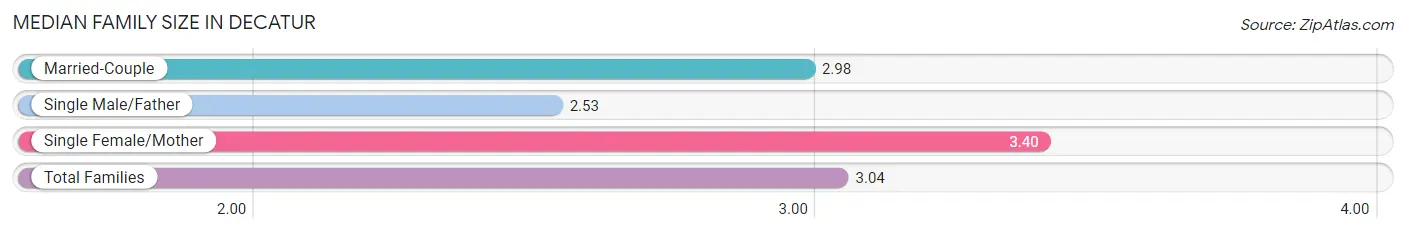
Median Family Size in Decatur
The median family size in Decatur is 3.04 persons per family, with single female/mother families (3,784 | 23.3%) accounting for the largest median family size of 3.4 persons per family. On the other hand, single male/father families (1,308 | 8.1%) represent the smallest median family size with 2.53 persons per family.
| Family Type | # Families | Family Size |
| Married-Couple | 11,166 (68.7%) | 2.98 |
| Single Male/Father | 1,308 (8.1%) | 2.53 |
| Single Female/Mother | 3,784 (23.3%) | 3.40 |
| Total Families | 16,258 (100.0%) | 3.04 |
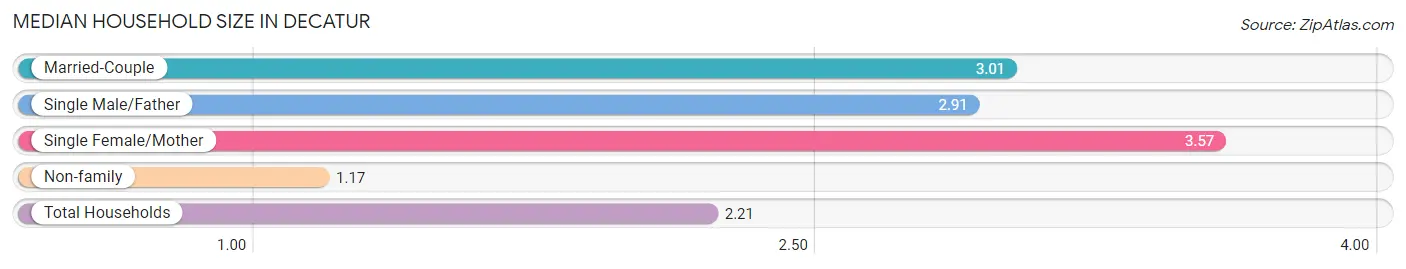
Median Household Size in Decatur
The median household size in Decatur is 2.21 persons per household, with single female/mother households (3,784 | 12.3%) accounting for the largest median household size of 3.57 persons per household. non-family households (14,469 | 47.1%) represent the smallest median household size with 1.17 persons per household.
| Household Type | # Households | Household Size |
| Married-Couple | 11,166 (36.3%) | 3.01 |
| Single Male/Father | 1,308 (4.3%) | 2.91 |
| Single Female/Mother | 3,784 (12.3%) | 3.57 |
| Non-family | 14,469 (47.1%) | 1.17 |
| Total Households | 30,727 (100.0%) | 2.21 |
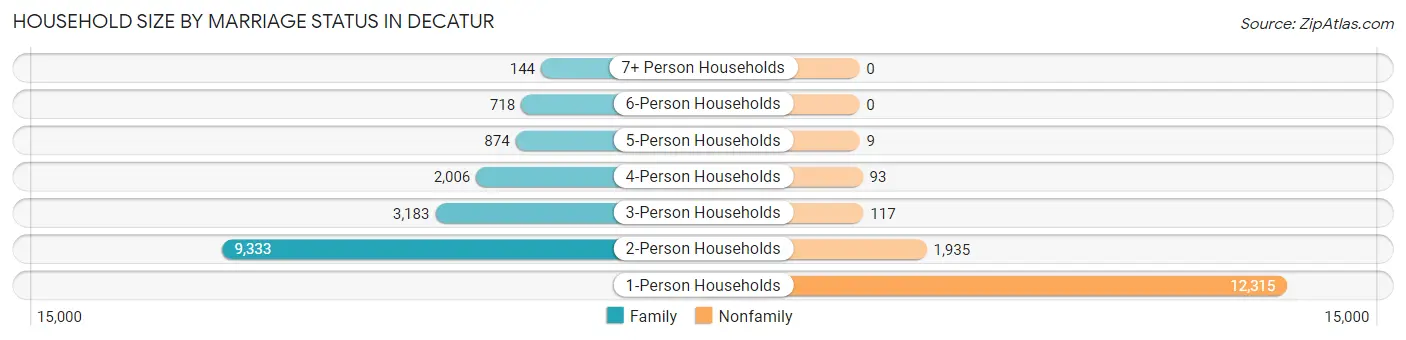
Household Size by Marriage Status in Decatur
Out of a total of 30,727 households in Decatur, 16,258 (52.9%) are family households, while 14,469 (47.1%) are nonfamily households. The most numerous type of family households are 2-person households, comprising 9,333, and the most common type of nonfamily households are 1-person households, comprising 12,315.
| Household Size | Family Households | Nonfamily Households |
| 1-Person Households | - | 12,315 (40.1%) |
| 2-Person Households | 9,333 (30.4%) | 1,935 (6.3%) |
| 3-Person Households | 3,183 (10.4%) | 117 (0.4%) |
| 4-Person Households | 2,006 (6.5%) | 93 (0.3%) |
| 5-Person Households | 874 (2.8%) | 9 (0.0%) |
| 6-Person Households | 718 (2.3%) | 0 (0.0%) |
| 7+ Person Households | 144 (0.5%) | 0 (0.0%) |
| Total | 16,258 (52.9%) | 14,469 (47.1%) |
Female Fertility in Decatur
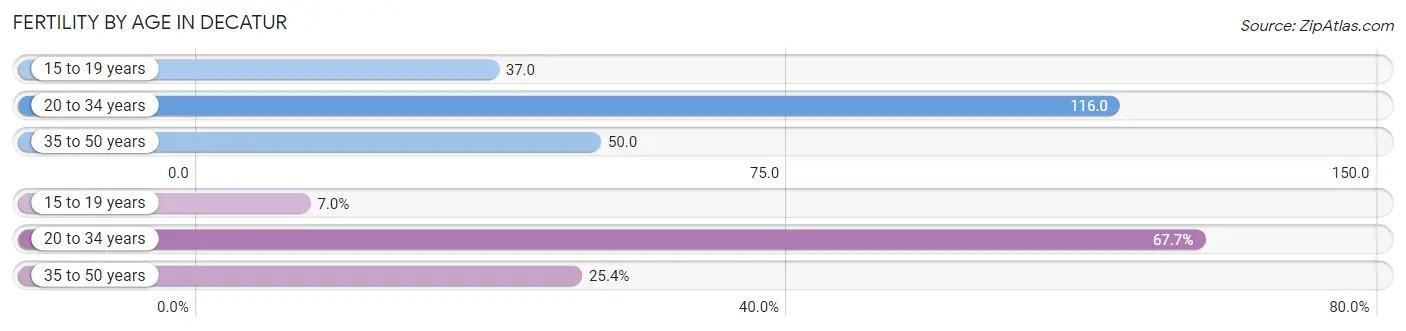
Fertility by Age in Decatur
Average fertility rate in Decatur is 78.0 births per 1,000 women. Women in the age bracket of 20 to 34 years have the highest fertility rate with 116.0 births per 1,000 women. Women in the age bracket of 20 to 34 years acount for 67.7% of all women with births.
| Age Bracket | Women with Births | Births / 1,000 Women |
| 15 to 19 years | 89 (7.0%) | 37.0 |
| 20 to 34 years | 866 (67.7%) | 116.0 |
| 35 to 50 years | 325 (25.4%) | 50.0 |
| Total | 1,280 (100.0%) | 78.0 |
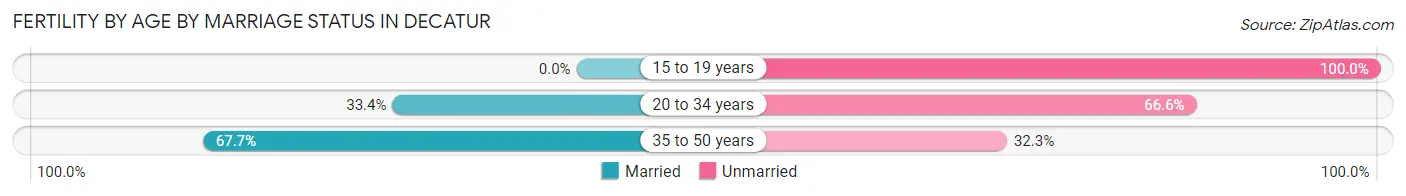
Fertility by Age by Marriage Status in Decatur
39.8% of women with births (1,280) in Decatur are married. The highest percentage of unmarried women with births falls into 15 to 19 years age bracket with 100.0% of them unmarried at the time of birth, while the lowest percentage of unmarried women with births belong to 35 to 50 years age bracket with 32.3% of them unmarried.
| Age Bracket | Married | Unmarried |
| 15 to 19 years | 0 (0.0%) | 89 (100.0%) |
| 20 to 34 years | 289 (33.4%) | 577 (66.6%) |
| 35 to 50 years | 220 (67.7%) | 105 (32.3%) |
| Total | 509 (39.8%) | 771 (60.2%) |
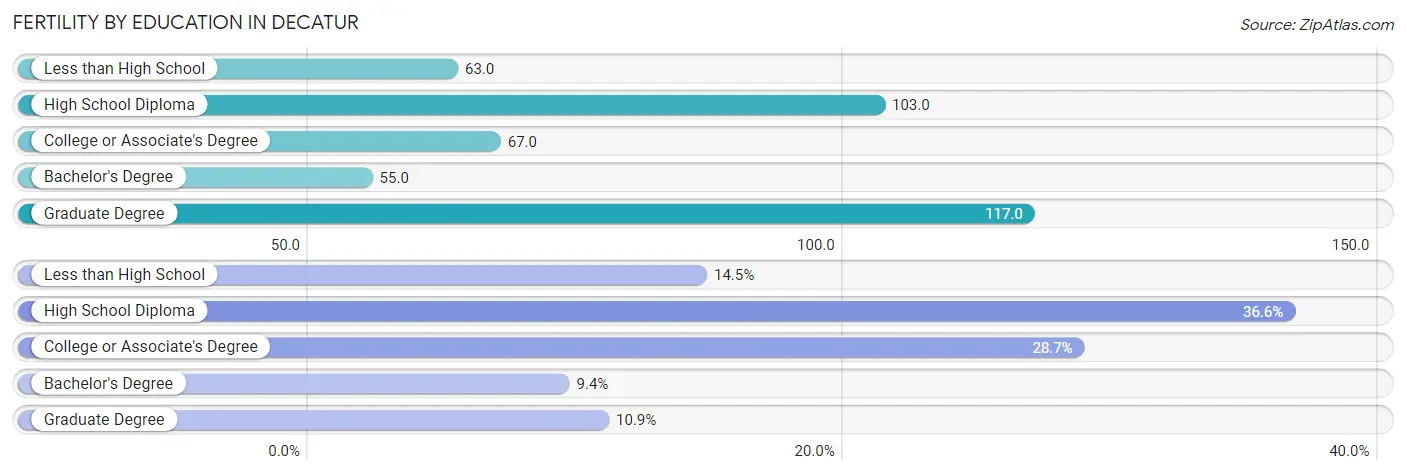
Fertility by Education in Decatur
Average fertility rate in Decatur is 78.0 births per 1,000 women. Women with the education attainment of graduate degree have the highest fertility rate of 117.0 births per 1,000 women, while women with the education attainment of bachelor's degree have the lowest fertility at 55.0 births per 1,000 women. Women with the education attainment of high school diploma represent 36.6% of all women with births.
| Educational Attainment | Women with Births | Births / 1,000 Women |
| Less than High School | 186 (14.5%) | 63.0 |
| High School Diploma | 468 (36.6%) | 103.0 |
| College or Associate's Degree | 367 (28.7%) | 67.0 |
| Bachelor's Degree | 120 (9.4%) | 55.0 |
| Graduate Degree | 139 (10.9%) | 117.0 |
| Total | 1,280 (100.0%) | 78.0 |
Fertility by Education by Marriage Status in Decatur
60.2% of women with births in Decatur are unmarried. Women with the educational attainment of bachelor's degree are most likely to be married with 100.0% of them married at childbirth, while women with the educational attainment of high school diploma are least likely to be married with 93.8% of them unmarried at childbirth.
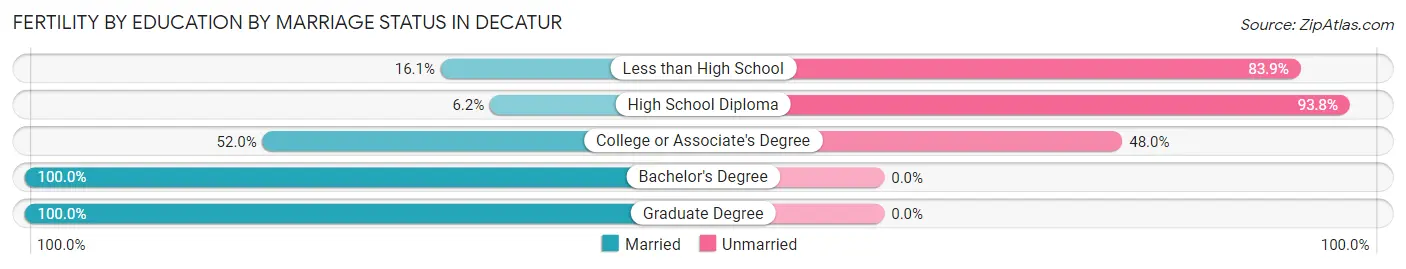
| Educational Attainment | Married | Unmarried |
| Less than High School | 30 (16.1%) | 156 (83.9%) |
| High School Diploma | 29 (6.2%) | 439 (93.8%) |
| College or Associate's Degree | 191 (52.0%) | 176 (48.0%) |
| Bachelor's Degree | 120 (100.0%) | 0 (0.0%) |
| Graduate Degree | 139 (100.0%) | 0 (0.0%) |
| Total | 509 (39.8%) | 771 (60.2%) |
Employment Characteristics in Decatur
Employment by Class of Employer in Decatur
Among the 29,381 employed individuals in Decatur, private company employees (21,054 | 71.7%), not-for-profit organizations (2,925 | 10.0%), and local government employees (2,141 | 7.3%) make up the most common classes of employment.
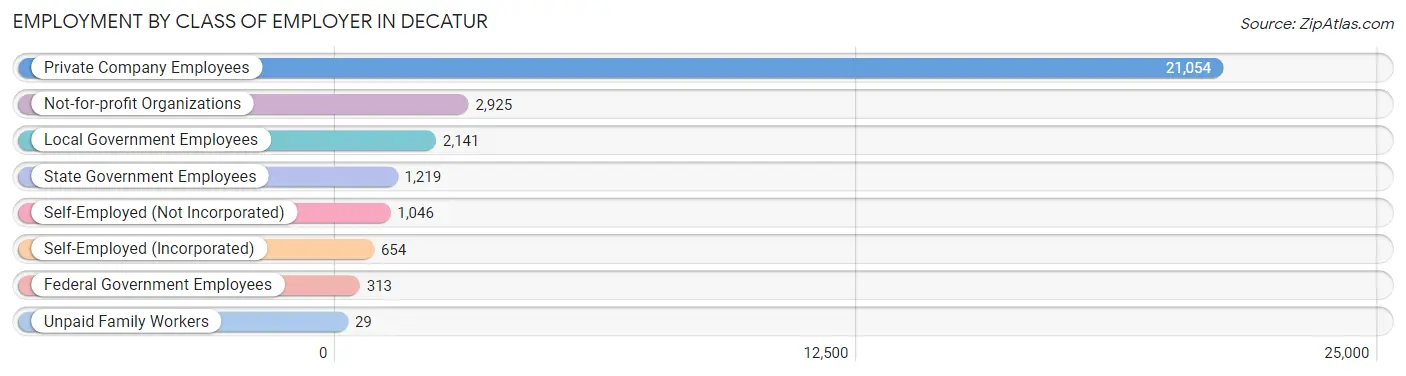
| Employer Class | # Employees | % Employees |
| Private Company Employees | 21,054 | 71.7% |
| Self-Employed (Incorporated) | 654 | 2.2% |
| Self-Employed (Not Incorporated) | 1,046 | 3.6% |
| Not-for-profit Organizations | 2,925 | 10.0% |
| Local Government Employees | 2,141 | 7.3% |
| State Government Employees | 1,219 | 4.2% |
| Federal Government Employees | 313 | 1.1% |
| Unpaid Family Workers | 29 | 0.1% |
| Total | 29,381 | 100.0% |
Employment Status by Age in Decatur
According to the labor force statistics for Decatur, out of the total population over 16 years of age (57,695), 56.7% or 32,713 individuals are in the labor force, with 8.9% or 2,911 of them unemployed. The age group with the highest labor force participation rate is 25 to 29 years, with 80.7% or 4,029 individuals in the labor force. Within the labor force, the 20 to 24 years age range has the highest percentage of unemployed individuals, with 15.8% or 580 of them being unemployed.
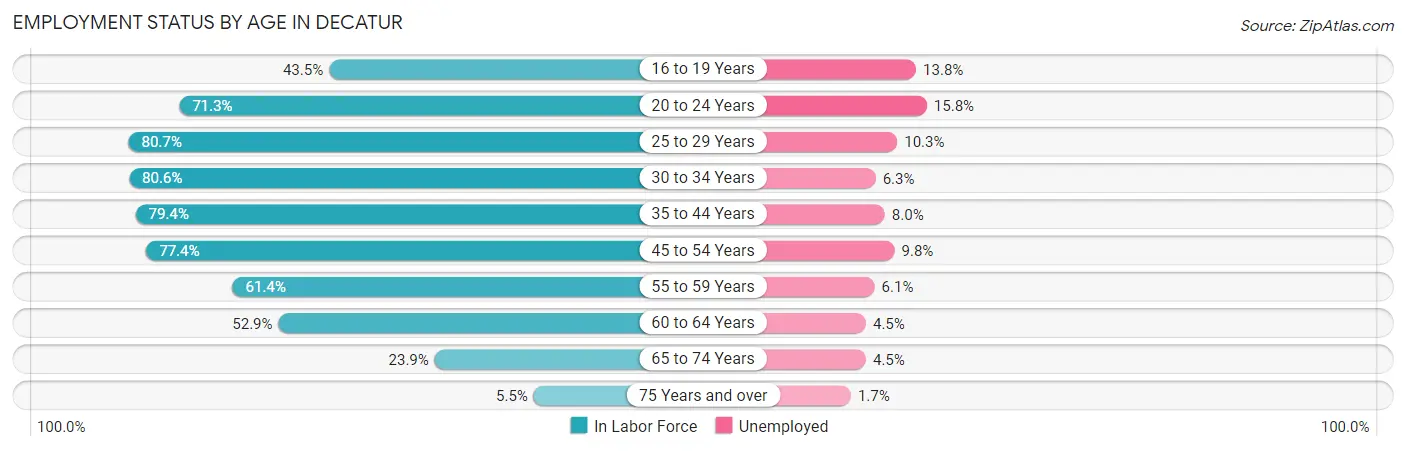
| Age Bracket | In Labor Force | Unemployed |
| 16 to 19 Years | 1,613 (43.5%) | 223 (13.8%) |
| 20 to 24 Years | 3,670 (71.3%) | 580 (15.8%) |
| 25 to 29 Years | 4,029 (80.7%) | 415 (10.3%) |
| 30 to 34 Years | 3,589 (80.6%) | 226 (6.3%) |
| 35 to 44 Years | 6,074 (79.4%) | 486 (8.0%) |
| 45 to 54 Years | 5,951 (77.4%) | 583 (9.8%) |
| 55 to 59 Years | 3,003 (61.4%) | 183 (6.1%) |
| 60 to 64 Years | 2,575 (52.9%) | 116 (4.5%) |
| 65 to 74 Years | 1,851 (23.9%) | 83 (4.5%) |
| 75 Years and over | 361 (5.5%) | 6 (1.7%) |
| Total | 32,713 (56.7%) | 2,911 (8.9%) |
Employment Status by Educational Attainment in Decatur
According to labor force statistics for Decatur, 73.0% of individuals (25,216) out of the total population between 25 and 64 years of age (34,543) are in the labor force, with 8.0% or 2,017 of them being unemployed. The group with the highest labor force participation rate are those with the educational attainment of bachelor's degree or higher, with 88.6% or 6,776 individuals in the labor force. Within the labor force, individuals with less than high school education have the highest percentage of unemployment, with 16.3% or 239 of them being unemployed.
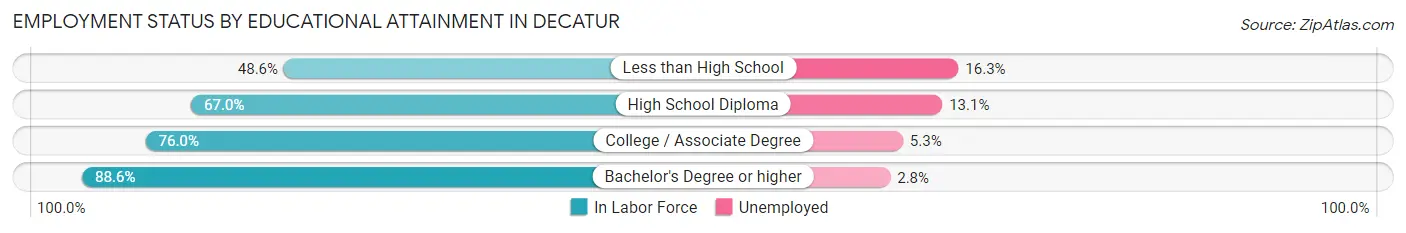
| Educational Attainment | In Labor Force | Unemployed |
| Less than High School | 1,468 (48.6%) | 492 (16.3%) |
| High School Diploma | 8,735 (67.0%) | 1,708 (13.1%) |
| College / Associate Degree | 8,237 (76.0%) | 574 (5.3%) |
| Bachelor's Degree or higher | 6,776 (88.6%) | 214 (2.8%) |
| Total | 25,216 (73.0%) | 2,763 (8.0%) |
Employment Occupations by Sex in Decatur
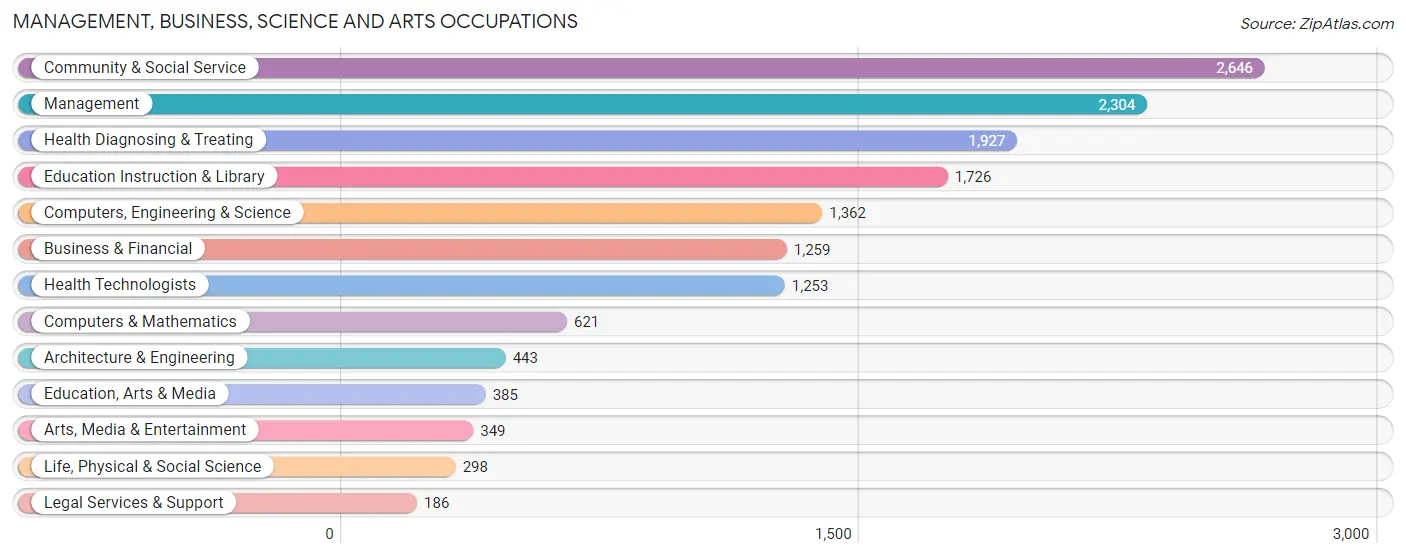
Management, Business, Science and Arts Occupations
The most common Management, Business, Science and Arts occupations in Decatur are Community & Social Service (2,646 | 8.9%), Management (2,304 | 7.7%), Health Diagnosing & Treating (1,927 | 6.5%), Education Instruction & Library (1,726 | 5.8%), and Computers, Engineering & Science (1,362 | 4.6%).
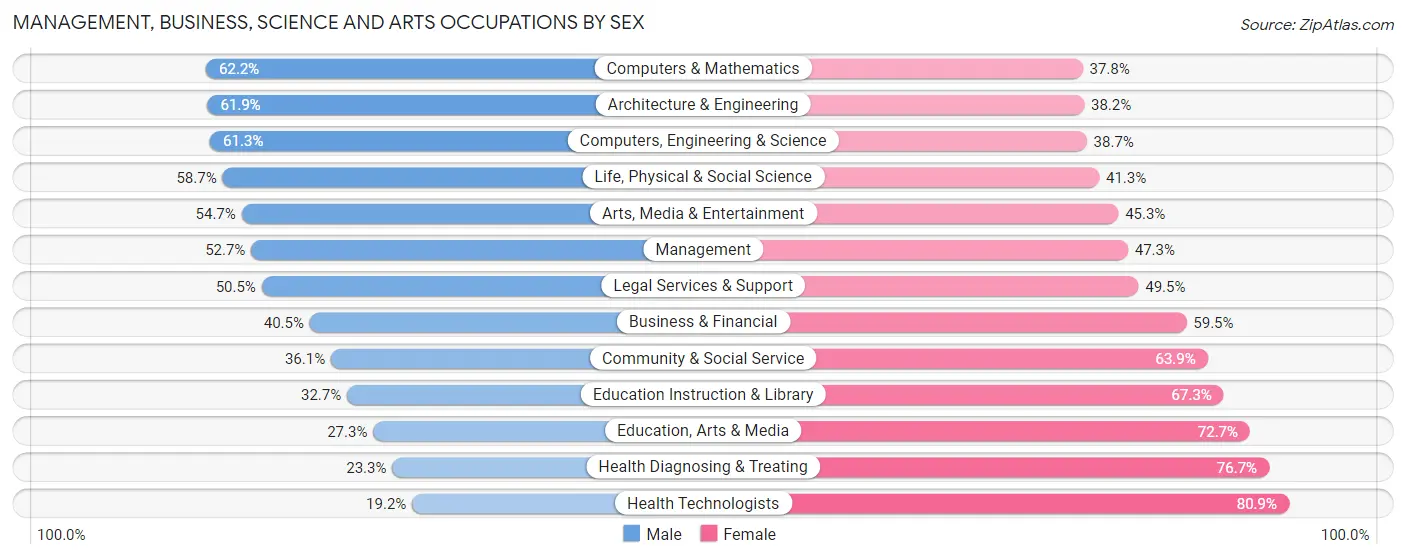
Management, Business, Science and Arts Occupations by Sex
Within the Management, Business, Science and Arts occupations in Decatur, the most male-oriented occupations are Computers & Mathematics (62.2%), Architecture & Engineering (61.9%), and Computers, Engineering & Science (61.3%), while the most female-oriented occupations are Health Technologists (80.8%), Health Diagnosing & Treating (76.7%), and Education, Arts & Media (72.7%).
| Occupation | Male | Female |
| Management | 1,215 (52.7%) | 1,089 (47.3%) |
| Business & Financial | 510 (40.5%) | 749 (59.5%) |
| Computers, Engineering & Science | 835 (61.3%) | 527 (38.7%) |
| Computers & Mathematics | 386 (62.2%) | 235 (37.8%) |
| Architecture & Engineering | 274 (61.9%) | 169 (38.2%) |
| Life, Physical & Social Science | 175 (58.7%) | 123 (41.3%) |
| Community & Social Service | 955 (36.1%) | 1,691 (63.9%) |
| Education, Arts & Media | 105 (27.3%) | 280 (72.7%) |
| Legal Services & Support | 94 (50.5%) | 92 (49.5%) |
| Education Instruction & Library | 565 (32.7%) | 1,161 (67.3%) |
| Arts, Media & Entertainment | 191 (54.7%) | 158 (45.3%) |
| Health Diagnosing & Treating | 449 (23.3%) | 1,478 (76.7%) |
| Health Technologists | 240 (19.2%) | 1,013 (80.8%) |
| Total (Category) | 3,964 (41.7%) | 5,534 (58.3%) |
| Total (Overall) | 14,831 (49.8%) | 14,974 (50.2%) |
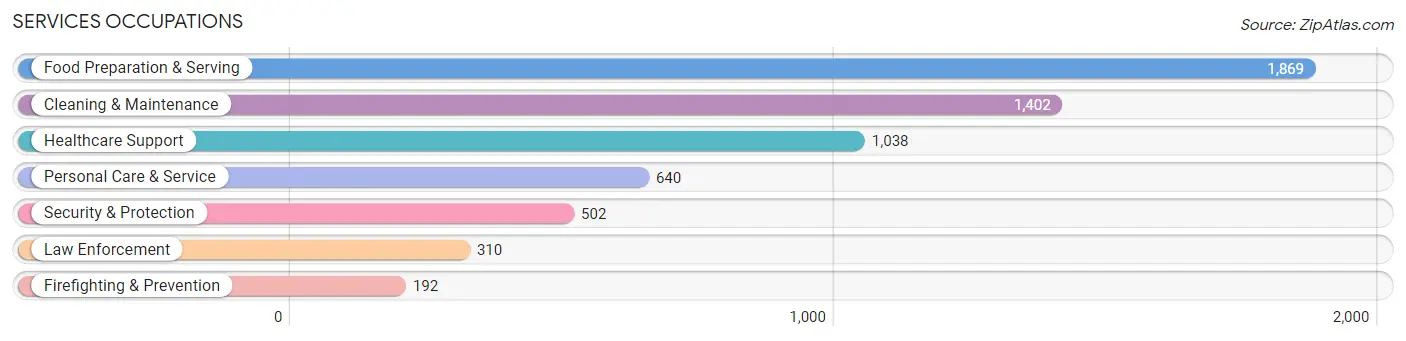
Services Occupations
The most common Services occupations in Decatur are Food Preparation & Serving (1,869 | 6.3%), Cleaning & Maintenance (1,402 | 4.7%), Healthcare Support (1,038 | 3.5%), Personal Care & Service (640 | 2.1%), and Security & Protection (502 | 1.7%).
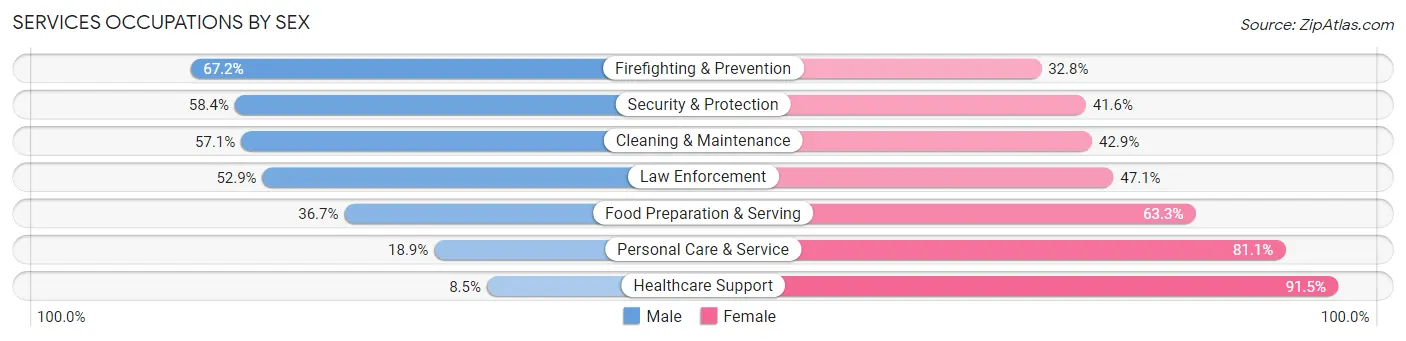
Services Occupations by Sex
Within the Services occupations in Decatur, the most male-oriented occupations are Firefighting & Prevention (67.2%), Security & Protection (58.4%), and Cleaning & Maintenance (57.1%), while the most female-oriented occupations are Healthcare Support (91.5%), Personal Care & Service (81.1%), and Food Preparation & Serving (63.3%).
| Occupation | Male | Female |
| Healthcare Support | 88 (8.5%) | 950 (91.5%) |
| Security & Protection | 293 (58.4%) | 209 (41.6%) |
| Firefighting & Prevention | 129 (67.2%) | 63 (32.8%) |
| Law Enforcement | 164 (52.9%) | 146 (47.1%) |
| Food Preparation & Serving | 686 (36.7%) | 1,183 (63.3%) |
| Cleaning & Maintenance | 801 (57.1%) | 601 (42.9%) |
| Personal Care & Service | 121 (18.9%) | 519 (81.1%) |
| Total (Category) | 1,989 (36.5%) | 3,462 (63.5%) |
| Total (Overall) | 14,831 (49.8%) | 14,974 (50.2%) |
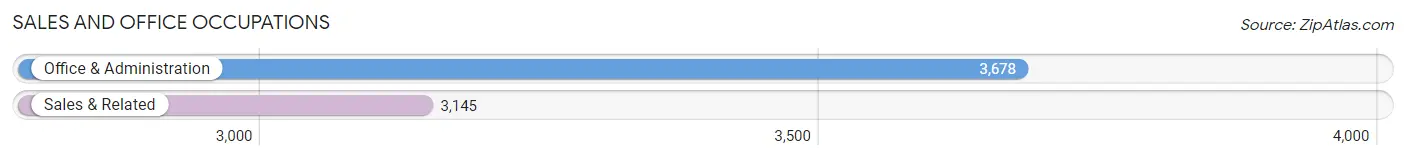
Sales and Office Occupations
The most common Sales and Office occupations in Decatur are Office & Administration (3,678 | 12.3%), and Sales & Related (3,145 | 10.5%).
Sales and Office Occupations by Sex
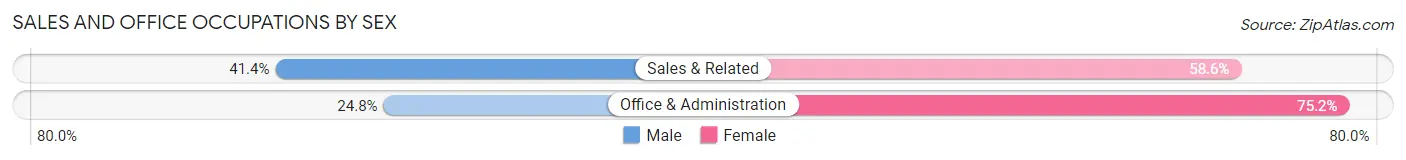
| Occupation | Male | Female |
| Sales & Related | 1,303 (41.4%) | 1,842 (58.6%) |
| Office & Administration | 912 (24.8%) | 2,766 (75.2%) |
| Total (Category) | 2,215 (32.5%) | 4,608 (67.5%) |
| Total (Overall) | 14,831 (49.8%) | 14,974 (50.2%) |
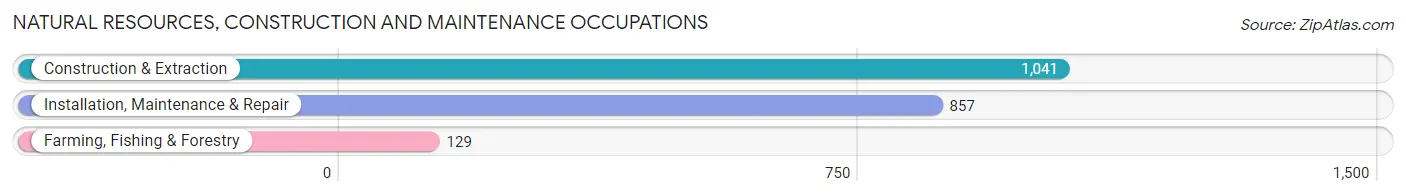
Natural Resources, Construction and Maintenance Occupations
The most common Natural Resources, Construction and Maintenance occupations in Decatur are Construction & Extraction (1,041 | 3.5%), Installation, Maintenance & Repair (857 | 2.9%), and Farming, Fishing & Forestry (129 | 0.4%).
Natural Resources, Construction and Maintenance Occupations by Sex
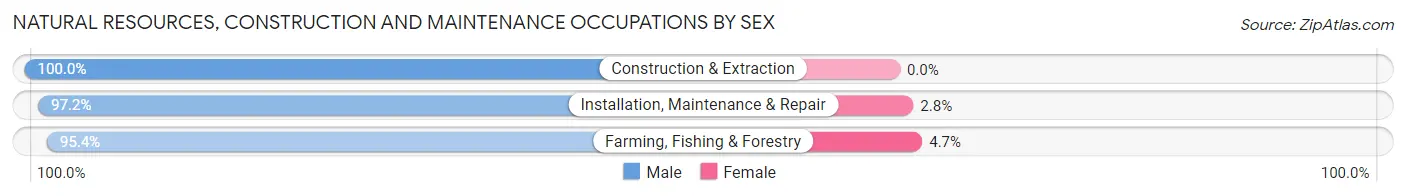
| Occupation | Male | Female |
| Farming, Fishing & Forestry | 123 (95.4%) | 6 (4.6%) |
| Construction & Extraction | 1,041 (100.0%) | 0 (0.0%) |
| Installation, Maintenance & Repair | 833 (97.2%) | 24 (2.8%) |
| Total (Category) | 1,997 (98.5%) | 30 (1.5%) |
| Total (Overall) | 14,831 (49.8%) | 14,974 (50.2%) |
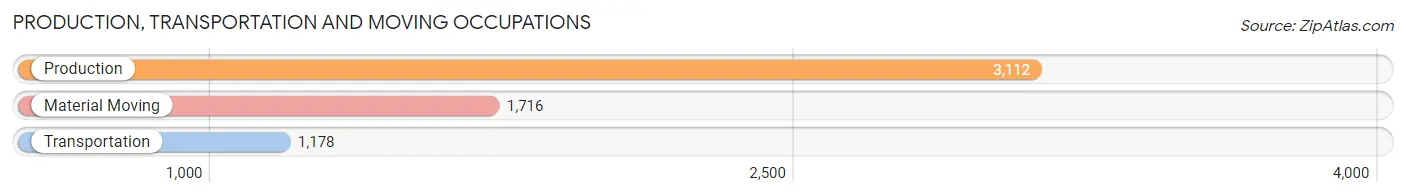
Production, Transportation and Moving Occupations
The most common Production, Transportation and Moving occupations in Decatur are Production (3,112 | 10.4%), Material Moving (1,716 | 5.8%), and Transportation (1,178 | 4.0%).
Production, Transportation and Moving Occupations by Sex
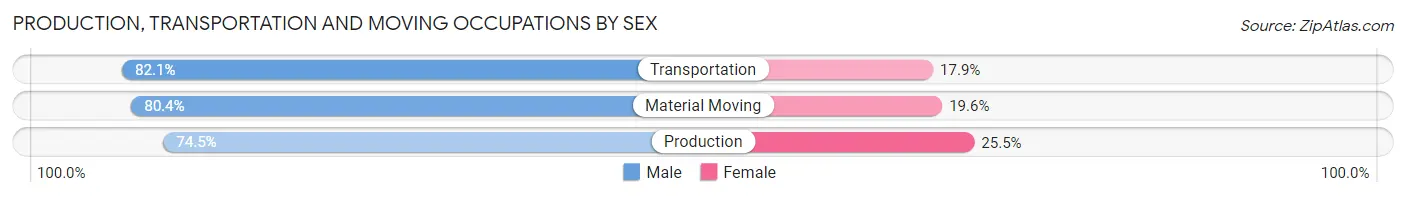
| Occupation | Male | Female |
| Production | 2,319 (74.5%) | 793 (25.5%) |
| Transportation | 967 (82.1%) | 211 (17.9%) |
| Material Moving | 1,380 (80.4%) | 336 (19.6%) |
| Total (Category) | 4,666 (77.7%) | 1,340 (22.3%) |
| Total (Overall) | 14,831 (49.8%) | 14,974 (50.2%) |
Employment Industries by Sex in Decatur
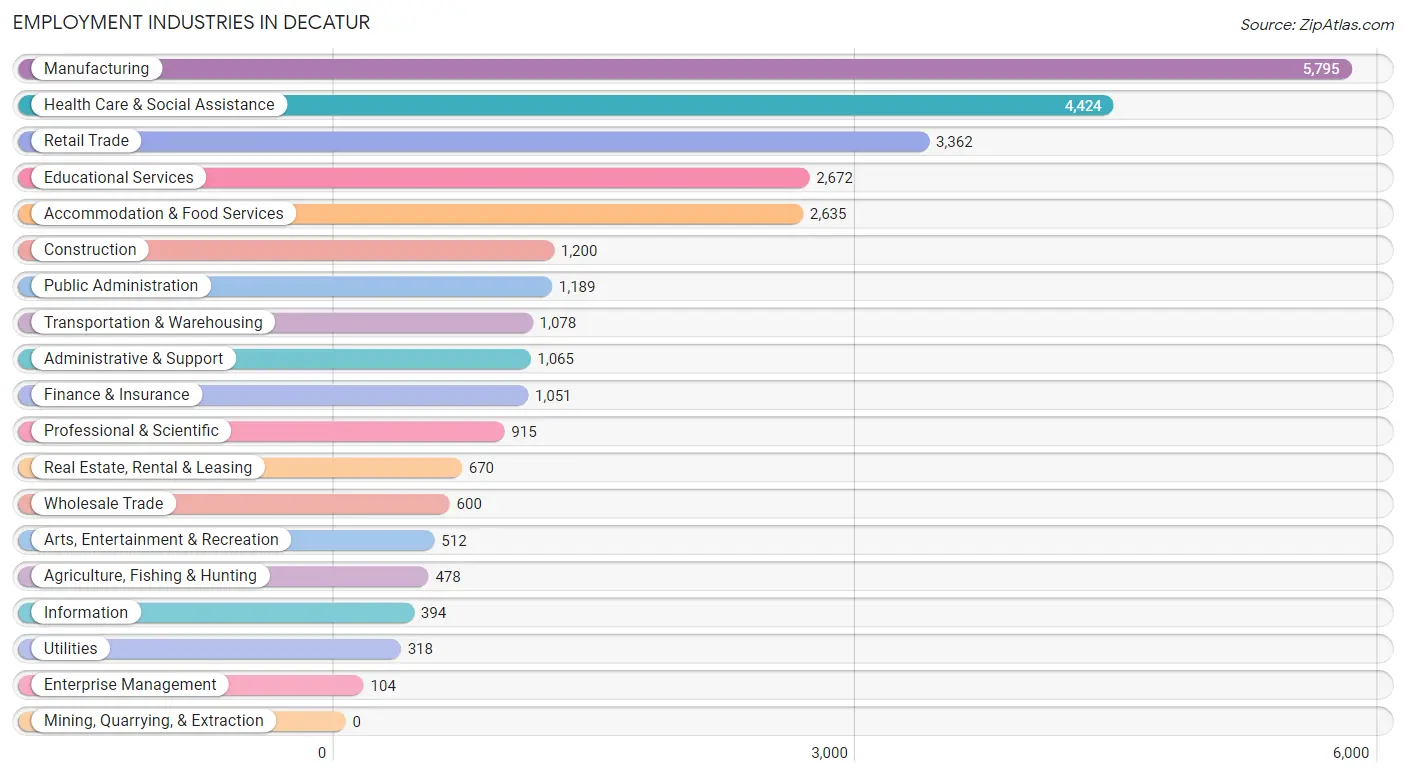
Employment Industries in Decatur
The major employment industries in Decatur include Manufacturing (5,795 | 19.4%), Health Care & Social Assistance (4,424 | 14.8%), Retail Trade (3,362 | 11.3%), Educational Services (2,672 | 9.0%), and Accommodation & Food Services (2,635 | 8.8%).
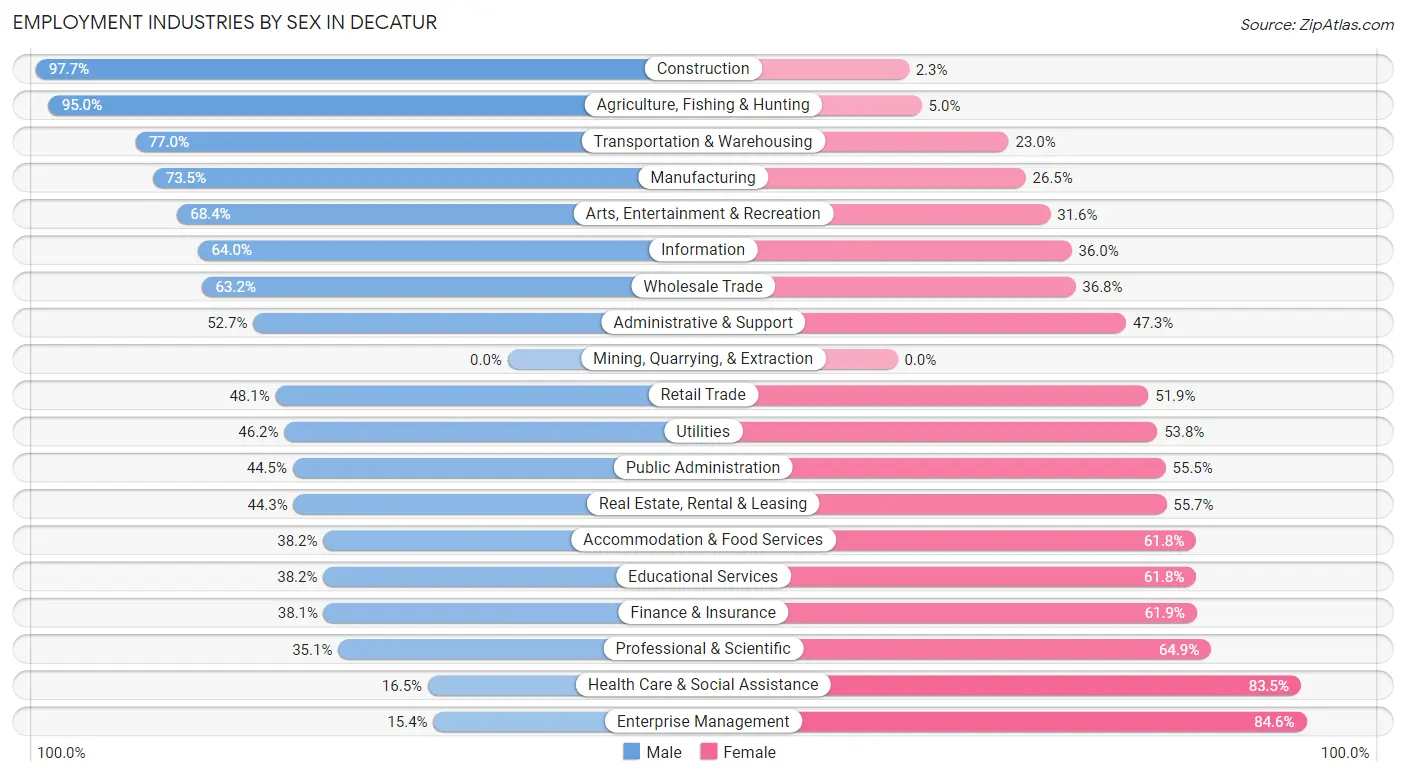
Employment Industries by Sex in Decatur
The Decatur industries that see more men than women are Construction (97.7%), Agriculture, Fishing & Hunting (95.0%), and Transportation & Warehousing (77.0%), whereas the industries that tend to have a higher number of women are Enterprise Management (84.6%), Health Care & Social Assistance (83.5%), and Professional & Scientific (64.9%).
| Industry | Male | Female |
| Agriculture, Fishing & Hunting | 454 (95.0%) | 24 (5.0%) |
| Mining, Quarrying, & Extraction | 0 (0.0%) | 0 (0.0%) |
| Construction | 1,172 (97.7%) | 28 (2.3%) |
| Manufacturing | 4,257 (73.5%) | 1,538 (26.5%) |
| Wholesale Trade | 379 (63.2%) | 221 (36.8%) |
| Retail Trade | 1,616 (48.1%) | 1,746 (51.9%) |
| Transportation & Warehousing | 830 (77.0%) | 248 (23.0%) |
| Utilities | 147 (46.2%) | 171 (53.8%) |
| Information | 252 (64.0%) | 142 (36.0%) |
| Finance & Insurance | 400 (38.1%) | 651 (61.9%) |
| Real Estate, Rental & Leasing | 297 (44.3%) | 373 (55.7%) |
| Professional & Scientific | 321 (35.1%) | 594 (64.9%) |
| Enterprise Management | 16 (15.4%) | 88 (84.6%) |
| Administrative & Support | 561 (52.7%) | 504 (47.3%) |
| Educational Services | 1,020 (38.2%) | 1,652 (61.8%) |
| Health Care & Social Assistance | 731 (16.5%) | 3,693 (83.5%) |
| Arts, Entertainment & Recreation | 350 (68.4%) | 162 (31.6%) |
| Accommodation & Food Services | 1,006 (38.2%) | 1,629 (61.8%) |
| Public Administration | 529 (44.5%) | 660 (55.5%) |
| Total | 14,831 (49.8%) | 14,974 (50.2%) |
Education in Decatur
School Enrollment in Decatur
The most common levels of schooling among the 15,079 students in Decatur are high school (3,482 | 23.1%), middle school (3,230 | 21.4%), and college / undergraduate (2,963 | 19.7%).
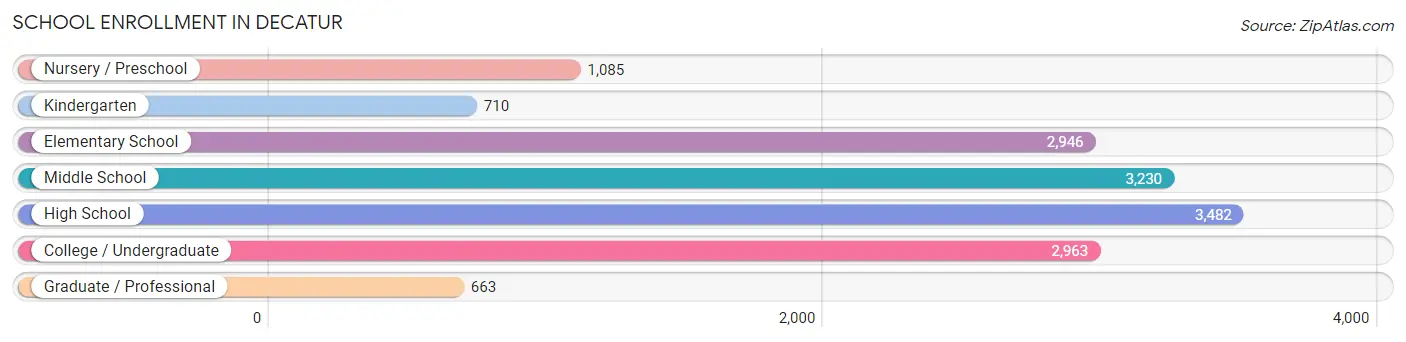
| School Level | # Students | % Students |
| Nursery / Preschool | 1,085 | 7.2% |
| Kindergarten | 710 | 4.7% |
| Elementary School | 2,946 | 19.5% |
| Middle School | 3,230 | 21.4% |
| High School | 3,482 | 23.1% |
| College / Undergraduate | 2,963 | 19.7% |
| Graduate / Professional | 663 | 4.4% |
| Total | 15,079 | 100.0% |
School Enrollment by Age by Funding Source in Decatur
Out of a total of 15,079 students who are enrolled in schools in Decatur, 3,272 (21.7%) attend a private institution, while the remaining 11,807 (78.3%) are enrolled in public schools. The age group of 20 to 24 year olds has the highest likelihood of being enrolled in private schools, with 979 (71.5% in the age bracket) enrolled. Conversely, the age group of 15 to 17 year olds has the lowest likelihood of being enrolled in a private school, with 2,284 (91.8% in the age bracket) attending a public institution.
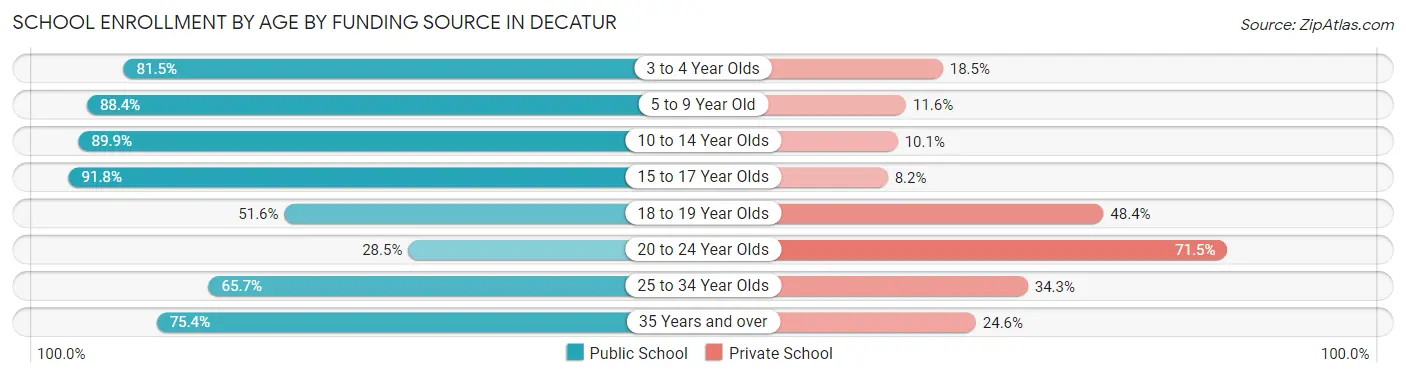
| Age Bracket | Public School | Private School |
| 3 to 4 Year Olds | 711 (81.5%) | 161 (18.5%) |
| 5 to 9 Year Old | 3,209 (88.4%) | 422 (11.6%) |
| 10 to 14 Year Olds | 3,421 (89.9%) | 383 (10.1%) |
| 15 to 17 Year Olds | 2,284 (91.8%) | 204 (8.2%) |
| 18 to 19 Year Olds | 718 (51.6%) | 673 (48.4%) |
| 20 to 24 Year Olds | 391 (28.5%) | 979 (71.5%) |
| 25 to 34 Year Olds | 483 (65.7%) | 252 (34.3%) |
| 35 Years and over | 594 (75.4%) | 194 (24.6%) |
| Total | 11,807 (78.3%) | 3,272 (21.7%) |
Educational Attainment by Field of Study in Decatur
Business (2,239 | 19.9%), education (2,235 | 19.9%), science & technology (1,441 | 12.8%), bio, nature & agricultural (688 | 6.1%), and social sciences (663 | 5.9%) are the most common fields of study among 11,241 individuals in Decatur who have obtained a bachelor's degree or higher.
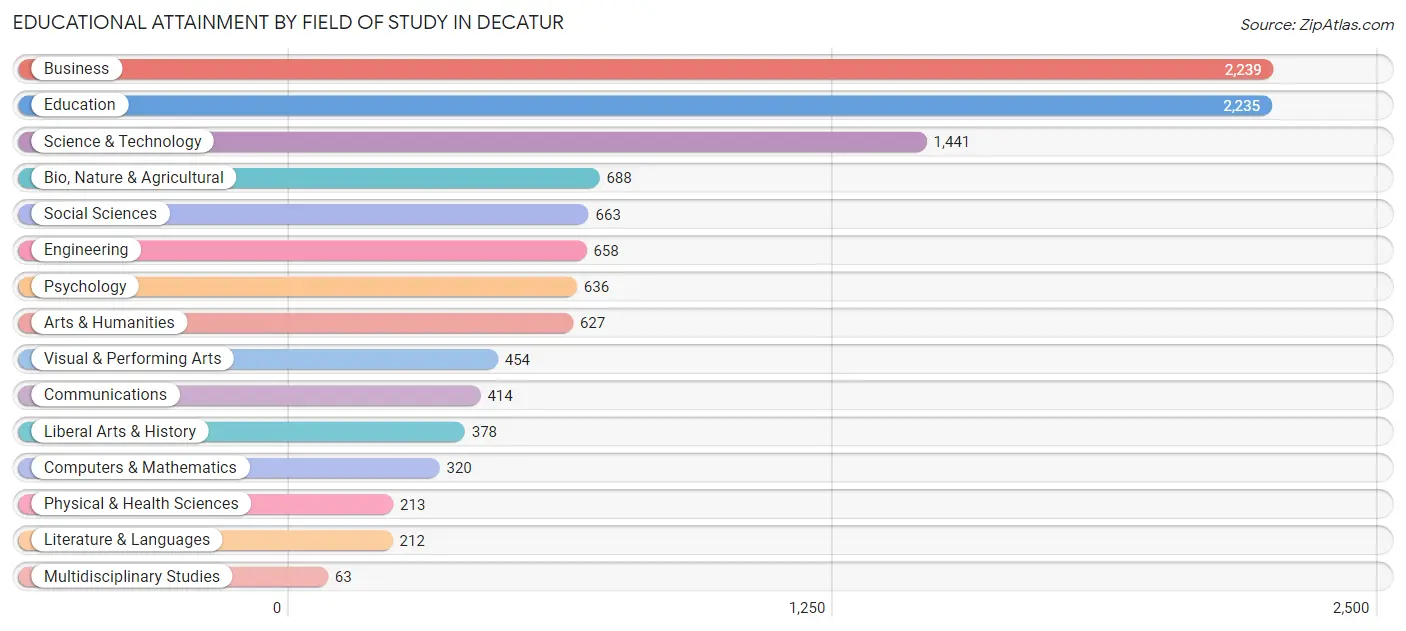
| Field of Study | # Graduates | % Graduates |
| Computers & Mathematics | 320 | 2.9% |
| Bio, Nature & Agricultural | 688 | 6.1% |
| Physical & Health Sciences | 213 | 1.9% |
| Psychology | 636 | 5.7% |
| Social Sciences | 663 | 5.9% |
| Engineering | 658 | 5.9% |
| Multidisciplinary Studies | 63 | 0.6% |
| Science & Technology | 1,441 | 12.8% |
| Business | 2,239 | 19.9% |
| Education | 2,235 | 19.9% |
| Literature & Languages | 212 | 1.9% |
| Liberal Arts & History | 378 | 3.4% |
| Visual & Performing Arts | 454 | 4.0% |
| Communications | 414 | 3.7% |
| Arts & Humanities | 627 | 5.6% |
| Total | 11,241 | 100.0% |
Transportation & Commute in Decatur
Vehicle Availability by Sex in Decatur
The most prevalent vehicle ownership categories in Decatur are males with 2 vehicles (6,423, accounting for 44.7%) and females with 2 vehicles (6,307, making up 43.9%).
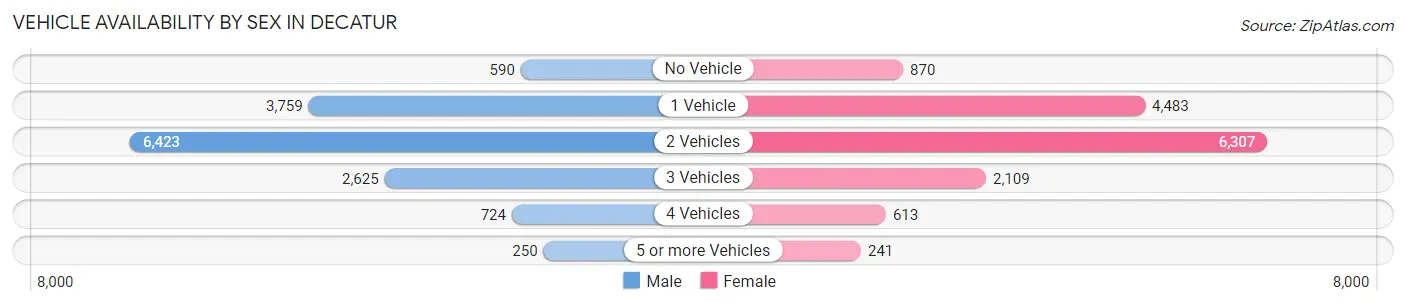
| Vehicles Available | Male | Female |
| No Vehicle | 590 (4.1%) | 870 (5.9%) |
| 1 Vehicle | 3,759 (26.2%) | 4,483 (30.7%) |
| 2 Vehicles | 6,423 (44.7%) | 6,307 (43.1%) |
| 3 Vehicles | 2,625 (18.3%) | 2,109 (14.4%) |
| 4 Vehicles | 724 (5.0%) | 613 (4.2%) |
| 5 or more Vehicles | 250 (1.7%) | 241 (1.7%) |
| Total | 14,371 (100.0%) | 14,623 (100.0%) |
Commute Time in Decatur
The most frequently occuring commute durations in Decatur are 10 to 14 minutes (7,789 commuters, 28.3%), 15 to 19 minutes (6,541 commuters, 23.7%), and 5 to 9 minutes (4,585 commuters, 16.7%).
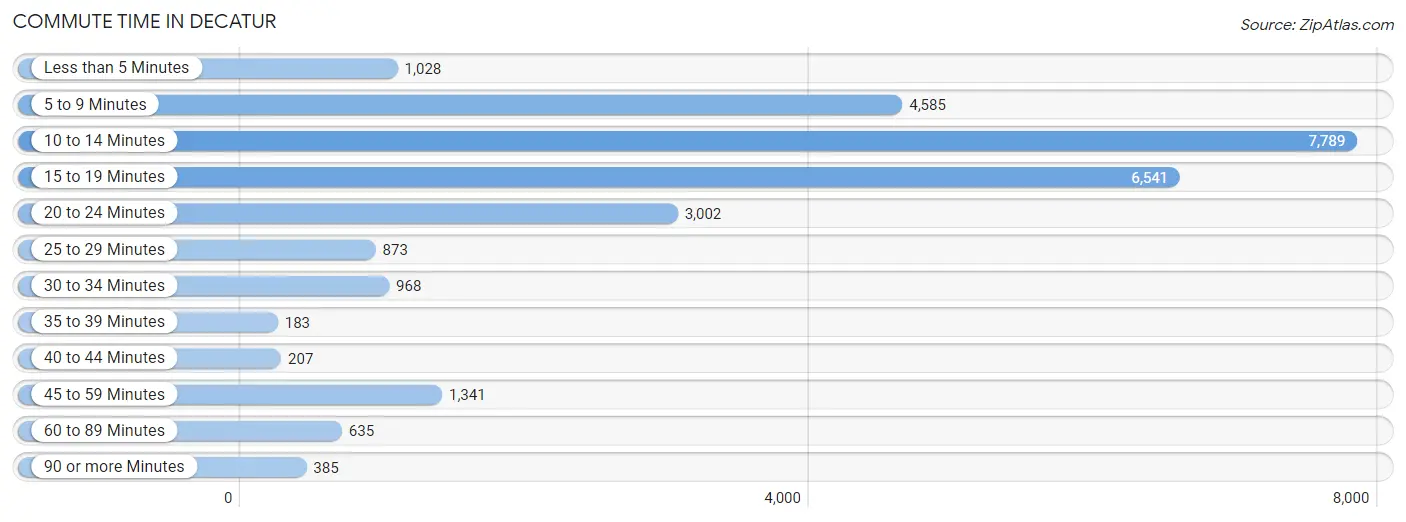
| Commute Time | # Commuters | % Commuters |
| Less than 5 Minutes | 1,028 | 3.7% |
| 5 to 9 Minutes | 4,585 | 16.7% |
| 10 to 14 Minutes | 7,789 | 28.3% |
| 15 to 19 Minutes | 6,541 | 23.7% |
| 20 to 24 Minutes | 3,002 | 10.9% |
| 25 to 29 Minutes | 873 | 3.2% |
| 30 to 34 Minutes | 968 | 3.5% |
| 35 to 39 Minutes | 183 | 0.7% |
| 40 to 44 Minutes | 207 | 0.7% |
| 45 to 59 Minutes | 1,341 | 4.9% |
| 60 to 89 Minutes | 635 | 2.3% |
| 90 or more Minutes | 385 | 1.4% |
Commute Time by Sex in Decatur
The most common commute times in Decatur are 10 to 14 minutes (3,525 commuters, 25.4%) for males and 10 to 14 minutes (4,264 commuters, 31.3%) for females.
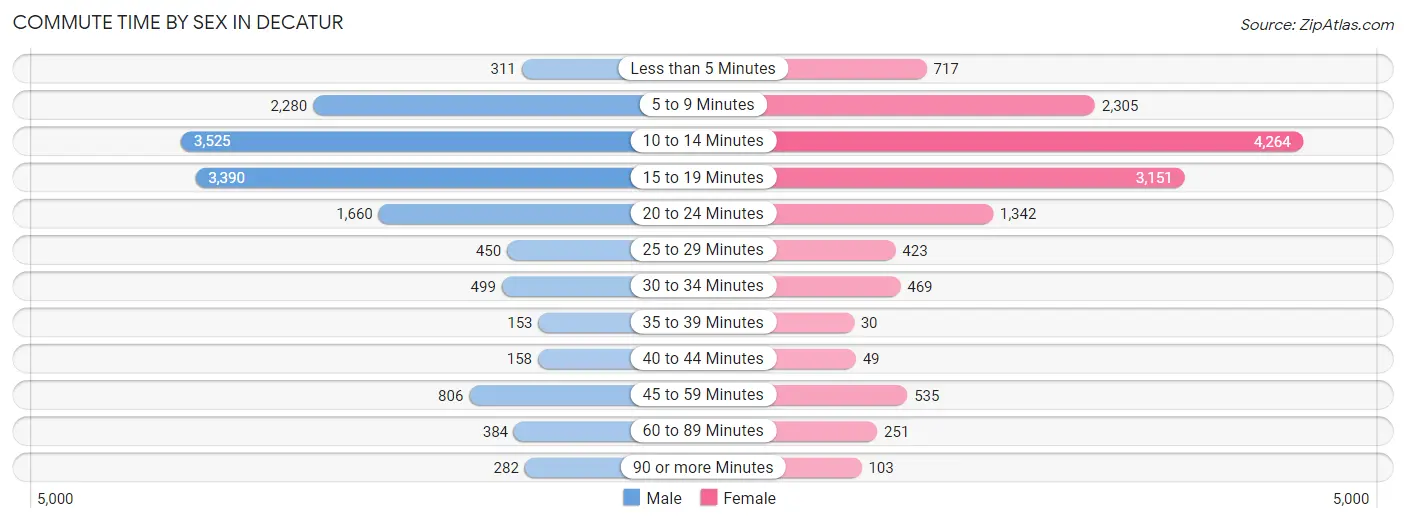
| Commute Time | Male | Female |
| Less than 5 Minutes | 311 (2.2%) | 717 (5.3%) |
| 5 to 9 Minutes | 2,280 (16.4%) | 2,305 (16.9%) |
| 10 to 14 Minutes | 3,525 (25.4%) | 4,264 (31.3%) |
| 15 to 19 Minutes | 3,390 (24.4%) | 3,151 (23.1%) |
| 20 to 24 Minutes | 1,660 (11.9%) | 1,342 (9.8%) |
| 25 to 29 Minutes | 450 (3.2%) | 423 (3.1%) |
| 30 to 34 Minutes | 499 (3.6%) | 469 (3.4%) |
| 35 to 39 Minutes | 153 (1.1%) | 30 (0.2%) |
| 40 to 44 Minutes | 158 (1.1%) | 49 (0.4%) |
| 45 to 59 Minutes | 806 (5.8%) | 535 (3.9%) |
| 60 to 89 Minutes | 384 (2.8%) | 251 (1.8%) |
| 90 or more Minutes | 282 (2.0%) | 103 (0.8%) |
Time of Departure to Work by Sex in Decatur
The most frequent times of departure to work in Decatur are 7:00 AM to 7:29 AM (2,093, 15.1%) for males and 7:30 AM to 7:59 AM (3,059, 22.4%) for females.
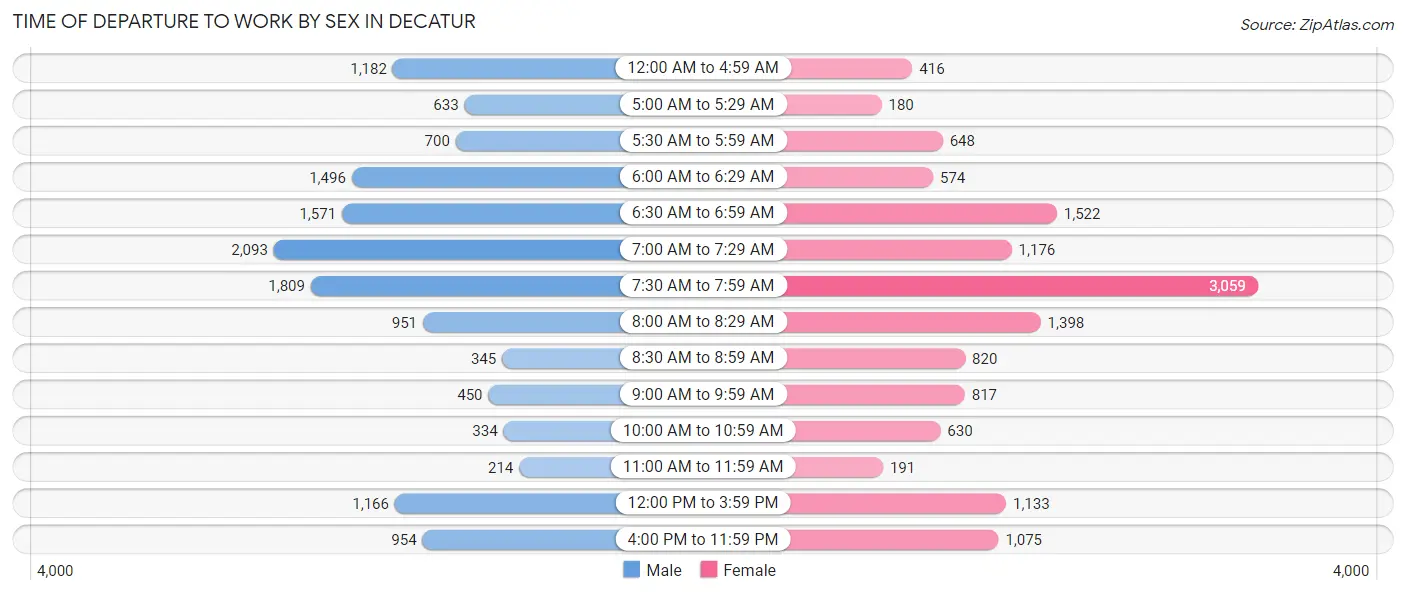
| Time of Departure | Male | Female |
| 12:00 AM to 4:59 AM | 1,182 (8.5%) | 416 (3.0%) |
| 5:00 AM to 5:29 AM | 633 (4.5%) | 180 (1.3%) |
| 5:30 AM to 5:59 AM | 700 (5.0%) | 648 (4.8%) |
| 6:00 AM to 6:29 AM | 1,496 (10.8%) | 574 (4.2%) |
| 6:30 AM to 6:59 AM | 1,571 (11.3%) | 1,522 (11.2%) |
| 7:00 AM to 7:29 AM | 2,093 (15.1%) | 1,176 (8.6%) |
| 7:30 AM to 7:59 AM | 1,809 (13.0%) | 3,059 (22.4%) |
| 8:00 AM to 8:29 AM | 951 (6.8%) | 1,398 (10.2%) |
| 8:30 AM to 8:59 AM | 345 (2.5%) | 820 (6.0%) |
| 9:00 AM to 9:59 AM | 450 (3.2%) | 817 (6.0%) |
| 10:00 AM to 10:59 AM | 334 (2.4%) | 630 (4.6%) |
| 11:00 AM to 11:59 AM | 214 (1.5%) | 191 (1.4%) |
| 12:00 PM to 3:59 PM | 1,166 (8.4%) | 1,133 (8.3%) |
| 4:00 PM to 11:59 PM | 954 (6.9%) | 1,075 (7.9%) |
| Total | 13,898 (100.0%) | 13,639 (100.0%) |
Housing Occupancy in Decatur
Occupancy by Ownership in Decatur
Of the total 30,727 dwellings in Decatur, owner-occupied units account for 18,808 (61.2%), while renter-occupied units make up 11,919 (38.8%).
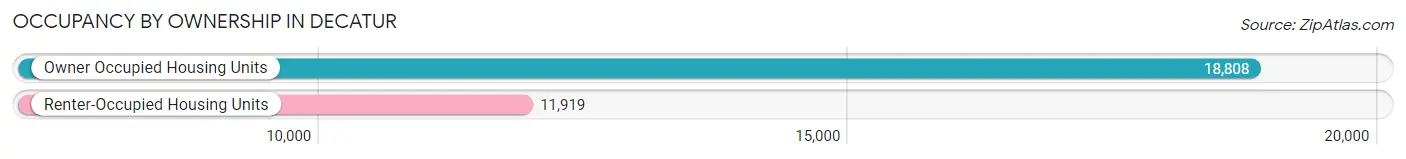
| Occupancy | # Housing Units | % Housing Units |
| Owner Occupied Housing Units | 18,808 | 61.2% |
| Renter-Occupied Housing Units | 11,919 | 38.8% |
| Total Occupied Housing Units | 30,727 | 100.0% |
Occupancy by Household Size in Decatur
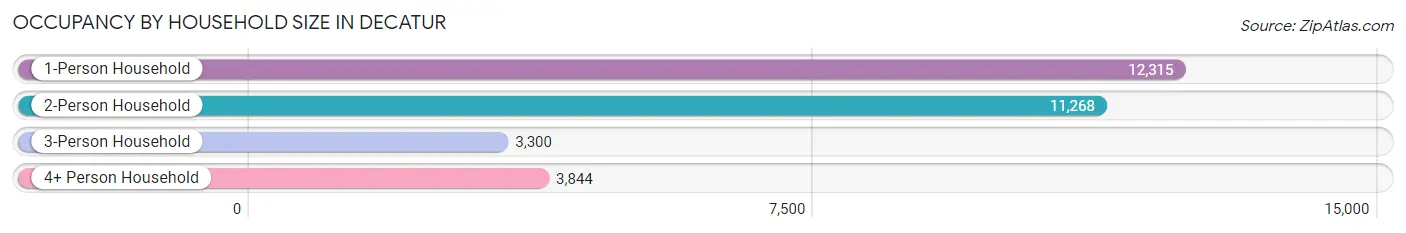
| Household Size | # Housing Units | % Housing Units |
| 1-Person Household | 12,315 | 40.1% |
| 2-Person Household | 11,268 | 36.7% |
| 3-Person Household | 3,300 | 10.7% |
| 4+ Person Household | 3,844 | 12.5% |
| Total Housing Units | 30,727 | 100.0% |
Occupancy by Ownership by Household Size in Decatur
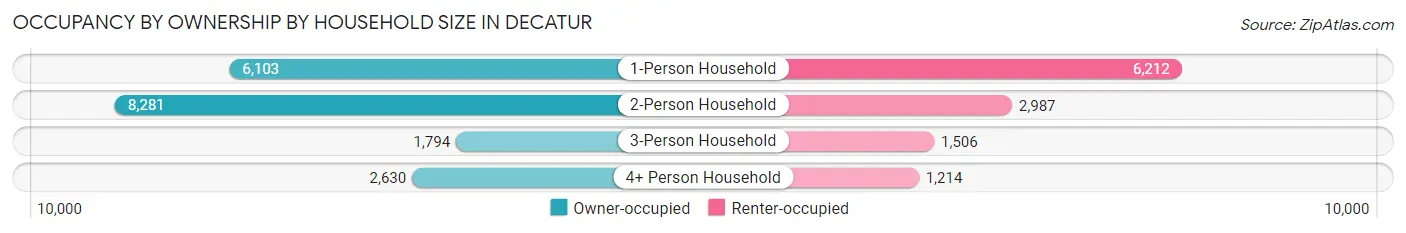
| Household Size | Owner-occupied | Renter-occupied |
| 1-Person Household | 6,103 (49.6%) | 6,212 (50.4%) |
| 2-Person Household | 8,281 (73.5%) | 2,987 (26.5%) |
| 3-Person Household | 1,794 (54.4%) | 1,506 (45.6%) |
| 4+ Person Household | 2,630 (68.4%) | 1,214 (31.6%) |
| Total Housing Units | 18,808 (61.2%) | 11,919 (38.8%) |
Occupancy by Educational Attainment in Decatur
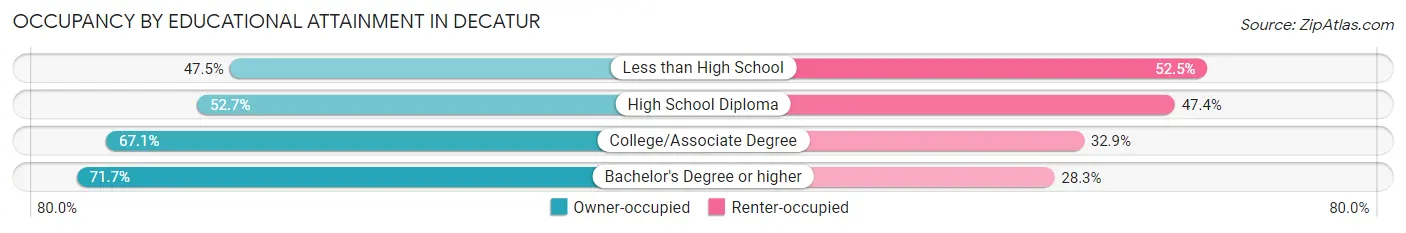
| Household Size | Owner-occupied | Renter-occupied |
| Less than High School | 1,155 (47.5%) | 1,278 (52.5%) |
| High School Diploma | 6,026 (52.6%) | 5,419 (47.3%) |
| College/Associate Degree | 6,608 (67.1%) | 3,245 (32.9%) |
| Bachelor's Degree or higher | 5,019 (71.7%) | 1,977 (28.3%) |
Occupancy by Age of Householder in Decatur
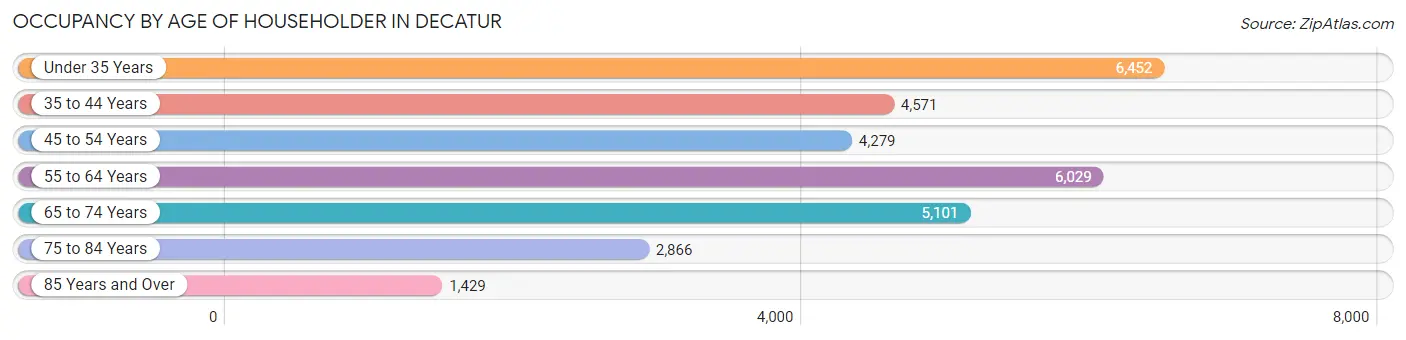
| Age Bracket | # Households | % Households |
| Under 35 Years | 6,452 | 21.0% |
| 35 to 44 Years | 4,571 | 14.9% |
| 45 to 54 Years | 4,279 | 13.9% |
| 55 to 64 Years | 6,029 | 19.6% |
| 65 to 74 Years | 5,101 | 16.6% |
| 75 to 84 Years | 2,866 | 9.3% |
| 85 Years and Over | 1,429 | 4.6% |
| Total | 30,727 | 100.0% |
Housing Finances in Decatur
Median Income by Occupancy in Decatur
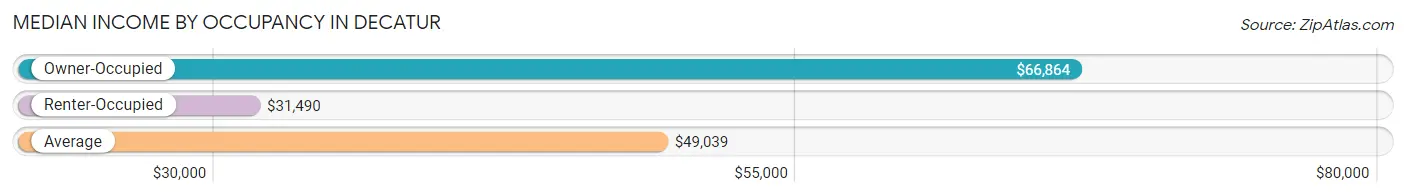
| Occupancy Type | # Households | Median Income |
| Owner-Occupied | 18,808 (61.2%) | $66,864 |
| Renter-Occupied | 11,919 (38.8%) | $31,490 |
| Average | 30,727 (100.0%) | $49,039 |
Occupancy by Householder Income Bracket in Decatur
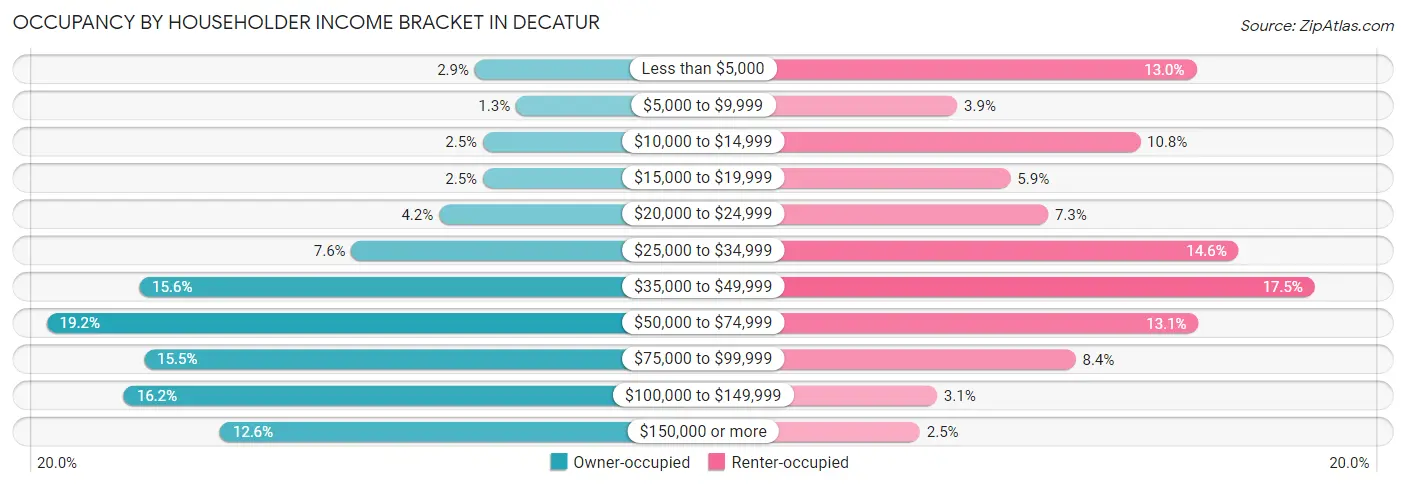
| Income Bracket | Owner-occupied | Renter-occupied |
| Less than $5,000 | 536 (2.9%) | 1,547 (13.0%) |
| $5,000 to $9,999 | 240 (1.3%) | 461 (3.9%) |
| $10,000 to $14,999 | 477 (2.5%) | 1,292 (10.8%) |
| $15,000 to $19,999 | 477 (2.5%) | 703 (5.9%) |
| $20,000 to $24,999 | 792 (4.2%) | 874 (7.3%) |
| $25,000 to $34,999 | 1,420 (7.5%) | 1,739 (14.6%) |
| $35,000 to $49,999 | 2,942 (15.6%) | 2,085 (17.5%) |
| $50,000 to $74,999 | 3,604 (19.2%) | 1,557 (13.1%) |
| $75,000 to $99,999 | 2,906 (15.4%) | 999 (8.4%) |
| $100,000 to $149,999 | 3,051 (16.2%) | 370 (3.1%) |
| $150,000 or more | 2,363 (12.6%) | 292 (2.5%) |
| Total | 18,808 (100.0%) | 11,919 (100.0%) |
Monthly Housing Cost Tiers in Decatur
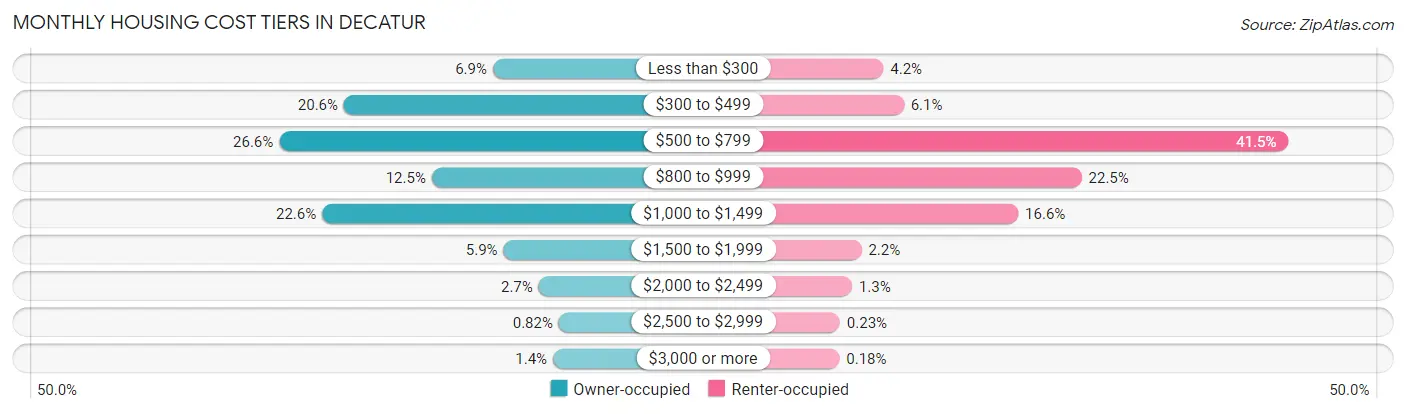
| Monthly Cost | Owner-occupied | Renter-occupied |
| Less than $300 | 1,297 (6.9%) | 504 (4.2%) |
| $300 to $499 | 3,877 (20.6%) | 727 (6.1%) |
| $500 to $799 | 4,998 (26.6%) | 4,948 (41.5%) |
| $800 to $999 | 2,354 (12.5%) | 2,679 (22.5%) |
| $1,000 to $1,499 | 4,254 (22.6%) | 1,983 (16.6%) |
| $1,500 to $1,999 | 1,114 (5.9%) | 264 (2.2%) |
| $2,000 to $2,499 | 504 (2.7%) | 160 (1.3%) |
| $2,500 to $2,999 | 155 (0.8%) | 27 (0.2%) |
| $3,000 or more | 255 (1.4%) | 22 (0.2%) |
| Total | 18,808 (100.0%) | 11,919 (100.0%) |
Physical Housing Characteristics in Decatur
Housing Structures in Decatur
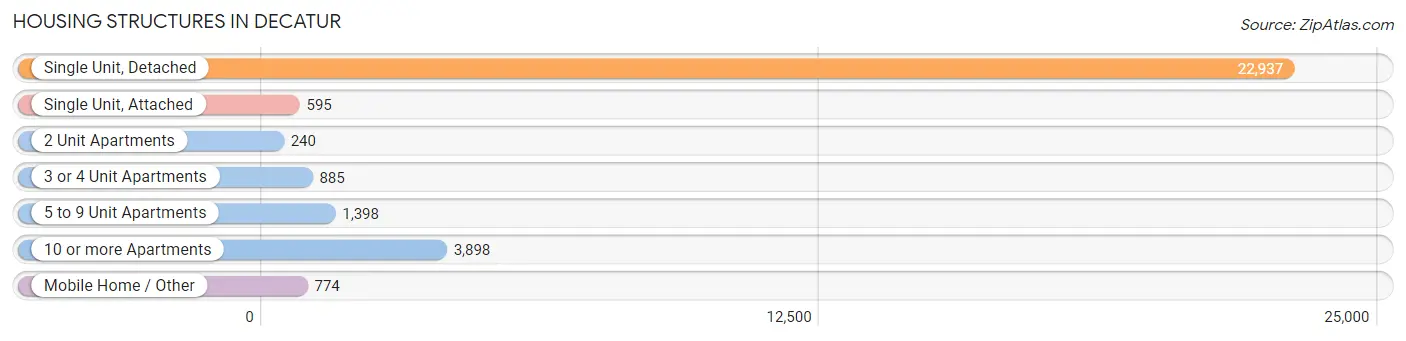
| Structure Type | # Housing Units | % Housing Units |
| Single Unit, Detached | 22,937 | 74.7% |
| Single Unit, Attached | 595 | 1.9% |
| 2 Unit Apartments | 240 | 0.8% |
| 3 or 4 Unit Apartments | 885 | 2.9% |
| 5 to 9 Unit Apartments | 1,398 | 4.5% |
| 10 or more Apartments | 3,898 | 12.7% |
| Mobile Home / Other | 774 | 2.5% |
| Total | 30,727 | 100.0% |
Housing Structures by Occupancy in Decatur
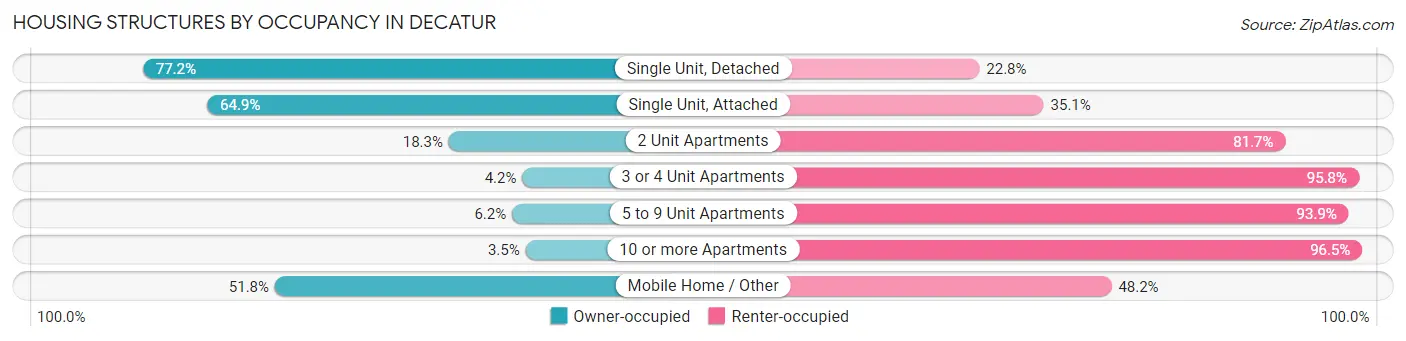
| Structure Type | Owner-occupied | Renter-occupied |
| Single Unit, Detached | 17,716 (77.2%) | 5,221 (22.8%) |
| Single Unit, Attached | 386 (64.9%) | 209 (35.1%) |
| 2 Unit Apartments | 44 (18.3%) | 196 (81.7%) |
| 3 or 4 Unit Apartments | 37 (4.2%) | 848 (95.8%) |
| 5 to 9 Unit Apartments | 86 (6.1%) | 1,312 (93.9%) |
| 10 or more Apartments | 138 (3.5%) | 3,760 (96.5%) |
| Mobile Home / Other | 401 (51.8%) | 373 (48.2%) |
| Total | 18,808 (61.2%) | 11,919 (38.8%) |
Housing Structures by Number of Rooms in Decatur
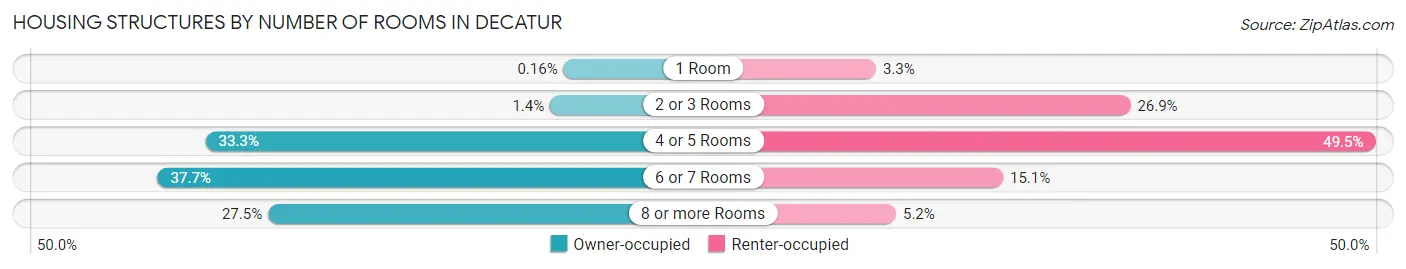
| Number of Rooms | Owner-occupied | Renter-occupied |
| 1 Room | 31 (0.2%) | 398 (3.3%) |
| 2 or 3 Rooms | 264 (1.4%) | 3,203 (26.9%) |
| 4 or 5 Rooms | 6,255 (33.3%) | 5,901 (49.5%) |
| 6 or 7 Rooms | 7,088 (37.7%) | 1,798 (15.1%) |
| 8 or more Rooms | 5,170 (27.5%) | 619 (5.2%) |
| Total | 18,808 (100.0%) | 11,919 (100.0%) |
Housing Structure by Heating Type in Decatur
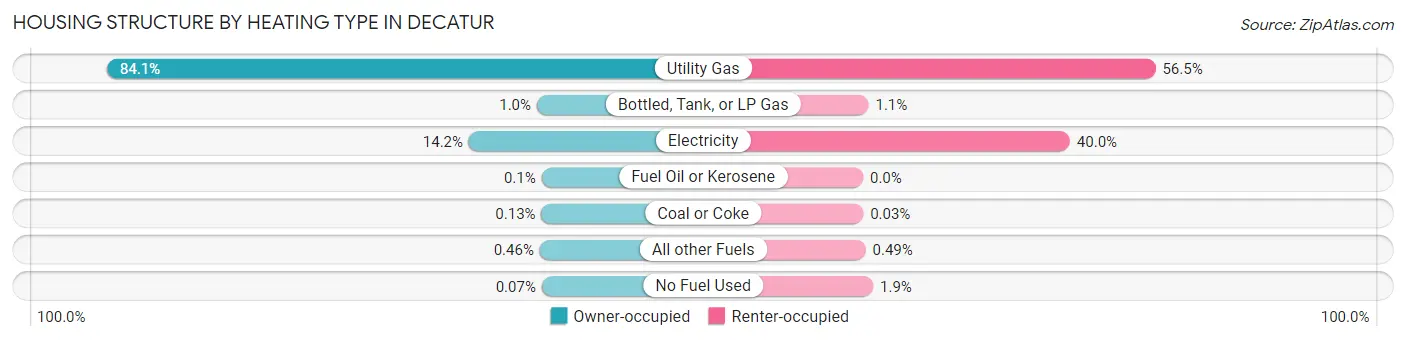
| Heating Type | Owner-occupied | Renter-occupied |
| Utility Gas | 15,816 (84.1%) | 6,736 (56.5%) |
| Bottled, Tank, or LP Gas | 190 (1.0%) | 126 (1.1%) |
| Electricity | 2,661 (14.1%) | 4,764 (40.0%) |
| Fuel Oil or Kerosene | 18 (0.1%) | 0 (0.0%) |
| Coal or Coke | 24 (0.1%) | 4 (0.0%) |
| All other Fuels | 86 (0.5%) | 58 (0.5%) |
| No Fuel Used | 13 (0.1%) | 231 (1.9%) |
| Total | 18,808 (100.0%) | 11,919 (100.0%) |
Household Vehicle Usage in Decatur
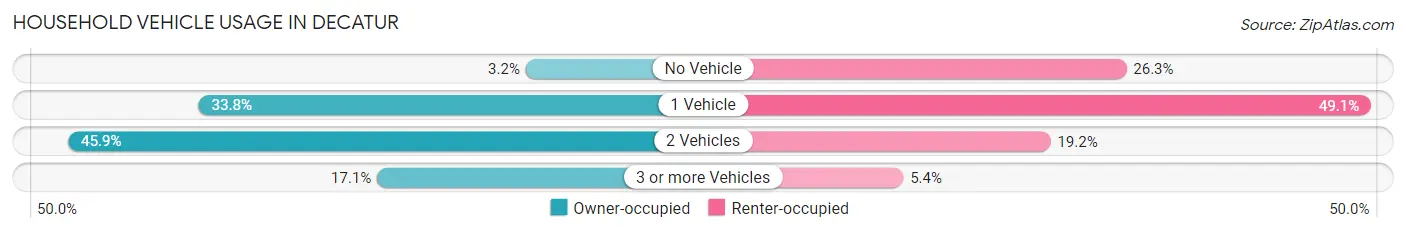
| Vehicles per Household | Owner-occupied | Renter-occupied |
| No Vehicle | 606 (3.2%) | 3,131 (26.3%) |
| 1 Vehicle | 6,347 (33.8%) | 5,853 (49.1%) |
| 2 Vehicles | 8,640 (45.9%) | 2,287 (19.2%) |
| 3 or more Vehicles | 3,215 (17.1%) | 648 (5.4%) |
| Total | 18,808 (100.0%) | 11,919 (100.0%) |
Real Estate & Mortgages in Decatur
Real Estate and Mortgage Overview in Decatur
| Characteristic | Without Mortgage | With Mortgage |
| Housing Units | 9,433 | 9,375 |
| Median Property Value | $90,400 | $103,600 |
| Median Household Income | $59,129 | $1,381 |
| Monthly Housing Costs | $491 | $226 |
| Real Estate Taxes | $1,806 | $170 |
Property Value by Mortgage Status in Decatur
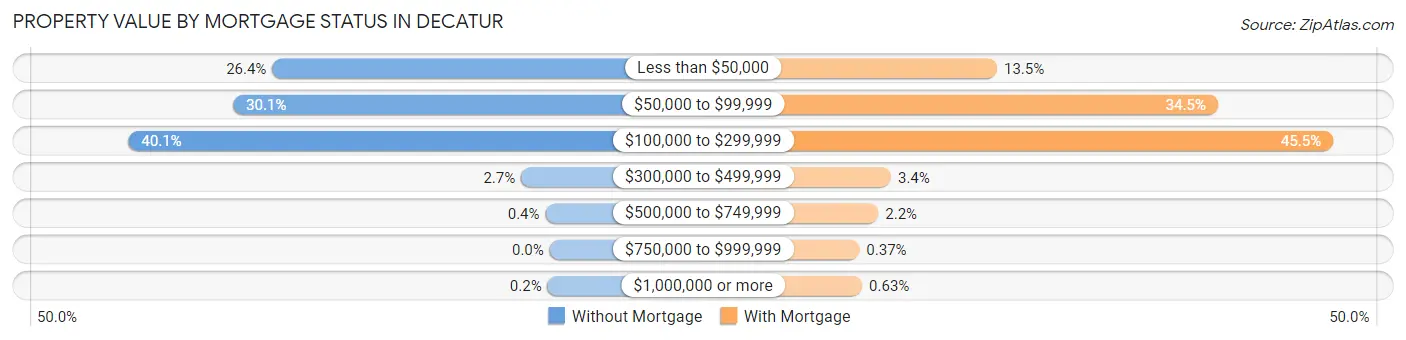
| Property Value | Without Mortgage | With Mortgage |
| Less than $50,000 | 2,492 (26.4%) | 1,264 (13.5%) |
| $50,000 to $99,999 | 2,843 (30.1%) | 3,234 (34.5%) |
| $100,000 to $299,999 | 3,784 (40.1%) | 4,263 (45.5%) |
| $300,000 to $499,999 | 257 (2.7%) | 317 (3.4%) |
| $500,000 to $749,999 | 38 (0.4%) | 203 (2.2%) |
| $750,000 to $999,999 | 0 (0.0%) | 35 (0.4%) |
| $1,000,000 or more | 19 (0.2%) | 59 (0.6%) |
| Total | 9,433 (100.0%) | 9,375 (100.0%) |
Household Income by Mortgage Status in Decatur
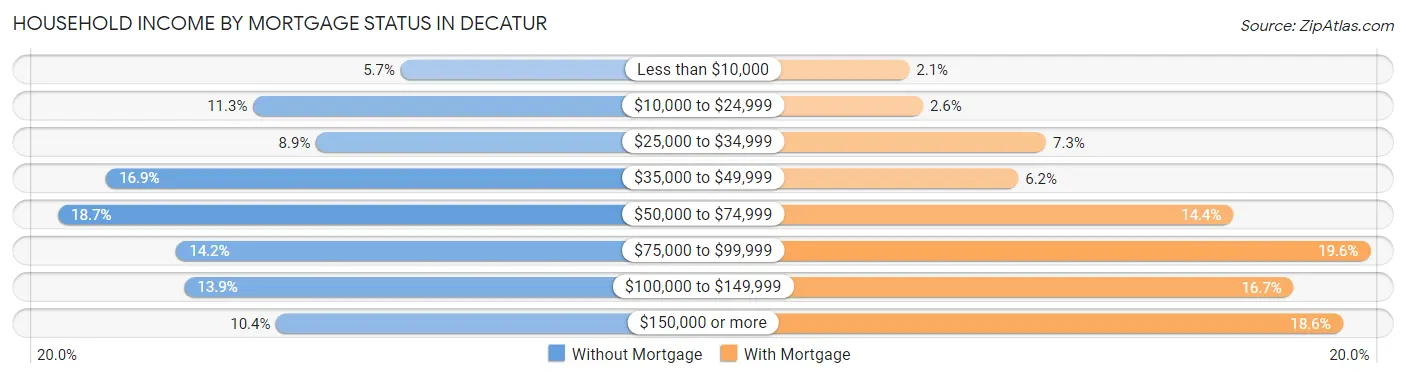
| Household Income | Without Mortgage | With Mortgage |
| Less than $10,000 | 535 (5.7%) | 192 (2.1%) |
| $10,000 to $24,999 | 1,065 (11.3%) | 241 (2.6%) |
| $25,000 to $34,999 | 839 (8.9%) | 681 (7.3%) |
| $35,000 to $49,999 | 1,593 (16.9%) | 581 (6.2%) |
| $50,000 to $74,999 | 1,766 (18.7%) | 1,349 (14.4%) |
| $75,000 to $99,999 | 1,341 (14.2%) | 1,838 (19.6%) |
| $100,000 to $149,999 | 1,312 (13.9%) | 1,565 (16.7%) |
| $150,000 or more | 982 (10.4%) | 1,739 (18.5%) |
| Total | 9,433 (100.0%) | 9,375 (100.0%) |
Property Value to Household Income Ratio in Decatur
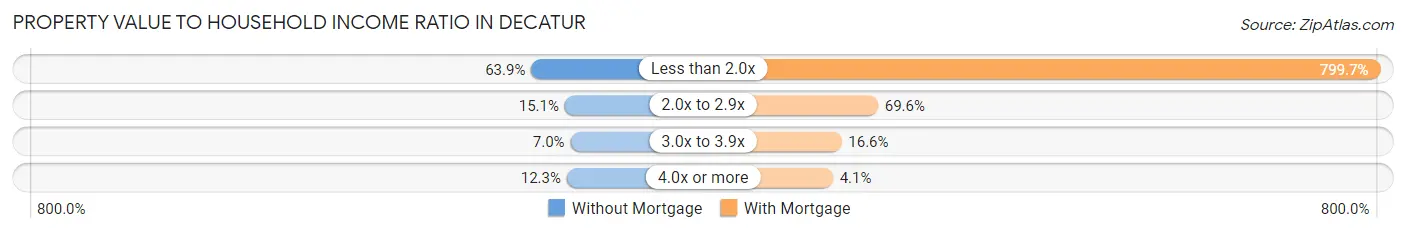
| Value-to-Income Ratio | Without Mortgage | With Mortgage |
| Less than 2.0x | 6,027 (63.9%) | 74,975 (799.7%) |
| 2.0x to 2.9x | 1,425 (15.1%) | 6,524 (69.6%) |
| 3.0x to 3.9x | 659 (7.0%) | 1,560 (16.6%) |
| 4.0x or more | 1,156 (12.2%) | 380 (4.1%) |
| Total | 9,433 (100.0%) | 9,375 (100.0%) |
Real Estate Taxes by Mortgage Status in Decatur
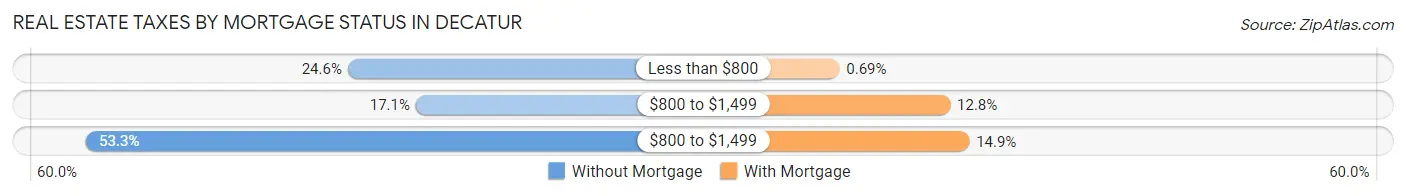
| Property Taxes | Without Mortgage | With Mortgage |
| Less than $800 | 2,320 (24.6%) | 65 (0.7%) |
| $800 to $1,499 | 1,616 (17.1%) | 1,203 (12.8%) |
| $800 to $1,499 | 5,024 (53.3%) | 1,399 (14.9%) |
| Total | 9,433 (100.0%) | 9,375 (100.0%) |
Health & Disability in Decatur
Health Insurance Coverage by Age in Decatur
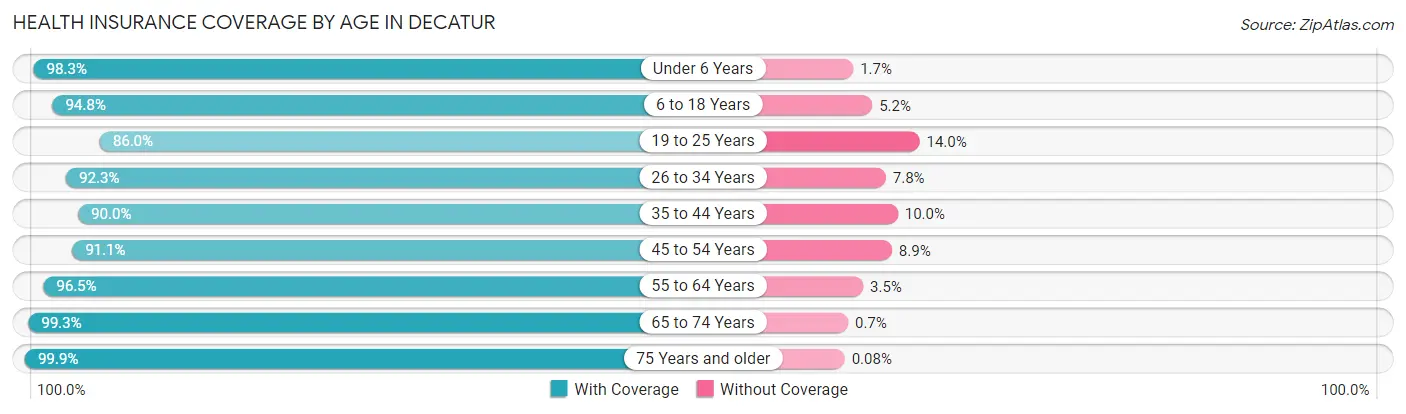
| Age Bracket | With Coverage | Without Coverage |
| Under 6 Years | 5,249 (98.3%) | 89 (1.7%) |
| 6 to 18 Years | 10,039 (94.8%) | 552 (5.2%) |
| 19 to 25 Years | 5,772 (86.0%) | 943 (14.0%) |
| 26 to 34 Years | 7,725 (92.2%) | 649 (7.7%) |
| 35 to 44 Years | 6,635 (90.0%) | 735 (10.0%) |
| 45 to 54 Years | 6,800 (91.1%) | 663 (8.9%) |
| 55 to 64 Years | 9,260 (96.5%) | 337 (3.5%) |
| 65 to 74 Years | 7,491 (99.3%) | 53 (0.7%) |
| 75 Years and older | 6,138 (99.9%) | 5 (0.1%) |
| Total | 65,109 (94.2%) | 4,026 (5.8%) |
Health Insurance Coverage by Citizenship Status in Decatur
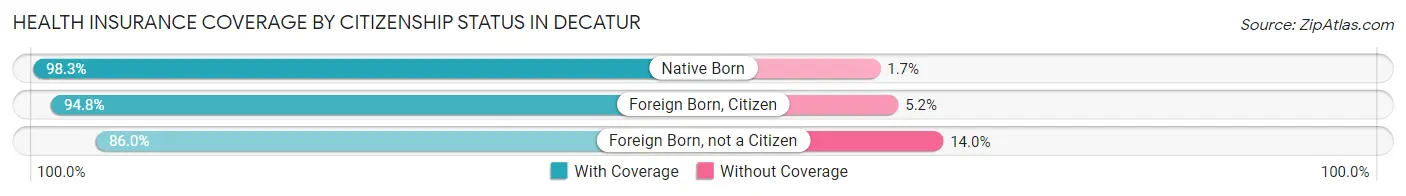
| Citizenship Status | With Coverage | Without Coverage |
| Native Born | 5,249 (98.3%) | 89 (1.7%) |
| Foreign Born, Citizen | 10,039 (94.8%) | 552 (5.2%) |
| Foreign Born, not a Citizen | 5,772 (86.0%) | 943 (14.0%) |
Health Insurance Coverage by Household Income in Decatur
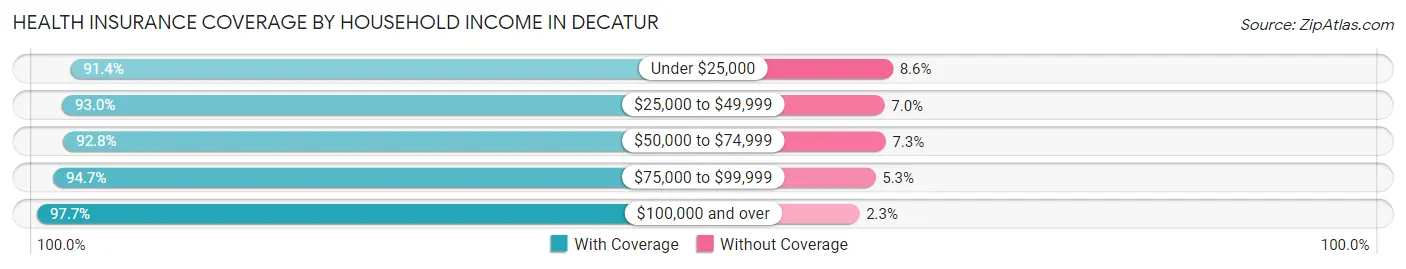
| Household Income | With Coverage | Without Coverage |
| Under $25,000 | 12,057 (91.4%) | 1,134 (8.6%) |
| $25,000 to $49,999 | 14,635 (93.0%) | 1,106 (7.0%) |
| $50,000 to $74,999 | 10,239 (92.7%) | 800 (7.2%) |
| $75,000 to $99,999 | 9,509 (94.7%) | 536 (5.3%) |
| $100,000 and over | 17,457 (97.7%) | 414 (2.3%) |
Public vs Private Health Insurance Coverage by Age in Decatur
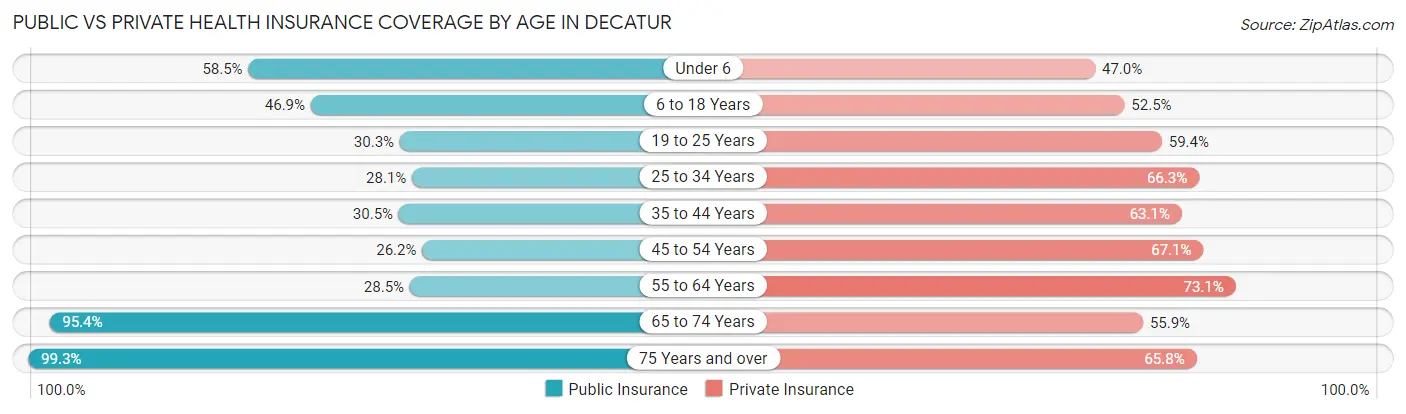
| Age Bracket | Public Insurance | Private Insurance |
| Under 6 | 3,120 (58.5%) | 2,509 (47.0%) |
| 6 to 18 Years | 4,964 (46.9%) | 5,556 (52.5%) |
| 19 to 25 Years | 2,037 (30.3%) | 3,989 (59.4%) |
| 25 to 34 Years | 2,350 (28.1%) | 5,552 (66.3%) |
| 35 to 44 Years | 2,249 (30.5%) | 4,650 (63.1%) |
| 45 to 54 Years | 1,954 (26.2%) | 5,008 (67.1%) |
| 55 to 64 Years | 2,733 (28.5%) | 7,014 (73.1%) |
| 65 to 74 Years | 7,198 (95.4%) | 4,217 (55.9%) |
| 75 Years and over | 6,102 (99.3%) | 4,044 (65.8%) |
| Total | 32,707 (47.3%) | 42,539 (61.5%) |
Disability Status by Sex by Age in Decatur
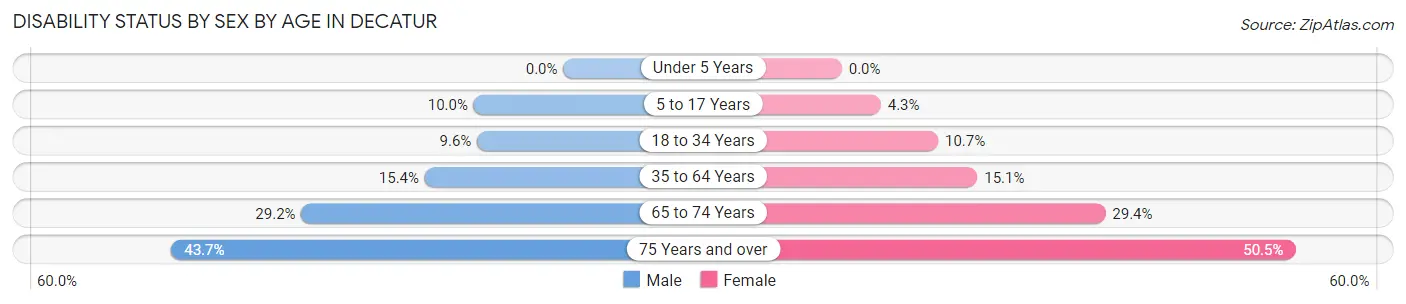
| Age Bracket | Male | Female |
| Under 5 Years | 0 (0.0%) | 0 (0.0%) |
| 5 to 17 Years | 525 (10.0%) | 228 (4.3%) |
| 18 to 34 Years | 755 (9.6%) | 886 (10.7%) |
| 35 to 64 Years | 1,784 (15.4%) | 1,940 (15.1%) |
| 65 to 74 Years | 1,024 (29.2%) | 1,184 (29.3%) |
| 75 Years and over | 1,054 (43.7%) | 1,883 (50.5%) |
Disability Class by Sex by Age in Decatur
Disability Class: Hearing Difficulty
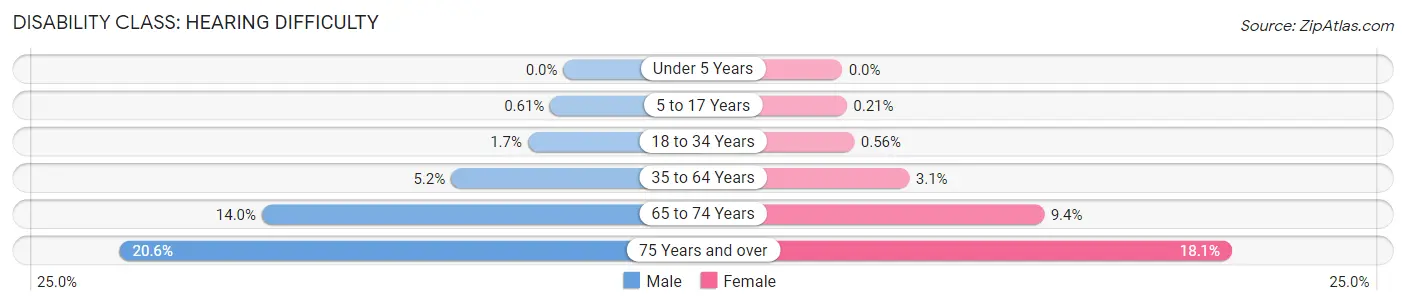
| Age Bracket | Male | Female |
| Under 5 Years | 0 (0.0%) | 0 (0.0%) |
| 5 to 17 Years | 32 (0.6%) | 11 (0.2%) |
| 18 to 34 Years | 130 (1.7%) | 46 (0.6%) |
| 35 to 64 Years | 603 (5.2%) | 400 (3.1%) |
| 65 to 74 Years | 491 (14.0%) | 378 (9.4%) |
| 75 Years and over | 497 (20.6%) | 675 (18.1%) |
Disability Class: Vision Difficulty
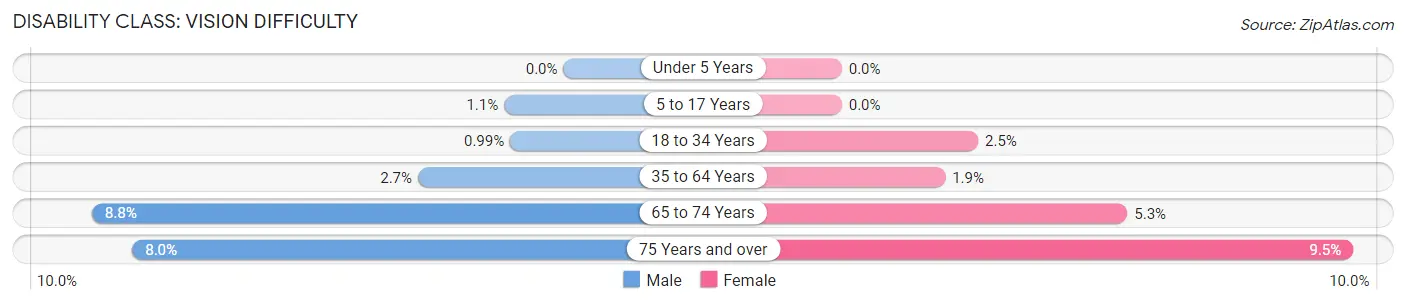
| Age Bracket | Male | Female |
| Under 5 Years | 0 (0.0%) | 0 (0.0%) |
| 5 to 17 Years | 58 (1.1%) | 0 (0.0%) |
| 18 to 34 Years | 78 (1.0%) | 209 (2.5%) |
| 35 to 64 Years | 312 (2.7%) | 247 (1.9%) |
| 65 to 74 Years | 307 (8.7%) | 214 (5.3%) |
| 75 Years and over | 193 (8.0%) | 354 (9.5%) |
Disability Class: Cognitive Difficulty
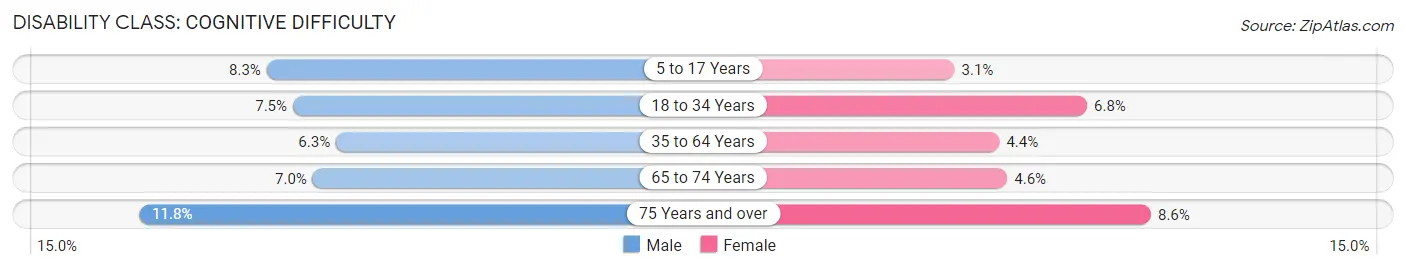
| Age Bracket | Male | Female |
| 5 to 17 Years | 435 (8.3%) | 165 (3.1%) |
| 18 to 34 Years | 592 (7.5%) | 564 (6.8%) |
| 35 to 64 Years | 733 (6.3%) | 564 (4.4%) |
| 65 to 74 Years | 245 (7.0%) | 186 (4.6%) |
| 75 Years and over | 285 (11.8%) | 321 (8.6%) |
Disability Class: Ambulatory Difficulty
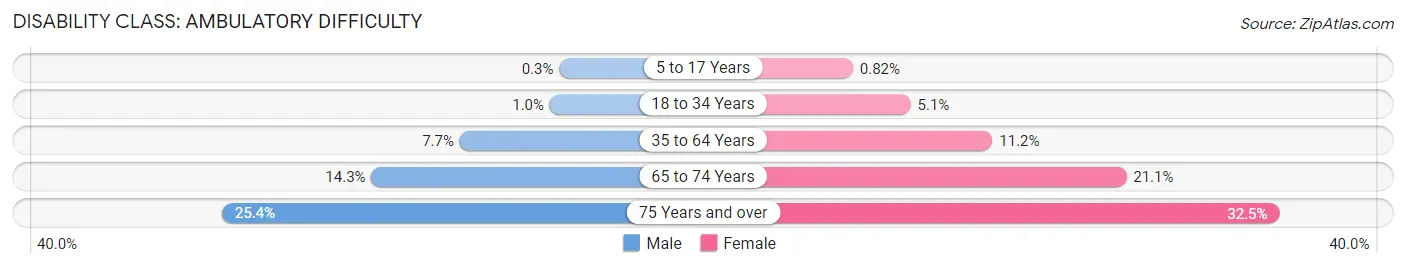
| Age Bracket | Male | Female |
| 5 to 17 Years | 16 (0.3%) | 43 (0.8%) |
| 18 to 34 Years | 79 (1.0%) | 422 (5.1%) |
| 35 to 64 Years | 890 (7.7%) | 1,438 (11.2%) |
| 65 to 74 Years | 500 (14.2%) | 852 (21.1%) |
| 75 Years and over | 612 (25.4%) | 1,211 (32.5%) |
Disability Class: Self-Care Difficulty
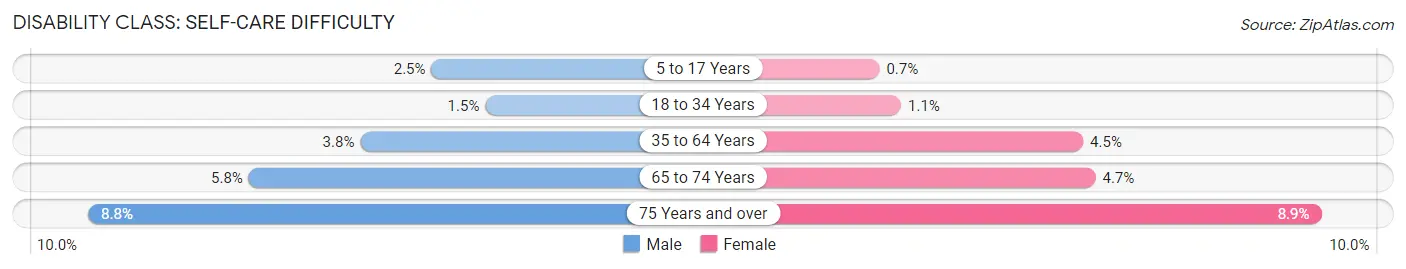
| Age Bracket | Male | Female |
| 5 to 17 Years | 129 (2.5%) | 37 (0.7%) |
| 18 to 34 Years | 114 (1.5%) | 91 (1.1%) |
| 35 to 64 Years | 436 (3.8%) | 576 (4.5%) |
| 65 to 74 Years | 205 (5.8%) | 190 (4.7%) |
| 75 Years and over | 213 (8.8%) | 332 (8.9%) |
Technology Access in Decatur
Computing Device Access in Decatur
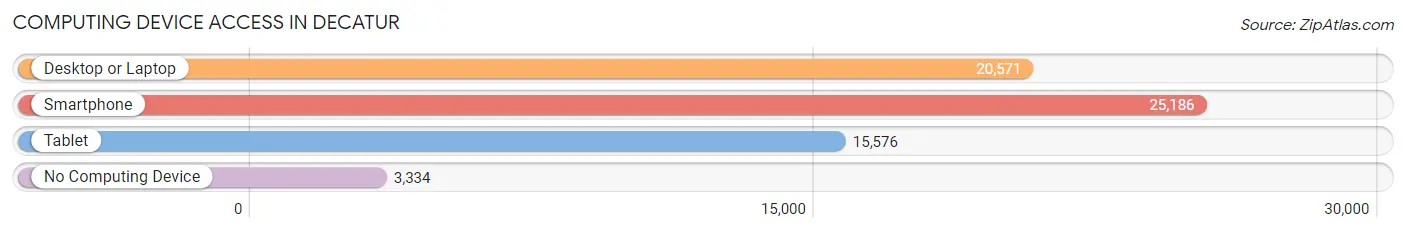
| Device Type | # Households | % Households |
| Desktop or Laptop | 20,571 | 66.9% |
| Smartphone | 25,186 | 82.0% |
| Tablet | 15,576 | 50.7% |
| No Computing Device | 3,334 | 10.8% |
| Total | 30,727 | 100.0% |
Internet Access in Decatur
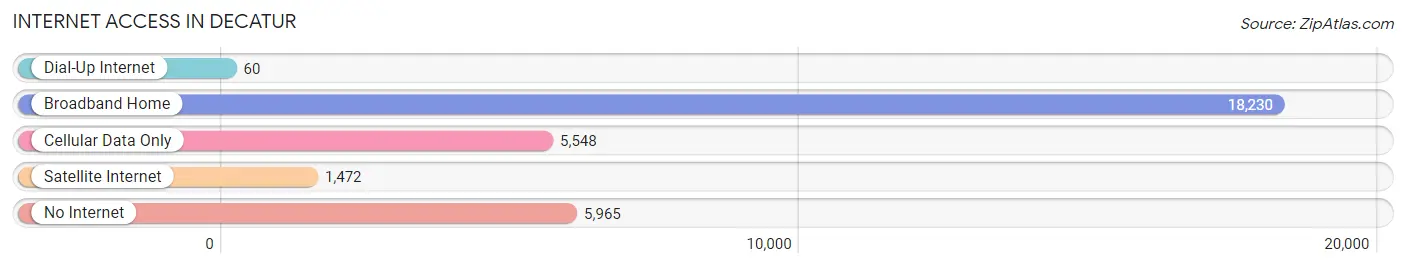
| Internet Type | # Households | % Households |
| Dial-Up Internet | 60 | 0.2% |
| Broadband Home | 18,230 | 59.3% |
| Cellular Data Only | 5,548 | 18.1% |
| Satellite Internet | 1,472 | 4.8% |
| No Internet | 5,965 | 19.4% |
| Total | 30,727 | 100.0% |
Decatur Summary
Decatur, Illinois is a city located in Macon County, Illinois, United States. It is the county seat of Macon County and is located along the Sangamon River. The city is located in Central Illinois and is part of the Decatur Metropolitan Statistical Area. As of the 2010 census, the city had a population of 76,122, making it the largest city in Macon County.
History
Decatur was founded in 1829 and was named after Stephen Decatur, Jr., a naval hero of the War of 1812. The city was incorporated in 1836 and was the first city in Macon County. Decatur was an important stop on the Underground Railroad and was a major center for the abolitionist movement. The city was also a major center for the Union Army during the Civil War.
Geography
Decatur is located at 39°51'N 88°56'W (39.8500, -88.9333). It is situated along the Sangamon River in Central Illinois. The city has a total area of 24.2 square miles, of which 24.1 square miles is land and 0.1 square miles is water.
Climate
Decatur has a humid continental climate, with hot, humid summers and cold, dry winters. The average annual temperature is 54°F, with an average high of 77°F in July and an average low of 31°F in January. The average annual precipitation is 40.2 inches.
Economy
Decatur is a major industrial center in Central Illinois. The city is home to several large companies, including Archer Daniels Midland, Tate & Lyle, and Caterpillar Inc. The city is also home to several smaller businesses, including manufacturing, retail, and service industries.
Demographics
As of the 2010 census, there were 76,122 people, 28,945 households, and 18,845 families residing in the city. The population density was 3,164.2 people per square mile. The racial makeup of the city was 79.2% White, 15.3% African American, 0.4% Native American, 1.2% Asian, 0.1% Pacific Islander, 1.7% from other races, and 2.1% from two or more races. Hispanic or Latino of any race were 4.2% of the population.
The median income for a household in the city was $37,945, and the median income for a family was $48,945. The per capita income for the city was $20,945. About 16.2% of families and 19.3% of the population were below the poverty line, including 28.2% of those under age 18 and 8.7% of those age 65 or over.
Decatur is a diverse city with a variety of cultures and backgrounds. The city is home to a large African American population, as well as a growing Hispanic population. The city also has a large number of immigrants from various countries, including India, China, and Mexico.
Common Questions
What is Per Capita Income in Decatur?
Per Capita income in Decatur is $31,233.
What is the Median Family Income in Decatur?
Median Family Income in Decatur is $70,663.
What is the Median Household income in Decatur?
Median Household Income in Decatur is $49,039.
What is Income or Wage Gap in Decatur?
Income or Wage Gap in Decatur is 28.6%.
Women in Decatur earn 71.4 cents for every dollar earned by a man.
What is Family Income Deficit in Decatur?
Family Income Deficit in Decatur is $12,323.
Families that are below poverty line in Decatur earn $12,323 less on average than the poverty threshold level.
What is Inequality or Gini Index in Decatur?
Inequality or Gini Index in Decatur is 0.48.
What is the Total Population of Decatur?
Total Population of Decatur is 70,975.
What is the Total Male Population of Decatur?
Total Male Population of Decatur is 33,662.
What is the Total Female Population of Decatur?
Total Female Population of Decatur is 37,313.
What is the Ratio of Males per 100 Females in Decatur?
There are 90.22 Males per 100 Females in Decatur.
What is the Ratio of Females per 100 Males in Decatur?
There are 110.85 Females per 100 Males in Decatur.
What is the Median Population Age in Decatur?
Median Population Age in Decatur is 39.7 Years.
What is the Average Family Size in Decatur
Average Family Size in Decatur is 3.0 People.
What is the Average Household Size in Decatur
Average Household Size in Decatur is 2.2 People.
How Large is the Labor Force in Decatur?
There are 32,713 People in the Labor Forcein in Decatur.
What is the Percentage of People in the Labor Force in Decatur?
56.7% of People are in the Labor Force in Decatur.
What is the Unemployment Rate in Decatur?
Unemployment Rate in Decatur is 8.9%.