Tuckahoe, NY Map & Demographics
Tuckahoe Map
Tuckahoe Overview
$75,120
PER CAPITA INCOME
$160,618
AVG FAMILY INCOME
$108,683
AVG HOUSEHOLD INCOME
28.6%
WAGE / INCOME GAP [ % ]
71.4¢/ $1
WAGE / INCOME GAP [ $ ]
0.54
INEQUALITY / GINI INDEX
6,995
TOTAL POPULATION
3,161
MALE POPULATION
3,834
FEMALE POPULATION
82.45
MALES / 100 FEMALES
121.29
FEMALES / 100 MALES
45.7
MEDIAN AGE
3.1
AVG FAMILY SIZE
2.2
AVG HOUSEHOLD SIZE
3,919
LABOR FORCE [ PEOPLE ]
65.7%
PERCENT IN LABOR FORCE
2.2%
UNEMPLOYMENT RATE
Tuckahoe Zip Codes
Tuckahoe Area Codes
Income in Tuckahoe
Income Overview in Tuckahoe
Per Capita Income in Tuckahoe is $75,120, while median incomes of families and households are $160,618 and $108,683 respectively.
| Characteristic | Number | Measure |
| Per Capita Income | 6,995 | $75,120 |
| Median Family Income | 1,653 | $160,618 |
| Mean Family Income | 1,653 | $227,896 |
| Median Household Income | 3,173 | $108,683 |
| Mean Household Income | 3,173 | $162,897 |
| Income Deficit | 1,653 | $0 |
| Wage / Income Gap (%) | 6,995 | 28.64% |
| Wage / Income Gap ($) | 6,995 | 71.36¢ per $1 |
| Gini / Inequality Index | 6,995 | 0.54 |
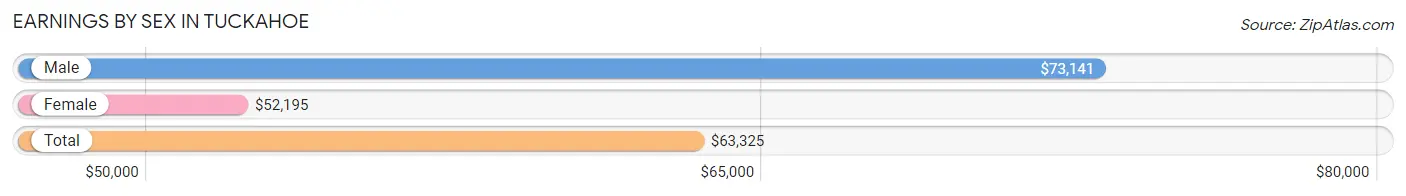
Earnings by Sex in Tuckahoe
Average Earnings in Tuckahoe are $63,325, $73,141 for men and $52,195 for women, a difference of 28.6%.
| Sex | Number | Average Earnings |
| Male | 2,197 (54.4%) | $73,141 |
| Female | 1,842 (45.6%) | $52,195 |
| Total | 4,039 (100.0%) | $63,325 |
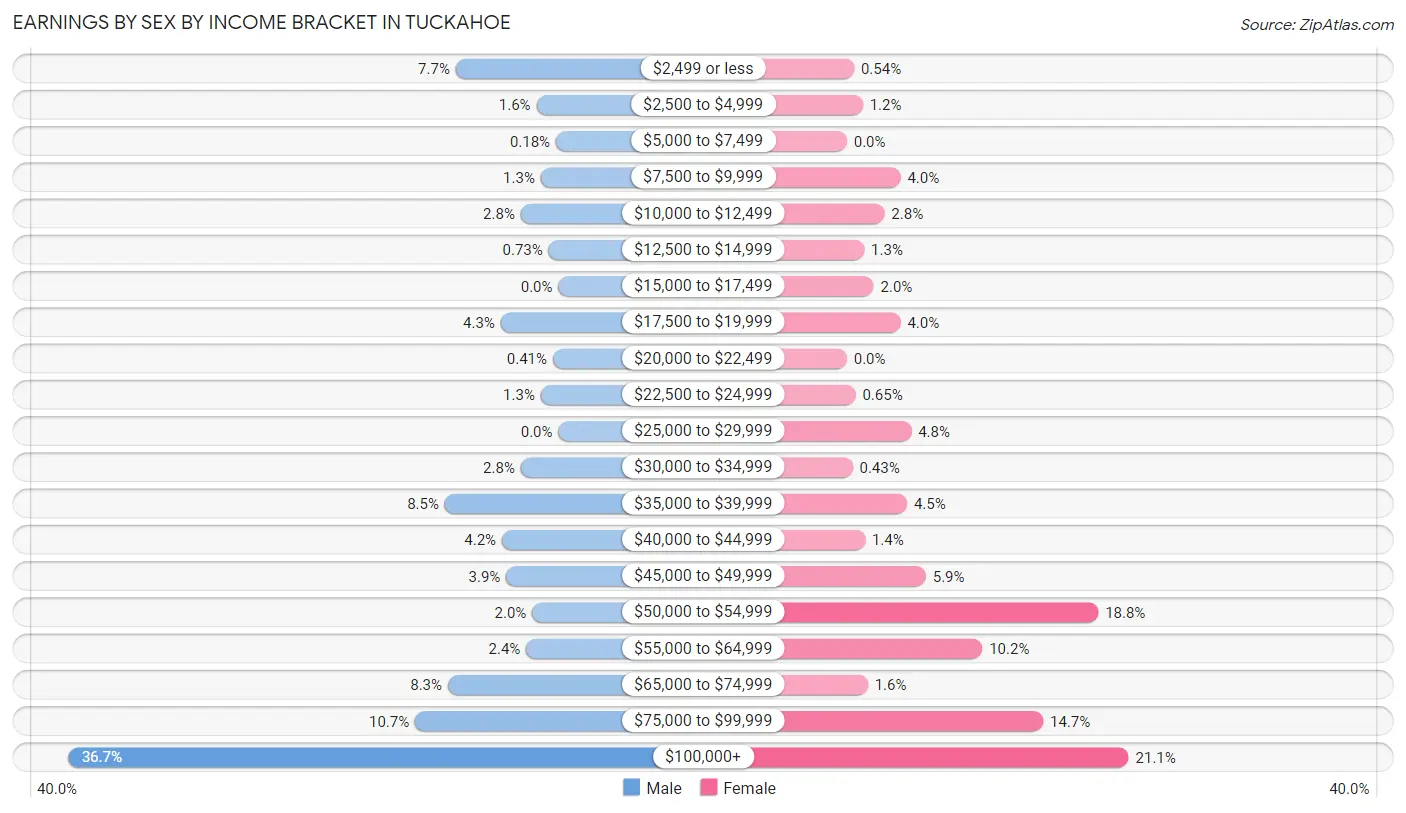
Earnings by Sex by Income Bracket in Tuckahoe
The most common earnings brackets in Tuckahoe are $100,000+ for men (806 | 36.7%) and $100,000+ for women (389 | 21.1%).
| Income | Male | Female |
| $2,499 or less | 169 (7.7%) | 10 (0.5%) |
| $2,500 to $4,999 | 36 (1.6%) | 22 (1.2%) |
| $5,000 to $7,499 | 4 (0.2%) | 0 (0.0%) |
| $7,500 to $9,999 | 29 (1.3%) | 74 (4.0%) |
| $10,000 to $12,499 | 62 (2.8%) | 52 (2.8%) |
| $12,500 to $14,999 | 16 (0.7%) | 24 (1.3%) |
| $15,000 to $17,499 | 0 (0.0%) | 37 (2.0%) |
| $17,500 to $19,999 | 95 (4.3%) | 74 (4.0%) |
| $20,000 to $22,499 | 9 (0.4%) | 0 (0.0%) |
| $22,500 to $24,999 | 29 (1.3%) | 12 (0.6%) |
| $25,000 to $29,999 | 0 (0.0%) | 89 (4.8%) |
| $30,000 to $34,999 | 62 (2.8%) | 8 (0.4%) |
| $35,000 to $39,999 | 187 (8.5%) | 83 (4.5%) |
| $40,000 to $44,999 | 93 (4.2%) | 25 (1.4%) |
| $45,000 to $49,999 | 86 (3.9%) | 109 (5.9%) |
| $50,000 to $54,999 | 43 (2.0%) | 347 (18.8%) |
| $55,000 to $64,999 | 53 (2.4%) | 187 (10.2%) |
| $65,000 to $74,999 | 182 (8.3%) | 29 (1.6%) |
| $75,000 to $99,999 | 236 (10.7%) | 271 (14.7%) |
| $100,000+ | 806 (36.7%) | 389 (21.1%) |
| Total | 2,197 (100.0%) | 1,842 (100.0%) |
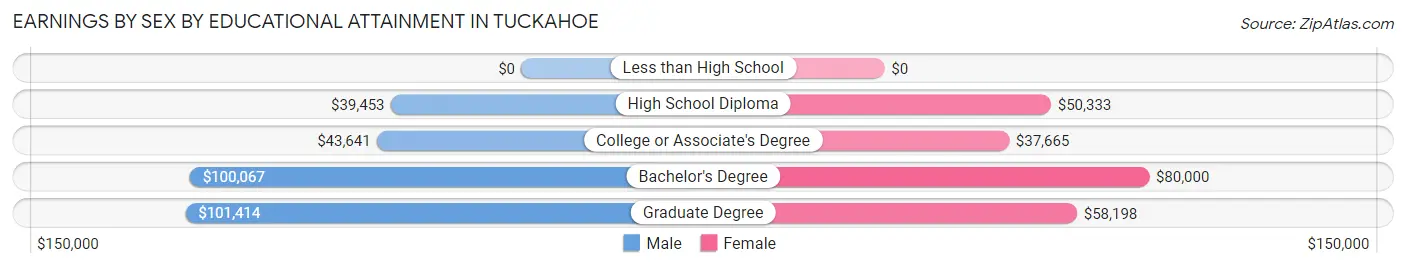
Earnings by Sex by Educational Attainment in Tuckahoe
Average earnings in Tuckahoe are $80,921 for men and $52,093 for women, a difference of 35.6%. Men with an educational attainment of graduate degree enjoy the highest average annual earnings of $101,414, while those with high school diploma education earn the least with $39,453. Women with an educational attainment of bachelor's degree earn the most with the average annual earnings of $80,000, while those with college or associate's degree education have the smallest earnings of $37,665.
| Educational Attainment | Male Income | Female Income |
| Less than High School | - | - |
| High School Diploma | $39,453 | $50,333 |
| College or Associate's Degree | $43,641 | $37,665 |
| Bachelor's Degree | $100,067 | $80,000 |
| Graduate Degree | $101,414 | $58,198 |
| Total | $80,921 | $52,093 |
Family Income in Tuckahoe
Family Income Brackets in Tuckahoe
According to the Tuckahoe family income data, there are 474 families falling into the $100,000 to $149,999 income range, which is the most common income bracket and makes up 28.7% of all families.
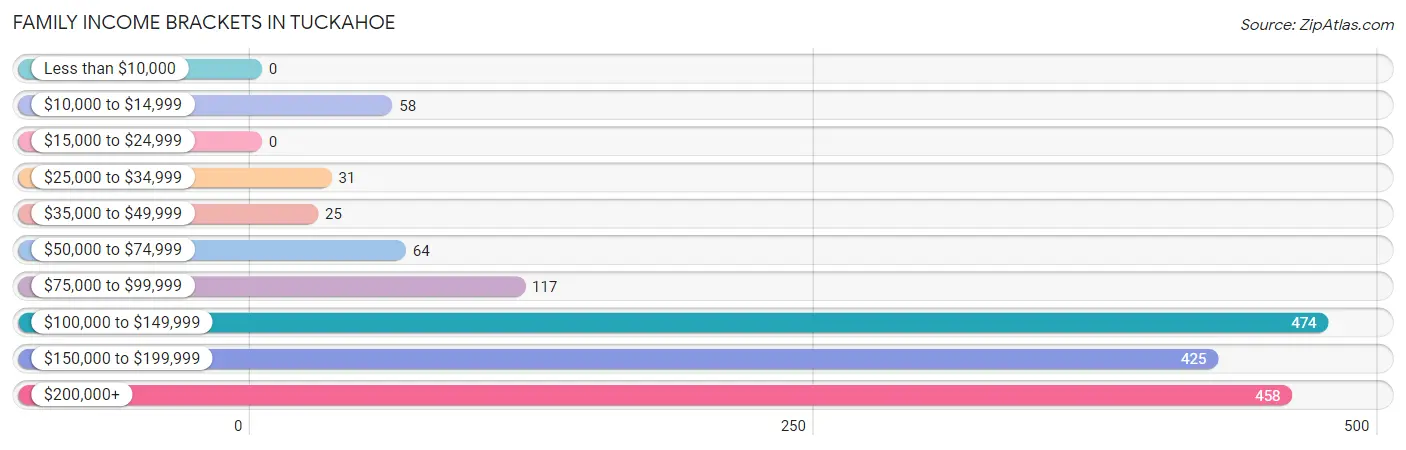
| Income Bracket | # Families | % Families |
| Less than $10,000 | 0 | 0.0% |
| $10,000 to $14,999 | 58 | 3.5% |
| $15,000 to $24,999 | 0 | 0.0% |
| $25,000 to $34,999 | 31 | 1.9% |
| $35,000 to $49,999 | 25 | 1.5% |
| $50,000 to $74,999 | 64 | 3.9% |
| $75,000 to $99,999 | 117 | 7.1% |
| $100,000 to $149,999 | 474 | 28.7% |
| $150,000 to $199,999 | 425 | 25.7% |
| $200,000+ | 458 | 27.7% |
Family Income by Famaliy Size in Tuckahoe
4-person families (441 | 26.7%) account for the highest median family income in Tuckahoe with $171,445 per family, while 2-person families (621 | 37.6%) have the highest median income of $80,764 per family member.
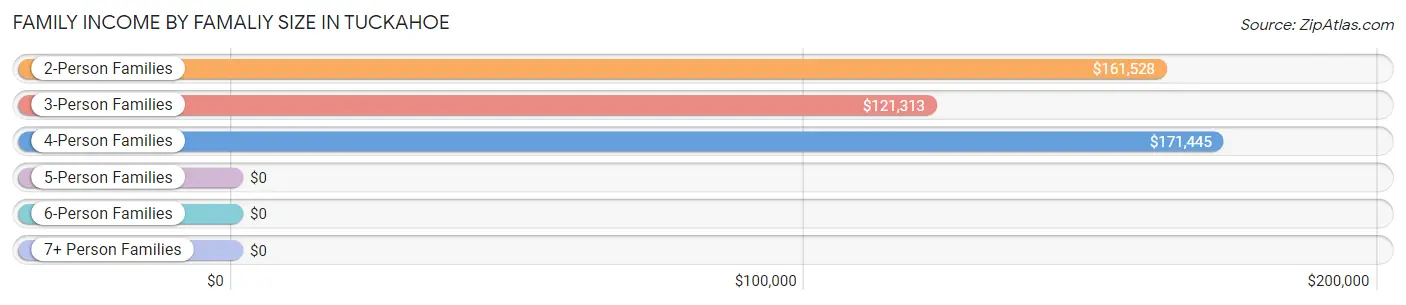
| Income Bracket | # Families | Median Income |
| 2-Person Families | 621 (37.6%) | $161,528 |
| 3-Person Families | 511 (30.9%) | $121,313 |
| 4-Person Families | 441 (26.7%) | $171,445 |
| 5-Person Families | 14 (0.9%) | $0 |
| 6-Person Families | 66 (4.0%) | $0 |
| 7+ Person Families | 0 (0.0%) | $0 |
| Total | 1,653 (100.0%) | $160,618 |
Family Income by Number of Earners in Tuckahoe
The median family income in Tuckahoe is $160,618, with families comprising 2 earners (874) having the highest median family income of $163,533, while families with 1 earner (473) have the lowest median family income of $119,803, accounting for 52.9% and 28.6% of families, respectively.
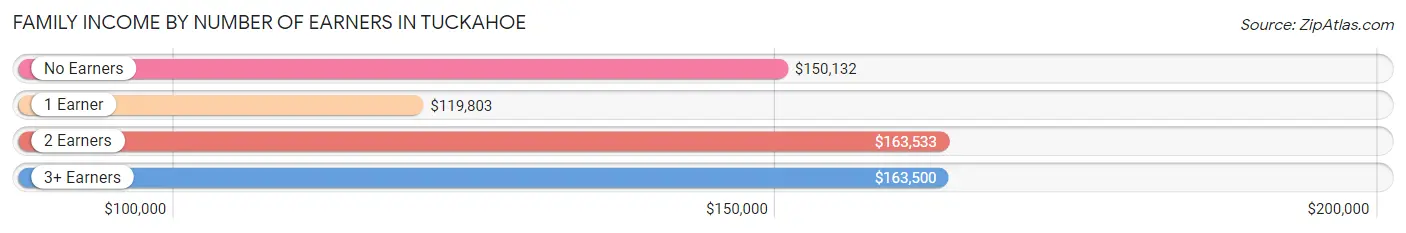
| Number of Earners | # Families | Median Income |
| No Earners | 122 (7.4%) | $150,132 |
| 1 Earner | 473 (28.6%) | $119,803 |
| 2 Earners | 874 (52.9%) | $163,533 |
| 3+ Earners | 184 (11.1%) | $163,500 |
| Total | 1,653 (100.0%) | $160,618 |
Household Income in Tuckahoe
Household Income Brackets in Tuckahoe
With 708 households falling in the category, the $100,000 to $149,999 income range is the most frequent in Tuckahoe, accounting for 22.3% of all households. In contrast, only 60 households (1.9%) fall into the $15,000 to $24,999 income bracket, making it the least populous group.
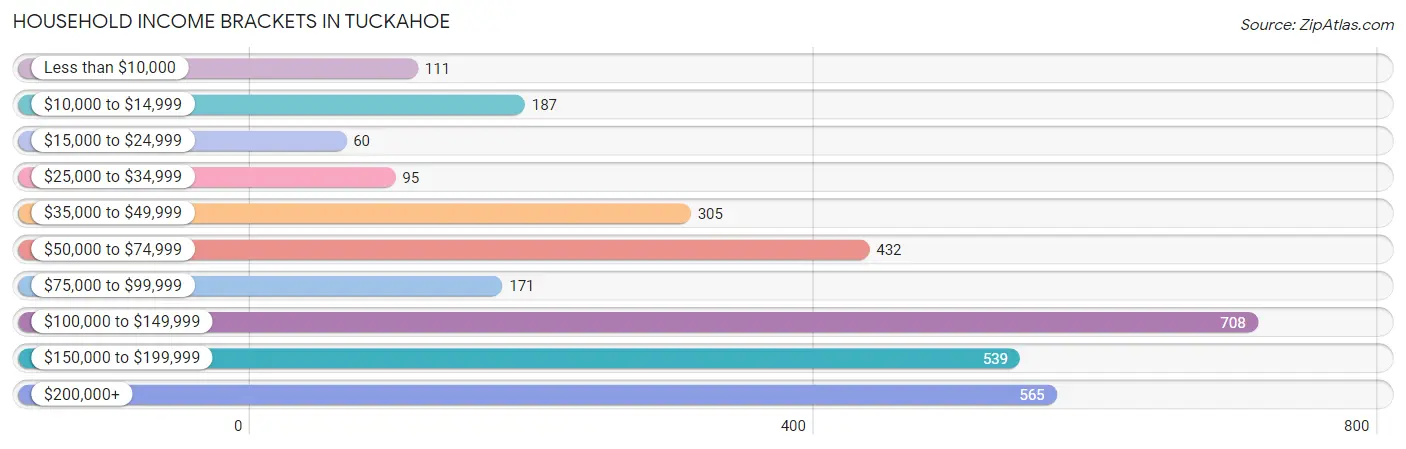
| Income Bracket | # Households | % Households |
| Less than $10,000 | 111 | 3.5% |
| $10,000 to $14,999 | 187 | 5.9% |
| $15,000 to $24,999 | 60 | 1.9% |
| $25,000 to $34,999 | 95 | 3.0% |
| $35,000 to $49,999 | 305 | 9.6% |
| $50,000 to $74,999 | 432 | 13.6% |
| $75,000 to $99,999 | 171 | 5.4% |
| $100,000 to $149,999 | 708 | 22.3% |
| $150,000 to $199,999 | 539 | 17.0% |
| $200,000+ | 565 | 17.8% |
Household Income by Householder Age in Tuckahoe
The median household income in Tuckahoe is $108,683, with the highest median household income of $120,170 found in the 25 to 44 years age bracket for the primary householder. A total of 911 households (28.7%) fall into this category.
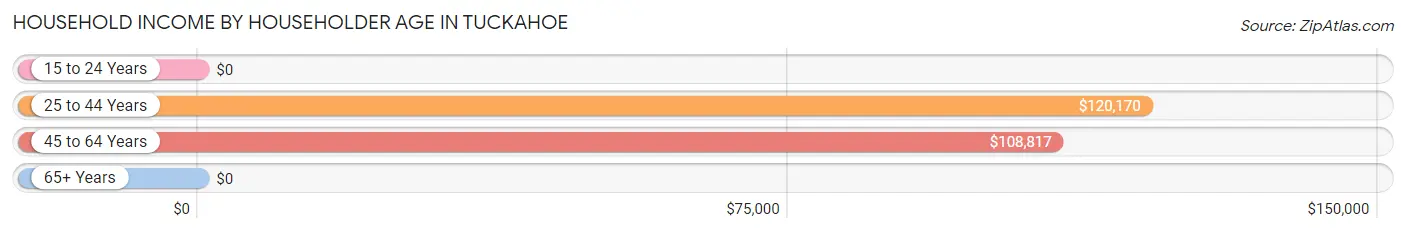
| Income Bracket | # Households | Median Income |
| 15 to 24 Years | 0 (0.0%) | $0 |
| 25 to 44 Years | 911 (28.7%) | $120,170 |
| 45 to 64 Years | 1,271 (40.1%) | $108,817 |
| 65+ Years | 991 (31.2%) | $0 |
| Total | 3,173 (100.0%) | $108,683 |
Poverty in Tuckahoe
Income Below Poverty by Sex and Age in Tuckahoe
With 4.4% poverty level for males and 10.7% for females among the residents of Tuckahoe, 75 year old and over males and 5 year old females are the most vulnerable to poverty, with 31 males (17.5%) and 31 females (67.4%) in their respective age groups living below the poverty level.
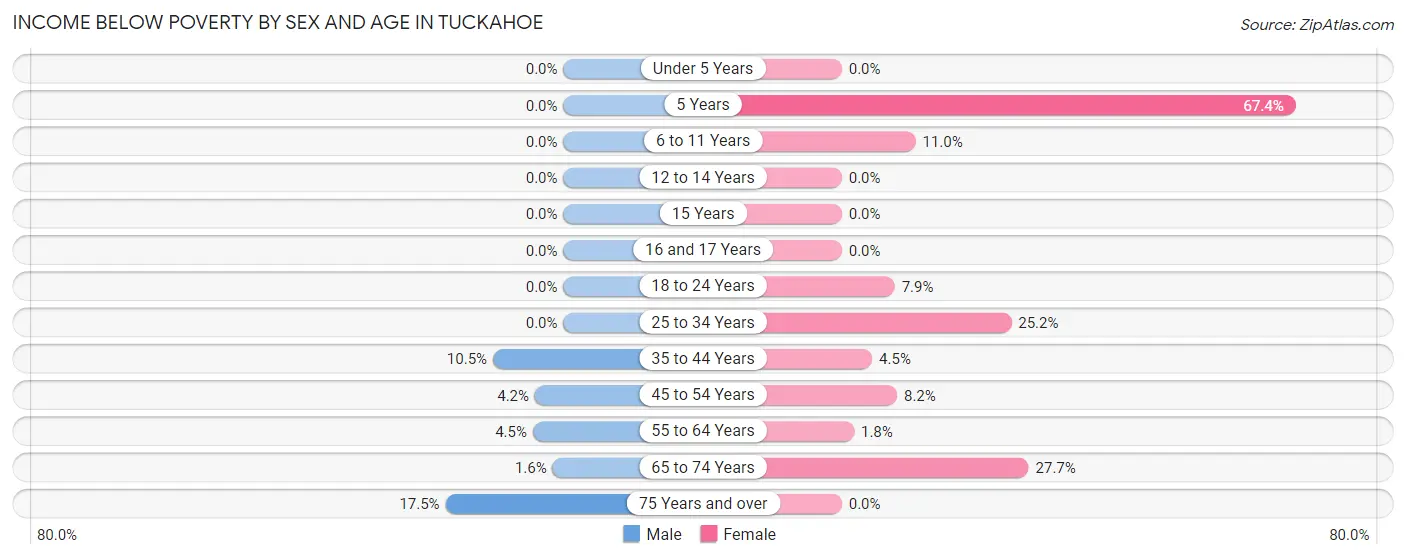
| Age Bracket | Male | Female |
| Under 5 Years | 0 (0.0%) | 0 (0.0%) |
| 5 Years | 0 (0.0%) | 31 (67.4%) |
| 6 to 11 Years | 0 (0.0%) | 31 (11.0%) |
| 12 to 14 Years | 0 (0.0%) | 0 (0.0%) |
| 15 Years | 0 (0.0%) | 0 (0.0%) |
| 16 and 17 Years | 0 (0.0%) | 0 (0.0%) |
| 18 to 24 Years | 0 (0.0%) | 11 (7.9%) |
| 25 to 34 Years | 0 (0.0%) | 113 (25.2%) |
| 35 to 44 Years | 62 (10.5%) | 22 (4.5%) |
| 45 to 54 Years | 13 (4.2%) | 52 (8.2%) |
| 55 to 64 Years | 25 (4.5%) | 10 (1.8%) |
| 65 to 74 Years | 6 (1.6%) | 139 (27.7%) |
| 75 Years and over | 31 (17.5%) | 0 (0.0%) |
| Total | 137 (4.4%) | 409 (10.7%) |
Income Above Poverty by Sex and Age in Tuckahoe
According to the poverty statistics in Tuckahoe, males aged under 5 years and females aged under 5 years are the age groups that are most secure financially, with 100.0% of males and 100.0% of females in these age groups living above the poverty line.
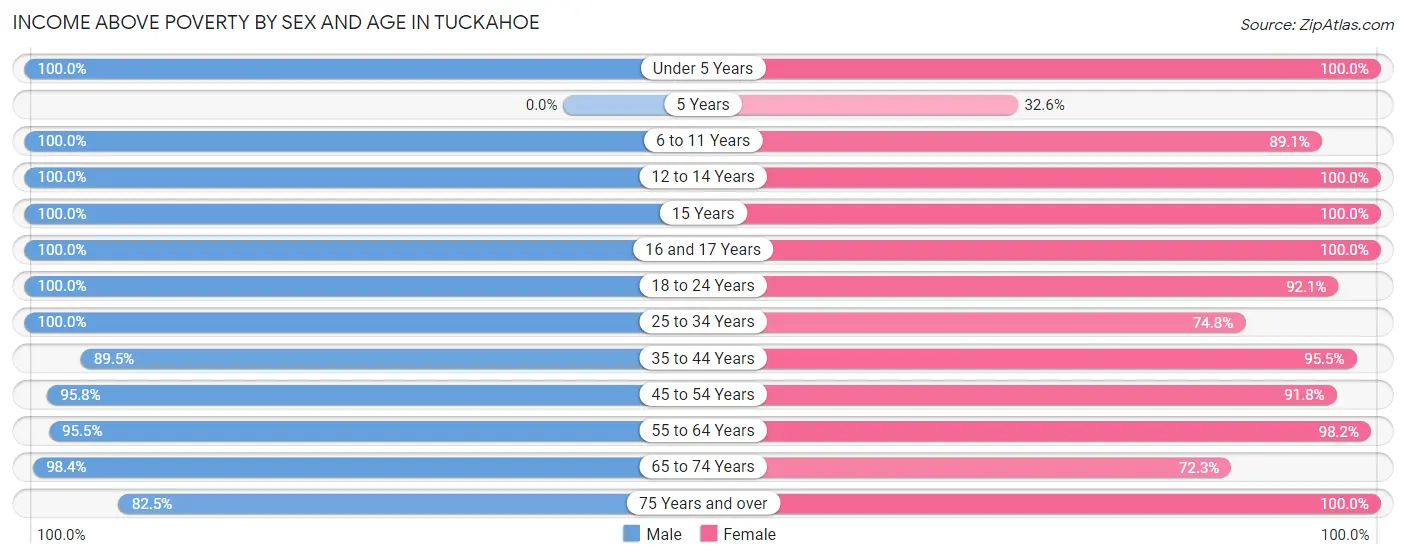
| Age Bracket | Male | Female |
| Under 5 Years | 204 (100.0%) | 208 (100.0%) |
| 5 Years | 0 (0.0%) | 15 (32.6%) |
| 6 to 11 Years | 166 (100.0%) | 252 (89.0%) |
| 12 to 14 Years | 58 (100.0%) | 5 (100.0%) |
| 15 Years | 52 (100.0%) | 8 (100.0%) |
| 16 and 17 Years | 173 (100.0%) | 63 (100.0%) |
| 18 to 24 Years | 95 (100.0%) | 129 (92.1%) |
| 25 to 34 Years | 371 (100.0%) | 336 (74.8%) |
| 35 to 44 Years | 531 (89.5%) | 466 (95.5%) |
| 45 to 54 Years | 294 (95.8%) | 582 (91.8%) |
| 55 to 64 Years | 526 (95.5%) | 538 (98.2%) |
| 65 to 74 Years | 369 (98.4%) | 362 (72.3%) |
| 75 Years and over | 146 (82.5%) | 455 (100.0%) |
| Total | 2,985 (95.6%) | 3,419 (89.3%) |
Income Below Poverty Among Married-Couple Families in Tuckahoe
The poverty statistics for married-couple families in Tuckahoe show that 3.5% or 45 of the total 1,266 families live below the poverty line. Families with 1 or 2 children have the highest poverty rate of 5.9%, comprising of 39 families. On the other hand, families with 3 or 4 children have the lowest poverty rate of 0.0%, which includes 0 families.
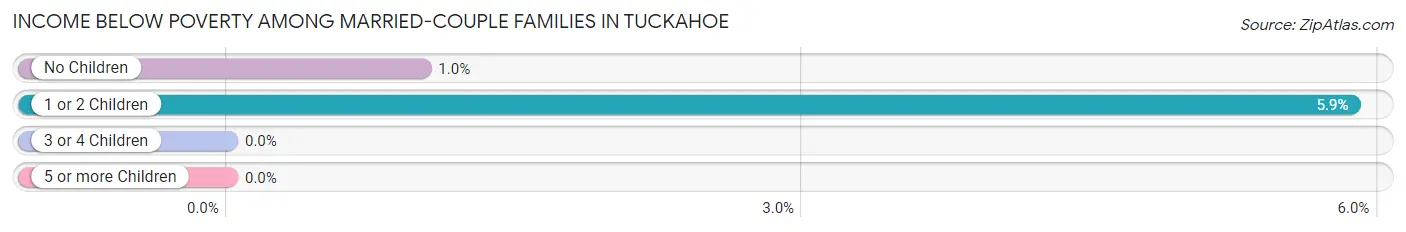
| Children | Above Poverty | Below Poverty |
| No Children | 587 (99.0%) | 6 (1.0%) |
| 1 or 2 Children | 627 (94.1%) | 39 (5.9%) |
| 3 or 4 Children | 7 (100.0%) | 0 (0.0%) |
| 5 or more Children | 0 (0.0%) | 0 (0.0%) |
| Total | 1,221 (96.5%) | 45 (3.5%) |
Income Below Poverty Among Single-Parent Households in Tuckahoe
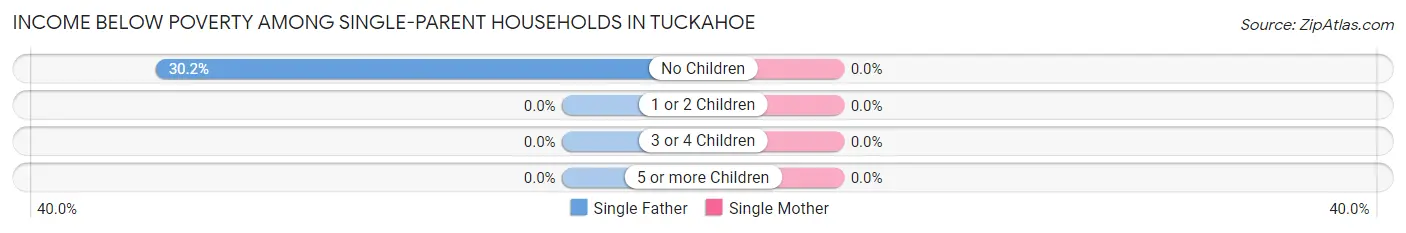
| Children | Single Father | Single Mother |
| No Children | 13 (30.2%) | 0 (0.0%) |
| 1 or 2 Children | 0 (0.0%) | 0 (0.0%) |
| 3 or 4 Children | 0 (0.0%) | 0 (0.0%) |
| 5 or more Children | 0 (0.0%) | 0 (0.0%) |
| Total | 13 (20.0%) | 0 (0.0%) |
Income Below Poverty Among Married-Couple vs Single-Parent Households in Tuckahoe
The poverty data for Tuckahoe shows that 45 of the married-couple family households (3.5%) and 13 of the single-parent households (3.4%) are living below the poverty level. Within the married-couple family households, those with 1 or 2 children have the highest poverty rate, with 39 households (5.9%) falling below the poverty line. Among the single-parent households, those with no children have the highest poverty rate, with 13 household (5.5%) living below poverty.
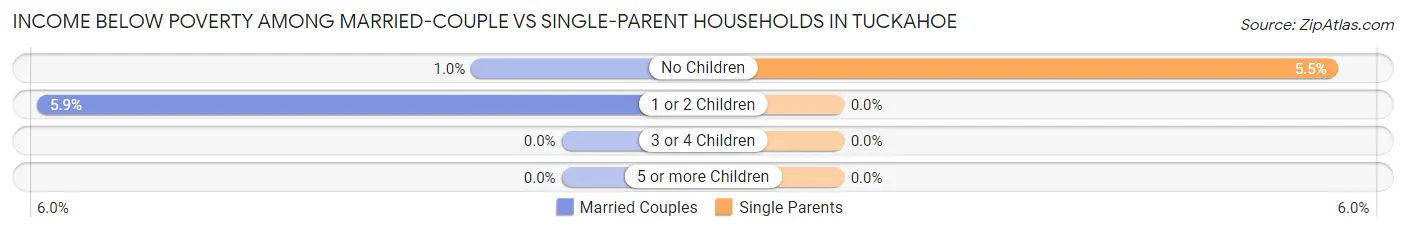
| Children | Married-Couple Families | Single-Parent Households |
| No Children | 6 (1.0%) | 13 (5.5%) |
| 1 or 2 Children | 39 (5.9%) | 0 (0.0%) |
| 3 or 4 Children | 0 (0.0%) | 0 (0.0%) |
| 5 or more Children | 0 (0.0%) | 0 (0.0%) |
| Total | 45 (3.5%) | 13 (3.4%) |
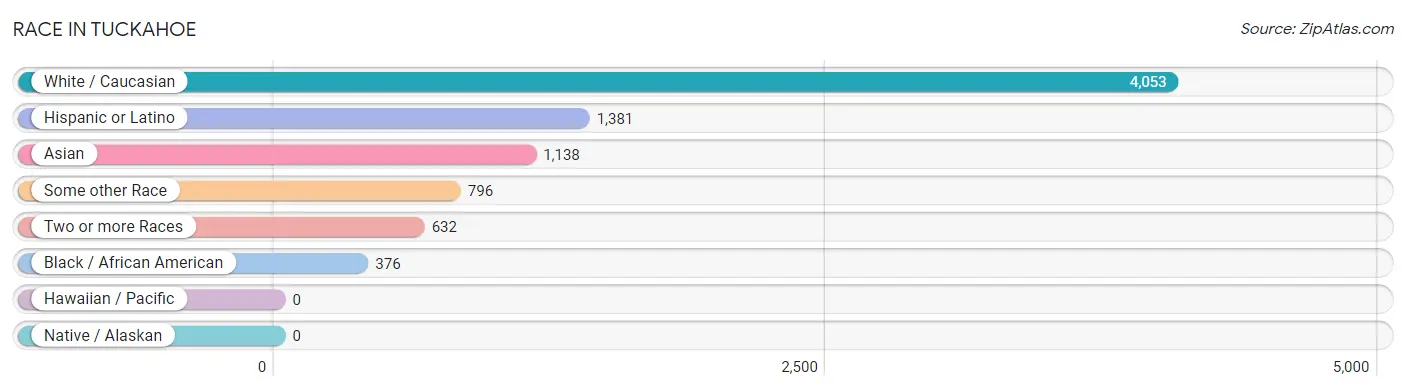
Race in Tuckahoe
The most populous races in Tuckahoe are White / Caucasian (4,053 | 57.9%), Hispanic or Latino (1,381 | 19.7%), and Asian (1,138 | 16.3%).
| Race | # Population | % Population |
| Asian | 1,138 | 16.3% |
| Black / African American | 376 | 5.4% |
| Hawaiian / Pacific | 0 | 0.0% |
| Hispanic or Latino | 1,381 | 19.7% |
| Native / Alaskan | 0 | 0.0% |
| White / Caucasian | 4,053 | 57.9% |
| Two or more Races | 632 | 9.0% |
| Some other Race | 796 | 11.4% |
| Total | 6,995 | 100.0% |
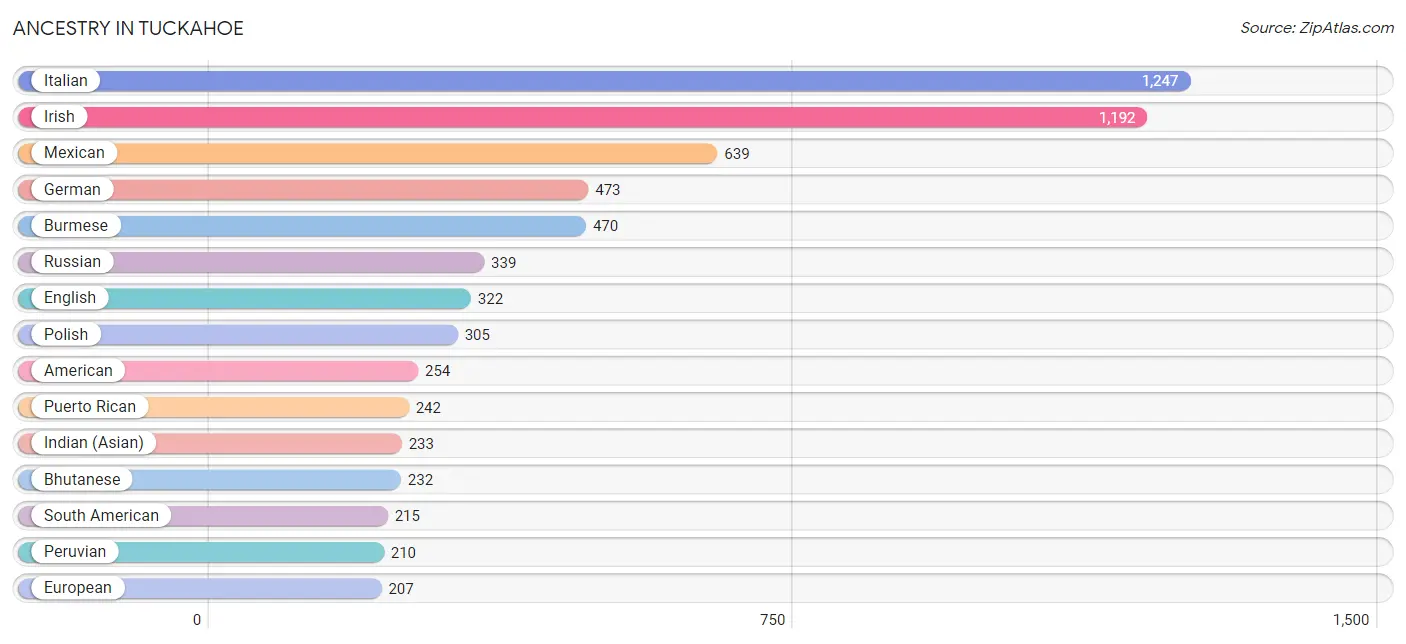
Ancestry in Tuckahoe
The most populous ancestries reported in Tuckahoe are Italian (1,247 | 17.8%), Irish (1,192 | 17.0%), Mexican (639 | 9.1%), German (473 | 6.8%), and Burmese (470 | 6.7%), together accounting for 57.5% of all Tuckahoe residents.
| Ancestry | # Population | % Population |
| American | 254 | 3.6% |
| Arab | 48 | 0.7% |
| Bhutanese | 232 | 3.3% |
| Brazilian | 11 | 0.2% |
| British | 34 | 0.5% |
| British West Indian | 8 | 0.1% |
| Burmese | 470 | 6.7% |
| Central American | 78 | 1.1% |
| Central American Indian | 31 | 0.4% |
| Cherokee | 6 | 0.1% |
| Colombian | 5 | 0.1% |
| Costa Rican | 36 | 0.5% |
| Croatian | 19 | 0.3% |
| Czech | 109 | 1.6% |
| Dominican | 121 | 1.7% |
| Egyptian | 30 | 0.4% |
| English | 322 | 4.6% |
| Ethiopian | 21 | 0.3% |
| European | 207 | 3.0% |
| Filipino | 19 | 0.3% |
| French | 11 | 0.2% |
| French Canadian | 19 | 0.3% |
| German | 473 | 6.8% |
| Greek | 55 | 0.8% |
| Hungarian | 81 | 1.2% |
| Indian (Asian) | 233 | 3.3% |
| Iranian | 49 | 0.7% |
| Irish | 1,192 | 17.0% |
| Italian | 1,247 | 17.8% |
| Kenyan | 21 | 0.3% |
| Korean | 207 | 3.0% |
| Lithuanian | 21 | 0.3% |
| Mexican | 639 | 9.1% |
| Mongolian | 16 | 0.2% |
| Norwegian | 15 | 0.2% |
| Pakistani | 1 | 0.0% |
| Peruvian | 210 | 3.0% |
| Polish | 305 | 4.4% |
| Portuguese | 16 | 0.2% |
| Puerto Rican | 242 | 3.5% |
| Romanian | 139 | 2.0% |
| Russian | 339 | 4.9% |
| Salvadoran | 42 | 0.6% |
| Slovak | 165 | 2.4% |
| South American | 215 | 3.1% |
| Spanish | 86 | 1.2% |
| Subsaharan African | 115 | 1.6% |
| Swedish | 17 | 0.2% |
| Thai | 56 | 0.8% |
| Trinidadian and Tobagonian | 39 | 0.6% |
| Welsh | 29 | 0.4% |
| Zimbabwean | 73 | 1.0% | View All 52 Rows |
Immigrants in Tuckahoe
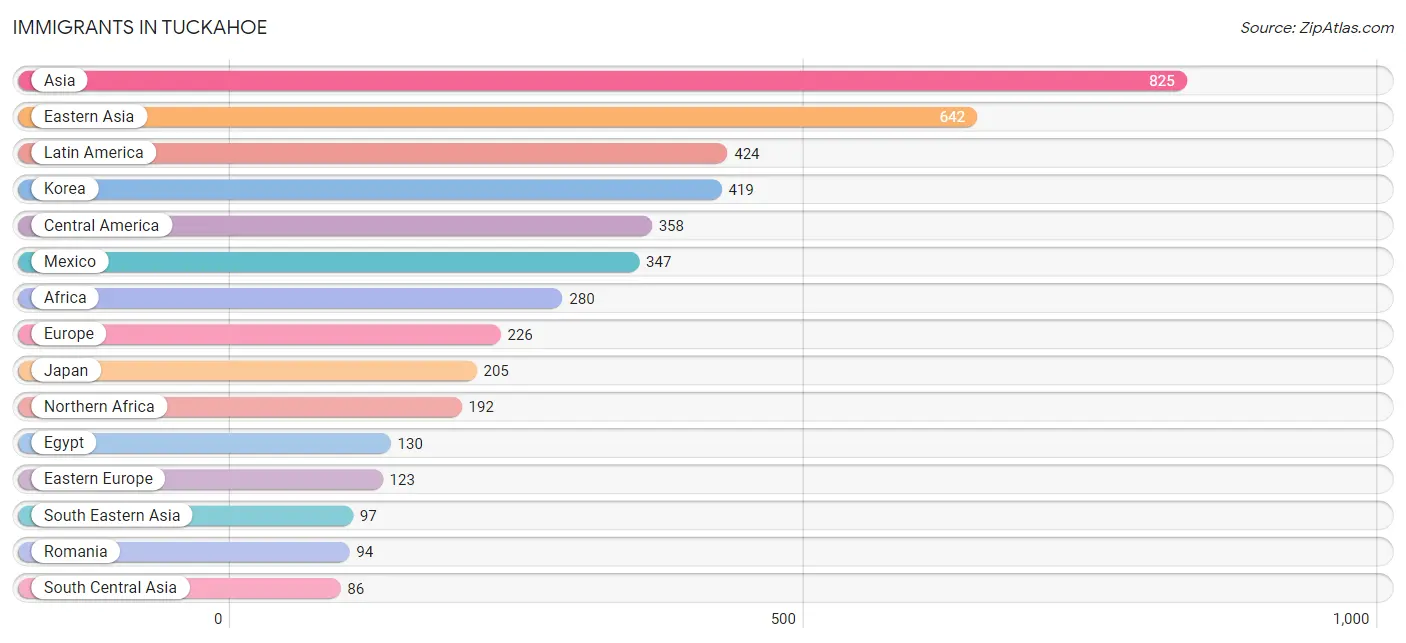
The most numerous immigrant groups reported in Tuckahoe came from Asia (825 | 11.8%), Eastern Asia (642 | 9.2%), Latin America (424 | 6.1%), Korea (419 | 6.0%), and Central America (358 | 5.1%), together accounting for 38.1% of all Tuckahoe residents.
| Immigration Origin | # Population | % Population |
| Afghanistan | 17 | 0.2% |
| Africa | 280 | 4.0% |
| Asia | 825 | 11.8% |
| Caribbean | 60 | 0.9% |
| Central America | 358 | 5.1% |
| China | 18 | 0.3% |
| Croatia | 19 | 0.3% |
| Dominican Republic | 21 | 0.3% |
| Eastern Africa | 46 | 0.7% |
| Eastern Asia | 642 | 9.2% |
| Eastern Europe | 123 | 1.8% |
| Egypt | 130 | 1.9% |
| El Salvador | 11 | 0.2% |
| England | 18 | 0.3% |
| Europe | 226 | 3.2% |
| France | 15 | 0.2% |
| Germany | 6 | 0.1% |
| Ghana | 42 | 0.6% |
| Hungary | 10 | 0.1% |
| India | 31 | 0.4% |
| Iran | 14 | 0.2% |
| Italy | 36 | 0.5% |
| Japan | 205 | 2.9% |
| Kenya | 21 | 0.3% |
| Korea | 419 | 6.0% |
| Latin America | 424 | 6.1% |
| Malaysia | 16 | 0.2% |
| Mexico | 347 | 5.0% |
| Northern Africa | 192 | 2.7% |
| Northern Europe | 18 | 0.3% |
| Pakistan | 24 | 0.3% |
| Philippines | 80 | 1.1% |
| Romania | 94 | 1.3% |
| South America | 6 | 0.1% |
| South Central Asia | 86 | 1.2% |
| South Eastern Asia | 97 | 1.4% |
| Southern Europe | 48 | 0.7% |
| Switzerland | 16 | 0.2% |
| Taiwan | 2 | 0.0% |
| Thailand | 1 | 0.0% |
| Trinidad and Tobago | 39 | 0.6% |
| Venezuela | 6 | 0.1% |
| Western Africa | 42 | 0.6% |
| Western Europe | 37 | 0.5% |
| Zimbabwe | 25 | 0.4% | View All 45 Rows |
Sex and Age in Tuckahoe
Sex and Age in Tuckahoe
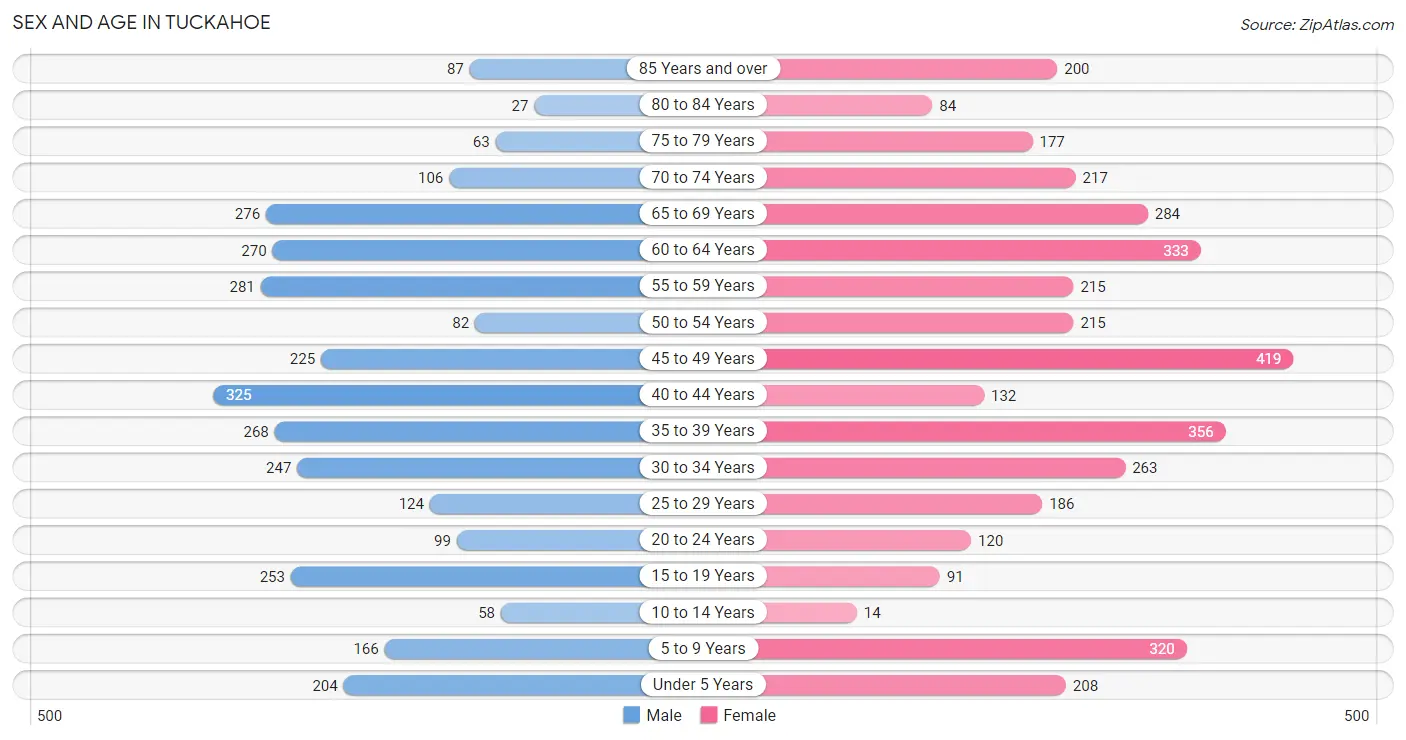
The most populous age groups in Tuckahoe are 40 to 44 Years (325 | 10.3%) for men and 45 to 49 Years (419 | 10.9%) for women.
| Age Bracket | Male | Female |
| Under 5 Years | 204 (6.5%) | 208 (5.4%) |
| 5 to 9 Years | 166 (5.2%) | 320 (8.4%) |
| 10 to 14 Years | 58 (1.8%) | 14 (0.4%) |
| 15 to 19 Years | 253 (8.0%) | 91 (2.4%) |
| 20 to 24 Years | 99 (3.1%) | 120 (3.1%) |
| 25 to 29 Years | 124 (3.9%) | 186 (4.9%) |
| 30 to 34 Years | 247 (7.8%) | 263 (6.9%) |
| 35 to 39 Years | 268 (8.5%) | 356 (9.3%) |
| 40 to 44 Years | 325 (10.3%) | 132 (3.4%) |
| 45 to 49 Years | 225 (7.1%) | 419 (10.9%) |
| 50 to 54 Years | 82 (2.6%) | 215 (5.6%) |
| 55 to 59 Years | 281 (8.9%) | 215 (5.6%) |
| 60 to 64 Years | 270 (8.5%) | 333 (8.7%) |
| 65 to 69 Years | 276 (8.7%) | 284 (7.4%) |
| 70 to 74 Years | 106 (3.4%) | 217 (5.7%) |
| 75 to 79 Years | 63 (2.0%) | 177 (4.6%) |
| 80 to 84 Years | 27 (0.9%) | 84 (2.2%) |
| 85 Years and over | 87 (2.8%) | 200 (5.2%) |
| Total | 3,161 (100.0%) | 3,834 (100.0%) |
Families and Households in Tuckahoe
Median Family Size in Tuckahoe
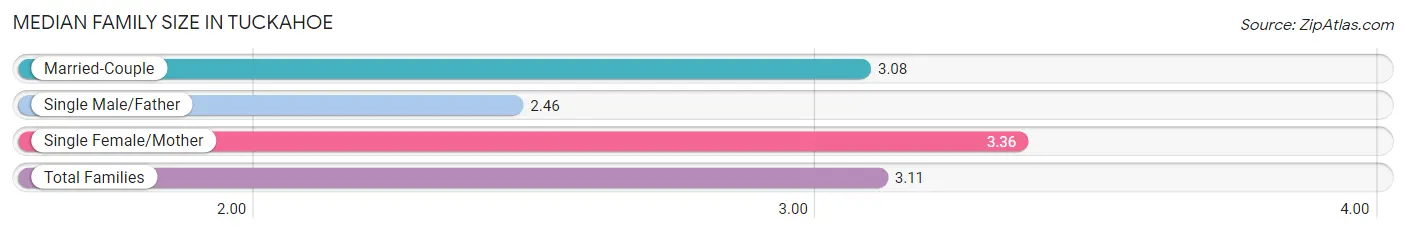
The median family size in Tuckahoe is 3.11 persons per family, with single female/mother families (322 | 19.5%) accounting for the largest median family size of 3.36 persons per family. On the other hand, single male/father families (65 | 3.9%) represent the smallest median family size with 2.46 persons per family.
| Family Type | # Families | Family Size |
| Married-Couple | 1,266 (76.6%) | 3.08 |
| Single Male/Father | 65 (3.9%) | 2.46 |
| Single Female/Mother | 322 (19.5%) | 3.36 |
| Total Families | 1,653 (100.0%) | 3.11 |
Median Household Size in Tuckahoe
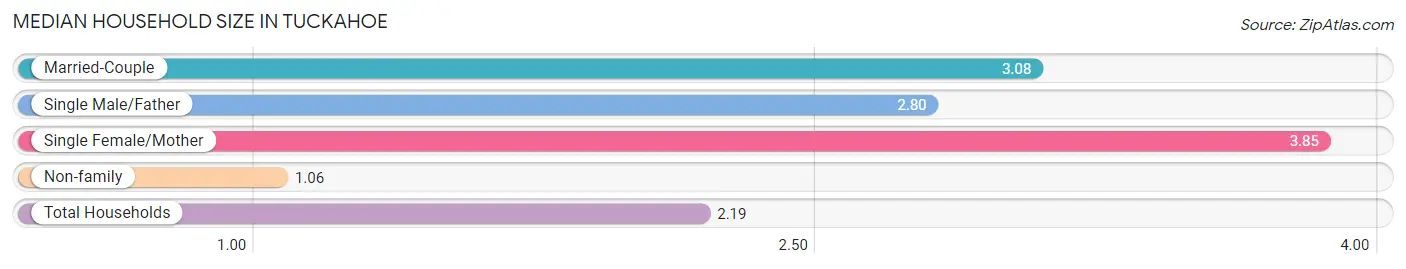
The median household size in Tuckahoe is 2.19 persons per household, with single female/mother households (322 | 10.2%) accounting for the largest median household size of 3.85 persons per household. non-family households (1,520 | 47.9%) represent the smallest median household size with 1.06 persons per household.
| Household Type | # Households | Household Size |
| Married-Couple | 1,266 (39.9%) | 3.08 |
| Single Male/Father | 65 (2.1%) | 2.80 |
| Single Female/Mother | 322 (10.2%) | 3.85 |
| Non-family | 1,520 (47.9%) | 1.06 |
| Total Households | 3,173 (100.0%) | 2.19 |
Household Size by Marriage Status in Tuckahoe
Out of a total of 3,173 households in Tuckahoe, 1,653 (52.1%) are family households, while 1,520 (47.9%) are nonfamily households. The most numerous type of family households are 2-person households, comprising 599, and the most common type of nonfamily households are 1-person households, comprising 1,437.
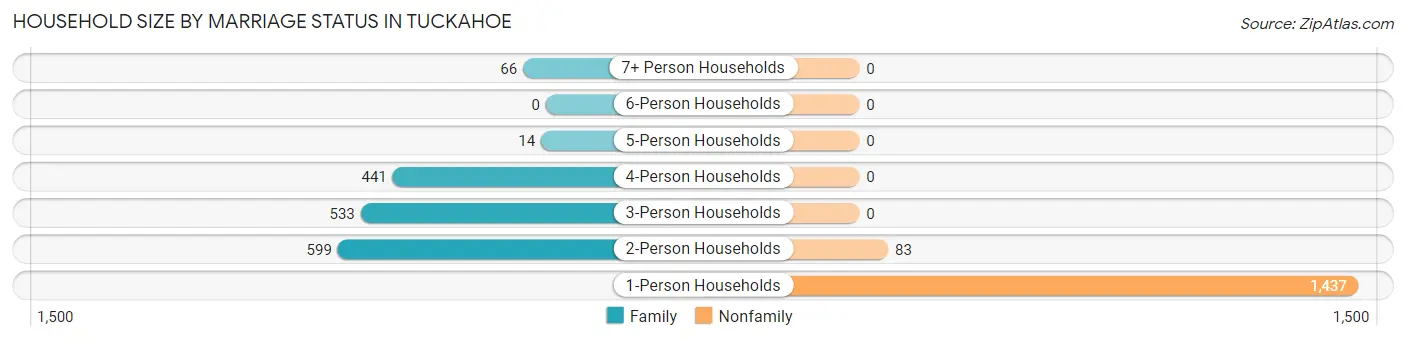
| Household Size | Family Households | Nonfamily Households |
| 1-Person Households | - | 1,437 (45.3%) |
| 2-Person Households | 599 (18.9%) | 83 (2.6%) |
| 3-Person Households | 533 (16.8%) | 0 (0.0%) |
| 4-Person Households | 441 (13.9%) | 0 (0.0%) |
| 5-Person Households | 14 (0.4%) | 0 (0.0%) |
| 6-Person Households | 0 (0.0%) | 0 (0.0%) |
| 7+ Person Households | 66 (2.1%) | 0 (0.0%) |
| Total | 1,653 (52.1%) | 1,520 (47.9%) |
Female Fertility in Tuckahoe
Fertility by Age in Tuckahoe
Average fertility rate in Tuckahoe is 31.0 births per 1,000 women. Women in the age bracket of 35 to 50 years have the highest fertility rate with 53.0 births per 1,000 women. Women in the age bracket of 35 to 50 years acount for 100.0% of all women with births.
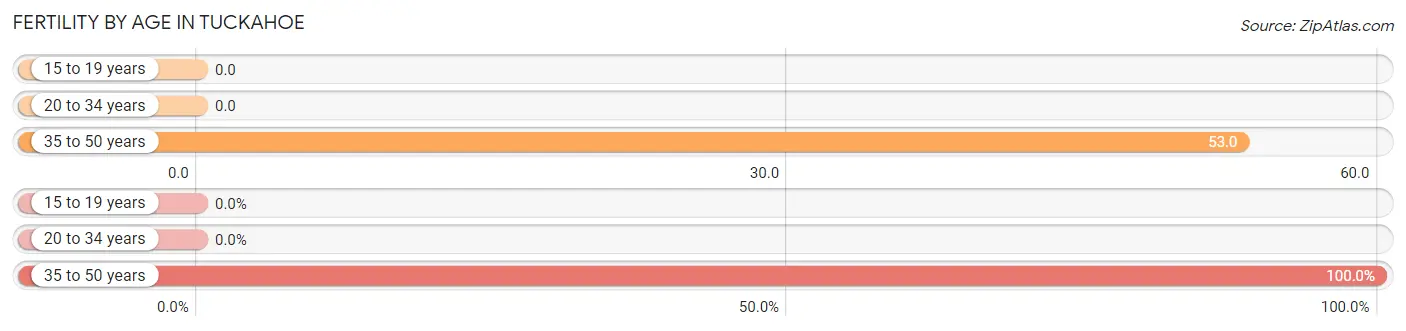
| Age Bracket | Women with Births | Births / 1,000 Women |
| 15 to 19 years | 0 (0.0%) | 0.0 |
| 20 to 34 years | 0 (0.0%) | 0.0 |
| 35 to 50 years | 49 (100.0%) | 53.0 |
| Total | 49 (100.0%) | 31.0 |
Fertility by Age by Marriage Status in Tuckahoe
55.1% of women with births (49) in Tuckahoe are married. The highest percentage of unmarried women with births falls into 35 to 50 years age bracket with 44.9% of them unmarried at the time of birth, while the lowest percentage of unmarried women with births belong to 35 to 50 years age bracket with 44.9% of them unmarried.
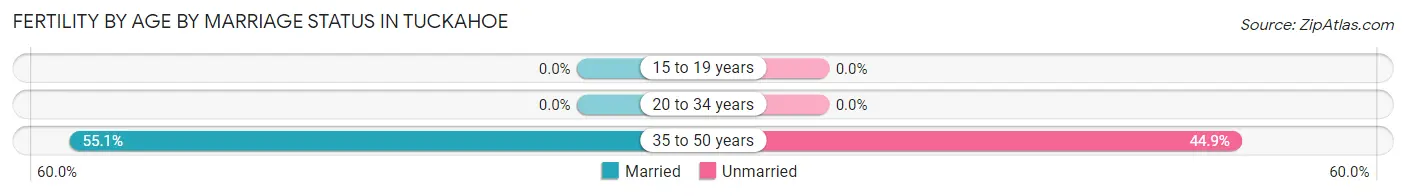
| Age Bracket | Married | Unmarried |
| 15 to 19 years | 0 (0.0%) | 0 (0.0%) |
| 20 to 34 years | 0 (0.0%) | 0 (0.0%) |
| 35 to 50 years | 27 (55.1%) | 22 (44.9%) |
| Total | 27 (55.1%) | 22 (44.9%) |
Fertility by Education in Tuckahoe
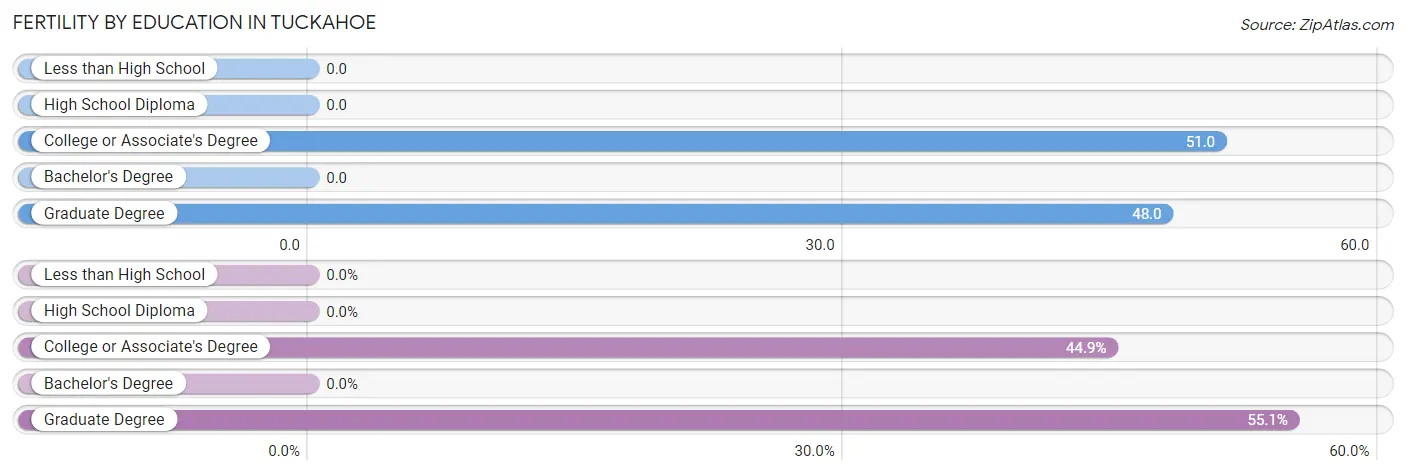
| Educational Attainment | Women with Births | Births / 1,000 Women |
| Less than High School | 0 (0.0%) | 0.0 |
| High School Diploma | 0 (0.0%) | 0.0 |
| College or Associate's Degree | 22 (44.9%) | 51.0 |
| Bachelor's Degree | 0 (0.0%) | 0.0 |
| Graduate Degree | 27 (55.1%) | 48.0 |
| Total | 49 (100.0%) | 31.0 |
Fertility by Education by Marriage Status in Tuckahoe
44.9% of women with births in Tuckahoe are unmarried. Women with the educational attainment of graduate degree are most likely to be married with 100.0% of them married at childbirth, while women with the educational attainment of college or associate's degree are least likely to be married with 100.0% of them unmarried at childbirth.
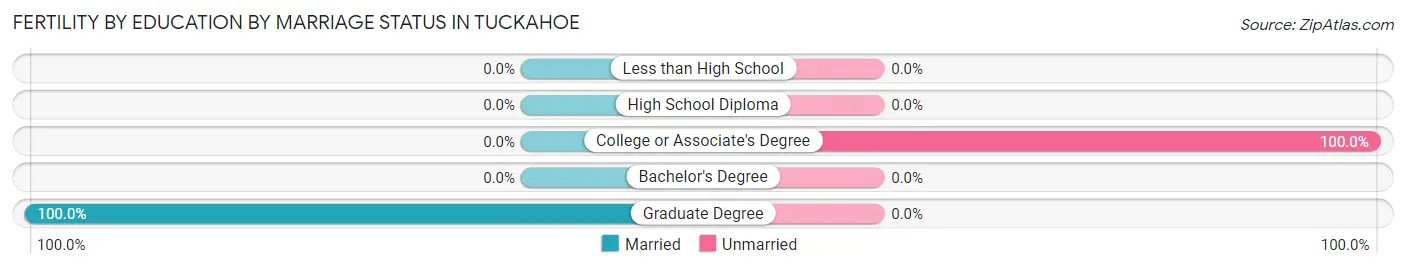
| Educational Attainment | Married | Unmarried |
| Less than High School | 0 (0.0%) | 0 (0.0%) |
| High School Diploma | 0 (0.0%) | 0 (0.0%) |
| College or Associate's Degree | 0 (0.0%) | 22 (100.0%) |
| Bachelor's Degree | 0 (0.0%) | 0 (0.0%) |
| Graduate Degree | 27 (100.0%) | 0 (0.0%) |
| Total | 27 (55.1%) | 22 (44.9%) |
Employment Characteristics in Tuckahoe
Employment by Class of Employer in Tuckahoe
Among the 3,797 employed individuals in Tuckahoe, private company employees (2,558 | 67.4%), local government employees (534 | 14.1%), and not-for-profit organizations (252 | 6.6%) make up the most common classes of employment.
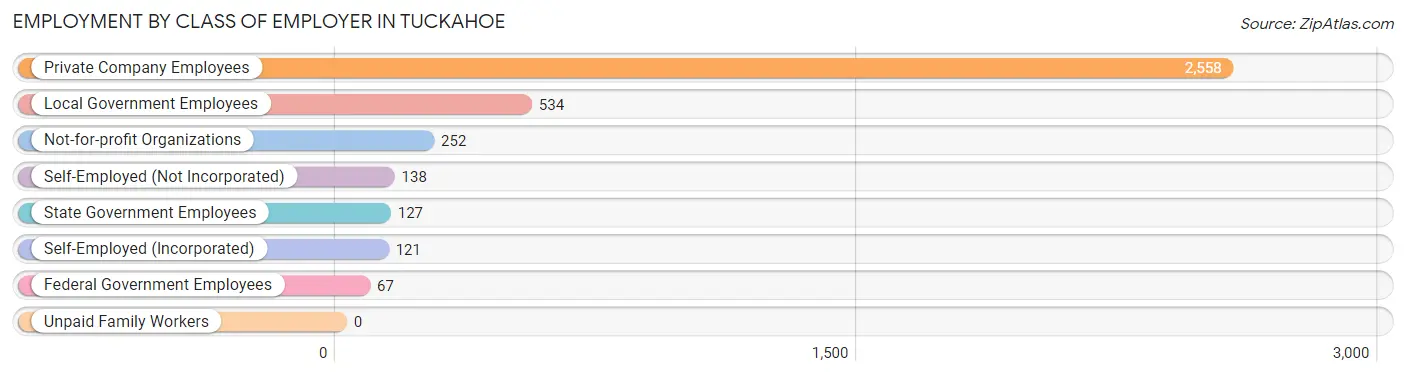
| Employer Class | # Employees | % Employees |
| Private Company Employees | 2,558 | 67.4% |
| Self-Employed (Incorporated) | 121 | 3.2% |
| Self-Employed (Not Incorporated) | 138 | 3.6% |
| Not-for-profit Organizations | 252 | 6.6% |
| Local Government Employees | 534 | 14.1% |
| State Government Employees | 127 | 3.3% |
| Federal Government Employees | 67 | 1.8% |
| Unpaid Family Workers | 0 | 0.0% |
| Total | 3,797 | 100.0% |
Employment Status by Age in Tuckahoe
According to the labor force statistics for Tuckahoe, out of the total population over 16 years of age (5,965), 65.7% or 3,919 individuals are in the labor force, with 2.2% or 86 of them unemployed. The age group with the highest labor force participation rate is 25 to 29 years, with 100.0% or 310 individuals in the labor force. Within the labor force, the 65 to 74 years age range has the highest percentage of unemployed individuals, with 5.1% or 17 of them being unemployed.
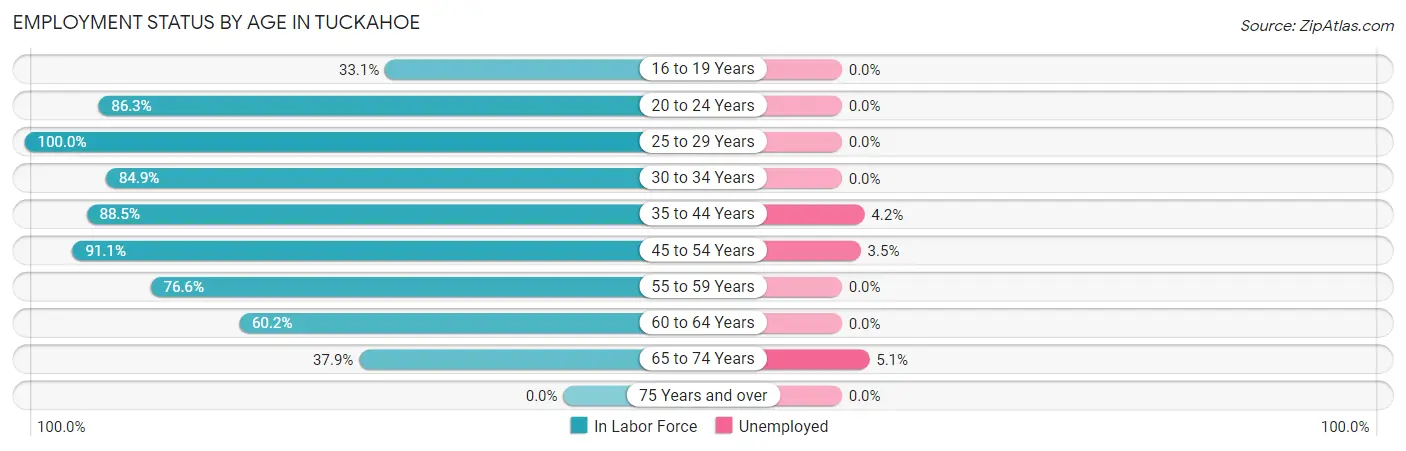
| Age Bracket | In Labor Force | Unemployed |
| 16 to 19 Years | 94 (33.1%) | 0 (0.0%) |
| 20 to 24 Years | 189 (86.3%) | 0 (0.0%) |
| 25 to 29 Years | 310 (100.0%) | 0 (0.0%) |
| 30 to 34 Years | 433 (84.9%) | 0 (0.0%) |
| 35 to 44 Years | 957 (88.5%) | 40 (4.2%) |
| 45 to 54 Years | 857 (91.1%) | 30 (3.5%) |
| 55 to 59 Years | 380 (76.6%) | 0 (0.0%) |
| 60 to 64 Years | 363 (60.2%) | 0 (0.0%) |
| 65 to 74 Years | 335 (37.9%) | 17 (5.1%) |
| 75 Years and over | 0 (0.0%) | 0 (0.0%) |
| Total | 3,919 (65.7%) | 86 (2.2%) |
Employment Status by Educational Attainment in Tuckahoe
According to labor force statistics for Tuckahoe, 83.7% of individuals (3,299) out of the total population between 25 and 64 years of age (3,941) are in the labor force, with 2.1% or 69 of them being unemployed. The group with the highest labor force participation rate are those with the educational attainment of college / associate degree, with 89.1% or 713 individuals in the labor force. Within the labor force, individuals with college / associate degree education have the highest percentage of unemployment, with 2.4% or 17 of them being unemployed.
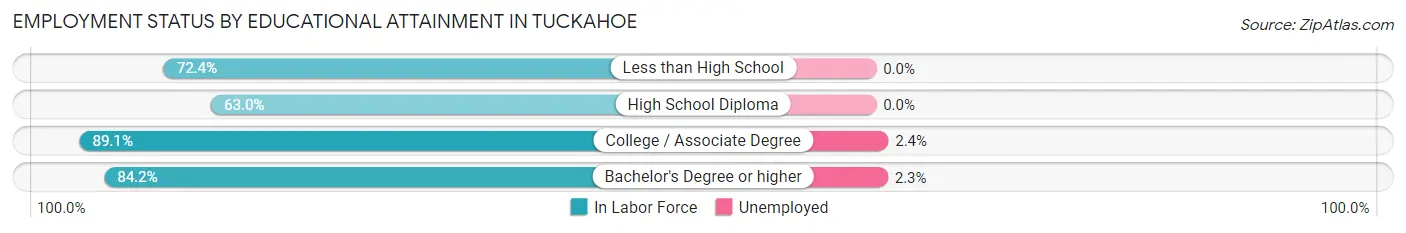
| Educational Attainment | In Labor Force | Unemployed |
| Less than High School | 118 (72.4%) | 0 (0.0%) |
| High School Diploma | 114 (63.0%) | 0 (0.0%) |
| College / Associate Degree | 713 (89.1%) | 19 (2.4%) |
| Bachelor's Degree or higher | 2,355 (84.2%) | 64 (2.3%) |
| Total | 3,299 (83.7%) | 83 (2.1%) |
Employment Occupations by Sex in Tuckahoe
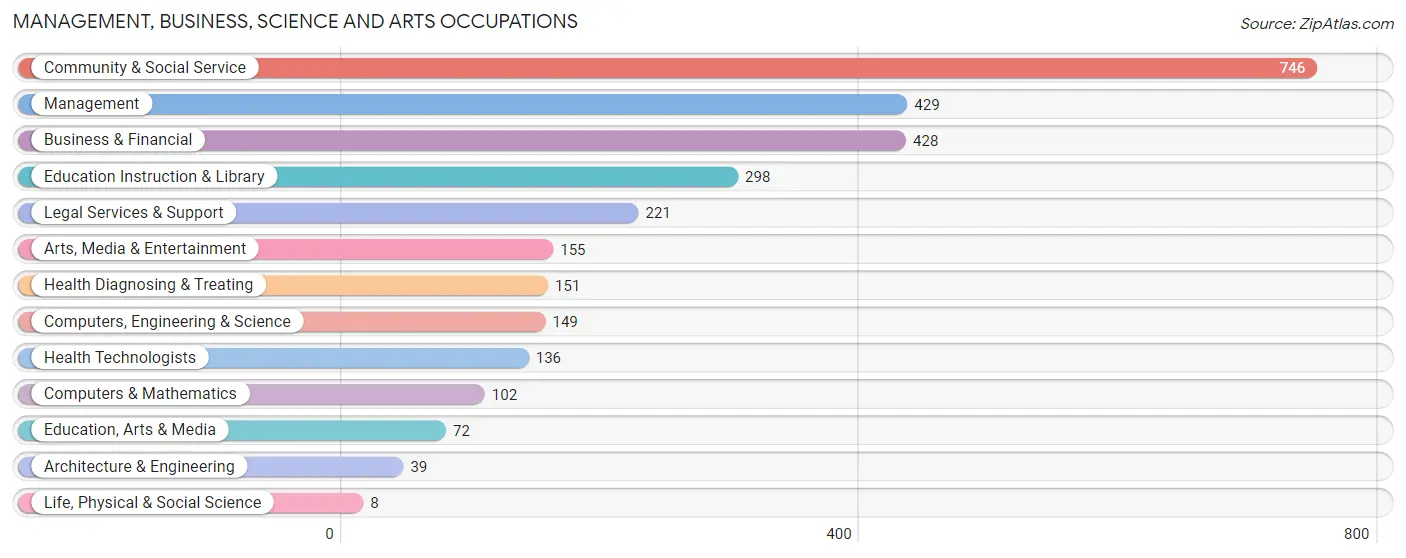
Management, Business, Science and Arts Occupations
The most common Management, Business, Science and Arts occupations in Tuckahoe are Community & Social Service (746 | 19.5%), Management (429 | 11.2%), Business & Financial (428 | 11.2%), Education Instruction & Library (298 | 7.8%), and Legal Services & Support (221 | 5.8%).
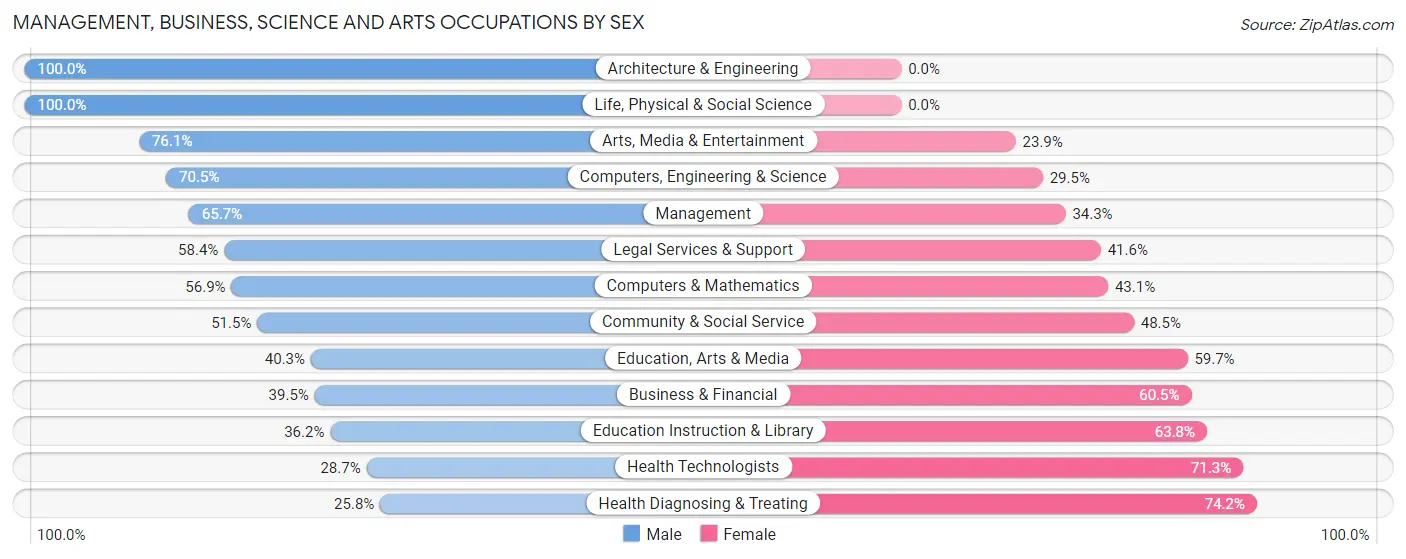
Management, Business, Science and Arts Occupations by Sex
Within the Management, Business, Science and Arts occupations in Tuckahoe, the most male-oriented occupations are Architecture & Engineering (100.0%), Life, Physical & Social Science (100.0%), and Arts, Media & Entertainment (76.1%), while the most female-oriented occupations are Health Diagnosing & Treating (74.2%), Health Technologists (71.3%), and Education Instruction & Library (63.8%).
| Occupation | Male | Female |
| Management | 282 (65.7%) | 147 (34.3%) |
| Business & Financial | 169 (39.5%) | 259 (60.5%) |
| Computers, Engineering & Science | 105 (70.5%) | 44 (29.5%) |
| Computers & Mathematics | 58 (56.9%) | 44 (43.1%) |
| Architecture & Engineering | 39 (100.0%) | 0 (0.0%) |
| Life, Physical & Social Science | 8 (100.0%) | 0 (0.0%) |
| Community & Social Service | 384 (51.5%) | 362 (48.5%) |
| Education, Arts & Media | 29 (40.3%) | 43 (59.7%) |
| Legal Services & Support | 129 (58.4%) | 92 (41.6%) |
| Education Instruction & Library | 108 (36.2%) | 190 (63.8%) |
| Arts, Media & Entertainment | 118 (76.1%) | 37 (23.9%) |
| Health Diagnosing & Treating | 39 (25.8%) | 112 (74.2%) |
| Health Technologists | 39 (28.7%) | 97 (71.3%) |
| Total (Category) | 979 (51.4%) | 924 (48.5%) |
| Total (Overall) | 2,004 (52.3%) | 1,827 (47.7%) |
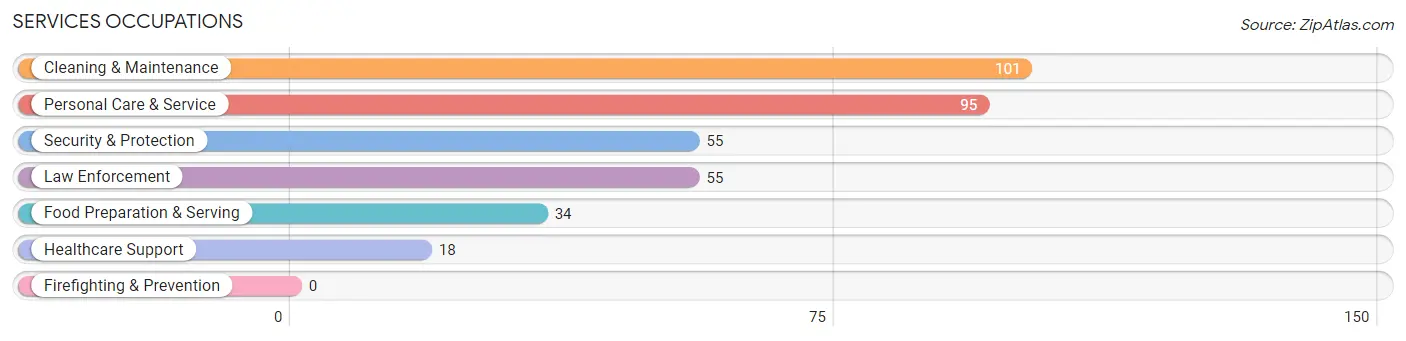
Services Occupations
The most common Services occupations in Tuckahoe are Cleaning & Maintenance (101 | 2.6%), Personal Care & Service (95 | 2.5%), Security & Protection (55 | 1.4%), Law Enforcement (55 | 1.4%), and Food Preparation & Serving (34 | 0.9%).
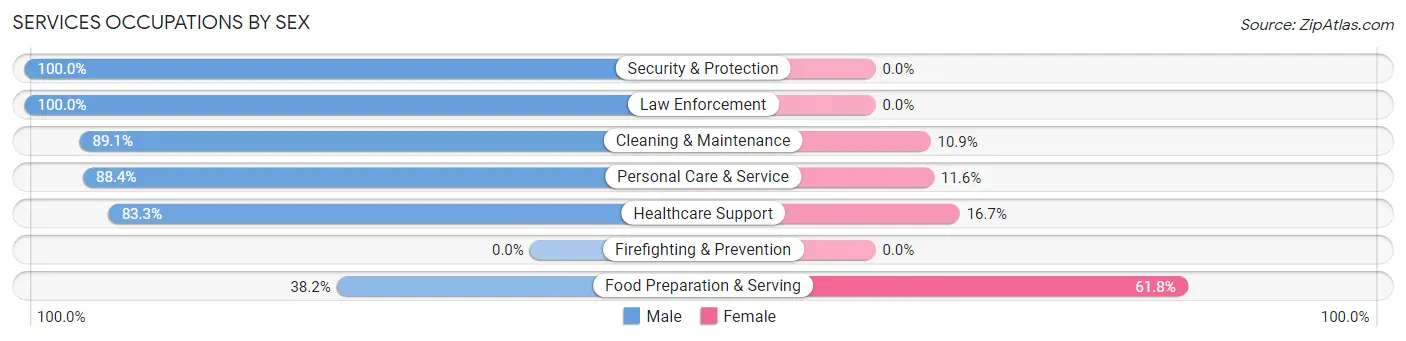
Services Occupations by Sex
Within the Services occupations in Tuckahoe, the most male-oriented occupations are Security & Protection (100.0%), Law Enforcement (100.0%), and Cleaning & Maintenance (89.1%), while the most female-oriented occupations are Food Preparation & Serving (61.8%), Healthcare Support (16.7%), and Personal Care & Service (11.6%).
| Occupation | Male | Female |
| Healthcare Support | 15 (83.3%) | 3 (16.7%) |
| Security & Protection | 55 (100.0%) | 0 (0.0%) |
| Firefighting & Prevention | 0 (0.0%) | 0 (0.0%) |
| Law Enforcement | 55 (100.0%) | 0 (0.0%) |
| Food Preparation & Serving | 13 (38.2%) | 21 (61.8%) |
| Cleaning & Maintenance | 90 (89.1%) | 11 (10.9%) |
| Personal Care & Service | 84 (88.4%) | 11 (11.6%) |
| Total (Category) | 257 (84.8%) | 46 (15.2%) |
| Total (Overall) | 2,004 (52.3%) | 1,827 (47.7%) |
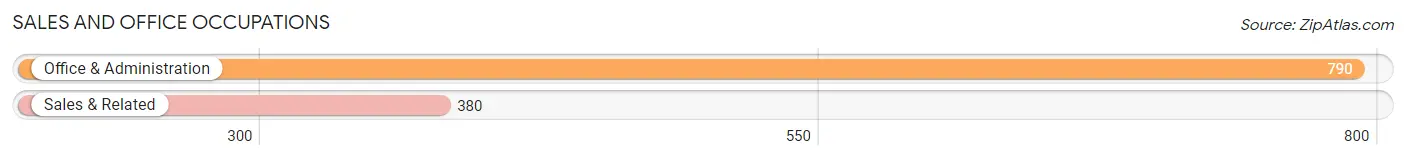
Sales and Office Occupations
The most common Sales and Office occupations in Tuckahoe are Office & Administration (790 | 20.6%), and Sales & Related (380 | 9.9%).
Sales and Office Occupations by Sex
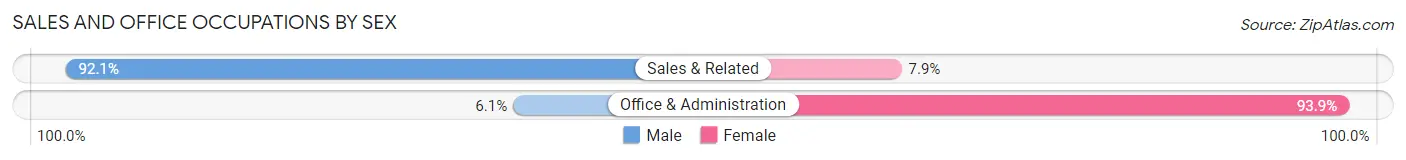
| Occupation | Male | Female |
| Sales & Related | 350 (92.1%) | 30 (7.9%) |
| Office & Administration | 48 (6.1%) | 742 (93.9%) |
| Total (Category) | 398 (34.0%) | 772 (66.0%) |
| Total (Overall) | 2,004 (52.3%) | 1,827 (47.7%) |
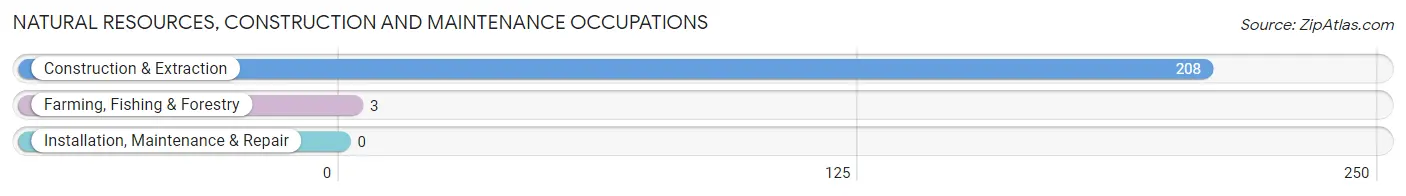
Natural Resources, Construction and Maintenance Occupations
The most common Natural Resources, Construction and Maintenance occupations in Tuckahoe are Construction & Extraction (208 | 5.4%), and Farming, Fishing & Forestry (3 | 0.1%).
Natural Resources, Construction and Maintenance Occupations by Sex
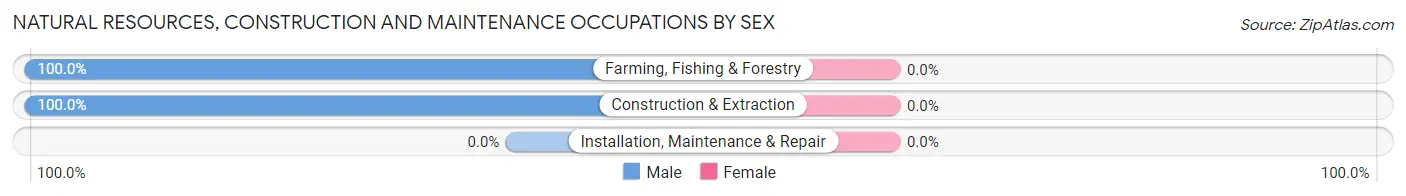
| Occupation | Male | Female |
| Farming, Fishing & Forestry | 3 (100.0%) | 0 (0.0%) |
| Construction & Extraction | 208 (100.0%) | 0 (0.0%) |
| Installation, Maintenance & Repair | 0 (0.0%) | 0 (0.0%) |
| Total (Category) | 211 (100.0%) | 0 (0.0%) |
| Total (Overall) | 2,004 (52.3%) | 1,827 (47.7%) |
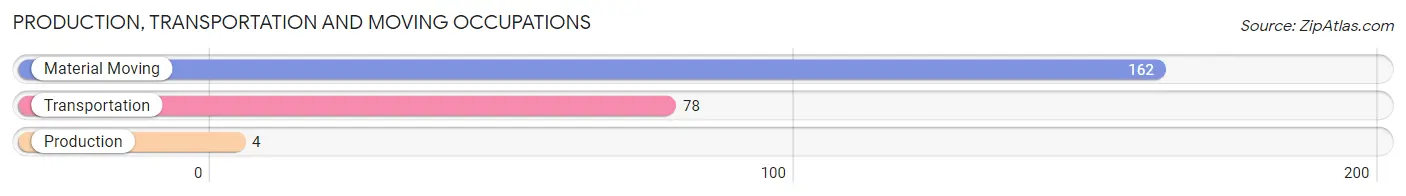
Production, Transportation and Moving Occupations
The most common Production, Transportation and Moving occupations in Tuckahoe are Material Moving (162 | 4.2%), Transportation (78 | 2.0%), and Production (4 | 0.1%).
Production, Transportation and Moving Occupations by Sex
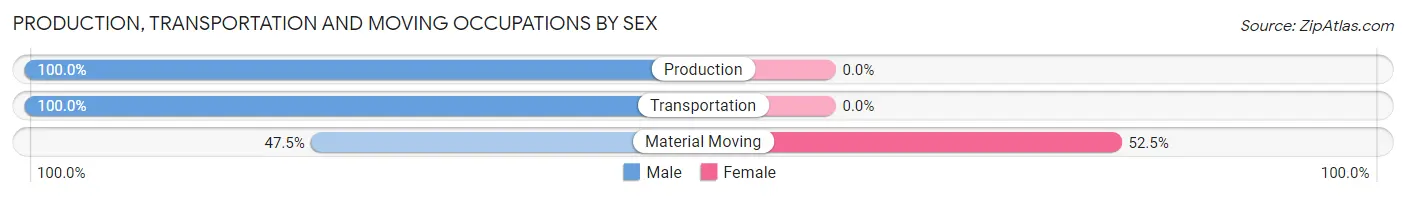
| Occupation | Male | Female |
| Production | 4 (100.0%) | 0 (0.0%) |
| Transportation | 78 (100.0%) | 0 (0.0%) |
| Material Moving | 77 (47.5%) | 85 (52.5%) |
| Total (Category) | 159 (65.2%) | 85 (34.8%) |
| Total (Overall) | 2,004 (52.3%) | 1,827 (47.7%) |
Employment Industries by Sex in Tuckahoe
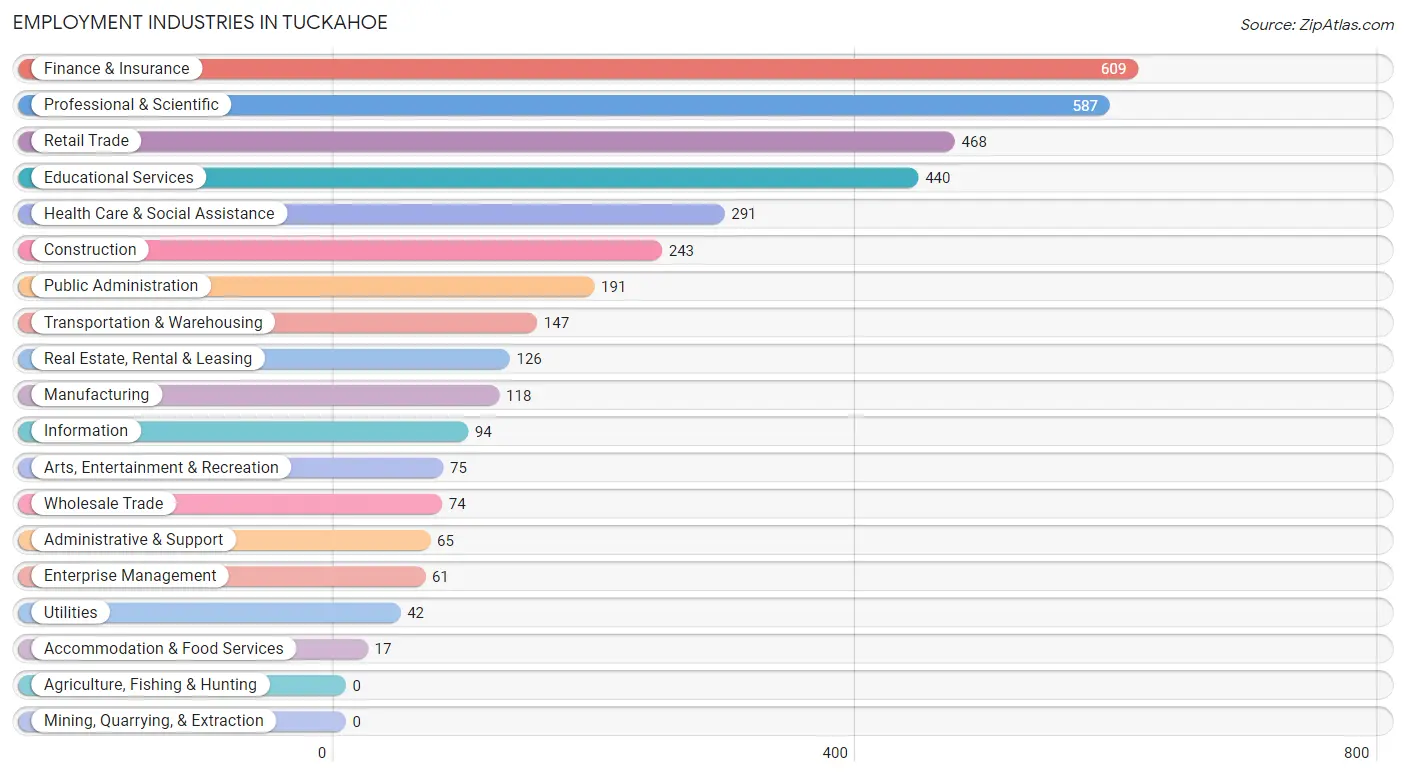
Employment Industries in Tuckahoe
The major employment industries in Tuckahoe include Finance & Insurance (609 | 15.9%), Professional & Scientific (587 | 15.3%), Retail Trade (468 | 12.2%), Educational Services (440 | 11.5%), and Health Care & Social Assistance (291 | 7.6%).
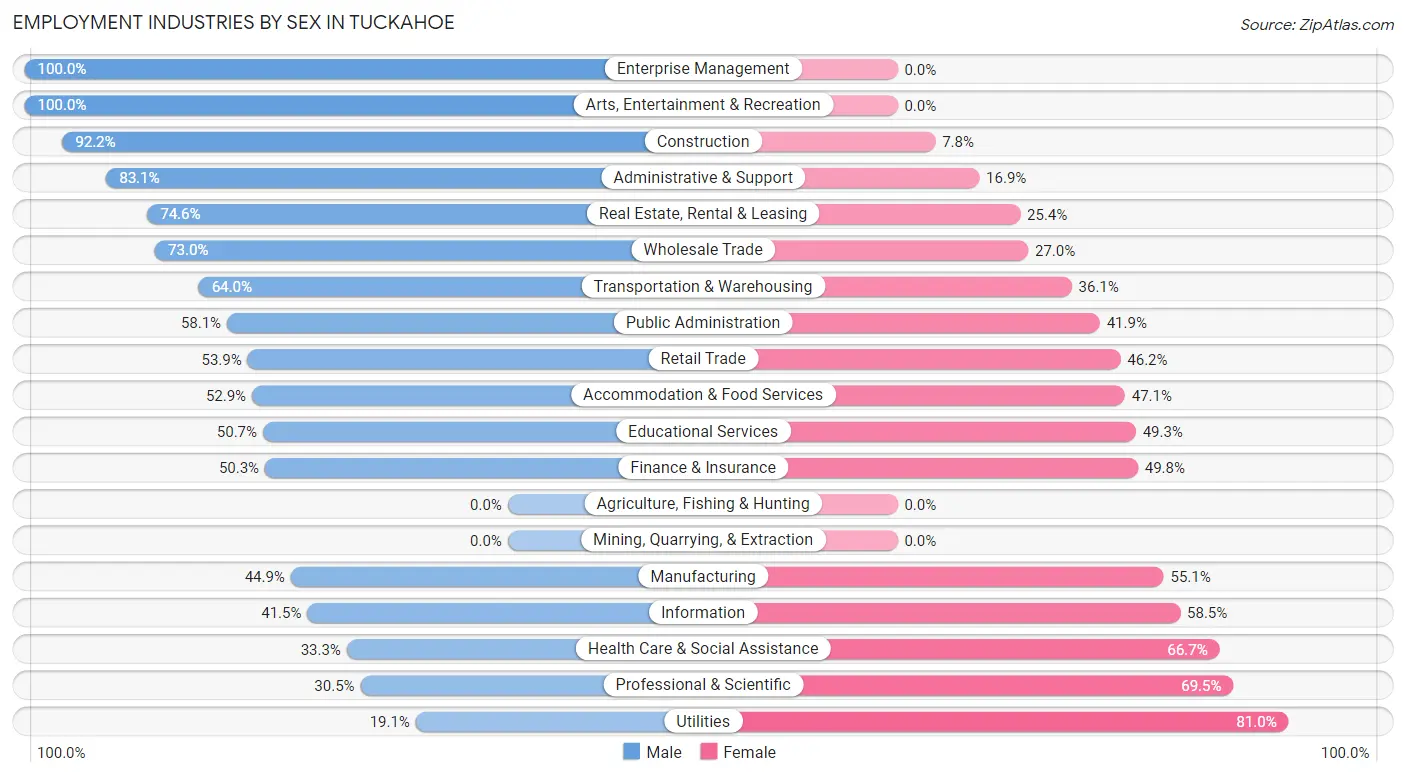
Employment Industries by Sex in Tuckahoe
The Tuckahoe industries that see more men than women are Enterprise Management (100.0%), Arts, Entertainment & Recreation (100.0%), and Construction (92.2%), whereas the industries that tend to have a higher number of women are Utilities (80.9%), Professional & Scientific (69.5%), and Health Care & Social Assistance (66.7%).
| Industry | Male | Female |
| Agriculture, Fishing & Hunting | 0 (0.0%) | 0 (0.0%) |
| Mining, Quarrying, & Extraction | 0 (0.0%) | 0 (0.0%) |
| Construction | 224 (92.2%) | 19 (7.8%) |
| Manufacturing | 53 (44.9%) | 65 (55.1%) |
| Wholesale Trade | 54 (73.0%) | 20 (27.0%) |
| Retail Trade | 252 (53.8%) | 216 (46.2%) |
| Transportation & Warehousing | 94 (63.9%) | 53 (36.0%) |
| Utilities | 8 (19.1%) | 34 (80.9%) |
| Information | 39 (41.5%) | 55 (58.5%) |
| Finance & Insurance | 306 (50.2%) | 303 (49.7%) |
| Real Estate, Rental & Leasing | 94 (74.6%) | 32 (25.4%) |
| Professional & Scientific | 179 (30.5%) | 408 (69.5%) |
| Enterprise Management | 61 (100.0%) | 0 (0.0%) |
| Administrative & Support | 54 (83.1%) | 11 (16.9%) |
| Educational Services | 223 (50.7%) | 217 (49.3%) |
| Health Care & Social Assistance | 97 (33.3%) | 194 (66.7%) |
| Arts, Entertainment & Recreation | 75 (100.0%) | 0 (0.0%) |
| Accommodation & Food Services | 9 (52.9%) | 8 (47.1%) |
| Public Administration | 111 (58.1%) | 80 (41.9%) |
| Total | 2,004 (52.3%) | 1,827 (47.7%) |
Education in Tuckahoe
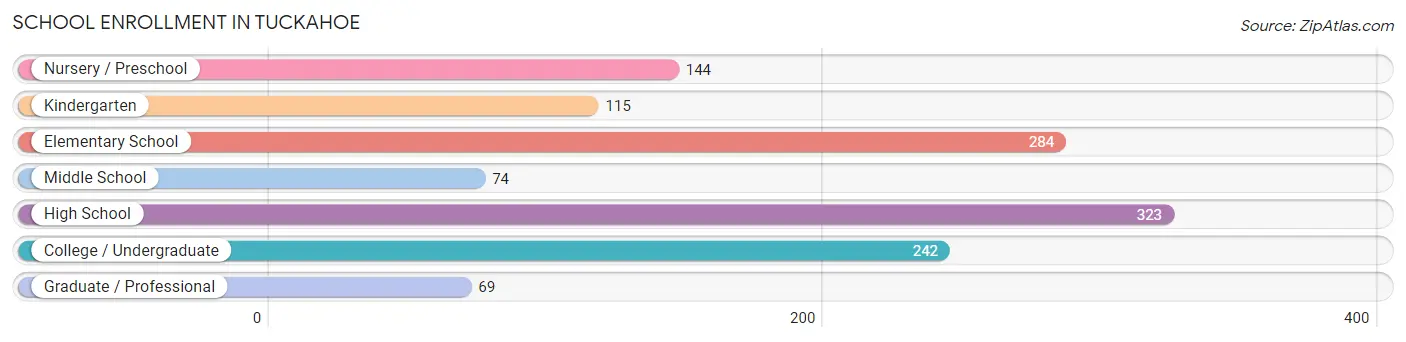
School Enrollment in Tuckahoe
The most common levels of schooling among the 1,251 students in Tuckahoe are high school (323 | 25.8%), elementary school (284 | 22.7%), and college / undergraduate (242 | 19.3%).
| School Level | # Students | % Students |
| Nursery / Preschool | 144 | 11.5% |
| Kindergarten | 115 | 9.2% |
| Elementary School | 284 | 22.7% |
| Middle School | 74 | 5.9% |
| High School | 323 | 25.8% |
| College / Undergraduate | 242 | 19.3% |
| Graduate / Professional | 69 | 5.5% |
| Total | 1,251 | 100.0% |
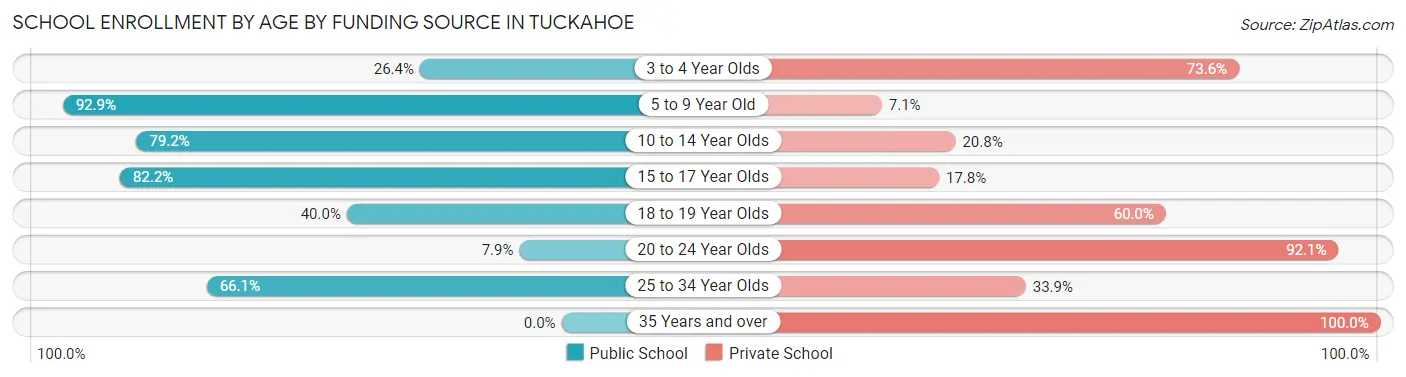
School Enrollment by Age by Funding Source in Tuckahoe
Out of a total of 1,251 students who are enrolled in schools in Tuckahoe, 427 (34.1%) attend a private institution, while the remaining 824 (65.9%) are enrolled in public schools. The age group of 35 years and over has the highest likelihood of being enrolled in private schools, with 31 (100.0% in the age bracket) enrolled. Conversely, the age group of 5 to 9 year old has the lowest likelihood of being enrolled in a private school, with 379 (92.9% in the age bracket) attending a public institution.
| Age Bracket | Public School | Private School |
| 3 to 4 Year Olds | 38 (26.4%) | 106 (73.6%) |
| 5 to 9 Year Old | 379 (92.9%) | 29 (7.1%) |
| 10 to 14 Year Olds | 57 (79.2%) | 15 (20.8%) |
| 15 to 17 Year Olds | 250 (82.2%) | 54 (17.8%) |
| 18 to 19 Year Olds | 16 (40.0%) | 24 (60.0%) |
| 20 to 24 Year Olds | 11 (7.9%) | 129 (92.1%) |
| 25 to 34 Year Olds | 74 (66.1%) | 38 (33.9%) |
| 35 Years and over | 0 (0.0%) | 31 (100.0%) |
| Total | 824 (65.9%) | 427 (34.1%) |
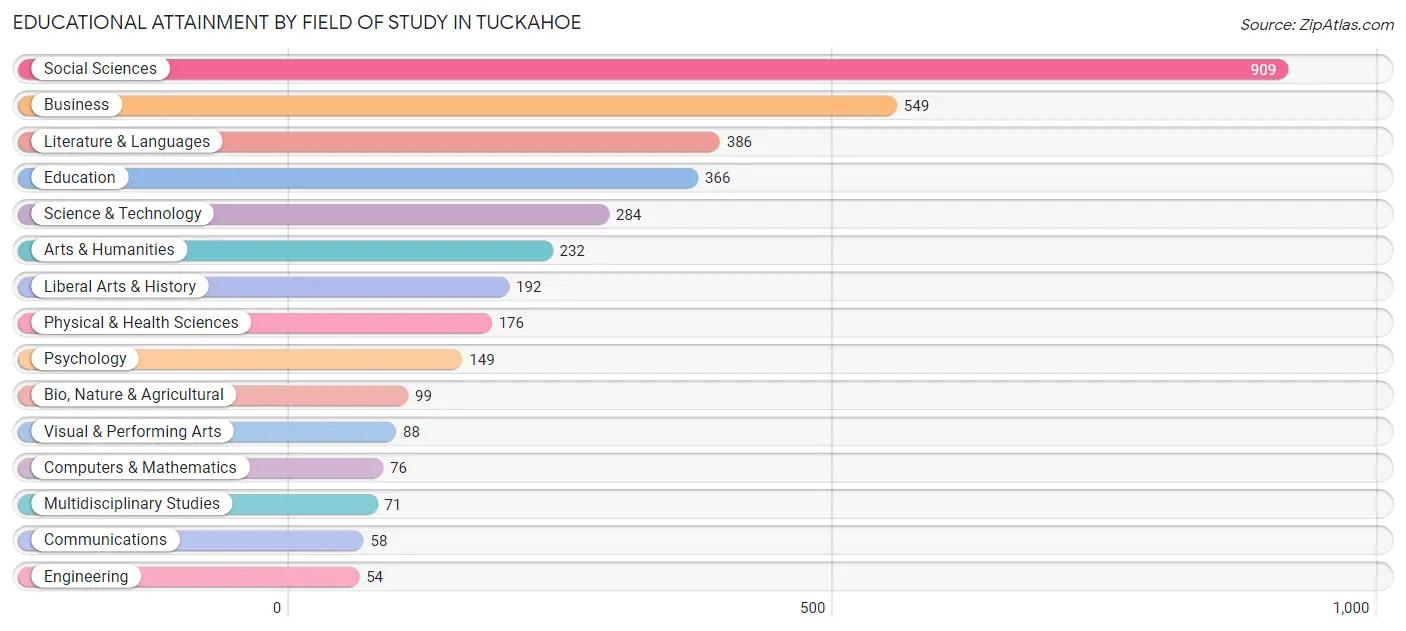
Educational Attainment by Field of Study in Tuckahoe
Social sciences (909 | 24.6%), business (549 | 14.9%), literature & languages (386 | 10.5%), education (366 | 9.9%), and science & technology (284 | 7.7%) are the most common fields of study among 3,689 individuals in Tuckahoe who have obtained a bachelor's degree or higher.
| Field of Study | # Graduates | % Graduates |
| Computers & Mathematics | 76 | 2.1% |
| Bio, Nature & Agricultural | 99 | 2.7% |
| Physical & Health Sciences | 176 | 4.8% |
| Psychology | 149 | 4.0% |
| Social Sciences | 909 | 24.6% |
| Engineering | 54 | 1.5% |
| Multidisciplinary Studies | 71 | 1.9% |
| Science & Technology | 284 | 7.7% |
| Business | 549 | 14.9% |
| Education | 366 | 9.9% |
| Literature & Languages | 386 | 10.5% |
| Liberal Arts & History | 192 | 5.2% |
| Visual & Performing Arts | 88 | 2.4% |
| Communications | 58 | 1.6% |
| Arts & Humanities | 232 | 6.3% |
| Total | 3,689 | 100.0% |
Transportation & Commute in Tuckahoe
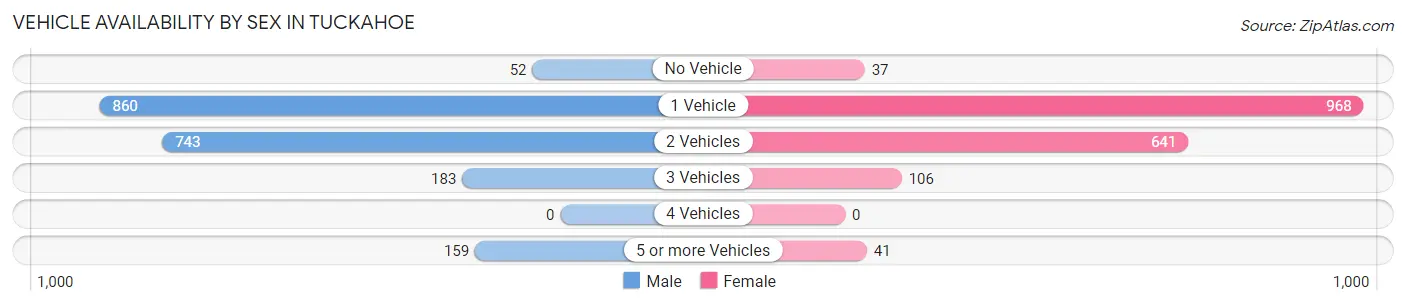
Vehicle Availability by Sex in Tuckahoe
The most prevalent vehicle ownership categories in Tuckahoe are males with 1 vehicle (860, accounting for 43.1%) and females with 1 vehicle (968, making up 48.0%).
| Vehicles Available | Male | Female |
| No Vehicle | 52 (2.6%) | 37 (2.1%) |
| 1 Vehicle | 860 (43.1%) | 968 (54.0%) |
| 2 Vehicles | 743 (37.2%) | 641 (35.7%) |
| 3 Vehicles | 183 (9.2%) | 106 (5.9%) |
| 4 Vehicles | 0 (0.0%) | 0 (0.0%) |
| 5 or more Vehicles | 159 (8.0%) | 41 (2.3%) |
| Total | 1,997 (100.0%) | 1,793 (100.0%) |
Commute Time in Tuckahoe
The most frequently occuring commute durations in Tuckahoe are 60 to 89 minutes (510 commuters, 17.7%), 20 to 24 minutes (410 commuters, 14.2%), and 45 to 59 minutes (405 commuters, 14.0%).
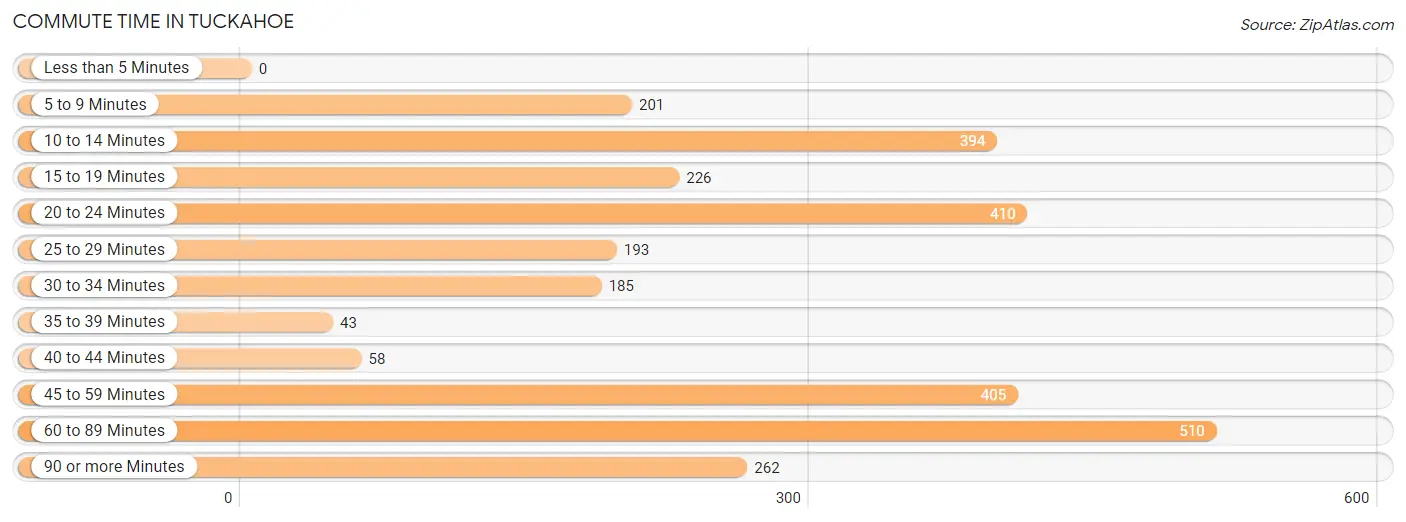
| Commute Time | # Commuters | % Commuters |
| Less than 5 Minutes | 0 | 0.0% |
| 5 to 9 Minutes | 201 | 7.0% |
| 10 to 14 Minutes | 394 | 13.7% |
| 15 to 19 Minutes | 226 | 7.8% |
| 20 to 24 Minutes | 410 | 14.2% |
| 25 to 29 Minutes | 193 | 6.7% |
| 30 to 34 Minutes | 185 | 6.4% |
| 35 to 39 Minutes | 43 | 1.5% |
| 40 to 44 Minutes | 58 | 2.0% |
| 45 to 59 Minutes | 405 | 14.0% |
| 60 to 89 Minutes | 510 | 17.7% |
| 90 or more Minutes | 262 | 9.1% |
Commute Time by Sex in Tuckahoe
The most common commute times in Tuckahoe are 45 to 59 minutes (282 commuters, 17.7%) for males and 60 to 89 minutes (261 commuters, 20.1%) for females.
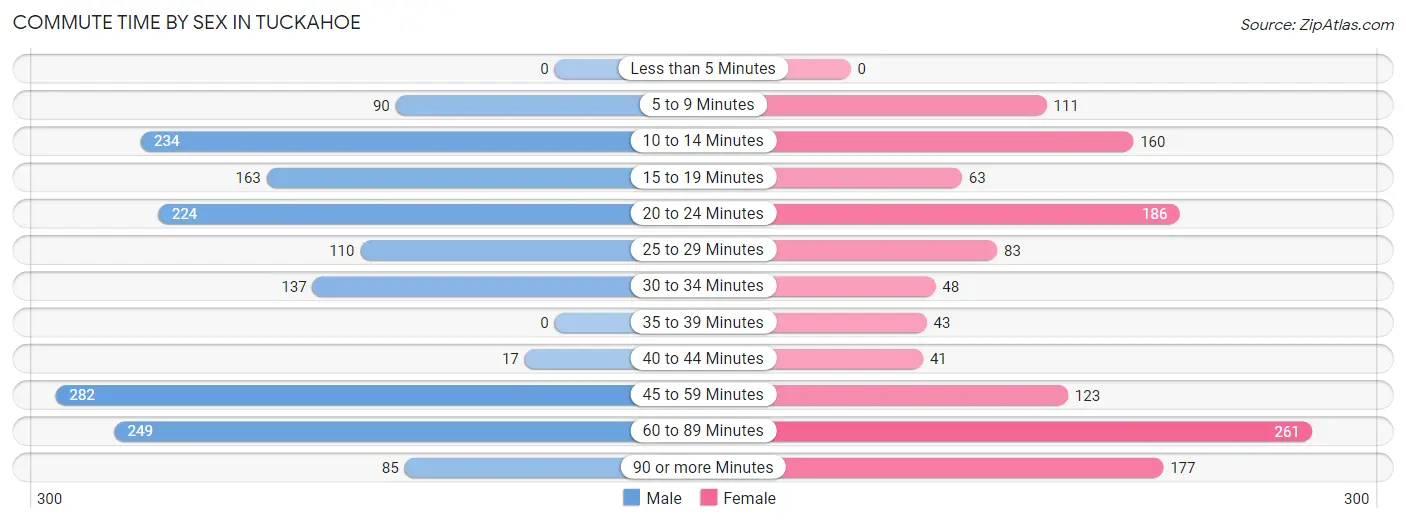
| Commute Time | Male | Female |
| Less than 5 Minutes | 0 (0.0%) | 0 (0.0%) |
| 5 to 9 Minutes | 90 (5.7%) | 111 (8.6%) |
| 10 to 14 Minutes | 234 (14.7%) | 160 (12.3%) |
| 15 to 19 Minutes | 163 (10.2%) | 63 (4.9%) |
| 20 to 24 Minutes | 224 (14.1%) | 186 (14.3%) |
| 25 to 29 Minutes | 110 (6.9%) | 83 (6.4%) |
| 30 to 34 Minutes | 137 (8.6%) | 48 (3.7%) |
| 35 to 39 Minutes | 0 (0.0%) | 43 (3.3%) |
| 40 to 44 Minutes | 17 (1.1%) | 41 (3.2%) |
| 45 to 59 Minutes | 282 (17.7%) | 123 (9.5%) |
| 60 to 89 Minutes | 249 (15.7%) | 261 (20.1%) |
| 90 or more Minutes | 85 (5.3%) | 177 (13.7%) |
Time of Departure to Work by Sex in Tuckahoe
The most frequent times of departure to work in Tuckahoe are 8:00 AM to 8:29 AM (246, 15.5%) for males and 8:00 AM to 8:29 AM (360, 27.8%) for females.
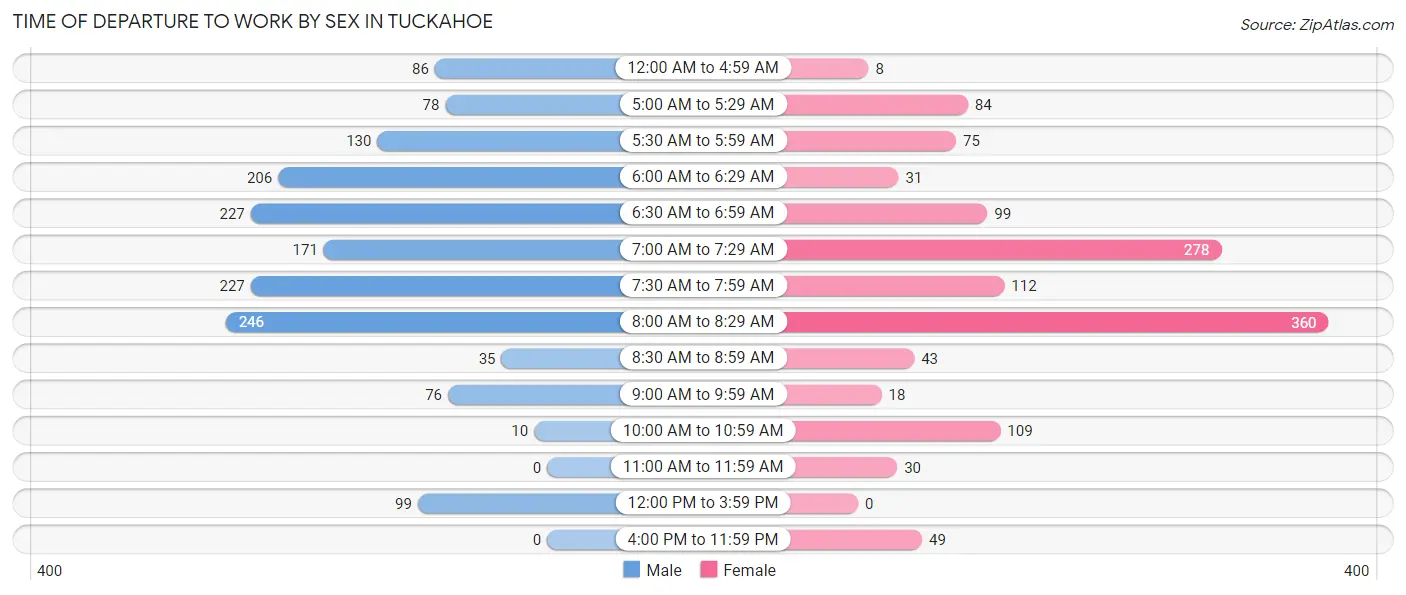
| Time of Departure | Male | Female |
| 12:00 AM to 4:59 AM | 86 (5.4%) | 8 (0.6%) |
| 5:00 AM to 5:29 AM | 78 (4.9%) | 84 (6.5%) |
| 5:30 AM to 5:59 AM | 130 (8.2%) | 75 (5.8%) |
| 6:00 AM to 6:29 AM | 206 (13.0%) | 31 (2.4%) |
| 6:30 AM to 6:59 AM | 227 (14.3%) | 99 (7.6%) |
| 7:00 AM to 7:29 AM | 171 (10.7%) | 278 (21.4%) |
| 7:30 AM to 7:59 AM | 227 (14.3%) | 112 (8.6%) |
| 8:00 AM to 8:29 AM | 246 (15.5%) | 360 (27.8%) |
| 8:30 AM to 8:59 AM | 35 (2.2%) | 43 (3.3%) |
| 9:00 AM to 9:59 AM | 76 (4.8%) | 18 (1.4%) |
| 10:00 AM to 10:59 AM | 10 (0.6%) | 109 (8.4%) |
| 11:00 AM to 11:59 AM | 0 (0.0%) | 30 (2.3%) |
| 12:00 PM to 3:59 PM | 99 (6.2%) | 0 (0.0%) |
| 4:00 PM to 11:59 PM | 0 (0.0%) | 49 (3.8%) |
| Total | 1,591 (100.0%) | 1,296 (100.0%) |
Housing Occupancy in Tuckahoe
Occupancy by Ownership in Tuckahoe
Of the total 3,173 dwellings in Tuckahoe, owner-occupied units account for 1,407 (44.3%), while renter-occupied units make up 1,766 (55.7%).
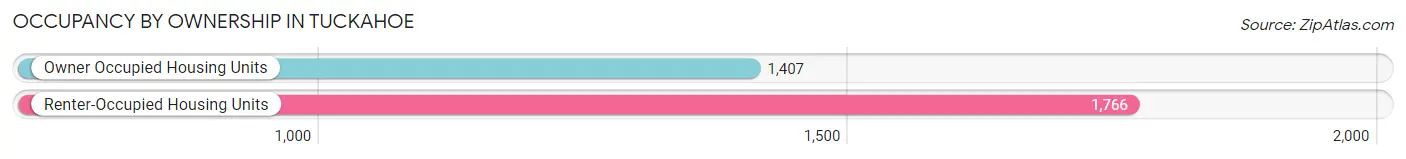
| Occupancy | # Housing Units | % Housing Units |
| Owner Occupied Housing Units | 1,407 | 44.3% |
| Renter-Occupied Housing Units | 1,766 | 55.7% |
| Total Occupied Housing Units | 3,173 | 100.0% |
Occupancy by Household Size in Tuckahoe
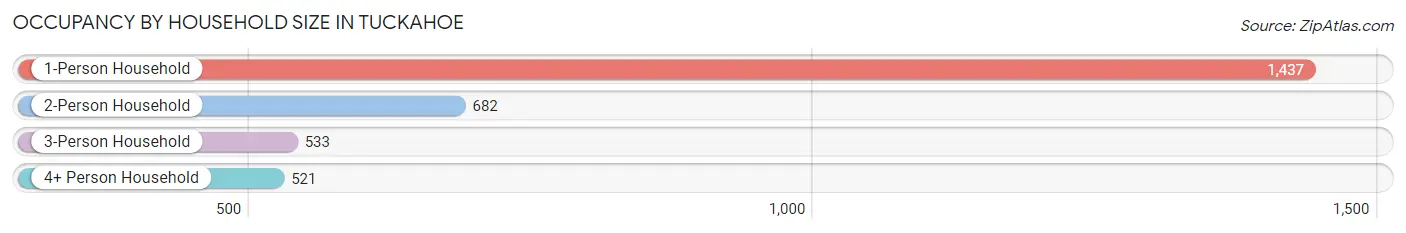
| Household Size | # Housing Units | % Housing Units |
| 1-Person Household | 1,437 | 45.3% |
| 2-Person Household | 682 | 21.5% |
| 3-Person Household | 533 | 16.8% |
| 4+ Person Household | 521 | 16.4% |
| Total Housing Units | 3,173 | 100.0% |
Occupancy by Ownership by Household Size in Tuckahoe
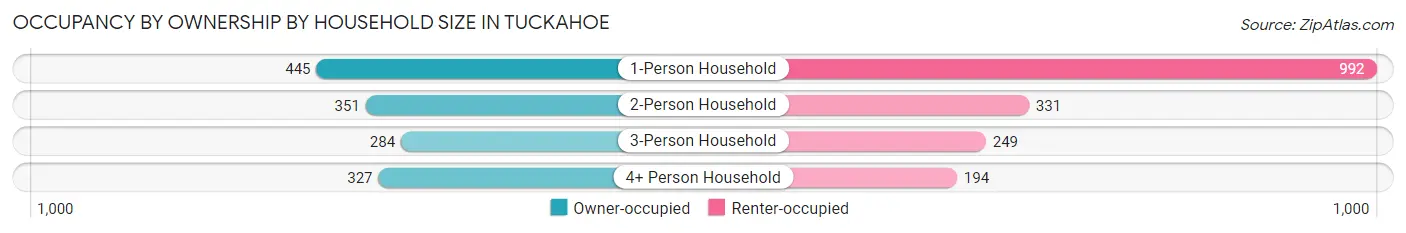
| Household Size | Owner-occupied | Renter-occupied |
| 1-Person Household | 445 (31.0%) | 992 (69.0%) |
| 2-Person Household | 351 (51.5%) | 331 (48.5%) |
| 3-Person Household | 284 (53.3%) | 249 (46.7%) |
| 4+ Person Household | 327 (62.8%) | 194 (37.2%) |
| Total Housing Units | 1,407 (44.3%) | 1,766 (55.7%) |
Occupancy by Educational Attainment in Tuckahoe
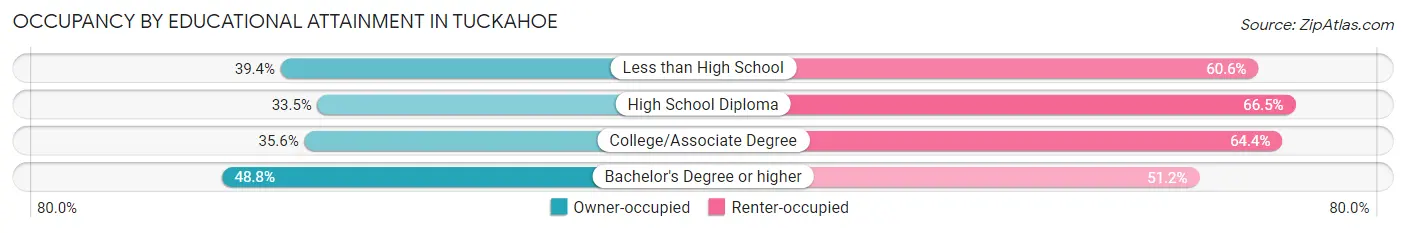
| Household Size | Owner-occupied | Renter-occupied |
| Less than High School | 50 (39.4%) | 77 (60.6%) |
| High School Diploma | 124 (33.5%) | 246 (66.5%) |
| College/Associate Degree | 194 (35.6%) | 351 (64.4%) |
| Bachelor's Degree or higher | 1,039 (48.8%) | 1,092 (51.2%) |
Occupancy by Age of Householder in Tuckahoe
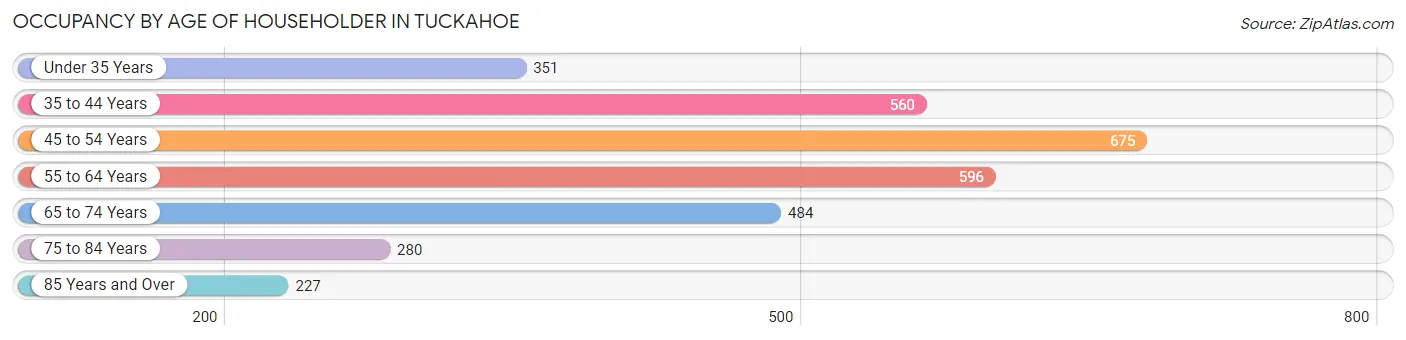
| Age Bracket | # Households | % Households |
| Under 35 Years | 351 | 11.1% |
| 35 to 44 Years | 560 | 17.6% |
| 45 to 54 Years | 675 | 21.3% |
| 55 to 64 Years | 596 | 18.8% |
| 65 to 74 Years | 484 | 15.2% |
| 75 to 84 Years | 280 | 8.8% |
| 85 Years and Over | 227 | 7.1% |
| Total | 3,173 | 100.0% |
Housing Finances in Tuckahoe
Median Income by Occupancy in Tuckahoe
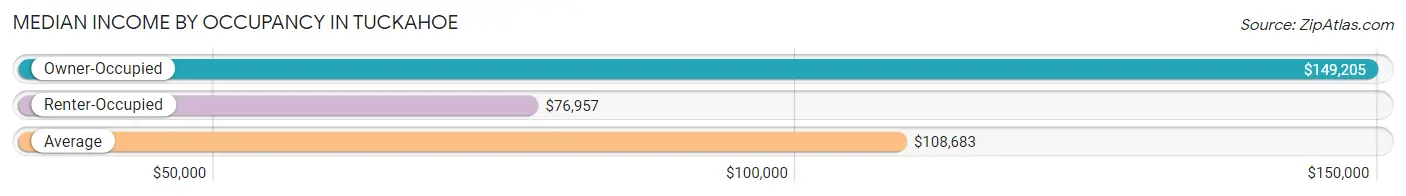
| Occupancy Type | # Households | Median Income |
| Owner-Occupied | 1,407 (44.3%) | $149,205 |
| Renter-Occupied | 1,766 (55.7%) | $76,957 |
| Average | 3,173 (100.0%) | $108,683 |
Occupancy by Householder Income Bracket in Tuckahoe
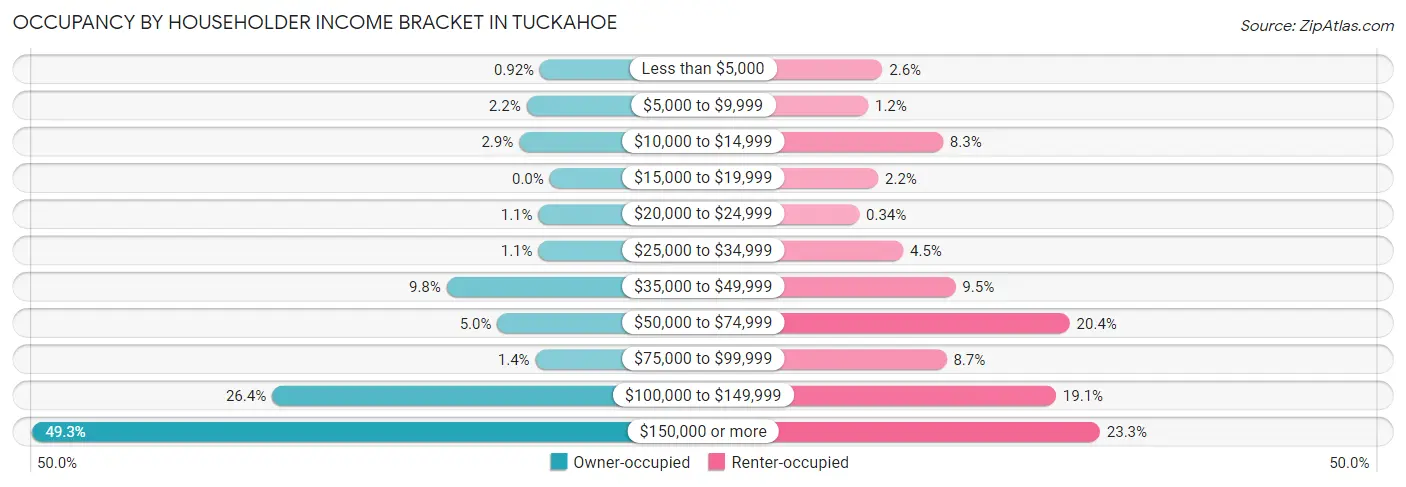
| Income Bracket | Owner-occupied | Renter-occupied |
| Less than $5,000 | 13 (0.9%) | 45 (2.5%) |
| $5,000 to $9,999 | 31 (2.2%) | 21 (1.2%) |
| $10,000 to $14,999 | 41 (2.9%) | 147 (8.3%) |
| $15,000 to $19,999 | 0 (0.0%) | 38 (2.1%) |
| $20,000 to $24,999 | 15 (1.1%) | 6 (0.3%) |
| $25,000 to $34,999 | 15 (1.1%) | 80 (4.5%) |
| $35,000 to $49,999 | 138 (9.8%) | 168 (9.5%) |
| $50,000 to $74,999 | 70 (5.0%) | 360 (20.4%) |
| $75,000 to $99,999 | 19 (1.3%) | 153 (8.7%) |
| $100,000 to $149,999 | 372 (26.4%) | 337 (19.1%) |
| $150,000 or more | 693 (49.2%) | 411 (23.3%) |
| Total | 1,407 (100.0%) | 1,766 (100.0%) |
Monthly Housing Cost Tiers in Tuckahoe
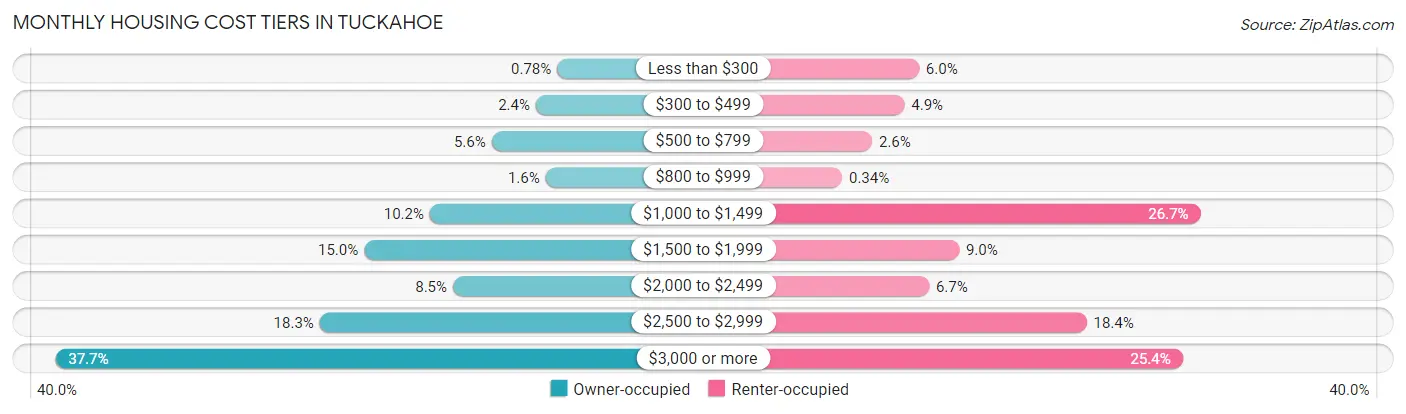
| Monthly Cost | Owner-occupied | Renter-occupied |
| Less than $300 | 11 (0.8%) | 106 (6.0%) |
| $300 to $499 | 33 (2.4%) | 87 (4.9%) |
| $500 to $799 | 79 (5.6%) | 45 (2.5%) |
| $800 to $999 | 23 (1.6%) | 6 (0.3%) |
| $1,000 to $1,499 | 143 (10.2%) | 472 (26.7%) |
| $1,500 to $1,999 | 211 (15.0%) | 158 (8.9%) |
| $2,000 to $2,499 | 119 (8.5%) | 119 (6.7%) |
| $2,500 to $2,999 | 257 (18.3%) | 324 (18.3%) |
| $3,000 or more | 531 (37.7%) | 449 (25.4%) |
| Total | 1,407 (100.0%) | 1,766 (100.0%) |
Physical Housing Characteristics in Tuckahoe
Housing Structures in Tuckahoe
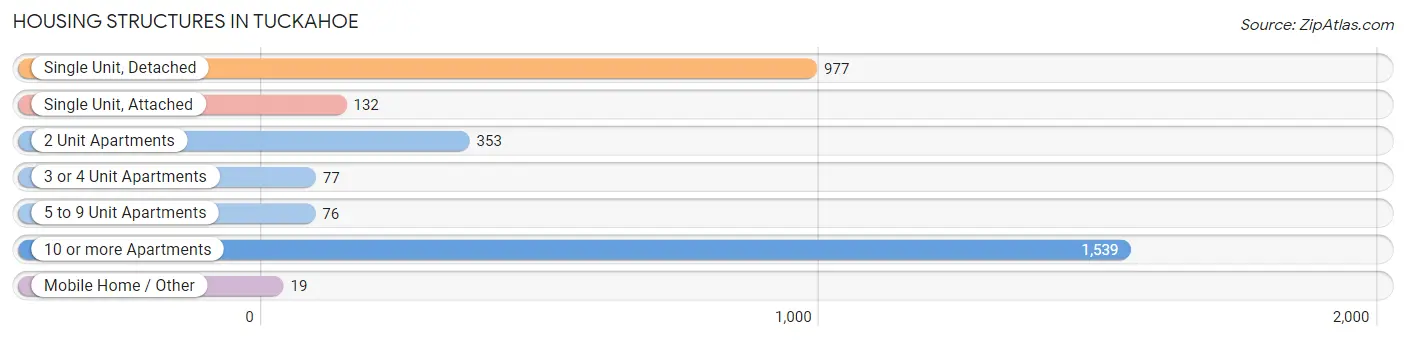
| Structure Type | # Housing Units | % Housing Units |
| Single Unit, Detached | 977 | 30.8% |
| Single Unit, Attached | 132 | 4.2% |
| 2 Unit Apartments | 353 | 11.1% |
| 3 or 4 Unit Apartments | 77 | 2.4% |
| 5 to 9 Unit Apartments | 76 | 2.4% |
| 10 or more Apartments | 1,539 | 48.5% |
| Mobile Home / Other | 19 | 0.6% |
| Total | 3,173 | 100.0% |
Housing Structures by Occupancy in Tuckahoe
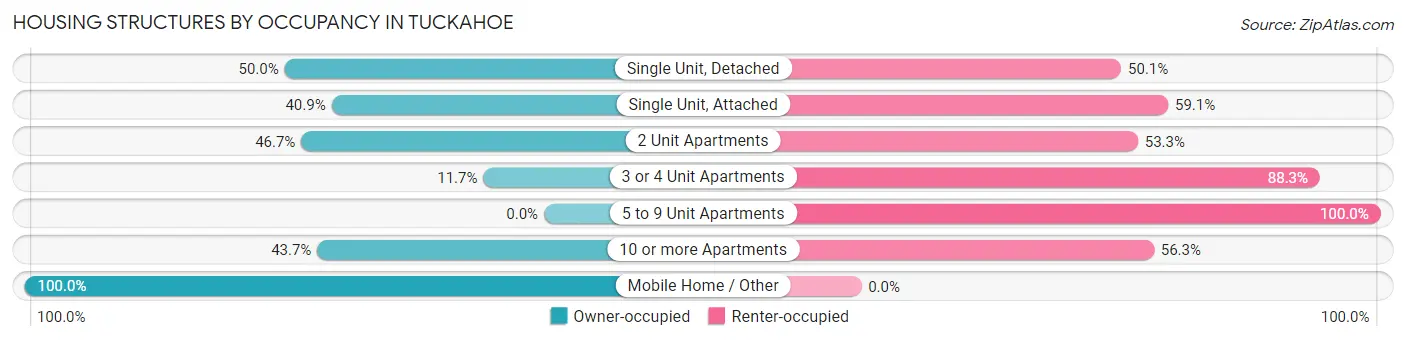
| Structure Type | Owner-occupied | Renter-occupied |
| Single Unit, Detached | 488 (49.9%) | 489 (50.0%) |
| Single Unit, Attached | 54 (40.9%) | 78 (59.1%) |
| 2 Unit Apartments | 165 (46.7%) | 188 (53.3%) |
| 3 or 4 Unit Apartments | 9 (11.7%) | 68 (88.3%) |
| 5 to 9 Unit Apartments | 0 (0.0%) | 76 (100.0%) |
| 10 or more Apartments | 672 (43.7%) | 867 (56.3%) |
| Mobile Home / Other | 19 (100.0%) | 0 (0.0%) |
| Total | 1,407 (44.3%) | 1,766 (55.7%) |
Housing Structures by Number of Rooms in Tuckahoe
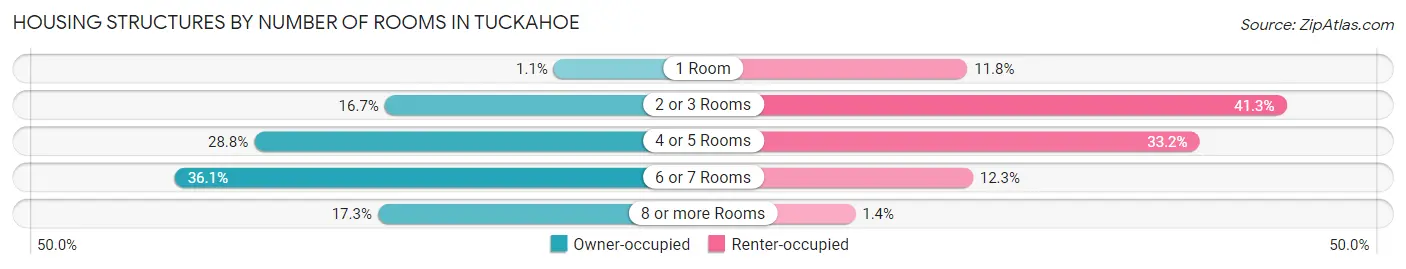
| Number of Rooms | Owner-occupied | Renter-occupied |
| 1 Room | 15 (1.1%) | 208 (11.8%) |
| 2 or 3 Rooms | 235 (16.7%) | 729 (41.3%) |
| 4 or 5 Rooms | 405 (28.8%) | 587 (33.2%) |
| 6 or 7 Rooms | 508 (36.1%) | 217 (12.3%) |
| 8 or more Rooms | 244 (17.3%) | 25 (1.4%) |
| Total | 1,407 (100.0%) | 1,766 (100.0%) |
Housing Structure by Heating Type in Tuckahoe
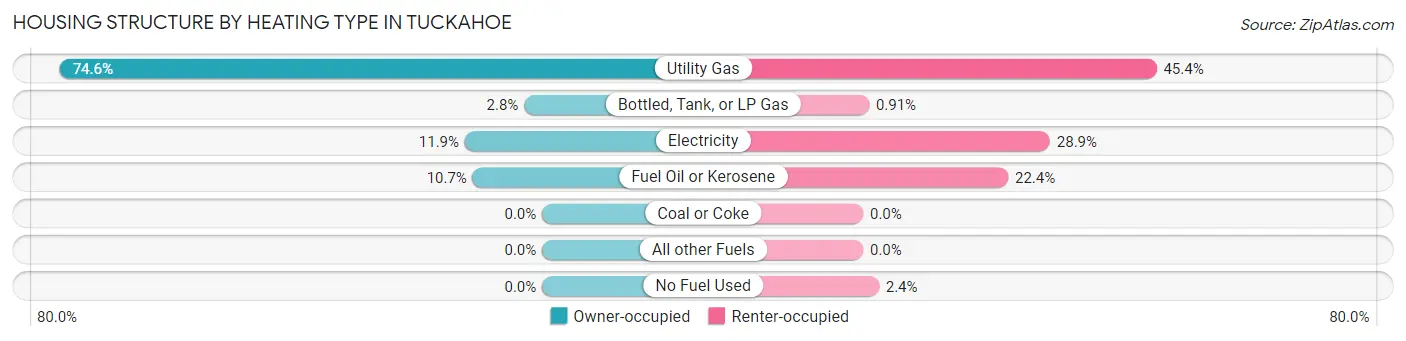
| Heating Type | Owner-occupied | Renter-occupied |
| Utility Gas | 1,049 (74.6%) | 801 (45.4%) |
| Bottled, Tank, or LP Gas | 39 (2.8%) | 16 (0.9%) |
| Electricity | 168 (11.9%) | 510 (28.9%) |
| Fuel Oil or Kerosene | 151 (10.7%) | 396 (22.4%) |
| Coal or Coke | 0 (0.0%) | 0 (0.0%) |
| All other Fuels | 0 (0.0%) | 0 (0.0%) |
| No Fuel Used | 0 (0.0%) | 43 (2.4%) |
| Total | 1,407 (100.0%) | 1,766 (100.0%) |
Household Vehicle Usage in Tuckahoe
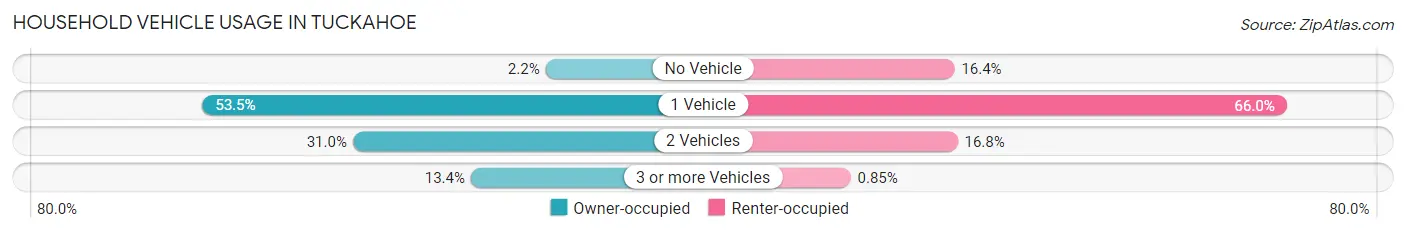
| Vehicles per Household | Owner-occupied | Renter-occupied |
| No Vehicle | 31 (2.2%) | 289 (16.4%) |
| 1 Vehicle | 752 (53.4%) | 1,165 (66.0%) |
| 2 Vehicles | 436 (31.0%) | 297 (16.8%) |
| 3 or more Vehicles | 188 (13.4%) | 15 (0.9%) |
| Total | 1,407 (100.0%) | 1,766 (100.0%) |
Real Estate & Mortgages in Tuckahoe
Real Estate and Mortgage Overview in Tuckahoe
| Characteristic | Without Mortgage | With Mortgage |
| Housing Units | 215 | 876 |
| Median Property Value | $852,500 | $544,100 |
| Median Household Income | $51,424 | $500 |
| Monthly Housing Costs | $1,021 | $481 |
| Real Estate Taxes | $6,174 | $77 |
Property Value by Mortgage Status in Tuckahoe
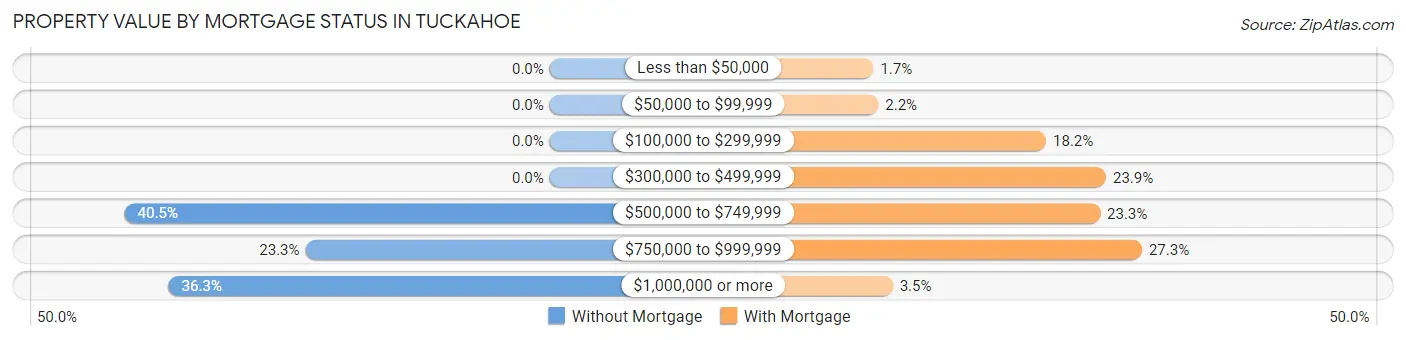
| Property Value | Without Mortgage | With Mortgage |
| Less than $50,000 | 0 (0.0%) | 15 (1.7%) |
| $50,000 to $99,999 | 0 (0.0%) | 19 (2.2%) |
| $100,000 to $299,999 | 0 (0.0%) | 159 (18.1%) |
| $300,000 to $499,999 | 0 (0.0%) | 209 (23.9%) |
| $500,000 to $749,999 | 87 (40.5%) | 204 (23.3%) |
| $750,000 to $999,999 | 50 (23.3%) | 239 (27.3%) |
| $1,000,000 or more | 78 (36.3%) | 31 (3.5%) |
| Total | 215 (100.0%) | 876 (100.0%) |
Household Income by Mortgage Status in Tuckahoe
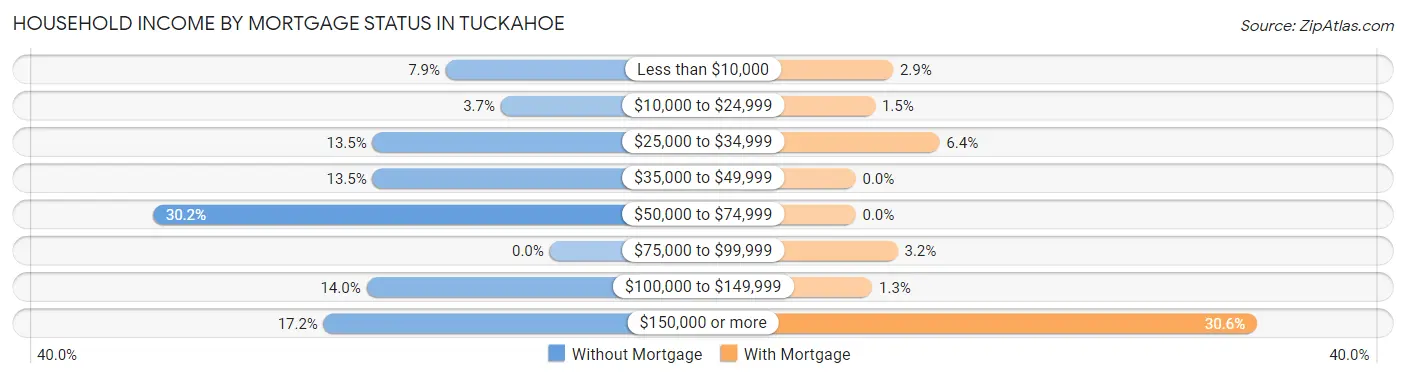
| Household Income | Without Mortgage | With Mortgage |
| Less than $10,000 | 17 (7.9%) | 25 (2.9%) |
| $10,000 to $24,999 | 8 (3.7%) | 13 (1.5%) |
| $25,000 to $34,999 | 29 (13.5%) | 56 (6.4%) |
| $35,000 to $49,999 | 29 (13.5%) | 0 (0.0%) |
| $50,000 to $74,999 | 65 (30.2%) | 0 (0.0%) |
| $75,000 to $99,999 | 0 (0.0%) | 28 (3.2%) |
| $100,000 to $149,999 | 30 (14.0%) | 11 (1.3%) |
| $150,000 or more | 37 (17.2%) | 268 (30.6%) |
| Total | 215 (100.0%) | 876 (100.0%) |
Property Value to Household Income Ratio in Tuckahoe
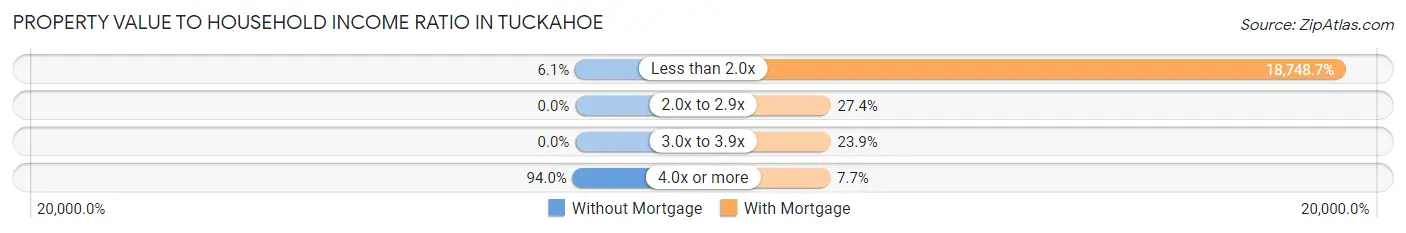
| Value-to-Income Ratio | Without Mortgage | With Mortgage |
| Less than 2.0x | 13 (6.0%) | 164,239 (18,748.7%) |
| 2.0x to 2.9x | 0 (0.0%) | 240 (27.4%) |
| 3.0x to 3.9x | 0 (0.0%) | 209 (23.9%) |
| 4.0x or more | 202 (94.0%) | 67 (7.6%) |
| Total | 215 (100.0%) | 876 (100.0%) |
Real Estate Taxes by Mortgage Status in Tuckahoe
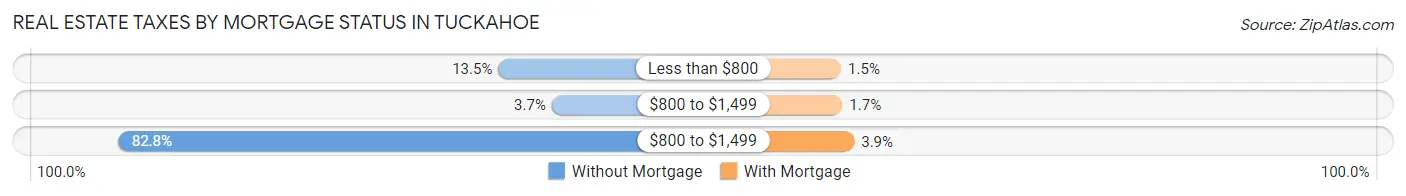
| Property Taxes | Without Mortgage | With Mortgage |
| Less than $800 | 29 (13.5%) | 13 (1.5%) |
| $800 to $1,499 | 8 (3.7%) | 15 (1.7%) |
| $800 to $1,499 | 178 (82.8%) | 34 (3.9%) |
| Total | 215 (100.0%) | 876 (100.0%) |
Health & Disability in Tuckahoe
Health Insurance Coverage by Age in Tuckahoe
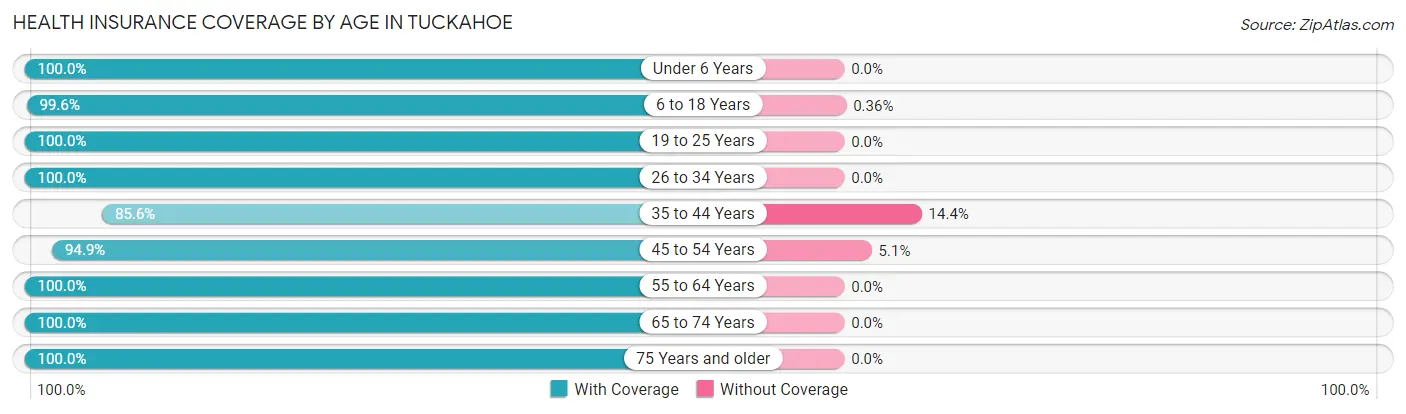
| Age Bracket | With Coverage | Without Coverage |
| Under 6 Years | 458 (100.0%) | 0 (0.0%) |
| 6 to 18 Years | 833 (99.6%) | 3 (0.4%) |
| 19 to 25 Years | 315 (100.0%) | 0 (0.0%) |
| 26 to 34 Years | 744 (100.0%) | 0 (0.0%) |
| 35 to 44 Years | 925 (85.6%) | 156 (14.4%) |
| 45 to 54 Years | 893 (94.9%) | 48 (5.1%) |
| 55 to 64 Years | 1,099 (100.0%) | 0 (0.0%) |
| 65 to 74 Years | 876 (100.0%) | 0 (0.0%) |
| 75 Years and older | 632 (100.0%) | 0 (0.0%) |
| Total | 6,775 (97.0%) | 207 (3.0%) |
Health Insurance Coverage by Citizenship Status in Tuckahoe
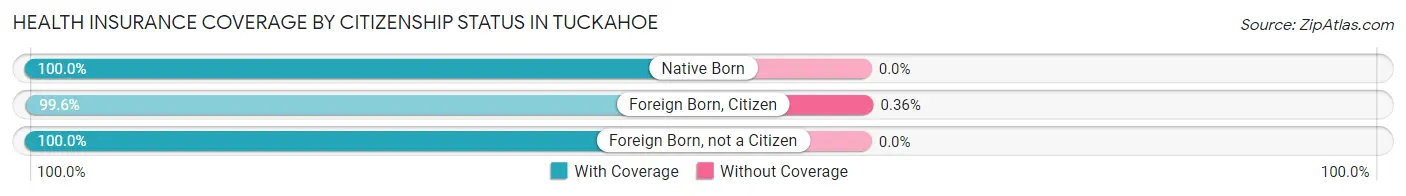
| Citizenship Status | With Coverage | Without Coverage |
| Native Born | 458 (100.0%) | 0 (0.0%) |
| Foreign Born, Citizen | 833 (99.6%) | 3 (0.4%) |
| Foreign Born, not a Citizen | 315 (100.0%) | 0 (0.0%) |
Health Insurance Coverage by Household Income in Tuckahoe
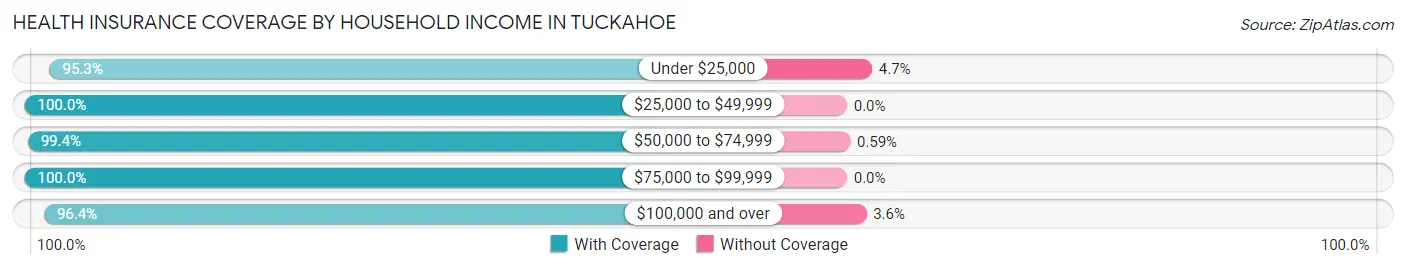
| Household Income | With Coverage | Without Coverage |
| Under $25,000 | 467 (95.3%) | 23 (4.7%) |
| $25,000 to $49,999 | 473 (100.0%) | 0 (0.0%) |
| $50,000 to $74,999 | 503 (99.4%) | 3 (0.6%) |
| $75,000 to $99,999 | 482 (100.0%) | 0 (0.0%) |
| $100,000 and over | 4,803 (96.4%) | 181 (3.6%) |
Public vs Private Health Insurance Coverage by Age in Tuckahoe
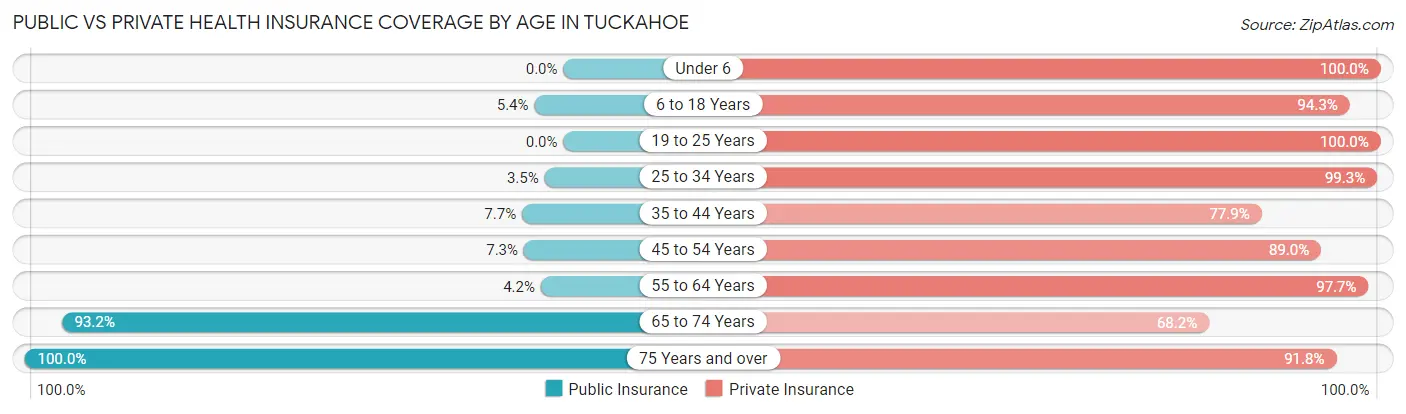
| Age Bracket | Public Insurance | Private Insurance |
| Under 6 | 0 (0.0%) | 458 (100.0%) |
| 6 to 18 Years | 45 (5.4%) | 788 (94.3%) |
| 19 to 25 Years | 0 (0.0%) | 315 (100.0%) |
| 25 to 34 Years | 26 (3.5%) | 739 (99.3%) |
| 35 to 44 Years | 83 (7.7%) | 842 (77.9%) |
| 45 to 54 Years | 69 (7.3%) | 837 (88.9%) |
| 55 to 64 Years | 46 (4.2%) | 1,074 (97.7%) |
| 65 to 74 Years | 816 (93.1%) | 597 (68.1%) |
| 75 Years and over | 632 (100.0%) | 580 (91.8%) |
| Total | 1,717 (24.6%) | 6,230 (89.2%) |
Disability Status by Sex by Age in Tuckahoe
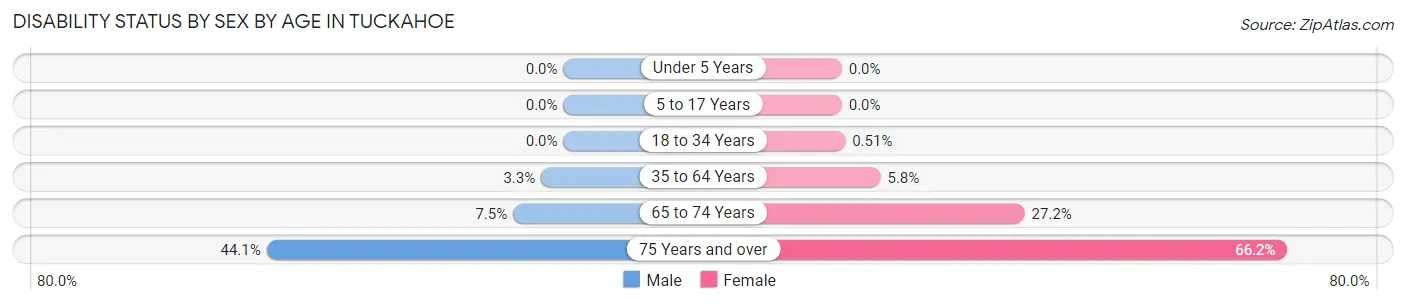
| Age Bracket | Male | Female |
| Under 5 Years | 0 (0.0%) | 0 (0.0%) |
| 5 to 17 Years | 0 (0.0%) | 0 (0.0%) |
| 18 to 34 Years | 0 (0.0%) | 3 (0.5%) |
| 35 to 64 Years | 48 (3.3%) | 96 (5.8%) |
| 65 to 74 Years | 28 (7.5%) | 136 (27.2%) |
| 75 Years and over | 78 (44.1%) | 301 (66.1%) |
Disability Class by Sex by Age in Tuckahoe
Disability Class: Hearing Difficulty
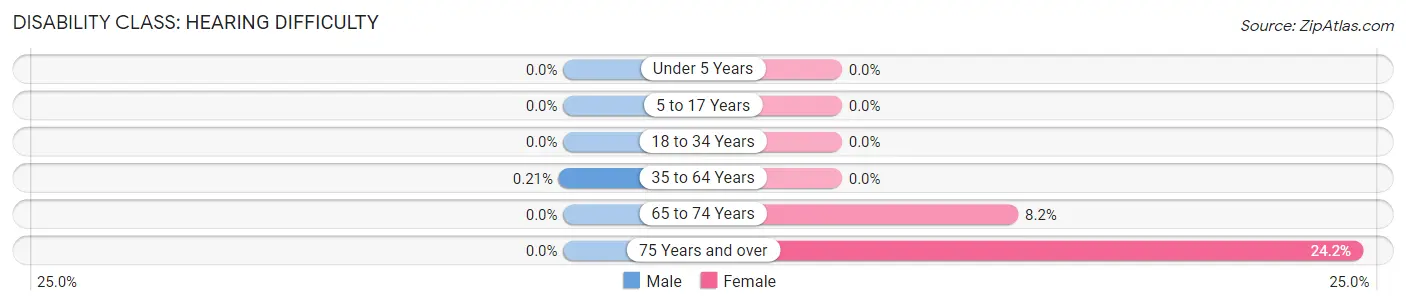
| Age Bracket | Male | Female |
| Under 5 Years | 0 (0.0%) | 0 (0.0%) |
| 5 to 17 Years | 0 (0.0%) | 0 (0.0%) |
| 18 to 34 Years | 0 (0.0%) | 0 (0.0%) |
| 35 to 64 Years | 3 (0.2%) | 0 (0.0%) |
| 65 to 74 Years | 0 (0.0%) | 41 (8.2%) |
| 75 Years and over | 0 (0.0%) | 110 (24.2%) |
Disability Class: Vision Difficulty
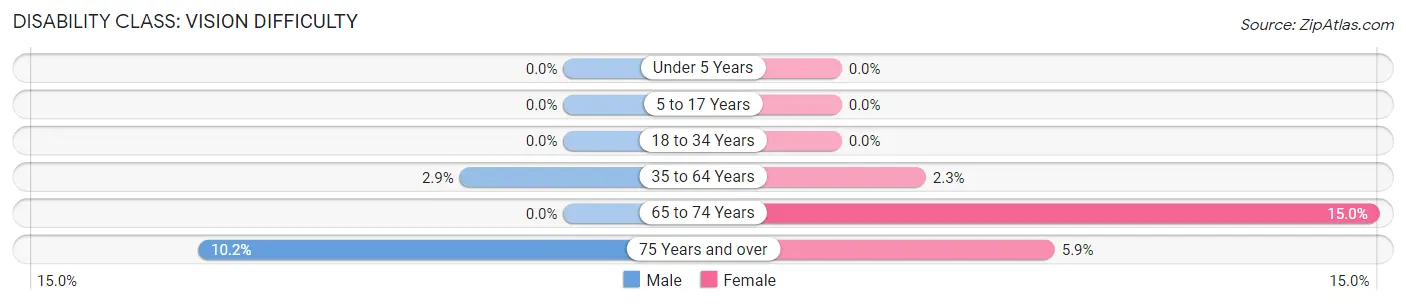
| Age Bracket | Male | Female |
| Under 5 Years | 0 (0.0%) | 0 (0.0%) |
| 5 to 17 Years | 0 (0.0%) | 0 (0.0%) |
| 18 to 34 Years | 0 (0.0%) | 0 (0.0%) |
| 35 to 64 Years | 42 (2.9%) | 39 (2.3%) |
| 65 to 74 Years | 0 (0.0%) | 75 (15.0%) |
| 75 Years and over | 18 (10.2%) | 27 (5.9%) |
Disability Class: Cognitive Difficulty
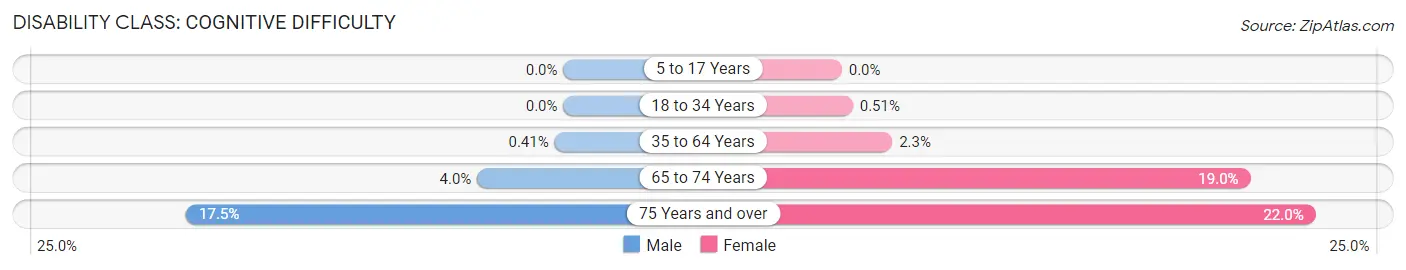
| Age Bracket | Male | Female |
| 5 to 17 Years | 0 (0.0%) | 0 (0.0%) |
| 18 to 34 Years | 0 (0.0%) | 3 (0.5%) |
| 35 to 64 Years | 6 (0.4%) | 39 (2.3%) |
| 65 to 74 Years | 15 (4.0%) | 95 (19.0%) |
| 75 Years and over | 31 (17.5%) | 100 (22.0%) |
Disability Class: Ambulatory Difficulty
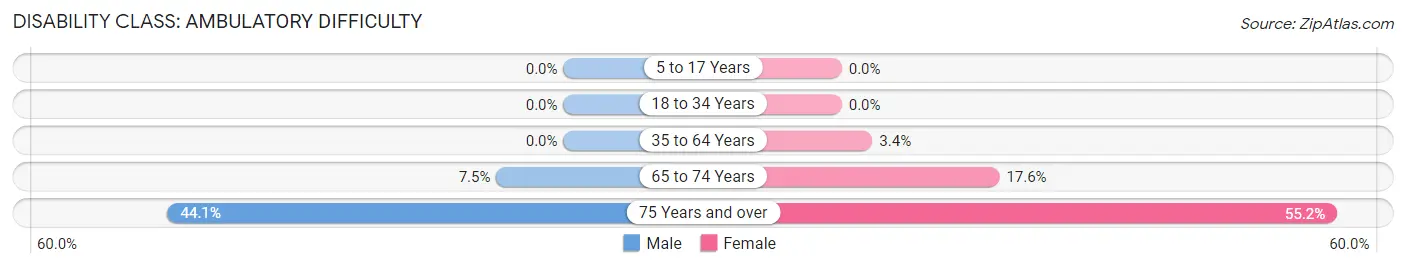
| Age Bracket | Male | Female |
| 5 to 17 Years | 0 (0.0%) | 0 (0.0%) |
| 18 to 34 Years | 0 (0.0%) | 0 (0.0%) |
| 35 to 64 Years | 0 (0.0%) | 57 (3.4%) |
| 65 to 74 Years | 28 (7.5%) | 88 (17.6%) |
| 75 Years and over | 78 (44.1%) | 251 (55.2%) |
Disability Class: Self-Care Difficulty
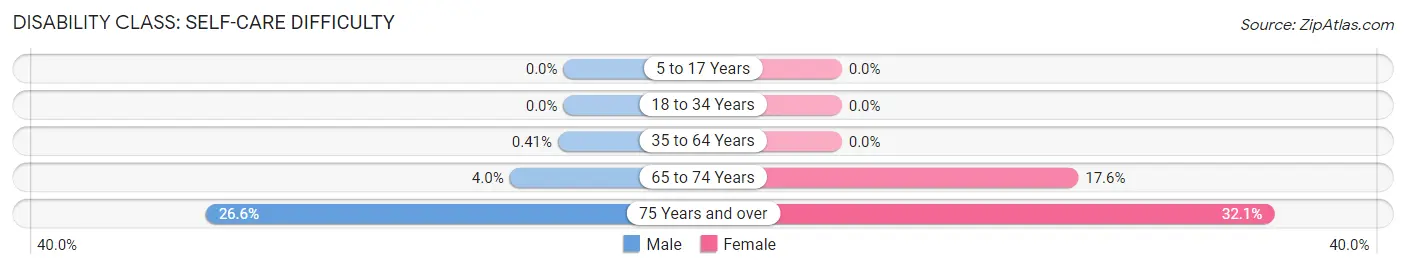
| Age Bracket | Male | Female |
| 5 to 17 Years | 0 (0.0%) | 0 (0.0%) |
| 18 to 34 Years | 0 (0.0%) | 0 (0.0%) |
| 35 to 64 Years | 6 (0.4%) | 0 (0.0%) |
| 65 to 74 Years | 15 (4.0%) | 88 (17.6%) |
| 75 Years and over | 47 (26.6%) | 146 (32.1%) |
Technology Access in Tuckahoe
Computing Device Access in Tuckahoe
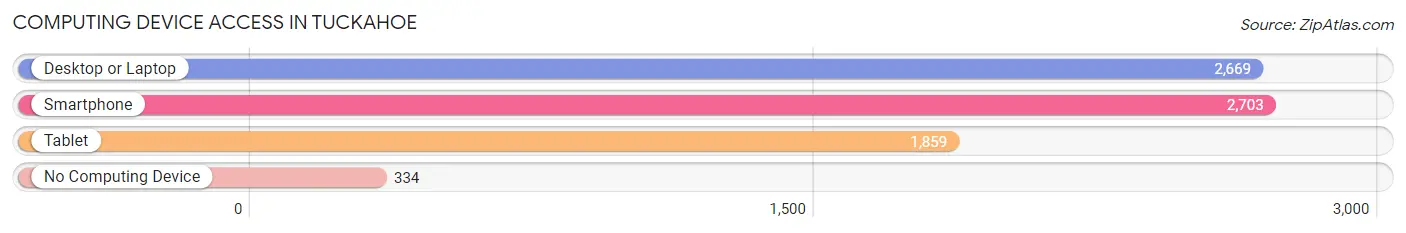
| Device Type | # Households | % Households |
| Desktop or Laptop | 2,669 | 84.1% |
| Smartphone | 2,703 | 85.2% |
| Tablet | 1,859 | 58.6% |
| No Computing Device | 334 | 10.5% |
| Total | 3,173 | 100.0% |
Internet Access in Tuckahoe
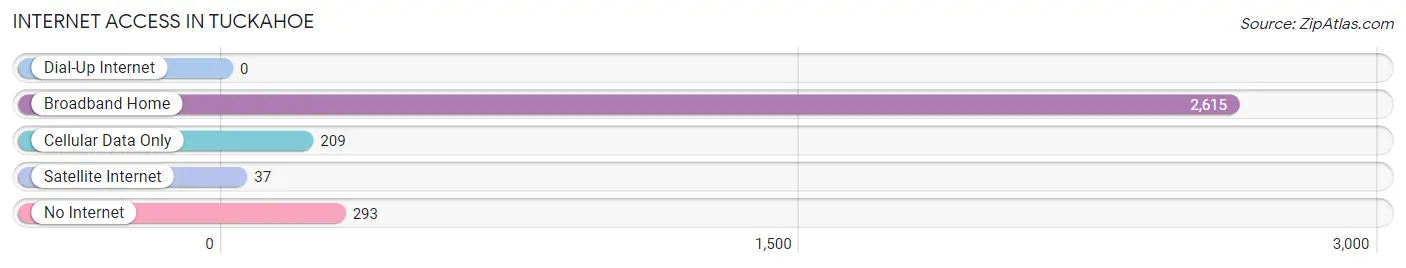
| Internet Type | # Households | % Households |
| Dial-Up Internet | 0 | 0.0% |
| Broadband Home | 2,615 | 82.4% |
| Cellular Data Only | 209 | 6.6% |
| Satellite Internet | 37 | 1.2% |
| No Internet | 293 | 9.2% |
| Total | 3,173 | 100.0% |
Tuckahoe Summary
Tuckahoe is a village located in Westchester County, New York, United States. It is situated in the town of Eastchester, and is part of the New York metropolitan area. The population was 6,486 at the 2010 census.
History
The area now known as Tuckahoe was originally inhabited by the Siwanoy Indians, a branch of the Wappinger Confederacy. The Siwanoy were a peaceful tribe, and were known for their hospitality. The name “Tuckahoe” is derived from the Siwanoy word for “it is soft”, referring to the marshy land in the area.
In 1654, the Dutch West India Company purchased the land from the Siwanoy, and the area was settled by Dutch and English colonists. The village was officially incorporated in 1788, and was named after the Siwanoy word for “it is soft”.
In the 19th century, Tuckahoe became a popular summer resort for wealthy New Yorkers. The village was home to several grand estates, including the Tuckahoe Mansion, which was built in 1845. The mansion was the home of the prominent Tuckahoe family, and is now a museum.
Geography
Tuckahoe is located in Westchester County, New York, at 40°57'N 73°48'W. It is situated in the town of Eastchester, and is part of the New York metropolitan area. The village is bordered by the Bronx River to the north, and the Hutchinson River to the south.
The village has a total area of 1.2 square miles, all of which is land. The terrain is mostly flat, with some hills in the northern part of the village.
Economy
The economy of Tuckahoe is largely based on retail and services. The village is home to several small businesses, including restaurants, shops, and professional services. The village is also home to several corporate offices, including those of the Tuckahoe School District and the Tuckahoe Public Library.
Demographics
As of the 2010 census, the population of Tuckahoe was 6,486. The racial makeup of the village was 79.2% White, 11.2% African American, 0.3% Native American, 4.2% Asian, and 4.9% from other races. Hispanic or Latino of any race were 11.7% of the population.
The median household income in Tuckahoe was $76,945, and the median family income was $90,917. The per capita income was $37,945. About 4.2% of families and 5.7% of the population were below the poverty line.
The village is served by the Tuckahoe School District, which consists of four elementary schools, one middle school, and one high school. The village is also home to several private schools, including the Tuckahoe Montessori School and the Tuckahoe Academy.
Common Questions
What is Per Capita Income in Tuckahoe?
Per Capita income in Tuckahoe is $75,120.
What is the Median Family Income in Tuckahoe?
Median Family Income in Tuckahoe is $160,618.
What is the Median Household income in Tuckahoe?
Median Household Income in Tuckahoe is $108,683.
What is Income or Wage Gap in Tuckahoe?
Income or Wage Gap in Tuckahoe is 28.6%.
Women in Tuckahoe earn 71.4 cents for every dollar earned by a man.
What is Inequality or Gini Index in Tuckahoe?
Inequality or Gini Index in Tuckahoe is 0.54.
What is the Total Population of Tuckahoe?
Total Population of Tuckahoe is 6,995.
What is the Total Male Population of Tuckahoe?
Total Male Population of Tuckahoe is 3,161.
What is the Total Female Population of Tuckahoe?
Total Female Population of Tuckahoe is 3,834.
What is the Ratio of Males per 100 Females in Tuckahoe?
There are 82.45 Males per 100 Females in Tuckahoe.
What is the Ratio of Females per 100 Males in Tuckahoe?
There are 121.29 Females per 100 Males in Tuckahoe.
What is the Median Population Age in Tuckahoe?
Median Population Age in Tuckahoe is 45.7 Years.
What is the Average Family Size in Tuckahoe
Average Family Size in Tuckahoe is 3.1 People.
What is the Average Household Size in Tuckahoe
Average Household Size in Tuckahoe is 2.2 People.
How Large is the Labor Force in Tuckahoe?
There are 3,919 People in the Labor Forcein in Tuckahoe.
What is the Percentage of People in the Labor Force in Tuckahoe?
65.7% of People are in the Labor Force in Tuckahoe.
What is the Unemployment Rate in Tuckahoe?
Unemployment Rate in Tuckahoe is 2.2%.