Wake Forest, NC Map & Demographics
Wake Forest Map
Wake Forest Overview
$47,191
PER CAPITA INCOME
$125,556
AVG FAMILY INCOME
$115,159
AVG HOUSEHOLD INCOME
23.6%
WAGE / INCOME GAP [ % ]
76.4¢/ $1
WAGE / INCOME GAP [ $ ]
0.38
INEQUALITY / GINI INDEX
48,047
TOTAL POPULATION
23,215
MALE POPULATION
24,832
FEMALE POPULATION
93.49
MALES / 100 FEMALES
106.97
FEMALES / 100 MALES
39.0
MEDIAN AGE
3.2
AVG FAMILY SIZE
2.8
AVG HOUSEHOLD SIZE
25,524
LABOR FORCE [ PEOPLE ]
70.1%
PERCENT IN LABOR FORCE
4.3%
UNEMPLOYMENT RATE
Wake Forest Zip Codes
Wake Forest Area Codes
Income in Wake Forest
Income Overview in Wake Forest
Per Capita Income in Wake Forest is $47,191, while median incomes of families and households are $125,556 and $115,159 respectively.
| Characteristic | Number | Measure |
| Per Capita Income | 48,047 | $47,191 |
| Median Family Income | 13,000 | $125,556 |
| Mean Family Income | 13,000 | $145,936 |
| Median Household Income | 16,811 | $115,159 |
| Mean Household Income | 16,811 | $132,350 |
| Income Deficit | 13,000 | $0 |
| Wage / Income Gap (%) | 48,047 | 23.57% |
| Wage / Income Gap ($) | 48,047 | 76.43¢ per $1 |
| Gini / Inequality Index | 48,047 | 0.38 |
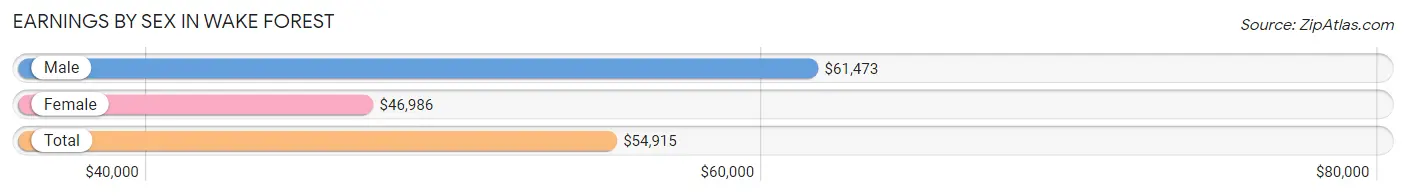
Earnings by Sex in Wake Forest
Average Earnings in Wake Forest are $54,915, $61,473 for men and $46,986 for women, a difference of 23.6%.
| Sex | Number | Average Earnings |
| Male | 14,366 (53.8%) | $61,473 |
| Female | 12,331 (46.2%) | $46,986 |
| Total | 26,697 (100.0%) | $54,915 |
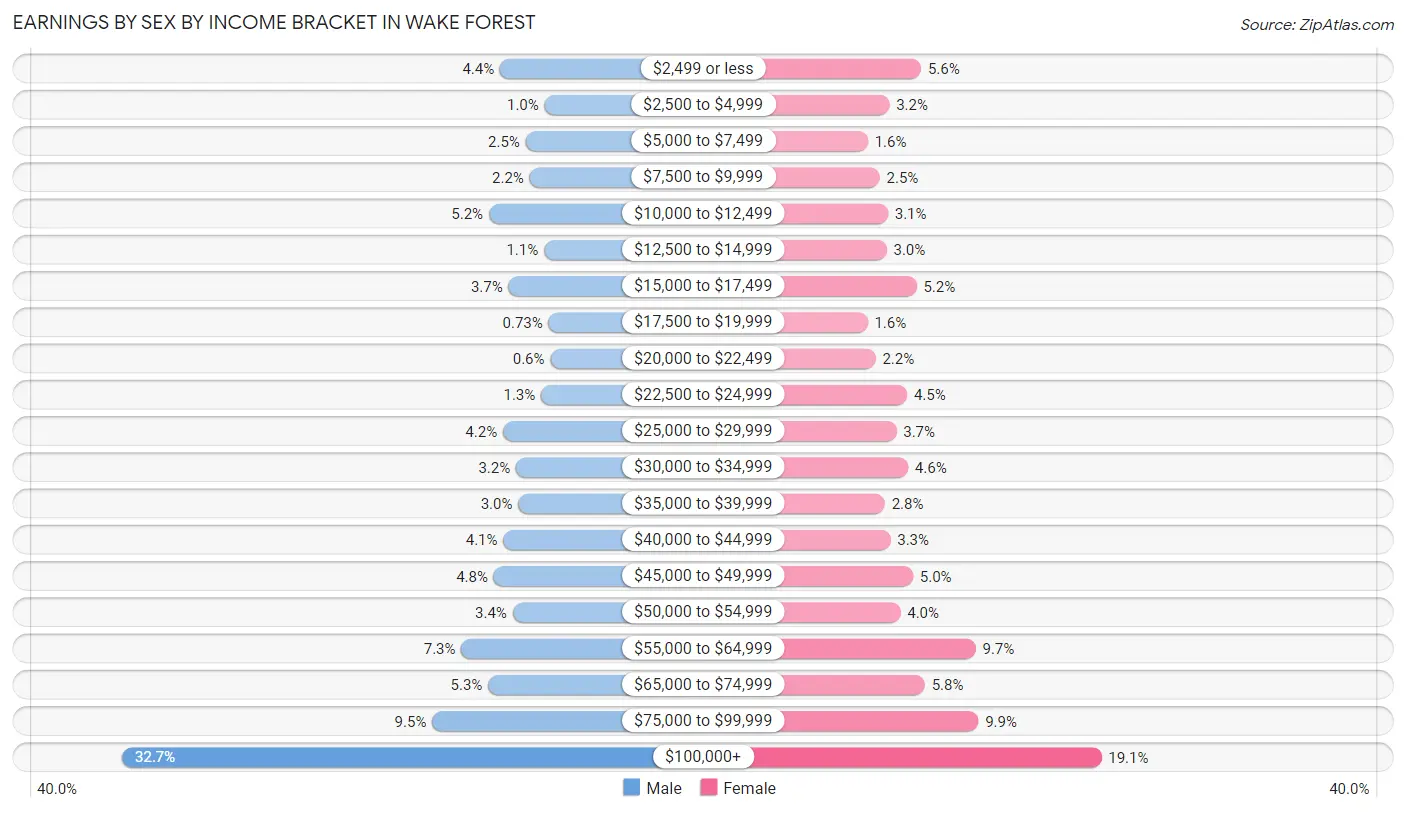
Earnings by Sex by Income Bracket in Wake Forest
The most common earnings brackets in Wake Forest are $100,000+ for men (4,699 | 32.7%) and $100,000+ for women (2,352 | 19.1%).
| Income | Male | Female |
| $2,499 or less | 628 (4.4%) | 686 (5.6%) |
| $2,500 to $4,999 | 148 (1.0%) | 392 (3.2%) |
| $5,000 to $7,499 | 352 (2.5%) | 194 (1.6%) |
| $7,500 to $9,999 | 309 (2.1%) | 303 (2.5%) |
| $10,000 to $12,499 | 747 (5.2%) | 378 (3.1%) |
| $12,500 to $14,999 | 153 (1.1%) | 367 (3.0%) |
| $15,000 to $17,499 | 536 (3.7%) | 644 (5.2%) |
| $17,500 to $19,999 | 105 (0.7%) | 191 (1.5%) |
| $20,000 to $22,499 | 86 (0.6%) | 265 (2.1%) |
| $22,500 to $24,999 | 185 (1.3%) | 556 (4.5%) |
| $25,000 to $29,999 | 596 (4.2%) | 457 (3.7%) |
| $30,000 to $34,999 | 456 (3.2%) | 565 (4.6%) |
| $35,000 to $39,999 | 431 (3.0%) | 350 (2.8%) |
| $40,000 to $44,999 | 592 (4.1%) | 402 (3.3%) |
| $45,000 to $49,999 | 696 (4.8%) | 610 (5.0%) |
| $50,000 to $54,999 | 491 (3.4%) | 494 (4.0%) |
| $55,000 to $64,999 | 1,044 (7.3%) | 1,190 (9.7%) |
| $65,000 to $74,999 | 755 (5.3%) | 720 (5.8%) |
| $75,000 to $99,999 | 1,357 (9.5%) | 1,215 (9.9%) |
| $100,000+ | 4,699 (32.7%) | 2,352 (19.1%) |
| Total | 14,366 (100.0%) | 12,331 (100.0%) |
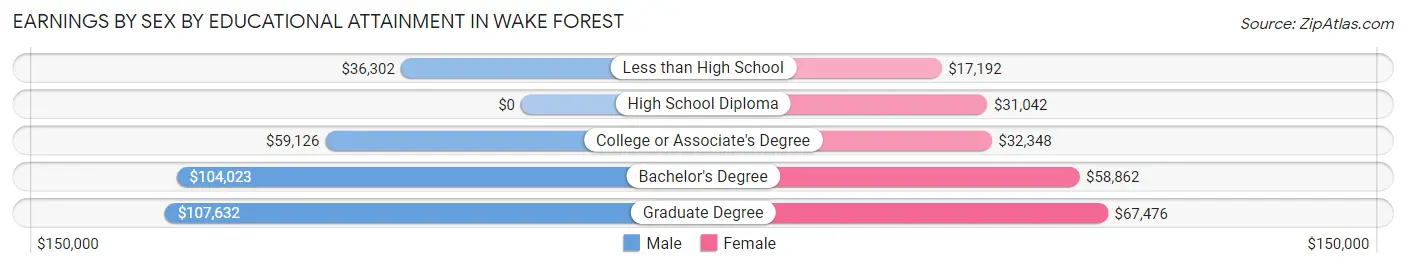
Earnings by Sex by Educational Attainment in Wake Forest
Average earnings in Wake Forest are $71,228 for men and $53,082 for women, a difference of 25.5%. Men with an educational attainment of graduate degree enjoy the highest average annual earnings of $107,632, while those with less than high school education earn the least with $36,302. Women with an educational attainment of graduate degree earn the most with the average annual earnings of $67,476, while those with less than high school education have the smallest earnings of $17,192.
| Educational Attainment | Male Income | Female Income |
| Less than High School | $36,302 | $17,192 |
| High School Diploma | - | - |
| College or Associate's Degree | $59,126 | $32,348 |
| Bachelor's Degree | $104,023 | $58,862 |
| Graduate Degree | $107,632 | $67,476 |
| Total | $71,228 | $53,082 |
Family Income in Wake Forest
Family Income Brackets in Wake Forest
According to the Wake Forest family income data, there are 3,484 families falling into the $100,000 to $149,999 income range, which is the most common income bracket and makes up 26.8% of all families. Conversely, the $10,000 to $14,999 income bracket is the least frequent group with only 52 families (0.4%) belonging to this category.
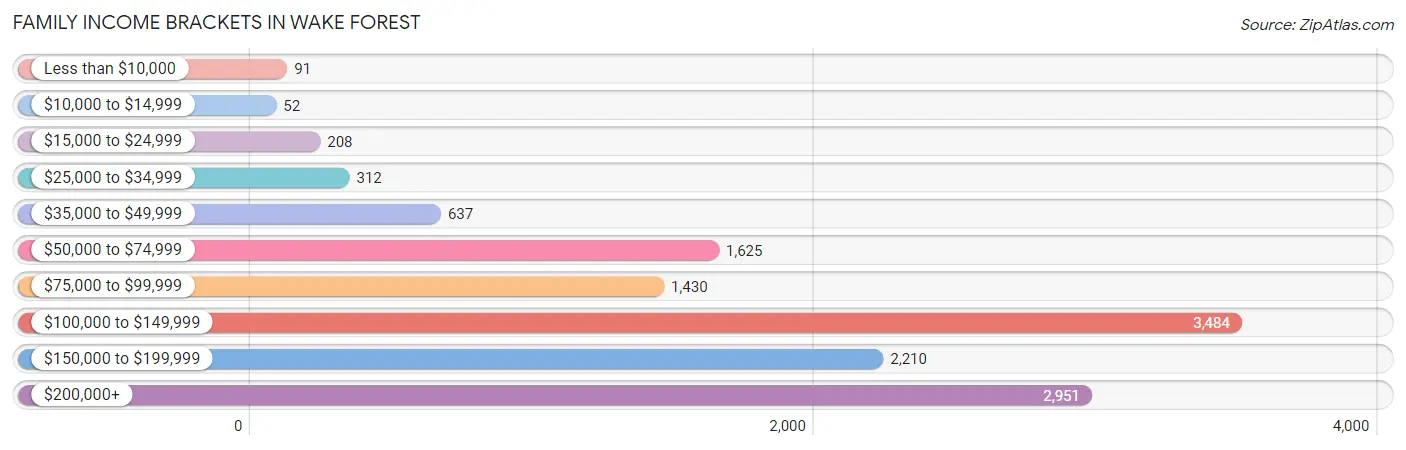
| Income Bracket | # Families | % Families |
| Less than $10,000 | 91 | 0.7% |
| $10,000 to $14,999 | 52 | 0.4% |
| $15,000 to $24,999 | 208 | 1.6% |
| $25,000 to $34,999 | 312 | 2.4% |
| $35,000 to $49,999 | 637 | 4.9% |
| $50,000 to $74,999 | 1,625 | 12.5% |
| $75,000 to $99,999 | 1,430 | 11.0% |
| $100,000 to $149,999 | 3,484 | 26.8% |
| $150,000 to $199,999 | 2,210 | 17.0% |
| $200,000+ | 2,951 | 22.7% |
Family Income by Famaliy Size in Wake Forest
5-person families (1,304 | 10.0%) account for the highest median family income in Wake Forest with $162,792 per family, while 2-person families (5,767 | 44.4%) have the highest median income of $56,719 per family member.
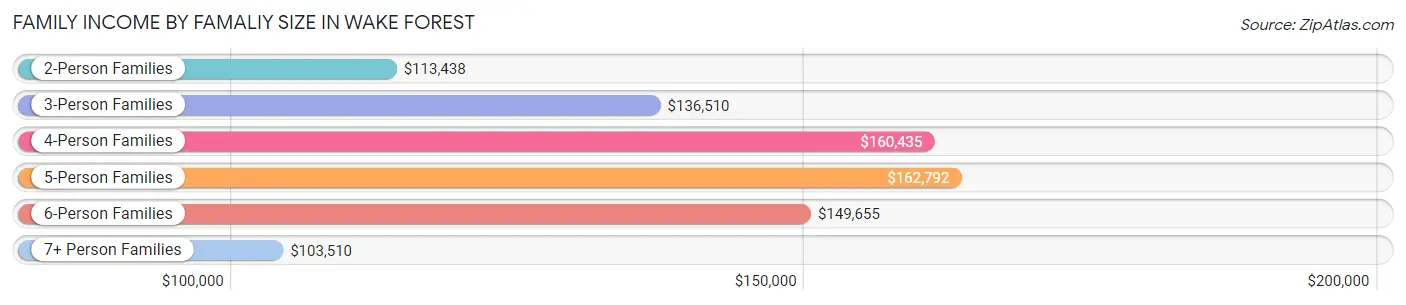
| Income Bracket | # Families | Median Income |
| 2-Person Families | 5,767 (44.4%) | $113,438 |
| 3-Person Families | 2,898 (22.3%) | $136,510 |
| 4-Person Families | 2,610 (20.1%) | $160,435 |
| 5-Person Families | 1,304 (10.0%) | $162,792 |
| 6-Person Families | 292 (2.2%) | $149,655 |
| 7+ Person Families | 129 (1.0%) | $103,510 |
| Total | 13,000 (100.0%) | $125,556 |
Family Income by Number of Earners in Wake Forest
The median family income in Wake Forest is $125,556, with families comprising 3+ earners (1,445) having the highest median family income of $173,643, while families with no earners (1,397) have the lowest median family income of $84,824, accounting for 11.1% and 10.7% of families, respectively.
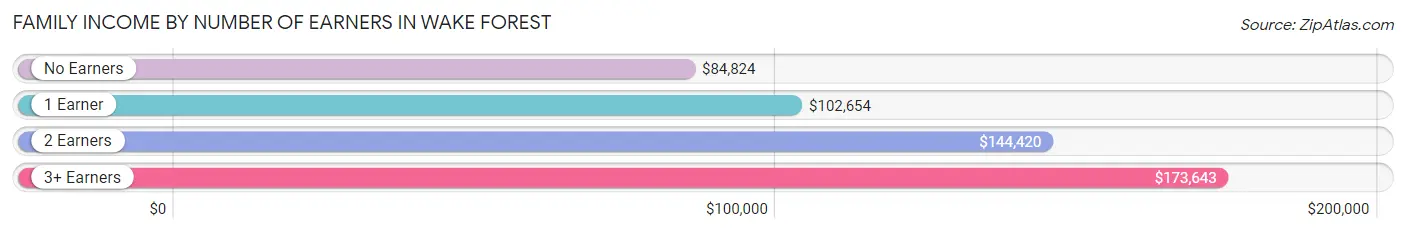
| Number of Earners | # Families | Median Income |
| No Earners | 1,397 (10.7%) | $84,824 |
| 1 Earner | 3,533 (27.2%) | $102,654 |
| 2 Earners | 6,625 (51.0%) | $144,420 |
| 3+ Earners | 1,445 (11.1%) | $173,643 |
| Total | 13,000 (100.0%) | $125,556 |
Household Income in Wake Forest
Household Income Brackets in Wake Forest
With 4,051 households falling in the category, the $100,000 to $149,999 income range is the most frequent in Wake Forest, accounting for 24.1% of all households. In contrast, only 168 households (1.0%) fall into the less than $10,000 income bracket, making it the least populous group.
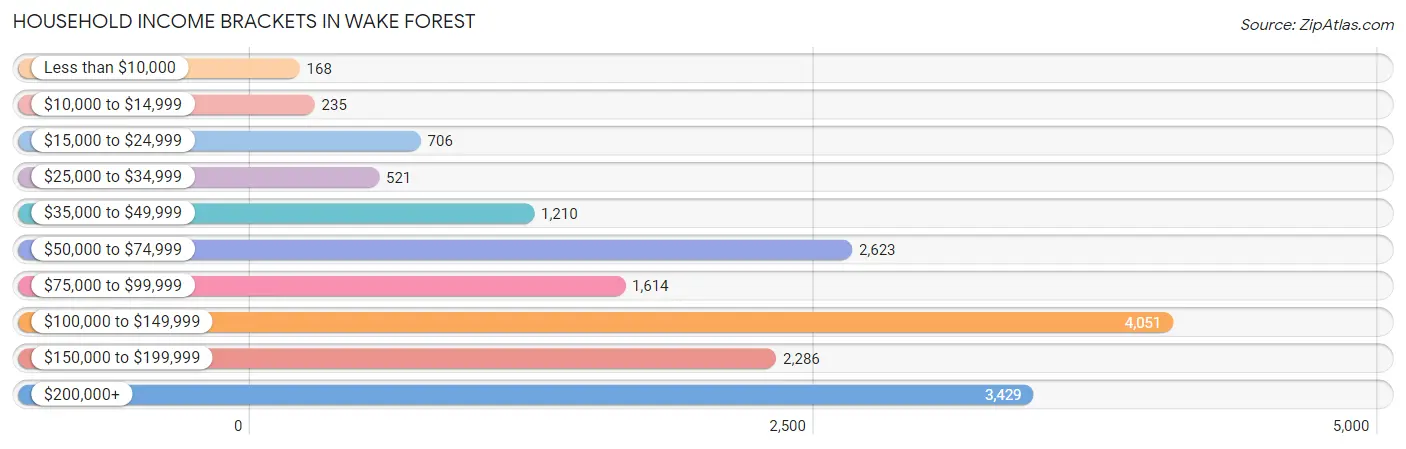
| Income Bracket | # Households | % Households |
| Less than $10,000 | 168 | 1.0% |
| $10,000 to $14,999 | 235 | 1.4% |
| $15,000 to $24,999 | 706 | 4.2% |
| $25,000 to $34,999 | 521 | 3.1% |
| $35,000 to $49,999 | 1,210 | 7.2% |
| $50,000 to $74,999 | 2,623 | 15.6% |
| $75,000 to $99,999 | 1,614 | 9.6% |
| $100,000 to $149,999 | 4,051 | 24.1% |
| $150,000 to $199,999 | 2,286 | 13.6% |
| $200,000+ | 3,429 | 20.4% |
Household Income by Householder Age in Wake Forest
The median household income in Wake Forest is $115,159, with the highest median household income of $135,040 found in the 45 to 64 years age bracket for the primary householder. A total of 7,180 households (42.7%) fall into this category. Meanwhile, the 15 to 24 years age bracket for the primary householder has the lowest median household income of $47,308, with 206 households (1.2%) in this group.
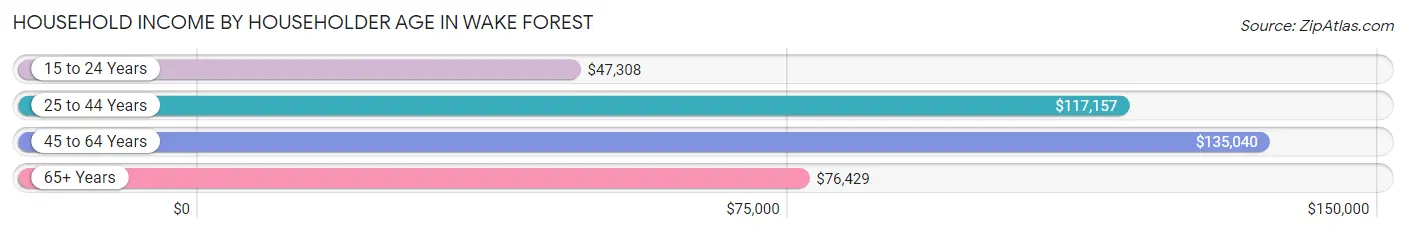
| Income Bracket | # Households | Median Income |
| 15 to 24 Years | 206 (1.2%) | $47,308 |
| 25 to 44 Years | 5,717 (34.0%) | $117,157 |
| 45 to 64 Years | 7,180 (42.7%) | $135,040 |
| 65+ Years | 3,708 (22.1%) | $76,429 |
| Total | 16,811 (100.0%) | $115,159 |
Poverty in Wake Forest
Income Below Poverty by Sex and Age in Wake Forest
With 2.9% poverty level for males and 3.2% for females among the residents of Wake Forest, 18 to 24 year old males and 75 year old and over females are the most vulnerable to poverty, with 131 males (8.5%) and 89 females (5.7%) in their respective age groups living below the poverty level.
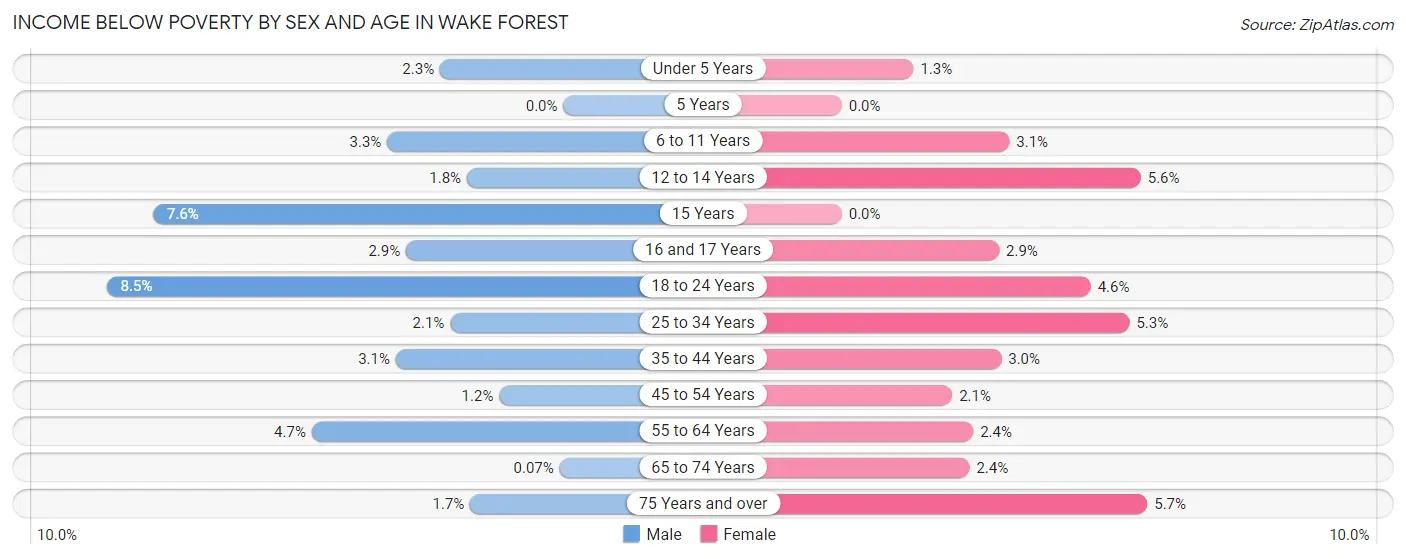
| Age Bracket | Male | Female |
| Under 5 Years | 38 (2.3%) | 24 (1.3%) |
| 5 Years | 0 (0.0%) | 0 (0.0%) |
| 6 to 11 Years | 54 (3.3%) | 73 (3.1%) |
| 12 to 14 Years | 24 (1.8%) | 66 (5.6%) |
| 15 Years | 40 (7.6%) | 0 (0.0%) |
| 16 and 17 Years | 24 (2.9%) | 20 (2.9%) |
| 18 to 24 Years | 131 (8.5%) | 51 (4.6%) |
| 25 to 34 Years | 54 (2.1%) | 151 (5.3%) |
| 35 to 44 Years | 123 (3.1%) | 103 (3.0%) |
| 45 to 54 Years | 44 (1.2%) | 90 (2.1%) |
| 55 to 64 Years | 108 (4.7%) | 60 (2.4%) |
| 65 to 74 Years | 1 (0.1%) | 44 (2.4%) |
| 75 Years and over | 17 (1.7%) | 89 (5.7%) |
| Total | 658 (2.9%) | 771 (3.2%) |
Income Above Poverty by Sex and Age in Wake Forest
According to the poverty statistics in Wake Forest, males aged 5 years and females aged 5 years are the age groups that are most secure financially, with 100.0% of males and 100.0% of females in these age groups living above the poverty line.
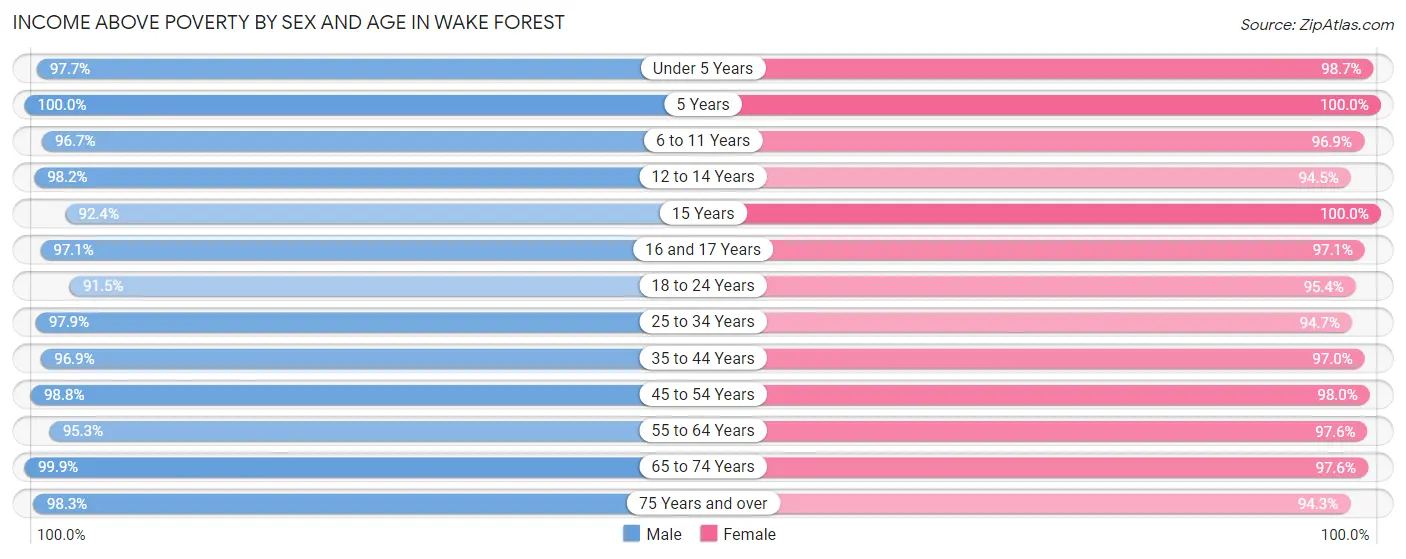
| Age Bracket | Male | Female |
| Under 5 Years | 1,621 (97.7%) | 1,778 (98.7%) |
| 5 Years | 330 (100.0%) | 172 (100.0%) |
| 6 to 11 Years | 1,596 (96.7%) | 2,276 (96.9%) |
| 12 to 14 Years | 1,320 (98.2%) | 1,124 (94.5%) |
| 15 Years | 486 (92.4%) | 501 (100.0%) |
| 16 and 17 Years | 798 (97.1%) | 664 (97.1%) |
| 18 to 24 Years | 1,418 (91.5%) | 1,052 (95.4%) |
| 25 to 34 Years | 2,514 (97.9%) | 2,679 (94.7%) |
| 35 to 44 Years | 3,836 (96.9%) | 3,380 (97.0%) |
| 45 to 54 Years | 3,649 (98.8%) | 4,300 (98.0%) |
| 55 to 64 Years | 2,204 (95.3%) | 2,397 (97.6%) |
| 65 to 74 Years | 1,523 (99.9%) | 1,815 (97.6%) |
| 75 Years and over | 965 (98.3%) | 1,482 (94.3%) |
| Total | 22,260 (97.1%) | 23,620 (96.8%) |
Income Below Poverty Among Married-Couple Families in Wake Forest
The poverty statistics for married-couple families in Wake Forest show that 1.2% or 126 of the total 10,318 families live below the poverty line. Families with 3 or 4 children have the highest poverty rate of 2.9%, comprising of 28 families. On the other hand, families with 5 or more children have the lowest poverty rate of 0.0%, which includes 0 families.
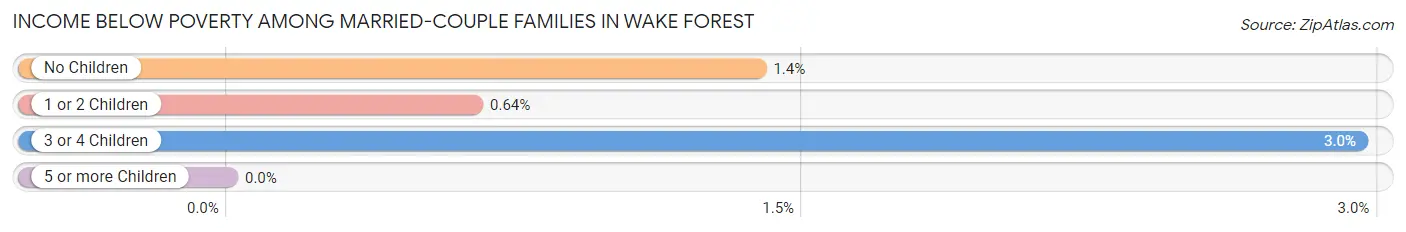
| Children | Above Poverty | Below Poverty |
| No Children | 5,162 (98.6%) | 72 (1.4%) |
| 1 or 2 Children | 4,060 (99.4%) | 26 (0.6%) |
| 3 or 4 Children | 920 (97.1%) | 28 (2.9%) |
| 5 or more Children | 50 (100.0%) | 0 (0.0%) |
| Total | 10,192 (98.8%) | 126 (1.2%) |
Income Below Poverty Among Single-Parent Households in Wake Forest
According to the poverty data in Wake Forest, 1.5% or 9 single-father households and 4.5% or 94 single-mother households are living below the poverty line. Among single-father households, those with no children have the highest poverty rate, with 9 households (5.1%) experiencing poverty. Likewise, among single-mother households, those with 3 or 4 children have the highest poverty rate, with 20 households (13.3%) falling below the poverty line.
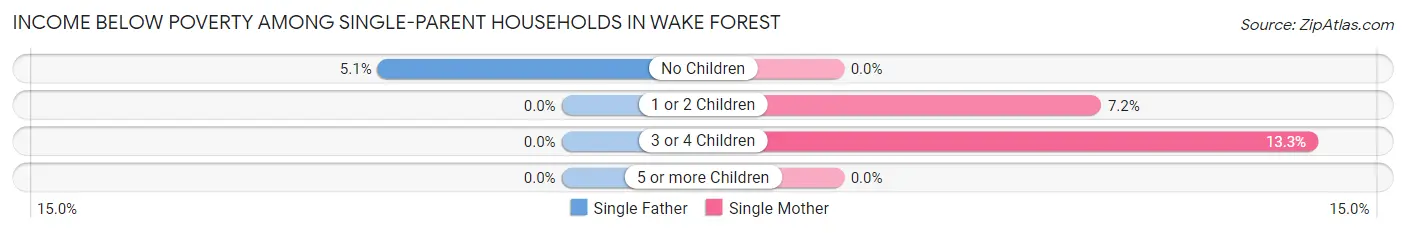
| Children | Single Father | Single Mother |
| No Children | 9 (5.1%) | 0 (0.0%) |
| 1 or 2 Children | 0 (0.0%) | 74 (7.2%) |
| 3 or 4 Children | 0 (0.0%) | 20 (13.3%) |
| 5 or more Children | 0 (0.0%) | 0 (0.0%) |
| Total | 9 (1.5%) | 94 (4.5%) |
Income Below Poverty Among Married-Couple vs Single-Parent Households in Wake Forest
The poverty data for Wake Forest shows that 126 of the married-couple family households (1.2%) and 103 of the single-parent households (3.8%) are living below the poverty level. Within the married-couple family households, those with 3 or 4 children have the highest poverty rate, with 28 households (2.9%) falling below the poverty line. Among the single-parent households, those with 3 or 4 children have the highest poverty rate, with 20 household (9.6%) living below poverty.
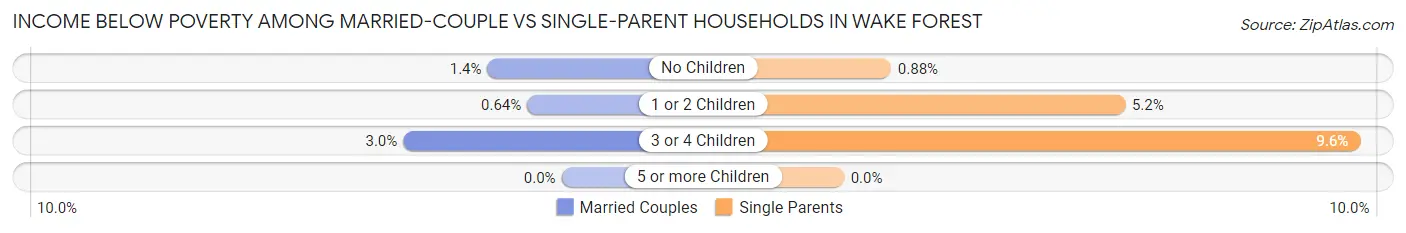
| Children | Married-Couple Families | Single-Parent Households |
| No Children | 72 (1.4%) | 9 (0.9%) |
| 1 or 2 Children | 26 (0.6%) | 74 (5.2%) |
| 3 or 4 Children | 28 (2.9%) | 20 (9.6%) |
| 5 or more Children | 0 (0.0%) | 0 (0.0%) |
| Total | 126 (1.2%) | 103 (3.8%) |
Race in Wake Forest
The most populous races in Wake Forest are White / Caucasian (33,379 | 69.5%), Black / African American (8,647 | 18.0%), and Hispanic or Latino (3,781 | 7.9%).
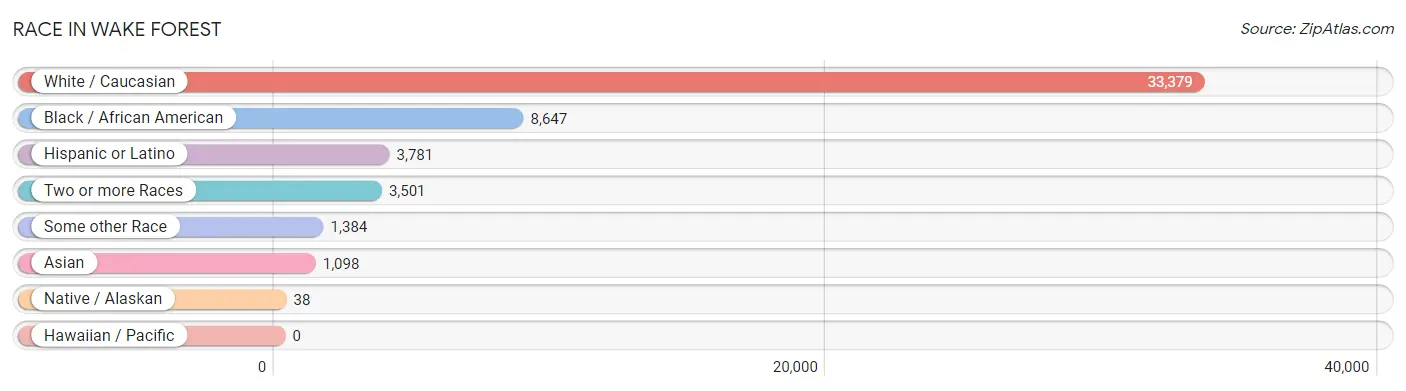
| Race | # Population | % Population |
| Asian | 1,098 | 2.3% |
| Black / African American | 8,647 | 18.0% |
| Hawaiian / Pacific | 0 | 0.0% |
| Hispanic or Latino | 3,781 | 7.9% |
| Native / Alaskan | 38 | 0.1% |
| White / Caucasian | 33,379 | 69.5% |
| Two or more Races | 3,501 | 7.3% |
| Some other Race | 1,384 | 2.9% |
| Total | 48,047 | 100.0% |
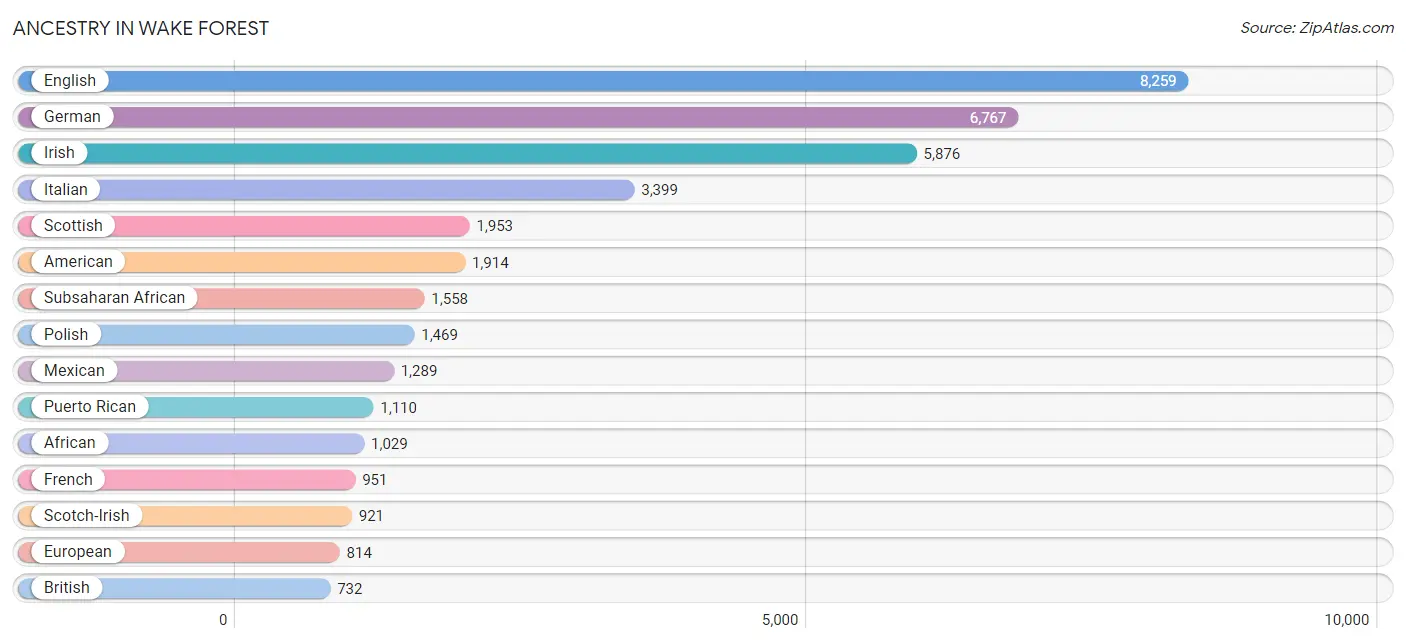
Ancestry in Wake Forest
The most populous ancestries reported in Wake Forest are English (8,259 | 17.2%), German (6,767 | 14.1%), Irish (5,876 | 12.2%), Italian (3,399 | 7.1%), and Scottish (1,953 | 4.1%), together accounting for 54.6% of all Wake Forest residents.
| Ancestry | # Population | % Population |
| African | 1,029 | 2.1% |
| American | 1,914 | 4.0% |
| Arab | 148 | 0.3% |
| Argentinean | 10 | 0.0% |
| Armenian | 14 | 0.0% |
| Australian | 10 | 0.0% |
| Austrian | 146 | 0.3% |
| Belgian | 13 | 0.0% |
| Bhutanese | 196 | 0.4% |
| Brazilian | 28 | 0.1% |
| British | 732 | 1.5% |
| Burmese | 310 | 0.6% |
| Canadian | 107 | 0.2% |
| Celtic | 12 | 0.0% |
| Central American | 270 | 0.6% |
| Central American Indian | 40 | 0.1% |
| Cherokee | 116 | 0.2% |
| Chippewa | 11 | 0.0% |
| Colombian | 349 | 0.7% |
| Costa Rican | 11 | 0.0% |
| Croatian | 53 | 0.1% |
| Cuban | 309 | 0.6% |
| Czech | 211 | 0.4% |
| Czechoslovakian | 71 | 0.2% |
| Danish | 84 | 0.2% |
| Dominican | 146 | 0.3% |
| Dutch | 405 | 0.8% |
| Eastern European | 132 | 0.3% |
| Egyptian | 17 | 0.0% |
| English | 8,259 | 17.2% |
| Ethiopian | 9 | 0.0% |
| European | 814 | 1.7% |
| Finnish | 65 | 0.1% |
| French | 951 | 2.0% |
| French Canadian | 112 | 0.2% |
| German | 6,767 | 14.1% |
| Greek | 266 | 0.5% |
| Haitian | 559 | 1.2% |
| Honduran | 47 | 0.1% |
| Hungarian | 257 | 0.5% |
| Indian (Asian) | 176 | 0.4% |
| Iranian | 15 | 0.0% |
| Irish | 5,876 | 12.2% |
| Iroquois | 51 | 0.1% |
| Italian | 3,399 | 7.1% |
| Jamaican | 17 | 0.0% |
| Japanese | 86 | 0.2% |
| Jordanian | 81 | 0.2% |
| Kenyan | 181 | 0.4% |
| Korean | 298 | 0.6% |
| Laotian | 27 | 0.1% |
| Lebanese | 42 | 0.1% |
| Lithuanian | 73 | 0.2% |
| Lumbee | 18 | 0.0% |
| Mexican | 1,289 | 2.7% |
| Nicaraguan | 46 | 0.1% |
| Nigerian | 140 | 0.3% |
| Northern European | 36 | 0.1% |
| Norwegian | 414 | 0.9% |
| Pakistani | 127 | 0.3% |
| Pennsylvania German | 23 | 0.1% |
| Peruvian | 3 | 0.0% |
| Polish | 1,469 | 3.1% |
| Portuguese | 91 | 0.2% |
| Puerto Rican | 1,110 | 2.3% |
| Russian | 392 | 0.8% |
| Salvadoran | 166 | 0.4% |
| Scandinavian | 191 | 0.4% |
| Scotch-Irish | 921 | 1.9% |
| Scottish | 1,953 | 4.1% |
| Serbian | 19 | 0.0% |
| Slavic | 19 | 0.0% |
| Slovak | 159 | 0.3% |
| Slovene | 19 | 0.0% |
| South African | 117 | 0.2% |
| South American | 362 | 0.7% |
| Spaniard | 35 | 0.1% |
| Spanish | 20 | 0.0% |
| Sri Lankan | 101 | 0.2% |
| Subsaharan African | 1,558 | 3.2% |
| Swedish | 424 | 0.9% |
| Swiss | 65 | 0.1% |
| Thai | 423 | 0.9% |
| Ukrainian | 555 | 1.2% |
| Welsh | 362 | 0.7% |
| West Indian | 81 | 0.2% |
| Yugoslavian | 25 | 0.1% |
| Zimbabwean | 82 | 0.2% | View All 88 Rows |
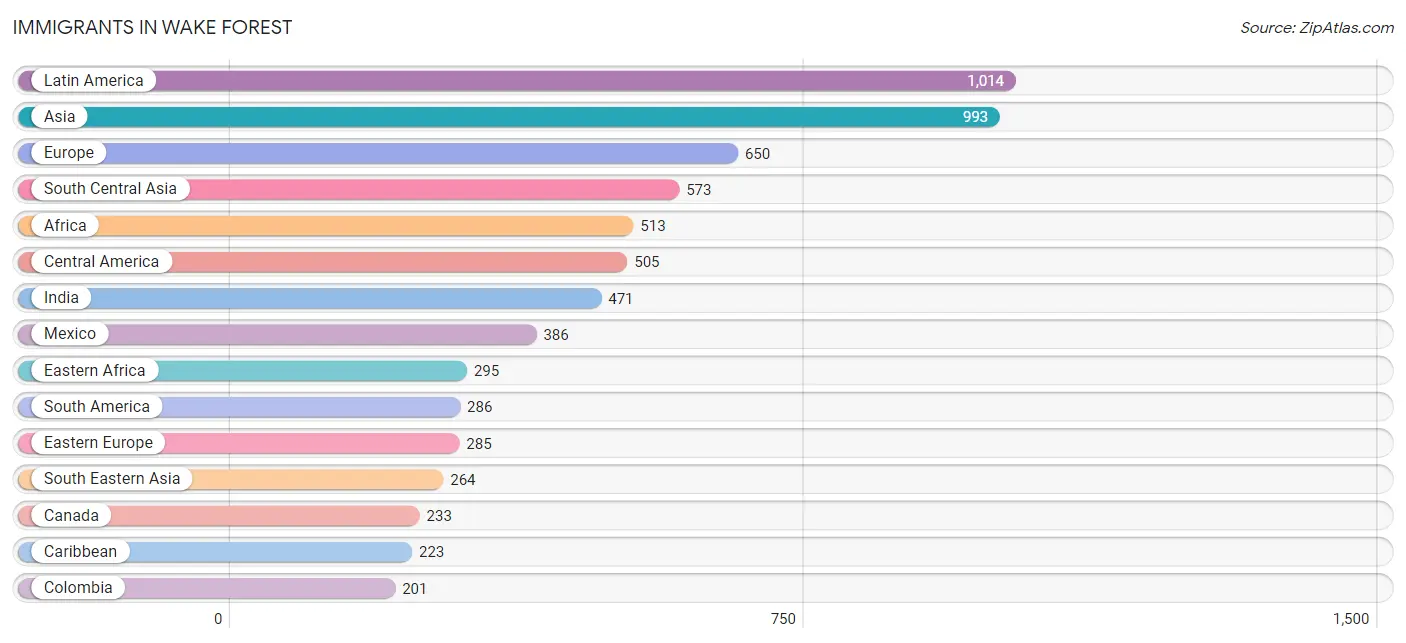
Immigrants in Wake Forest
The most numerous immigrant groups reported in Wake Forest came from Latin America (1,014 | 2.1%), Asia (993 | 2.1%), Europe (650 | 1.3%), South Central Asia (573 | 1.2%), and Africa (513 | 1.1%), together accounting for 7.8% of all Wake Forest residents.
| Immigration Origin | # Population | % Population |
| Africa | 513 | 1.1% |
| Albania | 7 | 0.0% |
| Argentina | 10 | 0.0% |
| Asia | 993 | 2.1% |
| Brazil | 10 | 0.0% |
| Canada | 233 | 0.5% |
| Caribbean | 223 | 0.5% |
| Central America | 505 | 1.1% |
| China | 27 | 0.1% |
| Colombia | 201 | 0.4% |
| Cuba | 88 | 0.2% |
| Dominican Republic | 94 | 0.2% |
| Eastern Africa | 295 | 0.6% |
| Eastern Asia | 102 | 0.2% |
| Eastern Europe | 285 | 0.6% |
| Egypt | 17 | 0.0% |
| El Salvador | 66 | 0.1% |
| England | 62 | 0.1% |
| Ethiopia | 9 | 0.0% |
| Europe | 650 | 1.3% |
| France | 36 | 0.1% |
| Germany | 97 | 0.2% |
| Greece | 51 | 0.1% |
| Haiti | 24 | 0.1% |
| Hungary | 10 | 0.0% |
| India | 471 | 1.0% |
| Indonesia | 27 | 0.1% |
| Iran | 5 | 0.0% |
| Japan | 10 | 0.0% |
| Jordan | 54 | 0.1% |
| Kazakhstan | 15 | 0.0% |
| Kenya | 123 | 0.3% |
| Korea | 65 | 0.1% |
| Latin America | 1,014 | 2.1% |
| Mexico | 386 | 0.8% |
| Nepal | 82 | 0.2% |
| Netherlands | 20 | 0.0% |
| Nicaragua | 46 | 0.1% |
| Nigeria | 123 | 0.3% |
| Northern Africa | 17 | 0.0% |
| Northern Europe | 153 | 0.3% |
| Philippines | 105 | 0.2% |
| Romania | 7 | 0.0% |
| Russia | 72 | 0.2% |
| South Africa | 78 | 0.2% |
| South America | 286 | 0.6% |
| South Central Asia | 573 | 1.2% |
| South Eastern Asia | 264 | 0.5% |
| Southern Europe | 59 | 0.1% |
| Spain | 8 | 0.0% |
| Sweden | 27 | 0.1% |
| Taiwan | 16 | 0.0% |
| Thailand | 50 | 0.1% |
| Ukraine | 170 | 0.4% |
| Vietnam | 82 | 0.2% |
| Western Africa | 123 | 0.3% |
| Western Asia | 54 | 0.1% |
| Western Europe | 153 | 0.3% |
| Zimbabwe | 163 | 0.3% | View All 59 Rows |
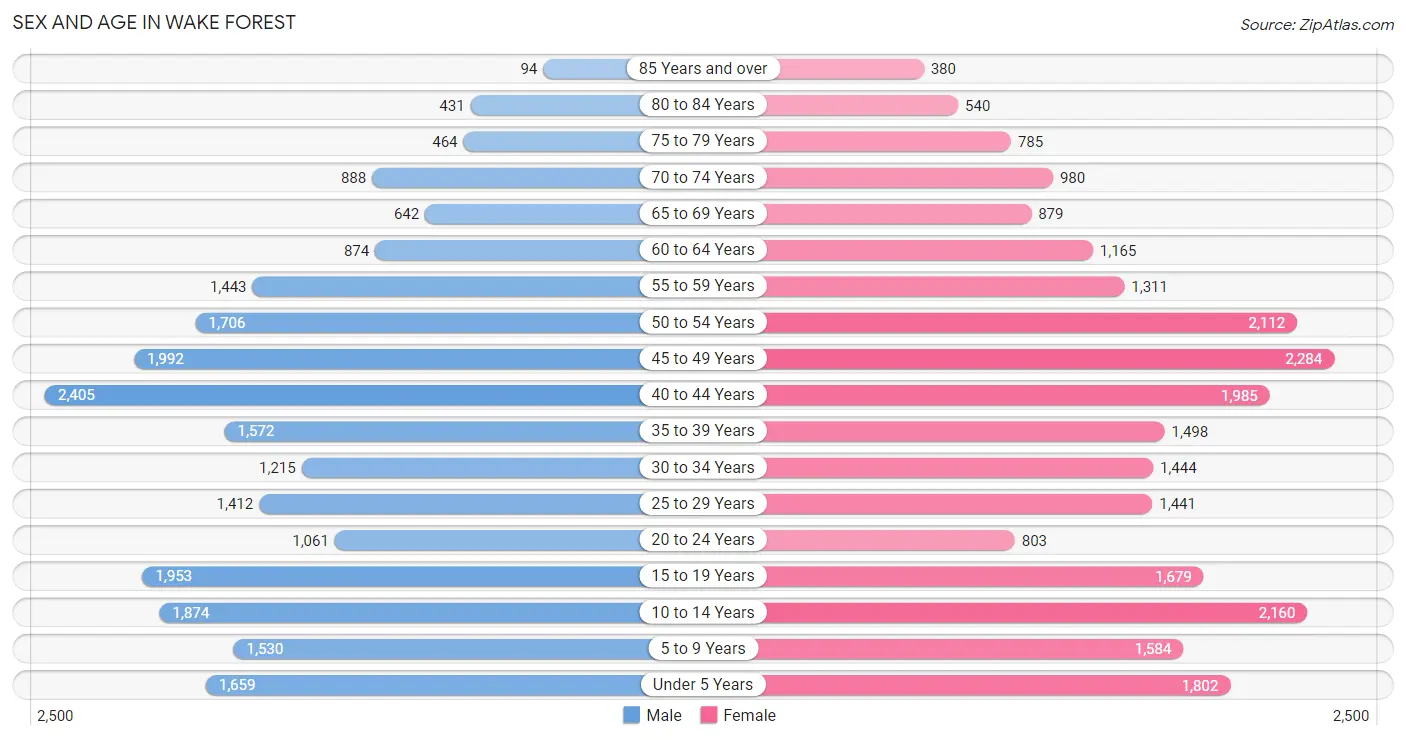
Sex and Age in Wake Forest
Sex and Age in Wake Forest
The most populous age groups in Wake Forest are 40 to 44 Years (2,405 | 10.4%) for men and 45 to 49 Years (2,284 | 9.2%) for women.
| Age Bracket | Male | Female |
| Under 5 Years | 1,659 (7.1%) | 1,802 (7.3%) |
| 5 to 9 Years | 1,530 (6.6%) | 1,584 (6.4%) |
| 10 to 14 Years | 1,874 (8.1%) | 2,160 (8.7%) |
| 15 to 19 Years | 1,953 (8.4%) | 1,679 (6.8%) |
| 20 to 24 Years | 1,061 (4.6%) | 803 (3.2%) |
| 25 to 29 Years | 1,412 (6.1%) | 1,441 (5.8%) |
| 30 to 34 Years | 1,215 (5.2%) | 1,444 (5.8%) |
| 35 to 39 Years | 1,572 (6.8%) | 1,498 (6.0%) |
| 40 to 44 Years | 2,405 (10.4%) | 1,985 (8.0%) |
| 45 to 49 Years | 1,992 (8.6%) | 2,284 (9.2%) |
| 50 to 54 Years | 1,706 (7.3%) | 2,112 (8.5%) |
| 55 to 59 Years | 1,443 (6.2%) | 1,311 (5.3%) |
| 60 to 64 Years | 874 (3.8%) | 1,165 (4.7%) |
| 65 to 69 Years | 642 (2.8%) | 879 (3.5%) |
| 70 to 74 Years | 888 (3.8%) | 980 (4.0%) |
| 75 to 79 Years | 464 (2.0%) | 785 (3.2%) |
| 80 to 84 Years | 431 (1.9%) | 540 (2.2%) |
| 85 Years and over | 94 (0.4%) | 380 (1.5%) |
| Total | 23,215 (100.0%) | 24,832 (100.0%) |
Families and Households in Wake Forest
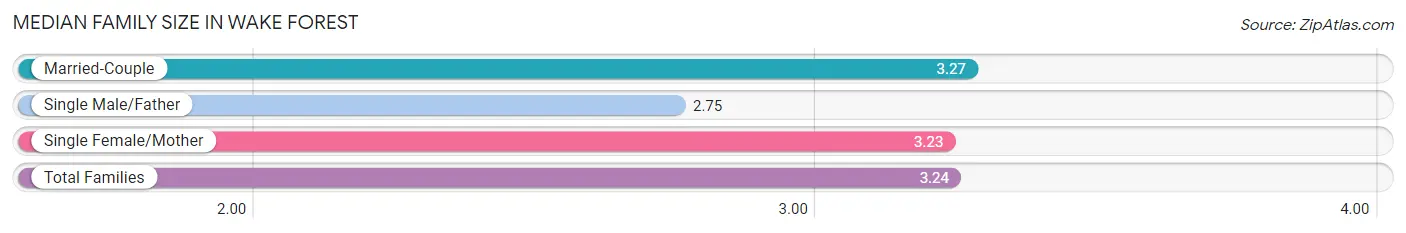
Median Family Size in Wake Forest
The median family size in Wake Forest is 3.24 persons per family, with married-couple families (10,318 | 79.4%) accounting for the largest median family size of 3.27 persons per family. On the other hand, single male/father families (614 | 4.7%) represent the smallest median family size with 2.75 persons per family.
| Family Type | # Families | Family Size |
| Married-Couple | 10,318 (79.4%) | 3.27 |
| Single Male/Father | 614 (4.7%) | 2.75 |
| Single Female/Mother | 2,068 (15.9%) | 3.23 |
| Total Families | 13,000 (100.0%) | 3.24 |
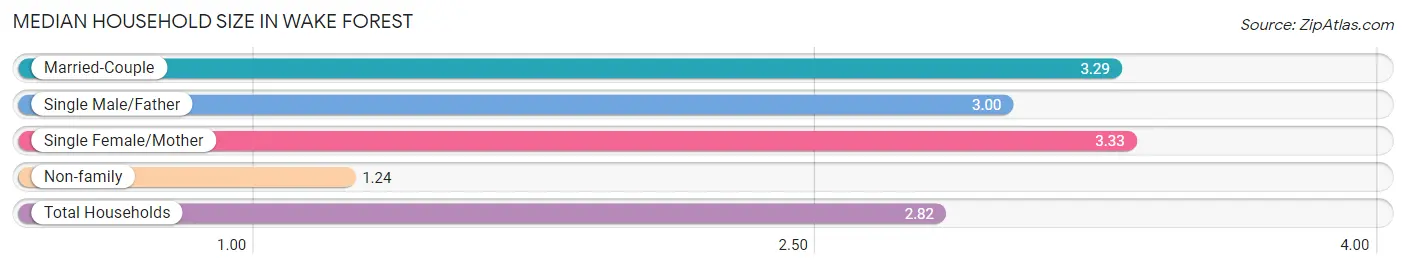
Median Household Size in Wake Forest
The median household size in Wake Forest is 2.82 persons per household, with single female/mother households (2,068 | 12.3%) accounting for the largest median household size of 3.33 persons per household. non-family households (3,811 | 22.7%) represent the smallest median household size with 1.24 persons per household.
| Household Type | # Households | Household Size |
| Married-Couple | 10,318 (61.4%) | 3.29 |
| Single Male/Father | 614 (3.6%) | 3.00 |
| Single Female/Mother | 2,068 (12.3%) | 3.33 |
| Non-family | 3,811 (22.7%) | 1.24 |
| Total Households | 16,811 (100.0%) | 2.82 |
Household Size by Marriage Status in Wake Forest
Out of a total of 16,811 households in Wake Forest, 13,000 (77.3%) are family households, while 3,811 (22.7%) are nonfamily households. The most numerous type of family households are 2-person households, comprising 5,539, and the most common type of nonfamily households are 1-person households, comprising 3,086.
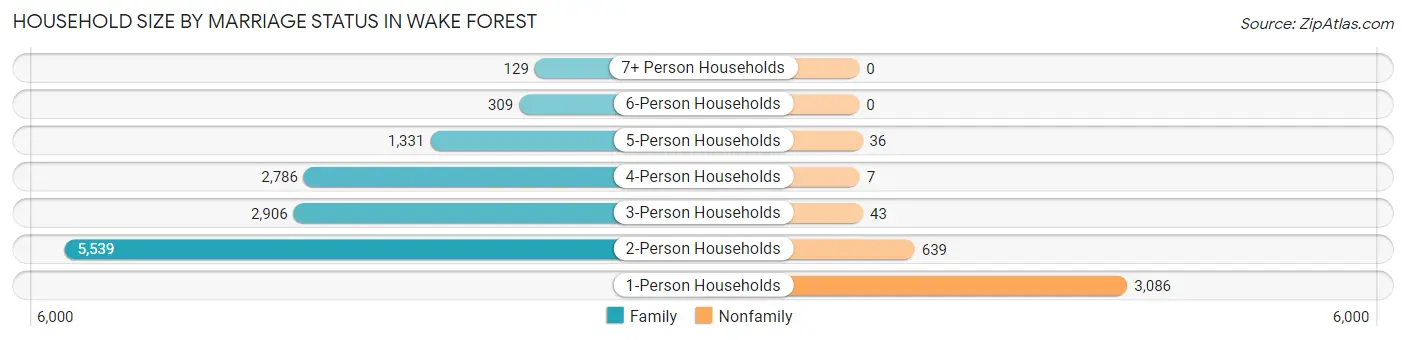
| Household Size | Family Households | Nonfamily Households |
| 1-Person Households | - | 3,086 (18.4%) |
| 2-Person Households | 5,539 (33.0%) | 639 (3.8%) |
| 3-Person Households | 2,906 (17.3%) | 43 (0.3%) |
| 4-Person Households | 2,786 (16.6%) | 7 (0.0%) |
| 5-Person Households | 1,331 (7.9%) | 36 (0.2%) |
| 6-Person Households | 309 (1.8%) | 0 (0.0%) |
| 7+ Person Households | 129 (0.8%) | 0 (0.0%) |
| Total | 13,000 (77.3%) | 3,811 (22.7%) |
Female Fertility in Wake Forest
Fertility by Age in Wake Forest
Average fertility rate in Wake Forest is 59.0 births per 1,000 women. Women in the age bracket of 20 to 34 years have the highest fertility rate with 107.0 births per 1,000 women. Women in the age bracket of 20 to 34 years acount for 56.5% of all women with births.
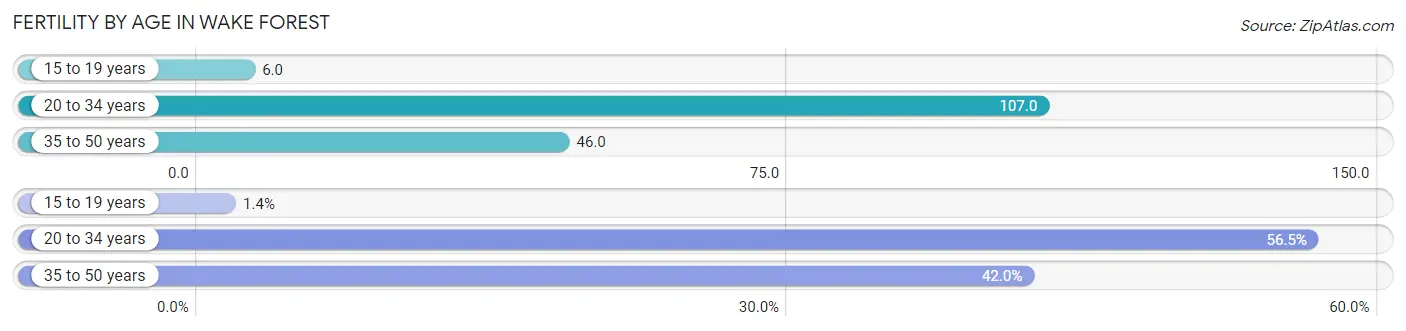
| Age Bracket | Women with Births | Births / 1,000 Women |
| 15 to 19 years | 10 (1.4%) | 6.0 |
| 20 to 34 years | 394 (56.5%) | 107.0 |
| 35 to 50 years | 293 (42.0%) | 46.0 |
| Total | 697 (100.0%) | 59.0 |
Fertility by Age by Marriage Status in Wake Forest
81.1% of women with births (697) in Wake Forest are married. The highest percentage of unmarried women with births falls into 15 to 19 years age bracket with 100.0% of them unmarried at the time of birth, while the lowest percentage of unmarried women with births belong to 35 to 50 years age bracket with 17.1% of them unmarried.
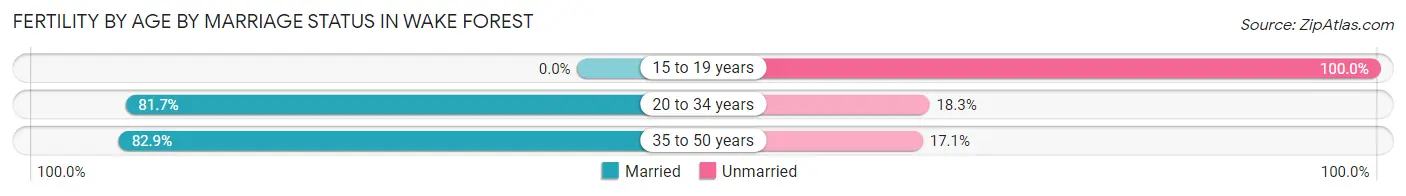
| Age Bracket | Married | Unmarried |
| 15 to 19 years | 0 (0.0%) | 10 (100.0%) |
| 20 to 34 years | 322 (81.7%) | 72 (18.3%) |
| 35 to 50 years | 243 (82.9%) | 50 (17.1%) |
| Total | 565 (81.1%) | 132 (18.9%) |
Fertility by Education in Wake Forest
Average fertility rate in Wake Forest is 59.0 births per 1,000 women. Women with the education attainment of graduate degree have the highest fertility rate of 83.0 births per 1,000 women, while women with the education attainment of less than high school have the lowest fertility at 20.0 births per 1,000 women. Women with the education attainment of bachelor's degree represent 37.7% of all women with births.
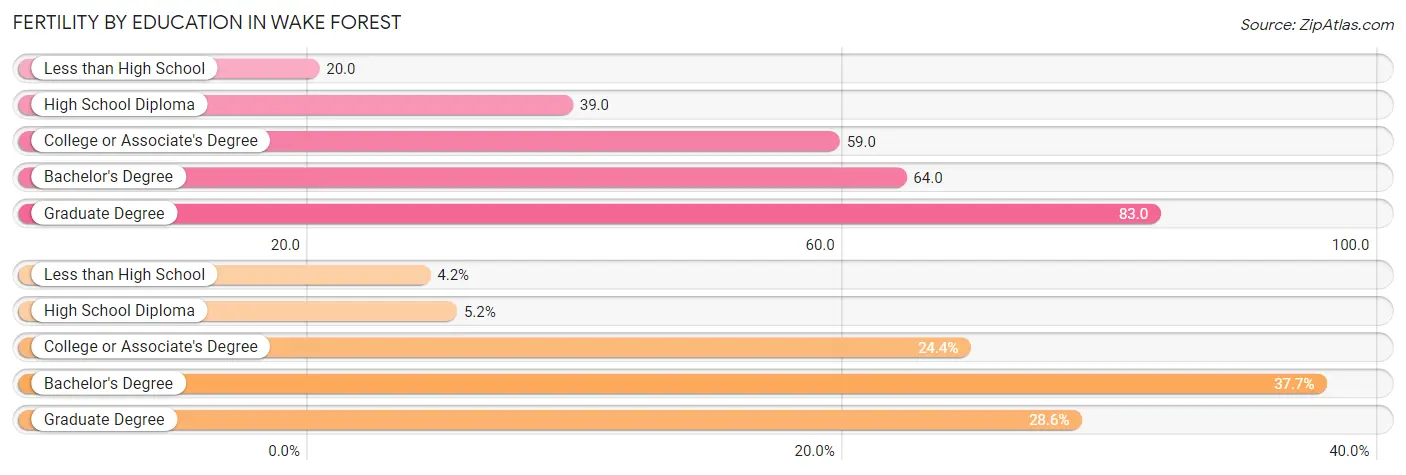
| Educational Attainment | Women with Births | Births / 1,000 Women |
| Less than High School | 29 (4.2%) | 20.0 |
| High School Diploma | 36 (5.2%) | 39.0 |
| College or Associate's Degree | 170 (24.4%) | 59.0 |
| Bachelor's Degree | 263 (37.7%) | 64.0 |
| Graduate Degree | 199 (28.5%) | 83.0 |
| Total | 697 (100.0%) | 59.0 |
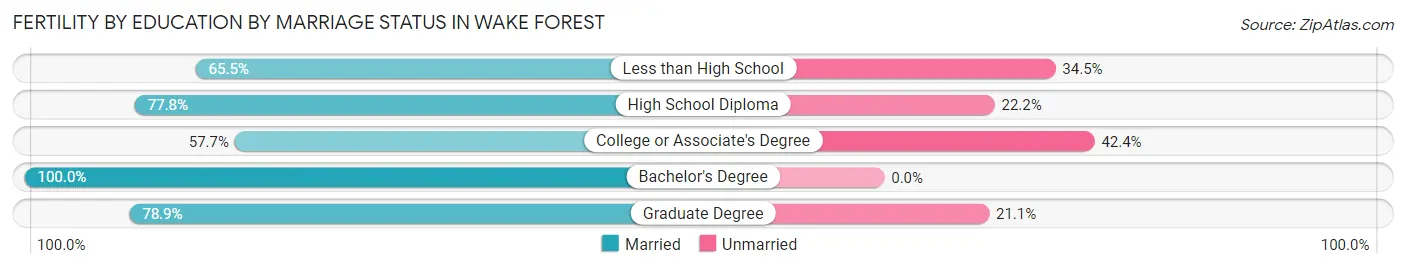
Fertility by Education by Marriage Status in Wake Forest
18.9% of women with births in Wake Forest are unmarried. Women with the educational attainment of bachelor's degree are most likely to be married with 100.0% of them married at childbirth, while women with the educational attainment of college or associate's degree are least likely to be married with 42.3% of them unmarried at childbirth.
| Educational Attainment | Married | Unmarried |
| Less than High School | 19 (65.5%) | 10 (34.5%) |
| High School Diploma | 28 (77.8%) | 8 (22.2%) |
| College or Associate's Degree | 98 (57.7%) | 72 (42.3%) |
| Bachelor's Degree | 263 (100.0%) | 0 (0.0%) |
| Graduate Degree | 157 (78.9%) | 42 (21.1%) |
| Total | 565 (81.1%) | 132 (18.9%) |
Employment Characteristics in Wake Forest
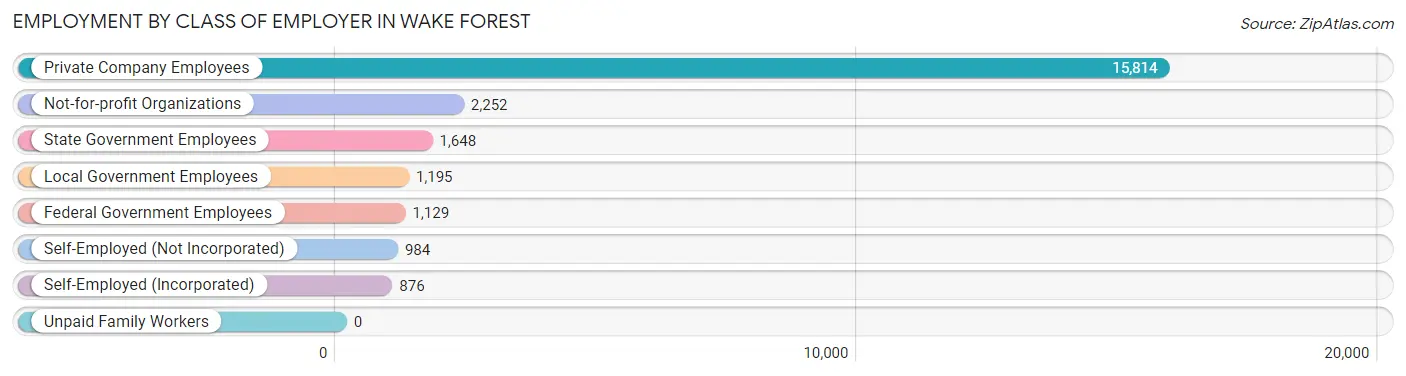
Employment by Class of Employer in Wake Forest
Among the 23,898 employed individuals in Wake Forest, private company employees (15,814 | 66.2%), not-for-profit organizations (2,252 | 9.4%), and state government employees (1,648 | 6.9%) make up the most common classes of employment.
| Employer Class | # Employees | % Employees |
| Private Company Employees | 15,814 | 66.2% |
| Self-Employed (Incorporated) | 876 | 3.7% |
| Self-Employed (Not Incorporated) | 984 | 4.1% |
| Not-for-profit Organizations | 2,252 | 9.4% |
| Local Government Employees | 1,195 | 5.0% |
| State Government Employees | 1,648 | 6.9% |
| Federal Government Employees | 1,129 | 4.7% |
| Unpaid Family Workers | 0 | 0.0% |
| Total | 23,898 | 100.0% |
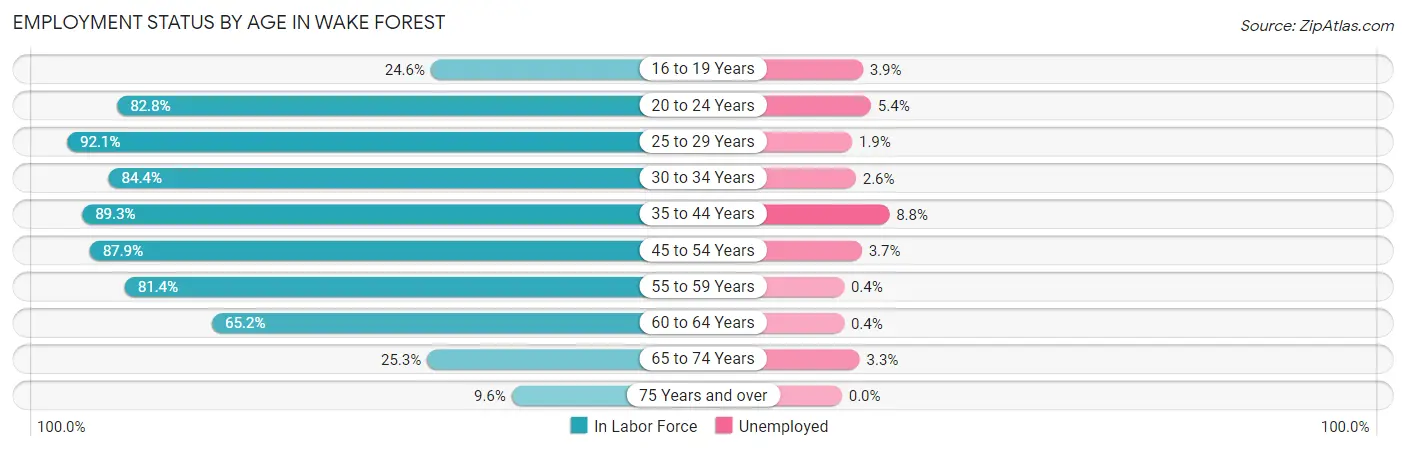
Employment Status by Age in Wake Forest
According to the labor force statistics for Wake Forest, out of the total population over 16 years of age (36,411), 70.1% or 25,524 individuals are in the labor force, with 4.3% or 1,098 of them unemployed. The age group with the highest labor force participation rate is 25 to 29 years, with 92.1% or 2,628 individuals in the labor force. Within the labor force, the 35 to 44 years age range has the highest percentage of unemployed individuals, with 8.8% or 586 of them being unemployed.
| Age Bracket | In Labor Force | Unemployed |
| 16 to 19 Years | 641 (24.6%) | 25 (3.9%) |
| 20 to 24 Years | 1,543 (82.8%) | 83 (5.4%) |
| 25 to 29 Years | 2,628 (92.1%) | 50 (1.9%) |
| 30 to 34 Years | 2,244 (84.4%) | 58 (2.6%) |
| 35 to 44 Years | 6,662 (89.3%) | 586 (8.8%) |
| 45 to 54 Years | 7,115 (87.9%) | 263 (3.7%) |
| 55 to 59 Years | 2,242 (81.4%) | 9 (0.4%) |
| 60 to 64 Years | 1,329 (65.2%) | 5 (0.4%) |
| 65 to 74 Years | 857 (25.3%) | 28 (3.3%) |
| 75 Years and over | 259 (9.6%) | 0 (0.0%) |
| Total | 25,524 (70.1%) | 1,098 (4.3%) |
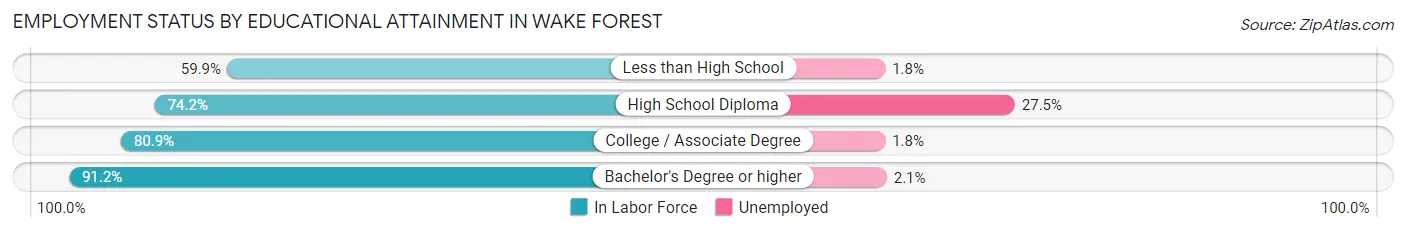
Employment Status by Educational Attainment in Wake Forest
According to labor force statistics for Wake Forest, 85.9% of individuals (22,213) out of the total population between 25 and 64 years of age (25,859) are in the labor force, with 4.4% or 977 of them being unemployed. The group with the highest labor force participation rate are those with the educational attainment of bachelor's degree or higher, with 91.2% or 14,567 individuals in the labor force. Within the labor force, individuals with high school diploma education have the highest percentage of unemployment, with 27.5% or 557 of them being unemployed.
| Educational Attainment | In Labor Force | Unemployed |
| Less than High School | 451 (59.9%) | 14 (1.8%) |
| High School Diploma | 2,025 (74.2%) | 750 (27.5%) |
| College / Associate Degree | 5,181 (80.9%) | 115 (1.8%) |
| Bachelor's Degree or higher | 14,567 (91.2%) | 335 (2.1%) |
| Total | 22,213 (85.9%) | 1,138 (4.4%) |
Employment Occupations by Sex in Wake Forest
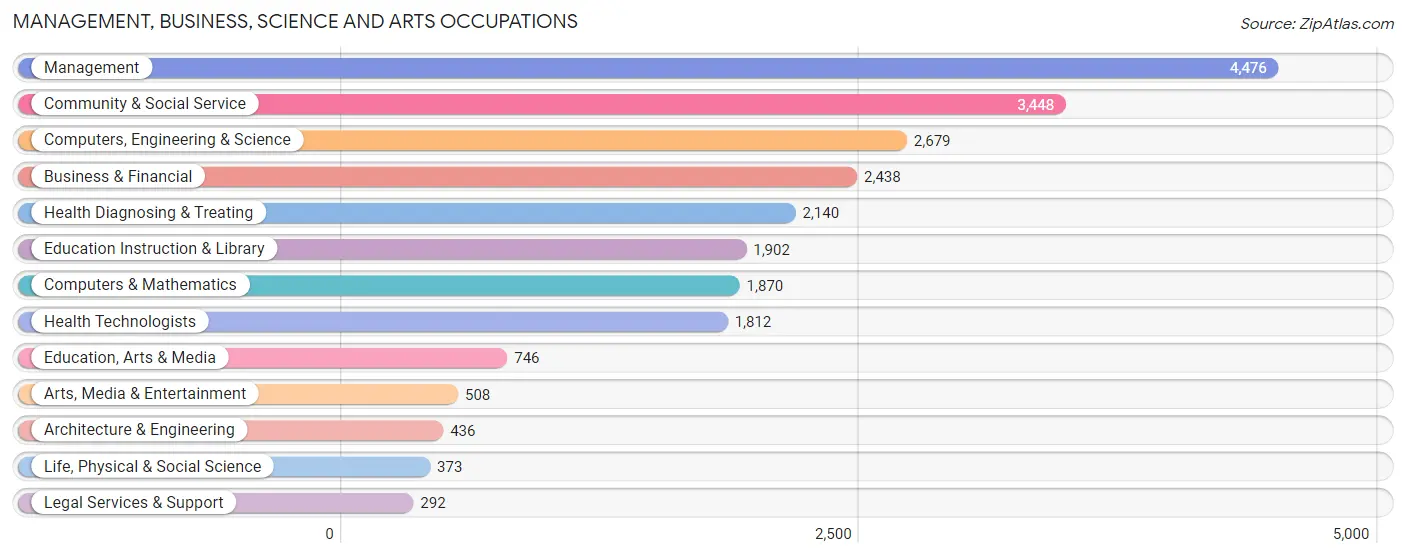
Management, Business, Science and Arts Occupations
The most common Management, Business, Science and Arts occupations in Wake Forest are Management (4,476 | 18.4%), Community & Social Service (3,448 | 14.2%), Computers, Engineering & Science (2,679 | 11.0%), Business & Financial (2,438 | 10.0%), and Health Diagnosing & Treating (2,140 | 8.8%).
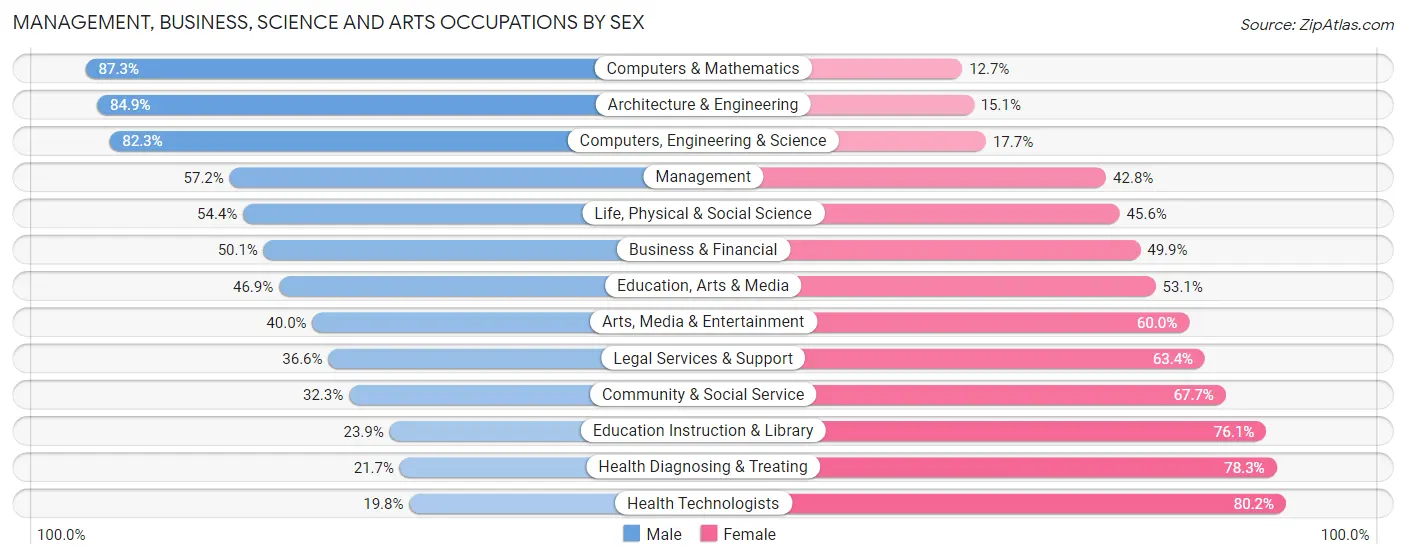
Management, Business, Science and Arts Occupations by Sex
Within the Management, Business, Science and Arts occupations in Wake Forest, the most male-oriented occupations are Computers & Mathematics (87.3%), Architecture & Engineering (84.9%), and Computers, Engineering & Science (82.3%), while the most female-oriented occupations are Health Technologists (80.2%), Health Diagnosing & Treating (78.3%), and Education Instruction & Library (76.1%).
| Occupation | Male | Female |
| Management | 2,562 (57.2%) | 1,914 (42.8%) |
| Business & Financial | 1,222 (50.1%) | 1,216 (49.9%) |
| Computers, Engineering & Science | 2,205 (82.3%) | 474 (17.7%) |
| Computers & Mathematics | 1,632 (87.3%) | 238 (12.7%) |
| Architecture & Engineering | 370 (84.9%) | 66 (15.1%) |
| Life, Physical & Social Science | 203 (54.4%) | 170 (45.6%) |
| Community & Social Service | 1,114 (32.3%) | 2,334 (67.7%) |
| Education, Arts & Media | 350 (46.9%) | 396 (53.1%) |
| Legal Services & Support | 107 (36.6%) | 185 (63.4%) |
| Education Instruction & Library | 454 (23.9%) | 1,448 (76.1%) |
| Arts, Media & Entertainment | 203 (40.0%) | 305 (60.0%) |
| Health Diagnosing & Treating | 465 (21.7%) | 1,675 (78.3%) |
| Health Technologists | 358 (19.8%) | 1,454 (80.2%) |
| Total (Category) | 7,568 (49.8%) | 7,613 (50.1%) |
| Total (Overall) | 12,849 (52.8%) | 11,481 (47.2%) |
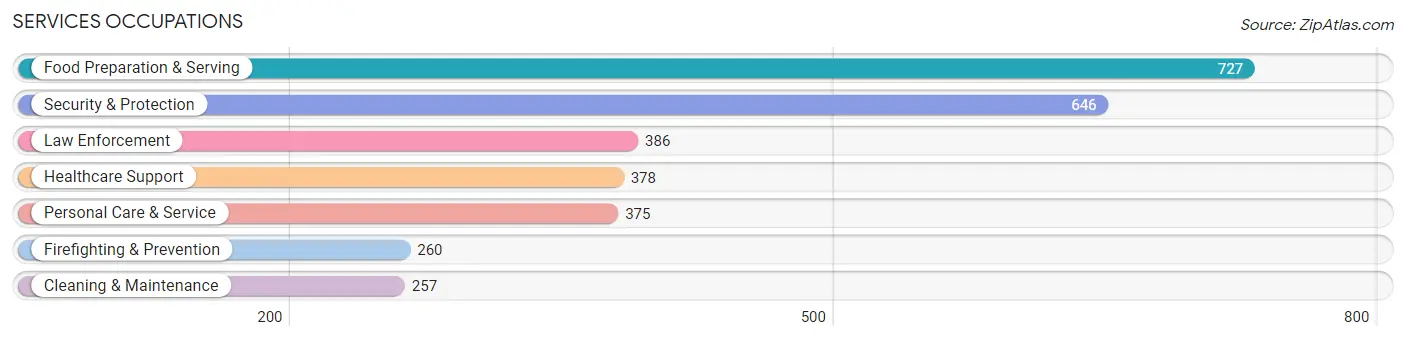
Services Occupations
The most common Services occupations in Wake Forest are Food Preparation & Serving (727 | 3.0%), Security & Protection (646 | 2.7%), Law Enforcement (386 | 1.6%), Healthcare Support (378 | 1.5%), and Personal Care & Service (375 | 1.5%).
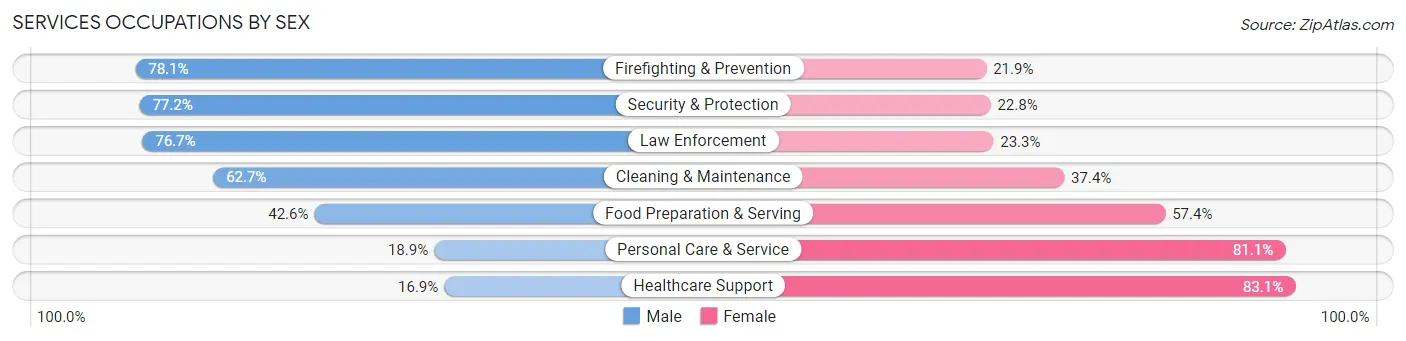
Services Occupations by Sex
Within the Services occupations in Wake Forest, the most male-oriented occupations are Firefighting & Prevention (78.1%), Security & Protection (77.2%), and Law Enforcement (76.7%), while the most female-oriented occupations are Healthcare Support (83.1%), Personal Care & Service (81.1%), and Food Preparation & Serving (57.4%).
| Occupation | Male | Female |
| Healthcare Support | 64 (16.9%) | 314 (83.1%) |
| Security & Protection | 499 (77.2%) | 147 (22.8%) |
| Firefighting & Prevention | 203 (78.1%) | 57 (21.9%) |
| Law Enforcement | 296 (76.7%) | 90 (23.3%) |
| Food Preparation & Serving | 310 (42.6%) | 417 (57.4%) |
| Cleaning & Maintenance | 161 (62.6%) | 96 (37.3%) |
| Personal Care & Service | 71 (18.9%) | 304 (81.1%) |
| Total (Category) | 1,105 (46.4%) | 1,278 (53.6%) |
| Total (Overall) | 12,849 (52.8%) | 11,481 (47.2%) |
Sales and Office Occupations
The most common Sales and Office occupations in Wake Forest are Sales & Related (2,654 | 10.9%), and Office & Administration (1,623 | 6.7%).
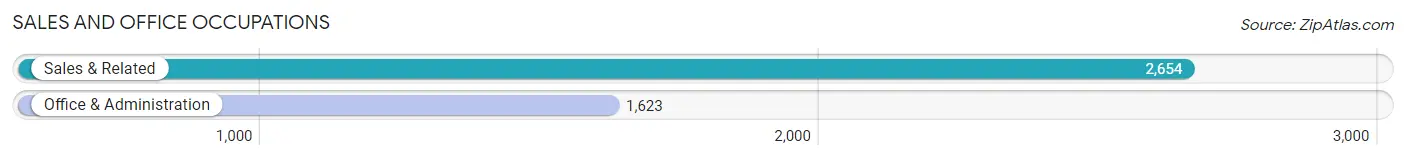
Sales and Office Occupations by Sex
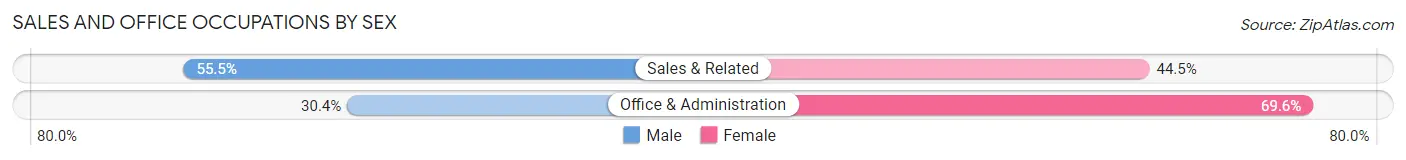
| Occupation | Male | Female |
| Sales & Related | 1,474 (55.5%) | 1,180 (44.5%) |
| Office & Administration | 493 (30.4%) | 1,130 (69.6%) |
| Total (Category) | 1,967 (46.0%) | 2,310 (54.0%) |
| Total (Overall) | 12,849 (52.8%) | 11,481 (47.2%) |
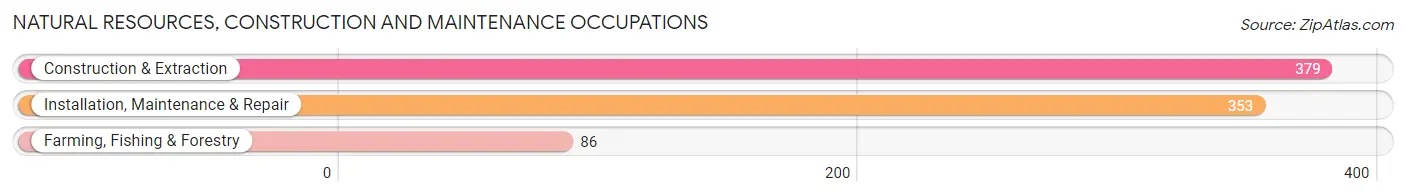
Natural Resources, Construction and Maintenance Occupations
The most common Natural Resources, Construction and Maintenance occupations in Wake Forest are Construction & Extraction (379 | 1.6%), Installation, Maintenance & Repair (353 | 1.5%), and Farming, Fishing & Forestry (86 | 0.4%).
Natural Resources, Construction and Maintenance Occupations by Sex
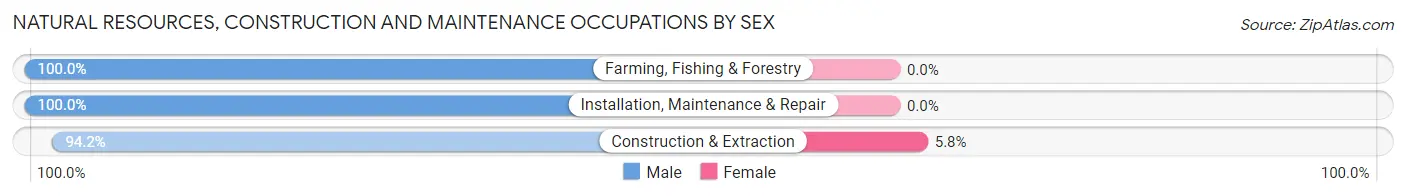
| Occupation | Male | Female |
| Farming, Fishing & Forestry | 86 (100.0%) | 0 (0.0%) |
| Construction & Extraction | 357 (94.2%) | 22 (5.8%) |
| Installation, Maintenance & Repair | 353 (100.0%) | 0 (0.0%) |
| Total (Category) | 796 (97.3%) | 22 (2.7%) |
| Total (Overall) | 12,849 (52.8%) | 11,481 (47.2%) |
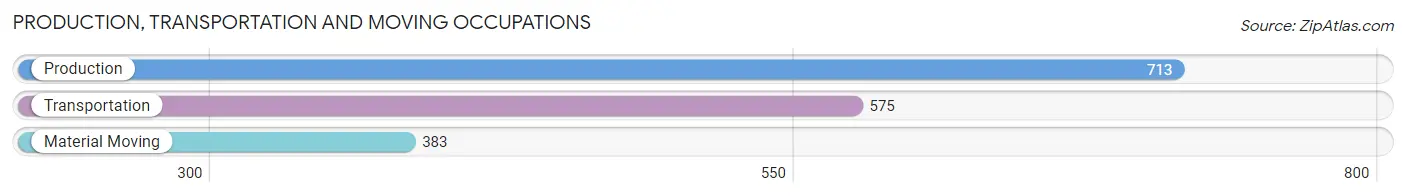
Production, Transportation and Moving Occupations
The most common Production, Transportation and Moving occupations in Wake Forest are Production (713 | 2.9%), Transportation (575 | 2.4%), and Material Moving (383 | 1.6%).
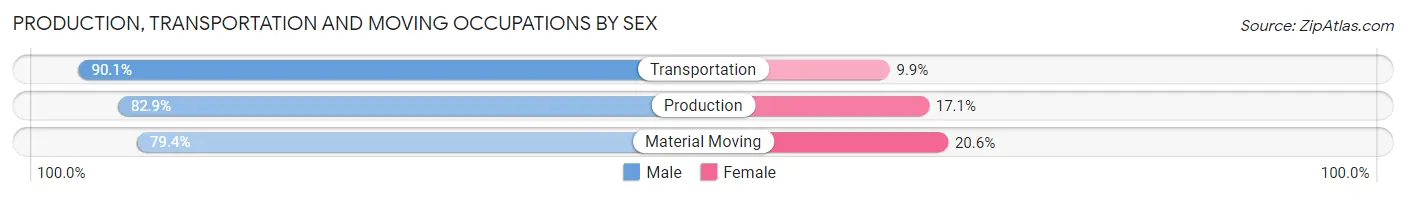
Production, Transportation and Moving Occupations by Sex
| Occupation | Male | Female |
| Production | 591 (82.9%) | 122 (17.1%) |
| Transportation | 518 (90.1%) | 57 (9.9%) |
| Material Moving | 304 (79.4%) | 79 (20.6%) |
| Total (Category) | 1,413 (84.6%) | 258 (15.4%) |
| Total (Overall) | 12,849 (52.8%) | 11,481 (47.2%) |
Employment Industries by Sex in Wake Forest
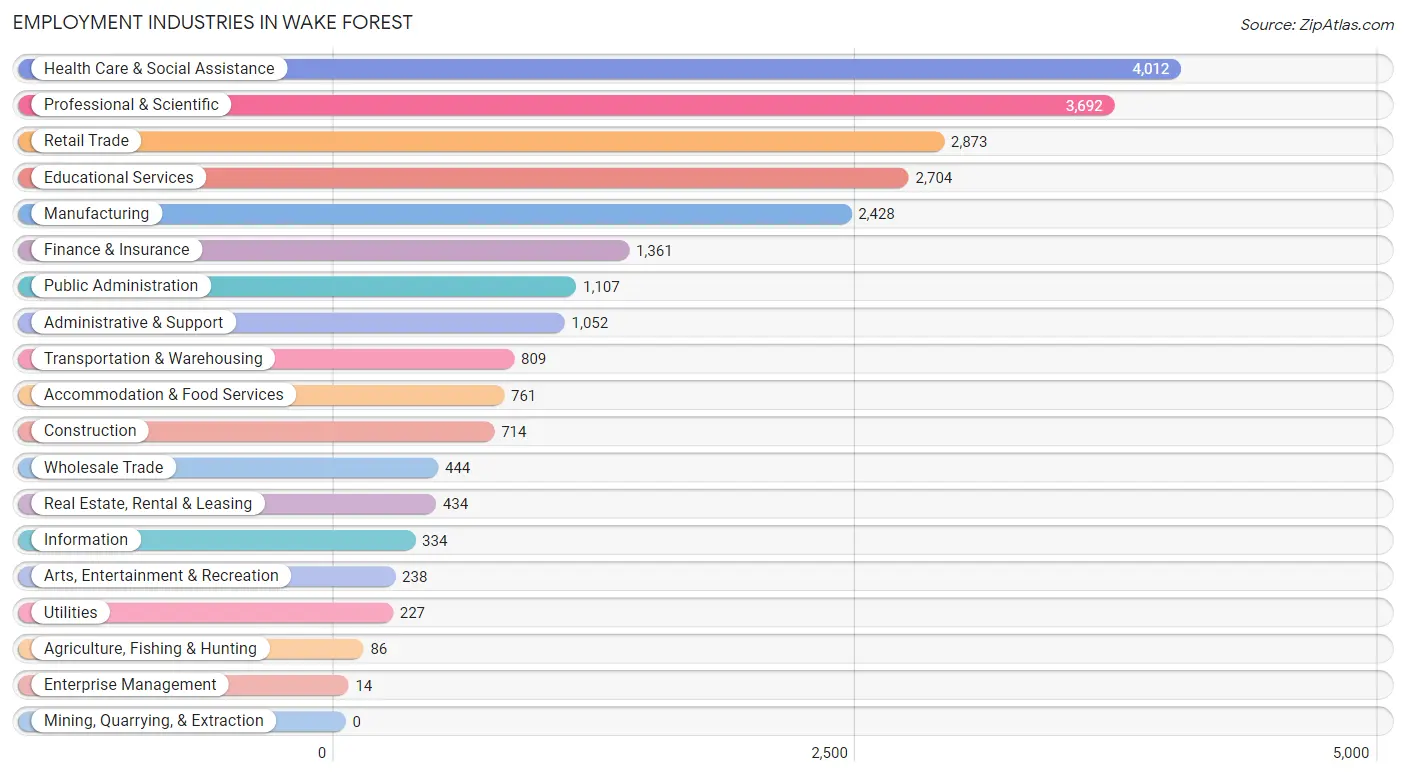
Employment Industries in Wake Forest
The major employment industries in Wake Forest include Health Care & Social Assistance (4,012 | 16.5%), Professional & Scientific (3,692 | 15.2%), Retail Trade (2,873 | 11.8%), Educational Services (2,704 | 11.1%), and Manufacturing (2,428 | 10.0%).
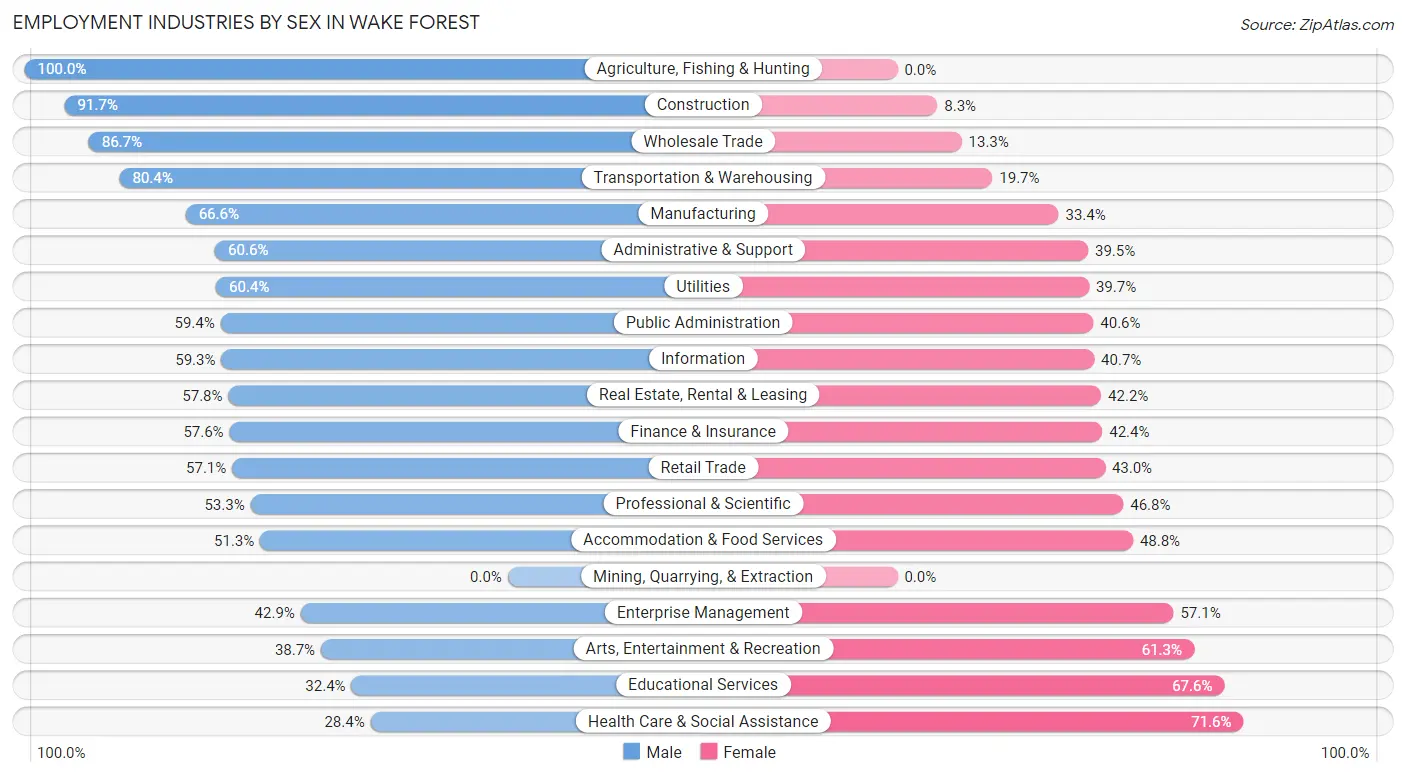
Employment Industries by Sex in Wake Forest
The Wake Forest industries that see more men than women are Agriculture, Fishing & Hunting (100.0%), Construction (91.7%), and Wholesale Trade (86.7%), whereas the industries that tend to have a higher number of women are Health Care & Social Assistance (71.6%), Educational Services (67.6%), and Arts, Entertainment & Recreation (61.3%).
| Industry | Male | Female |
| Agriculture, Fishing & Hunting | 86 (100.0%) | 0 (0.0%) |
| Mining, Quarrying, & Extraction | 0 (0.0%) | 0 (0.0%) |
| Construction | 655 (91.7%) | 59 (8.3%) |
| Manufacturing | 1,618 (66.6%) | 810 (33.4%) |
| Wholesale Trade | 385 (86.7%) | 59 (13.3%) |
| Retail Trade | 1,639 (57.1%) | 1,234 (42.9%) |
| Transportation & Warehousing | 650 (80.3%) | 159 (19.7%) |
| Utilities | 137 (60.4%) | 90 (39.7%) |
| Information | 198 (59.3%) | 136 (40.7%) |
| Finance & Insurance | 784 (57.6%) | 577 (42.4%) |
| Real Estate, Rental & Leasing | 251 (57.8%) | 183 (42.2%) |
| Professional & Scientific | 1,966 (53.2%) | 1,726 (46.8%) |
| Enterprise Management | 6 (42.9%) | 8 (57.1%) |
| Administrative & Support | 637 (60.6%) | 415 (39.5%) |
| Educational Services | 875 (32.4%) | 1,829 (67.6%) |
| Health Care & Social Assistance | 1,140 (28.4%) | 2,872 (71.6%) |
| Arts, Entertainment & Recreation | 92 (38.7%) | 146 (61.3%) |
| Accommodation & Food Services | 390 (51.2%) | 371 (48.7%) |
| Public Administration | 658 (59.4%) | 449 (40.6%) |
| Total | 12,849 (52.8%) | 11,481 (47.2%) |
Education in Wake Forest
School Enrollment in Wake Forest
The most common levels of schooling among the 14,005 students in Wake Forest are high school (3,479 | 24.8%), middle school (3,138 | 22.4%), and elementary school (2,120 | 15.1%).
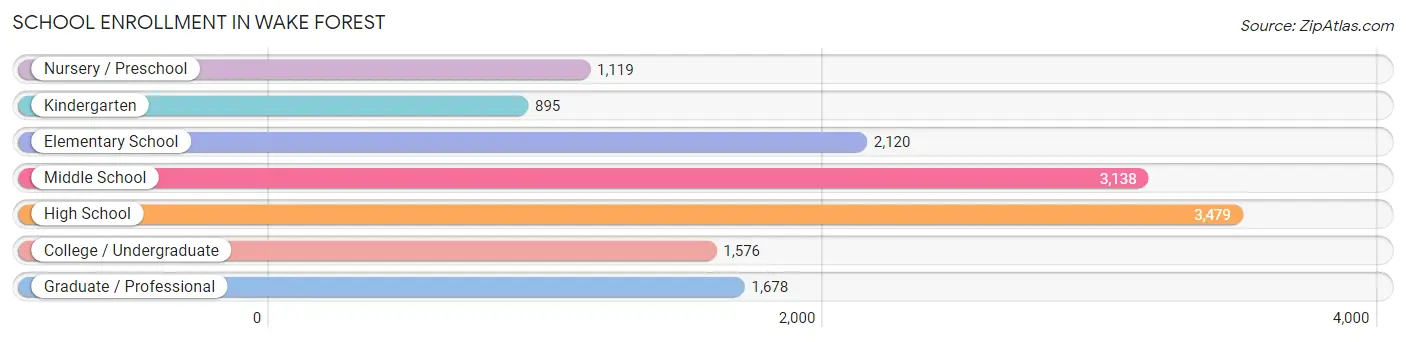
| School Level | # Students | % Students |
| Nursery / Preschool | 1,119 | 8.0% |
| Kindergarten | 895 | 6.4% |
| Elementary School | 2,120 | 15.1% |
| Middle School | 3,138 | 22.4% |
| High School | 3,479 | 24.8% |
| College / Undergraduate | 1,576 | 11.3% |
| Graduate / Professional | 1,678 | 12.0% |
| Total | 14,005 | 100.0% |
School Enrollment by Age by Funding Source in Wake Forest
Out of a total of 14,005 students who are enrolled in schools in Wake Forest, 3,823 (27.3%) attend a private institution, while the remaining 10,182 (72.7%) are enrolled in public schools. The age group of 3 to 4 year olds has the highest likelihood of being enrolled in private schools, with 808 (82.0% in the age bracket) enrolled. Conversely, the age group of 18 to 19 year olds has the lowest likelihood of being enrolled in a private school, with 600 (87.3% in the age bracket) attending a public institution.
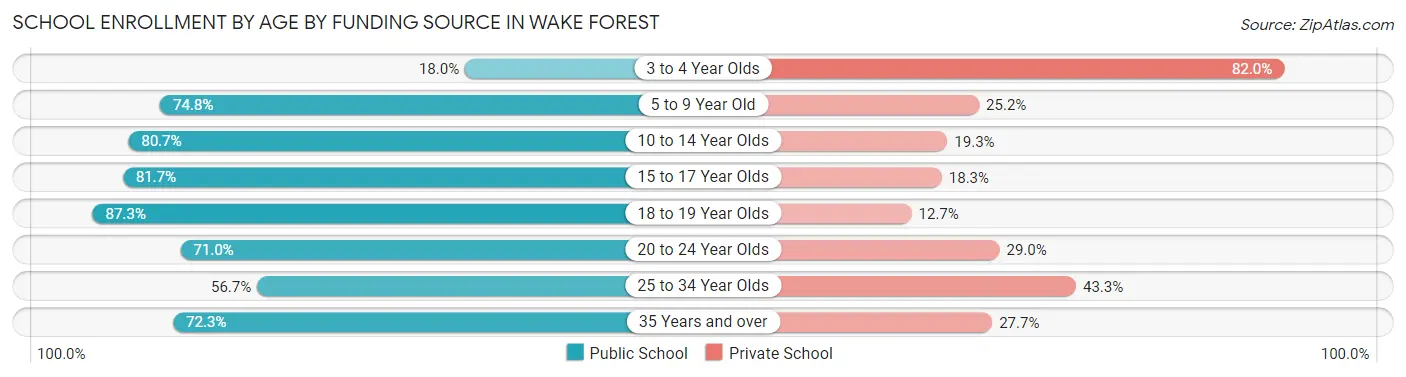
| Age Bracket | Public School | Private School |
| 3 to 4 Year Olds | 177 (18.0%) | 808 (82.0%) |
| 5 to 9 Year Old | 2,183 (74.8%) | 737 (25.2%) |
| 10 to 14 Year Olds | 3,233 (80.7%) | 774 (19.3%) |
| 15 to 17 Year Olds | 2,055 (81.7%) | 460 (18.3%) |
| 18 to 19 Year Olds | 600 (87.3%) | 87 (12.7%) |
| 20 to 24 Year Olds | 594 (71.0%) | 243 (29.0%) |
| 25 to 34 Year Olds | 507 (56.7%) | 387 (43.3%) |
| 35 Years and over | 839 (72.3%) | 321 (27.7%) |
| Total | 10,182 (72.7%) | 3,823 (27.3%) |
Educational Attainment by Field of Study in Wake Forest
Business (4,434 | 22.1%), science & technology (2,250 | 11.2%), education (1,848 | 9.2%), engineering (1,651 | 8.2%), and social sciences (1,419 | 7.1%) are the most common fields of study among 20,107 individuals in Wake Forest who have obtained a bachelor's degree or higher.
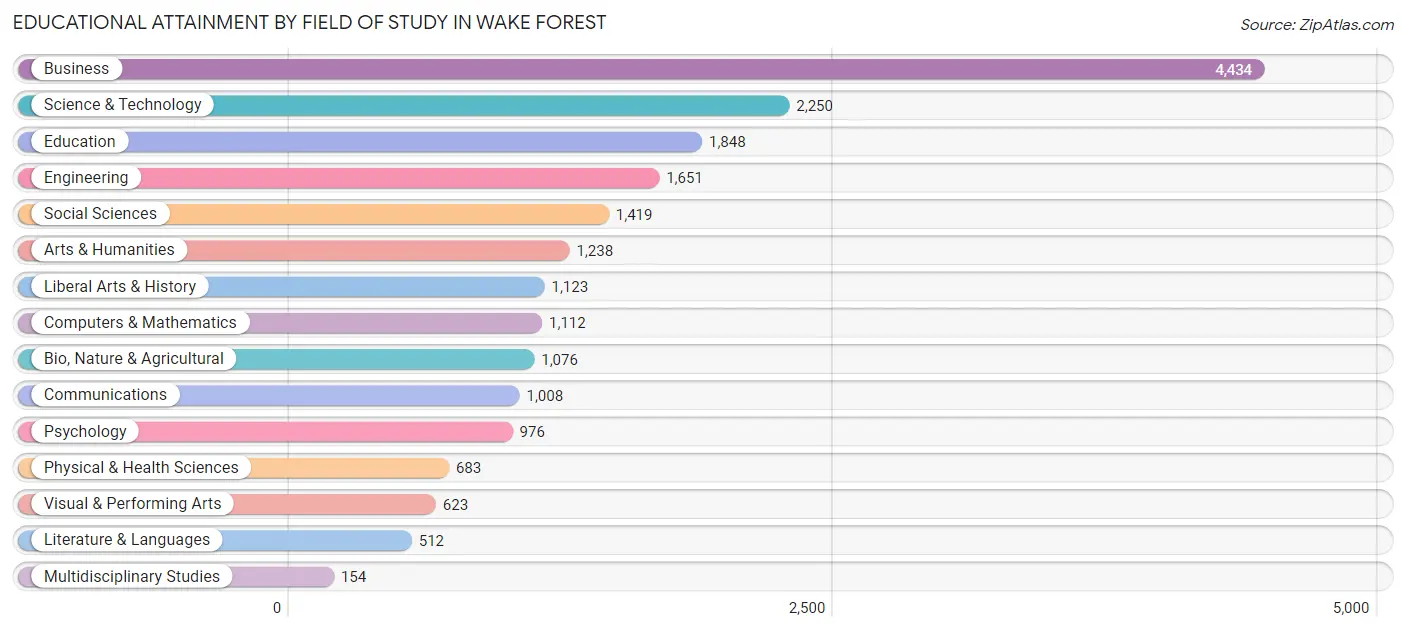
| Field of Study | # Graduates | % Graduates |
| Computers & Mathematics | 1,112 | 5.5% |
| Bio, Nature & Agricultural | 1,076 | 5.3% |
| Physical & Health Sciences | 683 | 3.4% |
| Psychology | 976 | 4.9% |
| Social Sciences | 1,419 | 7.1% |
| Engineering | 1,651 | 8.2% |
| Multidisciplinary Studies | 154 | 0.8% |
| Science & Technology | 2,250 | 11.2% |
| Business | 4,434 | 22.1% |
| Education | 1,848 | 9.2% |
| Literature & Languages | 512 | 2.5% |
| Liberal Arts & History | 1,123 | 5.6% |
| Visual & Performing Arts | 623 | 3.1% |
| Communications | 1,008 | 5.0% |
| Arts & Humanities | 1,238 | 6.2% |
| Total | 20,107 | 100.0% |
Transportation & Commute in Wake Forest
Vehicle Availability by Sex in Wake Forest
The most prevalent vehicle ownership categories in Wake Forest are males with 2 vehicles (6,732, accounting for 53.5%) and females with 2 vehicles (5,851, making up 60.8%).
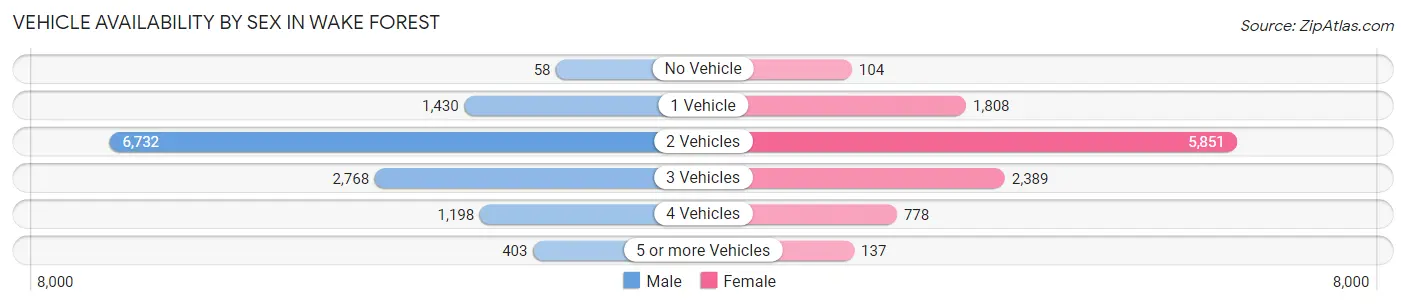
| Vehicles Available | Male | Female |
| No Vehicle | 58 (0.5%) | 104 (0.9%) |
| 1 Vehicle | 1,430 (11.4%) | 1,808 (16.3%) |
| 2 Vehicles | 6,732 (53.5%) | 5,851 (52.9%) |
| 3 Vehicles | 2,768 (22.0%) | 2,389 (21.6%) |
| 4 Vehicles | 1,198 (9.5%) | 778 (7.0%) |
| 5 or more Vehicles | 403 (3.2%) | 137 (1.2%) |
| Total | 12,589 (100.0%) | 11,067 (100.0%) |
Commute Time in Wake Forest
The most frequently occuring commute durations in Wake Forest are 30 to 34 minutes (3,100 commuters, 16.7%), 45 to 59 minutes (2,902 commuters, 15.6%), and 20 to 24 minutes (2,238 commuters, 12.0%).
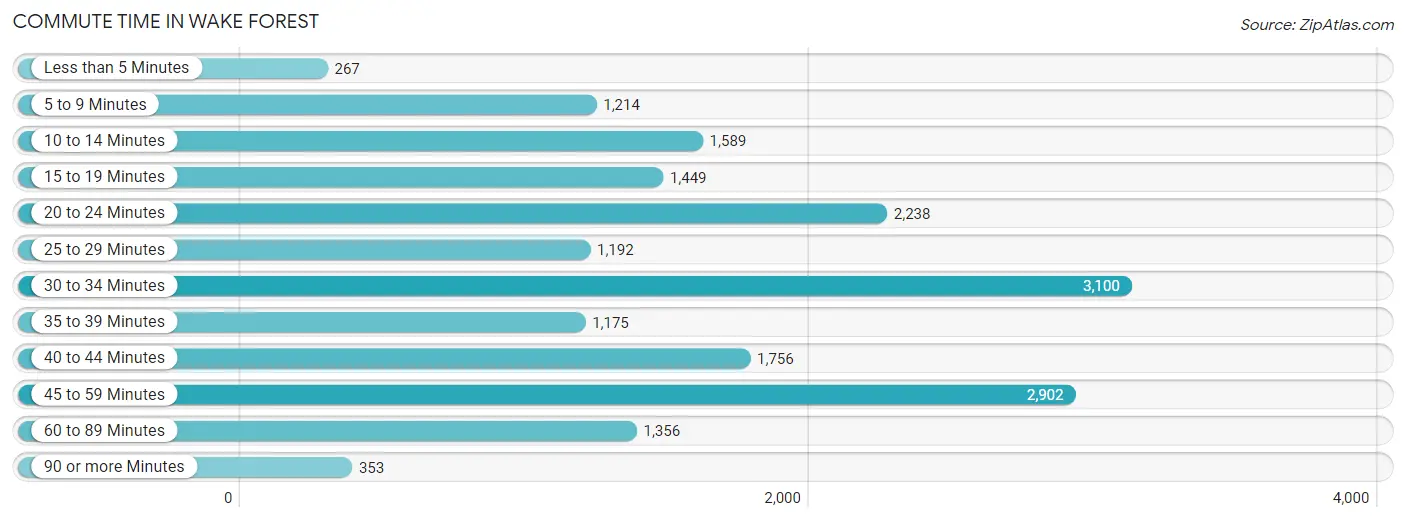
| Commute Time | # Commuters | % Commuters |
| Less than 5 Minutes | 267 | 1.4% |
| 5 to 9 Minutes | 1,214 | 6.5% |
| 10 to 14 Minutes | 1,589 | 8.6% |
| 15 to 19 Minutes | 1,449 | 7.8% |
| 20 to 24 Minutes | 2,238 | 12.0% |
| 25 to 29 Minutes | 1,192 | 6.4% |
| 30 to 34 Minutes | 3,100 | 16.7% |
| 35 to 39 Minutes | 1,175 | 6.3% |
| 40 to 44 Minutes | 1,756 | 9.5% |
| 45 to 59 Minutes | 2,902 | 15.6% |
| 60 to 89 Minutes | 1,356 | 7.3% |
| 90 or more Minutes | 353 | 1.9% |
Commute Time by Sex in Wake Forest
The most common commute times in Wake Forest are 45 to 59 minutes (1,954 commuters, 19.1%) for males and 30 to 34 minutes (1,651 commuters, 19.7%) for females.
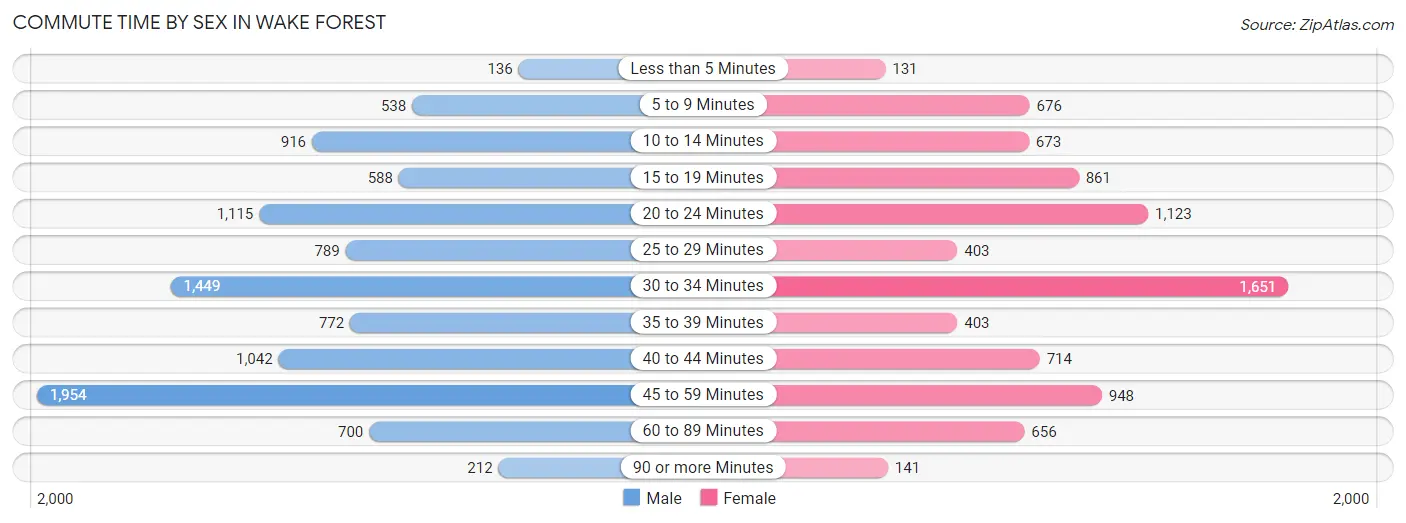
| Commute Time | Male | Female |
| Less than 5 Minutes | 136 (1.3%) | 131 (1.6%) |
| 5 to 9 Minutes | 538 (5.3%) | 676 (8.1%) |
| 10 to 14 Minutes | 916 (9.0%) | 673 (8.0%) |
| 15 to 19 Minutes | 588 (5.8%) | 861 (10.3%) |
| 20 to 24 Minutes | 1,115 (10.9%) | 1,123 (13.4%) |
| 25 to 29 Minutes | 789 (7.7%) | 403 (4.8%) |
| 30 to 34 Minutes | 1,449 (14.2%) | 1,651 (19.7%) |
| 35 to 39 Minutes | 772 (7.6%) | 403 (4.8%) |
| 40 to 44 Minutes | 1,042 (10.2%) | 714 (8.5%) |
| 45 to 59 Minutes | 1,954 (19.1%) | 948 (11.3%) |
| 60 to 89 Minutes | 700 (6.9%) | 656 (7.8%) |
| 90 or more Minutes | 212 (2.1%) | 141 (1.7%) |
Time of Departure to Work by Sex in Wake Forest
The most frequent times of departure to work in Wake Forest are 7:00 AM to 7:29 AM (1,664, 16.3%) for males and 7:00 AM to 7:29 AM (1,857, 22.2%) for females.
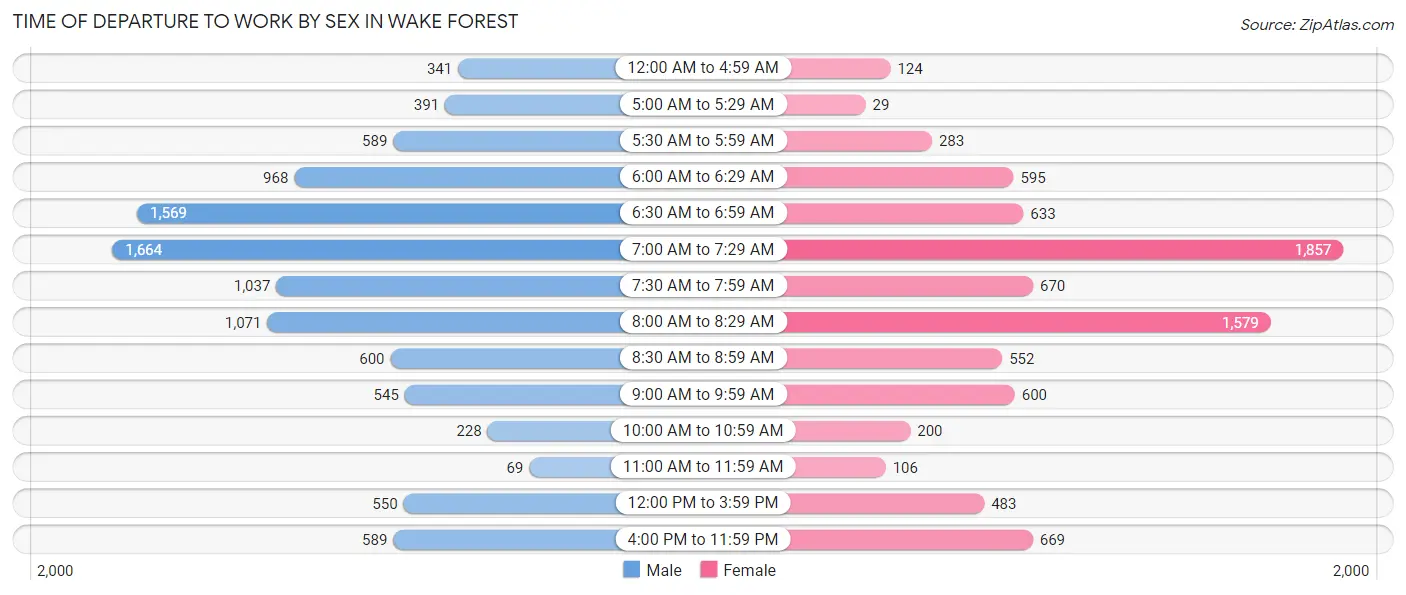
| Time of Departure | Male | Female |
| 12:00 AM to 4:59 AM | 341 (3.3%) | 124 (1.5%) |
| 5:00 AM to 5:29 AM | 391 (3.8%) | 29 (0.4%) |
| 5:30 AM to 5:59 AM | 589 (5.8%) | 283 (3.4%) |
| 6:00 AM to 6:29 AM | 968 (9.5%) | 595 (7.1%) |
| 6:30 AM to 6:59 AM | 1,569 (15.4%) | 633 (7.5%) |
| 7:00 AM to 7:29 AM | 1,664 (16.3%) | 1,857 (22.2%) |
| 7:30 AM to 7:59 AM | 1,037 (10.2%) | 670 (8.0%) |
| 8:00 AM to 8:29 AM | 1,071 (10.5%) | 1,579 (18.8%) |
| 8:30 AM to 8:59 AM | 600 (5.9%) | 552 (6.6%) |
| 9:00 AM to 9:59 AM | 545 (5.3%) | 600 (7.2%) |
| 10:00 AM to 10:59 AM | 228 (2.2%) | 200 (2.4%) |
| 11:00 AM to 11:59 AM | 69 (0.7%) | 106 (1.3%) |
| 12:00 PM to 3:59 PM | 550 (5.4%) | 483 (5.8%) |
| 4:00 PM to 11:59 PM | 589 (5.8%) | 669 (8.0%) |
| Total | 10,211 (100.0%) | 8,380 (100.0%) |
Housing Occupancy in Wake Forest
Occupancy by Ownership in Wake Forest
Of the total 16,811 dwellings in Wake Forest, owner-occupied units account for 12,355 (73.5%), while renter-occupied units make up 4,456 (26.5%).
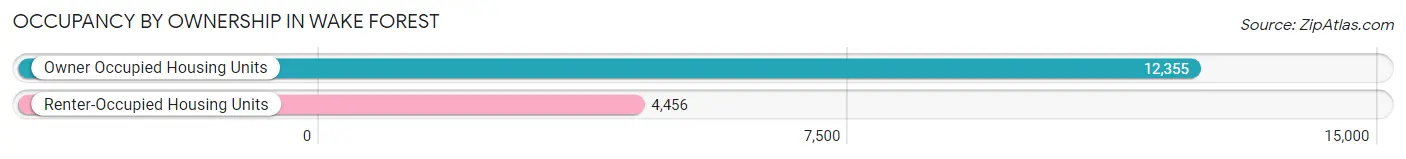
| Occupancy | # Housing Units | % Housing Units |
| Owner Occupied Housing Units | 12,355 | 73.5% |
| Renter-Occupied Housing Units | 4,456 | 26.5% |
| Total Occupied Housing Units | 16,811 | 100.0% |
Occupancy by Household Size in Wake Forest
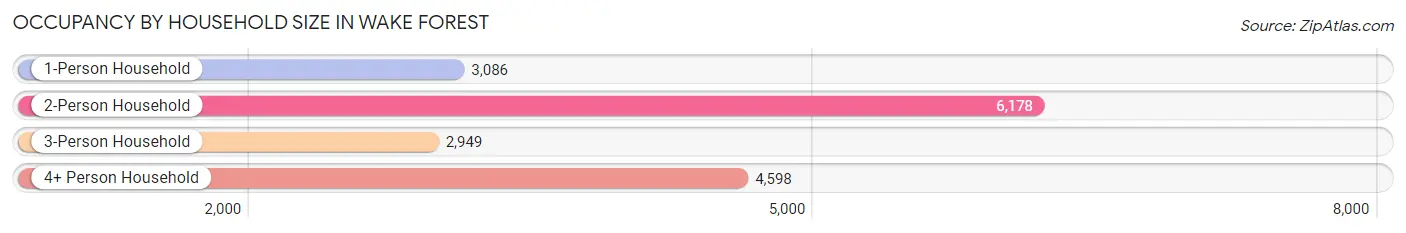
| Household Size | # Housing Units | % Housing Units |
| 1-Person Household | 3,086 | 18.4% |
| 2-Person Household | 6,178 | 36.7% |
| 3-Person Household | 2,949 | 17.5% |
| 4+ Person Household | 4,598 | 27.4% |
| Total Housing Units | 16,811 | 100.0% |
Occupancy by Ownership by Household Size in Wake Forest
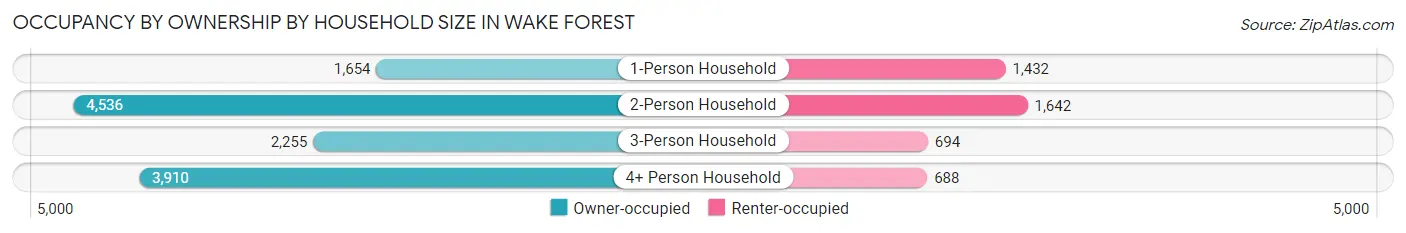
| Household Size | Owner-occupied | Renter-occupied |
| 1-Person Household | 1,654 (53.6%) | 1,432 (46.4%) |
| 2-Person Household | 4,536 (73.4%) | 1,642 (26.6%) |
| 3-Person Household | 2,255 (76.5%) | 694 (23.5%) |
| 4+ Person Household | 3,910 (85.0%) | 688 (15.0%) |
| Total Housing Units | 12,355 (73.5%) | 4,456 (26.5%) |
Occupancy by Educational Attainment in Wake Forest
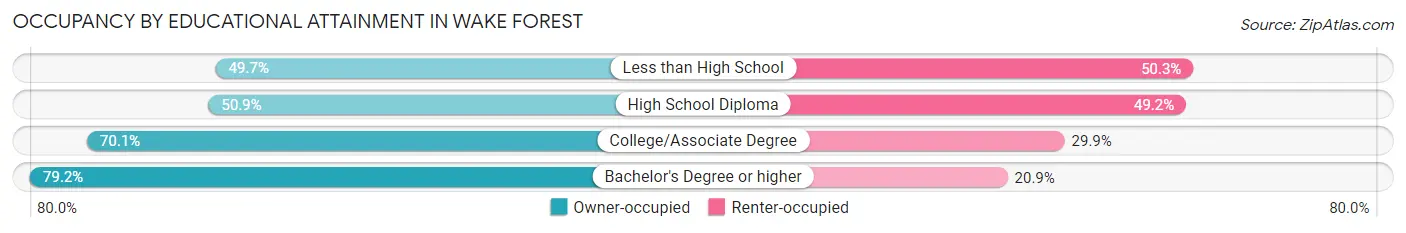
| Household Size | Owner-occupied | Renter-occupied |
| Less than High School | 176 (49.7%) | 178 (50.3%) |
| High School Diploma | 841 (50.8%) | 813 (49.1%) |
| College/Associate Degree | 2,932 (70.1%) | 1,250 (29.9%) |
| Bachelor's Degree or higher | 8,406 (79.1%) | 2,215 (20.8%) |
Occupancy by Age of Householder in Wake Forest
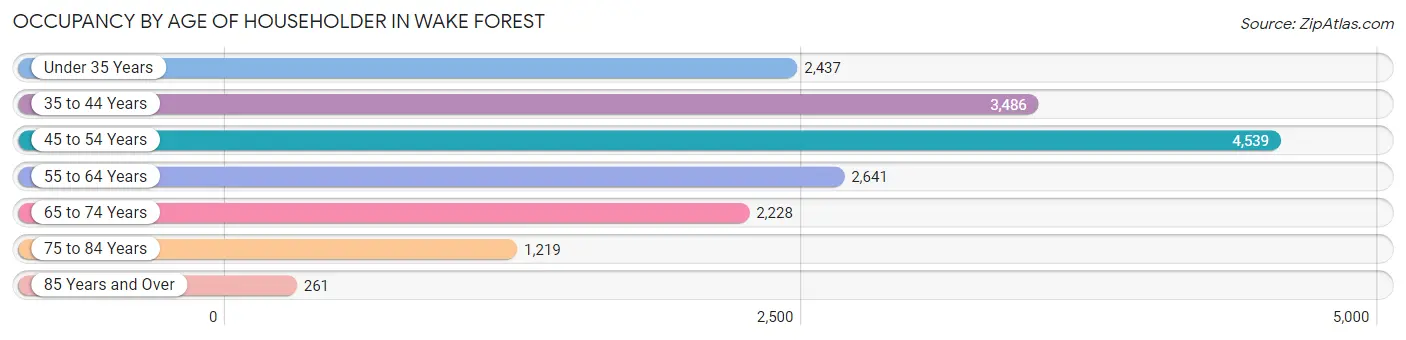
| Age Bracket | # Households | % Households |
| Under 35 Years | 2,437 | 14.5% |
| 35 to 44 Years | 3,486 | 20.7% |
| 45 to 54 Years | 4,539 | 27.0% |
| 55 to 64 Years | 2,641 | 15.7% |
| 65 to 74 Years | 2,228 | 13.3% |
| 75 to 84 Years | 1,219 | 7.2% |
| 85 Years and Over | 261 | 1.5% |
| Total | 16,811 | 100.0% |
Housing Finances in Wake Forest
Median Income by Occupancy in Wake Forest
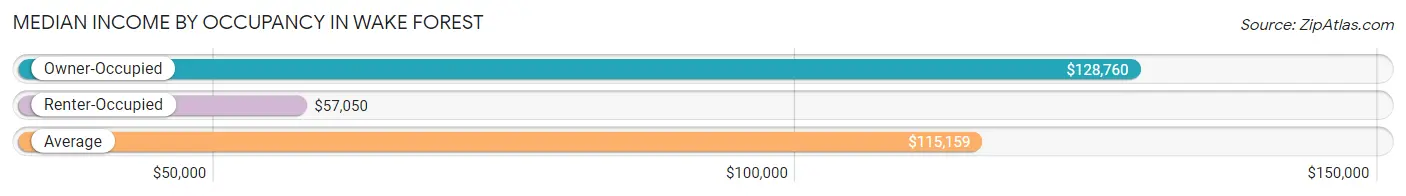
| Occupancy Type | # Households | Median Income |
| Owner-Occupied | 12,355 (73.5%) | $128,760 |
| Renter-Occupied | 4,456 (26.5%) | $57,050 |
| Average | 16,811 (100.0%) | $115,159 |
Occupancy by Householder Income Bracket in Wake Forest
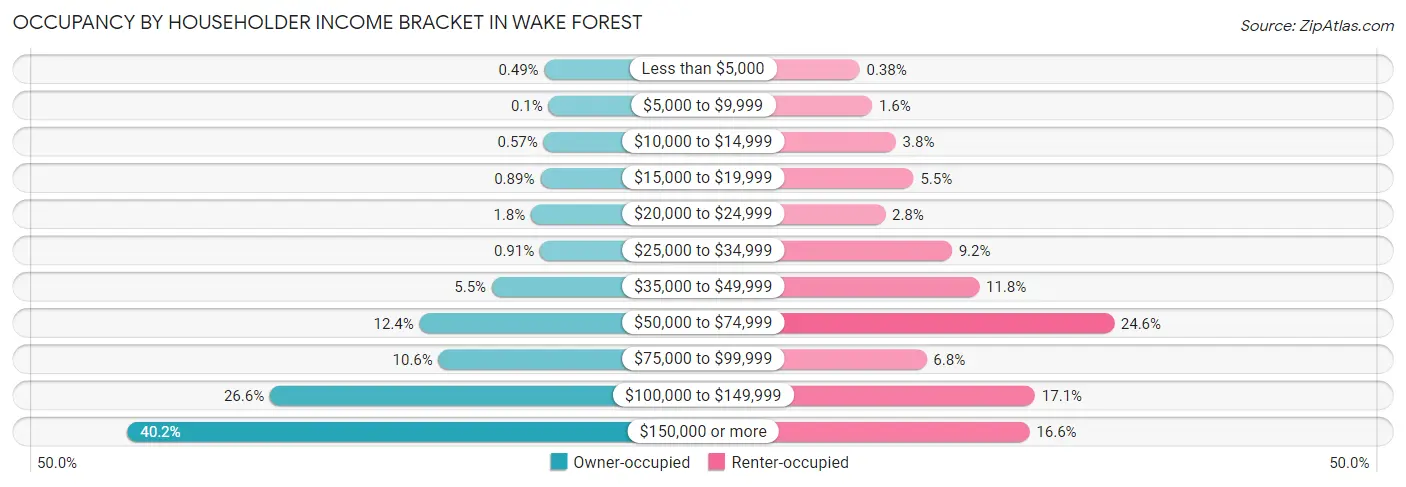
| Income Bracket | Owner-occupied | Renter-occupied |
| Less than $5,000 | 61 (0.5%) | 17 (0.4%) |
| $5,000 to $9,999 | 12 (0.1%) | 70 (1.6%) |
| $10,000 to $14,999 | 70 (0.6%) | 170 (3.8%) |
| $15,000 to $19,999 | 110 (0.9%) | 246 (5.5%) |
| $20,000 to $24,999 | 217 (1.8%) | 125 (2.8%) |
| $25,000 to $34,999 | 112 (0.9%) | 408 (9.2%) |
| $35,000 to $49,999 | 678 (5.5%) | 524 (11.8%) |
| $50,000 to $74,999 | 1,531 (12.4%) | 1,096 (24.6%) |
| $75,000 to $99,999 | 1,306 (10.6%) | 301 (6.8%) |
| $100,000 to $149,999 | 3,290 (26.6%) | 761 (17.1%) |
| $150,000 or more | 4,968 (40.2%) | 738 (16.6%) |
| Total | 12,355 (100.0%) | 4,456 (100.0%) |
Monthly Housing Cost Tiers in Wake Forest
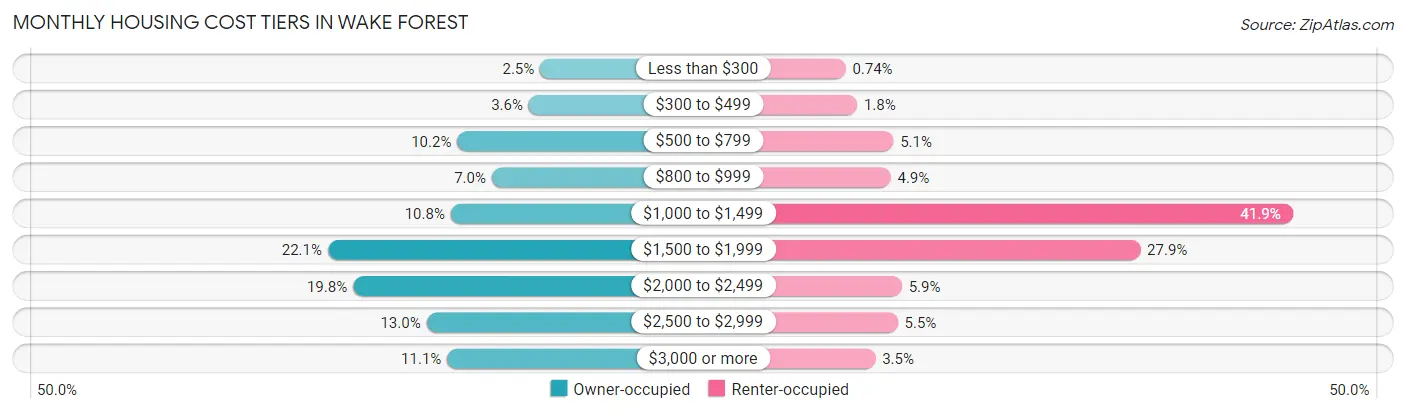
| Monthly Cost | Owner-occupied | Renter-occupied |
| Less than $300 | 314 (2.5%) | 33 (0.7%) |
| $300 to $499 | 442 (3.6%) | 80 (1.8%) |
| $500 to $799 | 1,256 (10.2%) | 229 (5.1%) |
| $800 to $999 | 864 (7.0%) | 218 (4.9%) |
| $1,000 to $1,499 | 1,331 (10.8%) | 1,867 (41.9%) |
| $1,500 to $1,999 | 2,729 (22.1%) | 1,242 (27.9%) |
| $2,000 to $2,499 | 2,442 (19.8%) | 264 (5.9%) |
| $2,500 to $2,999 | 1,606 (13.0%) | 247 (5.5%) |
| $3,000 or more | 1,371 (11.1%) | 155 (3.5%) |
| Total | 12,355 (100.0%) | 4,456 (100.0%) |
Physical Housing Characteristics in Wake Forest
Housing Structures in Wake Forest
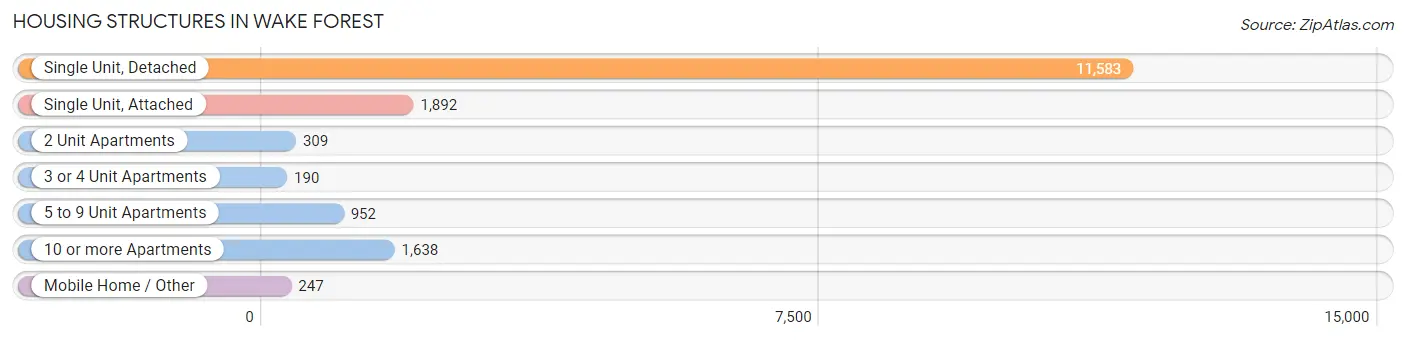
| Structure Type | # Housing Units | % Housing Units |
| Single Unit, Detached | 11,583 | 68.9% |
| Single Unit, Attached | 1,892 | 11.3% |
| 2 Unit Apartments | 309 | 1.8% |
| 3 or 4 Unit Apartments | 190 | 1.1% |
| 5 to 9 Unit Apartments | 952 | 5.7% |
| 10 or more Apartments | 1,638 | 9.7% |
| Mobile Home / Other | 247 | 1.5% |
| Total | 16,811 | 100.0% |
Housing Structures by Occupancy in Wake Forest
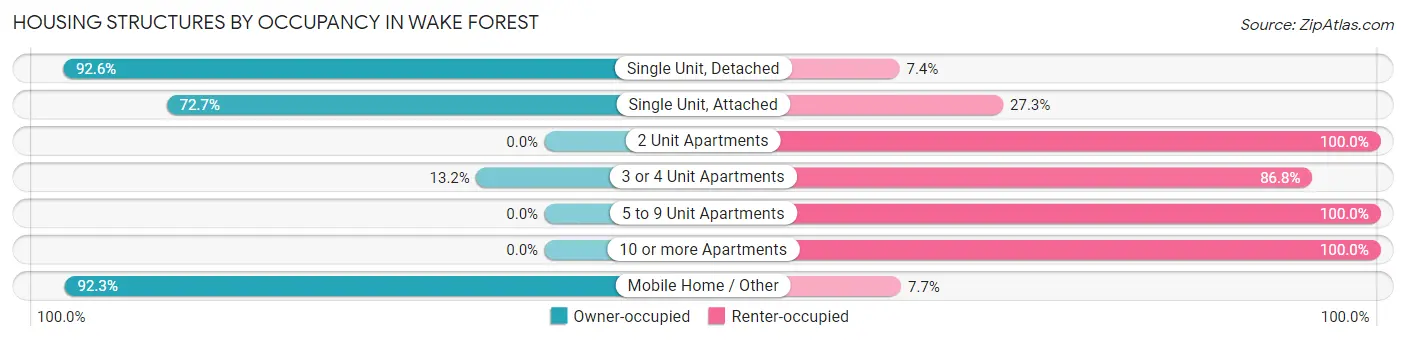
| Structure Type | Owner-occupied | Renter-occupied |
| Single Unit, Detached | 10,727 (92.6%) | 856 (7.4%) |
| Single Unit, Attached | 1,375 (72.7%) | 517 (27.3%) |
| 2 Unit Apartments | 0 (0.0%) | 309 (100.0%) |
| 3 or 4 Unit Apartments | 25 (13.2%) | 165 (86.8%) |
| 5 to 9 Unit Apartments | 0 (0.0%) | 952 (100.0%) |
| 10 or more Apartments | 0 (0.0%) | 1,638 (100.0%) |
| Mobile Home / Other | 228 (92.3%) | 19 (7.7%) |
| Total | 12,355 (73.5%) | 4,456 (26.5%) |
Housing Structures by Number of Rooms in Wake Forest
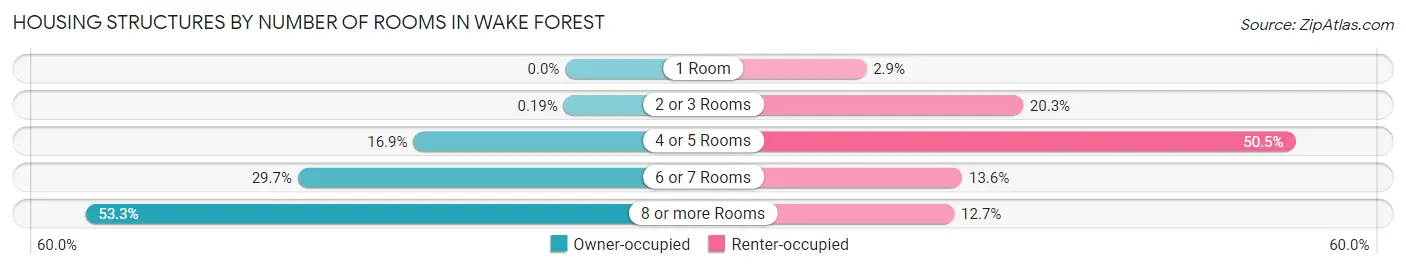
| Number of Rooms | Owner-occupied | Renter-occupied |
| 1 Room | 0 (0.0%) | 130 (2.9%) |
| 2 or 3 Rooms | 24 (0.2%) | 905 (20.3%) |
| 4 or 5 Rooms | 2,083 (16.9%) | 2,252 (50.5%) |
| 6 or 7 Rooms | 3,668 (29.7%) | 604 (13.6%) |
| 8 or more Rooms | 6,580 (53.3%) | 565 (12.7%) |
| Total | 12,355 (100.0%) | 4,456 (100.0%) |
Housing Structure by Heating Type in Wake Forest
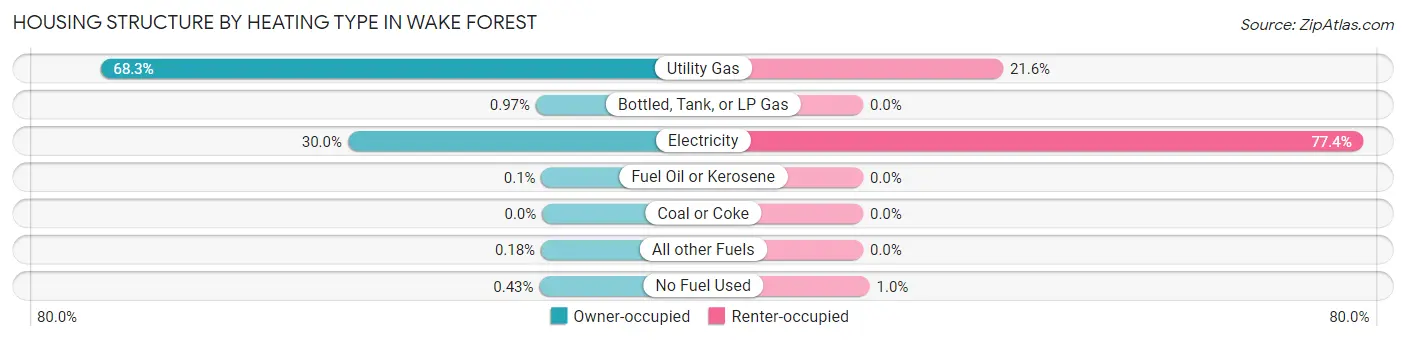
| Heating Type | Owner-occupied | Renter-occupied |
| Utility Gas | 8,436 (68.3%) | 964 (21.6%) |
| Bottled, Tank, or LP Gas | 120 (1.0%) | 0 (0.0%) |
| Electricity | 3,712 (30.0%) | 3,447 (77.4%) |
| Fuel Oil or Kerosene | 12 (0.1%) | 0 (0.0%) |
| Coal or Coke | 0 (0.0%) | 0 (0.0%) |
| All other Fuels | 22 (0.2%) | 0 (0.0%) |
| No Fuel Used | 53 (0.4%) | 45 (1.0%) |
| Total | 12,355 (100.0%) | 4,456 (100.0%) |
Household Vehicle Usage in Wake Forest
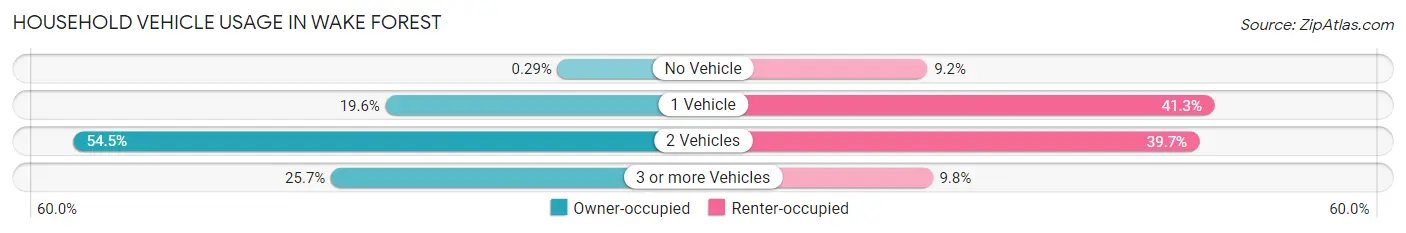
| Vehicles per Household | Owner-occupied | Renter-occupied |
| No Vehicle | 36 (0.3%) | 411 (9.2%) |
| 1 Vehicle | 2,416 (19.6%) | 1,841 (41.3%) |
| 2 Vehicles | 6,733 (54.5%) | 1,767 (39.7%) |
| 3 or more Vehicles | 3,170 (25.7%) | 437 (9.8%) |
| Total | 12,355 (100.0%) | 4,456 (100.0%) |
Real Estate & Mortgages in Wake Forest
Real Estate and Mortgage Overview in Wake Forest
| Characteristic | Without Mortgage | With Mortgage |
| Housing Units | 2,738 | 9,617 |
| Median Property Value | $381,100 | $402,800 |
| Median Household Income | $87,200 | $4,233 |
| Monthly Housing Costs | $669 | $1,371 |
| Real Estate Taxes | $3,716 | $59 |
Property Value by Mortgage Status in Wake Forest
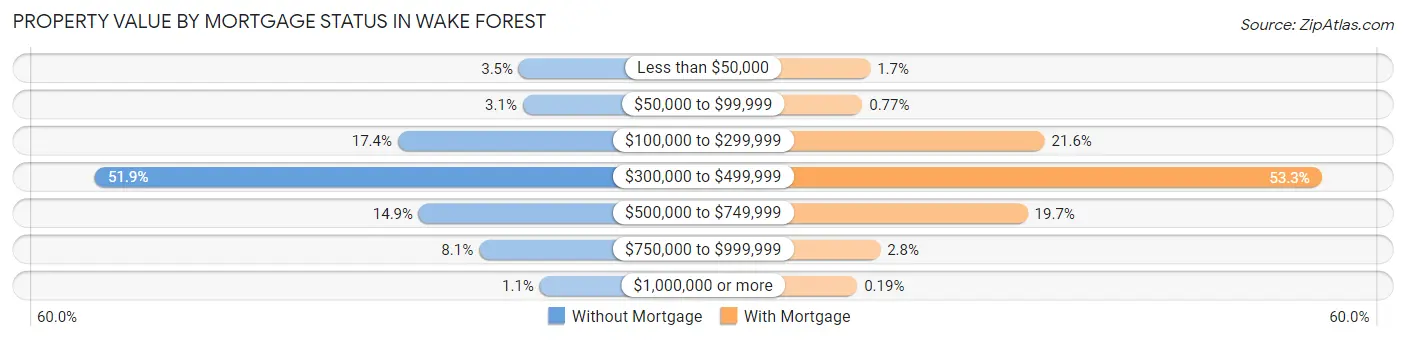
| Property Value | Without Mortgage | With Mortgage |
| Less than $50,000 | 96 (3.5%) | 162 (1.7%) |
| $50,000 to $99,999 | 84 (3.1%) | 74 (0.8%) |
| $100,000 to $299,999 | 475 (17.3%) | 2,078 (21.6%) |
| $300,000 to $499,999 | 1,422 (51.9%) | 5,122 (53.3%) |
| $500,000 to $749,999 | 409 (14.9%) | 1,892 (19.7%) |
| $750,000 to $999,999 | 221 (8.1%) | 271 (2.8%) |
| $1,000,000 or more | 31 (1.1%) | 18 (0.2%) |
| Total | 2,738 (100.0%) | 9,617 (100.0%) |
Household Income by Mortgage Status in Wake Forest
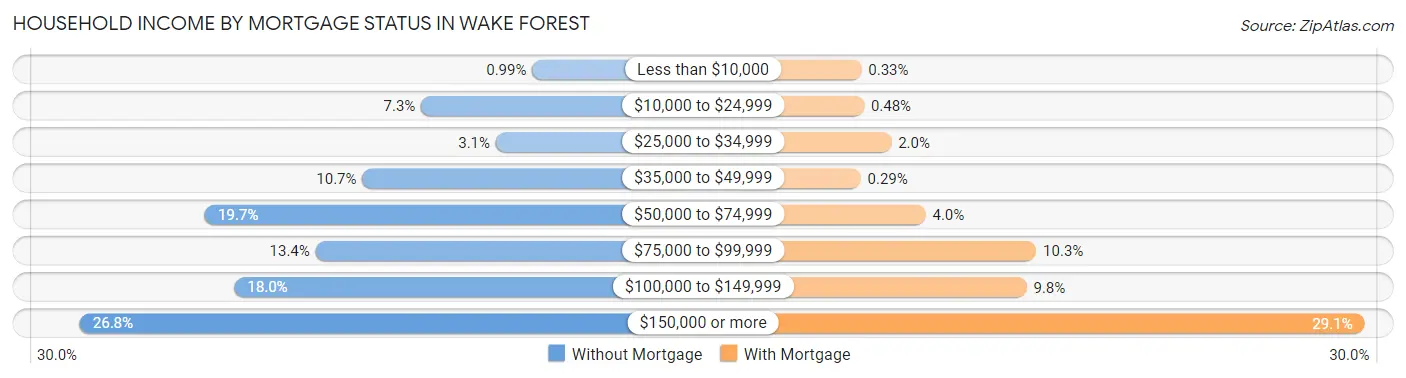
| Household Income | Without Mortgage | With Mortgage |
| Less than $10,000 | 27 (1.0%) | 32 (0.3%) |
| $10,000 to $24,999 | 201 (7.3%) | 46 (0.5%) |
| $25,000 to $34,999 | 84 (3.1%) | 196 (2.0%) |
| $35,000 to $49,999 | 293 (10.7%) | 28 (0.3%) |
| $50,000 to $74,999 | 539 (19.7%) | 385 (4.0%) |
| $75,000 to $99,999 | 366 (13.4%) | 992 (10.3%) |
| $100,000 to $149,999 | 493 (18.0%) | 940 (9.8%) |
| $150,000 or more | 735 (26.8%) | 2,797 (29.1%) |
| Total | 2,738 (100.0%) | 9,617 (100.0%) |
Property Value to Household Income Ratio in Wake Forest
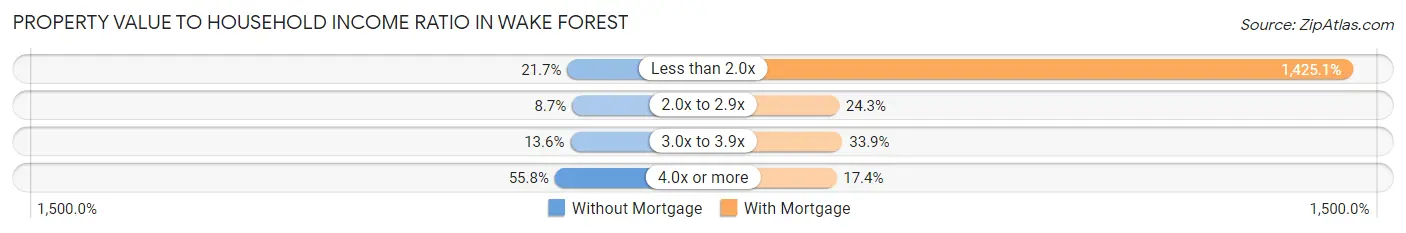
| Value-to-Income Ratio | Without Mortgage | With Mortgage |
| Less than 2.0x | 594 (21.7%) | 137,049 (1,425.1%) |
| 2.0x to 2.9x | 237 (8.7%) | 2,336 (24.3%) |
| 3.0x to 3.9x | 371 (13.6%) | 3,261 (33.9%) |
| 4.0x or more | 1,528 (55.8%) | 1,675 (17.4%) |
| Total | 2,738 (100.0%) | 9,617 (100.0%) |
Real Estate Taxes by Mortgage Status in Wake Forest
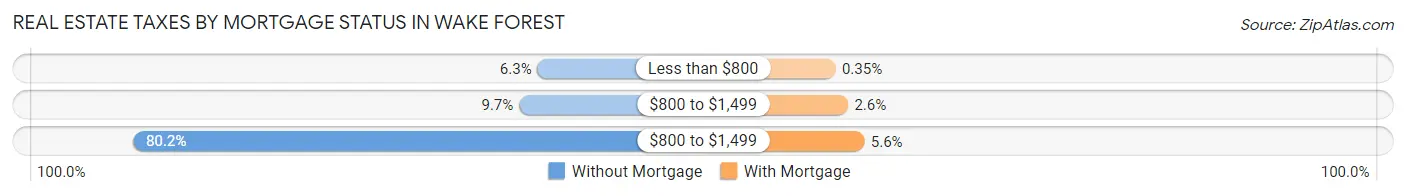
| Property Taxes | Without Mortgage | With Mortgage |
| Less than $800 | 173 (6.3%) | 34 (0.4%) |
| $800 to $1,499 | 265 (9.7%) | 253 (2.6%) |
| $800 to $1,499 | 2,196 (80.2%) | 540 (5.6%) |
| Total | 2,738 (100.0%) | 9,617 (100.0%) |
Health & Disability in Wake Forest
Health Insurance Coverage by Age in Wake Forest
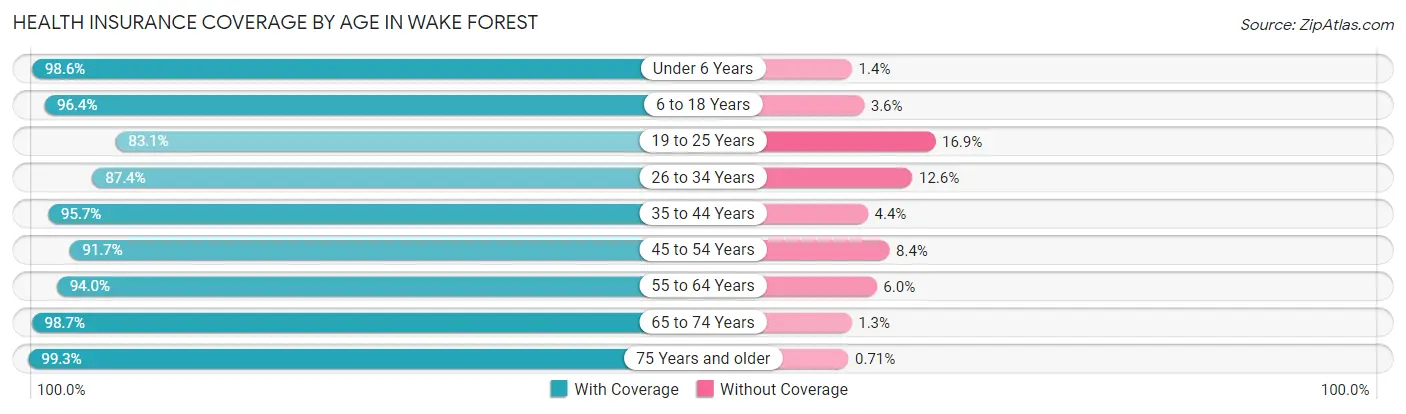
| Age Bracket | With Coverage | Without Coverage |
| Under 6 Years | 3,948 (98.6%) | 55 (1.4%) |
| 6 to 18 Years | 9,518 (96.4%) | 359 (3.6%) |
| 19 to 25 Years | 2,308 (83.1%) | 470 (16.9%) |
| 26 to 34 Years | 4,332 (87.4%) | 627 (12.6%) |
| 35 to 44 Years | 7,096 (95.7%) | 323 (4.3%) |
| 45 to 54 Years | 7,369 (91.6%) | 671 (8.4%) |
| 55 to 64 Years | 4,501 (94.0%) | 287 (6.0%) |
| 65 to 74 Years | 3,339 (98.7%) | 44 (1.3%) |
| 75 Years and older | 2,535 (99.3%) | 18 (0.7%) |
| Total | 44,946 (94.0%) | 2,854 (6.0%) |
Health Insurance Coverage by Citizenship Status in Wake Forest
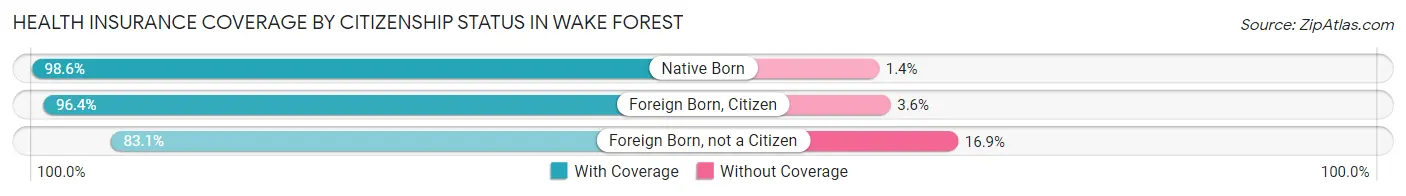
| Citizenship Status | With Coverage | Without Coverage |
| Native Born | 3,948 (98.6%) | 55 (1.4%) |
| Foreign Born, Citizen | 9,518 (96.4%) | 359 (3.6%) |
| Foreign Born, not a Citizen | 2,308 (83.1%) | 470 (16.9%) |
Health Insurance Coverage by Household Income in Wake Forest
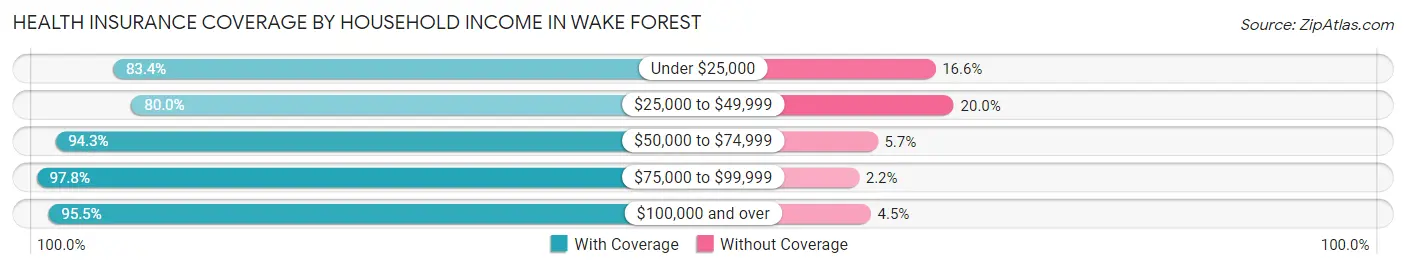
| Household Income | With Coverage | Without Coverage |
| Under $25,000 | 1,431 (83.4%) | 284 (16.6%) |
| $25,000 to $49,999 | 2,686 (80.0%) | 672 (20.0%) |
| $50,000 to $74,999 | 5,481 (94.3%) | 334 (5.7%) |
| $75,000 to $99,999 | 4,967 (97.8%) | 114 (2.2%) |
| $100,000 and over | 29,949 (95.5%) | 1,397 (4.5%) |
Public vs Private Health Insurance Coverage by Age in Wake Forest
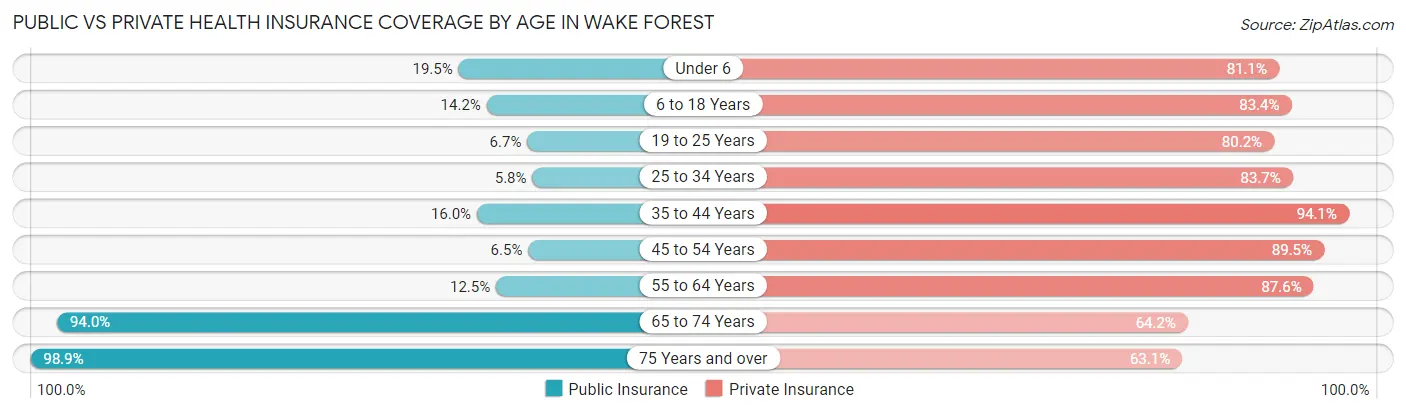
| Age Bracket | Public Insurance | Private Insurance |
| Under 6 | 779 (19.5%) | 3,247 (81.1%) |
| 6 to 18 Years | 1,406 (14.2%) | 8,240 (83.4%) |
| 19 to 25 Years | 186 (6.7%) | 2,228 (80.2%) |
| 25 to 34 Years | 285 (5.8%) | 4,149 (83.7%) |
| 35 to 44 Years | 1,190 (16.0%) | 6,981 (94.1%) |
| 45 to 54 Years | 524 (6.5%) | 7,193 (89.5%) |
| 55 to 64 Years | 598 (12.5%) | 4,192 (87.5%) |
| 65 to 74 Years | 3,180 (94.0%) | 2,172 (64.2%) |
| 75 Years and over | 2,526 (98.9%) | 1,612 (63.1%) |
| Total | 10,674 (22.3%) | 40,014 (83.7%) |
Disability Status by Sex by Age in Wake Forest
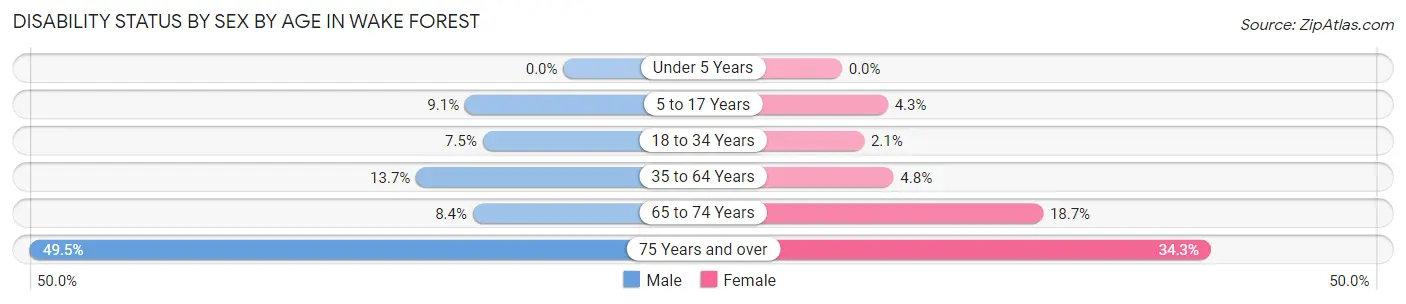
| Age Bracket | Male | Female |
| Under 5 Years | 0 (0.0%) | 0 (0.0%) |
| 5 to 17 Years | 434 (9.1%) | 210 (4.3%) |
| 18 to 34 Years | 321 (7.5%) | 86 (2.1%) |
| 35 to 64 Years | 1,352 (13.7%) | 496 (4.8%) |
| 65 to 74 Years | 128 (8.4%) | 347 (18.7%) |
| 75 Years and over | 486 (49.5%) | 538 (34.3%) |
Disability Class by Sex by Age in Wake Forest
Disability Class: Hearing Difficulty
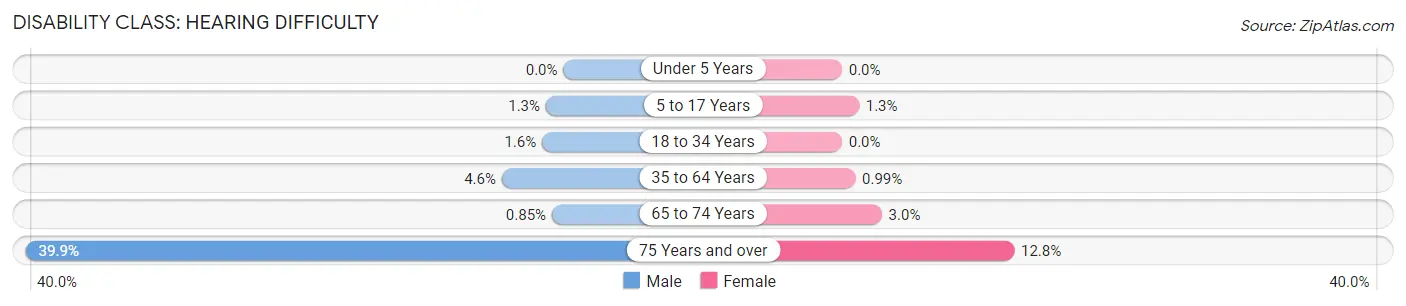
| Age Bracket | Male | Female |
| Under 5 Years | 0 (0.0%) | 0 (0.0%) |
| 5 to 17 Years | 62 (1.3%) | 62 (1.3%) |
| 18 to 34 Years | 68 (1.6%) | 0 (0.0%) |
| 35 to 64 Years | 452 (4.6%) | 102 (1.0%) |
| 65 to 74 Years | 13 (0.9%) | 55 (3.0%) |
| 75 Years and over | 392 (39.9%) | 201 (12.8%) |
Disability Class: Vision Difficulty
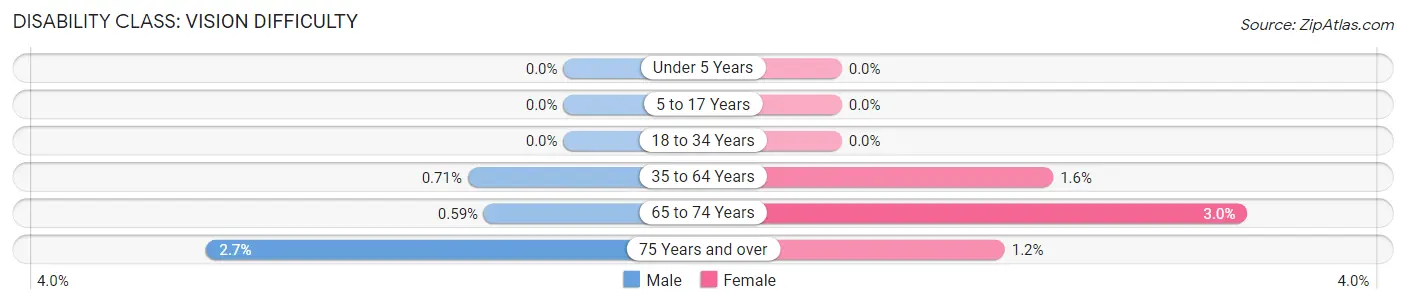
| Age Bracket | Male | Female |
| Under 5 Years | 0 (0.0%) | 0 (0.0%) |
| 5 to 17 Years | 0 (0.0%) | 0 (0.0%) |
| 18 to 34 Years | 0 (0.0%) | 0 (0.0%) |
| 35 to 64 Years | 70 (0.7%) | 162 (1.6%) |
| 65 to 74 Years | 9 (0.6%) | 56 (3.0%) |
| 75 Years and over | 26 (2.6%) | 19 (1.2%) |
Disability Class: Cognitive Difficulty
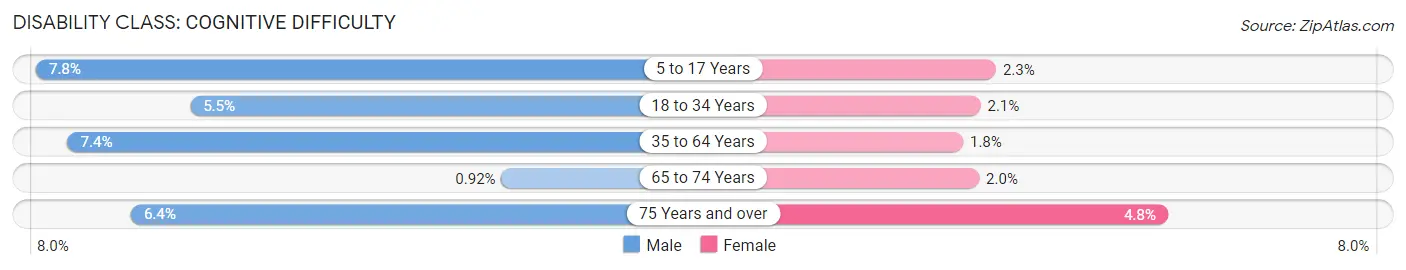
| Age Bracket | Male | Female |
| 5 to 17 Years | 372 (7.8%) | 113 (2.3%) |
| 18 to 34 Years | 238 (5.5%) | 86 (2.1%) |
| 35 to 64 Years | 728 (7.4%) | 186 (1.8%) |
| 65 to 74 Years | 14 (0.9%) | 38 (2.0%) |
| 75 Years and over | 63 (6.4%) | 76 (4.8%) |
Disability Class: Ambulatory Difficulty
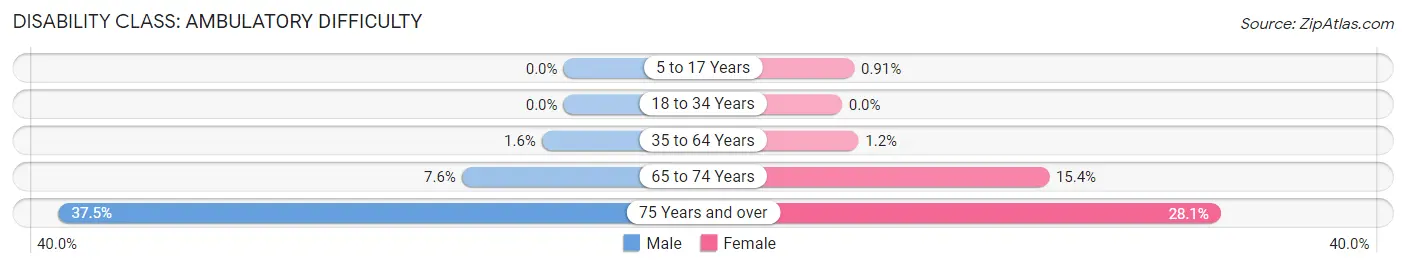
| Age Bracket | Male | Female |
| 5 to 17 Years | 0 (0.0%) | 45 (0.9%) |
| 18 to 34 Years | 0 (0.0%) | 0 (0.0%) |
| 35 to 64 Years | 159 (1.6%) | 127 (1.2%) |
| 65 to 74 Years | 115 (7.5%) | 286 (15.4%) |
| 75 Years and over | 368 (37.5%) | 442 (28.1%) |
Disability Class: Self-Care Difficulty
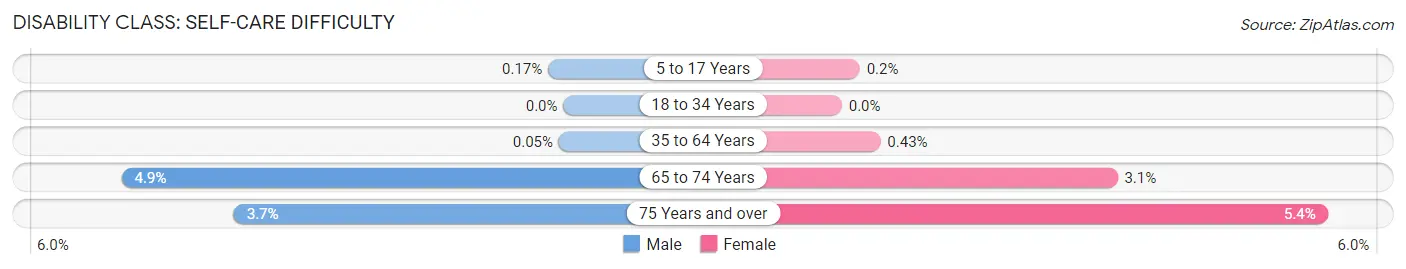
| Age Bracket | Male | Female |
| 5 to 17 Years | 8 (0.2%) | 10 (0.2%) |
| 18 to 34 Years | 0 (0.0%) | 0 (0.0%) |
| 35 to 64 Years | 5 (0.1%) | 45 (0.4%) |
| 65 to 74 Years | 75 (4.9%) | 57 (3.1%) |
| 75 Years and over | 36 (3.7%) | 85 (5.4%) |
Technology Access in Wake Forest
Computing Device Access in Wake Forest
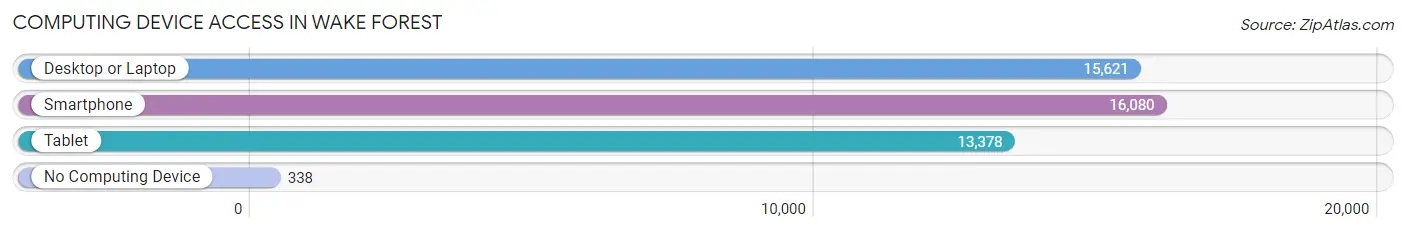
| Device Type | # Households | % Households |
| Desktop or Laptop | 15,621 | 92.9% |
| Smartphone | 16,080 | 95.7% |
| Tablet | 13,378 | 79.6% |
| No Computing Device | 338 | 2.0% |
| Total | 16,811 | 100.0% |
Internet Access in Wake Forest
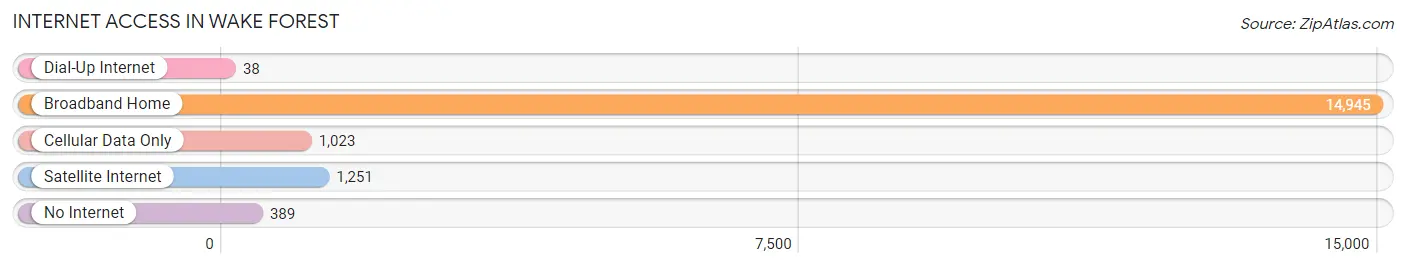
| Internet Type | # Households | % Households |
| Dial-Up Internet | 38 | 0.2% |
| Broadband Home | 14,945 | 88.9% |
| Cellular Data Only | 1,023 | 6.1% |
| Satellite Internet | 1,251 | 7.4% |
| No Internet | 389 | 2.3% |
| Total | 16,811 | 100.0% |
Wake Forest Summary
Wake Forest, North Carolina is a town located in Wake County, North Carolina. It is situated in the northeast corner of the county, just north of Raleigh, the state capital. The town has a population of approximately 30,000 people and is part of the Research Triangle metropolitan area. Wake Forest is known for its historic downtown area, which is home to a variety of shops, restaurants, and other businesses.
History
Wake Forest was founded in 1832 as the Wake Forest Manual Labor Institute, a Baptist school for men. The school was founded by the North Carolina Baptist Convention and was the first Baptist school in the state. The school was renamed Wake Forest College in 1838 and moved to its current location in Wake Forest in 1834. In 1851, the college was chartered as a university and began offering degrees in law, medicine, and theology. In 1868, the college was renamed Wake Forest University.
In the late 19th century, the town of Wake Forest began to grow around the university. The town was incorporated in 1880 and was named after the university. In the early 20th century, the town experienced a period of growth and development, with the construction of a railroad line and the establishment of several businesses.
Geography
Wake Forest is located in the northeast corner of Wake County, North Carolina. It is situated approximately 20 miles north of Raleigh, the state capital. The town is bordered by the towns of Rolesville, Youngsville, and Wake Forest to the north, and the towns of Knightdale and Wendell to the east. The town is located in the Piedmont region of North Carolina and is part of the Research Triangle metropolitan area.
The town of Wake Forest covers an area of approximately 10 square miles and is located at an elevation of approximately 400 feet above sea level. The town is situated on the banks of the Neuse River and is surrounded by rolling hills and forests. The town is home to several parks and recreational areas, including Falls Lake State Recreation Area, which is located just north of the town.
Economy
The economy of Wake Forest is largely driven by the presence of Wake Forest University. The university is the largest employer in the town, with over 4,000 employees. Other major employers in the town include WakeMed Health & Hospitals, Wake County Public Schools, and Wake Forest Baptist Medical Center.
The town is also home to a variety of small businesses, including restaurants, retail stores, and professional services. The town is also home to several technology companies, including SAS Institute, which is headquartered in the town.
Demographics
As of the 2010 census, the population of Wake Forest was 30,117. The racial makeup of the town was 79.2% White, 11.3% African American, 0.3% Native American, 4.2% Asian, 0.1% Pacific Islander, and 4.9% from other races. Hispanic or Latino of any race were 8.3% of the population.
The median household income in Wake Forest was $68,945, and the median family income was $77,837. The per capita income for the town was $32,945. About 8.2% of families and 10.7% of the population were below the poverty line, including 14.2% of those under age 18 and 6.2% of those age 65 or over.
Common Questions
What is Per Capita Income in Wake Forest?
Per Capita income in Wake Forest is $47,191.
What is the Median Family Income in Wake Forest?
Median Family Income in Wake Forest is $125,556.
What is the Median Household income in Wake Forest?
Median Household Income in Wake Forest is $115,159.
What is Income or Wage Gap in Wake Forest?
Income or Wage Gap in Wake Forest is 23.6%.
Women in Wake Forest earn 76.4 cents for every dollar earned by a man.
What is Inequality or Gini Index in Wake Forest?
Inequality or Gini Index in Wake Forest is 0.38.
What is the Total Population of Wake Forest?
Total Population of Wake Forest is 48,047.
What is the Total Male Population of Wake Forest?
Total Male Population of Wake Forest is 23,215.
What is the Total Female Population of Wake Forest?
Total Female Population of Wake Forest is 24,832.
What is the Ratio of Males per 100 Females in Wake Forest?
There are 93.49 Males per 100 Females in Wake Forest.
What is the Ratio of Females per 100 Males in Wake Forest?
There are 106.97 Females per 100 Males in Wake Forest.
What is the Median Population Age in Wake Forest?
Median Population Age in Wake Forest is 39.0 Years.
What is the Average Family Size in Wake Forest
Average Family Size in Wake Forest is 3.2 People.
What is the Average Household Size in Wake Forest
Average Household Size in Wake Forest is 2.8 People.
How Large is the Labor Force in Wake Forest?
There are 25,524 People in the Labor Forcein in Wake Forest.
What is the Percentage of People in the Labor Force in Wake Forest?
70.1% of People are in the Labor Force in Wake Forest.
What is the Unemployment Rate in Wake Forest?
Unemployment Rate in Wake Forest is 4.3%.