Ladson, SC Map & Demographics
Ladson Map

Ladson Overview
$37,413
PER CAPITA INCOME
$79,712
AVG FAMILY INCOME
$74,020
AVG HOUSEHOLD INCOME
29.9%
WAGE / INCOME GAP [ % ]
70.1¢/ $1
WAGE / INCOME GAP [ $ ]
0.51
INEQUALITY / GINI INDEX
15,298
TOTAL POPULATION
8,126
MALE POPULATION
7,172
FEMALE POPULATION
113.30
MALES / 100 FEMALES
88.26
FEMALES / 100 MALES
34.7
MEDIAN AGE
3.5
AVG FAMILY SIZE
2.8
AVG HOUSEHOLD SIZE
7,257
LABOR FORCE [ PEOPLE ]
64.1%
PERCENT IN LABOR FORCE
6.1%
UNEMPLOYMENT RATE
Ladson Zip Codes
Ladson Area Codes
Income in Ladson
Income Overview in Ladson
Per Capita Income in Ladson is $37,413, while median incomes of families and households are $79,712 and $74,020 respectively.
| Characteristic | Number | Measure |
| Per Capita Income | 15,298 | $37,413 |
| Median Family Income | 3,591 | $79,712 |
| Mean Family Income | 3,591 | $89,402 |
| Median Household Income | 5,408 | $74,020 |
| Mean Household Income | 5,408 | $101,684 |
| Income Deficit | 3,591 | $0 |
| Wage / Income Gap (%) | 15,298 | 29.91% |
| Wage / Income Gap ($) | 15,298 | 70.09¢ per $1 |
| Gini / Inequality Index | 15,298 | 0.51 |
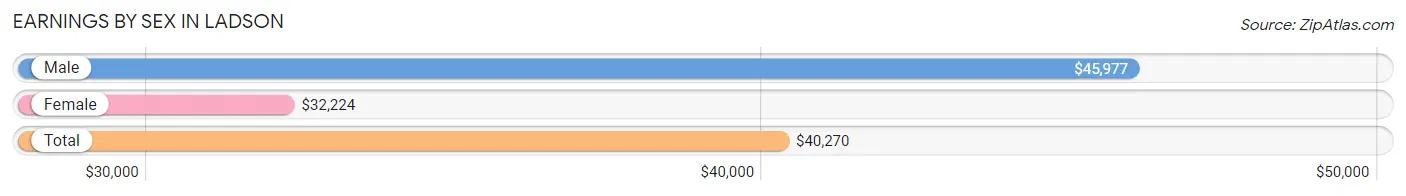
Earnings by Sex in Ladson
Average Earnings in Ladson are $40,270, $45,977 for men and $32,224 for women, a difference of 29.9%.
| Sex | Number | Average Earnings |
| Male | 4,146 (56.9%) | $45,977 |
| Female | 3,135 (43.1%) | $32,224 |
| Total | 7,281 (100.0%) | $40,270 |
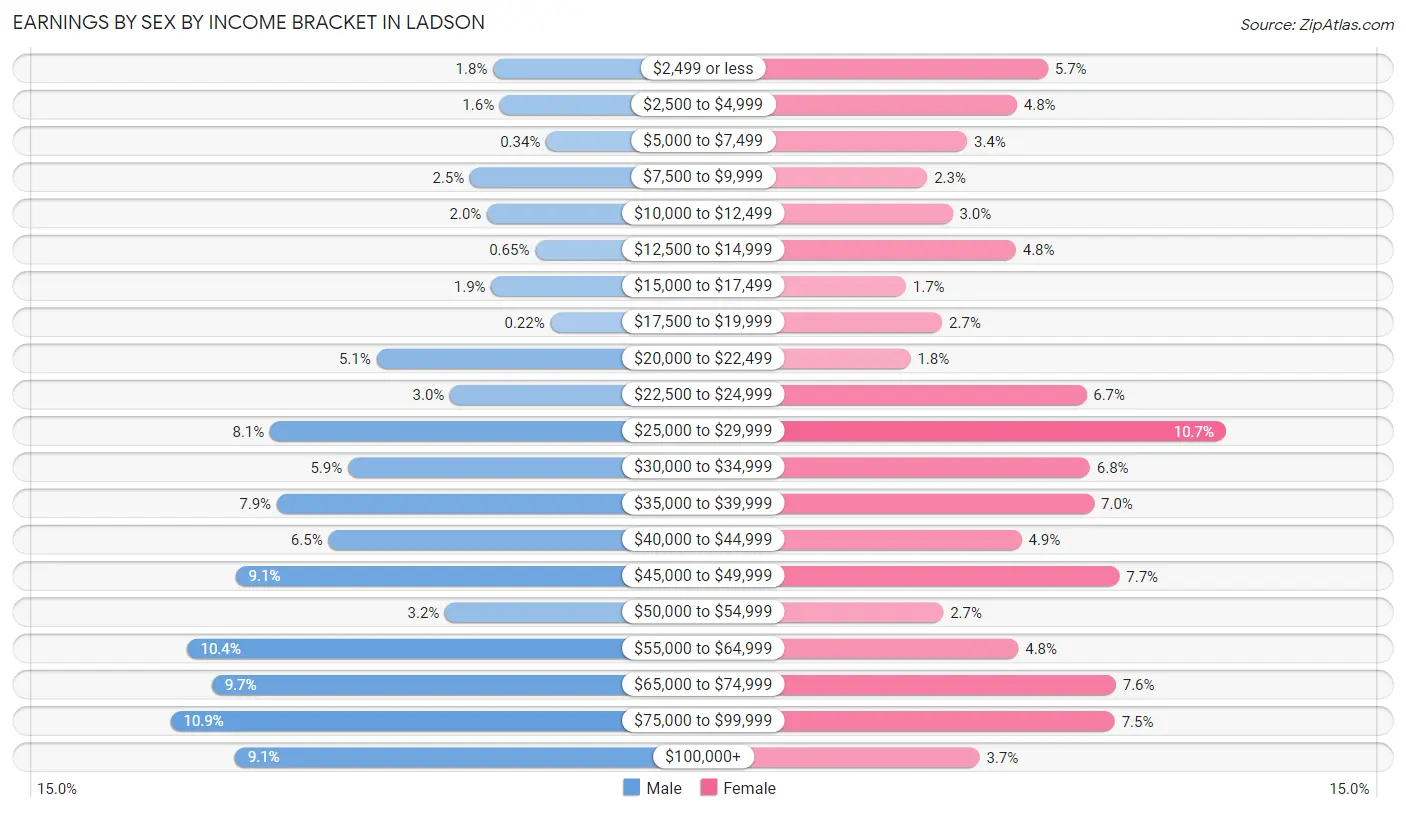
Earnings by Sex by Income Bracket in Ladson
The most common earnings brackets in Ladson are $75,000 to $99,999 for men (452 | 10.9%) and $25,000 to $29,999 for women (334 | 10.6%).
| Income | Male | Female |
| $2,499 or less | 76 (1.8%) | 177 (5.7%) |
| $2,500 to $4,999 | 68 (1.6%) | 150 (4.8%) |
| $5,000 to $7,499 | 14 (0.3%) | 106 (3.4%) |
| $7,500 to $9,999 | 103 (2.5%) | 71 (2.3%) |
| $10,000 to $12,499 | 83 (2.0%) | 93 (3.0%) |
| $12,500 to $14,999 | 27 (0.6%) | 149 (4.8%) |
| $15,000 to $17,499 | 78 (1.9%) | 52 (1.7%) |
| $17,500 to $19,999 | 9 (0.2%) | 84 (2.7%) |
| $20,000 to $22,499 | 212 (5.1%) | 56 (1.8%) |
| $22,500 to $24,999 | 126 (3.0%) | 211 (6.7%) |
| $25,000 to $29,999 | 336 (8.1%) | 334 (10.6%) |
| $30,000 to $34,999 | 245 (5.9%) | 214 (6.8%) |
| $35,000 to $39,999 | 328 (7.9%) | 218 (7.0%) |
| $40,000 to $44,999 | 268 (6.5%) | 154 (4.9%) |
| $45,000 to $49,999 | 376 (9.1%) | 240 (7.7%) |
| $50,000 to $54,999 | 132 (3.2%) | 85 (2.7%) |
| $55,000 to $64,999 | 432 (10.4%) | 151 (4.8%) |
| $65,000 to $74,999 | 404 (9.7%) | 237 (7.6%) |
| $75,000 to $99,999 | 452 (10.9%) | 236 (7.5%) |
| $100,000+ | 377 (9.1%) | 117 (3.7%) |
| Total | 4,146 (100.0%) | 3,135 (100.0%) |
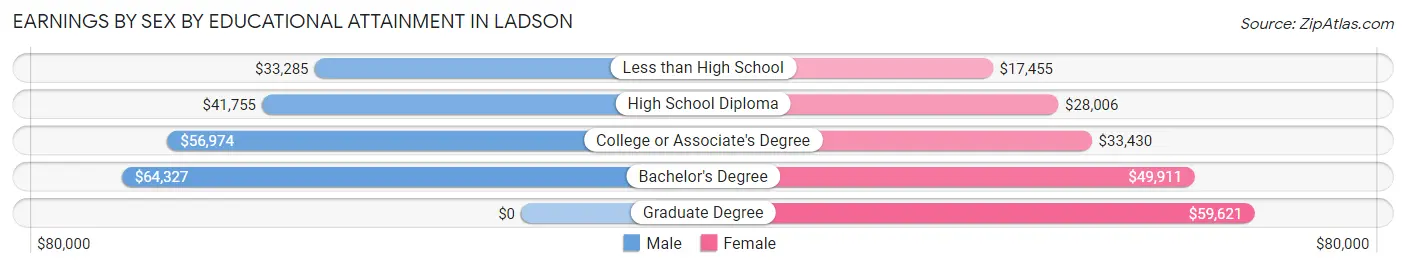
Earnings by Sex by Educational Attainment in Ladson
Average earnings in Ladson are $46,528 for men and $35,038 for women, a difference of 24.7%. Men with an educational attainment of bachelor's degree enjoy the highest average annual earnings of $64,327, while those with less than high school education earn the least with $33,285. Women with an educational attainment of graduate degree earn the most with the average annual earnings of $59,621, while those with less than high school education have the smallest earnings of $17,455.
| Educational Attainment | Male Income | Female Income |
| Less than High School | $33,285 | $17,455 |
| High School Diploma | $41,755 | $28,006 |
| College or Associate's Degree | $56,974 | $33,430 |
| Bachelor's Degree | $64,327 | $49,911 |
| Graduate Degree | - | - |
| Total | $46,528 | $35,038 |
Family Income in Ladson
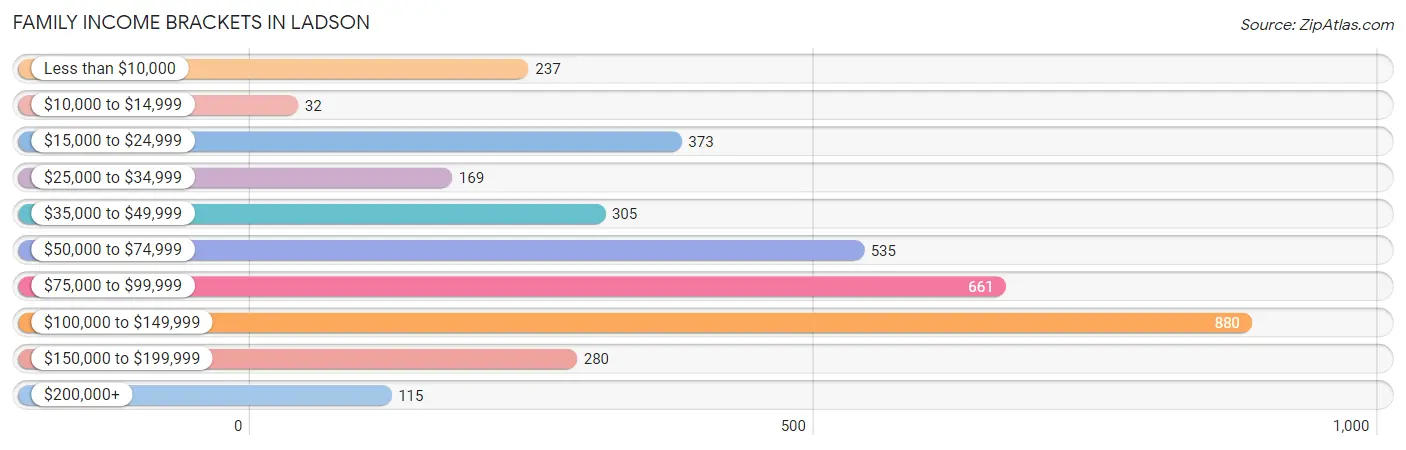
Family Income Brackets in Ladson
According to the Ladson family income data, there are 880 families falling into the $100,000 to $149,999 income range, which is the most common income bracket and makes up 24.5% of all families. Conversely, the $10,000 to $14,999 income bracket is the least frequent group with only 32 families (0.9%) belonging to this category.
| Income Bracket | # Families | % Families |
| Less than $10,000 | 237 | 6.6% |
| $10,000 to $14,999 | 32 | 0.9% |
| $15,000 to $24,999 | 373 | 10.4% |
| $25,000 to $34,999 | 169 | 4.7% |
| $35,000 to $49,999 | 305 | 8.5% |
| $50,000 to $74,999 | 535 | 14.9% |
| $75,000 to $99,999 | 661 | 18.4% |
| $100,000 to $149,999 | 880 | 24.5% |
| $150,000 to $199,999 | 280 | 7.8% |
| $200,000+ | 115 | 3.2% |
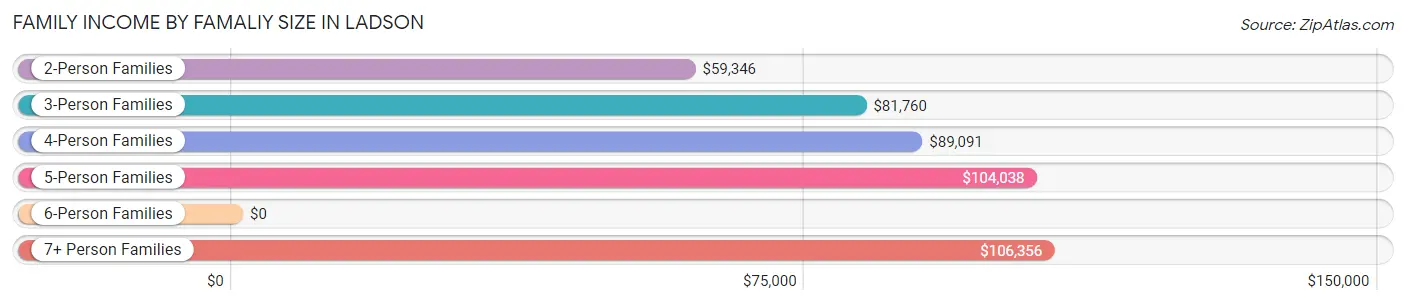
Family Income by Famaliy Size in Ladson
7+ person families (141 | 3.9%) account for the highest median family income in Ladson with $106,356 per family, while 2-person families (1,592 | 44.3%) have the highest median income of $29,673 per family member.
| Income Bracket | # Families | Median Income |
| 2-Person Families | 1,592 (44.3%) | $59,346 |
| 3-Person Families | 670 (18.7%) | $81,760 |
| 4-Person Families | 698 (19.4%) | $89,091 |
| 5-Person Families | 350 (9.8%) | $104,038 |
| 6-Person Families | 140 (3.9%) | $0 |
| 7+ Person Families | 141 (3.9%) | $106,356 |
| Total | 3,591 (100.0%) | $79,712 |
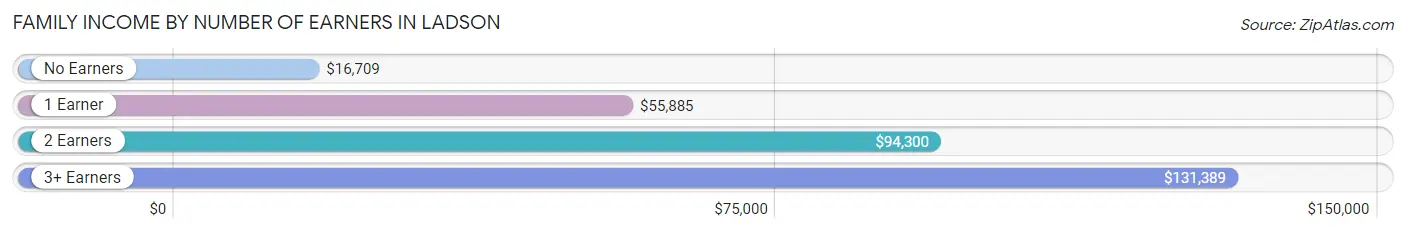
Family Income by Number of Earners in Ladson
The median family income in Ladson is $79,712, with families comprising 3+ earners (312) having the highest median family income of $131,389, while families with no earners (492) have the lowest median family income of $16,709, accounting for 8.7% and 13.7% of families, respectively.
| Number of Earners | # Families | Median Income |
| No Earners | 492 (13.7%) | $16,709 |
| 1 Earner | 1,363 (38.0%) | $55,885 |
| 2 Earners | 1,424 (39.7%) | $94,300 |
| 3+ Earners | 312 (8.7%) | $131,389 |
| Total | 3,591 (100.0%) | $79,712 |
Household Income in Ladson
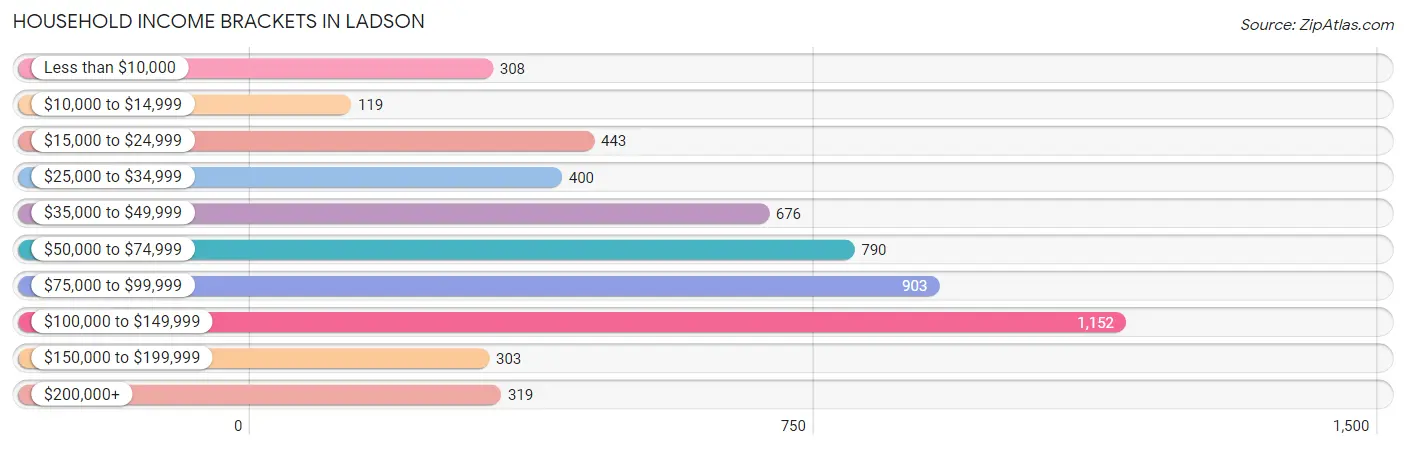
Household Income Brackets in Ladson
With 1,152 households falling in the category, the $100,000 to $149,999 income range is the most frequent in Ladson, accounting for 21.3% of all households. In contrast, only 119 households (2.2%) fall into the $10,000 to $14,999 income bracket, making it the least populous group.
| Income Bracket | # Households | % Households |
| Less than $10,000 | 308 | 5.7% |
| $10,000 to $14,999 | 119 | 2.2% |
| $15,000 to $24,999 | 443 | 8.2% |
| $25,000 to $34,999 | 400 | 7.4% |
| $35,000 to $49,999 | 676 | 12.5% |
| $50,000 to $74,999 | 790 | 14.6% |
| $75,000 to $99,999 | 903 | 16.7% |
| $100,000 to $149,999 | 1,152 | 21.3% |
| $150,000 to $199,999 | 303 | 5.6% |
| $200,000+ | 319 | 5.9% |
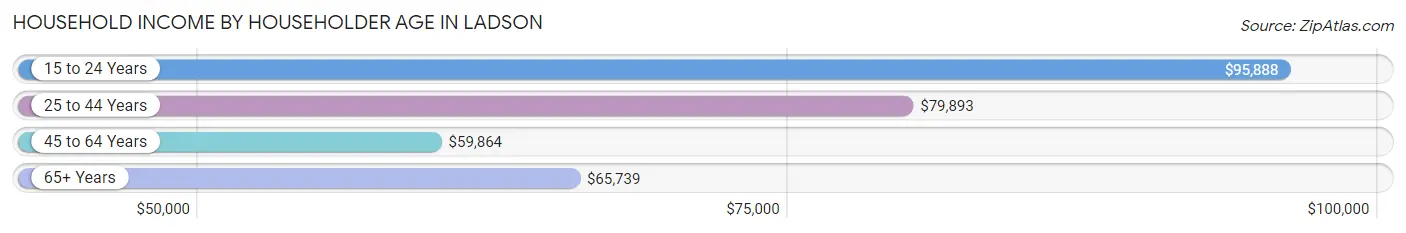
Household Income by Householder Age in Ladson
The median household income in Ladson is $74,020, with the highest median household income of $95,888 found in the 15 to 24 years age bracket for the primary householder. A total of 224 households (4.1%) fall into this category. Meanwhile, the 45 to 64 years age bracket for the primary householder has the lowest median household income of $59,864, with 1,944 households (35.9%) in this group.
| Income Bracket | # Households | Median Income |
| 15 to 24 Years | 224 (4.1%) | $95,888 |
| 25 to 44 Years | 2,005 (37.1%) | $79,893 |
| 45 to 64 Years | 1,944 (35.9%) | $59,864 |
| 65+ Years | 1,235 (22.8%) | $65,739 |
| Total | 5,408 (100.0%) | $74,020 |
Poverty in Ladson
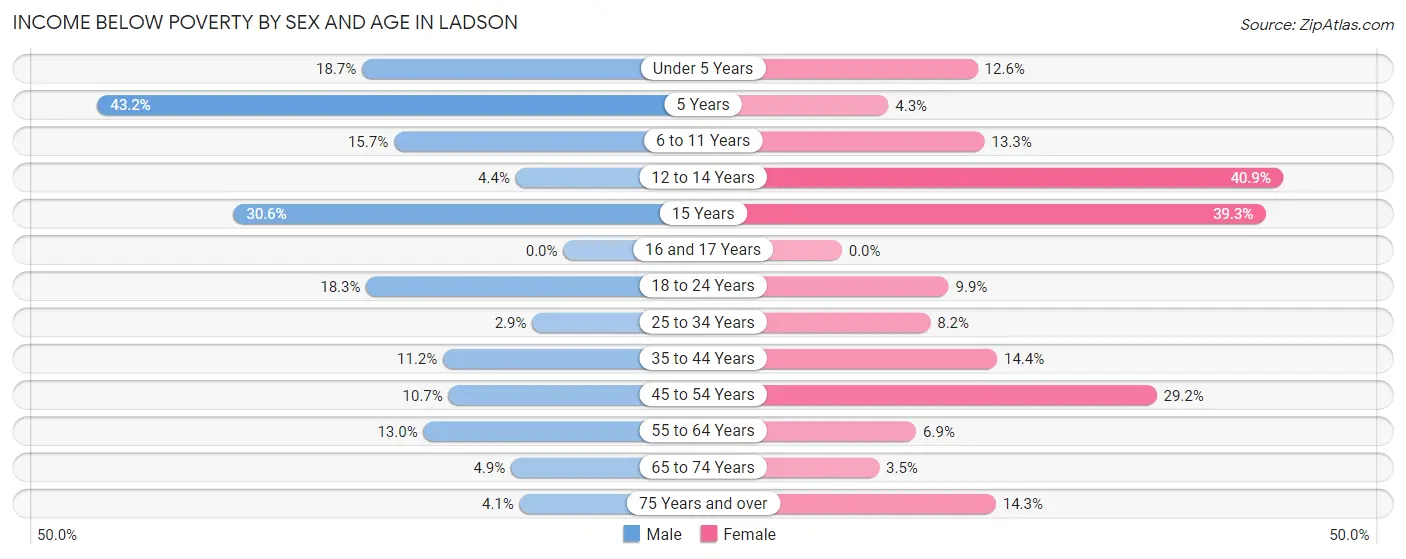
Income Below Poverty by Sex and Age in Ladson
With 11.9% poverty level for males and 14.2% for females among the residents of Ladson, 5 year old males and 12 to 14 year old females are the most vulnerable to poverty, with 96 males (43.2%) and 196 females (40.9%) in their respective age groups living below the poverty level.
| Age Bracket | Male | Female |
| Under 5 Years | 85 (18.7%) | 45 (12.6%) |
| 5 Years | 96 (43.2%) | 7 (4.3%) |
| 6 to 11 Years | 141 (15.7%) | 82 (13.3%) |
| 12 to 14 Years | 18 (4.4%) | 196 (40.9%) |
| 15 Years | 94 (30.6%) | 22 (39.3%) |
| 16 and 17 Years | 0 (0.0%) | 0 (0.0%) |
| 18 to 24 Years | 139 (18.3%) | 58 (9.9%) |
| 25 to 34 Years | 34 (2.9%) | 67 (8.2%) |
| 35 to 44 Years | 128 (11.2%) | 155 (14.4%) |
| 45 to 54 Years | 99 (10.6%) | 236 (29.2%) |
| 55 to 64 Years | 92 (13.0%) | 74 (6.9%) |
| 65 to 74 Years | 27 (4.9%) | 17 (3.5%) |
| 75 Years and over | 13 (4.1%) | 60 (14.3%) |
| Total | 966 (11.9%) | 1,019 (14.2%) |
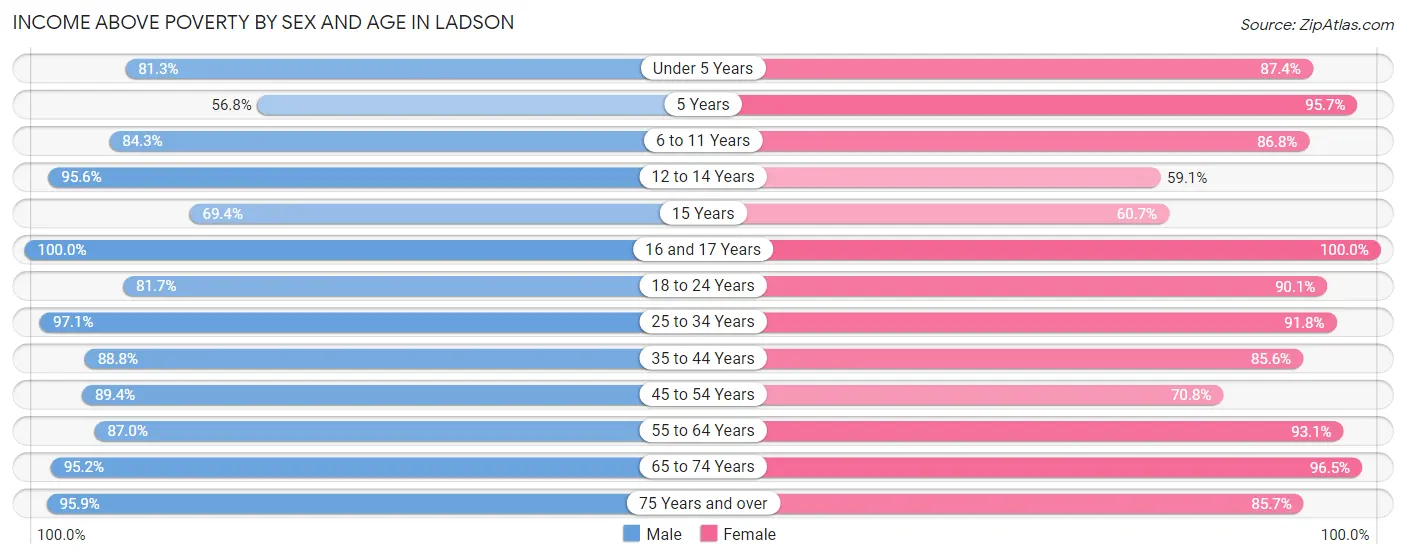
Income Above Poverty by Sex and Age in Ladson
According to the poverty statistics in Ladson, males aged 16 and 17 years and females aged 16 and 17 years are the age groups that are most secure financially, with 100.0% of males and 100.0% of females in these age groups living above the poverty line.
| Age Bracket | Male | Female |
| Under 5 Years | 370 (81.3%) | 312 (87.4%) |
| 5 Years | 126 (56.8%) | 155 (95.7%) |
| 6 to 11 Years | 756 (84.3%) | 537 (86.8%) |
| 12 to 14 Years | 389 (95.6%) | 283 (59.1%) |
| 15 Years | 213 (69.4%) | 34 (60.7%) |
| 16 and 17 Years | 226 (100.0%) | 222 (100.0%) |
| 18 to 24 Years | 621 (81.7%) | 527 (90.1%) |
| 25 to 34 Years | 1,147 (97.1%) | 749 (91.8%) |
| 35 to 44 Years | 1,019 (88.8%) | 921 (85.6%) |
| 45 to 54 Years | 831 (89.3%) | 572 (70.8%) |
| 55 to 64 Years | 617 (87.0%) | 999 (93.1%) |
| 65 to 74 Years | 530 (95.2%) | 474 (96.5%) |
| 75 Years and over | 307 (95.9%) | 360 (85.7%) |
| Total | 7,152 (88.1%) | 6,145 (85.8%) |
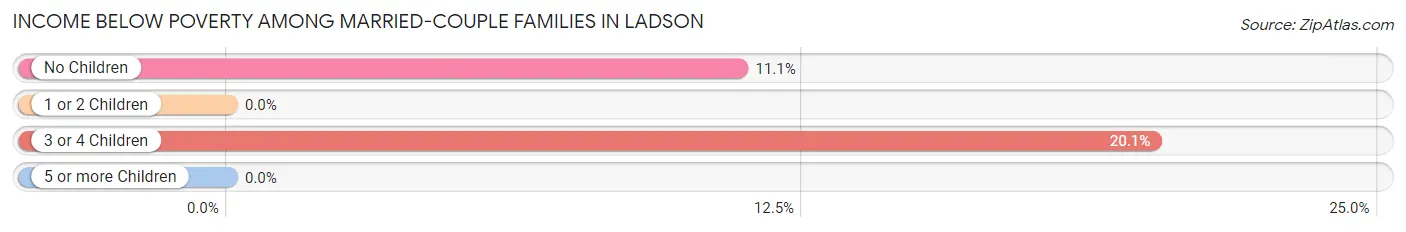
Income Below Poverty Among Married-Couple Families in Ladson
The poverty statistics for married-couple families in Ladson show that 8.8% or 194 of the total 2,203 families live below the poverty line. Families with 3 or 4 children have the highest poverty rate of 20.1%, comprising of 75 families. On the other hand, families with 1 or 2 children have the lowest poverty rate of 0.0%, which includes 0 families.
| Children | Above Poverty | Below Poverty |
| No Children | 952 (88.9%) | 119 (11.1%) |
| 1 or 2 Children | 759 (100.0%) | 0 (0.0%) |
| 3 or 4 Children | 298 (79.9%) | 75 (20.1%) |
| 5 or more Children | 0 (0.0%) | 0 (0.0%) |
| Total | 2,009 (91.2%) | 194 (8.8%) |
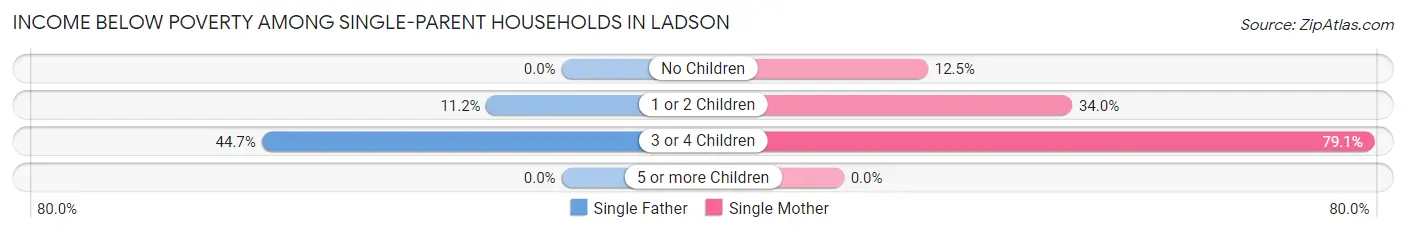
Income Below Poverty Among Single-Parent Households in Ladson
According to the poverty data in Ladson, 10.2% or 57 single-father households and 25.5% or 211 single-mother households are living below the poverty line. Among single-father households, those with 3 or 4 children have the highest poverty rate, with 21 households (44.7%) experiencing poverty. Likewise, among single-mother households, those with 3 or 4 children have the highest poverty rate, with 53 households (79.1%) falling below the poverty line.
| Children | Single Father | Single Mother |
| No Children | 0 (0.0%) | 59 (12.5%) |
| 1 or 2 Children | 36 (11.2%) | 99 (34.0%) |
| 3 or 4 Children | 21 (44.7%) | 53 (79.1%) |
| 5 or more Children | 0 (0.0%) | 0 (0.0%) |
| Total | 57 (10.2%) | 211 (25.5%) |
Income Below Poverty Among Married-Couple vs Single-Parent Households in Ladson
The poverty data for Ladson shows that 194 of the married-couple family households (8.8%) and 268 of the single-parent households (19.3%) are living below the poverty level. Within the married-couple family households, those with 3 or 4 children have the highest poverty rate, with 75 households (20.1%) falling below the poverty line. Among the single-parent households, those with 3 or 4 children have the highest poverty rate, with 74 household (64.9%) living below poverty.
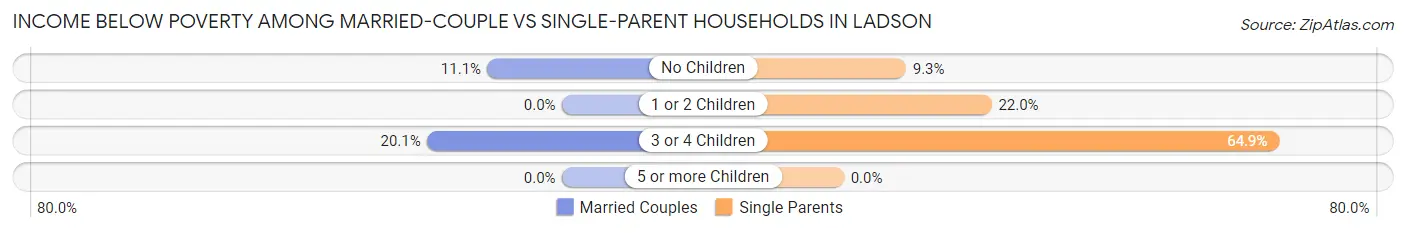
| Children | Married-Couple Families | Single-Parent Households |
| No Children | 119 (11.1%) | 59 (9.3%) |
| 1 or 2 Children | 0 (0.0%) | 135 (22.0%) |
| 3 or 4 Children | 75 (20.1%) | 74 (64.9%) |
| 5 or more Children | 0 (0.0%) | 0 (0.0%) |
| Total | 194 (8.8%) | 268 (19.3%) |
Race in Ladson
The most populous races in Ladson are White / Caucasian (7,864 | 51.4%), Black / African American (4,417 | 28.9%), and Hispanic or Latino (1,419 | 9.3%).
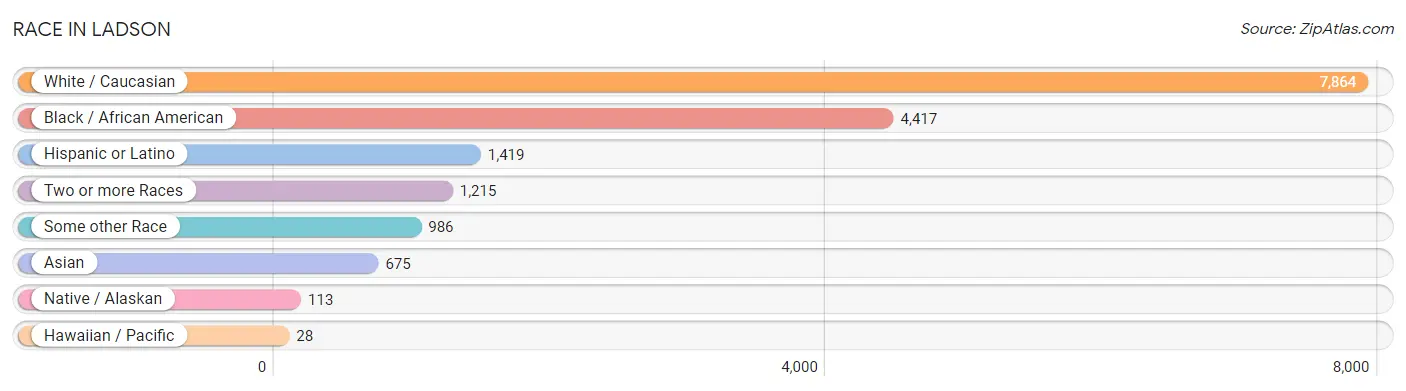
| Race | # Population | % Population |
| Asian | 675 | 4.4% |
| Black / African American | 4,417 | 28.9% |
| Hawaiian / Pacific | 28 | 0.2% |
| Hispanic or Latino | 1,419 | 9.3% |
| Native / Alaskan | 113 | 0.7% |
| White / Caucasian | 7,864 | 51.4% |
| Two or more Races | 1,215 | 7.9% |
| Some other Race | 986 | 6.5% |
| Total | 15,298 | 100.0% |
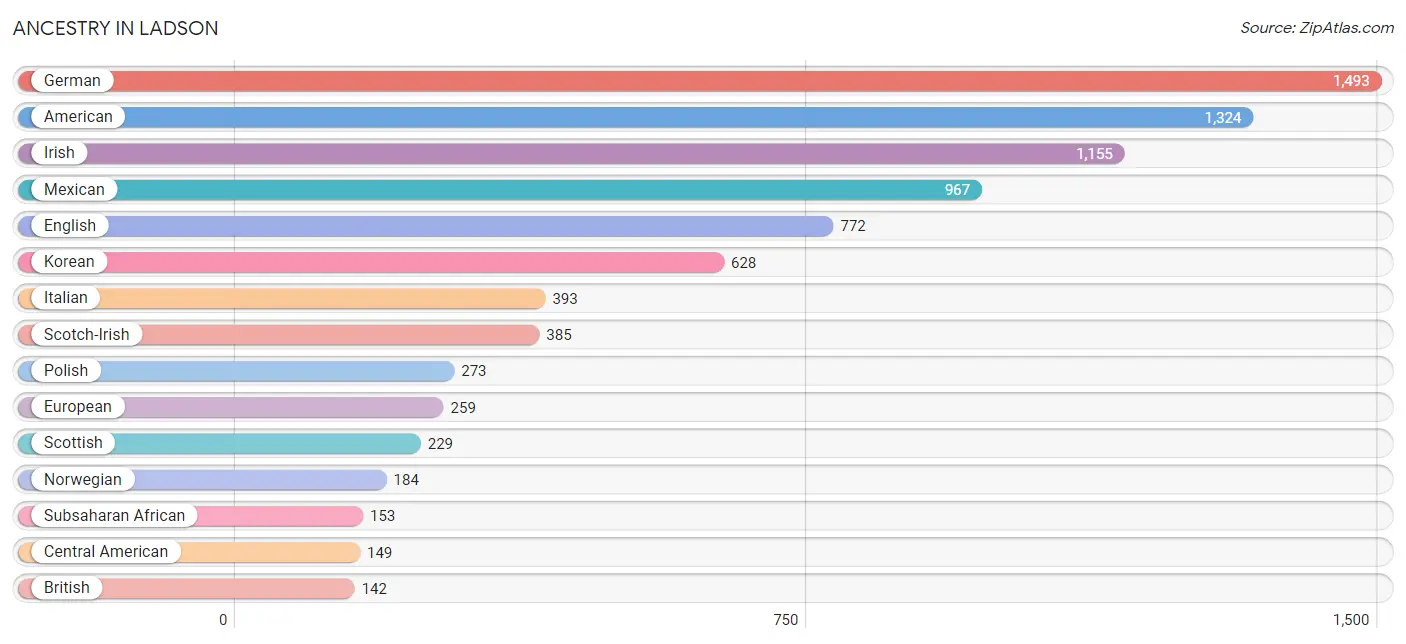
Ancestry in Ladson
The most populous ancestries reported in Ladson are German (1,493 | 9.8%), American (1,324 | 8.6%), Irish (1,155 | 7.5%), Mexican (967 | 6.3%), and English (772 | 5.1%), together accounting for 37.3% of all Ladson residents.
| Ancestry | # Population | % Population |
| African | 123 | 0.8% |
| American | 1,324 | 8.6% |
| Arab | 56 | 0.4% |
| Bhutanese | 1 | 0.0% |
| Blackfeet | 8 | 0.1% |
| British | 142 | 0.9% |
| Burmese | 21 | 0.1% |
| Central American | 149 | 1.0% |
| Cherokee | 35 | 0.2% |
| Chippewa | 7 | 0.1% |
| Colombian | 16 | 0.1% |
| Danish | 11 | 0.1% |
| Dominican | 58 | 0.4% |
| Dutch | 12 | 0.1% |
| English | 772 | 5.1% |
| European | 259 | 1.7% |
| French | 60 | 0.4% |
| French Canadian | 51 | 0.3% |
| German | 1,493 | 9.8% |
| Greek | 32 | 0.2% |
| Honduran | 25 | 0.2% |
| Hungarian | 8 | 0.1% |
| Indian (Asian) | 16 | 0.1% |
| Irish | 1,155 | 7.5% |
| Italian | 393 | 2.6% |
| Jamaican | 29 | 0.2% |
| Korean | 628 | 4.1% |
| Lebanese | 56 | 0.4% |
| Lithuanian | 12 | 0.1% |
| Lumbee | 27 | 0.2% |
| Mexican | 967 | 6.3% |
| Native Hawaiian | 14 | 0.1% |
| Northern European | 11 | 0.1% |
| Norwegian | 184 | 1.2% |
| Pakistani | 45 | 0.3% |
| Pennsylvania German | 7 | 0.1% |
| Peruvian | 37 | 0.2% |
| Polish | 273 | 1.8% |
| Portuguese | 33 | 0.2% |
| Potawatomi | 7 | 0.1% |
| Puerto Rican | 71 | 0.5% |
| Romanian | 15 | 0.1% |
| Russian | 9 | 0.1% |
| Salvadoran | 124 | 0.8% |
| Scandinavian | 63 | 0.4% |
| Scotch-Irish | 385 | 2.5% |
| Scottish | 229 | 1.5% |
| Seminole | 5 | 0.0% |
| Slovak | 29 | 0.2% |
| South American | 53 | 0.4% |
| Spaniard | 18 | 0.1% |
| Spanish | 103 | 0.7% |
| Sri Lankan | 39 | 0.3% |
| Subsaharan African | 153 | 1.0% |
| Swedish | 26 | 0.2% |
| Vietnamese | 69 | 0.4% |
| Welsh | 75 | 0.5% |
| Zimbabwean | 30 | 0.2% | View All 58 Rows |
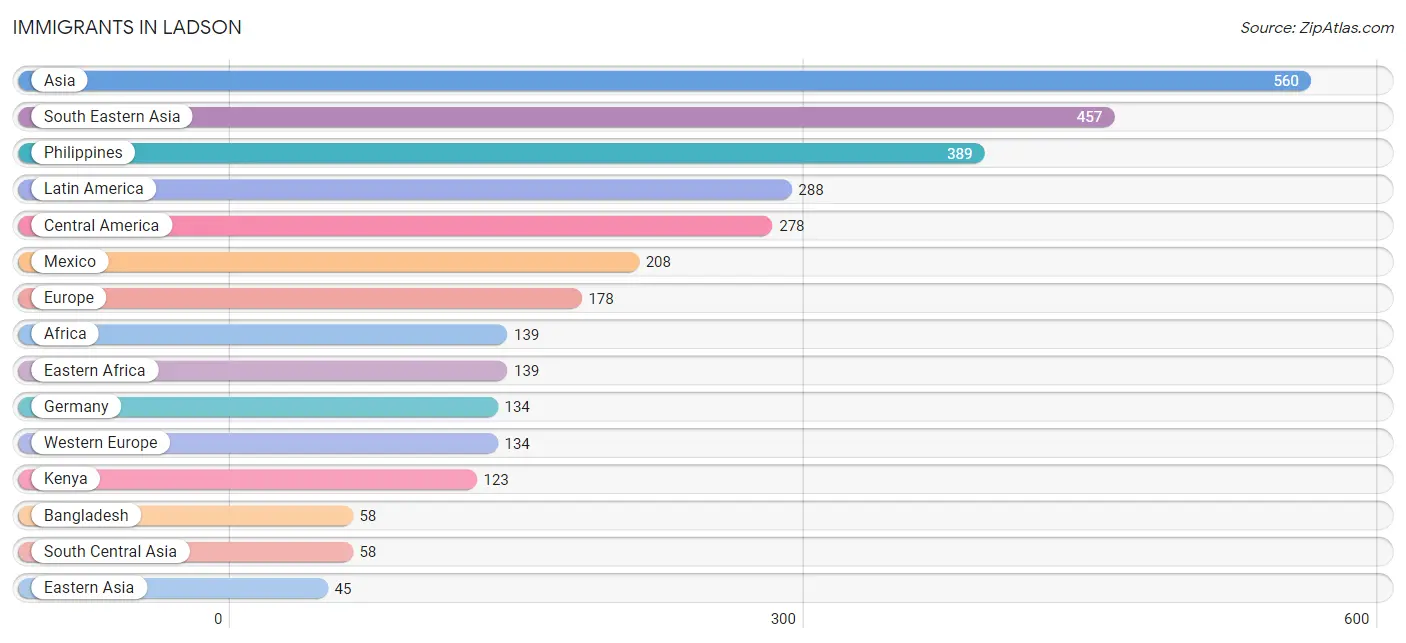
Immigrants in Ladson
The most numerous immigrant groups reported in Ladson came from Asia (560 | 3.7%), South Eastern Asia (457 | 3.0%), Philippines (389 | 2.5%), Latin America (288 | 1.9%), and Central America (278 | 1.8%), together accounting for 12.9% of all Ladson residents.
| Immigration Origin | # Population | % Population |
| Africa | 139 | 0.9% |
| Asia | 560 | 3.7% |
| Bangladesh | 58 | 0.4% |
| Central America | 278 | 1.8% |
| China | 24 | 0.2% |
| Eastern Africa | 139 | 0.9% |
| Eastern Asia | 45 | 0.3% |
| Eastern Europe | 26 | 0.2% |
| El Salvador | 45 | 0.3% |
| Europe | 178 | 1.2% |
| Germany | 134 | 0.9% |
| Honduras | 25 | 0.2% |
| Kenya | 123 | 0.8% |
| Korea | 21 | 0.1% |
| Latin America | 288 | 1.9% |
| Mexico | 208 | 1.4% |
| Peru | 10 | 0.1% |
| Philippines | 389 | 2.5% |
| Poland | 26 | 0.2% |
| South America | 10 | 0.1% |
| South Central Asia | 58 | 0.4% |
| South Eastern Asia | 457 | 3.0% |
| Southern Europe | 18 | 0.1% |
| Spain | 18 | 0.1% |
| Taiwan | 24 | 0.2% |
| Thailand | 30 | 0.2% |
| Vietnam | 38 | 0.3% |
| Western Europe | 134 | 0.9% |
| Zimbabwe | 16 | 0.1% | View All 29 Rows |
Sex and Age in Ladson
Sex and Age in Ladson
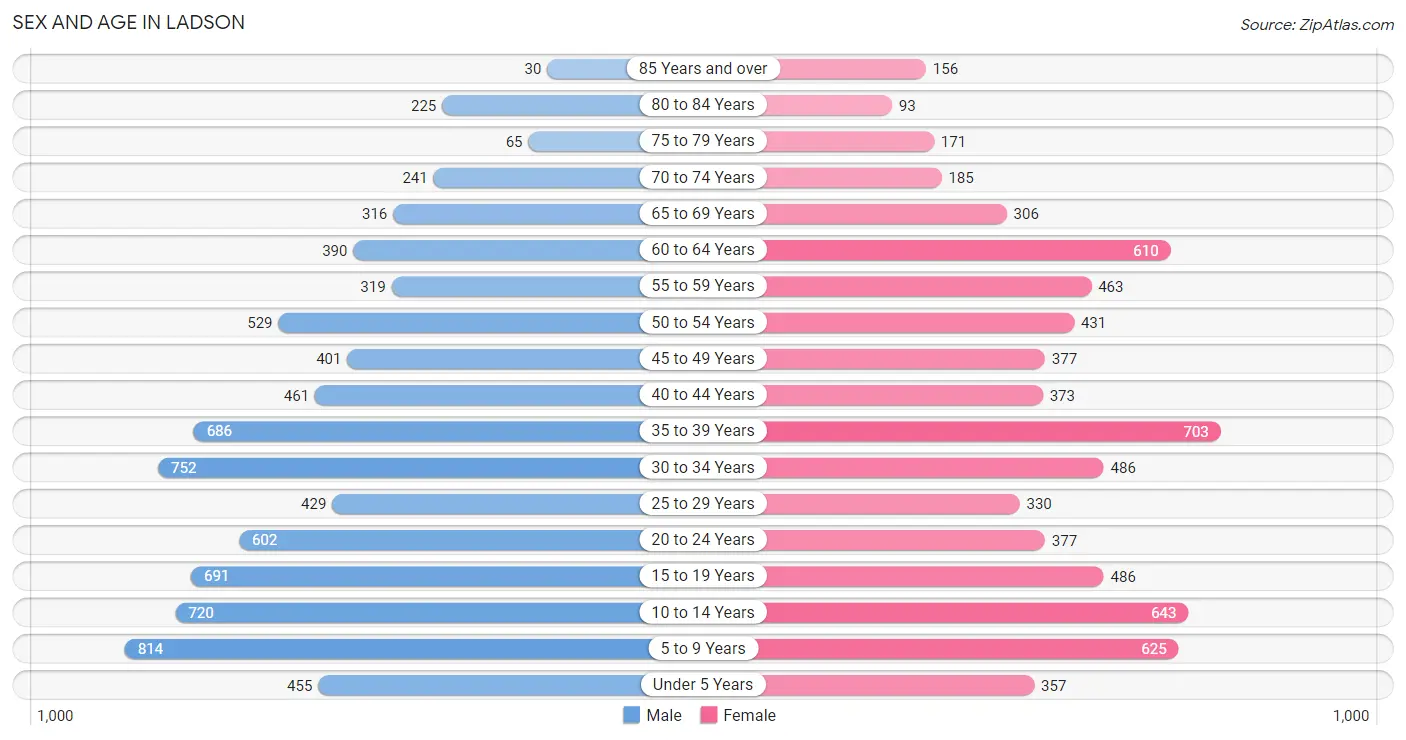
The most populous age groups in Ladson are 5 to 9 Years (814 | 10.0%) for men and 35 to 39 Years (703 | 9.8%) for women.
| Age Bracket | Male | Female |
| Under 5 Years | 455 (5.6%) | 357 (5.0%) |
| 5 to 9 Years | 814 (10.0%) | 625 (8.7%) |
| 10 to 14 Years | 720 (8.9%) | 643 (9.0%) |
| 15 to 19 Years | 691 (8.5%) | 486 (6.8%) |
| 20 to 24 Years | 602 (7.4%) | 377 (5.3%) |
| 25 to 29 Years | 429 (5.3%) | 330 (4.6%) |
| 30 to 34 Years | 752 (9.2%) | 486 (6.8%) |
| 35 to 39 Years | 686 (8.4%) | 703 (9.8%) |
| 40 to 44 Years | 461 (5.7%) | 373 (5.2%) |
| 45 to 49 Years | 401 (4.9%) | 377 (5.3%) |
| 50 to 54 Years | 529 (6.5%) | 431 (6.0%) |
| 55 to 59 Years | 319 (3.9%) | 463 (6.5%) |
| 60 to 64 Years | 390 (4.8%) | 610 (8.5%) |
| 65 to 69 Years | 316 (3.9%) | 306 (4.3%) |
| 70 to 74 Years | 241 (3.0%) | 185 (2.6%) |
| 75 to 79 Years | 65 (0.8%) | 171 (2.4%) |
| 80 to 84 Years | 225 (2.8%) | 93 (1.3%) |
| 85 Years and over | 30 (0.4%) | 156 (2.2%) |
| Total | 8,126 (100.0%) | 7,172 (100.0%) |
Families and Households in Ladson
Median Family Size in Ladson
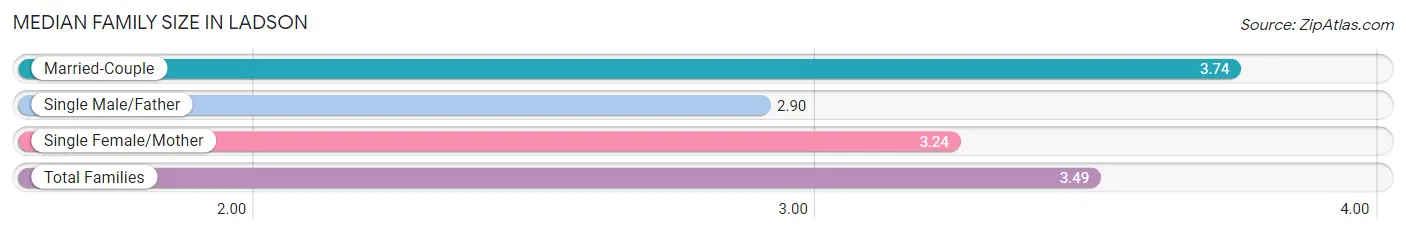
The median family size in Ladson is 3.49 persons per family, with married-couple families (2,203 | 61.4%) accounting for the largest median family size of 3.74 persons per family. On the other hand, single male/father families (559 | 15.6%) represent the smallest median family size with 2.90 persons per family.
| Family Type | # Families | Family Size |
| Married-Couple | 2,203 (61.4%) | 3.74 |
| Single Male/Father | 559 (15.6%) | 2.90 |
| Single Female/Mother | 829 (23.1%) | 3.24 |
| Total Families | 3,591 (100.0%) | 3.49 |
Median Household Size in Ladson
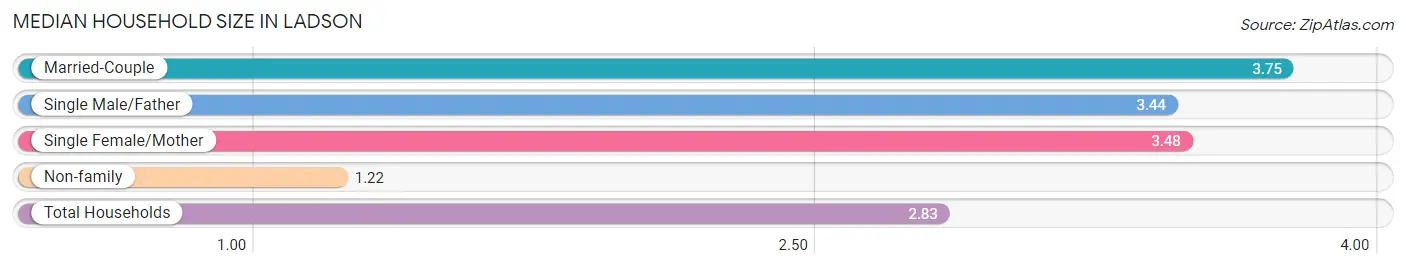
The median household size in Ladson is 2.83 persons per household, with married-couple households (2,203 | 40.7%) accounting for the largest median household size of 3.75 persons per household. non-family households (1,817 | 33.6%) represent the smallest median household size with 1.22 persons per household.
| Household Type | # Households | Household Size |
| Married-Couple | 2,203 (40.7%) | 3.75 |
| Single Male/Father | 559 (10.3%) | 3.44 |
| Single Female/Mother | 829 (15.3%) | 3.48 |
| Non-family | 1,817 (33.6%) | 1.22 |
| Total Households | 5,408 (100.0%) | 2.83 |
Household Size by Marriage Status in Ladson
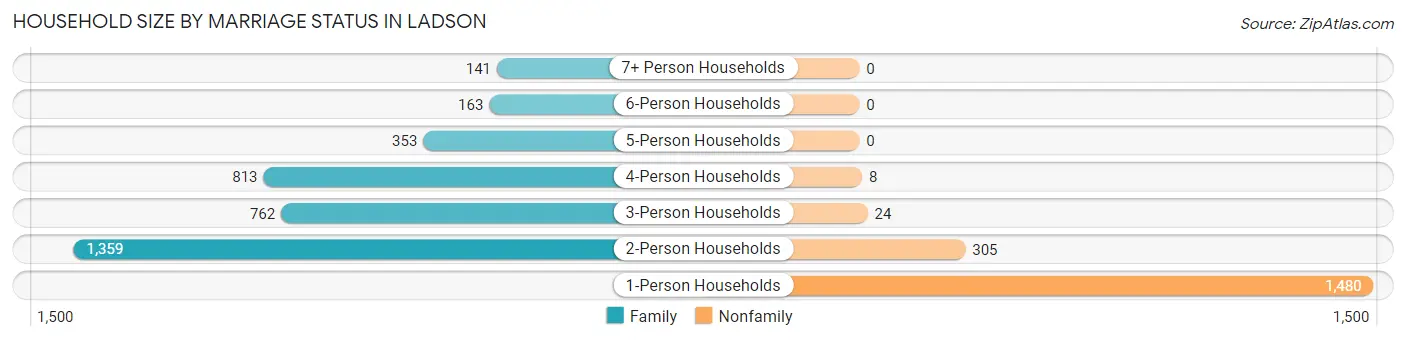
Out of a total of 5,408 households in Ladson, 3,591 (66.4%) are family households, while 1,817 (33.6%) are nonfamily households. The most numerous type of family households are 2-person households, comprising 1,359, and the most common type of nonfamily households are 1-person households, comprising 1,480.
| Household Size | Family Households | Nonfamily Households |
| 1-Person Households | - | 1,480 (27.4%) |
| 2-Person Households | 1,359 (25.1%) | 305 (5.6%) |
| 3-Person Households | 762 (14.1%) | 24 (0.4%) |
| 4-Person Households | 813 (15.0%) | 8 (0.2%) |
| 5-Person Households | 353 (6.5%) | 0 (0.0%) |
| 6-Person Households | 163 (3.0%) | 0 (0.0%) |
| 7+ Person Households | 141 (2.6%) | 0 (0.0%) |
| Total | 3,591 (66.4%) | 1,817 (33.6%) |
Female Fertility in Ladson
Fertility by Age in Ladson
Average fertility rate in Ladson is 56.0 births per 1,000 women. Women in the age bracket of 20 to 34 years have the highest fertility rate with 91.0 births per 1,000 women. Women in the age bracket of 20 to 34 years acount for 59.3% of all women with births.
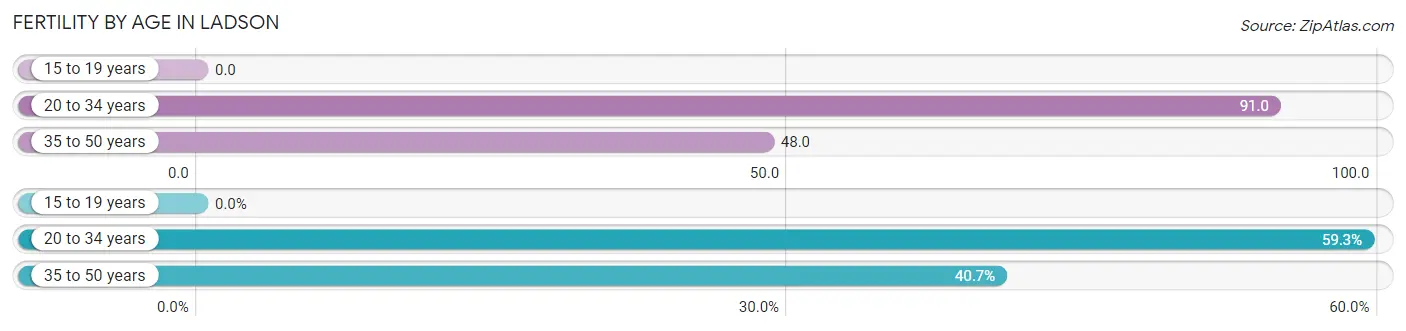
| Age Bracket | Women with Births | Births / 1,000 Women |
| 15 to 19 years | 0 (0.0%) | 0.0 |
| 20 to 34 years | 108 (59.3%) | 91.0 |
| 35 to 50 years | 74 (40.7%) | 48.0 |
| Total | 182 (100.0%) | 56.0 |
Fertility by Age by Marriage Status in Ladson
69.8% of women with births (182) in Ladson are married. The highest percentage of unmarried women with births falls into 20 to 34 years age bracket with 50.9% of them unmarried at the time of birth, while the lowest percentage of unmarried women with births belong to 35 to 50 years age bracket with 0.0% of them unmarried.
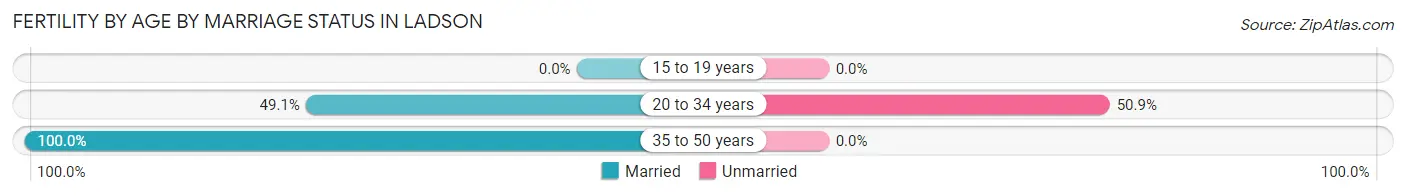
| Age Bracket | Married | Unmarried |
| 15 to 19 years | 0 (0.0%) | 0 (0.0%) |
| 20 to 34 years | 53 (49.1%) | 55 (50.9%) |
| 35 to 50 years | 74 (100.0%) | 0 (0.0%) |
| Total | 127 (69.8%) | 55 (30.2%) |
Fertility by Education in Ladson
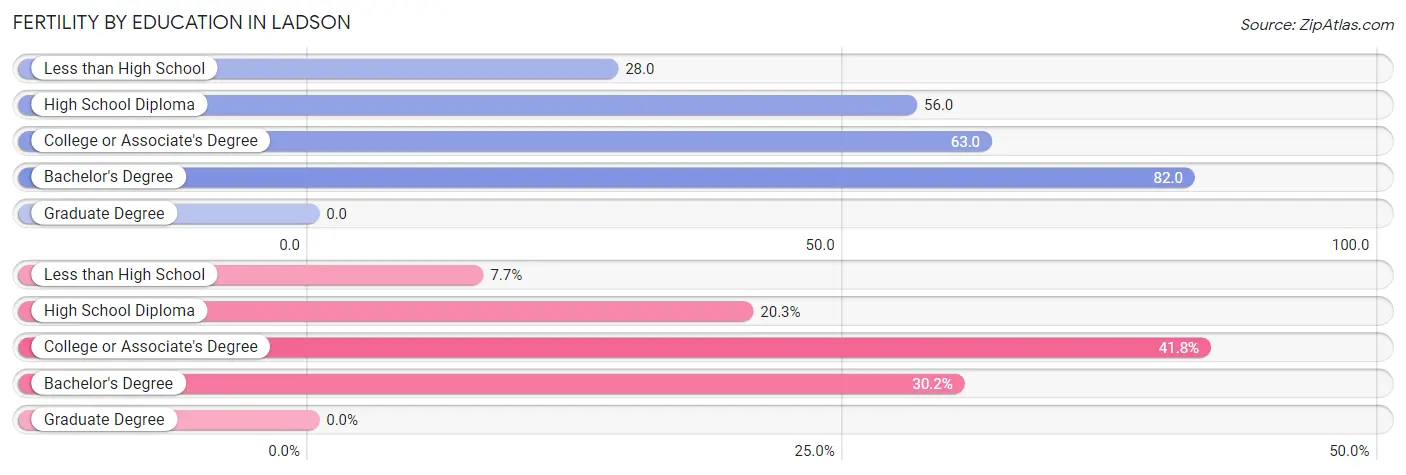
| Educational Attainment | Women with Births | Births / 1,000 Women |
| Less than High School | 14 (7.7%) | 28.0 |
| High School Diploma | 37 (20.3%) | 56.0 |
| College or Associate's Degree | 76 (41.8%) | 63.0 |
| Bachelor's Degree | 55 (30.2%) | 82.0 |
| Graduate Degree | 0 (0.0%) | 0.0 |
| Total | 182 (100.0%) | 56.0 |
Fertility by Education by Marriage Status in Ladson
30.2% of women with births in Ladson are unmarried. Women with the educational attainment of high school diploma are most likely to be married with 100.0% of them married at childbirth, while women with the educational attainment of less than high school are least likely to be married with 100.0% of them unmarried at childbirth.
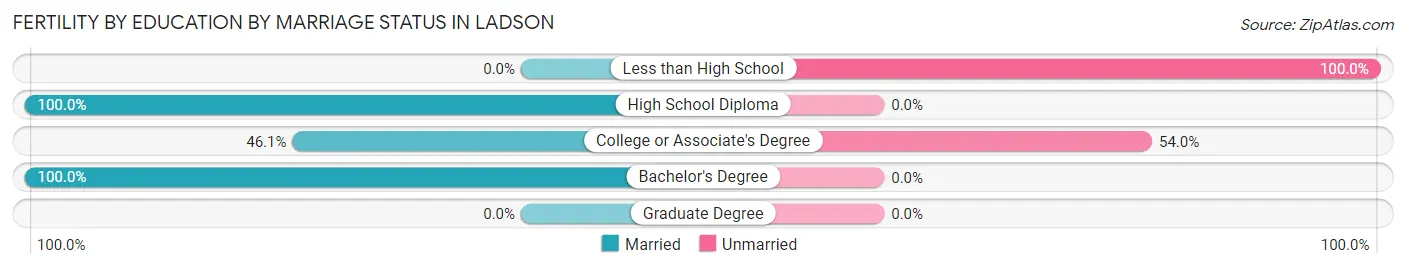
| Educational Attainment | Married | Unmarried |
| Less than High School | 0 (0.0%) | 14 (100.0%) |
| High School Diploma | 37 (100.0%) | 0 (0.0%) |
| College or Associate's Degree | 35 (46.1%) | 41 (53.9%) |
| Bachelor's Degree | 55 (100.0%) | 0 (0.0%) |
| Graduate Degree | 0 (0.0%) | 0 (0.0%) |
| Total | 127 (69.8%) | 55 (30.2%) |
Employment Characteristics in Ladson
Employment by Class of Employer in Ladson
Among the 6,708 employed individuals in Ladson, private company employees (4,445 | 66.3%), federal government employees (711 | 10.6%), and local government employees (353 | 5.3%) make up the most common classes of employment.
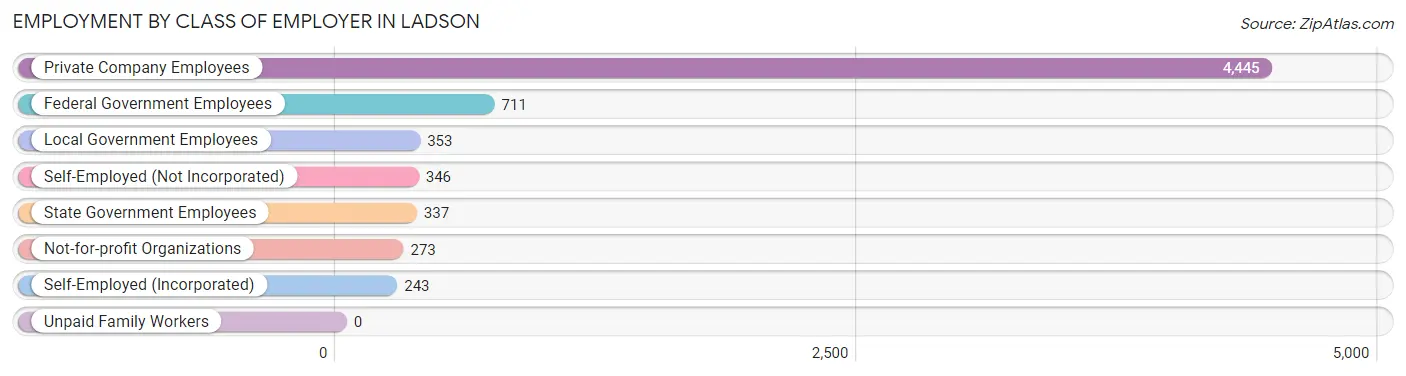
| Employer Class | # Employees | % Employees |
| Private Company Employees | 4,445 | 66.3% |
| Self-Employed (Incorporated) | 243 | 3.6% |
| Self-Employed (Not Incorporated) | 346 | 5.2% |
| Not-for-profit Organizations | 273 | 4.1% |
| Local Government Employees | 353 | 5.3% |
| State Government Employees | 337 | 5.0% |
| Federal Government Employees | 711 | 10.6% |
| Unpaid Family Workers | 0 | 0.0% |
| Total | 6,708 | 100.0% |
Employment Status by Age in Ladson
According to the labor force statistics for Ladson, out of the total population over 16 years of age (11,321), 64.1% or 7,257 individuals are in the labor force, with 6.1% or 443 of them unemployed. The age group with the highest labor force participation rate is 30 to 34 years, with 93.2% or 1,154 individuals in the labor force. Within the labor force, the 75 years and over age range has the highest percentage of unemployed individuals, with 19.7% or 13 of them being unemployed.
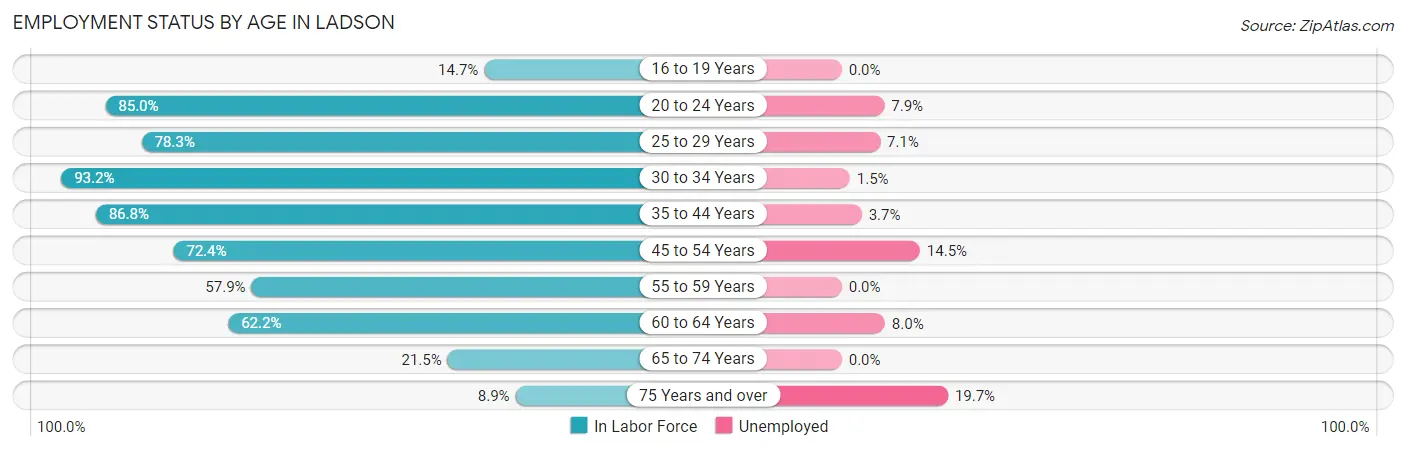
| Age Bracket | In Labor Force | Unemployed |
| 16 to 19 Years | 120 (14.7%) | 0 (0.0%) |
| 20 to 24 Years | 832 (85.0%) | 66 (7.9%) |
| 25 to 29 Years | 594 (78.3%) | 42 (7.1%) |
| 30 to 34 Years | 1,154 (93.2%) | 17 (1.5%) |
| 35 to 44 Years | 1,930 (86.8%) | 71 (3.7%) |
| 45 to 54 Years | 1,258 (72.4%) | 182 (14.5%) |
| 55 to 59 Years | 453 (57.9%) | 0 (0.0%) |
| 60 to 64 Years | 622 (62.2%) | 50 (8.0%) |
| 65 to 74 Years | 225 (21.5%) | 0 (0.0%) |
| 75 Years and over | 66 (8.9%) | 13 (19.7%) |
| Total | 7,257 (64.1%) | 443 (6.1%) |
Employment Status by Educational Attainment in Ladson
According to labor force statistics for Ladson, 77.7% of individuals (6,014) out of the total population between 25 and 64 years of age (7,740) are in the labor force, with 6.1% or 367 of them being unemployed. The group with the highest labor force participation rate are those with the educational attainment of bachelor's degree or higher, with 89.6% or 1,400 individuals in the labor force. Within the labor force, individuals with high school diploma education have the highest percentage of unemployment, with 9.7% or 186 of them being unemployed.
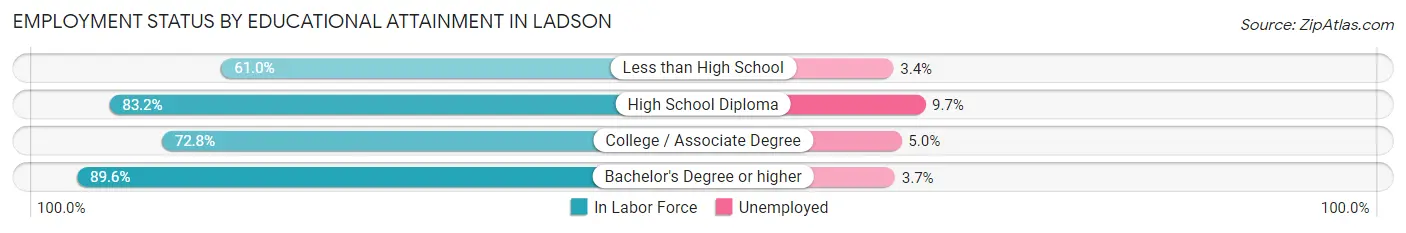
| Educational Attainment | In Labor Force | Unemployed |
| Less than High School | 641 (61.0%) | 36 (3.4%) |
| High School Diploma | 1,919 (83.2%) | 224 (9.7%) |
| College / Associate Degree | 2,054 (72.8%) | 141 (5.0%) |
| Bachelor's Degree or higher | 1,400 (89.6%) | 58 (3.7%) |
| Total | 6,014 (77.7%) | 472 (6.1%) |
Employment Occupations by Sex in Ladson
Management, Business, Science and Arts Occupations
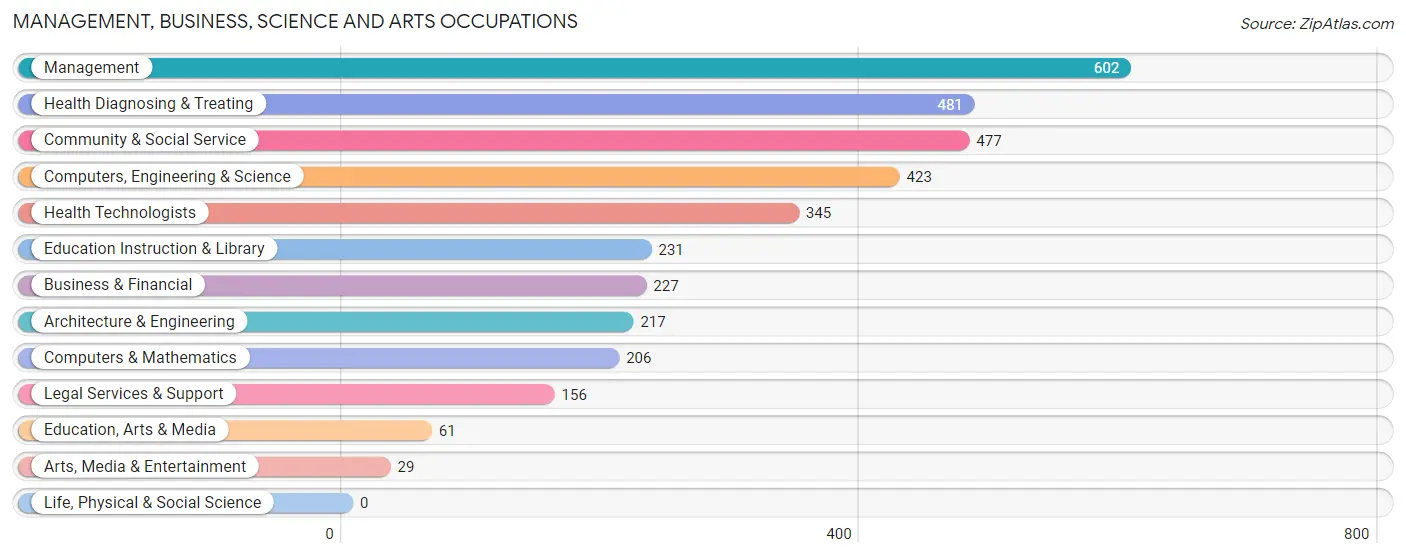
The most common Management, Business, Science and Arts occupations in Ladson are Management (602 | 9.2%), Health Diagnosing & Treating (481 | 7.4%), Community & Social Service (477 | 7.3%), Computers, Engineering & Science (423 | 6.5%), and Health Technologists (345 | 5.3%).
Management, Business, Science and Arts Occupations by Sex
Within the Management, Business, Science and Arts occupations in Ladson, the most male-oriented occupations are Arts, Media & Entertainment (100.0%), Computers & Mathematics (84.5%), and Computers, Engineering & Science (68.8%), while the most female-oriented occupations are Business & Financial (88.5%), Health Technologists (84.1%), and Education Instruction & Library (78.8%).
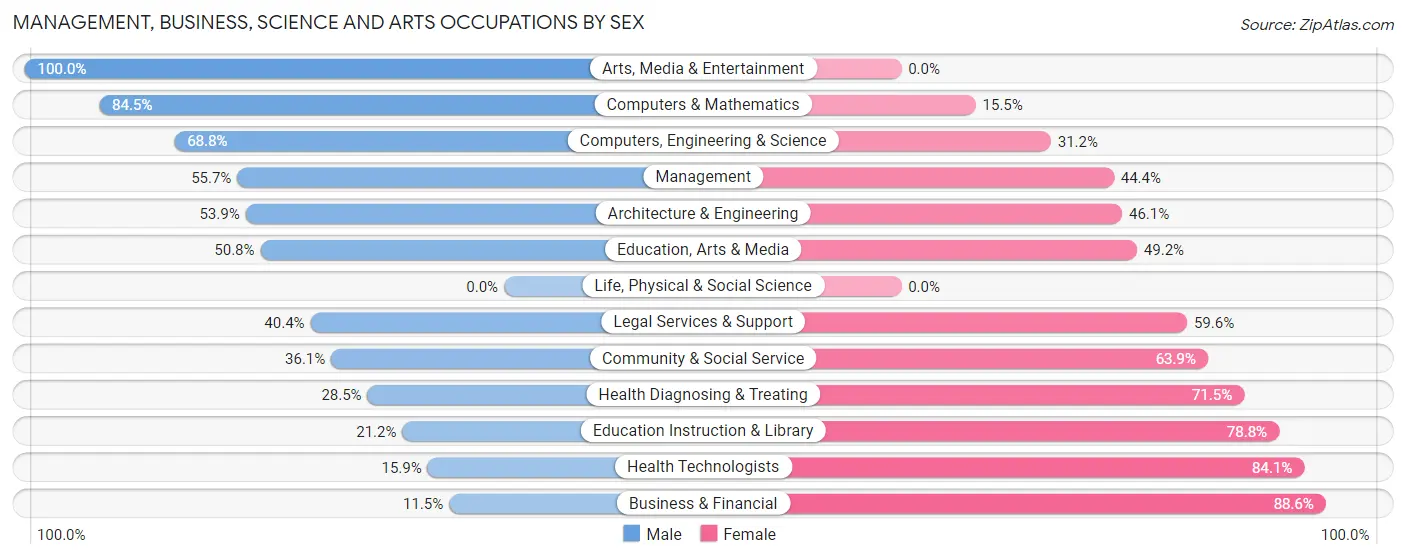
| Occupation | Male | Female |
| Management | 335 (55.6%) | 267 (44.4%) |
| Business & Financial | 26 (11.5%) | 201 (88.5%) |
| Computers, Engineering & Science | 291 (68.8%) | 132 (31.2%) |
| Computers & Mathematics | 174 (84.5%) | 32 (15.5%) |
| Architecture & Engineering | 117 (53.9%) | 100 (46.1%) |
| Life, Physical & Social Science | 0 (0.0%) | 0 (0.0%) |
| Community & Social Service | 172 (36.1%) | 305 (63.9%) |
| Education, Arts & Media | 31 (50.8%) | 30 (49.2%) |
| Legal Services & Support | 63 (40.4%) | 93 (59.6%) |
| Education Instruction & Library | 49 (21.2%) | 182 (78.8%) |
| Arts, Media & Entertainment | 29 (100.0%) | 0 (0.0%) |
| Health Diagnosing & Treating | 137 (28.5%) | 344 (71.5%) |
| Health Technologists | 55 (15.9%) | 290 (84.1%) |
| Total (Category) | 961 (43.5%) | 1,249 (56.5%) |
| Total (Overall) | 3,725 (57.0%) | 2,810 (43.0%) |
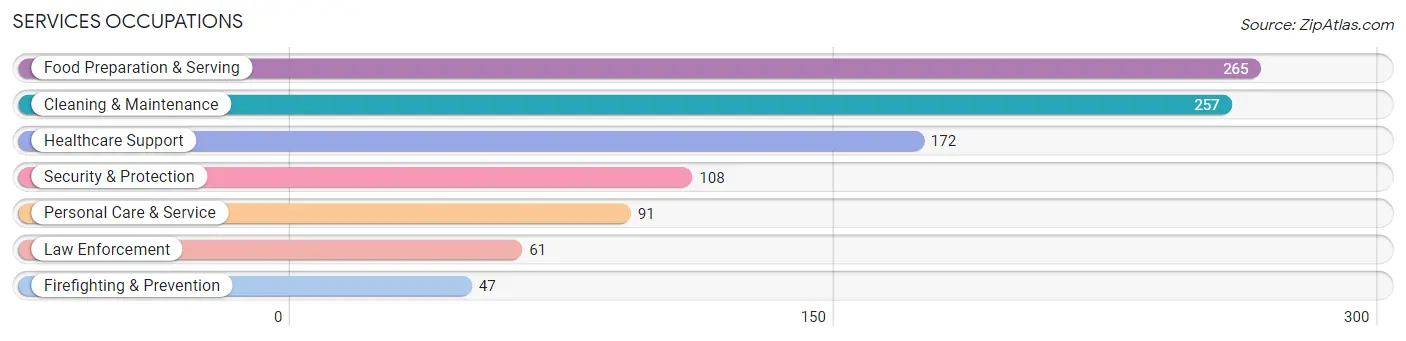
Services Occupations
The most common Services occupations in Ladson are Food Preparation & Serving (265 | 4.1%), Cleaning & Maintenance (257 | 3.9%), Healthcare Support (172 | 2.6%), Security & Protection (108 | 1.7%), and Personal Care & Service (91 | 1.4%).
Services Occupations by Sex
Within the Services occupations in Ladson, the most male-oriented occupations are Security & Protection (100.0%), Firefighting & Prevention (100.0%), and Law Enforcement (100.0%), while the most female-oriented occupations are Healthcare Support (100.0%), Personal Care & Service (87.9%), and Food Preparation & Serving (48.3%).
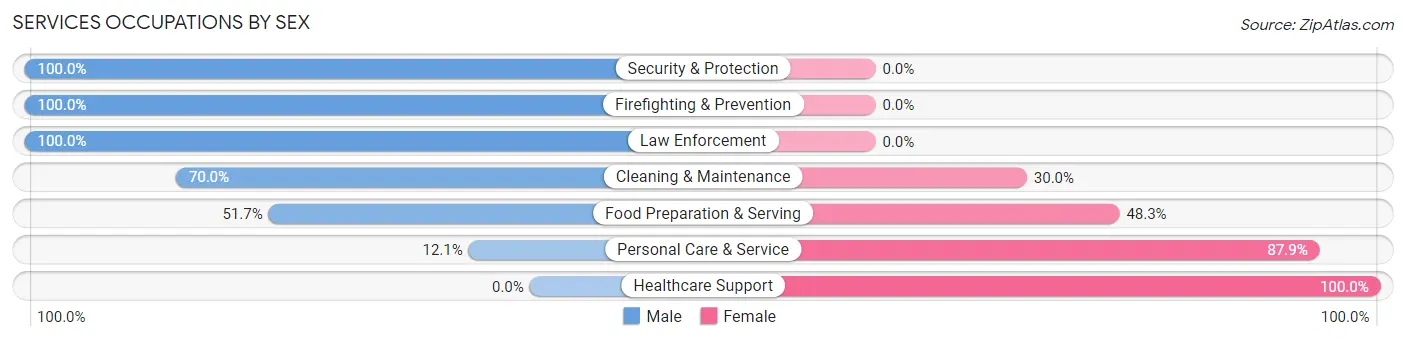
| Occupation | Male | Female |
| Healthcare Support | 0 (0.0%) | 172 (100.0%) |
| Security & Protection | 108 (100.0%) | 0 (0.0%) |
| Firefighting & Prevention | 47 (100.0%) | 0 (0.0%) |
| Law Enforcement | 61 (100.0%) | 0 (0.0%) |
| Food Preparation & Serving | 137 (51.7%) | 128 (48.3%) |
| Cleaning & Maintenance | 180 (70.0%) | 77 (30.0%) |
| Personal Care & Service | 11 (12.1%) | 80 (87.9%) |
| Total (Category) | 436 (48.8%) | 457 (51.2%) |
| Total (Overall) | 3,725 (57.0%) | 2,810 (43.0%) |
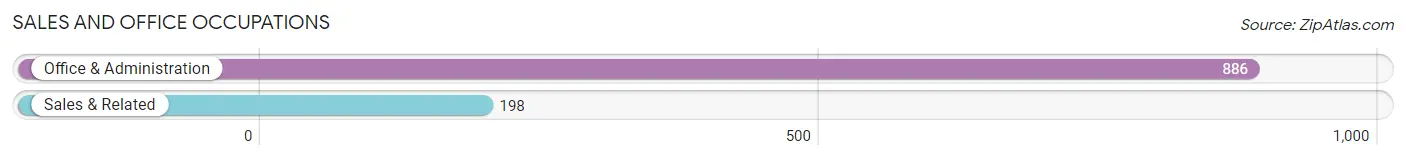
Sales and Office Occupations
The most common Sales and Office occupations in Ladson are Office & Administration (886 | 13.6%), and Sales & Related (198 | 3.0%).
Sales and Office Occupations by Sex
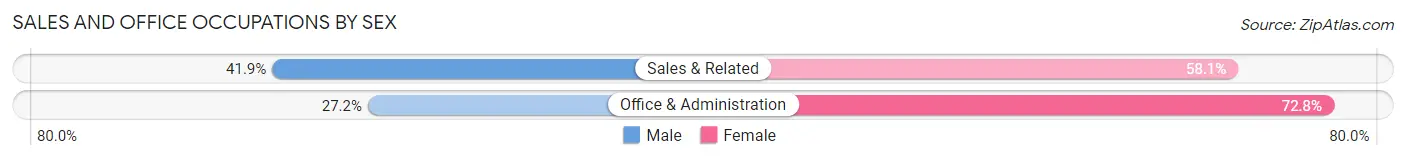
| Occupation | Male | Female |
| Sales & Related | 83 (41.9%) | 115 (58.1%) |
| Office & Administration | 241 (27.2%) | 645 (72.8%) |
| Total (Category) | 324 (29.9%) | 760 (70.1%) |
| Total (Overall) | 3,725 (57.0%) | 2,810 (43.0%) |
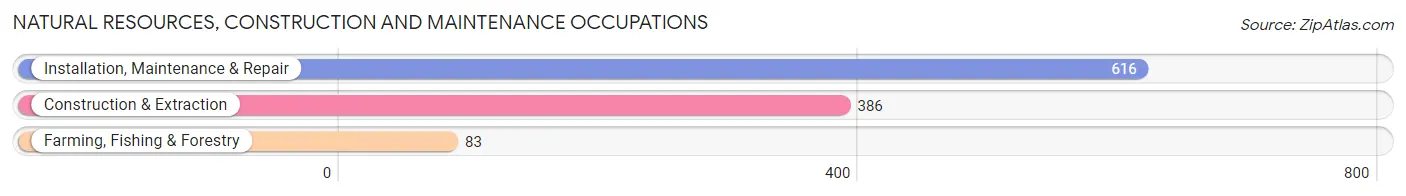
Natural Resources, Construction and Maintenance Occupations
The most common Natural Resources, Construction and Maintenance occupations in Ladson are Installation, Maintenance & Repair (616 | 9.4%), Construction & Extraction (386 | 5.9%), and Farming, Fishing & Forestry (83 | 1.3%).
Natural Resources, Construction and Maintenance Occupations by Sex
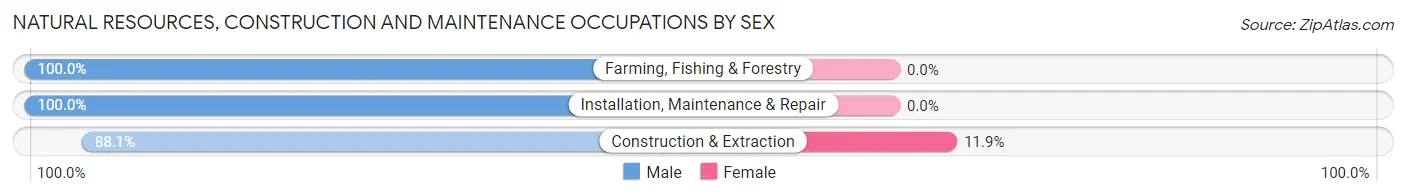
| Occupation | Male | Female |
| Farming, Fishing & Forestry | 83 (100.0%) | 0 (0.0%) |
| Construction & Extraction | 340 (88.1%) | 46 (11.9%) |
| Installation, Maintenance & Repair | 616 (100.0%) | 0 (0.0%) |
| Total (Category) | 1,039 (95.8%) | 46 (4.2%) |
| Total (Overall) | 3,725 (57.0%) | 2,810 (43.0%) |
Production, Transportation and Moving Occupations
The most common Production, Transportation and Moving occupations in Ladson are Production (475 | 7.3%), Transportation (467 | 7.1%), and Material Moving (321 | 4.9%).
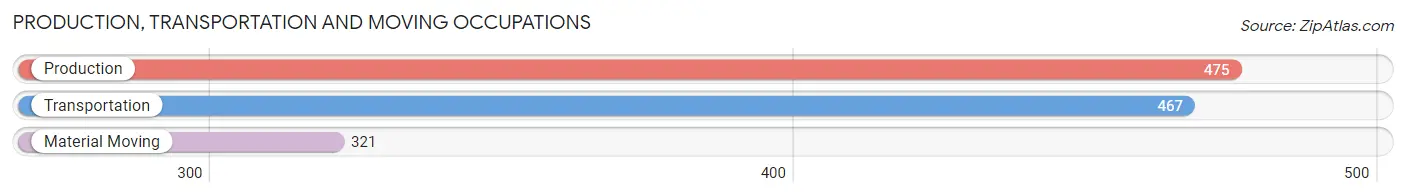
Production, Transportation and Moving Occupations by Sex
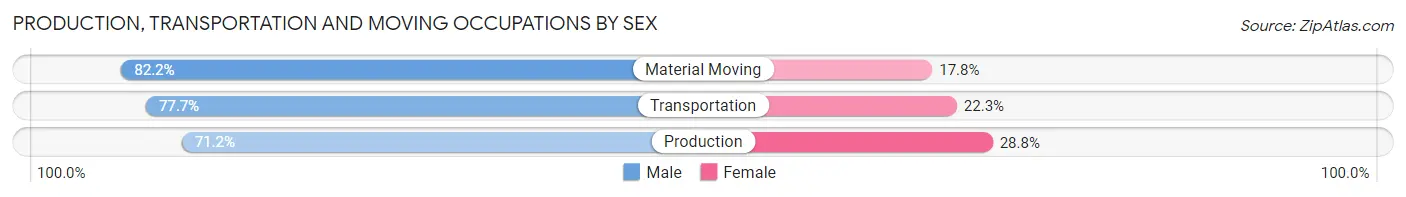
| Occupation | Male | Female |
| Production | 338 (71.2%) | 137 (28.8%) |
| Transportation | 363 (77.7%) | 104 (22.3%) |
| Material Moving | 264 (82.2%) | 57 (17.8%) |
| Total (Category) | 965 (76.4%) | 298 (23.6%) |
| Total (Overall) | 3,725 (57.0%) | 2,810 (43.0%) |
Employment Industries by Sex in Ladson
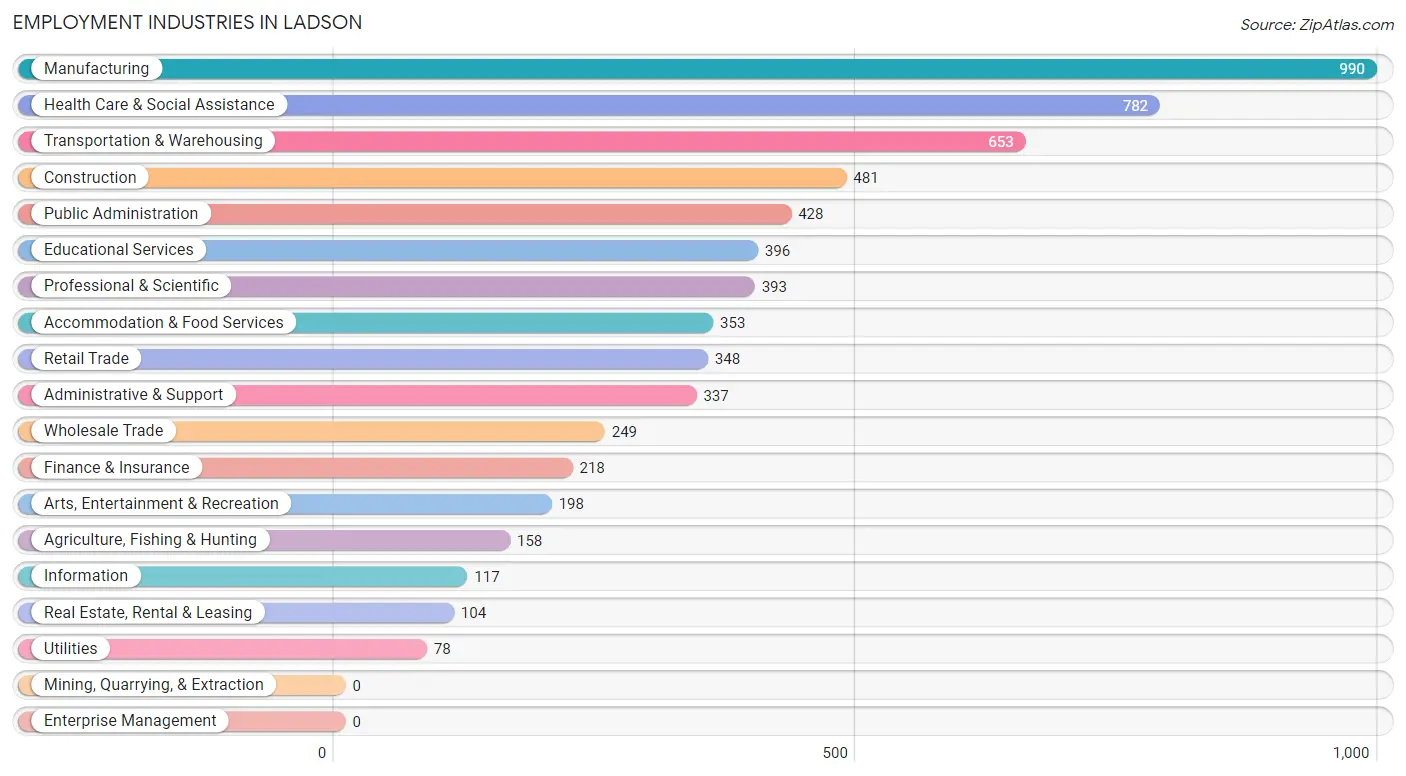
Employment Industries in Ladson
The major employment industries in Ladson include Manufacturing (990 | 15.1%), Health Care & Social Assistance (782 | 12.0%), Transportation & Warehousing (653 | 10.0%), Construction (481 | 7.4%), and Public Administration (428 | 6.6%).
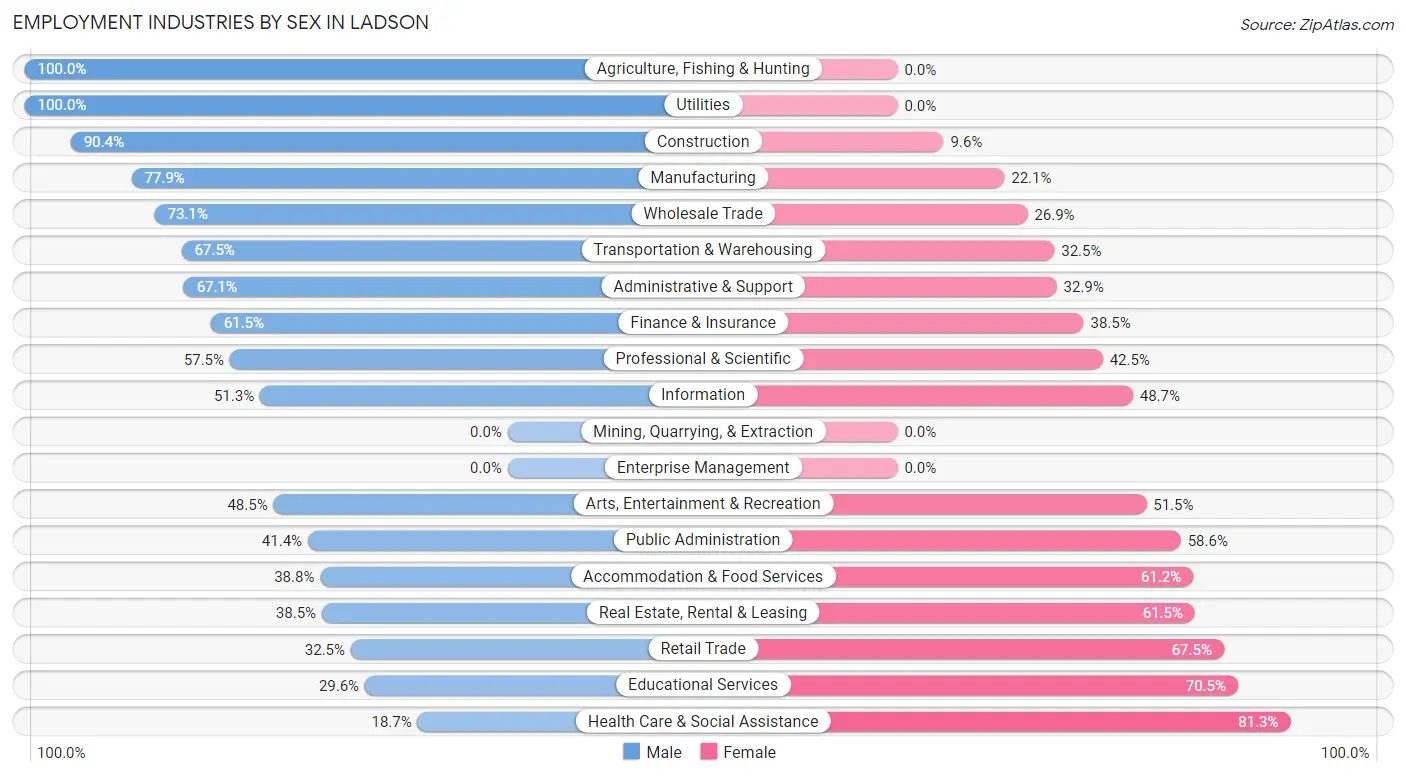
Employment Industries by Sex in Ladson
The Ladson industries that see more men than women are Agriculture, Fishing & Hunting (100.0%), Utilities (100.0%), and Construction (90.4%), whereas the industries that tend to have a higher number of women are Health Care & Social Assistance (81.3%), Educational Services (70.5%), and Retail Trade (67.5%).
| Industry | Male | Female |
| Agriculture, Fishing & Hunting | 158 (100.0%) | 0 (0.0%) |
| Mining, Quarrying, & Extraction | 0 (0.0%) | 0 (0.0%) |
| Construction | 435 (90.4%) | 46 (9.6%) |
| Manufacturing | 771 (77.9%) | 219 (22.1%) |
| Wholesale Trade | 182 (73.1%) | 67 (26.9%) |
| Retail Trade | 113 (32.5%) | 235 (67.5%) |
| Transportation & Warehousing | 441 (67.5%) | 212 (32.5%) |
| Utilities | 78 (100.0%) | 0 (0.0%) |
| Information | 60 (51.3%) | 57 (48.7%) |
| Finance & Insurance | 134 (61.5%) | 84 (38.5%) |
| Real Estate, Rental & Leasing | 40 (38.5%) | 64 (61.5%) |
| Professional & Scientific | 226 (57.5%) | 167 (42.5%) |
| Enterprise Management | 0 (0.0%) | 0 (0.0%) |
| Administrative & Support | 226 (67.1%) | 111 (32.9%) |
| Educational Services | 117 (29.5%) | 279 (70.5%) |
| Health Care & Social Assistance | 146 (18.7%) | 636 (81.3%) |
| Arts, Entertainment & Recreation | 96 (48.5%) | 102 (51.5%) |
| Accommodation & Food Services | 137 (38.8%) | 216 (61.2%) |
| Public Administration | 177 (41.4%) | 251 (58.6%) |
| Total | 3,725 (57.0%) | 2,810 (43.0%) |
Education in Ladson
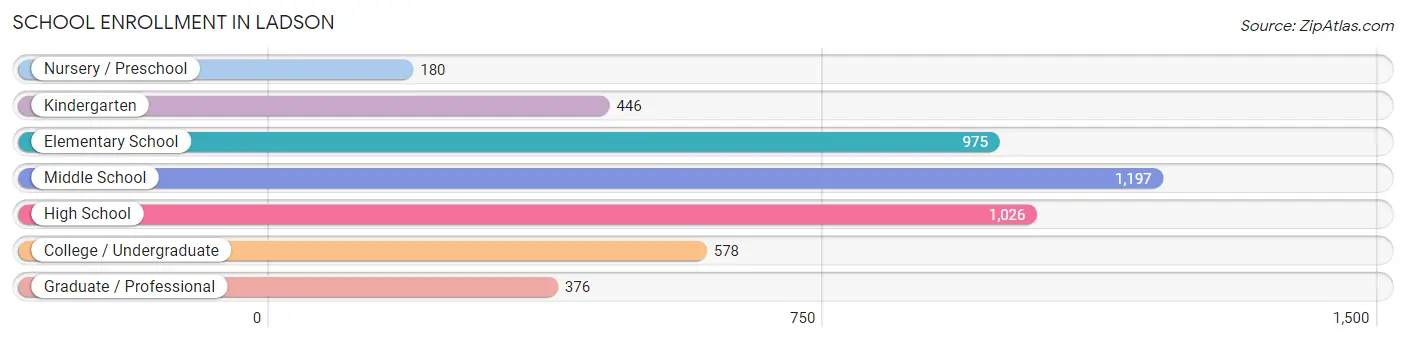
School Enrollment in Ladson
The most common levels of schooling among the 4,778 students in Ladson are middle school (1,197 | 25.1%), high school (1,026 | 21.5%), and elementary school (975 | 20.4%).
| School Level | # Students | % Students |
| Nursery / Preschool | 180 | 3.8% |
| Kindergarten | 446 | 9.3% |
| Elementary School | 975 | 20.4% |
| Middle School | 1,197 | 25.1% |
| High School | 1,026 | 21.5% |
| College / Undergraduate | 578 | 12.1% |
| Graduate / Professional | 376 | 7.9% |
| Total | 4,778 | 100.0% |
School Enrollment by Age by Funding Source in Ladson
Out of a total of 4,778 students who are enrolled in schools in Ladson, 545 (11.4%) attend a private institution, while the remaining 4,233 (88.6%) are enrolled in public schools. The age group of 35 years and over has the highest likelihood of being enrolled in private schools, with 106 (28.5% in the age bracket) enrolled. Conversely, the age group of 10 to 14 year olds has the lowest likelihood of being enrolled in a private school, with 1,322 (98.3% in the age bracket) attending a public institution.
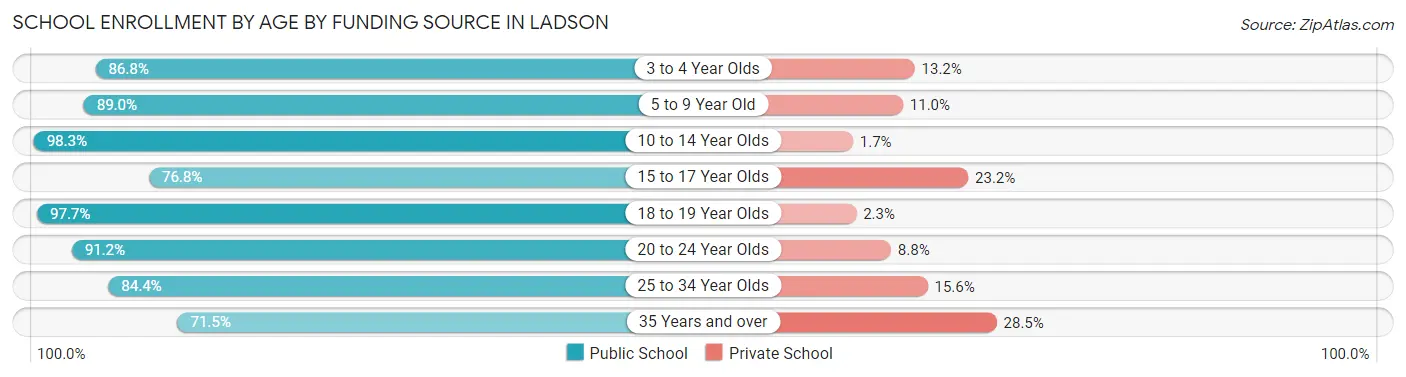
| Age Bracket | Public School | Private School |
| 3 to 4 Year Olds | 92 (86.8%) | 14 (13.2%) |
| 5 to 9 Year Old | 1,234 (89.0%) | 153 (11.0%) |
| 10 to 14 Year Olds | 1,322 (98.3%) | 23 (1.7%) |
| 15 to 17 Year Olds | 623 (76.8%) | 188 (23.2%) |
| 18 to 19 Year Olds | 250 (97.7%) | 6 (2.3%) |
| 20 to 24 Year Olds | 311 (91.2%) | 30 (8.8%) |
| 25 to 34 Year Olds | 135 (84.4%) | 25 (15.6%) |
| 35 Years and over | 266 (71.5%) | 106 (28.5%) |
| Total | 4,233 (88.6%) | 545 (11.4%) |
Educational Attainment by Field of Study in Ladson
Business (443 | 20.8%), engineering (326 | 15.3%), science & technology (308 | 14.5%), liberal arts & history (212 | 10.0%), and education (209 | 9.8%) are the most common fields of study among 2,130 individuals in Ladson who have obtained a bachelor's degree or higher.
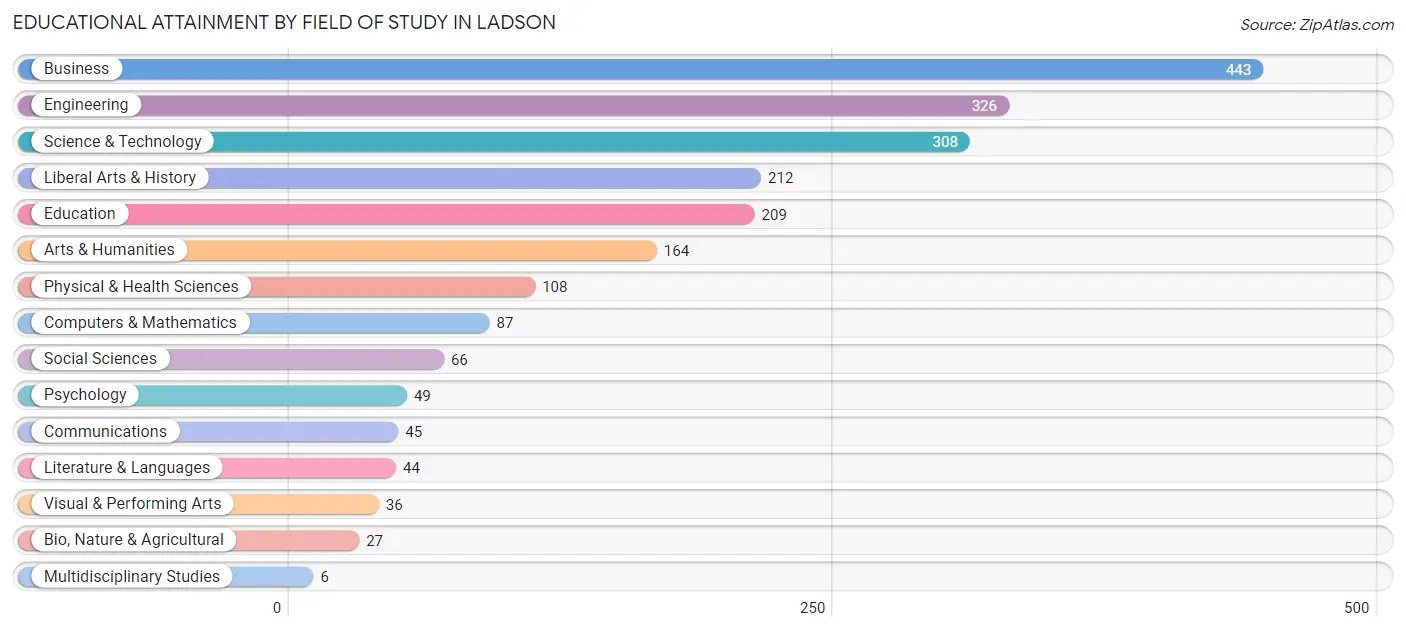
| Field of Study | # Graduates | % Graduates |
| Computers & Mathematics | 87 | 4.1% |
| Bio, Nature & Agricultural | 27 | 1.3% |
| Physical & Health Sciences | 108 | 5.1% |
| Psychology | 49 | 2.3% |
| Social Sciences | 66 | 3.1% |
| Engineering | 326 | 15.3% |
| Multidisciplinary Studies | 6 | 0.3% |
| Science & Technology | 308 | 14.5% |
| Business | 443 | 20.8% |
| Education | 209 | 9.8% |
| Literature & Languages | 44 | 2.1% |
| Liberal Arts & History | 212 | 10.0% |
| Visual & Performing Arts | 36 | 1.7% |
| Communications | 45 | 2.1% |
| Arts & Humanities | 164 | 7.7% |
| Total | 2,130 | 100.0% |
Transportation & Commute in Ladson
Vehicle Availability by Sex in Ladson
The most prevalent vehicle ownership categories in Ladson are males with 2 vehicles (1,898, accounting for 47.6%) and females with 2 vehicles (1,113, making up 69.8%).
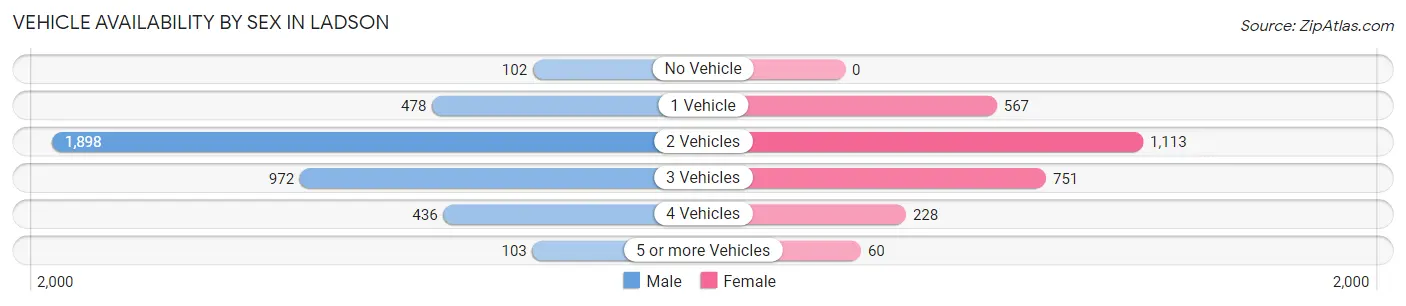
| Vehicles Available | Male | Female |
| No Vehicle | 102 (2.6%) | 0 (0.0%) |
| 1 Vehicle | 478 (12.0%) | 567 (20.8%) |
| 2 Vehicles | 1,898 (47.6%) | 1,113 (40.9%) |
| 3 Vehicles | 972 (24.4%) | 751 (27.6%) |
| 4 Vehicles | 436 (10.9%) | 228 (8.4%) |
| 5 or more Vehicles | 103 (2.6%) | 60 (2.2%) |
| Total | 3,989 (100.0%) | 2,719 (100.0%) |
Commute Time in Ladson
The most frequently occuring commute durations in Ladson are 30 to 34 minutes (1,670 commuters, 26.1%), 20 to 24 minutes (943 commuters, 14.7%), and 45 to 59 minutes (858 commuters, 13.4%).
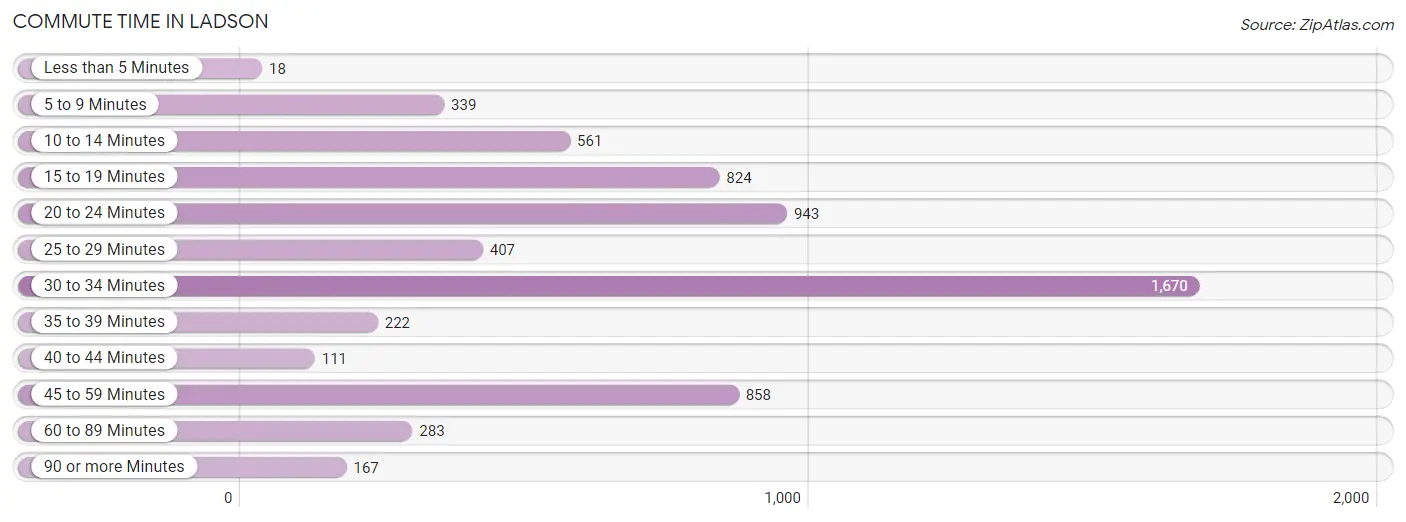
| Commute Time | # Commuters | % Commuters |
| Less than 5 Minutes | 18 | 0.3% |
| 5 to 9 Minutes | 339 | 5.3% |
| 10 to 14 Minutes | 561 | 8.8% |
| 15 to 19 Minutes | 824 | 12.9% |
| 20 to 24 Minutes | 943 | 14.7% |
| 25 to 29 Minutes | 407 | 6.4% |
| 30 to 34 Minutes | 1,670 | 26.1% |
| 35 to 39 Minutes | 222 | 3.5% |
| 40 to 44 Minutes | 111 | 1.7% |
| 45 to 59 Minutes | 858 | 13.4% |
| 60 to 89 Minutes | 283 | 4.4% |
| 90 or more Minutes | 167 | 2.6% |
Commute Time by Sex in Ladson
The most common commute times in Ladson are 30 to 34 minutes (1,209 commuters, 31.6%) for males and 30 to 34 minutes (461 commuters, 17.9%) for females.
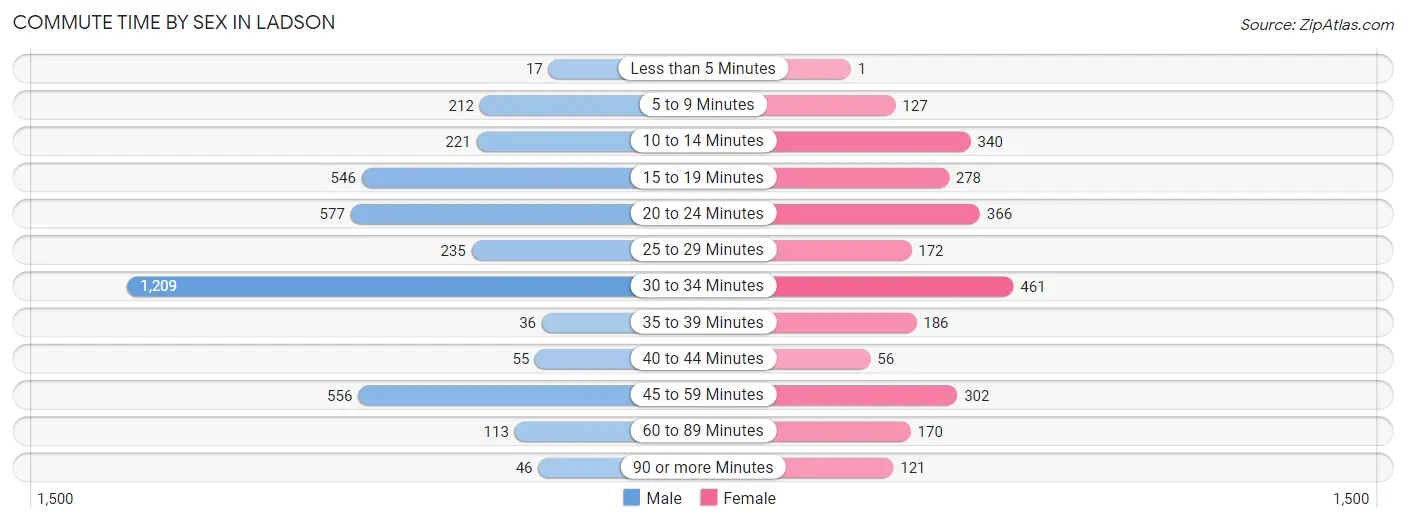
| Commute Time | Male | Female |
| Less than 5 Minutes | 17 (0.4%) | 1 (0.0%) |
| 5 to 9 Minutes | 212 (5.6%) | 127 (4.9%) |
| 10 to 14 Minutes | 221 (5.8%) | 340 (13.2%) |
| 15 to 19 Minutes | 546 (14.3%) | 278 (10.8%) |
| 20 to 24 Minutes | 577 (15.1%) | 366 (14.2%) |
| 25 to 29 Minutes | 235 (6.1%) | 172 (6.7%) |
| 30 to 34 Minutes | 1,209 (31.6%) | 461 (17.9%) |
| 35 to 39 Minutes | 36 (0.9%) | 186 (7.2%) |
| 40 to 44 Minutes | 55 (1.4%) | 56 (2.2%) |
| 45 to 59 Minutes | 556 (14.5%) | 302 (11.7%) |
| 60 to 89 Minutes | 113 (3.0%) | 170 (6.6%) |
| 90 or more Minutes | 46 (1.2%) | 121 (4.7%) |
Time of Departure to Work by Sex in Ladson
The most frequent times of departure to work in Ladson are 6:00 AM to 6:29 AM (710, 18.6%) for males and 7:30 AM to 7:59 AM (418, 16.2%) for females.
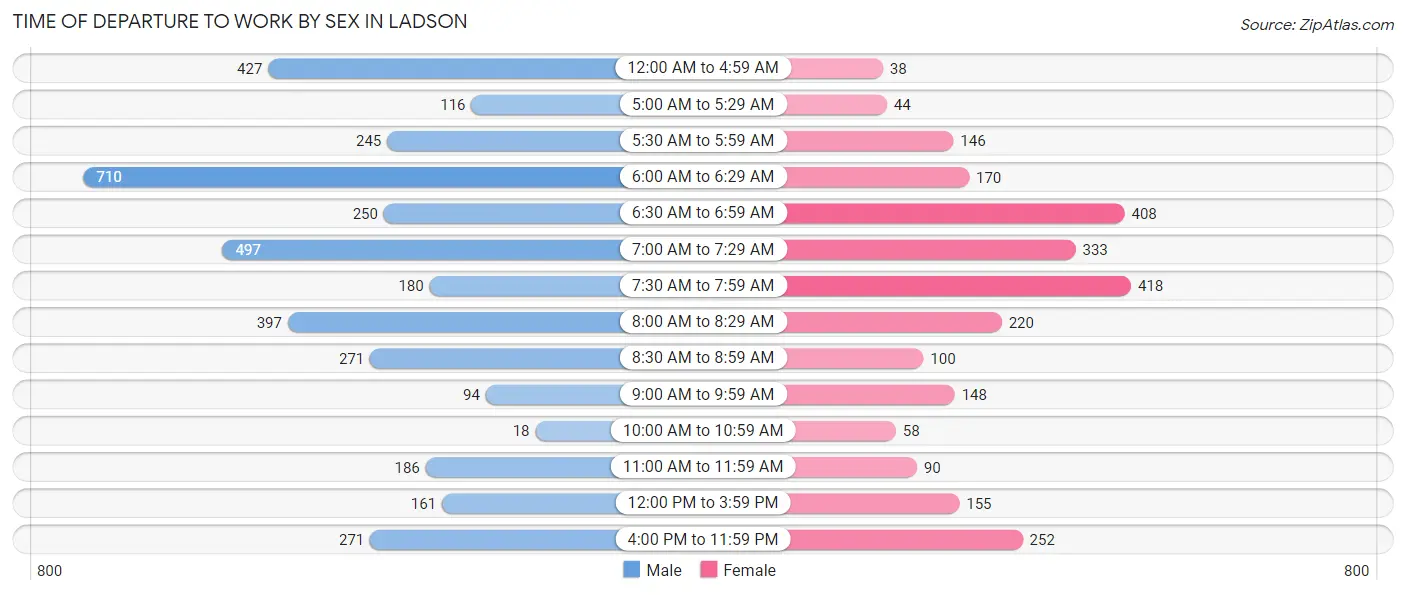
| Time of Departure | Male | Female |
| 12:00 AM to 4:59 AM | 427 (11.2%) | 38 (1.5%) |
| 5:00 AM to 5:29 AM | 116 (3.0%) | 44 (1.7%) |
| 5:30 AM to 5:59 AM | 245 (6.4%) | 146 (5.7%) |
| 6:00 AM to 6:29 AM | 710 (18.6%) | 170 (6.6%) |
| 6:30 AM to 6:59 AM | 250 (6.5%) | 408 (15.8%) |
| 7:00 AM to 7:29 AM | 497 (13.0%) | 333 (12.9%) |
| 7:30 AM to 7:59 AM | 180 (4.7%) | 418 (16.2%) |
| 8:00 AM to 8:29 AM | 397 (10.4%) | 220 (8.5%) |
| 8:30 AM to 8:59 AM | 271 (7.1%) | 100 (3.9%) |
| 9:00 AM to 9:59 AM | 94 (2.5%) | 148 (5.7%) |
| 10:00 AM to 10:59 AM | 18 (0.5%) | 58 (2.2%) |
| 11:00 AM to 11:59 AM | 186 (4.9%) | 90 (3.5%) |
| 12:00 PM to 3:59 PM | 161 (4.2%) | 155 (6.0%) |
| 4:00 PM to 11:59 PM | 271 (7.1%) | 252 (9.8%) |
| Total | 3,823 (100.0%) | 2,580 (100.0%) |
Housing Occupancy in Ladson
Occupancy by Ownership in Ladson
Of the total 5,408 dwellings in Ladson, owner-occupied units account for 4,197 (77.6%), while renter-occupied units make up 1,211 (22.4%).
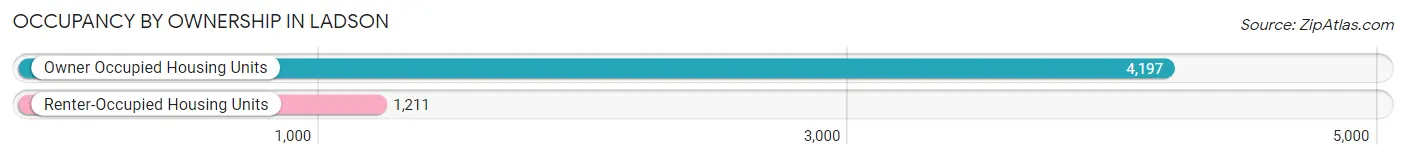
| Occupancy | # Housing Units | % Housing Units |
| Owner Occupied Housing Units | 4,197 | 77.6% |
| Renter-Occupied Housing Units | 1,211 | 22.4% |
| Total Occupied Housing Units | 5,408 | 100.0% |
Occupancy by Household Size in Ladson
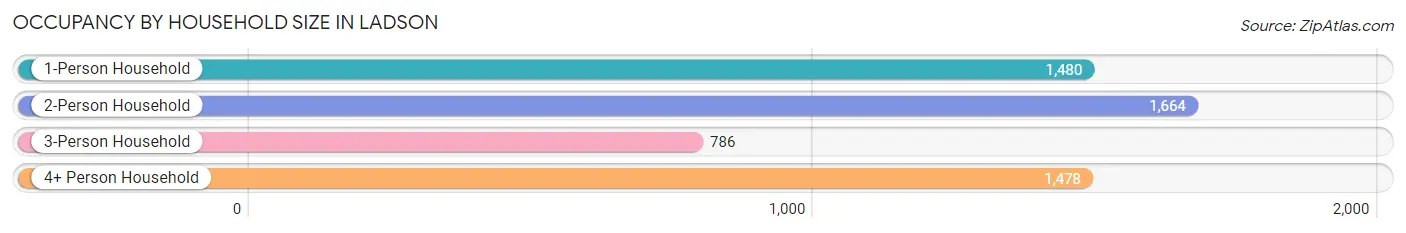
| Household Size | # Housing Units | % Housing Units |
| 1-Person Household | 1,480 | 27.4% |
| 2-Person Household | 1,664 | 30.8% |
| 3-Person Household | 786 | 14.5% |
| 4+ Person Household | 1,478 | 27.3% |
| Total Housing Units | 5,408 | 100.0% |
Occupancy by Ownership by Household Size in Ladson
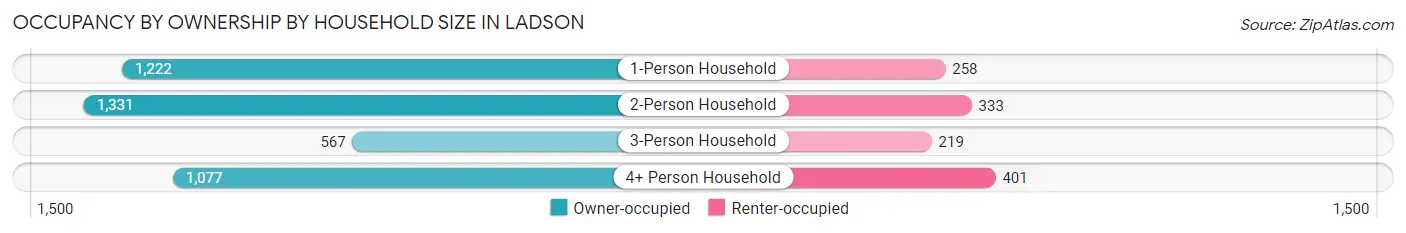
| Household Size | Owner-occupied | Renter-occupied |
| 1-Person Household | 1,222 (82.6%) | 258 (17.4%) |
| 2-Person Household | 1,331 (80.0%) | 333 (20.0%) |
| 3-Person Household | 567 (72.1%) | 219 (27.9%) |
| 4+ Person Household | 1,077 (72.9%) | 401 (27.1%) |
| Total Housing Units | 4,197 (77.6%) | 1,211 (22.4%) |
Occupancy by Educational Attainment in Ladson
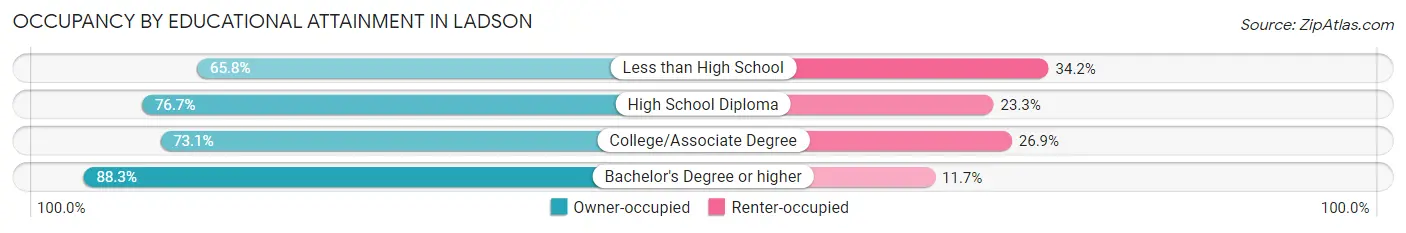
| Household Size | Owner-occupied | Renter-occupied |
| Less than High School | 306 (65.8%) | 159 (34.2%) |
| High School Diploma | 1,325 (76.7%) | 402 (23.3%) |
| College/Associate Degree | 1,318 (73.1%) | 485 (26.9%) |
| Bachelor's Degree or higher | 1,248 (88.3%) | 165 (11.7%) |
Occupancy by Age of Householder in Ladson
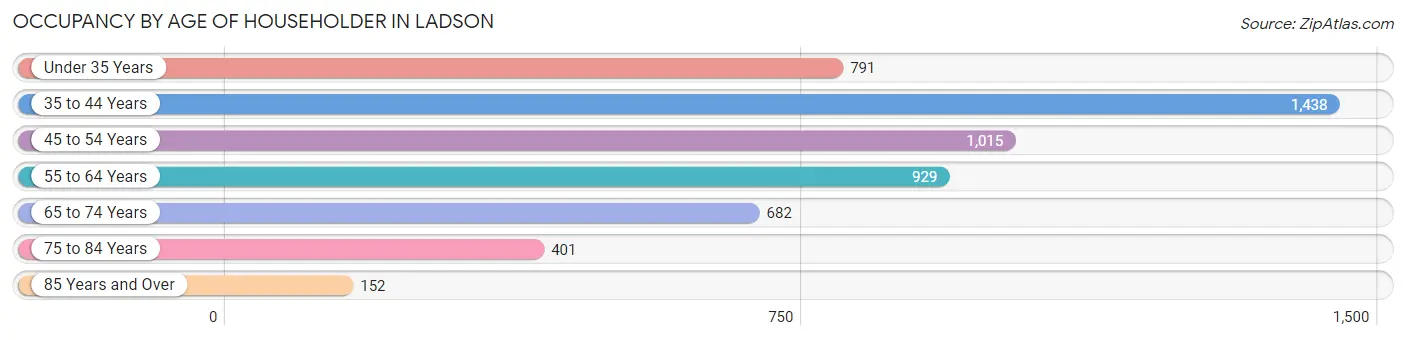
| Age Bracket | # Households | % Households |
| Under 35 Years | 791 | 14.6% |
| 35 to 44 Years | 1,438 | 26.6% |
| 45 to 54 Years | 1,015 | 18.8% |
| 55 to 64 Years | 929 | 17.2% |
| 65 to 74 Years | 682 | 12.6% |
| 75 to 84 Years | 401 | 7.4% |
| 85 Years and Over | 152 | 2.8% |
| Total | 5,408 | 100.0% |
Housing Finances in Ladson
Median Income by Occupancy in Ladson
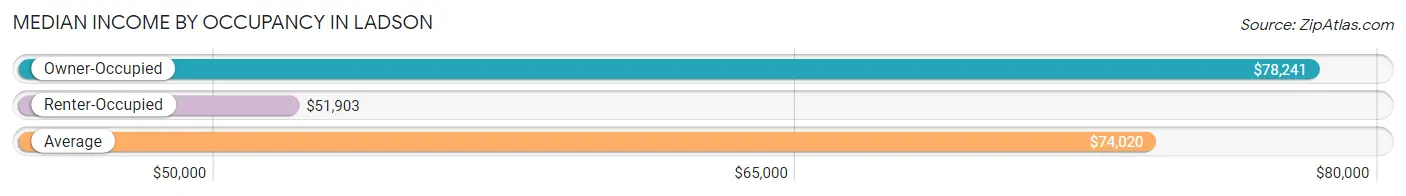
| Occupancy Type | # Households | Median Income |
| Owner-Occupied | 4,197 (77.6%) | $78,241 |
| Renter-Occupied | 1,211 (22.4%) | $51,903 |
| Average | 5,408 (100.0%) | $74,020 |
Occupancy by Householder Income Bracket in Ladson
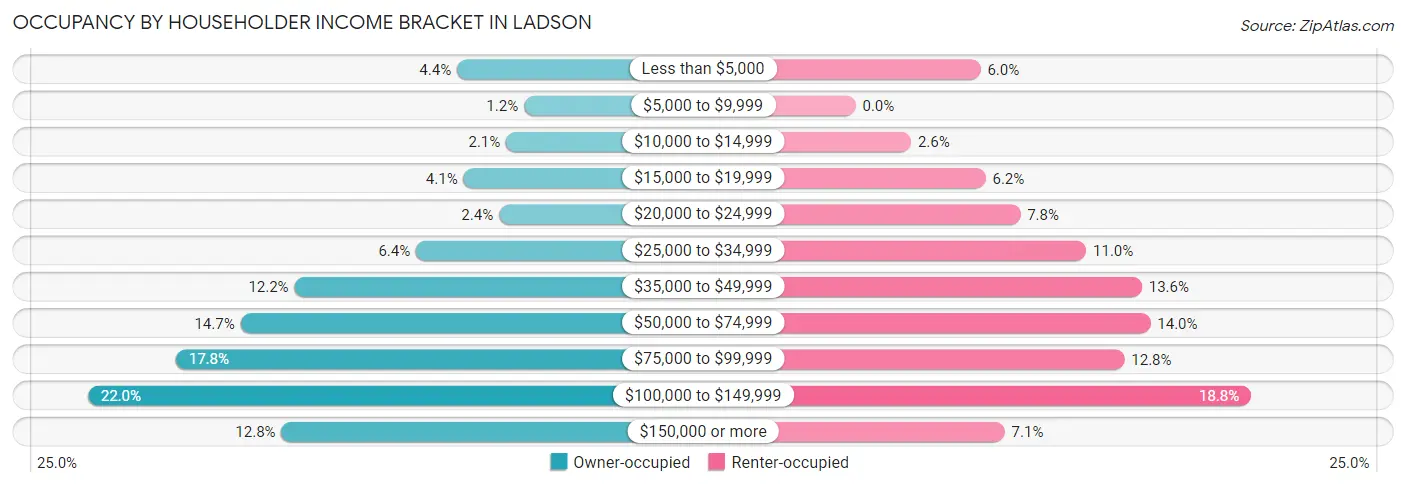
| Income Bracket | Owner-occupied | Renter-occupied |
| Less than $5,000 | 185 (4.4%) | 72 (5.9%) |
| $5,000 to $9,999 | 51 (1.2%) | 0 (0.0%) |
| $10,000 to $14,999 | 87 (2.1%) | 32 (2.6%) |
| $15,000 to $19,999 | 172 (4.1%) | 75 (6.2%) |
| $20,000 to $24,999 | 101 (2.4%) | 95 (7.8%) |
| $25,000 to $34,999 | 267 (6.4%) | 133 (11.0%) |
| $35,000 to $49,999 | 510 (12.1%) | 165 (13.6%) |
| $50,000 to $74,999 | 618 (14.7%) | 170 (14.0%) |
| $75,000 to $99,999 | 747 (17.8%) | 155 (12.8%) |
| $100,000 to $149,999 | 923 (22.0%) | 228 (18.8%) |
| $150,000 or more | 536 (12.8%) | 86 (7.1%) |
| Total | 4,197 (100.0%) | 1,211 (100.0%) |
Monthly Housing Cost Tiers in Ladson
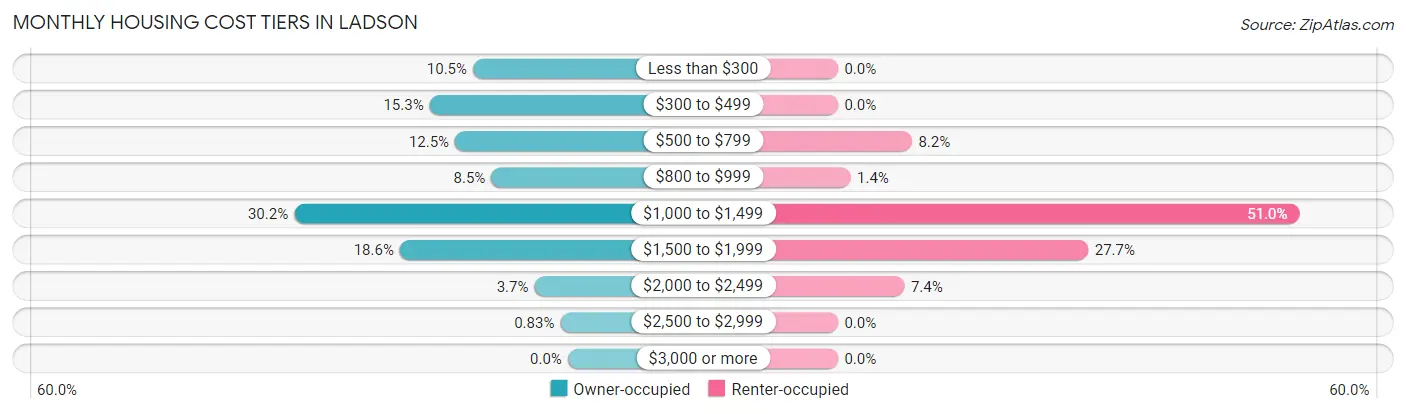
| Monthly Cost | Owner-occupied | Renter-occupied |
| Less than $300 | 440 (10.5%) | 0 (0.0%) |
| $300 to $499 | 641 (15.3%) | 0 (0.0%) |
| $500 to $799 | 523 (12.5%) | 99 (8.2%) |
| $800 to $999 | 355 (8.5%) | 17 (1.4%) |
| $1,000 to $1,499 | 1,269 (30.2%) | 618 (51.0%) |
| $1,500 to $1,999 | 779 (18.6%) | 335 (27.7%) |
| $2,000 to $2,499 | 155 (3.7%) | 89 (7.3%) |
| $2,500 to $2,999 | 35 (0.8%) | 0 (0.0%) |
| $3,000 or more | 0 (0.0%) | 0 (0.0%) |
| Total | 4,197 (100.0%) | 1,211 (100.0%) |
Physical Housing Characteristics in Ladson
Housing Structures in Ladson
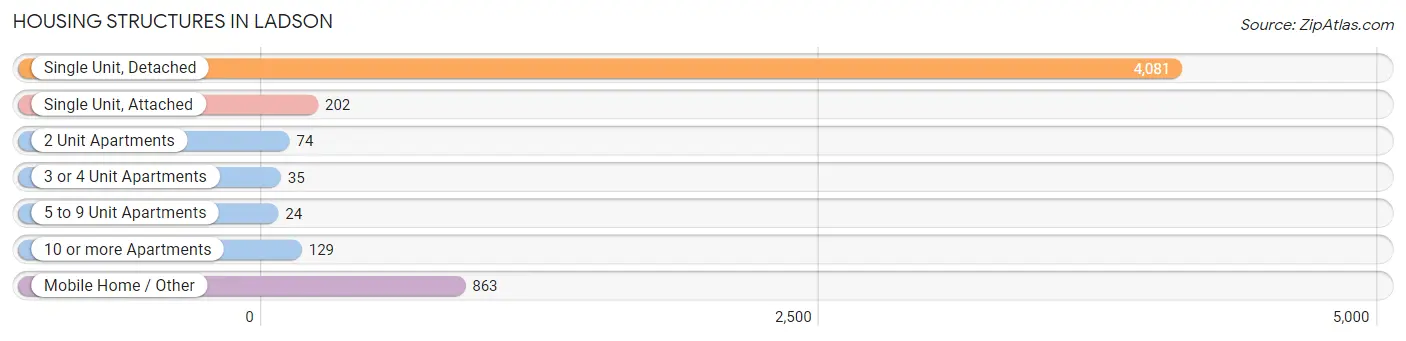
| Structure Type | # Housing Units | % Housing Units |
| Single Unit, Detached | 4,081 | 75.5% |
| Single Unit, Attached | 202 | 3.7% |
| 2 Unit Apartments | 74 | 1.4% |
| 3 or 4 Unit Apartments | 35 | 0.6% |
| 5 to 9 Unit Apartments | 24 | 0.4% |
| 10 or more Apartments | 129 | 2.4% |
| Mobile Home / Other | 863 | 16.0% |
| Total | 5,408 | 100.0% |
Housing Structures by Occupancy in Ladson
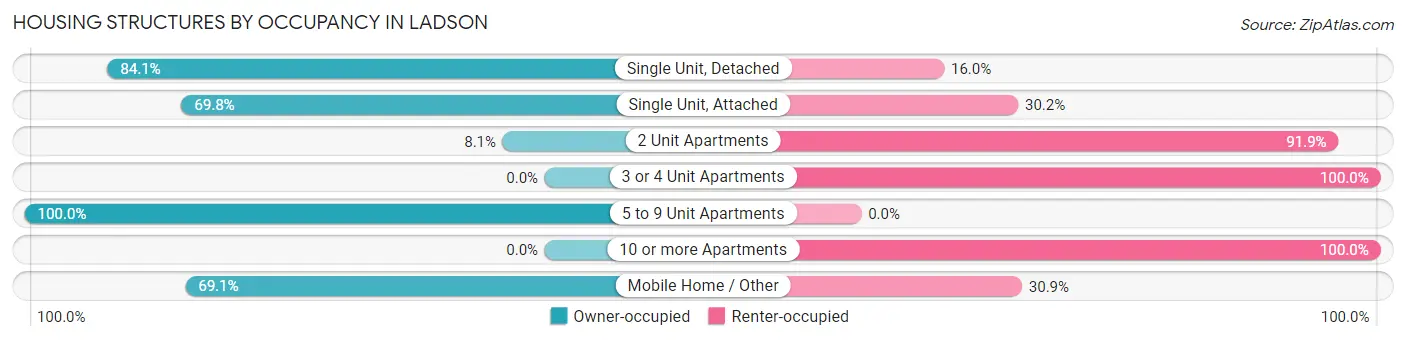
| Structure Type | Owner-occupied | Renter-occupied |
| Single Unit, Detached | 3,430 (84.1%) | 651 (16.0%) |
| Single Unit, Attached | 141 (69.8%) | 61 (30.2%) |
| 2 Unit Apartments | 6 (8.1%) | 68 (91.9%) |
| 3 or 4 Unit Apartments | 0 (0.0%) | 35 (100.0%) |
| 5 to 9 Unit Apartments | 24 (100.0%) | 0 (0.0%) |
| 10 or more Apartments | 0 (0.0%) | 129 (100.0%) |
| Mobile Home / Other | 596 (69.1%) | 267 (30.9%) |
| Total | 4,197 (77.6%) | 1,211 (22.4%) |
Housing Structures by Number of Rooms in Ladson
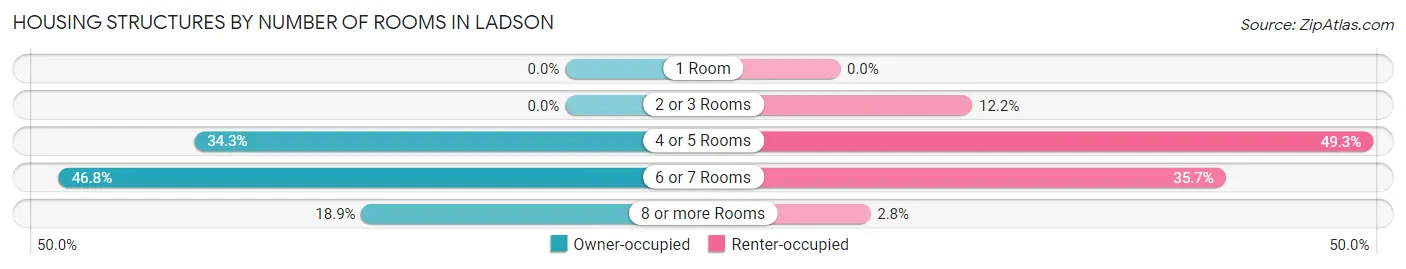
| Number of Rooms | Owner-occupied | Renter-occupied |
| 1 Room | 0 (0.0%) | 0 (0.0%) |
| 2 or 3 Rooms | 0 (0.0%) | 148 (12.2%) |
| 4 or 5 Rooms | 1,440 (34.3%) | 597 (49.3%) |
| 6 or 7 Rooms | 1,966 (46.8%) | 432 (35.7%) |
| 8 or more Rooms | 791 (18.9%) | 34 (2.8%) |
| Total | 4,197 (100.0%) | 1,211 (100.0%) |
Housing Structure by Heating Type in Ladson
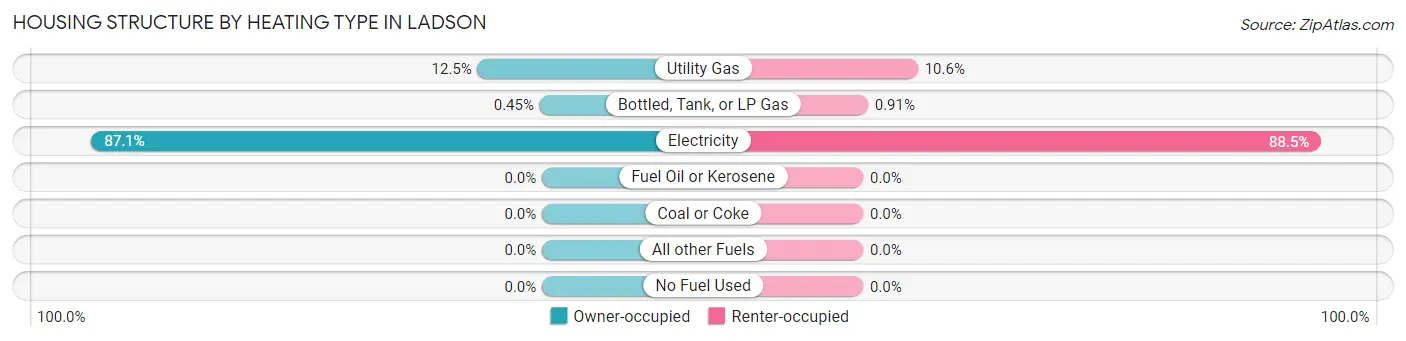
| Heating Type | Owner-occupied | Renter-occupied |
| Utility Gas | 523 (12.5%) | 128 (10.6%) |
| Bottled, Tank, or LP Gas | 19 (0.4%) | 11 (0.9%) |
| Electricity | 3,655 (87.1%) | 1,072 (88.5%) |
| Fuel Oil or Kerosene | 0 (0.0%) | 0 (0.0%) |
| Coal or Coke | 0 (0.0%) | 0 (0.0%) |
| All other Fuels | 0 (0.0%) | 0 (0.0%) |
| No Fuel Used | 0 (0.0%) | 0 (0.0%) |
| Total | 4,197 (100.0%) | 1,211 (100.0%) |
Household Vehicle Usage in Ladson
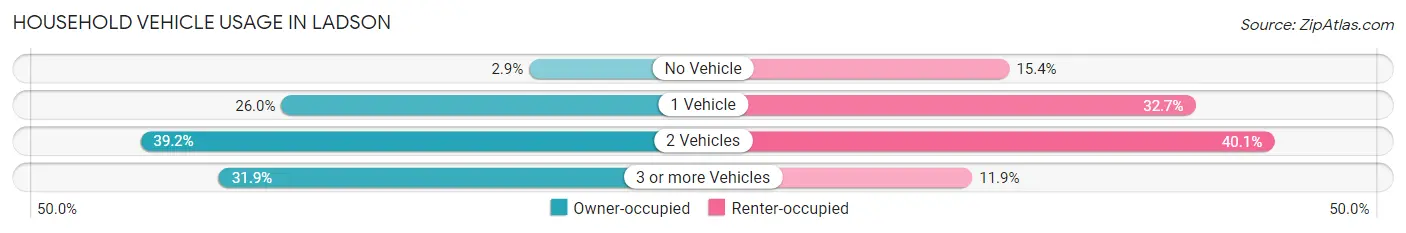
| Vehicles per Household | Owner-occupied | Renter-occupied |
| No Vehicle | 122 (2.9%) | 186 (15.4%) |
| 1 Vehicle | 1,093 (26.0%) | 396 (32.7%) |
| 2 Vehicles | 1,645 (39.2%) | 485 (40.1%) |
| 3 or more Vehicles | 1,337 (31.9%) | 144 (11.9%) |
| Total | 4,197 (100.0%) | 1,211 (100.0%) |
Real Estate & Mortgages in Ladson
Real Estate and Mortgage Overview in Ladson
| Characteristic | Without Mortgage | With Mortgage |
| Housing Units | 1,518 | 2,679 |
| Median Property Value | $197,700 | $220,600 |
| Median Household Income | $59,520 | $261 |
| Monthly Housing Costs | $404 | $0 |
| Real Estate Taxes | $827 | $64 |
Property Value by Mortgage Status in Ladson
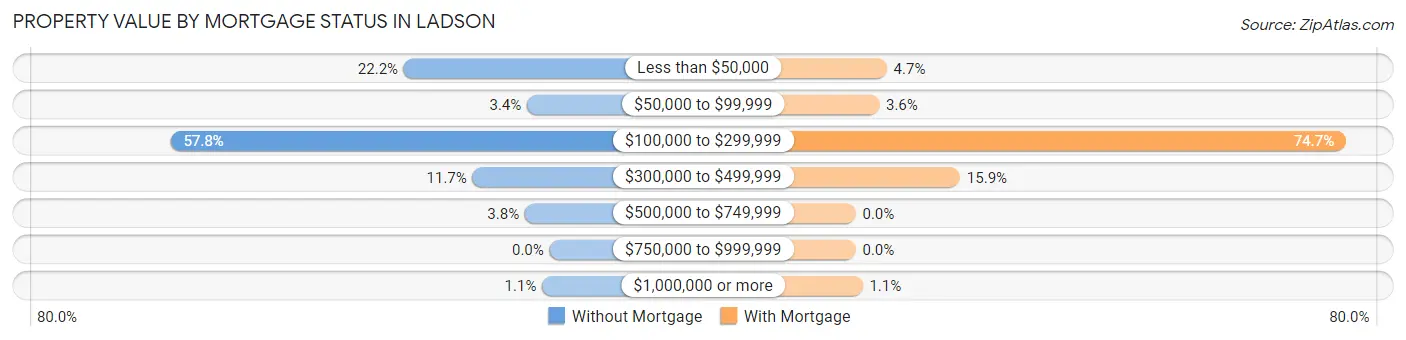
| Property Value | Without Mortgage | With Mortgage |
| Less than $50,000 | 337 (22.2%) | 127 (4.7%) |
| $50,000 to $99,999 | 52 (3.4%) | 96 (3.6%) |
| $100,000 to $299,999 | 877 (57.8%) | 2,002 (74.7%) |
| $300,000 to $499,999 | 178 (11.7%) | 426 (15.9%) |
| $500,000 to $749,999 | 57 (3.7%) | 0 (0.0%) |
| $750,000 to $999,999 | 0 (0.0%) | 0 (0.0%) |
| $1,000,000 or more | 17 (1.1%) | 28 (1.1%) |
| Total | 1,518 (100.0%) | 2,679 (100.0%) |
Household Income by Mortgage Status in Ladson
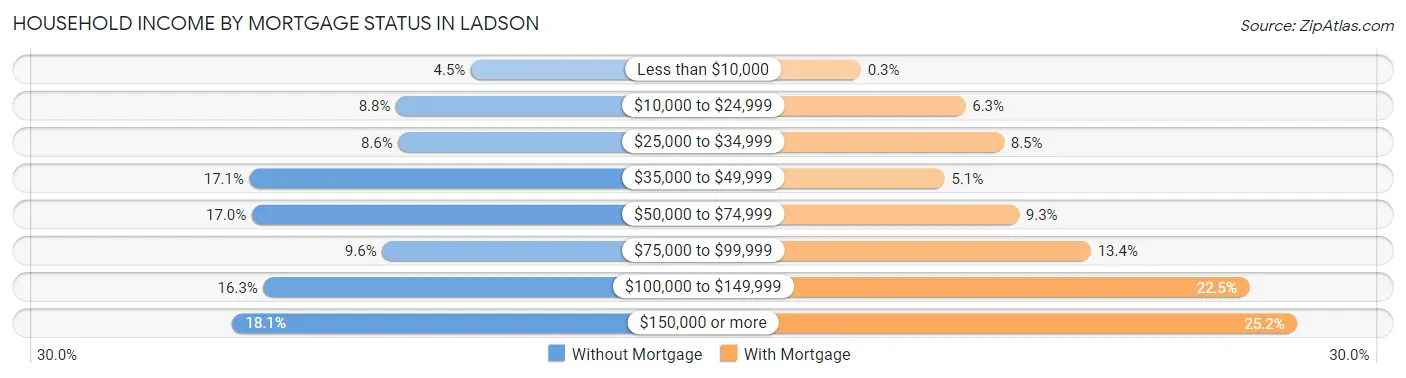
| Household Income | Without Mortgage | With Mortgage |
| Less than $10,000 | 68 (4.5%) | 8 (0.3%) |
| $10,000 to $24,999 | 133 (8.8%) | 168 (6.3%) |
| $25,000 to $34,999 | 131 (8.6%) | 227 (8.5%) |
| $35,000 to $49,999 | 260 (17.1%) | 136 (5.1%) |
| $50,000 to $74,999 | 258 (17.0%) | 250 (9.3%) |
| $75,000 to $99,999 | 145 (9.6%) | 360 (13.4%) |
| $100,000 to $149,999 | 248 (16.3%) | 602 (22.5%) |
| $150,000 or more | 275 (18.1%) | 675 (25.2%) |
| Total | 1,518 (100.0%) | 2,679 (100.0%) |
Property Value to Household Income Ratio in Ladson
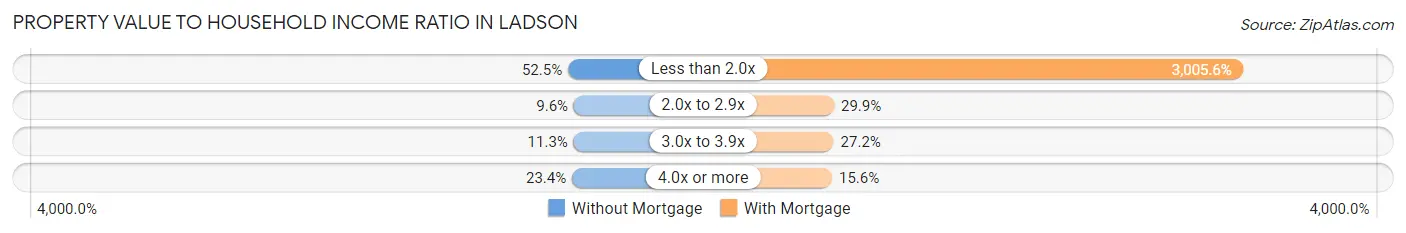
| Value-to-Income Ratio | Without Mortgage | With Mortgage |
| Less than 2.0x | 797 (52.5%) | 80,519 (3,005.6%) |
| 2.0x to 2.9x | 146 (9.6%) | 801 (29.9%) |
| 3.0x to 3.9x | 171 (11.3%) | 728 (27.2%) |
| 4.0x or more | 355 (23.4%) | 417 (15.6%) |
| Total | 1,518 (100.0%) | 2,679 (100.0%) |
Real Estate Taxes by Mortgage Status in Ladson
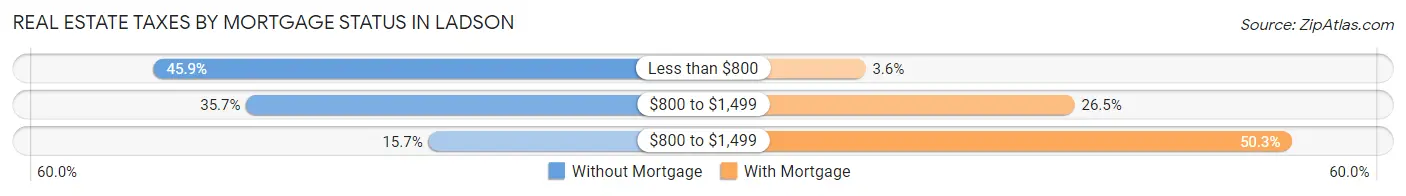
| Property Taxes | Without Mortgage | With Mortgage |
| Less than $800 | 696 (45.9%) | 95 (3.5%) |
| $800 to $1,499 | 542 (35.7%) | 709 (26.5%) |
| $800 to $1,499 | 239 (15.7%) | 1,348 (50.3%) |
| Total | 1,518 (100.0%) | 2,679 (100.0%) |
Health & Disability in Ladson
Health Insurance Coverage by Age in Ladson
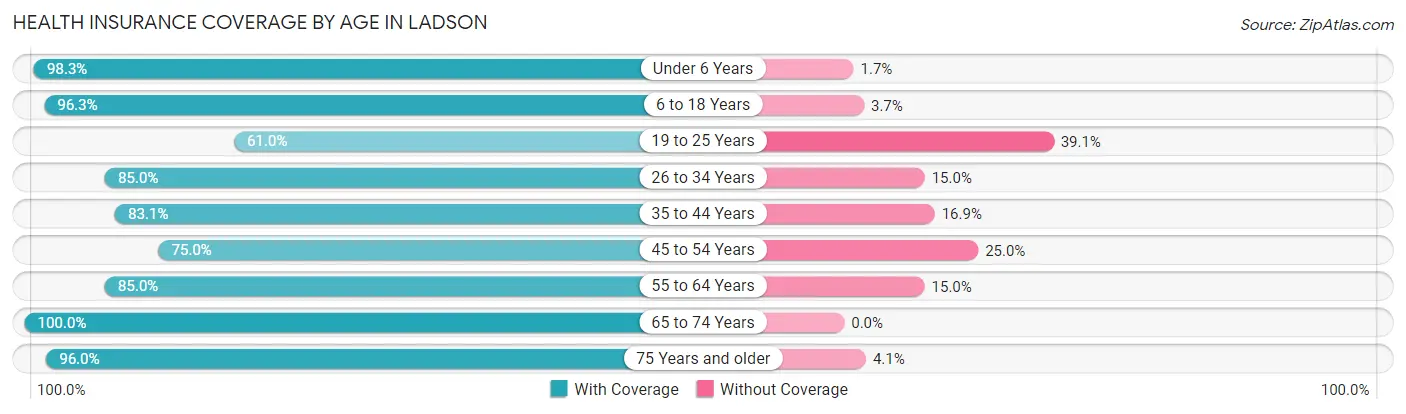
| Age Bracket | With Coverage | Without Coverage |
| Under 6 Years | 1,183 (98.3%) | 21 (1.7%) |
| 6 to 18 Years | 3,301 (96.3%) | 126 (3.7%) |
| 19 to 25 Years | 665 (61.0%) | 426 (39.1%) |
| 26 to 34 Years | 1,536 (85.0%) | 271 (15.0%) |
| 35 to 44 Years | 1,799 (83.1%) | 365 (16.9%) |
| 45 to 54 Years | 1,304 (75.0%) | 434 (25.0%) |
| 55 to 64 Years | 1,515 (85.0%) | 267 (15.0%) |
| 65 to 74 Years | 1,048 (100.0%) | 0 (0.0%) |
| 75 Years and older | 710 (96.0%) | 30 (4.1%) |
| Total | 13,061 (87.1%) | 1,940 (12.9%) |
Health Insurance Coverage by Citizenship Status in Ladson
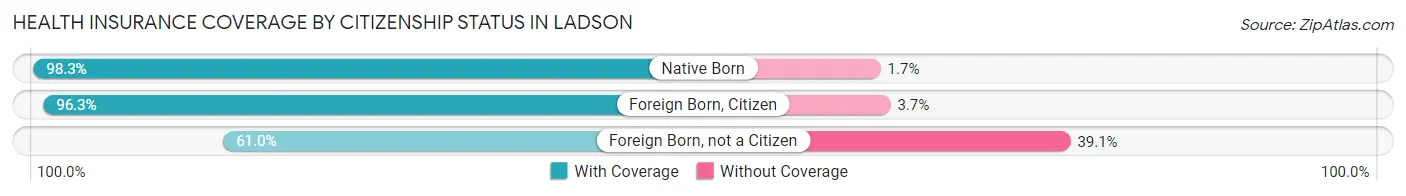
| Citizenship Status | With Coverage | Without Coverage |
| Native Born | 1,183 (98.3%) | 21 (1.7%) |
| Foreign Born, Citizen | 3,301 (96.3%) | 126 (3.7%) |
| Foreign Born, not a Citizen | 665 (61.0%) | 426 (39.1%) |
Health Insurance Coverage by Household Income in Ladson
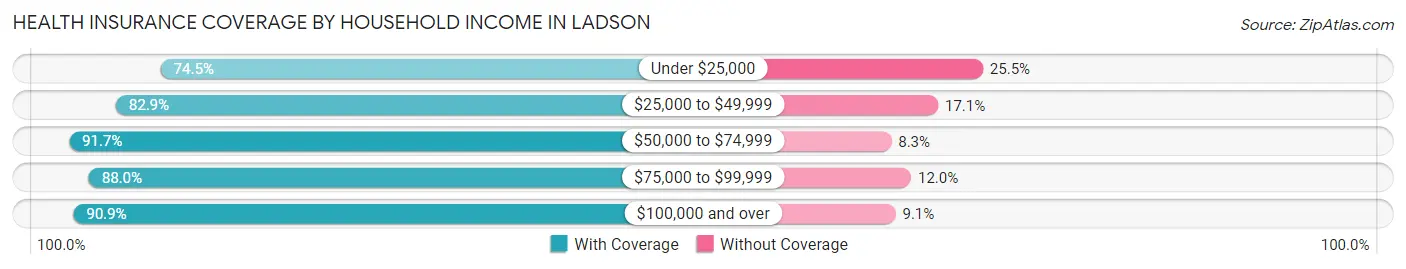
| Household Income | With Coverage | Without Coverage |
| Under $25,000 | 1,639 (74.5%) | 561 (25.5%) |
| $25,000 to $49,999 | 1,609 (82.9%) | 332 (17.1%) |
| $50,000 to $74,999 | 2,113 (91.7%) | 192 (8.3%) |
| $75,000 to $99,999 | 2,286 (88.0%) | 313 (12.0%) |
| $100,000 and over | 5,394 (90.9%) | 542 (9.1%) |
Public vs Private Health Insurance Coverage by Age in Ladson
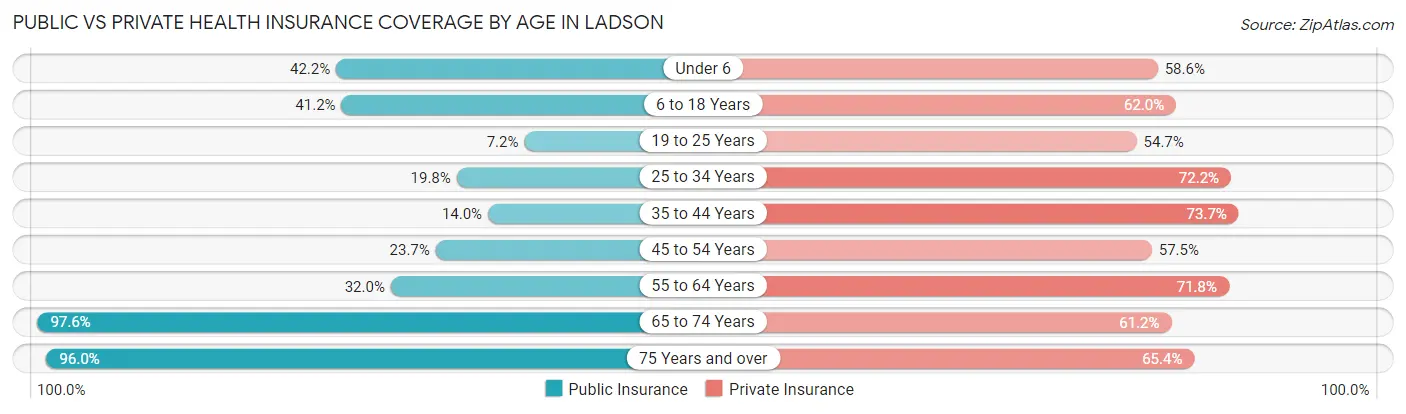
| Age Bracket | Public Insurance | Private Insurance |
| Under 6 | 508 (42.2%) | 706 (58.6%) |
| 6 to 18 Years | 1,412 (41.2%) | 2,126 (62.0%) |
| 19 to 25 Years | 79 (7.2%) | 597 (54.7%) |
| 25 to 34 Years | 358 (19.8%) | 1,305 (72.2%) |
| 35 to 44 Years | 303 (14.0%) | 1,594 (73.7%) |
| 45 to 54 Years | 412 (23.7%) | 1,000 (57.5%) |
| 55 to 64 Years | 571 (32.0%) | 1,280 (71.8%) |
| 65 to 74 Years | 1,023 (97.6%) | 641 (61.2%) |
| 75 Years and over | 710 (96.0%) | 484 (65.4%) |
| Total | 5,376 (35.8%) | 9,733 (64.9%) |
Disability Status by Sex by Age in Ladson
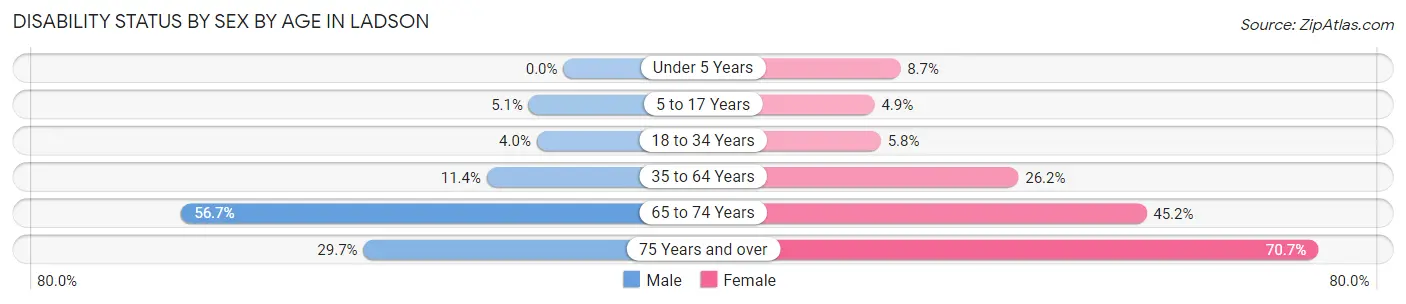
| Age Bracket | Male | Female |
| Under 5 Years | 0 (0.0%) | 31 (8.7%) |
| 5 to 17 Years | 106 (5.1%) | 75 (4.9%) |
| 18 to 34 Years | 68 (4.0%) | 80 (5.8%) |
| 35 to 64 Years | 310 (11.4%) | 775 (26.2%) |
| 65 to 74 Years | 316 (56.7%) | 222 (45.2%) |
| 75 Years and over | 95 (29.7%) | 297 (70.7%) |
Disability Class by Sex by Age in Ladson
Disability Class: Hearing Difficulty
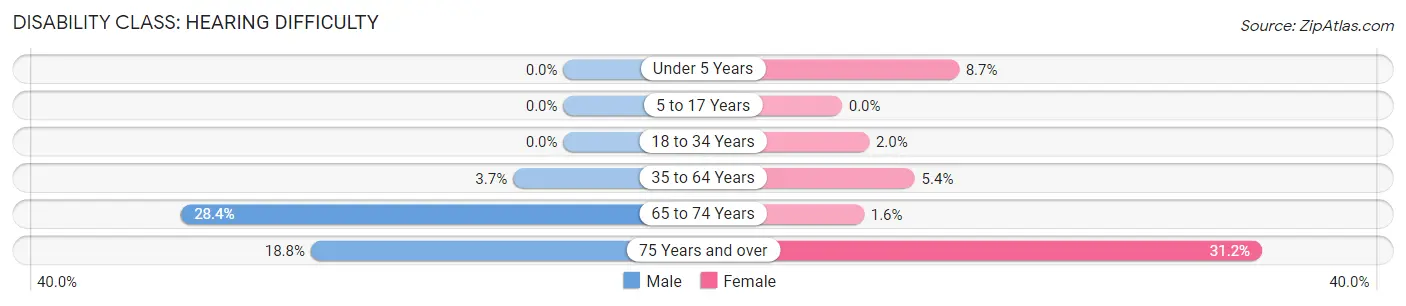
| Age Bracket | Male | Female |
| Under 5 Years | 0 (0.0%) | 31 (8.7%) |
| 5 to 17 Years | 0 (0.0%) | 0 (0.0%) |
| 18 to 34 Years | 0 (0.0%) | 28 (2.0%) |
| 35 to 64 Years | 102 (3.7%) | 160 (5.4%) |
| 65 to 74 Years | 158 (28.4%) | 8 (1.6%) |
| 75 Years and over | 60 (18.8%) | 131 (31.2%) |
Disability Class: Vision Difficulty
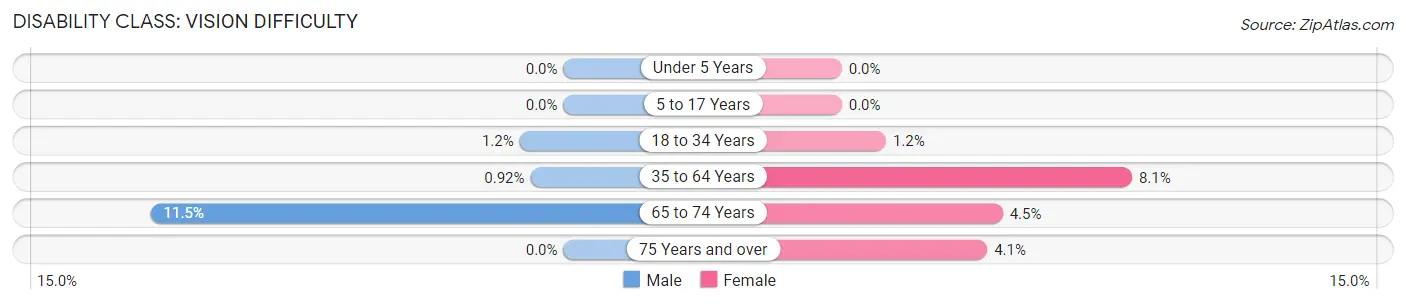
| Age Bracket | Male | Female |
| Under 5 Years | 0 (0.0%) | 0 (0.0%) |
| 5 to 17 Years | 0 (0.0%) | 0 (0.0%) |
| 18 to 34 Years | 21 (1.2%) | 17 (1.2%) |
| 35 to 64 Years | 25 (0.9%) | 239 (8.1%) |
| 65 to 74 Years | 64 (11.5%) | 22 (4.5%) |
| 75 Years and over | 0 (0.0%) | 17 (4.1%) |
Disability Class: Cognitive Difficulty
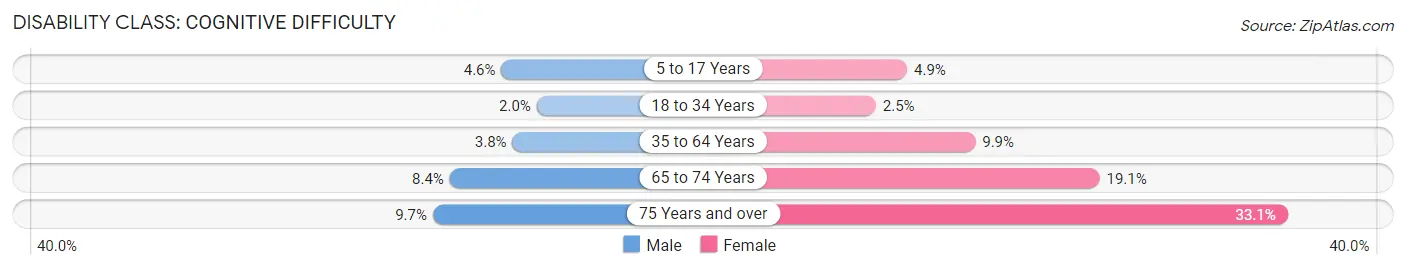
| Age Bracket | Male | Female |
| 5 to 17 Years | 95 (4.6%) | 75 (4.9%) |
| 18 to 34 Years | 34 (2.0%) | 35 (2.5%) |
| 35 to 64 Years | 103 (3.8%) | 293 (9.9%) |
| 65 to 74 Years | 47 (8.4%) | 94 (19.1%) |
| 75 Years and over | 31 (9.7%) | 139 (33.1%) |
Disability Class: Ambulatory Difficulty
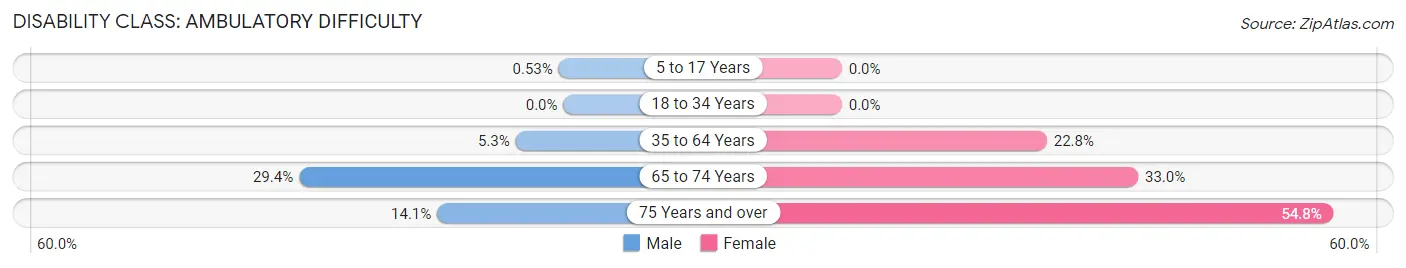
| Age Bracket | Male | Female |
| 5 to 17 Years | 11 (0.5%) | 0 (0.0%) |
| 18 to 34 Years | 0 (0.0%) | 0 (0.0%) |
| 35 to 64 Years | 145 (5.3%) | 675 (22.8%) |
| 65 to 74 Years | 164 (29.4%) | 162 (33.0%) |
| 75 Years and over | 45 (14.1%) | 230 (54.8%) |
Disability Class: Self-Care Difficulty
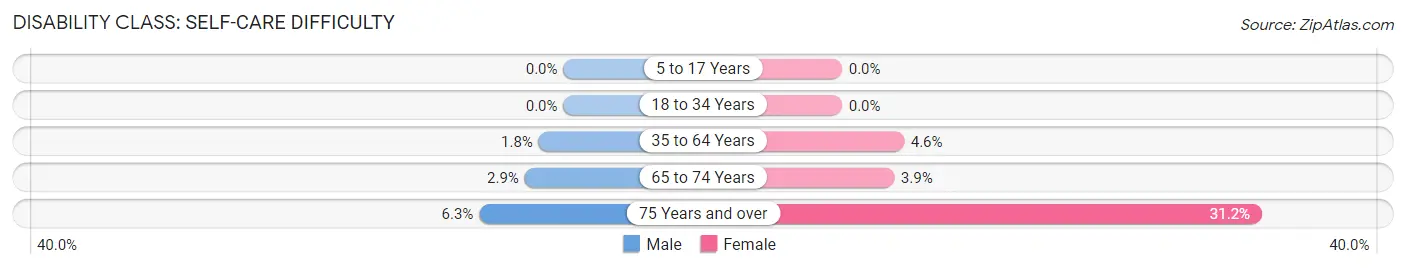
| Age Bracket | Male | Female |
| 5 to 17 Years | 0 (0.0%) | 0 (0.0%) |
| 18 to 34 Years | 0 (0.0%) | 0 (0.0%) |
| 35 to 64 Years | 50 (1.8%) | 136 (4.6%) |
| 65 to 74 Years | 16 (2.9%) | 19 (3.9%) |
| 75 Years and over | 20 (6.2%) | 131 (31.2%) |
Technology Access in Ladson
Computing Device Access in Ladson
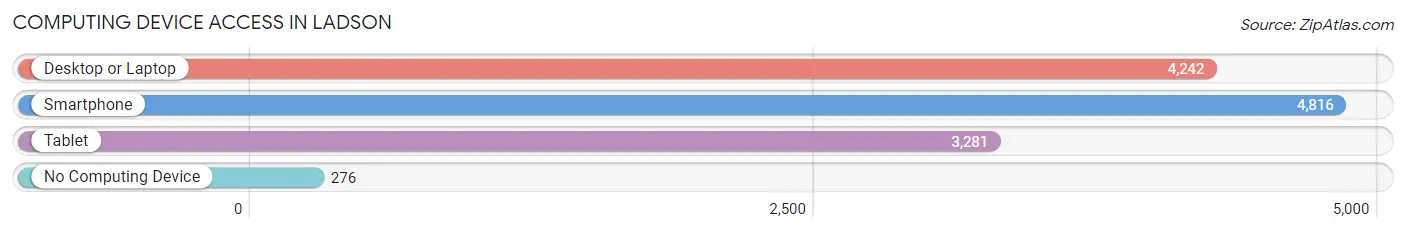
| Device Type | # Households | % Households |
| Desktop or Laptop | 4,242 | 78.4% |
| Smartphone | 4,816 | 89.0% |
| Tablet | 3,281 | 60.7% |
| No Computing Device | 276 | 5.1% |
| Total | 5,408 | 100.0% |
Internet Access in Ladson
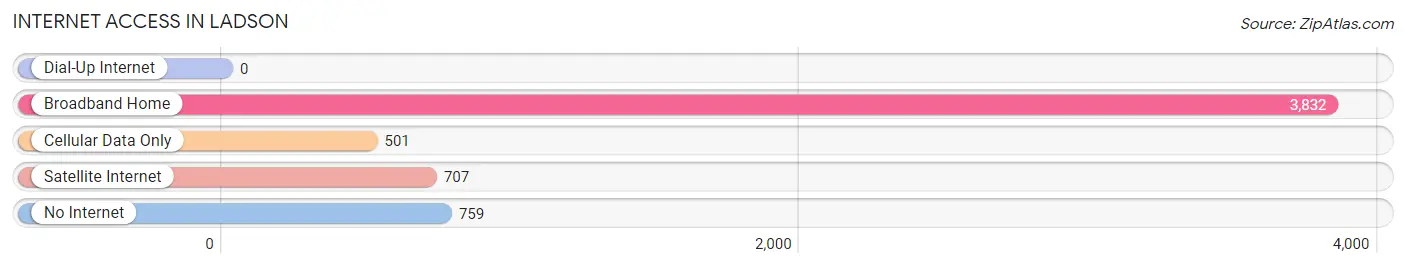
| Internet Type | # Households | % Households |
| Dial-Up Internet | 0 | 0.0% |
| Broadband Home | 3,832 | 70.9% |
| Cellular Data Only | 501 | 9.3% |
| Satellite Internet | 707 | 13.1% |
| No Internet | 759 | 14.0% |
| Total | 5,408 | 100.0% |
Ladson Summary
Ladson is a census-designated place (CDP) located in the northern part of Dorchester County, South Carolina. It is a suburb of Charleston and is located approximately 15 miles northwest of the city. The population of Ladson was 13,790 at the 2010 census.
History
Ladson was first settled in the late 1700s by a group of settlers from the nearby town of Summerville. The town was named after a local landowner, William Ladson, who owned a large tract of land in the area. The town was officially incorporated in 1891.
In the early 1900s, Ladson was a small farming community. The town was home to several small businesses, including a general store, a blacksmith shop, and a cotton gin. The town also had a post office and a school.
In the 1950s, Ladson began to experience rapid growth due to the expansion of the Charleston Air Force Base. The base brought many new jobs to the area and caused the population of Ladson to nearly double in size.
In the late 1970s, Ladson began to experience a decline in population as many of the military personnel stationed at the base were transferred to other locations. The town also experienced a decline in businesses as many of the local businesses closed due to the lack of customers.
In the late 1990s, Ladson began to experience a resurgence in population and businesses as the town began to attract new residents and businesses. The town is now home to several large retail stores, restaurants, and other businesses.
Geography
Ladson is located in northern Dorchester County, South Carolina. It is situated approximately 15 miles northwest of Charleston. The town is bordered by the towns of Summerville to the north, North Charleston to the east, and Goose Creek to the south.
The town is located in the Lowcountry region of South Carolina and is characterized by its flat terrain and sandy soil. The town is located near several bodies of water, including the Ashley River, the Cooper River, and the Wando River.
Economy
Ladson is home to several large businesses, including Boeing South Carolina, a major aircraft manufacturer, and the Charleston Air Force Base. The town is also home to several retail stores, restaurants, and other businesses.
The town is also home to several educational institutions, including Trident Technical College and the College of Charleston.
Demographics
As of the 2010 census, Ladson had a population of 13,790. The racial makeup of the town was 73.3% White, 19.2% African American, 0.5% Native American, 2.2% Asian, 0.1% Pacific Islander, 2.2% from other races, and 2.7% from two or more races. Hispanic or Latino of any race were 5.2% of the population.
The median income for a household in Ladson was $45,945, and the median income for a family was $54,945. The per capita income for the town was $21,945. About 8.3% of families and 10.7% of the population were below the poverty line, including 14.2% of those under age 18 and 8.2% of those age 65 or over.
Common Questions
What is Per Capita Income in Ladson?
Per Capita income in Ladson is $37,413.
What is the Median Family Income in Ladson?
Median Family Income in Ladson is $79,712.
What is the Median Household income in Ladson?
Median Household Income in Ladson is $74,020.
What is Income or Wage Gap in Ladson?
Income or Wage Gap in Ladson is 29.9%.
Women in Ladson earn 70.1 cents for every dollar earned by a man.
What is Inequality or Gini Index in Ladson?
Inequality or Gini Index in Ladson is 0.51.
What is the Total Population of Ladson?
Total Population of Ladson is 15,298.
What is the Total Male Population of Ladson?
Total Male Population of Ladson is 8,126.
What is the Total Female Population of Ladson?
Total Female Population of Ladson is 7,172.
What is the Ratio of Males per 100 Females in Ladson?
There are 113.30 Males per 100 Females in Ladson.
What is the Ratio of Females per 100 Males in Ladson?
There are 88.26 Females per 100 Males in Ladson.
What is the Median Population Age in Ladson?
Median Population Age in Ladson is 34.7 Years.
What is the Average Family Size in Ladson
Average Family Size in Ladson is 3.5 People.
What is the Average Household Size in Ladson
Average Household Size in Ladson is 2.8 People.
How Large is the Labor Force in Ladson?
There are 7,257 People in the Labor Forcein in Ladson.
What is the Percentage of People in the Labor Force in Ladson?
64.1% of People are in the Labor Force in Ladson.
What is the Unemployment Rate in Ladson?
Unemployment Rate in Ladson is 6.1%.