Nebraska City, NE Map & Demographics
Nebraska City Map
Nebraska City Overview
$31,073
PER CAPITA INCOME
$84,125
AVG FAMILY INCOME
$63,732
AVG HOUSEHOLD INCOME
36.2%
WAGE / INCOME GAP [ % ]
63.8¢/ $1
WAGE / INCOME GAP [ $ ]
$8,471
FAMILY INCOME DEFICIT
0.42
INEQUALITY / GINI INDEX
7,257
TOTAL POPULATION
3,780
MALE POPULATION
3,477
FEMALE POPULATION
108.71
MALES / 100 FEMALES
91.98
FEMALES / 100 MALES
38.8
MEDIAN AGE
3.2
AVG FAMILY SIZE
2.5
AVG HOUSEHOLD SIZE
3,828
LABOR FORCE [ PEOPLE ]
67.7%
PERCENT IN LABOR FORCE
2.8%
UNEMPLOYMENT RATE
Nebraska City Zip Codes
Nebraska City Area Codes
Income in Nebraska City
Income Overview in Nebraska City
Per Capita Income in Nebraska City is $31,073, while median incomes of families and households are $84,125 and $63,732 respectively.
| Characteristic | Number | Measure |
| Per Capita Income | 7,257 | $31,073 |
| Median Family Income | 1,662 | $84,125 |
| Mean Family Income | 1,662 | $88,150 |
| Median Household Income | 2,850 | $63,732 |
| Mean Household Income | 2,850 | $74,966 |
| Income Deficit | 1,662 | $8,471 |
| Wage / Income Gap (%) | 7,257 | 36.19% |
| Wage / Income Gap ($) | 7,257 | 63.81¢ per $1 |
| Gini / Inequality Index | 7,257 | 0.42 |
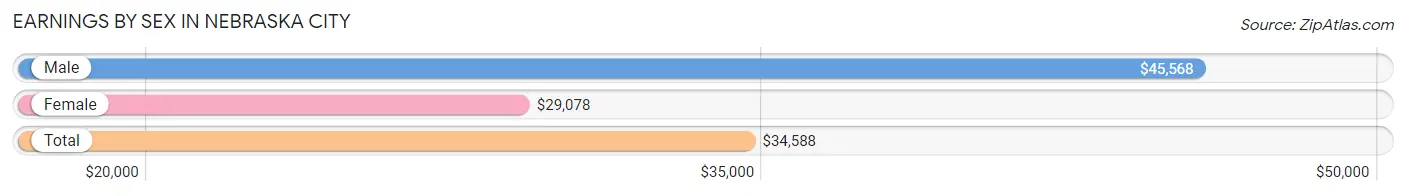
Earnings by Sex in Nebraska City
Average Earnings in Nebraska City are $34,588, $45,568 for men and $29,078 for women, a difference of 36.2%.
| Sex | Number | Average Earnings |
| Male | 2,196 (55.3%) | $45,568 |
| Female | 1,778 (44.7%) | $29,078 |
| Total | 3,974 (100.0%) | $34,588 |
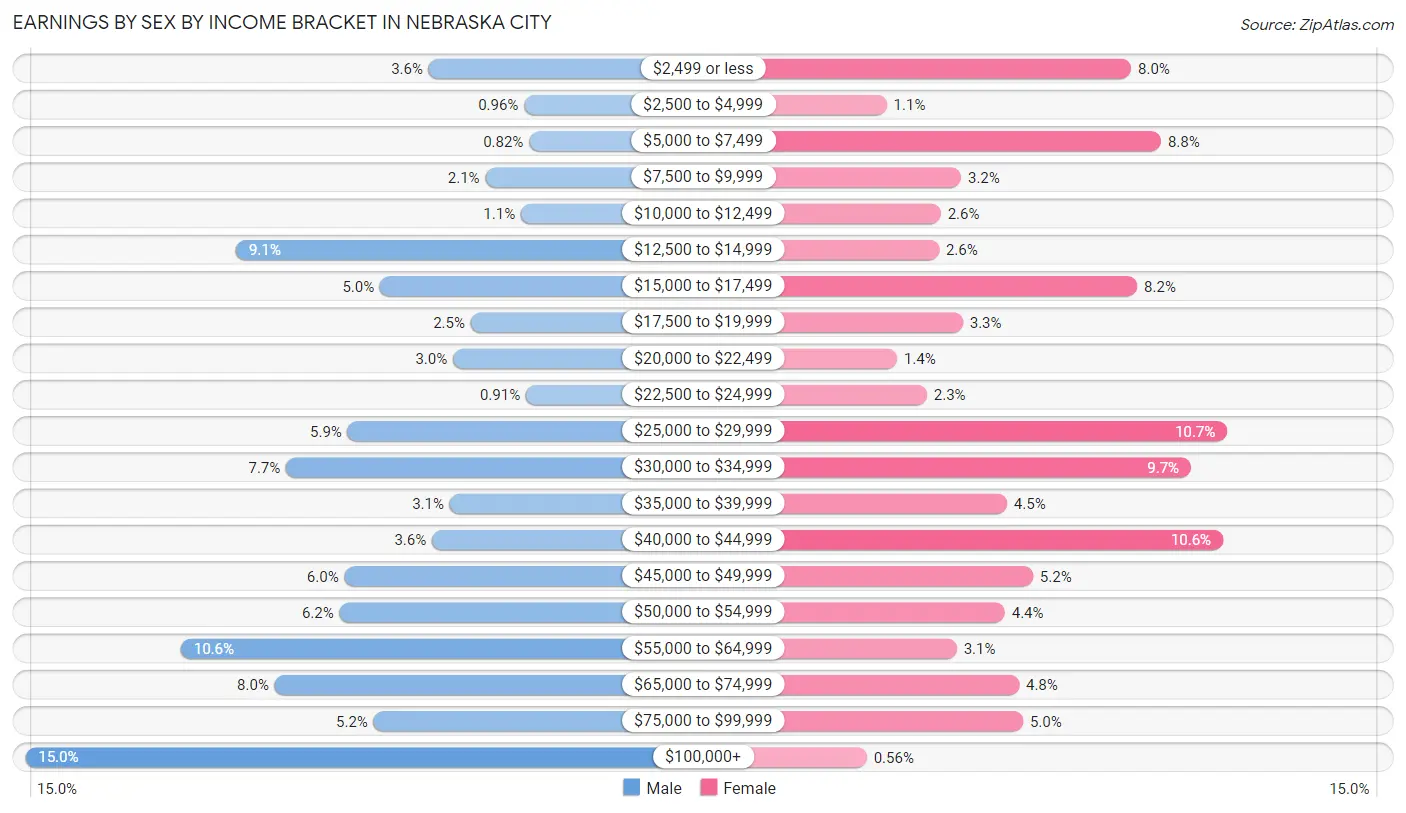
Earnings by Sex by Income Bracket in Nebraska City
The most common earnings brackets in Nebraska City are $100,000+ for men (329 | 15.0%) and $25,000 to $29,999 for women (190 | 10.7%).
| Income | Male | Female |
| $2,499 or less | 80 (3.6%) | 142 (8.0%) |
| $2,500 to $4,999 | 21 (1.0%) | 20 (1.1%) |
| $5,000 to $7,499 | 18 (0.8%) | 157 (8.8%) |
| $7,500 to $9,999 | 45 (2.1%) | 57 (3.2%) |
| $10,000 to $12,499 | 23 (1.1%) | 47 (2.6%) |
| $12,500 to $14,999 | 199 (9.1%) | 46 (2.6%) |
| $15,000 to $17,499 | 110 (5.0%) | 145 (8.2%) |
| $17,500 to $19,999 | 54 (2.5%) | 58 (3.3%) |
| $20,000 to $22,499 | 65 (3.0%) | 25 (1.4%) |
| $22,500 to $24,999 | 20 (0.9%) | 40 (2.2%) |
| $25,000 to $29,999 | 130 (5.9%) | 190 (10.7%) |
| $30,000 to $34,999 | 168 (7.6%) | 172 (9.7%) |
| $35,000 to $39,999 | 67 (3.0%) | 80 (4.5%) |
| $40,000 to $44,999 | 78 (3.5%) | 188 (10.6%) |
| $45,000 to $49,999 | 132 (6.0%) | 93 (5.2%) |
| $50,000 to $54,999 | 135 (6.1%) | 79 (4.4%) |
| $55,000 to $64,999 | 233 (10.6%) | 55 (3.1%) |
| $65,000 to $74,999 | 175 (8.0%) | 86 (4.8%) |
| $75,000 to $99,999 | 114 (5.2%) | 88 (5.0%) |
| $100,000+ | 329 (15.0%) | 10 (0.6%) |
| Total | 2,196 (100.0%) | 1,778 (100.0%) |
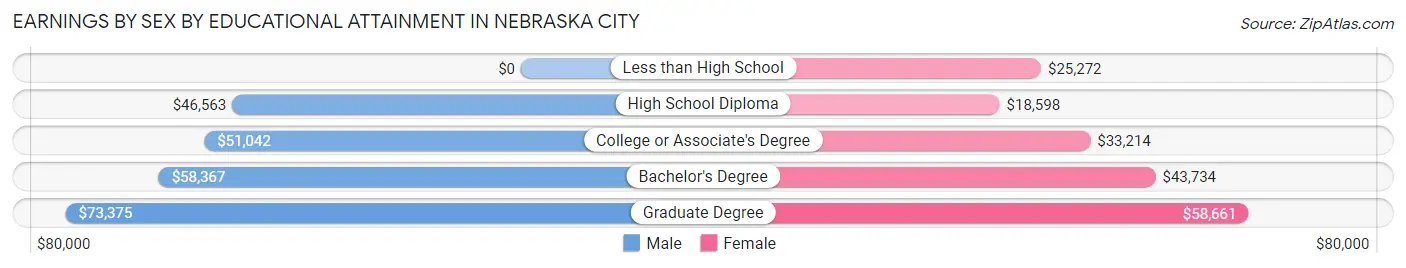
Earnings by Sex by Educational Attainment in Nebraska City
Average earnings in Nebraska City are $53,371 for men and $29,939 for women, a difference of 43.9%. Men with an educational attainment of graduate degree enjoy the highest average annual earnings of $73,375, while those with high school diploma education earn the least with $46,563. Women with an educational attainment of graduate degree earn the most with the average annual earnings of $58,661, while those with high school diploma education have the smallest earnings of $18,598.
| Educational Attainment | Male Income | Female Income |
| Less than High School | - | - |
| High School Diploma | $46,563 | $18,598 |
| College or Associate's Degree | $51,042 | $33,214 |
| Bachelor's Degree | $58,367 | $43,734 |
| Graduate Degree | $73,375 | $58,661 |
| Total | $53,371 | $29,939 |
Family Income in Nebraska City
Family Income Brackets in Nebraska City
According to the Nebraska City family income data, there are 376 families falling into the $100,000 to $149,999 income range, which is the most common income bracket and makes up 22.6% of all families. Conversely, the $25,000 to $34,999 income bracket is the least frequent group with only 12 families (0.7%) belonging to this category.
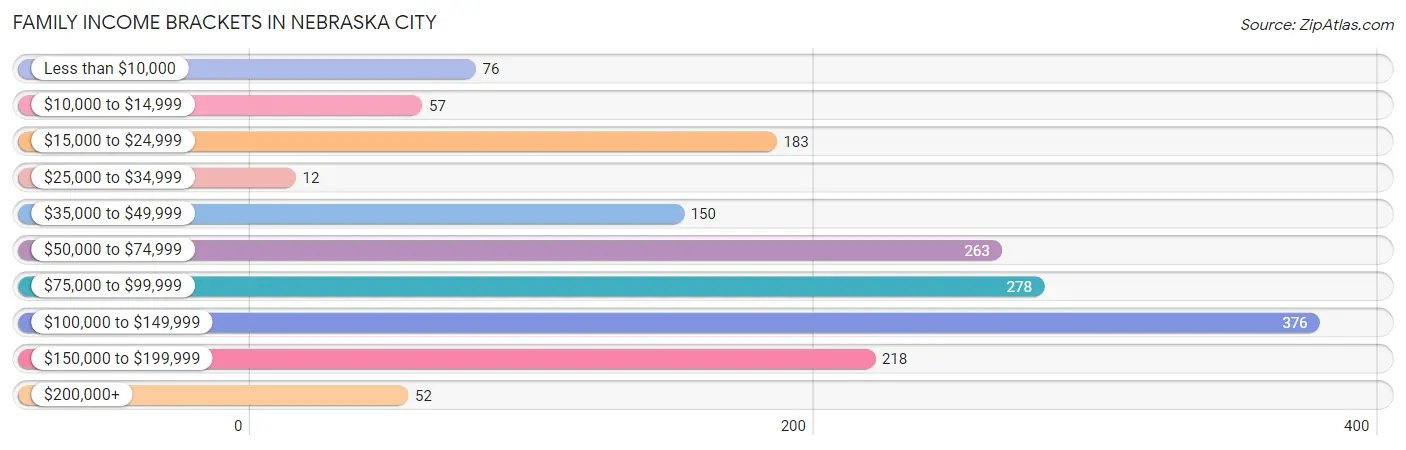
| Income Bracket | # Families | % Families |
| Less than $10,000 | 76 | 4.6% |
| $10,000 to $14,999 | 57 | 3.4% |
| $15,000 to $24,999 | 183 | 11.0% |
| $25,000 to $34,999 | 12 | 0.7% |
| $35,000 to $49,999 | 150 | 9.0% |
| $50,000 to $74,999 | 263 | 15.8% |
| $75,000 to $99,999 | 278 | 16.7% |
| $100,000 to $149,999 | 376 | 22.6% |
| $150,000 to $199,999 | 218 | 13.1% |
| $200,000+ | 52 | 3.1% |
Family Income by Famaliy Size in Nebraska City
5-person families (65 | 3.9%) account for the highest median family income in Nebraska City with $101,806 per family, while 2-person families (831 | 50.0%) have the highest median income of $34,946 per family member.
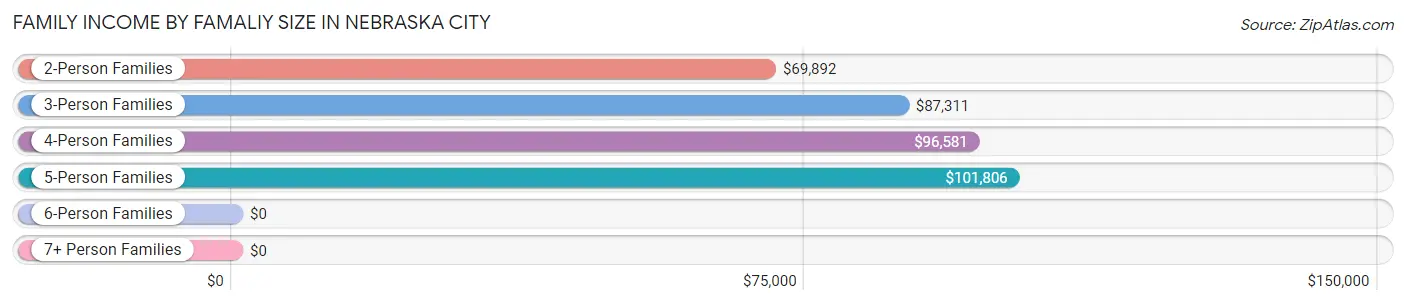
| Income Bracket | # Families | Median Income |
| 2-Person Families | 831 (50.0%) | $69,892 |
| 3-Person Families | 367 (22.1%) | $87,311 |
| 4-Person Families | 299 (18.0%) | $96,581 |
| 5-Person Families | 65 (3.9%) | $101,806 |
| 6-Person Families | 81 (4.9%) | $0 |
| 7+ Person Families | 19 (1.1%) | $0 |
| Total | 1,662 (100.0%) | $84,125 |
Family Income by Number of Earners in Nebraska City
The median family income in Nebraska City is $84,125, with families comprising 3+ earners (161) having the highest median family income of $180,434, while families with no earners (259) have the lowest median family income of $36,544, accounting for 9.7% and 15.6% of families, respectively.
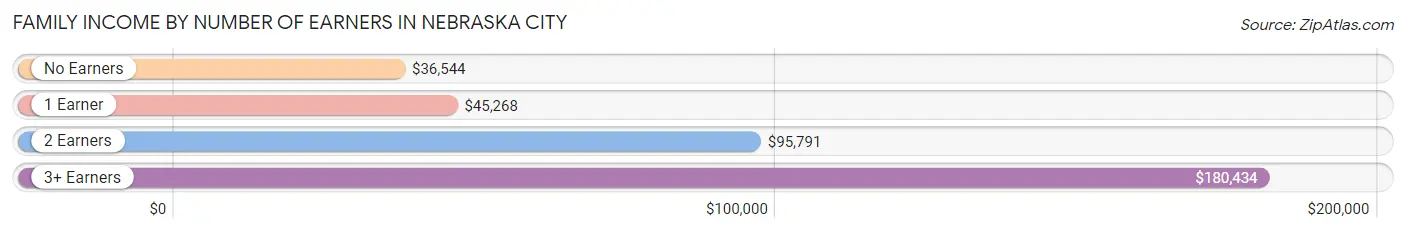
| Number of Earners | # Families | Median Income |
| No Earners | 259 (15.6%) | $36,544 |
| 1 Earner | 465 (28.0%) | $45,268 |
| 2 Earners | 777 (46.8%) | $95,791 |
| 3+ Earners | 161 (9.7%) | $180,434 |
| Total | 1,662 (100.0%) | $84,125 |
Household Income in Nebraska City
Household Income Brackets in Nebraska City
With 519 households falling in the category, the $50,000 to $74,999 income range is the most frequent in Nebraska City, accounting for 18.2% of all households. In contrast, only 57 households (2.0%) fall into the $200,000+ income bracket, making it the least populous group.
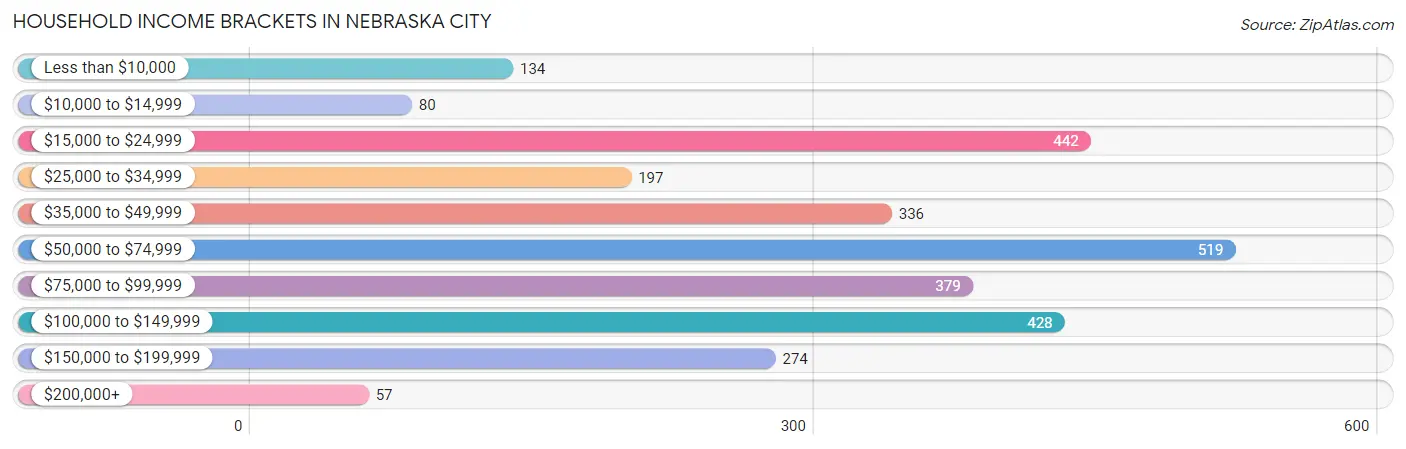
| Income Bracket | # Households | % Households |
| Less than $10,000 | 134 | 4.7% |
| $10,000 to $14,999 | 80 | 2.8% |
| $15,000 to $24,999 | 442 | 15.5% |
| $25,000 to $34,999 | 197 | 6.9% |
| $35,000 to $49,999 | 336 | 11.8% |
| $50,000 to $74,999 | 519 | 18.2% |
| $75,000 to $99,999 | 379 | 13.3% |
| $100,000 to $149,999 | 428 | 15.0% |
| $150,000 to $199,999 | 274 | 9.6% |
| $200,000+ | 57 | 2.0% |
Household Income by Householder Age in Nebraska City
The median household income in Nebraska City is $63,732, with the highest median household income of $90,385 found in the 45 to 64 years age bracket for the primary householder. A total of 978 households (34.3%) fall into this category. Meanwhile, the 15 to 24 years age bracket for the primary householder has the lowest median household income of $46,083, with 193 households (6.8%) in this group.
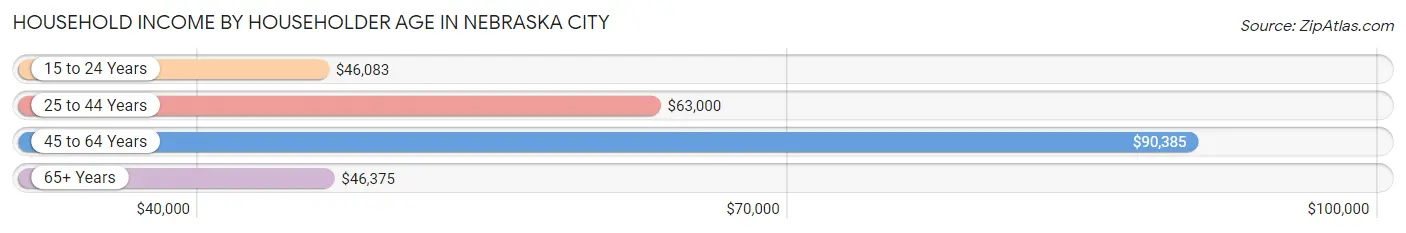
| Income Bracket | # Households | Median Income |
| 15 to 24 Years | 193 (6.8%) | $46,083 |
| 25 to 44 Years | 798 (28.0%) | $63,000 |
| 45 to 64 Years | 978 (34.3%) | $90,385 |
| 65+ Years | 881 (30.9%) | $46,375 |
| Total | 2,850 (100.0%) | $63,732 |
Poverty in Nebraska City
Income Below Poverty by Sex and Age in Nebraska City
With 14.4% poverty level for males and 20.7% for females among the residents of Nebraska City, under 5 year old males and 25 to 34 year old females are the most vulnerable to poverty, with 95 males (72.0%) and 132 females (54.3%) in their respective age groups living below the poverty level.
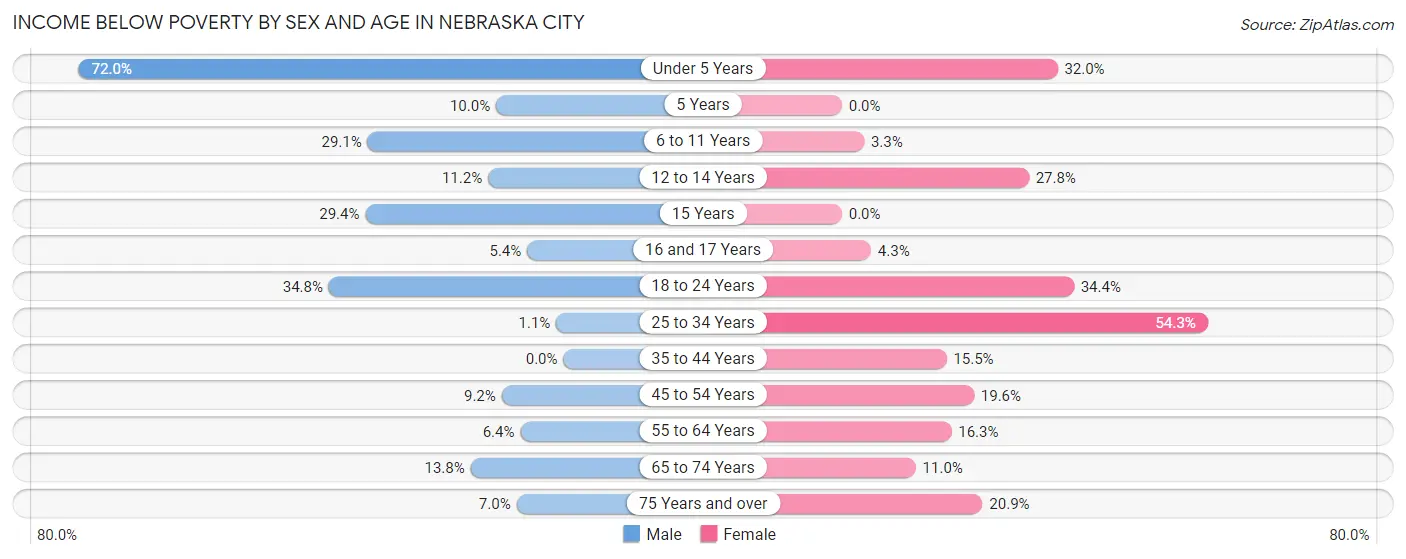
| Age Bracket | Male | Female |
| Under 5 Years | 95 (72.0%) | 73 (32.0%) |
| 5 Years | 5 (10.0%) | 0 (0.0%) |
| 6 to 11 Years | 89 (29.1%) | 7 (3.3%) |
| 12 to 14 Years | 47 (11.2%) | 48 (27.8%) |
| 15 Years | 10 (29.4%) | 0 (0.0%) |
| 16 and 17 Years | 5 (5.4%) | 6 (4.3%) |
| 18 to 24 Years | 147 (34.8%) | 93 (34.4%) |
| 25 to 34 Years | 5 (1.1%) | 132 (54.3%) |
| 35 to 44 Years | 0 (0.0%) | 90 (15.5%) |
| 45 to 54 Years | 43 (9.2%) | 80 (19.6%) |
| 55 to 64 Years | 26 (6.4%) | 66 (16.3%) |
| 65 to 74 Years | 47 (13.8%) | 44 (11.0%) |
| 75 Years and over | 16 (7.0%) | 62 (20.9%) |
| Total | 535 (14.4%) | 701 (20.7%) |
Income Above Poverty by Sex and Age in Nebraska City
According to the poverty statistics in Nebraska City, males aged 35 to 44 years and females aged 5 years are the age groups that are most secure financially, with 100.0% of males and 100.0% of females in these age groups living above the poverty line.
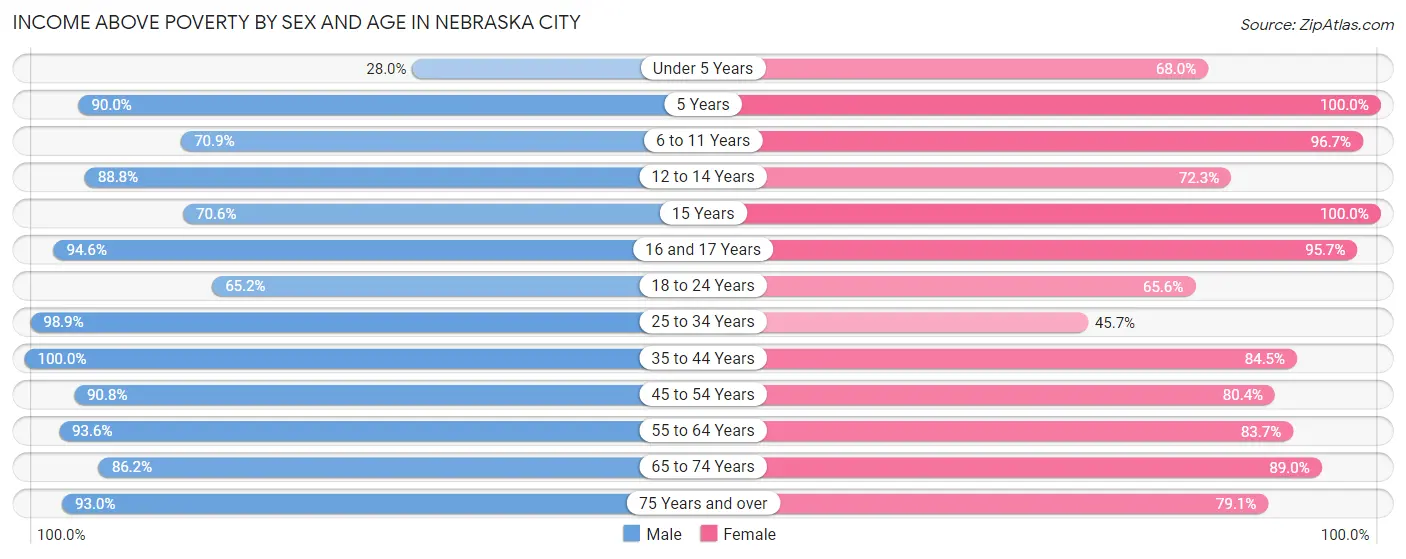
| Age Bracket | Male | Female |
| Under 5 Years | 37 (28.0%) | 155 (68.0%) |
| 5 Years | 45 (90.0%) | 15 (100.0%) |
| 6 to 11 Years | 217 (70.9%) | 206 (96.7%) |
| 12 to 14 Years | 373 (88.8%) | 125 (72.3%) |
| 15 Years | 24 (70.6%) | 17 (100.0%) |
| 16 and 17 Years | 88 (94.6%) | 133 (95.7%) |
| 18 to 24 Years | 275 (65.2%) | 177 (65.6%) |
| 25 to 34 Years | 465 (98.9%) | 111 (45.7%) |
| 35 to 44 Years | 336 (100.0%) | 489 (84.5%) |
| 45 to 54 Years | 426 (90.8%) | 328 (80.4%) |
| 55 to 64 Years | 381 (93.6%) | 340 (83.7%) |
| 65 to 74 Years | 294 (86.2%) | 357 (89.0%) |
| 75 Years and over | 214 (93.0%) | 235 (79.1%) |
| Total | 3,175 (85.6%) | 2,688 (79.3%) |
Income Below Poverty Among Married-Couple Families in Nebraska City
The poverty statistics for married-couple families in Nebraska City show that 5.4% or 67 of the total 1,244 families live below the poverty line. Families with no children have the highest poverty rate of 9.0%, comprising of 67 families. On the other hand, families with 1 or 2 children have the lowest poverty rate of 0.0%, which includes 0 families.
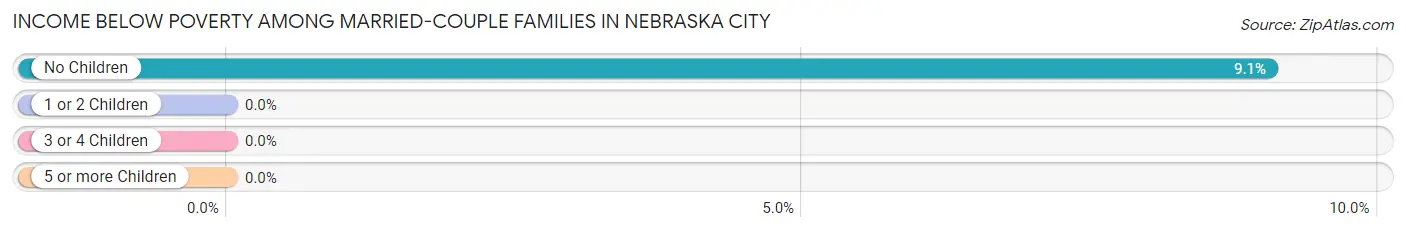
| Children | Above Poverty | Below Poverty |
| No Children | 673 (90.9%) | 67 (9.0%) |
| 1 or 2 Children | 415 (100.0%) | 0 (0.0%) |
| 3 or 4 Children | 70 (100.0%) | 0 (0.0%) |
| 5 or more Children | 19 (100.0%) | 0 (0.0%) |
| Total | 1,177 (94.6%) | 67 (5.4%) |
Income Below Poverty Among Single-Parent Households in Nebraska City
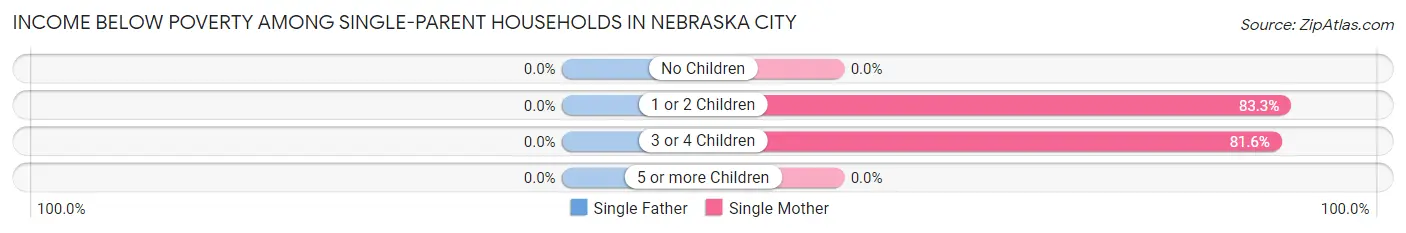
| Children | Single Father | Single Mother |
| No Children | 0 (0.0%) | 0 (0.0%) |
| 1 or 2 Children | 0 (0.0%) | 155 (83.3%) |
| 3 or 4 Children | 0 (0.0%) | 62 (81.6%) |
| 5 or more Children | 0 (0.0%) | 0 (0.0%) |
| Total | 0 (0.0%) | 217 (68.7%) |
Income Below Poverty Among Married-Couple vs Single-Parent Households in Nebraska City
The poverty data for Nebraska City shows that 67 of the married-couple family households (5.4%) and 217 of the single-parent households (51.9%) are living below the poverty level. Within the married-couple family households, those with no children have the highest poverty rate, with 67 households (9.0%) falling below the poverty line. Among the single-parent households, those with 3 or 4 children have the highest poverty rate, with 62 household (81.6%) living below poverty.
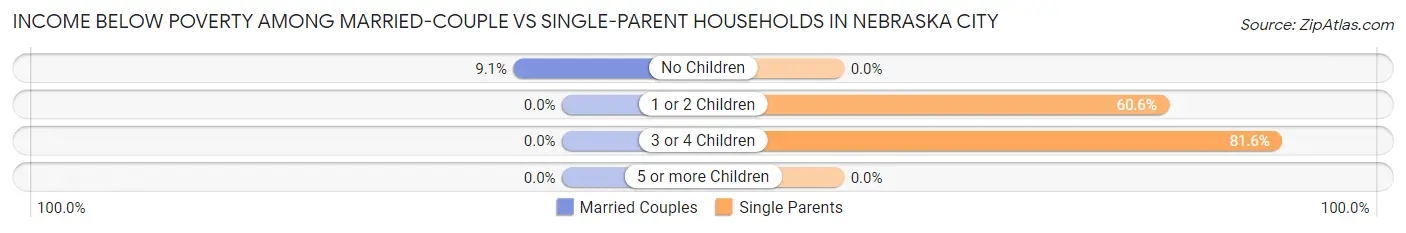
| Children | Married-Couple Families | Single-Parent Households |
| No Children | 67 (9.0%) | 0 (0.0%) |
| 1 or 2 Children | 0 (0.0%) | 155 (60.6%) |
| 3 or 4 Children | 0 (0.0%) | 62 (81.6%) |
| 5 or more Children | 0 (0.0%) | 0 (0.0%) |
| Total | 67 (5.4%) | 217 (51.9%) |
Race in Nebraska City
The most populous races in Nebraska City are White / Caucasian (5,805 | 80.0%), Hispanic or Latino (1,050 | 14.5%), and Some other Race (658 | 9.1%).
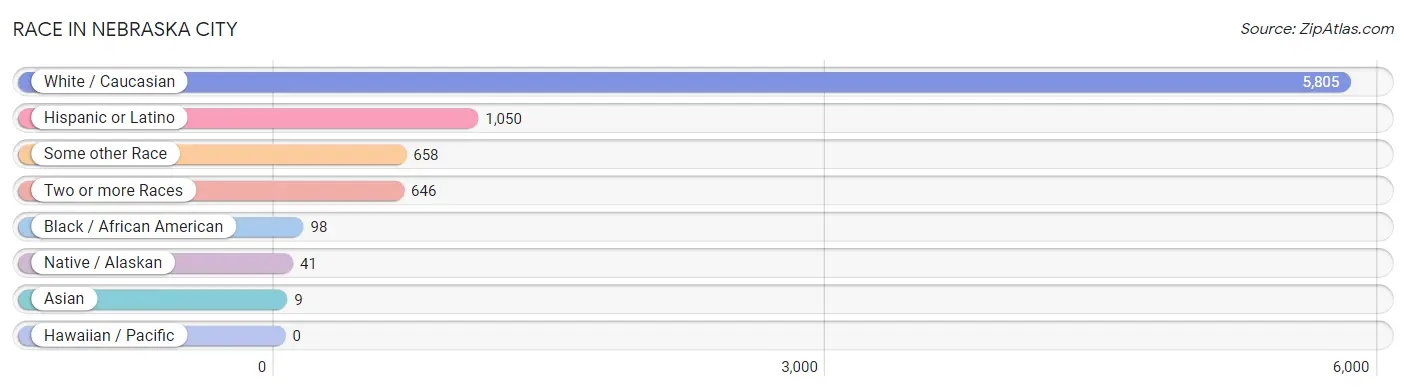
| Race | # Population | % Population |
| Asian | 9 | 0.1% |
| Black / African American | 98 | 1.3% |
| Hawaiian / Pacific | 0 | 0.0% |
| Hispanic or Latino | 1,050 | 14.5% |
| Native / Alaskan | 41 | 0.6% |
| White / Caucasian | 5,805 | 80.0% |
| Two or more Races | 646 | 8.9% |
| Some other Race | 658 | 9.1% |
| Total | 7,257 | 100.0% |
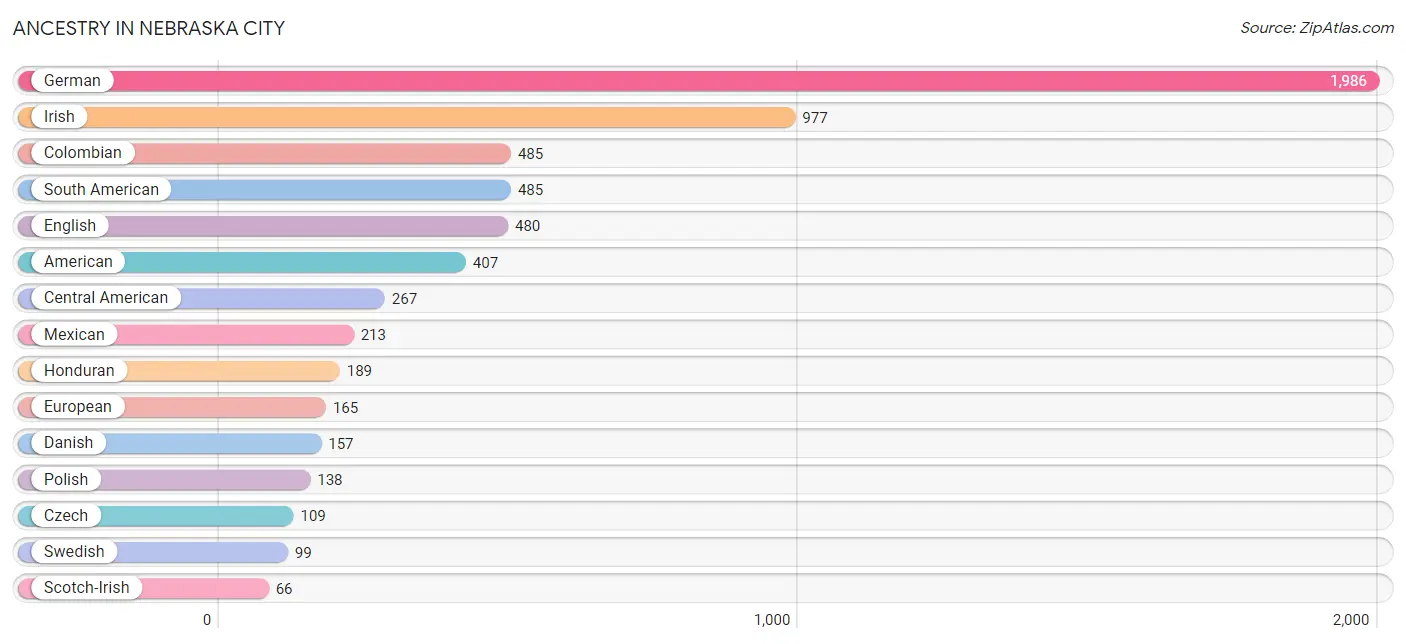
Ancestry in Nebraska City
The most populous ancestries reported in Nebraska City are German (1,986 | 27.4%), Irish (977 | 13.5%), Colombian (485 | 6.7%), South American (485 | 6.7%), and English (480 | 6.6%), together accounting for 60.8% of all Nebraska City residents.
| Ancestry | # Population | % Population |
| Alaskan Athabascan | 19 | 0.3% |
| American | 407 | 5.6% |
| Austrian | 14 | 0.2% |
| British | 58 | 0.8% |
| Central American | 267 | 3.7% |
| Central American Indian | 11 | 0.2% |
| Cherokee | 39 | 0.5% |
| Choctaw | 37 | 0.5% |
| Colombian | 485 | 6.7% |
| Czech | 109 | 1.5% |
| Czechoslovakian | 8 | 0.1% |
| Danish | 157 | 2.2% |
| Dutch | 58 | 0.8% |
| Eastern European | 28 | 0.4% |
| English | 480 | 6.6% |
| European | 165 | 2.3% |
| French | 48 | 0.7% |
| German | 1,986 | 27.4% |
| Guatemalan | 64 | 0.9% |
| Haitian | 12 | 0.2% |
| Honduran | 189 | 2.6% |
| Inupiat | 34 | 0.5% |
| Irish | 977 | 13.5% |
| Italian | 64 | 0.9% |
| Jamaican | 5 | 0.1% |
| Japanese | 10 | 0.1% |
| Korean | 9 | 0.1% |
| Mexican | 213 | 2.9% |
| Mexican American Indian | 10 | 0.1% |
| Norwegian | 59 | 0.8% |
| Polish | 138 | 1.9% |
| Portuguese | 39 | 0.5% |
| Russian | 21 | 0.3% |
| Salvadoran | 14 | 0.2% |
| Scandinavian | 20 | 0.3% |
| Scotch-Irish | 66 | 0.9% |
| Scottish | 61 | 0.8% |
| Sioux | 32 | 0.4% |
| South American | 485 | 6.7% |
| Spanish | 39 | 0.5% |
| Subsaharan African | 48 | 0.7% |
| Sudanese | 42 | 0.6% |
| Swedish | 99 | 1.4% |
| Swiss | 41 | 0.6% |
| Welsh | 62 | 0.9% |
| Zimbabwean | 6 | 0.1% | View All 46 Rows |
Immigrants in Nebraska City
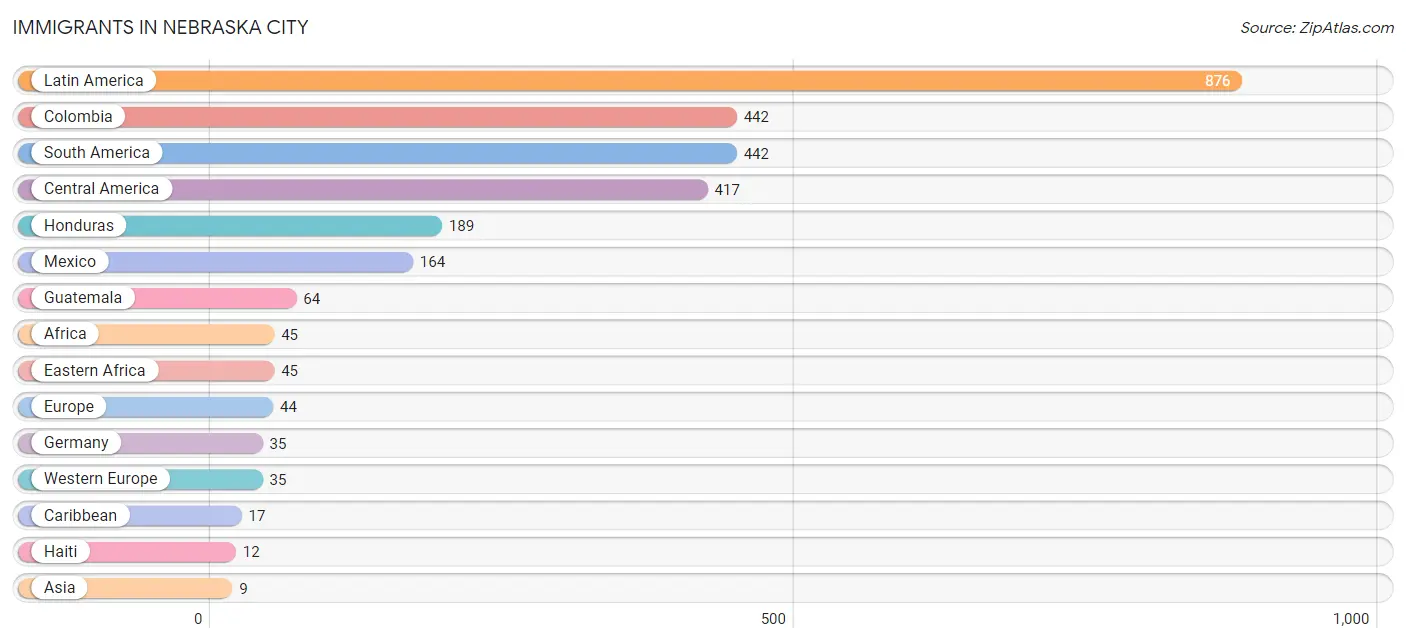
The most numerous immigrant groups reported in Nebraska City came from Latin America (876 | 12.1%), Colombia (442 | 6.1%), South America (442 | 6.1%), Central America (417 | 5.8%), and Honduras (189 | 2.6%), together accounting for 32.6% of all Nebraska City residents.
| Immigration Origin | # Population | % Population |
| Africa | 45 | 0.6% |
| Asia | 9 | 0.1% |
| Caribbean | 17 | 0.2% |
| Central America | 417 | 5.8% |
| Colombia | 442 | 6.1% |
| Eastern Africa | 45 | 0.6% |
| Europe | 44 | 0.6% |
| Germany | 35 | 0.5% |
| Guatemala | 64 | 0.9% |
| Haiti | 12 | 0.2% |
| Honduras | 189 | 2.6% |
| Jamaica | 5 | 0.1% |
| Latin America | 876 | 12.1% |
| Mexico | 164 | 2.3% |
| Philippines | 9 | 0.1% |
| South America | 442 | 6.1% |
| South Eastern Asia | 9 | 0.1% |
| Southern Europe | 9 | 0.1% |
| Spain | 9 | 0.1% |
| Western Europe | 35 | 0.5% |
| Zimbabwe | 6 | 0.1% | View All 21 Rows |
Sex and Age in Nebraska City
Sex and Age in Nebraska City
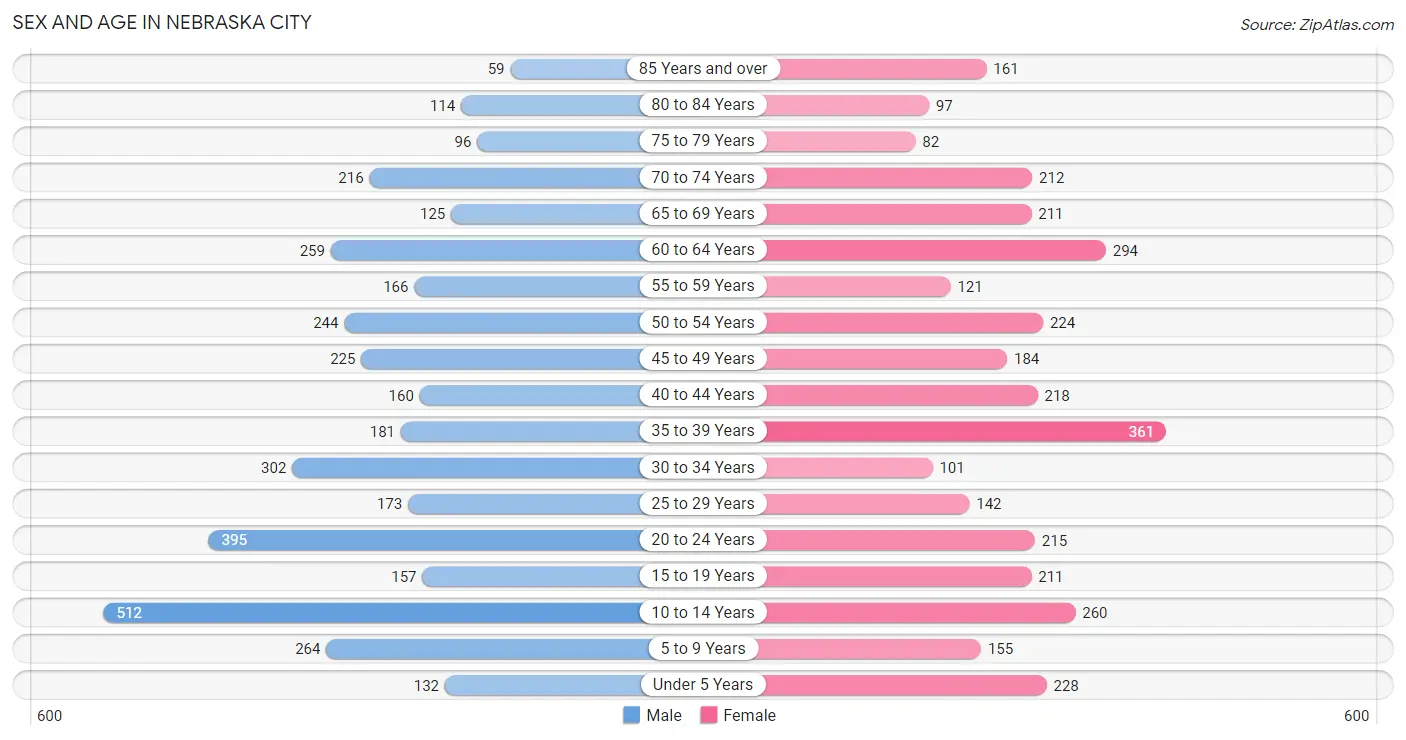
The most populous age groups in Nebraska City are 10 to 14 Years (512 | 13.5%) for men and 35 to 39 Years (361 | 10.4%) for women.
| Age Bracket | Male | Female |
| Under 5 Years | 132 (3.5%) | 228 (6.6%) |
| 5 to 9 Years | 264 (7.0%) | 155 (4.5%) |
| 10 to 14 Years | 512 (13.5%) | 260 (7.5%) |
| 15 to 19 Years | 157 (4.2%) | 211 (6.1%) |
| 20 to 24 Years | 395 (10.4%) | 215 (6.2%) |
| 25 to 29 Years | 173 (4.6%) | 142 (4.1%) |
| 30 to 34 Years | 302 (8.0%) | 101 (2.9%) |
| 35 to 39 Years | 181 (4.8%) | 361 (10.4%) |
| 40 to 44 Years | 160 (4.2%) | 218 (6.3%) |
| 45 to 49 Years | 225 (5.9%) | 184 (5.3%) |
| 50 to 54 Years | 244 (6.5%) | 224 (6.4%) |
| 55 to 59 Years | 166 (4.4%) | 121 (3.5%) |
| 60 to 64 Years | 259 (6.9%) | 294 (8.5%) |
| 65 to 69 Years | 125 (3.3%) | 211 (6.1%) |
| 70 to 74 Years | 216 (5.7%) | 212 (6.1%) |
| 75 to 79 Years | 96 (2.5%) | 82 (2.4%) |
| 80 to 84 Years | 114 (3.0%) | 97 (2.8%) |
| 85 Years and over | 59 (1.6%) | 161 (4.6%) |
| Total | 3,780 (100.0%) | 3,477 (100.0%) |
Families and Households in Nebraska City
Median Family Size in Nebraska City
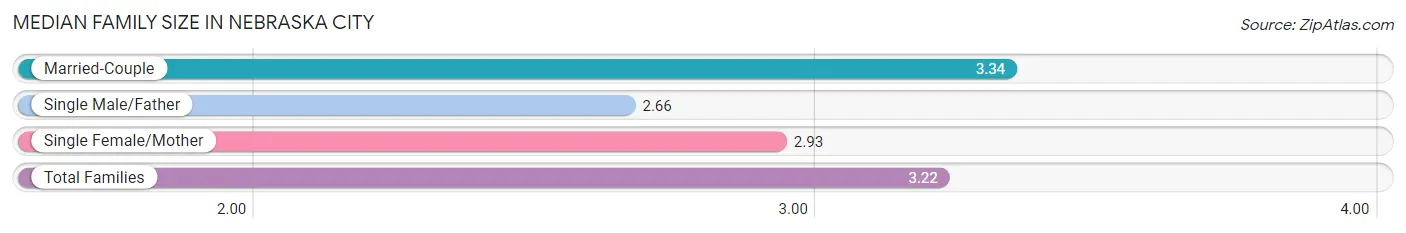
The median family size in Nebraska City is 3.22 persons per family, with married-couple families (1,244 | 74.9%) accounting for the largest median family size of 3.34 persons per family. On the other hand, single male/father families (102 | 6.1%) represent the smallest median family size with 2.66 persons per family.
| Family Type | # Families | Family Size |
| Married-Couple | 1,244 (74.9%) | 3.34 |
| Single Male/Father | 102 (6.1%) | 2.66 |
| Single Female/Mother | 316 (19.0%) | 2.93 |
| Total Families | 1,662 (100.0%) | 3.22 |
Median Household Size in Nebraska City
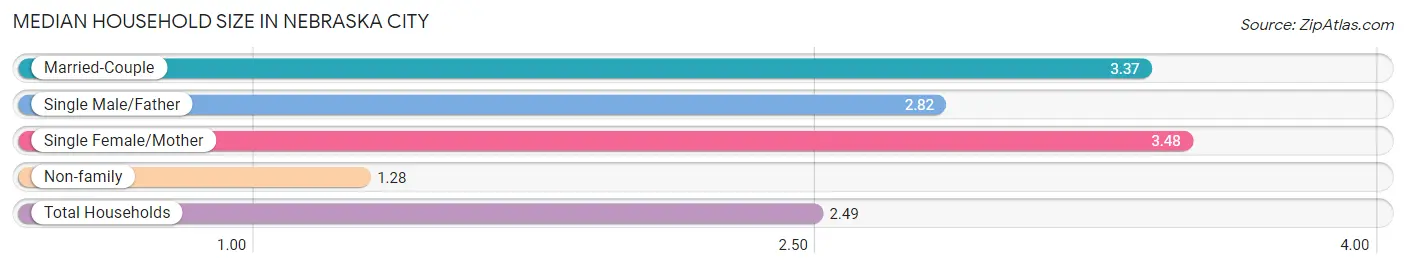
The median household size in Nebraska City is 2.49 persons per household, with single female/mother households (316 | 11.1%) accounting for the largest median household size of 3.48 persons per household. non-family households (1,188 | 41.7%) represent the smallest median household size with 1.28 persons per household.
| Household Type | # Households | Household Size |
| Married-Couple | 1,244 (43.6%) | 3.37 |
| Single Male/Father | 102 (3.6%) | 2.82 |
| Single Female/Mother | 316 (11.1%) | 3.48 |
| Non-family | 1,188 (41.7%) | 1.28 |
| Total Households | 2,850 (100.0%) | 2.49 |
Household Size by Marriage Status in Nebraska City
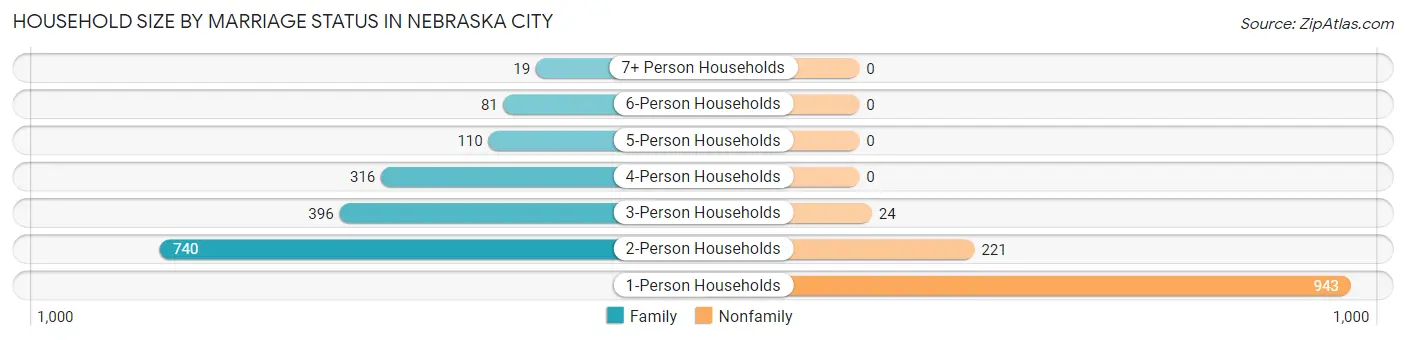
Out of a total of 2,850 households in Nebraska City, 1,662 (58.3%) are family households, while 1,188 (41.7%) are nonfamily households. The most numerous type of family households are 2-person households, comprising 740, and the most common type of nonfamily households are 1-person households, comprising 943.
| Household Size | Family Households | Nonfamily Households |
| 1-Person Households | - | 943 (33.1%) |
| 2-Person Households | 740 (26.0%) | 221 (7.7%) |
| 3-Person Households | 396 (13.9%) | 24 (0.8%) |
| 4-Person Households | 316 (11.1%) | 0 (0.0%) |
| 5-Person Households | 110 (3.9%) | 0 (0.0%) |
| 6-Person Households | 81 (2.8%) | 0 (0.0%) |
| 7+ Person Households | 19 (0.7%) | 0 (0.0%) |
| Total | 1,662 (58.3%) | 1,188 (41.7%) |
Female Fertility in Nebraska City
Fertility by Age in Nebraska City
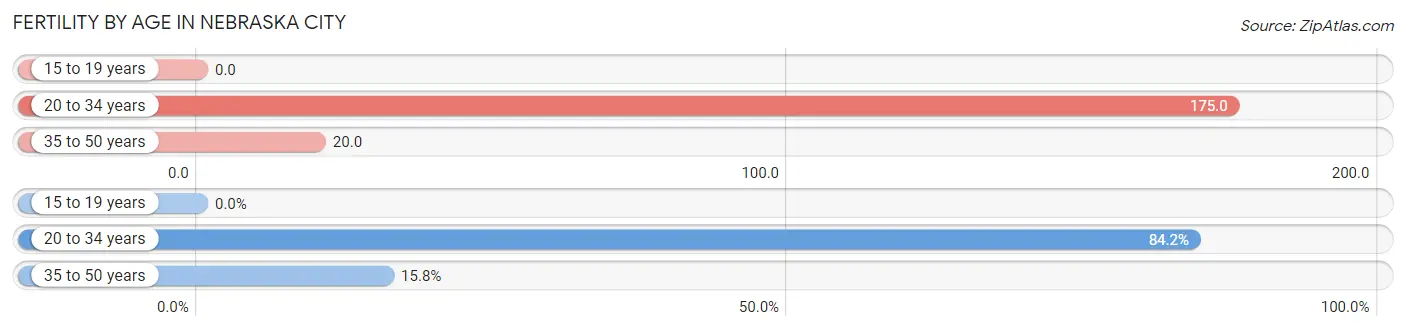
Average fertility rate in Nebraska City is 66.0 births per 1,000 women. Women in the age bracket of 20 to 34 years have the highest fertility rate with 175.0 births per 1,000 women. Women in the age bracket of 20 to 34 years acount for 84.2% of all women with births.
| Age Bracket | Women with Births | Births / 1,000 Women |
| 15 to 19 years | 0 (0.0%) | 0.0 |
| 20 to 34 years | 80 (84.2%) | 175.0 |
| 35 to 50 years | 15 (15.8%) | 20.0 |
| Total | 95 (100.0%) | 66.0 |
Fertility by Age by Marriage Status in Nebraska City
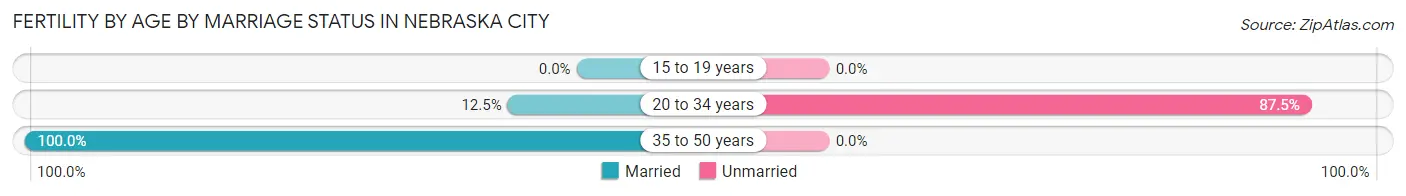
26.3% of women with births (95) in Nebraska City are married. The highest percentage of unmarried women with births falls into 20 to 34 years age bracket with 87.5% of them unmarried at the time of birth, while the lowest percentage of unmarried women with births belong to 35 to 50 years age bracket with 0.0% of them unmarried.
| Age Bracket | Married | Unmarried |
| 15 to 19 years | 0 (0.0%) | 0 (0.0%) |
| 20 to 34 years | 10 (12.5%) | 70 (87.5%) |
| 35 to 50 years | 15 (100.0%) | 0 (0.0%) |
| Total | 25 (26.3%) | 70 (73.7%) |
Fertility by Education in Nebraska City
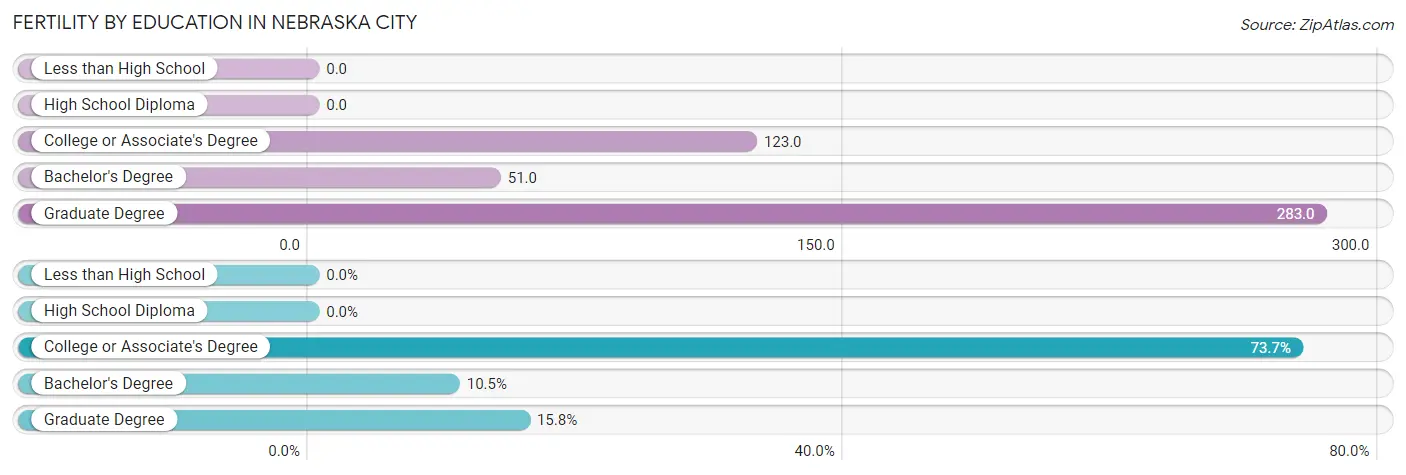
| Educational Attainment | Women with Births | Births / 1,000 Women |
| Less than High School | 0 (0.0%) | 0.0 |
| High School Diploma | 0 (0.0%) | 0.0 |
| College or Associate's Degree | 70 (73.7%) | 123.0 |
| Bachelor's Degree | 10 (10.5%) | 51.0 |
| Graduate Degree | 15 (15.8%) | 283.0 |
| Total | 95 (100.0%) | 66.0 |
Fertility by Education by Marriage Status in Nebraska City
73.7% of women with births in Nebraska City are unmarried. Women with the educational attainment of bachelor's degree are most likely to be married with 100.0% of them married at childbirth, while women with the educational attainment of college or associate's degree are least likely to be married with 100.0% of them unmarried at childbirth.
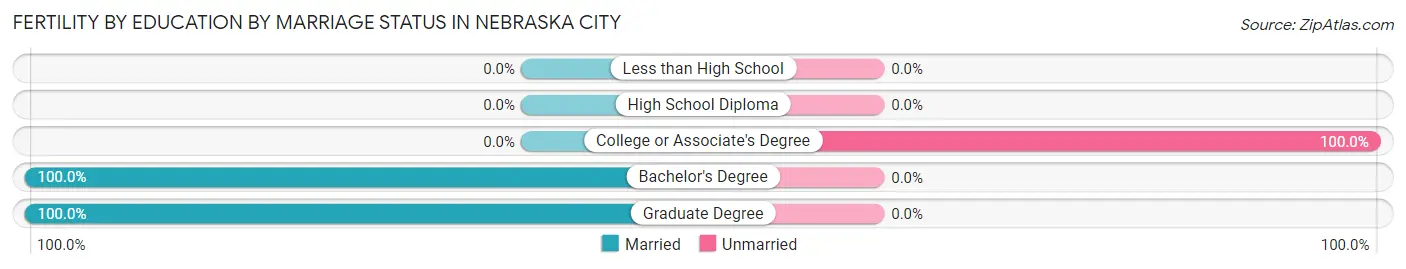
| Educational Attainment | Married | Unmarried |
| Less than High School | 0 (0.0%) | 0 (0.0%) |
| High School Diploma | 0 (0.0%) | 0 (0.0%) |
| College or Associate's Degree | 0 (0.0%) | 70 (100.0%) |
| Bachelor's Degree | 10 (100.0%) | 0 (0.0%) |
| Graduate Degree | 15 (100.0%) | 0 (0.0%) |
| Total | 25 (26.3%) | 70 (73.7%) |
Employment Characteristics in Nebraska City
Employment by Class of Employer in Nebraska City
Among the 3,594 employed individuals in Nebraska City, private company employees (2,085 | 58.0%), local government employees (564 | 15.7%), and not-for-profit organizations (428 | 11.9%) make up the most common classes of employment.
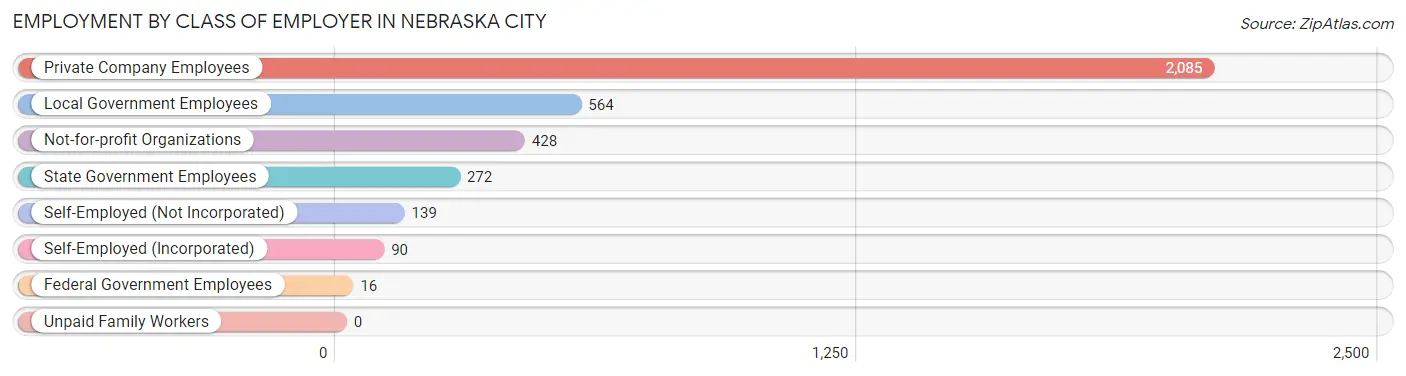
| Employer Class | # Employees | % Employees |
| Private Company Employees | 2,085 | 58.0% |
| Self-Employed (Incorporated) | 90 | 2.5% |
| Self-Employed (Not Incorporated) | 139 | 3.9% |
| Not-for-profit Organizations | 428 | 11.9% |
| Local Government Employees | 564 | 15.7% |
| State Government Employees | 272 | 7.6% |
| Federal Government Employees | 16 | 0.4% |
| Unpaid Family Workers | 0 | 0.0% |
| Total | 3,594 | 100.0% |
Employment Status by Age in Nebraska City
According to the labor force statistics for Nebraska City, out of the total population over 16 years of age (5,655), 67.7% or 3,828 individuals are in the labor force, with 2.8% or 107 of them unemployed. The age group with the highest labor force participation rate is 25 to 29 years, with 98.1% or 309 individuals in the labor force. Within the labor force, the 20 to 24 years age range has the highest percentage of unemployed individuals, with 17.0% or 98 of them being unemployed.
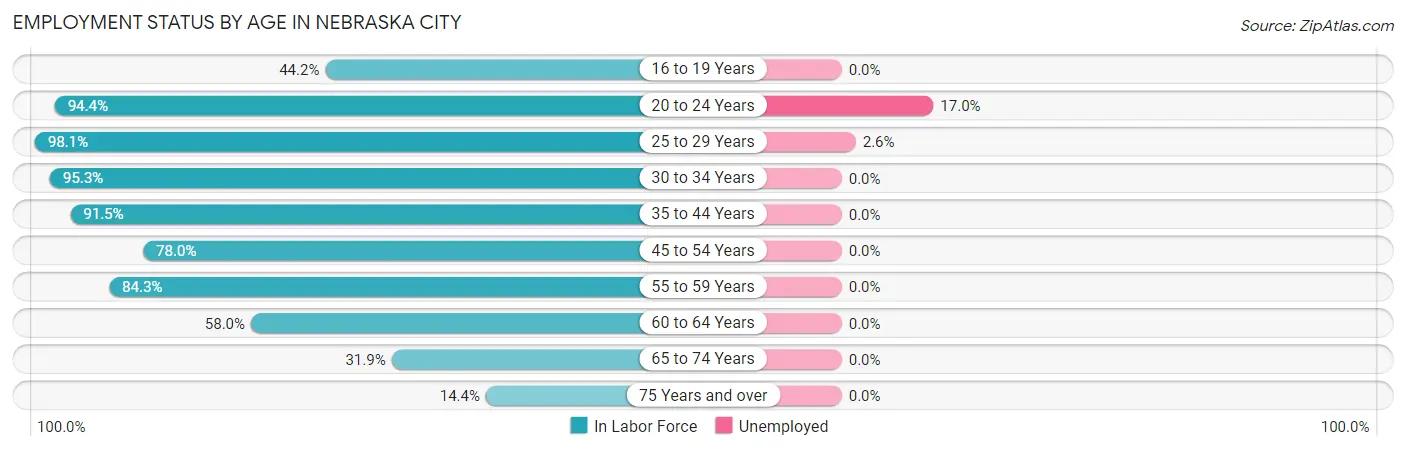
| Age Bracket | In Labor Force | Unemployed |
| 16 to 19 Years | 140 (44.2%) | 0 (0.0%) |
| 20 to 24 Years | 576 (94.4%) | 98 (17.0%) |
| 25 to 29 Years | 309 (98.1%) | 8 (2.6%) |
| 30 to 34 Years | 384 (95.3%) | 0 (0.0%) |
| 35 to 44 Years | 842 (91.5%) | 0 (0.0%) |
| 45 to 54 Years | 684 (78.0%) | 0 (0.0%) |
| 55 to 59 Years | 242 (84.3%) | 0 (0.0%) |
| 60 to 64 Years | 321 (58.0%) | 0 (0.0%) |
| 65 to 74 Years | 244 (31.9%) | 0 (0.0%) |
| 75 Years and over | 88 (14.4%) | 0 (0.0%) |
| Total | 3,828 (67.7%) | 107 (2.8%) |
Employment Status by Educational Attainment in Nebraska City
According to labor force statistics for Nebraska City, 82.9% of individuals (2,781) out of the total population between 25 and 64 years of age (3,355) are in the labor force, with 0.3% or 8 of them being unemployed. The group with the highest labor force participation rate are those with the educational attainment of bachelor's degree or higher, with 86.6% or 679 individuals in the labor force. Within the labor force, individuals with high school diploma education have the highest percentage of unemployment, with 1.0% or 8 of them being unemployed.
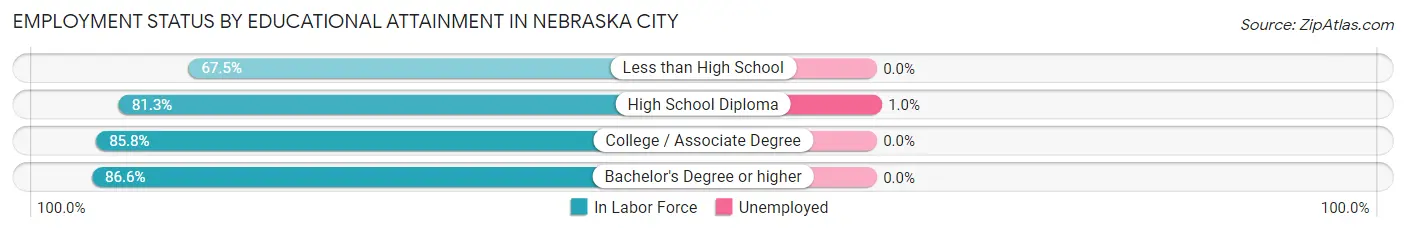
| Educational Attainment | In Labor Force | Unemployed |
| Less than High School | 214 (67.5%) | 0 (0.0%) |
| High School Diploma | 806 (81.3%) | 10 (1.0%) |
| College / Associate Degree | 1,083 (85.8%) | 0 (0.0%) |
| Bachelor's Degree or higher | 679 (86.6%) | 0 (0.0%) |
| Total | 2,781 (82.9%) | 10 (0.3%) |
Employment Occupations by Sex in Nebraska City
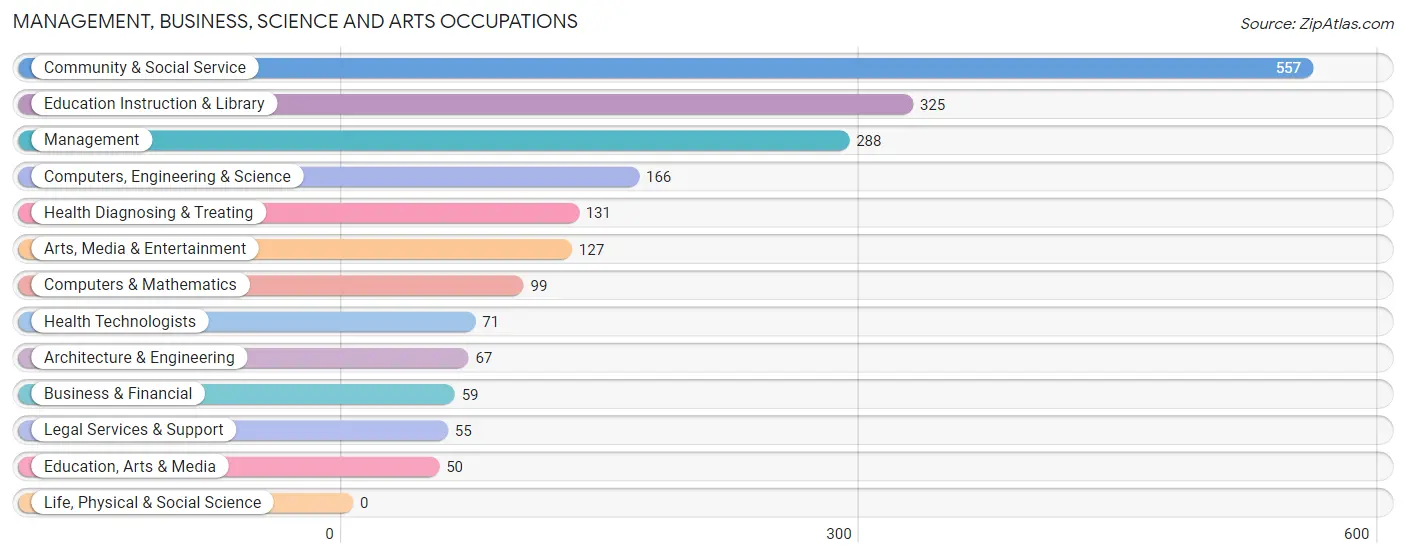
Management, Business, Science and Arts Occupations
The most common Management, Business, Science and Arts occupations in Nebraska City are Community & Social Service (557 | 15.0%), Education Instruction & Library (325 | 8.7%), Management (288 | 7.7%), Computers, Engineering & Science (166 | 4.5%), and Health Diagnosing & Treating (131 | 3.5%).
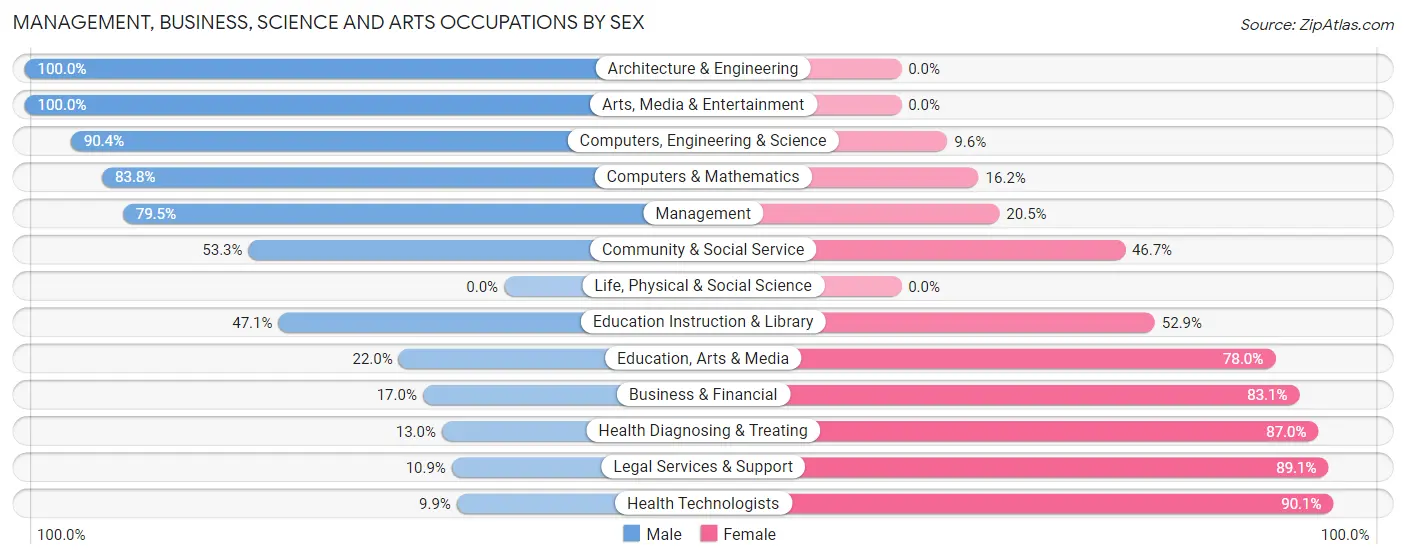
Management, Business, Science and Arts Occupations by Sex
Within the Management, Business, Science and Arts occupations in Nebraska City, the most male-oriented occupations are Architecture & Engineering (100.0%), Arts, Media & Entertainment (100.0%), and Computers, Engineering & Science (90.4%), while the most female-oriented occupations are Health Technologists (90.1%), Legal Services & Support (89.1%), and Health Diagnosing & Treating (87.0%).
| Occupation | Male | Female |
| Management | 229 (79.5%) | 59 (20.5%) |
| Business & Financial | 10 (17.0%) | 49 (83.1%) |
| Computers, Engineering & Science | 150 (90.4%) | 16 (9.6%) |
| Computers & Mathematics | 83 (83.8%) | 16 (16.2%) |
| Architecture & Engineering | 67 (100.0%) | 0 (0.0%) |
| Life, Physical & Social Science | 0 (0.0%) | 0 (0.0%) |
| Community & Social Service | 297 (53.3%) | 260 (46.7%) |
| Education, Arts & Media | 11 (22.0%) | 39 (78.0%) |
| Legal Services & Support | 6 (10.9%) | 49 (89.1%) |
| Education Instruction & Library | 153 (47.1%) | 172 (52.9%) |
| Arts, Media & Entertainment | 127 (100.0%) | 0 (0.0%) |
| Health Diagnosing & Treating | 17 (13.0%) | 114 (87.0%) |
| Health Technologists | 7 (9.9%) | 64 (90.1%) |
| Total (Category) | 703 (58.5%) | 498 (41.5%) |
| Total (Overall) | 2,063 (55.4%) | 1,661 (44.6%) |
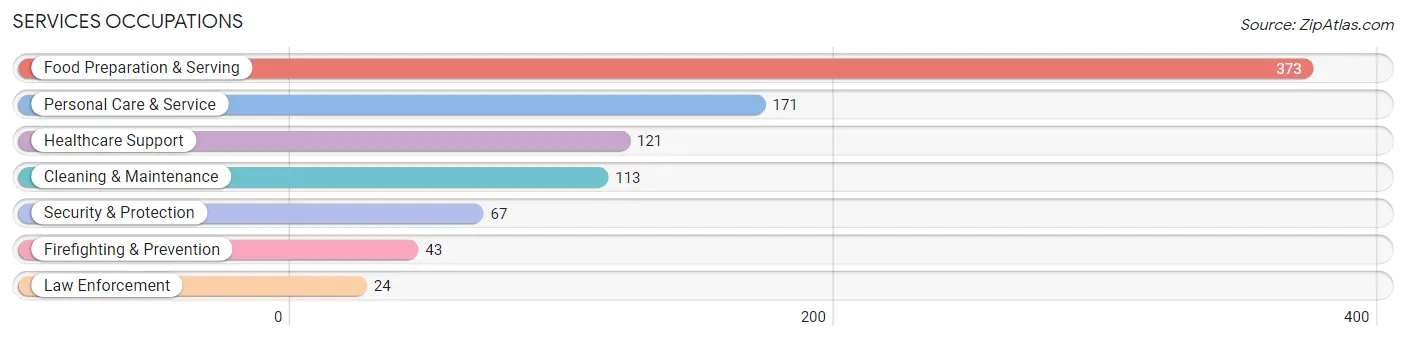
Services Occupations
The most common Services occupations in Nebraska City are Food Preparation & Serving (373 | 10.0%), Personal Care & Service (171 | 4.6%), Healthcare Support (121 | 3.3%), Cleaning & Maintenance (113 | 3.0%), and Security & Protection (67 | 1.8%).
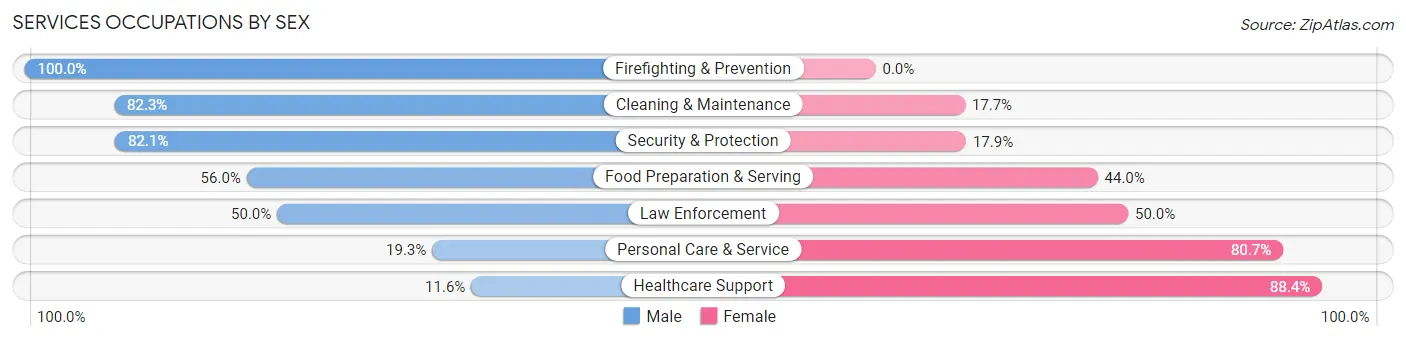
Services Occupations by Sex
Within the Services occupations in Nebraska City, the most male-oriented occupations are Firefighting & Prevention (100.0%), Cleaning & Maintenance (82.3%), and Security & Protection (82.1%), while the most female-oriented occupations are Healthcare Support (88.4%), Personal Care & Service (80.7%), and Law Enforcement (50.0%).
| Occupation | Male | Female |
| Healthcare Support | 14 (11.6%) | 107 (88.4%) |
| Security & Protection | 55 (82.1%) | 12 (17.9%) |
| Firefighting & Prevention | 43 (100.0%) | 0 (0.0%) |
| Law Enforcement | 12 (50.0%) | 12 (50.0%) |
| Food Preparation & Serving | 209 (56.0%) | 164 (44.0%) |
| Cleaning & Maintenance | 93 (82.3%) | 20 (17.7%) |
| Personal Care & Service | 33 (19.3%) | 138 (80.7%) |
| Total (Category) | 404 (47.8%) | 441 (52.2%) |
| Total (Overall) | 2,063 (55.4%) | 1,661 (44.6%) |
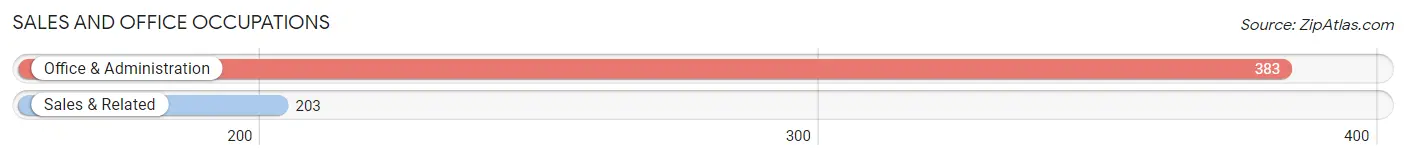
Sales and Office Occupations
The most common Sales and Office occupations in Nebraska City are Office & Administration (383 | 10.3%), and Sales & Related (203 | 5.4%).
Sales and Office Occupations by Sex
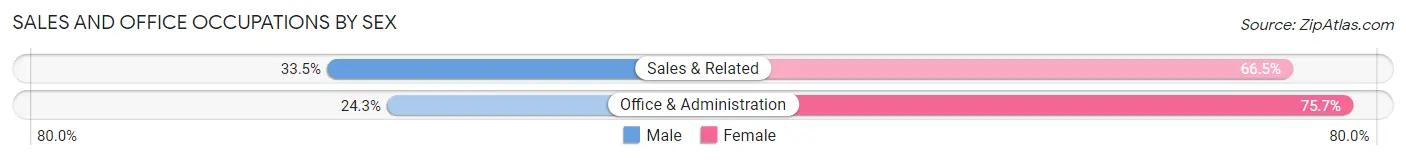
| Occupation | Male | Female |
| Sales & Related | 68 (33.5%) | 135 (66.5%) |
| Office & Administration | 93 (24.3%) | 290 (75.7%) |
| Total (Category) | 161 (27.5%) | 425 (72.5%) |
| Total (Overall) | 2,063 (55.4%) | 1,661 (44.6%) |
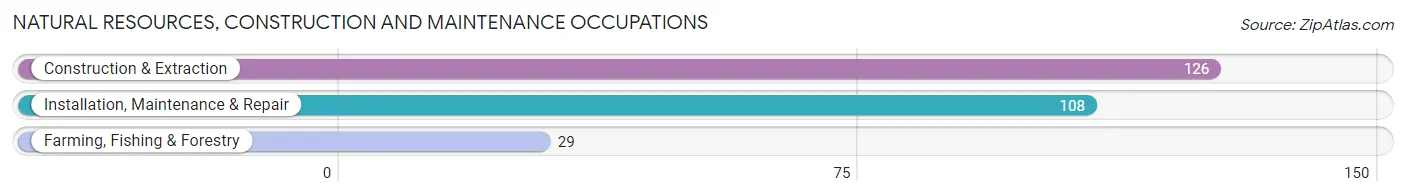
Natural Resources, Construction and Maintenance Occupations
The most common Natural Resources, Construction and Maintenance occupations in Nebraska City are Construction & Extraction (126 | 3.4%), Installation, Maintenance & Repair (108 | 2.9%), and Farming, Fishing & Forestry (29 | 0.8%).
Natural Resources, Construction and Maintenance Occupations by Sex
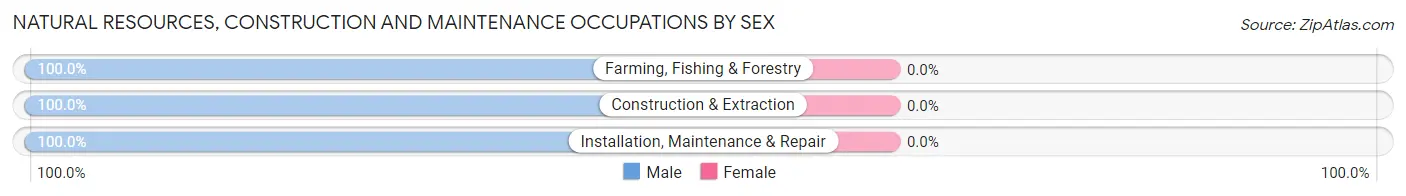
| Occupation | Male | Female |
| Farming, Fishing & Forestry | 29 (100.0%) | 0 (0.0%) |
| Construction & Extraction | 126 (100.0%) | 0 (0.0%) |
| Installation, Maintenance & Repair | 108 (100.0%) | 0 (0.0%) |
| Total (Category) | 263 (100.0%) | 0 (0.0%) |
| Total (Overall) | 2,063 (55.4%) | 1,661 (44.6%) |
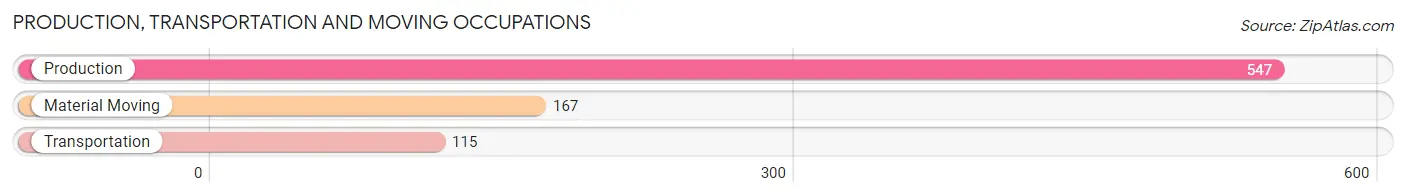
Production, Transportation and Moving Occupations
The most common Production, Transportation and Moving occupations in Nebraska City are Production (547 | 14.7%), Material Moving (167 | 4.5%), and Transportation (115 | 3.1%).
Production, Transportation and Moving Occupations by Sex
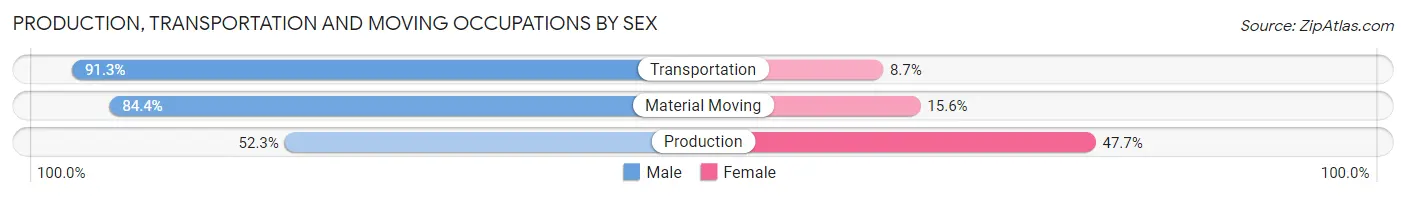
| Occupation | Male | Female |
| Production | 286 (52.3%) | 261 (47.7%) |
| Transportation | 105 (91.3%) | 10 (8.7%) |
| Material Moving | 141 (84.4%) | 26 (15.6%) |
| Total (Category) | 532 (64.2%) | 297 (35.8%) |
| Total (Overall) | 2,063 (55.4%) | 1,661 (44.6%) |
Employment Industries by Sex in Nebraska City
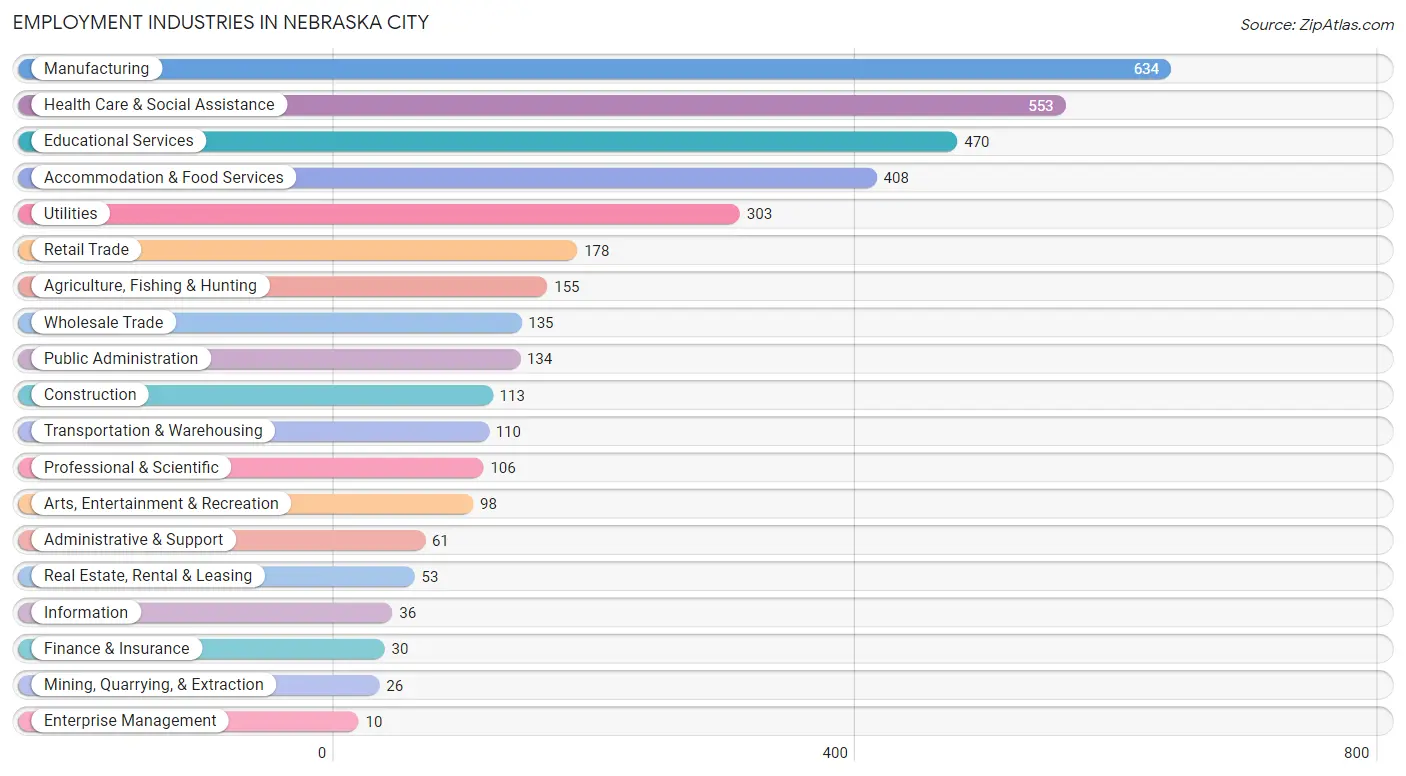
Employment Industries in Nebraska City
The major employment industries in Nebraska City include Manufacturing (634 | 17.0%), Health Care & Social Assistance (553 | 14.8%), Educational Services (470 | 12.6%), Accommodation & Food Services (408 | 11.0%), and Utilities (303 | 8.1%).
Employment Industries by Sex in Nebraska City
The Nebraska City industries that see more men than women are Mining, Quarrying, & Extraction (100.0%), Information (100.0%), and Utilities (96.7%), whereas the industries that tend to have a higher number of women are Enterprise Management (100.0%), Wholesale Trade (80.0%), and Health Care & Social Assistance (74.3%).
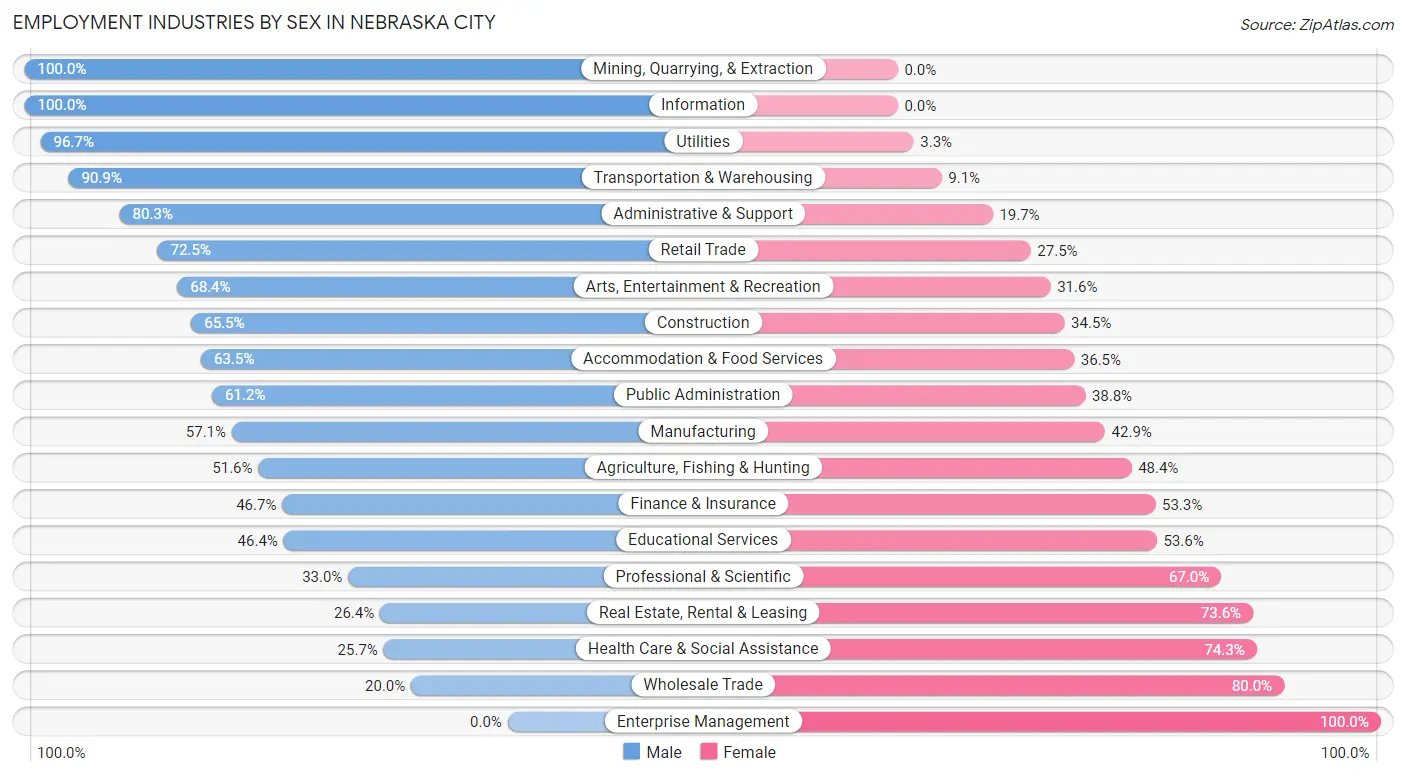
| Industry | Male | Female |
| Agriculture, Fishing & Hunting | 80 (51.6%) | 75 (48.4%) |
| Mining, Quarrying, & Extraction | 26 (100.0%) | 0 (0.0%) |
| Construction | 74 (65.5%) | 39 (34.5%) |
| Manufacturing | 362 (57.1%) | 272 (42.9%) |
| Wholesale Trade | 27 (20.0%) | 108 (80.0%) |
| Retail Trade | 129 (72.5%) | 49 (27.5%) |
| Transportation & Warehousing | 100 (90.9%) | 10 (9.1%) |
| Utilities | 293 (96.7%) | 10 (3.3%) |
| Information | 36 (100.0%) | 0 (0.0%) |
| Finance & Insurance | 14 (46.7%) | 16 (53.3%) |
| Real Estate, Rental & Leasing | 14 (26.4%) | 39 (73.6%) |
| Professional & Scientific | 35 (33.0%) | 71 (67.0%) |
| Enterprise Management | 0 (0.0%) | 10 (100.0%) |
| Administrative & Support | 49 (80.3%) | 12 (19.7%) |
| Educational Services | 218 (46.4%) | 252 (53.6%) |
| Health Care & Social Assistance | 142 (25.7%) | 411 (74.3%) |
| Arts, Entertainment & Recreation | 67 (68.4%) | 31 (31.6%) |
| Accommodation & Food Services | 259 (63.5%) | 149 (36.5%) |
| Public Administration | 82 (61.2%) | 52 (38.8%) |
| Total | 2,063 (55.4%) | 1,661 (44.6%) |
Education in Nebraska City
School Enrollment in Nebraska City
The most common levels of schooling among the 1,934 students in Nebraska City are middle school (666 | 34.4%), elementary school (358 | 18.5%), and high school (353 | 18.2%).
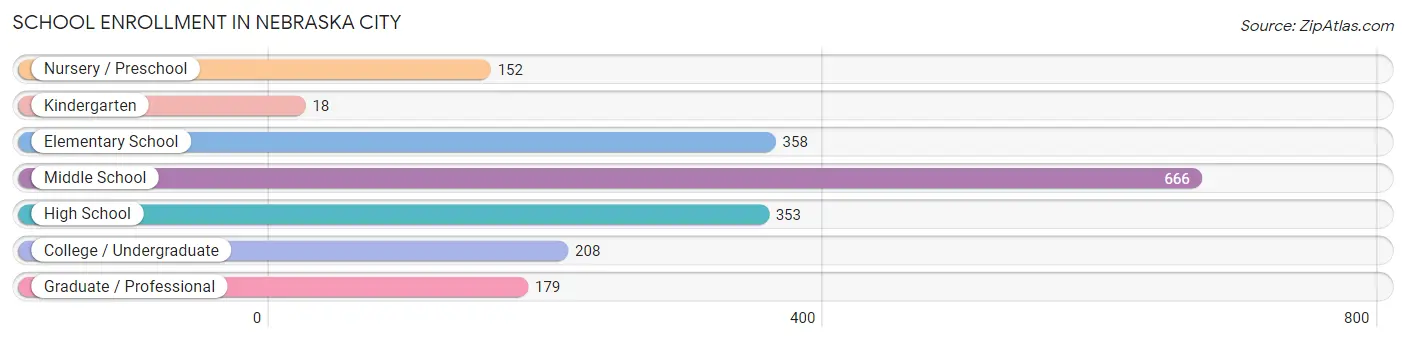
| School Level | # Students | % Students |
| Nursery / Preschool | 152 | 7.9% |
| Kindergarten | 18 | 0.9% |
| Elementary School | 358 | 18.5% |
| Middle School | 666 | 34.4% |
| High School | 353 | 18.2% |
| College / Undergraduate | 208 | 10.7% |
| Graduate / Professional | 179 | 9.3% |
| Total | 1,934 | 100.0% |
School Enrollment by Age by Funding Source in Nebraska City
Out of a total of 1,934 students who are enrolled in schools in Nebraska City, 193 (10.0%) attend a private institution, while the remaining 1,741 (90.0%) are enrolled in public schools. The age group of 18 to 19 year olds has the highest likelihood of being enrolled in private schools, with 47 (55.3% in the age bracket) enrolled. Conversely, the age group of 3 to 4 year olds has the lowest likelihood of being enrolled in a private school, with 132 (100.0% in the age bracket) attending a public institution.
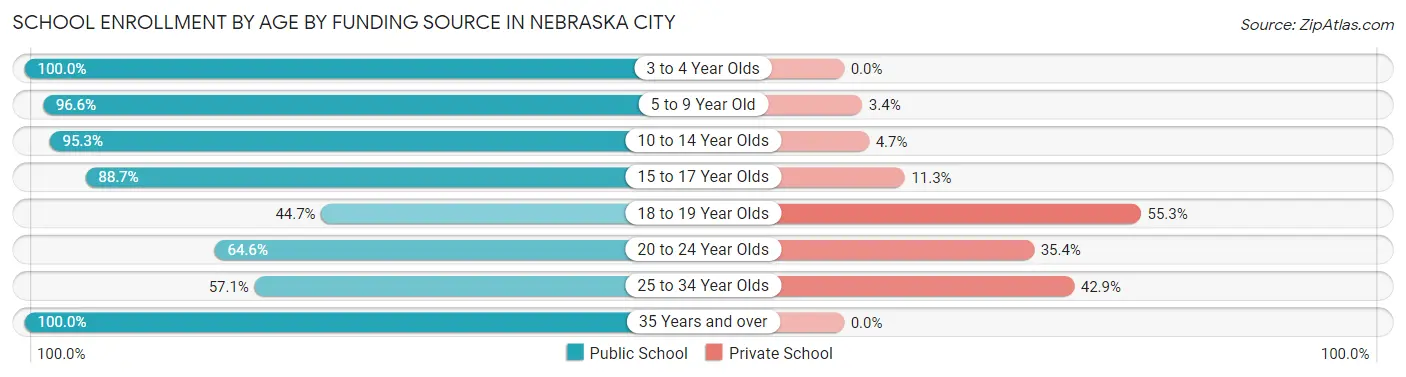
| Age Bracket | Public School | Private School |
| 3 to 4 Year Olds | 132 (100.0%) | 0 (0.0%) |
| 5 to 9 Year Old | 341 (96.6%) | 12 (3.4%) |
| 10 to 14 Year Olds | 736 (95.3%) | 36 (4.7%) |
| 15 to 17 Year Olds | 235 (88.7%) | 30 (11.3%) |
| 18 to 19 Year Olds | 38 (44.7%) | 47 (55.3%) |
| 20 to 24 Year Olds | 115 (64.6%) | 63 (35.4%) |
| 25 to 34 Year Olds | 8 (57.1%) | 6 (42.9%) |
| 35 Years and over | 135 (100.0%) | 0 (0.0%) |
| Total | 1,741 (90.0%) | 193 (10.0%) |
Educational Attainment by Field of Study in Nebraska City
Business (305 | 26.0%), education (282 | 24.0%), computers & mathematics (108 | 9.2%), arts & humanities (84 | 7.2%), and science & technology (79 | 6.7%) are the most common fields of study among 1,173 individuals in Nebraska City who have obtained a bachelor's degree or higher.
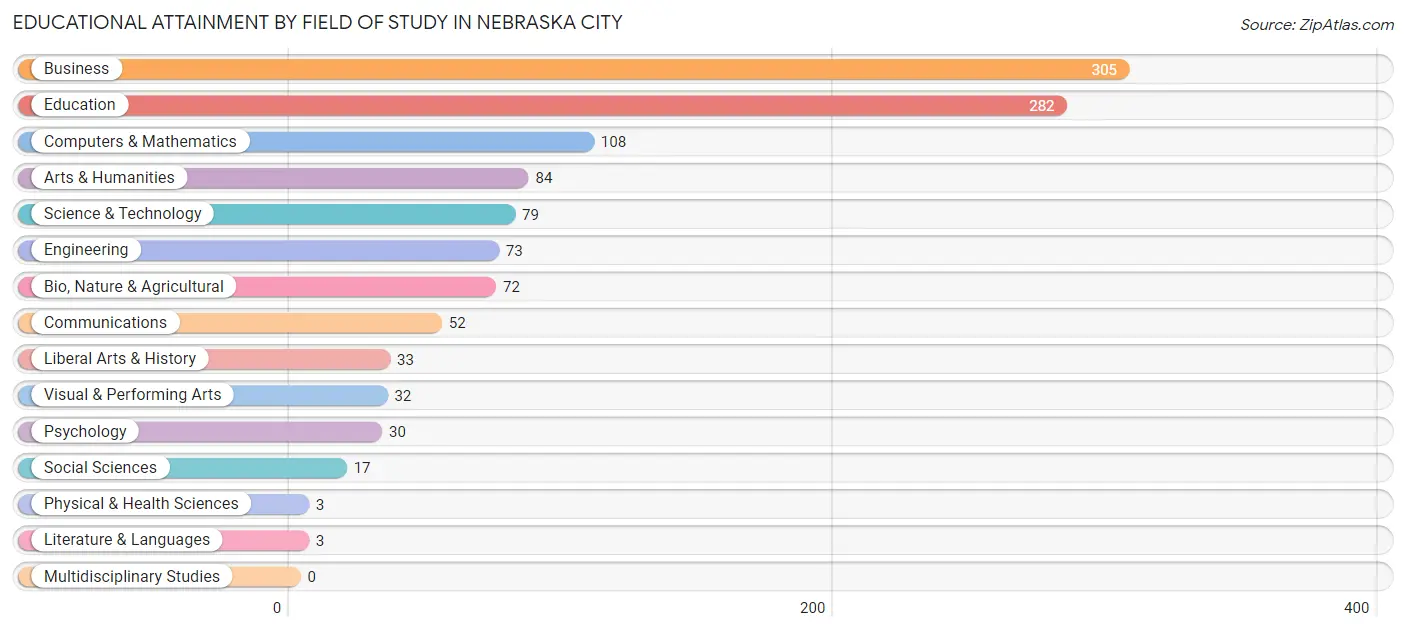
| Field of Study | # Graduates | % Graduates |
| Computers & Mathematics | 108 | 9.2% |
| Bio, Nature & Agricultural | 72 | 6.1% |
| Physical & Health Sciences | 3 | 0.3% |
| Psychology | 30 | 2.6% |
| Social Sciences | 17 | 1.5% |
| Engineering | 73 | 6.2% |
| Multidisciplinary Studies | 0 | 0.0% |
| Science & Technology | 79 | 6.7% |
| Business | 305 | 26.0% |
| Education | 282 | 24.0% |
| Literature & Languages | 3 | 0.3% |
| Liberal Arts & History | 33 | 2.8% |
| Visual & Performing Arts | 32 | 2.7% |
| Communications | 52 | 4.4% |
| Arts & Humanities | 84 | 7.2% |
| Total | 1,173 | 100.0% |
Transportation & Commute in Nebraska City
Vehicle Availability by Sex in Nebraska City
The most prevalent vehicle ownership categories in Nebraska City are males with 2 vehicles (784, accounting for 39.2%) and females with 2 vehicles (596, making up 49.1%).
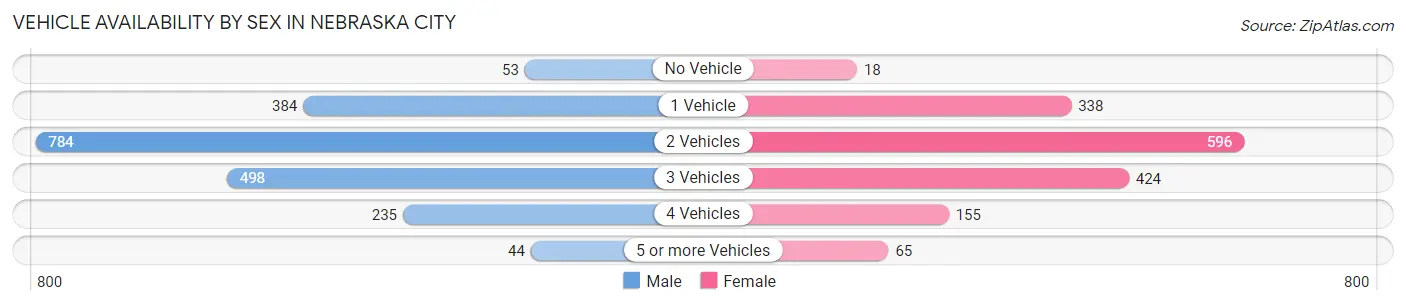
| Vehicles Available | Male | Female |
| No Vehicle | 53 (2.6%) | 18 (1.1%) |
| 1 Vehicle | 384 (19.2%) | 338 (21.2%) |
| 2 Vehicles | 784 (39.2%) | 596 (37.3%) |
| 3 Vehicles | 498 (24.9%) | 424 (26.6%) |
| 4 Vehicles | 235 (11.8%) | 155 (9.7%) |
| 5 or more Vehicles | 44 (2.2%) | 65 (4.1%) |
| Total | 1,998 (100.0%) | 1,596 (100.0%) |
Commute Time in Nebraska City
The most frequently occuring commute durations in Nebraska City are 5 to 9 minutes (1,120 commuters, 32.6%), 10 to 14 minutes (583 commuters, 17.0%), and 45 to 59 minutes (498 commuters, 14.5%).
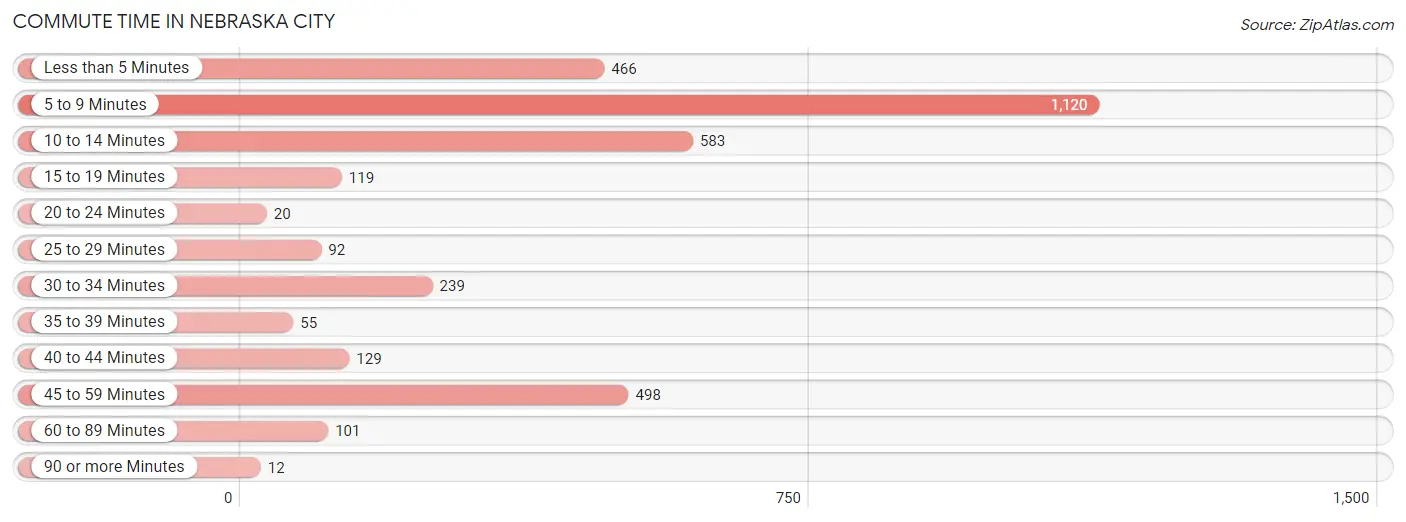
| Commute Time | # Commuters | % Commuters |
| Less than 5 Minutes | 466 | 13.6% |
| 5 to 9 Minutes | 1,120 | 32.6% |
| 10 to 14 Minutes | 583 | 17.0% |
| 15 to 19 Minutes | 119 | 3.5% |
| 20 to 24 Minutes | 20 | 0.6% |
| 25 to 29 Minutes | 92 | 2.7% |
| 30 to 34 Minutes | 239 | 7.0% |
| 35 to 39 Minutes | 55 | 1.6% |
| 40 to 44 Minutes | 129 | 3.8% |
| 45 to 59 Minutes | 498 | 14.5% |
| 60 to 89 Minutes | 101 | 2.9% |
| 90 or more Minutes | 12 | 0.4% |
Commute Time by Sex in Nebraska City
The most common commute times in Nebraska City are 5 to 9 minutes (681 commuters, 34.6%) for males and 5 to 9 minutes (439 commuters, 29.9%) for females.
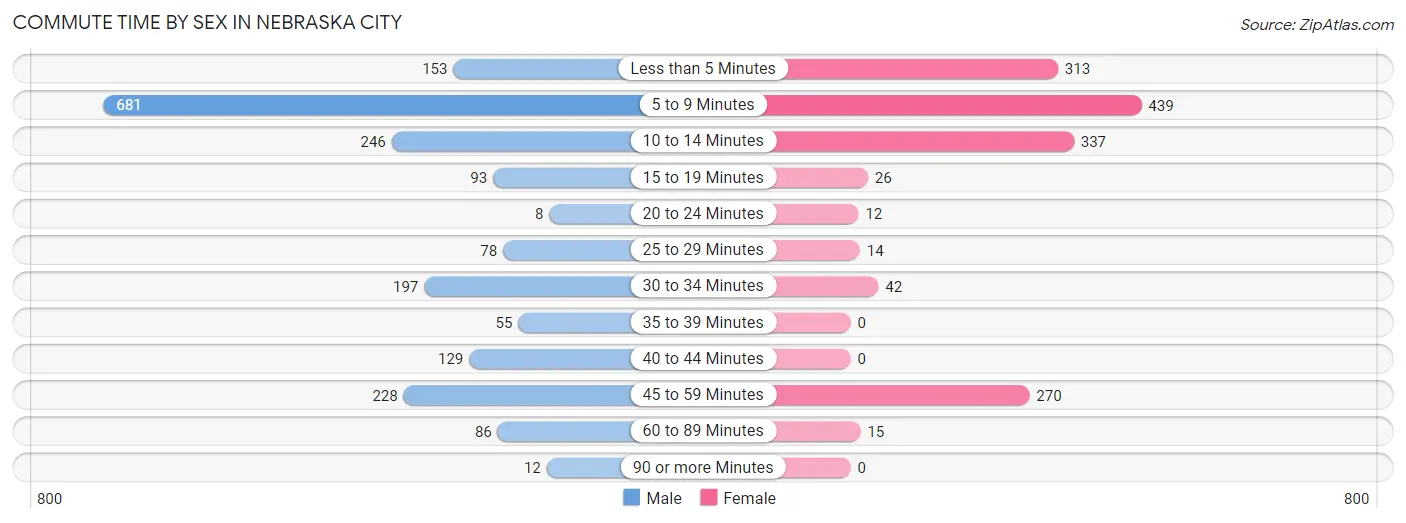
| Commute Time | Male | Female |
| Less than 5 Minutes | 153 (7.8%) | 313 (21.3%) |
| 5 to 9 Minutes | 681 (34.6%) | 439 (29.9%) |
| 10 to 14 Minutes | 246 (12.5%) | 337 (23.0%) |
| 15 to 19 Minutes | 93 (4.7%) | 26 (1.8%) |
| 20 to 24 Minutes | 8 (0.4%) | 12 (0.8%) |
| 25 to 29 Minutes | 78 (4.0%) | 14 (0.9%) |
| 30 to 34 Minutes | 197 (10.0%) | 42 (2.9%) |
| 35 to 39 Minutes | 55 (2.8%) | 0 (0.0%) |
| 40 to 44 Minutes | 129 (6.6%) | 0 (0.0%) |
| 45 to 59 Minutes | 228 (11.6%) | 270 (18.4%) |
| 60 to 89 Minutes | 86 (4.4%) | 15 (1.0%) |
| 90 or more Minutes | 12 (0.6%) | 0 (0.0%) |
Time of Departure to Work by Sex in Nebraska City
The most frequent times of departure to work in Nebraska City are 7:30 AM to 7:59 AM (257, 13.1%) for males and 7:30 AM to 7:59 AM (415, 28.3%) for females.
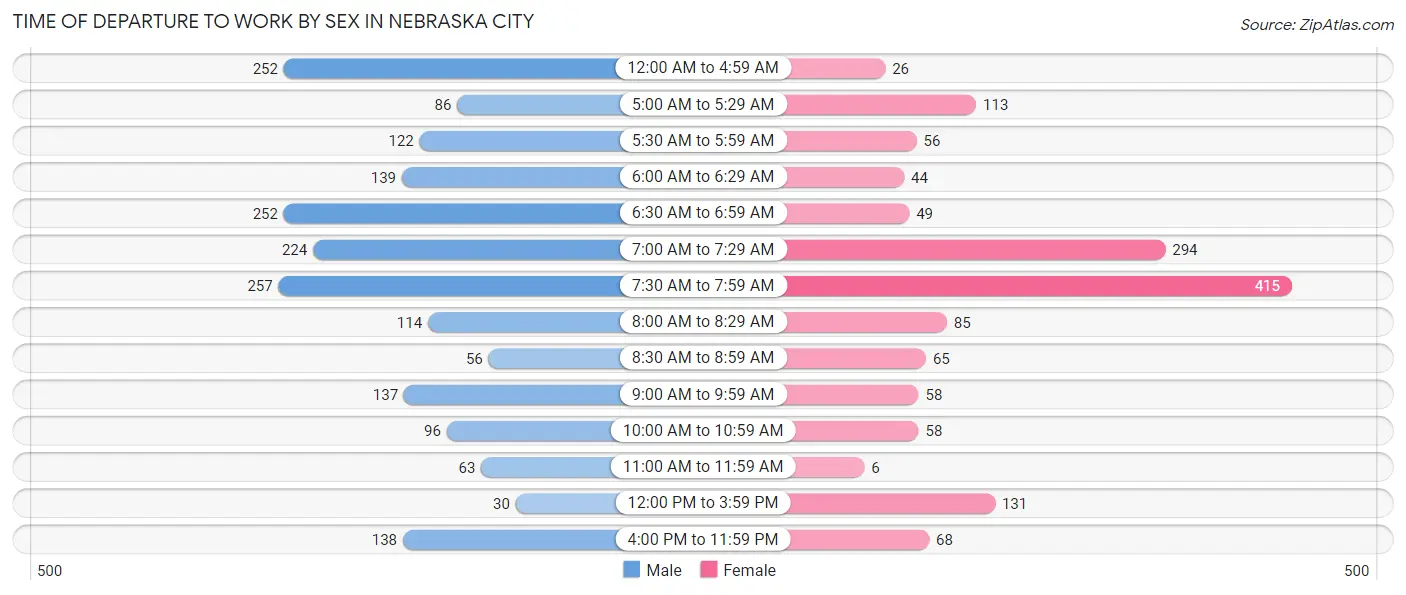
| Time of Departure | Male | Female |
| 12:00 AM to 4:59 AM | 252 (12.8%) | 26 (1.8%) |
| 5:00 AM to 5:29 AM | 86 (4.4%) | 113 (7.7%) |
| 5:30 AM to 5:59 AM | 122 (6.2%) | 56 (3.8%) |
| 6:00 AM to 6:29 AM | 139 (7.1%) | 44 (3.0%) |
| 6:30 AM to 6:59 AM | 252 (12.8%) | 49 (3.3%) |
| 7:00 AM to 7:29 AM | 224 (11.4%) | 294 (20.0%) |
| 7:30 AM to 7:59 AM | 257 (13.1%) | 415 (28.3%) |
| 8:00 AM to 8:29 AM | 114 (5.8%) | 85 (5.8%) |
| 8:30 AM to 8:59 AM | 56 (2.9%) | 65 (4.4%) |
| 9:00 AM to 9:59 AM | 137 (7.0%) | 58 (4.0%) |
| 10:00 AM to 10:59 AM | 96 (4.9%) | 58 (4.0%) |
| 11:00 AM to 11:59 AM | 63 (3.2%) | 6 (0.4%) |
| 12:00 PM to 3:59 PM | 30 (1.5%) | 131 (8.9%) |
| 4:00 PM to 11:59 PM | 138 (7.0%) | 68 (4.6%) |
| Total | 1,966 (100.0%) | 1,468 (100.0%) |
Housing Occupancy in Nebraska City
Occupancy by Ownership in Nebraska City
Of the total 2,850 dwellings in Nebraska City, owner-occupied units account for 1,933 (67.8%), while renter-occupied units make up 917 (32.2%).
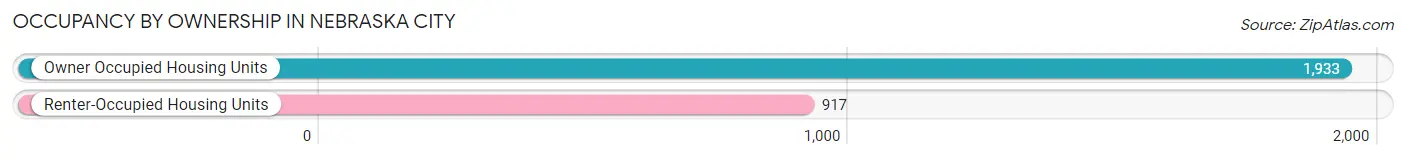
| Occupancy | # Housing Units | % Housing Units |
| Owner Occupied Housing Units | 1,933 | 67.8% |
| Renter-Occupied Housing Units | 917 | 32.2% |
| Total Occupied Housing Units | 2,850 | 100.0% |
Occupancy by Household Size in Nebraska City
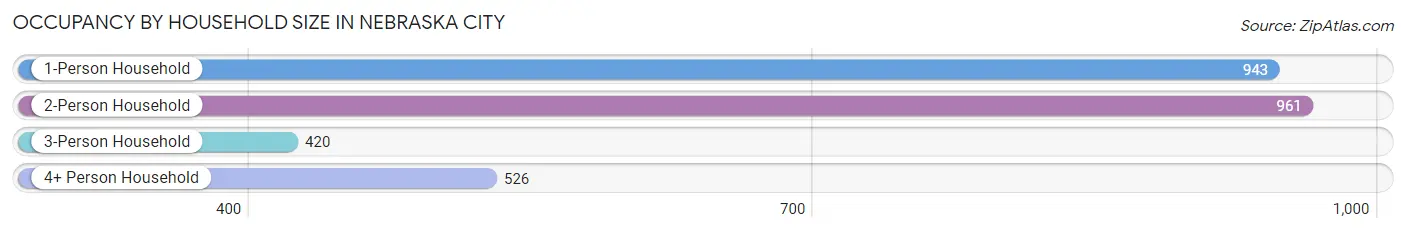
| Household Size | # Housing Units | % Housing Units |
| 1-Person Household | 943 | 33.1% |
| 2-Person Household | 961 | 33.7% |
| 3-Person Household | 420 | 14.7% |
| 4+ Person Household | 526 | 18.5% |
| Total Housing Units | 2,850 | 100.0% |
Occupancy by Ownership by Household Size in Nebraska City
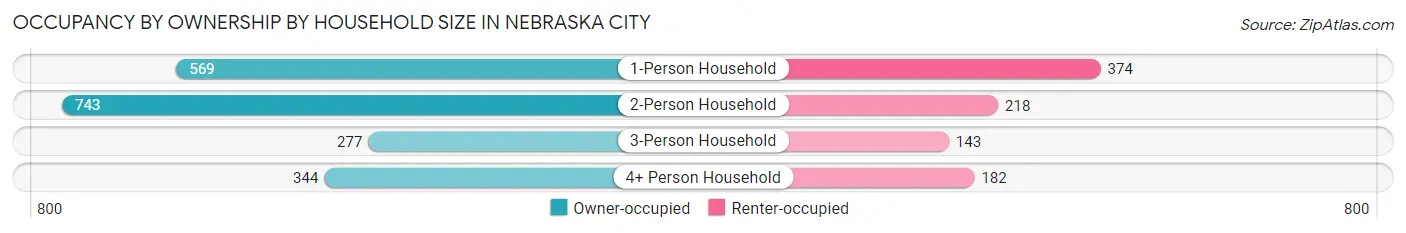
| Household Size | Owner-occupied | Renter-occupied |
| 1-Person Household | 569 (60.3%) | 374 (39.7%) |
| 2-Person Household | 743 (77.3%) | 218 (22.7%) |
| 3-Person Household | 277 (65.9%) | 143 (34.1%) |
| 4+ Person Household | 344 (65.4%) | 182 (34.6%) |
| Total Housing Units | 1,933 (67.8%) | 917 (32.2%) |
Occupancy by Educational Attainment in Nebraska City
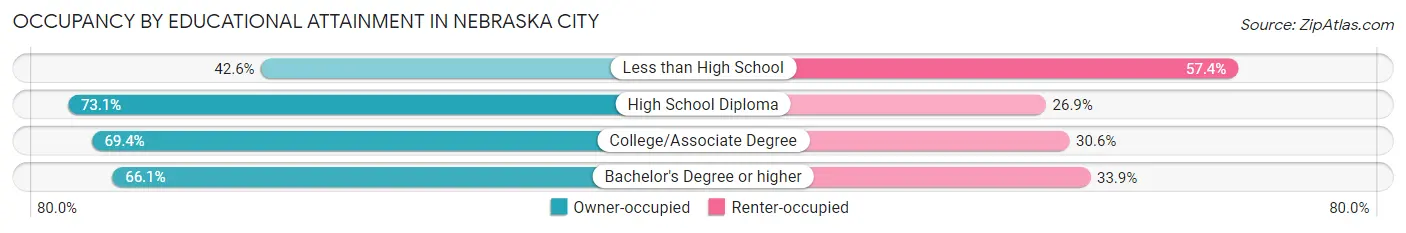
| Household Size | Owner-occupied | Renter-occupied |
| Less than High School | 95 (42.6%) | 128 (57.4%) |
| High School Diploma | 740 (73.1%) | 272 (26.9%) |
| College/Associate Degree | 646 (69.4%) | 285 (30.6%) |
| Bachelor's Degree or higher | 452 (66.1%) | 232 (33.9%) |
Occupancy by Age of Householder in Nebraska City
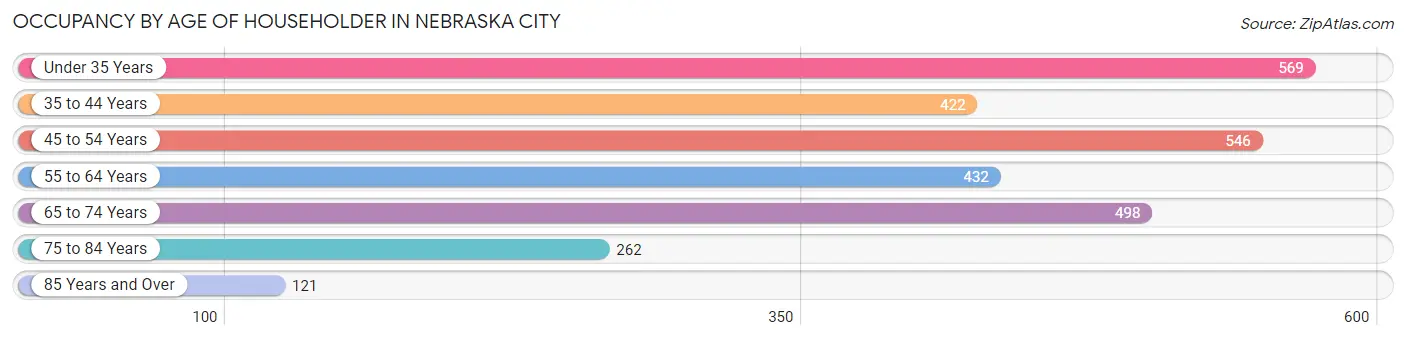
| Age Bracket | # Households | % Households |
| Under 35 Years | 569 | 20.0% |
| 35 to 44 Years | 422 | 14.8% |
| 45 to 54 Years | 546 | 19.2% |
| 55 to 64 Years | 432 | 15.2% |
| 65 to 74 Years | 498 | 17.5% |
| 75 to 84 Years | 262 | 9.2% |
| 85 Years and Over | 121 | 4.3% |
| Total | 2,850 | 100.0% |
Housing Finances in Nebraska City
Median Income by Occupancy in Nebraska City
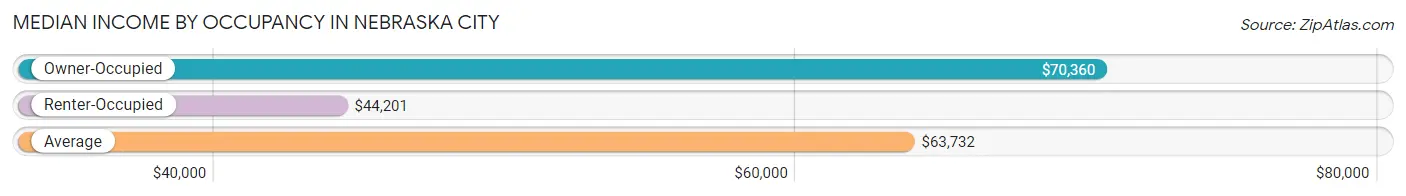
| Occupancy Type | # Households | Median Income |
| Owner-Occupied | 1,933 (67.8%) | $70,360 |
| Renter-Occupied | 917 (32.2%) | $44,201 |
| Average | 2,850 (100.0%) | $63,732 |
Occupancy by Householder Income Bracket in Nebraska City
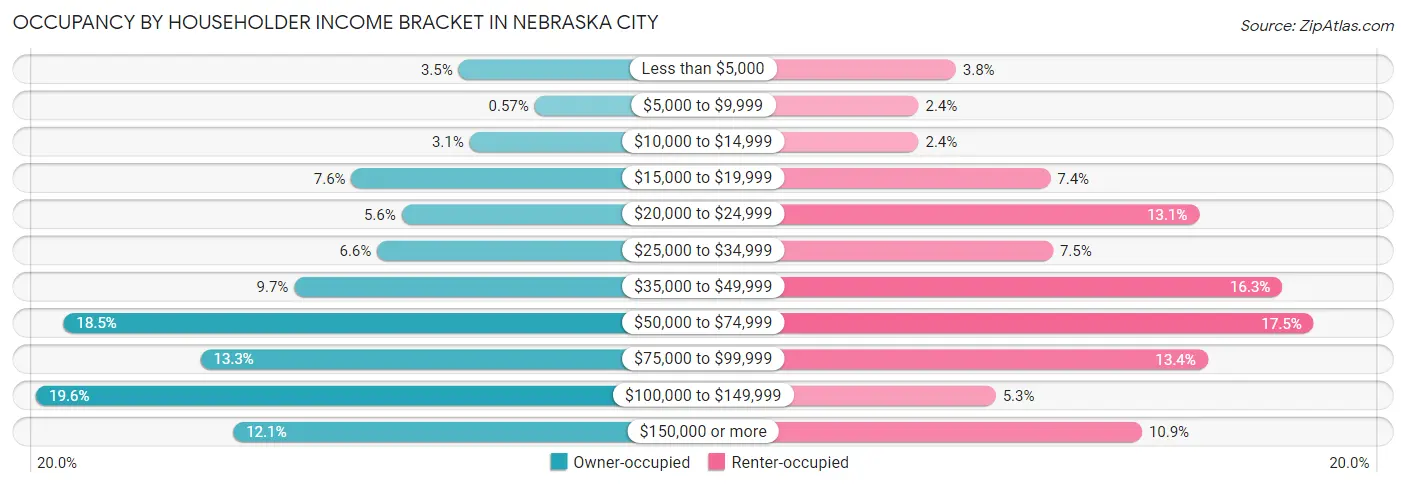
| Income Bracket | Owner-occupied | Renter-occupied |
| Less than $5,000 | 67 (3.5%) | 35 (3.8%) |
| $5,000 to $9,999 | 11 (0.6%) | 22 (2.4%) |
| $10,000 to $14,999 | 59 (3.0%) | 22 (2.4%) |
| $15,000 to $19,999 | 146 (7.5%) | 68 (7.4%) |
| $20,000 to $24,999 | 109 (5.6%) | 120 (13.1%) |
| $25,000 to $34,999 | 127 (6.6%) | 69 (7.5%) |
| $35,000 to $49,999 | 188 (9.7%) | 149 (16.3%) |
| $50,000 to $74,999 | 358 (18.5%) | 160 (17.4%) |
| $75,000 to $99,999 | 257 (13.3%) | 123 (13.4%) |
| $100,000 to $149,999 | 378 (19.6%) | 49 (5.3%) |
| $150,000 or more | 233 (12.0%) | 100 (10.9%) |
| Total | 1,933 (100.0%) | 917 (100.0%) |
Monthly Housing Cost Tiers in Nebraska City
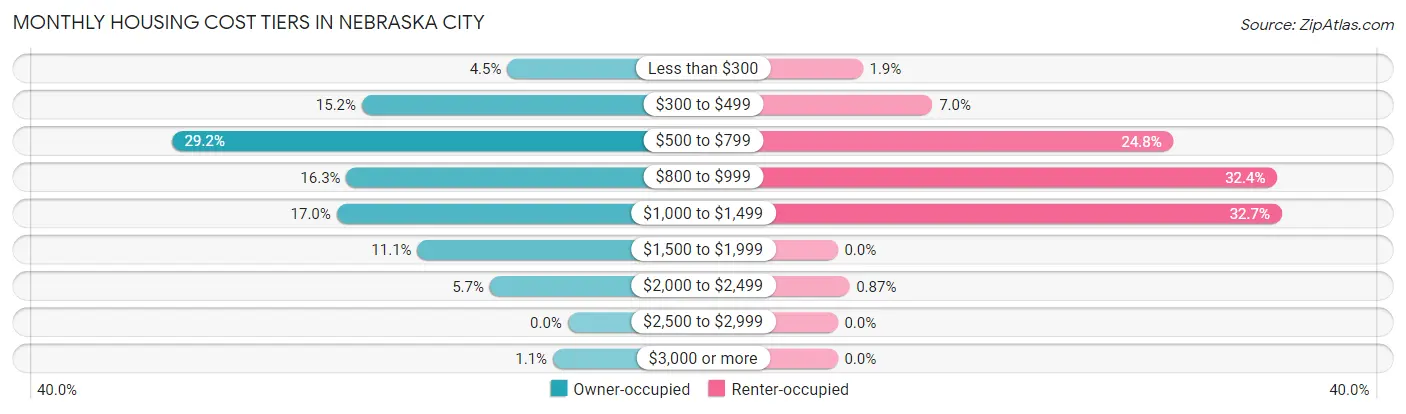
| Monthly Cost | Owner-occupied | Renter-occupied |
| Less than $300 | 86 (4.4%) | 17 (1.8%) |
| $300 to $499 | 293 (15.2%) | 64 (7.0%) |
| $500 to $799 | 564 (29.2%) | 227 (24.7%) |
| $800 to $999 | 315 (16.3%) | 297 (32.4%) |
| $1,000 to $1,499 | 329 (17.0%) | 300 (32.7%) |
| $1,500 to $1,999 | 214 (11.1%) | 0 (0.0%) |
| $2,000 to $2,499 | 111 (5.7%) | 8 (0.9%) |
| $2,500 to $2,999 | 0 (0.0%) | 0 (0.0%) |
| $3,000 or more | 21 (1.1%) | 0 (0.0%) |
| Total | 1,933 (100.0%) | 917 (100.0%) |
Physical Housing Characteristics in Nebraska City
Housing Structures in Nebraska City
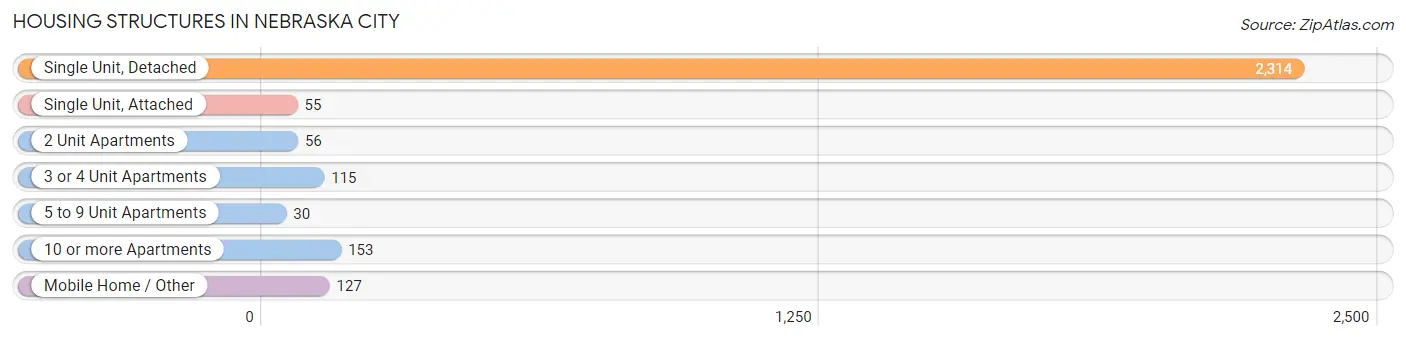
| Structure Type | # Housing Units | % Housing Units |
| Single Unit, Detached | 2,314 | 81.2% |
| Single Unit, Attached | 55 | 1.9% |
| 2 Unit Apartments | 56 | 2.0% |
| 3 or 4 Unit Apartments | 115 | 4.0% |
| 5 to 9 Unit Apartments | 30 | 1.1% |
| 10 or more Apartments | 153 | 5.4% |
| Mobile Home / Other | 127 | 4.5% |
| Total | 2,850 | 100.0% |
Housing Structures by Occupancy in Nebraska City
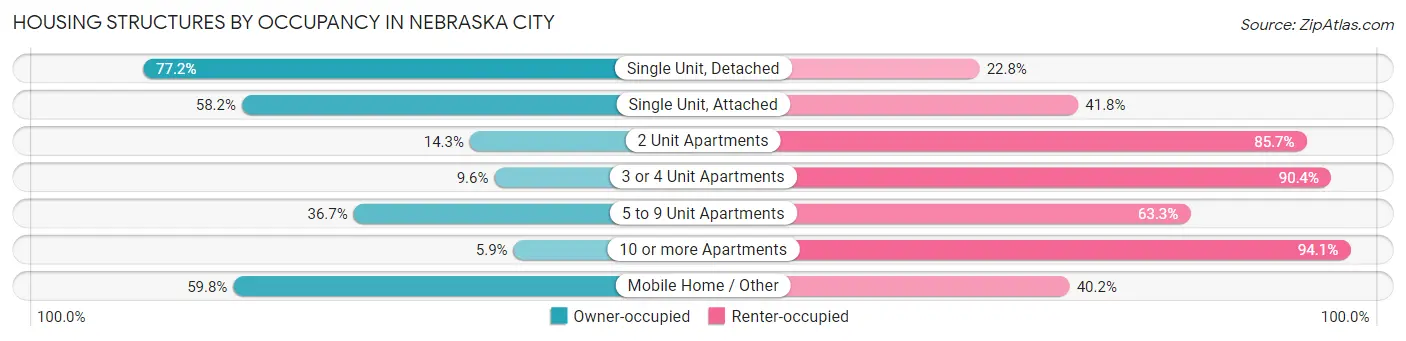
| Structure Type | Owner-occupied | Renter-occupied |
| Single Unit, Detached | 1,786 (77.2%) | 528 (22.8%) |
| Single Unit, Attached | 32 (58.2%) | 23 (41.8%) |
| 2 Unit Apartments | 8 (14.3%) | 48 (85.7%) |
| 3 or 4 Unit Apartments | 11 (9.6%) | 104 (90.4%) |
| 5 to 9 Unit Apartments | 11 (36.7%) | 19 (63.3%) |
| 10 or more Apartments | 9 (5.9%) | 144 (94.1%) |
| Mobile Home / Other | 76 (59.8%) | 51 (40.2%) |
| Total | 1,933 (67.8%) | 917 (32.2%) |
Housing Structures by Number of Rooms in Nebraska City
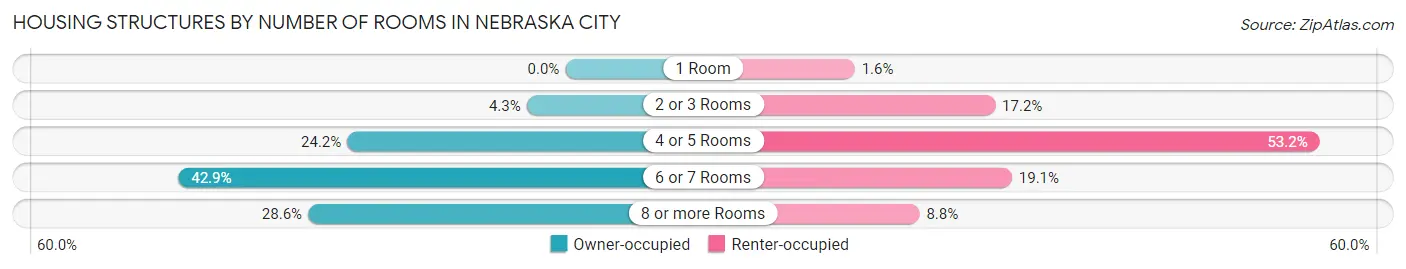
| Number of Rooms | Owner-occupied | Renter-occupied |
| 1 Room | 0 (0.0%) | 15 (1.6%) |
| 2 or 3 Rooms | 83 (4.3%) | 158 (17.2%) |
| 4 or 5 Rooms | 468 (24.2%) | 488 (53.2%) |
| 6 or 7 Rooms | 830 (42.9%) | 175 (19.1%) |
| 8 or more Rooms | 552 (28.6%) | 81 (8.8%) |
| Total | 1,933 (100.0%) | 917 (100.0%) |
Housing Structure by Heating Type in Nebraska City
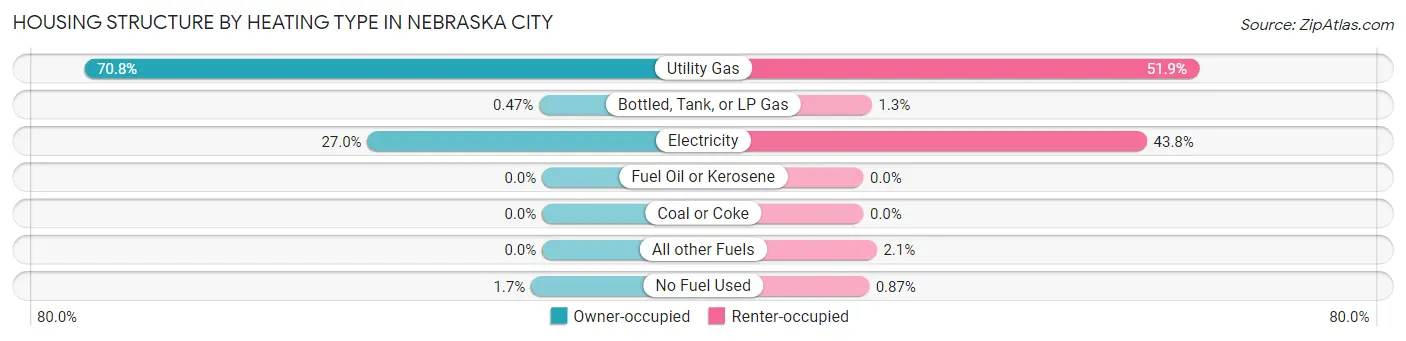
| Heating Type | Owner-occupied | Renter-occupied |
| Utility Gas | 1,369 (70.8%) | 476 (51.9%) |
| Bottled, Tank, or LP Gas | 9 (0.5%) | 12 (1.3%) |
| Electricity | 522 (27.0%) | 402 (43.8%) |
| Fuel Oil or Kerosene | 0 (0.0%) | 0 (0.0%) |
| Coal or Coke | 0 (0.0%) | 0 (0.0%) |
| All other Fuels | 0 (0.0%) | 19 (2.1%) |
| No Fuel Used | 33 (1.7%) | 8 (0.9%) |
| Total | 1,933 (100.0%) | 917 (100.0%) |
Household Vehicle Usage in Nebraska City
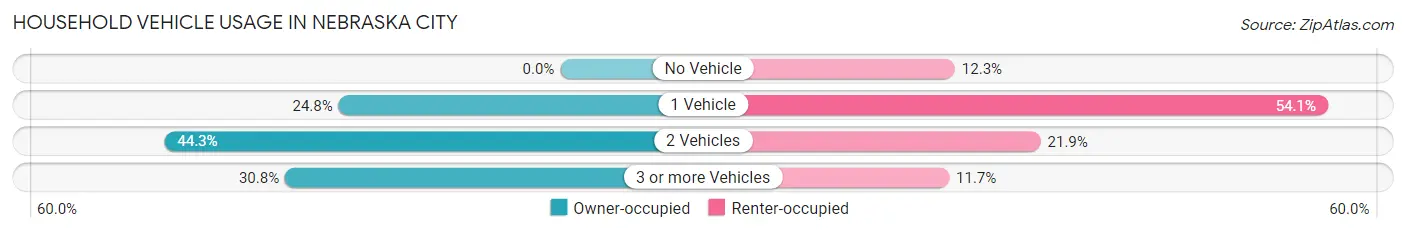
| Vehicles per Household | Owner-occupied | Renter-occupied |
| No Vehicle | 0 (0.0%) | 113 (12.3%) |
| 1 Vehicle | 480 (24.8%) | 496 (54.1%) |
| 2 Vehicles | 857 (44.3%) | 201 (21.9%) |
| 3 or more Vehicles | 596 (30.8%) | 107 (11.7%) |
| Total | 1,933 (100.0%) | 917 (100.0%) |
Real Estate & Mortgages in Nebraska City
Real Estate and Mortgage Overview in Nebraska City
| Characteristic | Without Mortgage | With Mortgage |
| Housing Units | 1,025 | 908 |
| Median Property Value | $134,500 | $155,800 |
| Median Household Income | $53,750 | $199 |
| Monthly Housing Costs | $573 | $21 |
| Real Estate Taxes | $2,053 | $17 |
Property Value by Mortgage Status in Nebraska City
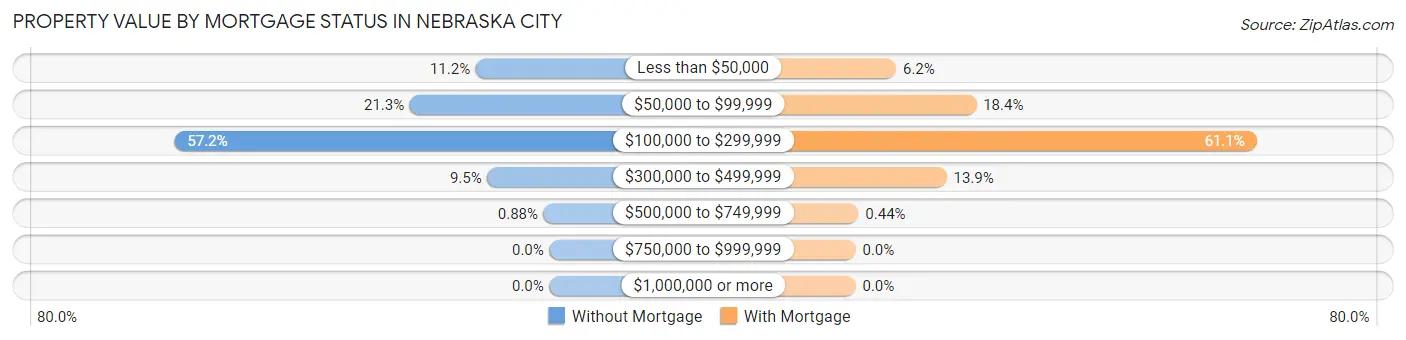
| Property Value | Without Mortgage | With Mortgage |
| Less than $50,000 | 115 (11.2%) | 56 (6.2%) |
| $50,000 to $99,999 | 218 (21.3%) | 167 (18.4%) |
| $100,000 to $299,999 | 586 (57.2%) | 555 (61.1%) |
| $300,000 to $499,999 | 97 (9.5%) | 126 (13.9%) |
| $500,000 to $749,999 | 9 (0.9%) | 4 (0.4%) |
| $750,000 to $999,999 | 0 (0.0%) | 0 (0.0%) |
| $1,000,000 or more | 0 (0.0%) | 0 (0.0%) |
| Total | 1,025 (100.0%) | 908 (100.0%) |
Household Income by Mortgage Status in Nebraska City
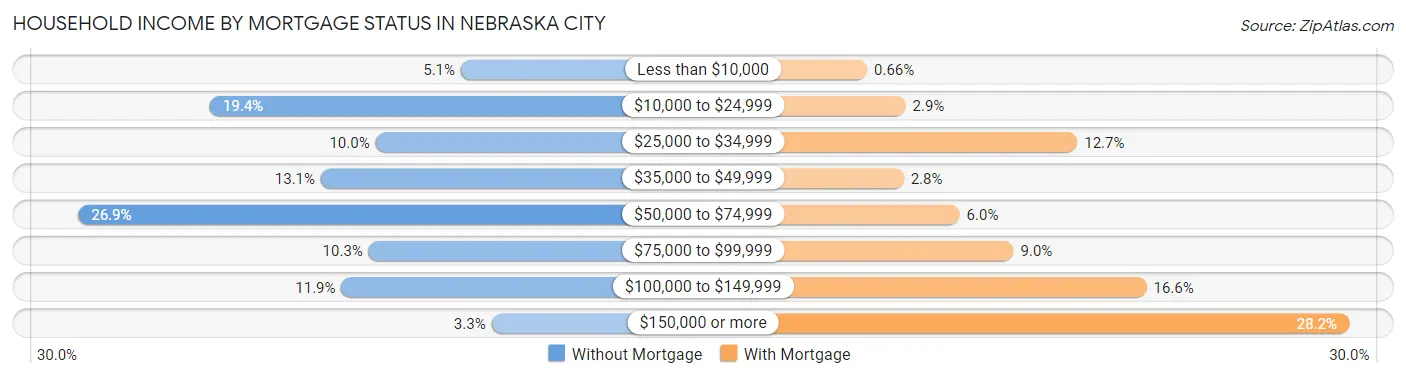
| Household Income | Without Mortgage | With Mortgage |
| Less than $10,000 | 52 (5.1%) | 6 (0.7%) |
| $10,000 to $24,999 | 199 (19.4%) | 26 (2.9%) |
| $25,000 to $34,999 | 102 (10.0%) | 115 (12.7%) |
| $35,000 to $49,999 | 134 (13.1%) | 25 (2.8%) |
| $50,000 to $74,999 | 276 (26.9%) | 54 (5.9%) |
| $75,000 to $99,999 | 106 (10.3%) | 82 (9.0%) |
| $100,000 to $149,999 | 122 (11.9%) | 151 (16.6%) |
| $150,000 or more | 34 (3.3%) | 256 (28.2%) |
| Total | 1,025 (100.0%) | 908 (100.0%) |
Property Value to Household Income Ratio in Nebraska City
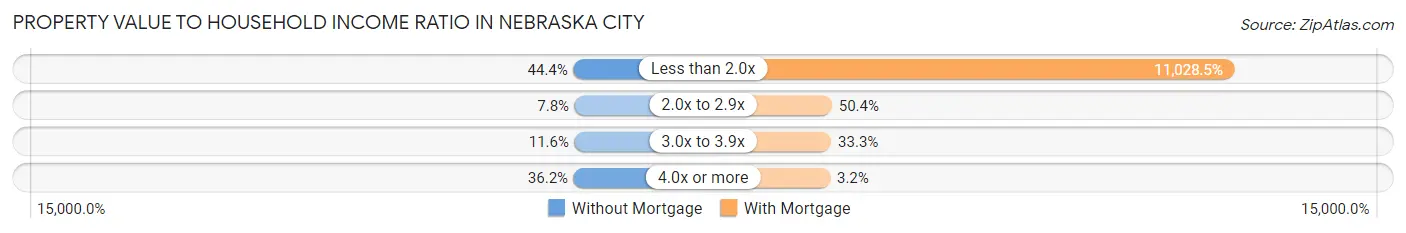
| Value-to-Income Ratio | Without Mortgage | With Mortgage |
| Less than 2.0x | 455 (44.4%) | 100,139 (11,028.5%) |
| 2.0x to 2.9x | 80 (7.8%) | 458 (50.4%) |
| 3.0x to 3.9x | 119 (11.6%) | 302 (33.3%) |
| 4.0x or more | 371 (36.2%) | 29 (3.2%) |
| Total | 1,025 (100.0%) | 908 (100.0%) |
Real Estate Taxes by Mortgage Status in Nebraska City
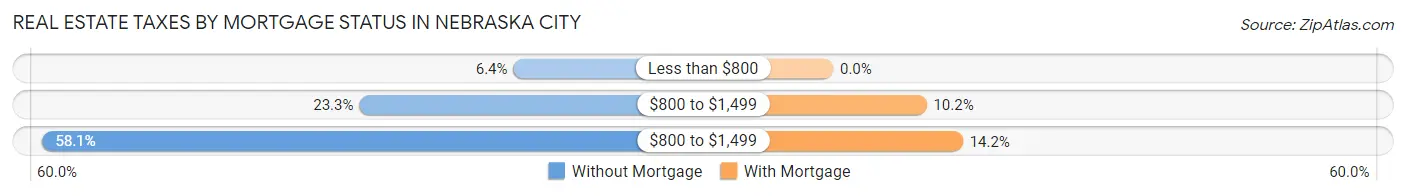
| Property Taxes | Without Mortgage | With Mortgage |
| Less than $800 | 66 (6.4%) | 0 (0.0%) |
| $800 to $1,499 | 239 (23.3%) | 93 (10.2%) |
| $800 to $1,499 | 595 (58.1%) | 129 (14.2%) |
| Total | 1,025 (100.0%) | 908 (100.0%) |
Health & Disability in Nebraska City
Health Insurance Coverage by Age in Nebraska City
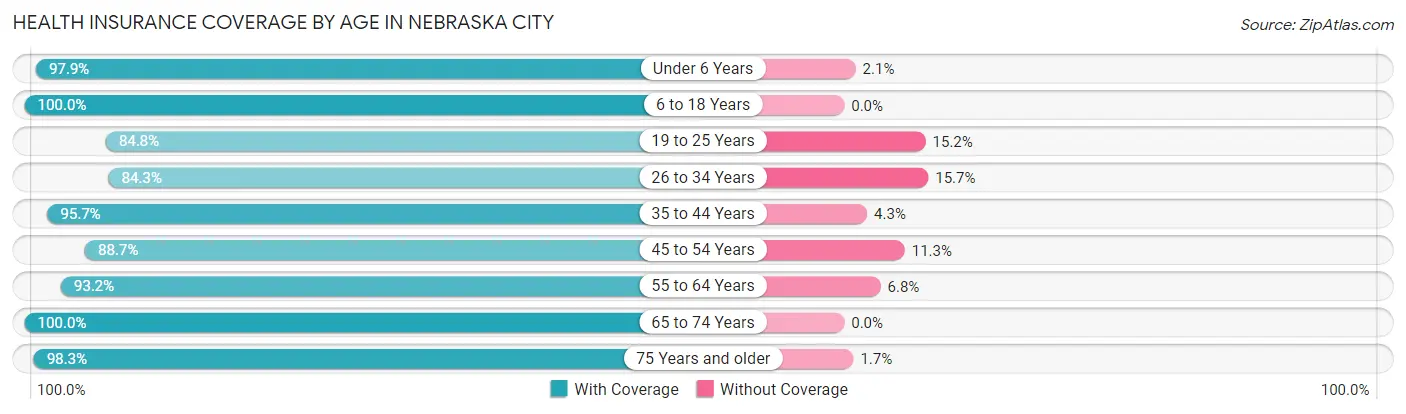
| Age Bracket | With Coverage | Without Coverage |
| Under 6 Years | 416 (97.9%) | 9 (2.1%) |
| 6 to 18 Years | 1,434 (100.0%) | 0 (0.0%) |
| 19 to 25 Years | 694 (84.8%) | 124 (15.2%) |
| 26 to 34 Years | 474 (84.3%) | 88 (15.7%) |
| 35 to 44 Years | 876 (95.7%) | 39 (4.3%) |
| 45 to 54 Years | 778 (88.7%) | 99 (11.3%) |
| 55 to 64 Years | 758 (93.2%) | 55 (6.8%) |
| 65 to 74 Years | 742 (100.0%) | 0 (0.0%) |
| 75 Years and older | 518 (98.3%) | 9 (1.7%) |
| Total | 6,690 (94.1%) | 423 (5.9%) |
Health Insurance Coverage by Citizenship Status in Nebraska City
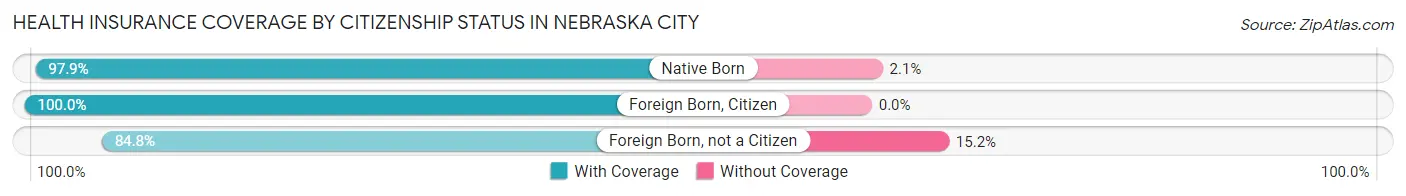
| Citizenship Status | With Coverage | Without Coverage |
| Native Born | 416 (97.9%) | 9 (2.1%) |
| Foreign Born, Citizen | 1,434 (100.0%) | 0 (0.0%) |
| Foreign Born, not a Citizen | 694 (84.8%) | 124 (15.2%) |
Health Insurance Coverage by Household Income in Nebraska City
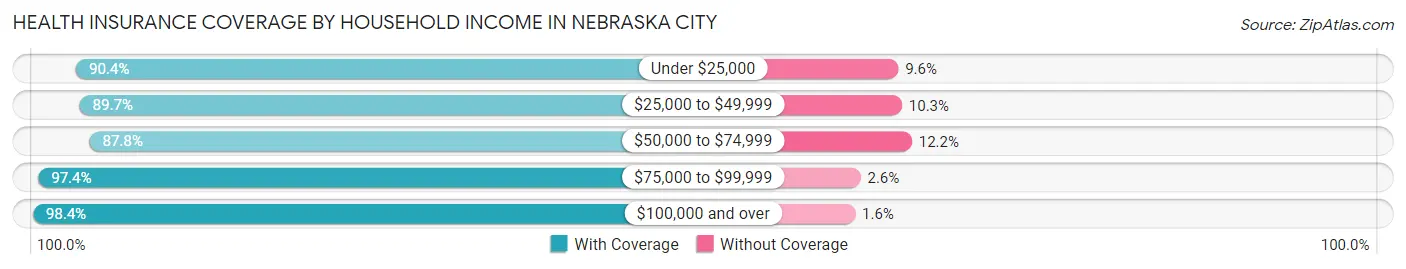
| Household Income | With Coverage | Without Coverage |
| Under $25,000 | 994 (90.4%) | 106 (9.6%) |
| $25,000 to $49,999 | 912 (89.7%) | 105 (10.3%) |
| $50,000 to $74,999 | 1,002 (87.8%) | 139 (12.2%) |
| $75,000 to $99,999 | 1,251 (97.4%) | 33 (2.6%) |
| $100,000 and over | 2,524 (98.4%) | 40 (1.6%) |
Public vs Private Health Insurance Coverage by Age in Nebraska City
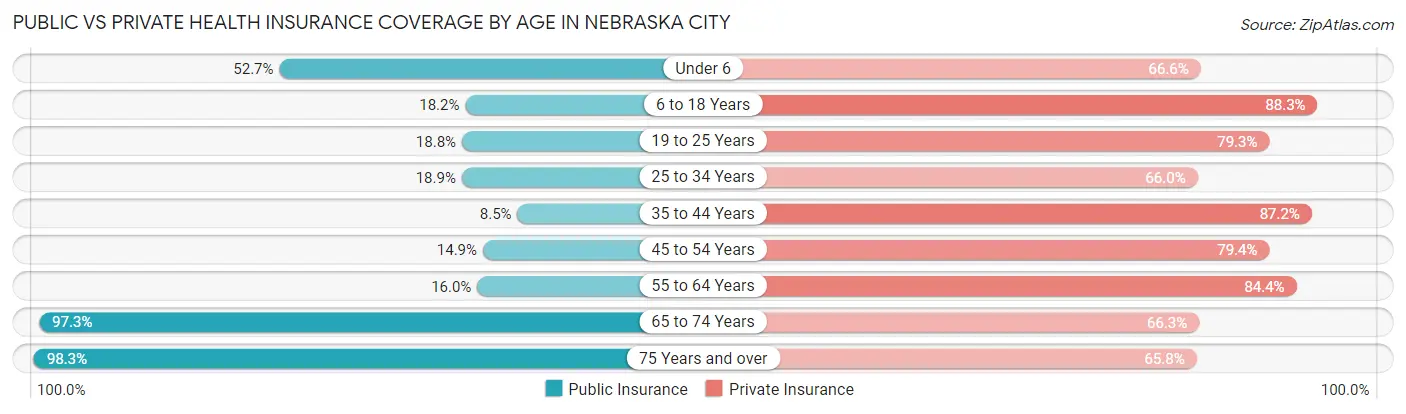
| Age Bracket | Public Insurance | Private Insurance |
| Under 6 | 224 (52.7%) | 283 (66.6%) |
| 6 to 18 Years | 261 (18.2%) | 1,266 (88.3%) |
| 19 to 25 Years | 154 (18.8%) | 649 (79.3%) |
| 25 to 34 Years | 106 (18.9%) | 371 (66.0%) |
| 35 to 44 Years | 78 (8.5%) | 798 (87.2%) |
| 45 to 54 Years | 131 (14.9%) | 696 (79.4%) |
| 55 to 64 Years | 130 (16.0%) | 686 (84.4%) |
| 65 to 74 Years | 722 (97.3%) | 492 (66.3%) |
| 75 Years and over | 518 (98.3%) | 347 (65.8%) |
| Total | 2,324 (32.7%) | 5,588 (78.6%) |
Disability Status by Sex by Age in Nebraska City
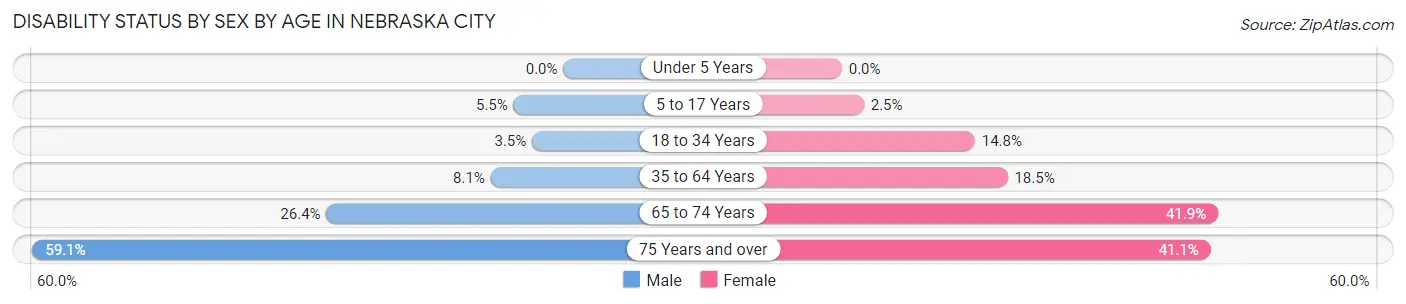
| Age Bracket | Male | Female |
| Under 5 Years | 0 (0.0%) | 0 (0.0%) |
| 5 to 17 Years | 50 (5.5%) | 14 (2.5%) |
| 18 to 34 Years | 31 (3.5%) | 76 (14.8%) |
| 35 to 64 Years | 98 (8.1%) | 257 (18.4%) |
| 65 to 74 Years | 90 (26.4%) | 168 (41.9%) |
| 75 Years and over | 136 (59.1%) | 122 (41.1%) |
Disability Class by Sex by Age in Nebraska City
Disability Class: Hearing Difficulty
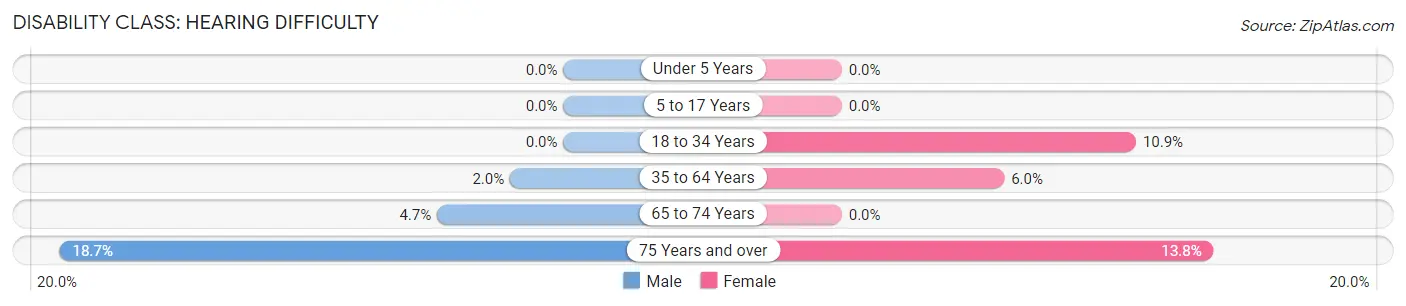
| Age Bracket | Male | Female |
| Under 5 Years | 0 (0.0%) | 0 (0.0%) |
| 5 to 17 Years | 0 (0.0%) | 0 (0.0%) |
| 18 to 34 Years | 0 (0.0%) | 56 (10.9%) |
| 35 to 64 Years | 24 (2.0%) | 84 (6.0%) |
| 65 to 74 Years | 16 (4.7%) | 0 (0.0%) |
| 75 Years and over | 43 (18.7%) | 41 (13.8%) |
Disability Class: Vision Difficulty
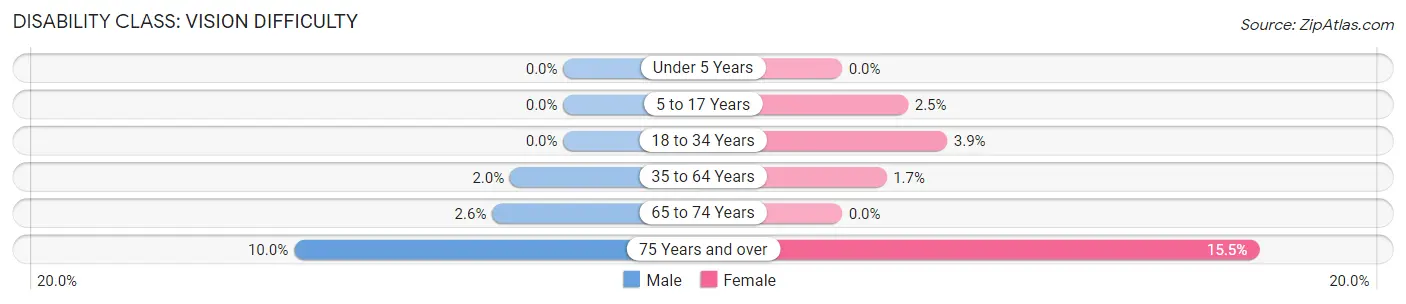
| Age Bracket | Male | Female |
| Under 5 Years | 0 (0.0%) | 0 (0.0%) |
| 5 to 17 Years | 0 (0.0%) | 14 (2.5%) |
| 18 to 34 Years | 0 (0.0%) | 20 (3.9%) |
| 35 to 64 Years | 24 (2.0%) | 23 (1.7%) |
| 65 to 74 Years | 9 (2.6%) | 0 (0.0%) |
| 75 Years and over | 23 (10.0%) | 46 (15.5%) |
Disability Class: Cognitive Difficulty
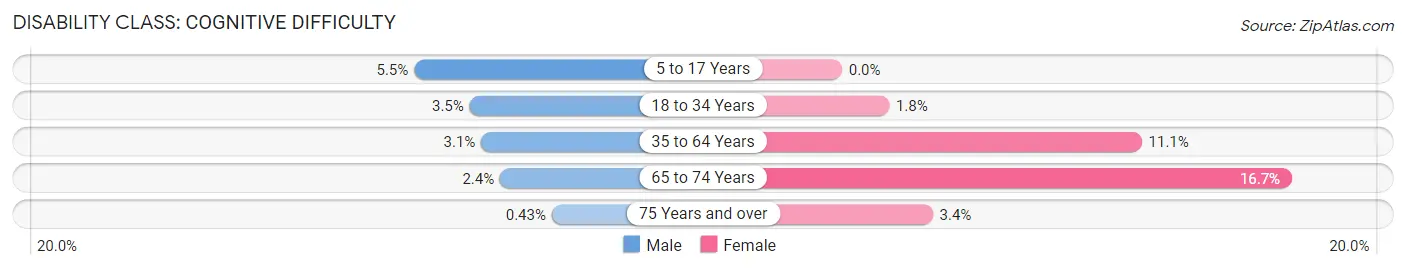
| Age Bracket | Male | Female |
| 5 to 17 Years | 50 (5.5%) | 0 (0.0%) |
| 18 to 34 Years | 31 (3.5%) | 9 (1.8%) |
| 35 to 64 Years | 37 (3.0%) | 155 (11.1%) |
| 65 to 74 Years | 8 (2.4%) | 67 (16.7%) |
| 75 Years and over | 1 (0.4%) | 10 (3.4%) |
Disability Class: Ambulatory Difficulty
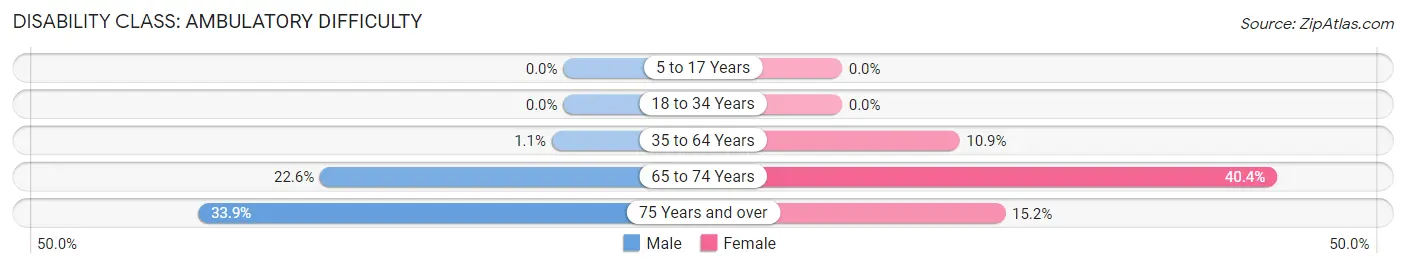
| Age Bracket | Male | Female |
| 5 to 17 Years | 0 (0.0%) | 0 (0.0%) |
| 18 to 34 Years | 0 (0.0%) | 0 (0.0%) |
| 35 to 64 Years | 13 (1.1%) | 152 (10.9%) |
| 65 to 74 Years | 77 (22.6%) | 162 (40.4%) |
| 75 Years and over | 78 (33.9%) | 45 (15.1%) |
Disability Class: Self-Care Difficulty
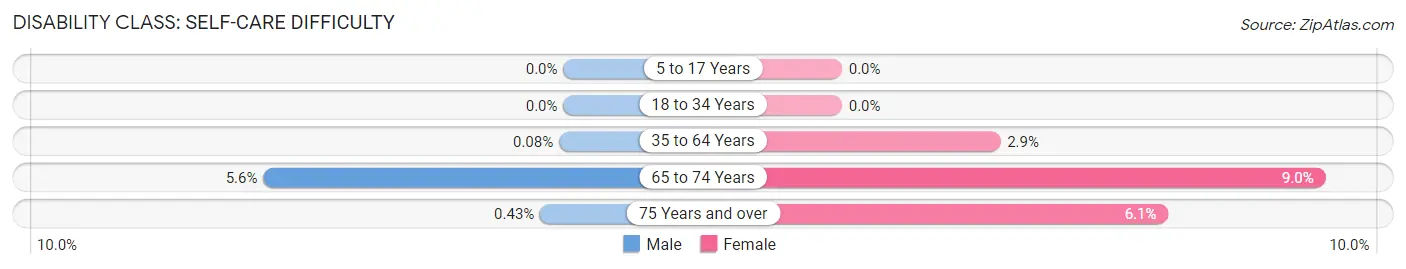
| Age Bracket | Male | Female |
| 5 to 17 Years | 0 (0.0%) | 0 (0.0%) |
| 18 to 34 Years | 0 (0.0%) | 0 (0.0%) |
| 35 to 64 Years | 1 (0.1%) | 41 (2.9%) |
| 65 to 74 Years | 19 (5.6%) | 36 (9.0%) |
| 75 Years and over | 1 (0.4%) | 18 (6.1%) |
Technology Access in Nebraska City
Computing Device Access in Nebraska City
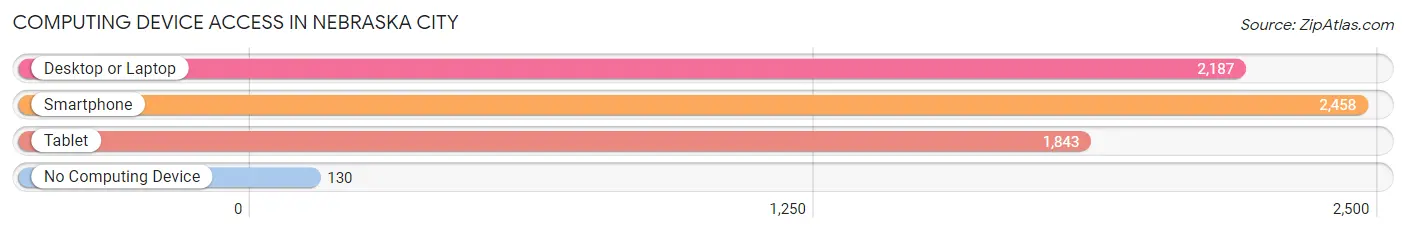
| Device Type | # Households | % Households |
| Desktop or Laptop | 2,187 | 76.7% |
| Smartphone | 2,458 | 86.3% |
| Tablet | 1,843 | 64.7% |
| No Computing Device | 130 | 4.6% |
| Total | 2,850 | 100.0% |
Internet Access in Nebraska City
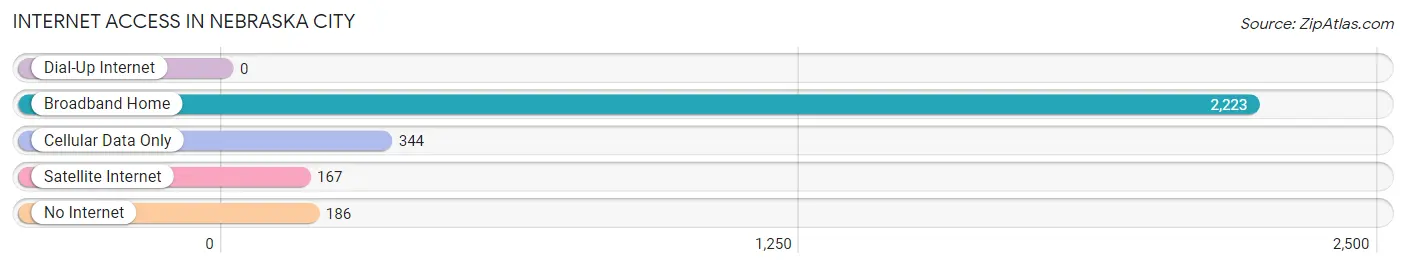
| Internet Type | # Households | % Households |
| Dial-Up Internet | 0 | 0.0% |
| Broadband Home | 2,223 | 78.0% |
| Cellular Data Only | 344 | 12.1% |
| Satellite Internet | 167 | 5.9% |
| No Internet | 186 | 6.5% |
| Total | 2,850 | 100.0% |
Nebraska City Summary
Nebraska City is a city located in Otoe County, Nebraska, United States. It is located on the Missouri River, and is the county seat of Otoe County. As of the 2010 census, the city had a population of 7,289.
History
Nebraska City was founded in 1854 by the Nebraska Town Company, which was formed by a group of settlers from the East Coast. The town was originally called "Cutler's Park" after one of the founders, J. Sterling Cutler. The name was changed to Nebraska City in 1855.
The city was incorporated in 1856 and was the first incorporated city in the state of Nebraska. The city was an important stop on the Oregon Trail, and was the first capital of the Nebraska Territory.
Geography
Nebraska City is located at 40°41'25" North, 95°53'45" West (40.690278, -95.895833). It is situated on the Missouri River, and is the county seat of Otoe County.
The city has a total area of 8.2 square miles, of which 8.1 square miles is land and 0.1 square miles is water.
Economy
Nebraska City is a major agricultural center, with a variety of crops grown in the area. The city is also home to several manufacturing companies, including a Tyson Foods plant and a ConAgra Foods plant.
The city is also home to several tourist attractions, including Arbor Day Farm, the Lied Lodge & Conference Center, and the Lewis & Clark Monument.
Demographics
As of the 2010 census, there were 7,289 people, 2,845 households, and 1,845 families residing in the city. The population density was 899.3 people per square mile. There were 3,093 housing units at an average density of 381.3 per square mile.
The racial makeup of the city was 92.2% White, 0.7% African American, 0.4% Native American, 0.7% Asian, 0.1% Pacific Islander, 4.2% from other races, and 1.7% from two or more races. Hispanic or Latino of any race were 8.2% of the population.
There were 2,845 households, out of which 32.2% had children under the age of 18 living with them, 48.2% were married couples living together, 11.7% had a female householder with no husband present, and 35.7% were non-families. 30.2% of all households were made up of individuals, and 13.2% had someone living alone who was 65 years of age or older. The average household size was 2.45 and the average family size was 3.05.
In the city, the population was spread out, with 25.9% under the age of 18, 8.2% from 18 to 24, 27.2% from 25 to 44, 22.7% from 45 to 64, and 16.0% who were 65 years of age or older. The median age was 37 years. For every 100 females, there were 93.2 males. For every 100 females age 18 and over, there were 89.3 males.
The median income for a household in the city was $37,917, and the median income for a family was $45,938. Males had a median income of $31,912 versus $22,917 for females. The per capita income for the city was $18,945. About 6.2% of families and 8.7% of the population were below the poverty line, including 10.3% of those under age 18 and 8.2% of those age 65 or over.
Common Questions
What is Per Capita Income in Nebraska City?
Per Capita income in Nebraska City is $31,073.
What is the Median Family Income in Nebraska City?
Median Family Income in Nebraska City is $84,125.
What is the Median Household income in Nebraska City?
Median Household Income in Nebraska City is $63,732.
What is Income or Wage Gap in Nebraska City?
Income or Wage Gap in Nebraska City is 36.2%.
Women in Nebraska City earn 63.8 cents for every dollar earned by a man.
What is Family Income Deficit in Nebraska City?
Family Income Deficit in Nebraska City is $8,471.
Families that are below poverty line in Nebraska City earn $8,471 less on average than the poverty threshold level.
What is Inequality or Gini Index in Nebraska City?
Inequality or Gini Index in Nebraska City is 0.42.
What is the Total Population of Nebraska City?
Total Population of Nebraska City is 7,257.
What is the Total Male Population of Nebraska City?
Total Male Population of Nebraska City is 3,780.
What is the Total Female Population of Nebraska City?
Total Female Population of Nebraska City is 3,477.
What is the Ratio of Males per 100 Females in Nebraska City?
There are 108.71 Males per 100 Females in Nebraska City.
What is the Ratio of Females per 100 Males in Nebraska City?
There are 91.98 Females per 100 Males in Nebraska City.
What is the Median Population Age in Nebraska City?
Median Population Age in Nebraska City is 38.8 Years.
What is the Average Family Size in Nebraska City
Average Family Size in Nebraska City is 3.2 People.
What is the Average Household Size in Nebraska City
Average Household Size in Nebraska City is 2.5 People.
How Large is the Labor Force in Nebraska City?
There are 3,828 People in the Labor Forcein in Nebraska City.
What is the Percentage of People in the Labor Force in Nebraska City?
67.7% of People are in the Labor Force in Nebraska City.
What is the Unemployment Rate in Nebraska City?
Unemployment Rate in Nebraska City is 2.8%.