West Lafayette, IN Map & Demographics
West Lafayette Map
West Lafayette Overview
$21,559
PER CAPITA INCOME
$101,331
AVG FAMILY INCOME
$30,317
AVG HOUSEHOLD INCOME
28.3%
WAGE / INCOME GAP [ % ]
71.7¢/ $1
WAGE / INCOME GAP [ $ ]
$8,340
FAMILY INCOME DEFICIT
0.60
INEQUALITY / GINI INDEX
44,861
TOTAL POPULATION
24,837
MALE POPULATION
20,024
FEMALE POPULATION
124.04
MALES / 100 FEMALES
80.62
FEMALES / 100 MALES
21.4
MEDIAN AGE
3.0
AVG FAMILY SIZE
2.2
AVG HOUSEHOLD SIZE
20,518
LABOR FORCE [ PEOPLE ]
49.3%
PERCENT IN LABOR FORCE
3.3%
UNEMPLOYMENT RATE
West Lafayette Zip Codes
West Lafayette Area Codes
Income in West Lafayette
Income Overview in West Lafayette
Per Capita Income in West Lafayette is $21,559, while median incomes of families and households are $101,331 and $30,317 respectively.
| Characteristic | Number | Measure |
| Per Capita Income | 44,861 | $21,559 |
| Median Family Income | 4,470 | $101,331 |
| Mean Family Income | 4,470 | $133,996 |
| Median Household Income | 14,097 | $30,317 |
| Mean Household Income | 14,097 | $63,804 |
| Income Deficit | 4,470 | $8,340 |
| Wage / Income Gap (%) | 44,861 | 28.28% |
| Wage / Income Gap ($) | 44,861 | 71.72¢ per $1 |
| Gini / Inequality Index | 44,861 | 0.60 |
Earnings by Sex in West Lafayette
Average Earnings in West Lafayette are $9,064, $10,383 for men and $7,447 for women, a difference of 28.3%.
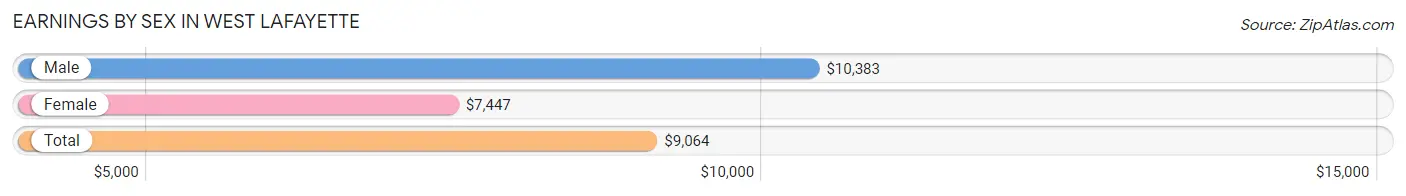
| Sex | Number | Average Earnings |
| Male | 16,999 (57.7%) | $10,383 |
| Female | 12,456 (42.3%) | $7,447 |
| Total | 29,455 (100.0%) | $9,064 |
Earnings by Sex by Income Bracket in West Lafayette
The most common earnings brackets in West Lafayette are $2,499 or less for men (2,628 | 15.5%) and $2,499 or less for women (2,799 | 22.5%).
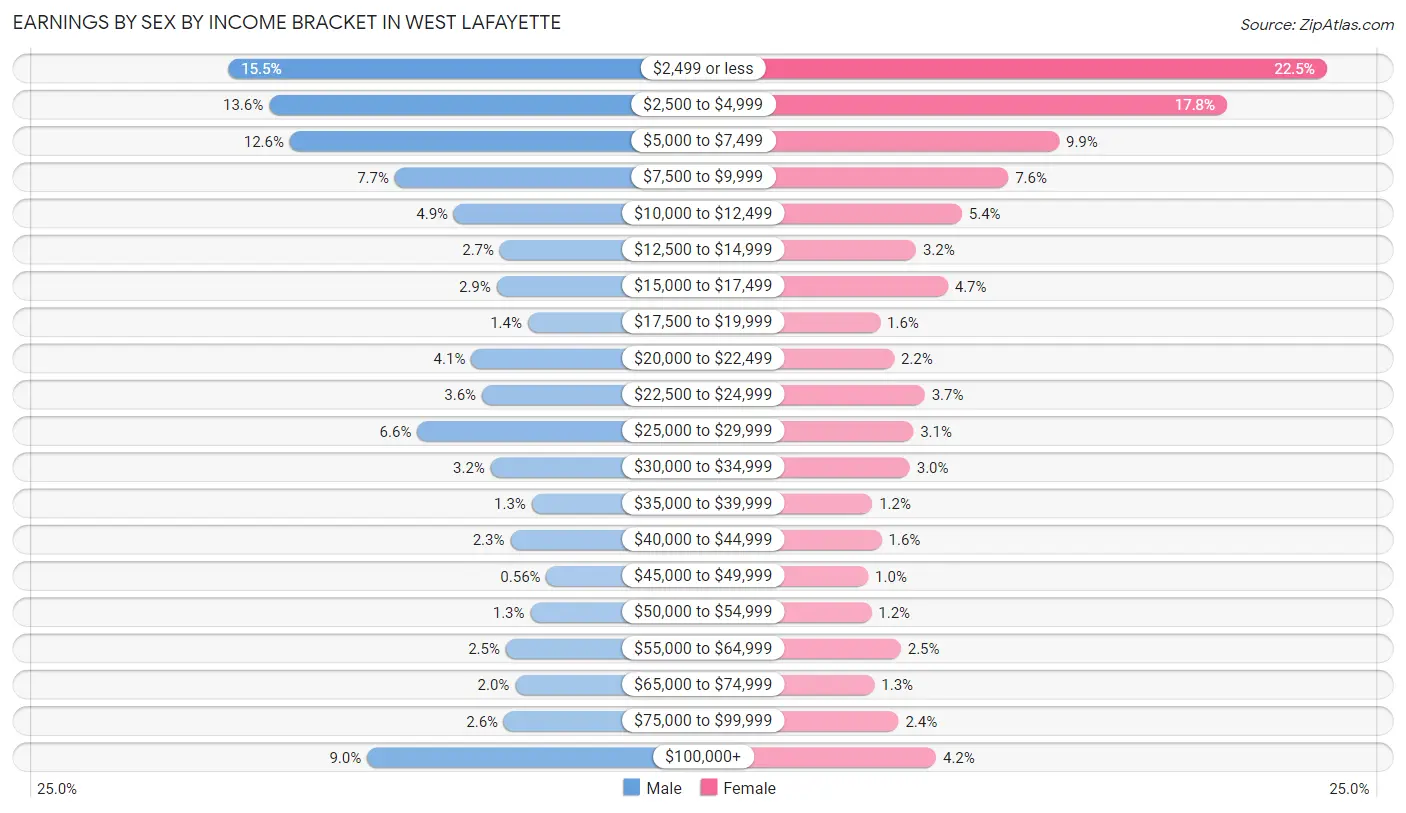
| Income | Male | Female |
| $2,499 or less | 2,628 (15.5%) | 2,799 (22.5%) |
| $2,500 to $4,999 | 2,304 (13.6%) | 2,217 (17.8%) |
| $5,000 to $7,499 | 2,138 (12.6%) | 1,238 (9.9%) |
| $7,500 to $9,999 | 1,302 (7.7%) | 942 (7.6%) |
| $10,000 to $12,499 | 832 (4.9%) | 671 (5.4%) |
| $12,500 to $14,999 | 465 (2.7%) | 404 (3.2%) |
| $15,000 to $17,499 | 491 (2.9%) | 589 (4.7%) |
| $17,500 to $19,999 | 243 (1.4%) | 194 (1.6%) |
| $20,000 to $22,499 | 693 (4.1%) | 275 (2.2%) |
| $22,500 to $24,999 | 609 (3.6%) | 455 (3.6%) |
| $25,000 to $29,999 | 1,123 (6.6%) | 387 (3.1%) |
| $30,000 to $34,999 | 539 (3.2%) | 368 (2.9%) |
| $35,000 to $39,999 | 213 (1.3%) | 148 (1.2%) |
| $40,000 to $44,999 | 383 (2.2%) | 203 (1.6%) |
| $45,000 to $49,999 | 95 (0.6%) | 124 (1.0%) |
| $50,000 to $54,999 | 223 (1.3%) | 143 (1.1%) |
| $55,000 to $64,999 | 418 (2.5%) | 315 (2.5%) |
| $65,000 to $74,999 | 343 (2.0%) | 161 (1.3%) |
| $75,000 to $99,999 | 434 (2.5%) | 302 (2.4%) |
| $100,000+ | 1,523 (9.0%) | 521 (4.2%) |
| Total | 16,999 (100.0%) | 12,456 (100.0%) |
Earnings by Sex by Educational Attainment in West Lafayette
Average earnings in West Lafayette are $55,031 for men and $35,323 for women, a difference of 35.8%. Men with an educational attainment of graduate degree enjoy the highest average annual earnings of $81,689, while those with less than high school education earn the least with $31,458. Women with an educational attainment of graduate degree earn the most with the average annual earnings of $55,205, while those with bachelor's degree education have the smallest earnings of $26,101.
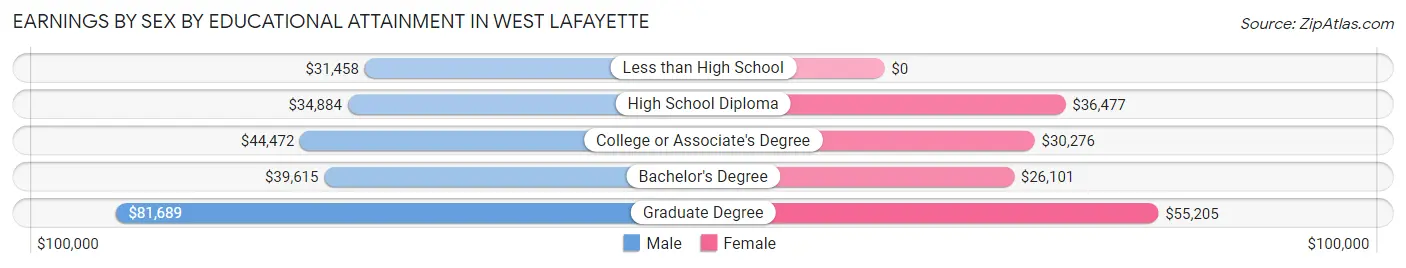
| Educational Attainment | Male Income | Female Income |
| Less than High School | $31,458 | $0 |
| High School Diploma | $34,884 | $36,477 |
| College or Associate's Degree | $44,472 | $30,276 |
| Bachelor's Degree | $39,615 | $26,101 |
| Graduate Degree | $81,689 | $55,205 |
| Total | $55,031 | $35,323 |
Family Income in West Lafayette
Family Income Brackets in West Lafayette
According to the West Lafayette family income data, there are 916 families falling into the $200,000+ income range, which is the most common income bracket and makes up 20.5% of all families. Conversely, the less than $10,000 income bracket is the least frequent group with only 94 families (2.1%) belonging to this category.
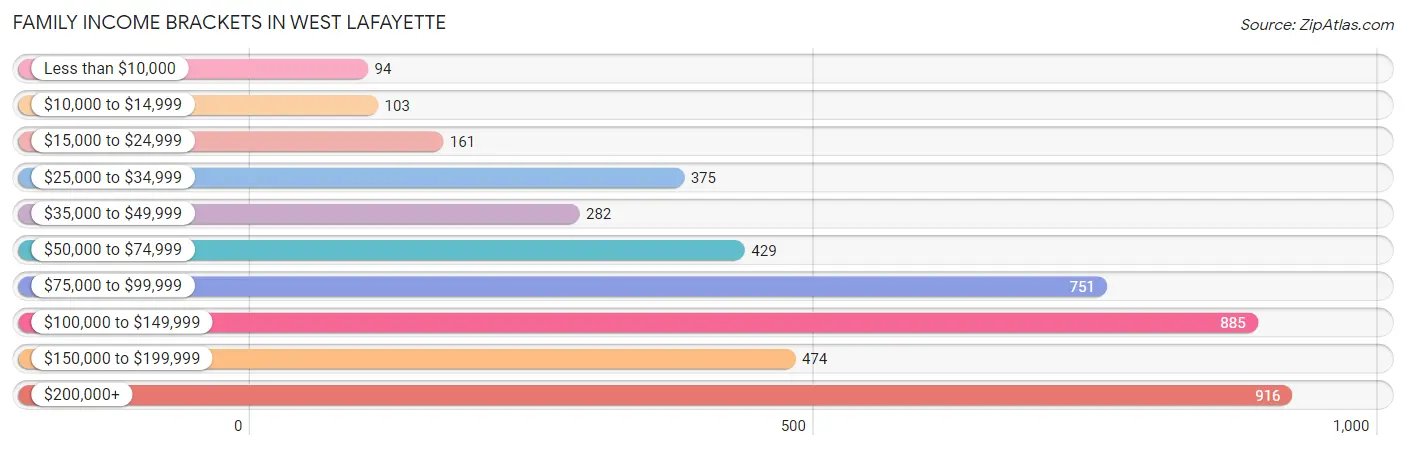
| Income Bracket | # Families | % Families |
| Less than $10,000 | 94 | 2.1% |
| $10,000 to $14,999 | 103 | 2.3% |
| $15,000 to $24,999 | 161 | 3.6% |
| $25,000 to $34,999 | 375 | 8.4% |
| $35,000 to $49,999 | 282 | 6.3% |
| $50,000 to $74,999 | 429 | 9.6% |
| $75,000 to $99,999 | 751 | 16.8% |
| $100,000 to $149,999 | 885 | 19.8% |
| $150,000 to $199,999 | 474 | 10.6% |
| $200,000+ | 916 | 20.5% |
Family Income by Famaliy Size in West Lafayette
6-person families (100 | 2.2%) account for the highest median family income in West Lafayette with $230,738 per family, while 2-person families (1,974 | 44.2%) have the highest median income of $42,778 per family member.
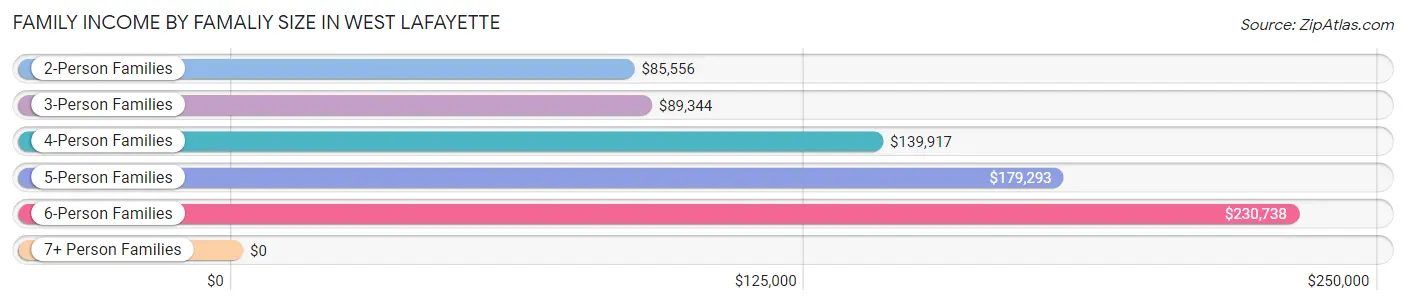
| Income Bracket | # Families | Median Income |
| 2-Person Families | 1,974 (44.2%) | $85,556 |
| 3-Person Families | 1,281 (28.7%) | $89,344 |
| 4-Person Families | 869 (19.4%) | $139,917 |
| 5-Person Families | 223 (5.0%) | $179,293 |
| 6-Person Families | 100 (2.2%) | $230,738 |
| 7+ Person Families | 23 (0.5%) | $0 |
| Total | 4,470 (100.0%) | $101,331 |
Family Income by Number of Earners in West Lafayette
The median family income in West Lafayette is $101,331, with families comprising 2 earners (2,261) having the highest median family income of $135,638, while families with no earners (629) have the lowest median family income of $49,135, accounting for 50.6% and 14.1% of families, respectively.
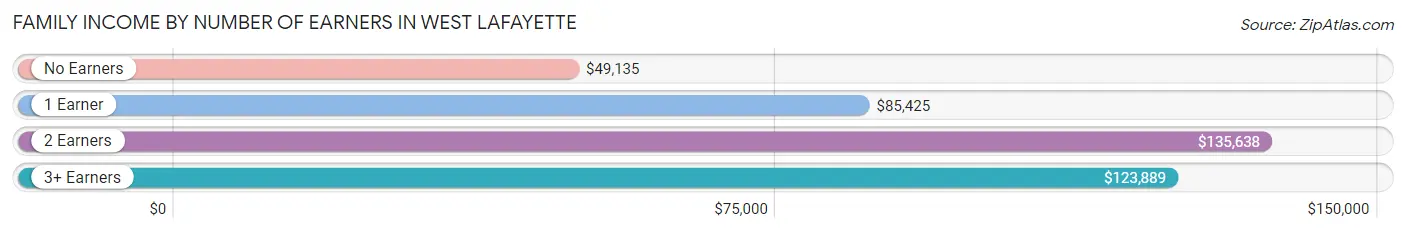
| Number of Earners | # Families | Median Income |
| No Earners | 629 (14.1%) | $49,135 |
| 1 Earner | 1,282 (28.7%) | $85,425 |
| 2 Earners | 2,261 (50.6%) | $135,638 |
| 3+ Earners | 298 (6.7%) | $123,889 |
| Total | 4,470 (100.0%) | $101,331 |
Household Income in West Lafayette
Household Income Brackets in West Lafayette
With 3,144 households falling in the category, the less than $10,000 income range is the most frequent in West Lafayette, accounting for 22.3% of all households. In contrast, only 620 households (4.4%) fall into the $150,000 to $199,999 income bracket, making it the least populous group.
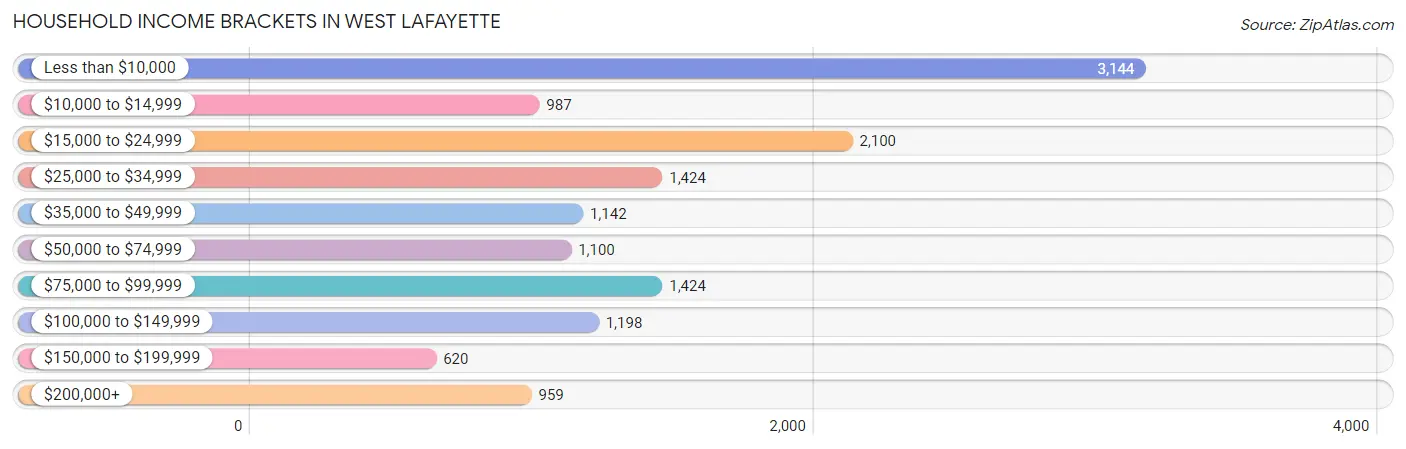
| Income Bracket | # Households | % Households |
| Less than $10,000 | 3,144 | 22.3% |
| $10,000 to $14,999 | 987 | 7.0% |
| $15,000 to $24,999 | 2,100 | 14.9% |
| $25,000 to $34,999 | 1,424 | 10.1% |
| $35,000 to $49,999 | 1,142 | 8.1% |
| $50,000 to $74,999 | 1,100 | 7.8% |
| $75,000 to $99,999 | 1,424 | 10.1% |
| $100,000 to $149,999 | 1,198 | 8.5% |
| $150,000 to $199,999 | 620 | 4.4% |
| $200,000+ | 959 | 6.8% |
Household Income by Householder Age in West Lafayette
The median household income in West Lafayette is $30,317, with the highest median household income of $104,821 found in the 45 to 64 years age bracket for the primary householder. A total of 2,114 households (15.0%) fall into this category. Meanwhile, the 15 to 24 years age bracket for the primary householder has the lowest median household income of $13,060, with 6,430 households (45.6%) in this group.
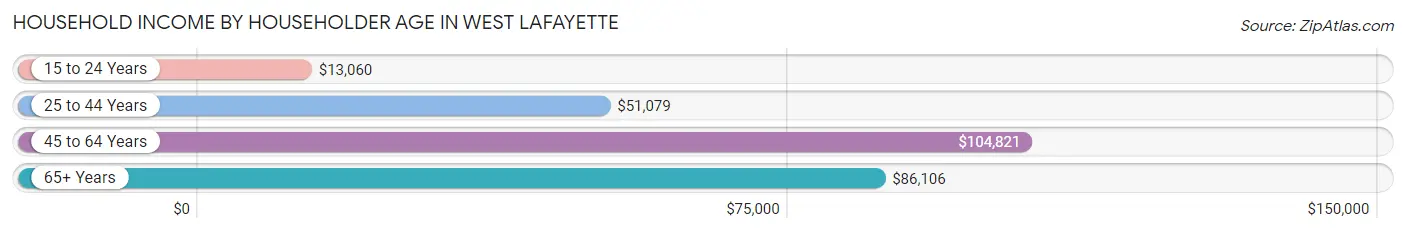
| Income Bracket | # Households | Median Income |
| 15 to 24 Years | 6,430 (45.6%) | $13,060 |
| 25 to 44 Years | 3,516 (24.9%) | $51,079 |
| 45 to 64 Years | 2,114 (15.0%) | $104,821 |
| 65+ Years | 2,037 (14.4%) | $86,106 |
| Total | 14,097 (100.0%) | $30,317 |
Poverty in West Lafayette
Income Below Poverty by Sex and Age in West Lafayette
With 42.4% poverty level for males and 35.1% for females among the residents of West Lafayette, 18 to 24 year old males and 18 to 24 year old females are the most vulnerable to poverty, with 6,149 males (71.4%) and 3,962 females (72.4%) in their respective age groups living below the poverty level.
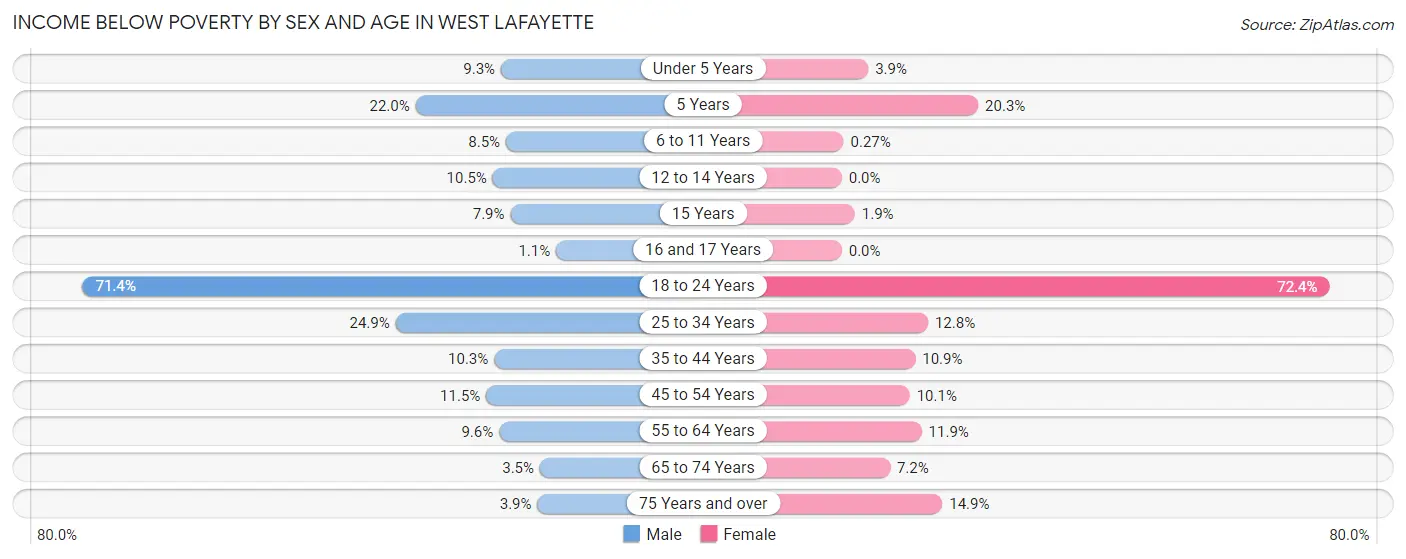
| Age Bracket | Male | Female |
| Under 5 Years | 43 (9.3%) | 13 (3.9%) |
| 5 Years | 9 (22.0%) | 32 (20.3%) |
| 6 to 11 Years | 44 (8.5%) | 2 (0.3%) |
| 12 to 14 Years | 36 (10.5%) | 0 (0.0%) |
| 15 Years | 10 (7.9%) | 2 (1.9%) |
| 16 and 17 Years | 3 (1.1%) | 0 (0.0%) |
| 18 to 24 Years | 6,149 (71.4%) | 3,962 (72.4%) |
| 25 to 34 Years | 573 (24.9%) | 188 (12.8%) |
| 35 to 44 Years | 113 (10.3%) | 115 (10.9%) |
| 45 to 54 Years | 114 (11.5%) | 109 (10.1%) |
| 55 to 64 Years | 88 (9.6%) | 107 (11.9%) |
| 65 to 74 Years | 26 (3.5%) | 55 (7.1%) |
| 75 Years and over | 24 (3.9%) | 136 (14.9%) |
| Total | 7,232 (42.4%) | 4,721 (35.1%) |
Income Above Poverty by Sex and Age in West Lafayette
According to the poverty statistics in West Lafayette, males aged 16 and 17 years and females aged 12 to 14 years are the age groups that are most secure financially, with 98.9% of males and 100.0% of females in these age groups living above the poverty line.
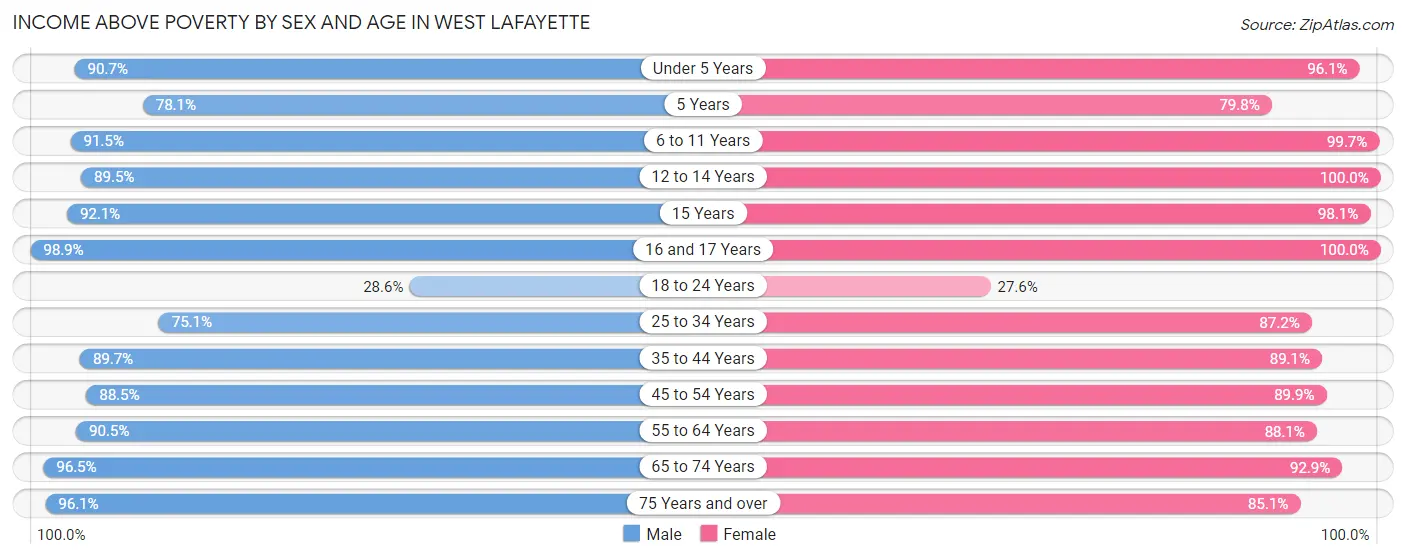
| Age Bracket | Male | Female |
| Under 5 Years | 421 (90.7%) | 319 (96.1%) |
| 5 Years | 32 (78.0%) | 126 (79.7%) |
| 6 to 11 Years | 472 (91.5%) | 748 (99.7%) |
| 12 to 14 Years | 307 (89.5%) | 319 (100.0%) |
| 15 Years | 117 (92.1%) | 101 (98.1%) |
| 16 and 17 Years | 274 (98.9%) | 125 (100.0%) |
| 18 to 24 Years | 2,464 (28.6%) | 1,511 (27.6%) |
| 25 to 34 Years | 1,726 (75.1%) | 1,281 (87.2%) |
| 35 to 44 Years | 986 (89.7%) | 939 (89.1%) |
| 45 to 54 Years | 881 (88.5%) | 971 (89.9%) |
| 55 to 64 Years | 833 (90.4%) | 795 (88.1%) |
| 65 to 74 Years | 719 (96.5%) | 714 (92.8%) |
| 75 Years and over | 598 (96.1%) | 775 (85.1%) |
| Total | 9,830 (57.6%) | 8,724 (64.9%) |
Income Below Poverty Among Married-Couple Families in West Lafayette
The poverty statistics for married-couple families in West Lafayette show that 4.7% or 176 of the total 3,773 families live below the poverty line. Families with 1 or 2 children have the highest poverty rate of 4.9%, comprising of 72 families. On the other hand, families with 5 or more children have the lowest poverty rate of 0.0%, which includes 0 families.
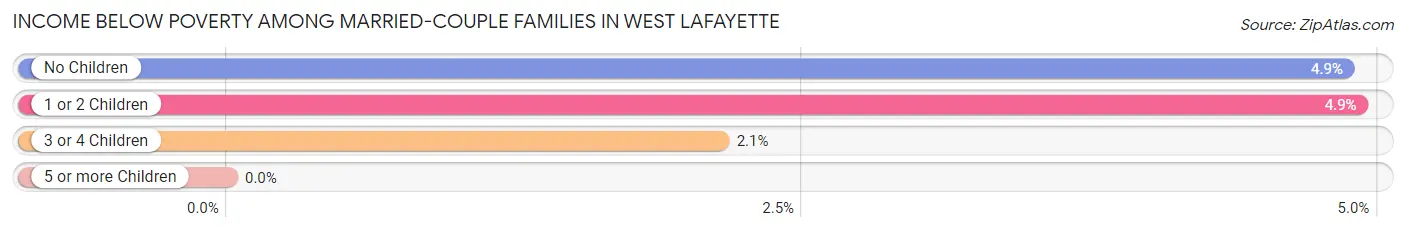
| Children | Above Poverty | Below Poverty |
| No Children | 1,919 (95.1%) | 98 (4.9%) |
| 1 or 2 Children | 1,392 (95.1%) | 72 (4.9%) |
| 3 or 4 Children | 275 (97.9%) | 6 (2.1%) |
| 5 or more Children | 11 (100.0%) | 0 (0.0%) |
| Total | 3,597 (95.3%) | 176 (4.7%) |
Income Below Poverty Among Single-Parent Households in West Lafayette
According to the poverty data in West Lafayette, 17.3% or 41 single-father households and 22.8% or 105 single-mother households are living below the poverty line. Among single-father households, those with no children have the highest poverty rate, with 41 households (42.3%) experiencing poverty. Likewise, among single-mother households, those with 3 or 4 children have the highest poverty rate, with 19 households (63.3%) falling below the poverty line.
| Children | Single Father | Single Mother |
| No Children | 41 (42.3%) | 66 (27.2%) |
| 1 or 2 Children | 0 (0.0%) | 20 (10.7%) |
| 3 or 4 Children | 0 (0.0%) | 19 (63.3%) |
| 5 or more Children | 0 (0.0%) | 0 (0.0%) |
| Total | 41 (17.3%) | 105 (22.8%) |
Income Below Poverty Among Married-Couple vs Single-Parent Households in West Lafayette
The poverty data for West Lafayette shows that 176 of the married-couple family households (4.7%) and 146 of the single-parent households (20.9%) are living below the poverty level. Within the married-couple family households, those with 1 or 2 children have the highest poverty rate, with 72 households (4.9%) falling below the poverty line. Among the single-parent households, those with 3 or 4 children have the highest poverty rate, with 19 household (35.2%) living below poverty.
| Children | Married-Couple Families | Single-Parent Households |
| No Children | 98 (4.9%) | 107 (31.5%) |
| 1 or 2 Children | 72 (4.9%) | 20 (6.6%) |
| 3 or 4 Children | 6 (2.1%) | 19 (35.2%) |
| 5 or more Children | 0 (0.0%) | 0 (0.0%) |
| Total | 176 (4.7%) | 146 (20.9%) |
Race in West Lafayette
The most populous races in West Lafayette are White / Caucasian (30,811 | 68.7%), Asian (9,465 | 21.1%), and Hispanic or Latino (2,179 | 4.9%).
| Race | # Population | % Population |
| Asian | 9,465 | 21.1% |
| Black / African American | 1,716 | 3.8% |
| Hawaiian / Pacific | 14 | 0.0% |
| Hispanic or Latino | 2,179 | 4.9% |
| Native / Alaskan | 100 | 0.2% |
| White / Caucasian | 30,811 | 68.7% |
| Two or more Races | 2,083 | 4.6% |
| Some other Race | 672 | 1.5% |
| Total | 44,861 | 100.0% |
Ancestry in West Lafayette
The most populous ancestries reported in West Lafayette are German (9,156 | 20.4%), Irish (4,342 | 9.7%), Thai (3,700 | 8.3%), Indian (Asian) (3,535 | 7.9%), and English (3,423 | 7.6%), together accounting for 53.8% of all West Lafayette residents.
| Ancestry | # Population | % Population |
| African | 142 | 0.3% |
| Albanian | 53 | 0.1% |
| Aleut | 7 | 0.0% |
| American | 1,113 | 2.5% |
| Arab | 509 | 1.1% |
| Argentinean | 75 | 0.2% |
| Armenian | 57 | 0.1% |
| Assyrian / Chaldean / Syriac | 2 | 0.0% |
| Australian | 27 | 0.1% |
| Austrian | 132 | 0.3% |
| Belgian | 43 | 0.1% |
| Bhutanese | 575 | 1.3% |
| Brazilian | 120 | 0.3% |
| British | 433 | 1.0% |
| Bulgarian | 9 | 0.0% |
| Burmese | 1,061 | 2.4% |
| Canadian | 19 | 0.0% |
| Celtic | 30 | 0.1% |
| Central American | 164 | 0.4% |
| Cherokee | 80 | 0.2% |
| Colombian | 329 | 0.7% |
| Costa Rican | 19 | 0.0% |
| Croatian | 129 | 0.3% |
| Cuban | 130 | 0.3% |
| Czech | 304 | 0.7% |
| Czechoslovakian | 46 | 0.1% |
| Danish | 96 | 0.2% |
| Dominican | 10 | 0.0% |
| Dutch | 754 | 1.7% |
| Eastern European | 94 | 0.2% |
| Ecuadorian | 91 | 0.2% |
| Egyptian | 283 | 0.6% |
| English | 3,423 | 7.6% |
| Estonian | 20 | 0.0% |
| Ethiopian | 56 | 0.1% |
| European | 1,129 | 2.5% |
| Filipino | 267 | 0.6% |
| Finnish | 60 | 0.1% |
| French | 723 | 1.6% |
| French Canadian | 127 | 0.3% |
| German | 9,156 | 20.4% |
| German Russian | 13 | 0.0% |
| Ghanaian | 100 | 0.2% |
| Greek | 273 | 0.6% |
| Guatemalan | 37 | 0.1% |
| Haitian | 15 | 0.0% |
| Honduran | 30 | 0.1% |
| Hungarian | 131 | 0.3% |
| Icelander | 10 | 0.0% |
| Indian (Asian) | 3,535 | 7.9% |
| Indonesian | 16 | 0.0% |
| Iranian | 111 | 0.3% |
| Irish | 4,342 | 9.7% |
| Iroquois | 2 | 0.0% |
| Israeli | 8 | 0.0% |
| Italian | 2,149 | 4.8% |
| Jamaican | 55 | 0.1% |
| Jordanian | 20 | 0.0% |
| Kenyan | 139 | 0.3% |
| Korean | 223 | 0.5% |
| Laotian | 81 | 0.2% |
| Lebanese | 56 | 0.1% |
| Lithuanian | 149 | 0.3% |
| Macedonian | 39 | 0.1% |
| Malaysian | 2 | 0.0% |
| Maltese | 8 | 0.0% |
| Mexican | 568 | 1.3% |
| Mexican American Indian | 8 | 0.0% |
| Mongolian | 35 | 0.1% |
| Moroccan | 27 | 0.1% |
| Native Hawaiian | 21 | 0.1% |
| Nicaraguan | 33 | 0.1% |
| Nigerian | 330 | 0.7% |
| Northern European | 5 | 0.0% |
| Norwegian | 373 | 0.8% |
| Okinawan | 16 | 0.0% |
| Pakistani | 147 | 0.3% |
| Palestinian | 40 | 0.1% |
| Panamanian | 37 | 0.1% |
| Peruvian | 108 | 0.2% |
| Polish | 1,964 | 4.4% |
| Portuguese | 214 | 0.5% |
| Puerto Rican | 316 | 0.7% |
| Romanian | 107 | 0.2% |
| Russian | 304 | 0.7% |
| Salvadoran | 8 | 0.0% |
| Samoan | 7 | 0.0% |
| Scandinavian | 67 | 0.2% |
| Scotch-Irish | 280 | 0.6% |
| Scottish | 1,290 | 2.9% |
| Serbian | 59 | 0.1% |
| Slavic | 27 | 0.1% |
| Slovak | 253 | 0.6% |
| South American | 699 | 1.6% |
| South American Indian | 32 | 0.1% |
| Spaniard | 169 | 0.4% |
| Spanish | 32 | 0.1% |
| Sri Lankan | 355 | 0.8% |
| Subsaharan African | 832 | 1.8% |
| Swedish | 569 | 1.3% |
| Swiss | 271 | 0.6% |
| Syrian | 31 | 0.1% |
| Thai | 3,700 | 8.3% |
| Turkish | 183 | 0.4% |
| Ukrainian | 69 | 0.2% |
| Uruguayan | 20 | 0.0% |
| Venezuelan | 76 | 0.2% |
| Vietnamese | 16 | 0.0% |
| Welsh | 293 | 0.6% |
| Yugoslavian | 34 | 0.1% |
| Zimbabwean | 57 | 0.1% | View All 111 Rows |
Immigrants in West Lafayette
The most numerous immigrant groups reported in West Lafayette came from Asia (7,399 | 16.5%), Eastern Asia (3,547 | 7.9%), South Central Asia (2,992 | 6.7%), China (2,713 | 6.0%), and India (2,545 | 5.7%), together accounting for 42.8% of all West Lafayette residents.
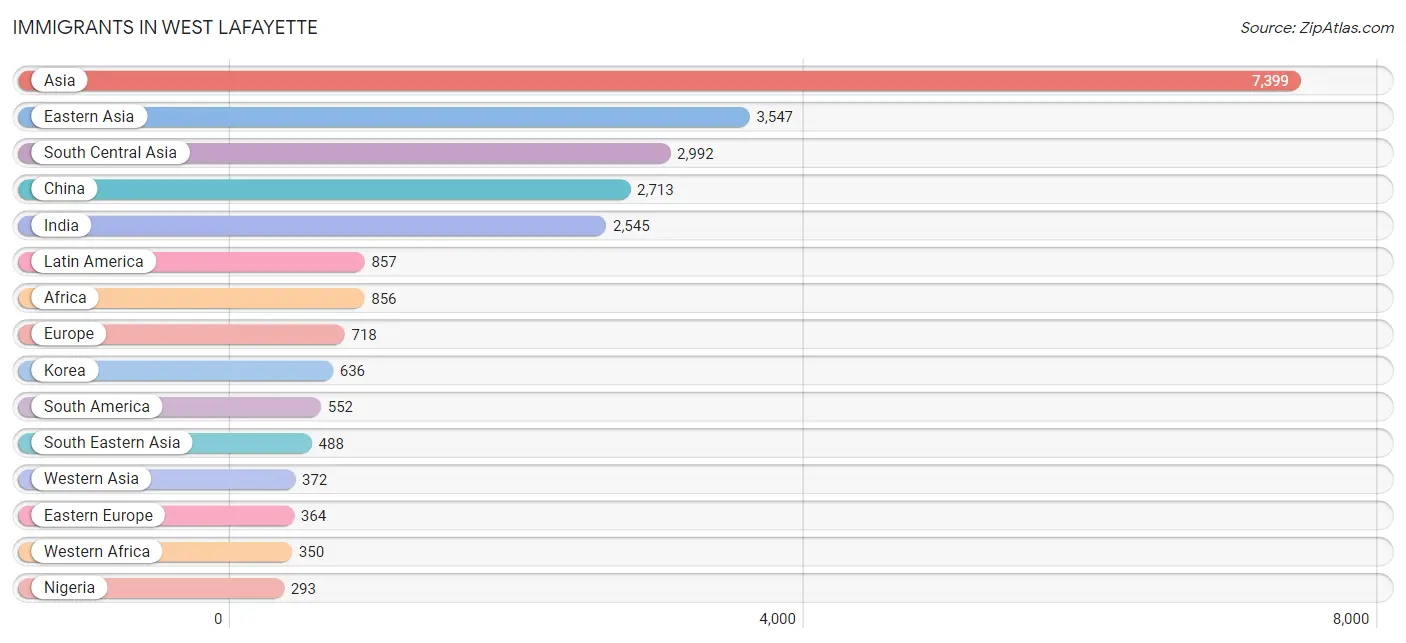
| Immigration Origin | # Population | % Population |
| Africa | 856 | 1.9% |
| Argentina | 60 | 0.1% |
| Armenia | 22 | 0.1% |
| Asia | 7,399 | 16.5% |
| Australia | 89 | 0.2% |
| Austria | 3 | 0.0% |
| Bangladesh | 90 | 0.2% |
| Belarus | 5 | 0.0% |
| Brazil | 143 | 0.3% |
| Cambodia | 15 | 0.0% |
| Canada | 156 | 0.4% |
| Caribbean | 37 | 0.1% |
| Central America | 268 | 0.6% |
| Chile | 8 | 0.0% |
| China | 2,713 | 6.0% |
| Colombia | 247 | 0.5% |
| Costa Rica | 30 | 0.1% |
| Eastern Africa | 214 | 0.5% |
| Eastern Asia | 3,547 | 7.9% |
| Eastern Europe | 364 | 0.8% |
| Ecuador | 29 | 0.1% |
| Egypt | 234 | 0.5% |
| England | 5 | 0.0% |
| Ethiopia | 10 | 0.0% |
| Europe | 718 | 1.6% |
| France | 11 | 0.0% |
| Germany | 62 | 0.1% |
| Ghana | 57 | 0.1% |
| Greece | 28 | 0.1% |
| Guatemala | 15 | 0.0% |
| Honduras | 43 | 0.1% |
| Hong Kong | 51 | 0.1% |
| India | 2,545 | 5.7% |
| Indonesia | 85 | 0.2% |
| Iran | 64 | 0.1% |
| Italy | 23 | 0.1% |
| Jamaica | 29 | 0.1% |
| Japan | 198 | 0.4% |
| Kazakhstan | 8 | 0.0% |
| Kenya | 173 | 0.4% |
| Korea | 636 | 1.4% |
| Kuwait | 52 | 0.1% |
| Latin America | 857 | 1.9% |
| Lithuania | 40 | 0.1% |
| Malaysia | 56 | 0.1% |
| Mexico | 136 | 0.3% |
| Nepal | 46 | 0.1% |
| Netherlands | 19 | 0.0% |
| Nigeria | 293 | 0.6% |
| Northern Africa | 234 | 0.5% |
| Northern Europe | 145 | 0.3% |
| Oceania | 106 | 0.2% |
| Pakistan | 164 | 0.4% |
| Panama | 44 | 0.1% |
| Peru | 65 | 0.1% |
| Philippines | 22 | 0.1% |
| Poland | 29 | 0.1% |
| Portugal | 20 | 0.0% |
| Romania | 16 | 0.0% |
| Russia | 274 | 0.6% |
| Saudi Arabia | 63 | 0.1% |
| Scotland | 28 | 0.1% |
| Singapore | 31 | 0.1% |
| South Africa | 13 | 0.0% |
| South America | 552 | 1.2% |
| South Central Asia | 2,992 | 6.7% |
| South Eastern Asia | 488 | 1.1% |
| Southern Europe | 83 | 0.2% |
| Spain | 12 | 0.0% |
| Sri Lanka | 19 | 0.0% |
| Sweden | 28 | 0.1% |
| Switzerland | 31 | 0.1% |
| Syria | 17 | 0.0% |
| Taiwan | 243 | 0.5% |
| Thailand | 156 | 0.4% |
| Trinidad and Tobago | 8 | 0.0% |
| Turkey | 168 | 0.4% |
| Vietnam | 103 | 0.2% |
| Western Africa | 350 | 0.8% |
| Western Asia | 372 | 0.8% |
| Western Europe | 126 | 0.3% |
| Zimbabwe | 20 | 0.0% | View All 82 Rows |
Sex and Age in West Lafayette
Sex and Age in West Lafayette
The most populous age groups in West Lafayette are 20 to 24 Years (9,962 | 40.1%) for men and 20 to 24 Years (6,873 | 34.3%) for women.
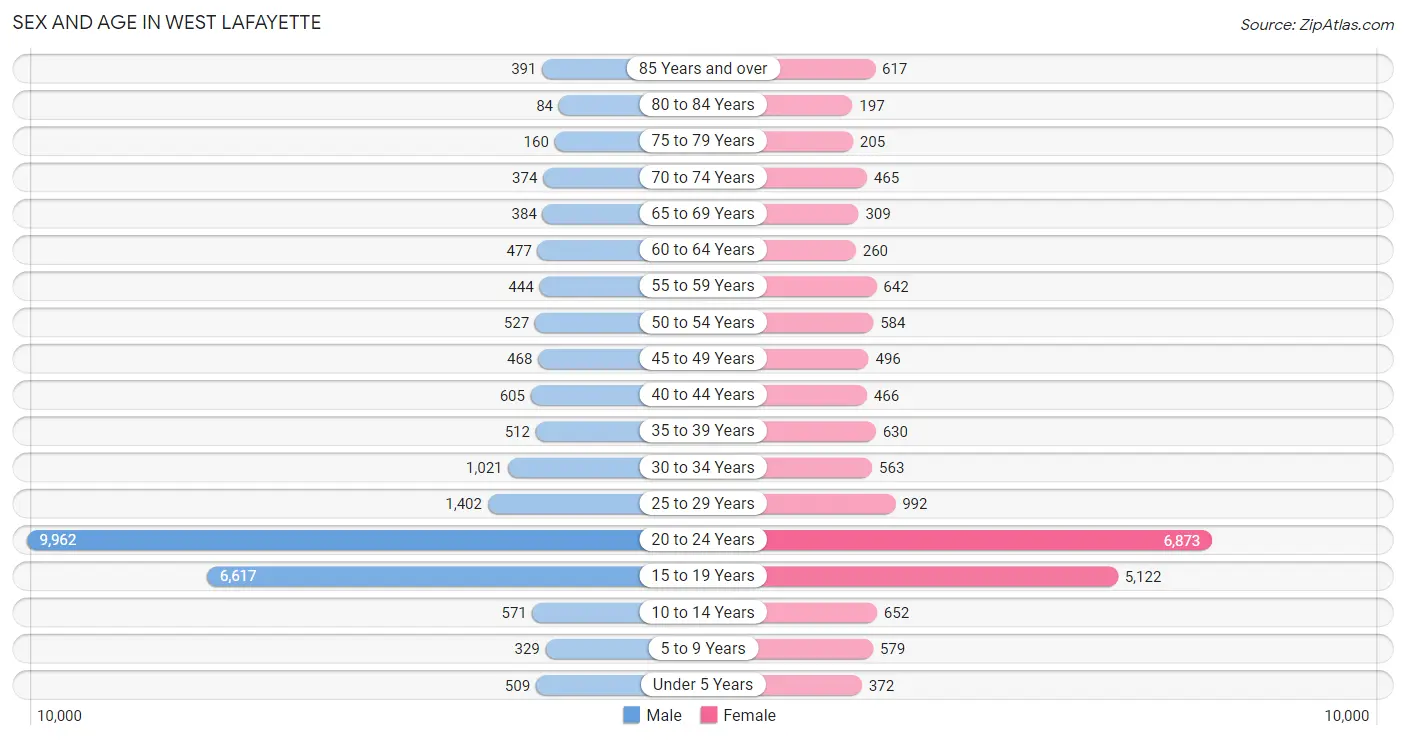
| Age Bracket | Male | Female |
| Under 5 Years | 509 (2.1%) | 372 (1.9%) |
| 5 to 9 Years | 329 (1.3%) | 579 (2.9%) |
| 10 to 14 Years | 571 (2.3%) | 652 (3.3%) |
| 15 to 19 Years | 6,617 (26.6%) | 5,122 (25.6%) |
| 20 to 24 Years | 9,962 (40.1%) | 6,873 (34.3%) |
| 25 to 29 Years | 1,402 (5.6%) | 992 (5.0%) |
| 30 to 34 Years | 1,021 (4.1%) | 563 (2.8%) |
| 35 to 39 Years | 512 (2.1%) | 630 (3.2%) |
| 40 to 44 Years | 605 (2.4%) | 466 (2.3%) |
| 45 to 49 Years | 468 (1.9%) | 496 (2.5%) |
| 50 to 54 Years | 527 (2.1%) | 584 (2.9%) |
| 55 to 59 Years | 444 (1.8%) | 642 (3.2%) |
| 60 to 64 Years | 477 (1.9%) | 260 (1.3%) |
| 65 to 69 Years | 384 (1.5%) | 309 (1.5%) |
| 70 to 74 Years | 374 (1.5%) | 465 (2.3%) |
| 75 to 79 Years | 160 (0.6%) | 205 (1.0%) |
| 80 to 84 Years | 84 (0.3%) | 197 (1.0%) |
| 85 Years and over | 391 (1.6%) | 617 (3.1%) |
| Total | 24,837 (100.0%) | 20,024 (100.0%) |
Families and Households in West Lafayette
Median Family Size in West Lafayette
The median family size in West Lafayette is 2.97 persons per family, with married-couple families (3,773 | 84.4%) accounting for the largest median family size of 3.07 persons per family. On the other hand, single female/mother families (460 | 10.3%) represent the smallest median family size with 2.26 persons per family.
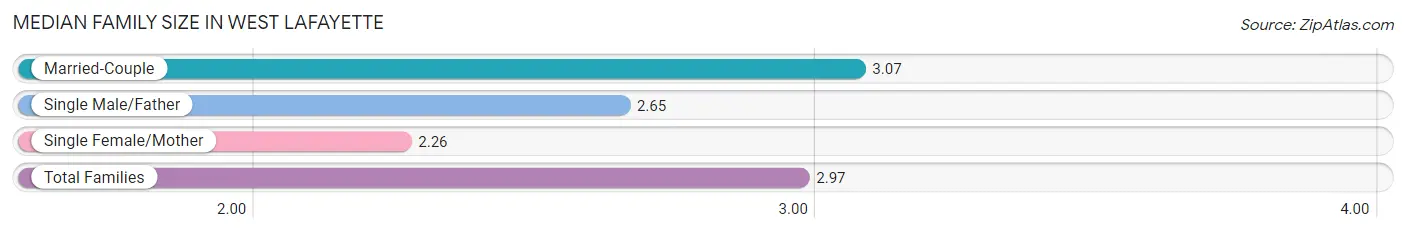
| Family Type | # Families | Family Size |
| Married-Couple | 3,773 (84.4%) | 3.07 |
| Single Male/Father | 237 (5.3%) | 2.65 |
| Single Female/Mother | 460 (10.3%) | 2.26 |
| Total Families | 4,470 (100.0%) | 2.97 |
Median Household Size in West Lafayette
The median household size in West Lafayette is 2.16 persons per household, with single male/father households (237 | 1.7%) accounting for the largest median household size of 3.15 persons per household. non-family households (9,627 | 68.3%) represent the smallest median household size with 1.75 persons per household.
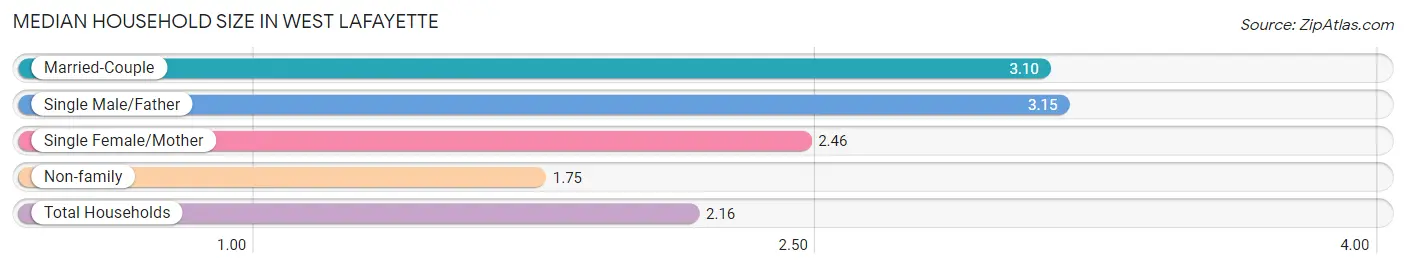
| Household Type | # Households | Household Size |
| Married-Couple | 3,773 (26.8%) | 3.10 |
| Single Male/Father | 237 (1.7%) | 3.15 |
| Single Female/Mother | 460 (3.3%) | 2.46 |
| Non-family | 9,627 (68.3%) | 1.75 |
| Total Households | 14,097 (100.0%) | 2.16 |
Household Size by Marriage Status in West Lafayette
Out of a total of 14,097 households in West Lafayette, 4,470 (31.7%) are family households, while 9,627 (68.3%) are nonfamily households. The most numerous type of family households are 2-person households, comprising 1,856, and the most common type of nonfamily households are 1-person households, comprising 5,440.
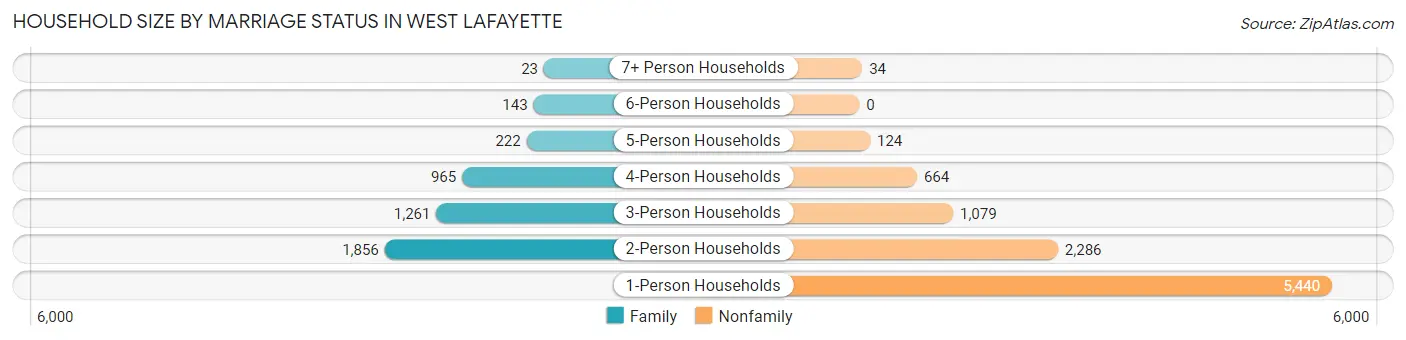
| Household Size | Family Households | Nonfamily Households |
| 1-Person Households | - | 5,440 (38.6%) |
| 2-Person Households | 1,856 (13.2%) | 2,286 (16.2%) |
| 3-Person Households | 1,261 (8.9%) | 1,079 (7.6%) |
| 4-Person Households | 965 (6.9%) | 664 (4.7%) |
| 5-Person Households | 222 (1.6%) | 124 (0.9%) |
| 6-Person Households | 143 (1.0%) | 0 (0.0%) |
| 7+ Person Households | 23 (0.2%) | 34 (0.2%) |
| Total | 4,470 (31.7%) | 9,627 (68.3%) |
Female Fertility in West Lafayette
Fertility by Age in West Lafayette
Average fertility rate in West Lafayette is 9.0 births per 1,000 women. Women in the age bracket of 35 to 50 years have the highest fertility rate with 29.0 births per 1,000 women. Women in the age bracket of 20 to 34 years acount for 62.3% of all women with births.
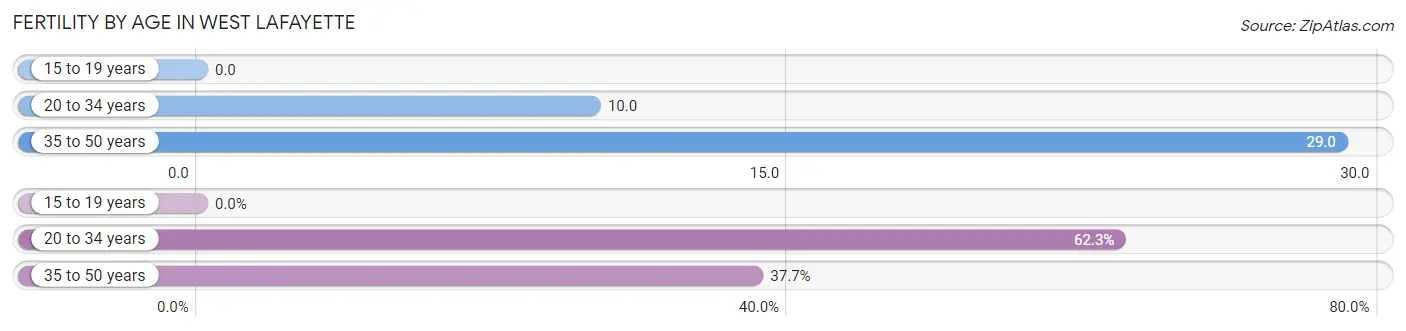
| Age Bracket | Women with Births | Births / 1,000 Women |
| 15 to 19 years | 0 (0.0%) | 0.0 |
| 20 to 34 years | 81 (62.3%) | 10.0 |
| 35 to 50 years | 49 (37.7%) | 29.0 |
| Total | 130 (100.0%) | 9.0 |
Fertility by Age by Marriage Status in West Lafayette
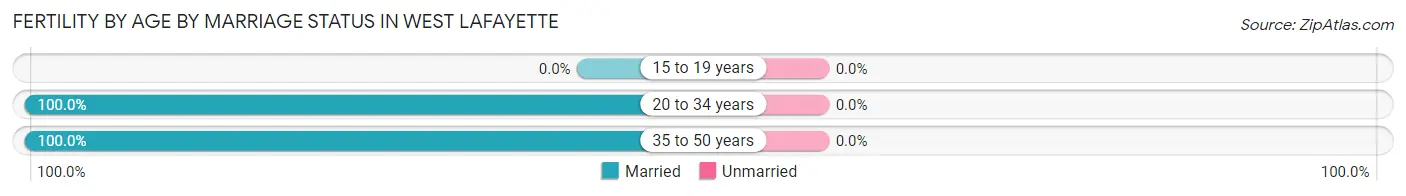
| Age Bracket | Married | Unmarried |
| 15 to 19 years | 0 (0.0%) | 0 (0.0%) |
| 20 to 34 years | 81 (100.0%) | 0 (0.0%) |
| 35 to 50 years | 49 (100.0%) | 0 (0.0%) |
| Total | 130 (100.0%) | 0 (0.0%) |
Fertility by Education in West Lafayette
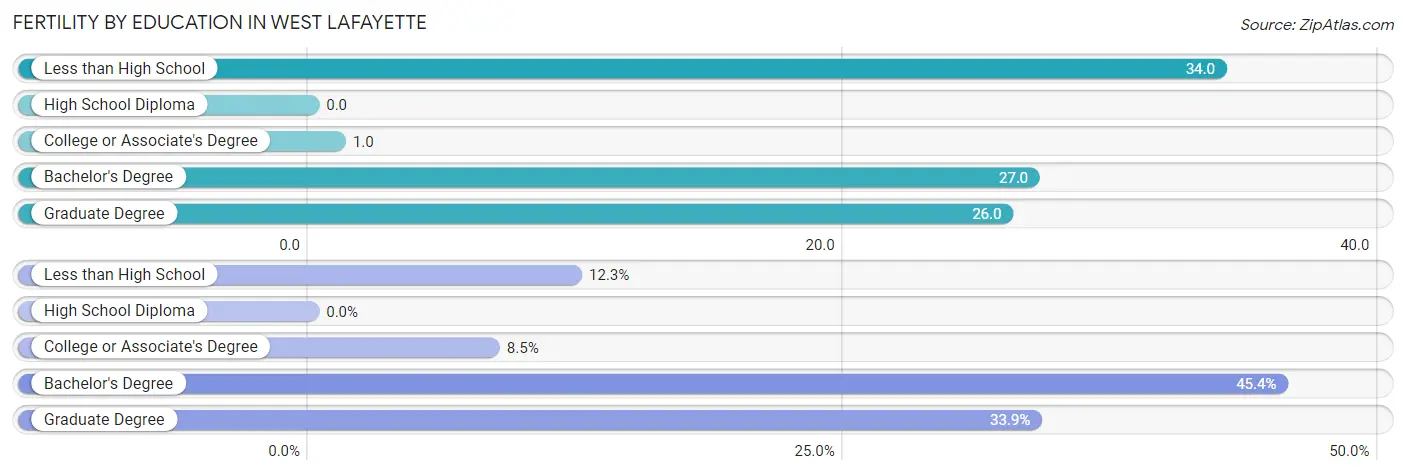
| Educational Attainment | Women with Births | Births / 1,000 Women |
| Less than High School | 16 (12.3%) | 34.0 |
| High School Diploma | 0 (0.0%) | 0.0 |
| College or Associate's Degree | 11 (8.5%) | 1.0 |
| Bachelor's Degree | 59 (45.4%) | 27.0 |
| Graduate Degree | 44 (33.9%) | 26.0 |
| Total | 130 (100.0%) | 9.0 |
Fertility by Education by Marriage Status in West Lafayette
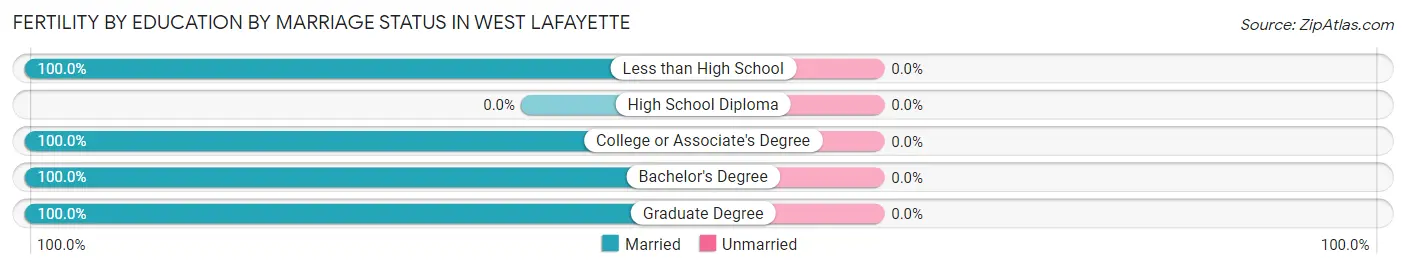
| Educational Attainment | Married | Unmarried |
| Less than High School | 16 (100.0%) | 0 (0.0%) |
| High School Diploma | 0 (0.0%) | 0 (0.0%) |
| College or Associate's Degree | 11 (100.0%) | 0 (0.0%) |
| Bachelor's Degree | 59 (100.0%) | 0 (0.0%) |
| Graduate Degree | 44 (100.0%) | 0 (0.0%) |
| Total | 130 (100.0%) | 0 (0.0%) |
Employment Characteristics in West Lafayette
Employment by Class of Employer in West Lafayette
Among the 18,216 employed individuals in West Lafayette, private company employees (9,438 | 51.8%), state government employees (5,033 | 27.6%), and not-for-profit organizations (2,107 | 11.6%) make up the most common classes of employment.
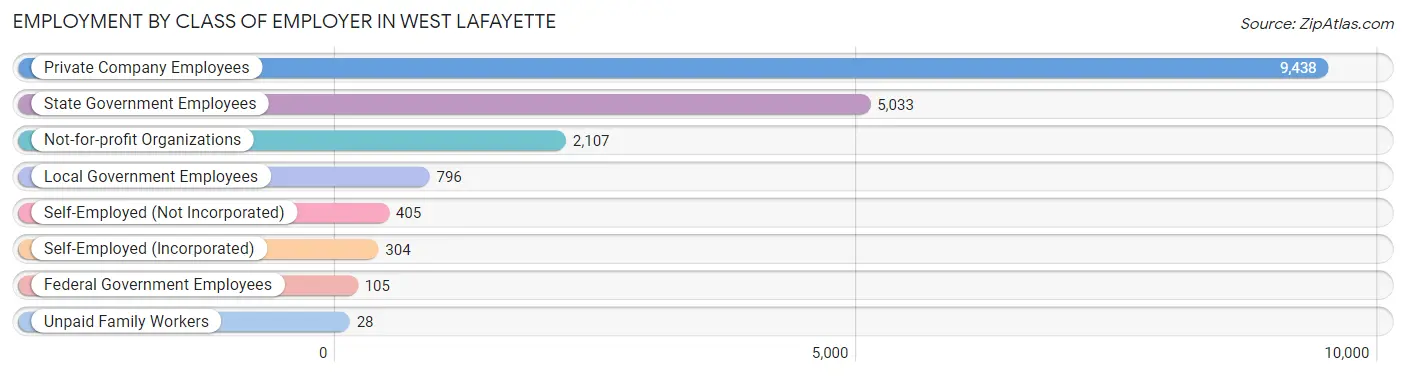
| Employer Class | # Employees | % Employees |
| Private Company Employees | 9,438 | 51.8% |
| Self-Employed (Incorporated) | 304 | 1.7% |
| Self-Employed (Not Incorporated) | 405 | 2.2% |
| Not-for-profit Organizations | 2,107 | 11.6% |
| Local Government Employees | 796 | 4.4% |
| State Government Employees | 5,033 | 27.6% |
| Federal Government Employees | 105 | 0.6% |
| Unpaid Family Workers | 28 | 0.2% |
| Total | 18,216 | 100.0% |
Employment Status by Age in West Lafayette
According to the labor force statistics for West Lafayette, out of the total population over 16 years of age (41,619), 49.3% or 20,518 individuals are in the labor force, with 3.3% or 677 of them unemployed. The age group with the highest labor force participation rate is 35 to 44 years, with 81.9% or 1,812 individuals in the labor force. Within the labor force, the 16 to 19 years age range has the highest percentage of unemployed individuals, with 7.3% or 276 of them being unemployed.
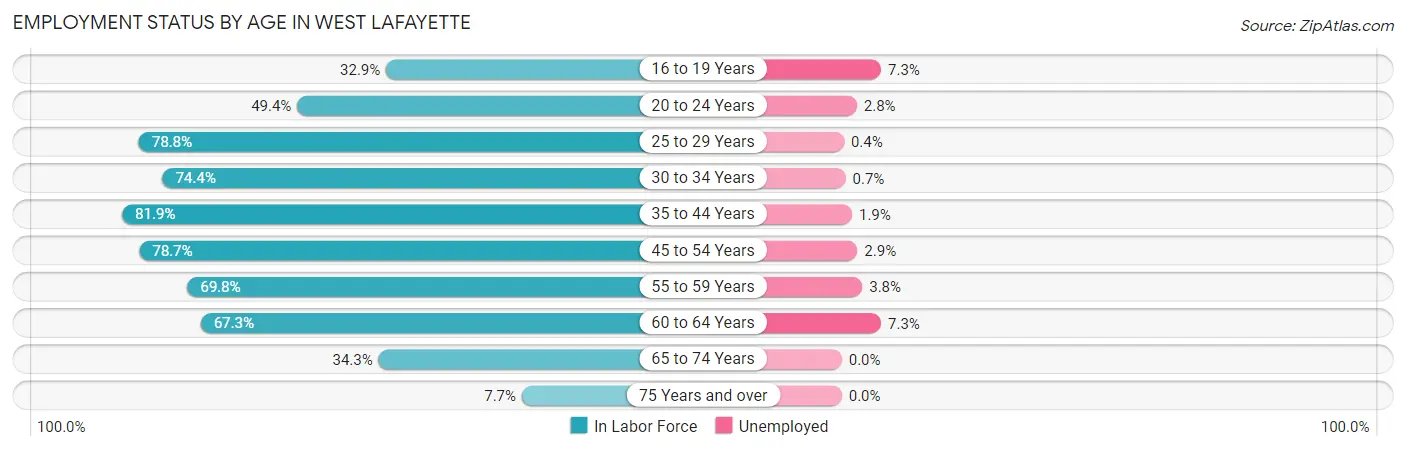
| Age Bracket | In Labor Force | Unemployed |
| 16 to 19 Years | 3,786 (32.9%) | 276 (7.3%) |
| 20 to 24 Years | 8,316 (49.4%) | 233 (2.8%) |
| 25 to 29 Years | 1,886 (78.8%) | 8 (0.4%) |
| 30 to 34 Years | 1,178 (74.4%) | 8 (0.7%) |
| 35 to 44 Years | 1,812 (81.9%) | 34 (1.9%) |
| 45 to 54 Years | 1,633 (78.7%) | 47 (2.9%) |
| 55 to 59 Years | 758 (69.8%) | 29 (3.8%) |
| 60 to 64 Years | 496 (67.3%) | 36 (7.3%) |
| 65 to 74 Years | 525 (34.3%) | 0 (0.0%) |
| 75 Years and over | 127 (7.7%) | 0 (0.0%) |
| Total | 20,518 (49.3%) | 677 (3.3%) |
Employment Status by Educational Attainment in West Lafayette
According to labor force statistics for West Lafayette, 77.0% of individuals (7,769) out of the total population between 25 and 64 years of age (10,089) are in the labor force, with 2.1% or 163 of them being unemployed. The group with the highest labor force participation rate are those with the educational attainment of bachelor's degree or higher, with 82.4% or 6,290 individuals in the labor force. Within the labor force, individuals with less than high school education have the highest percentage of unemployment, with 5.6% or 8 of them being unemployed.
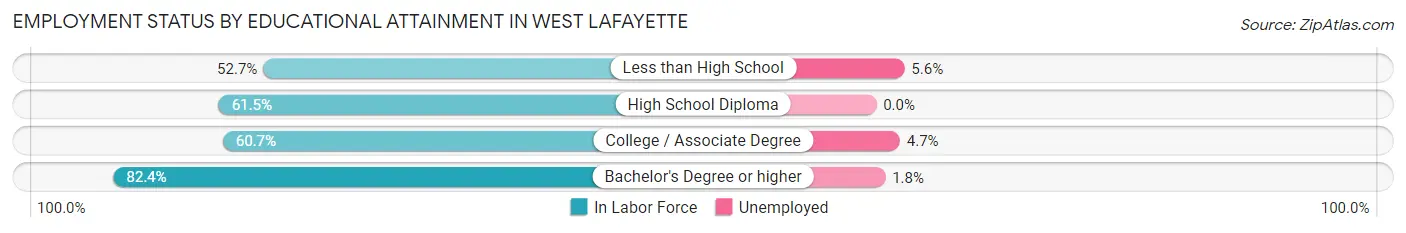
| Educational Attainment | In Labor Force | Unemployed |
| Less than High School | 144 (52.7%) | 15 (5.6%) |
| High School Diploma | 375 (61.5%) | 0 (0.0%) |
| College / Associate Degree | 954 (60.7%) | 74 (4.7%) |
| Bachelor's Degree or higher | 6,290 (82.4%) | 137 (1.8%) |
| Total | 7,769 (77.0%) | 212 (2.1%) |
Employment Occupations by Sex in West Lafayette
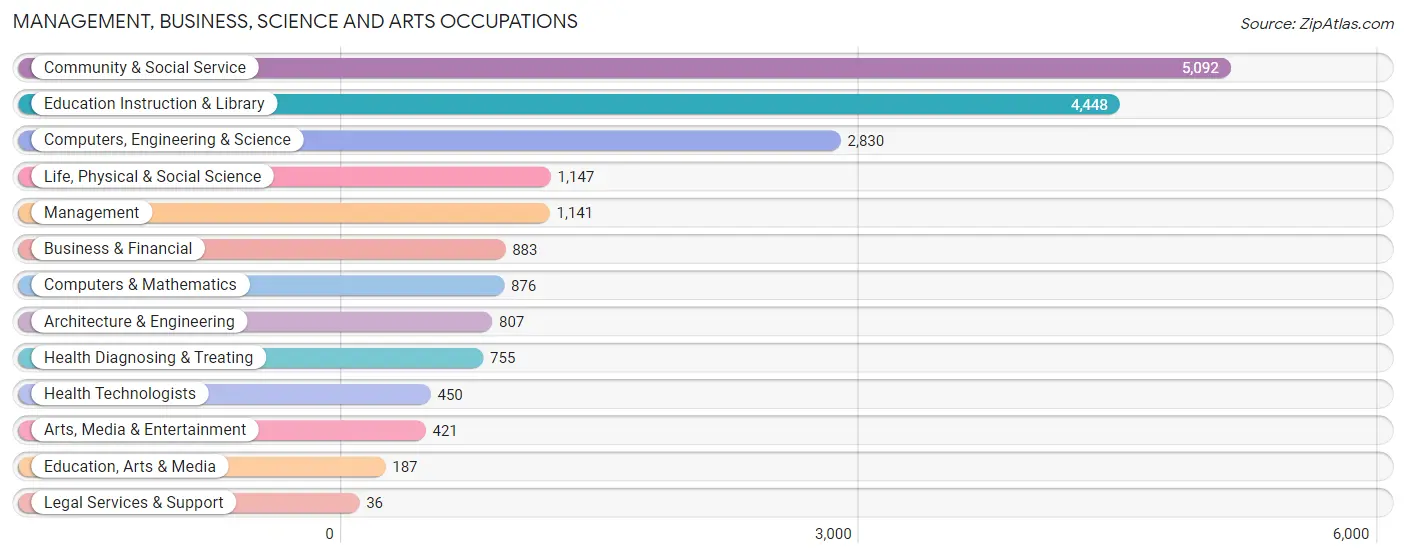
Management, Business, Science and Arts Occupations
The most common Management, Business, Science and Arts occupations in West Lafayette are Community & Social Service (5,092 | 25.7%), Education Instruction & Library (4,448 | 22.4%), Computers, Engineering & Science (2,830 | 14.3%), Life, Physical & Social Science (1,147 | 5.8%), and Management (1,141 | 5.8%).
Management, Business, Science and Arts Occupations by Sex
Within the Management, Business, Science and Arts occupations in West Lafayette, the most male-oriented occupations are Architecture & Engineering (85.1%), Computers, Engineering & Science (77.8%), and Life, Physical & Social Science (76.6%), while the most female-oriented occupations are Legal Services & Support (100.0%), Education, Arts & Media (80.7%), and Arts, Media & Entertainment (61.5%).
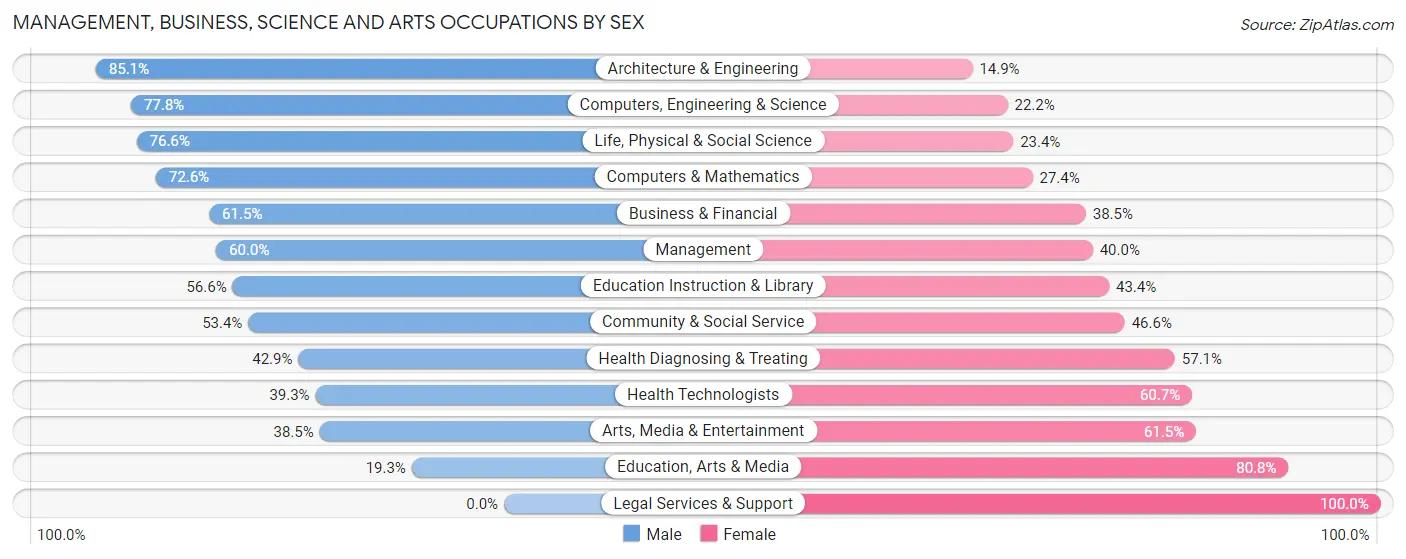
| Occupation | Male | Female |
| Management | 685 (60.0%) | 456 (40.0%) |
| Business & Financial | 543 (61.5%) | 340 (38.5%) |
| Computers, Engineering & Science | 2,202 (77.8%) | 628 (22.2%) |
| Computers & Mathematics | 636 (72.6%) | 240 (27.4%) |
| Architecture & Engineering | 687 (85.1%) | 120 (14.9%) |
| Life, Physical & Social Science | 879 (76.6%) | 268 (23.4%) |
| Community & Social Service | 2,717 (53.4%) | 2,375 (46.6%) |
| Education, Arts & Media | 36 (19.3%) | 151 (80.7%) |
| Legal Services & Support | 0 (0.0%) | 36 (100.0%) |
| Education Instruction & Library | 2,519 (56.6%) | 1,929 (43.4%) |
| Arts, Media & Entertainment | 162 (38.5%) | 259 (61.5%) |
| Health Diagnosing & Treating | 324 (42.9%) | 431 (57.1%) |
| Health Technologists | 177 (39.3%) | 273 (60.7%) |
| Total (Category) | 6,471 (60.5%) | 4,230 (39.5%) |
| Total (Overall) | 11,250 (56.8%) | 8,575 (43.2%) |
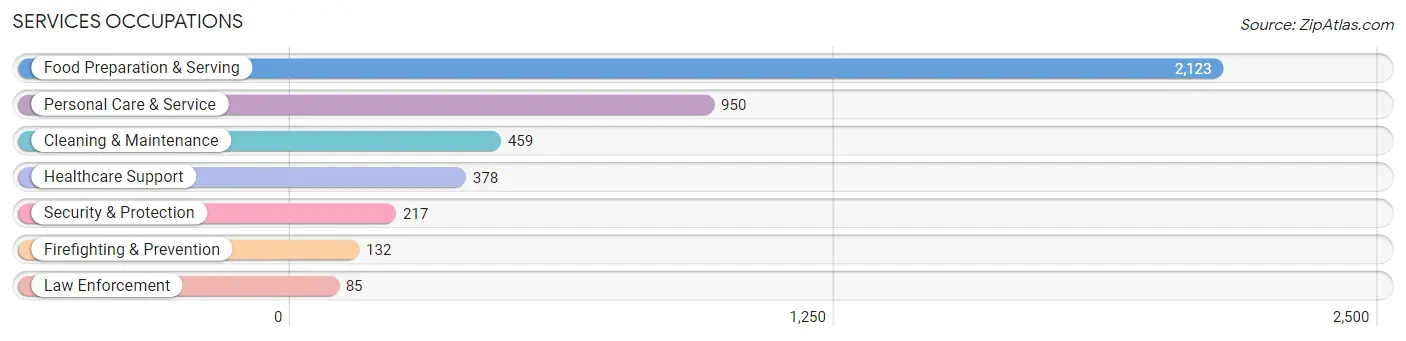
Services Occupations
The most common Services occupations in West Lafayette are Food Preparation & Serving (2,123 | 10.7%), Personal Care & Service (950 | 4.8%), Cleaning & Maintenance (459 | 2.3%), Healthcare Support (378 | 1.9%), and Security & Protection (217 | 1.1%).
Services Occupations by Sex
Within the Services occupations in West Lafayette, the most male-oriented occupations are Law Enforcement (72.9%), Cleaning & Maintenance (69.7%), and Security & Protection (52.1%), while the most female-oriented occupations are Healthcare Support (76.7%), Firefighting & Prevention (61.4%), and Food Preparation & Serving (57.8%).
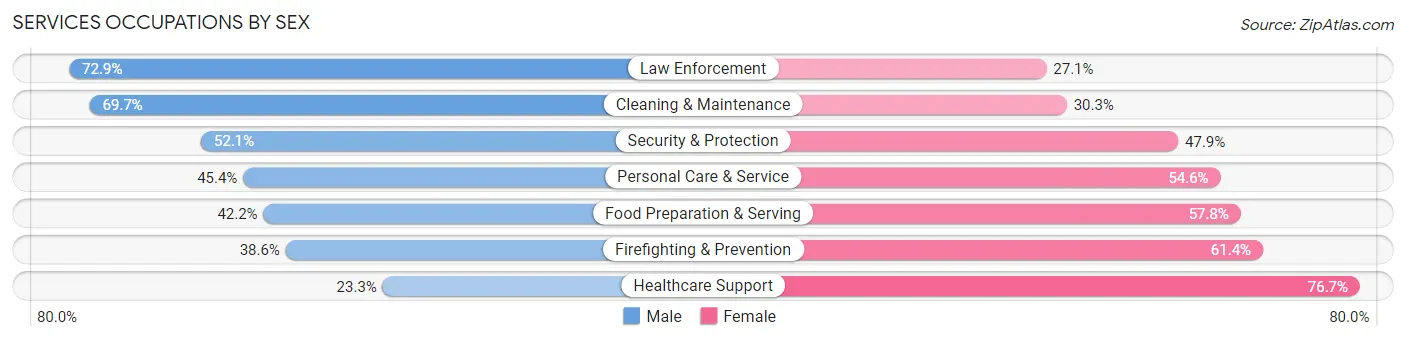
| Occupation | Male | Female |
| Healthcare Support | 88 (23.3%) | 290 (76.7%) |
| Security & Protection | 113 (52.1%) | 104 (47.9%) |
| Firefighting & Prevention | 51 (38.6%) | 81 (61.4%) |
| Law Enforcement | 62 (72.9%) | 23 (27.1%) |
| Food Preparation & Serving | 895 (42.2%) | 1,228 (57.8%) |
| Cleaning & Maintenance | 320 (69.7%) | 139 (30.3%) |
| Personal Care & Service | 431 (45.4%) | 519 (54.6%) |
| Total (Category) | 1,847 (44.8%) | 2,280 (55.2%) |
| Total (Overall) | 11,250 (56.8%) | 8,575 (43.2%) |
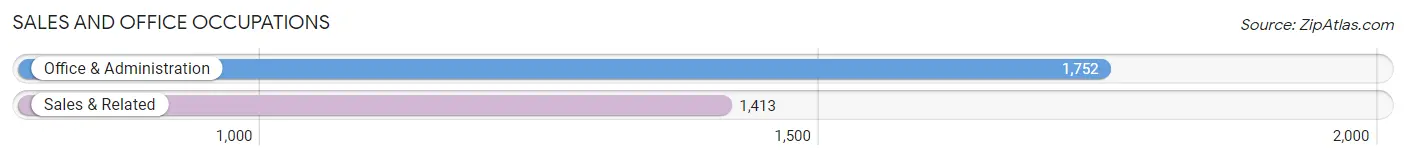
Sales and Office Occupations
The most common Sales and Office occupations in West Lafayette are Office & Administration (1,752 | 8.8%), and Sales & Related (1,413 | 7.1%).
Sales and Office Occupations by Sex
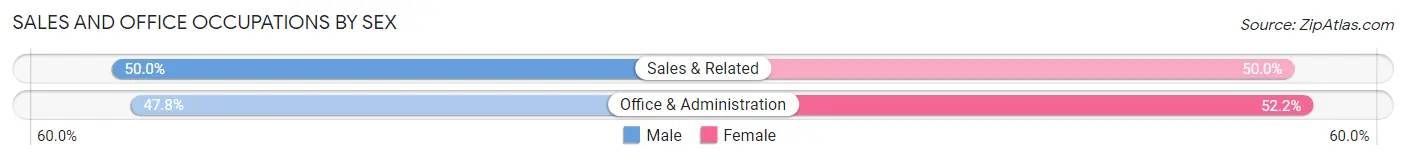
| Occupation | Male | Female |
| Sales & Related | 706 (50.0%) | 707 (50.0%) |
| Office & Administration | 837 (47.8%) | 915 (52.2%) |
| Total (Category) | 1,543 (48.7%) | 1,622 (51.2%) |
| Total (Overall) | 11,250 (56.8%) | 8,575 (43.2%) |
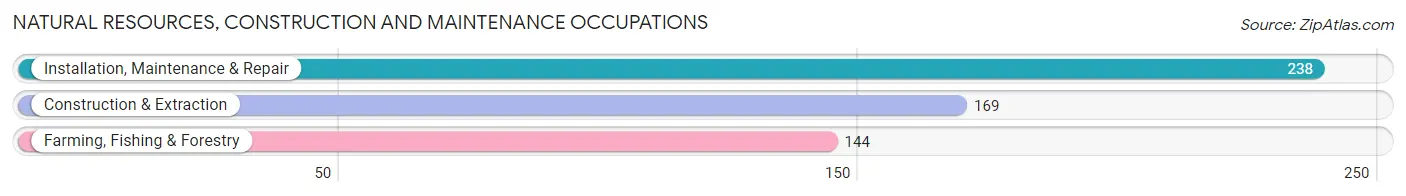
Natural Resources, Construction and Maintenance Occupations
The most common Natural Resources, Construction and Maintenance occupations in West Lafayette are Installation, Maintenance & Repair (238 | 1.2%), Construction & Extraction (169 | 0.9%), and Farming, Fishing & Forestry (144 | 0.7%).
Natural Resources, Construction and Maintenance Occupations by Sex
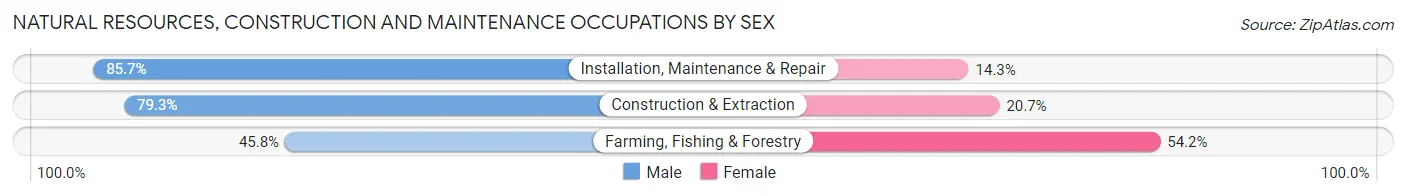
| Occupation | Male | Female |
| Farming, Fishing & Forestry | 66 (45.8%) | 78 (54.2%) |
| Construction & Extraction | 134 (79.3%) | 35 (20.7%) |
| Installation, Maintenance & Repair | 204 (85.7%) | 34 (14.3%) |
| Total (Category) | 404 (73.3%) | 147 (26.7%) |
| Total (Overall) | 11,250 (56.8%) | 8,575 (43.2%) |
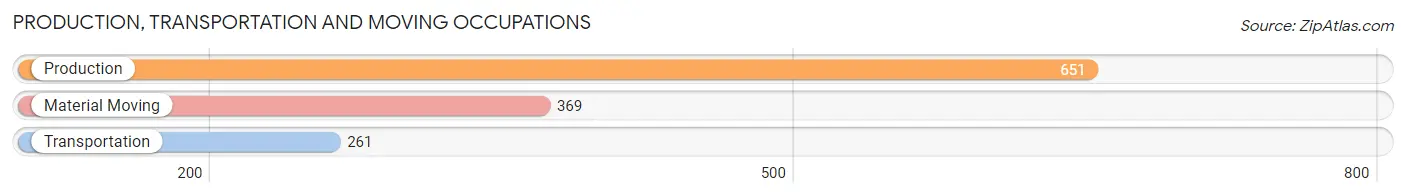
Production, Transportation and Moving Occupations
The most common Production, Transportation and Moving occupations in West Lafayette are Production (651 | 3.3%), Material Moving (369 | 1.9%), and Transportation (261 | 1.3%).
Production, Transportation and Moving Occupations by Sex
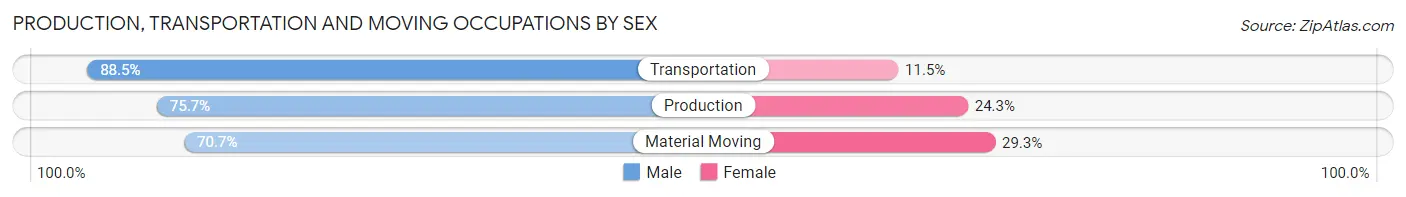
| Occupation | Male | Female |
| Production | 493 (75.7%) | 158 (24.3%) |
| Transportation | 231 (88.5%) | 30 (11.5%) |
| Material Moving | 261 (70.7%) | 108 (29.3%) |
| Total (Category) | 985 (76.9%) | 296 (23.1%) |
| Total (Overall) | 11,250 (56.8%) | 8,575 (43.2%) |
Employment Industries by Sex in West Lafayette
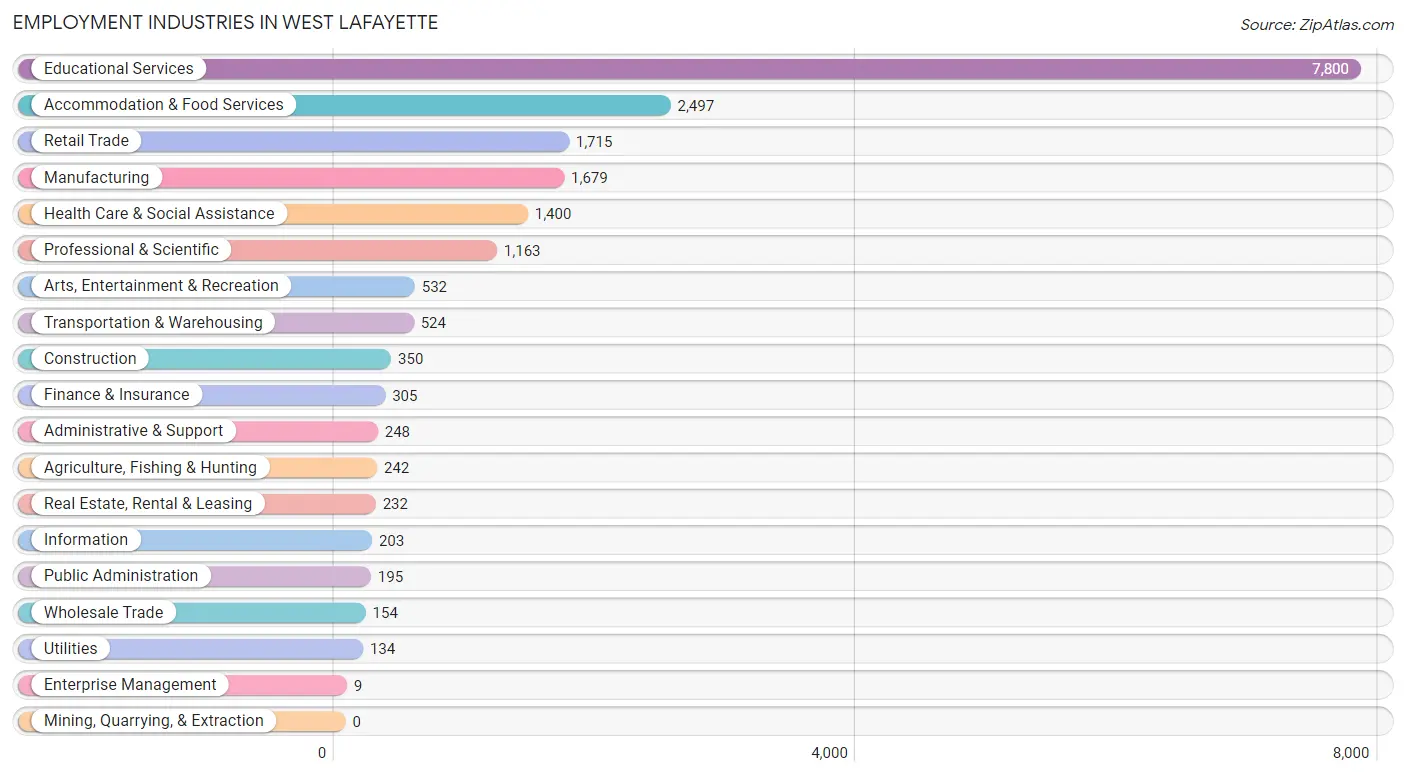
Employment Industries in West Lafayette
The major employment industries in West Lafayette include Educational Services (7,800 | 39.3%), Accommodation & Food Services (2,497 | 12.6%), Retail Trade (1,715 | 8.6%), Manufacturing (1,679 | 8.5%), and Health Care & Social Assistance (1,400 | 7.1%).
Employment Industries by Sex in West Lafayette
The West Lafayette industries that see more men than women are Enterprise Management (100.0%), Construction (88.6%), and Utilities (80.6%), whereas the industries that tend to have a higher number of women are Health Care & Social Assistance (63.6%), Administrative & Support (56.0%), and Information (54.7%).
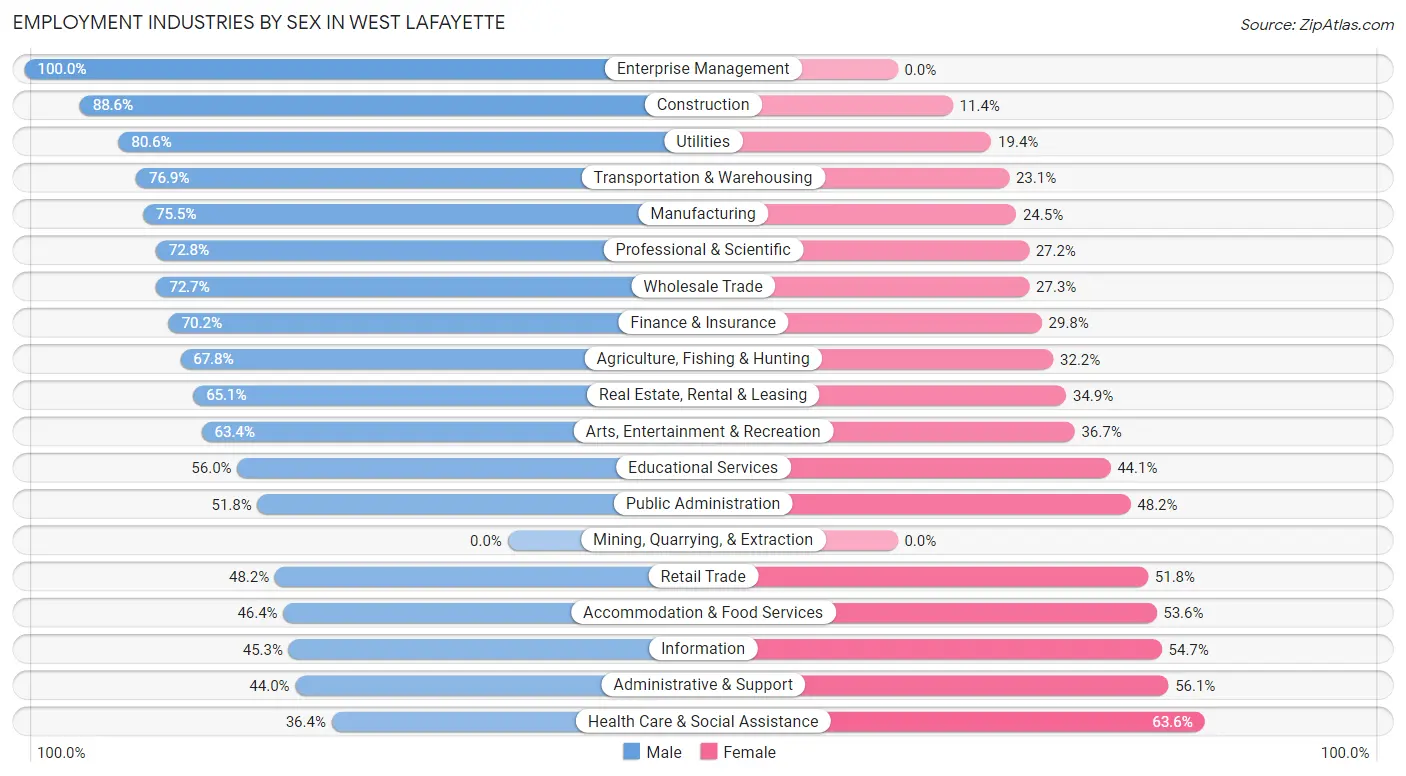
| Industry | Male | Female |
| Agriculture, Fishing & Hunting | 164 (67.8%) | 78 (32.2%) |
| Mining, Quarrying, & Extraction | 0 (0.0%) | 0 (0.0%) |
| Construction | 310 (88.6%) | 40 (11.4%) |
| Manufacturing | 1,267 (75.5%) | 412 (24.5%) |
| Wholesale Trade | 112 (72.7%) | 42 (27.3%) |
| Retail Trade | 826 (48.2%) | 889 (51.8%) |
| Transportation & Warehousing | 403 (76.9%) | 121 (23.1%) |
| Utilities | 108 (80.6%) | 26 (19.4%) |
| Information | 92 (45.3%) | 111 (54.7%) |
| Finance & Insurance | 214 (70.2%) | 91 (29.8%) |
| Real Estate, Rental & Leasing | 151 (65.1%) | 81 (34.9%) |
| Professional & Scientific | 847 (72.8%) | 316 (27.2%) |
| Enterprise Management | 9 (100.0%) | 0 (0.0%) |
| Administrative & Support | 109 (44.0%) | 139 (56.0%) |
| Educational Services | 4,364 (55.9%) | 3,436 (44.1%) |
| Health Care & Social Assistance | 510 (36.4%) | 890 (63.6%) |
| Arts, Entertainment & Recreation | 337 (63.3%) | 195 (36.6%) |
| Accommodation & Food Services | 1,159 (46.4%) | 1,338 (53.6%) |
| Public Administration | 101 (51.8%) | 94 (48.2%) |
| Total | 11,250 (56.8%) | 8,575 (43.2%) |
Education in West Lafayette
School Enrollment in West Lafayette
The most common levels of schooling among the 31,802 students in West Lafayette are college / undergraduate (24,205 | 76.1%), graduate / professional (4,392 | 13.8%), and middle school (1,035 | 3.3%).
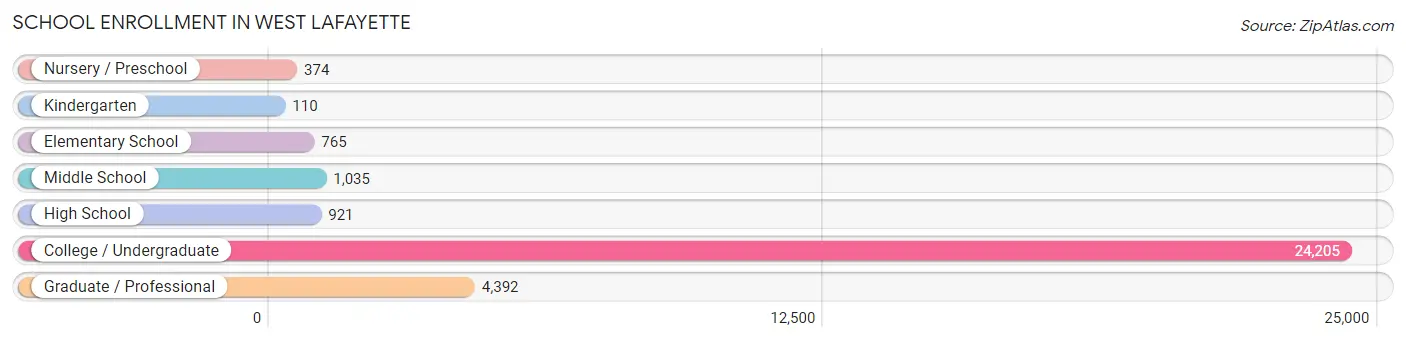
| School Level | # Students | % Students |
| Nursery / Preschool | 374 | 1.2% |
| Kindergarten | 110 | 0.4% |
| Elementary School | 765 | 2.4% |
| Middle School | 1,035 | 3.3% |
| High School | 921 | 2.9% |
| College / Undergraduate | 24,205 | 76.1% |
| Graduate / Professional | 4,392 | 13.8% |
| Total | 31,802 | 100.0% |
School Enrollment by Age by Funding Source in West Lafayette
Out of a total of 31,802 students who are enrolled in schools in West Lafayette, 1,208 (3.8%) attend a private institution, while the remaining 30,594 (96.2%) are enrolled in public schools. The age group of 3 to 4 year olds has the highest likelihood of being enrolled in private schools, with 116 (46.6% in the age bracket) enrolled. Conversely, the age group of 18 to 19 year olds has the lowest likelihood of being enrolled in a private school, with 10,769 (98.9% in the age bracket) attending a public institution.
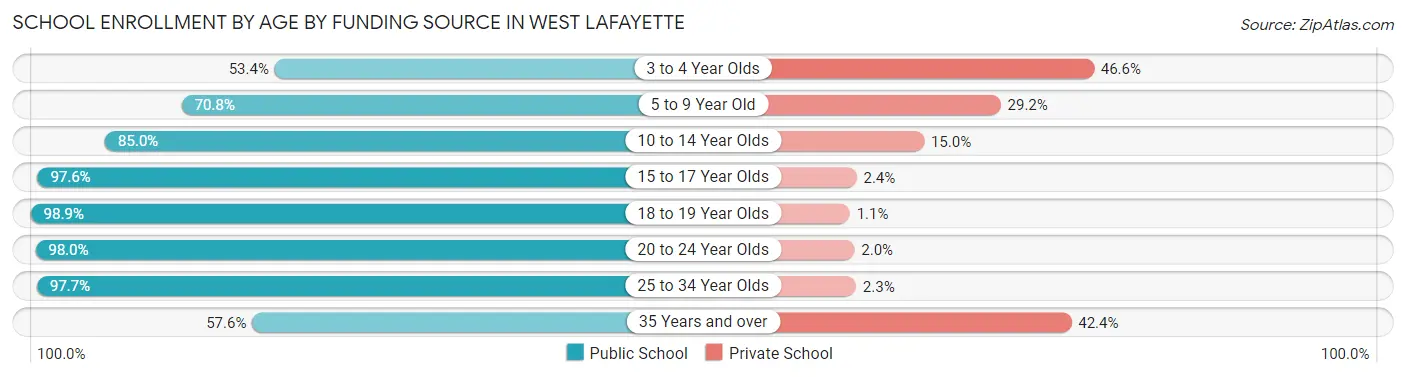
| Age Bracket | Public School | Private School |
| 3 to 4 Year Olds | 133 (53.4%) | 116 (46.6%) |
| 5 to 9 Year Old | 627 (70.8%) | 259 (29.2%) |
| 10 to 14 Year Olds | 1,040 (85.0%) | 183 (15.0%) |
| 15 to 17 Year Olds | 732 (97.6%) | 18 (2.4%) |
| 18 to 19 Year Olds | 10,769 (98.9%) | 123 (1.1%) |
| 20 to 24 Year Olds | 14,895 (98.0%) | 302 (2.0%) |
| 25 to 34 Year Olds | 2,147 (97.7%) | 50 (2.3%) |
| 35 Years and over | 235 (57.6%) | 173 (42.4%) |
| Total | 30,594 (96.2%) | 1,208 (3.8%) |
Educational Attainment by Field of Study in West Lafayette
Engineering (1,944 | 19.3%), bio, nature & agricultural (1,356 | 13.5%), business (937 | 9.3%), education (907 | 9.0%), and physical & health sciences (866 | 8.6%) are the most common fields of study among 10,061 individuals in West Lafayette who have obtained a bachelor's degree or higher.
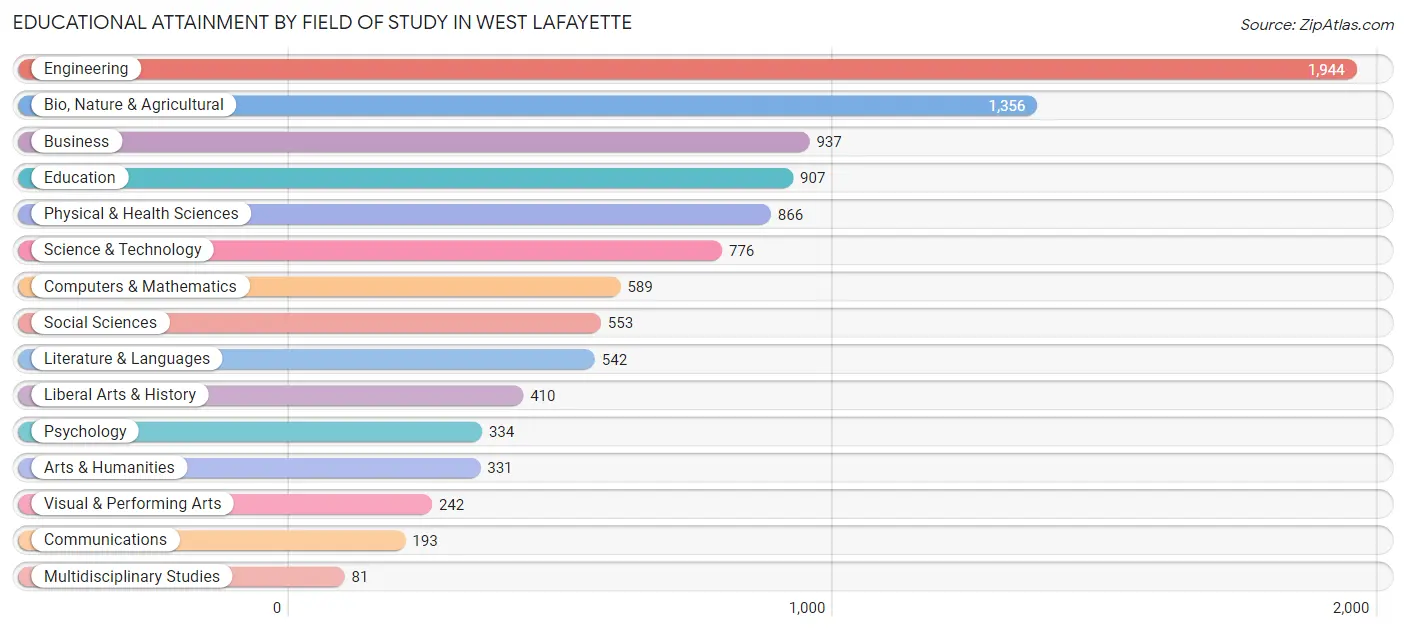
| Field of Study | # Graduates | % Graduates |
| Computers & Mathematics | 589 | 5.9% |
| Bio, Nature & Agricultural | 1,356 | 13.5% |
| Physical & Health Sciences | 866 | 8.6% |
| Psychology | 334 | 3.3% |
| Social Sciences | 553 | 5.5% |
| Engineering | 1,944 | 19.3% |
| Multidisciplinary Studies | 81 | 0.8% |
| Science & Technology | 776 | 7.7% |
| Business | 937 | 9.3% |
| Education | 907 | 9.0% |
| Literature & Languages | 542 | 5.4% |
| Liberal Arts & History | 410 | 4.1% |
| Visual & Performing Arts | 242 | 2.4% |
| Communications | 193 | 1.9% |
| Arts & Humanities | 331 | 3.3% |
| Total | 10,061 | 100.0% |
Transportation & Commute in West Lafayette
Vehicle Availability by Sex in West Lafayette
The most prevalent vehicle ownership categories in West Lafayette are males with 2 vehicles (2,816, accounting for 32.4%) and females with 2 vehicles (2,200, making up 49.2%).
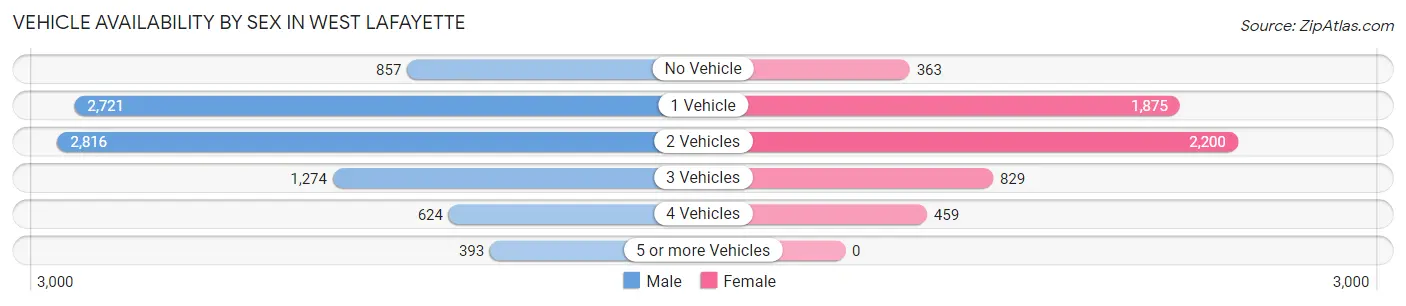
| Vehicles Available | Male | Female |
| No Vehicle | 857 (9.9%) | 363 (6.3%) |
| 1 Vehicle | 2,721 (31.3%) | 1,875 (32.8%) |
| 2 Vehicles | 2,816 (32.4%) | 2,200 (38.4%) |
| 3 Vehicles | 1,274 (14.7%) | 829 (14.5%) |
| 4 Vehicles | 624 (7.2%) | 459 (8.0%) |
| 5 or more Vehicles | 393 (4.5%) | 0 (0.0%) |
| Total | 8,685 (100.0%) | 5,726 (100.0%) |
Commute Time in West Lafayette
The most frequently occuring commute durations in West Lafayette are 10 to 14 minutes (4,459 commuters, 27.5%), 15 to 19 minutes (4,109 commuters, 25.3%), and 5 to 9 minutes (2,888 commuters, 17.8%).
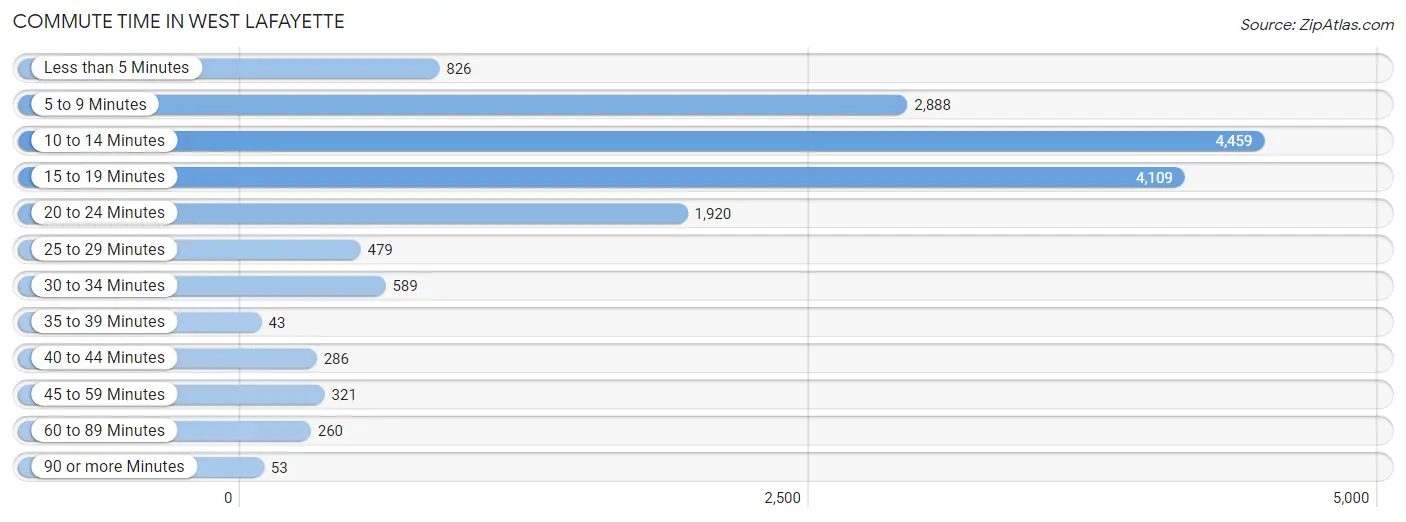
| Commute Time | # Commuters | % Commuters |
| Less than 5 Minutes | 826 | 5.1% |
| 5 to 9 Minutes | 2,888 | 17.8% |
| 10 to 14 Minutes | 4,459 | 27.5% |
| 15 to 19 Minutes | 4,109 | 25.3% |
| 20 to 24 Minutes | 1,920 | 11.8% |
| 25 to 29 Minutes | 479 | 2.9% |
| 30 to 34 Minutes | 589 | 3.6% |
| 35 to 39 Minutes | 43 | 0.3% |
| 40 to 44 Minutes | 286 | 1.8% |
| 45 to 59 Minutes | 321 | 2.0% |
| 60 to 89 Minutes | 260 | 1.6% |
| 90 or more Minutes | 53 | 0.3% |
Commute Time by Sex in West Lafayette
The most common commute times in West Lafayette are 10 to 14 minutes (2,744 commuters, 29.0%) for males and 15 to 19 minutes (1,782 commuters, 26.3%) for females.
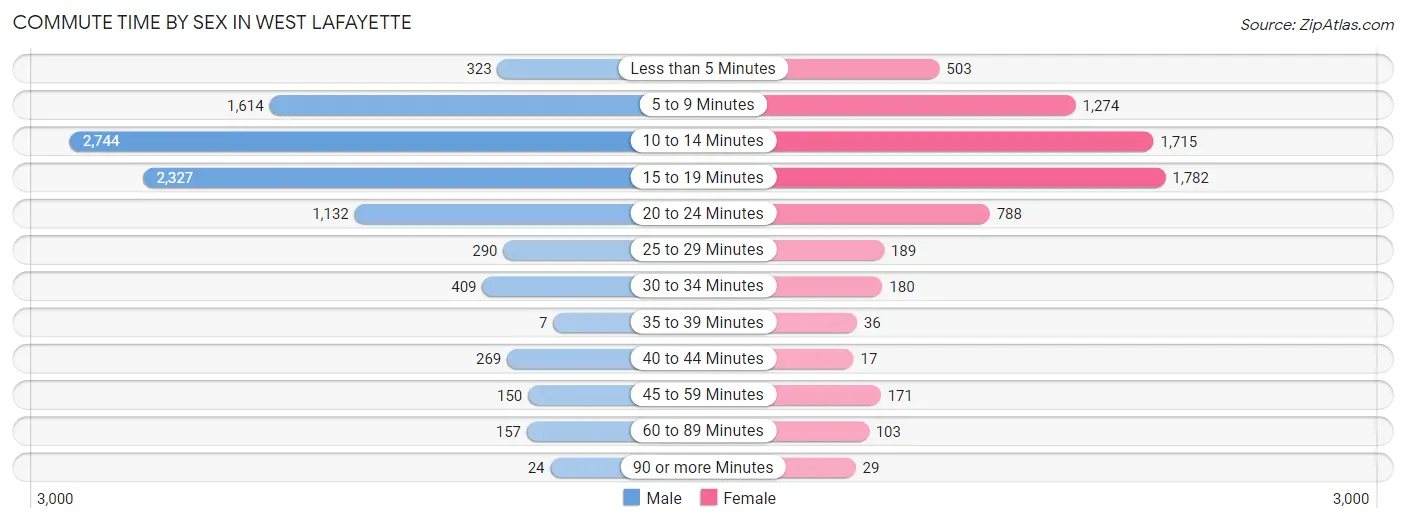
| Commute Time | Male | Female |
| Less than 5 Minutes | 323 (3.4%) | 503 (7.4%) |
| 5 to 9 Minutes | 1,614 (17.1%) | 1,274 (18.8%) |
| 10 to 14 Minutes | 2,744 (29.0%) | 1,715 (25.3%) |
| 15 to 19 Minutes | 2,327 (24.6%) | 1,782 (26.3%) |
| 20 to 24 Minutes | 1,132 (12.0%) | 788 (11.6%) |
| 25 to 29 Minutes | 290 (3.1%) | 189 (2.8%) |
| 30 to 34 Minutes | 409 (4.3%) | 180 (2.6%) |
| 35 to 39 Minutes | 7 (0.1%) | 36 (0.5%) |
| 40 to 44 Minutes | 269 (2.9%) | 17 (0.3%) |
| 45 to 59 Minutes | 150 (1.6%) | 171 (2.5%) |
| 60 to 89 Minutes | 157 (1.7%) | 103 (1.5%) |
| 90 or more Minutes | 24 (0.3%) | 29 (0.4%) |
Time of Departure to Work by Sex in West Lafayette
The most frequent times of departure to work in West Lafayette are 12:00 PM to 3:59 PM (1,476, 15.6%) for males and 9:00 AM to 9:59 AM (1,097, 16.2%) for females.
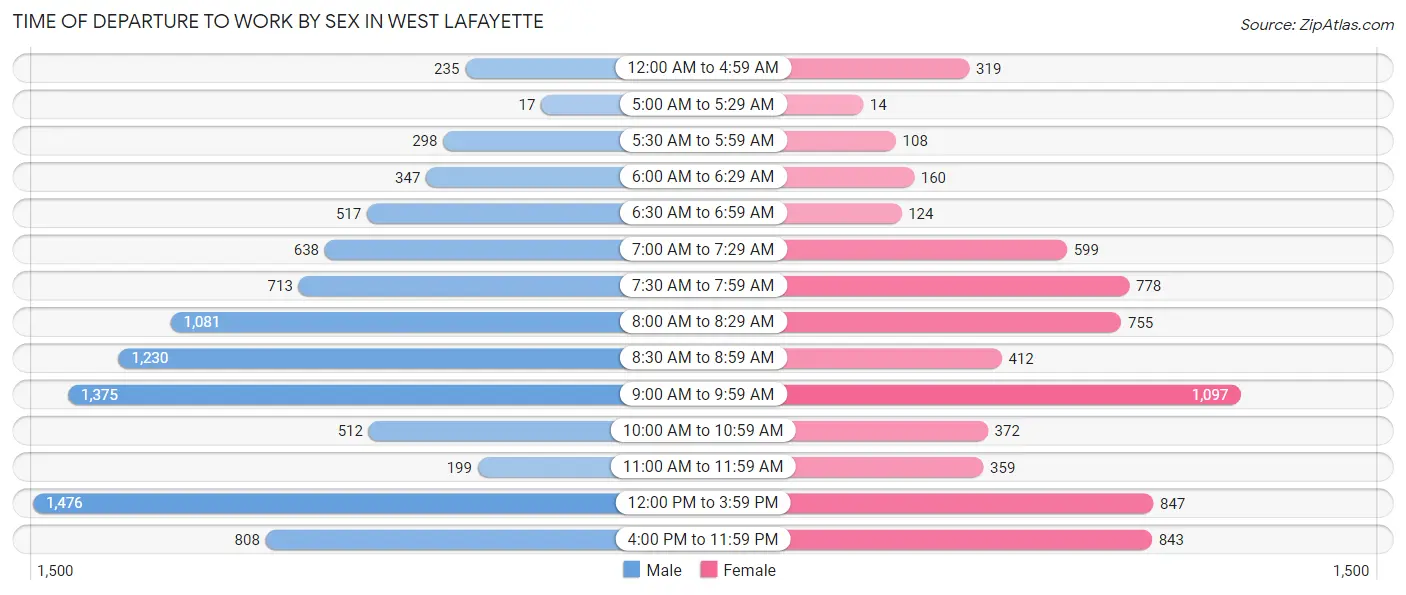
| Time of Departure | Male | Female |
| 12:00 AM to 4:59 AM | 235 (2.5%) | 319 (4.7%) |
| 5:00 AM to 5:29 AM | 17 (0.2%) | 14 (0.2%) |
| 5:30 AM to 5:59 AM | 298 (3.2%) | 108 (1.6%) |
| 6:00 AM to 6:29 AM | 347 (3.7%) | 160 (2.4%) |
| 6:30 AM to 6:59 AM | 517 (5.5%) | 124 (1.8%) |
| 7:00 AM to 7:29 AM | 638 (6.8%) | 599 (8.8%) |
| 7:30 AM to 7:59 AM | 713 (7.5%) | 778 (11.5%) |
| 8:00 AM to 8:29 AM | 1,081 (11.4%) | 755 (11.1%) |
| 8:30 AM to 8:59 AM | 1,230 (13.0%) | 412 (6.1%) |
| 9:00 AM to 9:59 AM | 1,375 (14.6%) | 1,097 (16.2%) |
| 10:00 AM to 10:59 AM | 512 (5.4%) | 372 (5.5%) |
| 11:00 AM to 11:59 AM | 199 (2.1%) | 359 (5.3%) |
| 12:00 PM to 3:59 PM | 1,476 (15.6%) | 847 (12.5%) |
| 4:00 PM to 11:59 PM | 808 (8.6%) | 843 (12.4%) |
| Total | 9,446 (100.0%) | 6,787 (100.0%) |
Housing Occupancy in West Lafayette
Occupancy by Ownership in West Lafayette
Of the total 14,097 dwellings in West Lafayette, owner-occupied units account for 4,154 (29.5%), while renter-occupied units make up 9,943 (70.5%).
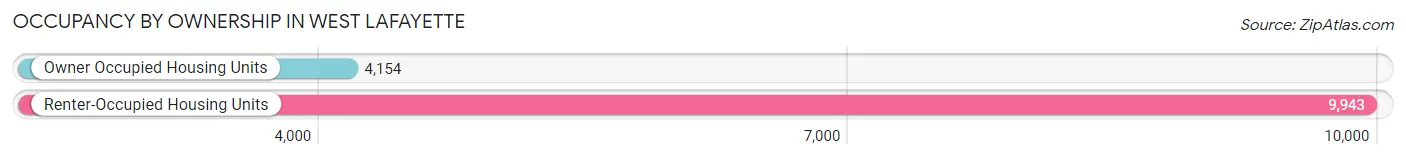
| Occupancy | # Housing Units | % Housing Units |
| Owner Occupied Housing Units | 4,154 | 29.5% |
| Renter-Occupied Housing Units | 9,943 | 70.5% |
| Total Occupied Housing Units | 14,097 | 100.0% |
Occupancy by Household Size in West Lafayette
| Household Size | # Housing Units | % Housing Units |
| 1-Person Household | 5,440 | 38.6% |
| 2-Person Household | 4,142 | 29.4% |
| 3-Person Household | 2,340 | 16.6% |
| 4+ Person Household | 2,175 | 15.4% |
| Total Housing Units | 14,097 | 100.0% |
Occupancy by Ownership by Household Size in West Lafayette
| Household Size | Owner-occupied | Renter-occupied |
| 1-Person Household | 925 (17.0%) | 4,515 (83.0%) |
| 2-Person Household | 1,253 (30.2%) | 2,889 (69.8%) |
| 3-Person Household | 878 (37.5%) | 1,462 (62.5%) |
| 4+ Person Household | 1,098 (50.5%) | 1,077 (49.5%) |
| Total Housing Units | 4,154 (29.5%) | 9,943 (70.5%) |
Occupancy by Educational Attainment in West Lafayette
| Household Size | Owner-occupied | Renter-occupied |
| Less than High School | 8 (7.2%) | 103 (92.8%) |
| High School Diploma | 238 (12.1%) | 1,731 (87.9%) |
| College/Associate Degree | 668 (14.3%) | 3,988 (85.7%) |
| Bachelor's Degree or higher | 3,240 (44.0%) | 4,121 (56.0%) |
Occupancy by Age of Householder in West Lafayette
| Age Bracket | # Households | % Households |
| Under 35 Years | 8,715 | 61.8% |
| 35 to 44 Years | 1,231 | 8.7% |
| 45 to 54 Years | 1,019 | 7.2% |
| 55 to 64 Years | 1,095 | 7.8% |
| 65 to 74 Years | 949 | 6.7% |
| 75 to 84 Years | 401 | 2.8% |
| 85 Years and Over | 687 | 4.9% |
| Total | 14,097 | 100.0% |
Housing Finances in West Lafayette
Median Income by Occupancy in West Lafayette
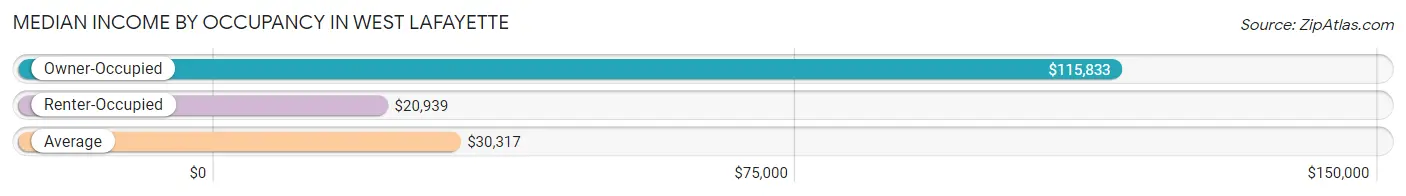
| Occupancy Type | # Households | Median Income |
| Owner-Occupied | 4,154 (29.5%) | $115,833 |
| Renter-Occupied | 9,943 (70.5%) | $20,939 |
| Average | 14,097 (100.0%) | $30,317 |
Occupancy by Householder Income Bracket in West Lafayette
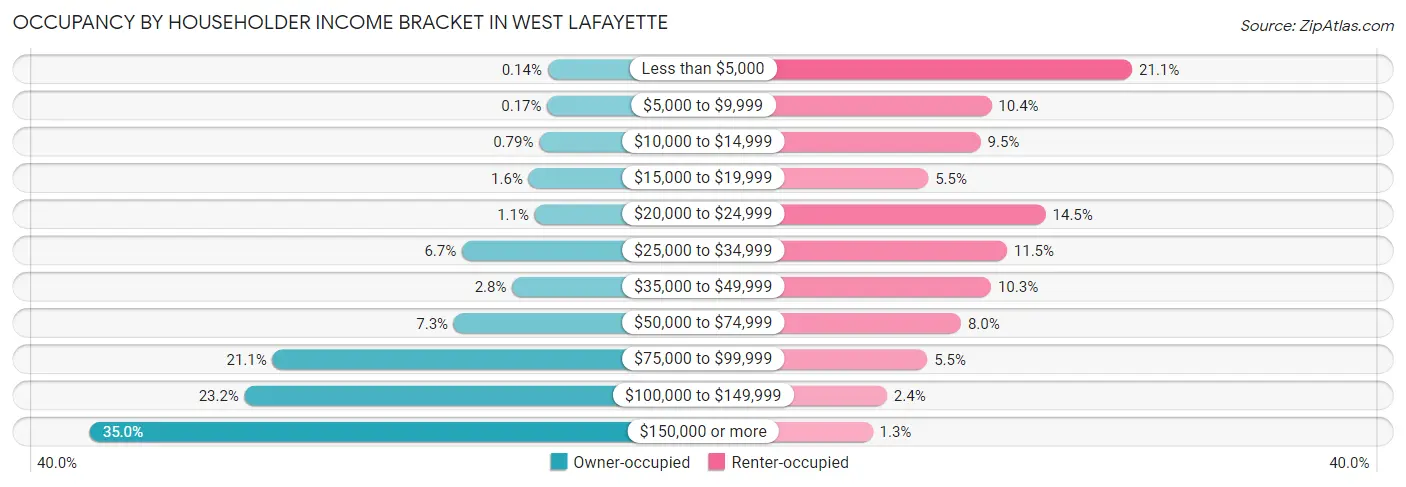
| Income Bracket | Owner-occupied | Renter-occupied |
| Less than $5,000 | 6 (0.1%) | 2,095 (21.1%) |
| $5,000 to $9,999 | 7 (0.2%) | 1,029 (10.3%) |
| $10,000 to $14,999 | 33 (0.8%) | 948 (9.5%) |
| $15,000 to $19,999 | 66 (1.6%) | 551 (5.5%) |
| $20,000 to $24,999 | 47 (1.1%) | 1,440 (14.5%) |
| $25,000 to $34,999 | 277 (6.7%) | 1,146 (11.5%) |
| $35,000 to $49,999 | 118 (2.8%) | 1,026 (10.3%) |
| $50,000 to $74,999 | 303 (7.3%) | 798 (8.0%) |
| $75,000 to $99,999 | 877 (21.1%) | 543 (5.5%) |
| $100,000 to $149,999 | 965 (23.2%) | 238 (2.4%) |
| $150,000 or more | 1,455 (35.0%) | 129 (1.3%) |
| Total | 4,154 (100.0%) | 9,943 (100.0%) |
Monthly Housing Cost Tiers in West Lafayette
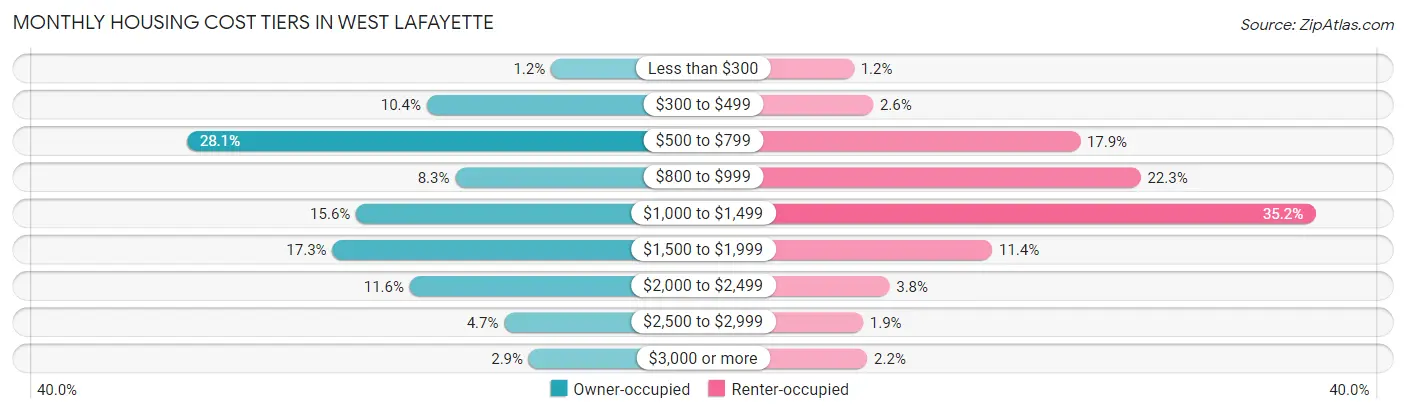
| Monthly Cost | Owner-occupied | Renter-occupied |
| Less than $300 | 51 (1.2%) | 119 (1.2%) |
| $300 to $499 | 431 (10.4%) | 261 (2.6%) |
| $500 to $799 | 1,165 (28.1%) | 1,776 (17.9%) |
| $800 to $999 | 344 (8.3%) | 2,219 (22.3%) |
| $1,000 to $1,499 | 647 (15.6%) | 3,497 (35.2%) |
| $1,500 to $1,999 | 720 (17.3%) | 1,133 (11.4%) |
| $2,000 to $2,499 | 483 (11.6%) | 380 (3.8%) |
| $2,500 to $2,999 | 194 (4.7%) | 186 (1.9%) |
| $3,000 or more | 119 (2.9%) | 218 (2.2%) |
| Total | 4,154 (100.0%) | 9,943 (100.0%) |
Physical Housing Characteristics in West Lafayette
Housing Structures in West Lafayette
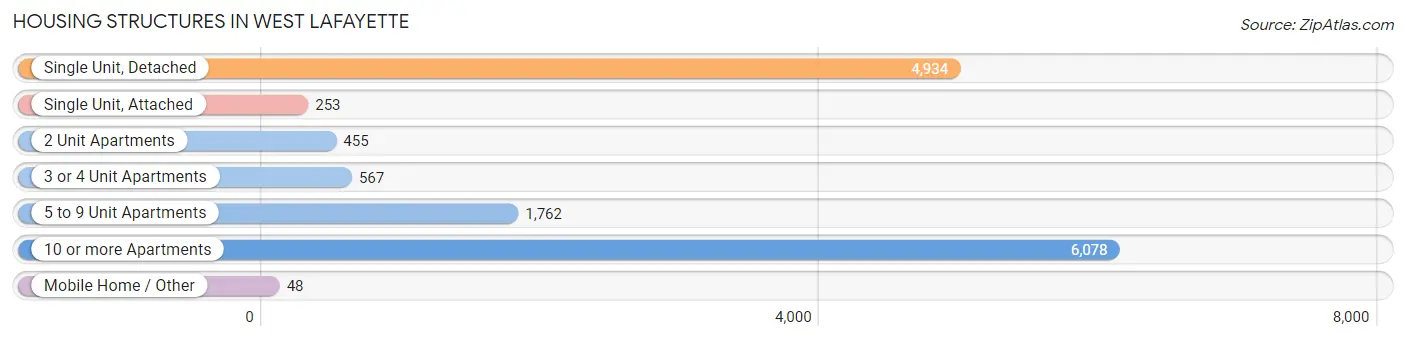
| Structure Type | # Housing Units | % Housing Units |
| Single Unit, Detached | 4,934 | 35.0% |
| Single Unit, Attached | 253 | 1.8% |
| 2 Unit Apartments | 455 | 3.2% |
| 3 or 4 Unit Apartments | 567 | 4.0% |
| 5 to 9 Unit Apartments | 1,762 | 12.5% |
| 10 or more Apartments | 6,078 | 43.1% |
| Mobile Home / Other | 48 | 0.3% |
| Total | 14,097 | 100.0% |
Housing Structures by Occupancy in West Lafayette
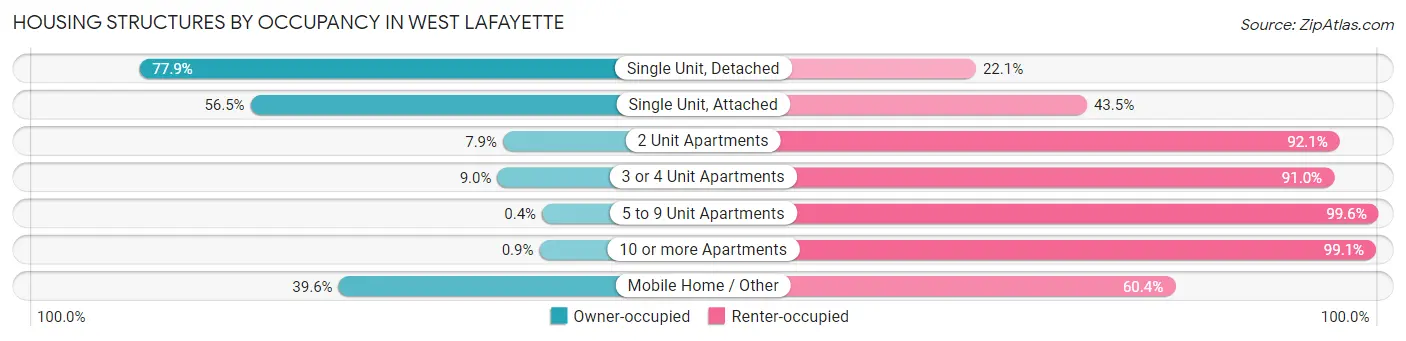
| Structure Type | Owner-occupied | Renter-occupied |
| Single Unit, Detached | 3,843 (77.9%) | 1,091 (22.1%) |
| Single Unit, Attached | 143 (56.5%) | 110 (43.5%) |
| 2 Unit Apartments | 36 (7.9%) | 419 (92.1%) |
| 3 or 4 Unit Apartments | 51 (9.0%) | 516 (91.0%) |
| 5 to 9 Unit Apartments | 7 (0.4%) | 1,755 (99.6%) |
| 10 or more Apartments | 55 (0.9%) | 6,023 (99.1%) |
| Mobile Home / Other | 19 (39.6%) | 29 (60.4%) |
| Total | 4,154 (29.5%) | 9,943 (70.5%) |
Housing Structures by Number of Rooms in West Lafayette
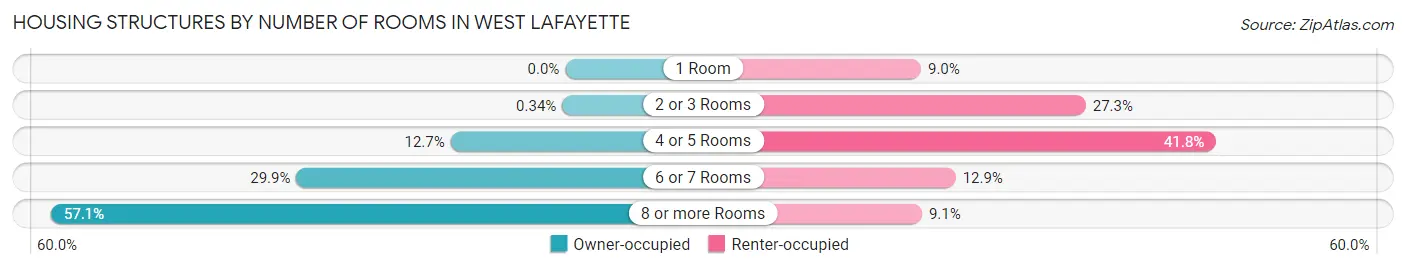
| Number of Rooms | Owner-occupied | Renter-occupied |
| 1 Room | 0 (0.0%) | 895 (9.0%) |
| 2 or 3 Rooms | 14 (0.3%) | 2,713 (27.3%) |
| 4 or 5 Rooms | 529 (12.7%) | 4,151 (41.7%) |
| 6 or 7 Rooms | 1,240 (29.8%) | 1,278 (12.9%) |
| 8 or more Rooms | 2,371 (57.1%) | 906 (9.1%) |
| Total | 4,154 (100.0%) | 9,943 (100.0%) |
Housing Structure by Heating Type in West Lafayette
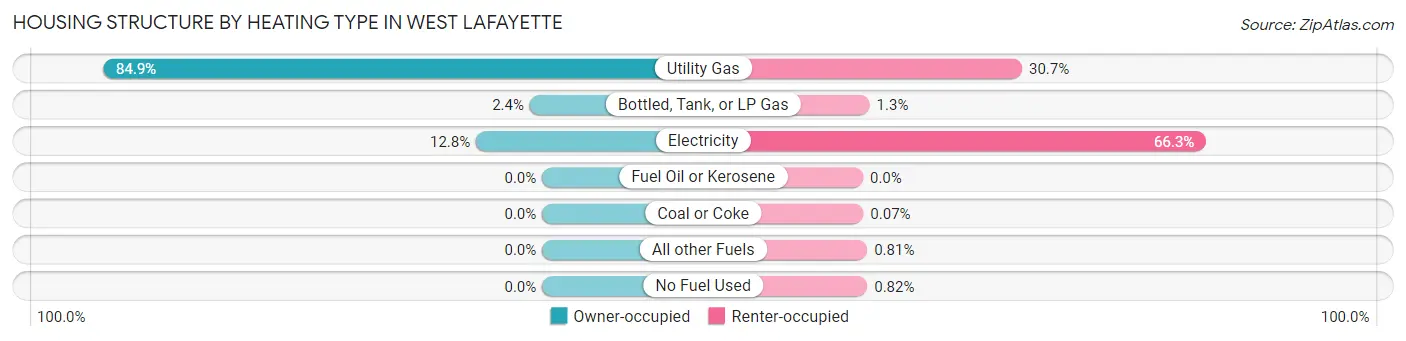
| Heating Type | Owner-occupied | Renter-occupied |
| Utility Gas | 3,525 (84.9%) | 3,055 (30.7%) |
| Bottled, Tank, or LP Gas | 99 (2.4%) | 127 (1.3%) |
| Electricity | 530 (12.8%) | 6,591 (66.3%) |
| Fuel Oil or Kerosene | 0 (0.0%) | 0 (0.0%) |
| Coal or Coke | 0 (0.0%) | 7 (0.1%) |
| All other Fuels | 0 (0.0%) | 81 (0.8%) |
| No Fuel Used | 0 (0.0%) | 82 (0.8%) |
| Total | 4,154 (100.0%) | 9,943 (100.0%) |
Household Vehicle Usage in West Lafayette
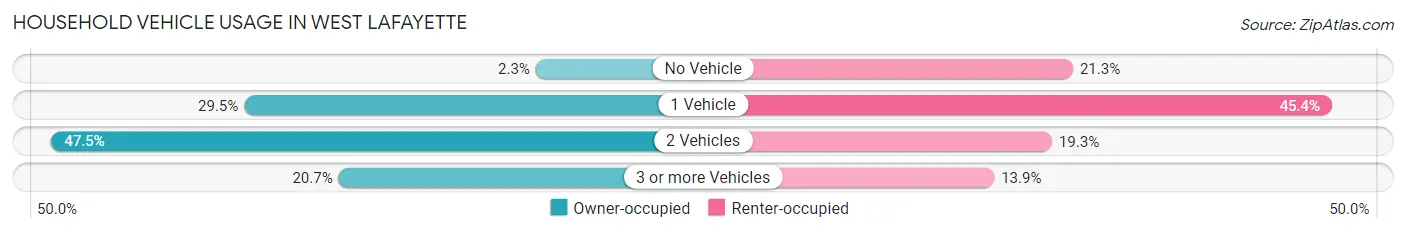
| Vehicles per Household | Owner-occupied | Renter-occupied |
| No Vehicle | 95 (2.3%) | 2,117 (21.3%) |
| 1 Vehicle | 1,226 (29.5%) | 4,518 (45.4%) |
| 2 Vehicles | 1,973 (47.5%) | 1,922 (19.3%) |
| 3 or more Vehicles | 860 (20.7%) | 1,386 (13.9%) |
| Total | 4,154 (100.0%) | 9,943 (100.0%) |
Real Estate & Mortgages in West Lafayette
Real Estate and Mortgage Overview in West Lafayette
| Characteristic | Without Mortgage | With Mortgage |
| Housing Units | 1,735 | 2,419 |
| Median Property Value | $253,600 | $326,300 |
| Median Household Income | $97,124 | $906 |
| Monthly Housing Costs | $589 | $119 |
| Real Estate Taxes | $2,709 | $0 |
Property Value by Mortgage Status in West Lafayette
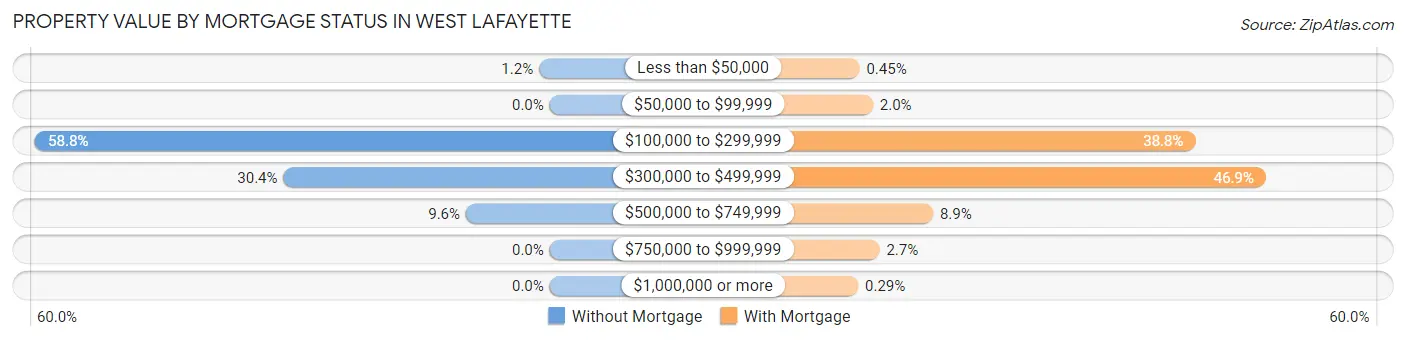
| Property Value | Without Mortgage | With Mortgage |
| Less than $50,000 | 21 (1.2%) | 11 (0.4%) |
| $50,000 to $99,999 | 0 (0.0%) | 48 (2.0%) |
| $100,000 to $299,999 | 1,020 (58.8%) | 939 (38.8%) |
| $300,000 to $499,999 | 528 (30.4%) | 1,134 (46.9%) |
| $500,000 to $749,999 | 166 (9.6%) | 214 (8.8%) |
| $750,000 to $999,999 | 0 (0.0%) | 66 (2.7%) |
| $1,000,000 or more | 0 (0.0%) | 7 (0.3%) |
| Total | 1,735 (100.0%) | 2,419 (100.0%) |
Household Income by Mortgage Status in West Lafayette
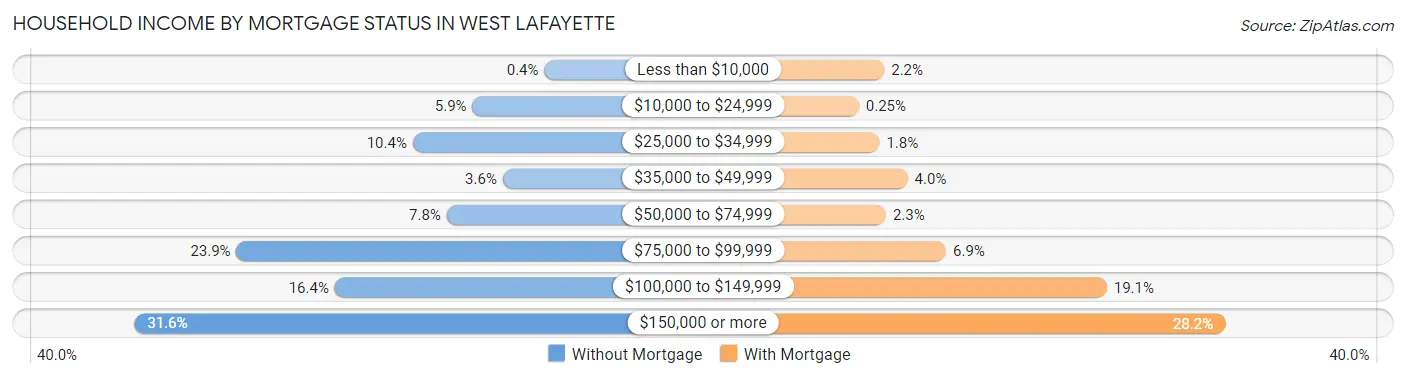
| Household Income | Without Mortgage | With Mortgage |
| Less than $10,000 | 7 (0.4%) | 53 (2.2%) |
| $10,000 to $24,999 | 102 (5.9%) | 6 (0.3%) |
| $25,000 to $34,999 | 181 (10.4%) | 44 (1.8%) |
| $35,000 to $49,999 | 62 (3.6%) | 96 (4.0%) |
| $50,000 to $74,999 | 136 (7.8%) | 56 (2.3%) |
| $75,000 to $99,999 | 414 (23.9%) | 167 (6.9%) |
| $100,000 to $149,999 | 284 (16.4%) | 463 (19.1%) |
| $150,000 or more | 549 (31.6%) | 681 (28.1%) |
| Total | 1,735 (100.0%) | 2,419 (100.0%) |
Property Value to Household Income Ratio in West Lafayette
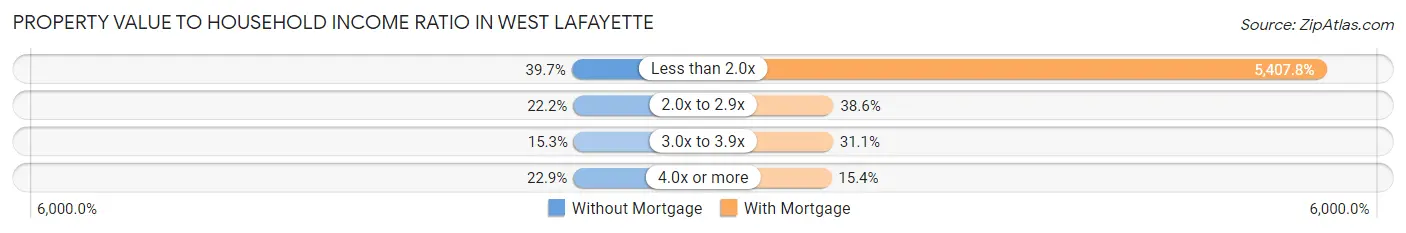
| Value-to-Income Ratio | Without Mortgage | With Mortgage |
| Less than 2.0x | 688 (39.7%) | 130,814 (5,407.8%) |
| 2.0x to 2.9x | 385 (22.2%) | 933 (38.6%) |
| 3.0x to 3.9x | 265 (15.3%) | 753 (31.1%) |
| 4.0x or more | 397 (22.9%) | 373 (15.4%) |
| Total | 1,735 (100.0%) | 2,419 (100.0%) |
Real Estate Taxes by Mortgage Status in West Lafayette
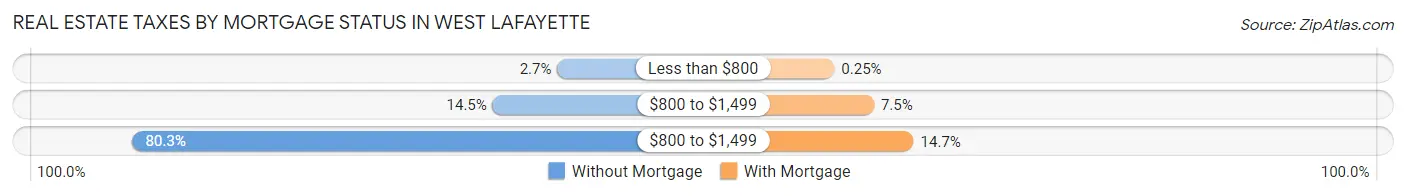
| Property Taxes | Without Mortgage | With Mortgage |
| Less than $800 | 47 (2.7%) | 6 (0.3%) |
| $800 to $1,499 | 252 (14.5%) | 181 (7.5%) |
| $800 to $1,499 | 1,393 (80.3%) | 356 (14.7%) |
| Total | 1,735 (100.0%) | 2,419 (100.0%) |
Health & Disability in West Lafayette
Health Insurance Coverage by Age in West Lafayette
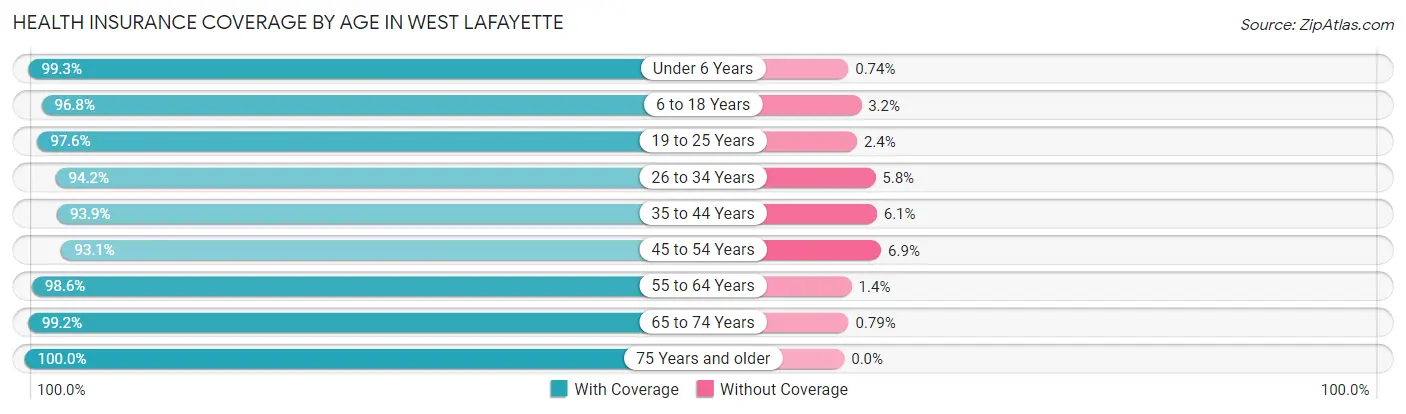
| Age Bracket | With Coverage | Without Coverage |
| Under 6 Years | 1,072 (99.3%) | 8 (0.7%) |
| 6 to 18 Years | 7,285 (96.8%) | 238 (3.2%) |
| 19 to 25 Years | 23,184 (97.6%) | 563 (2.4%) |
| 26 to 34 Years | 3,025 (94.2%) | 186 (5.8%) |
| 35 to 44 Years | 2,079 (93.9%) | 134 (6.1%) |
| 45 to 54 Years | 1,926 (93.1%) | 142 (6.9%) |
| 55 to 64 Years | 1,798 (98.6%) | 25 (1.4%) |
| 65 to 74 Years | 1,502 (99.2%) | 12 (0.8%) |
| 75 Years and older | 1,533 (100.0%) | 0 (0.0%) |
| Total | 43,404 (97.1%) | 1,308 (2.9%) |
Health Insurance Coverage by Citizenship Status in West Lafayette
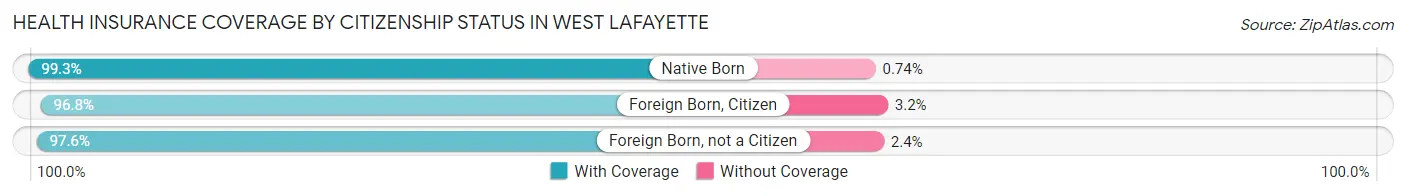
| Citizenship Status | With Coverage | Without Coverage |
| Native Born | 1,072 (99.3%) | 8 (0.7%) |
| Foreign Born, Citizen | 7,285 (96.8%) | 238 (3.2%) |
| Foreign Born, not a Citizen | 23,184 (97.6%) | 563 (2.4%) |
Health Insurance Coverage by Household Income in West Lafayette
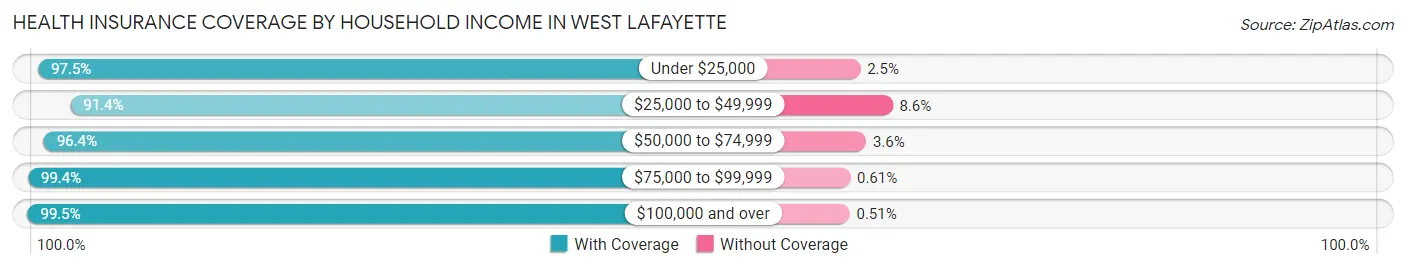
| Household Income | With Coverage | Without Coverage |
| Under $25,000 | 10,744 (97.5%) | 277 (2.5%) |
| $25,000 to $49,999 | 4,515 (91.4%) | 423 (8.6%) |
| $50,000 to $74,999 | 2,501 (96.4%) | 93 (3.6%) |
| $75,000 to $99,999 | 3,276 (99.4%) | 20 (0.6%) |
| $100,000 and over | 8,553 (99.5%) | 44 (0.5%) |
Public vs Private Health Insurance Coverage by Age in West Lafayette
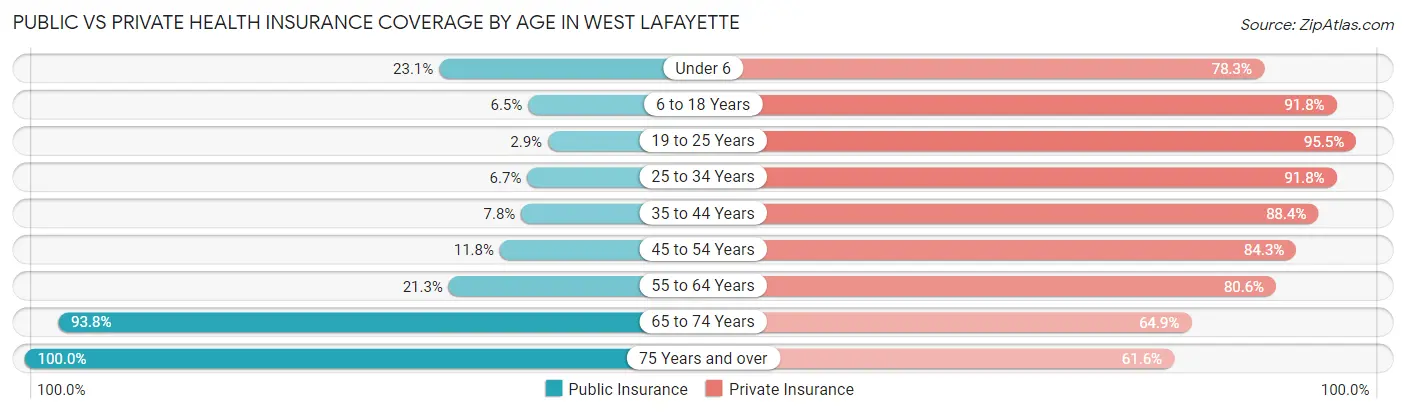
| Age Bracket | Public Insurance | Private Insurance |
| Under 6 | 249 (23.1%) | 846 (78.3%) |
| 6 to 18 Years | 492 (6.5%) | 6,907 (91.8%) |
| 19 to 25 Years | 679 (2.9%) | 22,669 (95.5%) |
| 25 to 34 Years | 215 (6.7%) | 2,948 (91.8%) |
| 35 to 44 Years | 173 (7.8%) | 1,957 (88.4%) |
| 45 to 54 Years | 244 (11.8%) | 1,744 (84.3%) |
| 55 to 64 Years | 388 (21.3%) | 1,469 (80.6%) |
| 65 to 74 Years | 1,420 (93.8%) | 982 (64.9%) |
| 75 Years and over | 1,533 (100.0%) | 945 (61.6%) |
| Total | 5,393 (12.1%) | 40,467 (90.5%) |
Disability Status by Sex by Age in West Lafayette
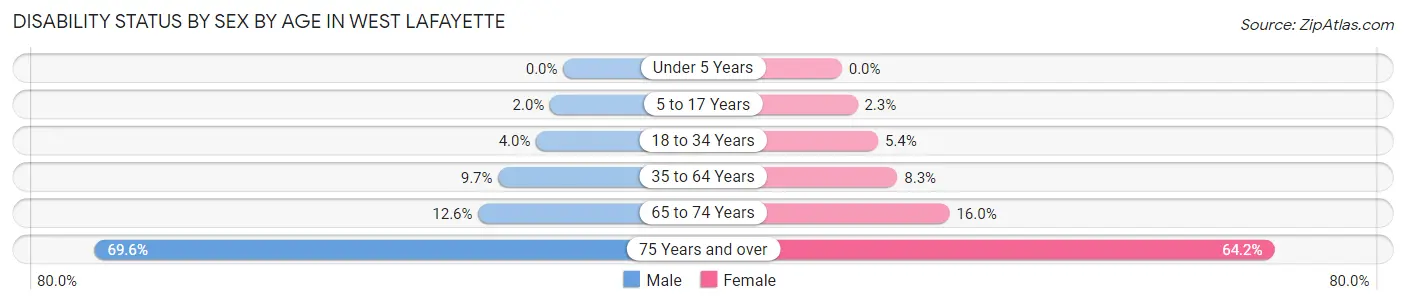
| Age Bracket | Male | Female |
| Under 5 Years | 0 (0.0%) | 0 (0.0%) |
| 5 to 17 Years | 27 (2.0%) | 35 (2.3%) |
| 18 to 34 Years | 745 (4.0%) | 715 (5.4%) |
| 35 to 64 Years | 292 (9.7%) | 254 (8.3%) |
| 65 to 74 Years | 94 (12.6%) | 123 (16.0%) |
| 75 Years and over | 433 (69.6%) | 585 (64.2%) |
Disability Class by Sex by Age in West Lafayette
Disability Class: Hearing Difficulty
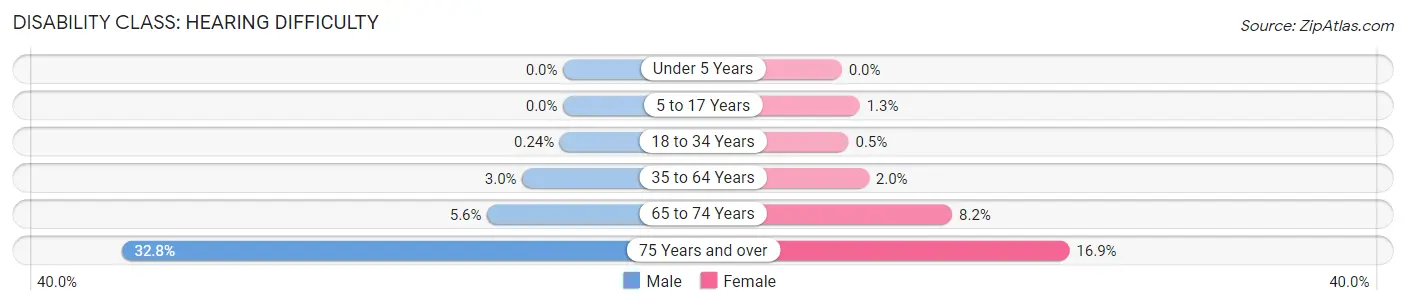
| Age Bracket | Male | Female |
| Under 5 Years | 0 (0.0%) | 0 (0.0%) |
| 5 to 17 Years | 0 (0.0%) | 20 (1.3%) |
| 18 to 34 Years | 45 (0.2%) | 67 (0.5%) |
| 35 to 64 Years | 92 (3.0%) | 62 (2.0%) |
| 65 to 74 Years | 42 (5.6%) | 63 (8.2%) |
| 75 Years and over | 204 (32.8%) | 154 (16.9%) |
Disability Class: Vision Difficulty
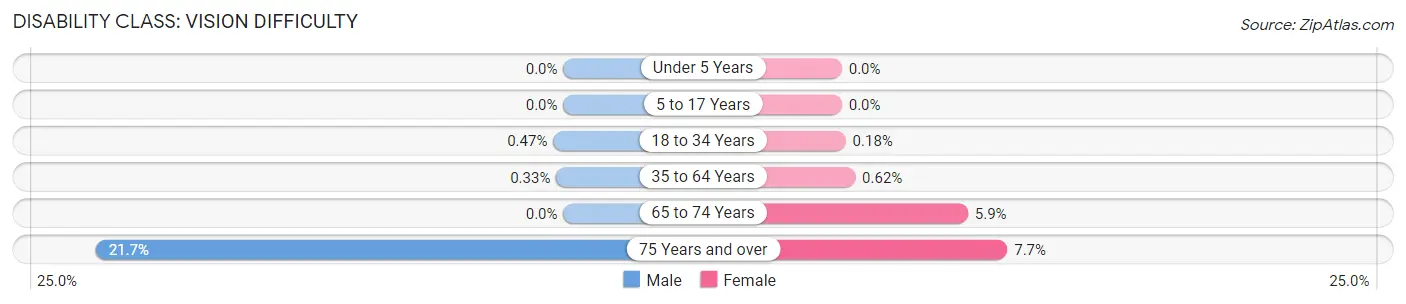
| Age Bracket | Male | Female |
| Under 5 Years | 0 (0.0%) | 0 (0.0%) |
| 5 to 17 Years | 0 (0.0%) | 0 (0.0%) |
| 18 to 34 Years | 87 (0.5%) | 24 (0.2%) |
| 35 to 64 Years | 10 (0.3%) | 19 (0.6%) |
| 65 to 74 Years | 0 (0.0%) | 45 (5.9%) |
| 75 Years and over | 135 (21.7%) | 70 (7.7%) |
Disability Class: Cognitive Difficulty
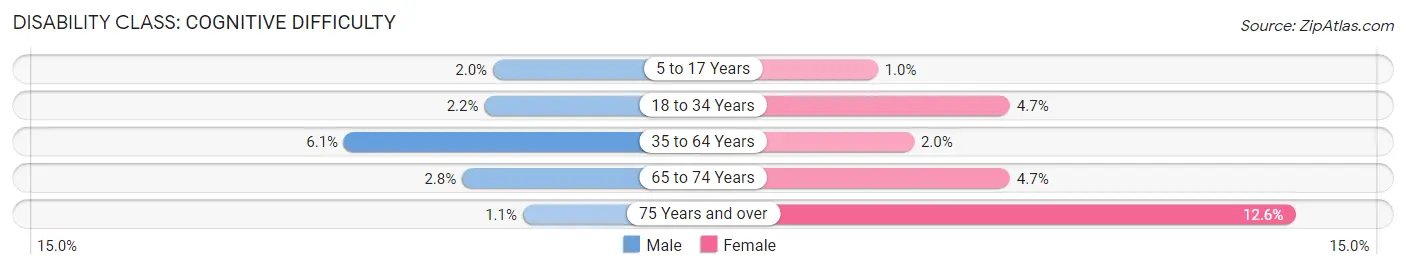
| Age Bracket | Male | Female |
| 5 to 17 Years | 27 (2.0%) | 15 (1.0%) |
| 18 to 34 Years | 407 (2.2%) | 621 (4.7%) |
| 35 to 64 Years | 185 (6.1%) | 62 (2.0%) |
| 65 to 74 Years | 21 (2.8%) | 36 (4.7%) |
| 75 Years and over | 7 (1.1%) | 115 (12.6%) |
Disability Class: Ambulatory Difficulty
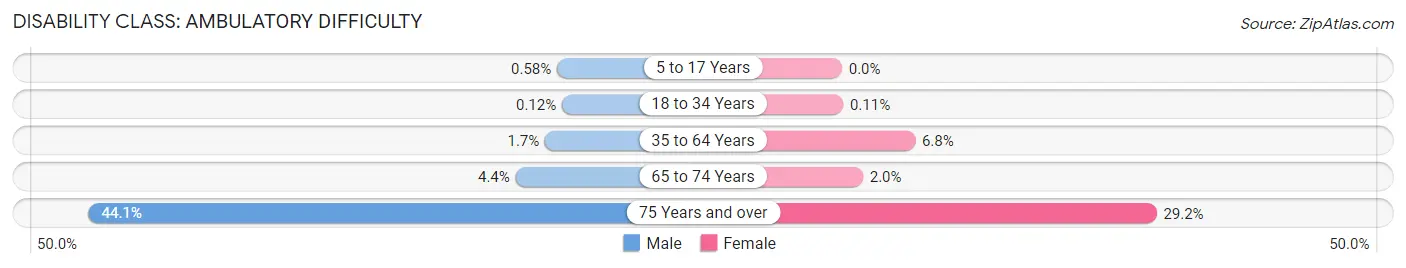
| Age Bracket | Male | Female |
| 5 to 17 Years | 8 (0.6%) | 0 (0.0%) |
| 18 to 34 Years | 22 (0.1%) | 15 (0.1%) |
| 35 to 64 Years | 51 (1.7%) | 209 (6.8%) |
| 65 to 74 Years | 33 (4.4%) | 15 (1.9%) |
| 75 Years and over | 274 (44.1%) | 266 (29.2%) |
Disability Class: Self-Care Difficulty
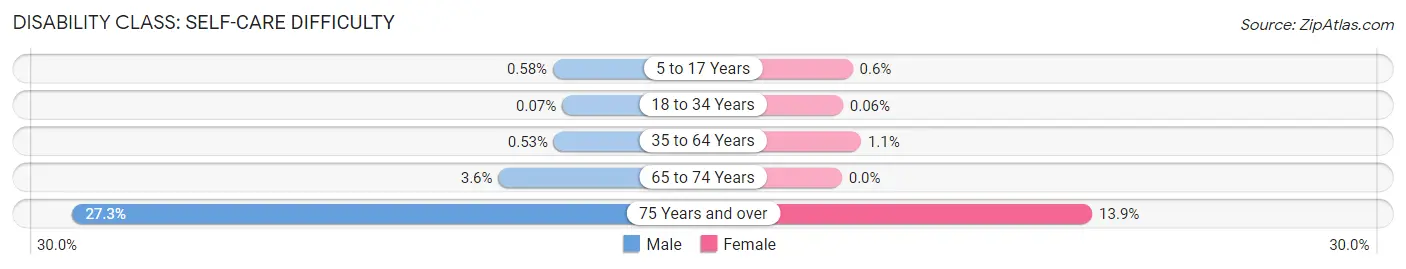
| Age Bracket | Male | Female |
| 5 to 17 Years | 8 (0.6%) | 9 (0.6%) |
| 18 to 34 Years | 13 (0.1%) | 8 (0.1%) |
| 35 to 64 Years | 16 (0.5%) | 33 (1.1%) |
| 65 to 74 Years | 27 (3.6%) | 0 (0.0%) |
| 75 Years and over | 170 (27.3%) | 127 (13.9%) |
Technology Access in West Lafayette
Computing Device Access in West Lafayette
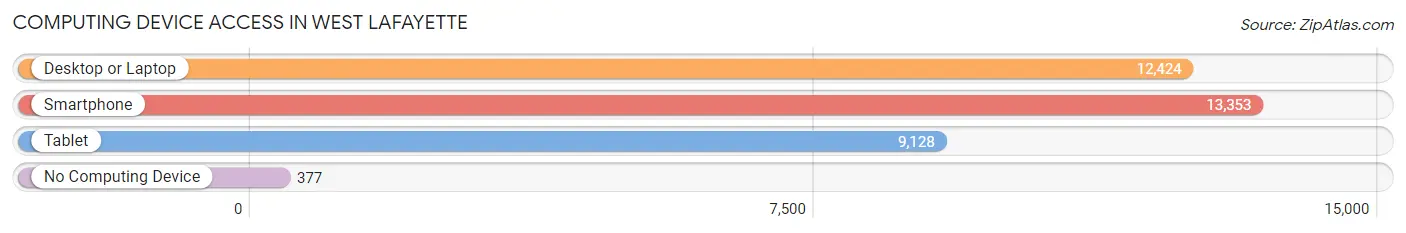
| Device Type | # Households | % Households |
| Desktop or Laptop | 12,424 | 88.1% |
| Smartphone | 13,353 | 94.7% |
| Tablet | 9,128 | 64.7% |
| No Computing Device | 377 | 2.7% |
| Total | 14,097 | 100.0% |
Internet Access in West Lafayette
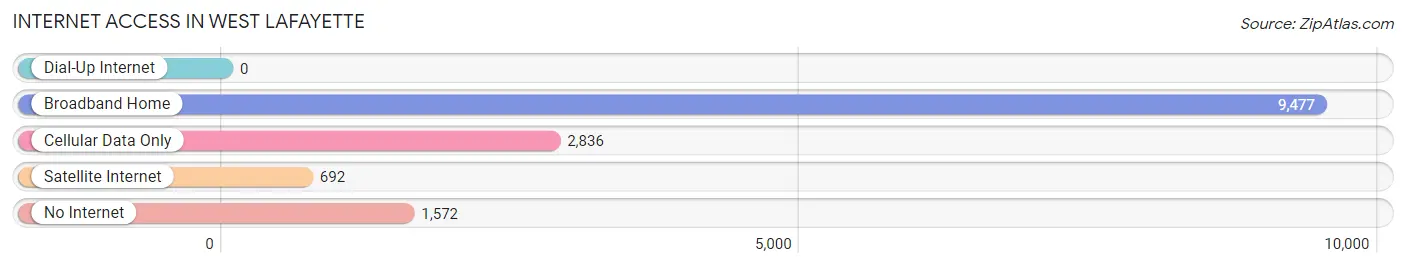
| Internet Type | # Households | % Households |
| Dial-Up Internet | 0 | 0.0% |
| Broadband Home | 9,477 | 67.2% |
| Cellular Data Only | 2,836 | 20.1% |
| Satellite Internet | 692 | 4.9% |
| No Internet | 1,572 | 11.2% |
| Total | 14,097 | 100.0% |
West Lafayette Summary
West Lafayette, Indiana is a city located in Tippecanoe County, Indiana, United States. It is part of the Lafayette, Indiana Metropolitan Statistical Area. As of the 2010 census, the city had a total population of 29,596. It is the most densely populated city in Indiana and is home to Purdue University.
History
West Lafayette was founded in 1838 by William Digby, a Quaker from North Carolina. He purchased land from the Native Americans and established a trading post. The town was originally called Chauncey, but was later renamed West Lafayette in 1845. The city was incorporated in 1888.
In the late 19th century, West Lafayette was a major center for the production of agricultural products, including wheat, corn, and oats. The city was also home to several manufacturing companies, including the West Lafayette Foundry and Machine Works, which produced farm implements and other machinery.
Geography
West Lafayette is located in the western part of Tippecanoe County, Indiana, at 40°25'N 86°52'W (40.4139, -86.8667). The city is situated on the banks of the Wabash River, which forms the border between Indiana and Illinois. The city has a total area of 8.7 square miles (22.5 km2), of which 8.6 square miles (22.3 km2) is land and 0.1 square miles (0.2 km2) is water.
Economy
West Lafayette is home to Purdue University, which is the largest employer in the city. Other major employers include the city government, the Tippecanoe County government, and local businesses. The city also has a thriving retail sector, with several shopping centers and malls.
Demographics
As of the 2010 census, there were 29,596 people, 11,945 households, and 5,845 families residing in the city. The population density was 3,427.2 people per square mile (1,323.2/km2). There were 12,844 housing units at an average density of 1,478.3 per square mile (571.2/km2). The racial makeup of the city was 79.2% White, 8.7% African American, 0.3% Native American, 8.9% Asian, 0.1% Pacific Islander, 0.8% from other races, and 2.1% from two or more races. Hispanic or Latino of any race were 3.3% of the population.
There were 11,945 households, out of which 20.2% had children under the age of 18 living with them, 37.2% were married couples living together, 8.2% had a female householder with no husband present, and 51.3% were non-families. 36.2% of all households were made up of individuals, and 8.3% had someone living alone who was 65 years of age or older. The average household size was 2.17 and the average family size was 2.86.
In the city, the population was spread out, with 17.2% under the age of 18, 28.2% from 18 to 24, 28.2% from 25 to 44, 17.2% from 45 to 64, and 9.2% who were 65 years of age or older. The median age was 25 years. For every 100 females, there were 103.3 males. For every 100 females age 18 and over, there were 103.2 males.
The median income for a household in the city was $37,945, and the median income for a family was $58,821. Males had a median income of $40,821 versus $30,845 for females. The per capita income for the city was $20,845. About 8.2% of families and 22.2% of the population were below the poverty line, including 15.2% of those under age 18 and 5.2% of those age 65 or over.
Common Questions
What is Per Capita Income in West Lafayette?
Per Capita income in West Lafayette is $21,559.
What is the Median Family Income in West Lafayette?
Median Family Income in West Lafayette is $101,331.
What is the Median Household income in West Lafayette?
Median Household Income in West Lafayette is $30,317.
What is Income or Wage Gap in West Lafayette?
Income or Wage Gap in West Lafayette is 28.3%.
Women in West Lafayette earn 71.7 cents for every dollar earned by a man.
What is Family Income Deficit in West Lafayette?
Family Income Deficit in West Lafayette is $8,340.
Families that are below poverty line in West Lafayette earn $8,340 less on average than the poverty threshold level.
What is Inequality or Gini Index in West Lafayette?
Inequality or Gini Index in West Lafayette is 0.60.
What is the Total Population of West Lafayette?
Total Population of West Lafayette is 44,861.
What is the Total Male Population of West Lafayette?
Total Male Population of West Lafayette is 24,837.
What is the Total Female Population of West Lafayette?
Total Female Population of West Lafayette is 20,024.
What is the Ratio of Males per 100 Females in West Lafayette?
There are 124.04 Males per 100 Females in West Lafayette.
What is the Ratio of Females per 100 Males in West Lafayette?
There are 80.62 Females per 100 Males in West Lafayette.
What is the Median Population Age in West Lafayette?
Median Population Age in West Lafayette is 21.4 Years.
What is the Average Family Size in West Lafayette
Average Family Size in West Lafayette is 3.0 People.
What is the Average Household Size in West Lafayette
Average Household Size in West Lafayette is 2.2 People.
How Large is the Labor Force in West Lafayette?
There are 20,518 People in the Labor Forcein in West Lafayette.
What is the Percentage of People in the Labor Force in West Lafayette?
49.3% of People are in the Labor Force in West Lafayette.
What is the Unemployment Rate in West Lafayette?
Unemployment Rate in West Lafayette is 3.3%.