Dodge City, KS Map & Demographics
Dodge City Map
Dodge City Overview
$27,441
PER CAPITA INCOME
$76,952
AVG FAMILY INCOME
$66,932
AVG HOUSEHOLD INCOME
28.2%
WAGE / INCOME GAP [ % ]
71.8¢/ $1
WAGE / INCOME GAP [ $ ]
$8,720
FAMILY INCOME DEFICIT
0.40
INEQUALITY / GINI INDEX
27,721
TOTAL POPULATION
14,087
MALE POPULATION
13,634
FEMALE POPULATION
103.32
MALES / 100 FEMALES
96.78
FEMALES / 100 MALES
30.3
MEDIAN AGE
3.5
AVG FAMILY SIZE
3.0
AVG HOUSEHOLD SIZE
14,392
LABOR FORCE [ PEOPLE ]
71.4%
PERCENT IN LABOR FORCE
3.6%
UNEMPLOYMENT RATE
Dodge City Zip Codes
Dodge City Area Codes
Income in Dodge City
Income Overview in Dodge City
Per Capita Income in Dodge City is $27,441, while median incomes of families and households are $76,952 and $66,932 respectively.
| Characteristic | Number | Measure |
| Per Capita Income | 27,721 | $27,441 |
| Median Family Income | 6,294 | $76,952 |
| Mean Family Income | 6,294 | $89,732 |
| Median Household Income | 9,050 | $66,932 |
| Mean Household Income | 9,050 | $80,411 |
| Income Deficit | 6,294 | $8,720 |
| Wage / Income Gap (%) | 27,721 | 28.17% |
| Wage / Income Gap ($) | 27,721 | 71.83¢ per $1 |
| Gini / Inequality Index | 27,721 | 0.40 |
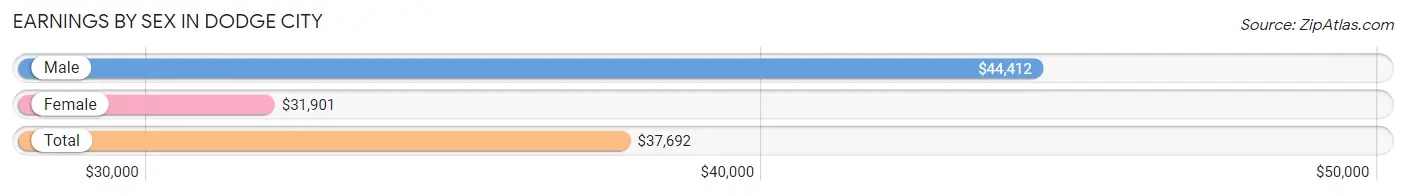
Earnings by Sex in Dodge City
Average Earnings in Dodge City are $37,692, $44,412 for men and $31,901 for women, a difference of 28.2%.
| Sex | Number | Average Earnings |
| Male | 8,538 (57.2%) | $44,412 |
| Female | 6,392 (42.8%) | $31,901 |
| Total | 14,930 (100.0%) | $37,692 |
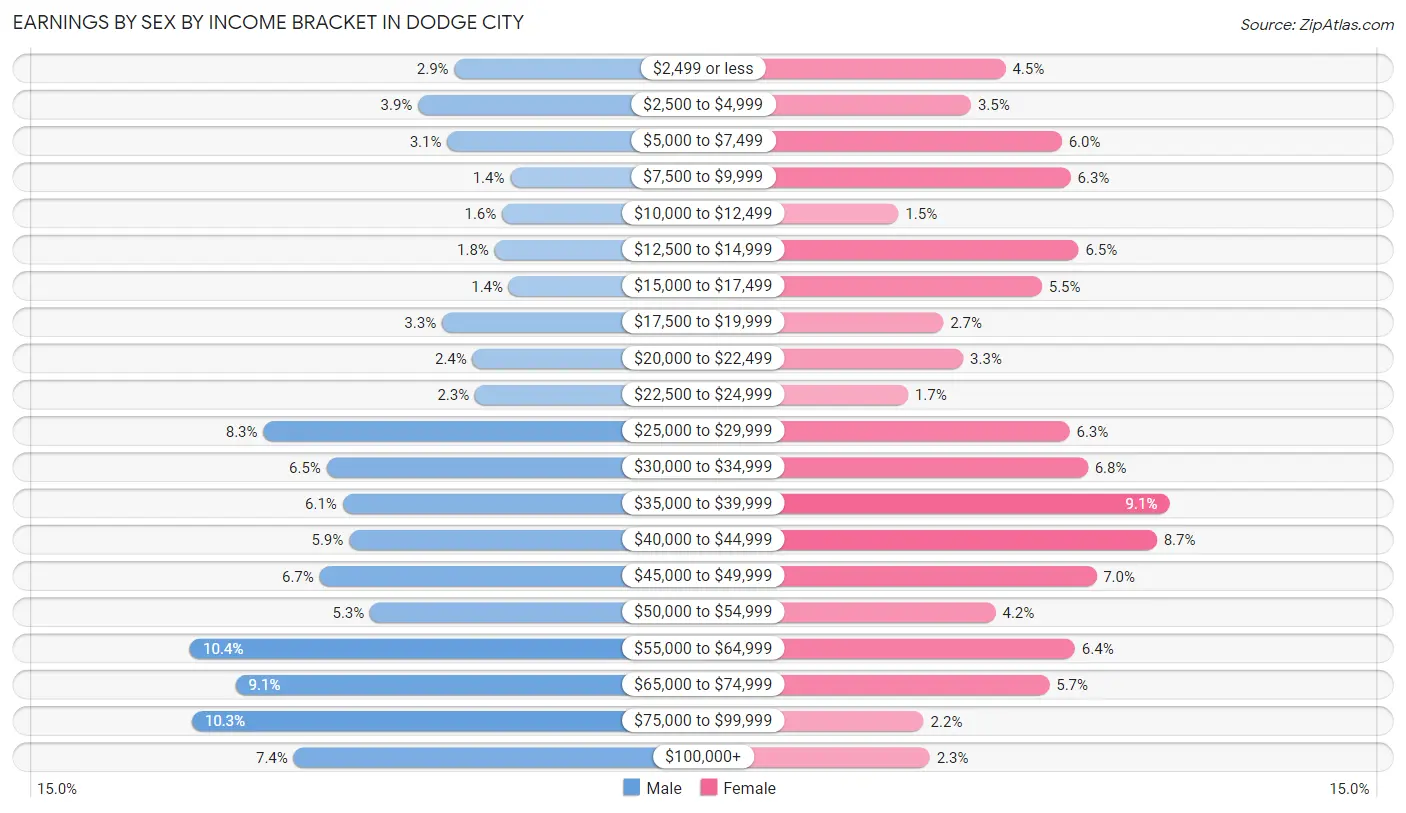
Earnings by Sex by Income Bracket in Dodge City
The most common earnings brackets in Dodge City are $55,000 to $64,999 for men (884 | 10.3%) and $35,000 to $39,999 for women (579 | 9.1%).
| Income | Male | Female |
| $2,499 or less | 249 (2.9%) | 285 (4.5%) |
| $2,500 to $4,999 | 336 (3.9%) | 223 (3.5%) |
| $5,000 to $7,499 | 266 (3.1%) | 386 (6.0%) |
| $7,500 to $9,999 | 115 (1.3%) | 402 (6.3%) |
| $10,000 to $12,499 | 135 (1.6%) | 93 (1.5%) |
| $12,500 to $14,999 | 153 (1.8%) | 416 (6.5%) |
| $15,000 to $17,499 | 119 (1.4%) | 350 (5.5%) |
| $17,500 to $19,999 | 279 (3.3%) | 173 (2.7%) |
| $20,000 to $22,499 | 206 (2.4%) | 209 (3.3%) |
| $22,500 to $24,999 | 200 (2.3%) | 110 (1.7%) |
| $25,000 to $29,999 | 708 (8.3%) | 400 (6.3%) |
| $30,000 to $34,999 | 556 (6.5%) | 433 (6.8%) |
| $35,000 to $39,999 | 517 (6.1%) | 579 (9.1%) |
| $40,000 to $44,999 | 502 (5.9%) | 557 (8.7%) |
| $45,000 to $49,999 | 573 (6.7%) | 448 (7.0%) |
| $50,000 to $54,999 | 452 (5.3%) | 267 (4.2%) |
| $55,000 to $64,999 | 884 (10.3%) | 410 (6.4%) |
| $65,000 to $74,999 | 774 (9.1%) | 364 (5.7%) |
| $75,000 to $99,999 | 879 (10.3%) | 138 (2.2%) |
| $100,000+ | 635 (7.4%) | 149 (2.3%) |
| Total | 8,538 (100.0%) | 6,392 (100.0%) |
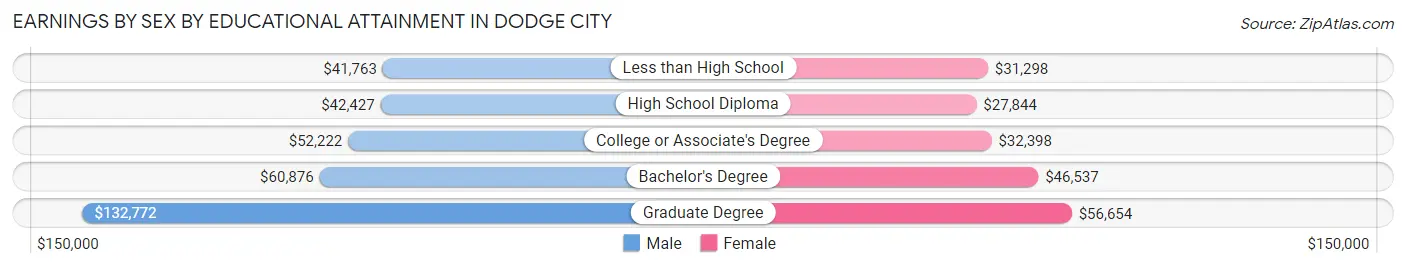
Earnings by Sex by Educational Attainment in Dodge City
Average earnings in Dodge City are $48,446 for men and $36,594 for women, a difference of 24.5%. Men with an educational attainment of graduate degree enjoy the highest average annual earnings of $132,772, while those with less than high school education earn the least with $41,763. Women with an educational attainment of graduate degree earn the most with the average annual earnings of $56,654, while those with high school diploma education have the smallest earnings of $27,844.
| Educational Attainment | Male Income | Female Income |
| Less than High School | $41,763 | $31,298 |
| High School Diploma | $42,427 | $27,844 |
| College or Associate's Degree | $52,222 | $32,398 |
| Bachelor's Degree | $60,876 | $46,537 |
| Graduate Degree | $132,772 | $56,654 |
| Total | $48,446 | $36,594 |
Family Income in Dodge City
Family Income Brackets in Dodge City
According to the Dodge City family income data, there are 1,429 families falling into the $75,000 to $99,999 income range, which is the most common income bracket and makes up 22.7% of all families. Conversely, the $10,000 to $14,999 income bracket is the least frequent group with only 113 families (1.8%) belonging to this category.
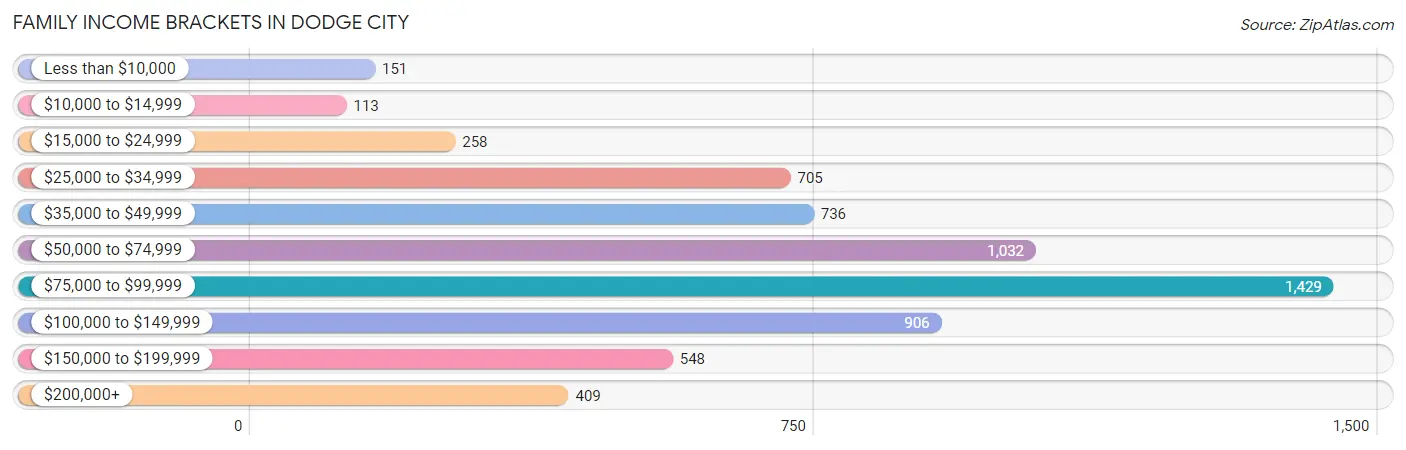
| Income Bracket | # Families | % Families |
| Less than $10,000 | 151 | 2.4% |
| $10,000 to $14,999 | 113 | 1.8% |
| $15,000 to $24,999 | 258 | 4.1% |
| $25,000 to $34,999 | 705 | 11.2% |
| $35,000 to $49,999 | 736 | 11.7% |
| $50,000 to $74,999 | 1,032 | 16.4% |
| $75,000 to $99,999 | 1,429 | 22.7% |
| $100,000 to $149,999 | 906 | 14.4% |
| $150,000 to $199,999 | 548 | 8.7% |
| $200,000+ | 409 | 6.5% |
Family Income by Famaliy Size in Dodge City
7+ person families (53 | 0.8%) account for the highest median family income in Dodge City with $120,046 per family, while 2-person families (2,135 | 33.9%) have the highest median income of $37,720 per family member.
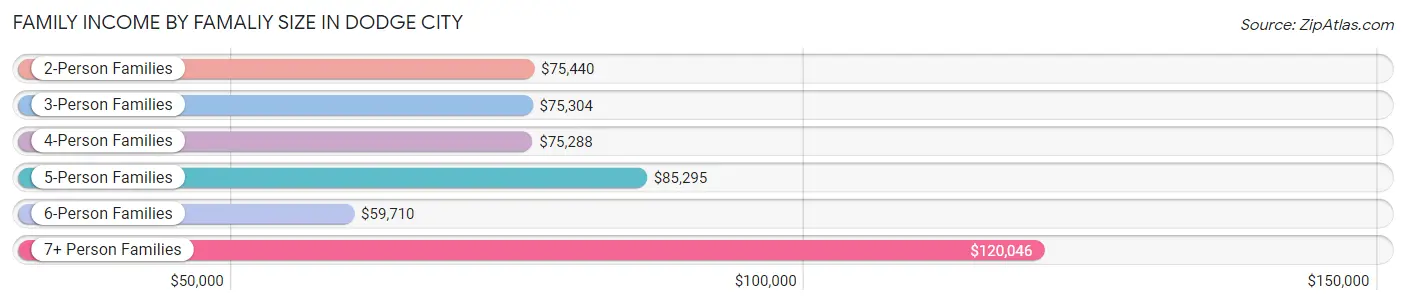
| Income Bracket | # Families | Median Income |
| 2-Person Families | 2,135 (33.9%) | $75,440 |
| 3-Person Families | 1,591 (25.3%) | $75,304 |
| 4-Person Families | 1,413 (22.5%) | $75,288 |
| 5-Person Families | 627 (10.0%) | $85,295 |
| 6-Person Families | 475 (7.5%) | $59,710 |
| 7+ Person Families | 53 (0.8%) | $120,046 |
| Total | 6,294 (100.0%) | $76,952 |
Family Income by Number of Earners in Dodge City
The median family income in Dodge City is $76,952, with families comprising 3+ earners (853) having the highest median family income of $127,666, while families with no earners (298) have the lowest median family income of $33,413, accounting for 13.6% and 4.7% of families, respectively.
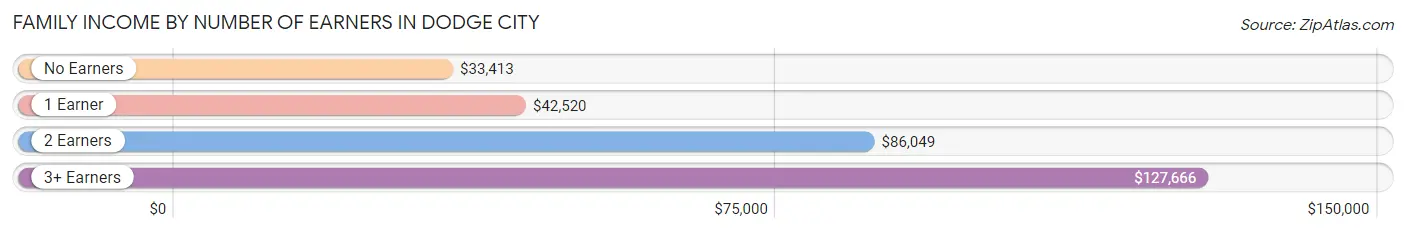
| Number of Earners | # Families | Median Income |
| No Earners | 298 (4.7%) | $33,413 |
| 1 Earner | 2,435 (38.7%) | $42,520 |
| 2 Earners | 2,708 (43.0%) | $86,049 |
| 3+ Earners | 853 (13.6%) | $127,666 |
| Total | 6,294 (100.0%) | $76,952 |
Household Income in Dodge City
Household Income Brackets in Dodge City
With 1,765 households falling in the category, the $75,000 to $99,999 income range is the most frequent in Dodge City, accounting for 19.5% of all households. In contrast, only 127 households (1.4%) fall into the $10,000 to $14,999 income bracket, making it the least populous group.
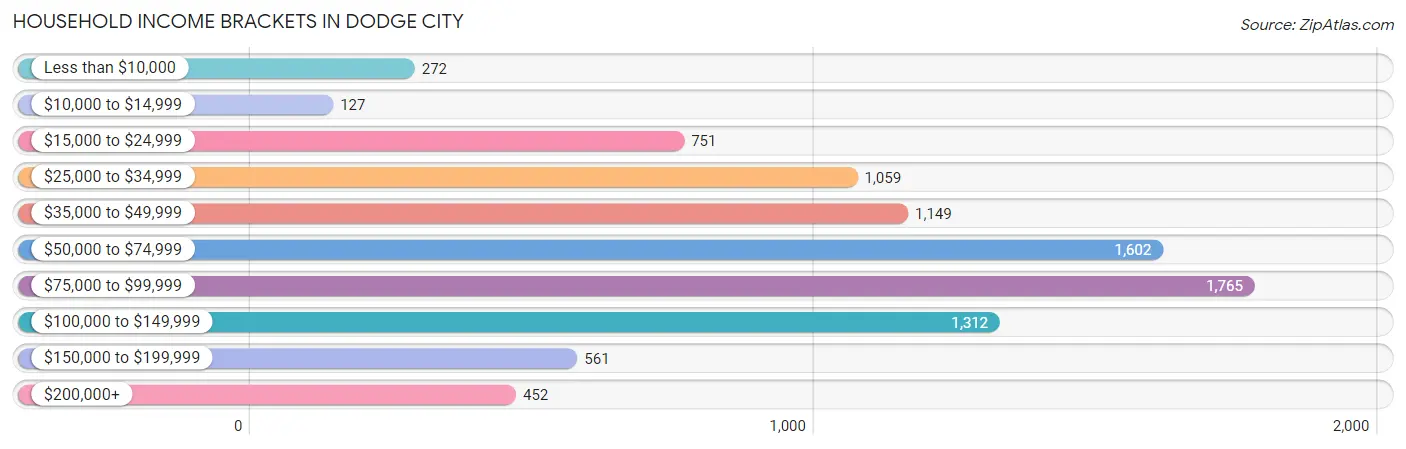
| Income Bracket | # Households | % Households |
| Less than $10,000 | 272 | 3.0% |
| $10,000 to $14,999 | 127 | 1.4% |
| $15,000 to $24,999 | 751 | 8.3% |
| $25,000 to $34,999 | 1,059 | 11.7% |
| $35,000 to $49,999 | 1,149 | 12.7% |
| $50,000 to $74,999 | 1,602 | 17.7% |
| $75,000 to $99,999 | 1,765 | 19.5% |
| $100,000 to $149,999 | 1,312 | 14.5% |
| $150,000 to $199,999 | 561 | 6.2% |
| $200,000+ | 452 | 5.0% |
Household Income by Householder Age in Dodge City
The median household income in Dodge City is $66,932, with the highest median household income of $79,511 found in the 45 to 64 years age bracket for the primary householder. A total of 3,264 households (36.1%) fall into this category. Meanwhile, the 65+ years age bracket for the primary householder has the lowest median household income of $36,113, with 1,656 households (18.3%) in this group.
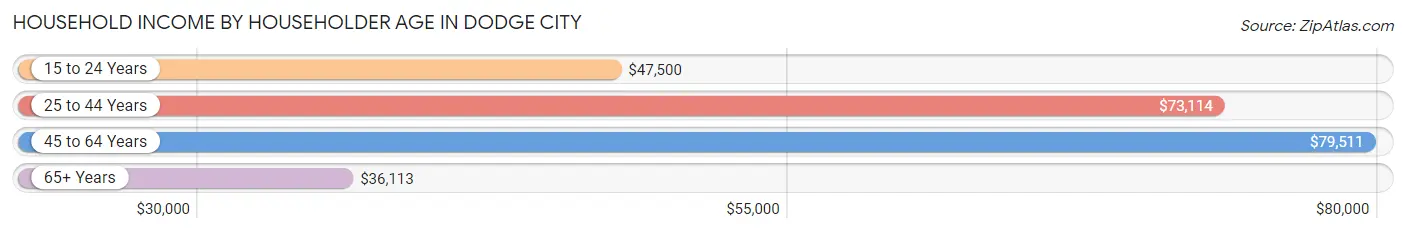
| Income Bracket | # Households | Median Income |
| 15 to 24 Years | 564 (6.2%) | $47,500 |
| 25 to 44 Years | 3,566 (39.4%) | $73,114 |
| 45 to 64 Years | 3,264 (36.1%) | $79,511 |
| 65+ Years | 1,656 (18.3%) | $36,113 |
| Total | 9,050 (100.0%) | $66,932 |
Poverty in Dodge City
Income Below Poverty by Sex and Age in Dodge City
With 10.5% poverty level for males and 15.0% for females among the residents of Dodge City, 5 year old males and 18 to 24 year old females are the most vulnerable to poverty, with 83 males (53.9%) and 371 females (27.7%) in their respective age groups living below the poverty level.
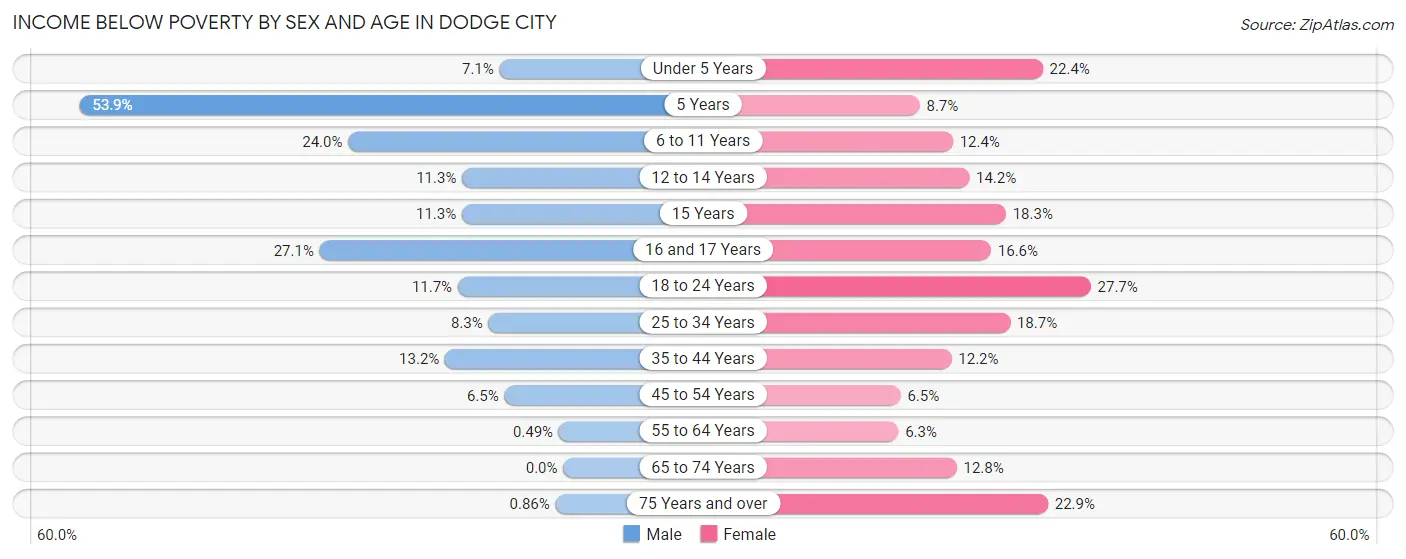
| Age Bracket | Male | Female |
| Under 5 Years | 80 (7.1%) | 247 (22.4%) |
| 5 Years | 83 (53.9%) | 31 (8.7%) |
| 6 to 11 Years | 309 (23.9%) | 170 (12.3%) |
| 12 to 14 Years | 101 (11.3%) | 101 (14.2%) |
| 15 Years | 22 (11.3%) | 21 (18.3%) |
| 16 and 17 Years | 121 (27.1%) | 85 (16.6%) |
| 18 to 24 Years | 186 (11.7%) | 371 (27.7%) |
| 25 to 34 Years | 168 (8.3%) | 341 (18.7%) |
| 35 to 44 Years | 241 (13.2%) | 201 (12.2%) |
| 45 to 54 Years | 107 (6.5%) | 102 (6.5%) |
| 55 to 64 Years | 7 (0.5%) | 92 (6.3%) |
| 65 to 74 Years | 0 (0.0%) | 91 (12.8%) |
| 75 Years and over | 3 (0.9%) | 159 (22.9%) |
| Total | 1,428 (10.5%) | 2,012 (15.0%) |
Income Above Poverty by Sex and Age in Dodge City
According to the poverty statistics in Dodge City, males aged 65 to 74 years and females aged 55 to 64 years are the age groups that are most secure financially, with 100.0% of males and 93.7% of females in these age groups living above the poverty line.
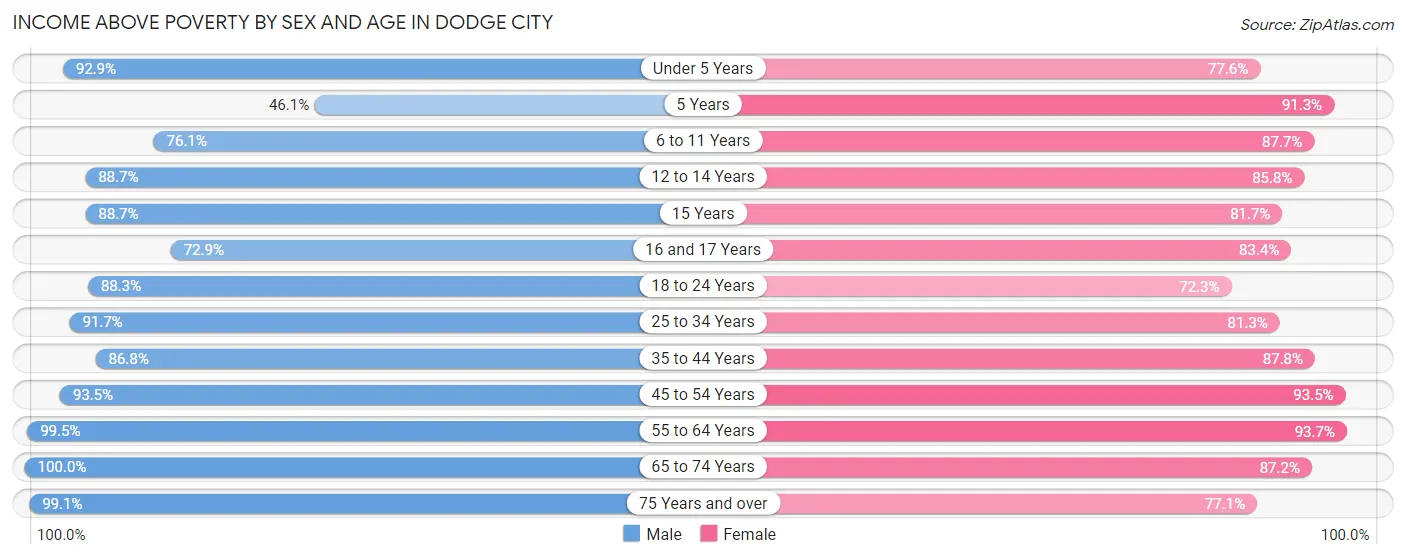
| Age Bracket | Male | Female |
| Under 5 Years | 1,046 (92.9%) | 857 (77.6%) |
| 5 Years | 71 (46.1%) | 327 (91.3%) |
| 6 to 11 Years | 981 (76.0%) | 1,206 (87.6%) |
| 12 to 14 Years | 796 (88.7%) | 612 (85.8%) |
| 15 Years | 173 (88.7%) | 94 (81.7%) |
| 16 and 17 Years | 325 (72.9%) | 427 (83.4%) |
| 18 to 24 Years | 1,399 (88.3%) | 968 (72.3%) |
| 25 to 34 Years | 1,849 (91.7%) | 1,480 (81.3%) |
| 35 to 44 Years | 1,591 (86.8%) | 1,446 (87.8%) |
| 45 to 54 Years | 1,529 (93.5%) | 1,459 (93.5%) |
| 55 to 64 Years | 1,432 (99.5%) | 1,374 (93.7%) |
| 65 to 74 Years | 573 (100.0%) | 621 (87.2%) |
| 75 Years and over | 346 (99.1%) | 534 (77.1%) |
| Total | 12,111 (89.4%) | 11,405 (85.0%) |
Income Below Poverty Among Married-Couple Families in Dodge City
The poverty statistics for married-couple families in Dodge City show that 3.9% or 161 of the total 4,165 families live below the poverty line. Families with 3 or 4 children have the highest poverty rate of 17.1%, comprising of 105 families. On the other hand, families with 5 or more children have the lowest poverty rate of 0.0%, which includes 0 families.
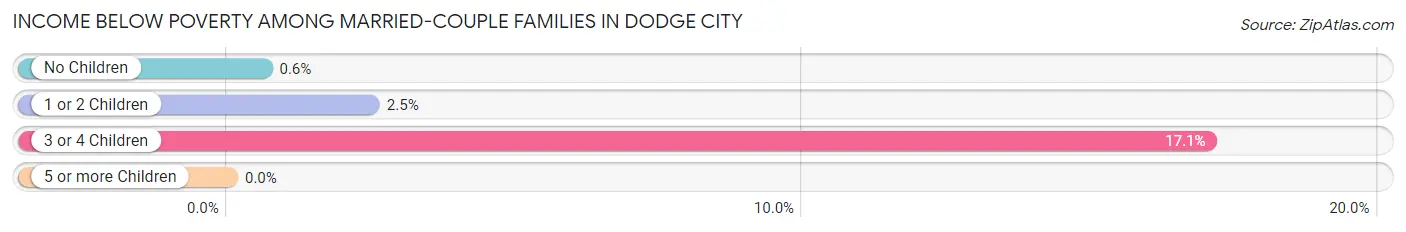
| Children | Above Poverty | Below Poverty |
| No Children | 1,649 (99.4%) | 10 (0.6%) |
| 1 or 2 Children | 1,820 (97.5%) | 46 (2.5%) |
| 3 or 4 Children | 511 (83.0%) | 105 (17.1%) |
| 5 or more Children | 24 (100.0%) | 0 (0.0%) |
| Total | 4,004 (96.1%) | 161 (3.9%) |
Income Below Poverty Among Single-Parent Households in Dodge City
According to the poverty data in Dodge City, 10.0% or 42 single-father households and 29.4% or 503 single-mother households are living below the poverty line. Among single-father households, those with 3 or 4 children have the highest poverty rate, with 11 households (25.0%) experiencing poverty. Likewise, among single-mother households, those with 1 or 2 children have the highest poverty rate, with 359 households (40.7%) falling below the poverty line.
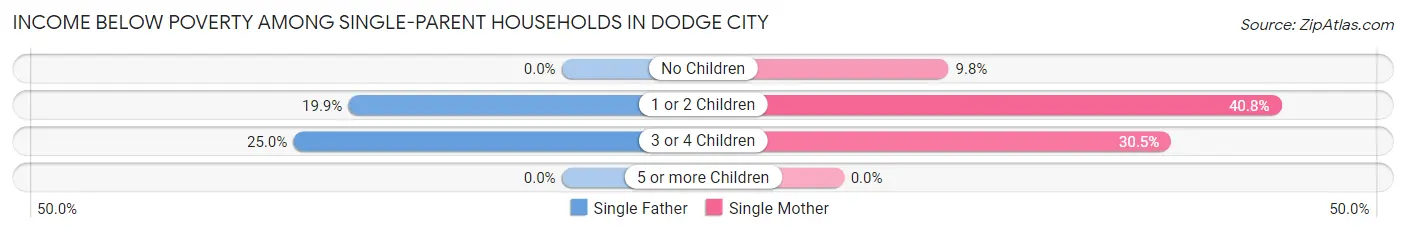
| Children | Single Father | Single Mother |
| No Children | 0 (0.0%) | 51 (9.8%) |
| 1 or 2 Children | 31 (19.9%) | 359 (40.7%) |
| 3 or 4 Children | 11 (25.0%) | 93 (30.5%) |
| 5 or more Children | 0 (0.0%) | 0 (0.0%) |
| Total | 42 (10.0%) | 503 (29.4%) |
Income Below Poverty Among Married-Couple vs Single-Parent Households in Dodge City
The poverty data for Dodge City shows that 161 of the married-couple family households (3.9%) and 545 of the single-parent households (25.6%) are living below the poverty level. Within the married-couple family households, those with 3 or 4 children have the highest poverty rate, with 105 households (17.1%) falling below the poverty line. Among the single-parent households, those with 1 or 2 children have the highest poverty rate, with 390 household (37.6%) living below poverty.
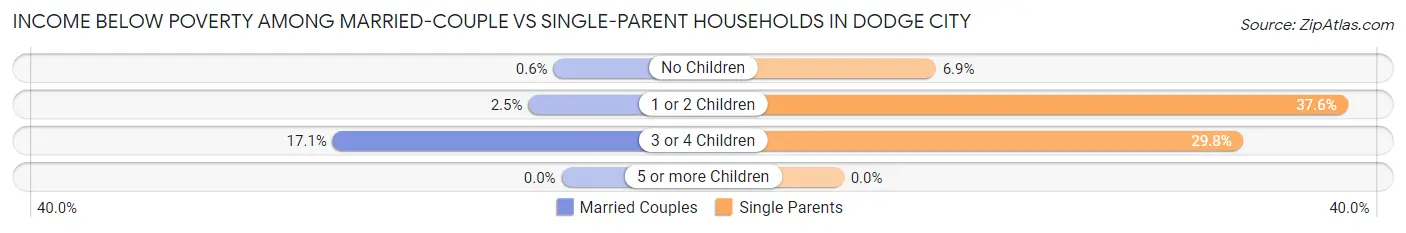
| Children | Married-Couple Families | Single-Parent Households |
| No Children | 10 (0.6%) | 51 (6.9%) |
| 1 or 2 Children | 46 (2.5%) | 390 (37.6%) |
| 3 or 4 Children | 105 (17.1%) | 104 (29.8%) |
| 5 or more Children | 0 (0.0%) | 0 (0.0%) |
| Total | 161 (3.9%) | 545 (25.6%) |
Race in Dodge City
The most populous races in Dodge City are Hispanic or Latino (18,105 | 65.3%), White / Caucasian (17,182 | 62.0%), and Two or more Races (4,877 | 17.6%).
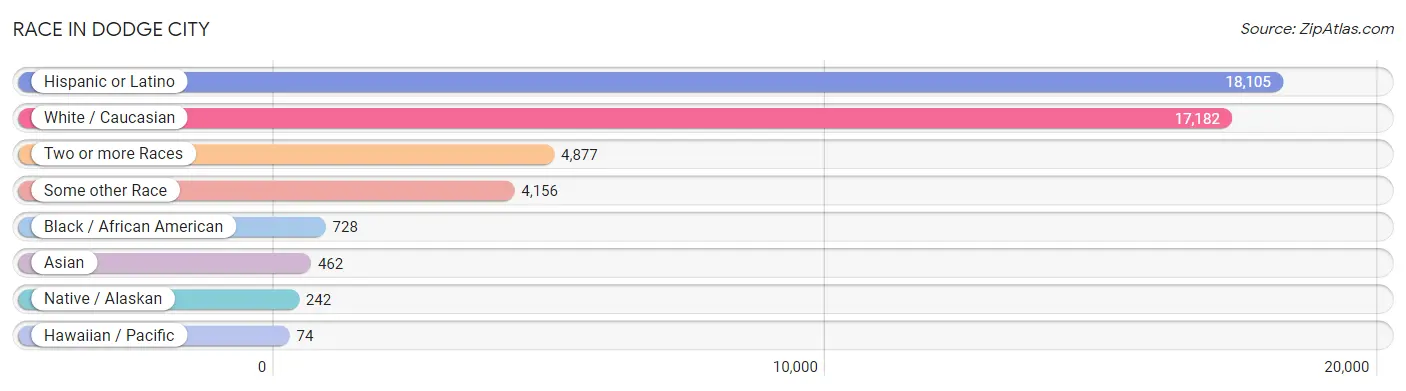
| Race | # Population | % Population |
| Asian | 462 | 1.7% |
| Black / African American | 728 | 2.6% |
| Hawaiian / Pacific | 74 | 0.3% |
| Hispanic or Latino | 18,105 | 65.3% |
| Native / Alaskan | 242 | 0.9% |
| White / Caucasian | 17,182 | 62.0% |
| Two or more Races | 4,877 | 17.6% |
| Some other Race | 4,156 | 15.0% |
| Total | 27,721 | 100.0% |
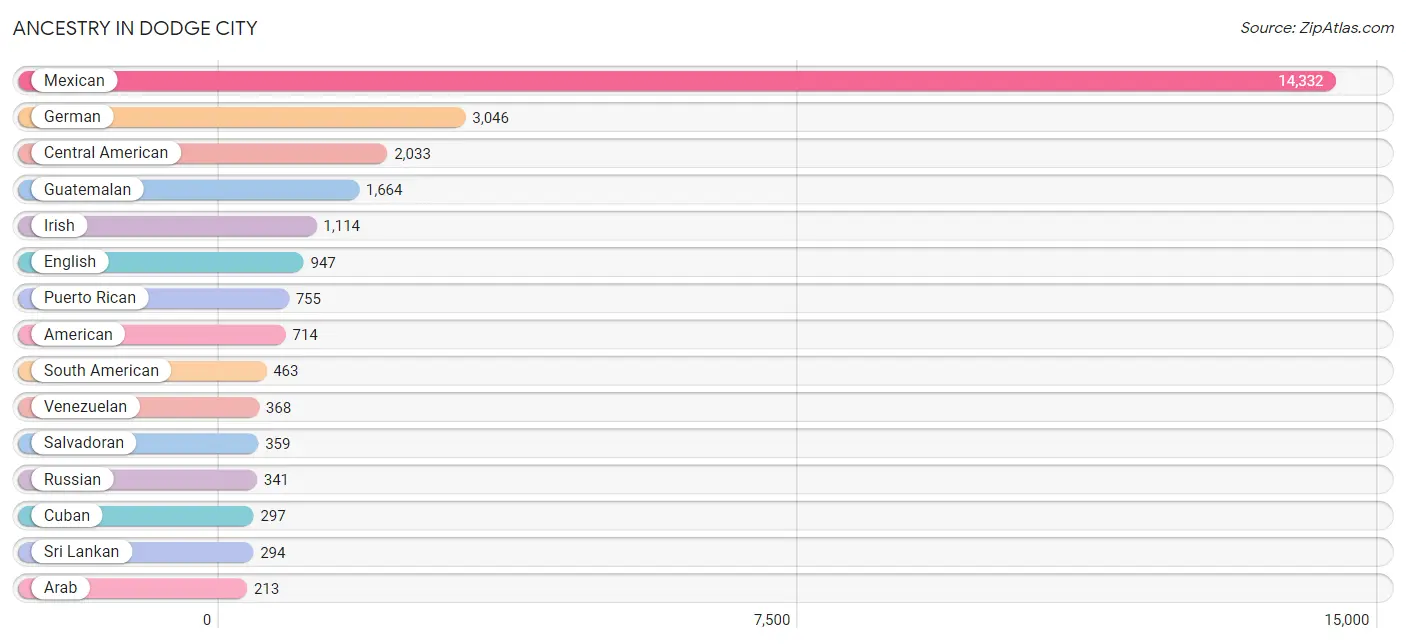
Ancestry in Dodge City
The most populous ancestries reported in Dodge City are Mexican (14,332 | 51.7%), German (3,046 | 11.0%), Central American (2,033 | 7.3%), Guatemalan (1,664 | 6.0%), and Irish (1,114 | 4.0%), together accounting for 80.0% of all Dodge City residents.
| Ancestry | # Population | % Population |
| African | 75 | 0.3% |
| American | 714 | 2.6% |
| Apache | 49 | 0.2% |
| Arab | 213 | 0.8% |
| Armenian | 4 | 0.0% |
| Bhutanese | 29 | 0.1% |
| Blackfeet | 5 | 0.0% |
| Brazilian | 35 | 0.1% |
| British | 28 | 0.1% |
| Burmese | 129 | 0.5% |
| Central American | 2,033 | 7.3% |
| Central American Indian | 90 | 0.3% |
| Cherokee | 86 | 0.3% |
| Choctaw | 67 | 0.2% |
| Colombian | 62 | 0.2% |
| Costa Rican | 10 | 0.0% |
| Cuban | 297 | 1.1% |
| Czech | 179 | 0.6% |
| Czechoslovakian | 13 | 0.1% |
| Danish | 36 | 0.1% |
| Dominican | 37 | 0.1% |
| Dutch | 166 | 0.6% |
| English | 947 | 3.4% |
| European | 82 | 0.3% |
| French | 127 | 0.5% |
| French Canadian | 43 | 0.2% |
| German | 3,046 | 11.0% |
| German Russian | 10 | 0.0% |
| Guatemalan | 1,664 | 6.0% |
| Indian (Asian) | 30 | 0.1% |
| Irish | 1,114 | 4.0% |
| Italian | 137 | 0.5% |
| Korean | 67 | 0.2% |
| Lebanese | 213 | 0.8% |
| Malaysian | 11 | 0.0% |
| Mexican | 14,332 | 51.7% |
| Mexican American Indian | 25 | 0.1% |
| Navajo | 86 | 0.3% |
| Osage | 5 | 0.0% |
| Pakistani | 24 | 0.1% |
| Peruvian | 33 | 0.1% |
| Polish | 185 | 0.7% |
| Puerto Rican | 755 | 2.7% |
| Russian | 341 | 1.2% |
| Salvadoran | 359 | 1.3% |
| Scandinavian | 20 | 0.1% |
| Scotch-Irish | 110 | 0.4% |
| Scottish | 133 | 0.5% |
| Slovak | 8 | 0.0% |
| South American | 463 | 1.7% |
| Spanish | 13 | 0.1% |
| Sri Lankan | 294 | 1.1% |
| Subsaharan African | 120 | 0.4% |
| Sudanese | 20 | 0.1% |
| Swedish | 101 | 0.4% |
| Swiss | 19 | 0.1% |
| Ukrainian | 5 | 0.0% |
| Venezuelan | 368 | 1.3% |
| Welsh | 24 | 0.1% |
| Zimbabwean | 23 | 0.1% | View All 60 Rows |
Immigrants in Dodge City
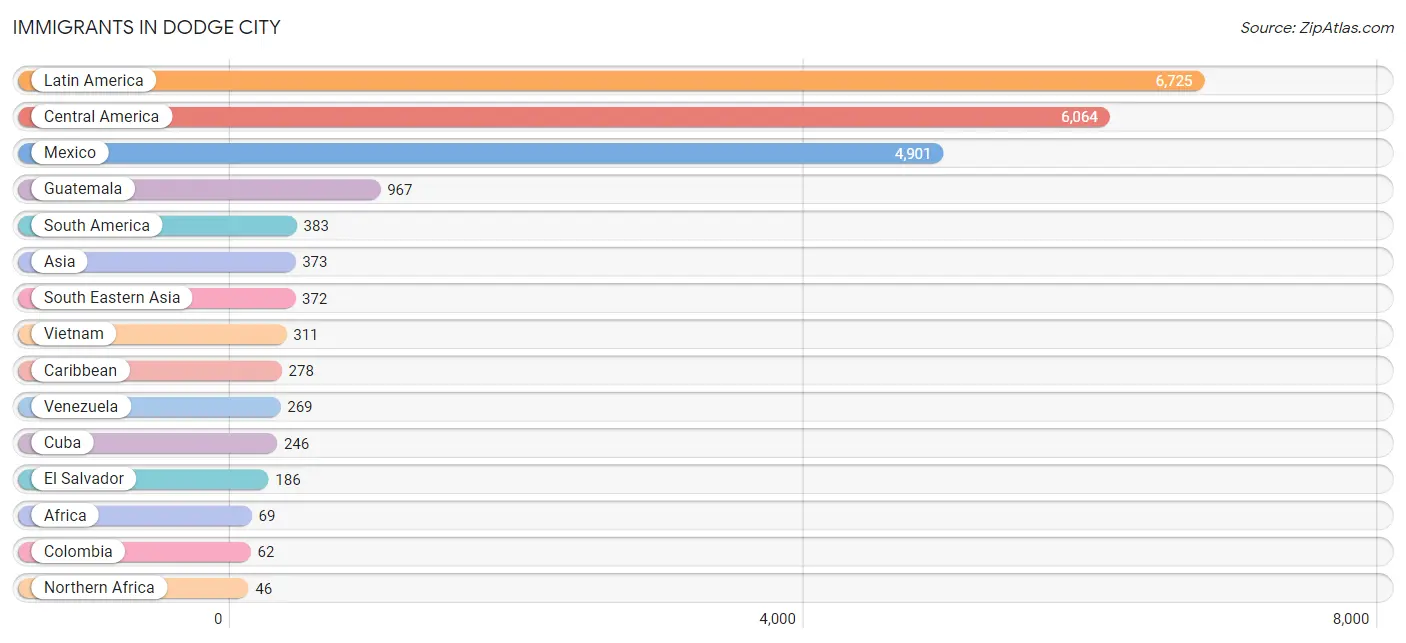
The most numerous immigrant groups reported in Dodge City came from Latin America (6,725 | 24.3%), Central America (6,064 | 21.9%), Mexico (4,901 | 17.7%), Guatemala (967 | 3.5%), and South America (383 | 1.4%), together accounting for 68.7% of all Dodge City residents.
| Immigration Origin | # Population | % Population |
| Africa | 69 | 0.3% |
| Asia | 373 | 1.3% |
| Brazil | 19 | 0.1% |
| Caribbean | 278 | 1.0% |
| Central America | 6,064 | 21.9% |
| Colombia | 62 | 0.2% |
| Cuba | 246 | 0.9% |
| Dominican Republic | 32 | 0.1% |
| Eastern Africa | 23 | 0.1% |
| Eastern Asia | 1 | 0.0% |
| Eastern Europe | 10 | 0.0% |
| El Salvador | 186 | 0.7% |
| England | 3 | 0.0% |
| Europe | 25 | 0.1% |
| Germany | 12 | 0.0% |
| Guatemala | 967 | 3.5% |
| Honduras | 10 | 0.0% |
| Korea | 1 | 0.0% |
| Latin America | 6,725 | 24.3% |
| Mexico | 4,901 | 17.7% |
| Micronesia | 32 | 0.1% |
| Northern Africa | 46 | 0.2% |
| Northern Europe | 3 | 0.0% |
| Oceania | 32 | 0.1% |
| Peru | 33 | 0.1% |
| Philippines | 37 | 0.1% |
| Russia | 10 | 0.0% |
| South America | 383 | 1.4% |
| South Eastern Asia | 372 | 1.3% |
| Sudan | 46 | 0.2% |
| Thailand | 24 | 0.1% |
| Venezuela | 269 | 1.0% |
| Vietnam | 311 | 1.1% |
| Western Europe | 12 | 0.0% |
| Zimbabwe | 23 | 0.1% | View All 35 Rows |
Sex and Age in Dodge City
Sex and Age in Dodge City
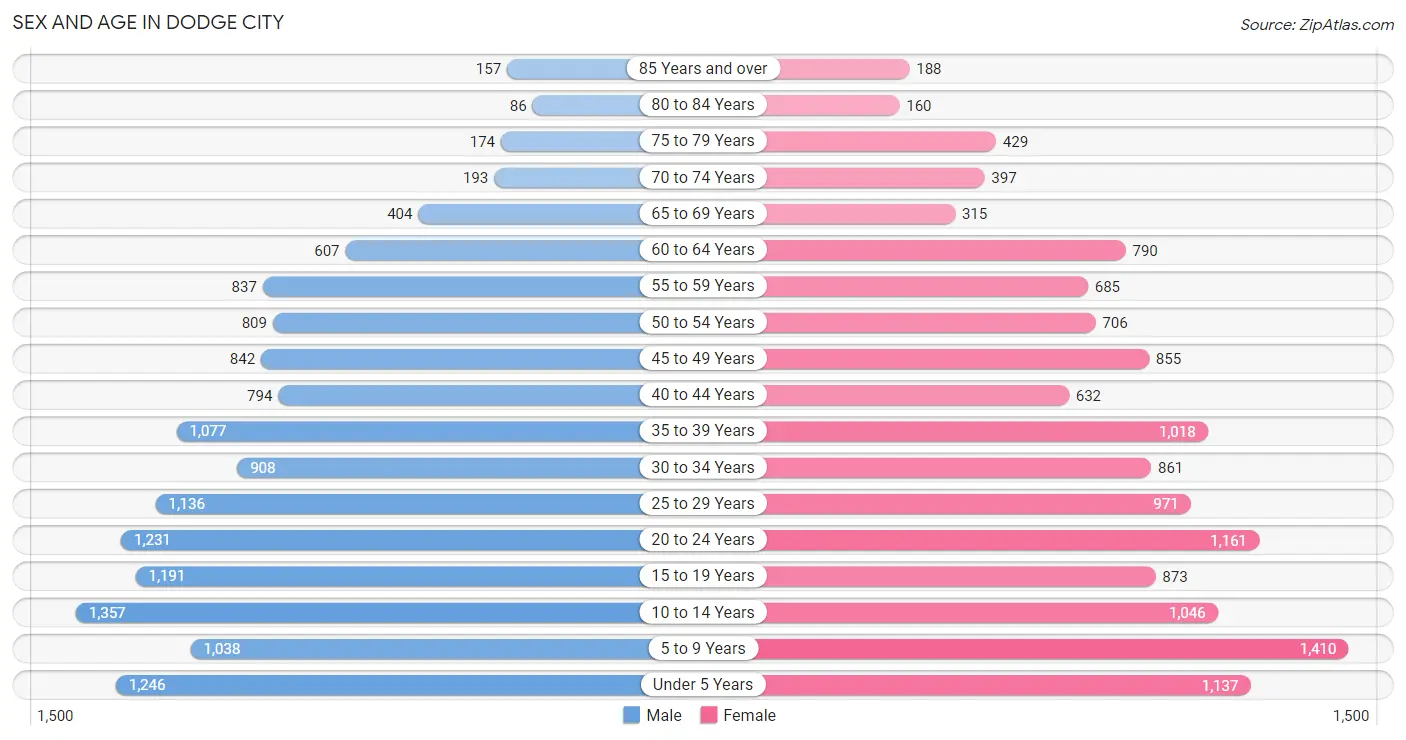
The most populous age groups in Dodge City are 10 to 14 Years (1,357 | 9.6%) for men and 5 to 9 Years (1,410 | 10.3%) for women.
| Age Bracket | Male | Female |
| Under 5 Years | 1,246 (8.8%) | 1,137 (8.3%) |
| 5 to 9 Years | 1,038 (7.4%) | 1,410 (10.3%) |
| 10 to 14 Years | 1,357 (9.6%) | 1,046 (7.7%) |
| 15 to 19 Years | 1,191 (8.5%) | 873 (6.4%) |
| 20 to 24 Years | 1,231 (8.7%) | 1,161 (8.5%) |
| 25 to 29 Years | 1,136 (8.1%) | 971 (7.1%) |
| 30 to 34 Years | 908 (6.5%) | 861 (6.3%) |
| 35 to 39 Years | 1,077 (7.6%) | 1,018 (7.5%) |
| 40 to 44 Years | 794 (5.6%) | 632 (4.6%) |
| 45 to 49 Years | 842 (6.0%) | 855 (6.3%) |
| 50 to 54 Years | 809 (5.7%) | 706 (5.2%) |
| 55 to 59 Years | 837 (5.9%) | 685 (5.0%) |
| 60 to 64 Years | 607 (4.3%) | 790 (5.8%) |
| 65 to 69 Years | 404 (2.9%) | 315 (2.3%) |
| 70 to 74 Years | 193 (1.4%) | 397 (2.9%) |
| 75 to 79 Years | 174 (1.2%) | 429 (3.2%) |
| 80 to 84 Years | 86 (0.6%) | 160 (1.2%) |
| 85 Years and over | 157 (1.1%) | 188 (1.4%) |
| Total | 14,087 (100.0%) | 13,634 (100.0%) |
Families and Households in Dodge City
Median Family Size in Dodge City
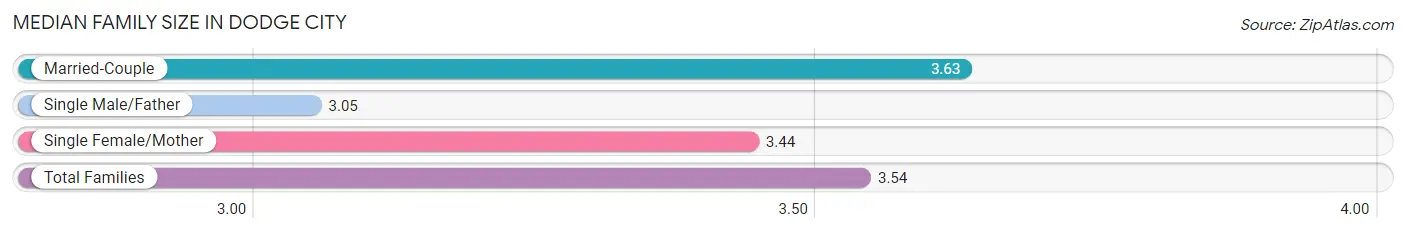
The median family size in Dodge City is 3.54 persons per family, with married-couple families (4,165 | 66.2%) accounting for the largest median family size of 3.63 persons per family. On the other hand, single male/father families (421 | 6.7%) represent the smallest median family size with 3.05 persons per family.
| Family Type | # Families | Family Size |
| Married-Couple | 4,165 (66.2%) | 3.63 |
| Single Male/Father | 421 (6.7%) | 3.05 |
| Single Female/Mother | 1,708 (27.1%) | 3.44 |
| Total Families | 6,294 (100.0%) | 3.54 |
Median Household Size in Dodge City
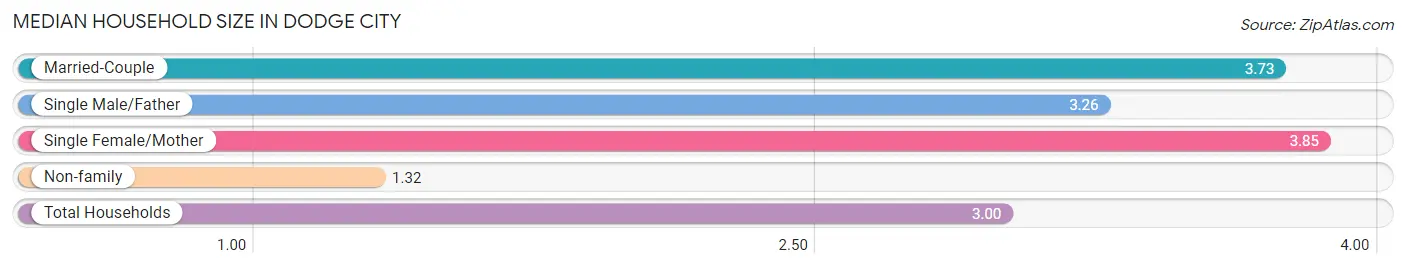
The median household size in Dodge City is 3.00 persons per household, with single female/mother households (1,708 | 18.9%) accounting for the largest median household size of 3.85 persons per household. non-family households (2,756 | 30.4%) represent the smallest median household size with 1.32 persons per household.
| Household Type | # Households | Household Size |
| Married-Couple | 4,165 (46.0%) | 3.73 |
| Single Male/Father | 421 (4.6%) | 3.26 |
| Single Female/Mother | 1,708 (18.9%) | 3.85 |
| Non-family | 2,756 (30.4%) | 1.32 |
| Total Households | 9,050 (100.0%) | 3.00 |
Household Size by Marriage Status in Dodge City
Out of a total of 9,050 households in Dodge City, 6,294 (69.6%) are family households, while 2,756 (30.4%) are nonfamily households. The most numerous type of family households are 2-person households, comprising 1,829, and the most common type of nonfamily households are 1-person households, comprising 2,207.
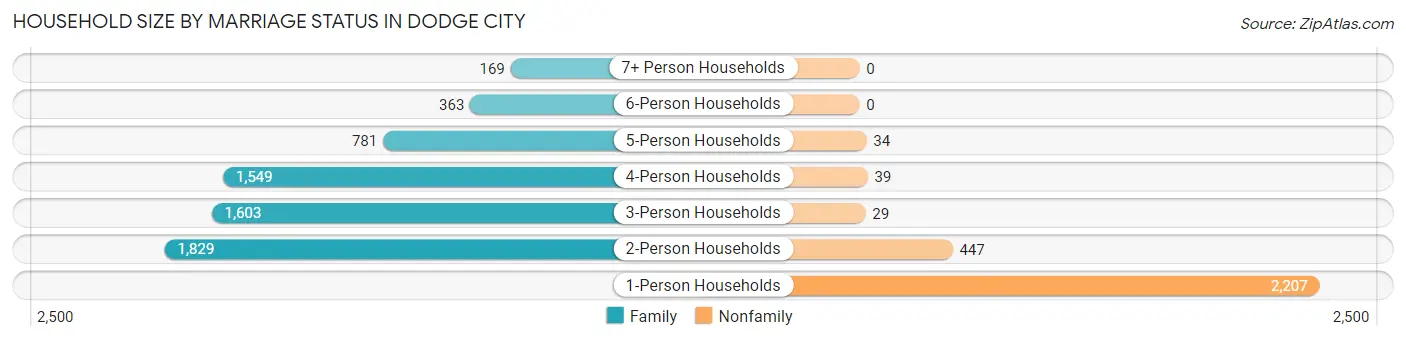
| Household Size | Family Households | Nonfamily Households |
| 1-Person Households | - | 2,207 (24.4%) |
| 2-Person Households | 1,829 (20.2%) | 447 (4.9%) |
| 3-Person Households | 1,603 (17.7%) | 29 (0.3%) |
| 4-Person Households | 1,549 (17.1%) | 39 (0.4%) |
| 5-Person Households | 781 (8.6%) | 34 (0.4%) |
| 6-Person Households | 363 (4.0%) | 0 (0.0%) |
| 7+ Person Households | 169 (1.9%) | 0 (0.0%) |
| Total | 6,294 (69.6%) | 2,756 (30.4%) |
Female Fertility in Dodge City
Fertility by Age in Dodge City
Average fertility rate in Dodge City is 53.0 births per 1,000 women. Women in the age bracket of 20 to 34 years have the highest fertility rate with 70.0 births per 1,000 women. Women in the age bracket of 20 to 34 years acount for 60.9% of all women with births.
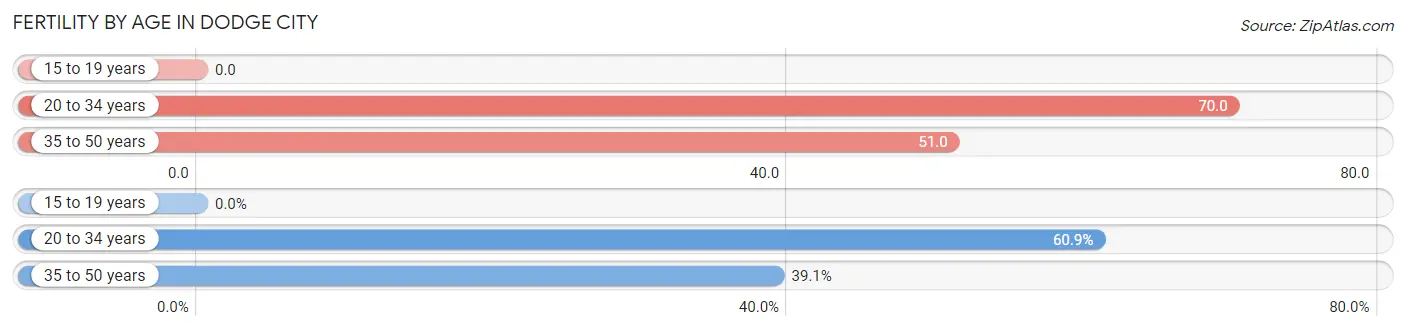
| Age Bracket | Women with Births | Births / 1,000 Women |
| 15 to 19 years | 0 (0.0%) | 0.0 |
| 20 to 34 years | 210 (60.9%) | 70.0 |
| 35 to 50 years | 135 (39.1%) | 51.0 |
| Total | 345 (100.0%) | 53.0 |
Fertility by Age by Marriage Status in Dodge City
87.2% of women with births (345) in Dodge City are married. The highest percentage of unmarried women with births falls into 20 to 34 years age bracket with 14.3% of them unmarried at the time of birth, while the lowest percentage of unmarried women with births belong to 35 to 50 years age bracket with 10.4% of them unmarried.
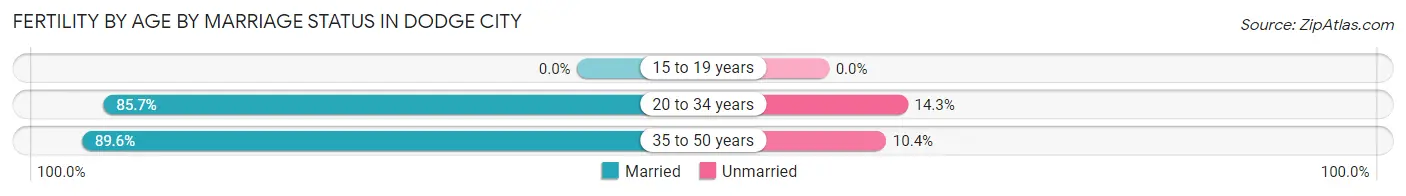
| Age Bracket | Married | Unmarried |
| 15 to 19 years | 0 (0.0%) | 0 (0.0%) |
| 20 to 34 years | 180 (85.7%) | 30 (14.3%) |
| 35 to 50 years | 121 (89.6%) | 14 (10.4%) |
| Total | 301 (87.3%) | 44 (12.8%) |
Fertility by Education in Dodge City
Average fertility rate in Dodge City is 53.0 births per 1,000 women. Women with the education attainment of high school diploma have the highest fertility rate of 74.0 births per 1,000 women, while women with the education attainment of graduate degree have the lowest fertility at 12.0 births per 1,000 women. Women with the education attainment of college or associate's degree represent 37.1% of all women with births.
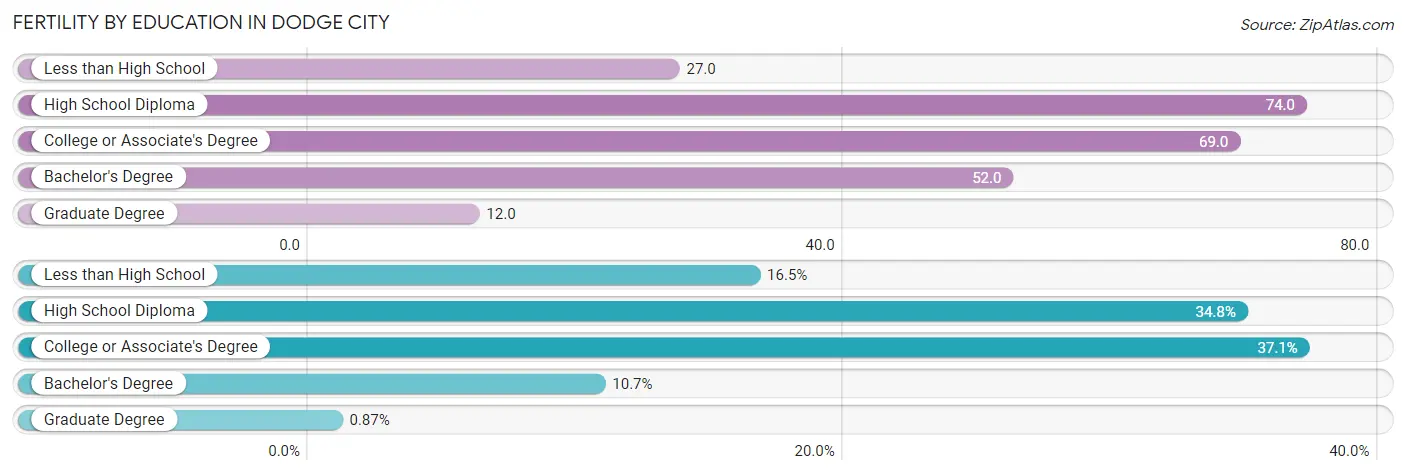
| Educational Attainment | Women with Births | Births / 1,000 Women |
| Less than High School | 57 (16.5%) | 27.0 |
| High School Diploma | 120 (34.8%) | 74.0 |
| College or Associate's Degree | 128 (37.1%) | 69.0 |
| Bachelor's Degree | 37 (10.7%) | 52.0 |
| Graduate Degree | 3 (0.9%) | 12.0 |
| Total | 345 (100.0%) | 53.0 |
Fertility by Education by Marriage Status in Dodge City
12.8% of women with births in Dodge City are unmarried. Women with the educational attainment of less than high school are most likely to be married with 100.0% of them married at childbirth, while women with the educational attainment of high school diploma are least likely to be married with 25.0% of them unmarried at childbirth.
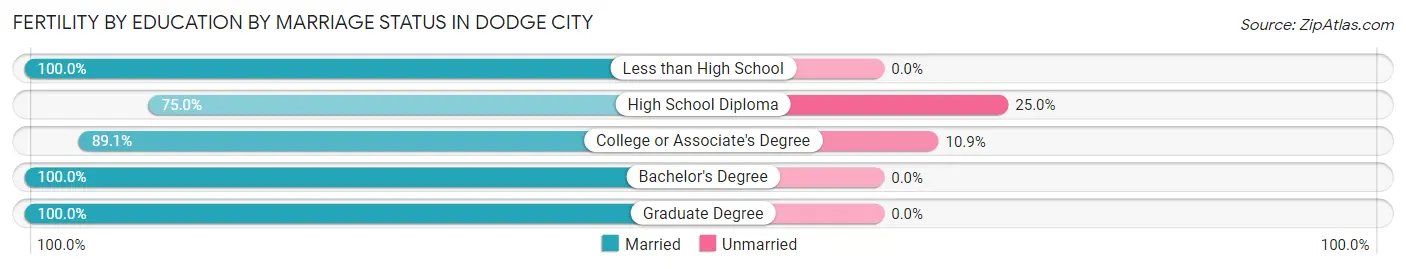
| Educational Attainment | Married | Unmarried |
| Less than High School | 57 (100.0%) | 0 (0.0%) |
| High School Diploma | 90 (75.0%) | 30 (25.0%) |
| College or Associate's Degree | 114 (89.1%) | 14 (10.9%) |
| Bachelor's Degree | 37 (100.0%) | 0 (0.0%) |
| Graduate Degree | 3 (100.0%) | 0 (0.0%) |
| Total | 301 (87.3%) | 44 (12.8%) |
Employment Characteristics in Dodge City
Employment by Class of Employer in Dodge City
Among the 13,606 employed individuals in Dodge City, private company employees (10,396 | 76.4%), local government employees (1,033 | 7.6%), and self-employed (not incorporated) (818 | 6.0%) make up the most common classes of employment.
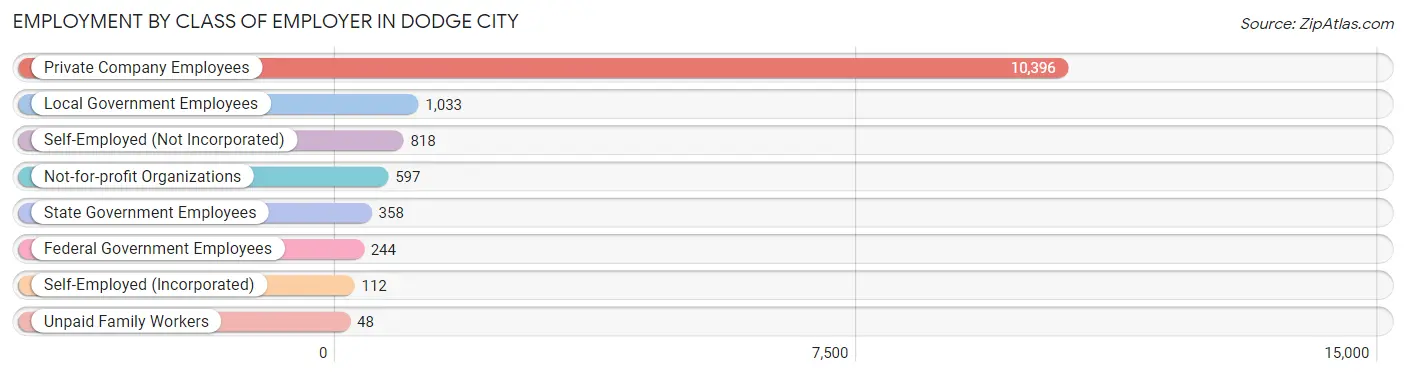
| Employer Class | # Employees | % Employees |
| Private Company Employees | 10,396 | 76.4% |
| Self-Employed (Incorporated) | 112 | 0.8% |
| Self-Employed (Not Incorporated) | 818 | 6.0% |
| Not-for-profit Organizations | 597 | 4.4% |
| Local Government Employees | 1,033 | 7.6% |
| State Government Employees | 358 | 2.6% |
| Federal Government Employees | 244 | 1.8% |
| Unpaid Family Workers | 48 | 0.4% |
| Total | 13,606 | 100.0% |
Employment Status by Age in Dodge City
According to the labor force statistics for Dodge City, out of the total population over 16 years of age (20,157), 71.4% or 14,392 individuals are in the labor force, with 3.6% or 518 of them unemployed. The age group with the highest labor force participation rate is 30 to 34 years, with 88.8% or 1,571 individuals in the labor force. Within the labor force, the 65 to 74 years age range has the highest percentage of unemployed individuals, with 9.2% or 34 of them being unemployed.
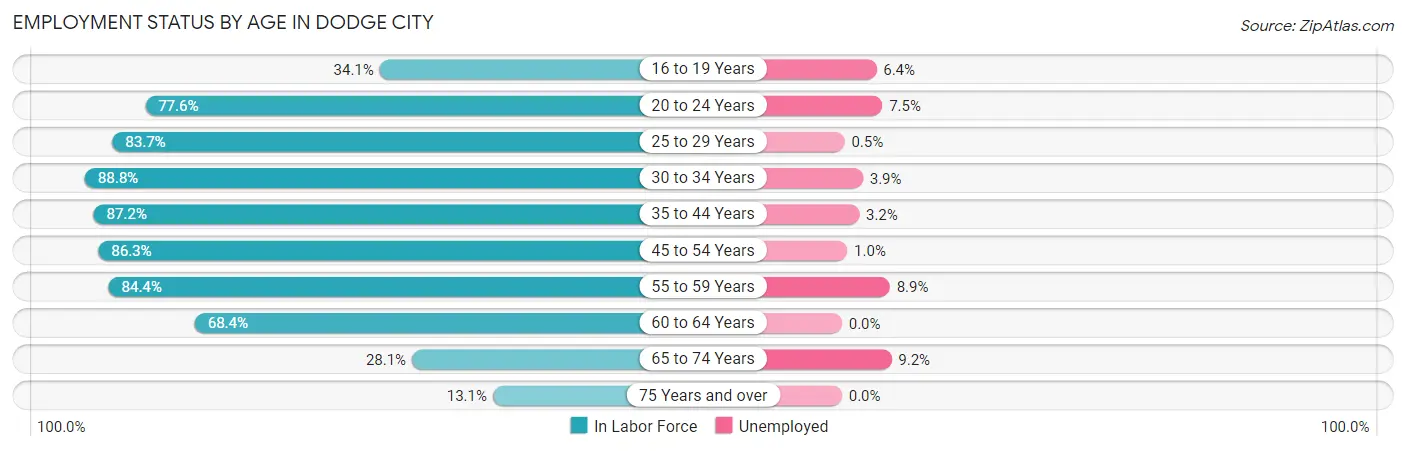
| Age Bracket | In Labor Force | Unemployed |
| 16 to 19 Years | 591 (34.1%) | 38 (6.4%) |
| 20 to 24 Years | 1,856 (77.6%) | 139 (7.5%) |
| 25 to 29 Years | 1,764 (83.7%) | 9 (0.5%) |
| 30 to 34 Years | 1,571 (88.8%) | 61 (3.9%) |
| 35 to 44 Years | 3,070 (87.2%) | 98 (3.2%) |
| 45 to 54 Years | 2,772 (86.3%) | 28 (1.0%) |
| 55 to 59 Years | 1,285 (84.4%) | 114 (8.9%) |
| 60 to 64 Years | 956 (68.4%) | 0 (0.0%) |
| 65 to 74 Years | 368 (28.1%) | 34 (9.2%) |
| 75 Years and over | 156 (13.1%) | 0 (0.0%) |
| Total | 14,392 (71.4%) | 518 (3.6%) |
Employment Status by Educational Attainment in Dodge City
According to labor force statistics for Dodge City, 84.4% of individuals (11,418) out of the total population between 25 and 64 years of age (13,528) are in the labor force, with 2.7% or 308 of them being unemployed. The group with the highest labor force participation rate are those with the educational attainment of bachelor's degree or higher, with 91.8% or 2,203 individuals in the labor force. Within the labor force, individuals with high school diploma education have the highest percentage of unemployment, with 7.9% or 245 of them being unemployed.
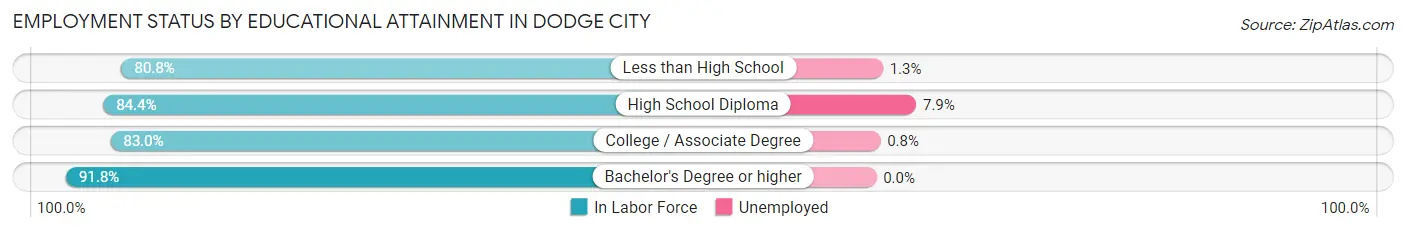
| Educational Attainment | In Labor Force | Unemployed |
| Less than High School | 2,864 (80.8%) | 46 (1.3%) |
| High School Diploma | 3,102 (84.4%) | 290 (7.9%) |
| College / Associate Degree | 3,244 (83.0%) | 31 (0.8%) |
| Bachelor's Degree or higher | 2,203 (91.8%) | 0 (0.0%) |
| Total | 11,418 (84.4%) | 365 (2.7%) |
Employment Occupations by Sex in Dodge City
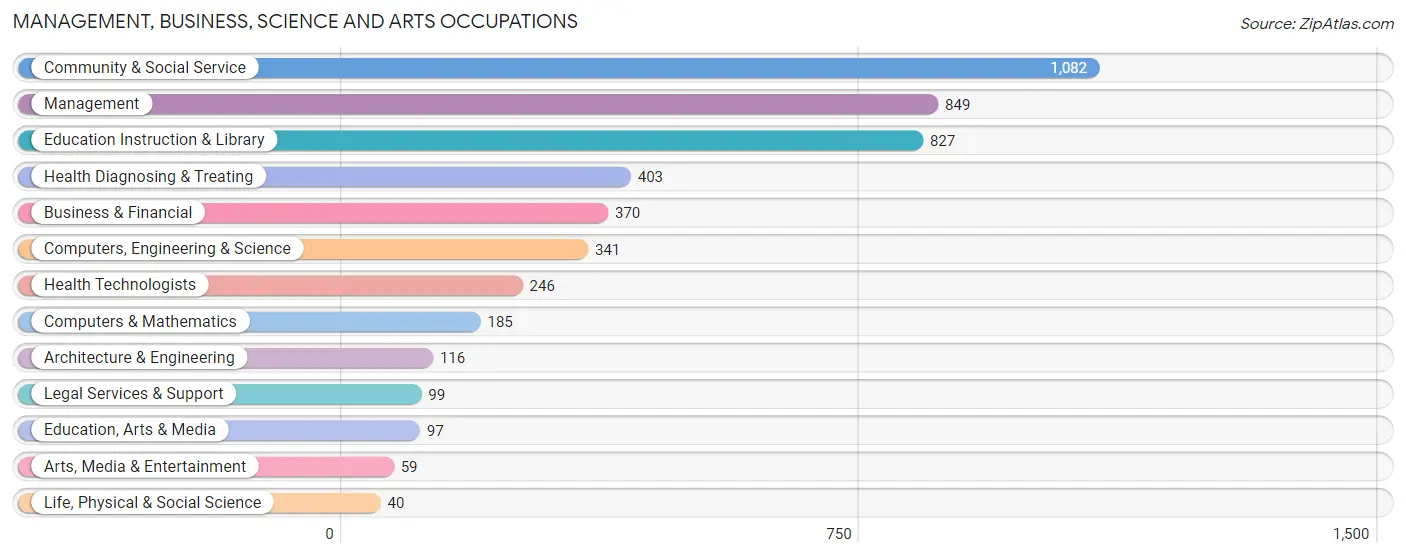
Management, Business, Science and Arts Occupations
The most common Management, Business, Science and Arts occupations in Dodge City are Community & Social Service (1,082 | 7.8%), Management (849 | 6.1%), Education Instruction & Library (827 | 6.0%), Health Diagnosing & Treating (403 | 2.9%), and Business & Financial (370 | 2.7%).
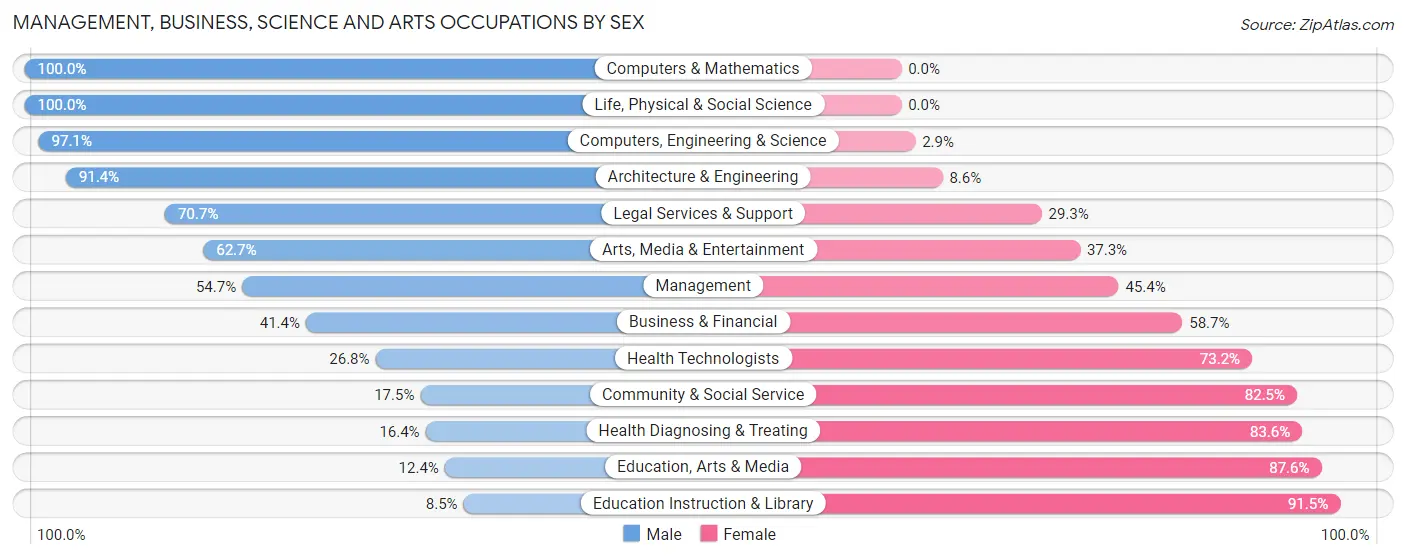
Management, Business, Science and Arts Occupations by Sex
Within the Management, Business, Science and Arts occupations in Dodge City, the most male-oriented occupations are Computers & Mathematics (100.0%), Life, Physical & Social Science (100.0%), and Computers, Engineering & Science (97.1%), while the most female-oriented occupations are Education Instruction & Library (91.5%), Education, Arts & Media (87.6%), and Health Diagnosing & Treating (83.6%).
| Occupation | Male | Female |
| Management | 464 (54.6%) | 385 (45.4%) |
| Business & Financial | 153 (41.3%) | 217 (58.7%) |
| Computers, Engineering & Science | 331 (97.1%) | 10 (2.9%) |
| Computers & Mathematics | 185 (100.0%) | 0 (0.0%) |
| Architecture & Engineering | 106 (91.4%) | 10 (8.6%) |
| Life, Physical & Social Science | 40 (100.0%) | 0 (0.0%) |
| Community & Social Service | 189 (17.5%) | 893 (82.5%) |
| Education, Arts & Media | 12 (12.4%) | 85 (87.6%) |
| Legal Services & Support | 70 (70.7%) | 29 (29.3%) |
| Education Instruction & Library | 70 (8.5%) | 757 (91.5%) |
| Arts, Media & Entertainment | 37 (62.7%) | 22 (37.3%) |
| Health Diagnosing & Treating | 66 (16.4%) | 337 (83.6%) |
| Health Technologists | 66 (26.8%) | 180 (73.2%) |
| Total (Category) | 1,203 (39.5%) | 1,842 (60.5%) |
| Total (Overall) | 8,041 (58.0%) | 5,823 (42.0%) |
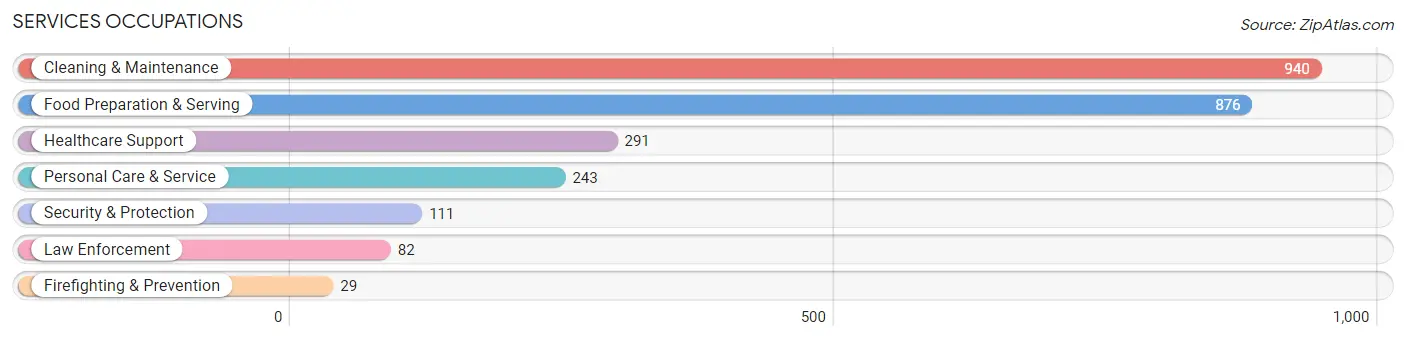
Services Occupations
The most common Services occupations in Dodge City are Cleaning & Maintenance (940 | 6.8%), Food Preparation & Serving (876 | 6.3%), Healthcare Support (291 | 2.1%), Personal Care & Service (243 | 1.8%), and Security & Protection (111 | 0.8%).
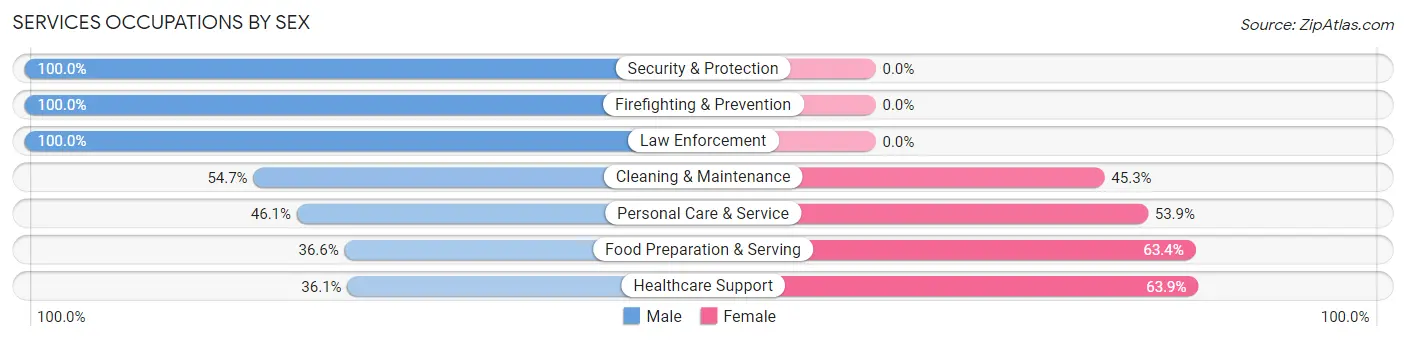
Services Occupations by Sex
Within the Services occupations in Dodge City, the most male-oriented occupations are Security & Protection (100.0%), Firefighting & Prevention (100.0%), and Law Enforcement (100.0%), while the most female-oriented occupations are Healthcare Support (63.9%), Food Preparation & Serving (63.4%), and Personal Care & Service (53.9%).
| Occupation | Male | Female |
| Healthcare Support | 105 (36.1%) | 186 (63.9%) |
| Security & Protection | 111 (100.0%) | 0 (0.0%) |
| Firefighting & Prevention | 29 (100.0%) | 0 (0.0%) |
| Law Enforcement | 82 (100.0%) | 0 (0.0%) |
| Food Preparation & Serving | 321 (36.6%) | 555 (63.4%) |
| Cleaning & Maintenance | 514 (54.7%) | 426 (45.3%) |
| Personal Care & Service | 112 (46.1%) | 131 (53.9%) |
| Total (Category) | 1,163 (47.3%) | 1,298 (52.7%) |
| Total (Overall) | 8,041 (58.0%) | 5,823 (42.0%) |
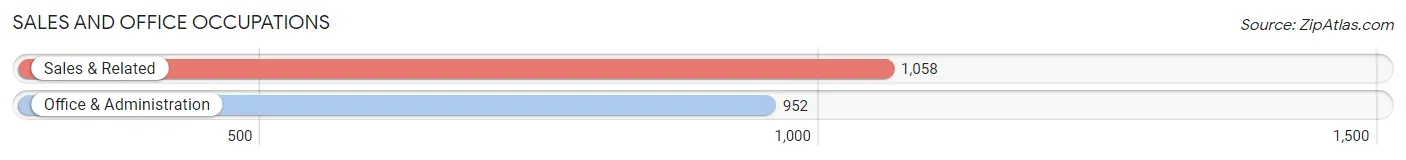
Sales and Office Occupations
The most common Sales and Office occupations in Dodge City are Sales & Related (1,058 | 7.6%), and Office & Administration (952 | 6.9%).
Sales and Office Occupations by Sex
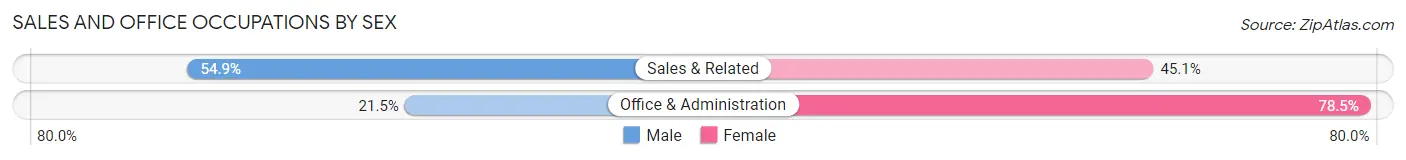
| Occupation | Male | Female |
| Sales & Related | 581 (54.9%) | 477 (45.1%) |
| Office & Administration | 205 (21.5%) | 747 (78.5%) |
| Total (Category) | 786 (39.1%) | 1,224 (60.9%) |
| Total (Overall) | 8,041 (58.0%) | 5,823 (42.0%) |
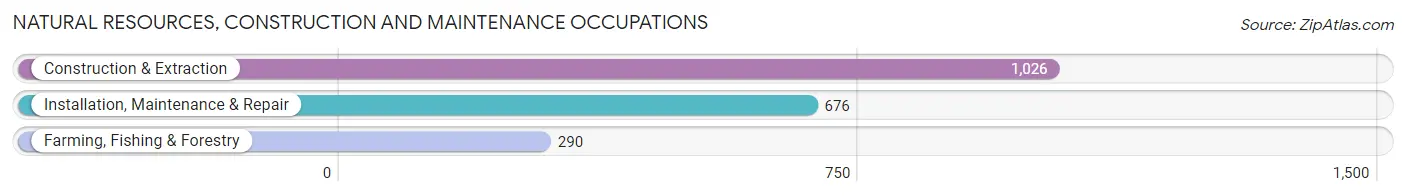
Natural Resources, Construction and Maintenance Occupations
The most common Natural Resources, Construction and Maintenance occupations in Dodge City are Construction & Extraction (1,026 | 7.4%), Installation, Maintenance & Repair (676 | 4.9%), and Farming, Fishing & Forestry (290 | 2.1%).
Natural Resources, Construction and Maintenance Occupations by Sex
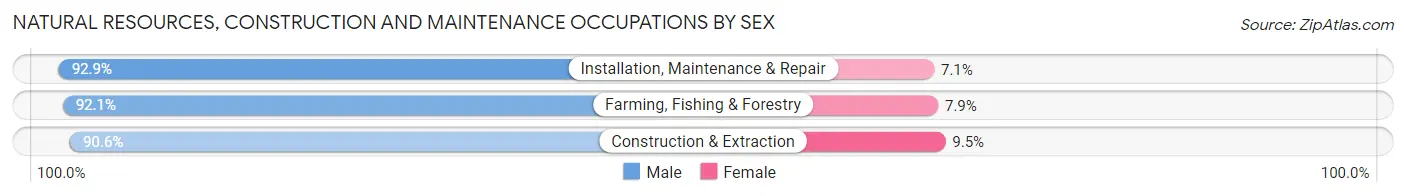
| Occupation | Male | Female |
| Farming, Fishing & Forestry | 267 (92.1%) | 23 (7.9%) |
| Construction & Extraction | 929 (90.5%) | 97 (9.5%) |
| Installation, Maintenance & Repair | 628 (92.9%) | 48 (7.1%) |
| Total (Category) | 1,824 (91.6%) | 168 (8.4%) |
| Total (Overall) | 8,041 (58.0%) | 5,823 (42.0%) |
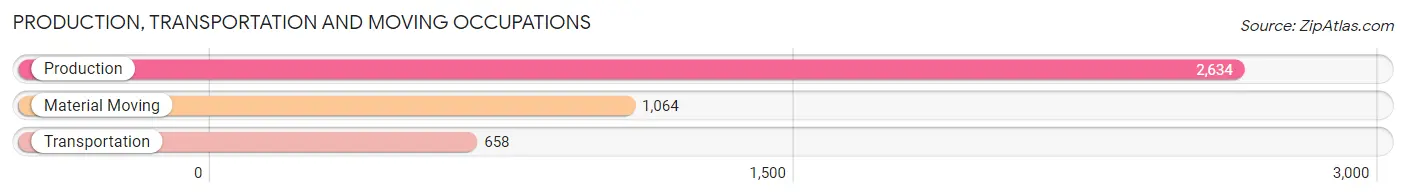
Production, Transportation and Moving Occupations
The most common Production, Transportation and Moving occupations in Dodge City are Production (2,634 | 19.0%), Material Moving (1,064 | 7.7%), and Transportation (658 | 4.8%).
Production, Transportation and Moving Occupations by Sex
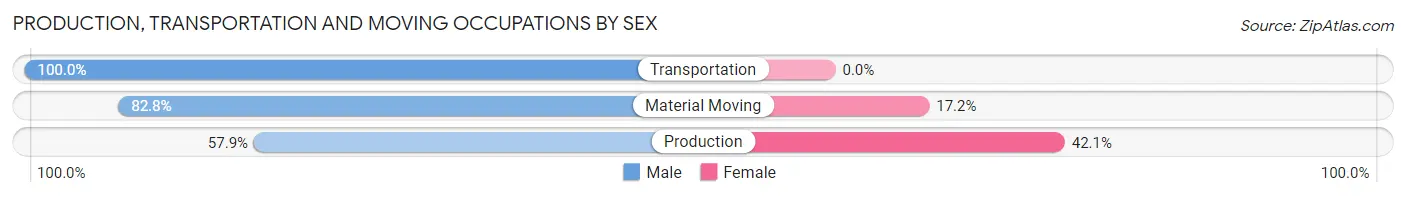
| Occupation | Male | Female |
| Production | 1,526 (57.9%) | 1,108 (42.1%) |
| Transportation | 658 (100.0%) | 0 (0.0%) |
| Material Moving | 881 (82.8%) | 183 (17.2%) |
| Total (Category) | 3,065 (70.4%) | 1,291 (29.6%) |
| Total (Overall) | 8,041 (58.0%) | 5,823 (42.0%) |
Employment Industries by Sex in Dodge City
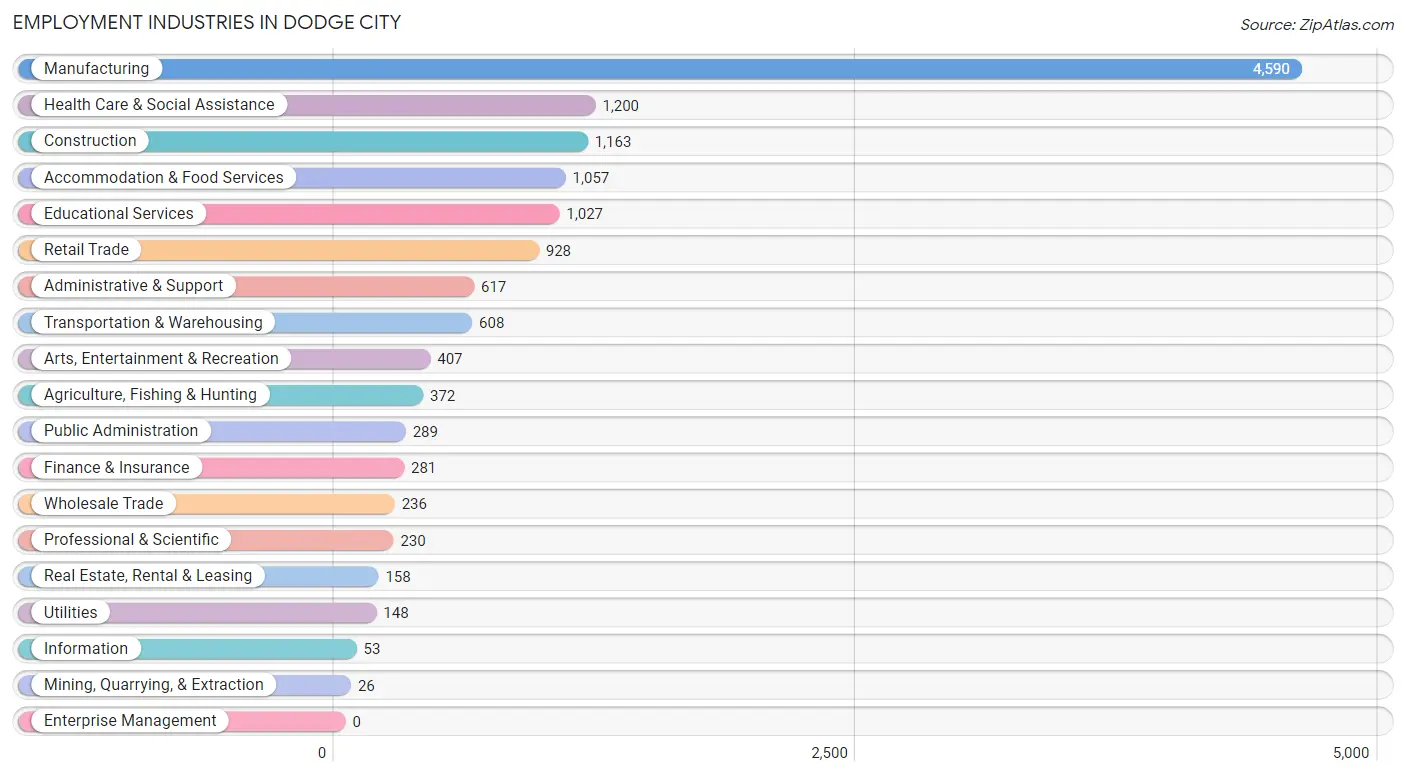
Employment Industries in Dodge City
The major employment industries in Dodge City include Manufacturing (4,590 | 33.1%), Health Care & Social Assistance (1,200 | 8.7%), Construction (1,163 | 8.4%), Accommodation & Food Services (1,057 | 7.6%), and Educational Services (1,027 | 7.4%).
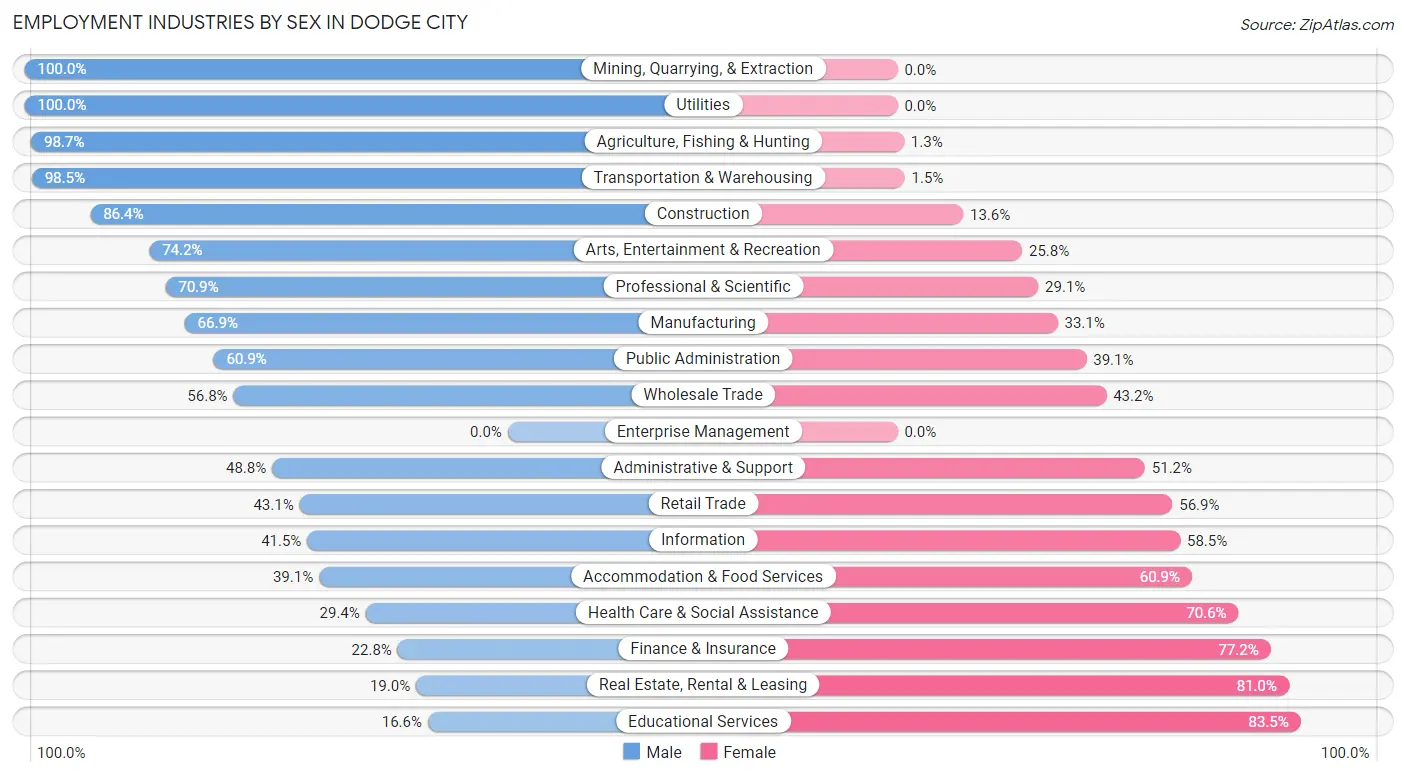
Employment Industries by Sex in Dodge City
The Dodge City industries that see more men than women are Mining, Quarrying, & Extraction (100.0%), Utilities (100.0%), and Agriculture, Fishing & Hunting (98.7%), whereas the industries that tend to have a higher number of women are Educational Services (83.5%), Real Estate, Rental & Leasing (81.0%), and Finance & Insurance (77.2%).
| Industry | Male | Female |
| Agriculture, Fishing & Hunting | 367 (98.7%) | 5 (1.3%) |
| Mining, Quarrying, & Extraction | 26 (100.0%) | 0 (0.0%) |
| Construction | 1,005 (86.4%) | 158 (13.6%) |
| Manufacturing | 3,069 (66.9%) | 1,521 (33.1%) |
| Wholesale Trade | 134 (56.8%) | 102 (43.2%) |
| Retail Trade | 400 (43.1%) | 528 (56.9%) |
| Transportation & Warehousing | 599 (98.5%) | 9 (1.5%) |
| Utilities | 148 (100.0%) | 0 (0.0%) |
| Information | 22 (41.5%) | 31 (58.5%) |
| Finance & Insurance | 64 (22.8%) | 217 (77.2%) |
| Real Estate, Rental & Leasing | 30 (19.0%) | 128 (81.0%) |
| Professional & Scientific | 163 (70.9%) | 67 (29.1%) |
| Enterprise Management | 0 (0.0%) | 0 (0.0%) |
| Administrative & Support | 301 (48.8%) | 316 (51.2%) |
| Educational Services | 170 (16.6%) | 857 (83.5%) |
| Health Care & Social Assistance | 353 (29.4%) | 847 (70.6%) |
| Arts, Entertainment & Recreation | 302 (74.2%) | 105 (25.8%) |
| Accommodation & Food Services | 413 (39.1%) | 644 (60.9%) |
| Public Administration | 176 (60.9%) | 113 (39.1%) |
| Total | 8,041 (58.0%) | 5,823 (42.0%) |
Education in Dodge City
School Enrollment in Dodge City
The most common levels of schooling among the 7,884 students in Dodge City are middle school (2,001 | 25.4%), high school (1,976 | 25.1%), and elementary school (1,963 | 24.9%).
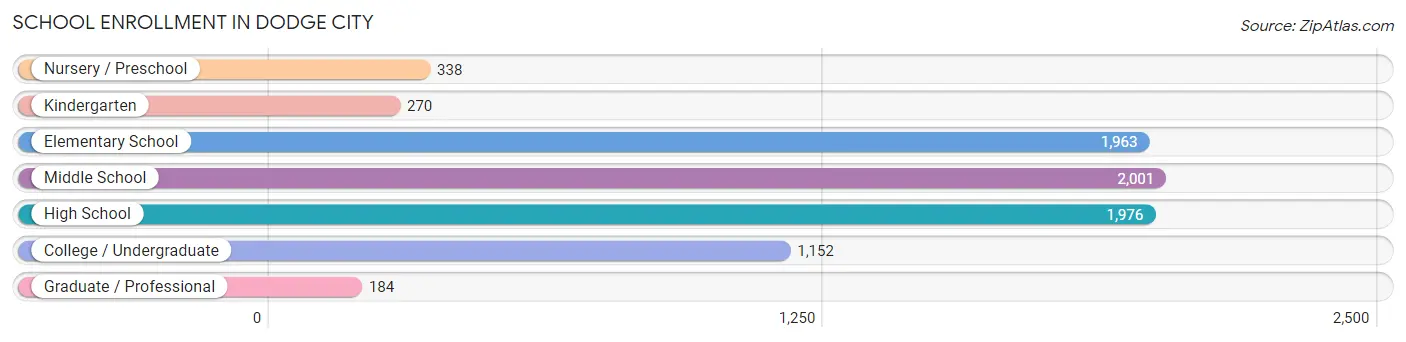
| School Level | # Students | % Students |
| Nursery / Preschool | 338 | 4.3% |
| Kindergarten | 270 | 3.4% |
| Elementary School | 1,963 | 24.9% |
| Middle School | 2,001 | 25.4% |
| High School | 1,976 | 25.1% |
| College / Undergraduate | 1,152 | 14.6% |
| Graduate / Professional | 184 | 2.3% |
| Total | 7,884 | 100.0% |
School Enrollment by Age by Funding Source in Dodge City
Out of a total of 7,884 students who are enrolled in schools in Dodge City, 244 (3.1%) attend a private institution, while the remaining 7,640 (96.9%) are enrolled in public schools. The age group of 25 to 34 year olds has the highest likelihood of being enrolled in private schools, with 52 (16.3% in the age bracket) enrolled. Conversely, the age group of 3 to 4 year olds has the lowest likelihood of being enrolled in a private school, with 249 (100.0% in the age bracket) attending a public institution.
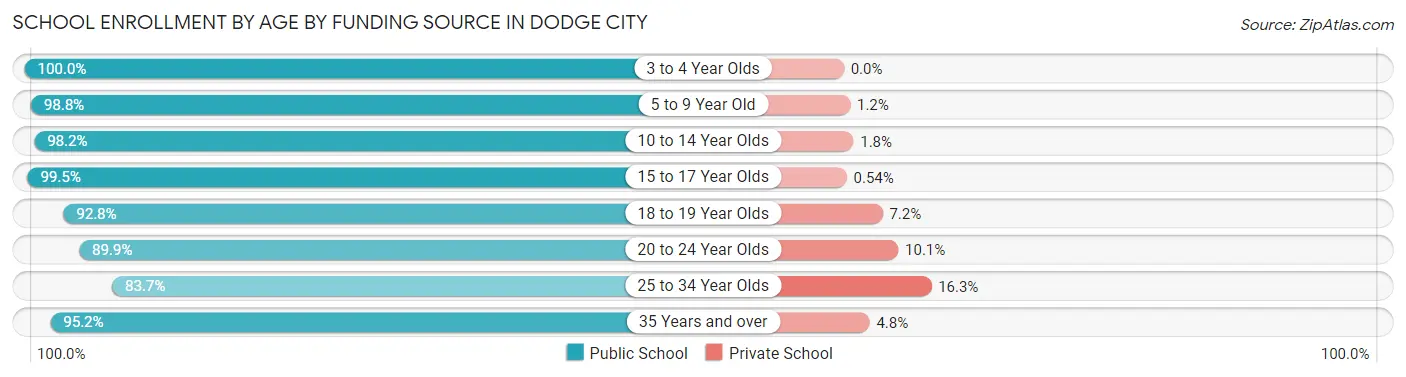
| Age Bracket | Public School | Private School |
| 3 to 4 Year Olds | 249 (100.0%) | 0 (0.0%) |
| 5 to 9 Year Old | 2,086 (98.8%) | 25 (1.2%) |
| 10 to 14 Year Olds | 2,360 (98.2%) | 43 (1.8%) |
| 15 to 17 Year Olds | 1,281 (99.5%) | 7 (0.5%) |
| 18 to 19 Year Olds | 577 (92.8%) | 45 (7.2%) |
| 20 to 24 Year Olds | 558 (89.9%) | 63 (10.1%) |
| 25 to 34 Year Olds | 267 (83.7%) | 52 (16.3%) |
| 35 Years and over | 258 (95.2%) | 13 (4.8%) |
| Total | 7,640 (96.9%) | 244 (3.1%) |
Educational Attainment by Field of Study in Dodge City
Education (996 | 32.1%), business (537 | 17.3%), science & technology (435 | 14.0%), bio, nature & agricultural (279 | 9.0%), and engineering (144 | 4.6%) are the most common fields of study among 3,103 individuals in Dodge City who have obtained a bachelor's degree or higher.
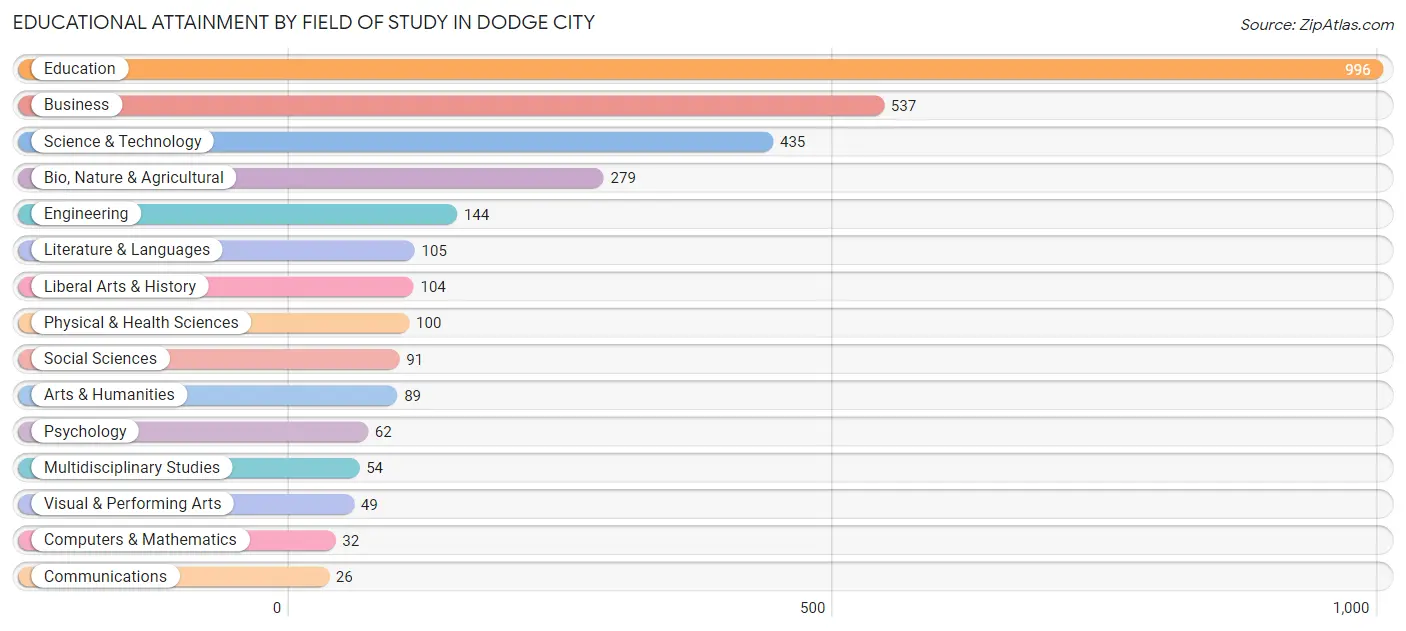
| Field of Study | # Graduates | % Graduates |
| Computers & Mathematics | 32 | 1.0% |
| Bio, Nature & Agricultural | 279 | 9.0% |
| Physical & Health Sciences | 100 | 3.2% |
| Psychology | 62 | 2.0% |
| Social Sciences | 91 | 2.9% |
| Engineering | 144 | 4.6% |
| Multidisciplinary Studies | 54 | 1.7% |
| Science & Technology | 435 | 14.0% |
| Business | 537 | 17.3% |
| Education | 996 | 32.1% |
| Literature & Languages | 105 | 3.4% |
| Liberal Arts & History | 104 | 3.4% |
| Visual & Performing Arts | 49 | 1.6% |
| Communications | 26 | 0.8% |
| Arts & Humanities | 89 | 2.9% |
| Total | 3,103 | 100.0% |
Transportation & Commute in Dodge City
Vehicle Availability by Sex in Dodge City
The most prevalent vehicle ownership categories in Dodge City are males with 2 vehicles (3,190, accounting for 40.6%) and females with 2 vehicles (2,298, making up 56.5%).
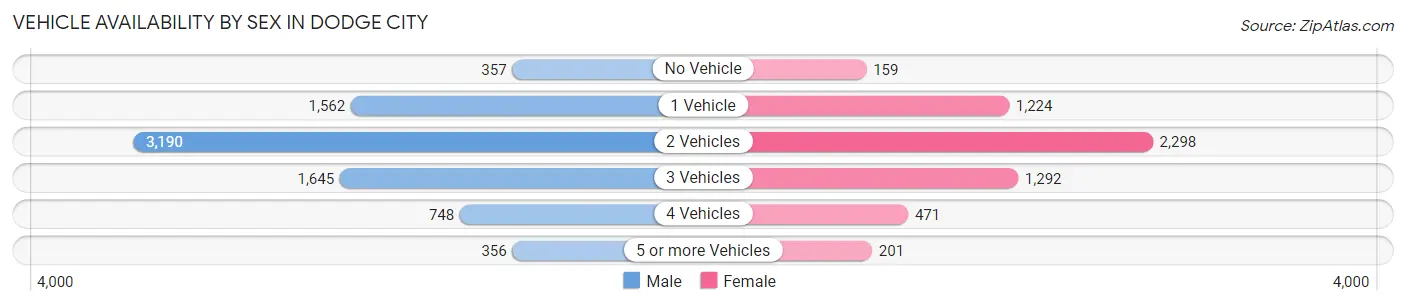
| Vehicles Available | Male | Female |
| No Vehicle | 357 (4.5%) | 159 (2.8%) |
| 1 Vehicle | 1,562 (19.9%) | 1,224 (21.7%) |
| 2 Vehicles | 3,190 (40.6%) | 2,298 (40.7%) |
| 3 Vehicles | 1,645 (20.9%) | 1,292 (22.9%) |
| 4 Vehicles | 748 (9.5%) | 471 (8.3%) |
| 5 or more Vehicles | 356 (4.5%) | 201 (3.6%) |
| Total | 7,858 (100.0%) | 5,645 (100.0%) |
Commute Time in Dodge City
The most frequently occuring commute durations in Dodge City are 10 to 14 minutes (4,612 commuters, 34.3%), 5 to 9 minutes (4,212 commuters, 31.3%), and 15 to 19 minutes (1,822 commuters, 13.5%).
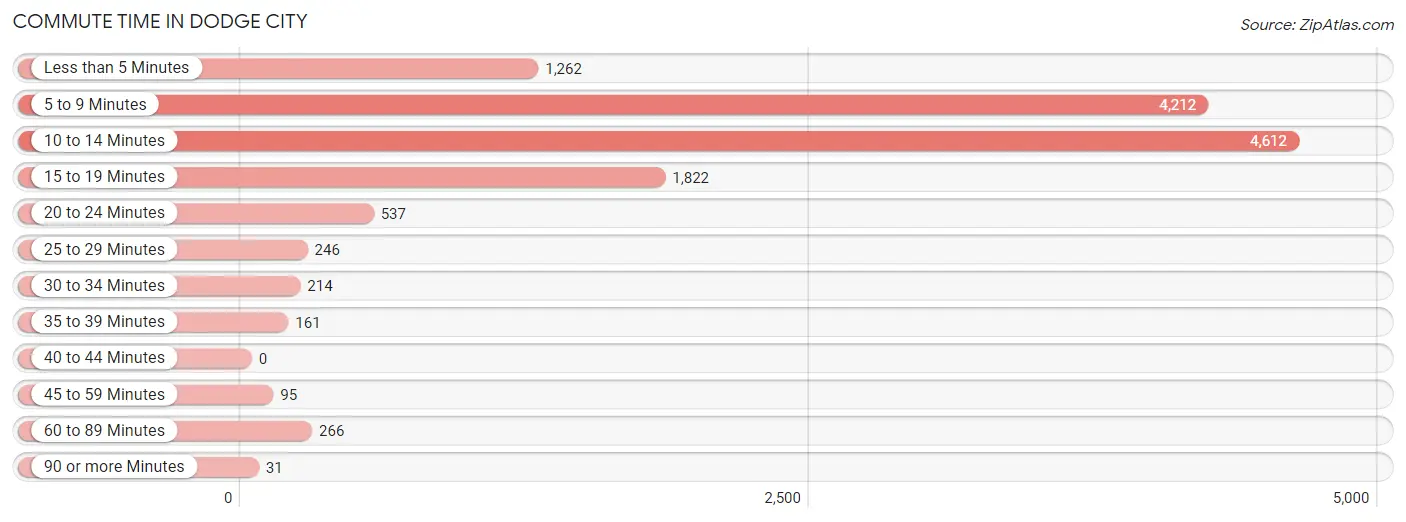
| Commute Time | # Commuters | % Commuters |
| Less than 5 Minutes | 1,262 | 9.4% |
| 5 to 9 Minutes | 4,212 | 31.3% |
| 10 to 14 Minutes | 4,612 | 34.3% |
| 15 to 19 Minutes | 1,822 | 13.5% |
| 20 to 24 Minutes | 537 | 4.0% |
| 25 to 29 Minutes | 246 | 1.8% |
| 30 to 34 Minutes | 214 | 1.6% |
| 35 to 39 Minutes | 161 | 1.2% |
| 40 to 44 Minutes | 0 | 0.0% |
| 45 to 59 Minutes | 95 | 0.7% |
| 60 to 89 Minutes | 266 | 2.0% |
| 90 or more Minutes | 31 | 0.2% |
Commute Time by Sex in Dodge City
The most common commute times in Dodge City are 10 to 14 minutes (2,819 commuters, 35.8%) for males and 10 to 14 minutes (1,793 commuters, 32.1%) for females.
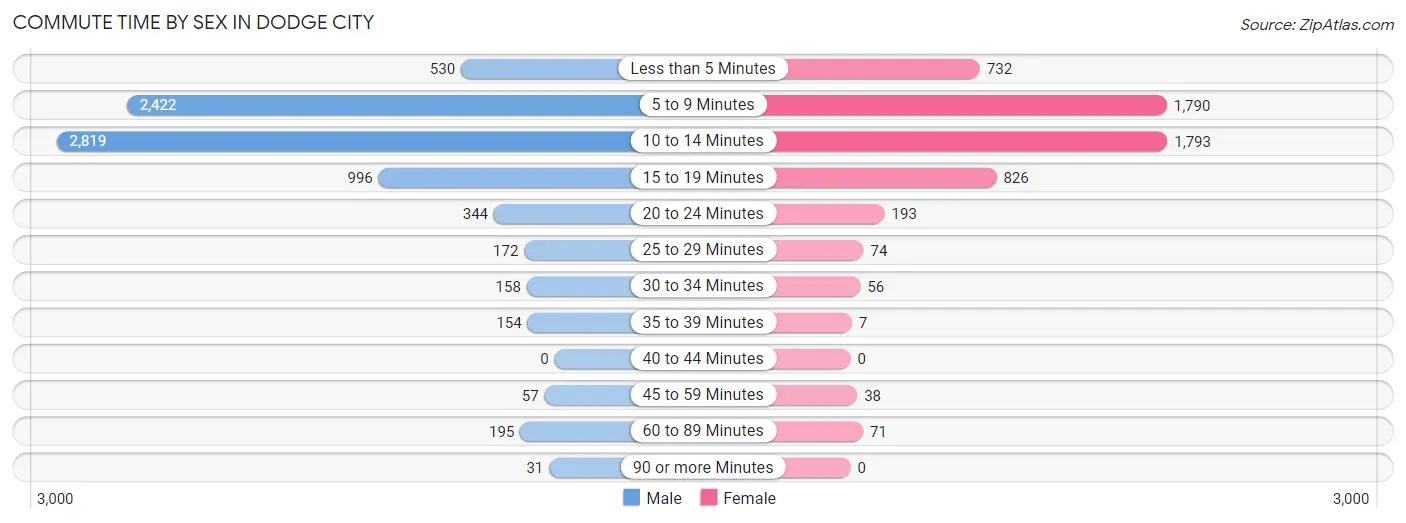
| Commute Time | Male | Female |
| Less than 5 Minutes | 530 (6.7%) | 732 (13.1%) |
| 5 to 9 Minutes | 2,422 (30.7%) | 1,790 (32.1%) |
| 10 to 14 Minutes | 2,819 (35.8%) | 1,793 (32.1%) |
| 15 to 19 Minutes | 996 (12.6%) | 826 (14.8%) |
| 20 to 24 Minutes | 344 (4.4%) | 193 (3.5%) |
| 25 to 29 Minutes | 172 (2.2%) | 74 (1.3%) |
| 30 to 34 Minutes | 158 (2.0%) | 56 (1.0%) |
| 35 to 39 Minutes | 154 (1.9%) | 7 (0.1%) |
| 40 to 44 Minutes | 0 (0.0%) | 0 (0.0%) |
| 45 to 59 Minutes | 57 (0.7%) | 38 (0.7%) |
| 60 to 89 Minutes | 195 (2.5%) | 71 (1.3%) |
| 90 or more Minutes | 31 (0.4%) | 0 (0.0%) |
Time of Departure to Work by Sex in Dodge City
The most frequent times of departure to work in Dodge City are 12:00 PM to 3:59 PM (1,502, 19.1%) for males and 12:00 PM to 3:59 PM (975, 17.5%) for females.
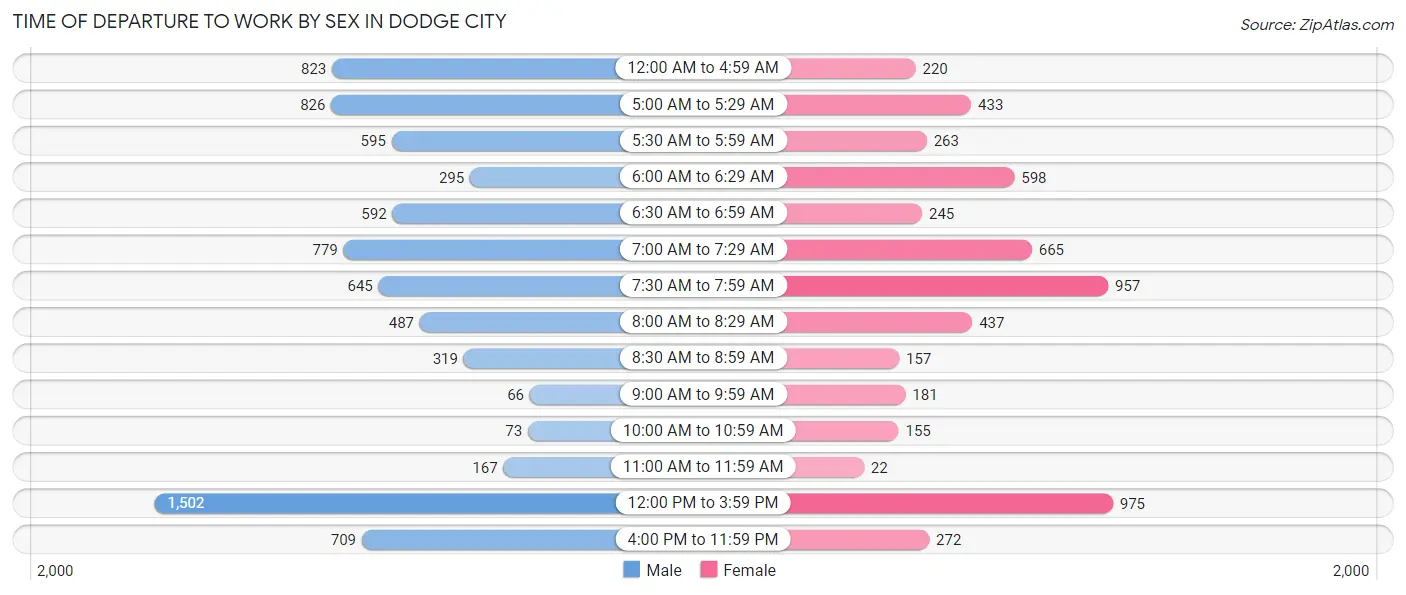
| Time of Departure | Male | Female |
| 12:00 AM to 4:59 AM | 823 (10.4%) | 220 (3.9%) |
| 5:00 AM to 5:29 AM | 826 (10.5%) | 433 (7.8%) |
| 5:30 AM to 5:59 AM | 595 (7.5%) | 263 (4.7%) |
| 6:00 AM to 6:29 AM | 295 (3.7%) | 598 (10.7%) |
| 6:30 AM to 6:59 AM | 592 (7.5%) | 245 (4.4%) |
| 7:00 AM to 7:29 AM | 779 (9.9%) | 665 (11.9%) |
| 7:30 AM to 7:59 AM | 645 (8.2%) | 957 (17.2%) |
| 8:00 AM to 8:29 AM | 487 (6.2%) | 437 (7.8%) |
| 8:30 AM to 8:59 AM | 319 (4.1%) | 157 (2.8%) |
| 9:00 AM to 9:59 AM | 66 (0.8%) | 181 (3.2%) |
| 10:00 AM to 10:59 AM | 73 (0.9%) | 155 (2.8%) |
| 11:00 AM to 11:59 AM | 167 (2.1%) | 22 (0.4%) |
| 12:00 PM to 3:59 PM | 1,502 (19.1%) | 975 (17.5%) |
| 4:00 PM to 11:59 PM | 709 (9.0%) | 272 (4.9%) |
| Total | 7,878 (100.0%) | 5,580 (100.0%) |
Housing Occupancy in Dodge City
Occupancy by Ownership in Dodge City
Of the total 9,050 dwellings in Dodge City, owner-occupied units account for 5,393 (59.6%), while renter-occupied units make up 3,657 (40.4%).
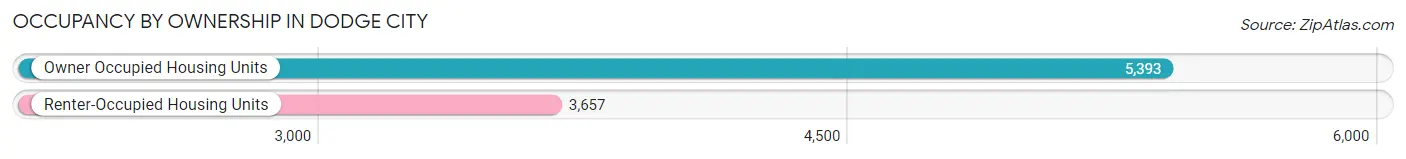
| Occupancy | # Housing Units | % Housing Units |
| Owner Occupied Housing Units | 5,393 | 59.6% |
| Renter-Occupied Housing Units | 3,657 | 40.4% |
| Total Occupied Housing Units | 9,050 | 100.0% |
Occupancy by Household Size in Dodge City
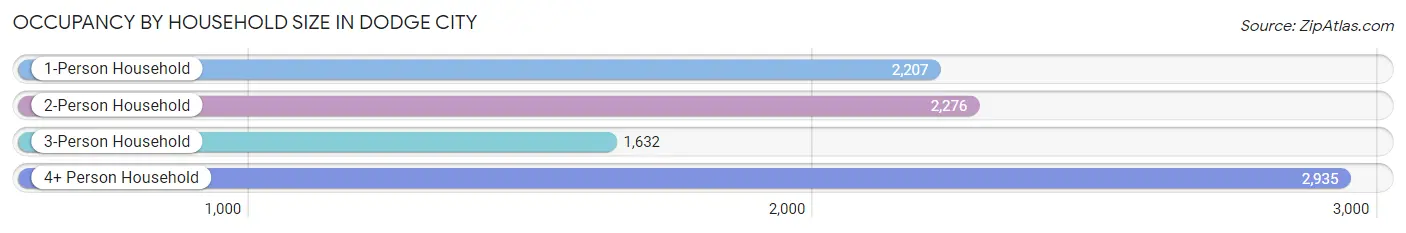
| Household Size | # Housing Units | % Housing Units |
| 1-Person Household | 2,207 | 24.4% |
| 2-Person Household | 2,276 | 25.2% |
| 3-Person Household | 1,632 | 18.0% |
| 4+ Person Household | 2,935 | 32.4% |
| Total Housing Units | 9,050 | 100.0% |
Occupancy by Ownership by Household Size in Dodge City
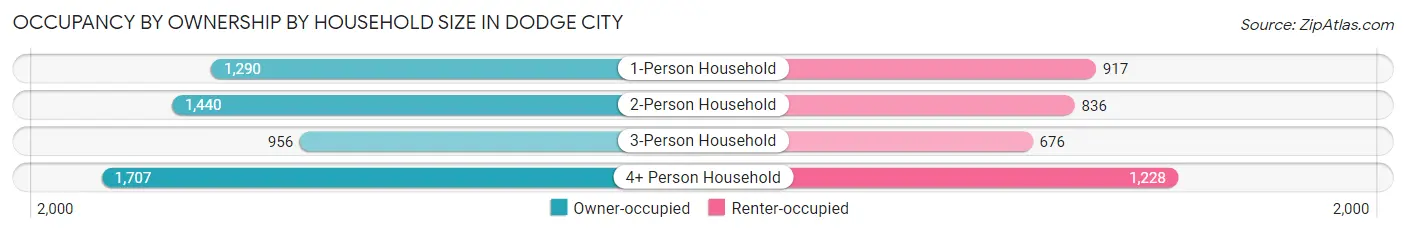
| Household Size | Owner-occupied | Renter-occupied |
| 1-Person Household | 1,290 (58.5%) | 917 (41.5%) |
| 2-Person Household | 1,440 (63.3%) | 836 (36.7%) |
| 3-Person Household | 956 (58.6%) | 676 (41.4%) |
| 4+ Person Household | 1,707 (58.2%) | 1,228 (41.8%) |
| Total Housing Units | 5,393 (59.6%) | 3,657 (40.4%) |
Occupancy by Educational Attainment in Dodge City
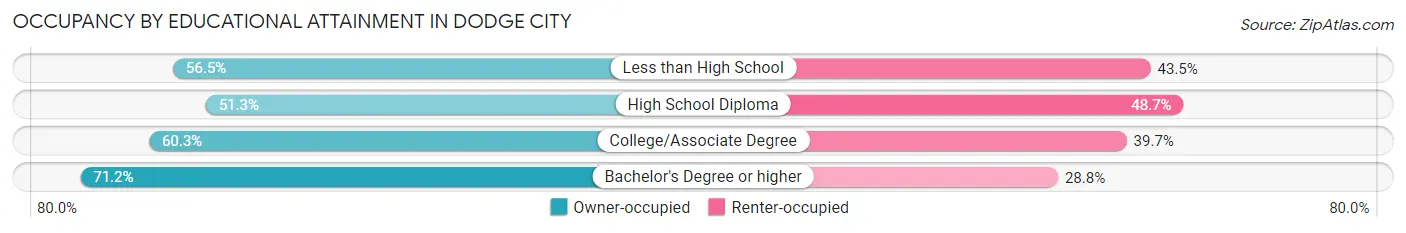
| Household Size | Owner-occupied | Renter-occupied |
| Less than High School | 1,205 (56.5%) | 929 (43.5%) |
| High School Diploma | 1,153 (51.3%) | 1,096 (48.7%) |
| College/Associate Degree | 1,584 (60.3%) | 1,044 (39.7%) |
| Bachelor's Degree or higher | 1,451 (71.2%) | 588 (28.8%) |
Occupancy by Age of Householder in Dodge City
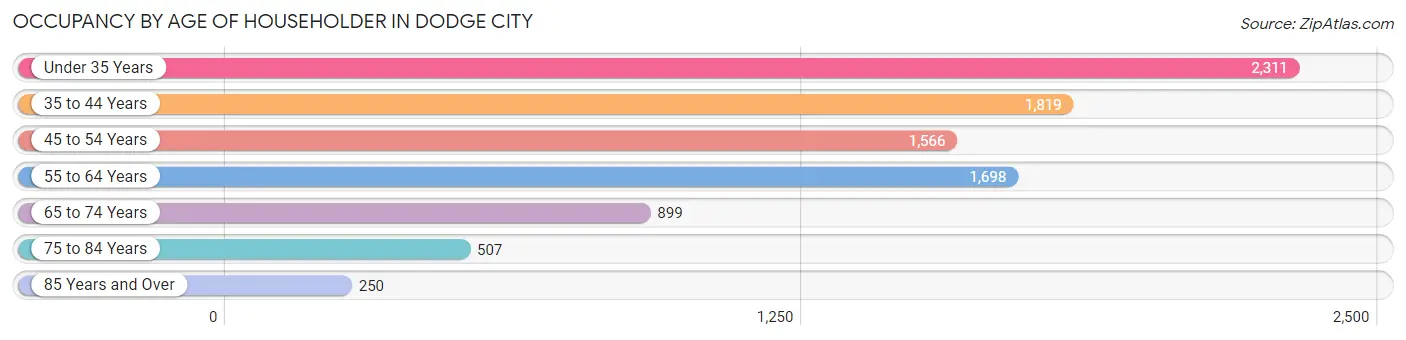
| Age Bracket | # Households | % Households |
| Under 35 Years | 2,311 | 25.5% |
| 35 to 44 Years | 1,819 | 20.1% |
| 45 to 54 Years | 1,566 | 17.3% |
| 55 to 64 Years | 1,698 | 18.8% |
| 65 to 74 Years | 899 | 9.9% |
| 75 to 84 Years | 507 | 5.6% |
| 85 Years and Over | 250 | 2.8% |
| Total | 9,050 | 100.0% |
Housing Finances in Dodge City
Median Income by Occupancy in Dodge City
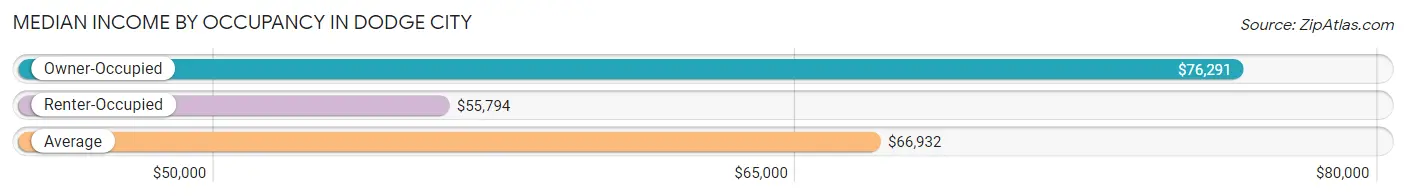
| Occupancy Type | # Households | Median Income |
| Owner-Occupied | 5,393 (59.6%) | $76,291 |
| Renter-Occupied | 3,657 (40.4%) | $55,794 |
| Average | 9,050 (100.0%) | $66,932 |
Occupancy by Householder Income Bracket in Dodge City
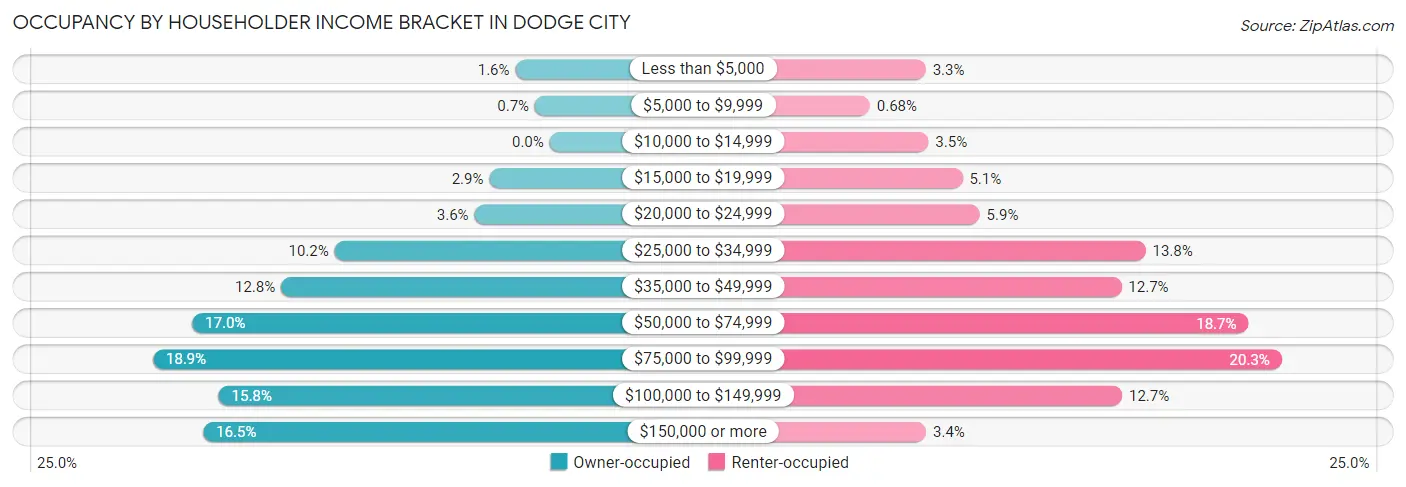
| Income Bracket | Owner-occupied | Renter-occupied |
| Less than $5,000 | 88 (1.6%) | 122 (3.3%) |
| $5,000 to $9,999 | 38 (0.7%) | 25 (0.7%) |
| $10,000 to $14,999 | 0 (0.0%) | 127 (3.5%) |
| $15,000 to $19,999 | 155 (2.9%) | 186 (5.1%) |
| $20,000 to $24,999 | 193 (3.6%) | 216 (5.9%) |
| $25,000 to $34,999 | 552 (10.2%) | 505 (13.8%) |
| $35,000 to $49,999 | 690 (12.8%) | 463 (12.7%) |
| $50,000 to $74,999 | 918 (17.0%) | 684 (18.7%) |
| $75,000 to $99,999 | 1,019 (18.9%) | 742 (20.3%) |
| $100,000 to $149,999 | 850 (15.8%) | 464 (12.7%) |
| $150,000 or more | 890 (16.5%) | 123 (3.4%) |
| Total | 5,393 (100.0%) | 3,657 (100.0%) |
Monthly Housing Cost Tiers in Dodge City
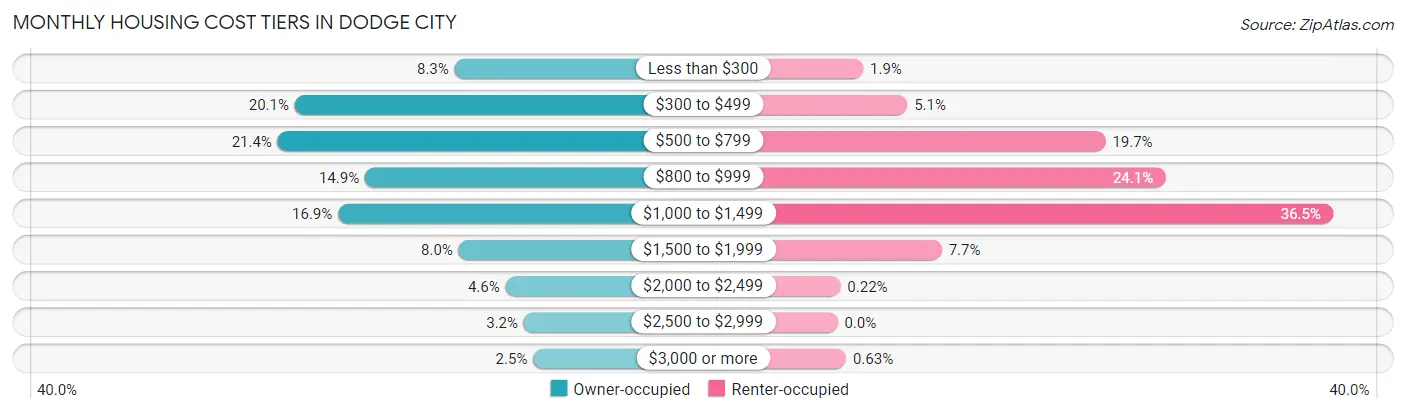
| Monthly Cost | Owner-occupied | Renter-occupied |
| Less than $300 | 449 (8.3%) | 69 (1.9%) |
| $300 to $499 | 1,084 (20.1%) | 188 (5.1%) |
| $500 to $799 | 1,152 (21.4%) | 722 (19.7%) |
| $800 to $999 | 805 (14.9%) | 882 (24.1%) |
| $1,000 to $1,499 | 912 (16.9%) | 1,334 (36.5%) |
| $1,500 to $1,999 | 433 (8.0%) | 281 (7.7%) |
| $2,000 to $2,499 | 247 (4.6%) | 8 (0.2%) |
| $2,500 to $2,999 | 174 (3.2%) | 0 (0.0%) |
| $3,000 or more | 137 (2.5%) | 23 (0.6%) |
| Total | 5,393 (100.0%) | 3,657 (100.0%) |
Physical Housing Characteristics in Dodge City
Housing Structures in Dodge City
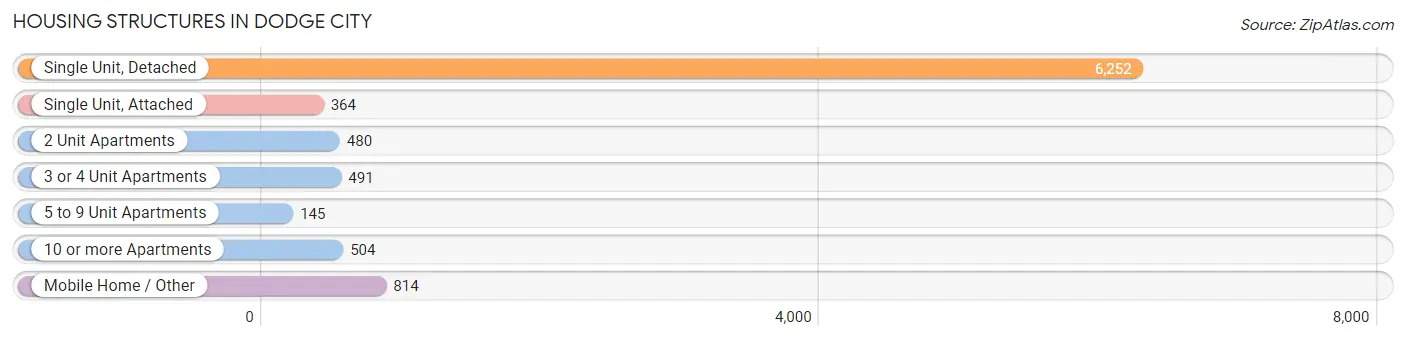
| Structure Type | # Housing Units | % Housing Units |
| Single Unit, Detached | 6,252 | 69.1% |
| Single Unit, Attached | 364 | 4.0% |
| 2 Unit Apartments | 480 | 5.3% |
| 3 or 4 Unit Apartments | 491 | 5.4% |
| 5 to 9 Unit Apartments | 145 | 1.6% |
| 10 or more Apartments | 504 | 5.6% |
| Mobile Home / Other | 814 | 9.0% |
| Total | 9,050 | 100.0% |
Housing Structures by Occupancy in Dodge City
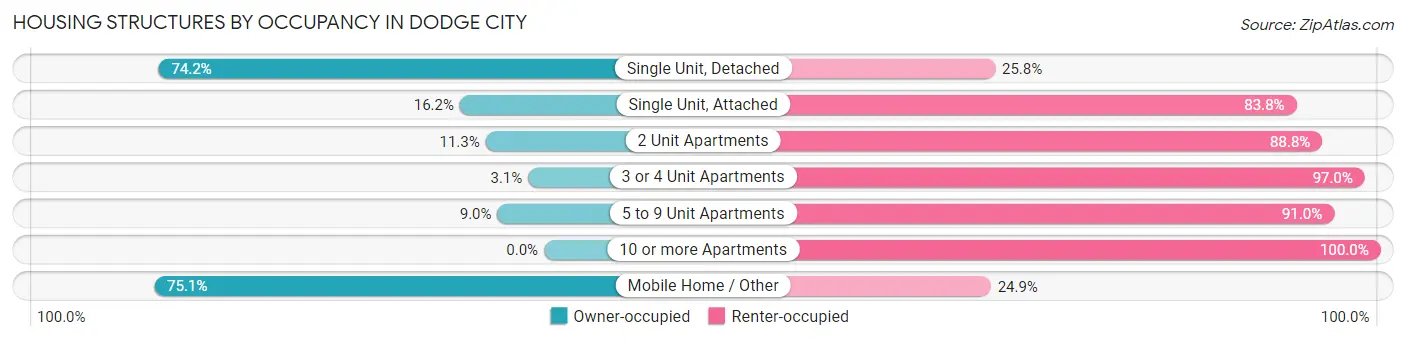
| Structure Type | Owner-occupied | Renter-occupied |
| Single Unit, Detached | 4,641 (74.2%) | 1,611 (25.8%) |
| Single Unit, Attached | 59 (16.2%) | 305 (83.8%) |
| 2 Unit Apartments | 54 (11.3%) | 426 (88.7%) |
| 3 or 4 Unit Apartments | 15 (3.0%) | 476 (97.0%) |
| 5 to 9 Unit Apartments | 13 (9.0%) | 132 (91.0%) |
| 10 or more Apartments | 0 (0.0%) | 504 (100.0%) |
| Mobile Home / Other | 611 (75.1%) | 203 (24.9%) |
| Total | 5,393 (59.6%) | 3,657 (40.4%) |
Housing Structures by Number of Rooms in Dodge City
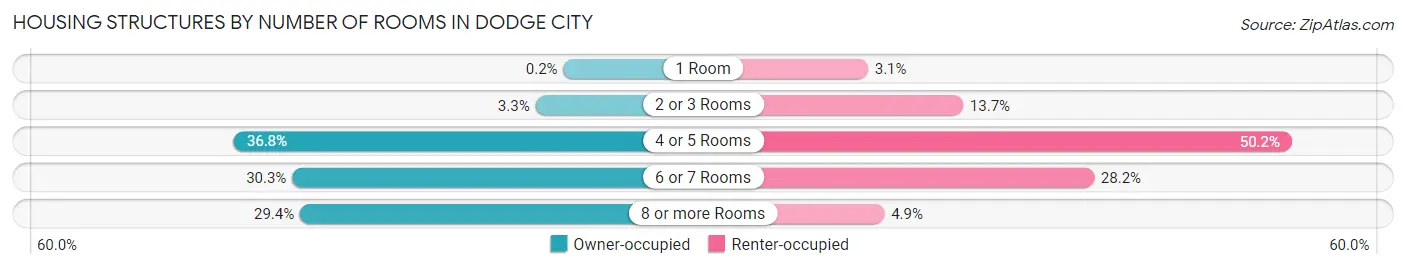
| Number of Rooms | Owner-occupied | Renter-occupied |
| 1 Room | 11 (0.2%) | 113 (3.1%) |
| 2 or 3 Rooms | 178 (3.3%) | 499 (13.7%) |
| 4 or 5 Rooms | 1,983 (36.8%) | 1,834 (50.1%) |
| 6 or 7 Rooms | 1,634 (30.3%) | 1,031 (28.2%) |
| 8 or more Rooms | 1,587 (29.4%) | 180 (4.9%) |
| Total | 5,393 (100.0%) | 3,657 (100.0%) |
Housing Structure by Heating Type in Dodge City
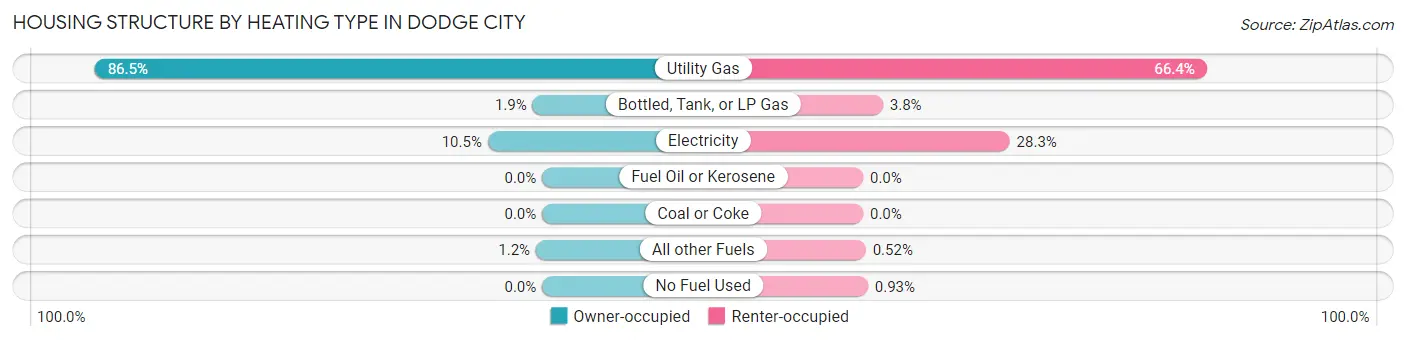
| Heating Type | Owner-occupied | Renter-occupied |
| Utility Gas | 4,662 (86.5%) | 2,428 (66.4%) |
| Bottled, Tank, or LP Gas | 100 (1.8%) | 140 (3.8%) |
| Electricity | 567 (10.5%) | 1,036 (28.3%) |
| Fuel Oil or Kerosene | 0 (0.0%) | 0 (0.0%) |
| Coal or Coke | 0 (0.0%) | 0 (0.0%) |
| All other Fuels | 64 (1.2%) | 19 (0.5%) |
| No Fuel Used | 0 (0.0%) | 34 (0.9%) |
| Total | 5,393 (100.0%) | 3,657 (100.0%) |
Household Vehicle Usage in Dodge City
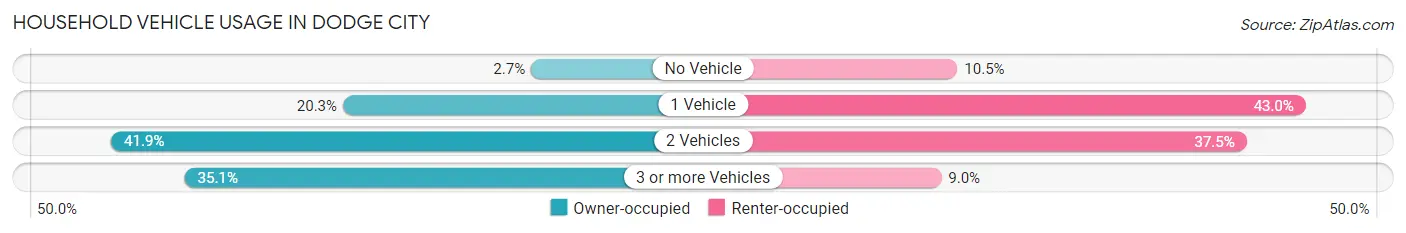
| Vehicles per Household | Owner-occupied | Renter-occupied |
| No Vehicle | 147 (2.7%) | 384 (10.5%) |
| 1 Vehicle | 1,094 (20.3%) | 1,573 (43.0%) |
| 2 Vehicles | 2,261 (41.9%) | 1,371 (37.5%) |
| 3 or more Vehicles | 1,891 (35.1%) | 329 (9.0%) |
| Total | 5,393 (100.0%) | 3,657 (100.0%) |
Real Estate & Mortgages in Dodge City
Real Estate and Mortgage Overview in Dodge City
| Characteristic | Without Mortgage | With Mortgage |
| Housing Units | 2,809 | 2,584 |
| Median Property Value | $91,900 | $151,300 |
| Median Household Income | $64,441 | $647 |
| Monthly Housing Costs | $494 | $137 |
| Real Estate Taxes | $1,476 | $56 |
Property Value by Mortgage Status in Dodge City
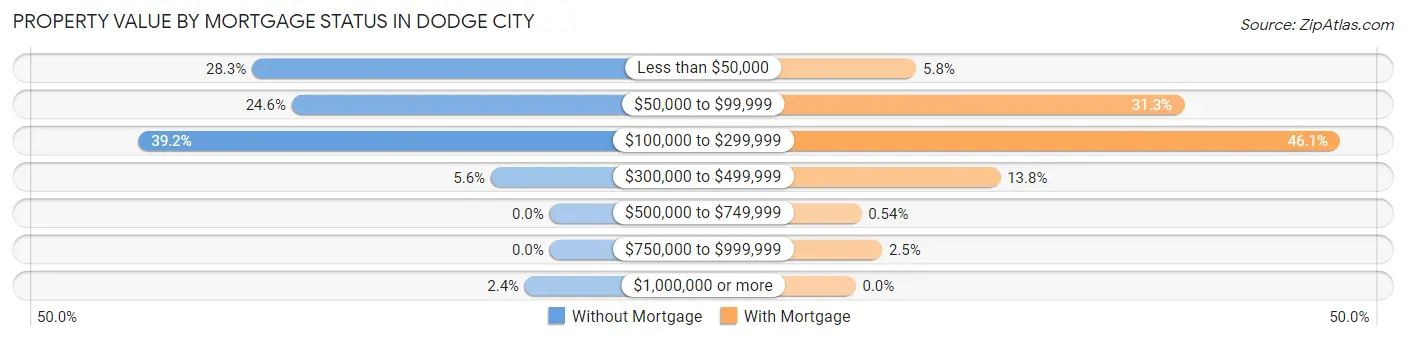
| Property Value | Without Mortgage | With Mortgage |
| Less than $50,000 | 796 (28.3%) | 149 (5.8%) |
| $50,000 to $99,999 | 690 (24.6%) | 808 (31.3%) |
| $100,000 to $299,999 | 1,100 (39.2%) | 1,192 (46.1%) |
| $300,000 to $499,999 | 157 (5.6%) | 356 (13.8%) |
| $500,000 to $749,999 | 0 (0.0%) | 14 (0.5%) |
| $750,000 to $999,999 | 0 (0.0%) | 65 (2.5%) |
| $1,000,000 or more | 66 (2.4%) | 0 (0.0%) |
| Total | 2,809 (100.0%) | 2,584 (100.0%) |
Household Income by Mortgage Status in Dodge City
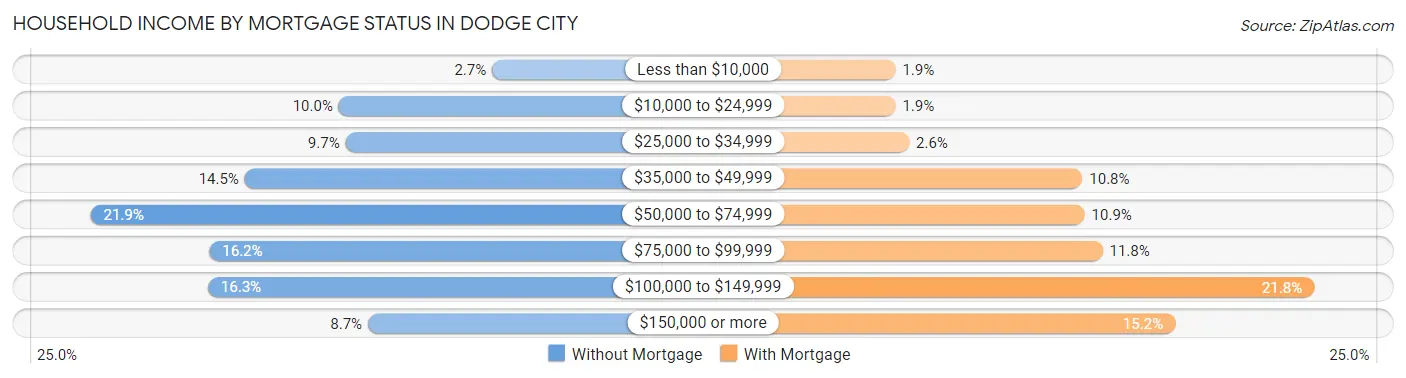
| Household Income | Without Mortgage | With Mortgage |
| Less than $10,000 | 77 (2.7%) | 49 (1.9%) |
| $10,000 to $24,999 | 282 (10.0%) | 49 (1.9%) |
| $25,000 to $34,999 | 273 (9.7%) | 66 (2.5%) |
| $35,000 to $49,999 | 408 (14.5%) | 279 (10.8%) |
| $50,000 to $74,999 | 614 (21.9%) | 282 (10.9%) |
| $75,000 to $99,999 | 455 (16.2%) | 304 (11.8%) |
| $100,000 to $149,999 | 457 (16.3%) | 564 (21.8%) |
| $150,000 or more | 243 (8.6%) | 393 (15.2%) |
| Total | 2,809 (100.0%) | 2,584 (100.0%) |
Property Value to Household Income Ratio in Dodge City
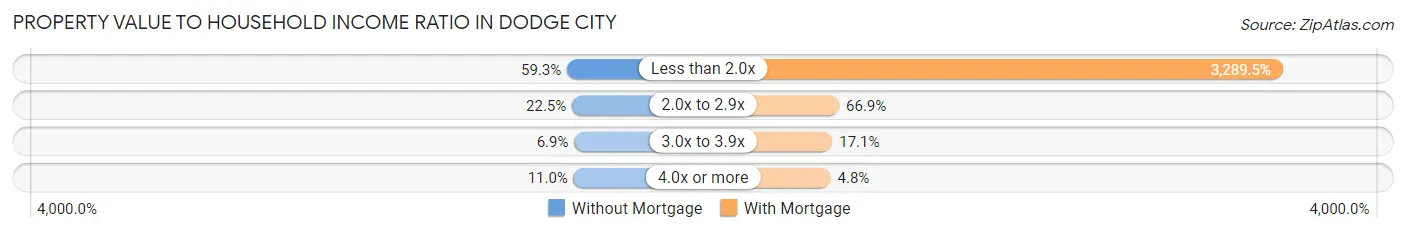
| Value-to-Income Ratio | Without Mortgage | With Mortgage |
| Less than 2.0x | 1,665 (59.3%) | 85,000 (3,289.5%) |
| 2.0x to 2.9x | 631 (22.5%) | 1,728 (66.9%) |
| 3.0x to 3.9x | 194 (6.9%) | 443 (17.1%) |
| 4.0x or more | 310 (11.0%) | 124 (4.8%) |
| Total | 2,809 (100.0%) | 2,584 (100.0%) |
Real Estate Taxes by Mortgage Status in Dodge City
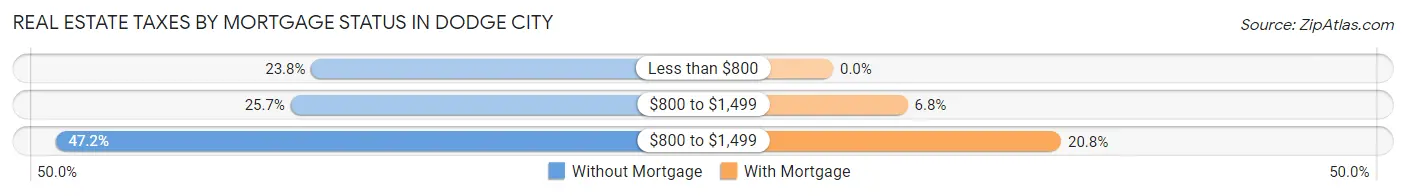
| Property Taxes | Without Mortgage | With Mortgage |
| Less than $800 | 669 (23.8%) | 0 (0.0%) |
| $800 to $1,499 | 722 (25.7%) | 176 (6.8%) |
| $800 to $1,499 | 1,325 (47.2%) | 538 (20.8%) |
| Total | 2,809 (100.0%) | 2,584 (100.0%) |
Health & Disability in Dodge City
Health Insurance Coverage by Age in Dodge City
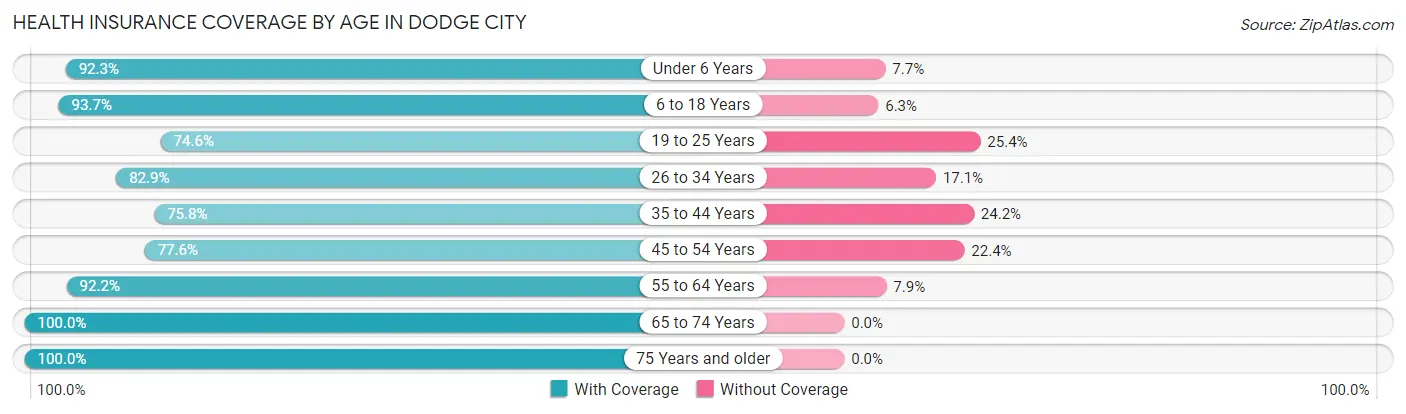
| Age Bracket | With Coverage | Without Coverage |
| Under 6 Years | 2,673 (92.3%) | 222 (7.7%) |
| 6 to 18 Years | 5,656 (93.7%) | 383 (6.3%) |
| 19 to 25 Years | 2,187 (74.6%) | 744 (25.4%) |
| 26 to 34 Years | 2,989 (82.9%) | 616 (17.1%) |
| 35 to 44 Years | 2,638 (75.8%) | 841 (24.2%) |
| 45 to 54 Years | 2,481 (77.6%) | 716 (22.4%) |
| 55 to 64 Years | 2,677 (92.1%) | 228 (7.9%) |
| 65 to 74 Years | 1,285 (100.0%) | 0 (0.0%) |
| 75 Years and older | 1,042 (100.0%) | 0 (0.0%) |
| Total | 23,628 (86.3%) | 3,750 (13.7%) |
Health Insurance Coverage by Citizenship Status in Dodge City
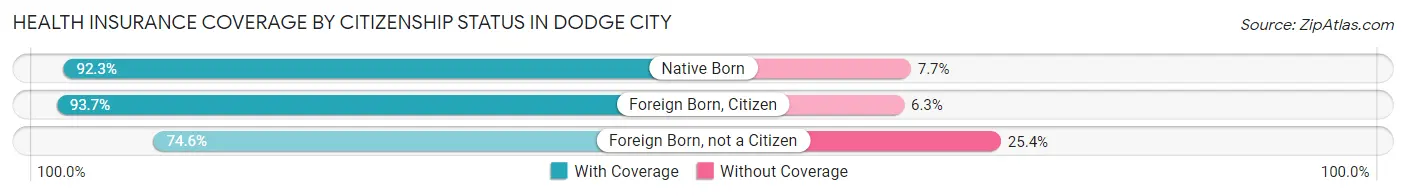
| Citizenship Status | With Coverage | Without Coverage |
| Native Born | 2,673 (92.3%) | 222 (7.7%) |
| Foreign Born, Citizen | 5,656 (93.7%) | 383 (6.3%) |
| Foreign Born, not a Citizen | 2,187 (74.6%) | 744 (25.4%) |
Health Insurance Coverage by Household Income in Dodge City
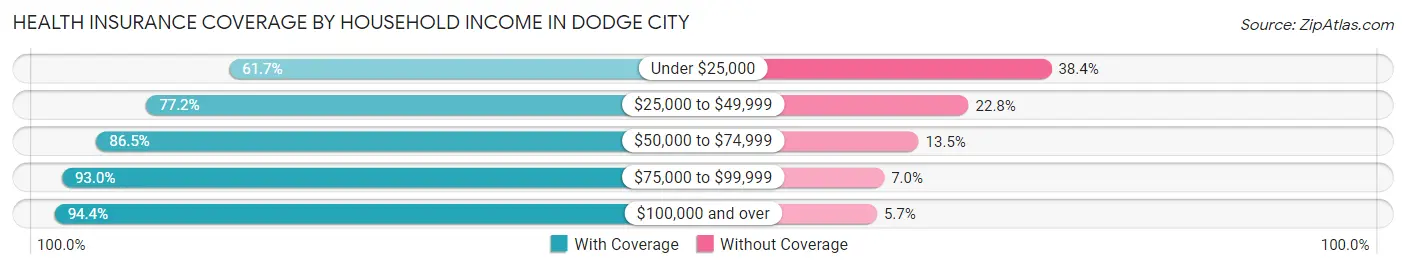
| Household Income | With Coverage | Without Coverage |
| Under $25,000 | 1,450 (61.7%) | 902 (38.4%) |
| $25,000 to $49,999 | 4,062 (77.2%) | 1,201 (22.8%) |
| $50,000 to $74,999 | 4,577 (86.5%) | 712 (13.5%) |
| $75,000 to $99,999 | 5,515 (93.0%) | 416 (7.0%) |
| $100,000 and over | 7,812 (94.4%) | 468 (5.7%) |
Public vs Private Health Insurance Coverage by Age in Dodge City
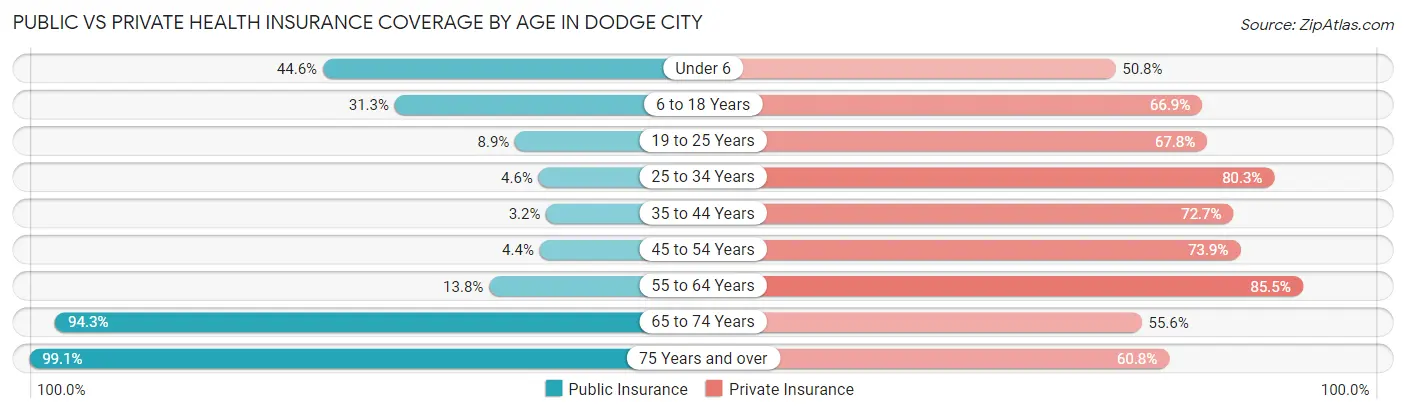
| Age Bracket | Public Insurance | Private Insurance |
| Under 6 | 1,292 (44.6%) | 1,470 (50.8%) |
| 6 to 18 Years | 1,889 (31.3%) | 4,038 (66.9%) |
| 19 to 25 Years | 262 (8.9%) | 1,987 (67.8%) |
| 25 to 34 Years | 165 (4.6%) | 2,893 (80.2%) |
| 35 to 44 Years | 110 (3.2%) | 2,528 (72.7%) |
| 45 to 54 Years | 140 (4.4%) | 2,364 (73.9%) |
| 55 to 64 Years | 400 (13.8%) | 2,484 (85.5%) |
| 65 to 74 Years | 1,212 (94.3%) | 715 (55.6%) |
| 75 Years and over | 1,033 (99.1%) | 633 (60.8%) |
| Total | 6,503 (23.7%) | 19,112 (69.8%) |
Disability Status by Sex by Age in Dodge City
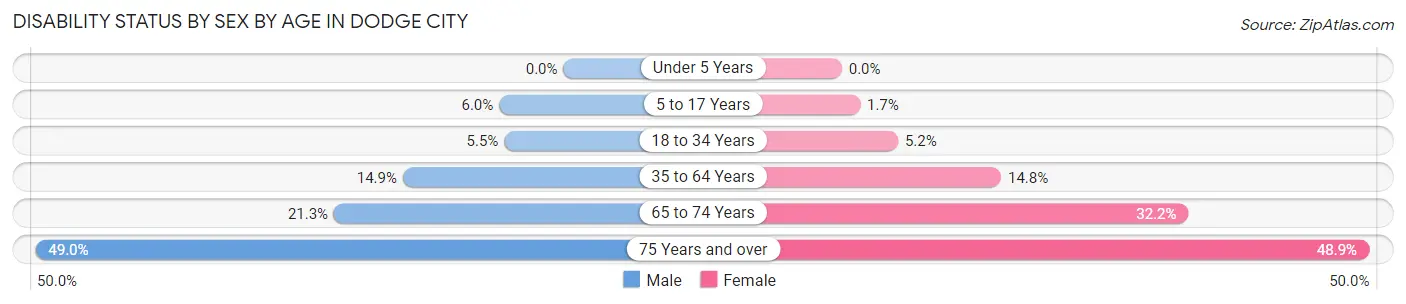
| Age Bracket | Male | Female |
| Under 5 Years | 0 (0.0%) | 0 (0.0%) |
| 5 to 17 Years | 181 (6.0%) | 52 (1.7%) |
| 18 to 34 Years | 206 (5.5%) | 168 (5.2%) |
| 35 to 64 Years | 731 (14.9%) | 691 (14.8%) |
| 65 to 74 Years | 122 (21.3%) | 229 (32.2%) |
| 75 Years and over | 171 (49.0%) | 339 (48.9%) |
Disability Class by Sex by Age in Dodge City
Disability Class: Hearing Difficulty
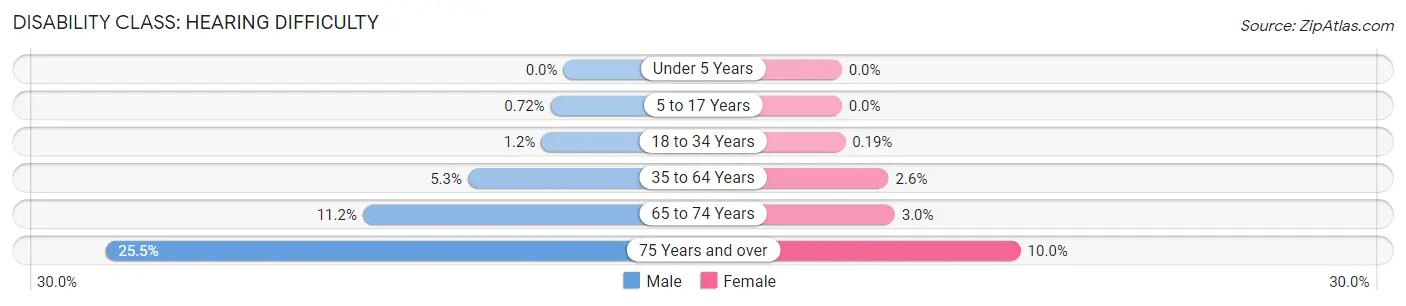
| Age Bracket | Male | Female |
| Under 5 Years | 0 (0.0%) | 0 (0.0%) |
| 5 to 17 Years | 22 (0.7%) | 0 (0.0%) |
| 18 to 34 Years | 46 (1.2%) | 6 (0.2%) |
| 35 to 64 Years | 261 (5.3%) | 122 (2.6%) |
| 65 to 74 Years | 64 (11.2%) | 21 (2.9%) |
| 75 Years and over | 89 (25.5%) | 69 (10.0%) |
Disability Class: Vision Difficulty
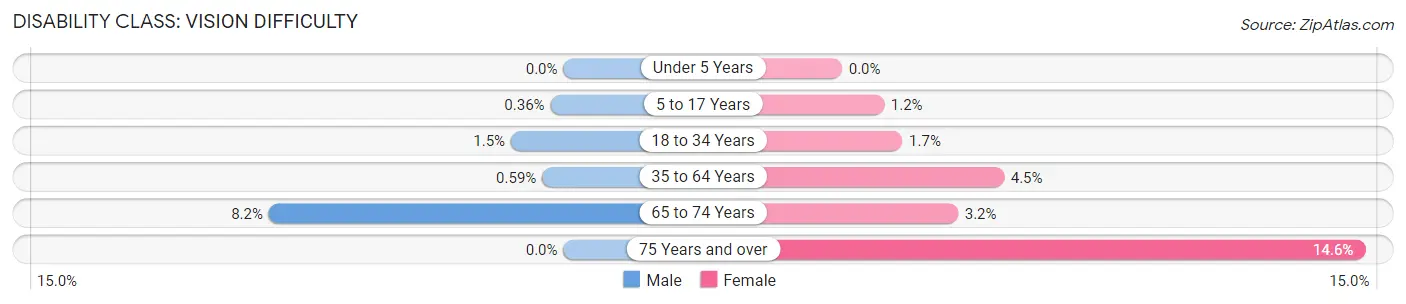
| Age Bracket | Male | Female |
| Under 5 Years | 0 (0.0%) | 0 (0.0%) |
| 5 to 17 Years | 11 (0.4%) | 36 (1.2%) |
| 18 to 34 Years | 55 (1.5%) | 54 (1.7%) |
| 35 to 64 Years | 29 (0.6%) | 211 (4.5%) |
| 65 to 74 Years | 47 (8.2%) | 23 (3.2%) |
| 75 Years and over | 0 (0.0%) | 101 (14.6%) |
Disability Class: Cognitive Difficulty
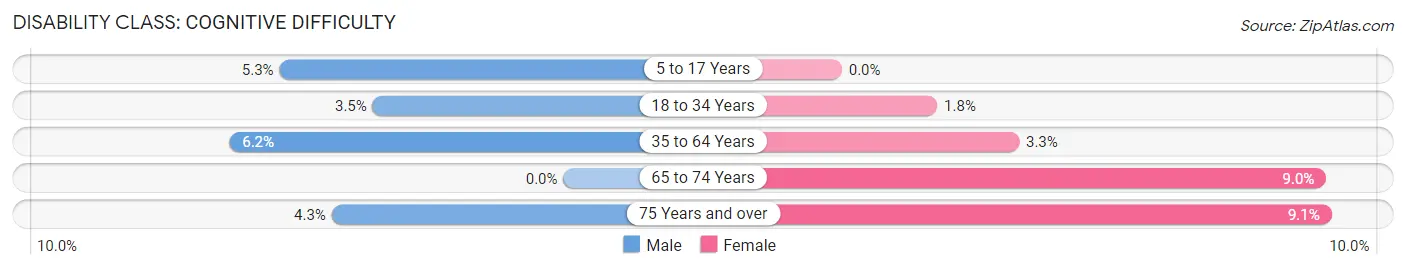
| Age Bracket | Male | Female |
| 5 to 17 Years | 160 (5.3%) | 0 (0.0%) |
| 18 to 34 Years | 133 (3.5%) | 57 (1.8%) |
| 35 to 64 Years | 304 (6.2%) | 154 (3.3%) |
| 65 to 74 Years | 0 (0.0%) | 64 (9.0%) |
| 75 Years and over | 15 (4.3%) | 63 (9.1%) |
Disability Class: Ambulatory Difficulty
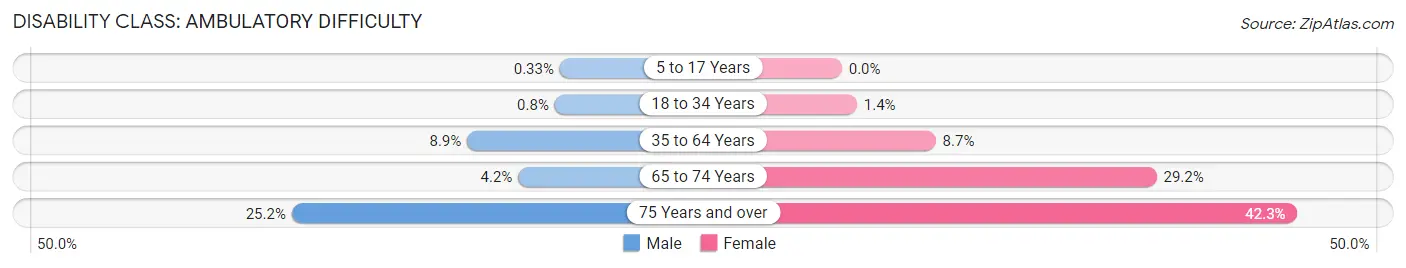
| Age Bracket | Male | Female |
| 5 to 17 Years | 10 (0.3%) | 0 (0.0%) |
| 18 to 34 Years | 30 (0.8%) | 45 (1.4%) |
| 35 to 64 Years | 438 (8.9%) | 407 (8.7%) |
| 65 to 74 Years | 24 (4.2%) | 208 (29.2%) |
| 75 Years and over | 88 (25.2%) | 293 (42.3%) |
Disability Class: Self-Care Difficulty
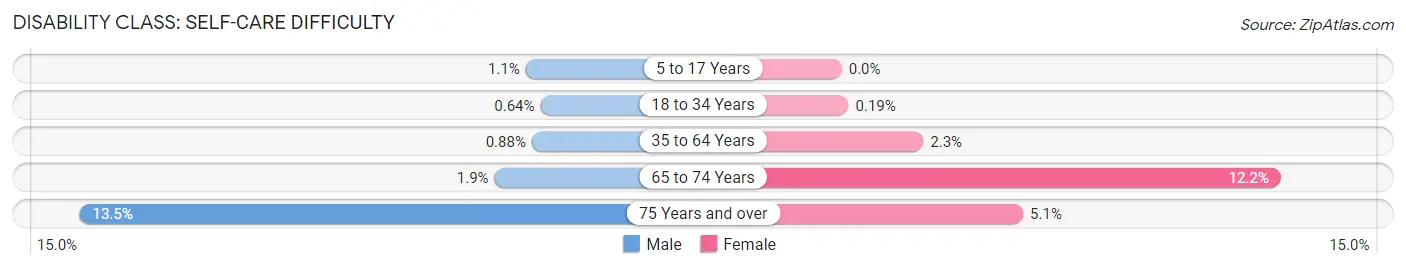
| Age Bracket | Male | Female |
| 5 to 17 Years | 32 (1.1%) | 0 (0.0%) |
| 18 to 34 Years | 24 (0.6%) | 6 (0.2%) |
| 35 to 64 Years | 43 (0.9%) | 106 (2.3%) |
| 65 to 74 Years | 11 (1.9%) | 87 (12.2%) |
| 75 Years and over | 47 (13.5%) | 35 (5.1%) |
Technology Access in Dodge City
Computing Device Access in Dodge City
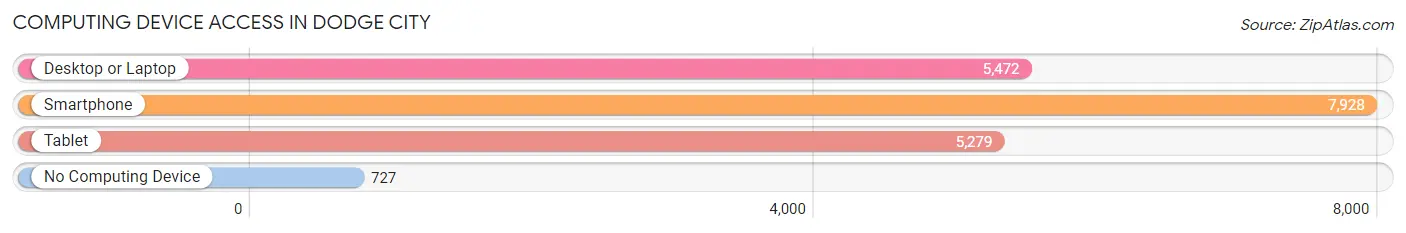
| Device Type | # Households | % Households |
| Desktop or Laptop | 5,472 | 60.5% |
| Smartphone | 7,928 | 87.6% |
| Tablet | 5,279 | 58.3% |
| No Computing Device | 727 | 8.0% |
| Total | 9,050 | 100.0% |
Internet Access in Dodge City
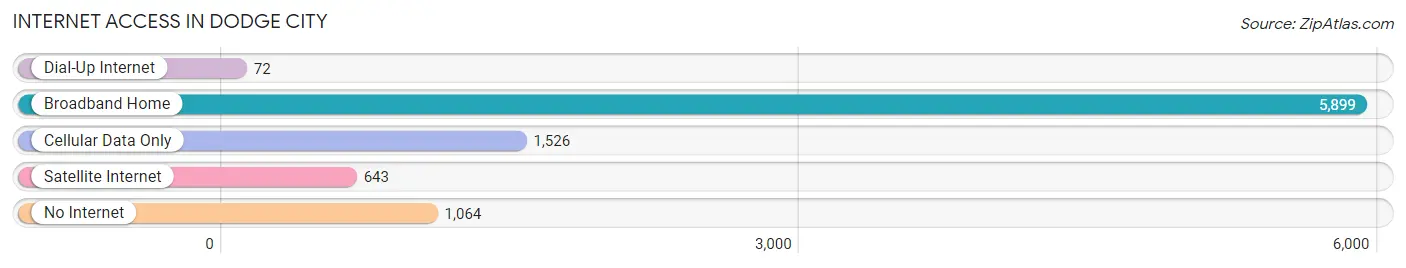
| Internet Type | # Households | % Households |
| Dial-Up Internet | 72 | 0.8% |
| Broadband Home | 5,899 | 65.2% |
| Cellular Data Only | 1,526 | 16.9% |
| Satellite Internet | 643 | 7.1% |
| No Internet | 1,064 | 11.8% |
| Total | 9,050 | 100.0% |
Dodge City Summary
Dodge City, Kansas is a city located in Ford County in the southwestern part of the state. It is the county seat and the largest city in the county. The city is located on the Arkansas River and is known for its rich history and culture.
History
Dodge City was founded in 1872 by Henry J. Sitler, a cattleman from Texas. Sitler named the city after his hometown of Dodge City, Texas. The city quickly became a major stop on the cattle trail, and by 1875, it was the largest cattle shipping point in the United States. The city was also known for its lawlessness, and was the setting for the famous gunfight at the O.K. Corral in 1881.
In the late 19th century, Dodge City was a major stop on the Atchison, Topeka and Santa Fe Railway. The city was also home to a large number of saloons and gambling halls, which attracted many famous figures such as Wyatt Earp, Bat Masterson, and Doc Holliday.
In the early 20th century, Dodge City began to transition from a wild frontier town to a more modern city. The city was the site of the first public library in Kansas, and the first public hospital in the state was built in Dodge City in 1912. The city also became a major center for the beef industry, and by the 1950s, it was the largest beef-packing center in the world.
Geography
Dodge City is located in southwestern Kansas, in Ford County. The city is situated on the Arkansas River, and is surrounded by the High Plains to the west and the Flint Hills to the east. The city has a total area of 16.3 square miles, of which 16.2 square miles is land and 0.1 square miles is water.
The climate in Dodge City is semi-arid, with hot summers and cold winters. The average temperature in July is 85°F, and the average temperature in January is 24°F. The city receives an average of 17.5 inches of precipitation per year.
Economy
Dodge City has a diversified economy, with a mix of manufacturing, retail, and service industries. The city is home to several major employers, including Cargill Meat Solutions, which is the largest beef-packing plant in the world, and the Dodge City Community College.
The city is also a major tourist destination, with attractions such as the Boot Hill Museum, the Santa Fe Trail Center, and the Dodge City Raceway Park. The city is also home to several annual events, such as the Dodge City Days Festival and the Dodge City Roundup Rodeo.
Demographics
As of the 2010 census, Dodge City had a population of 27,340. The racial makeup of the city was 75.3% White, 1.2% African American, 0.9% Native American, 0.7% Asian, 0.1% Pacific Islander, 19.2% from other races, and 3.6% from two or more races. Hispanic or Latino of any race were 44.2% of the population.
The median household income in Dodge City was $37,945, and the median family income was $45,945. The per capita income was $19,945. About 17.2% of the population was below the poverty line.
Dodge City is served by the Dodge City Public Schools, which includes four elementary schools, one middle school, and one high school. The city is also home to the Dodge City Community College, which offers associate's degrees and certificate programs.
Common Questions
What is Per Capita Income in Dodge City?
Per Capita income in Dodge City is $27,441.
What is the Median Family Income in Dodge City?
Median Family Income in Dodge City is $76,952.
What is the Median Household income in Dodge City?
Median Household Income in Dodge City is $66,932.
What is Income or Wage Gap in Dodge City?
Income or Wage Gap in Dodge City is 28.2%.
Women in Dodge City earn 71.8 cents for every dollar earned by a man.
What is Family Income Deficit in Dodge City?
Family Income Deficit in Dodge City is $8,720.
Families that are below poverty line in Dodge City earn $8,720 less on average than the poverty threshold level.
What is Inequality or Gini Index in Dodge City?
Inequality or Gini Index in Dodge City is 0.40.
What is the Total Population of Dodge City?
Total Population of Dodge City is 27,721.
What is the Total Male Population of Dodge City?
Total Male Population of Dodge City is 14,087.
What is the Total Female Population of Dodge City?
Total Female Population of Dodge City is 13,634.
What is the Ratio of Males per 100 Females in Dodge City?
There are 103.32 Males per 100 Females in Dodge City.
What is the Ratio of Females per 100 Males in Dodge City?
There are 96.78 Females per 100 Males in Dodge City.
What is the Median Population Age in Dodge City?
Median Population Age in Dodge City is 30.3 Years.
What is the Average Family Size in Dodge City
Average Family Size in Dodge City is 3.5 People.
What is the Average Household Size in Dodge City
Average Household Size in Dodge City is 3.0 People.
How Large is the Labor Force in Dodge City?
There are 14,392 People in the Labor Forcein in Dodge City.
What is the Percentage of People in the Labor Force in Dodge City?
71.4% of People are in the Labor Force in Dodge City.
What is the Unemployment Rate in Dodge City?
Unemployment Rate in Dodge City is 3.6%.